Quarterly Report July, 2012
139
National Bank of the Republic of Macedonia Quarterly Report July, 2012
-
Upload
khangminh22 -
Category
Documents
-
view
2 -
download
0
Transcript of Quarterly Report July, 2012

National Bank of the Republic of Macedonia
Quarterly Report July, 2012

Quarterly Report, July, 2012
2
Contents:
Introduction ........................................................................................................... 3
I. Macroeconomic developments ............................................................................ 5
1.1. International economic environment ............................................................................ 5 1.2. Domestic supply ............................................................................................................ 9 1.3. Aggregate demand ...................................................................................................... 12 1.3.1. Private consumption ...........................................................................................................13 1.3.2. Public consumption .............................................................................................................14 Appendix 1: Fiscal policy ..........................................................................................................................15 1.3.3. Investment consumption .....................................................................................................17 1.3.4. Net export demand .............................................................................................................18 1.4. Employment and wages .............................................................................................. 19 Appendix 2: Analysis of labor supply .........................................................................................................22 1.5. Balance of payments ................................................................................................... 24 1.5.1. Current account ..................................................................................................................25 Appendix 3: Foreign trade and nominal and real effective exchange rate (NEER and REER) ......................26 1.5.2. Capital and financial account ...............................................................................................29 1.5.3. Gross external debt .............................................................................................................31 1.6. Inflation ....................................................................................................................... 33 Appendix 4: Inflation expectations of the economic agents in the Republic of Macedonia ..........................35
II. Monetary policy ............................................................................................... 37
2.1. Bank liquidity and financial market developments ..................................................... 39 2.2. Monetary and credit aggregates ................................................................................. 41 2.2.1. Monetary aggregates ..........................................................................................................42 2.2.2. Credit activity .....................................................................................................................45
III. Stock exchange indices and real estate prices .............................................. 49
IV. Macroeconomic projections ............................................................................ 51
4.1. Assumptions in the external environment projections ............................................... 51 4.2. Projection and effects on the monetary policy ........................................................... 54
Statistical Appendix ............................................................................................................ 63

Quarterly Report, July, 2012
3
Introduction
During the second quarter of 2012, NBRM eased the monetary policy, lowering the key interest rate by 0.25 percentage points and altering the monetary instruments. Observed from a monetary point of view, the movements registered in the beginning of 2012 were favorable and represented a continuation of the trends from the previous year. Foreign reserves continued to be maintained at a level consistent with the adequate, and the expectations for inflation and exchange rate were stable. On the other hand, as a result of the weaker economic activity in the Euro area, as well as the unfavorable weather conditions at the beginning of the year, the vulnerability of the real sector has increased, with many indicators suggesting a weaker economic activity. Macroeconomic projections from April indicated relatively favorable environment for the monetary policy conduct in the forthcoming period, in accordance with the expectations for maintaining low and controlled inflation and balance of payments position that provides additional foreign reserves. All these factors have opened room for monetary easing, as a contribution to faster credit growth and thus support of the domestic economic activity, without jeopardizing the achievement of the ultimate monetary objective - maintaining price stability by maintaining the stability of the exchange rate.
In the period since the change in the monetary policy stance until now,
the global economic environment has witnessed changes which meant further increase in the risks in terms of monetary policy. Changes in the global environment had some, albeit limited effect on current developments in the domestic economy and on future expectations. Namely, in this period the problems of the debt crisis in some of the Member States of the Euro area aggravated. In such conditions, the uncertainty and mistrust rose again to unusually high levels, limiting both the existing and the expected growth rates of our major trading partners. The negative effects were felt in the exports, which amid still resistant import demand led to a larger than expected trade deficit in the second quarter. The probably lower capital inflows, amid capital outflows of certain companies to their parent companies in the form of dividends and intercompany loans, had an additional effect. On the other hand, private transfers continuously exceed expectations, indicating an extremely high confidence in the domestic currency. By the end of the year the negative gap in trade is expected to decrease in one part, due to the synchronization of export-import activity of individual exporters and due to reduced imports stimulated by domestic demand. In such conditions, the trade balance in 2012 is expected to move close to the April projection of about 22% of GDP. On the other hand, taking into account past performance, as well as the assessments for further maintenance of high confidence in the domestic currency, net inflows from private transfers are expected to be higher, resulting in more favorable assessments of the current account deficit in 2012, which now is estimated to amount to 2.9% of GDP (3.2% of GDP in the April projection). Projections of capital inflows have been largely revised downwards. These changes are due to the new assessments of lower foreign investment, and a significant reduction of the external debt of the country, amid worsening conditions of funding in the international capital market. However, even with such assessments of the balance of payments position in 2012, new growth in foreign reserves is expected, which would continue to gravitate around the adequate level. In 2013, the current account deficit is expected to be 3% of GDP (3.2% of GDP in the previous projection), with expectations for improved export performance and further retention of the positive trends in private transfers. In parallel, recovery in capital inflows is expected, primarily based on foreign direct investment, which would contribute to further growth of foreign reserves and their maintenance on an adequate level.
Quarterly Report, July, 2012
4
Downward revision of the current account deficit and the assessments for its retention on a relatively low level is consistent with the assessments for the retention of the economic growth below the potential growth by the end of 2013. The negative effects of the worsening economic outlook in the euro area have already materialized in part since the beginning of the year. So, current assessments are that the performance of the domestic export sector in 2012 will be weaker than previously expected, and a delay of the planned investments is possible, with negative effects on the overall investment demand. According to these expectations and taking into account the lower GDP in the first quarter, it is assessed that the growth of the economic activity in 2012 will be weaker and will be around 1%, versus the expected 2% in the April projection. Although the current assessments indicate more intense slowdown of economic growth compared to previous expectations, it is not expected that this dynamics would jeopardize the capacity for growth in the domestic economy. Thus, in 2013, a gradual recovery of the economies of the foreign partners is expected, which would create positive transmission effects on consumption and investment decisions of domestic agents. At the same time, growth in foreign and public investments, as well as active credit support by the banking sector are expected, which would result in acceleration of the economic growth of about 3%. The banking sector is expected to actively support the domestic private sector in conditions of available resources for financial support, adequate liquidity and capitalization and relaxed monetary conditions. Banks' lending activity during this and next year is expected to grow at a rate of about 8% and 10%, respectively. In terms of inflation, there has been a small upward correction of projected inflation. Risks around the projection are in the upward direction, as a consequence of the movement of import and regulated prices. Recent evaluations of food import prices show a higher price level than previously expected, caused by a negative shock in the global supply. On the other hand, weaker growth and retention of the negative output gap by the end of 2013 indicate the absence of pressures on the domestic prices through demand. In the course of this and next year, the average inflation is expected to be around 2.2%, and it continues to be maintained within acceptable limits.
In sum, the macroeconomic picture by the end of 2013 indicates retention
of the negative output gap, inflation moving within controlled framework and balance of payments position with a moderate current account deficit and sufficient capital inflows for its financing. However, the fact that in the period between the last two projections a larger downward correction in the volume of capital inflows was made, shows the high sensitivity of the domestic macroeconomic scenario and of the monetary conditions to the changes in the propensity of investors to accept risks and the changes in the external financing conditions. In addition, the volatility of import prices is extremely high, creating potential risks to domestic inflation, and the external sector. In this macro-economic picture for the forthcoming period, so far the current monetary position is assessed as appropriate. In any case, NBRM will continue to closely monitor the developments also in the future period and if necessary it will make appropriate changes in the monetary policy in order to successfully achieve the monetary goals.

Quarterly Report, July, 2012
5
I. Macroeconomic developments 1.1. International economic environment1
In the first quarter of 2012, global growth rate accelerated, with the pace
of growth being faster than expected. This was in part due to temporary factors, which among other things include temporary return of the confidence of consumers and businesses and easing of the financial conditions as a result of the ECB's monetary actions implemented during this period. However, these positive trends were interrupted in the second quarter, amid renewed political and financial uncertainty and problems in the banking systems in some European countries, as well as lack of confidence in the capacity of these countries for appropriate fiscal adjustment and reform. In such conditions, in July, the IMF made a moderate downward revision of the forecasts for the global economy. The risks for the projection continue to be downward, and the main risk is still associated with a possible worsening of the debt crisis in the Euro area, which in the worst case scenario would cause exiting of some Member State. In terms of global inflation, it continued to slow down, with expectation that the inflation rate in the developed countries and the emerging and developing countries will follow a downward path.
The global economic growth in the
first quarter of 2012 was higher than expected and accounted for 3.6%. At the
same time, this growth is higher than in the previous quarter when the growth rate was 3.2%.
Favorable global economic environment at the beginning of the year is partly due to temporary
factors related to improved confidence of market
participants and eased financial conditions due to the successful monetary measures taken in the EU
in this period. Additionally, the eased monetary policies in developing countries had a positive
impact on their economies and thus supported the
global economic activity. Positive trends were observed also in the world trade, which was fueled
by the stronger domestic demand in the USA and the relatively strong import demand in developing
countries. The latest estimates are that despite the
relatively strong first quarter, the second half of 2012 will be marked by slower economic growth
both in developed countries and in the key emerging economies. Hence, in the July
projections of the IMF global growth of 3.5% in 2012 is forecasted, which is a
moderate downward revision of 0.1
percentage point compared to the April projections. Leading indicators of economic
1 The analysis is based on the ECB's monthly bulletin, May and June, 2012; updating of the "World Economic Outlook", IMF, July 2012; reports of "Capital Economics"; weekly reports of the National Bank of Greece and announcements of "Markit Economics".
-6
-4
-2
0
2
4
6
8
10
Emerging and developing economiesAdvanced economies
World
Source: IMF.
Global GDP growth(annual real growth rates, quarterly data)

Quarterly Report, July, 2012
6
activity - PMI2 indicate growth of the world economy in the second quarter, but at a slower
pace. Global composite PMI in June remained in the growth zone (over the limit of 50 index points),
amid slower activity in the service sector and a
decline in the manufacturing industry. Most unfavorable are the economic developments in the
Euro area, whose PMI recorded the lowest value after June 2009, while the USA continue to have a
positive contribution to world growth. Global
economy in 2012 remains susceptible to high downward risks. The most important risk
refers to the another deterioration of the indebtedness of some countries in the Euro area,
due to insufficient or untimely action of policy makers in the Euro area. An additional risk is the
position of the public finances of the USA, where
the possible excessive fiscal tightening and delaying of the necessary change in the threshold
of the federal debt would increase the risks of financial markets and disrupt the confidence of
private entities.
Global inflationary trends have
continued to subside in the months of the second quarter. Thus, global inflation3 dropped
to 3.3% in May, compared to 3.9% in March 2012 and 4.1% in December 2011, which is the lowest
level in 20 months. This trend resulted from the
reduced inflation rate in advanced economies, which in May was 1.7%, with simultaneous greater
slowing of the inflation in emerging economies and developing countries (5.6% in May compared to
6.2% in March). Major factor for the slowdown of
inflation in this period was the reduction in the price of crude oil on the world market, which in
this quarter declined on an annual basis, for the first time after the third quarter of 2009. The latest
projections for 2012, forecast calming inflationary
trends on a global level, as a result of pent-up global demand and declining prices of primary
products. Thus, current estimates are that global inflation in 2012-2013 will amount to 3 to 3.5%.
Moreover, the rate of inflation in the advanced economies will be lowered from 2% in 2012 to
1.6% in 2013, with a similar trajectory also in
developing countries, where the inflation rate will be 6.3% in 2012 and 5.6% in 2013.
In the first quarter, economic activity
in the Euro area stagnated, amid still present
2 PMI (Purchasing Managers Index - PMI) is based on surveys of a representative sample of companies from the manufacturing and service sectors, and are often used as high frequency indicators of current and future economic activity. 3 Data source is the International Financial Statistics database of the IMF.
30
35
40
45
50
55
60
65
70
75
Q12008
Q3 Q12009
Q3 Q12010
Q3 Q12011
Q3 Q12012
JPMorgan Global Manufacturing & Services PMI
EC Composite PMI Output
US Chicago Purchasing Managers Index
*The PMI index reflects the percentage of respondents that reported
better bussiness conditions compared to the previous month and it can
take values between 0 and 100. PMI=50 is considered as a reference value, indicating unchanged economic conditions. A PMI value over 50 is
taken to indicate that the economy is expanding, while a PMI value below
50 suggests that the economy is contracting.Source: Bloomberg.
Global economic activity indicators
(monthly indices*)
-10,0
-8,0
-6,0
-4,0
-2,0
0,0
2,0
4,0
6,0
euro areaUnited StatesJapanUnited Kingdom
Source: Eurostat.
Real GDP growth in advanced economies(year-on-year percentage changes; quarterly data)
2,0
3,0
4,0
5,0
6,0
7,0
8,0
9,0
10,0
11,0euro areaUnited StatesJapanUnited Kingdom
Unemployment in advanced economies(in percent; seasonally adjusted monthly data)
Source: Eurostat.

Quarterly Report, July, 2012
7
tensions in the government bond markets of some Euro area countries. After the fall of
0.3% registered in the previous quarter, the quarterly GDP growth rate was 0%,
resulting in an annual rate of decline of -
0.1% (0.7% growth in the previous quarter). Net exports continued to be the main
driver of growth, while domestic demand and investments in inventories were the components
that contributed negatively to growth. Namely, in
this period a faster growth of exports than imports was registered, as a result of the strengthening of
external demand, mainly from Latin America and the United States. Some improvement was noted
in private consumption, which after the fall in the previous quarter remained unchanged, amid still
unfavorable movements in real disposable income
and increased unemployment rate to a level of 10.9% in this quarter. Investment activity had the
largest decline after the second quarter of 2009, due to lower investments in construction and in
other sectors, amid tightened credit conditions and
deteriorating condition of the real estate market. On the other hand, for the first time in the year,
public consumption recorded minimal growth and thus acted towards support of the domestic
demand.
In the second quarter of 2012, the
trend of slowdown of the price growth in the Euro area continued. Thus, the average
inflation rate in the second quarter was 2.5%, versus 2.7% in the previous quarter.
Such disinflationary movements were in line with
the strong decline in the prices of oil and non-energy primary products in these months. A more
detailed analysis shows that within the consumer price index, energy price growth slowed to 7.2%,
with only gas registering higher prices compared to
the same period last year, while food price experienced lower growth of 3%. On the other
hand, core inflation increased moderately from 1.5% to 1.6% due to the transmission effects of
the increase in indirect taxes in certain Member States.
During the second quarter, the FED, the Bank of England and the ECB did not
change their interest rate policies and kept interest rates at a level of 0 to 0.25%, 0.5%
and 1%, respectively. With the short-term
interest rate being near the lower limit of 0%, central banks are opting to pursue unconventional
monetary measures. Thus, in order to support lending to households and enterprises by the
banking sector, on June 20, the ECB decided to lower the threshold for the minimum rating of
-3
-2
-1
0
1
2
3
4
5
6
7euro area United States
Japan United Kingdom
Source: Eurostat and national statistical offices.
Inflation in advanced economies(annual percentage changes; monthly data)
0.0
1.0
2.0
3.0
4.0
5.0
6.0
2007 2008 2009 2010 2011 2012
Policy rates in advanced economies(in %)
United Kingdom
United States
euro area
Japan
Source: Central banks.

Quarterly Report, July, 2012
8
assets accepted as collateral, as well as to expand the list of eligible collateral and certain securities
collateralized by assets such as auto loans, leasing and commercial and residential mortgages. As a
result of the expectations for lower growth and
higher unemployment, in June the FED continued to implement the program for extending the
maturity of the assets in its balance sheet (operation "Twist")4. FED's intention is through this
measure to act toward reducing long-term interest
rates and thus stimulate the US economy. On the other hand, the Bank of England announced that
in cooperation with the Treasury it will conduct a program for financial support of lending, which will
provide funds to banks at rates below market rates, provided they can be funneled into loans to
the non-financial sector in the United Kingdom.
The nominal exchange rate of the
euro against the US dollar during the second quarter registered a trend of depreciation,
with such low levels being last seen in mid-
2010. Thus, in April, the euro dropped in value by 0.3% on a monthly basis, while May and June
were marked by a more significant depreciation of -2.8% and -2.1%, respectively. Such movements
of the exchange rate are mainly due to the continuously present concerns about the fiscal
situation in some countries in the Euro area, and
the political uncertainty in Greece had a strong negative impact, especially in May. In June, one
euro was traded at 1.25 USD on average, which is 5.1% lower than its value in March 2012, i.e. 10%
compared to its average in 2011.
After the growth in the previous
quarter, prices of oil and non-energy primary products5 continued to decline in the second
quarter. The fall in oil prices is mainly due to the
intensification of the debt crisis in the Euro area and the slower growth of the Chinese economy.
This coupled with the increase in supply caused the average price of crude oil "Brent" to drop to
USD 108.9 per barrel in the second quarter, which represents a decrease of 8.1% compared to the
previous quarter, or 7% on annual basis. Prices
of non-energy primary products in the second quarter declined on a quarterly and
annual basis. Moreover, metals registered steeper annual price decline of 19.7% (5.4% on a
quarterly basis) as a result of the growing
4 Within this operation FED will sell government securities with maturity of less than 3 years and will buy government securities with maturity of 6 to 30 years at a cost of USD 267 billion in 2012. 5 Price index of primary products includes: the prices of food, beverages, agricultural raw materials and metals.
0.60
0.65
0.70
0.75
0.80
0.85
2007 2008 2009 2010 2011 2012
EUR/USD
Source: Eurostat.
EUR/USD Exchange rate(monthly data, average)
80
100
120
140
160
180
200
220
30
40
50
60
70
80
90
100
110
120
130
140
Brent crude oil (USD/barrel; left-hand scale)
non-energy commodities (USD; index: 2005=100; right-hand scale)
Source: IMF monthly database.
Prices of crude oil and non-energy commodities
(monthly data)
80
100
120
140
160
180
200
220
240
260 metals (USD; index: 2005=100)
food (USD; index: 2005=100)
Source: IMF monthly database.
Prices of food and metals
(monthly data)

Quarterly Report, July, 2012
9
concerns about global demand, especially from China. On the other hand, the price of food
registered lower annual decline of 8.3%, due to favorable spring weather conditions and higher
expected supply of certain cereals. Part of the
decrease in the prices of primary products is explained by the appreciation of the US dollar
during this period.
In the first quarter of 2012, some of
the countries in the region had negative economic growth, while in the others the
slowdown continued (except Bulgaria). Decline in the economic activity has been reported
in Serbia and Croatia, which is the only country in the region to tap into a technical recession. This is
primarily due to the weak economic activity in the
EU, which caused a reduced export demand. Low external demand was also the main reason for the
significant slowdown in the economic growth of Romania at the beginning of the year. However,
due to the retained dynamics of investment
consumption, aided by the growing use of EU funds, the growth of the Romanian GDP remained
in the positive zone. On the other hand, Bulgaria is the only country in the region where the trend of
slowing of the economy was interrupted in the first quarter, mainly due to the growth of private
consumption and investment.
In the second quarter of 2012 in
most countries of the region the process of disinflation continued. The reduced rate of
inflation is particularly noticeable in Serbia, which
reflected the positive basic effect and suppressed domestic activity. Price growth slowed down also
in Turkey and Romania, due to downward trends in domestic food prices, while their change in the
opposite direction led to accelerated inflation rate
in Albania. Fastest price growth in this period was registered in Croatia, which was in part a
transmission effect of the VAT rate increase in March.
1.2. Domestic supply
In the first quarter of 2012, economic activity entered the zone of negative changes, given the extremely adverse weather conditions, and worsening global economic outlook. With the fall on a quarterly basis, the annual real GDP decline equaled 1.4%, and it followed the annual growth of 0.7% in the last quarter of the previous year. With the exception of financial intermediation, transport and public administration, the annual pace of all other activities slowed down compared to the previous quarter. In the first quarter, the industry was an activity with the largest negative contribution, partly as an effect of the deterioration of the global economic activity. On the other hand, the somewhat
-6.0
-4.0
-2.0
0.0
2.0
4.0
6.0
8.0
10.0
12.0
14.0
Q1 2010
Q2 Q3 Q4 Q1 2011
Q2 Q3 Q4 Q1 2012
Macedonia Croatia Turkey Bulgaria Serbia Albania Romania
Source: Eurostat and national statistical offices.
Real GDP growth in countries from the region(annual percentage changes, quarterly data)
0.0
2.0
4.0
6.0
8.0
10.0
12.0
14.0
Q1 2010
Q2 Q3 Q4 Q1 2011
Q2 Q3 Q4 Q1 2012
Q2
Macedonia Croatia Turkey Bulgaria Serbia Albania Romania Kosovo
Source: Eurostat and national statistical offices.
Inflation in countries from the region(annual percentage changes)
Quarterly Report, July, 2012
10
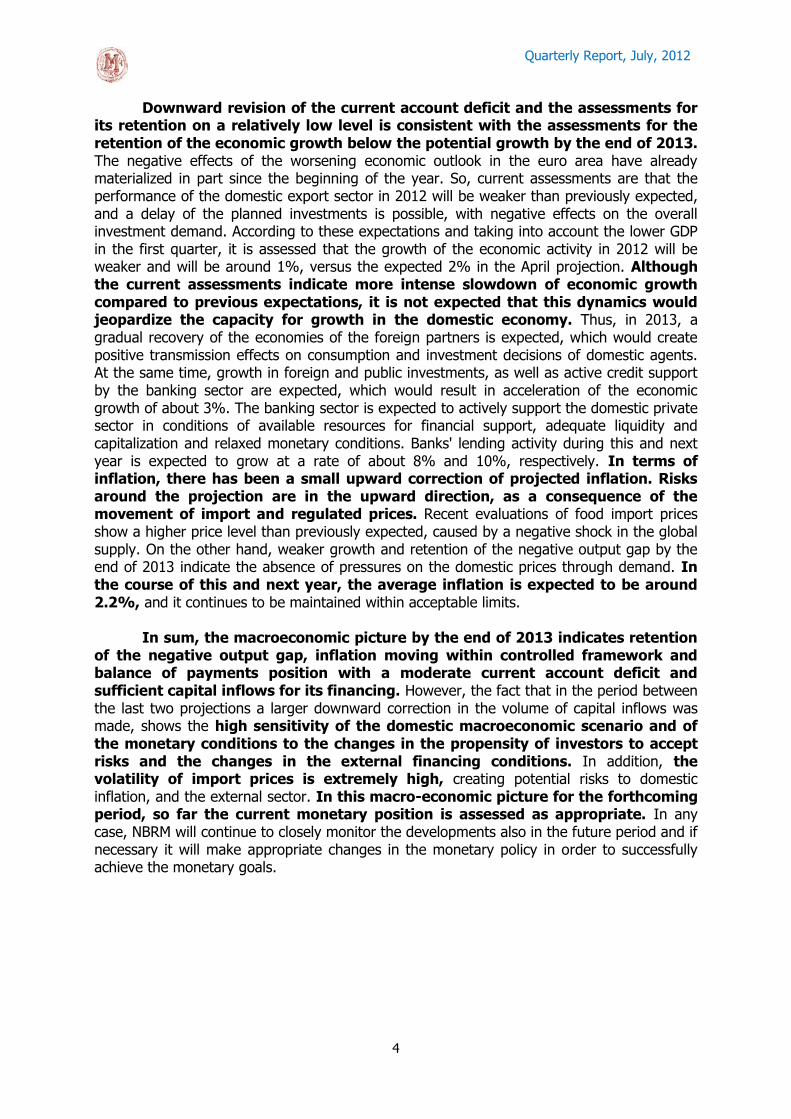
better results in services indicate the still present positive impulses from domestic demand. These developments indicate that the domestic production is highly determined by the worsened global environment, leading to a reduction in foreign demand and increased restraint of domestic economic entities. Moreover, the trajectory of the European crisis and the effectiveness of the response of economic policies remain crucial for the global economic outlook and prospects for the domestic economy.
In the first quarter of 2012, gross
domestic product6 registered a quarterly
decline (1.2% seasonally adjusted).
However, domestic production entered the zone of negative changes observed also on
an annual basis (a decline of 1.4%, which follows the growth of 0.7% in the previous
quarter). The negative growth of industrial
activity is the major determinant of the decline in the domestic output. With the exception of
November stagnation and slight growth in December, the trend of monthly decline in the
industrial activity which started in August 2011 was maintained until February 20127. March data on
the industrial output index indicate only slight
monthly increase. The largest contribution to the annual decline is that of the manufacturing
industry. Namely, the decline in external demand and lower export prices adversely affected part of
the export-oriented production facilities causing a
decline in the output. The lower production of oil derivatives had an additional effect. Poor
performances in the industry are in part associated with the unexpected bad weather, a factor whose
impact will be exhausted in the next period.
Worsening environment and weaker
performances of this segment are in part perceived also through the Survey on the
business tendencies in the manufacturing industry. Thus, the average capacity utilization in
the first quarter registered quarterly deterioration,
being reduced to a level below the historical average of the past eight years. The estimates of
the current production volume have also deteriorated. In terms of the factors that limit the
increase of production, the Survey indicates an increase in the limiting impact of domestic
demand, with almost unchanged pessimism
regarding foreign demand. The opinions in the surveys for the first two months of the second
quarter already point to strengthened pessimism, both in terms of domestic and in terms of foreign
demand. In addition, for the next three months,
managers expect a decline in production, implicitly referring to expectations for retained deterioration
6 GDP data for 2011 and 2012 are estimated data of the SSO. 7 Analyzed on a seasonally adjusted basis.
0.1
-1.8
-0.4
0.0
0.10.0
0.5 0.3
-1.4
1.0
-9.6 -9.8
0.3
5.8
-0.1
3.0 2.3
-1.4
-12.0
-10.0
-8.0
-6.0
-4.0
-2.0
0.0
2.0
4.0
6.0
8.0
Agriculture
Industr
y
Constr
uction
Tra
de
Hote
ls a
nd resta
ura
nts
Com
munic
ations
Fin
ancia
l in
term
edia
tion
Public a
dm
inis
tration
Tota
l
Real growth rates of individual sectors of GDP and their contributions to the total growth in
Q1.2012Contribution, p.p.
Growth, %
Source: State Statistical Office and NBRM.
-8.4
-0.5
0.6
-1.8
-0.6
-2.5 -1
.0
-0.5
2.0
-2.2
-2.9
1.0
-6.3
-0.6
0.0
-1.8 -0
.2
-2.3
-1.4
-2.1
2.7
-2.5
-1.4
3.3
-15-12-9-6-30369
121518
To
tal i
nd
ust
ry
Min
ing
Fo
od p
roduct
s
Weari
ng
ap
par
el
Pri
nit
ng
and
repro
duct
ion o
f re
cord
ed m
edia
Co
ke a
nd
petr
ole
um
pro
duct
s
No
n-m
eta
l min
era
ls
Basic
meta
ls
Meta
l pro
duct
s
Ele
ctri
cal e
quip
men
t
Energ
y, g
as,
ste
am
and a
ir
cond
itio
nin
g
Oth
er
Contributions of individual industries to the
total industrial production growth(percentage points)
2012-Q1
2012-Q2 (Apr-May)
Source: State Statistical Office and NBRM.
-20.0
-15.0
-10.0
-5.0
0.0
5.0
10.0
15.0
20.0
25.0
-10
-5
0
5
10
15
20
25
30
35
2004 Q
1Q
2Q
3Q
42005 Q
1Q
2Q
3Q
42006 Q
1Q
2Q
3Q
42007 Q
1Q
2Q
3Q
42008 Q
1Q
2Q
3Q
42009 Q
1Q
2Q
3Q
42010 Q
1Q
2Q
3Q
42011 Q
1Q
2Q
3Q
42012 Q
1Q
2*
GDP, Industry and managers' expectations for production volume
Expectations for the volume of production during the next 3 months
GDP, real growth rate, in % (right scale)
Industry, real growth rate, in % (right scale)
Source: State Statistical Office.
Quarterly Report, July, 2012
11
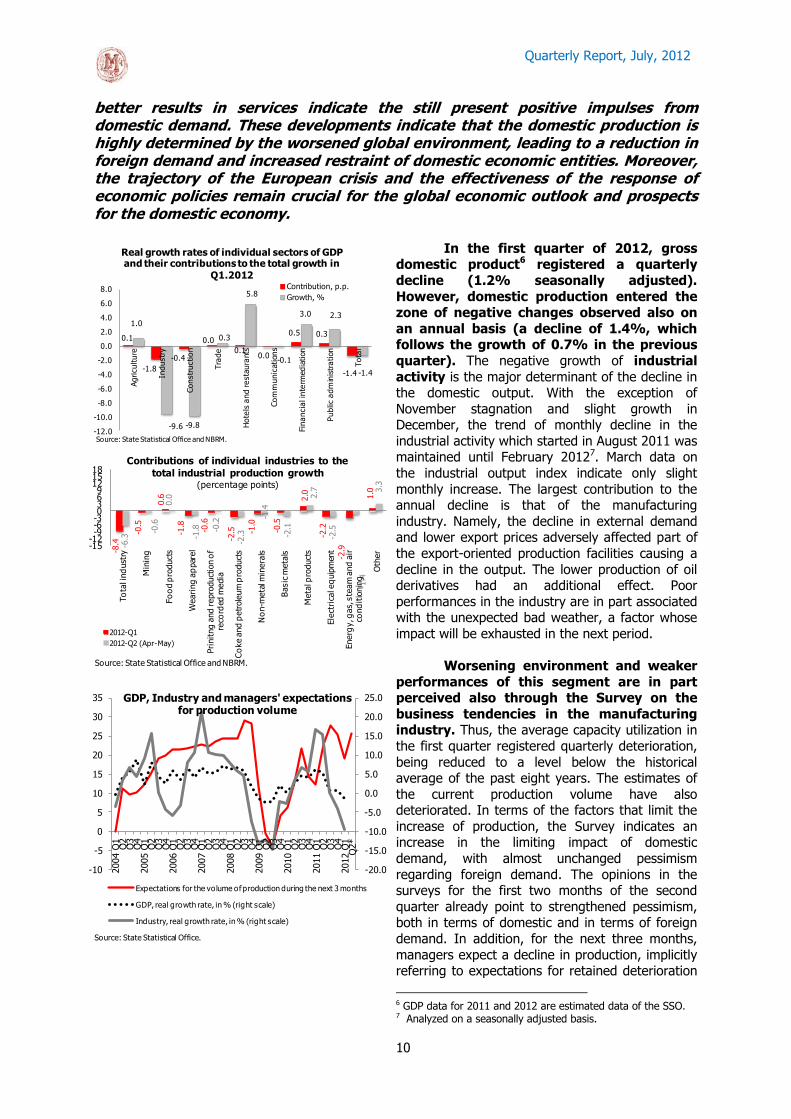
in the demand as a limiting factor also in the future.
The negative effect of the activity in
industry on the domestic supply was greatly
strengthened by the weaker efforts in the construction industry. Namely, in the first
quarter, construction activity showed a sharp quarterly and annual decline. Such a movement
which comes after a two-digit growth in the
previous period, is in large part associated with the severe drop in the worked effective hours in the
construction industry due to the extremely cold weather during the winter months. At the same
time, the annual decline in construction activity comes amid moderate real growth of public
investment, which, however, registered some
slowing in the quarterly dynamics in the first quarter. The Survey on business tendencies in the
construction indicates quarterly decline of the pessimism regarding the estimates for the current
economic situation, which corresponds to the
somewhat improved perceptions both in terms of the problem of insufficient demand, and in terms
of interest costs. Also, for the first time in three years, in the first quarter of 2012 positive
perceptions regarding the financial situation of enterprises outnumber the negative ones. In terms
of the expectations of the managers8 of
construction companies for the next three months, increased optimism compared with the previous
quarter is noted in the expectations for signing new contracts, with estimates for growth in the
sales prices and number of jobs. In the first
quarter, transport and communications registered a minimal annual decline, which is a
slowdown of the negative annual pace registered in the fourth quarter of the previous year. Trade
gave a positive contribution to the growth of
economic activity, but at slower annual growth compared with the previous quarter. At the same
time, the slower growth dynamics of value added in trade is consistent with the path of movement of
private consumption. On the other hand, assessments of the managers in the retail trade9 in
the first quarter indicate quarterly strengthening of
the positive perceptions about the current business situation of enterprises. At the same time,
according to the assessments of managers, the significance of the weak demand from buyers as a
limiting factor also decreases. Expectations of the
managers of commercial enterprises for the orders for the next three months are relatively less
8 From the Survey on business tendencies in construction, of the SSO, for the first quarter of 2012. 9 From the Survey on business tendencies in retail, of the SSO, for the first quarter of 2012.
-30.0
-20.0
-10.0
0.0
10.0
20.0
30.0
2007 Q
1
Q2
Q3
Q4
2008 Q
1
Q2
Q3
Q4
2009 Q
1
Q2
Q3
Q4
2010 Q
1
Q2
Q3
Q4
2011 Q
1
Q2
Q3
Q4
2012 Q
1
2012 Q
2
GDP, construction and expectations of the construction sector
Expectations for the total orders (agreements) during the
next 3 months Construction, real growth rates, in %
GDP, real growth rates, in %
Source: State Statistical Office.
-9.8
2.4 1.0
-40.5
14.7
-49.3
-60.0
-50.0
-40.0
-30.0
-20.0
-10.0
0.0
10.0
20.0
Valu
e a
dded in c
onst
ruct
ion
Govern
ment
capital in
vest
ments
Build
ings
(exc
ludin
g r
esi
dential)
Resi
dential buid
ings
Wate
rwork
s
Civ
il engin
eering (
exc
ludin
g
wate
rwork
s)
Contruction in 2012-Q1(real growth rates, in %)
Source: State Statistical Office and Ministry of finance.
-3.9
19.8
-6.0
-10.0
38.3
7.2
17.0
12.0
-20
-10
0
10
20
30
40
50
Tra
nsport
and
com
munic
ations
Tele
com
munic
ations
Passenger,
road
Passenger,
railw
ays
Goods, ro
ad
Goods, ra
ilw
ays
Passenger,
avio
transp
ort
Goods, avio
transport
Transports and communications in 2012-Q1
(real growth rates, in %)
Source: State Statistical Office.
-12
-7
-2
3
8
13
18
0
5
10
15
20
25
30
Q1 2
007
Q2
Q3
Q4
Q1 2
008
Q2
Q3
Q4
Q1 2
009
Q2
Q3
Q4
Q1 2
010
Q2
Q3
Q4
Q1 2
011
Q2
Q3
Q4
Q1 2
012
Q2
Trade, household final consumption and expectations
of managers of business entities engaged in retail
Expectations for
economic state
(left axis, balances
of answers)Growth of value
added in trade
(right axis, %)
Growth of private
consumption (right
axis, %)
Source: State Statistical Office.

Quarterly Report, July, 2012
12
favorable, but still there is stronger optimism regarding the business situation in the next six
months.
1.3. Aggregate demand
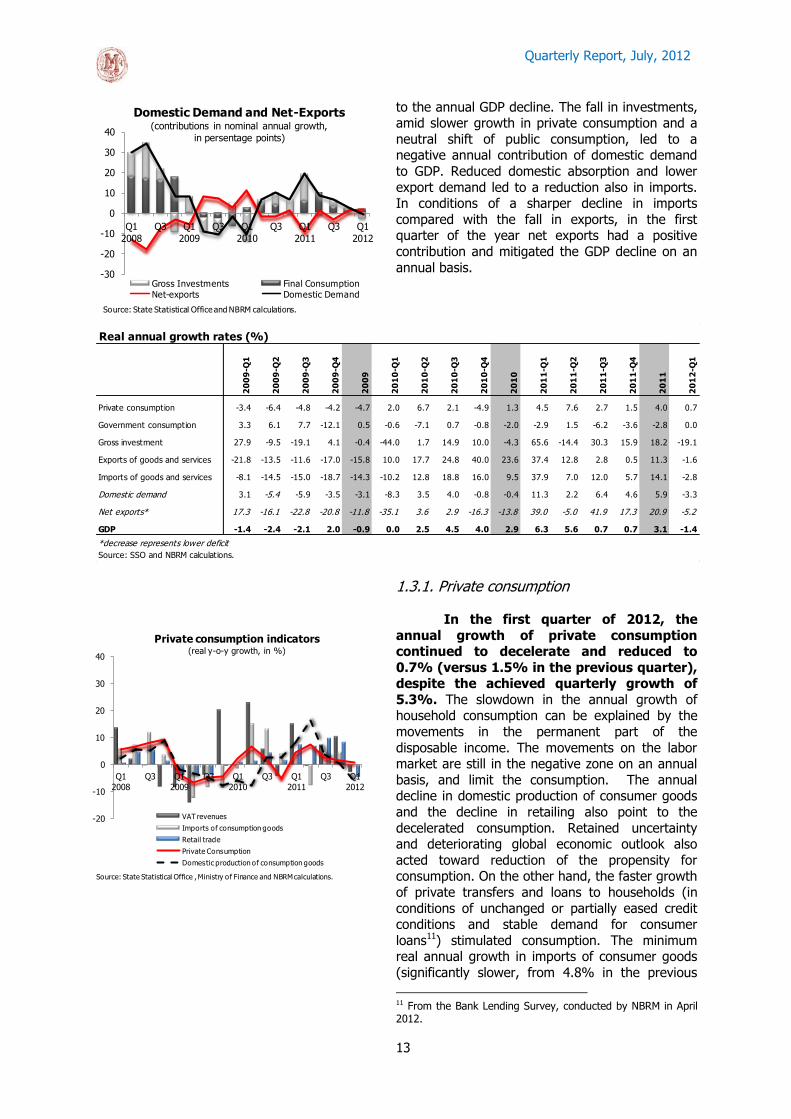
The decline in the economic activity in the first quarter was mainly due to the reduced investment demand. Namely, after the record high investments in 2011, in the first quarter of the year, they registered a significant quarterly decline, reflecting the turbulent global economic environment, and the extremely bad weather conditions that led to a slowdown of construction activity. Quarterly drop and the high comparison base caused a significant decline in investment also on annual basis, which resulted in a negative annual contribution of domestic demand to GDP. Unfavorable economic performance of the Euro area, lower demand for Macedonian products and lower export prices, whose negative effects have been felt since the second half of 2011, slowed down the quarterly dynamics of export growth, contributing to an annual decline of the activity in the export sector (for the first time after two years). Reduced absorption and lower exports eased the pressures on imports, which led to its sharper fall compared with the fall in exports. Thus, in the first quarter of the year, net exports had a positive contribution and acted toward mitigation of the quarterly decline in GDP.
In the first quarter of 2012, gross
domestic product entered the zone of
negative growth rates, registering a decline on a quarterly and annual basis (1.2%10 and
1.4%, respectively). The decline in the economic
activity followed the significant deceleration in the second half of 2011 (an average growth of 0.6%,
versus 6% in the first half of 2011) and was due to the negative contribution of investment and export
demand. Retained global uncertainty, coupled with
unexpected bad weather in the country has led to a decline in investment activity, which was a
component with the highest negative contribution
10 Seasonally adjusted.
Q 1
2011
Q 2
2011
Q 3
2011
Q 4
20112011
Q 1
2012
Q 1
2011
Q 2
2011
Q 3
2011
Q 4
20112011
Q 1
2012
9.8 3.0 -11.2 6.6 1.1 1.0 0.8 0.3 -1.3 0.8 0.1 0.1
16.8 15.2 0.2 -4.1 6.3 -9.6 2.9 2.6 0.0 -0.7 1.1 -1.8
21.9 23.4 9.0 10.4 14.7 -9.8 0.7 1.1 0.5 0.6 0.7 -0.4
3.8 15.7 2.5 3.8 6.4 0.3 0.6 2.2 0.4 0.5 0.9 0.0
5.7 9.0 16.7 10.9 11.2 5.8 0.1 0.1 0.2 0.1 0.1 0.1
6.0 1.2 2.5 -3.9 1.2 -0.1 0.6 0.1 0.2 -0.4 0.1 0.0
-1.9 -1.2 -2.4 0.9 -1.1 3.0 -0.4 -0.2 -0.4 0.1 -0.2 0.5
3.0 3.8 2.9 1.5 2.8 2.3 0.5 0.5 0.4 0.2 0.4 0.3
7.2 8.5 0.3 1.0 4.0 -1.9 6.3 7.3 0.3 0.9 3.5 -1.7
0.2 -10.7 3.0 -0.8 -2.1 2.7 0.0 -1.5 0.4 -0.1 -0.3 0.3
6.3 5.6 0.7 0.7 3.1 -1.4 6.3 5.6 0.7 0.7 3.1 -1.4
Source: State Statistical Office and calculations of NBRM.
Public administration and defence, compulsory
social security, Education, Health and social work
Value Added
Net taxes on products
Gross Domestic Product
Mining and quarrying, Manufacturing and
Electricity, gas and water supply
Construction
Wholesale and retail trade; repair of motor
vehicles, motorcycles and personal and household
goodsHotels and restaurants
Transport, storage and communication
Financial intermediation, Real estate, renting and
business activities, Other community, social and
personal service activities and Imputed rents
real growth rates, in % contribution to GDP growth (in p.p.)
Agriculture, hunting, forestry and Fishing
-3.9
19.8
-6.0
-10.0
38.3
7.2
17.0
12.0
-20
-10
0
10
20
30
40
50
Сооб
раќа
ј и к
омун
икац
ии
Теле
фон
ија
Пат
ничк
и па
тен
Пат
ничк
и ж
елез
ничк
и
Това
рен
пате
н
Това
рен
жел
езни
чки
Пат
ничк
и во
здух
опло
вен
Това
рен
возд
ухоп
лове
н
Сообраќајот и врските во 2012-Кв.1(реални годишни стапки на раст, во проценти)
Извор: Државен завод за статистика.
-15
-10
-5
0
5
10
15
20
Q1 2
008
Q2
Q3
Q4
Q1 2
009
Q2
Q3
Q4
Q1 2
010
Q2
Q3
Q4
Q1 2
011
Q2
Q3
Q4
Q1 2
012
Contribution to real annual GDP growth
(in percentage points)
Private consumption Government consumption
Gross investments Net-exports
GDP
Source: State Statistical Office and NBRM calculations.
Quarterly Report, July, 2012
13
to the annual GDP decline. The fall in investments, amid slower growth in private consumption and a
neutral shift of public consumption, led to a negative annual contribution of domestic demand
to GDP. Reduced domestic absorption and lower
export demand led to a reduction also in imports. In conditions of a sharper decline in imports
compared with the fall in exports, in the first quarter of the year net exports had a positive
contribution and mitigated the GDP decline on an
annual basis.
1.3.1. Private consumption
In the first quarter of 2012, the
annual growth of private consumption continued to decelerate and reduced to
0.7% (versus 1.5% in the previous quarter), despite the achieved quarterly growth of
5.3%. The slowdown in the annual growth of household consumption can be explained by the
movements in the permanent part of the
disposable income. The movements on the labor market are still in the negative zone on an annual
basis, and limit the consumption. The annual decline in domestic production of consumer goods
and the decline in retailing also point to the
decelerated consumption. Retained uncertainty and deteriorating global economic outlook also
acted toward reduction of the propensity for consumption. On the other hand, the faster growth
of private transfers and loans to households (in
conditions of unchanged or partially eased credit conditions and stable demand for consumer
loans11) stimulated consumption. The minimum real annual growth in imports of consumer goods
(significantly slower, from 4.8% in the previous
11 From the Bank Lending Survey, conducted by NBRM in April 2012.
Real annual growth rates (%)
20
09
-Q1
20
09
-Q2
20
09
-Q3
20
09
-Q4
20
09
20
10
-Q1
20
10
-Q2
20
10
-Q3
20
10
-Q4
20
10
20
11
-Q1
20
11
-Q2
20
11
-Q3
20
11
-Q4
20
11
20
12
-Q1
Private consumption -3.4 -6.4 -4.8 -4.2 -4.7 2.0 6.7 2.1 -4.9 1.3 4.5 7.6 2.7 1.5 4.0 0.7
Government consumption 3.3 6.1 7.7 -12.1 0.5 -0.6 -7.1 0.7 -0.8 -2.0 -2.9 1.5 -6.2 -3.6 -2.8 0.0
Gross investment 27.9 -9.5 -19.1 4.1 -0.4 -44.0 1.7 14.9 10.0 -4.3 65.6 -14.4 30.3 15.9 18.2 -19.1
Exports of goods and services -21.8 -13.5 -11.6 -17.0 -15.8 10.0 17.7 24.8 40.0 23.6 37.4 12.8 2.8 0.5 11.3 -1.6
Imports of goods and services -8.1 -14.5 -15.0 -18.7 -14.3 -10.2 12.8 18.8 16.0 9.5 37.9 7.0 12.0 5.7 14.1 -2.8
Domestic demand 3.1 -5.4 -5.9 -3.5 -3.1 -8.3 3.5 4.0 -0.8 -0.4 11.3 2.2 6.4 4.6 5.9 -3.3
Net exports* 17.3 -16.1 -22.8 -20.8 -11.8 -35.1 3.6 2.9 -16.3 -13.8 39.0 -5.0 41.9 17.3 20.9 -5.2
GDP -1.4 -2.4 -2.1 2.0 -0.9 0.0 2.5 4.5 4.0 2.9 6.3 5.6 0.7 0.7 3.1 -1.4
*decrease represents lower deficit
Source: SSO and NBRM calculations.
-30
-20
-10
0
10
20
30
40
Q1
2008
Q3 Q1
2009
Q3 Q1
2010
Q3 Q1
2011
Q3 Q1
2012
Domestic Demand and Net-Exports(contributions in nominal annual growth,
in persentage points)
Gross Investments Final ConsumptionNet-exports Domestic Demand
Source: State Statistical Office and NBRM calculations.
-20
-10
0
10
20
30
40
Q1
2008
Q3 Q1
2009
Q3 Q1
2010
Q3 Q1
2011
Q3 Q1
2012
Private consumption indicators (real y-o-y growth, in %)
VAT revenues
Imports of consumption goods
Retail trade
Private Consumption
Domestic production of consumption goods
Source: State Statistical Office , Ministry of Finance and NBRM calculations.

Quarterly Report, July, 2012
14
quarter to just 0.3%) and lower level of inventories of commercial enterprises12 than usual
for the season, indicate that probably a large part of the household consumption is covered by
imports and inventories. For the second quarter
of 2012, further downward adjustment of private consumption according to the latest
available data13 and the high comparison base from the same period in 2011 is
expected. In terms of sources of funding, recent
data point to a slowdown of the dynamics of the real annual growth of household lending and
pensions, while the inflation slowdown led to slower real annual fall of wages. Production and
imports of consumer goods registered real annual decline, amid real decline of retailing. The
expectations of the managers of commercial
enterprises for the second quarter of 2012 also point to slower movement of private consumption.
They also have less favorable expectations regarding the orders, stagnant expectations
regarding the sales prices and more favorable
expectations regarding the business situation in enterprises and the number of employees14.
1.3.2. Public consumption
In the first quarter of 2012, public consumption registered a quarterly growth
(1.4% seasonally adjusted), which resulted in disruption of the annual decline (annual
change of 0%, versus a decline of 3.6% in the previous quarter). Moreover, in terms of
components, the annual increase in the cost of
goods and services was the main factor that led to the suspension of the fall in total public
consumption, which in the first quarter of 2012 remained unchanged compared to the same period
of the previous year. According to the total
expenditures of the central government and funds in April and May 2012 (real decrease in the cost of
goods and services, wages, other transfers and slower growth of the health fund), for the
second quarter a real annual fall in public consumption is estimated.
12 From the Survey on business tendencies in retail, conducted by the SSO in the first quarter of 2012. 13 Data on domestic production of consumer goods, pensions, VAT, import of consumer goods and household credits are as of May, while the data on wages and retail are as of April. 14 From the Survey on business tendencies in retail, of the SSO, conducted in the first quarter of 2012.
-6,000
-4,000
-2,000
0
2,000
4,000
6,000
Q1 2
008
Q2
Q3
Q4
Q1 2
009
Q2
Q3
Q4
Q1 2
010
Q2
Q3
Q4
Q1 2
011
Q2
Contributions of the components to the annual nominal growth of the
government consumption(in million denars)
Wages Spending on goods and services
Health fund Transfers to local governments
Other Government consumption
Source: Ministry of Finance and State Statistical Office.

Quarterly Report, July, 2012
15
Appendix 1: Fiscal policy
In the period January-May 2012, in the Budget of the Republic of Macedonia
(central budget and budgets of funds) total revenues of 11.7% of GDP15 were generated. Compared to the same period last year budget revenues were lower by 1.8%. In conditions
of a decline in the economic activity in the first quarter and present negative trends in the first two months of the second quarter, total tax revenues decreased by 2.8% annually, which was mostly due
to lower revenues based on VAT, which were lower by 6.2% on an annual basis. Reduction was reported also in the profit tax (by 6.2%), while income taxes and revenues from import duties
increased annually by 2% and 11%, respectively. Total contributions were higher by 3.8% on an
annual basis, while non-tax revenues registered a decline of 15.3%.
Total budget expenditures in the period January-May 2012 amounted to 12.9% of
GDP. Budget expenditures declined by 3.3% annually. The reduction of the total expenditures is mostly a result of the lower current costs (by 2.3% annually), mainly due to the decline in the
category other transfers16. Capital expenditures were lower by 10.8% on an annual basis and explain about 40% of the decline of total budget expenditures in this period.
15 Within the analysis, for the nominal GDP for 2012 the projection of the Ministry of Finance is used. 16 This category includes, inter alia, transfers to local governments in the form of block grants and subsidies to farmers. Moreover, the reduction of the remaining transfers in large part explains the time discrepancy in the payment of subsidies to farmers in 2011 and 2012. Thus, in 2011, most of the subsidies were paid during April and May, while in 2012 they were paid during June and July.
-4.0
-3.0
-2.0
-1.0
0.0
1.0
2.0
4.0
5.0
6.0
7.0
8.0
9.0
10.0
11.0
12.0
13.0
Q1.2
008
Q2
Q3
Q4
Q1.2
009
Q2
Q3
Q4
Q1.2
010
Q2
Q3
Q4
Q1 2
011
Q2
Q3
Q4
Q1 2
012
Q2*
Budget revenues and expenditures(in % of GDP)
Revenues
Expenditures
Budget balance (right scale)
* Refers to April and May 2012.Source: Ministry of Finance.
3.0
4.0
5.0
6.0
7.0
8.0
9.0
10.0
11.0
12.0
13.0
Q1.2
008
Q2
Q3
Q4
Q1.2
009
Q2
Q3
Q4
Q1.2
010
Q2
Q3
Q4
Q1 2
011
Q2
Q3
Q4
Q1 2
012
Q2*
Structure of budget expenditures
(in % of GDP)
Capital expenditures
Current expenditures
* Refers to April and May 2012.Source: Ministry of Finance.

Quarterly Report, July, 2012
16
In the period January-May 2012, the budget deficit amounted to Denar 5,419 million or 1.1% of GDP, which is about 45% of the projected budget deficit for 2012.
Financing of the budget deficit in this period was mostly done through borrowing on the domestic market through new issues of government securities, with a significantly higher proportion of the total
domestic borrowing being accomplished in the months of April and May. Additional inflows, although
in much smaller amount, were generated by borrowing abroad. Net inflows from the total indebtedness of the government were higher than the budget deficit in this period, which provided
additional accumulation of deposits on the government account with the NBRM (a total of Denar 3,930 million). According to the latest available data, the central government debt as of May 31,
2012 amounted to 29.1% of GDP.
Table
Budget (Central Budget and Funds)
Source: Ministry of Finance.
At the beginning of June 2012, the Supplementary Budget of the Republic of
Macedonia for 2012 was adopted for the purpose of timely and effective consolidation of public
-18,000
-15,000
-12,000
-9,000
-6,000
-3,000
0
3,000
6,000
9,000
12,000
15,000
18,000
Q1.2
008
Q2
Q3
Q4
Q1.2
009
Q2
Q3
Q4
Q1.2
010
Q2
Q3
Q4
Q1 2
011
Q2
Q3
Q4
Q1 2
012
Q2**
Privatisations inflows Domestic financing, net
External financing, net Change in deposits*
Budget balance
Budget balance financing(in Denar million)
* Positive change- deposits withdrawal; negative change-deposits accumulation.** Refers to April and May 2012.Source: Ministry of finance of the Republic of Macedonia.
22.425.9
19.614.7 13.7
16.5 17.021.7 20.4
13.3
12.5
12.4
9.36.9
7.3 7.8
6.9 8.6
0.0
5.0
10.0
15.0
20.0
25.0
30.0
35.0
40.0
45.0
50.0
2004 2005 2006 2007 2008 2009 2010 2011 May
2012
Central Government debt (consolidated)
External debt (in % of GDP)
Domestic debt (in % of GDP)
Central Government debt, total (in % of GDP)
Source: Ministry of Finance.
2012 Budget
Supplement
to 2012
Budget
Jan Feb Mar K1 Apr May Jan-May
Jan-May 2012 /
Jan-May 2011,
in %
Jan-May
realization
in % of
Budget
TOTAL BUDGET REVENUES 156,750 149,532 10,352 10,332 11,114 31,798 13,714 10,332 55,844 -1.8 37.3
Tax revenues and contributions 128,913 123,766 8,985 9,009 9,878 27,872 10,237 9,039 47,148 -0.5 38.1
Taxes 85,841 81,843 6,245 5,586 6,386 18,217 6,715 5,526 30,458 -2.8 37.2
Contributions 42,620 41,471 2,690 3,354 3,401 9,445 3,460 3,450 16,355 3.8 39.4
Non-tax revenues 17,188 15,196 824 1,043 915 2,782 888 1,026 4,696 -15.3 30.9
Capital revenues 5,945 5,815 437 138 171 746 2,510 115 3,371 9.2 58.0
Donations from abroad 4,104 4,155 69 108 103 280 66 95 441 -6.6 10.6
Revenues of recovered loans 600 600 37 34 47 118 13 57 188 -53.0 31.3
TOTAL BUDGET EXPENDITURES 169,198 161,667 11,781 12,203 12,344 36,328 13,603 11,332 61,263 -3.3 37.9
Current expenditures 142,190 140,231 10,102 10,638 11,373 32,113 12,068 10,440 54,621 -2.3 39.0
Capital expenditures 27,008 21,436 1,679 1,565 971 4,215 1,535 892 6,642 -10.8 31.0
BUDGET DEFICIT/SURPLUS -12,448 -12,135 -1,429 -1,871 -1,230 -4,530 111 -1,000 -5,419 -16.1 44.7
Financing 12,448 12,135 1,429 1,871 1,230 4,530 -111 1,000 5,419
Inflows 17,769 17,676 1,819 2,168 1,435 5,422 356 1,448 7,226
Privatization receipts 0 0 0 0 0 0 0 0 0
Foreign loans 17,669 13,876 122 203 520 845 51 326 1,222
Deposits -100 0 1,298 1,972 112 3,382 -1,592 -5,720 -3,930
Treasury bills 0 3,600 399 -7 783 1,175 1,864 6,842 9,881
Sell of stocks 200 200 0 0 20 20 33 0 53
Outflows 5,321 5,541 390 297 205 892 467 448 1,807
Amortization of debt (principal repayment) 5,321 5,541 390 297 205 892 467 448 1,807
External debt 3,471 3,613 258 297 205 760 335 448 1,543
Domestic debt 1,850 1,928 132 0 0 132 132 0 264
plan, in Denar million realized, in Denar million

Quarterly Report, July, 2012
17
finances and fiscal policy adjustment to the trends in the economy. As pointed out by the Ministry of Finance17, given that the Budget for 2012 was passed in conditions of uncertainty and risks from the
debt crisis in Europe, the Supplementary Budget aims to provide fiscal policy adjustment in line with the current realization and the expected stabilization of the economic activity by the end of the year.
However, the Ministry of Finance outlines the realized movements in the first quarter, the lower total
revenues compared to the planned since the beginning of the year and the need to limit public consumption in order to keep the budget deficit of 2.5% of GDP, for the purpose of preserving
macroeconomic stability, as the main reasons for the adoption of the Supplementary Budget for 2012. Within the Supplementary Budget a revision was made to the initially planned revenues toward their
reduction by 4.6%, while the planned expenditures were reduced by 4.5% compared to the initially
planned amount. Doing so, provides maintenance of the initially planned budget deficit under 2.5% of GDP.
At the beginning of June, the Government of the Republic of Macedonia adopted a new
package of economic and social measures18 aimed at mitigating the negative effects that the Euro area debt crisis has on the domestic economy. The package includes a total of 12
measures, 4 of which are aimed at directly reducing unemployment through public works programs,
private sector lending projects, training for a known employer and allocation of state land with usufruct right to socially unprotected people. The remaining eight measures are intended to provide
additional resources for support of the private sector (including recapitalization of the Macedonian Bank for Development Promotion in the amount of Denar 660 million), than for support of the socially
vulnerable families, legalization of fixed assets of farmers and support for the transport sector.
According to the Government of the Republic of Macedonia, measures are aimed at improving the position and competitiveness of the population and the business sector, through a systemic approach,
and in part they are directed towards socially vulnerable groups and have a direct impact on improving the standard of that social group.
1.3.3. Investment consumption
As in the previous quarter, also in the first quarter of 2012, investment
demand had a negative quarterly dynamics
(22.1%, seasonally adjusted). The quarterly drop and the high comparison base caused
an annual decline in investments of 19.1% and are a component with the most
significant contribution to the slower activity in the domestic economy. Global uncertainty
which resulted in increased risk aversion of
domestic and foreign investors, as well as the extraordinary weather conditions that prevailed
during this period of the year were the main factors influencing these movements. Moreover, it
is estimated that the decline is a result of
investments in fixed assets, a conclusion that is confirmed by almost all high frequency data. Thus,
on an annual basis completed construction works declined, which meant cessation of the persistent
double-digit growth rates achieved in the past six
quarters. The strong decline in the imports of capital goods, reduced domestic production of
17 Supplementary Budget of the Republic of Macedonia for 2012, http://www.finance.gov.mk. 18 More detail on the new package of economic and social measures are given on the website of the Government of the Republic of Macedonia http://www.vlada.mk.
-75
-50
-25
0
25
50
75
100
125
Q1 2008
Q3 Q1 2009
Q3 Q1 2010
Q3 Q1 2011
Q3 Q1 2012
Gross investment and indicative series(real annual growth rates, %)
Completed construction work
Domestic production of capital goods
Profit tax
Gross investments (right scale)
Imports of capital goods
Source: State Statistical Office, Ministry of Finance and NBRM calculations.

Quarterly Report, July, 2012
18
capital goods, as well as the income tax from the previous quarter also point to a decline. Regarding
other indicators, foreign direct investments (in equity) are significantly lower (about 4 times), due
to high inflows on this basis in the same period last
year. Despite the simultaneous tightening of the conditions for long-term loans to enterprises, they
registered an improved growth dynamics. Moreover, the demand for long-term corporate
loans is mostly affected by the increased demand
for investments in inventory and working capital, rather than investments in fixed assets19. For the
second quarter of 2012, estimates point to a further reduction of investments on an
annual basis in accordance with the indications of the data available20, deteriorating economic
outlook particularly in the Euro area and
unfavorable expectations of economic agents. The latest available data, which indicate downward
movements, are the value of completed construction works, public capital investment,
domestic production of capital goods, imports of
capital goods, and foreign direct investments, while growth is retained only in long-term
corporate loans. On the other hand, managers in construction activity have slightly more favorable
expectations for the second quarter21 regarding the total orders, number of employees and sales
prices, compared to the previous quarter.
1.3.4. Net export demand In line with the deteriorated
international economic environment and
transmission effects on the domestic economy, after two years of steady growth,
in the first quarter of 2012 an annual decline both on the export and on the import side
was observed. Decline in exports along with
reduced absorption led to stronger adjustment of imports. Thus, net exports
recorded a positive contribution of 1.5 p.p. to the annual change in GDP and helped
mitigate the decline in GDP.
In the first quarter of 2012, negative
annual growth rates in the export of goods and services were realized for the first time in two
years. The slowing quarterly growth dynamics (from 4% to 2.8%, seasonally adjusted), and the
high comparison base, resulted in an annual 19 From the Bank Lending Survey, conducted by the National Bank in April 2012. 20 Data on completed construction works and foreign direct investments (in equity) are given as of April, while the remaining data are given as of May. 21 From the Survey on business tendencies in construction, of the SSO, conducted in the first quarter of 2012.
-50-40-30-20-1001020304050607080
-200
-100
0
100
200
300
400
500
600
700
Q1 2
008
Q2
Q3
Q4
Q1 2
009
Q2
Q3
Q4
Q1 2
010
Q2
Q3
Q4
Q1 2
011
Q2
Q3
Q4
Q1 2
012
Gross investments and determinants(nominal annual growth rates, %)
FDI (left scale)
Government investments (left scale)
Gross investments (right scale)
Long term credits to enterprises (right scale)
Source: State Statistical Office, Ministry of Finance and NBRM calculations.
-25000
-15000
-5000
5000
15000
25000
Q1 2
008
Q2
Q3
Q4
Q1 2
009
Q2
Q3
Q4
Q1 2
010
Q2
Q3
Q4
Q1 2
011
Q2
Q3
Q4
Q1 2
012
Export and Import nominal changes(y-o-y, in milion denars)
Import Export Net exports
Source: State Statistical Office .

Quarterly Report, July, 2012
19
decline in the exports of goods and services by 1.6%. The sharper decline in foreign effective
demand and the reduction in the international prices of our export products, particularly metals,
were the major cause for the reduced production
and sales of the export-oriented domestic processing sector. Reduction of domestic and
export demand led to a contraction also of the imports of goods and services, which had a real
annual fall of 2.8% in the first quarter of 2012
(despite the growth of 5.8% on a quarterly basis, seasonally adjusted).
Continued deepening of the crisis in the
Euro area, the decline in world export prices, as well as the less favorable expectations of
companies for the volume of production and
purchasing and selling prices for the second quarter22, point to further downward shifts in
foreign trade. These indications are confirmed by the performance for the first two months of the
second quarter (according to external statistics)
and indicate an annual exports decline and low import growth due to high imports of raw materials
for the production of the large export-import companies. Consequently, net exports are
estimated to have a negative annual contribution to the annual change in GDP in the second quarter
of 2012.
1.4. Employment and wages
The movements on the labor market in the first quarter were relatively favorable. Total employment in the first quarter of 2012 increased on a quarterly basis, thus interrupting the trend of continuous quarterly decrease, present throughout 2011. These adjustments in the labor market may be explained as delayed spillover effects of the quarterly growth of the economic activity in recent quarters. Increased demand for labor led to a reduction in unemployment, with the unemployment rate registering a decline for the first time after four quarters of growth. However, on an annual basis, downward adjustment continued, but at a slower pace. Such unfavorable movements did not have a negative effect on the price aspect of labor, where slight acceleration of the nominal annual growth of wages and slowdown in their real decline was registered. In terms of future developments on the labor market, although according to the surveys on the business tendencies, expectations for the number of employees for the next quarter are mainly favorable, the latest developments in the domestic and global economy indicate significant adverse risks.
After four quarters of continuous
reduction of labor demand, in the first
quarter of 2012 the number of employees for the first time registered a quarterly
22 From the Survey on business tendencies in manufacturing industry, of the SSO, conducted in May 2012.

Quarterly Report, July, 2012
20
growth. Namely, after the faster decline in the number of employees in the first half of 2011 (of
1.2% on average) and the deceleration of the quarterly decline in the second half (of 0.4% on
average), already in the first quarter of 2012, the
number of employees increased by 1.3%23. Such a shift in the number of employees, led to a slight
increase in the employment rate of 0.3 percentage points compared with the previous quarter.
Considering the time lag of the adjustment of the
labor market, the growth may be explained by the dynamics of economic activity in the previous
period. In fact, since 2010, the quarterly changes in economic activity have been mostly positive,
which probably has an effect in terms of creating new jobs. The analysis of employment by
economic status of employees showed that the
upward dynamics of labor demand in the last three quarters, and especially in the first quarter of
2012, results primarily from the growth in the category "employees"24. On annual basis, the
number of employees decreased slightly by
0.9%, which caused a decline in the employment rate by 0.7 percentage points. The analysis by
activity shows that the annual employment decline stems primarily from the decline in agriculture and
trade, while the highest growth in the number of employees is registered in the manufacturing
industry and in other service activities.
In terms of labor demand in the next
period, the short-term expectations of manufacturers are mostly favorable. The
expectations of managers in construction and
trade are more favorable compared to the previous quarter, while in industry they show a slight
deterioration25. However, the annual decline of the economy in the first quarter of 2012 and the
further decline of production and employees in the
industry in the first two months of the second quarter of 2012, as well as the downward
correction of the expectations for the foreign
23 The analysis of the quarterly dynamics of employment, unemployment and total active population is made with seasonally adjusted data. Seasonal adjustment is not made only in the total working population, due to the absence of seasonal dynamics in this series. 24 Starting from January 2011, the State Statistical Office has been applying the new National Classification of Economic Activities (NACE rev. 2) for compilation of data on the money market (wages and employment). The change in classifications did not allow the quarterly analysis of employment, wages, productivity and unit labor costs in different economic activities. Comparable data for activities according to the new classification is available only for the annual changes. 25 Source: State Statistical Office, Surveys on the business tendencies in manufacturing industry (May 2012), construction (first quarter of 2012) and trade (first quarter of 2012).
34.0
35.0
36.0
37.0
38.0
39.0
40.0
41.0
Q1
2008
Q3 Q1
2009
Q3 Q1
2010
Q3 Q1
2011
Q3 Q1
2012
Employment rate(in %)
employment rate (not seasonaly adjusted)
employment rate (seasonaly adjusted)
Source: State Statistical Office, Labour Force Survey.
-20000.0
-15000.0
-10000.0
-5000.0
0.0
5000.0
10000.0
15000.0
20000.0
25000.0
Q1
2008
Q3 Q1
2009
Q3 Q1
2010
Q3 Q1
2011
Q3 Q1
2012
Employed by economic status(q-o-q changes, persons)
unpaid family workerself-employedemployeremployedtotal
Source: State Statistical Office, Labor Force Survey.

Quarterly Report, July, 2012
21
demand point to negative risks that could adversely affect the labor market.
The upward shift of labor demand in
the first quarter of the year caused a
moderate growth in the labor supply. Same as with employment, the active population has
registered quarterly increase in the last three quarters. Thus, after the quarterly slowdown in the
decline in the third quarter and limited growth in
the fourth quarter of the year before, in the first quarter of 2012, the growth rate of the active
population accelerated to 0.7%. However, in conditions of growth of the working-age inactive
population, the activity rate remained almost unchanged. On annual basis, the total active
population registered a minimal decrease of
0.3%, with a simultaneous decrease in the activity rate by 0.7 pp. Although minimal, the
reduction of the active population has been present for three consecutive quarters. The
analysis in terms of age, indicates that the reduced
supply of labor in the first quarter is mainly due to the lower propensity to work mainly among
persons aged 15 to 24, and due to the transition to the status of retired persons, among those aged
over 65.
In conditions of a small quarterly
increase in the labor supply and given the faster growth of labor demand, in the first
quarter of the year unemployment declined. This is the first reduction in the number of jobless
persons after three quarters of growth. Thus, the
total number of unemployed persons decreased by 0.5% while the unemployment rate fell by 0.4
percentage points. On annual basis, the reduced labor supply, in conditions of larger slowdown in
the growth of labor demand caused an increase in
unemployment of 0.9% and in the unemployment rate (of 0.4 percentage points), which reached
31.6%. In terms of the age structure, the annual growth of total unemployment is due mainly to
rising unemployment among persons aged 15 to 49.
Regarding the cost of labor, on a quarterly basis, nominal wages moderately
decreased (-0.7% on a net and -0.8% on a gross basis). Reduction of wages in the first
quarter is present in almost two-thirds of the
activities26. The quarterly fall in nominal wages was accompanied by increased inflation. Thus,
after two quarters of growth, the real purchasing
26 Exceptions are few services and the activity "power supply", where higher wages are paid compared to the previous quarter.
-8.0
-6.0
-4.0
-2.0
0.0
2.0
4.0
6.0
50
51
52
53
54
55
56
57
58
59
Q1
2008
Q3 Q1
2009
Q3 Q1
2010
Q3 Q1
2011
Q3 Q1
2012
Labour force, inactive population and participation rate
(in %)
activity rate
labour force (y-o-y changes, right scale)
Inactive population (y-o-y changes, right scale)
Source: State Statistical Office, Labor Force Survey.
28
29
30
31
32
33
34
35
36
-12.0
-10.0
-8.0
-6.0
-4.0
-2.0
0.0
2.0
4.0
6.0
8.0
10.0
Q1 2008
Q3 Q1 2009
Q3 Q1 2010
Q3 Q1 2011
Q3 Q1 2012
Unemployment rate (y-o-y, in p.p.)
15 years nad over
15-24
25-49
50-64
unemployment rate, in % (right scale)
Source: State Statistical Office, Labor Force Survey.
nominal
changes
real
changes
Agriculture, forestry and fishing 7.2 4.5
Mining and quarrying -6.5 -8.8
Manufacturing 0.6 -1.9
Electricity supply 4.4 1.8
Water supply 1.0 -1.5
Construction 3.0 0.4
Trade 2.4 -0.1
Transportation and storage 0.3 -2.1
Accomodation and food service activities 0.9 -1.6
Information and communication 18.9 16.0
Financial and insurance activities -7.3 -9.6
Real estate activities 10.3 7.6
Scientific activities 18.2 15.2
Administrative activities -4.0 -6.4
Public administration and defence 1.2 -1.3
Education -0.8 -3.3
Health and social work 1.9 -0.6
Arts, entertainment and recreation -5.2 -7.5
Other service activities 0.2 -2.3
Source: State Statistical Office.
Annual changes in average paid net wage by sectors in Q1.2012
(in %)
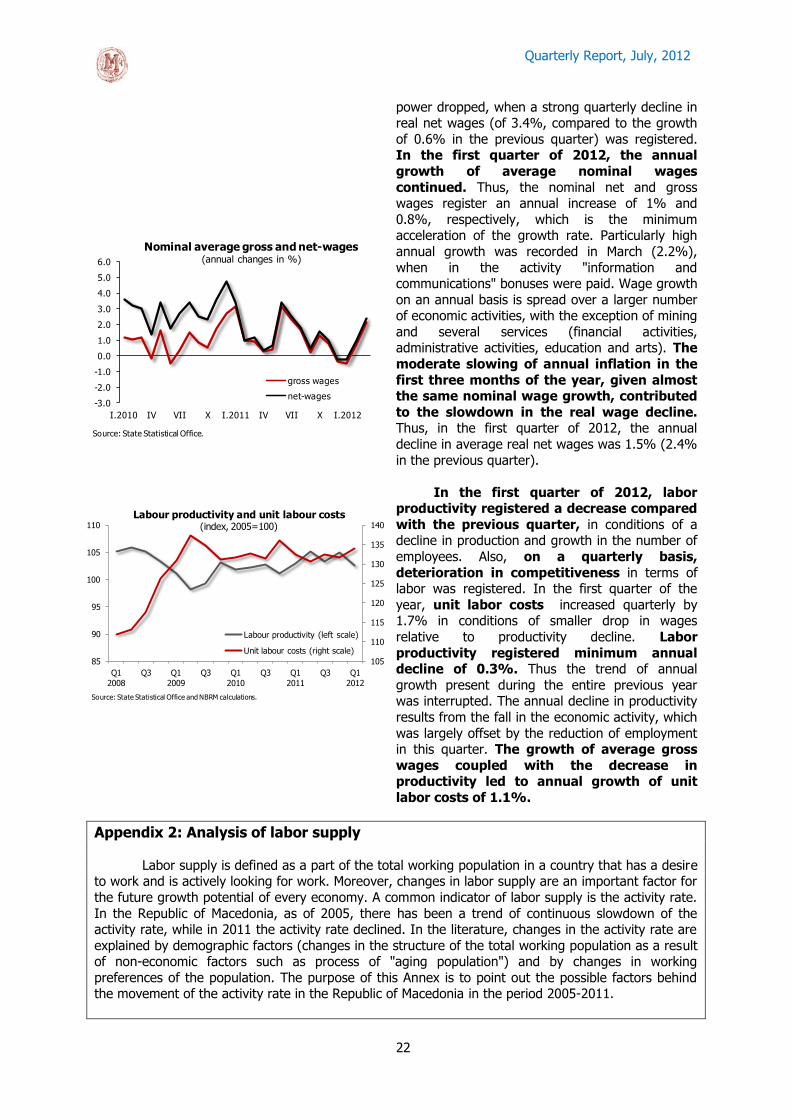
Quarterly Report, July, 2012
22
power dropped, when a strong quarterly decline in real net wages (of 3.4%, compared to the growth
of 0.6% in the previous quarter) was registered. In the first quarter of 2012, the annual
growth of average nominal wages
continued. Thus, the nominal net and gross wages register an annual increase of 1% and
0.8%, respectively, which is the minimum acceleration of the growth rate. Particularly high
annual growth was recorded in March (2.2%),
when in the activity "information and communications" bonuses were paid. Wage growth
on an annual basis is spread over a larger number of economic activities, with the exception of mining
and several services (financial activities, administrative activities, education and arts). The
moderate slowing of annual inflation in the
first three months of the year, given almost the same nominal wage growth, contributed
to the slowdown in the real wage decline. Thus, in the first quarter of 2012, the annual
decline in average real net wages was 1.5% (2.4%
in the previous quarter).
In the first quarter of 2012, labor productivity registered a decrease compared
with the previous quarter, in conditions of a decline in production and growth in the number of
employees. Also, on a quarterly basis,
deterioration in competitiveness in terms of labor was registered. In the first quarter of the
year, unit labor costs increased quarterly by 1.7% in conditions of smaller drop in wages
relative to productivity decline. Labor
productivity registered minimum annual decline of 0.3%. Thus the trend of annual
growth present during the entire previous year was interrupted. The annual decline in productivity
results from the fall in the economic activity, which
was largely offset by the reduction of employment in this quarter. The growth of average gross
wages coupled with the decrease in productivity led to annual growth of unit
labor costs of 1.1%.
Appendix 2: Analysis of labor supply
Labor supply is defined as a part of the total working population in a country that has a desire to work and is actively looking for work. Moreover, changes in labor supply are an important factor for
the future growth potential of every economy. A common indicator of labor supply is the activity rate.
In the Republic of Macedonia, as of 2005, there has been a trend of continuous slowdown of the activity rate, while in 2011 the activity rate declined. In the literature, changes in the activity rate are
explained by demographic factors (changes in the structure of the total working population as a result of non-economic factors such as process of "aging population") and by changes in working
preferences of the population. The purpose of this Annex is to point out the possible factors behind the movement of the activity rate in the Republic of Macedonia in the period 2005-2011.
-3.0
-2.0
-1.0
0.0
1.0
2.0
3.0
4.0
5.0
6.0
I.2010 IV VII X I.2011 IV VII X I.2012
Nominal average gross and net-wages(annual changes in %)
gross wages
net-wages
Source: State Statistical Office.
105
110
115
120
125
130
135
140
85
90
95
100
105
110
Q1
2008
Q3 Q1
2009
Q3 Q1
2010
Q3 Q1
2011
Q3 Q1
2012
Labour productivity and unit labour costs(index, 2005=100)
Labour productivity (left scale)
Unit labour costs (right scale)
Source: State Statistical Office and NBRM calculations.

Quarterly Report, July, 2012
23
The overall rate of activity in the economy is equal to the weighted sum of the
activity rates of different age groups , with the weights being equal to the share of each
age group in the total working age population27.
Thus changes in the total activity rate will be equal to the sum of the changes in the activity
rate of each age group and in the shares of each age group in the total working population.
The analysis of labor supply leads to three important conclusions.
First, changes in the activity rate in the Republic of Macedonia in the period 2005-2011,
almost entirely derive from the changes in the working i.e. non-working preferences of the population (changes in individual activity rates), while demographic changes explain a very small part.
Source: State Statistical Office and NBRM calculations.
Second, older population has dominant contribution to the total growth rate. Namely, changes
in the activity rate of the population aged 25-49 and 50-64 explain most of the changes in the overall activity rate. These developments coincide with the adoption of the Law on Labour Relations in 2005,
which provided greater flexibility in the labor market. The new legal framework offers diversity in
terms of the definition of employment (part-time and full-time employment contracts, half-time employment contracts, legal definition of overtime etc.), as well as changes in the framework for
collective bargaining. This change in legislation, coupled with the intensification of economic growth which started in 2004, probably explains part of the increase in both supply and demand for labor in
this age group. However, identifying the true determinants requires more detailed and complex analysis.
Third, a significant part of the growth slowdown in 2009 and 2010 and the decline in the activity rate in 2011 can be explained by the reduced participation of young people (15-24 years of
age). In the literature this movement is commonly explained by the change in the preference of young people in terms of continuing education rather than joining the workforce28. The most frequent
economic reasons for the increased preferences for education are the higher yields from higher
education and the greater likelihood of finding a safe and higher paid job. Additional factor that would encourage this trend may be the measures of the structural policies aimed at higher education level.
27 Julie, L., Hotchkiss. "Decomposing Changes in the Aggregate Labor Force Participation Rate." Federal Reserve Bank of Atlanta Working Paper 2009-6. 28 Aaronson, Stephanie; Bruce Fallick; Andrew Figura; Jonathan Pingle; and William Wascher. "The Recent Decline in the Labor Force Participation Rate and its Implications for Potential Labor Supply." Brookings Papers on Economic Activity 1 (2006): 69-134.
-0.5
0.0
0.5
1.0
1.5
2.0
2005 2006 2007 2008 2009 2010 2011
Decomposition of the changes in in the activity rate (in % and p.p.)
changed shares of different age groups (contribution to growth)
changed preference towards working (contribution to growth)
activity rate (growth rate, in %)
-2.5
-2.0
-1.5
-1.0
-0.5
0.0
0.5
1.0
1.5
2.0
2005 2006 2007 2008 2009 2010 2011
Decomposition of the changes in the activity rate (in % and p.p.)
changed shares of different age groups (contribution to growth)
contribution of the changes in the activity rates of the population aged 65 and more
contribution of the changes in the activity rates of the population aged 50 to 64 years
contribution of the changes in the activity rates of the population aged 25 to 49 years
contribution of the changes in the activity rates of the population aged 15 to 24 years
activity rate (growth rate, in %)

Quarterly Report, July, 2012
24
Source: EUROSTAT.
In the Republic of Macedonia there is a significant increase in the participation of young people in the formal and informal education system - in the age group 15-17 participation has
increased by about 22 percentage points over a period of six years, while among those aged 18-24, the increase is about 15 percentage points for the same period. Taking into account the relatively
recent structural measures of the government (introduction of compulsory secondary education,
dispersed studies and the reduction of financial expenses for higher education etc.), it is likely that this trend would continue in the future. In addition, the Republic of Macedonia is still below the
average share of young people in the education system measured in the European Union (about 95% of the persons aged 15-17 and 55% of the persons aged 18-24 are included in the education system).
Hence, it is likely that the active participation of this category of persons in the labor market will
further reduce. Such a trend would likely result in slower growth or reduction of labor supply in the short run. However, in the long run such movements will translate into a better and higher qualified
labor supply, employment growth and higher potential growth of the economy.
1.5. Balance of payments
In the first quarter of 2012, current account balance was negative and deteriorated on a quarterly basis, primarily due to the lower net inflows of private transfers, in conditions of extraordinary high base effect of the previous quarter when they surged under the influence of extraordinary factors. On the other hand, in conditions of larger downward adjustment of imports vis-à-vis exports, the trade balance narrowed compared to the preceding quarter and partially offset the adverse effect of the lower transfers. Net purchase of foreign currency on the currency exchange market kept on increasing on an annual basis and in this quarter, at a slower pace though. Nevertheless, the increase was fast enough to preserve the private transfers at the historically highest level achieved in the first quarter of the year (since 2003). In such circumstances, current account balance markedly improved on an annual basis, also due to the reduction of trade deficit. Net inflows in the financial account of the balance of payments in the first quarter, mainly based on direct investments, were sufficient to finance the current account deficit and to maintain stable level of foreign reserves that ensure sufficient coverage of import of goods and services of the next year. However, in the second quarter, the global economic environment worsened again. The weaker external demand and the downtrend of metal prices, the investors' hesitation and the lower external debt caused adverse developments in the balance of payments, making it necessary to finance a portion of the current transactions in this period with foreign reserves.
69.891.9
35.9
51.1
-10
10
30
50
70
90
110
2006 2007 2008 2009 2010 2011
Share of the population aged 15-24 years in the education
system (in %)
age group: 15-17, Macedonia age group: 18-24, Macedonia
age group: 15-17 - EU (2006-2011 period average)
age group: 18-24 - EU (2006-2011 period average)

Quarterly Report, July, 2012
25
1.5.1. Current account
The first quarter of 2012 experienced a negative current account balance of Euro
116 million or 1.5% of GDP, which is deterioration compared to the previous quarter
that registered unusual surplus. Most of such deterioration is caused by the lower net inflows of current transfers (negative contribution of 1.8
percentage points of GDP in the change of the current account), primarily due to the decrease of
private transfers that in the first quarter of the year usually went down on a quarterly basis.
However, in spite of the decrease of private
transfers, comparing inflows in the first quarters, the inflows on this basis are at the historically
highest level since 2003. Such developments are explained by the continuation of the increase of
supply of foreign cash (primarily euros) on the currency exchange market and their conversion in
Denars29. The minor net outflow based on services
also made negative contribution to the quarterly change in the current account balance, while the
reduction of trade deficit and the income deficit made a positive impact (positive contribution of
0.4 percentage points and 0.1 percentage point of
GDP, respectively). As for the foreign trade, the deterioration of external demand and unfavorable
weather conditions had adverse effect on the output and foreign trade in the first quarter, which
along with the lower domestic demand brought
about larger downward adjustment of imports, and accordingly, reduction of the negative trade
balance.
Compared to the same quarter of the previous year, the current account balance
improved by 1.1 percentage points of GDP,
due to the higher net inflows of current transfers and reduction of trade deficit, while the income
balance remained unchanged and the services balance deteriorated. The annual increase of
current transfers of 0.8 percentage points of GDP
is primarily due to the higher inflows from private transfers, i.e. net purchase of foreign assets on the
currency exchange market. Trade deficit shrank by 0.7 percentage points of GDP due to the faster fall
of imports30 compared to exports. The recent
29 These developments were most noticeable in December, prior to the EU Summit, and triggered substantial net inflows on the currency exchange market in the fourth quarter, in the amount of Euro 349 million. In the first quarter, this trend slowed down. Thus the currency exchange market reported net inflows of Euro 252 million. 30 Lower imports are due to the lower import of raw materials for the industry, investment goods and services for private consumption, in conditions of higher import of energy.
-4.7
-1.5
0.9
-1.5
-0.5 -0.6
0.9
-1.8
-2.7
-0.8
0.60.2
-1.5
-6.0
-5.0
-4.0
-3.0
-2.0
-1.0
0.0
1.0
2.0
Q1 2
009
Q2
Q3
Q4
Q1 2
010
Q2
Q3
Q4
Q1 2
011
Q2
Q3
Q4
Q1 2
012
Current account balance(% of GDP)
Source: NBRM.
EUR -116 mil.
0.4
-0.4
0.1
-1.8-2.0
-1.5
-1.0
-0.5
0.0
0.5
1.0
1.5
2.0
Trade balance Services, net Income, net Current transfers, net
Contribution of current account components
in its quarterly change
(in p.p. of GDP)
Q1 2011
Q2
Q3
Q4
Q1 2012
Source: NBRM.
-200.0
-150.0
-100.0
-50.0
0.0
50.0
100.0
150.0
200.0
Q1 2
005
Q2
Q3
Q4
Q1 2
006
Q1
Q2
Q3
Q1 2
007
Q2
Q3
Q4
Q1 2
008
Q1
Q2
Q3
Q1 2
009
Q4
Q1
Q2
Q1 2
010
Q2
Q3
Q4
Q1 2
011
Q2
Q3
Q4
Q1 2
012
Current transfers(quaretrly change, million of Denars)

Quarterly Report, July, 2012
26
data for April 2012 show that the current account deficit widened on an annual basis, owing
to the higher trade deficit. In conditions of worsened global environment, weakened external
demand and lower metal prices, the exports
deteriorated and the negative gap of the trade balance enlarged. On the other hand, the net
inflows of current transfers continued increasing.
Appendix 3: Foreign trade31 and nominal and real effective exchange rate (NEER and REER)
In the first quarter of 2012, the foreign trade of the Republic of Macedonia
decreased due to the quarterly fall of both exports and imports of 14% and 11.3%, respectively. While the foreign trade tends
to decelerate in this period of the year, its
intensity, however, is stronger than usual and points to influence of another factor.
This refers solely to the unfavorable weather conditions in January and February,
and to the deceleration of economic activity
of our key trading partners, which was immediately and directly transmitted to the
exports and imports. In the first quarter of 2012, exports and imports shrank the trade
deficit by 6.6% on a quarterly basis. Such quarterly changes are caused by the
shrink of nonenergy trade deficit,
while the energy trade deficit widened substantially. In the first quarter, given
the rise of energy prices on the global markets and the significantly higher energy consumption due to the unfavorable weather conditions, the energy deficit continued widening. The negative effect
of the quantitative and price increase of imported natural gas (due to the operations of the new
thermal power plant) and the imported electricity32, was somewhat alleviated by the reduction of oil and oil derivative trade deficit (quantitative effect). On the other hand, the analysis of nonenergy
balance shows significant reduction on a quarterly basis, which is particularly evident in the industrial and investment consumption of the corporate sector. The lower import of yarns (a raw material for
the textile industry), and the lower import of non-ferrous metals33, in both value and quantity, made the most remarkable contribution to the reduction of the foreign trade deficit. Nonenergy trade
balance decreased also due to the fall of investment import of electrical and telecommunication
machines. On the other hand, the fall of export of industrial procurements cased by the lower
31 Under the Foreign Trade Methodology, export data are disclosed on f.o.b. basis and import data are disclosed on c.i.f. basis. 32 The unfavorable weather conditions early this year and the higher electricity prices on the international markets brought about higher import of this energy source than expected, in line with the usual seasonal dynamics in the first quarter.
33 After the notable import of non-ferrous metals (input in the production process of a relevant plant in the economic zone) in January, the import pace slowed down markedly in the remaining period of the quarter.
0.7
-0.40.0
0.8
-2.5
-2.0
-1.5
-1.0
-0.5
0.0
0.5
1.0
1.5
2.0
Trade balance Services, net Income, net Current transfers, net
Contribution of current account components
in its annual change
(in p.p. of GDP)
Q1 2011
Q2
Q3
Q4
Q1 2012
Source: NBRM.
-4.6 -2.8
8.4
-4.43.5 3.0
-5.6
7.6
-4.2
3.6
-1.8
-4.3
4.9
22.2
-9.1
6.7
11.6
7.5
-17.0
5.5
-4.8
-5.4
1.5
-8.1
10.4
-12.5
24.7
4.8
-4.6
2.7
-3.0 -9.3
-12.4
10.8
-6.5
-4.3
3.5
-5.8 -4.4
5.6
-5.3
4.4
-4.6
-4.2
2.6
-2.8
-60
-40
-20
0
20
40
60
80
Q1 2
010
Q2
Q3
Q4
Q1 2
011
Q2
Q3
Q4
Q1 2
012
Trade balance according to SITC*(contributions in the Q-o-Q changes of the trade deficit, in p.p.)
Miscellaneous manufactured articles Machinery and transport equipment
Manufactured goods classified by materials Chemical Products
Mineral fuels, lubricants and related materials Crude materials, inedible, except fuels
Food, beverages and tobacco Total (q-o-q, %)
Source: DZS and NBRM.* Negative sign indicates contribution to the narrowing of the trade deficit

Quarterly Report, July, 2012
27
exported quantities of iron and steel34 made the surplus of the trade of these products decrease on a quarterly basis. Other traditional export branches also reported a quarterly deceleration of exports.
Source: SSO.
The analysis of annual changes in the first quarter of the year indicates reduction of trade balance of 9.6%, given the annual fall of imports (of 4%) and
stagnation of the export demand (nominal fall of 0.1%). The analysis of individual factors indicates that the nonenergy balance considerably narrowed (by 23.8%), fully contributing to the
improvement of the overall deficit. On the other hand, energy trade kept on widening on an annual
basis. The greatest contribution to the decrease of nonenergy balance deficit was made by the net trade of industrial inputs and investments, as a result of the lower import of chemical products, non-
ferrous metals35 and iron and steel, and by the category of machines and transport equipment, while the imports decreased and the exports significantly surged36. The fall of imported industrial inputs
corresponds with the negative industrial production rates in the first quarter, while the poorer foreign
direct investments made the import of equipment and machines decrease. The other traditional export products registered positive developments on an annual basis, i.e. the export of tobacco and textile
keeps on increasing, at a slower pace though. The energy balance reported enlargement of deficit in the trade in all energy sources. The import of natural gas and electricity increased in terms of
quantity, while the higher import of oil and oil derivatives is solely a price effect (lower imported
quantities).
34 Quarterly observed, export prices of iron and steel increased marginally. 35 The annual fall of import of non-ferrous metals partially results from the high base effect of the first quarter of 2011, when one capacity in the economic zone, which was new at that time, imported significant quantities of platinum. 36 The faster export of industrial machines is solely due to the export activity of the above capacity.
quantity price
ENERGY IMPORT Q4 2011 Q1 2012 Q4 2011 Q1 2012
- petroleum and petroleum
products209.2 198.7 318,484.5 292,578.2 -10.5 -5.0 -8.1 -8.1 3.1
- natural or industrial gas 20.1 40.2 30,437.6 66,524.4 20.1 100.3 118.6 118.6 -18.3
Q1 2011 Q1 2012 Q1 2011 Q1 2012
- petroleum and petroleum
products177.2 198.7 327,423.8 292,578.2 21.5 12.2 -10.6 -10.6 22.8
- natural or industrial gas 24.9 40.2 51,823.7 66,524.4 15.3 61.3 28.4 28.4 32.9
ENERGY EXPORT Q4 2011 Q1 2012 Q4 2011 Q1 2012
- petroleum and petroleum
products46.7 43.8 75,581.0 57,386.7 -3.0 -6.3 -24.1 -24.1 17.7
- natural or industrial gas 0.4 0.9 268.9 840.4 0.5 111.4 212.6 212.6 -101.2
Q1 2011 Q1 2012 Q1 2011 Q1 2012
- petroleum and petroleum
products45.7 43.8 74,478.4 57,386.7 -2.0 -4.3 -22.9 -22.9 18.7
- natural or industrial gas 1.6 0.9 1,839.7 840.4 -0.6 -39.6 -54.3 -54.3 14.7
Q4 2011 Q1 2012 Q4 2011 Q1 2012
EXPORT OF IRON AND STEEL 191.3 156.2 199,775 161,816 -35.1 -18.4 -19.0 -19.0 0.6
IMPORT OF IRON AND STEEL 76.0 54.9 143,518 105,846 -21.1 -27.8 -26.2 -26.2 -1.5
Q1 2011 Q1 2012 Q1 2011 Q1 2012
EXPORT OF IRON AND STEEL 162.3 156.2 199,202 161,816 -6.1 -3.8 -18.8 -18.8 15.0
IMPORT OF IRON AND STEEL 81.8 54.9 161,554 105,846 -27.0 -32.9 -34.5 -34.5 1.5
annual change contributions in the
annual change
quarterly change contributions in the
quarterly change
annual change contributions in the
annual change
percentage points
quarterly change contributions in the
quarterly change
annual change contributions in the
annual change
quarterly change contributions in the
quarterly change
in millions of EUR in tons/GWh
in millions
of EUR %
quantities
%

Quarterly Report, July, 2012
28
The recent data on foreign trade in April and May indicate opposite development of the trade balance, which compared to the same period of the previous
year widened by 31.4%. Non-
ferrous metal, iron and steel, and food balances made the greatest
contribution to the enlargement. The acceleration of import of these
categories, as a factor that widened the trade balance, was accompanied
by the weak export performances of
metal manufacturing and textile industry in April and May. Only the
machine and transport equipment balance improved.
Source: SSO.
The annual trade analysis by trading partner indicates narrowing of the trade
deficit with the European Union, as our most important trading partner, and lower trade deficit with other developed countries. Trade deficit with EU narrowed due to the changes in
import dynamics, while the export side reported higher annual export to Germany, our most important
Trade balance, GoodsQ1 2011 Q4 2011 Q1 2012
in millions
of EUR%
in millions
of EUR%
percentag
e points%
Total -498.0 -481.9 -450.0 48.0 -9.6 31.9 -6.6 -9.6 100.0
Food and live animals -62.5 -72.8 -74.0 -11.5 18.4 -1.2 1.6 2.3 -24.0
- meat and meat preparations -14.7 -23.7 -16.4 -1.7 11.4 7.3 -30.8 0.3 -3.5
- cereals and cereal preparations -9.2 -12.0 -13.1 -3.9 42.0 -1.1 8.9 0.8 -8.1
- fruits and vegetables 6.6 19.4 0.3 -6.4 -96.0 -19.2 -98.6 1.3 -13.2
Beverages and tobacco 25.2 43.6 30.3 5.0 19.9 -13.3 -30.6 -1.0 10.5
Crude materials, inedible, except fuels -7.0 -28.6 -19.9 -12.9 185.0 8.7 -30.5 2.6 -26.9
- metalliferous ores and metal scrap -4.1 -19.1 -14.7 -10.6 259.6 4.4 -22.9 2.1 -22.2
Mineral fuels, lubricants and related materials -199.1 -233.3 -269.6 -70.5 35.4 -36.3 15.6 14.2 -147.0
- petroleum and petroleum products -131.4 -162.5 -154.9 -23.5 17.9 7.6 -4.7 4.7 -49.0
- natural or industrial gas -23.4 -19.6 -39.2 -15.9 68.0 -19.6 100.0 3.2 -33.1
- electric energy -36.5 -45.1 -67.9 -31.4 86.1 -22.9 50.7 6.3 -65.5
Animal and vegetable oils and fats -8.5 -14.5 -14.0 -5.4 63.4 0.6 -4.0 1.1 -11.3
Chemical Products -35.1 6.0 -1.4 33.7 -96.0 -7.4 -123.5 -6.8 70.3
- inorganic chemical products -36.8 -1.1 -10.1 26.7 -72.5 -9.0 801.3 -5.4 55.6
- dyeing and tanning extracts -27.3 -8.8 -15.0 12.3 -45.1 -6.2 69.8 -2.5 25.7
- chemical materials and products 88.8 84.7 85.6 -3.2 -3.6 1.0 1.1 0.6 -6.6
Manufactured goods classified by materials -145.1 -119.9 -75.2 69.9 -48.2 44.7 -37.3 -14.0 145.7
- textile yarn, fabrics, made up articles and related
products -61.4 -87.7 -57.4 3.9 -6.4 30.3 -34.5 -0.8 8.2
- iron and steel 80.4 115.3 101.3 20.9 25.9 -14.0 -12.2 -4.2 43.5
- non ferous metals -108.3 -70.8 -56.8 51.5 -47.6 14.0 -19.8 -10.3 107.3
Machinery and transport equipment -143.7 -128.8 -107.5 36.2 -25.2 21.4 -16.6 -7.3 75.5
- general industrial machinery and equipment,
n.e.s., and machine parts, n.e.s. -19.6 -3.0 5.2 24.7 -126.3 8.1 -272.7 -5.0 51.5
- telecommunication apparatus and equipment -23.2 -33.5 -23.1 0.1 -0.5 10.4 -31.0 0.0 0.2
- electrical machinery, apparatus and appliances,
n.e.s., and electrical parts thereof -15.7 -10.9 -6.4 9.3 -59.3 4.5 -41.4 -1.9 19.4
- road vehicles -53.0 -47.1 -50.1 2.9 -5.4 -3.0 6.4 -0.6 6.0
Miscellaneous manufactured articles 78.1 68.3 81.7 3.6 4.6 13.3 19.5 -0.7 7.5
- articles of apparel and clothing accessories 103.8 111.1 107.0 3.2 3.1 -4.2 -3.7 -0.6 6.7
q-o-q changecontributions in
the annual change
in millions of EUR
y-o-y change
-4.73.6
-2.8 -2.63.7 4.3 1.3
7.4
-5.5
8.62.6
-8.1
12.17.5
12.7
28.8
7.5
19.1
8.2
14.2 1.2
-13.2-11.2 -12.6 -14.1
-2.8 -6.8
-4.5
-7.5
5.2
28.2
8.0
28.0
-14.0
29.4
-12.7
5.6
-8.7
-4.7
-9.5
-7.3
-7.3
-10.6
-3.7
-3.5
-2.7
-2.6
-0.7
2.6
-60
-40
-20
0
20
40
60
80Q
1 2
010
Q2
Q3
Q4
Q1 2
011
Q2
Q3
Q4
Q1 2
012
IV+
V
Trade balance according to SITC* (contributions in the annual changes of the trade deficit, in p.p.)
Miscellaneous manufactured articles
Machinery and transport equipment
Manufactured goods classified by materials
Chemical Products
Mineral fuels, lubricants and related materials
Crude materials, inedible, except fuels
Food, beverages and tobacco
Total (y-o-y, %)
Source: DZS and NBRM.* Negative sign indicates contribution to the narrowing of the trade deficit

Quarterly Report, July, 2012
29
trading partner. The lower import from Great Britain is the most relevant factor that contributed to the reduction of trade deficit with the EU member states, besides the increase of imported energy
sources, primarily from Greece. The trade with Western Balkan countries keeps on widening our trade deficit. The changes are more evident on the export side, due to the lower export to Croatia and
Kosovo. Observing the group of other developed countries, the export of metal manufacturing
industry in the Asian countries is the reason behind the improved balance.
Price competitiveness indicators in the first quarter of 2012 indicate deteriorated
competitiveness of the domestic economy. REER calculated by both indices (CPI and PPI) appreciated compared to the previous quarter by 2% and 0.6%, respectively, solely due to the
unfavorable price ratio (faster rise of domestic prices compared to foreign prices), when NEER
depreciates by 0.1%, primarily due to the depreciation of Denar against Russian Ruble and Turkish Lira. Recent data for April and May 2012 (average indices) show various competitiveness
indications. REER-CPI depreciated by 0.6% compared to the first quarter, mainly due to the NEER depreciation of 0.4%, and to a lower extent, to the decrease of relative prices, i.e. the faster rise of
foreign prices compared to domestic prices. On the other hand, REER-PPI appreciated by 0.4%, solely due to the unfavorable price ratio (faster increase of domestic producer prices compared to foreign
producer prices).
1.5.2. Capital and financial account
In the first quarter of 2012, the
capital and financial account registered net inflows of Euro 110.4 million or 1.5% of
82.0
84.0
86.0
88.0
90.0
92.0
94.0
96.0
98.0
100.0
102.0
Q1 2
007
Q2
Q3
Q4
Q1 2
008
Q2
Q3
Q4
Q1 2
009
Q2
Q3
Q4
Q1 2
010
Q2
Q3
Q4
Q1 2
011
Q2
Q3
Q4
Q1 2
012
Relative prices(2006=100)
Relative prices (domestic/foreign
inflation), 2006=100
Relative prices (domestic/foreign
producer prices), 2006=10085.0
90.0
95.0
100.0
105.0
110.0
Q1 2
007
Q2
Q3
Q4
Q1 2
008
Q2
Q3
Q4
Q1 2
009
Q2
Q3
Q4
Q1 2
010
Q2
Q3
Q4
Q1 2
011
Q2
Q3
Q4
Q1 2
012
REER(CPI and PPI based, 2006=100)
NEER REER - CPI REER - PPI
-1.00
-0.80
-0.60
-0.40
-0.20
0.00
0.20
0.40
0.60
0.80
1.00
BGL HRK TRY DIN RUB USD EUR
Contribution to the change of NEER of the Denar* (in p.p.)
appreciation
* An aggregated share of the shares of the Euro area countries included in the calculation of REER is used for the Euro. Source: NBRM.
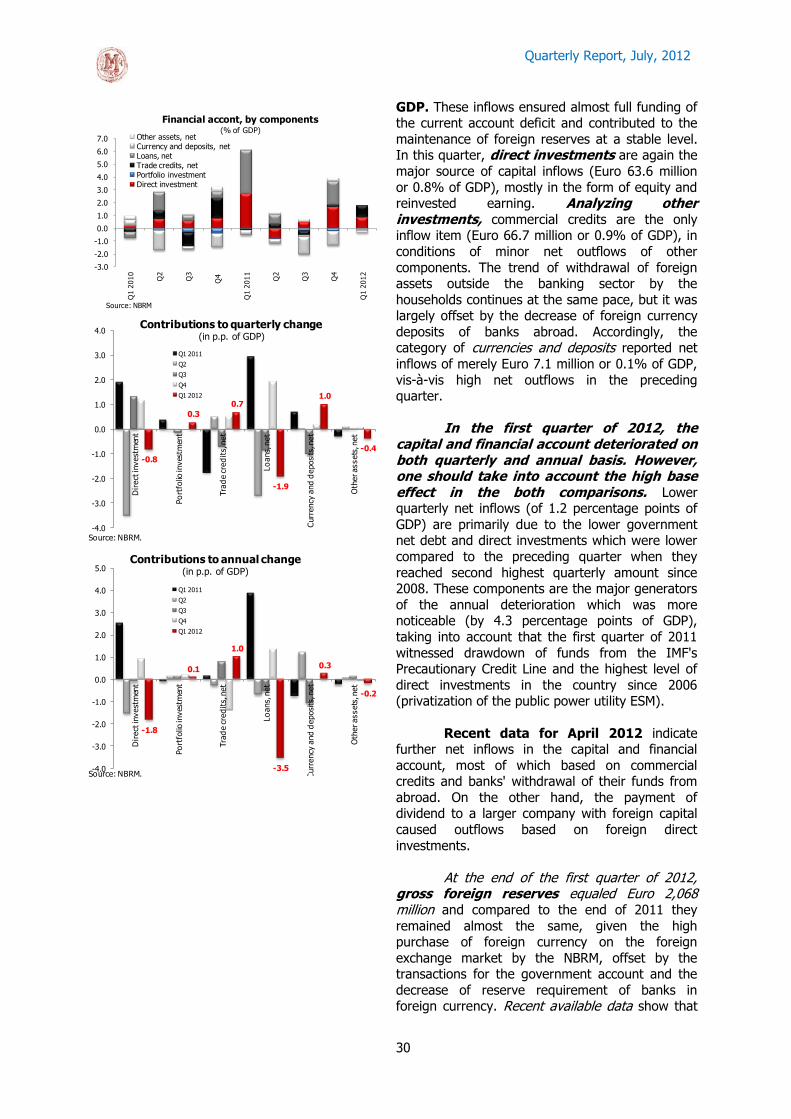
Quarterly Report, July, 2012
30
GDP. These inflows ensured almost full funding of the current account deficit and contributed to the
maintenance of foreign reserves at a stable level. In this quarter, direct investments are again the
major source of capital inflows (Euro 63.6 million
or 0.8% of GDP), mostly in the form of equity and reinvested earning. Analyzing other investments, commercial credits are the only inflow item (Euro 66.7 million or 0.9% of GDP), in
conditions of minor net outflows of other
components. The trend of withdrawal of foreign assets outside the banking sector by the
households continues at the same pace, but it was largely offset by the decrease of foreign currency
deposits of banks abroad. Accordingly, the category of currencies and deposits reported net
inflows of merely Euro 7.1 million or 0.1% of GDP,
vis-à-vis high net outflows in the preceding quarter.
In the first quarter of 2012, the
capital and financial account deteriorated on both quarterly and annual basis. However, one should take into account the high base effect in the both comparisons. Lower quarterly net inflows (of 1.2 percentage points of
GDP) are primarily due to the lower government net debt and direct investments which were lower
compared to the preceding quarter when they
reached second highest quarterly amount since 2008. These components are the major generators
of the annual deterioration which was more noticeable (by 4.3 percentage points of GDP),
taking into account that the first quarter of 2011
witnessed drawdown of funds from the IMF's Precautionary Credit Line and the highest level of
direct investments in the country since 2006 (privatization of the public power utility ESM).
Recent data for April 2012 indicate further net inflows in the capital and financial
account, most of which based on commercial credits and banks' withdrawal of their funds from
abroad. On the other hand, the payment of dividend to a larger company with foreign capital
caused outflows based on foreign direct
investments.
At the end of the first quarter of 2012, gross foreign reserves equaled Euro 2,068 million and compared to the end of 2011 they
remained almost the same, given the high purchase of foreign currency on the foreign
exchange market by the NBRM, offset by the transactions for the government account and the
decrease of reserve requirement of banks in foreign currency. Recent available data show that
-3.0
-2.0
-1.0
0.0
1.0
2.0
3.0
4.0
5.0
6.0
7.0Q
1 2
010
Q2
Q3
Q4
Q1 2
011
Q2
Q3
Q4
Q1 2
012
Financial accont, by components(% of GDP)
Other assets, netCurrency and deposits, netLoans, net
Trade credits, netPortfolio investmentDirect investment
Source: NBRM
-0.8
0.3
0.7
-1.9
1.0
-0.4
-4.0
-3.0
-2.0
-1.0
0.0
1.0
2.0
3.0
4.0
Dir
ect
invest
men
t
Po
rtfo
lio in
ves
tmen
t
Tra
de c
red
its,
net
Lo
ans,
net
Curr
ency
and
deposi
ts, n
et
Oth
er assets
, net
Contributions to quarterly change(in p.p. of GDP)
Q1 2011
Q2
Q3
Q4
Q1 2012
Source: NBRM.
-1.8
0.1
1.0
-3.5
0.3
-0.2
-4.0
-3.0
-2.0
-1.0
0.0
1.0
2.0
3.0
4.0
5.0
Dir
ect
invest
men
t
Po
rtfo
lio in
ves
tmen
t
Tra
de c
red
its,
net
Lo
ans,
net
Curr
ency
and
deposi
ts, n
et
Oth
er assets
, net
Contributions to annual change (in p.p. of GDP)
Q1 2011
Q2
Q3
Q4
Q1 2012
Source: NBRM.

Quarterly Report, July, 2012
31
at the end of June 2012, the foreign reserves were valued at Euro 2,018.7 million, which is by Euro
50.2 million less compared to the end of 2011, mainly under the influence of transactions for
government account.
1.5.3. Gross external debt
At the end of the first quarter of
2012, gross external debt amounted to Euro
4,917.5 million or 65.1% of GDP which is by Euro 42.7 million or by 0.9% more on a quarterly
basis. Have repo transactions37 been excluded, the gross debt would equal Euro 4,621.2 million
(61.2% of GDP), which is a quarterly decrease of
Euro 21.1 million, or by 0.5%38. Such change is fully due to the private debt reduction, while the
public debt made the total debt slightly increase39. Observing the maturity, the fall of short-term debt
reflects the change of total gross debt, while the long-term debt acts in opposite direction.
Analyzing by institutional sector, the lower debt
mainly arises from the debt of other sectors in the economy and the government that registered a
quarterly fall, compared to the previous quarter. Thus, the lower debt of other sectors arises from
the decrease of liabilities based on short-term
commercial credits and, to a lower extent, based on long-term loans. Government debt also
decreased given the fall of long-term credit liabilities40 and the repayment of due liabilities,
most of which being offset by the increase of liabilities based on Eurobonds41. The debt of
monetary authority (without repo transactions)
is almost unchanged on a quarterly basis. On the other hand, the higher debt of the Macedonian
Bank for Development Promotion (MBDP) based on
37 In the second quarter of 2011, the NBRM started concluding repo and reverse repo transactions. Repo transactions create liabilities (classified under category of loans) that contribute to the increase of the level of gross debt. Simultaneously, during the conclusion of reverse repo agreements, the created claims contribute to the increase of gross claims. The NBRM simultaneously conduct matched conclusion of repo and reverse repo agreements, in almost identical amount. Overall, since they are concluded concurrently, these transactions have neutral net-effect, i.e. they appear in almost identical amount on the side of both liabilities and claims, thus having no effect on the total net-external debt. 38 The analysis that follows refers to gross external debt without any monetary authorities' liabilities based on repo transactions. 39 Public sector debt includes the debt of central government and funds, monetary authority, public utilities and the Macedonian Bank for Development Promotion. Private sector debt includes the debt of banks (excluding the Macedonian Bank for Development Promotion), the debt of other sectors (excluding public utilities) and the intercompany lending. 40 Mainly due to negative exchange rate differentials. 41 Most of the liabilities based on Eurobonds (two thirds) increase due to the rise of market price of Eurobonds, and to the sale of a part of the Eurobonds to nonresidents.
0.0
10.0
20.0
30.0
40.0
50.0
60.0
70.0
0
500
1,000
1,500
2,000
2,500
3,000
3,500
4,000
4,500
5,000
Q4 2
004
Q4 2
005
Q4 2
006
Q4 2
007
Q1 2
008
Q2
Q3
Q4
Q1 2
009
Q2
Q3
Q4
Q1 2
010
Q2
Q3
Q4
Q1 2
011
Q2
Q3
Q4
Q1 2
012
Gross external debt
Gross external debt, in EUR million (left scale)Gross external debt, as % of GDP (right scale)
Source: NBRM.
-0.3
0.0
0.1
-0.8
0.6
-1.0 -0.5 0.0 0.5 1.0
Government sector
Monetary authorities (NBRM)
Banking sector
Other sectors
Intercompany lending
Contributions to the quarterly change of the gross external debt, by sectors
(in p.p.)
Source: NBRM.

Quarterly Report, July, 2012
32
the European Investment Bank credit line (EIB) for support of small- and medium-size enterprises, as
a segment of the public debt tends to increase the total gross debt. Simultaneously, the
intercompany lending accelerated, given the
higher use of long-term loans from direct investors. In addition, the banking sector also
slightly contributed to the debt increase, which reported higher liabilities in the form of short-term
nonresident deposits and long-term loans.
The annual analysis indicates an increase
of the gross external debt in the first quarter of the year in the amount of Euro 124.7 million or by
2.8%, fully arising from the higher public debt, while observing the maturity, the long-term debt
made higher contribution (of 53.5%). Analyzing
institutional sectors, the increase of gross external debt was mostly attributable to the increase of
long-term government debt in the form of loans, mainly the World Bank-backed Policy Based
Guarantee in December. Major contribution to the
debt growth was also made by other sectors in the economy, arising from higher debt based on
long-term loans, short-term commercial loans and overdue loan. The remaining part of the increase
of gross debt constitutes the debt of the Macedonian Bank for Development Promotion
(MBDP). On the other hand, the intercompany
lending contributed to lowering the debt on an annual basis, in conditions of reducing long-term
debts to direct investors. The banking sector debt also decreased, where the fall of liabilities
based on nonresident deposits exceeded the effect
of higher long-term loan debt.
Solvency indicators of the domestic economy relative to external liabilities,
measured by the World Bank methodology42,
improved. Gross debt -to- exports ratio and debt service -to- exports ratio indicate
improved debt position on an annual basis (a decrease of 12.3 percentage points and 3.8
percentage points, respectively). Also, gross debt -to- GDP ratio also improved by 0.7 percentage
points, due to the faster growth of the three-year
average of nominal GDP compared to the growth of gross external debt. On the other hand, the
deterioration of the interest payment -to- exports ratio is minor (0.1 percentage point), and
this indicators is still preserved at a relatively low
42 World Bank methodology includes three-year moving averages of GDP and export of goods and services and other inflows (including inflows from investment income, employee compensation and remittances), as denominators in the calculation of indicators. This methodology also defines debt criteria, as indebtedness referent values.
2.7
0.0
-0.1
1.5
-1.3
-1.5 -1.0 -0.5 0.0 0.5 1.0 1.5 2.0 2.5 3.0
Government sector
Monetary authorities (NBRM)
Banking sector
Other sectors
Intercompany lending
Contributions to the annual change of the gross external debt, by sectors
(in p.p.)
Source: NBRM.
Foreign
reserves/
ST debt
Foreign
reserves/
ST debt at
remaining
maturity*
ST debt/
Total gross
debt
ratio ratio in %
31.12.2004 1.14 0.89 30.3
31.12.2005 1.67 1.04 26.7
31.12.2006 1.95 1.34 29.0
31.12.2007 1.35 1.08 39.8
31.03.2008 1.51 1.03 35.1
30.06.2008 1.39 1.06 36.4
30.09.2008 1.35 1.04 38.1
31.12.2008 1.29 0.95 35.2
31.03.2009 1.03 0.78 36.0
30.06.2009 1.07 0.79 33.2
30.09.2009 1.26 0.93 32.5
31.12.2009 1.29 0.94 32.9
31.03.2010 1.33 0.90 31.2
30.06.2010 1.32 0.97 31.9
30.09.2010 1.36 0.92 31.3
31.12.2010 1.29 0.89 32.1
31.03.2011 1.44 1.04 29.3
30.06.2011 1.38 0.99 29.5
30.09.2011 1.40 0.98 29.5
31.12.2011 1.46 1.03 30.5
31.03.2012 1.50 0.94 29.7
Критериум 1.00
Source: NBRM.
EXTERNAL DEBT
INDICATORS
Liquidity
In compliance with "External debt statistics: Guide for compilers and users,"
published by the IMF.
*According to the "Greenspan-Guidotti rule", a country should maintain full
coverage of short-term debt at remaining maturity with gross foreign
reserves.

Quarterly Report, July, 2012
33
level. The analysis of indebtedness referent values shows that the Republic of Macedonia belongs to
the group of less indebted countries, and only according to the share of gross external debt in GDP, it is in the group of highly indebted countries.
Liquidity indicators register marginal changes, and do not indicate higher vulnerability. Thus the
share of short-term debt in total gross debt (of 29.7%) registers an annual growth of 0.5
percentage points, and the coverage of short-term
debt, residual maturity, with foreign reserves is by 4.2% higher, while the foreign reserves further
ensure full coverage of short-term debt.
1.6. Inflation The decrease of food and oil prices on the global markets kept on creating
downward pressures on the domestic prices. Thus, the trend of permanent deceleration of the annual inflation continued in the second quarter of 2012, when the annual inflation rate slowed down from 2.5% to 2.1%. Major factor for such dynamics is the deceleration of the rise of domestic food prices, as an effect of changes in global prices, and partially, the weak domestic demand. The growth of domestic prices kept on decelerating on a quarterly basis due to the fall of world oil price, and the base effect of the previous quarter, when the prices of electricity and heating energy increased. In the second quarter, the base inflation slightly accelerated and equaled 1.8% on an annual basis. To some extent, the increase of this component reflects the secondary effects of the increase of energy prices in the last period. However, most of these developments result from one-off factors, confirmed by the significant deceleration of core inflation to the end of the quarter. The dynamics of domestic producer prices and unit labor costs indicates no pronounced inflation pressures in the period ahead.
In the second quarter of 2012, the
increase of domestic prices slowed down to 1.2% on a quarterly basis (0.6% seasonally
adjusted). The slower quarterly pace of inflation
is largely determined by the high base effect of the energy component of inflation, and to a lower
extent, to the seasonal movement of the price of food component. After the rise43 of regulated
prices in the first quarter of 2012, this price
segment registered a quarterly stagnation in the second quarter. In addition, the quarterly fall of
43 On January 1, 2012, the prices of electricity and central heating increased by 7.83% and 10.8%, respectively.
Interest
payments/
Exports of
goods and
services
Gross debt/
Export of
goods and
services
Gross debt/
GDP
Debt service/
Exports of
goods and
services
31.12.2004 2.24 120.1 49.3 11.531.12.2005 2.33 128.5 56.3 9.731.12.2006 2.88 109.8 51.8 18.231.12.2007 2.38 102.3 53.2 16.631.03.2008 2.30 87.5 47.9 8.830.06.2008 2.30 93.6 51.2 8.830.09.2008 2.30 100.7 55.1 8.831.12.2008 2.30 101.1 55.3 8.831.03.2009 2.10 102.3 52.9 10.230.06.2009 2.10 101.1 52.2 10.230.09.2009 2.10 111.7 57.7 10.231.12.2009 2.10 113.3 58.5 10.231.03.2010 2.79 114.3 56.6 12.030.06.2010 2.79 120.1 59.5 12.030.09.2010 2.79 117.8 58.4 12.031.12.2010 2.79 122.2 60.6 12.031.03.2011 2.71 125.6 63.4 14.630.06.2011 2.71 125.2 63.1 14.630.09.2011 2.71 125.3 63.2 14.631.12.2011 2.71 129.7 65.4 14.631.03.2012 2.84 113.3 62.6 10.8
Moderate
indebtedness
criterion12 - 20% 165 - 275% 30 - 50% 18 - 30%
Source: NBRM.
EXTERNAL DEBT
INDICATORS
Solvency
in %
*The moderate indebtness criterion is accordng to the World bank's methodology of calculationg
indebtness indicators, which implies 3-year moving averages of GDP and exports of goods and
services in the calculation of the indicators. Data for 2012 are according to BoP projection April
2012.
0
20
40
60
80
100
120
140
160
0
50
100
150
200
250
I.2005
III V
VII IX XI
I.2006
III V
VII IX XI
I.2007
III V
VII IX XI
I.2008
III V
VII IX XI
I.2009
III V
VII IX XI
I.2010
III V
VII IX XI
I.2011
III V
VII IX XI
I.2012
III V
Commodity Food Price Index, 2005 = 100, includes Cereal, Vegetable Oils, Meat, Seafood, Sugar, Bananas, and Oranges Price Indices
Crude Oil (petroleum); Dated Brent, US$ per barrel
Source: IMF Primary Commodity Prices.
Crude oil and food prices

Quarterly Report, July, 2012
34
global oil prices significantly slowed the growth of energy component (from 6.2% to 1.1%), and
accordingly, the contribution to the overall inflation in the second quarter (from 0.9 percentage points
to 0.2 percentage points). Simultaneously, the
seasonal fall of the price of fresh vegetables was partially offset by the increase of the price of fresh
fruits and eggs (due to the Easter holidays), when the contribution of food component to the total
inflation decreased marginally to 0.6 percentage
points.
The slower quarterly price dynamics decelerated the annual inflation, which has
been decreasing for four consecutive quarters. In the second quarter, the annual
inflation equaled 2.1% compared to 2.5% in the
previous quarter. Thus the average inflation for the first six months of the year equals 2.3%. Domestic
inflation decelerated along with the gradual exhaustion of inflation pressures on the supply
side, i.e. the annual decrease of global food and oil
prices. The inflation primarily decelerated due to the lower contribution of food component as a
result of the decrease of import prices and their transmission effect on the domestic consumer
prices. Apart from the decrease of prices of fresh vegetables, the prices of cereal products also
decreased on an annual basis for the first time
since the second half of 2010. Moreover, the energy component contributed slightly less to the
overall inflation, where the slower rise of electricity price44 was partially offset by the
increase of domestic oil derivative prices due to
the depreciation of Denar against US Dollar45. The annual growth rates of foreign effective inflation
also decelerated by 0.2% in the second quarter, but at a faster pace, compared to 2.0% in the
previous quarter.
The long-term inflation component
increased moderately in the second quarter of the year. The core inflation (price component
without food and energy) equaled 1.8% on an annual basis, compared to 1.4% in the preceding
quarter. While the pressures of the domestic
demand46 were absent, the rate of long-term inflation component intensified due to the
44 In 2011, the electricity price was upwardly corrected in March. Therefore, the increase of electricity price in January 2012 was more pronounced in the first quarter. 45The fall of global oil prices of 7.0%, in US Dollars, was offset by the appreciation of US Dollar against Euro of 11.0%, and consequently, against Denar, thus the crude oil price in Euro increased by 4.3% on an annual basis, which was transmitted on the domestic prices of oil derivatives. 46 The NBRM assessments show that the domestic output is still below the potential (a negative output gap).
-6-4-20246810121416182022
-6
-4
-2
0
2
4
6
8
10
12
14
I.2006
III V
VII IX XI
I.2007
III V
VII IX XI
I.2008
III V
VII IX XI
I.2009
III V
VII IX XI
I.2010
III V
VII IX XI
I.2011
III V
VII IX XI
I.2012
III V
Inflation
Energy (regulated prices)
Inflation excl. food and energy (core inflation)
Food (right axis)
Inflation and volatility of food and energy(annual growth rates, in %)
Source: State statistical office and NBRM calculations.
-3.0
-2.0
-1.0
0.0
1.0
2.0
3.0
4.0
5.0
6.0
7.0
8.0
9.0
10.0
Q1.2
007
Q2
Q3
Q4
Q1.2
008
Q2
Q3
Q4
Q1.2
009
Q2
Q3
Q4
Q1.2
010
Q2
Q3
Q4
Q1.2
011
Q2
Q3
Q4
Q1.2
012
Q2
Food
Energy
Core inflation
Total inflation
Source: State statistical office and NBRM calculations.
Volatile (food and energy) and long-term component of inflation
(contribution to inflation, in percentage points)
95
100
105
110
115
120
125
130
135
I.2005 IV VII X
I.2006 IV VII X
I.2007 IV VII X
I.2008 IV VII X
I.2009 IV VII X
I.2010 IV VII X
I.2011 IV VII X
I.2012 IV
Foreign effective food prices
Domestic food prices
Foreign effective food prices* and domestic food prices
* Foreign effective food prices are calculated as weighted sum of food prices in
countries that are major trade partners with Macedonia.
Source: State statistical office, Eurostat and NBRM calculations.

Quarterly Report, July, 2012
35
secondary effect of the rise of prices of energy sources in the previous period. Most of the
acceleration of the growth, however, is caused by a one-off factor, primarily attributable to the prices
of footwear. The exhaustion of this factor brought
about considerable deceleration of the growth of core inflation at the end of the second quarter.
The average core inflation is still low and relatively stable, and in June 2012 it equaled 1.6%.
Price categories
Source: State Statistical Office and NBRM calculations.
The trend of rise of producer prices
continued in the second quarter of 2012, but at a slower pace. In the second quarter, these
prices increased by 1.2% on a quarterly basis, compared to 2.7% in the preceding quarter
(seasonally adjusted data indicate a fall of 0.9%).
The increase is still mostly due to the higher energy prices, i.e. the prices of electricity and, to a
lower extent, of oil derivatives. Annually, the increase continued decelerating (fifth consecutive
quarter) and reduced to 3.1% (5.1% in the preceding quarter). Such dynamics is due to the
slower rise of energy prices that still largely
influence the increase of price level. The movement of producer prices that influence
the domestic component of the inflation47 indicate no significant inflation pressures in
the next period (quarterly fall, and substantially
slower annual growth pace of 4.6%). Lesser inflation pressures are expected from the
unit labor costs, as well, whose low annual growth in the first quarter (of 1.1%), follows the
decrease of 3.2% in the last quarter of 2011.
Appendix 4: Inflation expectations of the economic agents in the Republic of Macedonia
The Survey of inflation expectations conducted in July 201248, for the end of the third quarter of 2012 shows that most of the respondents expect stable and higher inflation (42.1% and
47 Consumption goods (durable and nondurable) and energy. 48 The responsiveness to the survey was 52.1%, i.e. 38 of 73 respondents responded to the survey. Observed by group of
Q1 Q2 Q3 Q4 Q1 Q2 Q1 Q2 Q3 Q4 Q1 Q2
Consumer price index - all items 1.6 4.1 4.7 3.6 3.2 3.9 2.5 2.1 1.6 4.1 4.7 3.6 3.2 3.9 2.5 2.1
Food 0.3 7.1 8.4 5.4 4.7 6.4 1.4 0.2 0.1 2.7 3.2 2.0 1.8 2.4 0.6 0.1
Fresh food -0.9 4.6 6.7 1.7 2.9 4.0 0.7 -0.4 -0.2 0.8 1.2 0.3 0.5 0.7 0.1 -0.1
Processed food 1.3 8.5 9.9 8.4 6.2 8.3 2.0 0.6 0.3 1.7 2.0 1.8 1.3 1.7 0.4 0.1
Energy 11.2 7.1 6.9 7.0 7.2 7.1 9.4 8.7 1.4 0.9 0.9 0.9 1.0 0.9 1.4 1.2
Fuels and lubricants 19.3 18.4 10.9 12.2 12.4 13.5 7.9 10.5 0.6 0.6 0.4 0.4 0.5 0.5 0.4 0.5
Electrical power 9.8 1.8 5.4 5.4 5.4 4.5 11.5 7.7 0.6 0.1 0.4 0.4 0.4 0.3 0.8 0.5
Heating power 6.5 6.3 5.7 4.2 4.9 5.3 7.6 7.7 0.2 0.2 0.2 0.1 0.2 0.2 0.2 0.2
Food and energy (volatile prices) 2.9 7.1 8.0 5.8 5.4 6.6 3.5 2.4 1.5 3.6 4.1 3.0 2.7 3.4 1.9 1.3
Core inflation (inflation excl. food and energy) 0.2 1.0 1.2 1.1 0.7 1.0 1.4 1.8 0.1 0.5 0.6 0.6 0.5 0.5 0.6 0.8
(contributions to annual growth rates, in p.p.)
201220112010
2011
(annual growth rates, in %)
2012201120112010
-30
-20
-10
0
10
20
30
40
-15
-10
-5
0
5
10
15
20
I.2006
III V
VII IX XI
I.2007
III V
VII IX XI
I.2008
III V
VII IX XI
I.2009
III V
VII IX XI
I.2010
III V
VII IX XI
I.2011
III V
VII IX XI
I.2012
III V
Inflation
Producer prices
Prices of non durable goods
Prices of produced energy (right axis)
Inflation and industrial producer prices (annual growth rates, in %)
Source: State statistical office and NBRM calculations.

Quarterly Report, July, 2012
36
36.8%, respectively). Only few (13.2%) respondents expect it to decelerate49. Analyzing by group of respondents, more than half (42.9%) of surveyed companies expect stable inflation, followed by
those who expect the inflation to accelerate (39.3%) and 7.1% expect that the inflation will decelerate. Analysts have similar expectations: most of them expect stable inflation (60%) and 40%
expect higher inflation rate. Most banks expect lower inflation (60%), and the expectations of the
remaining banks are equally distributed among those who expect stable and those who expect higher inflation (20% each). Distribution of answers concerning inflation expectations, by group of respondents
for the third quarter of 2012 for 2012
Source: NBRM, Inflation Expectations Survey.
The inflation rate is mostly expected to be higher throughout 2012. In 2012, most of the respondents (50%) expect the annual inflation rate to be higher than the actual inflation rate
(2.3%) in the second quarter of the year, a substantial number of respondents (31.6%) expects stable inflation and 10.5% expect lower inflation. Analyzing by group of respondents, more than half
(53.6%) of surveyed companies expect higher inflation rate, 28.6% have stable expectations, and
7.1% expect it to decrease. Furthermore, 40% of the banks expect higher inflation and 40% expect lower inflation, while the remaining banks (20%) expect stable inflation. Most of the analysts expect
stable inflation in 2012 (60% of respondents) and 40% expect it to increase. According to the responses of surveyed economic agents, in 2012, the average expected inflation rate equals around 2.7%, which is a marginal downward adjustment of inflation expectations compared to the previous survey (around 2.8%).
respondents, the banks’ responsiveness is 71.4%, followed by companies with 52.8% and economic analysts with 38.5%. 49 The percent that is missing to 100%, throughout the text, includes respondents that chose the option “hard to determine”.
0%
10%
20%
30%
40%
50%
60%
70%
80%
90%
100%
Economic
analysts
Banks Enterprises
will fall stay about the same
will increase it is difficult to answer
0%
10%
20%
30%
40%
50%
60%
70%
80%
90%
100%
Economic
analysts
Banks Enterprises
will fall stay about the same
will increase it is difficult to answer
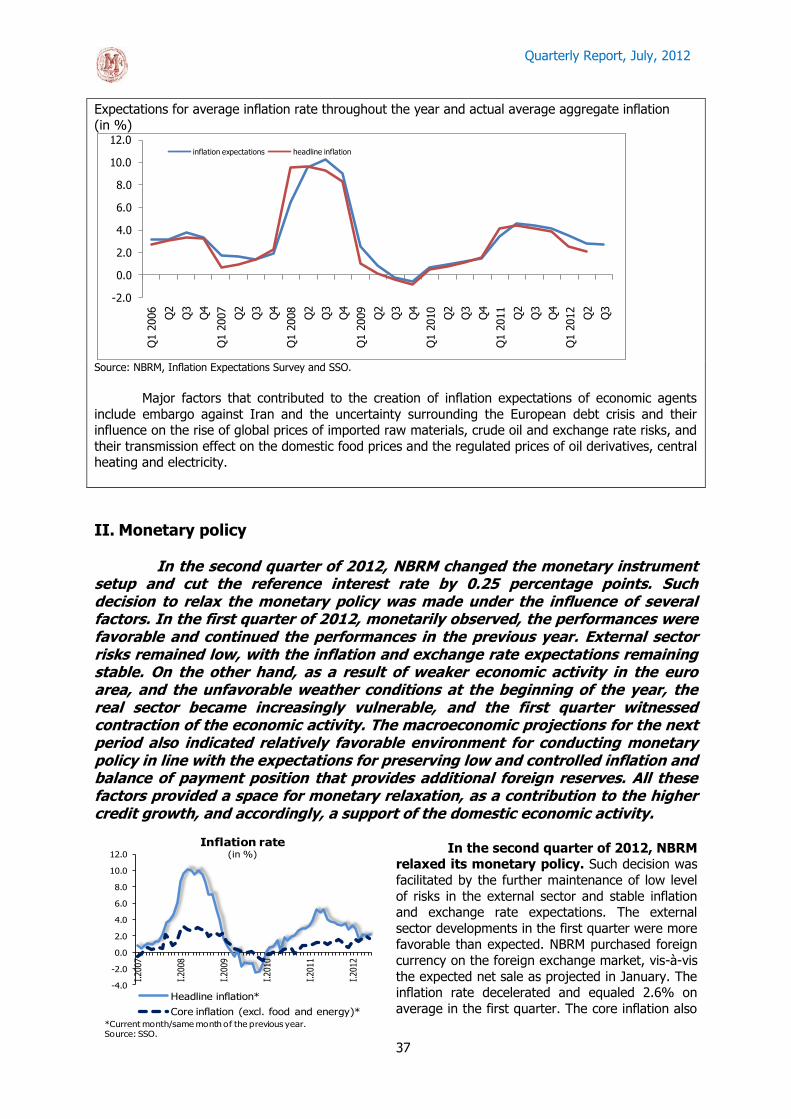
Quarterly Report, July, 2012
37
Expectations for average inflation rate throughout the year and actual average aggregate inflation (in %)
Source: NBRM, Inflation Expectations Survey and SSO.
Major factors that contributed to the creation of inflation expectations of economic agents
include embargo against Iran and the uncertainty surrounding the European debt crisis and their influence on the rise of global prices of imported raw materials, crude oil and exchange rate risks, and
their transmission effect on the domestic food prices and the regulated prices of oil derivatives, central heating and electricity.
II. Monetary policy
In the second quarter of 2012, NBRM changed the monetary instrument setup and cut the reference interest rate by 0.25 percentage points. Such decision to relax the monetary policy was made under the influence of several factors. In the first quarter of 2012, monetarily observed, the performances were favorable and continued the performances in the previous year. External sector risks remained low, with the inflation and exchange rate expectations remaining stable. On the other hand, as a result of weaker economic activity in the euro area, and the unfavorable weather conditions at the beginning of the year, the real sector became increasingly vulnerable, and the first quarter witnessed contraction of the economic activity. The macroeconomic projections for the next period also indicated relatively favorable environment for conducting monetary policy in line with the expectations for preserving low and controlled inflation and balance of payment position that provides additional foreign reserves. All these factors provided a space for monetary relaxation, as a contribution to the higher credit growth, and accordingly, a support of the domestic economic activity.
In the second quarter of 2012, NBRM
relaxed its monetary policy. Such decision was
facilitated by the further maintenance of low level
of risks in the external sector and stable inflation and exchange rate expectations. The external
sector developments in the first quarter were more favorable than expected. NBRM purchased foreign
currency on the foreign exchange market, vis-à-vis
the expected net sale as projected in January. The inflation rate decelerated and equaled 2.6% on
average in the first quarter. The core inflation also
-2.0
0.0
2.0
4.0
6.0
8.0
10.0
12.0Q
1 2
006
Q2
Q3
Q4
Q1 2
007
Q2
Q3
Q4
Q1 2
008
Q2
Q3
Q4
Q1 2
009
Q2
Q3
Q4
Q1 2
010
Q2
Q3
Q4
Q1 2
011
Q2
Q3
Q4
Q1 2
012
Q2
Q3
inflation expectations headline inflation
-4.0
-2.0
0.0
2.0
4.0
6.0
8.0
10.0
12.0
I.2007
I.2008
I.2009
I.2010
I.2011
I.2012
Inflation rate(in %)
Headline inflation*
Core inflation (excl. food and energy)**Current month/same month of the previous year.Source: SSO.

Quarterly Report, July, 2012
38
remained stable. On the other hand, the domestic economy suffered a lot from the adverse effects of
the deteriorated economic performances of the euro area, as a result of debt crisis, given the
substantial slowdown of the economic growth50 in
the last quarter of 2011. The economic conditions in the euro area remained anemic in the first
quarter of 201251, which along with the exceptionally unfavorable weather conditions in
February, signaled probable continuation of
unfavorable tendencies of domestic economic activity in the first quarter. On the other hand, in
the first quarter, banks remained relatively restrained in their credit policy, although the
banking performances indicated ample space for more active lending to the private sector without
jeopardizing the macroeconomic and financial
stability. Thus household deposits kept on increasing in the first quarter, and most of the new
inflows of deposits were invested in risk-free instruments, i.e. CB bills. At the end of March, CB
bills reached the historically highest level of about
Denar 40 billion, when bank liquidity and capitalization is preserved at high level. In such
circumstances, on April 6, 2012, the NBRM made changes in its operational monetary
framework52, aimed towards development and support of financial markets, more active liquidity
and investment portfolio management of the
banks. These changes included reduction of the frequency of CB bill auctions to once in the reserve
requirement period and switch from unlimited volume tender to limited volume tender and
maximum interest rate of the present 4%.
Furthermore, NBRM also introduced regular weekly repo operations to provide liquidity in the banking
system - (overnight and seven-day) deposit facilities, and cut the interest rate on available
overnight facility.
The favorable monetary policy
environment continued at the beginning of the second quarter. In April, in spite of the
payment of a large amount of dividend by one domestic company to a foreign investor, foreign
exchange market developments remained stable,
contributing to further maintenance of the foreign reserves at an adequate level. Inflation
50 According to the released SSO data for March 2012. 51 The available economic indicators early this year indicated potential circumvention of the technical recession in the euro area. It was, however, expected that the economic activity will stabilize and remain low (as confirmed by the official statistical data). 52 For the changes in the NBRM operational monetary framework see the Quarterly Report, April 2012, Box 4: Changes in the operational framework for conducting the NBRM monetary policy.
0,00,51,01,52,02,53,03,54,04,55,05,56,06,57,07,58,08,59,09,5
I.2008
I.2009
I.2010
I.2011
I.2012
Каматен распон(во процентни поени)
помеѓу благајнички записи на НБРМ -28 дена и основната каматна стапка на ЕЦБ
помеѓу СКИБОР - еден месец и ЕУРИБОР-еден месец
Извор: НБРМ, ЕЦБ (www.ecb.int) и Централната банка на Холандија (www.statistics.dnb.nl).
-250.0
-200.0
-150.0
-100.0
-50.0
0.0
50.0
100.0
150.0
Q1 2
009
Q2
Q3
Q4
Q1 2
010
Q2
Q3
Q4
Q1 2
011
Q2
Q3
Q4
Q1 2
012
Q2
NBRM interventions on the F/X market
(in EUR million)
Transactions with banks market-makers
Source: NBRM.
0
5,000
10,000
15,000
20,000
25,000
30,000
35,000
40,000
45,000
Q4 2
008
Q1 2
009
Q2
Q3
Q4
Q1 2
010
Q2
Q3
Q4
Q1 2
011
Q2
Q3
Q4
Q1 2
012
Q2
CB bills(outstanding amount, in Denar million)
Source: NBRM.

Quarterly Report, July, 2012
39
performances were also stable, and the annual inflation rate equaled 2.2% in April. In this period,
the Government announced a budget revision for 2012 (a budget cut of 5%). Simultaneously, the
regular assessment of macroeconomic
developments in terms of quarterly projections in April indicated further maintenance of the
favorable environment to conduct monetary policy in the period ahead, without greater risks to the
price and exchange rate stability. The global
signals were also positive. The political and economic measures undertaken in the overall euro
area at the end of the previous year and beginning of this year, as a response to the debt crisis,
calmed the tensions down and contributed to the relative improvement of the global outlook in the
period ahead. In such conditions, on May 3,
2012, the NBRM cut the reference interest rate from 4% to 3.75%.
As a result of the reduction of the
NBRM reference interest rate, while the ECB
reference interest rate remained 1%, the interest spread between these two interest
rates narrowed and equaled 2.75 percentage points in June (3 percentage points in
March). On the domestic financial market, SKIBOR53 followed the changes in the reference
interest rates, and slightly decreased in May. The
European financial market also witnessed a reduction of the EURIBOR, which is in line with the
dynamics of EONIA, which has been preserved at a low level since early this year, and generally
registers a downward trend, as a result of the
substantial excess liquidity on the interbank overnight lending market54. In such conditions, the
interest spread between the one-month SKIBOR and the one-month EURIBOR was relatively stable,
and equaled 3.6 percentage points in June (3.7
percentage points in March).
2.1. Bank liquidity and financial market developments
At the end of June 2012 compared to
the end of the first quarter, bank liquidity increased by Denar 2,199 million. Thus, at the
end of June, the banks' account balances with the NBRM55 amounted to Denar 16,624 million. In
May, the annual growth rate of reserve money56
equaled 2.1%, compared to 3.1% at the end of the first quarter.
53 Interbank Denar deposit interest rate calculated using quotations of referent banks. 54 ECB Monthly Bulletin, June 2012. 55 Refers to Denar accounts of banks bound to allocate reserve requirement. 56 Includes the foreign currency reserve requirement, as well.
0.00.51.01.52.02.53.03.54.04.55.05.56.06.57.07.58.08.59.09.5
I.2008
I.2009
I.2010
I.2011
I.2012
Interest rate spread(in percentage points)
between NBRM CB bills-28 days and ECB policy rate
between SKIBOR-one month and EURIBOR-one month
Source: NBRM, ECB (www.ecb.int) and De Nederlandsche Bank (www.statistics.dnb.nl).
-10.0
-5.0
0.0
5.0
10.0
15.0
20.0
25.0
30.0
Q1.2
007
Q2
Q3
Q4
Q1.2
018
Q2
Q3
Q4
Q1.2
009
Q2
Q3
Q4
Q1.2
010
Q2
Q3
Q4
Q1 2
011
Q2
Q3
Q4
Q1 2
012
May 2
012
Contribution to annual change in reserve money
(in percentage points)
Currency in circulation Banks' reserves
Reserve money, y-o-y change, in %
Source: NBRM.

Quarterly Report, July, 2012
40
In the second quarter of 2012, the
autonomous factors, on a net basis, tend to decrease bank liquidity in the total amount
of Denar 10,135 million. Thus government
transactions made the greatest contribution of around 71% directed towards withdrawal of liquid
assets, mostly as a result of the accumulation of deposits on the government Denar account with
the NBRM (of Denar 5,707 million in total, in this
period). Most of the funds based on the higher issue of treasury bills in this period remained
deposited on the government account with the NBRM, as a potential for financing the budget
deficit in the next period. The higher demand for treasury bills partially results from the changes in
the CB bills setup that encourages more active
asset management by banks, by investing in various instruments. According to the net sale of
foreign currency on the foreign exchange market by the NBRM, a contribution of Denar 2,142
million, directed towards withdrawal of liquid
assets, was made by the NBRM foreign currency transactions and the currency in circulation (effect
of Denar 1,076 million).
The NBRM monetary instruments created liquid assets in the second quarter
on a net basis in a total amount of Denar
12,334 million, most of which created through the CB bills (Denar 11,729 million).
High liquidity was created through CB bills within the new operational setup of the monetary policy,
i.e. switch towards limited volume tender and
maximum interest rate. At the CB bills auctions held in this period57, the interest rate gravitated
around the maximum interest rate set by the NBRM. Additional liquidity of Denar 1,700 million
was created through repo operations in this period,
while banks invested total of Denar 1,095 million in available deposit facility with the NBRM (overnight
and 7-day). The reduction of frequency of CB bills auctions and the restriction of the total amount
offered encouraged the banks to actively use alternative monetary instruments, i.e. available
deposits and repo operations, making them more
57 The NBRM started switching towards the new operational setup of monetary policy at the second CB bills auction in April (April 11, 2012) applying (limited) volume tender and maximum interest rate. In the following period, the NBRM continued holding regular weekly auctions, but with shorter CB bill maturity (21, 14 and 7 days, respectively), in order to concentrate the total due amount of CB bills at the second auction in May (May 9, 2012) when the transmission to the new system was completed. At this auction with lower maximum interest rate of 3.75%, the NBRM offered CB bills in the amount of Denar 32,000 million, 90% of which being sold. The next CB bill auction was held on June 13, 2012, when the CB bills in the amount of Denar 29.000 million were almost totally sold.
-12,000-10,000-8,000-6,000-4,000-2,000
02,0004,0006,0008,000
10,00012,00014,000
Q1 2
011
Q2
Q3
Q4
Q1 2
012
Q2
Factors of reserve money provision and withdrawal*
(quarterly changes, in Denar million)
Transactions of the government*
NBRM interventions on the F/X market with banks*
Monetary policy instruments*
Currency in circulation*
Banks' reserves*Positive change- reserve money provision; negative change - reserve money withdrawal.Source: NBRM.
-12,000
-9,500
-7,000
-4,500-2,000
500
3,000
5,500
8,000
10,500
13,00015,500
Q1 2
009
Q2
Q3
Q4
Q1 2
010
Q2
Q3
Q4
Q1 2
011
Q2
Q3
Q4
Q1 2
012
Q2
Monetary policy instruments(quarterly changes, in Denar million)*
CB bills
Bills of 6-month deposit with NBRM
Deposit facility
Repo auctions
*Positive change- reserve money provision; negative change - reserve money withdrawal.Source: NBRM.
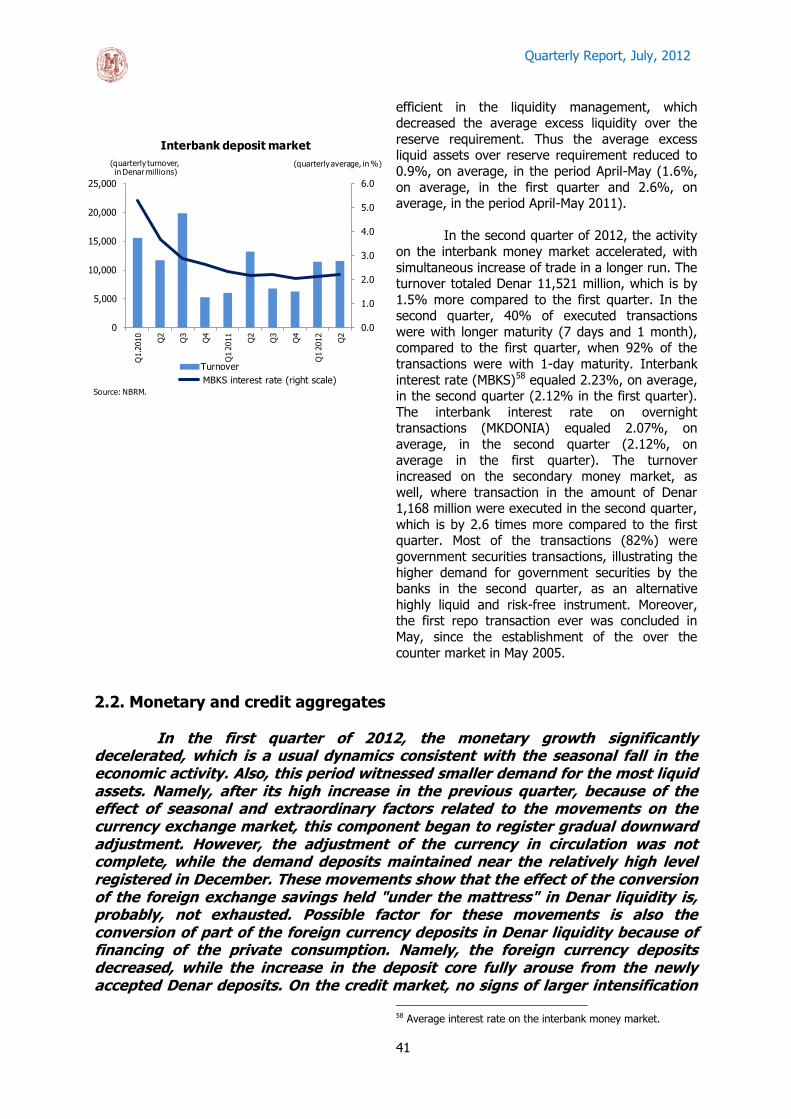
Quarterly Report, July, 2012
41
efficient in the liquidity management, which decreased the average excess liquidity over the
reserve requirement. Thus the average excess liquid assets over reserve requirement reduced to
0.9%, on average, in the period April-May (1.6%,
on average, in the first quarter and 2.6%, on average, in the period April-May 2011).
In the second quarter of 2012, the activity
on the interbank money market accelerated, with
simultaneous increase of trade in a longer run. The turnover totaled Denar 11,521 million, which is by
1.5% more compared to the first quarter. In the second quarter, 40% of executed transactions
were with longer maturity (7 days and 1 month), compared to the first quarter, when 92% of the
transactions were with 1-day maturity. Interbank
interest rate (MBKS)58 equaled 2.23%, on average, in the second quarter (2.12% in the first quarter).
The interbank interest rate on overnight transactions (MKDONIA) equaled 2.07%, on
average, in the second quarter (2.12%, on
average in the first quarter). The turnover increased on the secondary money market, as
well, where transaction in the amount of Denar 1,168 million were executed in the second quarter,
which is by 2.6 times more compared to the first quarter. Most of the transactions (82%) were
government securities transactions, illustrating the
higher demand for government securities by the banks in the second quarter, as an alternative
highly liquid and risk-free instrument. Moreover, the first repo transaction ever was concluded in
May, since the establishment of the over the
counter market in May 2005.
2.2. Monetary and credit aggregates
In the first quarter of 2012, the monetary growth significantly decelerated, which is a usual dynamics consistent with the seasonal fall in the economic activity. Also, this period witnessed smaller demand for the most liquid assets. Namely, after its high increase in the previous quarter, because of the effect of seasonal and extraordinary factors related to the movements on the currency exchange market, this component began to register gradual downward adjustment. However, the adjustment of the currency in circulation was not complete, while the demand deposits maintained near the relatively high level registered in December. These movements show that the effect of the conversion of the foreign exchange savings held "under the mattress" in Denar liquidity is, probably, not exhausted. Possible factor for these movements is also the conversion of part of the foreign currency deposits in Denar liquidity because of financing of the private consumption. Namely, the foreign currency deposits decreased, while the increase in the deposit core fully arouse from the newly accepted Denar deposits. On the credit market, no signs of larger intensification
58 Average interest rate on the interbank money market.
0.0
1.0
2.0
3.0
4.0
5.0
6.0
0
5,000
10,000
15,000
20,000
25,000
Q1.2
010
Q2
Q3
Q4
Q1 2
011
Q2
Q3
Q4
Q1 2
012
Q2
Interbank deposit market
Turnover
MBKS interest rate (right scale)
(quarterly turnover, in Denar millions)
(quarterly average, in %)
Source: NBRM.
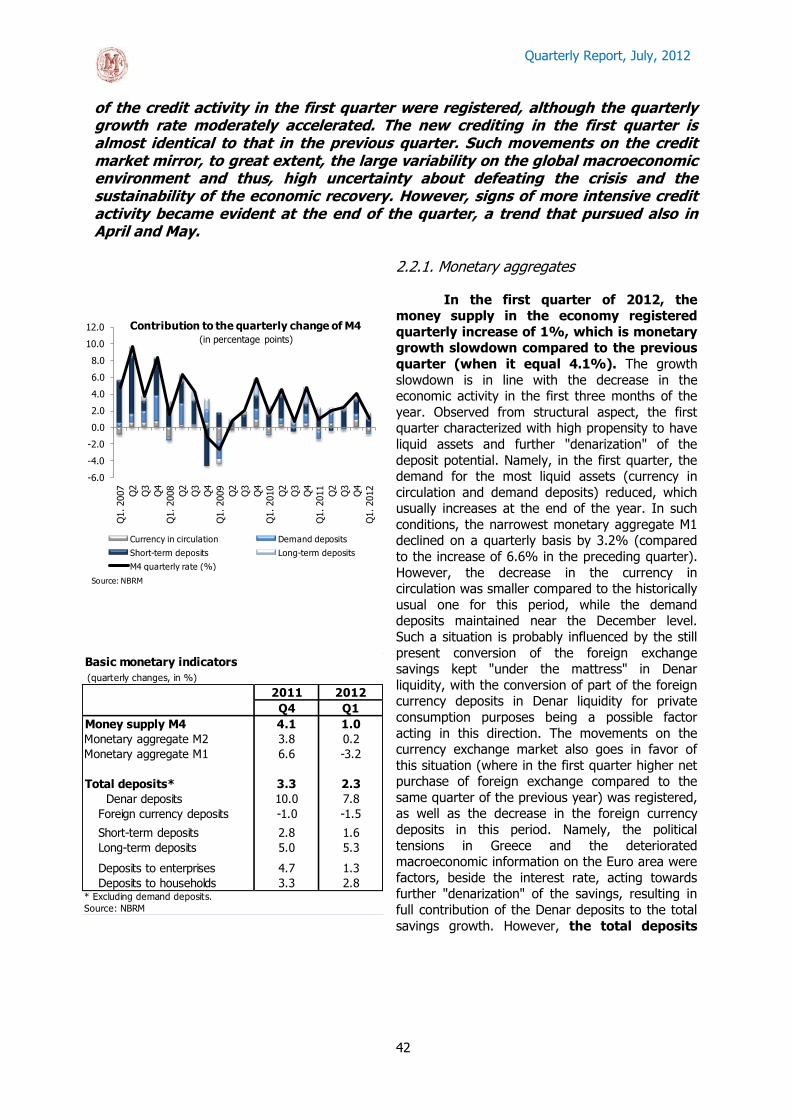
Quarterly Report, July, 2012
42
of the credit activity in the first quarter were registered, although the quarterly growth rate moderately accelerated. The new crediting in the first quarter is almost identical to that in the previous quarter. Such movements on the credit market mirror, to great extent, the large variability on the global macroeconomic environment and thus, high uncertainty about defeating the crisis and the sustainability of the economic recovery. However, signs of more intensive credit activity became evident at the end of the quarter, a trend that pursued also in April and May.
2.2.1. Monetary aggregates
In the first quarter of 2012, the money supply in the economy registered
quarterly increase of 1%, which is monetary growth slowdown compared to the previous
quarter (when it equal 4.1%). The growth
slowdown is in line with the decrease in the economic activity in the first three months of the
year. Observed from structural aspect, the first quarter characterized with high propensity to have
liquid assets and further "denarization" of the
deposit potential. Namely, in the first quarter, the demand for the most liquid assets (currency in
circulation and demand deposits) reduced, which usually increases at the end of the year. In such
conditions, the narrowest monetary aggregate M1 declined on a quarterly basis by 3.2% (compared
to the increase of 6.6% in the preceding quarter).
However, the decrease in the currency in circulation was smaller compared to the historically
usual one for this period, while the demand deposits maintained near the December level.
Such a situation is probably influenced by the still
present conversion of the foreign exchange savings kept "under the mattress" in Denar
liquidity, with the conversion of part of the foreign currency deposits in Denar liquidity for private
consumption purposes being a possible factor
acting in this direction. The movements on the currency exchange market also goes in favor of
this situation (where in the first quarter higher net purchase of foreign exchange compared to the
same quarter of the previous year) was registered, as well as the decrease in the foreign currency
deposits in this period. Namely, the political
tensions in Greece and the deteriorated macroeconomic information on the Euro area were
factors, beside the interest rate, acting towards further "denarization" of the savings, resulting in
full contribution of the Denar deposits to the total
savings growth. However, the total deposits
-6.0
-4.0
-2.0
0.0
2.0
4.0
6.0
8.0
10.0
12.0
Q1. 2007
Q2
Q3
Q4
Q1. 2008
Q2
Q3
Q4
Q1. 2009
Q2
Q3
Q4
Q1. 2010
Q2
Q3
Q4
Q1. 2011
Q2
Q3
Q4
Q1. 2012
Contribution to the quarterly change of M4 (in percentage points)
Currency in circulation Demand deposits
Short-term deposits Long-term deposits
M4 quarterly rate (%)
Source: NBRM
Basic monetary indicators
(quarterly changes, in %)
2011 2012
Q4 Q1
Money supply M4 4.1 1.0
Monetary aggregate M2 3.8 0.2
Monetary aggregate M1 6.6 -3.2
Total deposits* 3.3 2.3
Denar deposits 10.0 7.8
Foreign currency deposits -1.0 -1.5
Short-term deposits 2.8 1.6
Long-term deposits 5.0 5.3
Deposits to enterprises 4.7 1.3
Deposits to households 3.3 2.8* Excluding demand deposits.
Source: NBRM
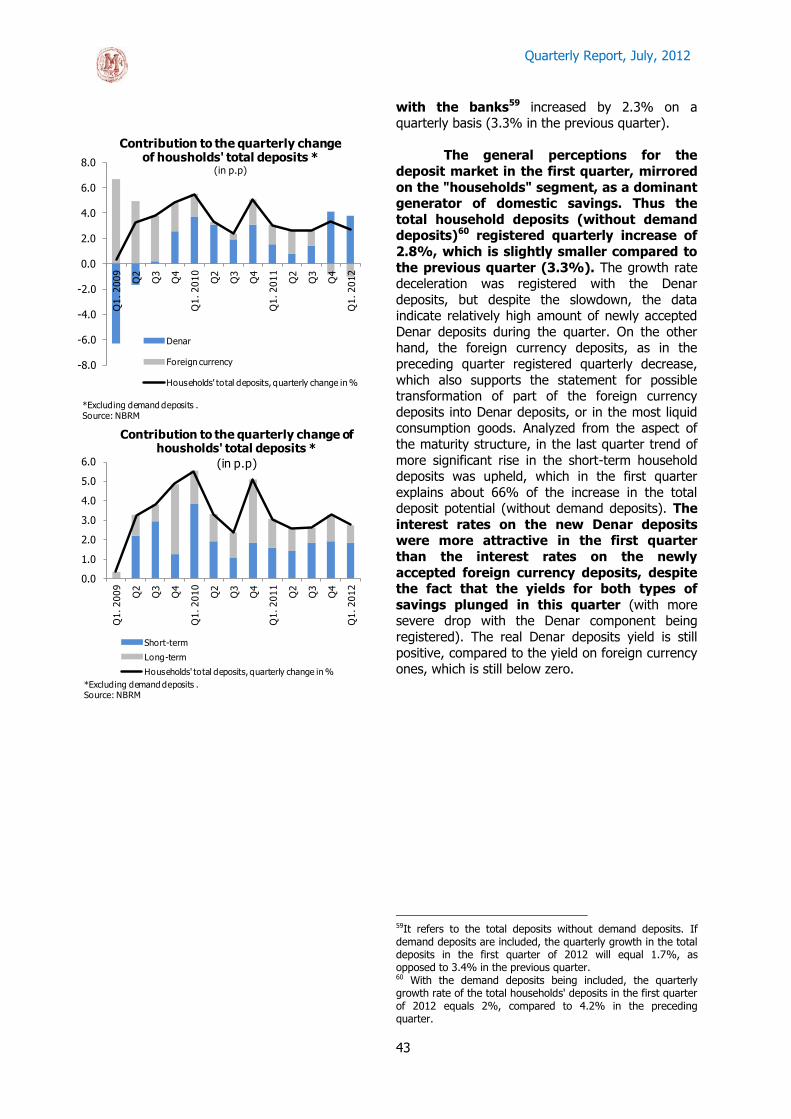
Quarterly Report, July, 2012
43
with the banks59 increased by 2.3% on a quarterly basis (3.3% in the previous quarter).
The general perceptions for the
deposit market in the first quarter, mirrored
on the "households" segment, as a dominant generator of domestic savings. Thus the
total household deposits (without demand deposits)60 registered quarterly increase of
2.8%, which is slightly smaller compared to
the previous quarter (3.3%). The growth rate deceleration was registered with the Denar
deposits, but despite the slowdown, the data indicate relatively high amount of newly accepted
Denar deposits during the quarter. On the other hand, the foreign currency deposits, as in the
preceding quarter registered quarterly decrease,
which also supports the statement for possible transformation of part of the foreign currency
deposits into Denar deposits, or in the most liquid consumption goods. Analyzed from the aspect of
the maturity structure, in the last quarter trend of
more significant rise in the short-term household deposits was upheld, which in the first quarter
explains about 66% of the increase in the total deposit potential (without demand deposits). The
interest rates on the new Denar deposits were more attractive in the first quarter
than the interest rates on the newly
accepted foreign currency deposits, despite the fact that the yields for both types of
savings plunged in this quarter (with more severe drop with the Denar component being
registered). The real Denar deposits yield is still
positive, compared to the yield on foreign currency ones, which is still below zero.
59It refers to the total deposits without demand deposits. If demand deposits are included, the quarterly growth in the total deposits in the first quarter of 2012 will equal 1.7%, as opposed to 3.4% in the previous quarter. 60 With the demand deposits being included, the quarterly growth rate of the total households' deposits in the first quarter of 2012 equals 2%, compared to 4.2% in the preceding quarter.
-8.0
-6.0
-4.0
-2.0
0.0
2.0
4.0
6.0
8.0
Q1. 2009
Q2
Q3
Q4
Q1. 2010
Q2
Q3
Q4
Q1. 2011
Q2
Q3
Q4
Q1. 2012
Contribution to the quarterly change of housholds' total deposits *
(in p.p)
Denar
Foreign currency
Households' total deposits, quarterly change in %
*Excluding demand deposits . Source: NBRM
0.0
1.0
2.0
3.0
4.0
5.0
6.0
Q1. 2009
Q2
Q3
Q4
Q1. 2010
Q2
Q3
Q4
Q1. 2011
Q2
Q3
Q4
Q1. 2012
Contribution to the quarterly change of housholds' total deposits *
(in p.p)
Short-term
Long-term
Households' total deposits, quarterly change in %
*Excluding demand deposits . Source: NBRM

Quarterly Report, July, 2012
44
Regarding the enterprises, the capacity for placement of new deposits in
the banking sector in the first quarter of 2012 was small (quarterly rise of 1.3%,
compared to 4.7% in the fourth quarter of
201161). Analyzed from the viewpoint of the currency structure, the Denar deposits registered
dominant contribution to the total corporate deposits growth, in conditions of moderate
decrease in the foreign currency deposits. From
maturity aspect, the increase in the total corporate
61It refers to the total deposits without demand deposits. If demand deposits are included, quarterly growth of 0.7% is registered, compared to the increase of 2.6% in the preceding quarter.
Banking conditions - Households deposit market
Source: NBRM
Interest rates on newly received deposits of households, in %, on annual level
Interest rates on outstanding amount of total deposits, in %, on annual level
0
1
2
3
4
5
6
7
Q2 2
009
Q3
Q4
Q1. 2010
Q2
Q3
Q4
Q1. 2011
Q2
Q3
Q4
Q1. 2012
Denar deposits
Foreign currency deposits
-4
-2
0
2
4
6
8
10
Q2 2
009
Q3
Q4
Q1. 2010
Q2
Q3
Q4
Q1. 2011
Q2
Q3
Q4
Q1. 2012
2
2.5
3
3.5
4
4.5
1.5
2.5
3.5
4.5
5.5
6.5
7.5
8.5
Q2 2
009
Q3
Q4
Q1. 2
010
Q2
Q3
Q4
Q1. 2
011
Q2
Q3
Q4
Q1. 2
012
Interest rate spread
between denar and
foreign currency
deposits (RHS)
2.5
2.8
3.0
3.3
3.5
3.8
4.0
4.3
4.5
-15,000
-10,000
-5,000
0
5,000
10,000
15,000
Q1. 2
009
Q2
Q3
Q4
Q1. 2
010
Q2
Q3
Q4
Q1. 2
011
Q2
Q3
Q4
Money multiplier-money supply M4*(quarterly changes, in Denar million)
Money multiplier (RHS) Reserve money
Monetary policy instruments M4
*Money multiplier= money supply M4/(reserve money + monetary policy instruments).Source: NBRM
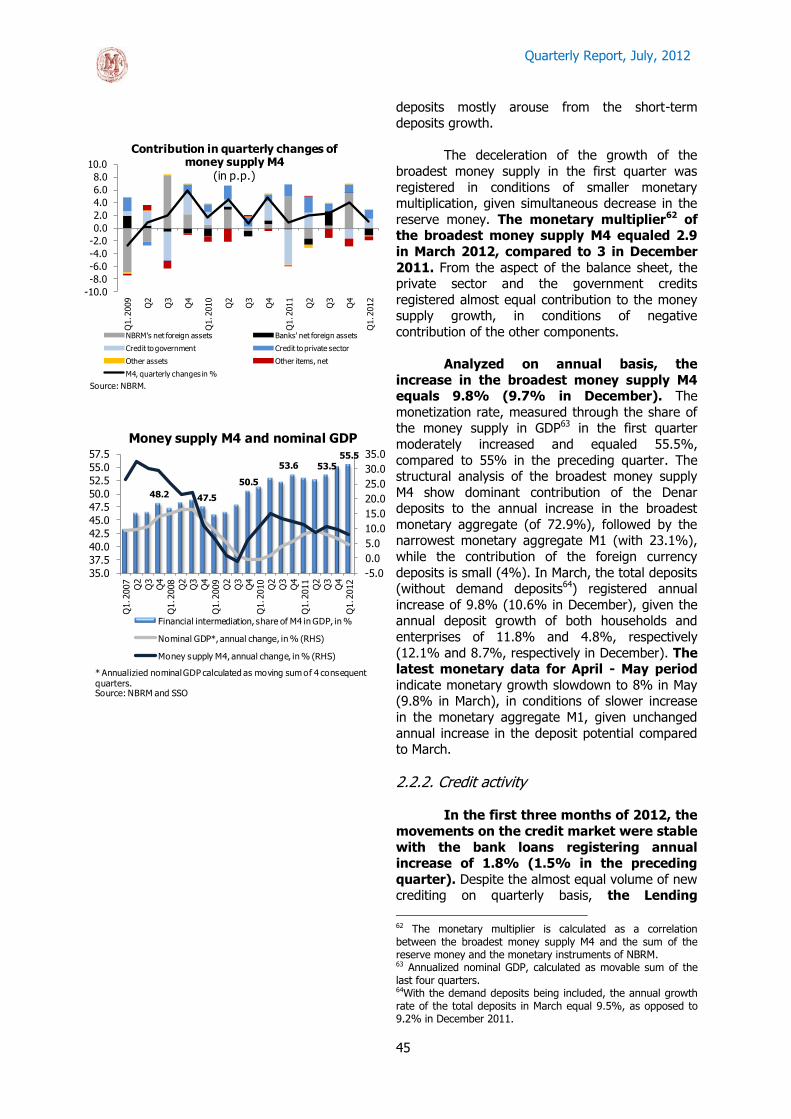
Quarterly Report, July, 2012
45
deposits mostly arouse from the short-term deposits growth.
The deceleration of the growth of the
broadest money supply in the first quarter was
registered in conditions of smaller monetary multiplication, given simultaneous decrease in the
reserve money. The monetary multiplier62 of the broadest money supply М4 equaled 2.9
in March 2012, compared to 3 in December
2011. From the aspect of the balance sheet, the private sector and the government credits
registered almost equal contribution to the money supply growth, in conditions of negative
contribution of the other components.
Analyzed on annual basis, the
increase in the broadest money supply M4 equals 9.8% (9.7% in December). The
monetization rate, measured through the share of the money supply in GDP63 in the first quarter
moderately increased and equaled 55.5%,
compared to 55% in the preceding quarter. The structural analysis of the broadest money supply
М4 show dominant contribution of the Denar deposits to the annual increase in the broadest
monetary aggregate (of 72.9%), followed by the narrowest monetary aggregate M1 (with 23.1%),
while the contribution of the foreign currency
deposits is small (4%). In March, the total deposits (without demand deposits64) registered annual
increase of 9.8% (10.6% in December), given the annual deposit growth of both households and
enterprises of 11.8% and 4.8%, respectively
(12.1% and 8.7%, respectively in December). The latest monetary data for April - May period
indicate monetary growth slowdown to 8% in May (9.8% in March), in conditions of slower increase
in the monetary aggregate M1, given unchanged
annual increase in the deposit potential compared to March.
2.2.2. Credit activity In the first three months of 2012, the
movements on the credit market were stable
with the bank loans registering annual increase of 1.8% (1.5% in the preceding
quarter). Despite the almost equal volume of new crediting on quarterly basis, the Lending
62 The monetary multiplier is calculated as a correlation between the broadest money supply M4 and the sum of the reserve money and the monetary instruments of NBRM. 63 Annualized nominal GDP, calculated as movable sum of the last four quarters. 64With the demand deposits being included, the annual growth rate of the total deposits in March equal 9.5%, as opposed to 9.2% in December 2011.
-4.0
-2.0
0.0
2.0
4.0
6.0
8.0
10.0
Кв.
1 2
007
Кв.
3
Кв.
1 2
008
Кв.
3
Кв.
1 2
009
Кв.
3
Кв.
1 2
010
Кв.
3
Кв.
1 2
011
Кв.
3
Кв.
1 2
012
Придонес во кварталната промена на вкупните кредити на претпријатијата
(во п.п)
Девизни
Денарски
Вкупни кредити, квартални промени, во %Извор: НБРМ.
-10.0
-8.0
-6.0
-4.0
-2.0
0.0
2.0
4.0
6.0
8.0
10.0
Q1. 2
009
Q2
Q3
Q4
Q1. 2
010
Q2
Q3
Q4
Q1. 2
011
Q2
Q3
Q4
Q1. 2
012
Contribution in quarterly changes of money supply M4
(in p.p.)
NBRM's net foreign assets Banks' net foreign assets
Credit to government Credit to private sector
Other assets Other items, net
M4, quarterly changes in %
Source: NBRM.
48.2 47.5
50.5
53.6 53.555.5
-5.0
0.0
5.0
10.0
15.0
20.0
25.0
30.0
35.0
35.0
37.5
40.0
42.5
45.0
47.5
50.0
52.5
55.0
57.5
Q1. 2
007
Q2
Q3
Q4
Q1. 2
008
Q2
Q3
Q4
Q1. 2
009
Q2
Q3
Q4
Q1. 2
010
Q2
Q3
Q4
Q1. 2
011
Q2
Q3
Q4
Q1. 2
012
Money supply M4 and nominal GDP
Financial intermediation, share of M4 in GDP, in %
Nominal GDP*, annual change, in % (RHS)
Money supply M4, annual change, in % (RHS)
* Annualizied nominal GDP calculated as moving sum of 4 consequent quarters.Source: NBRM and SSO

Quarterly Report, July, 2012
46
Survey65 shows net tightening of the crediting terms especially with the corporate
sector, which is the main credit growth mover. The main factors influencing the banks
behavior in this direction, pursuant to the Survey,
are deteriorated risk perceptions in the economy and the future perceptions. Such perceptions show
that in conditions of reduced domestic economic activity and intensified unfavorable signals the
global economy emits, the banks perceive
intensified direct and indirect credit risk and react adequately by adjusting the supply conditions.
Although less emphasized, the quite variable macroeconomic environment and its possible
transmission effects on the domestic economy pose certain risk to the banks and the
"households" segment. The temporary stabilization
on the labor market at the end of the preceding year failed to impose substantially the income
position of the households, having in mind that in the first quarter of 2012 the net wage continued to
fall, both nominally and really. However, the
households' credit portfolio quality fails to register larger deterioration, measured through the share
of the non-performing loans in the households' total loans, which contributed towards further
relaxation of the crediting terms in this segment (on net basis, according to the Survey), but less
intensively in this quarter.
65 Lending Survey, April 2012.
Credit indicators
(quarterly changes, in %)
2011 2012
Q4 Q1
Total credit 1.5 1.8
Denar credit 0.8 2.2
Foreign currency credit 3.4 1.0
Short-term credit -0.3 0.0
Long-term credit 2.3 2.1
Regular credit* 1.5 1.5
Doubtful and contested claims 1.8 4.5
Credit to enterprises 1.8 2.5
Credit to households 1.0 0.8
Source: NBRM.
*Total credit minus doubtful and contested claims and accrued
interest.

Quarterly Report, July, 2012
47
The quarterly growth rate of the
corporate credits in the first quarter of 2012 equaled 2.5%, indicating growth
acceleration and contribution to the total
credits growth (up to 80.4%) relative to the preceding quarter. From the aspect of the
maturity, the increase fully arouse from the long-term crediting, while from the currency viewpoint,
the Denar crediting registered high quarterly contribution (83%), contrary to the preceding
quarter, when its contribution was relatively small
(26.3%). According to the Survey, the larger demand for corporate credits in the first quarter
was influenced by the corporate needs for investment in inventories and working capital. On
the other hand, the needs for investments in fixed
assets had neutral effect on the credit demand, which is probably a reflection of the reduced
investment activity in this period. This points to the still small exploitation of the production facilities66
66According to the Survey for the business tendencies in the manufacturing industry.
-2.0
0.0
2.0
4.0
6.0
8.0
10.0
12.0
14.0
Q1. 2007
Q2
Q3
Q4
Q1. 2008
Q2
Q3
Q4
Q1. 2009
Q2
Q3
Q4
Q1. 2010
Q2
Q3
Q4
Q1. 2011
Q2
Q3
Q4
Q1. 2012
Contribution in quarterly changes of total
credit to households(in p.p.)
F/C
Denar
Quarterly changes of total credits, in %
Source: NBRM

Quarterly Report, July, 2012
48
and reduced import of means of operations in the first quarter. In such conditions, the intensified
increase in the long-term credits can be driven by the needs for settlement of arrears to the
creditors, having in mind the generally difficult
liquidity position of the enterprises67, on one hand, and the weak increase in the corporate deposits
(with demand deposits) on another. The corporate sector will probably face with financial hurdles also
in the following period, especially in Europe, where
the trade connections are routed to and where the most important financial inflows come from. From
the aspect of the credit price, in the first quarter, the newly extended corporate
credits were placed at lower interest rate, on average, compared to the previous quarter.
The credit growth of the "households" sector continued to mount
with relatively smaller dynamics also in the first quarter (quarterly rise of 0.8% on a
quarterly basis, compared to 1% in the
previous quarter). In conditions of mainly unchanged or net relaxed crediting terms68, one of
the factors that have influenced for smaller credit growth is the reduced net demand for credits by
this sector. From the aspect of the individual types of household credits, certain change
relative to the constant dominant contribution of
the consumer loans to the total credits growth was registered. Namely, in this quarter, the increase
was equally supported by the increase in the consumer loans, housing loans and the negative
balances based on current accounts which
registered almost equal absolute quarterly growth. The other loan types registered a decrease. From
the aspect of the factors that influenced on the supply of and demand for household loans, it
seems, for now, that the risks in this sector have
been relatively stabilized. From the end of 2011, the nonperforming loans maintained relatively
stable, while the crediting terms relaxed on a net basis in the last two quarters. However, the banks'
perceptions in the last two Surveys indicate certain change in the influence of the household solvency
as a specific crediting terms factor. Namely,
despite the still mainly neutral influence of this factor, part of the banks indicates its certain
partially unfavorable effect towards tightening of
67 In 2011 and 2010, the balance sheets of the enterprises indicate generally long period of assets binding because of the overdue claims (about 120 days) and realization of the inventories (about 61 days). Accordingly, the period for settlement of the liabilities to the creditors is long and equals about 171 day. More details for the corporate sector performances see in the Financial Stability Report in the Republic of Macedonia, NBRM, June 2012, www.nbrm.mk 68 Lending Survey for the first quarter of 2012.
-4.0
-2.0
0.0
2.0
4.0
6.0
8.0
10.0
12.0
14.0
16.0
Q1. 2007
Q2
Q3
Q4
Q1. 2008
Q2
Q3
Q4
Q1. 2009
Q2
Q3
Q4
Q1. 2010
Q2
Q3
Q4
Q1. 2011
Q2
Q3
Q4
Q1. 2012
Contribution to the quarterly changes of regular
credits* to households(in p.p.)
short-term long-term Quarterly changes of total credits, in %
Source:NBRM
* Total credit to households minus doubtful and contested claims and accured interest.
-4.0
-2.0
0.0
2.0
4.0
6.0
8.0
10.0Q
1. 2007
Q3
Q1. 2008
Q3
Q1. 2009
Q3
Q1. 2010
Q3
Q1. 2011
Q3
Q1. 2012
Contribution in quarterly changes of
total credit to enterprises(in p.p.)
F/C Denar Quarterly changes of total credits, in %
Source:NBRM
-3.0
-2.0
-1.0
0.0
1.0
2.0
3.0
4.0
Q1.
2009
Q3 Q1.
2010
Q3 Q1.
2011
Q3 Q1.
2012
Credit to households by type (contribution in quarterly change of total credit
to households, in %)
Consumer loans
Lending for house purchase
Auto loans
Credit cards
Overdrafts
Other credits
Quarterly changes of total credits, in %Source: NBRM.

Quarterly Report, July, 2012
49
the conditions. Having in mind the expectations for slow economic growth and stagnant movements
on the labor market, it is possible that the financial capacity of the households, the capability for
regular debt servicing, as well as the inclination for
new borrowings will adjust downwards. Observed from the aspect of the price of the household
credits, in the first quarter the interest rates on the newly extended credits were stable
and maintained on average level of the
previous year.
Analyzed on annual basis, the increase in the total loans in March 2012
equals 8% (8.5% in December). In such conditions, the share of the total credits in GDP69
equals 45.4%, compared to 44.7%, in the
preceding quarter. However the credit-to-deposit coverage indicator continued to maintain stable of
about 90%, which indicate possibility for further intensification of the credit activity in the domestic
economy. The latest movements on the credit
market for third consecutive month (starting from March 2012) point to intensified new
crediting. However, in April and May, the annual growth rate equaled 8.5% and 8%,
respectively.
III. Stock exchange indices and real estate prices In the second quarter, the Macedonian stock exchange index MBI-10
generally registered a downward trend. Downward change was also registered with the indices with all regional stock exchanges, mostly as a result of the renewed pessimism, in conditions of new intensification of the debt crisis in the Euro area. The decrease in the value follows the increase in the previous quarter, when temporary smaller risk aversion of the investors was evidenced. The prices of the real estate registered mild fall on both quarterly and annual basis, conditioned by the supply and demand. With the anticipated slowdown of the domestic economic activity, the perceptions for further downward movement of the prices on the capital market and the real estate market also intensify.
In the second quarter, although with
short periods of stagnation and growth, the Macedonian stock exchange index MBI-10
registered downward change compared to the level registered at the end of the
previous quarter. As a result, at the end of
June, the value of MBI-10 was lower by 8.3% compared to the value reached at the end of the
preceding quarter. During the analyzed period, similar trail was registered also with the publically
owned companies index MBID, as well as the
69 Annualized nominal GDP calculated as a movable sum of the respective four quarters.
35.1
41.8
43.4 44.0 44.544.7
-5.0
0.0
5.0
10.0
15.0
20.0
25.0
30.0
35.0
40.0
45.0
25.0
27.5
30.0
32.5
35.0
37.5
40.0
42.5
45.0
47.5
Q1. 2007
Q3
Q1. 2008
Q3
Q1. 2009
Q3
Q1. 2010
Q3
Q1. 2011
Q3
Q1. 2012
Total credits and nominal GDP
Financial intermediation, total credit share in GDP, in %
Total credit, annual change, in % (RHS)
Nominal GDP*, annual change, in % (RHS)
* Annualizied nominal GDP calculated as moving sum of 4 consequent quarters.Source: NBRM and SSO
0.00
2000.00
4000.00
6000.00
8000.00
10000.00
12000.00
01.2
007
03.2
007
05.2
007
07.2
007
09.2
007
11.2
007
01.2
008
03.2
008
05.2
008
07.2
008
09.2
008
11.2
008
01.2
009
03.2
009
05.2
009
07.2
009
09.2
009
11.2
009
01.2
010
03.2
010
05.2
010
07.2
010
09.2
010
11.2
010
01.2
011
03.2
011
05.2
011
07.2
011
09.2
011
11.2
011
01.2
012
03.2
012
MBI-10 Index
MBID
Source: MacedonianStock Exchange.
MBI-10 and MBID

Quarterly Report, July, 2012
50
bonds index OMB which were lower in June by 5.5% and 1.8%, respectively, compared to the
level attained on March 31,2012. With the expected slowdown of the domestic economic
activity, the perceptions for further decrease in the
prices on the capital market also strengthened.
In the second quarter, fall in the value with the regional stock exchanges was
also registered. Namely, the globally smaller risk
aversion, as a characteristic for the first quarter, mainly as a reaction of the Greek debt reduction
and the injected liquidity in the banking system of the Euro area, in the second quarter was replaced
with new pessimism, which is mostly connected with the new intensification of the Euro area debt
crisis. The largest downward correction was
registered by the stock exchange indices from the South Eastern Europe, which is partially related to
the weaker growth prospects of these economies, as a result of the Euro area crisis.
The prices of the real estate, measured through the apartment price
index70, in the second quarter registered quarterly and annual fall of 1.3% and 1.5%,
respectively. Namely, since the second half of the preceding year, the quarterly movement of the
index has been showing alternate stagnation and
falls. With the last negative quarterly movement, the commenced trend of decrease in the
apartment prices intensified. These downward price movements on the real estate market can be
explained also through the supply. Namely, the
continuous maintenance of the growth tendency of the completed construction works in the past
several years can be deemed as cumulated positive effect on the supply, which, most
probably, partially contributes to the initiated mild
downward price change. Simultaneously, the commenced moderate decrease in the apartment
prices could partially be related to the general growth tendency, observed from the beginning of
the previous year, with the number of apartments the construction of which was licensed71. From the
aspect of the demand, a factor that might have
influenced towards increase in the demand for real
70 Hedonic apartment price index prepared by NBRM on the basis of the advertisements for sale in the capital city, while published by the real estate agencies. The price of the apartment is function of the size, location, the floor, whether the apartment is heated through a central heating system, and whether it is new. 71 The connection can be located in the fact that the partly built apartments, as well as blueprint apartments are put on sale, with their price being directly competitive to the apartments of the older housing fund. The data refer to the approvals for construction of apartments in the Skopje region.
15
25
35
45
55
65
75
85
95
105
I.2010
II.2
010
IV.2
010
V.2
010
VI.
2010
VII
I.2010
IX.2
010
XI.
2010
XII
.2010
II.2
011
III.
2011
V.2
011
VI.
2011
VII
I.2011
IX.2
011
XI.
2011
XII
.2011
II.2
012
III.
2012
IV.2
012
VI.
2012
Dow Jones Stoxx Balkan 50 CROBEX - Zagreb
SOFIX - Sofia BELEX15 - Belgrade
SBITOP - Ljubljana BET - Buchurest
MBI-10 - Skopje DJIA-New York
SASX-10 - Sarajevo
Selected stock exchange indices developments(01.01.2008=100)
Source: national stock exchanges.
-12.2
-18.0
-7.6
-13.2
-5.2
-15.7
-6.9
-0.5
-11.0
-8.3
-20 -10 0
SASX-10 - Sarajevo
BELEX15 - Belgrade
CROBEX - Zagreb
SBITOP - Ljubljana
SOFIX - Sofia
BET - Buchurest
BUX - Budapest
WIG20 - Warsaw
DJ Stoxx Balkan 50
MBI-10 - Skopje
Quarterly changes of the regional stock exchange
indices (in %)
Source: national stock exchanges.
80
100
120
140
160
180
200
Q1 2
000
Q3
Q1 2
001
Q3
Q1 2
002
Q3
Q1 2
003
Q3
Q1 2
004
Q3
Q1 2
005
Q3
Q1 2
006
Q3
Q1 2
007
Q3
Q1 2
008
Q3
Q1 2
009
Q3
Q1 2
010
Q3
Q1 2
011
Q3
Q1 2
012
Index of real estate prices (base index ,2005=100)
Source: calculations by the employees of the NBRM based on the data from the daily newspapers.

Quarterly Report, July, 2012
51
estate in the second quarter is the intensification of the monthly growth pace of the housing loans.
In the following period, given the expected
deceleration of the economic activity and
accordingly, increased uncertainty with the households about the future disposable income,
stagnation or slight decrease in the real estate prices is the most probable scenario.
IV. Macroeconomic projections
Within the period between the two projections, new intensification of the debt problems in individual Euro area countries and further deterioration of the economic prospects for the European economy was registered. Given the estimations for further delay of the economic recovery of Europe, the current estimations for the economic growth of the domestic economy equal about 1%, unlike the expectations for economic growth of about 2% in 2012. Although such ambient means smaller exploitation of the export potential, however, it also means absence of pressures of the domestic demand on the imports and absence of bigger disturbance of the external disbalance. In environment of more evident uncertainty and mounting expenses for external borrowing, the capital inflows are expected to be lower. However, the total capital inflows are estimated as sufficient for financing the current account deficit and additional accumulation of foreign reserves. As a result, the current macroeconomic scenario until the end of 2012 indicates no larger disbalance on the foreign exchange market and further maintenance of adequate level of foreign reserves. The latest estimations for 2012 inflation show inflation growth of 2.2%, with evident upward risks because of the unfavorable shocks emerging in the world supply of food. Similar inflation rate is expected also in 2013. The projections for 2013 show recovery of the real sector and acceleration of the GDP growth rate to 3%, underpinned by the recovery of the export and investment revival. The current account deficit is not expected to have larger changes compared to 2012. The capital net inflows are estimated to be at similar level as in 2012 and they are sufficient for covering needs for financing based on current transactions and increase in the foreign reserves. The risks related to this macroeconomic scenario mainly arise from the external sources. First, there is risk of intensification of the slight growth effect of our most important trading partners on the real sector and that it will carry on also in 2013, delaying the crisis for a longer period. In one such scenario, the risk of significantly lower capital inflows than expected is especially important. Secondly, the risks of larger price shocks with the food products, created by the factors on the supply side, with potentially transmission effects on other prices are more apparent.
4.1. Assumptions in the external environment projections
The prolongation and the intensification of the debt crisis in the Euro area in May caused new changes in the global economic environment. In such conditions, in a relatively short period, the assumptions for the external environment of the Macedonian economy have changed. The economic prospects for the most important trading partners deteriorated again. The worsened economic and financial conditions created downward pressures with the prices also on the global market of primary products, worsening the trading conditions and changing the downward pressures of the import prices on the domestic inflation. However, shocks on the food supply side occurred meanwhile, which once again returned the world food prices on the upward track.
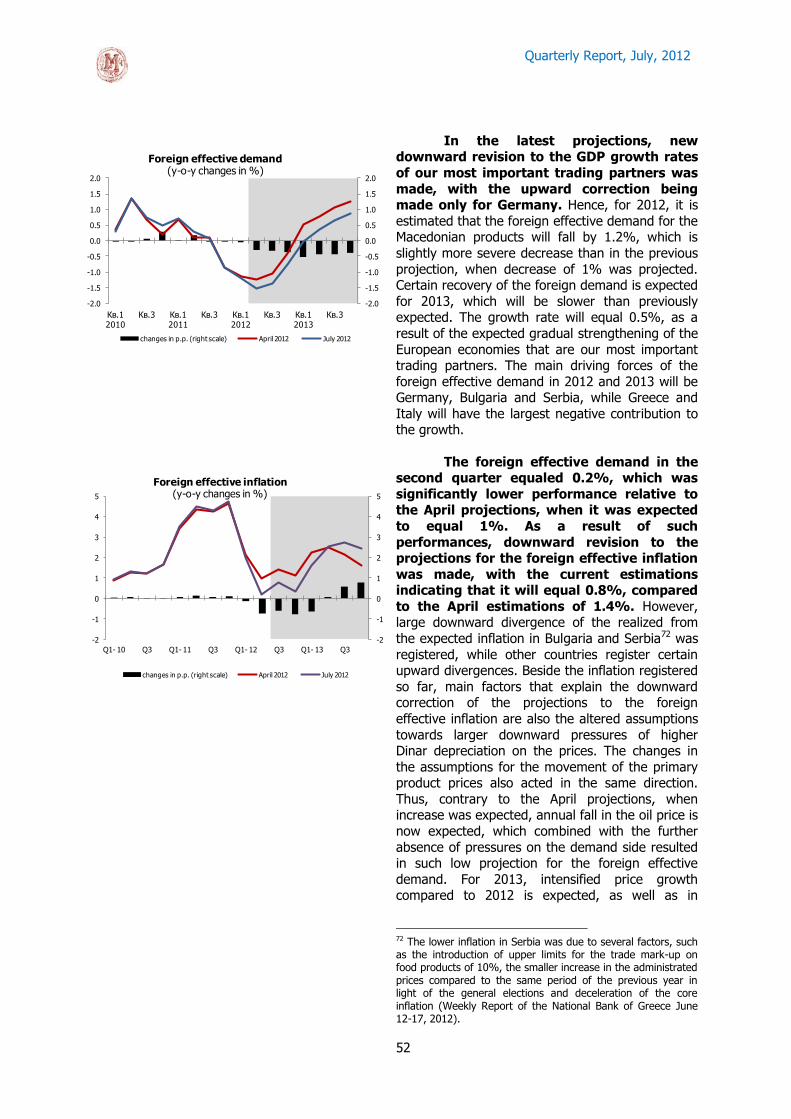
Quarterly Report, July, 2012
52
In the latest projections, new downward revision to the GDP growth rates
of our most important trading partners was
made, with the upward correction being made only for Germany. Hence, for 2012, it is
estimated that the foreign effective demand for the Macedonian products will fall by 1.2%, which is
slightly more severe decrease than in the previous
projection, when decrease of 1% was projected. Certain recovery of the foreign demand is expected
for 2013, which will be slower than previously expected. The growth rate will equal 0.5%, as a
result of the expected gradual strengthening of the
European economies that are our most important trading partners. The main driving forces of the
foreign effective demand in 2012 and 2013 will be Germany, Bulgaria and Serbia, while Greece and
Italy will have the largest negative contribution to the growth.
The foreign effective demand in the second quarter equaled 0.2%, which was
significantly lower performance relative to the April projections, when it was expected
to equal 1%. As a result of such
performances, downward revision to the projections for the foreign effective inflation
was made, with the current estimations indicating that it will equal 0.8%, compared
to the April estimations of 1.4%. However, large downward divergence of the realized from
the expected inflation in Bulgaria and Serbia72 was
registered, while other countries register certain upward divergences. Beside the inflation registered
so far, main factors that explain the downward correction of the projections to the foreign
effective inflation are also the altered assumptions
towards larger downward pressures of higher Dinar depreciation on the prices. The changes in
the assumptions for the movement of the primary product prices also acted in the same direction.
Thus, contrary to the April projections, when increase was expected, annual fall in the oil price is
now expected, which combined with the further
absence of pressures on the demand side resulted in such low projection for the foreign effective
demand. For 2013, intensified price growth compared to 2012 is expected, as well as in
72 The lower inflation in Serbia was due to several factors, such as the introduction of upper limits for the trade mark-up on food products of 10%, the smaller increase in the administrated prices compared to the same period of the previous year in light of the general elections and deceleration of the core inflation (Weekly Report of the National Bank of Greece June 12-17, 2012).
-2.0
-1.5
-1.0
-0.5
0.0
0.5
1.0
1.5
2.0
-2.0
-1.5
-1.0
-0.5
0.0
0.5
1.0
1.5
2.0
Кв.1 2010
Кв.3 Кв.12011
Кв.3 Кв.12012
Кв.3 Кв.12013
Кв.3
Foreign effective demand(y-o-y changes in %)
changes in p.p. (right scale) April 2012 July 2012
-2
-1
0
1
2
3
4
5
-2
-1
0
1
2
3
4
5
Q1- 10 Q3 Q1- 11 Q3 Q1- 12 Q3 Q1- 13 Q3
Foreign effective inflation(y-o-y changes in %)
changes in p.p. (right scale) April 2012 July 2012

Quarterly Report, July, 2012
53
comparison with April projections, with the foreign effective inflation being equal to 2.3%.
In the second quarter of 2012, the
average oil price fell by 7% on annual basis
for the first time after 2009 and equaled US Dollar 108.9 per barrel. This is opposite to April
assumptions when oil price growth of 3.7% was expected. Until the end of 2012, further substantial
decrease in the oil price is expected. Thus the
latest estimations indicate that the average oil price in 2012 will plunge to the level of US Dollar
105.8 per barrel, which is a decrease of 4.6% compared to 2011, i.e. 11.3% compared to the
previous projection. The downward correction of the estimation for the oil price is due to the
estimations for higher current and future supply of
crude oil compared to the expectations, mainly of the non-OPEK members, as well as the prospects
for the global demand. In 2013, the oil price is expected to drop below US Dollar 100 for the first
time since 2010, i.e. to equal US Dollar 97.7 per
barrel, on average, on annual basis, which is substantially lower than in April projection by US
Dollar 115.6.
The metal prices continued to register
severe annual drop also in the second quarter. By products, larger price decrease compared to April
projections with iron, nickel and steel was registered. Such price decrease was due to the
decelerated import demand, especially from Europe and China, as well as the mounting stocks
of certain metals. According to the latest
projections, in 2012 intensified decrease in the prices of iron, nickel and steel compared to the
previous estimations is expected. The metal prices will stay in the zone of negative changes also in
2013, with the annual significantly lower decrease
being expected than in 2012. In comparison with April projections, it is now expected larger
decrease in the nickel price, lower decrease in the iron price and decrease instead of increase in the
price of steel.
The food prices in the second quarter
of 2012 substantially fell as a result of the solid supply and deteriorated global demand. However,
the prices of maize and wheat registered significantly deeper decrease than expected in the
April projections. As for the dynamics, in the
second half of the year, intensified increase in the price of maize and wheat is expected as a result of
the worsened prospects for their supply caused by the drought in the USA and Russia. Such a growth
effect is expected to be exhausted until the end of
2013, when the food prices are expected to
-25
-20
-15
-10
-5
0
5
70
80
90
100
110
120
130
Q1- 10 Q3 Q1- 11 Q3 Q1- 12 Q3 Q1- 13 Q3
Europe Brent(quarterly average, USD/barrel)
changes in p.p. (right scale) April 2012 July 2012
0.00
0.01
0.02
0.03
0.04
0.05
0.06
0.07
0.08
0.09
0.10
0.60
0.65
0.70
0.75
0.80
0.85
0.90
Q1- 10 Q3 Q1- 11 Q3 Q1- 12 Q3 Q1- 13 Q3
Euro/Dollar exchange rate
changes in p.p. (right scale) April 2012 July 2012
-40
-20
0
20
40
60
80
100
Q1- 10 Q3 Q1- 11 Q3 Q1- 12 Q3 Q1- 13 Q3
Metal prices(y-o-y changes in %)
Nickel Steel Iron
-40
-20
0
20
40
60
80
100
Q1- 10 Q3 Q1- 11 Q3 Q1- 12 Q3 Q1- 13 Q3
Food prices(y-o-y changes in %)
Wheat - April 2012 Wheat - July 2012
Maize - April 2012 Maize - July 2012

Quarterly Report, July, 2012
54
decrease again. On average, in 2012 increase in the prices of maize and wheat is envisaged, that
will continue also in 2013 and it will be higher with the prices of wheat.
In the second quarter of 2012, the relevant foreign interest rate (one-month
EURIBOR) continued to decrease, as a result of which the realized level was lower than expected.
The decrease in the interest rate on the European
interbank market was mostly due to the spread influence of the three-year long-term refunding
operations performed in the two preceding quarters through which ECB ensured sufficient
liquidity for the banking system at extremely low
interest rates. Also, in July, ECB reduced the key interest rate by 0.25 percentage points. It is
expected that at the end of 2012 and in 2013, the foreign interest rate will gradually increase, but still
remaining at low levels (lower than projected in April).
4.2. Projection and effects on the monetary policy The changes in the global economic and financial conditions in both the
second and the third quarter impacted also the domestic monetary policy ambient. The turbulence on the global financial markets, once again elevated the uncertainty and the incredulity of the investors. In such conditions, the international capital flows are volatile thus creating large risks also for the private capital inflows in the domestic economy. Simultaneously, the conditions for external financing of the Government deteriorated, which can also mean smaller foreign exchange inflows in the economy. On the other hand, it is estimated that in the following two-year period the domestic demand will not make pressure on the external position. Namely, the delayed economic recovery of the Euro area means also probable prolongation of the period of incomplete use of the domestic economic potential. Also, the further decrease in the foreign interest rate results in widening of the interest rate differential. This also means larger attractiveness of the domestic currency and consequently, no pressures on the demand for foreign exchange. The combination of these factors is expected to result in a foreign reserves level that will be near to the adequate one also in the following two years. Thus, basically, the risk premium of the domestic economy relative to the Euro area is not changing significantly, so the current monetary conditions are considered as adequate.
The further deterioration of the global
economic environment and the extremely
unfavorable weather conditions resulted in a
reduction of the economic activity in the first quarter. The available data for April and May
indicate downward adjustment of the economic activity also in the second quarter of the year. In
such conditions, the new estimates for the domestic economy growth suggest significant
growth slowdown in 2012 compared to
2011, i.e. GDP growth of about 1% is
-1.0
-0.5
0.0
0.5
1.0
1.5
2.0
2.5
-1.0
-0.5
0.0
0.5
1.0
1.5
2.0
2.5
Q1- 10 Q3 Q1- 11 Q3 Q1- 12 Q3 Q1- 13 Q3
1M Euribor(in %)
changes in p.p. (right scale) April 2012 July 2012
-12.0
-9.0
-6.0
-3.0
0.0
3.0
6.0
9.0
12.0
15.0
Q1 2010
Q3 Q1 2011
Q3 Q1 2012
Q3 Q1 2013
Q3
Growth decomposition(contributions to the y-o-y rate, in p.p.)
domestic demand net-exports GDP (in %)

Quarterly Report, July, 2012
55
expected. However, in accordance with the sources of uncertainty, it is estimated that the
investments and the export would have significant negative contribution to the growth, which will be
mitigated through the positive contribution of the
private consumption and the reduced import. For 2013, stabilization of the situation and
economic growth of 3% has been projected given intensification of the growth of the domestic
demand and exports.
The decrease in the economic activity in
part of the Euro area countries, together with the high uncertainty regarding the duration of the
European debt crisis reflected on the estimations for the future movement of the foreign demand for
the Macedonian products, which is negative in
2012. This, accompanied with the decrease in the export prices of the domestic products because of
the downward movements with the world prices, will result in a decrease in the real export in
2012. The gradual recovery of the foreign demand
accompanied with the expected growth on the world export prices point to acceleration of the
export activity in 2013. Beside the influence of these factors, significant factor for the export
growth in 2013 will also be the increase in the total export potential, because of the expansion of the
existing and the start-up of the new export
capacities.
The renewed increase of the global uncertainty, the lower export activity and
larger restrain of the economic entities are
expected to condition significant growth deceleration of the domestic demand in
2012. The bigger caution of the consumers, accompanied with the expected decrease in the
real wages and the anemic condition on the labor
market are factors that will result in a deceleration of the private consumption
growth rate in 2012 compared to the previous year. However, having in mind the slow
adjustment of the private consumption, proved by the data for the first quarter of the year, the
household consumption is expected to stay in the
positive zone also in 2012. The propensity to consume will be underpinned, to certain extent, by
the lower opportunity cost given the fall in the savings yields. In line with the performances
in the first quarter of the year, in 2012 larger
downward adjustment to the investment activity is expected. The anticipated decrease in
the domestic production and the poor export activity will act towards larger restrain from
investment with the economic entities. The current estimate for probably lower inflow of foreign
-10
0
10
20
30
40
50
Q1 2010
Q3 Q1 2011
Q3 Q1 2012
Q3 Q1 2013
Q3
Exports of goods and services
(y-o-y changes, in %)
-6
-4
-2
0
2
4
6
8
10
Q1 2010
Q3 Q1 2011
Q3 Q1 2012
Q3 Q1 2013
Q3
Private consumption(y-o-y changes, in %)
-45
-30
-15
0
15
30
45
60
75
Q1 2010
Q3 Q1 2011
Q3 Q1 2012
Q3 Q1 2013
Q3
Gross fixed capital formation(y-o-y changes, in %)

Quarterly Report, July, 2012
56
investments has also additional negative effect. The negative trends in the domestic
economy would be depleted in 2013 already, in line with the expected recovery of the
European economy and revival of the global
economic activity. Main growth factors in 2013 are expected to be the export and the
investments, while positive contribution to the increase is estimated from the private
consumption. In 2013, growth intensification of the
private consumption is expected, given projected increase in the real disposable income and gradual
strengthening of the consumer confidence. Also, the starting of the new production capacities would
have positive transmission effects on the labour market - through opening new jobs and
stimulating the demand for labour force, which
would additionally stir the household consumption. Positive impulses to the growth in 2013
based on revitalization of the investment activity are also expected. Namely, after the
decrease in the investments in 2012, the
stabilization of the situation in the global environment in 2013 will mean better expectations
of both the domestic and foreign investors. Large part of the private investments will be financed
through the expected inflow of foreign direct investments.
The banking system in this and in the following year should provide, according
to the expectations, additional financial support to the domestic demand. In the first
half of the year, intensification of the activity on
the credit market was registered. Until the end of 2012, the current estimations indicate further
credit growth, which would reach about 8% on annual basis. These estimations are based on the
banks stable risk perceptions, in conditions of
temporary activity discontinuity in the real sector. Also further stimulating effect towards higher
credit growth from the monetary policy relaxation in the previous quarter is expected, having in mind
the time lags in the monetary transmission. Active financial support through banks is expected not
only for the corporate sector, but for the
households, as well. Namely, given the real decrease in the wages, the bank credits are
expected to finance one segment of the household consumption in 2012. However, the largest portion
of the credits is expected to be placed with the
corporate sector, supported also by the EIB credit line. The credit activity is expected to mount,
up to 10% in 2013, as well. However, also in 2012 and 2013, in conditions of disposable assets
with the banks for larger credit activity, key factor for larger credit support will be the perceptions for
-4
-2
0
2
4
6
Q1 2010
Q3 Q1 2011
Q3 Q1 2012
Q3 Q1 2013
Q3
Employed persons(y-o-y changes, in%)
40
43
46
49
52
55
0
3
6
9
12
Q1 2010
Q3 Q1 2011
Q3 Q1 2012
Q3 Q1 2013
Q3
Credit growth
credit growth (y-o-y changes, in %)
share of credits in GDP (in %), right axis

Quarterly Report, July, 2012
57
the risk degree of the new demand and its delayed effects on the credit portfolio quality. From the
aspect of the credit demand, in 2012 relatively solid credit demand is expected. The inclination for
new borrowing would additionally increase in 2013
according to the assumptions for revitalization of the investment activity and improvement of the
labor market conditions. Also in 2012 and 2013, deposit growth is expected, which remains
to be the main source of banks funding.
According to the current expectations for the economic activity growth, for the prices and the
movements in the external sector, the deposit growth in 2012 and 2013 is estimated at 7% and
10.4% on annual basis, respectively.
The lower export and the reduced
investment activity will result in a decrease in the import of goods and services in 2012. The
simultaneous decrease in both the export and import of goods and services conditions exhaustion
of the negative contribution of the net export
demand, i.e. it would have neutral effect. Contrary, the expected recovery of the domestic demand
and the export activity will condition also higher import in 2013, with the contribution of the net
export returning again in the negative zone.
In conformity with the estimated export
and import dynamics, the deficit in the trade of goods and services in 2012 is expected to equal
about 21.4% of GDP, which is minimal widening compared to the previous year. The private
transfers are expected to further finance
substantial part of the foreign trade deficit. Namely, also in the first half of 2012, in conditions
of larger instability on the financial markets and uncertainty about the future of the Euro area, the
confidence in the Euro currency remained low. In
such conditions, the confidence in Denar continued to strengthen, so significantly higher net purchase
of foreign cash on the currency exchange market is expected. Although this effect is expected to be
weaker in the second half of the year, in 2012, however, increase in the share of the private
transfers to 19.5% of GDO is estimated. These
expectations correspond to the estimates for absence of larger inflationary pressures, as well as
with mounting propensity for keeping domestic currency. In line with these assumptions, in 2012
the current account deficit is expected to equal
2.9% of GDP. In 2013, relatively faster growth in the exports than the imports and moderate
narrowing of the trade deficit is expected. The private transfers will further finance the largest
part of the trade deficit also in 2013, although their relative share in GDP will decrease to 18.3%,
-10
0
10
20
30
40
50
Q1 2010
Q3 Q1 2011
Q3 Q1 2012
Q3 Q1 2013
Q3
Imports of goods and services
(y-o-y changes, in %)
2008 2009 2010 2011 2012 2013
Current account -12.8 -6.8 -2.1 -2.7 -2.9 -3.0
Trade balance -26.2 -23.3 -20.8 -22.3 -22.2 -21.5
Services, net 0.1 0.2 0.7 1.3 0.8 0.8
Income, net -1.4 -0.7 -1.4 -1.5 -1.5 -1.2
Current transfers, net 14.7 16.9 19.4 19.8 20.0 18.9
Private transfers, net 13.9 16.4 18.9 18.8 19.5 18.3
Capital account -0.2 0.3 0.2 0.3 0.0 0.0
Financial account 11.9 5.9 1.7 6.2 3.3 3.5
Foreign Direct Investment, net 6.1 2.0 2.2 4.0 2.0 3.0
Portfolio Investment, net -0.8 1.6 -0.9 -0.6 -0.1 -2.2
Other Investment, net 6.5 2.4 0.3 2.7 1.5 2.7
Balance of Payment Forecast
(% of GDP)
Quarterly Report, July, 2012
58
which will be the main factor for minimal increase in the current account deficit in 2013 to 3% of
GDP.
As opposed to the almost unchanged
current account deficit, the total capital and financial net inflows in 2012 are estimated
lower than in 2011. This change is mainly due to the Government behavior, i.e. reduced foreign
borrowing, amid unfavorable financial conditions
on the international financial markets. Also, the worsened economic environment and the
mounting uncertainty are expected to result in smaller inflows based on both direct investments
and borrowings of the private sector. Namely, the realized foreign direct investments so far are
moderate, as a reflection of the payment of
dividend to foreign owners, as well as the outflow of funds for financing parent companies through
intercompany borrowing. Until the end of the year, the current estimations show possibility for direct
investments based inflows of about 2% of GDP,
i.e. twice less compared to the previous year. However, in conditions of worsened global
economic environment and larger uncertainty, there are risks for weaker performances. This
refers, to great extent, to the possible outflows of capital through intercompany borrowing, in
conditions of liquidity needs of the parent entities.
The recovery of the global economy, the return of the investors' confidence and the realization of the
postponed projects will result in increase in the foreign direct investments in 2013, when they are
expected to equal about 3% of GDP, thus
contributing for intensification of the investment activity in the country. The increase in the foreign
investments is the main factor for the rise in the private capital inflows in 2013. However, in
conditions of net repayments of the Government's
external debt, the total capital net inflows in 2013 would be minimally higher compared to 2012.
In conditions of moderate current account
deficit in 2012 and in 2013, the projected capital flows are estimated as sufficient for both, its financing and supplementing the foreign reserves. It is estimated also that the foreign reserves stock will continually be maintained near the adequate level.
The inflation projection for 2012 and
2013 equals 2.2%. In conditions of negative shock on the food supply side73, in the second half
of 2012 and in 2013 the world prices are expected
73 Lower yields and smaller expected supply of maize and wheat because of the warm weather conditions in USA and Black Sea region.

Quarterly Report, July, 2012
59
to create upward pressures on the domestic food prices. On the other hand, the pressures of the oil
prices on the domestic inflation are expected to exhaust gradually, especially during 2013. In
conditions of negative output gap, also in 2012
and in 2013, the demand is not expected to act towards increase in the price level. However, the inflation projection is accompanied with upward risks. Namely, the recent growth in oil and food prices and the possible realization of the announcements that it will continue in the following period would result in more intensive price growth until the end of this year and in 2013. In addition, despite the fact that certain increase in
the regulated prices (electricity and heating energy prices) has already been included in the baseline
inflation projection, however, the intensity of their
growth and their transmission effects are important risk factor.
Comparison with the previous projection
The comparison of the July with the April
projections indicate smaller current account deficit in 2012 and 2013, driven to great extent, by the expectations for higher inflows through private transfers. In the capital and financial account, downward revision of the expected inflows was made. In 2012, this correction is a combination of lower private and government inflows, while in 2013 it is due to the lower net inflows for the private sector. In 2012 and 2013, smaller GDP growth compared to the previous projection is expected. The projection for the average annual inflation rate has been revised upwards compared to the previous projection.
In conditions of further unfavorable
economic situation in the Euro area, in the July
projection, new and more sizeable downward revision of the Macedonian economy growth
projection was made. Thus unlike the previous expectations for growth of 2%, the latest
estimates indicate GDP growth of about 1% in 2012, with the downward correction being made
with almost all expenditures components of GDP.
The current projections envisage moderately lower foreign effective demand relative to the April
projection, which influence downwards to the estimates for the investment consumption and the
export of goods and services. However, instead of
the expected growth in April, it is now envisaged that the investments will register annual drop,
while the decrease with the export will be deeper than in the April projection. It is further expected
that the private consumption will be slightly higher compared to the previous estimations. The
-4
-3
-2
-1
0
1
2
3
4
5
Q1 2009
Q3 Q1 2010
Q3 Q1 2011
Q3 Q1 2012
Q3 Q1 2013
Q3
Inflation
(y-o-y changes, in %)
inflation output gap (% of potential GDP)
-5.0
-3.0
-1.0
1.0
3.0
5.0
7.0
9.0
Q1 2010
Q3 Q1 2011
Q3 Q1 2012
Q3 Q1 2013
Q3
GDP(annual changes, in%)
April 2012 July 2012

Quarterly Report, July, 2012
60
decrease in the imports, conditioned by the reduced export is estimated to be higher than in
the previous projection, influenced by the downward revised growth in the domestic demand.
In 2013 recovery of the domestic economy is
expected to be slower than the previous estimates, with the GDP growth rate equaling 3%, instead of
3.7%, as expected in April.
The projection cycle in July envisage minor
upward movements regarding the projected inflation rate in 2012 and 2013, so now it is
expected to equal about 2.2%, on average. Regarding the assumptions for the inflation
projection, downward revision to the increase in the crude oil price was made, towards slight
upward influence in 2012 and large downward
influence in 2013. On the other hand, the food prices suffered substantial upward correction, thus
influencing relatively strongly on the price growth in 2012 and 2013. However, the influence of such
high attainments has been partially compensated
by the downward effect of the expected deeper and enduring negative output gap on the prices.
As a result of the worsened assumption
regarding the external environment and revised real economy growth, the July projection was
adequately corrected also regarding the expected
foreign trade flows. However, the current projection fails to show change with the trade
balance as a share in the GDP relative to April, given slight worsening in the non-energy trade
deficit and improvement in the deficit in the trade
of energy. On the other hand, the inflows based on current transfers are expected to be at higher
level than in April projection. Hence, slight downward revision to the projected current
account deficit in 2012 was made, which will
equal 2.9% of GDP, instead of 3.2%, as expected in April. Unlike the current account,
more significant downward corrections with the capital and financial account were made. From the
aspect of the components, the net inflows based on direct investments, which are important
category from the aspect of the current deficit
financing, registered the largest downward change. Also, according to the official
announcements, substantially lower external borrowing of the Government in 2012 is now
expected. As a result of these revisions, smaller
accumulation of foreign reserves in 2012 is projected now, relative to the previous projections.
Similar to 2012, the current account deficit has been revised downwards compared to the April
projections, expecting that it would equal 3% instead of 3.2% of GDP. The private capital inflows
-4.0
-3.0
-2.0
-1.0
0.0
1.0
2.0
3.0
4.0
5.0
6.0
Q1 2011
Q2 Q3 Q4 Q1 2012
Q2 Q3 Q4
Inflation
(annual changes, in %)
April 2012 July 2012
-15.0
-13.0
-11.0
-9.0
-7.0
-5.0
-3.0
-1.0
2007 2008 2009 2010 2011 2012 2013
Current account
(in % of GDP)
April 2012 July 2012
April July April July
GDP 2.0 1.0 3.7 3.0
Personal consumption 1.3 1.7 2.3 1.9
Investment consumption 2.7 -1.3 8.8 8.0
Public consumption 2.5 1.0 3.0 2.5
Export of goods and services -2.3 -2.9 13.5 12.4
Import of goods and services -1.3 -1.9 10.7 9.9
Inflation 2.0 2.2 - 2.2
Current account deficit
(% of GDP)-3.2 -2.9 -3.2 -3.0
Forecast of selected macroeconomic variables
annual rates of change (in %)2012 forecast 2013 forecast
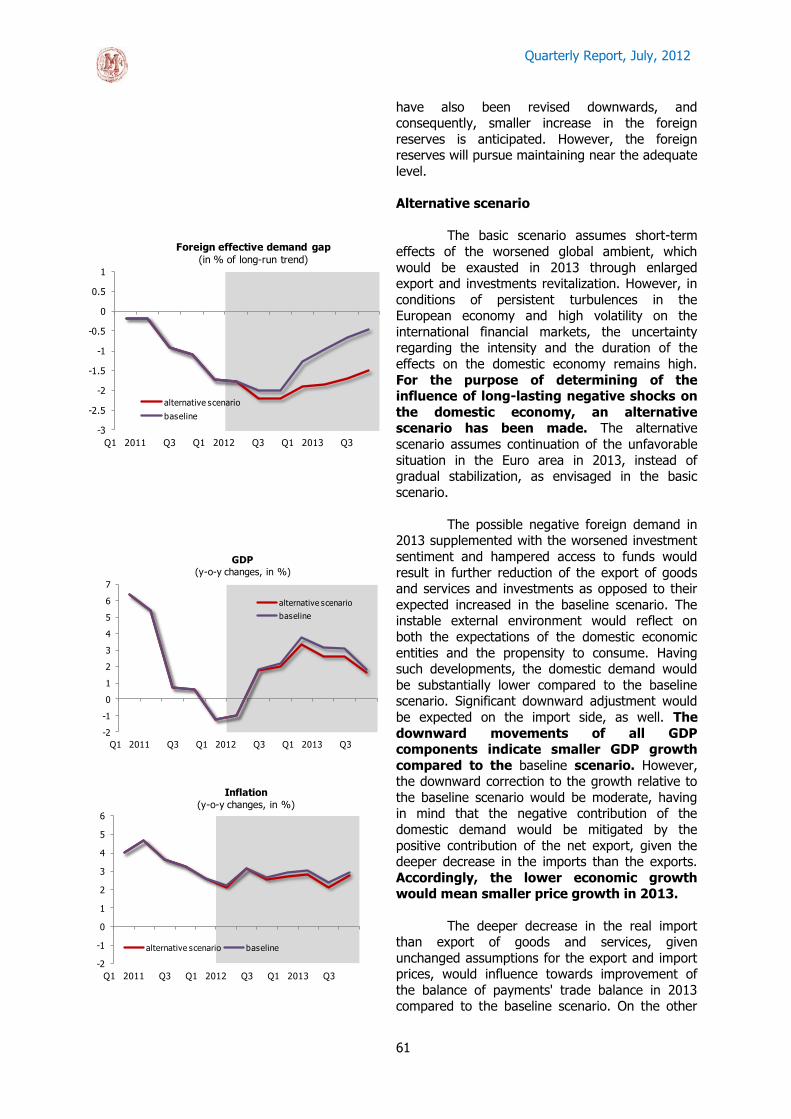
Quarterly Report, July, 2012
61
have also been revised downwards, and consequently, smaller increase in the foreign
reserves is anticipated. However, the foreign reserves will pursue maintaining near the adequate
level.
Alternative scenario
The basic scenario assumes short-term
effects of the worsened global ambient, which
would be exausted in 2013 through enlarged export and investments revitalization. However, in
conditions of persistent turbulences in the European economy and high volatility on the
international financial markets, the uncertainty regarding the intensity and the duration of the
effects on the domestic economy remains high.
For the purpose of determining of the influence of long-lasting negative shocks on
the domestic economy, an alternative scenario has been made. The alternative
scenario assumes continuation of the unfavorable
situation in the Euro area in 2013, instead of gradual stabilization, as envisaged in the basic
scenario.
The possible negative foreign demand in 2013 supplemented with the worsened investment
sentiment and hampered access to funds would
result in further reduction of the export of goods and services and investments as opposed to their
expected increased in the baseline scenario. The instable external environment would reflect on
both the expectations of the domestic economic
entities and the propensity to consume. Having such developments, the domestic demand would
be substantially lower compared to the baseline scenario. Significant downward adjustment would
be expected on the import side, as well. The
downward movements of all GDP components indicate smaller GDP growth
compared to the baseline scenario. However, the downward correction to the growth relative to
the baseline scenario would be moderate, having in mind that the negative contribution of the
domestic demand would be mitigated by the
positive contribution of the net export, given the deeper decrease in the imports than the exports.
Accordingly, the lower economic growth would mean smaller price growth in 2013.
The deeper decrease in the real import than export of goods and services, given
unchanged assumptions for the export and import prices, would influence towards improvement of
the balance of payments' trade balance in 2013 compared to the baseline scenario. On the other
-3
-2.5
-2
-1.5
-1
-0.5
0
0.5
1
Q1 2011 Q3 Q1 2012 Q3 Q1 2013 Q3
Foreign effective demand gap
(in % of long-run trend)
alternative scenario
baseline
-2
-1
0
1
2
3
4
5
6
7
Q1 2011 Q3 Q1 2012 Q3 Q1 2013 Q3
GDP
(y-o-y changes, in %)
alternative scenario
baseline
-2
-1
0
1
2
3
4
5
6
Q1 2011 Q3 Q1 2012 Q3 Q1 2013 Q3
Inflation
(y-o-y changes, in %)
alternative scenario baseline

Quarterly Report, July, 2012
62
hand, as for the net private transfers, as an indicator for the economic agents' currency
preference, no larger changes compared to the baseline scenario are expected. The decrease in
the trade deficit would result in narrowing of
the current account deficit compared to the baseline scenario. Contrary to the improvement in
the current account balance, the alternative scenario assumes significant downward
correction of the capital and financial
account relative to the baseline scenario. Firstly, the escalation of the crisis would be
followed by larger restrain from investment, because of the worsened risk perceptions of the
foreign investors, which would result in smaller volume of new foreign direct investments.
Secondly, the crisis deepening would also mean
less borrowing of the domestic economic agents on the international markets because of the
smaller need for external borrowing in conditions of smaller increase in the production, as well as
because of the larger borrowing cost. Hence the
alternative scenario indicates probably lower capital inflows from borrowing relative to the
baseline scenario. In such conditions, the possible materialization of the alternative scenario
could also mean a need for financing part of the current deficit in 2013 through the
foreign reserves.
-15
-12
-9
-6
-3
0
2007 2009 2011 2013
Current account
(in % of GDP)
alternative scenario
baseline
STATISTICAL APPENDIX
Tables from the real sector
Table 1: Gross domestic product
Table 2: Prices
Table 3: Industrial production index
Table 4: Employment and productivity in total economy
Table 5: Wages
Table 6: Budget of the Republic of Macedonia
Tables from the monetary sector
Table 7: National bank of the Republic of Macedonia - balance sheet
Table 8: Report form for other depository corporations (banks and saving houses)
Table 9: Depository corporations survey - NBRM, other depository corporations (ODI-banks and saving houses)
Table 10: Banks and saving houses' loans
Table 11: Monetary aggregates and components thereof (non-government sector)
Table 12: Claims of other depository corporations (banks and saving houses)
Table 13: Liabilities of other depository corporations (banks and saving houses)
Table 14: Report on weighted interest rates on deposits and borrowings
Table 15: Interest rates of the National Bank of the Republic of Macedonia
Table 16: Reserve requirements of banks and saving houses
Table 17: Interest rates on government securities
Tables from the foreign exchange sector
Table 18: Republic of Macedonia:balance of payments
Table 19: Republic of Macedonia:balance of payments
Table 20: Republic of Macedonia:balance of payments - services
Table 21: Republic of Macedonia:balance of payments - income
Table 22: Republic of Macedonia:balance of payments - current transfers
Table 23: Republic of Macedonia:balance of payments - capital and financial account
Table 24: Merchandise trade by sections of SITC and by end use
Table 25: Foreign trade by countries
Table 26: Stock of foreign direct investment in Republic of Macedonia by contry
Table 27: Stock of foreign direct investment in Republic of Macedonia by activity
Table 28: International investment position of the Republic of Macedonia, as of the end of the period
Table 29: International investment position of the Republic of Macedonia, as of the end of the period
Table 30: Republic of Macedonia:gross external debt
Table 31: Republic of Macedonia:gross external claims
Table 32: Republic of Macedonia:net external debt position
Table 33: Reserve assets
Table 34: Exchange rates (average for the period)
Table 35: Mid exchange rates (end of period)
Table 36: Indices on effective exchange rate of the Denar
Methodological explanations

Table 1Gross Domestic Product (by production approach)In millions of denars (at constant prices - reference year 2005) and real annual growth rates (in %)
GD
P t
otal
%
Agric
ultu
re, h
untin
g,
fore
stry
and
fis
hing
%
Min
ing
and
quar
ryin
g,
man
ufac
turin
g an
d el
ectr
icity
, gas
and
w
ater
sup
ply
%
Cons
truc
tion
%
Who
lesa
les
and
reta
il sa
les
%
Hot
els
and
rest
aura
nts
%
Tran
spor
t, s
tora
ge a
nd
com
mun
icat
ions
%
Fina
ncia
l in
term
edia
tion,
rea
l es
tate
and
oth
er
busi
ness
and
ser
vice
ac
tiviti
es
%
Publ
ic a
dmin
istr
atio
n an
d de
fenc
e
%
A+B C+D+E F G H I J+K+L M+N+O+P1997/1 235750 1.4 30099 45646 12570 26280 2844 15378 38109 35331
1998 243765 3.4 31090 3.3 46303 1.4 13537 7.7 26379 0.4 3052 7.3 19453 26.5 38109 0.0 35759 1.21999 254247 4.3 31370 0.9 47089 1.7 14946 10.4 27179 3.0 3804 24.7 22792 17.2 38838 1.9 37226 4.12000 265688 4.5 31689 1.0 51493 9.4 15335 2.6 28005 3.0 3375 -11.3 24723 8.5 39887 2.7 37261 0.12001 253732 -4.5 28268 -10.8 49140 -4.6 13122 -14.4 27771 -0.8 3223 -4.5 22666 -8.3 40720 2.1 36387 -2.32002 256016 0.9 27693 -2.0 48741 -0.8 13203 0.6 29276 5.4 3759 16.6 22268 -1.8 39218 -3.7 37649 3.52003 270314 5.6 29030 4.8 51214 5.1 14957 13.3 29796 1.8 4121 9.6 22366 0.4 37794 -3.6 39501 4.92004 282748 4.6 30888 6.4 52648 2.8 15810 5.7 33282 11.7 4051 -1.7 21292 -4.8 43010 13.8 39264 -0.62005 295052 4.4 30991 0.3 55052 4.6 15761 -0.3 38649 16.1 4245 4.8 23459 10.2 42625 -0.9 40670 3.62006 309895 5.0 32465 4.8 56465 2.6 16513 4.8 40528 4.9 4309 1.5 25759 9.8 46139 8.2 41301 1.62007 328951 6.1 31508 -2.9 63607 12.6 17063 3.3 43186 6.6 4677 8.5 28460 10.5 48015 4.1 42274 2.42008 345239 5.0 33293 5.7 65133 2.4 16125 -5.5 46014 6.5 4954 5.9 31920 12.2 51177 6.6 44175 4.52009 342062 -0.9 34175 2.6 58159 -10.7 16835 4.4 48974 6.4 4528 -8.6 31563 -1.1 53556 4.6 45215 2.42010 351963 2.9 36348 6.4 60133 3.4 17244 2.4 49422 0.9 4406 -2.7 31680 0.4 55620 3.9 46986 3.9
2011/2 362908 3.1 36740 1.1 63943 6.3 19783 14.7 52580 6.4 4897 11.2 32048 1.2 54984 -1.1 48295 2.8
2005 Q1 63697 2.3 5291 -2.6 12563 9.1 2133 -21.7 7730 14.4 906 -0.8 5058 0.8 10662 -0.9 10157 3.8 Q2 74535 8.2 6871 0.3 14503 15.6 3956 -6.0 9899 25.7 1022 3.7 5883 10.7 10734 -0.6 10229 4.5 Q3 75061 4.4 7439 2.2 13793 0.1 4585 6.3 9672 14.2 1229 8.7 6386 17.9 10569 -1.8 10164 3.7 Q4 81760 2.6 11390 0.5 14194 -4.2 5086 11.5 11348 11.5 1088 6.6 6132 10.7 10660 -0.2 10121 2.3
2006 Q1 67610 6.1 5414 2.3 11822 -5.9 2777 30.2 9843 27.3 922 1.8 5966 18.0 11137 4.5 10321.0 1.6 Q2 77191 3.6 7455 8.5 14042 -3.2 4821 21.9 9709 -1.9 1047 2.4 6336 7.7 11676 8.8 10307.0 0.8 Q3 80100 6.7 7937 6.7 14883 7.9 4634 1.1 10312 6.6 1238 0.7 6732 5.4 11616 9.9 10308 1.4 Q4 84994 4.0 11659 2.4 15718 10.7 4281 -15.8 10664 -6.0 1102 1.3 6726 9.7 11710 9.8 10365 2.4
2007 Q1 72083 6.6 5803 7.2 14342 21.3 2606 -6.2 9362 -4.9 923 0.1 6325 6.0 11474 3.0 10465 1.4 Q2 81116 5.1 7533 1.0 15540 10.7 4763 -1.2 10570 8.9 1185 13.2 6846 8.0 11873 1.7 10553 2.4
Q3 84493 5.5 7535 -5.1 16417 10.3 4910 6.0 11136 8.0 1391 12.4 7317 8.7 12218 5.2 10577 2.6Q4 91259 7.4 10635 -8.8 17308 10.1 4785 11.8 12118 13.6 1178 6.9 7973 18.5 12450 6.3 10678 3.0
2008 Q1 76552 6.2 5885 1.4 15484 8.0 2443 -6.3 10290 9.9 1056 14.4 7223 14.2 12395 8.0 10908 4.2Q2 86448 6.6 8059 7.0 16443 5.8 4511 -5.3 11544 9.2 1225 3.4 8032 17.3 13050 9.9 11019 4.4Q3 89403 5.8 8514 13.0 17199 4.8 4360 -11.2 11744 5.5 1456 4.7 8231 12.5 12851 5.2 11094 4.9Q4 92836 1.7 10834 1.9 16007 -7.5 4812 0.6 12436 2.6 1218 3.4 8433 5.8 12881 3.5 11155 4.5
2009 Q1 75516 -1.4 6042 2.7 13398 -13.5 2551 4.4 10785 4.8 1002 -5.1 7243 0.3 13249 6.9 11135 2.1Q2 84368 -2.4 7873 -2.3 14443 -12.2 4897 8.6 11957 3.6 1135 -7.3 7847 -2.3 13404 2.7 11345 3.0Q3 87495 -2.1 8821 3.6 14659 -14.8 4446 2.0 12546 6.8 1346 -7.6 8253 0.3 13554 5.5 11328 2.1Q4 94683 2.0 11439 5.6 15658 -2.2 4942 2.7 13685 10.0 1045 -14.2 8220 -2.5 13348 3.6 11407 2.3
2010 Q1 75509 0.0 6173 2.2 13040 -2.7 2508 -1.7 10957 1.6 885 -11.7 7063 -2.5 13760 3.9 11696 5.0Q2 86506 2.5 8141 3.4 14929 3.4 4037 -17.6 12164 1.7 1127 -0.7 7956 1.4 13945 4.0 11662 2.8Q3 91449 4.5 10745 21.8 15621 6.6 4767 7.2 12762 1.7 1335 -0.8 7740 -6.2 14097 4.0 11732 3.6Q4 98499 4.0 11289 -1.3 16544 5.7 5932 20.0 13540 -1.1 1059 1.3 8920 8.5 13819 3.5 11896 4.3
2011/2 Q1 80274 6.3 6778 9.8 15237 16.8 3056 21.9 11377 3.8 936 5.7 7487 6.0 13494 -1.9 12044 3.0Q2 91322 5.6 8384 3.0 17201 15.2 4983 23.4 14069 15.7 1228 9.0 8056 1.2 13781 -1.2 12100 3.8Q3 92121 0.7 9541 -11.2 15648 0.2 5194 9.0 13085 2.5 1559 16.7 7934 2.5 13760 -2.4 12071 2.9Q4 99191 0.7 12036 6.6 15857 -4.1 6549 10.4 14049 3.8 1175 10.9 8571 -3.9 13948 0.9 12079 1.5
2012/2 Q1 79190 -1.4 6849 1.0 13774 -9.6 2755 -9.8 11414 0.3 990 5.8 7479 -0.1 13894 3.0 12324 2.3
/2 Estimated data./3 Preliminary data.Source: State Statistical Office and NBRM staff calculations.
/1 Real value of GDP and value added by sectors from 1997q1 to 2003q4 are NBRM staff calculations based on national accounts data from SSO.

Table 2PricesAnnual rates (%)
Tota
l
Flat
(re
nt,
wat
er,
serv
ices
)
Fuel
and
lig
htin
g
Hou
seho
ld
appl
ianc
es
1997 2.6 2.2 3.8 4.2 -3.9 -1.6 1.7 0.3 3.8 1.6 -0.5 -8.6 19.4 - - 4.21998 -0.1 0.0 -0.4 -0.2 3.6 2.4 0.4 0.0 0.4 2.0 0.1 -10.3 2.4 - - 4.01999 -0.7 -1.1 0.5 -1.6 0.2 1.2 0.3 0.1 1.1 -1.9 -1.4 -2.2 -0.8 - - -0.12000 5.8 5.2 8.9 -0.4 13.9 -2.3 19.3 8.8 27.4 1.7 -1.7 -1.6 22.4 - - 8.92001 5.5 4.5 10.9 6.9 2.3 1.3 5.5 11.3 3.9 0.1 -0.7 1.9 9.5 - - 2.02002 1.8 1.2 5.0 1.8 1.0 6.8 1.7 4.1 1.0 -0.6 -3.8 3.6 2.1 - - -0.92003 1.2 0.3 5.9 -1.4 3.4 2.2 3.9 3.9 4.4 1.1 3.9 2.2 4.2 - - -0.32004 -0.4 -1.1 3.3 -3.1 1.1 0.9 2.2 -0.3 3.0 4.2 0.4 1.3 4.0 - - 0.92005 0.5 0.3 1.3 -1.2 5.5 2.2 0.4 0.3 1.0 -1.2 -3.5 0.9 3.7 - - 3.22006 3.2 3.7 1.3 2.2 17.8 0.2 2.0 -0.7 3.7 -0.8 2.0 6.4 1.8 - - 6.92007 2.3 3.0 -0.3 3.9 1.8 1.8 4.7 6.3 5.8 -0.7 0.3 2.4 -3.1 4.7 8.6 2.52008 8.3 9.2 5.1 15.3 4.0 1.8 6.0 6.1 7.3 1.4 1.5 0.2 3.2 11.4 2.2 10.22009 -0.8 -0.8 -0.8 -1.6 4.0 0.0 4.5 2.0 6.3 1.7 2.1 -3.8 -7.9 2.2 -5.8 -7.02010 1.6 1.9 0.0 0.3 0.5 0.8 5.1 0.6 8.7 0.4 0.4 0.4 3.7 0.4 -5.6 8.72011 3.9 4.5 0.7 6.4 0.9 1.4 3.7 5.6 4.8 0.1 2.9 -0.8 3.1 1.6 -0.1 11.1
2006 Q1/2 2.7 3.2 0.9 1.6 17.7 -0.5 0.9 -0.2 1.6 -0.5 0.3 6.0 2.6 - - 7.2 Q2 3.4 3.8 2.0 2.3 17.5 0.3 1.1 0.2 1.9 -0.5 1.9 6.8 3.8 - - 9.0 Q3 3.6 4.0 1.9 2.9 17.9 0.5 1.7 -0.6 3.2 -0.9 2.7 6.9 2.3 - - 6.9 Q4 3.1 3.7 0.4 2.1 17.9 0.6 4.2 -2.2 7.9 -1.1 2.9 5.7 -1.5 - - 4.4
2007 Q1 0.7 1.3 -1.1 0.7 0.1 1.8 5.1 1.6 8.8 -1.8 0.0 3.5 -5.0 3.0 -2.8 1.3
Q2 1.1 1.6 -0.5 0.7 2.2 1.0 5.9 6.6 7.8 -0.9 0.5 3.1 -4.3 3.6 11.6 0.5Q3 2.4 3.0 0.2 3.8 2.3 1.1 5.2 7.5 6.0 -0.1 0.9 3.6 -3.1 3.9 12.5 1.3Q4 4.9 6.2 0.4 10.4 2.4 3.5 2.8 9.6 1.1 0.0 0.0 -0.5 -0.6 8.0 13.0 7.1
2008 Q1 9.5 11.0 3.9 19.0 4.2 1.6 3.6 8.5 2.7 0.4 1.5 -0.3 4.4 11.8 16.7 10.3
Q2 9.9 11.4 4.5 19.5 3.5 3.6 3.4 4.7 3.7 1.0 1.1 0.5 5.8 12.0 1.9 13.7Q3 8.4 9.0 6.1 14.7 4.1 1.9 6.3 5.7 7.9 1.6 1.2 -0.2 5.1 13.1 -1.1 15.3Q4 5.5 5.4 5.8 8.6 4.3 0.3 10.4 5.8 14.4 2.7 2.1 0.9 -2.4 8.9 -6.6 1.5
2009 Q1 0.9 0.8 1.2 0.9 4.5 1.6 7.4 3.8 9.9 3.8 2.1 -1.7 -9.1 5.1 -7.3 -6.6
Q2 -0.6 -0.7 0.0 -1.0 4.2 -0.9 6.7 2.4 9.7 2.4 2.7 -2.3 -10.9 3.1 -8.6 -10.0 Q3 -1.4 -1.3 -1.8 -2.2 3.8 0.2 4.1 1.3 6.2 1.0 2.3 -4.4 -9.1 1.0 -5.8 -11.0 Q4 -2.1 -2.0 -2.4 -4.2 3.3 -0.8 0.2 0.6 0.3 -0.3 1.4 -6.9 -2.1 -0.1 -0.9 -0.8
2010 Q1 0.5 0.6 -0.2 -2.4 1.2 -0.4 4.9 0.3 8.7 -0.2 1.2 -0.1 4.0 -0.4 -2.3 7.3
Q2 1.1 1.4 -0.2 -0.9 0.1 0.9 4.7 -0.2 8.3 0.2 -0.3 0.8 5.2 -0.1 -7.1 10.5 Q3 1.8 2.0 0.6 1.2 -0.2 1.1 5.2 0.0 8.9 0.7 0.0 1.6 2.6 0.5 -6.8 8.4 Q4 2.9 3.5 0.0 3.3 0.8 1.6 5.8 2.5 8.9 1.1 0.7 -0.8 3.1 1.6 -6.2 8.6
January 0.1 0.1 0.2 -3.5 2.4 -1.2 5.4 0.4 9.5 -0.2 1.2 -0.5 3.7 -0.4 -0.2 6.5
February 0.6 0.8 -0.3 -1.9 0.7 -0.3 4.8 0.3 8.6 -0.3 0.9 -0.3 4.0 -0.4 0.8 7.4March 0.7 0.9 -0.6 -1.9 0.5 0.4 4.5 0.3 7.9 -0.2 1.6 0.4 4.2 -0.5 -7.6 8.7
April 1.4 1.8 -0.5 -0.3 0.3 0.7 4.7 0.0 8.3 0.0 0.2 1.1 5.4 -0.5 -7.4 10.5May 0.2 0.3 -0.7 -3.4 0.0 1.1 4.7 -0.3 8.3 0.2 -0.4 0.0 5.7 -0.1 -6.9 10.9June 1.8 2.0 0.7 0.9 0.0 1.0 4.6 -0.4 8.2 0.4 -0.6 1.2 4.5 0.3 -6.9 7.6July 1.5 1.6 0.8 0.2 -0.2 1.0 4.7 -0.2 8.2 0.6 -0.1 2.1 3.6 0.6 -7.1 7.5
August 1.9 2.0 1.4 1.0 -0.3 1.2 5.5 -0.2 9.5 0.7 -0.1 3.0 2.8 0.7 -6.8 7.7September 2.0 2.5 -0.3 2.3 -0.2 1.2 5.4 0.4 9.1 0.7 0.1 -0.3 1.3 0.2 -6.4 7.8
October 2.7 3.5 -0.8 3.4 0.7 2.0 5.7 1.6 9.1 1.0 -0.1 -2.5 3.1 0.7 -6.5 8.7November 2.9 3.5 0.4 3.4 0.9 1.5 5.9 3.0 8.9 1.3 0.6 0.3 2.5 2.2 -6.1 7.1December 3.0 3.5 0.3 3.2 0.7 1.3 5.7 3.0 8.6 1.0 1.5 -0.3 3.6 1.9 -6.1 9.3
2011 Q1 4.1 4.5 1.0 7.1 1.0 1.0 3.0 6.0 3.3 0.4 1.4 -0.8 4.8 1.5 -5.5 13.6Q2 4.7 5.4 1.1 8.4 1.0 1.4 4.3 6.9 5.5 -0.1 3.5 -2.6 2.8 1.6 2.4 11.7Q3 3.6 4.4 0.2 5.4 1.2 1.5 3.9 6.3 5.0 0.0 3.8 -0.7 2.6 1.6 2.0 10.2Q4 3.2 3.8 0.6 4.7 0.2 1.6 3.5 3.1 5.2 0.0 2.8 0.8 2.4 1.8 1.1 9.1
January 3.2 3.6 0.7 5.3 0.8 0.9 2.3 4.8 2.3 0.7 1.2 -0.9 5.0 1.0 -8.3 12.7February 3.9 4.2 0.9 6.8 1.1 1.0 2.3 6.5 2.0 0.4 1.4 -0.5 4.6 1.1 -8.3 12.8
March 5.2 5.7 1.5 9.1 1.2 1.2 4.3 6.7 5.6 0.1 1.6 -1.0 4.9 2.3 0.1 15.3April 4.8 5.3 1.6 8.3 0.9 1.5 4.2 6.9 5.4 -0.1 3.3 -2.2 3.7 2.0 2.3 13.3May 5.2 5.9 1.5 9.6 1.1 1.6 4.3 6.8 5.5 -0.1 3.4 -2.8 2.9 1.6 2.3 10.8June 4.1 5.1 0.2 7.2 1.1 1.2 4.3 7.0 5.5 -0.1 3.9 -2.8 1.7 1.2 2.5 10.9July 3.8 4.5 0.9 6.2 1.1 1.8 4.2 6.7 5.5 -0.2 3.3 -2.2 2.0 1.7 2.4 9.5
August 3.6 4.6 -0.6 5.6 1.2 1.4 3.9 6.5 4.8 0.2 4.2 -1.7 2.4 1.6 2.1 11.1September 3.4 4.1 0.3 4.3 1.2 1.2 3.7 5.8 4.7 0.0 4.0 1.7 3.5 1.6 1.6 10.0
October 3.3 4.0 0.9 4.3 0.3 0.9 3.4 4.8 4.6 -0.1 3.9 2.2 3.6 1.5 1.1 8.6November 3.5 4.3 0.5 5.3 0.2 1.9 3.5 2.3 5.5 -0.1 3.1 0.4 2.5 1.8 1.1 10.4December 2.8 3.2 0.5 4.4 0.2 1.9 3.7 2.3 5.6 0.1 1.4 -0.1 1.1 2.1 1.1 8.3
2012 Q1 2.6 2.6 1.6 1.4 0.0 1.6 6.8 1.9 10.3 -0.2 1.8 0.7 3.6 3.0 1.0 5.0Q2 2.1 2.4 1.5 0.2 0.2 4.2 5.4 2.4 7.7 0.0 2.5 1.3 3.7 2.8 -0.7
2012 January 3.4 3.6 1.1 3.5 0.1 1.3 7.7 3.0 11.5 -0.6 1.6 0.7 2.8 2.5 1.1 5.1February 2.9 2.9 1.8 1.8 0.0 1.9 7.6 1.4 11.5 -0.1 1.8 0.4 3.7 3.7 1.1 5.8
March 1.4 1.4 1.8 -1.0 -0.2 1.6 5.3 1.3 7.8 0.0 1.8 0.8 4.2 2.7 0.9 4.3April 2.2 2.3 1.8 0.0 0.2 3.9 5.5 2.5 7.8 0.0 2.5 1.1 4.8 2.8 -0.5 3.0May 2.0 2.3 1.6 -0.2 0.2 4.0 5.4 2.5 7.7 0.1 2.7 1.4 3.8 3.3 -0.7 3.2June 2.1 2.6 1.1 0.6 0.3 4.8 5.3 2.3 7.7 0.0 2.2 1.5 2.5 2.3 -1.0
1/ Since 2007, the structure of the consumer price index (CPI) includes also the following categories: restaurants and hotels and the category of other services which are n.e.s.2/ Quarterly calculations are made in the Research Department in NBRM.Source: State Statistical Office.
Housing
Hyg
iene
and
he
alth
Cultu
re a
nd
ente
rtai
nmen
t
Tran
spor
t m
eans
and
se
rvic
es
Res
taur
ants
an
d ho
tels
/1
Oth
er s
ervi
ces
/1
Consumer price index (growth rates)
Prod
ucer
pric
e in
dex
(gro
wth
rat
es)
Tota
l
Goo
ds
Serv
ices
By categories
Food
Toba
cco
and
beve
rage
s
Clot
hing
and
fo
otw
ear

Table 3
Industrial productionAnnual growth rates (%)
Tota
l
Min
ing
and
Qua
rryi
ng
Man
ufac
turin
g
Elec
tric
ity, G
as,
Stea
m a
nd A
ir co
nditi
onin
g su
pply
Ener
gy
Inte
rmed
iary
go
ods,
exc
ept
ener
gy
Capi
tal g
oods
Dur
able
con
sum
er
good
s
Non
-dur
able
co
nsum
er g
oods
2002 -5.3 -24.5 -4.7 -3.8 -16.8 -8.0 53.3 -22.6 -2.42003 4.7 -39.1 5.9 9.8 28.7 -12.1 -9.0 36.9 19.02004 -2.2 -5.0 -2.1 -2.6 -1.8 0.9 -20.1 9.1 -3.42005 7.0 40.4 7.3 2.5 4.6 14.2 -3.2 -14.9 3.82006 5.9 11.1 6.4 0.8 3.2 10.1 6.1 -17.1 4.72007 3.9 10.0 5.5 -9.5 -6.9 11.8 25.0 9.3 -1.32008 5.1 9.4 5.9 -3.1 -0.1 7.5 -1.0 64.6 2.82009 -8.7 -12.4 -10.4 8.7 2.5 -14.9 -23.1 -21.6 -3.32010 -4.8 -3.8 -7.5 14.4 6.8 -12.8 -10.8 -1.0 -1.82011 3.3 7.4 5.5 -11.1 -10.6 2.1 41.1 57.2 3.5
2005 Q1/1 4.8 -19.7 5.8 3.7 2.0 14.0 -1.7 -19.3 0.7Q2 13.5 14.0 16.3 -0.3 5.8 24.6 -2.2 10.0 8.8Q3 6.0 62.4 5.5 2.0 3.8 9.8 -5.4 -10.7 5.1Q4 4.1 95.1 2.5 3.7 6.9 9.5 -7.1 -26.3 0.1
2006 Q1 3.0 37.9 2.4 -0.7 4.7 5.8 -18.0 2.1 2.2Q2 4.2 23.6 3.9 1.0 -2.9 4.1 27.3 -37.9 7.4Q3 10.5 2.8 11.5 4.6 5.2 18.6 11.6 -5.4 6.2Q4 5.4 -4.8 6.9 -0.4 5.3 11.3 1.0 -16.7 2.4
2007 Q1 11.0 14.3 15.2 -9.0 -2.1 20.9 60.3 10.3 6.0Q2 -2.6 16.6 -1.2 -20.7 -16.7 6.9 -1.2 25.3 -7.3Q3 1.5 16.0 1.9 -8.6 -4.5 7.0 30.2 -2.3 -4.9Q4 6.9 -3.7 8.6 -1.1 -6.3 15.3 27.0 7.7 2.9
2008 Q1 6.0 10.5 6.9 -0.8 1.7 9.2 28.5 74.6 -1.3Q2 11.4 13.1 12.3 1.8 15.9 13.0 29.9 73.7 2.4Q3 12.4 2.5 13.8 1.9 3.4 26.8 -16.7 52.1 2.9Q4 -8.2 11.9 -8.6 -12.1 -15.3 -18.3 -31.5 60.3 6.1
2009 Q1 -12.3 -12.2 -14.0 -1.6 -0.1 -27.2 -22.7 -16.1 -0.6Q2 -14.5 -18.8 -16.9 15.5 -0.9 -25.1 -39.7 -31.7 -1.0Q3 -13.4 -11.4 -15.4 10.3 -5.2 -22.1 -17.7 -14.2 -4.1Q4 6.4 -7.4 6.3 14.2 16.1 22.2 -5.1 -22.4 -6.5
2010 Q1 -9.3 -6.4 -14.6 19.1 -2.5 -15.5 -27.7 -1.3 -6.2Q2 -0.9 -0.4 -5.8 38.5 28.6 -5.1 -5.9 1.9 -8.1Q3 -3.6 5.1 -5.1 6.9 8.5 -12.6 -12.7 -5.8 3.0Q4 -6.0 -12.5 -5.9 -3.8 -1.7 -17.6 5.1 1.1 2.9
January -2.8 8.8 -8.0 16.8 6.6 -10.1 -36.7 5.9 0.0February -10.6 1.0 -17.9 31.3 7.2 -21.4 -26.5 0.0 -10.2
March -13.3 -22.9 -16.6 10.6 -20.9 -13.8 -22.3 -8.5 -7.4April -7.2 -14.2 -11.4 29.6 2.5 -4.8 -24.3 10.3 -12.4May -1.1 -3.2 -6.1 37.6 55.1 -12.0 -21.4 -17.3 -6.9June 5.5 20.6 0.1 49.7 33.3 2.1 31.3 14.1 -5.2July 8.0 10.7 5.0 35.1 24.3 17.8 4.2 1.5 -4.0
August -2.5 6.1 -3.2 -0.1 9.7 -13.2 -13.9 -3.3 6.2September -14.0 -0.5 -14.9 -10.8 -12.4 -29.0 -22.4 -13.2 7.9
October -4.7 -7.5 -4.1 -8.2 -10.1 -9.3 2.9 -1.0 2.3November -2.9 -11.4 -1.0 -14.3 -4.3 -11.2 -16.7 -0.8 6.7December -10.0 -18.8 -12.2 10.0 8.7 -30.7 28.1 5.5 -0.6
2011 Q1 13.8 7.9 18.4 -3.1 6.8 19.9 64.5 65.2 3.8Q2 5.3 14.6 9.7 -21.6 -23.3 4.2 44.7 117.5 9.7Q3 1.4 -5.2 4.0 -16.7 -18.2 2.3 43.0 59.8 0.6Q4 -4.7 13.4 -5.6 -4.1 -9.9 -11.3 18.6 -1.5 0.6
January 4.9 2.4 8.0 -4.8 -6.1 16.8 72.6 19.5 -1.8February 10.9 -2.7 16.6 -7.9 1.2 18.2 81.9 22.4 3.2
March 24.5 24.4 28.9 4.1 31.8 23.6 47.4 150.2 9.3April 11.8 20.8 14.7 -6.3 12.9 4.7 44.8 107.0 7.3May 6.9 27.3 11.9 -24.4 -30.1 12.2 87.0 103.9 10.2June -1.8 -2.8 3.4 -33.5 -45.7 -3.6 17.6 139.8 11.4July 5.5 2.2 9.0 -18.7 -15.5 2.6 26.1 181.1 6.3
August 0.9 -8.9 3.1 -12.9 -21.1 9.9 55.0 3.8 -3.1September -2.3 -8.6 -0.3 -18.8 -17.9 -5.3 48.1 8.7 -1.8
October -3.8 11.7 -5.3 1.2 -11.3 -10.6 17.3 -1.7 4.0November -5.3 15.5 -7.6 5.7 -4.2 -12.6 70.3 -0.7 -6.6December -4.8 13.2 -3.8 -15.3 -13.6 -10.8 -12.7 -2.0 5.4
2012 Q1 -8.4 -10.4 -6.4 -17.6 -24.2 2.0 -13.9 -42.8 -1.5
2012 January -8.0 -12.1 -4.6 -20.4 -22.6 5.6 -9.1 -34.4 -4.8February -8.8 -15.7 -8.5 -7.9 -14.6 -9.3 -18.2 -19.8 -1.5
March -8.5 -4.7 -6.0 -23.8 -35.0 8.4 -13.6 -57.2 0.9April -7.2 -3.2 -7.0 -10.3 -27.4 -2.3 1.2 -57.7 5.1May -5.4 -22.8 -3.2 -14.1 -22.9 1.0 -19.8 -43.2 1.6
1/ Quartile calculations are made in the Research Department in NBRM.
By sectors By group of products
Source: State Statistical Office.

Table 4Employment and productivity of the economy
Total Employees Unemployed Agriculture Industry Services
1996 1,436,602 789,081 537,591 251,489 100,067 193,975 243,548 -1997 1,489,625 800,513 512,301 288,213 84,256 163,988 264,056 -1998 1,503,365 823,826 539,762 284,064 107,249 190,674 241,839 -1999 1,518,250 806,674 545,222 261,452 115,361 185,283 244,580 -2000 1,534,256 811,557 549,846 261,711 119,971 187,066 242,809 -2001 1,554,420 862,504 599,308 263,196 131,094 190,458 277,755 -2002 1,566,953 824,824 561,341 263,483 134,293 186,917 238,868 -2003 1,579,450 860,976 545,108 315,868 120,132 184,855 238,583 -2004 1,594,557 832,281 522,995 309,286 88,050 171,390 261,810 -2005 1,607,997 869,187 545,253 323,934 106,533 175,868 261,523 0.12006 1,618,482 891,679 570,404 321,274 114,777 186,085 268,117 0.52007 1,628,635 907,138 590,234 316,905 107,717 184,928 294,305 2.42008 1,633,341 919,424 609,015 310,409 119,749 190,530 297,189 1.92009 1,638,869 928,775 629,901 298,873 116,668 187,077 324,410 -4.22010 1,648,522 938,294 637,855 300,439 121,771 185,243 328,778 1.52011 1,656,215 940,048 645,085 294,963 120,893 193,554 328,206 2.2
2005 Q1 1,603,675 827,428 507,397 320,030 76,546 181,450 251,307 5.3Q2 1,606,833 883,522 552,797 330,724 126,194 174,588 251,112 6.0Q3 1,609,071 889,725 564,880 324,845 135,712 170,157 257,804 -1.7Q4 1,612,410 876,074 555,938 320,136 87,921 180,089 286,837 -7.8
2006 Q1 1,615,584 877,798 559,702 318,096 103,319 190,355 264,550 -2.5Q2 1,617,423 885,609 566,293 319,316 128,519 189,630 246,842 0.7Q3 1,619,447 899,732 576,813 322,919 125,322 187,760 262,480 3.6Q4 1,621,475 903,576 578,810 324,766 101,948 176,592 298,599 0.3
2007 Q1 1,624,611 902,588 579,301 323,287 95,384 186,975 293,629 4.0Q2 1,627,216 906,199 589,254 316,944 112,982 184,622 288,104 -0.3Q3 1,630,010 909,466 598,327 311,139 117,531 181,993 294,863 0.9Q4 1,632,702 910,301 594,054 316,247 104,975 186,122 300,622 4.9
2008 Q1 1,635,058 920,512 600,593 319,919 121,238 178,848 298,110 3.0Q2 1,633,339 917,566 607,125 310,441 129,711 186,184 289,783 3.3Q3 1,631,646 925,073 619,802 305,271 119,149 198,499 301,415 2.3Q4 1,633,321 914,547 608,541 306,006 108,896 198,590 299,451 -1.0
2009 Q1 1,634,986 919,026 618,189 300,837 120,186 181,567 314,199 -3.7Q2 1,637,828 933,878 636,156 297,722 122,958 188,433 322,983 -7.2Q3 1,640,302 940,661 642,541 298,120 119,474 189,239 333,028 -5.3Q4 1,642,360 921,534 622,720 298,814 104,055 189,069 327,428 -0.6
2010 Q1 1,644,423 925,613 615,962 309,651 109,821 182,562 321,505 0.2Q2 1,648,132 923,323 627,129 296,194 121,442 183,307 320,243 2.9Q3 1,649,507 949,313 648,773 300,540 128,825 186,077 332,186 1.2Q4 1,652,026 954,928 659,557 295,371 126,995 189,024 341,179 -2.6
2011 Q1 1,653,275 944,216 649,575 294,641 118,837 192,349 335,187 1.1Q2 1,655,188 936,256 642,809 293,448 122,698 194,047 323,785 2.9Q3 1,657,216 942,395 648,617 293,778 123,973 197,175 325,504 0.7Q4 1,659,180 937,326 639,340 297,986 118,065 190,645 328,349 3.9
2012 Q1 1,667,862 941,019 643,668 297,351 109,222 190,928 341,116 -0.3/1 Annual growth rates (%). NBRM staff calculations.
Source: State Statistical Office - Labour Force Survey and NBRM staff calculations.
* Starting from January 2011 the State Statistical Office applied the new National Classification of Activities(NACE Rev.2) when compiling the data on number of employees. Note: due to the methodological changes,the data on employees by economic activities for 2011 is not fully comparable with the data for the previousperiod.
Total population fit
for work
Active population Number of employees by economic activities*:
Prod
uctiv
ity
/1

Table 5SalariesAmount in denars, change in (%)
Agric
ultu
re
Indu
stry
Serv
ices
Agric
ultu
re
Indu
stry
Serv
ices
1999 16,941 3.6 - 12,944 16,306 19,684 10,029 2.9 3.6 8,667 8,380 10,7202000 17,958 6.0 - 15,733 17,785 20,968 10,526 5.5 -0.3 9,294 8,883 11,3542001 17,893 -0.4 -5.6 14,739 18,304 20,467 10,592 3.5 -1.9 8,754 10,348 11,8522002 19,030 6.4 4.5 14,437 19,243 21,648 11,550 6.9 5.0 8,833 11,415 12,7912003 19,957 4.9 3.7 14,100 19,854 22,955 11,955 4.8 3.6 8,522 11,782 13,5492004 20,779 4.1 4.5 17,287 20,692 23,748 12,534 4.0 4.4 10,337 12,290 13,9992005 21,335 2.7 2.2 19,128 21,450 24,737 13,125 2.5 2.0 11,419 12,738 14,5482006 23,037 8.0 4.6 19,485 23,570 25,624 13,854 7.3 4.0 11,660 13,983 15,0362007 24,139 4.8 2.4 17,755 23,965 26,520 14,586 7.9 5.5 10,766 14,585 16,0802008 25,349 8.7 0.3 17,342 25,478 28,492 16,095 10.3 1.9 10,693 15,780 17,5812009 29,923 9.4 10.3 19,331 29,068 33,056 19,958 9.9 10.8 13,096 19,316 22,1362010 30,226 1.0 -0.6 19,597 29,762 32,659 20,554 3.0 1.4 13,388 20,090 22,2892011 30,603 1.3 -2.5 21,423 31,885 34,147 20,848 1.4 -2.4 14,785 21,544 23,351
2006 Q1 22,559 7.6 4.9 19,179 22,969 25,184 13,207 6.9 3.7 11,466 13,606 14,757Q2 22,923 8.5 5.1 19,600 23,340 25,444 13,428 7.7 4.2 11,681 13,820 14,910Q3 23,214 8.7 5.1 19,719 23,967 25,835 13,584 7.7 3.9 11,779 14,184 15,125Q4 23,451 7.1 4.0 19,440 24,003 26,035 13,854 7.2 4.0 11,712 14,321 15,351
2007 Q1 23,139 2.6 1.9 17,809 23,414 25,635 13,962 5.7 5.0 10,802 14,230 15,516Q2 23,651 3.2 2.1 18,396 23,569 26,020 14,287 6.4 5.3 11,161 14,335 15,746Q3 24,193 4.2 1.8 17,524 24,043 26,510 14,604 7.5 5.1 10,652 14,608 16,086Q4 25,574 9.1 4.2 17,291 24,836 27,917 15,490 11.8 6.9 10,451 15,167 16,971
2008 Q1 25,146 8.7 -0.8 16,983 24,571 27,429 15,430 10.5 0.9 10,315 15,220 16,934Q2 25,566 8.1 -1.6 16,679 25,126 27,899 15,697 9.9 0.0 10,295 15,559 17,228Q3 26,337 8.9 0.4 16,779 25,610 28,561 16,171 10.7 2.1 10,479 15,860 17,628Q4 27,863 9.0 3.3 18,928 26,604 30,080 17,081 10.3 4.5 11,684 16,480 18,534
2009 Q1* 29,540 12.5 11.5 19,127 28,496 32,764 19,653 12.7 11.8 12,973 18,774 21,885Q2* 30,137 12.8 13.5 19,489 29,156 33,394 20,116 13.4 14.1 13,191 19,414 22,423Q3* 29,833 8.4 9.9 19,453 29,248 32,861 19,891 8.9 10.4 13,171 19,496 21,973Q4* 30,183 3.7 5.9 19,254 29,372 33,207 20,172 4.5 6.8 13,051 19,579 22,261
2010 Q1 29,879 1.1 0.6 19,358 29,223 32,467 20,303 3.3 2.8 13,234 19,774 22,136Q2 30,238 0.3 -0.8 19,678 29,636 32,650 20,557 2.2 1.1 13,491 19,982 22,283Q3 30,099 0.9 -0.9 20,072 29,724 32,325 20,465 2.9 1.1 13,668 20,056 22,049Q4 30,688 1.7 -1.2 19,280 30,465 33,194 20,890 3.6 0.7 13,161 20,548 22,690
January '10 29,947 1.2 1.1 19,844 29,370 32,586 20,330 3.6 3.5 13,651 19,850 22,196February 29,751 1.1 0.5 19,205 28,801 32,659 20,240 3.3 2.7 13,155 19,565 22,324
March 29,938 1.1 0.4 19,026 29,500 32,157 20,338 3.0 2.3 12,897 19,907 21,889April 30,081 -0.2 -1.6 19,723 29,249 32,481 20,449 1.4 0.0 13,551 19,760 22,155May 30,598 1.7 1.5 19,684 29,925 32,971 20,798 3.4 3.2 13,573 20,154 22,501June 30,035 -0.5 -2.2 19,626 29,734 32,500 20,424 1.8 0.0 13,348 20,033 22,193July 29,827 0.3 -1.2 20,661 29,164 31,921 20,299 2.7 1.2 14,125 19,728 21,792
August 30,207 1.5 -0.4 19,839 29,976 32,421 20,541 3.4 1.5 13,499 20,215 22,118September 30,263 0.9 -1.1 19,716 30,031 32,634 20,554 2.5 0.5 13,379 20,226 22,236
October 30,279 0.6 -2.1 18,716 30,034 32,582 20,584 2.3 -0.4 12,630 20,245 22,232November 30,349 1.7 -1.1 19,488 29,734 32,786 20,633 3.6 0.7 13,363 20,071 22,382December 31,435 2.7 -0.3 19,636 31,629 34,213 21,454 4.7 1.7 13,491 21,329 23,456
2011 Q1 30,383 1.7 -2.3 20,478 31,582 33,718 20,682 1.9 -2.1 14,093 21,319 23,030Q2 30,633 1.3 -3.2 21,613 32,000 34,397 20,864 1.5 -3.1 14,871 21,597 23,515Q3 30,528 1.5 -2.1 21,581 31,974 33,808 20,795 1.6 -1.9 14,937 21,636 23,102Q4 30,870 0.6 -2.5 22,020 31,984 34,664 21,050 0.8 -2.4 15,240 21,627 23,756
January '11** 30,902 3.2 0.0 20,689 31,900 34,252 21,029 3.4 0.2 14,247 21,369 23,431February 30,032 0.9 -2.8 19,938 31,550 33,346 20,433 1.0 -2.8 13,731 21,394 22,748
March 30,216 0.9 -4.1 20,806 31,297 33,557 20,585 1.2 -3.8 14,301 21,193 22,910April 30,172 0.3 -4.3 21,195 31,705 33,735 20,519 0.3 -4.3 14,542 21,276 23,027May 30,736 0.5 -4.5 21,765 32,342 34,274 20,954 0.7 -4.3 14,966 21,850 23,441June 30,990 3.2 -0.9 21,880 31,954 35,181 21,119 3.4 -0.7 15,104 21,664 24,078July 30,528 2.4 -1.3 21,314 31,453 34,030 20,813 2.5 -1.3 14,741 21,343 23,281
August 30,715 1.7 -1.8 21,814 32,587 33,834 20,912 1.8 -1.7 15,109 22,027 23,086September 30,340 0.3 -3.0 21,616 31,881 33,560 20,659 0.5 -2.8 14,961 21,537 22,938
October 30,680 1.3 -1.9 22,367 32,336 33,819 20,902 1.5 -1.7 15,561 21,867 23,098November 30,591 0.8 -2.6 21,622 31,828 33,952 20,834 1.0 -2.4 14,920 21,484 23,190December 31,338 -0.3 -3.0 22,071 31,788 36,220 21,415 -0.2 -2.9 15,237 21,530 24,981
2012 Q1 30,634 0.8 -1.7 21,902 31,757 34,690 20,896 1.0 -1.5 15,108 21,469 23,783
January '12 30,768 -0.4 -3.7 22,197 32,492 34,100 20,982 -0.2 -3.5 15,341 21,953 23,379February 30,257 0.7 -2.1 21,302 30,940 34,165 20,625 0.9 -1.9 14,706 20,931 23,366
March 30,876 2.2 0.8 22,207 31,840 35,804 21,081 2.4 1.0 15,277 21,522 24,603April 30,444 0.9 -1.2 22,322 32,094 33,993 20,743 1.1 -1.1 15,444 21,684 23,211
Source: State Statistical Office and NBRM staff calculations.
By economic activities:
*From January 2009 there is structural break in the wage data, due to the "gross wage" reform. Consequently,values for net and gross wages from January 2009 are significantly higher than in the previous period. On the other g y pp (Rev.2) for collecting and processing data on the average monthly net and gross wages. Note: due to the
Gross salaries: Net salaries:
Aver
age,
tot
al
Nom
inal
ch
ange
Rea
l cha
nge By economic activities:
Aver
age,
tot
al
Nom
inal
ch
ange
Rea
l cha
nge
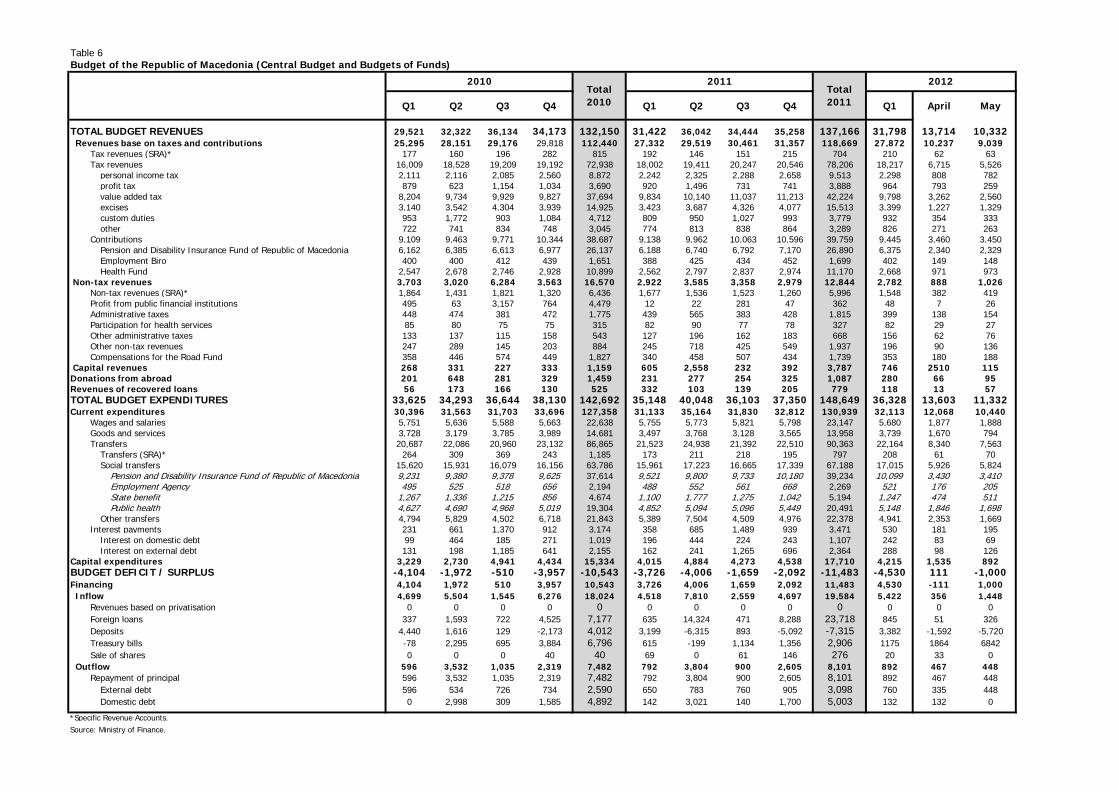
Table 6Budget of the Republic of Macedonia (Central Budget and Budgets of Funds)
Q1 Q2 Q3 Q4 Q1 Q2 Q3 Q4 Q1 April May
TOTAL BUDGET REVENUES 29,521 32,322 36,134 34,173 132,150 31,422 36,042 34,444 35,258 137,166 31,798 13,714 10,332 Revenues base on taxes and contributions 25,295 28,151 29,176 29,818 112,440 27,332 29,519 30,461 31,357 118,669 27,872 10,237 9,039
Tax revenues (SRA)* 177 160 196 282 815 192 146 151 215 704 210 62 63Tax revenues 16,009 18,528 19,209 19,192 72,938 18,002 19,411 20,247 20,546 78,206 18,217 6,715 5,526
personal income tax 2,111 2,116 2,085 2,560 8,872 2,242 2,325 2,288 2,658 9,513 2,298 808 782profit tax 879 623 1,154 1,034 3,690 920 1,496 731 741 3,888 964 793 259value added tax 8,204 9,734 9,929 9,827 37,694 9,834 10,140 11,037 11,213 42,224 9,798 3,262 2,560excises 3,140 3,542 4,304 3,939 14,925 3,423 3,687 4,326 4,077 15,513 3,399 1,227 1,329custom duties 953 1,772 903 1,084 4,712 809 950 1,027 993 3,779 932 354 333other 722 741 834 748 3,045 774 813 838 864 3,289 826 271 263
Contributions 9,109 9,463 9,771 10,344 38,687 9,138 9,962 10,063 10,596 39,759 9,445 3,460 3,450Pension and Disability Insurance Fund of Republic of Macedonia 6,162 6,385 6,613 6,977 26,137 6,188 6,740 6,792 7,170 26,890 6,375 2,340 2,329Employment Biro 400 400 412 439 1,651 388 425 434 452 1,699 402 149 148Health Fund 2,547 2,678 2,746 2,928 10,899 2,562 2,797 2,837 2,974 11,170 2,668 971 973
Non-tax revenues 3,703 3,020 6,284 3,563 16,570 2,922 3,585 3,358 2,979 12,844 2,782 888 1,026Non-tax revenues (SRA)* 1,864 1,431 1,821 1,320 6,436 1,677 1,536 1,523 1,260 5,996 1,548 382 419Profit from public financial institutions 495 63 3,157 764 4,479 12 22 281 47 362 48 7 26Administrative taxes 448 474 381 472 1,775 439 565 383 428 1,815 399 138 154Participation for health services 85 80 75 75 315 82 90 77 78 327 82 29 27Other administrative taxes 133 137 115 158 543 127 196 162 183 668 156 62 76Other non-tax revenues 247 289 145 203 884 245 718 425 549 1,937 196 90 136Compensations for the Road Fund 358 446 574 449 1,827 340 458 507 434 1,739 353 180 188
Capital revenues 268 331 227 333 1,159 605 2,558 232 392 3,787 746 2510 115Donations from abroad 201 648 281 329 1,459 231 277 254 325 1,087 280 66 95Revenues of recovered loans 56 173 166 130 525 332 103 139 205 779 118 13 57TOTAL BUDGET EXPENDITURES 33,625 34,293 36,644 38,130 142,692 35,148 40,048 36,103 37,350 148,649 36,328 13,603 11,332Current expenditures 30,396 31,563 31,703 33,696 127,358 31,133 35,164 31,830 32,812 130,939 32,113 12,068 10,440
Wages and salaries 5,751 5,636 5,588 5,663 22,638 5,755 5,773 5,821 5,798 23,147 5,680 1,877 1,888Goods and services 3,728 3,179 3,785 3,989 14,681 3,497 3,768 3,128 3,565 13,958 3,739 1,670 794Transfers 20,687 22,086 20,960 23,132 86,865 21,523 24,938 21,392 22,510 90,363 22,164 8,340 7,563
Transfers (SRA)* 264 309 369 243 1,185 173 211 218 195 797 208 61 70Social transfers 15,620 15,931 16,079 16,156 63,786 15,961 17,223 16,665 17,339 67,188 17,015 5,926 5,824
Pension and Disability Insurance Fund of Republic of Macedonia 9,231 9,380 9,378 9,625 37,614 9,521 9,800 9,733 10,180 39,234 10,099 3,430 3,410Employment Agency 495 525 518 656 2,194 488 552 561 668 2,269 521 176 205State benefit 1,267 1,336 1,215 856 4,674 1,100 1,777 1,275 1,042 5,194 1,247 474 511Public health 4,627 4,690 4,968 5,019 19,304 4,852 5,094 5,096 5,449 20,491 5,148 1,846 1,698
Other transfers 4,794 5,829 4,502 6,718 21,843 5,389 7,504 4,509 4,976 22,378 4,941 2,353 1,669Interest payments 231 661 1,370 912 3,174 358 685 1,489 939 3,471 530 181 195
Interest on domestic debt 99 464 185 271 1,019 196 444 224 243 1,107 242 83 69Interest on external debt 131 198 1,185 641 2,155 162 241 1,265 696 2,364 288 98 126
Capital expenditures 3,229 2,730 4,941 4,434 15,334 4,015 4,884 4,273 4,538 17,710 4,215 1,535 892BUDGET DEFICIT / SURPLUS -4,104 -1,972 -510 -3,957 -10,543 -3,726 -4,006 -1,659 -2,092 -11,483 -4,530 111 -1,000Financing 4,104 1,972 510 3,957 10,543 3,726 4,006 1,659 2,092 11,483 4,530 -111 1,000 Inflow 4,699 5,504 1,545 6,276 18,024 4,518 7,810 2,559 4,697 19,584 5,422 356 1,448
Revenues based on privatisation 0 0 0 0 0 0 0 0 0 0 0 0 0Foreign loans 337 1,593 722 4,525 7,177 635 14,324 471 8,288 23,718 845 51 326Deposits 4,440 1,616 129 -2,173 4,012 3,199 -6,315 893 -5,092 -7,315 3,382 -1,592 -5,720Treasury bills -78 2,295 695 3,884 6,796 615 -199 1,134 1,356 2,906 1175 1864 6842Sale of shares 0 0 0 40 40 69 0 61 146 276 20 33 0
Outflow 596 3,532 1,035 2,319 7,482 792 3,804 900 2,605 8,101 892 467 448Repayment of principal 596 3,532 1,035 2,319 7,482 792 3,804 900 2,605 8,101 892 467 448
External debt 596 534 726 734 2,590 650 783 760 905 3,098 760 335 448Domestic debt 0 2,998 309 1,585 4,892 142 3,021 140 1,700 5,003 132 132 0
*Specific Revenue Accounts.Source: Ministry of Finance.
2010Total 2010
2011Total 2011
2012

Table 7
Report form for the Central bank1,2,3,4
in milions of denars
2003 2004 2007 2006 2007
XII XII XII XII XII I XII I XII I II III IV V VI VII VIII IX X XI XII
A. ASSETS 52223 51352 75272 95647 99990 100006 96111 93073 102010 103709 103882 103114 105478 107774 109433 105350 110091 112350 110622 111982 114473
1. Foreign Assets 46078 44831 69588 88102 94979 94978 91908 88888 97807 99515 99697 98935 101310 103590 105246 101212 105896 104160 102450 103745 105495
1.1. Official Reserves Assets 44178 44423 68698 86664 93291 94332 91808 88543 97725 99435 99595 98837 101209 103485 105138 101126 105844 104119 102408 103707 105451
1.2 Other Foreign Assets 1900 408 890 1438 1688 646 100 345 83 80 102 99 102 105 108 86 53 41 42 38 45
2. Claims on Central Government 3890 3495 3549 2519 1271 1272 1304 1309 1327 1337 1347 1347 1355 1380 1394 1370 1381 5405 5402 5477 5493
2.1. In national currency 3815 3495 3549 2505 1264 1264 1296 1297 1318 1328 1338 1338 1346 1371 1383 1360 1371 5395 5392 5465 5479
2.2. In foreign currency 75 0 0 14 7 8 8 12 9 9 9 9 9 9 11 10 11 11 10 12 13
3. Other Assets 2254 3025 2135 5025 3740 3756 2898 2876 2876 2857 2838 2832 2813 2804 2793 2768 2813 2784 2770 2760 3485
B. TOTAL LIABILITIES 52223 51352 75272 95647 99990 100006 96111 93073 102010 103709 103882 103114 105478 107774 109433 105350 110091 112350 110622 111982 114473
1. Reserve money 22345 22683 28374 34018 41468 39386 48035 45654 51892 52672 51077 50046 51684 52365 54127 52346 52903 51432 54313 53027 53917
1.1. Currency in circulation 15010 15071 15813 17732 19894 18333 20799 18484 19482 18431 17949 17995 17925 18576 18463 19752 19338 18879 19007 18507 20173
1.2. Other Depository Corporations 6018 6043 10307 13769 17966 16939 21619 21246 26639 28044 27090 26001 27345 27166 29001 27167 28000 26845 29445 28770 28830
1.2.1. Transferable Deposits Excluded, NC 3248 2677 4984 7396 10689 9518 10288 10550 14245 15704 14919 13761 14877 14760 16299 14479 15109 13804 16514 15849 15659
1.2.2. Other Deposits Excluded from Broad money, NC 0 1528 895 169 150 0 0 0 0 0 0 0 0 0 0 0
1.2.3. Other Deposits Excluded from Broad money, FC 2770 3366 5323 6373 7277 7421 9803 9801 12225 12189 12171 12240 12468 12406 12702 12688 12891 13042 12931 12921 13170
1.3. State and Local Government 0 0 679 635 1602 1891 2823 3080 2361 2896 2622 2592 2930 3162 3179 3157 3370 3425 3532 3420 2505
1.3.1. Transferable Deposits - State and Local Government NC 0 0 679 635 1602 1891 2823 3080 2361 2896 2622 2592 2930 3162 3179 3157 3370 3425 3532 3420 2505
1.4. Other Financial Corporations 1317 1569 1575 1882 2006 2223 2794 2844 3410 3300 3415 3459 3484 3460 3484 2270 2195 2282 2328 2330 2409
2. Currency held by Other Depository Corporations 844 921 1389 1545 1986 1948 3198 2569 3216 2906 2862 3151 2702 3071 2801 3024 3135 2934 2939 2922 3215
3. Other Depository Corporations - Other Liabilities 4581 4713 8945 9480 21040 21616 17451 13593 16676 18194 21033 23201 23447 25012 23660 22878 25427 27618 25623 27118 26867
3.1. Transferable Deposits Excluded from Broad money, FC 193 147 0 0 0 0 0 1 0 0 0 0 0 0 0 0 0 0 0 0 0
3.2. Other Deposits Excluded from Broad money, FC 0 0 0 0 0 0 0 0 814 417 215 246 215 197 185 62 985 986 924 984 923
3.3. Securities Excluded from Broad money, NC 4388 4566 8945 9480 21040 21616 17451 13593 15862 17776 20817 22954 23231 24814 23475 22816 24441 26631 24698 26133 25944
4. Restricted Deposits 0 0 0 0 0 0 11 2 0 0 0 0 0 0 0 0 0 0 0 0 0
5. Foreign liabilities 3982 3457 3863 3249 555 560 955 949 4561 4638 4719 4722 4777 4812 4903 4724 4993 4816 4788 4872 4886
6. Central Government Deposits 12348 12865 24025 34648 20833 21431 12334 13738 12692 11385 9507 8242 7620 6112 6774 7807 8043 10435 8172 8024 9009
6.1. In national currency 3997 6584 8399 16962 15313 15928 9208 10876 2775 3110 3013 4206 2384 1546 2189 3995 4402 3485 2129 2875 5941
6.2. In foreign currency 8351 6281 15626 17686 5520 5503 3126 2862 9917 8274 6494 4035 5236 4566 4585 3812 3640 6950 6043 5149 3068
7. Other liabilities 8967 7634 10065 14252 16094 17013 17324 19137 16189 16820 17546 16904 17950 19474 19968 17594 18725 18049 17726 18941 19794
1) Revised data: Starting with Quarterly Report with Q1.2009 the data are revised in accordance with the new introduced methodology for the period from January 2003
2) Starting from August 2009, Deposit Money Banks and Saving Houses are obliged to allocate compulsory deposit at NBRM, according Decision of compulsory deposit at NBRM, No 02-15/VI-1/2008 from 12.06.2008
3) Starting from January 2009 the data are compiled based on the New Banks' Chart of accounts
4) In accordance with the IMF guidelines, SDR allocations is treated as foreign liabilities and no longer as "shares and other equity". The all historical series is revised.
2008 2009 2010

Table 7
Report form for the Central bank1,2,3,4
in milions of denars
I II III IV V VI VII VIII IX X XI XII I II III
A. ASSETS 113189 112959 138681 138380 142965 140365 146861 143536 139862 151305 153490 164498 167990 163161 166352
1. Foreign Assets 105025 104760 116919 118563 122646 120236 124943 123392 119141 131031 132502 141624 146633 142305 145456
1.1. Official Reserves Assets 104979 104715 116881 115470 116006 112912 111589 113389 113644 113083 113577 127247 127142 126801 127184
1.2 Other Foreign Assets 46 45 38 3092 6640 7324 13354 10003 5497 17948 18924 14377 19491 15504 18272
2. Claims on Central Government 5451 5468 19039 18451 18932 18750 19058 18739 19322 18884 19600 20098 19979 19486 19534
2.1. In national currency 5379 5395 5402 5209 5317 5281 5358 5278 5424 5314 5502 5647 5642 5473 5485
2.2. In foreign currency 72 74 13637 13242 13615 13469 13700 13461 13898 13571 14099 14451 14337 14013 14049
3. Other Assets 2713 2731 2722 1366 1387 1379 2859 1404 1398 1390 1388 2776 1379 1370 1363
B. TOTAL LIABILITIES 113189 112959 138681 138380 142965 140365 146861 143536 139862 151305 153490 164498 167990 163161 166352
1. Reserve money 53993 54389 61954 65852 65868 65572 69231 68663 63903 54810 54116 58879 56700 56001 54592
1.1. Currency in circulation 18875 19087 18744 19841 20592 20135 21418 20843 20357 20321 19711 22767 21559 21623 21095
1.2. Other Depository Corporations 29518 29633 37199 39600 38934 39148 41836 41799 37261 28471 28469 30877 29567 28977 27701
1.2.1. Transferable Deposits Excluded, NC 16123 15073 15083 16396 16023 14422 14824 15338 11987 14261 14438 16746 16063 15659 14679
1.2.2. Other Deposits Excluded from Broad money, NC 0 1070 8597 9549 9120 10818 12997 12417 11086 0 0 0 0 0 0
1.2.3. Other Deposits Excluded from Broad money, FC 13395 13490 13519 13655 13791 13907 14015 14044 14188 14211 14032 14131 13504 13318 13022
1.3. State and Local Government 3124 3177 3452 3836 3716 3621 3273 3262 3471 3281 3113 2340 2622 2336 2742
1.3.1. Transferable Deposits - State and Local Government NC 3124 3177 3452 3836 3716 3621 3273 3262 3471 3281 3113 2340 2622 2336 2742
1.4. Other Financial Corporations 2476 2492 2559 2575 2626 2668 2704 2759 2813 2736 2823 2895 2952 3065 3055
2. Currency held by Other Depository Corporations 3061 3025 2801 3044 3311 3095 3332 3291 3172 3355 3084 3460 3358 3289 3235
3. Other Depository Corporations - Other Liabilities 27142 27388 19874 15946 19493 19219 15814 14765 20492 31151 31286 32230 34342 36702 40421
3.1. Transferable Deposits Excluded from Broad money, FC 0 0 0 0 0 0 0 0 0 0 0 0 0 0 0
3.2. Other Deposits Excluded from Broad money, FC 923 923 0 0 0 0 0 0 0 0 0 0 0 0 0
3.3. Securities Excluded from Broad money, NC 26218 26465 19874 15945 19492 19219 15813 14765 20491 31150 31285 32230 34341 36702 40420
4. Restricted Deposits 0 0 0 0 0 0 0 0 0 0 4 0 0 0 19
5. Foreign liabilities 4786 4832 4761 7688 11342 12000 17847 14452 10090 22415 23578 19121 24195 20136 22922
6. Central Government Deposits 9659 8185 34240 32730 28990 26840 26347 26684 26633 24542 24675 33541 32147 29851 29476
6.1. In national currency 5515 4132 2906 5384 1315 2552 3696 4461 5011 4124 4599 7028 6014 4427 4383
6.2. In foreign currency 4144 4053 31334 27346 27674 24288 22651 22224 21622 20418 20076 26512 26133 25424 25092
7. Other liabilities 17610 18165 17852 16164 17272 16733 17620 18971 18744 18386 19830 20728 20606 20471 18923
1) Revised data: Starting with Quarterly Report with Q1.2009 the data are revised in accordance with the new introduced methodology for the period from January 2003
2) Starting from August 2009, Deposit Money Banks and Saving Houses are obliged to allocate compulsory deposit at NBRM, according Decision of compulsory deposit at NBRM, No 02-15/VI-1/2008 from 12.06.2008
3) Starting from January 2009 the data are compiled based on the New Banks' Chart of accounts
4) In accordance with the IMF guidelines, SDR allocations is treated as foreign liabilities and no longer as "shares and other equity". The all historical series is revised.
2011 2012

Table 8
Report form for other depository corporations (Banks and Saving houses) 1,2
in milions of denars
2003 2004 2005 2006 2007 2009
XII XII XII XII XII XII XII I II III IV V VI VII VIII IX X XI XII
A. ASSETS 128133 146283 171189 204745 254348 283710 306469 307928 309677 310961 317359 324351 328194 331352 331594 335190 337668 342815 349758
1. Currency and Deposits 40700 44136 49509 55860 59192 50211 60794 57956 55073 53849 56658 60361 60487 60167 60032 59705 63303 64985 68466
1.1. Currency 2368 2390 3332 3905 4791 5667 5912 5153 4932 5286 5231 5534 5297 6135 6152 5635 5514 5427 6204
1.1.1. Holdings of National Currency 844 921 1389 1545 1986 3198 3216 2906 2862 3151 2702 3071 2801 3024 3135 2934 2939 2922 3215
1.1.2. Holdings of Foreign Currency 1524 1469 1943 2360 2805 2469 2696 2247 2070 2135 2530 2463 2496 3111 3018 2701 2575 2506 2989
1.2. Deposits 38332 41746 46177 51955 54401 44544 54882 52802 50140 48563 51427 54827 55190 54032 53880 54070 57789 59557 62262
1.2.1. In National Currency 3583 2850 4814 7420 10848 11977 14614 15967 15031 13930 14952 14926 16737 14560 15320 14059 16609 16079 15978 1.2.1.1. Central Bank/Required
Reserves and Clearing Balances,
Compulsory deposit 3295 2767 4742 7329 10649 11616 14176 15528 14586 13484 14580 14529 16312 14132 14871 13630 16173 15647 15391
1.2.1.2. Other Depository Corporations 288 83 72 91 199 361 438 439 445 446 372 397 425 428 449 429 436 432 587
1.2.2. In Foreign Currency 34749 38896 41363 44535 43553 32567 40268 36835 35109 34633 36475 39901 38453 39472 38560 40011 41180 43479 46285
1.2.2.1. Other Depository Corporations 771 343 766 1347 1185 1832 1686 1233 1123 1166 1095 1021 1010 934 1726 1748 1886 1729 1789
1.2.2.2. Central Bank 2951 3504 5323 6373 7277 9769 12225 12189 12171 12240 12468 12406 12702 12688 12891 13042 12931 12921 13170
1.2.2.3. Nonresidents 31027 35049 35274 36815 35091 20966 26357 23412 21814 21227 22912 26474 24742 25850 23943 25221 26363 28828 31325
2. Securities Other than Shares 10778 11656 16218 22912 34300 27339 29782 32668 35877 36709 36801 38309 38149 36272 38681 40898 39765 42739 44492
2.1. In National Currency 4829 6041 16140 22835 34217 27240 29265 32145 35353 36336 36431 37952 37789 35919 38316 40530 39384 42357 44114
2.1.1. Central Bank 4006 4465 8932 9457 21000 17437 15861 17776 20814 22954 23230 24814 23196 22816 24441 26630 24698 26132 25943
2.1.2.Other Depository Corporations 0 0 0 0 300 529 833 836 839 840 841 835 837 838 840 841 842 835 617
2.1.3.Other Financial Corporations 0 0 0 0 0 0 0 0 0 0 0 0 0 0 0 0 0 0 0
2.1.4. Central Government 823 1571 7205 13365 12837 9252 12571 13533 13701 12542 12360 12303 13756 12266 13036 13060 13845 15390 17554
2.1.5. Other Nonfinancial Corporations 0 5 3 13 80 22 0 0 0 0 0 0 0 0 0 0 0 0 0
2.1.6. Nonresidents 0 0 0 0 0 0 0 0 0 0 0 0 0 0 0 0 0 0 0
2.2. In Foreign Currency 5949 5615 78 77 83 99 517 523 523 374 370 357 360 353 365 367 381 381 377
2.2.1. Central Government 5889 5502 0 0 0 0 359 362 361 374 370 357 360 353 365 367 381 381 377
2.2.2. Nonresidents 60 113 78 77 83 99 159 161 162 0 0 0 0 0 0 0 0 0 0
3. Loans 49164 60126 72604 95069 131562 176417 184241 184395 185977 187083 188961 190102 191702 192930 194698 195411 195873 196655 198375
3.1. In National Currency 40735 47799 54148 70302 99521 136665 142289 142513 142846 143465 143654 143816 144628 146210 147201 147004 147292 146911 144692
3.1.1. Central Bank 0 0 0 0 0 0 14 13 12 13 12 13 13 14 14 13 14 13 16
3.1.2. Other Depository Corporations 1342 743 796 1568 1966 2849 2925 2690 2911 2905 2245 2285 2486 2611 2849 2262 2056 1966 2061
3.1.3. Other Financial Corporations 46 0 3 4 52 30 31 41 41 42 43 39 21 23 19 19 39 37 40
3.1.4. Central Government 24 153 44 268 139 115 98 97 98 101 96 97 102 95 98 97 93 95 99
3.1.5. State and Local Government 2 20 13 0 0 24 20 20 20 19 18 18 17 18 17 16 16 15 15
3.1.6. Public Nonfinancial Corporations 458 677 517 363 315 133 33 33 32 31 25 23 18 13 12 11 10 10 10
3.1.7. Other Nonfinancial Corporations 28507 30065 30336 37026 48498 68078 70993 71540 71734 72103 72594 72099 72006 73382 73620 73731 73866 73386 71848
3.1.8. Other Resident Sectors 10355 16139 22428 31049 48487 65414 68121 68025 67945 68196 68561 69186 69908 69997 70517 70801 71141 71330 70544
3.1.9. Nonresidents 1 2 11 24 64 22 54 53 54 54 61 55 56 57 57 55 57 57 58
3.2. In Foreign Currency 8429 12327 18456 24767 32041 39752 41952 41882 43131 43618 45307 46286 47074 46720 47497 48407 48581 49745 53683
3.2.1. Other Depository Corporations 917 666 962 988 1151 1175 1826 1817 2263 2265 2908 2954 2850 3144 3150 3633 3526 3622 4593
3.2.2. Other Financial Corporations 0 0 0 2 0 0 41 46 46 46 45 44 45 44 45 43 41 24 23
3.2.3. Central Government 2 1 0 0 0 0 18 18 18 17 17 17 17 17 12 11 11 11 10
3.2.4. Local Government 0 0 0 0 0 0 0 0 0 0 0 0 0
3.2.5. Public Nonfinancial Corporations 27 5 0 0 0 0 398 391 386 395 395 437 430 421 419 422 416 407 407
3.2.6. Other Nonfinancial Corporations 7069 10934 16477 21864 28361 34128 34737 34798 35630 36057 36992 37744 38595 37973 38644 39041 39186 40170 42844
3.2.7. Other Resident Sectors 180 458 750 1709 2358 4344 3823 3806 3778 3833 3990 4077 4218 4352 4435 4526 4649 4753 5085
3.2.8. Nonresidents 234 263 267 204 171 105 1109 1005 1009 1005 961 1013 920 770 791 731 751 758 721
4. Shares and Other Equity 1424 1349 1567 1622 1308 1593 1353 1337 1347 1351 1356 1342 1355 1340 1339 1333 1335 1342 1430
4.1. In National Currency 1275 1200 1415 1451 1117 1402 1154 1137 1144 1143 1144 1143 1153 1145 1142 1140 1141 1145 1238
4.2. In Foreign Currency 149 149 152 171 191 191 198 199 203 207 212 199 202 195 198 193 194 197 192
5. Financial Derivatives 0 0 0 0 0 0 15 18 4 5 8 18 20 16 6 2 11 1 3
6. Other claims 15085 17498 20113 18538 17935 17193 17861 19238 19079 19597 21036 21731 23890 27983 24206 24916 24468 23288 23080
6.1. In National Currency 13686 15345 18946 17214 16141 16024 16549 17971 17810 18316 19774 20511 22637 26814 23017 23724 23399 22250 22101
6.2. In Foreign Currency 1399 2153 1167 1324 1794 1169 1312 1267 1269 1282 1262 1219 1253 1169 1189 1191 1069 1038 979
7. Nonfinacial Assets 10982 11518 11178 10744 10051 10957 12424 12317 12321 12367 12538 12488 12591 12644 12631 12927 12913 13806 13913
2008 2010

Report form for other depository corporations (Banks and Saving houses) 1,2
in milions of denars
2003 2004 2005 2006 2007 2009
XII XII XII XII XII XII XII I II III IV V VI VII VIII IX X XI XII
2008 2010
B. Liabilities 128133 146283 171189 204745 254348 283710 306469 307928 309677 310961 317359 324351 328194 331352 331594 335190 337668 342815 349758
1. Deposit included in Borad money 65671 78831 92725 117838 155869 175130 187587 189304 189768 192433 196282 200480 201213 197149 201567 203658 206073 211217 213202
1.1. In National Currency 31159 36262 41617 57385 87613 91298 87073 87556 88087 89897 91937 95189 96197 92959 96227 97744 99695 102694 104409
1.1.1. Other Financial Corporations 398 285 338 492 1008 1947 7005 7062 7266 7497 7777 7896 7690 7985 8293 8148 8070 8111 7821
1.1.2. State and Local Government 308 193 16 10 33 42 34 33 33 33 33 33 32 34 40 41 46 45 18
1.1.3.Public Nonfinancial Corporations 457 659 609 674 2511 3095 3067 2410 3127 2799 2962 2684 2732 2546 3021 3381 3560 3467 2927
1.1.4. Other Nonfinancial Corporations 15491 18866 20571 27691 37280 38913 31459 31777 29999 29881 30026 32156 32122 27750 29945 30428 30817 32342 31646
1.1.5. Other Resident Sectors 14505 16259 20083 28518 46781 47301 45508 46273 47663 49685 51138 52420 53621 54644 54929 55747 57202 58730 61997
1.2. In Foreign Currency 34512 42569 51108 60453 68256 83832 100513 101748 101681 102535 104345 105292 105016 104190 105340 105914 106378 108523 108793
1.2.1. Other Financial Corporations 49 73 20 32 78 217 1108 1085 1044 1382 956 970 1010 1140 1052 1023 937 1000 1037
1.2.2. State and Local Government 0 0 0 0 0 0 9 9 9 9 9 9 10 9 9 9 9 9 9
1.2.3.Public Nonfinancial Corporations 0 0 0 0 0 0 358 369 364 362 363 365 341 351 360 294 279 283 311
1.2.4. Other Nonfinancial Corporations 6834 9659 11522 15243 17417 19883 17679 17732 16931 17370 19636 20693 20034 19531 19660 20381 20500 21196 20648
1.2.5. Other Resident Sectors 27629 32837 39566 45178 50761 63732 81360 82553 83333 83412 83380 83254 83621 83159 84258 84206 84652 86035 86788
2. Deposit excluded from Broad money 7372 5849 8541 13869 18367 23512 21332 19363 19154 19076 18423 18380 18501 19259 18070 18236 18722 19261 21811
2.1. In National Currency 3166 2241 2985 3516 4398 5721 6124 6438 5582 5743 5786 5655 5688 5646 5447 5681 5837 6083 5754
2.1.1. Central Bank NC 0 0 0 0 0 0 8 9 10 12 13 15 17 20 19 21 1 0 1
2.1.2. Other Depository Corporations 1150 740 1273 1746 2954 3420 552 565 551 582 491 494 523 515 536 518 534 517 679
2.1.3. Other Financial Corporations 0 0 0 0 0 0 37 38 33 34 33 33 33 45 46 46 16 16 16
2.1.4. Central Government 1850 1177 1562 1672 1359 2243 1226 1256 1122 1175 1307 1154 1104 854 827 1072 1039 1118 1157
2.1.5. Local Government 0 0 0 0 0 0 18 12 12 10 10 10 10 10 7 7 7 7 7
2.1.6. Public Nonfinancial Corporations 166 324 150 98 85 58 21 21 21 21 21 21 21 21 21 21 21 21 21
2.1.7. Other Nonfinancial Corporations 0 0 0 0 0 0 912 1048 992 992 939 933 899 893 912 920 963 1059 984
2.1.8. Other Resident Sectors 0 0 0 0 0 0 1136 1187 1128 1132 1170 1169 1226 1452 1329 1322 1365 1402 1362
2.1.9. Nonresidents 0 0 0 0 0 0 2214 2302 1713 1786 1801 1824 1853 1836 1751 1755 1892 1943 1528
2.2. In Foreign Currency 4206 3608 5556 10353 13969 17791 15208 12926 13571 13333 12637 12725 12813 13613 12623 12555 12885 13177 16057
2.2.1. Other Depository Corporations 760 340 964 1657 1571 2308 902 849 875 945 862 807 797 829 738 764 953 718 870
2.2.2. Other Financial Corporations 0 0 0 0 0 0 9 9 9 12 12 12 14 13 14 14 13 14 15
2.2.3. Central Government 25 27 1 1 1 2 5 6 7 6 6 6 5 5 7 5 4 201 164
2.2.4. Other Nonfinancial Corporations 0 0 0 0 0 0 1747 1764 1762 1652 1626 1673 1636 1543 1512 1495 1524 1472 1434
2.2.5. Public Nonfinancial Corporations
2.2.6. Other Resident Sectors 0 0 0 0 0 0 2243 2258 2353 2404 2474 2430 2808 2482 2451 2522 2531 2627 2639
2.2.7. Nonresidents 3421 3241 4591 8695 12397 15481 10303 8040 8567 8316 7657 7798 7553 8740 7901 7755 7859 8146 10936
3. Securities Other than Shares 0 0 0 0 300 954 932 938 942 945 949 945 936 939 943 947 950 927 617
4. Loans 8959 9691 13556 14646 17860 16047 25445 25125 26354 25004 25900 27845 28593 30978 31177 31230 30615 30882 33749
4.1. In National Currency 2532 1946 2218 3212 3575 5089 5779 5462 5713 5710 4964 5139 5363 5421 5655 5063 4745 4742 4807
4.2. In Foreign Currency 6427 7745 11338 11434 14285 10958 19666 19663 20641 19294 20936 22705 23230 25557 25522 26167 25870 26140 28942
5. Financial derivatives 1 5 6 1 0 0 2 0 8 5 7 3 1
5.1. In National Currency 0 0 0 0 0 0 0 0 0 0 0 0 0
5.2. In Foreign Currency 1 5 6 1 0 0 2 0 8 5 7 3 1
6. Other liabilities 14131 16931 18778 19115 18639 18373 18366 19854 19760 19810 22141 22690 24395 28220 24605 25220 25009 23855 23924
6.1. In National Currency 12791 14086 17542 17802 16684 17090 17036 18481 18356 18454 20796 21334 23033 26880 23278 23873 23758 22613 22572
6.2. In Foreign Currency 1340 2845 1236 1313 1955 1283 1330 1373 1404 1356 1345 1356 1362 1340 1327 1347 1251 1242 1353
7. Shares and Other Equity 32000 34981 37589 39277 43313 49694 52806 53340 53693 53692 53664 54011 54555 54808 55224 55894 56293 56671 56454
1) Revised data: Starting with Quarterly Report with Q1.2009 the data are revised in accordance with the new introduced methodology for the period from January 2003
2) Starting from January 2009 the data are compiled based on the New Banks' Chart of accounts

Table 8
Report form for other depository corporations (Banks and Saving houses) 1,2
in milions of denars
I II III IV V VI VII VIII IX X XI XII I II III
A. ASSETS 348059 351252 356990 360817 366040 369593 371368 372410 372235 375134 375852 383002 381184 386519 391441
1. Currency and Deposits 66204 66670 74245 77974 77060 76951 85044 85288 78185 68911 67309 71531 67900 69356 64673
1.1. Currency 5339 5340 4926 5577 5569 5773 6629 6148 5972 6372 6114 7601 6248 5948 5769
1.1.1. Holdings of National Currency 3061 3025 2801 3044 3311 3095 3332 3291 3172 3355 3084 3460 3358 3289 3235
1.1.2. Holdings of Foreign Currency 2278 2315 2125 2533 2258 2678 3297 2857 2800 3017 3031 4141 2890 2659 2534
1.2. Deposits 60865 61331 69319 72397 71491 71178 78415 79140 72213 62539 61195 63931 61652 63408 58904
1.2.1. In National Currency 16271 16293 23818 25905 25061 25135 28041 27998 23415 14632 14564 16784 15965 15700 14545 1.2.1.1. Central Bank/Required
Reserves and Clearing Balances,
Compulsory deposit 15826 15849 23372 25509 24666 24749 27639 27578 22994 14212 14431 16648 15905 15566 14440
1.2.1.2. Other Depository Corporations 445 444 446 397 395 385 402 420 420 420 133 137 60 134 104
1.2.2. In Foreign Currency 44595 45038 45501 46491 46430 46043 50374 51142 48798 47907 46631 47146 45687 47707 44359
1.2.2.1. Other Depository Corporations 1493 1630 757 996 792 854 1151 914 993 854 391 744 431 1206 649
1.2.2.2. Central Bank 13395 13490 13519 13655 13791 13907 14015 14044 14188 14210 14031 14130 13504 13318 13022
1.2.2.3. Nonresidents 29707 29918 31224 31841 31847 31282 35208 36183 33618 32842 32209 32272 31752 33183 30688
2. Securities Other than Shares 44601 44793 38121 34060 36421 36058 32549 31708 36868 47791 48008 48837 51084 53779 57631
2.1. In National Currency 44222 44351 37675 33610 35965 35601 32107 31274 36432 47294 47510 48343 50583 53266 57117
2.1.1. Central Bank 26218 26465 19873 15944 19492 19218 15813 14764 20490 31150 31285 32229 34340 36700 40418
2.1.2.Other Depository Corporations 618 619 621 622 617 618 620 620 622 623 0 0 0 0 0
2.1.3.Other Financial Corporations 0 0 0 0 0 0 4 4 4 4 4 4 4 4 4
2.1.4. Central Government 17385 17267 17181 17044 15857 15765 15671 15886 15316 15517 16222 16110 16240 16562 16695
2.1.5. Other Nonfinancial Corporations 0 0 0 0 0 0 0 0 0 0 0 0 0 0 0
2.1.6. Nonresidents 0 0 0 0 0 0 0 0 0 0 0 0 0 0 0
2.2. In Foreign Currency 379 442 446 450 455 457 442 435 437 497 497 494 501 513 514
2.2.1. Central Government 379 442 446 450 455 457 442 435 437 497 497 494 501 513 514
2.2.2. Nonresidents 0 0 0 0 0 0 0 0 0 0 0 0 0 0 0
3. Loans 198310 200049 203787 206275 209023 211061 211827 212059 213695 214091 215590 218061 217608 218518 222483
3.1. In National Currency 144552 145486 146885 148673 149914 150990 150698 149999 150702 150894 152017 152291 152352 152886 155140
3.1.1. Central Bank 15 13 21 35 46 52 61 72 49 19 15 17 11 5 7
3.1.2. Other Depository Corporations 1974 1756 1758 1849 2095 1940 1756 1719 1979 1655 1764 2315 1557 1548 1933
3.1.3. Other Financial Corporations 21 21 25 20 39 39 49 49 30 35 36 42 40 85 81
3.1.4. Central Government 89 92 97 88 97 105 107 114 84 99 107 118 98 109 124
3.1.5. State and Local Government 15 14 13 13 13 12 33 72 118 118 135 243 248 264 262
3.1.6. Public Nonfinancial Corporations 12 17 17 19 21 25 24 14 14 13 41 41 39 39 39
3.1.7. Other Nonfinancial Corporations 71792 72916 73681 74993 75100 75502 74752 73529 73748 73849 74452 74291 75082 75584 76839
3.1.8. Other Resident Sectors 70577 70601 71216 71600 72447 73260 73861 74375 74627 75054 75414 75171 75225 75201 75804
3.1.9. Nonresidents 57 56 57 56 56 55 55 55 54 53 53 53 53 52 52
3.2. In Foreign Currency 53758 54563 56902 57602 59109 60071 61128 62061 62993 63197 63574 65769 65255 65632 67343
3.2.1. Other Depository Corporations 4632 4742 5759 6564 6794 7059 6743 6789 6817 6480 6546 7936 7343 7521 8497
3.2.2. Other Financial Corporations 34 31 32 31 29 28 26 23 22 21 18 17 17 17 17
3.2.3. Central Government 10 9 9 8 7 5 4 4 4 4 4 3 3 3 3
3.2.4. Local Government 0 0 0 0 0 0 0 1 6 6 7 10 10 10 11
3.2.5. Public Nonfinancial Corporations 398 397 383 274 269 265 266 255 260 258 277 280 281 280 280
3.2.6. Other Nonfinancial Corporations 42815 43289 44313 44139 45272 46006 47253 48059 48869 49312 49500 50450 50451 50547 50969
3.2.7. Other Resident Sectors 5134 5299 5528 5786 5944 6014 6110 6167 6278 6423 6510 6556 6561 6571 6611
3.2.8. Nonresidents 735 796 877 801 794 694 726 762 737 692 712 517 589 682 956
4. Shares and Other Equity 1431 1436 1417 1416 1430 1434 1450 1447 1450 1454 1469 1533 1604 1640 1620
4.1. In National Currency 1242 1245 1228 1227 1233 1240 1252 1249 1247 1247 1257 1312 1386 1411 1387
4.2. In Foreign Currency 189 192 188 188 197 194 199 198 203 206 212 221 218 229 233
5. Financial Derivatives 12 12 0 0 0 0 0 0 0 0 7 3 0 0 0
6. Other claims 23627 24538 25437 26986 27883 29652 26027 27164 27233 27841 28397 27593 27647 27956 29622
6.1. In National Currency 22718 23132 24007 25589 26221 27932 24291 25423 25463 26113 26518 25707 25775 26575 28120
6.2. In Foreign Currency 909 1406 1431 1397 1662 1720 1737 1741 1770 1728 1878 1886 1872 1381 1502
7. Nonfinacial Assets 13874 13754 13982 14106 14225 14437 14470 14744 14803 15047 15072 15444 15340 15270 15411
2011 2012

Report form for other depository corporations (Banks and Saving houses) 1,2
in milions of denars
I II III IV V VI VII VIII IX X XI XII I II III
2011 2012
B. Liabilities 348059 351252 356990 360817 366040 369593 371368 372410 372235 375135 375852 383002 381184 386519 391441
1. Deposit included in Borad money 213743 214900 216220 215044 218119 219709 224616 226647 225103 227568 229428 232836 234157 234764 236705
1.1. In National Currency 104662 105056 105381 105271 106796 107536 108472 109759 110462 111861 112552 119357 121686 123384 124940
1.1.1. Other Financial Corporations 8022 8294 8073 8008 7903 7857 8304 8149 7320 7544 7317 7407 7556 7302 7445
1.1.2. State and Local Government 24 22 16 18 19 26 21 23 20 19 21 20 17 18 16
1.1.3.Public Nonfinancial Corporations 2856 2740 2739 2690 2880 2527 2513 2643 3025 2773 2485 2132 2358 2378 2216
1.1.4. Other Nonfinancial Corporations 32106 31223 31698 29936 31086 31696 32100 33140 33024 33671 33589 35243 35287 35055 35811
1.1.5. Other Resident Sectors 61655 62778 62854 64619 64908 65430 65534 65805 67074 67854 69140 74555 76467 78632 79452
1.2. In Foreign Currency 109081 109844 110839 109773 111323 112173 116144 116887 114641 115707 116876 113479 112471 111380 111765
1.2.1. Other Financial Corporations 985 977 931 1047 1076 1091 1145 1282 1243 1148 1155 1135 1123 1227 1089
1.2.2. State and Local Government 9 0 0 0 0 0 0 0 0 0 0 0 0 0 0
1.2.3.Public Nonfinancial Corporations 317 344 333 324 312 308 303 324 348 383 402 409 372 349 380
1.2.4. Other Nonfinancial Corporations 20581 20695 20893 19176 19383 19550 22654 22894 20178 21758 22622 20249 20230 19492 20055
1.2.5. Other Resident Sectors 87190 87829 88681 89226 90551 91225 92041 92388 92872 92417 92696 91686 90746 90311 90241
2. Deposit excluded from Broad money 19065 19029 20061 20986 21653 21582 22010 19219 20349 20657 17818 18961 17908 18740 18361
2.1. In National Currency 5428 5582 5630 5852 6195 6174 5889 5540 5832 6147 5891 6068 5683 5922 5855
2.1.1. Central Bank NC 1 0 1 1 1 0 1 0 0 0 0 1 0 1 1
2.1.2. Other Depository Corporations 499 488 516 564 565 574 576 584 645 677 471 393 265 431 303
2.1.3. Other Financial Corporations 16 15 15 25 26 27 19 19 20 20 20 21 21 21 21
2.1.4. Central Government 1100 1137 1095 1173 1088 1060 1051 1123 1330 1550 1512 1238 1260 1273 1270
2.1.5. Local Government 7 6 3 3 3 3 4 4 3 3 3 3 3 3 2
2.1.6. Public Nonfinancial Corporations 21 21 21 21 21 22 22 22 23 23 23 23 23 22 22
2.1.7. Other Nonfinancial Corporations 947 939 909 937 1029 1094 1024 1021 1028 1037 992 1402 1144 1085 1112
2.1.8. Other Resident Sectors 1292 1404 1544 1491 1812 1600 1859 1671 1648 1648 1638 1802 1747 1842 1862
2.1.9. Nonresidents 1545 1572 1525 1637 1648 1793 1333 1097 1134 1188 1231 1185 1219 1244 1262
2.2. In Foreign Currency 13636 13447 14431 15134 15459 15408 16121 13679 14517 14510 11927 12894 12225 12819 12506
2.2.1. Other Depository Corporations 571 717 769 1001 805 862 1041 902 999 864 436 747 452 1024 475
2.2.2. Other Financial Corporations 15 13 19 19 19 19 21 22 23 21 22 22 19 20 22
2.2.3. Central Government 114 107 103 95 97 90 81 88 92 87 90 84 87 72 68
2.2.4. Other Nonfinancial Corporations 1397 1412 1393 1373 1314 1271 1211 1160 1193 1063 1059 1512 1427 1385 1161
2.2.5. Public Nonfinancial Corporations 0 14 14 0 14 14 14 14 14 14 14 14
2.2.6. Other Resident Sectors 2619 2633 2717 2802 2814 3336 2820 2921 3062 3212 3072 3026 3080 3127 3218
2.2.7. Nonresidents 8921 8564 9429 9844 10410 9829 10946 8572 9135 9250 7236 7488 7146 7177 7548
3. Securities Other than Shares 618 619 621 622 617 618 620 620 622 623 0 0 0 0 0
4. Loans 33349 33306 35518 37895 38563 38639 38394 36956 36874 35939 36182 39602 36673 38802 40067
4.1. In National Currency 4565 4353 4363 4282 4607 4466 5758 4286 4574 4078 4240 4913 4083 4192 4716
4.2. In Foreign Currency 28784 28952 31155 33613 33955 34173 32635 32670 32299 31860 31942 34689 32591 34610 35351
5. Financial derivatives 6 1 6 18 8 7 8 0 0 12 0 0 2 10 5
5.1. In National Currency 0 0 0 0 0 0 0 0 0 0 0 0 0 0 0
5.2. In Foreign Currency 6 1 6 18 8 7 8 0 0 12 0 0 2 10 5
6. Other liabilities 24456 25377 26650 28021 28452 30033 26272 27675 27692 28257 28641 27464 27839 28157 30158
6.1. In National Currency 23264 23631 24977 25847 26579 28202 24395 25676 25797 26429 26828 25669 26023 26785 28855
6.2. In Foreign Currency 1192 1746 1673 2175 1873 1832 1877 1999 1894 1828 1812 1795 1816 1372 1303
7. Shares and Other Equity 56822 58019 57913 58230 58629 59005 59449 61293 61596 62079 63784 64140 64605 66046 66146
1) Revised data: Starting with Quarterly Report with Q1.2009 the data are revised in accordance with the new introduced methodology for the period from January 2003
2) Starting from January 2009 the data are compiled based on the New Banks' Chart of accounts

Table 9
Depository corporations survey NBRM, other depository corporations (ODI banks and saving houses) 1,2
in milions of denars
2003 2004 2005 2006 2007
XII XII XII XII XII XII XII I II III IV V VI VII VIII IX X XI XII
A. FOREIGN ASSETS (NET) 65371 67722 88937 107524 109068 90980 94764 95012 92917 92943 96911 100656 99983 94424 97854 97099 96366 99436 99869
1. Foreign Assets, Net 42096 41374 65725 84853 94424 90953 93246 94877 94978 94214 96534 98778 100343 96488 100903 99344 97662 98873 100610
1.1. Foreig Assets 46078 44831 69588 88102 94979 91908 97807 99515 99697 98935 101310 103590 105246 101212 105896 104160 102450 103745 105495
1.2. Foreign Liabilities -3982 -3457 -3863 -3249 -555 -955 -4561 -4638 -4719 -4722 -4777 -4812 -4903 -4724 -4993 -4816 -4788 -4872 -4886
2. Foreign Assets, Net 23275 26348 23212 22671 14644 27 1518 135 -2061 -1271 377 1877 -360 -2064 -3049 -2245 -1296 563 -740
2.1. Foreig Assets 33080 37106 37797 39732 38478 23904 30643 27146 25372 24694 26761 30269 28488 30044 28071 29002 30009 32411 35346
2.2. Foreign Liabilities -9805 -10758 -14585 -17061 -23834 -23877 -29125 -27012 -27433 -25965 -26383 -28392 -28848 -32108 -31120 -31247 -31304 -31848 -36086
B. DOMESTIC CREDIT 43317 55212 57232 72912 121814 169749 178825 181649 184830 186027 188332 190973 193713 193501 195453 197962 201704 203991 206007
1. Claims on Central Government, Net -4392 -4132 -15271 -21263 -8922 -5530 -2408 -91 2070 2145 2476 4153 5036 3675 4253 5726 8849 10365 11511
1.1. Claims od Central Government 3890 3495 3549 2519 1271 1304 1327 1337 1347 1347 1355 1380 1394 1370 1381 5405 5402 5477 5493
1.2. Central Government Deposits -12348 -12865 -24025 -34648 -20833 -12334 -12692 -11385 -9507 -8242 -7620 -6112 -6774 -7807 -8043 -10435 -8172 -8024 -9009
1.3. Claims on Central Government 6833 7333 7542 13646 12995 9380 13059 14021 14195 13056 12865 12800 14266 12764 13550 13580 14379 15932 18060
1.4. Central Government Deposits -2767 -2095 -2338 -2781 -2355 -3880 -4103 -4064 -3965 -4017 -4124 -3916 -3849 -2652 -2636 -2825 -2759 -3019 -3033
2. Claims on State & Local Government 2 20 13 0 0 24 20 20 20 19 18 18 17 18 17 16 16 15 15
2.1. Claims on State & Local Government 0 0 0 0 0 0 0 0 0 0 0 0 0 0 0 0 0 0 0
2.2. Claims on State & Local Government 2 20 13 0 0 24 20 20 20 19 18 18 17 18 17 16 16 15 15
3. Claims on Public NonfinancialCorporations 485 682 517 363 315 133 431 424 417 426 420 461 448 433 431 433 427 417 417
3. 1. Claims on Public NonfinancialCorporations 0 0 0 0 0 0 0 0 0 0 0 0 0 0 0 0 0 0 0
3. 2. Claims on Public Nonfinancial Corporations 485 682 517 363 315 133 431 424 417 426 420 461 448 433 431 433 427 417 417
4. Claims on Private Sector 47172 58639 71967 93803 130366 174782 180196 180710 181736 182852 184832 185758 187635 188797 190177 191215 191822 192617 193394
4. 1. Claims on Private Sector -1 44 1063 1092 1412 1508 1512 1514 1493 1487 1468 1453 1444 1445 1492 1482 1475 1464 1455
4. 2. Claims on Private Sector 47173 58595 70904 92711 128954 173274 178684 179196 180244 181364 183364 184305 186191 187352 188686 189733 190347 191153 191939
5. Claims on Other Financial Corporations 49 3 6 9 55 340 587 586 587 586 586 584 577 578 575 572 590 576 669
5. 1. Claims on Other Financial Corporations 3 3 3 3 3 3 1 1 1 1 1 1 1 1 1 1 1 1 1
5. 2. Claims on Other Financial Corporations 46 0 3 6 52 337 586 585 585 585 585 582 576 576 574 571 589 575 668
C. MONEY 28265 28842 31354 36788 48858 56942 54584 52872 53367 52866 53508 56104 55706 55854 56966 57197 57301 57428 59867
1. Currency outside Other Depository
Corporations 14166 14150 14424 16187 17908 17601 16266 15525 15087 14844 15224 15505 15662 16728 16204 15945 16068 15585 16958
2. Public Sector Liabilities 0 0 679 635 1602 2823 2361 2896 2622 2592 2930 3162 3179 3157 3370 3425 3532 3420 2505
3. Other Financial Corporations Liabilities 1317 1569 1575 1882 2006 2794 3410 3300 3415 3459 3484 3460 3484 2270 2195 2282 2328 2330 2409
4. Demand Money 12782 13123 14676 18084 27342 33724 32547 31151 32242 31971 31871 33976 33381 33699 35198 35544 35373 36093 37995
D. RESTRICTED DEPOSITS 166 324 150 98 85 69 6077 6291 6268 6211 6241 6237 6601 6402 6232 6288 6411 6589 6447
1. Restricted Deposits 0 0 0 0 0 11 0 0 0 0 0 0 0 0 0 0 0 0 0
2. Restricted Deposits 166 324 150 98 85 58 6077 6290 6268 6211 6240 6237 6600 6401 6231 6287 6411 6589 6446
E. OTHER DEPOSITS 52889 65708 78049 99754 128527 141406 155040 158153 157526 160461 164411 166504 167832 163449 166369 168113 170700 175124 175207
1. Time, Svaings, & Foreign Currency Deposits 52889 65708 78049 99754 128527 141406 155040 158153 157526 160461 164411 166504 167832 163449 166369 168113 170700 175124 175207
F. LIABILITIES TO OTHER FINANCIAL CORPORATIONS 0 0 0 15 346 10 397 398 396 379 378 363 348 415 402 383 357 365 407
1. Liabilites to Other Financial Corporations 0 0 0 15 0 0 0 0 0 0 0 0 0 0 0 0 0 0 0
2. Liabilites to Other Financial Corporations 0 0 0 0 346 10 397 398 396 379 378 363 348 415 402 383 357 365 407
G. CAPITAL ACCOUNTS 38327 40727 45756 47644 52570 61474 65554 66408 67627 67758 68609 70473 71522 69495 71133 71132 71169 72798 72902
H. OTHER ITEMS (NET) -10959 -12667 -9140 -3863 496 828 -8062 -7460 -7437 -8705 -7903 -8053 -8313 -7690 -7796 -8052 -7870 -8877 -8953
1) Revised data: Starting with Quarterly Report with Q1.2009 the data are revised in accordance with the new introduced methodology for the period from January 2003
2) Starting from January 2009 the data are compiled based on the New Banks' Chart of accounts
2008 2009 2010

Table 9
Depository corporations survey NBRM, other depository corporations (ODI banks and saving houses) 1,2
in milions of denars
I II III IV V VI VII VIII IX X XI XII I II III
A. FOREIGN ASSETS (NET) 99191 99443 110825 108111 107580 104757 108683 113703 111001 109995 111657 124698 124696 123934 121662
1. Foreign Assets, Net 100239 99928 112158 110875 111304 108236 107096 108940 109051 108616 108923 122504 122438 122170 122534
1.1. Foreig Assets 105025 104760 116919 118563 122646 120236 124943 123392 119141 131031 132502 141624 146633 142305 145456
1.2. Foreign Liabilities -4786 -4832 -4761 -7688 -11342 -12000 -17847 -14452 -10090 -22415 -23578 -19121 -24195 -20136 -22922
2. Foreign Assets, Net -1048 -485 -1333 -2764 -3723 -3479 1587 4763 1950 1379 2734 2194 2258 1765 -872
2.1. Foreig Assets 33018 33332 34543 35503 35233 34985 39595 40137 37519 36897 36299 37287 35584 36898 34562
2.2. Foreign Liabilities -34066 -33817 -35876 -38267 -38956 -38464 -38008 -35375 -35570 -35518 -33565 -35093 -33326 -35133 -35434
B. DOMESTIC CREDIT 205104 208176 198325 199754 204961 208906 211014 210630 211868 214535 217189 210005 212091 214907 217746
1. Claims on Central Government, Net 10800 12210 -294 531 3682 5595 6364 5831 5658 7421 8771 518 1935 4081 4609
1.1. Claims od Central Government 5451 5468 19039 18451 18932 18750 19058 18739 19322 18884 19600 20098 19979 19486 19534
1.2. Central Government Deposits -9659 -8185 -34240 -32730 -28990 -26840 -26347 -26684 -26633 -24542 -24675 -33541 -32147 -29851 -29476
1.3. Claims on Central Government 17880 17833 17756 17605 16434 16354 16250 16474 15879 16159 16877 16737 16844 17192 17343
1.4. Central Government Deposits -2872 -2907 -2849 -2795 -2695 -2669 -2596 -2698 -2910 -3081 -3031 -2777 -2742 -2746 -2793
2. Claims on State & Local Government 15 14 13 13 13 12 33 73 124 124 142 253 258 274 272
2.1. Claims on State & Local Government 0 0 0 0 0 0 0 0 0 0 0 0 0 0 0
2.2. Claims on State & Local Government 15 14 13 13 13 12 33 73 124 124 142 253 258 274 272
3. Claims on Public NonfinancialCorporations 410 414 400 292 290 290 290 269 273 271 318 321 320 318 319
3. 1. Claims on Public NonfinancialCorporations 0 0 0 0 0 0 0 0 0 0 0 0 0 0 0
3. 2. Claims on Public Nonfinancial Corporations 410 414 400 292 290 290 290 269 273 271 318 321 320 318 319
4. Claims on Private Sector 193216 194878 197557 198274 200308 202335 203629 203763 205139 206040 207304 208198 208833 209443 211756
4. 1. Claims on Private Sector 1445 1437 1427 110 101 98 89 79 74 68 61 74 89 84 84
4. 2. Claims on Private Sector 191771 193441 196130 198165 200208 202237 203540 203684 205065 205973 207242 208124 208744 209358 211672
5. Claims on Other Financial Corporations 662 660 648 643 666 674 697 694 674 678 654 715 745 791 790
5. 1. Claims on Other Financial Corporations 1 1 0 0 0 0 0 0 0 0 0 0 0 0 0
5. 2. Claims on Other Financial Corporations 661 659 648 643 666 674 697 694 674 678 654 715 745 791 790
C. MONEY 57755 57299 57505 61008 61896 61637 61116 61263 60969 60808 59199 63641 62781 62130 62073
1. Currency outside Other Depository
Corporations 15814 16062 15944 16797 17281 17040 18086 17552 17185 16966 16627 19308 18201 18333 17860
2. Public Sector Liabilities 3124 3177 3452 3836 3716 3621 3273 3262 3471 3281 3113 2340 2622 2336 2742
3. Other Financial Corporations Liabilities 2476 2492 2559 2575 2626 2668 2704 2759 2813 2736 2823 2895 2952 3065 3055
4. Demand Money 36341 35567 35551 37801 38273 38308 37053 37691 37500 37825 36636 39098 39006 38395 38416
D. RESTRICTED DEPOSITS 6283 6416 6589 6627 6994 7326 6941 6812 6971 6999 6804 7783 7438 7477 7409
1. Restricted Deposits 0 0 0 0 0 0 0 0 0 0 4 0 0 0 19
2. Restricted Deposits 6283 6415 6589 6627 6993 7325 6940 6811 6970 6999 6800 7782 7438 7477 7390
E. OTHER DEPOSITS 177402 179333 180670 177243 179846 181402 187563 188956 187603 189743 192792 193738 195151 196369 198289
1. Time, Svaings, & Foreign Currency Deposits 177402 179333 180670 177243 179846 181402 187563 188956 187603 189743 192792 193738 195151 196369 198289
F. LIABILITIES TO OTHER FINANCIAL CORPORATIONS 413 401 407 423 459 487 536 584 576 583 608 644 632 664 674
1. Liabilites to Other Financial Corporations 0 0 0 0 0 0 0 0 0 0 0 0 0 0 0
2. Liabilites to Other Financial Corporations 413 401 407 423 459 487 536 584 576 583 608 644 632 664 674
G. CAPITAL ACCOUNTS 71610 73387 72944 72973 74481 74282 75948 78806 78831 79081 82197 82518 84186 85306 83570
H. OTHER ITEMS (NET) -9169 -9217 -8964 -10410 -11135 -11470 -12407 -12087 -12079 -12684 -12754 -13619 -13402 -13105 -12606
1) Revised data: Starting with Quarterly Report with Q1.2009 the data are revised in accordance with the new introduced methodology for the period from January 2003
2) Starting from January 2009 the data are compiled based on the New Banks' Chart of accounts
2011 2012
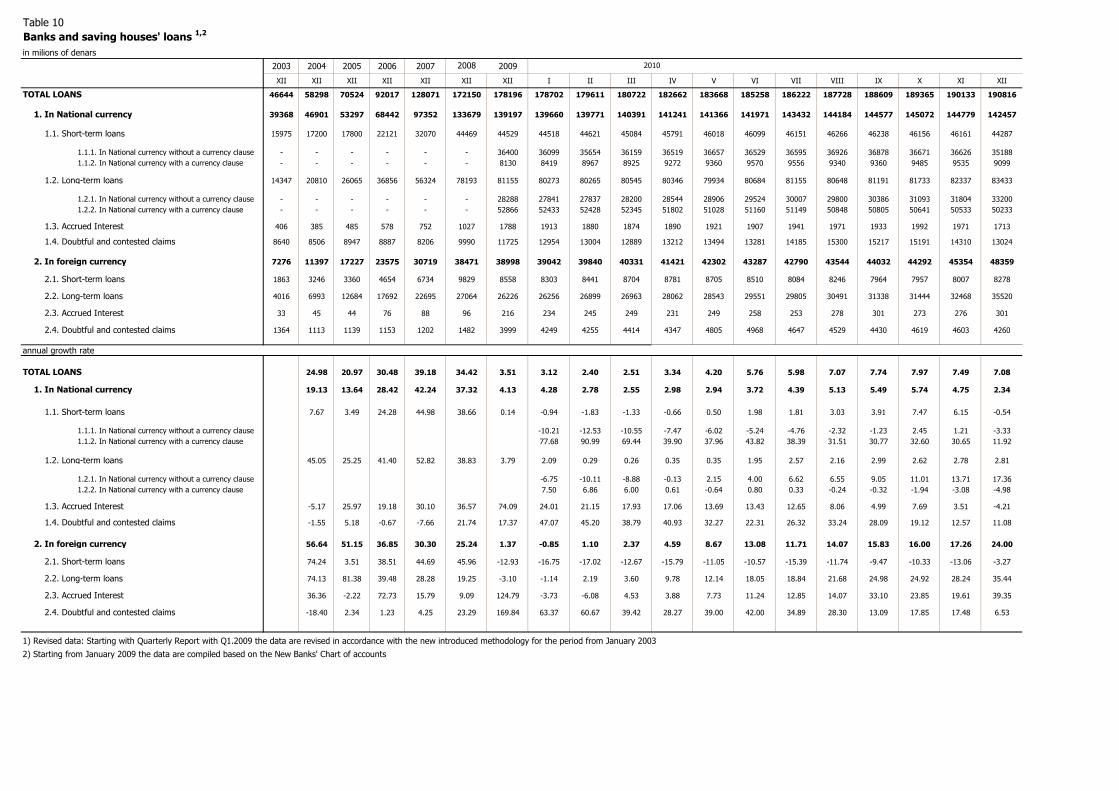
Table 10
Banks and saving houses' loans 1,2
in milions of denars
2003 2004 2005 2006 2007 2009
XII XII XII XII XII XII XII I II III IV V VI VII VIII IX X XI XII
TOTAL LOANS 46644 58298 70524 92017 128071 172150 178196 178702 179611 180722 182662 183668 185258 186222 187728 188609 189365 190133 190816
1. In National currency 39368 46901 53297 68442 97352 133679 139197 139660 139771 140391 141241 141366 141971 143432 144184 144577 145072 144779 142457
1.1. Short-term loans 15975 17200 17800 22121 32070 44469 44529 44518 44621 45084 45791 46018 46099 46151 46266 46238 46156 46161 44287
1.1.1. In National currency without a currency clause - - - - - - 36400 36099 35654 36159 36519 36657 36529 36595 36926 36878 36671 36626 35188
1.1.2. In National currency with a currency clause - - - - - - 8130 8419 8967 8925 9272 9360 9570 9556 9340 9360 9485 9535 9099
1.2. Long-term loans 14347 20810 26065 36856 56324 78193 81155 80273 80265 80545 80346 79934 80684 81155 80648 81191 81733 82337 83433
1.2.1. In National currency without a currency clause - - - - - - 28288 27841 27837 28200 28544 28906 29524 30007 29800 30386 31093 31804 33200
1.2.2. In National currency with a currency clause - - - - - - 52866 52433 52428 52345 51802 51028 51160 51149 50848 50805 50641 50533 50233
1.3. Accrued Interest 406 385 485 578 752 1027 1788 1913 1880 1874 1890 1921 1907 1941 1971 1933 1992 1971 1713
1.4. Doubtful and contested claims 8640 8506 8947 8887 8206 9990 11725 12954 13004 12889 13212 13494 13281 14185 15300 15217 15191 14310 13024
2. In foreign currency 7276 11397 17227 23575 30719 38471 38998 39042 39840 40331 41421 42302 43287 42790 43544 44032 44292 45354 48359
2.1. Short-term loans 1863 3246 3360 4654 6734 9829 8558 8303 8441 8704 8781 8705 8510 8084 8246 7964 7957 8007 8278
2.2. Long-term loans 4016 6993 12684 17692 22695 27064 26226 26256 26899 26963 28062 28543 29551 29805 30491 31338 31444 32468 35520
2.3. Accrued Interest 33 45 44 76 88 96 216 234 245 249 231 249 258 253 278 301 273 276 301
2.4. Doubtful and contested claims 1364 1113 1139 1153 1202 1482 3999 4249 4255 4414 4347 4805 4968 4647 4529 4430 4619 4603 4260
annual growth rate
TOTAL LOANS 24.98 20.97 30.48 39.18 34.42 3.51 3.12 2.40 2.51 3.34 4.20 5.76 5.98 7.07 7.74 7.97 7.49 7.08
1. In National currency 19.13 13.64 28.42 42.24 37.32 4.13 4.28 2.78 2.55 2.98 2.94 3.72 4.39 5.13 5.49 5.74 4.75 2.34
1.1. Short-term loans 7.67 3.49 24.28 44.98 38.66 0.14 -0.94 -1.83 -1.33 -0.66 0.50 1.98 1.81 3.03 3.91 7.47 6.15 -0.54
1.1.1. In National currency without a currency clause -10.21 -12.53 -10.55 -7.47 -6.02 -5.24 -4.76 -2.32 -1.23 2.45 1.21 -3.33
1.1.2. In National currency with a currency clause 77.68 90.99 69.44 39.90 37.96 43.82 38.39 31.51 30.77 32.60 30.65 11.92
1.2. Long-term loans 45.05 25.25 41.40 52.82 38.83 3.79 2.09 0.29 0.26 0.35 0.35 1.95 2.57 2.16 2.99 2.62 2.78 2.81
1.2.1. In National currency without a currency clause -6.75 -10.11 -8.88 -0.13 2.15 4.00 6.62 6.55 9.05 11.01 13.71 17.36
1.2.2. In National currency with a currency clause 7.50 6.86 6.00 0.61 -0.64 0.80 0.33 -0.24 -0.32 -1.94 -3.08 -4.98
1.3. Accrued Interest -5.17 25.97 19.18 30.10 36.57 74.09 24.01 21.15 17.93 17.06 13.69 13.43 12.65 8.06 4.99 7.69 3.51 -4.21
1.4. Doubtful and contested claims -1.55 5.18 -0.67 -7.66 21.74 17.37 47.07 45.20 38.79 40.93 32.27 22.31 26.32 33.24 28.09 19.12 12.57 11.08
2. In foreign currency 56.64 51.15 36.85 30.30 25.24 1.37 -0.85 1.10 2.37 4.59 8.67 13.08 11.71 14.07 15.83 16.00 17.26 24.00
2.1. Short-term loans 74.24 3.51 38.51 44.69 45.96 -12.93 -16.75 -17.02 -12.67 -15.79 -11.05 -10.57 -15.39 -11.74 -9.47 -10.33 -13.06 -3.27
2.2. Long-term loans 74.13 81.38 39.48 28.28 19.25 -3.10 -1.14 2.19 3.60 9.78 12.14 18.05 18.84 21.68 24.98 24.92 28.24 35.44
2.3. Accrued Interest 36.36 -2.22 72.73 15.79 9.09 124.79 -3.73 -6.08 4.53 3.88 7.73 11.24 12.85 14.07 33.10 23.85 19.61 39.35
2.4. Doubtful and contested claims -18.40 2.34 1.23 4.25 23.29 169.84 63.37 60.67 39.42 28.27 39.00 42.00 34.89 28.30 13.09 17.85 17.48 6.53
1) Revised data: Starting with Quarterly Report with Q1.2009 the data are revised in accordance with the new introduced methodology for the period from January 2003
2) Starting from January 2009 the data are compiled based on the New Banks' Chart of accounts
2008 2010

Banks and saving houses' loans 1,2
in milions of denars
I II III IV V VI VII VIII IX X XI XII I II III
TOTAL LOANS 190799 192584 195209 196874 199135 201151 202374 202544 203972 205090 206390 207102 207954 208597 210912
1. In National currency 142417 143569 144952 146645 147621 148839 148719 148038 148537 149069 150078 149789 150634 151172 153024
1.1. Short-term loans 44374 44943 45601 45807 45978 45785 45380 44098 44524 44362 44499 43915 44573 44679 44670
1.1.1. In National currency without a currency clause 35498 35907 36615 36794 37008 36782 36416 35431 35906 35933 36326 35775 36715 36908 37314
1.1.2. In National currency with a currency clause 8877 9036 8986 9012 8971 9003 8964 8666 8618 8428 8174 8140 7858 7771 7356
1.2. Long-term loans 82675 83370 84230 85504 86111 87663 87284 86989 87504 87735 88480 89422 89271 89941 91614
1.2.1. In National currency without a currency clause 33087 33784 34540 35802 35975 37123 36771 36600 36963 37089 37613 38144 38278 38498 39923
1.2.2. In National currency with a currency clause 49588 49586 49690 49702 50136 50540 50512 50389 50541 50646 50868 51277 50993 51444 51691
1.3. Accrued Interest 1790 1790 1821 1870 1896 1895 1946 1940 1899 1984 1962 1874 1994 2001 1978
1.4. Doubtful and contested claims 13578 13466 13300 13465 13636 13495 14109 15011 14610 14989 15137 14579 14796 14550 14762
2. In foreign currency 48382 49016 50257 50229 51514 52313 53655 54506 55435 56021 56311 57312 57321 57426 57888
2.1. Short-term loans 8312 8432 7264 7233 7572 7730 8143 8069 8312 9123 9063 8779 8656 8411 7999
2.2. Long-term loans 35444 35853 38102 38160 38765 39504 40195 41046 41667 41231 41520 42686 42457 42685 43327
2.3. Accrued Interest 302 317 352 322 344 360 355 368 371 341 368 368 350 350 357
2.4. Doubtful and contested claims 4324 4413 4540 4514 4833 4719 4961 5023 5084 5326 5360 5479 5857 5979 6205
annual growth rate
TOTAL LOANS 6.77 7.22 8.02 7.78 8.42 8.58 8.67 7.89 8.15 8.30 8.55 8.53 8.99 8.31 8.04
1. In National currency 1.97 2.72 3.25 3.83 4.43 4.84 3.69 2.67 2.74 2.75 3.66 5.15 5.77 5.30 5.57
1.1. Short-term loans -0.32 0.72 1.15 0.03 -0.09 -0.68 -1.67 -4.69 -3.71 -3.89 -3.60 -0.84 0.45 -0.59 -2.04
1.1.1. In National currency without a currency clause -1.67 0.71 1.26 0.75 0.96 0.69 -0.49 -4.05 -2.64 -2.01 -0.82 1.67 3.43 2.79 1.91
1.1.2. In National currency with a currency clause 5.43 0.77 0.69 -2.80 -4.16 -5.92 -6.20 -7.21 -7.92 -11.14 -14.28 -10.54 -11.47 -14.00 -18.14
1.2. Long-term loans 2.99 3.87 4.57 6.42 7.73 8.65 7.55 7.86 7.78 7.34 7.46 7.18 7.98 7.88 8.77
1.2.1. In National currency without a currency clause 18.85 21.36 22.48 25.43 24.46 25.74 22.54 22.82 21.65 19.29 18.27 14.89 15.69 13.95 15.59
1.2.2. In National currency with a currency clause -5.43 -5.42 -5.07 -4.06 -1.75 -1.21 -1.24 -0.90 -0.52 0.01 0.66 2.08 2.83 3.75 4.03
1.3. Accrued Interest -6.44 -4.81 -2.81 -1.08 -1.32 -0.61 0.26 -1.54 -1.73 -0.41 -0.50 9.41 11.44 11.83 8.62
1.4. Doubtful and contested claims 4.81 3.55 3.19 1.91 1.06 1.61 -0.54 -1.88 -3.99 -1.33 5.78 11.94 8.97 8.05 10.99
2. In foreign currency 23.92 23.03 24.61 21.26 21.78 20.85 25.39 25.17 25.90 26.48 24.16 18.51 18.48 17.16 15.18
2.1. Short-term loans 0.10 -0.11 -16.55 -17.63 -13.02 -9.17 0.74 -2.14 4.38 14.66 13.19 6.06 4.14 -0.25 10.12
2.2. Long-term loans 34.99 33.29 41.31 35.98 35.81 33.68 34.86 34.61 32.96 31.12 27.88 20.17 19.79 19.05 13.71
2.3. Accrued Interest 29.36 29.70 41.09 39.76 37.96 39.88 40.29 32.19 23.48 25.11 33.46 22.45 15.83 10.47 1.60
2.4. Doubtful and contested claims 1.75 3.71 2.85 3.84 0.60 -5.02 6.76 10.92 14.77 15.32 16.46 28.60 35.47 35.49 36.67
1) Revised data: Starting with Quarterly Report with Q1.2009 the data are revised in accordance with the new introduced methodology for the period from January 2003
2) Starting from January 2009 the data are compiled based on the New Banks' Chart of accounts
20122011

Table 11
Monetary aggregates and components thereof (non-government sector) 1,2
in milions of denars
2003 2004 2005 2006 2007
XII XII XII XII XII XII XII I II III IV V VI VII VIII IX X XI XII
1. Currency in circulation 14166 14150 14424 16187 17908 17601 16266 15525 15087 14844 15224 15505 15662 16728 16204 15945 16068 15585 16958
2. Demand Deposits 14099 14692 16251 19966 29348 36518 35957 34451 35658 35430 35355 37437 36865 35969 37393 37827 37701 38423 40404
3. (1+2) Money supply M1 28265 28842 30675 36153 47256 54119 52223 49976 50745 50274 50578 52942 52527 52697 53596 53772 53769 54008 57362
4. Short-term deposits 48986 61593 73802 94187 119697 124766 133761 136124 135063 136879 139799 141464 142646 138009 140246 141594 143320 146452 144217
4.1. in denars 15752 20722 24677 36742 55599 49584 45735 47145 46229 47695 49297 50090 51574 47799 49184 50072 51562 52980 51296
4.2. in foreign currency 33234 40871 49125 57445 64098 75182 88025 88979 88835 89184 90502 91374 91072 90211 91062 91522 91758 93472 92921
5. (3+4.1.) Money supply M2 - Denar 44017 49564 55352 72895 102855 103703 97958 97121 96974 97969 99876 103032 104101 100495 102781 103844 105331 106988 108658
6. (5+4.2.) Money supply M2 - total 77251 90435 104477 130340 166953 178885 185984 186100 185808 187153 190377 194406 195173 190706 193842 195366 197089 200460 201579
7. Long-term deposits 3903 4115 4247 5567 8830 16640 21279 22029 22463 23582 24612 25040 25186 25440 26123 26518 27380 28672 30989
7.1. in denars 2625 2417 2264 2559 4672 7990 8791 9260 9617 10231 10769 11123 11242 11460 11845 12127 12760 13621 15118
7.2. in foreign currency 1278 1698 1983 3008 4158 8650 12488 12769 12846 13351 13843 13918 13945 13979 14278 14391 14619 15051 15872
8. (6+7) Money supply M4 - total 81154 94550 108724 135907 175783 195525 207262 208129 208271 210735 214989 219446 220359 216146 219965 221884 224469 229132 232569
annual growth rate
1. Currency in circulation -0.11 1.94 12.22 10.63 -1.71 -7.59 -2.45 -1.65 1.35 3.14 7.35 10.22 9.34 9.74 10.30 10.03 7.71 4.26
2. Demand Deposits 4.21 10.61 22.86 46.99 24.43 -1.54 2.21 6.29 10.22 10.28 13.85 10.29 8.95 7.33 13.07 9.23 11.08 12.37
3. Money supply M1 2.04 6.35 17.86 30.71 14.52 -3.50 0.71 3.80 7.44 8.03 11.87 10.27 9.07 8.05 12.24 9.47 10.09 9.84
4. Short-term deposits 25.74 19.82 27.62 27.08 4.23 7.21 5.98 4.84 6.80 7.53 10.86 11.33 8.82 8.21 8.35 7.93 10.22 7.82
4.1. in denars 31.55 19.09 48.89 51.32 -10.82 -7.76 -6.54 -8.37 1.49 5.83 10.47 13.27 15.11 16.74 15.01 14.69 15.83 12.16
4.2. in foreign currency 22.98 20.20 16.94 11.58 17.29 17.08 14.07 13.34 9.87 8.48 11.07 10.26 5.76 4.10 5.02 4.47 7.28 5.56
5. Money supply M2 - denar 12.60 11.68 31.69 41.10 0.82 -5.54 -2.94 -2.38 4.46 6.93 11.18 11.74 11.86 12.04 13.56 11.96 12.85 10.92
6. Money supply M2 - total 17.07 15.53 24.75 28.09 7.15 3.97 4.51 4.55 6.97 7.66 11.13 11.04 8.89 8.17 9.39 8.35 10.19 8.39
7. Long-term deposits 5.43 3.21 31.08 58.61 88.45 27.88 50.74 49.17 52.95 57.25 57.41 55.60 54.56 58.36 54.75 51.79 46.92 45.63
7.1. in denars -7.92 -6.33 13.03 82.57 71.02 10.02 28.96 32.85 40.24 48.62 52.63 57.00 64.30 73.61 69.35 69.30 69.84 71.97
7.2. in foreign currency 32.86 16.78 51.69 38.23 108.03 44.37 71.78 64.28 64.36 64.70 61.45 54.49 47.39 47.60 44.27 39.22 30.92 27.09
8. Money supply M4 - total 16.51 14.99 25.00 29.34 11.23 6.00 8.02 8.04 10.69 11.69 14.99 14.80 12.82 12.40 13.36 12.27 13.74 12.21
1) Revised data: Starting with Quarterly Report with Q1.2009 the data are revised in accordance with the new introduced methodology for the period from January 2003
2) Starting from January 2009 the data are compiled based on the New Banks' Chart of accounts
2008 20102009

Monetary aggregates and components thereof (non-government sector) 1,2
in milions of denars
I II III IV V VI VII VIII IX X XI XII I II III
1. Currency in circulation 15814 16062 15944 16797 17281 17040 18086 17552 17185 16966 16627 19308 18201 18334 17860
2. Demand Deposits 38817 38060 38109 40376 40899 40976 39757 40449 40313 40562 39459 41993 41958 41461 41471
3. (1+2) Money supply M1 54631 54122 54053 57172 58180 58016 57843 58001 57498 57528 56086 61301 60159 59794 59331
4. Short-term deposits 145550 146838 147519 143712 145763 146532 151671 152807 151223 152365 154760 155399 157078 157236 157804
4.1. in denars 52544 53326 53281 50782 51460 51660 53018 53240 53698 54191 55419 58293 59907 60871 61518
4.2. in foreign currency 93006 93512 94238 92930 94303 94872 98654 99567 97526 98174 99341 97107 97171 96365 96287
5. (3+4.1.) Money supply M2 - Denar 107175 107447 107334 107954 109640 109676 110860 111241 111195 111718 111505 119593 120065 120665 120849
6. (5+4.2.) Money supply M2 - total 200181 200959 201572 200884 203944 204548 209514 210808 208721 209892 210846 216700 217236 217030 217136
7. Long-term deposits 31852 32495 33150 33531 34083 34869 35891 36149 36380 37377 38031 38338 38074 39132 40484
7.1. in denars 15777 16163 16549 16689 17063 17569 18401 18829 19264 19845 20497 21966 22773 24117 25006
7.2. in foreign currency 16074 16332 16601 16842 17020 17301 17490 17320 17115 17532 17534 16372 15300 15015 15478
8. (6+7) Money supply M4 - total 232033 233454 234722 234416 238026 239417 245406 246957 245101 247270 248877 255038 255310 256163 257620
annual growth rate
1. Currency in circulation 1.86 6.46 7.41 10.33 11.45 8.80 8.12 8.32 7.78 5.59 6.69 13.86 15.09 14.14 12.02
2. Demand Deposits 12.67 6.74 7.56 14.20 9.25 11.15 10.53 8.17 6.57 7.59 2.70 3.93 8.09 8.94 8.82
3. Money supply M1 9.31 6.65 7.52 13.04 9.89 10.45 9.77 8.22 6.93 6.99 3.85 6.87 10.12 10.48 9.77
4. Short-term deposits 6.92 8.72 7.77 2.80 3.04 2.72 9.90 8.96 6.80 6.31 5.67 7.75 7.92 7.08 6.97
4.1. in denars 11.45 15.35 11.71 3.01 2.74 0.17 10.92 8.25 7.24 5.10 4.60 13.64 14.01 14.15 15.46
4.2. in foreign currency 4.53 5.27 5.67 2.68 3.21 4.17 9.36 9.34 6.56 6.99 6.28 4.50 4.48 3.05 2.17
5. Money supply M2 - denar 10.35 10.80 9.56 8.09 6.41 5.36 10.31 8.23 7.08 6.06 4.22 10.06 12.03 12.30 12.59
6. Money supply M2 - total 7.57 8.15 7.70 5.52 4.91 4.80 9.86 8.75 6.84 6.50 5.18 7.50 8.52 8.00 7.72
7. Long-term deposits 44.59 44.66 40.57 36.24 36.11 38.45 41.08 38.38 37.19 36.52 32.64 23.72 19.53 20.43 22.12
7.1. in denars 70.38 68.07 61.76 54.98 53.40 56.28 60.57 58.96 58.85 55.52 50.48 45.30 44.35 49.21 51.10
7.2. in foreign currency 25.89 27.14 24.34 21.66 22.29 24.07 25.11 21.31 18.93 19.93 16.50 3.15 -4.82 -8.06 -6.76
8. Money supply M4 - total 11.49 12.09 11.38 9.04 8.47 8.65 13.54 12.27 10.46 10.16 8.62 9.66 10.03 9.73 9.76
1) Revised data: Starting with Quarterly Report with Q1.2009 the data are revised in accordance with the new introduced methodology for the period from January 2003
2) Starting from January 2009 the data are compiled based on the New Banks' Chart of accounts
2011 2012

Table 12
Claims of other depository corporations (banks and saving houses) 1,2
In millions of denars
I. NON-GOVERNMENT SECTOR
- Nonfinancial Corporations (public and private)
In d
enars
In f
ore
ign
curr
ency
Short
-term
Long-t
erm
In d
enars
In f
ore
ign
curr
ency
In d
enars
In f
ore
ign
curr
ency
In d
enars
In f
ore
ign
curr
ency
In d
enars
In f
ore
ign
curr
ency
2010 I 63659 31173 35100 59732 596 204 7318 3813 0 0 351 6
II 63838 31965 35486 60317 596 221 7331 3831 0 0 357 6
III 64418 32248 36317 60349 565 226 7152 3978 0 0 357 6
IV 64627 33277 37090 60815 572 210 7420 3900 0 0 357 6
V 64199 33603 37126 60676 572 228 7352 4350 0 0 355 6
VI 64377 34409 37112 61674 542 237 7107 4378 0 0 355 6
VII 64959 34134 37008 62085 560 232 7876 4028 0 0 353 6
VIII 64256 34910 37181 61985 559 256 8816 3898 0 0 351 6
IX 64591 35396 36867 63121 525 278 8625 3789 0 0 350 6
X 64702 35366 36802 63266 565 249 8610 3987 0 0 350 6
XI 64948 36313 36935 64326 565 252 7883 4012 0 0 351 6
XII 63994 39303 35705 67592 476 275 7388 3672 0 0 351 6
2011 I 63485 39205 35721 66969 522 275 7798 3733 0 0 355 6
II 64583 39575 36521 67637 523 291 7828 3820 0 0 356 6
III 65507 40447 35899 70055 528 323 7664 3927 0 0 356 6
IV 66620 40210 36184 70646 569 291 7822 3911 0 0 355 6
V 66683 41010 36532 71161 571 311 7867 4220 0 0 353 6
VI 67179 41821 36501 72499 520 327 7828 4123 0 0 352 6
VII 65850 42823 36643 72031 569 321 8357 4375 0 0 352 6
VIII 63771 43556 35208 72119 547 332 9224 4426 0 0 350 6
IX 64486 44301 35996 72791 501 336 8775 4492 0 0 348 6
X 64271 44528 36497 72303 556 304 9035 4738 0 0 348 6
XI 64664 44665 36695 72634 526 332 9303 4780 0 0 366 0
XII 64916 45484 36333 74067 478 332 8939 4914 0 0 365 0
2012 I 65489 45146 36667 73968 559 311 9073 5275 0 0 407 0
II 66225 45105 36618 74712 557 313 8840 5409 0 0 416 0
III 67350 45310 36149 76511 507 318 9021 5622 0 0 403 0
I. NON-GOVERNMENT SECTOR
- Households (Individuals and Self-Employed Individuals)
Period Loans
In d
enars
In f
ore
ign
curr
ency
Short
-term
Long-t
erm
In d
enars
In f
ore
ign
curr
ency
In d
enars
In f
ore
ign
curr
ency
Consu
mer
Auto
Lendin
g f
or
house
purc
hase
Cre
dit c
ard
s and
overd
raft
s
Oth
er
Self -
em
plo
yed
indiv
iduals
act
ivity
2010 I 61003 3329 17663 46669 1316 29 5636 436 22220 4045 14211 17403 2850 3603
II 60925 3318 17518 46725 1283 24 5673 425 22197 4028 14367 17246 2837 3568
III 61069 3363 17411 47021 1308 23 5736 436 22346 3983 14498 17177 2854 3574
IV 61363 3512 17426 47449 1317 21 5792 447 22585 3963 14678 17207 2919 3524
V 61618 3591 17541 47667 1348 21 6137 454 22806 3918 14770 17312 2942 3461
VI 62260 3599 17469 48390 1364 20 6169 589 23313 3897 14983 17257 2985 3424
VII 62230 3693 17215 48708 1380 21 6304 619 23634 3823 15104 17003 3008 3351
VIII 62535 3764 17315 48985 1410 21 6478 631 23845 3763 15217 17138 3061 3276
IX 62721 3845 17317 49249 1407 21 6586 641 24187 3716 15226 17150 3048 3238
X 63062 3977 17284 49755 1426 23 6576 631 24487 3664 15421 17120 3127 3220
XI 63430 4127 17208 50348 1405 23 6423 590 24759 3617 15642 17087 3235 3216
XII 63585 4460 16814 51231 1236 25 5631 588 25331 3579 15890 16719 3317 3210
2011 I 63456 4503 16938 51021 1267 27 5769 591 25203 3511 15888 16856 3338 3162
II 63622 4665 16827 51461 1265 26 5627 593 25527 3444 16029 16732 3430 3125
III 64219 4873 16939 52154 1292 28 5622 613 26071 3377 16199 16810 3536 3100
IV 64548 5139 16787 52900 1300 30 5636 603 26615 3322 16368 16663 3620 3100
V 65223 5285 16943 53565 1323 32 5762 613 27120 3260 16566 16826 3658 3080
VI 66122 5372 16984 54510 1374 32 5667 596 27725 3210 16892 16868 3730 3068
VII 66639 5477 16843 55272 1375 34 5751 586 28360 3151 17069 16721 3778 3036
VIII 67108 5522 16922 55708 1391 35 5781 597 28773 3076 17195 16833 3779 2974
IX 67302 5641 16824 56119 1397 35 5829 592 29256 2992 17304 16760 3788 2843
X 67581 5787 16970 56398 1425 36 5954 588 29457 2927 17409 16920 3796 2859
XI 68054 5883 16851 57087 1433 36 5834 580 29880 2856 17662 16826 3851 2863
XII 68059 5945 16345 57659 1393 36 5640 565 30743 2790 17904 16375 3339 2853
2012 I 67995 5929 16547 57377 1432 39 5722 582 30579 2722 17906 16604 3326 2787
II 67956 5952 16391 57517 1442 37 5710 571 30654 2642 18060 16448 3350 2752
III 68480 5977 16413 58044 1468 39 5741 583 31026 2574 18222 16529 3393 2713
By currency By purposes
Period
Loans Accrued interest
Overdue and doubtful and
contested claims based on
loans Securities
By currency
Loans Accrued interest
Overdue and doubtful and
contested claims based on
loans
By currency By maturity By currency
Shares
By currency By maturity By currency By currency By currency

Table 12
Claims of other depository corporations (banks and saving houses) 1,2
In millions of denars
I. NON-GOVERNMENT SECTOR
- Other
(Nonprofit institutions serving households, Other financial corporations, Local Government)
In
denars
In
fore
ign
curr
ency
Short
-
term
Long-
term
In
denars
In
fore
ign
curr
ency
In
denars
In
fore
ign
curr
ency
In
denars
In
fore
ign
curr
ency
In
denars
In
fore
ign
curr
ency
2010 I 130 57 58 129 2 0 1 0 0 493 4
II 122 57 58 122 2 0 1 0 0 493 4
III 142 56 59 139 1 0 1 0 0 493 4
IV 147 55 57 145 1 0 1 0 0 493 4
V 134 54 55 133 1 1 5 0 0 494 5
VI 147 54 29 171 1 1 5 0 0 505 5
VII 118 62 12 168 1 1 5 0 0 505 5
VIII 123 63 16 170 1 1 5 0 0 505 5
IX 116 60 18 159 1 1 5 0 0 505 4
X 127 58 28 157 1 1 5 0 0 505 4
XI 120 36 25 131 1 1 5 0 0 509 4
XII 141 35 45 130 1 1 4 0 0 601 4
2011 I 108 48 27 129 1 0 11 0 0 601 4
II 108 45 27 126 1 1 11 0 0 603 4
III 105 45 27 123 1 1 14 0 0 587 4
IV 142 44 68 118 1 1 7 0 0 0 587 4
V 183 41 74 150 2 1 7 0 0 0 594 4
VI 147 41 29 158 1 1 0 0 0 0 603 4
VII 176 39 38 176 1 1 0 0 4 0 615 4
VIII 207 37 37 208 2 0 6 0 4 0 614 4
IX 240 38 17 261 2 0 6 0 4 0 614 4
X 244 38 17 265 3 0 0 0 4 0 614 4
XI 262 35 16 280 2 0 0 0 4 0 593 4
XII 362 36 16 382 3 0 0 0 4 0 648 5
2012 I 360 38 15 384 4 0 0 0 4 0 681 4
II 439 39 81 397 2 0 0 0 4 0 681 4
III 454 39 106 386 4 0 0 0 4 0 684 4
II. GOVERNMENT
In
denars
In
fore
ign
curr
enc
y Short
-
term
Long-
term
In
denars
In
fore
ign
curr
enc
y In
denars
In
fore
ign
curr
enc
y In
denars
In
fore
ign
curr
enc
y In
denars
In
fore
ign
curr
enc
y
2010 I 87 18 13 92 1 0 8 0 13533 362 0 0
II 87 18 14 91 2 0 8 0 13701 361 0 0
III 90 17 17 90 3 0 8 0 12542 374 0 0
IV 86 17 14 89 1 0 8 0 12360 370 0 0
V 85 17 14 88 3 0 8 0 12303 357 0 0
VI 88 17 17 88 4 0 9 0 13756 360 0 0
VII 85 17 15 88 1 0 9 0 12266 353 0 0
VIII 85 12 12 85 4 0 9 0 13036 365 0 0
IX 83 11 10 85 6 0 9 0 13060 367 0 0
X 82 11 10 82 2 0 9 0 13845 381 0 0
XI 81 11 11 81 5 0 9 0 15390 381 0 0
XII 80 10 11 80 11 0 9 0 17554 377 0 0
2011 I 78 10 11 77 3 0 8 0 17385 379 0 0
II 75 9 8 76 9 0 8 0 17267 442 0 0
III 73 9 7 74 16 0 8 0 17181 446 0 0
IV 75 8 10 73 4 0 8 0 17044 450 0 0
V 74 7 12 69 14 0 8 0 15857 455 0 0
VI 72 5 11 67 24 0 8 0 15765 457 0 0
VII 66 4 7 63 32 0 8 0 15671 442 0 0
VIII 65 4 7 62 40 0 8 0 15886 435 0 0
IX 65 4 7 61 19 0 0 0 15316 437 0 0
X 64 4 8 59 35 0 0 0 15517 497 0 0
XI 62 4 8 58 45 0 0 0 16222 497 0 0
XII 62 3 8 56 56 0 0 0 16110 494 0 0
2012 I 58 3 7 54 38 0 3 0 16240 501 0 0
II 58 3 7 55 50 0 0 0 16562 513 0 0
III 57 3 8 52 66 0 0 0 16695 514 0 0
1) Revised data: Starting with Quarterly Report with Q1.2009 the data are revised in accordance with the new introduced methodology for the period from January 2003
2) Starting from January 2009 the data are compiled based on the New Banks' Chart of accounts
Period
Loans
Period
Loans Accrued interest
By currency By maturity By currency
By currency By maturity By currency
Accrued interest
By currency By currency By currency
By currency By currency
Shares
Shares
Overdue and doubtful and
contested claims based on Securities
By currency
Overdue and doubtful and
contested claims based on Securities

Table 13
Liabilities of other depository corporations (banks and saving houses) 1,2
in millions of denars
dem
and
deposi
ts
sight
deposi
ts
with m
atu
rity
up t
o 3
month
s
with m
atu
rity
over
3 m
onth
s
up t
o 1
year
with m
atu
rity
over
1 y
ear
rest
rict
ed
deposi
ts
sight
deposi
ts
with m
atu
rity
up t
o 1
year
with m
atu
rity
over
1 y
ear
rest
rict
ed
deposi
ts
In n
ational
curr
ency
In fore
ign
curr
ency
In n
ational
curr
ency
In fore
ign
curr
ency
I. NON-GOVERNMENT SECTOR - Non-Financial Corporations ( Public and Private Corporations)
2010 I 17374 254 7766 7260 1044 490 8134 8561 297 1108 0 0 26 3
II 18300 147 6280 6881 1039 479 7284 8630 273 1108 0 0 26 3
III 17411 231 8980 4544 1008 507 7468 8817 219 1228 0 0 26 2
IV 17217 154 8647 5486 960 526 9324 9487 231 958 0 0 26 2
V 18776 375 6760 7394 1001 534 10305 9080 221 1453 0 0 26 2
VI 18298 205 5980 8856 1003 512 9505 9277 206 1387 0 0 26 1
VII 18233 307 5235 5043 977 500 9643 8107 206 1926 0 0 26 1
VIII 20122 298 5567 5345 987 646 9356 8926 210 1528 0 0 26 1
IX 20377 257 5069 6463 998 646 10023 9022 202 1428 0 0 26 1
X 20388 303 4956 6993 1053 684 9175 9747 184 1673 0 0 26 0
XI 20962 284 4830 8044 1058 631 9193 10259 57 1970 0 0 26 0
XII 21180 276 3854 7510 1148 606 9885 9671 116 1288 0 0 26 0
2011 I 20545 248 4677 7680 1178 634 9584 9798 123 1393 0 0 26 0
II 19412 242 5108 7573 1174 454 9196 9747 141 1954 0 0 26 0
III 19568 106 6666 6468 1192 437 9666 10032 145 1383 0 0 26 0
IV 20387 401 5337 4888 1166 447 10019 7924 68 1489 0 0 26 0
V 21101 168 5584 5477 1226 410 9960 8163 69 1504 0 0 26 0
VI 21136 181 5283 5715 1367 540 9634 8042 78 2104 0 0 26 0
VII 19940 278 6064 6170 1684 478 12418 8903 92 1543 0 0 26 0
VIII 21047 197 5954 6279 1781 525 12075 9563 97 1483 0 0 26 0
IX 20906 137 4981 7472 1951 602 9707 9533 107 1180 0 0 25 0
X 21231 203 4659 7977 1744 631 10464 10130 278 1269 0 0 25 0
XI 19939 170 4312 9094 1922 638 11226 10260 284 1254 0 0 27 0
XII 20678 202 5388 8916 1686 504 10179 9412 110 957 0 0 25 0
2012 I 20750 164 5686 8907 1699 438 9831 9617 200 954 0 0 25 0
II 20244 190 6121 8469 1961 449 9286 9485 176 894 0 0 25 0
III 20629 273 7992 6944 1741 448 10302 8520 348 1265 0 0 25 0
2010 I 11943 2739 9010 13711 6374 318 19465 48340 12961 1509 0 0 10 0
II 12142 2685 9463 14259 6612 334 19686 48688 13048 1589 0 0 10 0
III 12725 2731 9820 14845 7118 338 19571 48434 13552 1557 0 0 12 0
IV 12804 2906 9969 15482 7520 355 19037 48425 14040 1556 0 0 11 0
V 13162 2828 10227 15880 7870 360 18776 48466 14148 1562 0 0 3 0
VI 12787 2894 10590 16553 8124 369 18906 48621 14202 1602 0 0 5 0
VII 13039 2748 10675 17011 8579 395 18643 48410 14246 1566 0 0 5 0
VIII 12514 2619 10709 17504 8931 414 18817 48985 14557 1567 0 0 5 0
IX 12597 2550 10707 17960 9220 430 18473 49202 14674 1554 0 0 6 0
X 12859 2706 10738 18521 9606 443 18141 49682 14964 1535 0 0 6 0
XI 13101 2624 10665 19105 10459 443 17996 50376 15517 1564 0 0 6 0
XII 14981 2582 10628 19415 11697 434 18072 50589 16224 1463 0 0 9 0
2011 I 13634 2603 10809 19610 12277 476 17935 51021 16382 1503 0 0 9 0
II 13960 2576 10920 20078 12593 493 17788 51495 16633 1565 0 0 9 0
III 13879 2545 10658 20150 12924 529 17934 51861 16927 1595 0 0 10 0
IV 15227 2780 10640 20126 13155 541 18006 51989 17248 1595 0 0 10 0
V 15184 2743 10597 20145 13418 558 18326 52816 17464 1575 0 0 10 0
VI 15174 2772 10592 20126 13772 581 18520 52994 17717 1581 0 0 5 0
VII 14964 2723 10456 20423 14159 536 18764 53389 17913 1582 0 0 5 0
VIII 14470 2635 10451 20890 14526 541 18540 54158 17758 1553 0 0 5 0IX 14725 2587 10475 21180 15051 515 18668 54758 17548 1516 0 0 6 0
X 14490 2717 10455 21433 15749 573 18154 54669 17726 1513 0 0 6 0
XI 14714 2703 10465 21807 16464 588 18344 54644 17682 1647 0 0 6 0
XII 16667 2689 11067 23388 17935 601 19002 54118 16607 1579 0 0 7 0
2012 I 16052 2714 11306 24829 18644 621 18808 54552 15422 1559 0 0 7 0
II 16307 2724 11644 25425 19654 594 18595 54690 15094 1520 0 0 7 0
III 15811 2763 11611 25702 20502 652 18344 54466 15409 1586 0 0 8 0
- Households (Individuals and Self-employed individuals)
Period
Deposits
Securities
Other credit
liabilitiesIn denars In foreign currency

Table 13
Liabilities of other depository corporations (banks and saving houses) 1,2
in millions of denars
dem
and
deposi
ts
sight
deposi
ts
with m
atu
rity
up t
o 3
month
s
with m
atu
rity
over
3 m
onth
s
up t
o 1
year
with m
atu
rity
over
1 y
ear
rest
rict
ed
deposi
ts
sight
deposi
ts
with m
atu
rity
up t
o 1
year
with m
atu
rity
over
1 y
ear
rest
rict
ed
deposi
ts
In n
ational
curr
ency
In fore
ign
curr
ency
In n
ational
curr
ency
In fore
ign
curr
ency
Period
Deposits
Securities
Other credit
liabilitiesIn denars In foreign currency
I. NON-GOVERNMENT SECTOR - Other (Non-Profit Institutions serving households, Other Financial Corporations, State and Local Government)
2010 I 1834 29 1753 3138 2452 65 486 698 174 13 0 0 380 0
II 1801 40 1784 3182 2590 69 479 707 176 11 0 0 383 1
III 1836 132 1550 3336 2724 62 786 715 176 11 0 0 361 0
IV 1850 59 1225 3796 2926 55 450 655 172 10 0 0 359 0
V 2038 48 1099 3893 2893 50 439 656 177 10 0 0 344 1
VI 2296 36 1038 3836 2766 54 476 648 176 10 0 0 328 0
VII 2427 8 1246 3953 2533 48 574 676 181 13 0 0 383 0
VIII 2562 14 1342 4014 2592 47 508 689 183 13 0 0 370 0
IX 2570 20 1287 3969 2562 62 483 655 185 13 0 0 351 0
X 2126 20 1313 4138 2786 59 427 679 157 13 0 0 355 0
XI 2029 19 1241 4335 2805 58 727 693 158 13 0 0 362 0
XII 1835 20 1098 4146 2938 61 626 687 160 13 0 0 401 2
2011 I 2162 5 1050 4095 2927 50 497 679 155 11 0 0 407 3
II 2194 40 1099 4079 3011 49 494 663 156 11 0 0 397 2
III 2104 59 1020 3920 3089 67 478 640 165 11 0 0 398 2
IV 2187 29 1185 3686 3022 68 601 661 161 11 0 0 405 0
V 1989 40 1157 3823 3099 76 618 652 164 14 0 0 440 0
VI 1998 42 1232 3841 3102 80 684 607 200 14 0 0 467 0
VII 2149 56 1121 3949 3250 71 673 652 200 14 0 0 522 0
VIII 2173 31 1106 3835 3247 70 790 653 204 14 0 0 569 0
IX 1869 34 1163 3754 3011 49 603 807 201 13 0 0 560 0
X 2104 33 918 3774 3120 50 606 596 287 13 0 0 568 0
XI 1983 34 1097 3679 2892 50 611 564 346 13 0 0 581 12
XII 1753 36 926 3762 3108 50 517 637 346 16 0 0 614 13
2012 I 2204 40 767 3655 3154 53 598 615 301 16 0 0 609 10
II 1845 41 868 3568 3234 46 615 669 340 16 0 0 640 10
III 1976 43 808 3483 3525 35 561 608 342 14 0 0 647 10
II. GOVERNMENT2010 I 1013 2 88 142 0 11 6 0 0 0 0 0 1920 868
II 888 52 38 142 0 2 7 0 0 0 0 0 1954 871
III 918 2 109 142 0 4 6 0 0 0 0 0 1971 814
IV 1051 2 109 142 0 3 6 0 0 0 0 0 1903 816
V 908 2 109 132 0 3 6 0 0 0 0 0 1935 789
VI 929 2 37 132 0 4 5 0 0 0 0 0 1970 752
VII 686 2 72 91 0 2 5 0 0 0 0 0 1035 746
VIII 661 2 71 91 0 2 7 0 0 0 0 0 1041 748
IX 905 2 72 91 0 2 5 0 0 0 0 0 1051 685
X 861 2 72 91 0 13 4 0 0 0 0 0 1019 685
XI 954 2 69 91 0 2 201 0 0 0 0 0 1028 658
XII 949 2 97 107 0 2 164 0 0 0 0 0 1038 635
2011 I 952 3 37 106 0 2 114 0 0 0 0 0 1007 630
II 928 3 38 167 0 2 107 0 0 0 0 0 1012 630
III 888 3 37 167 0 1 103 0 0 0 0 0 1023 575
IV 1001 2 2 167 0 1 95 0 0 0 0 0 943 576
V 979 3 4 102 0 1 97 0 0 0 0 0 951 549
VI 949 3 4 102 0 3 90 0 0 0 0 0 969 537
VII 940 3 3 101 0 5 81 0 0 0 0 0 930 531
VIII 1007 3 7 101 0 5 88 0 0 0 0 0 941 531
IX 1218 3 7 101 0 2 92 0 0 0 0 0 961 509
X 1405 3 40 101 0 1 87 0 0 0 0 0 930 510
XI 1359 3 40 110 0 1 90 0 0 0 0 0 939 482
XII 1064 3 60 110 0 1 84 0 0 0 0 0 950 468
2012 I 1091 3 56 110 0 1 87 0 0 0 0 0 922 462
II 1163 3 56 49 0 2 72 0 0 0 0 0 927 462
III 1160 3 56 49 0 1 68 0 0 0 0 0 948 452
1) Revised data: Starting with Quarterly Report with Q1.2009 the data are revised in accordance with the new introduced methodology for the period from January 2003
2) Starting from January 2009 the data are compiled based on the New Banks' Chart of accounts

Table 14
Report on weighted interest rates on deposits and borrowings 1,2
(in % on annual level)
2005 2006 2007 2008 2009 2010
XII XII XII XII XII I.10 II.10 III.10 IV.10 V.10 VI.10 VII.10 VIII.10 IX.10 X.10 XI.10 XII.10 I.10 II.10 III.10 IV.11 V.11 VI.11 VII.11 VIII.11 IX.11 X.11 XI.11 XII.11 I.12 II.12 III.12
LOANS INTEREST RATES (DENAR AND FOREIGN CURRENCY) 9.6 9.5 9.3 9.2 9.2 9.0 9.0 8.7 8.7 8.7 8.6 8.6 8.6 8.5 8.5 8.5 8.5 8.4 8.4 8.4 8.4 8.4 8.4 8.3 8.3 8.3 8.2 8.2
DEPOSITS INTEREST RATES (DENAR AND FOREIGN CURRENCY) 4.7 4.6 4.7 4.7 4.6 4.5 4.5 4.4 4.4 4.3 4.3 4.3 4.3 4.2 4.2 4.0 4.0 3.9 3.9 3.8 3.8 3.9 3.8 3.7 3.8 3.7 3.6 3.6
A. DENAR INTEREST RATES
1. INTEREST RATES ON DENAR CREDITS 12.1 10.7 9.9 9.8 10.3 10.2 10.0 9.8 9.8 9.6 9.6 9.2 9.2 9.2 9.1 9.1 9.0 9.0 9.0 8.9 8.9 8.9 8.8 8.9 8.8 8.8 8.8 8.8 8.8 8.7 8.7 8.6
1.1. Interest rates on credits without FX clause 12.6 10.9 10.2 10.5 11.5 11.5 11.5 11.3 11.3 11.0 10.9 10.3 10.2 10.2 10.1 10.1 10.0 9.8 9.7 9.7 9.6 9.6 9.6 9.6 9.6 9.5 9.6 9.5 9.5 9.4 9.4 9.3
Interest rates on short-term credits without FX clause 11.4 9.9 8.9 9.2 10.0 9.9 9.9 9.7 9.7 9.3 9.2 9.2 9.2 9.1 9.0 8.9 8.9 8.8 8.8 8.7 8.7 8.7 8.7 8.7 8.7 8.7 8.7 8.6 8.6 8.6 8.6 8.5
- on short-term credits on enterprises 10.7 9.5 8.6 9.0 9.9 9.8 9.8 9.7 9.6 9.2 9.2 9.2 9.1 9.1 8.9 8.9 8.9 8.8 8.8 8.7 8.7 8.7 8.7 8.7 8.7 8.7 8.7 8.6 8.6 8.6 8.6 8.5
- on short-term credits on households 19.4 16.9 13.4 13.5 14.3 14.4 14.6 14.0 14.0 13.7 13.4 11.7 11.7 11.7 11.7 11.5 11.2 10.8 10.6 10.5 10.3 10.1 10.0 10.1 10.1 10.0 9.7 10.0 9.9 9.7 9.7 9.6
Interest rates on long-term credits without FX clause 13.5 11.7 11.3 11.6 12.5 12.5 12.5 12.3 12.3 12.1 12.0 10.9 10.9 10.9 10.8 10.7 10.6 10.3 10.2 10.2 10.1 10.1 10.0 10.0 10.0 9.9 9.9 9.9 9.9 9.8 9.8 9.6
- on long-term credits on enterprises 10.0 8.4 8.4 8.8 9.8 9.7 9.7 9.5 9.5 9.1 9.1 9.0 9.0 9.0 8.8 8.8 8.7 8.8 8.7 8.7 8.6 8.6 8.5 8.6 8.6 8.5 8.6 8.6 8.6 8.5 8.5 8.3
- on long-term credits on households 15.3 14.3 13.3 13.4 14.6 14.5 14.5 14.3 14.3 14.1 13.9 12.1 12.1 12.1 12.0 12.0 11.9 11.3 11.3 11.2 11.2 11.1 11.1 11.1 11.0 10.9 10.9 10.9 10.8 10.8 10.8 10.7
1.2. Interest rates on credits with FX clause 11.1 10.3 9.5 9.1 9.3 9.2 8.9 8.7 8.7 8.5 8.5 8.3 8.3 8.3 8.3 8.2 8.2 8.3 8.3 8.3 8.2 8.2 8.2 8.2 8.2 8.2 8.2 8.1 8.1 8.1 8.0 8.0
Interest rates on short-term credits with FX clause 9.0 8.1 7.2 7.4 8.9 8.8 8.7 8.7 8.6 8.5 8.4 8.4 8.3 8.3 8.3 8.2 8.3 8.3 8.2 8.1 8.1 8.0 8.1 8.1 8.1 8.1 8.1 8.1 8.1 8.1 8.2 8.1
- on short-term credits on enterprises 9.1 8.3 7.2 7.4 8.9 8.9 8.7 8.7 8.6 8.5 8.4 8.4 8.3 8.3 8.3 8.2 8.3 8.3 8.3 8.1 8.1 8.1 8.1 8.1 8.1 8.1 8.1 8.1 8.1 8.1 8.2 8.1
- on short-term credits on households 8.1 7.0 7.1 7.3 8.2 8.2 7.7 7.8 7.7 7.8 7.8 7.5 7.8 7.9 7.8 7.7 7.4 7.6 7.8 7.6 7.3 7.1 7.2 7.2 7.2 7.3 7.6 7.7 7.5 7.3 7.2 7.1
Interest rates on long-term credits with FX clause 11.5 10.6 9.6 9.2 9.3 9.2 8.9 8.7 8.7 8.6 8.5 8.3 8.3 8.3 8.2 8.2 8.2 8.3 8.3 8.3 8.3 8.2 8.2 8.2 8.2 8.2 8.2 8.1 8.1 8.1 8.0 8.0
- on long-term credits on enterprises 11.0 10.4 9.3 9.0 9.7 9.5 9.5 9.4 9.4 9.2 9.2 9.1 9.1 9.1 9.0 9.0 8.9 8.9 8.8 8.8 8.8 8.7 8.7 8.7 8.6 8.6 8.6 8.5 8.5 8.5 8.4 8.4
- on long-term credits on households 11.9 10.8 9.8 9.4 9.0 8.9 8.4 8.0 8.0 8.0 7.9 7.6 7.5 7.6 7.5 7.5 7.5 7.9 7.9 7.9 7.8 7.8 7.8 7.8 7.8 7.8 7.8 7.8 7.8 7.8 7.7 7.7
2. INTEREST RATES ON DENAR DEPOSITS 5.6 4.4 5.3 6.5 7.5 7.3 7.5 7.5 7.4 7.1 7.0 7.1 7.0 6.8 6.7 6.7 6.7 6.4 6.3 6.0 6.0 6.0 5.9 5.8 5.8 5.8 5.7 5.6 5.6 5.5 5.3 5.2
2.1. Interest rates on Denar deposits without FX clause 5.7 4.5 5.6 6.8 8.4 8.0 8.0 8.0 7.9 7.6 7.5 7.3 7.2 7.1 7.0 7.0 7.0 6.7 6.6 6.2 6.1 6.1 6.0 5.9 5.9 6.0 5.9 5.8 5.8 5.7 5.4 5.4
Interest rates on Denar deposits without FX clause on enterprises 7.2 3.4 5.4 6.2 7.1 6.2 6.5 6.5 6.3 5.9 5.8 5.8 5.6 5.4 5.3 5.3 5.4 5.2 5.2 5.0 4.9 4.9 4.8 4.7 5.0 5.1 5.0 5.0 4.9 4.9 4.8 4.9
- on sight deposits 0.6 0.7 2.3 1.5 0.2 0.1 0.1 0.2 0.1 0.1 0.1 0.1 0.1 0.0 0.0 0.1 0.0 0.1 0.3 0.2 0.2 0.2 0.2 0.3 0.2 0.2 0.2 0.2 0.3 0.3 0.3 0.3
- on short-term deposits 7.3 3.4 5.4 6.0 7.0 6.0 6.2 6.2 6.1 5.6 5.5 5.6 5.4 5.2 5.0 5.0 5.1 4.9 4.9 4.7 4.6 4.7 4.4 4.3 4.5 4.6 4.6 4.5 4.6 4.6 4.4 4.5
- on long-term deposits 7.3 6.7 7.5 8.6 9.1 9.1 9.1 9.0 8.9 8.8 8.8 8.6 8.6 8.5 8.5 8.4 8.2 8.1 7.9 7.8 7.9 7.6 7.5 7.5 7.5 7.5 7.4 7.4 7.4 7.4 7.2 7.3
Interest rates on Denar deposits without FX clause on households 4.8 5.0 5.7 7.0 8.7 8.5 8.4 8.4 8.3 8.0 8.0 7.7 7.7 7.5 7.4 7.4 7.3 7.0 6.9 6.5 6.4 6.3 6.2 6.2 6.2 6.2 6.1 6.0 6.0 5.9 5.6 5.6
- on sight deposits 1.0 1.0 1.1 1.0 1.1 0.8 0.7 0.9 0.7 0.4 0.5 0.3 0.3 0.3 0.3 0.3 0.3 0.3 0.3 0.3 0.2 0.2 0.2 0.3 0.3 0.3 0.3 0.3 0.3 0.3 0.3 0.4
- on short-term deposits 7.0 6.7 6.9 7.9 9.1 8.9 8.7 8.6 8.4 8.0 8.0 7.6 7.6 7.3 7.3 7.3 7.1 6.7 6.6 6.1 5.9 5.9 5.8 5.6 5.6 5.7 5.6 5.4 5.3 5.3 4.9 4.9
- on long-term deposits 8.0 8.0 8.3 9.1 10.7 10.7 10.5 10.8 10.8 10.7 10.6 10.2 10.1 10.1 9.9 9.7 9.6 9.3 9.2 8.8 8.8 8.7 8.6 8.5 8.5 8.4 8.3 8.2 8.1 7.9 7.6 7.6
2.2. Interest rates on Denar credits with FX clause 4.4 3.4 3.9 5.0 3.6 3.1 3.9 3.7 3.8 3.6 3.2 2.6 2.6 2.5 2.5 2.4 2.6 2.6 2.5 2.4 3.1 2.8 2.8 2.9 2.8 2.7 2.7 2.6 2.6 2.6 2.6 2.2
Interest rates on Denar deposits with FX clause on enterprises 4.4 3.3 3.9 5.0 3.5 3.0 3.8 3.7 3.8 3.6 3.2 2.6 2.6 2.5 2.5 2.4 2.6 2.5 2.5 2.4 3.1 2.8 2.8 2.9 2.8 2.7 2.7 2.6 2.6 2.6 2.6 2.2
- on short-term deposits 4.5 3.2 3.9 5.0 3.5 3.0 3.8 3.7 3.8 3.5 3.1 2.4 2.5 2.4 2.4 2.4 2.5 2.5 2.4 2.3 2.9 2.6 2.6 2.8 2.8 2.7 2.6 2.5 2.5 2.5 2.5 2.1
- on long-term deposits 3.7 5.8 4.0 4.3 7.1 7.1 7.1 7.1 7.1 6.9 6.9 6.9 6.9 6.9 6.9 7.0 7.6 7.6 7.6 7.6 7.6 7.6 7.6 7.6 7.6 7.6 7.6 7.8 7.8 7.8 7.8 7.8
Interest rates on Denar deposits with FX clause on households 8.8 8.3 9.2 7.6 7.6 7.6 9.6 9.6 9.6 9.6 9.6 9.8 9.8 9.8 9.8 9.8 9.8 9.8 4.3 4.6 6.3 6.3 6.8 6.3 6.3 6.3 6.3 6.3 6.1 6.1 6.1
- on short-term deposits 8.8 8.3 8.9 7.5 7.5 7.5 5.3 5.3 5.3 5.3 5.3 5.4 5.3 5.3 5.3 5.3 5.3 5.3 4.3 4.6 6.3 6.3 6.8 6.3 6.3 6.3 6.3 6.3 6.1 6.1 6.1
- on long-term deposits 8.0 9.9 9.7 9.7 9.7 9.7 9.7 9.7 9.7 9.7 10.0 10.0 10.0 10.0 10.0 10.0 10.0
2011 2012

Report on weighted interest rates on deposits and borrowings 1,2
(in % on annual level)
2005 2006 2007 2008 2009 2010
XII XII XII XII XII I.10 II.10 III.10 IV.10 V.10 VI.10 VII.10 VIII.10 IX.10 X.10 XI.10 XII.10 I.10 II.10 III.10 IV.11 V.11 VI.11 VII.11 VIII.11 IX.11 X.11 XI.11 XII.11 I.12 II.12 III.12
2011 2012
B. FOREIGN CURRENCY INTEREST RATES
1. INTEREST RATES ON FOREIGN CURRENCY CREDITS 7.8 8.5 8.5 7.2 7.6 7.5 7.3 7.3 7.3 7.3 7.3 7.4 7.4 7.4 7.4 7.4 7.4 7.4 7.4 7.4 7.4 7.4 7.4 7.5 7.4 7.4 7.4 7.4 7.3 7.2 7.2 7.1
1.1. Interest rates on foreign currency short-term credits 8.1 8.4 8.1 6.2 7.4 7.4 7.4 7.4 7.4 7.4 7.4 7.5 7.4 7.4 7.5 7.4 7.4 7.4 7.5 7.6 7.6 7.5 7.4 7.5 7.5 7.5 7.4 7.4 7.2 7.1 7.2 7.2
Interest rates on foreign currency short-term credits on enterprises 8.0 8.4 8.0 6.2 7.4 7.4 7.4 7.4 7.4 7.4 7.4 7.5 7.4 7.4 7.5 7.4 7.4 7.4 7.5 7.6 7.6 7.5 7.4 7.5 7.5 7.5 7.4 7.3 7.2 7.1 7.2 7.2
- in Euros 8.1 8.4 8.1 6.8 7.7 7.7 7.8 7.8 7.8 7.7 7.7 7.7 7.6 7.6 7.7 7.6 7.6 7.6 7.6 7.7 7.7 7.5 7.4 7.5 7.5 7.5 7.4 7.4 7.3 7.2 7.2 7.2
- in USA Dollars 7.4 8.0 6.8 3.1 6.0 6.0 5.9 5.9 5.9 5.9 5.9 6.0 6.0 5.9 5.9 5.9 5.9 5.9 6.7 7.0 7.0 6.6 6.6 6.9 6.9 6.9 6.1 6.0 6.0 6.3 6.3 6.2
Interest rates on foreign currency short-term credits on households 16.2 13.3 12.4 12.8 9.6 9.6 9.2 9.1 9.1 8.8 9.1 8.8 8.8 8.3 8.3 8.3 8.7 8.8 8.7 8.7 8.7 8.7 8.8 8.6 8.4 8.5 8.6 8.6 8.6 8.7 8.7 8.5
- in Euros 16.2 13.3 12.4 12.8 10.0 9.6 9.2 9.1 9.1 8.8 9.1 8.8 8.8 8.3 8.3 8.3 8.7 8.8 8.7 8.7 8.7 8.7 8.8 8.6 8.4 8.5 8.6 8.6 8.6 8.7 8.7 8.5
- in USA Dollars 3.0 2.0
1.2. Interest rates on foreign currency long-term credits 7.8 8.5 8.7 7.5 7.6 7.5 7.2 7.3 7.3 7.3 7.3 7.3 7.3 7.3 7.4 7.4 7.4 7.4 7.4 7.4 7.4 7.4 7.4 7.5 7.4 7.4 7.4 7.4 7.3 7.2 7.2 7.1
Interest rates on foreign currency long-term credits on enterprises 7.6 8.4 8.7 7.3 7.3 7.2 7.1 7.2 7.2 7.2 7.2 7.2 7.2 7.2 7.3 7.3 7.3 7.3 7.3 7.3 7.3 7.2 7.3 7.4 7.3 7.3 7.3 7.3 7.2 7.1 7.0 7.0
- in Euros 7.6 8.5 8.7 7.4 7.3 7.2 7.1 7.2 7.2 7.2 7.2 7.2 7.2 7.2 7.3 7.3 7.3 7.3 7.3 7.3 7.3 7.3 7.3 7.4 7.4 7.3 7.3 7.3 7.3 7.2 7.1 7.0
- in USA Dollars 6.9 7.6 7.1 3.7 6.5 6.5 6.4 6.5 6.5 6.7 6.6 6.6 6.6 6.5 6.5 6.5 6.4 6.4 6.1 5.5 5.5 5.5 5.5 7.0 6.4 6.4 6.2 6.3 6.3 6.5 6.5 6.5
Interest rates on foreign currency long-term credits on households 10.4 9.2 8.6 8.5 10.2 9.7 8.1 8.1 8.1 8.1 8.1 8.1 8.1 8.1 8.1 8.1 8.1 8.1 8.1 8.1 8.0 8.0 8.0 8.0 8.0 8.0 7.9 7.9 7.9 7.9 7.9 7.9
- in Euros 10.4 9.2 8.6 8.5 10.2 9.7 8.1 8.1 8.1 8.1 8.1 8.1 8.1 8.1 8.1 8.1 8.1 8.1 8.1 8.1 8.1 8.0 8.0 8.0 8.0 8.0 8.0 7.9 7.9 7.9 7.9 7.9
- in USA Dollars 4.2 4.1 4.7 3.0 2.8 2.8 3.9 2.8 2.8 2.7 2.7 2.8 2.8 2.9 2.8 2.8 2.8 2.8 2.5 2.4 2.4 2.4 2.4 2.5 2.4 2.4 2.4 2.4 2.7 2.3 2.7 2.7
2. INTEREST RATES ON FOREIGN CURRENCY DEPOSITS 1.4 1.8 2.0 3.0 3.4 3.3 3.3 3.2 3.2 3.1 3.1 3.0 3.0 3.0 3.0 3.0 3.0 2.9 2.9 2.8 2.8 2.8 2.8 2.7 2.7 2.7 2.7 2.6 2.5 2.5 2.3 2.3
2.1. Interest rates on foreign currency deposits on enterprises 1.7 2.1 2.3 2.7 2.2 2.0 2.1 2.0 1.9 1.7 1.6 1.7 1.7 1.6 1.6 1.6 1.6 1.6 1.6 1.4 1.3 1.3 1.3 1.2 1.2 1.4 1.4 1.3 1.3 1.3 1.3 1.2
- on sight deposits 0.5 0.6 0.6 0.7 0.4 0.4 0.4 0.3 0.3 0.3 0.3 0.3 0.3 0.2 0.2 0.2 0.2 0.2 0.2 0.2 0.2 0.2 0.2 0.2 0.2 0.2 0.2 0.2 0.2 0.1 0.1 0.1
- in Euros 0.5 0.6 0.6 0.7 0.4 0.4 0.3 0.3 0.3 0.3 0.3 0.3 0.3 0.2 0.2 0.2 0.2 0.2 0.2 0.2 0.2 0.2 0.2 0.2 0.2 0.2 0.2 0.2 0.2 0.1 0.1 0.1
- in USA Dollars 0.5 0.6 0.6 0.3 0.4 0.4 0.5 0.4 0.5 0.5 0.5 0.4 0.4 0.3 0.3 0.3 0.2 0.2 0.2 0.2 0.2 0.2 0.2 0.2 0.2 0.2 0.2 0.2 0.2 0.2 0.1 0.1
- on short-term deposits 2.5 3.2 3.6 4.2 3.6 3.5 3.5 3.4 3.5 3.1 2.9 3.2 3.1 3.1 2.8 2.7 2.9 2.9 2.9 2.5 2.7 2.6 2.7 2.6 2.6 2.6 2.6 2.5 2.5 2.4 2.4 2.5
- in Euros 2.1 2.8 3.6 4.3 3.6 3.5 3.5 3.4 3.5 3.1 2.9 3.2 3.2 3.1 2.8 2.7 2.9 2.9 2.9 2.5 2.7 2.6 2.7 2.6 2.6 2.6 2.6 2.5 2.5 2.4 2.4 2.5
- in USA Dollars 3.3 4.3 3.8 3.1 2.4 2.4 2.3 1.9 1.7 2.5 2.3 2.5 2.3 2.5 2.5 2.5 2.2 2.1 2.1 2.1 1.3 1.3 1.3 1.3 1.3 1.7 1.7 1.7 1.7 1.7 1.3 1.3
- on long-term deposits 3.0 2.7 2.5 5.0 5.0 5.0 5.0 5.0 5.0 5.0 4.9 4.9 4.9 4.9 5.1 2.7 2.7 2.7 2.7 3.9 3.9 3.2 3.4 3.4 3.3 2.7 4.4 3.1 4.1 2.7 4.3
- in Euros 3.0 2.7 2.5 5.0 5.0 5.0 5.0 5.0 5.0 5.0 4.9 4.9 4.9 4.9 5.1 2.7 2.7 2.7 2.7 3.9 3.9 3.2 3.4 3.4 3.3 2.7 4.4 3.1 4.1 2.7 4.3
- in USA Dollars 2.5 1.7 1.3 1.3
2.2. Interest rates on foreign currency deposits on households 1.3 1.7 1.9 3.1 3.6 3.6 3.6 3.5 3.5 3.4 3.4 3.4 3.3 3.3 3.3 3.4 3.4 3.3 3.2 3.1 3.1 3.1 3.1 3.0 3.0 3.0 3.0 2.9 2.8 2.7 2.5 2.5
- on sight deposits 0.6 0.8 0.8 0.8 0.7 0.7 0.6 0.4 0.4 0.3 0.3 0.3 0.3 0.2 0.2 0.2 0.2 0.2 0.2 0.2 0.2 0.2 0.2 0.2 0.2 0.2 0.2 0.2 0.2 0.2 0.2 0.2
- in Euros 0.7 0.8 0.8 0.8 0.8 0.7 0.6 0.5 0.4 0.3 0.3 0.3 0.3 0.2 0.2 0.2 0.2 0.2 0.2 0.2 0.2 0.2 0.2 0.2 0.2 0.2 0.2 0.2 0.2 0.2 0.2 0.2
- in USA Dolars 0.5 0.6 0.6 0.5 0.4 0.4 0.4 0.2 0.2 0.2 0.2 0.2 0.2 0.2 0.2 0.2 0.2 0.2 0.2 0.2 0.2 0.2 0.2 0.2 0.2 0.2 0.1 0.1 0.1 0.1 0.1 0.1
- on short-term time deposits 1.8 2.3 2.6 3.9 4.3 4.3 4.2 4.1 4.1 4.0 4.1 3.9 3.8 3.8 3.9 3.9 3.8 3.7 3.7 3.5 3.5 3.4 3.4 3.4 3.3 3.3 3.3 3.2 3.1 3.1 2.9 2.9
- in Euros 1.8 2.3 2.6 4.1 4.5 4.5 4.4 4.3 4.3 4.2 4.3 4.1 4.0 4.0 4.0 4.0 4.0 3.8 3.8 3.6 3.6 3.6 3.6 3.5 3.5 3.5 3.4 3.3 3.3 3.2 3.1 3.0
- in USA Dollars 1.7 2.3 2.4 2.3 2.2 2.2 2.2 2.1 2.1 2.1 2.0 2.0 2.0 2.0 2.0 2.0 2.0 2.0 2.0 2.0 2.0 2.0 2.0 1.9 1.8 1.8 1.8 1.8 1.8 1.7 1.0 0.9
- on long-term time deposits 2.9 3.7 3.7 4.8 5.5 5.5 5.5 5.4 5.4 5.5 5.4 5.3 5.3 5.3 5.3 5.3 5.2 5.2 5.1 4.9 4.9 4.9 4.8 4.8 4.8 4.7 4.8 4.7 4.6 4.5 4.2 4.1
- in Euros 2.9 3.8 3.9 4.9 5.5 5.5 5.5 5.5 5.5 5.6 5.5 5.4 5.4 5.4 5.4 5.3 5.3 5.2 5.1 5.0 5.0 4.9 4.9 4.9 4.9 4.8 4.8 4.8 4.6 4.5 4.2 4.2
- in USA Dollars 2.5 3.1 3.0 2.8 3.6 3.6 3.7 3.7 3.1 3.6 3.6 3.6 3.1 3.2 3.2 3.2 3.1 3.1 3.1 3.0 3.0 2.9 2.8 2.8 2.8 2.9 2.9 2.9 2.8 1.8 1.0 1.0
1) Revised data: Starting with Quarterly Report with Q1.2009 the data are revised in accordance with the new introduced methodology for the period from January 2003
2) Starting from January 2009 the data are compiled based on the New Banks' Chart of accounts

Table 15
Interest rates of the National bank of the Republic of Macedonia
(in %)
2003.XII 6.5 14.0 6.22004.XII 6.5 13.0 10.02005.XII 6.5 13.0 8.52006.XII 6.5 9.5 5.72007.XII 6.5 7.5 4.772008.XII 6.5 8.5 7.002009.XII 6.5 9.0 10.0 8.50
2010.I 6.5 8.5 9.5 8.00
II 8.5 9.0 7.61
III 8.5 9.0 7.26
IV 8.5 8.0 6.50
V 8.5 7.5 6.24
VI 8.5 6.5 5.46
VII 5.0 6.5 5.00
VIII 5.0 6.0 4.68
IX 5.0 6.0 4.50
X 5.0 6.0 4.50
XI 5.0 6.0 4.50
XII 5.0 5.5 4.11
2011.I 4.0 5.5 4.00
II 4.0 5.5 4.00
III 4.0 5.5 4.00
IV 4.0 5.5 4.00
V 4.0 5.5 4.00
VI 4.0 5.5 4.00
VII 4.0 5.5 4.50 4.00
VIII 4.0 5.5 4.00
IX 4.0 5.5 4.50 4.00
X 4.0 5.5 4.00
XI 4.0 5.5 4.00
XII 4.0 5.5 4.00
2012.I 4.0 5.5 4.00
II 4.0 5.5 4.00
III 4.0 5.5 4.00* 28 days
Period Discount rate
Reference
rate for
calculating
the penalty
interest rate
Lending interest rates -
creating liquidity
Deposit interest rates -
withdrawing liquidity
Over night
credits-Lombard
credit
Auction repo-
transactions
CB bills - basic maturity*
volume
tender
interest rate
tender

Table 16
Reserve requirements of banks and saving houses*
in millions of denars
Lia
bili
ties
in
dom
est
ic
curr
ency
(%
)
Lia
bili
ties
in
dom
est
ic
curr
ency
with
FX c
lause
Lia
bili
tiy in
fore
ign
curr
ency
Perc
enta
ge o
f
the a
mount
calc
ula
ted
from
lia
bili
ties
in fore
ign
curr
ency
**
Rese
rve
requirem
ent
Avera
ge
fulfill
ment
Exce
ss /
Short
age
Fulfill
ment
in
perc
ents
(%
)
Renum
era
tion
rate
(%
)
Rese
rve
requirem
ent
Renum
era
tion
rate
(%
)
Rese
rve
requirem
ent
rate
(%
)
Rese
rve
requirem
ent
Renum
era
tion
rate
(%
)
2003.XII 7.5 7.5 0.00 2,488 3,467 980 139.4 4.0 2,763 1.0 2.5 7 4.02004.XII 7.5 7.5 0.00 2,855 3,309 454 115.9 2.0 3,374 1.0 2.5 8 2.02005.XII 10.0 10.0 0.00 4,242 5,267 1,025 124.2 2.0 5,325 0.0 2.5 11 2.02006.XII 10.0 10.0 0.00 5,618 6,705 1,087 119.3 2.0 6,373 0.0 2.5 14 2.02007.XII 10.0 10.0 0.00 8,436 9,125 689 108.2 2.0 7,288 0.0 2.5 17 2.02008.XII 10.0 10.0 0.00 10,125 10,762 637 106.3 2.0 9,802 0.0 2.5 18 2.02009.XII 10.0 20 13.0 23.00 13,874 14,253 379 102.7 2.0 12,225 0.1 2.5 14 2.0
2010.I 10.0 20.0 13.0 23.00 14,097 14,549 452 103.2 2.0 12,151 0.1 2.5 14 2.0II 10.0 20.0 13.0 23.00 14,212 14,606 394 102.8 2.0 12,144 0.1 2.5 14 2.0
III 10.0 20.0 13.0 23.00 13,914 14,217 302 102.2 2.0 12,237 0.1 2.5 14 2.0IV 10.0 20.0 13.0 23.00 14,164 14,348 184 101.3 2.0 12,459 0.1 2.5 14 2.0V 10.0 20.0 13.0 23.00 14,439 14,559 120 100.8 2.0 12,418 0.1 2.5 14 2.0
VI 10.0 20.0 13.0 23.00 14,843 15,152 309 102.8 2.0 12,693 0.1 2.5 14 2.0VII 10.0 20.0 13.0 23.00 15,034 15,415 381 102.5 2.0 12,696 0.1 2.5 14 2.0
VIII 10.0 20.0 13.0 23.00 14,518 15,035 517 103.6 2.0 12,876 0.1 2.5 14 2.0
IX 10.0 20.0 13.0 23.00 14,420 14,887 467 103.2 2.0 13,030 0.1 2.5 15 2.0X 10.0 20.0 13.0 23.00 14,572 14,919 347 102.4 2.0 12,942 0.1 2.5 15 2.0
XI 10.0 20.0 13.0 23.00 14,878 15,072 194 101.3 2.0 12,938 0.1 2.5 16 2.0XII 10.0 20.0 13.0 23.00 15,284 15,595 311 102.0 2.0 13,170 0.1 2.5 17 2.0
2011.I 10.0 20.0 13.0 23.00 15,484 15,785 301 101.9 2.0 13,395 0.1 2.5 17 2.0II 10.0 20.0 13.0 23.00 15,637 15,915 278 101.8 2.0 13,489 0.1 2.5 17 2.0
III 10.0 20.0 13.0 23.00 15,703 16,040 337 102.2 2.0 13,517 0.1 2.5 17 2.0
IV 10.00 20.00 13.00 23.00 15,770 16,291 521 103.3 2.0 13,656 0.1 2.5 18 2.0
V 10.00 20.00 13.00 23.00 15,923 16,226 302 101.9 2.0 13,768 0.1 2.5 18 2.0
VI 10.00 20.00 13.00 23.00 15,689 15,863 174 101.1 2.0 13,906 0.1 2.5 18 2.0
VII 10.00 20.00 13.00 23.00 15,896 16,111 216 101.4 2.0 14,019 0.1 2.5 18 2.0
VIII 10.00 20.00 13.00 23.00 15,959 16,182 223 101.4 2.0 14,066 0.1 2.5 18 2.0
IX 10.00 20.00 13.00 23.00 16,146 16,616 470 102.9 2.0 14,189 0.1 2.5 18 2.0
X 10.00 20.00 13.00 23.00 16,381 16,624 244 101.5 2.0 14,210 0.1 2.5 18 2.0
XI 10.00 20.00 13.00 23.00 16,505 16,692 187 101.1 2.0 14,030 0.1 2.5 18 2.0
XII 10.00 20.00 13.00 23.00 16,575 17,141 566 103.4 2.0 14,132 0.1 2.5 18 2.0
2012.I 10.00 20.00 13.00 23.00 16,622 16,922 300 101.8 1.0 13,504 0.1 2.5 18 1.0
II 10.00 20.00 13.00 23.00 17,002 17,226 224 101.3 1.0 13,319 0.1 2.5 18 1.0
III 10.00 20.00 13.00 23.00 17,019 17,290 271 101.6 1.0 13,021 0.1 2.5 18 1.0* Banks fulfill reserve requirement in Denars on averaging provision, while bank's reserve requirement in Euro and savings houses' reserve requirement in Denars is held on fixed basis.
** Percentage of amount calculated from liabilities in foreign currency, which is fulfilled in Denars. The remaining amount is reserve requirement fulfilled in Euro.
***Before July 11, 2009 the reserve requirement ratio on liabilities in domestic currency with FX clause was equal to the reserve requirement ratio on liabilities in domestic currency.
Period
Banks'reserve requirments ratio
(in%)
Reserve requirements of banks in Denar Reserve requirements of
banks in foreign
currency
Reserve requirements of
saving houses in Denar

Table 17
(in%)
2004.XII 9.2 10.42005.XII 8.0 8.8 9.62006.XII 6.3 7.0 8.92007.XII 4.82008.XII 7.48 7.84 7.002009.XII 5.30
2010.I 5.20II 5.00
III 4.99IV 4.99V 4.99
VI 4.99VII 4.70
VIII 5.00 4.70IX 4.70 4.40X 4.70 4.40
XI 4.50 4.50 4.30XII 4.46 4.30
2011.I 4.30 4.15II 4.20 4.10
III 4.20 4.30 4.10 4.10
IV 4.30 4.10 4.10
V 4.20 4.10 4.10
VI 4.20 4.10 4.10
VII 4.20 4.10 4.10
VIII 4.20 4.10 4.10
IX 4.20 4.10 4.10
X 4.20 4.10 4.10
XI 4.20 4.10 4.10
XII 4.20 5.70 4.10 5.50
2012.I 4.20 4.10 4.10
II 4.20 4.10 4.10
III 4.20 5.70 4.10 4.10 5.50
5 years3 years
Interest rates on government securities
DENARS DENARS (with foreign clause)
Period 1 months 3 months 6 months 12 months 2 years 3 years 1 months 3 months 6 months 12 months 2 years5 years

Table 18
Republic of Macedonia: balance of payments
Summary / 1
In USD Million
1993 1994 1995 1996 1997 1998 1999 2000 2001 2002 2003 2004 2005 2006 2007 2008 2009 2010 2011
I. Current Account -82.5 -262.9 -298.9 -339.8 -286.5 -280.1 -65.6 -103.1 -235.4 -378.8 -185.5 -451.6 -159.3 -28.5 -605.7 -1235.8 -609.6 -200.0 -273.5
GOODS, net 42.8 -184.9 -222.8 -314.7 -386.3 -515.6 -495.9 -690.8 -526.7 -805.6 -851.0 -1139.0 -1063.0 -1260.5 -1638.5 -2589.9 -2168.8 -1945.6 -2330.4
Exports, f.o.b. 1055.3 1086.3 1204.0 1147.4 1236.8 1291.5 1190.0 1320.7 1155.4 1112.1 1362.7 1674.9 2040.6 2410.7 3391.5 3983.3 2702.3 3295.6 4428.9
Imports, f.o.b. /2 -1012.5 -1271.3 -1426.8 -1462.1 -1623.1 -1807.1 -1685.9 -2011.6 -1682.2 -1917.7 -2213.7 -2813.8 -3103.6 -3671.2 -5030.0 -6573.2 -4871.0 -5241.2 -6759.2
SERVICES, net -154.5 -155.1 -200.5 -156.2 -137.8 -59.8 38.9 48.7 -19.2 -22.1 -10.4 -57.1 -39.3 22.3 38.7 15.9 24.1 64.4 136.3
Inflow 84.0 172.0 185.2 154.3 138.1 149.3 272.8 316.7 244.6 253.1 381.2 453.4 516.6 603.5 822.3 1017.3 861.6 917.1 1113.9
Outflow -238.5 -327.1 -385.7 -310.4 -275.8 -209.1 -234.0 -268.0 -263.8 -275.3 -391.6 -510.4 -555.9 -581.2 -783.6 -1001.4 -837.5 -852.7 -977.6
INCOME, net -56.7 -46.6 -39.6 -51.3 -54.4 -53.5 -72.1 -70.0 -27.2 -45.5 -60.0 -35.3 -109.2 -27.5 -389.3 -119.8 -66.9 -123.7 -152.9
Inflow 4.3 10.0 20.8 22.8 17.5 23.6 24.2 41.6 52.6 50.8 60.3 84.6 97.1 134.7 213.1 272.7 178.1 194.8 240.5
Outflow -61.0 -56.6 -60.4 -74.2 -71.9 -77.1 -96.4 -111.7 -79.8 -96.3 -120.3 -119.9 -206.3 -162.2 -602.4 -392.5 -245.0 -318.5 -393.3
CURRENT TRANSFERS, net 85.8 123.7 163.9 182.3 292.0 348.9 463.6 609.0 337.8 494.4 735.9 779.7 1052.2 1237.1 1383.4 1458.0 1602.0 1804.9 2073.4
Inflow 115.0 197.0 293.5 341.3 433.3 376.5 507.2 635.5 372.4 535.2 773.8 824.5 1094.9 1279.2 1480.9 1528.0 1668.4 1867.0 2140.3
Outflow -29.2 -73.3 -129.5 -158.9 -141.3 -27.6 -43.6 -26.5 -34.6 -40.8 -37.9 -44.8 -42.7 -42.1 -97.5 -70.0 -66.4 -62.2 -67.0
II. Capital and Financial Account -12.9 162.3 280.6 318.2 349.6 296.3 -91.4 40.2 236.6 388.0 218.3 434.1 165.5 24.6 657.6 1266.7 569.2 175.9 286.0
CAPITAL ACCOUNT, net 0.0 30.0 1.7 0.0 0.0 -1.8 0.0 0.3 1.4 8.3 -6.7 -4.6 -2.0 -1.1 4.9 -17.6 28.6 17.0 28.5
FINANCIAL ACCOUNT, net -12.9 132.3 278.9 318.2 349.6 298.1 -91.4 39.9 235.2 379.7 225.0 438.7 167.5 25.7 652.7 1284.2 540.5 158.8 257.5
Direct investment, net 0.0 24.0 9.5 11.2 58.0 150.5 88.1 215.7 446.3 105.5 117.5 321.9 94.2 424.0 700.2 600.5 185.5 205.6 407.8
Inward direct investment 0.0 24.0 9.5 11.2 58.1 150.5 88.4 215.1 447.1 105.6 117.8 323.0 97.0 424.2 699.1 587.0 197.1 207.5 410.0
Outward direct investment 0.0 0.0 0.0 0.0 -0.1 0.0 -0.3 0.6 -0.9 -0.1 -0.3 -1.2 -2.8 -0.2 1.1 13.5 -11.6 -1.9 -2.2
Portfolio investment, net 0.0 0.0 2.7 0.3 1.3 -0.2 0.1 -0.9 3.5 1.2 5.7 11.5 238.6 92.4 155.2 -72.5 147.2 -78.4 -58.0
Assets 0.0 0.0 1.4 -0.5 1.7 0.2 0.1 -0.8 3.2 1.2 0.3 -0.9 0.8 -0.5 -2.8 -1.1 -51.3 -29.0 -10.7
Liabilities 0.0 0.0 1.3 0.8 -0.4 -0.4 0.0 -0.1 0.4 0.1 5.3 12.4 237.8 92.8 157.9 -71.4 198.5 -49.4 -47.3
Other investment, net 44.0 150.2 367.4 300.8 294.1 201.1 -36.3 89.6 -137.6 133.4 152.8 124.8 249.7 -116.4 -69.4 676.2 355.1 108.7 351.8
Assets 32.0 34.7 39.9 77.7 -66.1 -58.9 -184.1 -63.0 -112.2 226.8 18.2 8.5 -47.0 -148.6 -80.9 297.7 -144.6 -206.3 -575.5
Liabilities 12.0 115.5 327.5 223.1 360.3 260.0 147.8 152.6 -25.4 -93.4 134.7 116.3 296.8 32.2 11.4 378.4 499.7 315.0 927.3
Gross official reserves (- = increase) /3 -56.8 -41.9 -100.6 5.9 -3.8 -53.3 -143.3 -264.5 -77.0 139.7 -51.0 -19.5 -415.1 -374.2 -133.2 80.0 -147.3 -77.1 -444.1
III. Errors and Omissions 95.4 100.6 18.3 21.6 -63.2 -16.2 157.0 62.9 -1.2 -9.2 -32.8 17.6 -6.2 4.0 -51.8 -30.9 40.4 24.1 -12.5
Source: National Bank of the Republic of Macedonia
1/ Preliminary data.
a. Revision of data has been done in September 2011 in the following categories:
- for 2010 data: direct investment, income and other investment, due to inclusion of data from the annual FDI Survey DI 22 and improved coverage of credit indebtedness data and introducing of accrual interest;
- services and current transfers for 2010- as a result of improved coverage of data
- goods, services and trade credits data for 2009 due to the final data on foreign trade for 2009.
- calculation of Financial Services Indirectly Measured (FISIM) has been introduced within the BoP, starting from 2003
- securities within the reserve asstes are presented without price changes, starting from 2006.
2/ Imports data are on fob basis in accordance with IMF V Balance of Payments Manual
Calculation of cif / fob factor as % of imports cif equals: 1993-20%, 1994-20%. 1995-20%,1996-14%,1997-10%,1998-5,02%,1999-4,86%, 2000-3,9%, 2001-4,2%, 2002-3,8% 2003-4,06%, 2004 , 2005, 2006, 2007-4,14%, 2008, 2009 and 2010-3,86%
Imports for 2006, 2007 and 2008 have been additionally adjusted with time adjustments for imports of electricity.3/ For the period 2006-2010 excluding price changes and exchange rate differences. Excluding monetary gold and exchange rate differences up to 2005.

Table 19
Republic of Macedonia: balance of payments
Summary / 1, 4
In EUR Million
2012
2003 2004 2005 2006 2007 2008 2009 2010 1 2 3 4 5 6 7 8 9 10 11 12 Q1 Q2 Q3 Q4 2011 1 2 3 Q1
I. Current Account -169.8 -361.8 -122.5 -23.4 -421.2 -862.2 -457.1 -150.4 -92.7 -73.3 -34.3 -41.6 -0.1 -17.7 -7.0 26.5 27.2 25.6 -59.1 45.5 -200.3 -59.4 46.7 12.0 -201.1 -42.8 -26.0 -47.2 -116.0
GOODS, net -753.0 -914.3 -858.5 -1001.5 -1181.0 -1762.5 -1559.6 -1467.8 -193.3 -142.2 -126.0 -149.1 -102.8 -122.8 -158.9 -132.6 -111.8 -100.0 -177.4 -164.9 -461.5 -374.6 -403.3 -442.2 -1681.7 -145.4 -107.9 -157.4 -410.8
Exports, f.o.b. 1203.2 1345.0 1642.9 1914.0 2472.2 2692.6 1932.6 2492.8 222.2 238.6 251.6 276.1 285.2 256.1 234.1 278.6 312.3 281.6 265.7 276.7 712.4 817.5 825.0 823.9 3178.9 208.9 233.4 263.9 706.2
Imports, f.o.b. /2 -1956.2 -2259.3 -2501.4 -2915.5 -3653.2 -4455.1 -3492.2 -3960.7 -415.5 -380.9 -377.6 -425.2 -388.0 -378.9 -392.9 -411.3 -424.1 -381.5 -443.1 -441.5 -1174.0 -1192.1 -1228.3 -1266.1 -4860.5 -354.3 -341.4 -421.4 -1117.0
SERVICES, net -9.4 -45.6 -29.2 17.4 28.3 9.3 16.5 49.4 14.1 -5.8 11.0 4.6 9.7 9.3 12.6 15.6 9.3 7.3 0.3 9.3 19.3 23.7 37.6 16.9 97.4 -4.8 -7.6 2.2 -10.2
Inflow 336.1 364.4 417.1 479.1 597.3 692.0 617.6 693.8 60.2 49.7 67.5 62.2 66.6 66.3 73.0 76.7 70.4 67.0 63.4 77.0 177.3 195.1 220.1 207.4 799.9 56.0 52.3 62.3 170.6
Outflow -345.5 -410.0 -446.3 -461.7 -569.1 -682.8 -601.1 -644.3 -46.0 -55.5 -56.5 -57.6 -56.8 -57.0 -60.4 -61.1 -61.1 -59.7 -63.1 -67.7 -158.0 -171.4 -182.6 -190.5 -702.5 -60.8 -59.9 -60.1 -180.8
INCOME, net -53.5 -30.1 -88.1 -21.2 -280.8 -94.4 -47.3 -99.1 -9.5 -8.1 -6.6 -9.6 -9.8 -8.4 -10.7 -7.8 -9.2 -9.5 -8.3 -12.2 -24.1 -27.8 -27.7 -29.9 -109.5 -6.2 -7.8 -11.6 -25.6
Inflow 53.2 67.9 78.6 107.1 155.2 185.2 128.0 146.6 15.4 12.8 15.7 14.2 14.0 14.6 13.1 15.5 14.2 14.1 15.4 13.6 44.0 42.8 42.8 43.1 172.7 18.3 16.5 14.6 49.4
Outflow -106.7 -98.0 -166.7 -128.3 -436.0 -279.6 -175.3 -245.7 -24.9 -20.9 -22.3 -23.8 -23.7 -23.0 -23.9 -23.3 -23.3 -23.6 -23.6 -25.8 -68.1 -70.5 -70.5 -73.0 -282.2 -24.6 -24.3 -26.2 -75.0
CURRENT TRANSFERS, net 646.1 628.2 853.3 981.9 1012.4 985.5 1133.3 1367.2 95.9 82.7 87.4 112.4 102.7 104.2 149.9 151.2 138.9 127.7 126.4 213.2 266.0 319.3 440.1 467.3 1492.6 113.6 97.4 119.7 330.7
Inflow 679.5 664.2 887.5 1015.3 1081.3 1033.2 1181.0 1414.0 99.3 86.1 91.3 116.1 106.7 108.4 153.8 155.4 142.6 131.7 130.8 218.6 276.7 331.3 451.8 481.0 1540.8 117.6 101.0 124.1 342.7
Outflow -33.4 -36.0 -34.2 -33.4 -68.9 -47.7 -47.7 -46.9 -3.3 -3.4 -3.9 -3.7 -4.0 -4.3 -3.9 -4.1 -3.7 -4.1 -4.4 -5.3 -10.7 -12.0 -11.7 -13.8 -48.1 -3.9 -3.7 -4.4 -12.0
II. Capital and Financial Account 193.9 347.1 127.7 19.6 461.1 886.2 430.0 130.9 96.6 76.5 51.4 51.4 2.9 14.1 -1.0 -29.5 -40.4 -25.4 56.9 -44.9 224.5 68.4 -70.9 -13.4 208.5 40.6 26.3 37.0 103.9
CAPITAL ACCOUNT, net -5.8 -3.8 -1.7 -0.8 3.7 -12.2 20.2 12.9 7.8 0.9 0.8 1.2 1.4 0.9 3.1 0.5 0.3 0.4 0.9 2.7 9.4 3.4 3.9 4.0 20.9 0.1 2.3 0.7 3.0
FINANCIAL ACCOUNT, net 199.7 350.9 129.4 20.4 457.4 898.4 409.8 118.0 88.8 75.6 50.6 50.2 1.5 13.2 -4.2 -30.0 -40.7 -25.9 56.0 -47.6 215.0 64.9 -74.8 -17.5 187.6 40.5 24.0 36.3 100.9
Direct investment, net 100.1 259.7 74.9 344.7 506.9 409.4 136.9 157.6 46.6 61.2 93.8 -22.9 -17.5 -22.0 21.6 28.4 -13.4 29.3 74.9 21.8 201.6 -62.4 36.6 126.0 301.9 28.3 29.3 6.0 63.6
Inward direct investment 100.4 260.7 77.2 344.8 506.0 399.9 145.0 159.1 -0.3 -0.2 0.2 0.0 0.3 0.0 0.0 -0.1 -0.9 -0.4 -0.1 -0.1 -0.3 0.3 -1.0 -0.6 -1.6 -0.5 0.0 -0.1 -0.6
Outward direct investment -0.3 -0.9 -2.3 -0.1 0.9 9.5 -8.1 -1.4 46.9 61.4 93.6 -22.9 -17.8 -22.0 21.6 28.4 -12.4 29.6 75.1 21.9 202.0 -62.7 37.6 126.6 303.5 28.8 29.3 6.1 64.2
Portfolio investment, net 5.1 8.6 200.8 72.7 114.1 -50.6 104.0 -61.7 0.2 -2.2 -1.2 0.2 0.8 -5.5 -14.8 -2.8 1.0 -6.5 -3.7 -7.5 -3.2 -4.6 -16.6 -17.7 -42.0 0.2 2.1 0.9 3.1
Assets 0.3 -0.8 0.7 -0.4 -2.0 -0.5 -37.6 -21.9 -1.3 -3.0 -2.3 -2.7 0.0 -2.6 0.6 0.4 0.0 3.1 0.0 0.2 -6.6 -5.3 1.1 3.3 -7.6 -0.2 -0.9 -1.5 -2.6
Liabilities 4.8 9.3 200.1 73.1 116.1 -50.1 141.7 -39.7 1.6 0.8 1.1 2.9 0.7 -2.9 -15.4 -3.2 1.0 -9.6 -3.7 -7.7 3.5 0.8 -17.7 -20.9 -34.4 0.3 3.0 2.4 5.7
Other investment, net 133.1 98.5 201.6 -100.7 -68.9 464.4 245.8 83.7 60.4 3.1 162.4 59.7 6.4 1.9 -52.1 -48.5 -20.3 -52.8 -30.5 169.4 226.0 67.9 -121.0 86.2 259.1 -9.1 -6.8 56.5 40.6
Assets 14.1 7.3 -39.8 -117.6 -61.5 207.4 -107.0 -159.7 28.3 -8.7 -25.1 -74.3 -60.4 -16.8 -180.2 32.7 99.5 -211.9 -25.6 40.6 -5.4 -151.5 -48.0 -197.0 -401.9 -72.1 25.0 -32.0 -79.1
Liabilities 119.1 91.2 241.4 17.0 -7.5 256.9 352.8 243.4 32.1 11.7 187.5 134.0 66.7 18.7 128.2 -81.3 -119.8 159.2 -4.8 128.9 231.4 219.4 -72.9 283.2 661.0 63.0 -31.8 88.5 119.7
Gross official reserves (- = increase) /3 -38.6 -15.9 -347.9 -296.4 -94.7 75.3 -76.9 -61.7 -18.4 13.5 -204.5 13.3 11.9 38.8 41.1 -7.0 -7.9 4.1 15.2 -231.4 -209.4 64.0 26.1 -212.0 -331.3 21.2 -0.5 -27.1 -6.5
III. Errors and Omissions -24.1 14.7 -5.3 3.8 -39.9 -24.0 27.1 19.5 -3.9 -3.1 -17.1 -9.8 -2.8 3.6 8.1 3.0 13.2 -0.2 2.2 -0.6 -24.1 -9.0 24.2 1.4 -7.4 2.2 -0.3 10.2 12.1
Source: National Bank of the Republic of Macedonia
1/ Preliminary data.
a. Revision of data has been done in September 2011 in the following categories:
- for 2010 data: direct investment, income and other investment, due to inclusion of data from the annual FDI Survey DI 22 and improved coverage of credit indebtedness data and introducing of accrual interest;
- services and current transfers for 2010- as a result of improved coverage of data
- goods, services and trade credits data for 2009 due to the final data on foreign trade for 2009.
- calculation of Financial Services Indirectly Measured (FISIM) has been introduced within the BoP, starting from 2003
- securities within the reserve asstes are presented without price changes, starting from 2006.
2/ Imports data are on fob basis in accordance with IMF V Balance of Payments Manual
Calculation of cif / fob factor as % of imports cif equals: 1993-20%, 1994-20%. 1995-20%,1996-14%,1997-10%,1998-5,02%,1999-4,86%, 2000-3,9%, 2001-4,2%, 2002-3,8% 2003-4,06%, 2004 , 2005, 2006, 2007-4,14%, 2008,
2009, 2010 and 2011-3,86%. Imports for 2006, 2007 and 2008 have been additionally adjusted with time adjustments for imports of electricity.3/ For the period 2006-2011 excluding price changes and exchange rate differences. Excluding monetary gold and exchange rate differences up to 2005.
4/ Methodological notes: Calculation of Financial Services Indirectly Measured (FISIM) has been introduced starting January 2011. Liabilities under PCL with the IMF are classified under Financial Account-Other Investment-Liabilities-Loans-General Government-Long Term-Drawings.

Table 20
Republic of Macedonia: balance of payments - servicesIn EUR Million
Period 2003 2004 2005 2006 2007 2008 2009 2010 Q1 Q2 Q3 Q4 2011 1 2 3 Q1. 2012
Services, net -9.4 -45.6 -29.2 17.4 28.3 9.3 16.5 49.4 19.3 23.7 37.6 16.9 97.4 -4.8 -7.6 2.2 -10.2
- Credit 336.1 364.4 417.1 479.1 597.3 692.0 617.6 693.8 177.3 195.1 220.1 207.4 799.9 56.0 52.3 62.3 170.6
- Debit -345.5 -410.0 -446.3 -461.7 -569.1 -682.8 -601.1 -644.3 -158.0 -171.4 -182.6 -190.5 -702.5 -60.8 -59.9 -60.1 -180.8
1. Transportation -32.8 -52.8 -45.3 -33.9 -43.3 -47.6 -38.4 -20.4 0.8 -5.6 2.9 -1.4 -3.4 -1.3 -6.7 -4.8 -12.8
- Credit 110.9 115.2 129.3 148.1 183.9 222.8 180.4 218.0 62.1 68.5 70.2 73.0 273.8 19.1 18.4 21.0 58.6
- Debit -143.7 -168.0 -174.6 -182.0 -227.2 -270.4 -218.8 -238.4 -61.3 -74.1 -67.2 -74.5 -277.1 -20.5 -25.1 -25.8 -71.4
2. Travel 7.6 14.0 22.4 46.3 61.0 62.7 84.0 79.7 18.0 17.4 37.2 18.6 91.2 7.3 4.5 3.8 15.6
- Credit 49.9 57.9 72.3 102.4 134.9 155.2 156.2 149.6 31.8 38.1 64.2 37.2 171.2 12.8 9.3 10.0 32.1
- Debit -42.3 -43.9 -49.9 -56.2 -73.9 -92.4 -72.2 -69.9 -13.8 -20.7 -26.9 -18.6 -80.1 -5.5 -4.8 -6.3 -16.5
3. Other services 15.7 -6.7 -6.3 5.0 10.5 -5.8 -29.1 -9.8 0.6 11.9 -2.6 -0.3 9.6 -10.8 -5.3 3.1 -13.0
- Credit 175.3 191.4 215.4 228.5 278.6 314.1 280.9 326.2 83.5 88.5 85.8 97.1 354.9 24.0 24.7 31.2 79.8
- Debit -159.6 -198.1 -221.8 -223.5 -268.0 -319.9 -310.0 -336.0 -82.9 -76.6 -88.4 -97.4 -345.3 -34.8 -30.0 -28.0 -92.9
3.1. Communications services 31.1 21.8 19.6 26.5 27.8 21.9 19.6 23.0 9.7 10.8 10.0 6.5 37.0 1.9 2.0 4.1 7.9
- Credit 48.7 38.6 36.2 48.5 50.9 54.6 61.9 60.0 14.9 13.7 18.1 19.7 66.4 3.9 4.4 6.1 14.4
- Debit -17.6 -16.8 -16.6 -22.0 -23.1 -32.7 -42.3 -37.0 -5.3 -2.8 -8.1 -13.1 -29.4 -2.0 -2.4 -2.0 -6.5
Postal and courier services 0.7 0.7 0.7 0.4 0.4 0.6 0.4 -0.2 -0.1 -0.2 -0.2 -0.2 -0.7 -0.1 0.1 -0.1 -0.1
- Credit 1.1 0.9 0.8 1.1 1.1 1.1 1.4 1.3 0.4 0.4 0.4 0.3 1.5 0.1 0.3 0.1 0.4
- Debit -0.3 -0.2 -0.2 -0.6 -0.7 -0.5 -0.9 -1.5 -0.5 -0.5 -0.5 -0.5 -2.1 -0.2 -0.2 -0.1 -0.5
Telecommunications services 30.3 21.2 19.0 26.0 27.3 21.3 19.2 23.2 9.8 11.0 10.2 6.7 37.7 2.0 1.9 4.1 8.0
- Credit 47.6 37.7 35.4 47.4 49.8 53.5 60.5 58.6 14.5 13.3 17.7 19.3 64.9 3.8 4.1 6.0 13.9
- Debit -17.3 -16.5 -16.4 -21.4 -22.5 -32.2 -41.3 -35.4 -4.8 -2.3 -7.6 -12.6 -27.2 -1.8 -2.3 -1.9 -5.9
3.2. Construction services 32.9 43.0 40.6 36.0 53.2 34.3 22.4 6.6 -0.3 0.8 2.5 3.6 6.5 -2.4 0.7 2.6 1.0
- Credit 36.5 45.4 47.8 38.3 54.9 43.3 31.8 13.8 2.6 3.1 3.8 4.4 13.9 0.6 0.8 2.7 4.0
- Debit -3.6 -2.4 -7.2 -2.3 -1.7 -8.9 -9.4 -7.2 -2.9 -2.3 -1.3 -0.8 -7.4 -2.9 0.0 0.0 -3.0
Construction abroad 36.5 45.4 47.7 29.2 34.1 29.1 29.4 12.5 2.4 2.5 3.2 4.2 12.3 0.6 0.7 2.5 3.7
- Credit 36.5 45.4 47.7 29.2 34.1 29.1 29.4 12.5 2.4 2.5 3.2 4.2 12.3 0.6 0.7 2.5 3.7
- Debit 0.0 0.0 0.0 0.0 0.0 0.0 0.0 0.0 0.0 0.0 0.0 0.0 0.0 0.0 0.0 0.0 0.0
Construction in the compiling -3.6 -2.4 -7.1 6.8 19.1 5.2 -7.0 -6.0 -2.7 -1.7 -0.7 -0.6 -5.8 -2.9 0.0 0.1 -2.8
economy
- Credit 0.0 0.0 0.1 9.1 20.8 14.1 2.4 1.3 0.2 0.6 0.6 0.2 1.6 0.0 0.1 0.2 0.2
- Debit -3.6 -2.4 -7.2 -2.3 -1.7 -8.9 -9.4 -7.2 -2.9 -2.3 -1.3 -0.8 -7.4 -2.9 0.0 0.0 -3.0
3.3. Insurance services -7.5 -7.1 -9.1 -11.8 -11.9 -12.1 -8.9 -15.3 -1.8 -2.7 -3.5 -2.7 -10.7 -0.9 -1.0 -0.5 -2.3
- Credit 2.0 3.7 3.9 4.7 4.2 5.3 6.2 5.1 2.6 2.0 1.2 2.0 7.8 0.4 0.7 0.8 1.9
- Debit -9.5 -10.9 -13.1 -16.5 -16.1 -17.4 -15.2 -20.5 -4.4 -4.7 -4.7 -4.7 -18.4 -1.2 -1.7 -1.3 -4.2
3.4. Financial services -3.3 -2.3 -5.4 -3.3 4.6 2.4 -13.1 -13.5 -2.4 -2.7 -2.3 -3.0 -10.4 -0.9 -0.7 -0.9 -2.5
- Credit 3.3 3.2 3.7 5.9 9.2 7.5 2.2 2.7 0.8 0.4 0.8 0.6 2.5 0.2 0.2 0.3 0.7
- Debit -6.6 -5.6 -9.1 -9.2 -4.6 -5.1 -15.3 -16.1 -3.2 -3.1 -3.1 -3.6 -13.0 -1.1 -0.9 -1.1 -3.1
3.5. Computer and information services -7.5 -9.6 -6.2 -13.3 -6.4 -8.4 -14.4 -3.8 -3.6 2.9 1.9 2.6 3.7 2.3 -1.7 0.8 1.4
- Credit 4.0 7.1 13.5 18.6 24.0 34.3 26.4 37.3 9.2 10.3 9.9 11.1 40.5 4.4 3.4 4.2 12.0
- Debit -11.5 -16.7 -19.7 -31.9 -30.4 -42.7 -40.8 -41.1 -12.9 -7.4 -8.0 -8.5 -36.8 -2.1 -5.1 -3.4 -10.6
3.6. Royalties and license fees -4.1 -5.0 -5.8 -4.7 -10.5 -13.3 -10.2 -8.1 -3.4 -1.9 -3.4 -1.9 -10.6 -0.9 -3.2 -1.4 -5.5
- Credit 2.0 2.5 2.5 2.1 3.4 3.9 4.5 5.2 0.8 1.6 1.1 3.6 7.1 0.3 0.4 0.4 1.1
- Debit -6.2 -7.5 -8.3 -6.9 -13.9 -17.2 -14.6 -13.4 -4.2 -3.5 -4.5 -5.5 -17.7 -1.2 -3.5 -1.8 -6.6
3.7. Other business services -28.0 -49.9 -44.2 -19.7 -36.9 -18.7 -10.9 18.6 7.1 8.5 -4.0 -1.3 10.2 -7.3 0.9 0.7 -5.7
- Credit 56.9 66.0 80.7 86.7 106.2 139.3 121.4 175.3 45.9 50.3 43.0 48.7 187.9 13.1 13.5 14.7 41.3
- Debit -84.9 -115.9 -125.0 -106.4 -143.2 -158.1 -132.3 -156.6 -38.8 -41.8 -46.9 -50.1 -177.7 -20.4 -12.6 -13.9 -46.9
3.7.1. Merchanting and other 7.9 6.8 15.1 12.4 1.9 16.3 7.4 50.6 17.1 18.2 12.0 10.4 57.7 3.4 2.1 4.3 9.8
trade-related services
- Credit 12.9 13.8 22.5 17.8 17.7 29.2 20.6 61.1 19.2 20.9 14.5 12.4 67.1 3.7 3.0 5.6 12.2
- Debit -4.9 -6.9 -7.4 -5.5 -15.8 -12.8 -13.2 -10.5 -2.1 -2.7 -2.5 -2.0 -9.3 -0.2 -0.9 -1.3 -2.4
3.7.2. Operational leasing services 0.1 -0.3 -1.2 -2.6 -5.8 -3.8 -0.7 -0.6 -0.3 -0.3 -0.9 -0.4 -1.9 0.0 -0.1 -0.1 -0.1
- Credit 1.1 0.8 1.7 1.0 0.7 1.4 1.3 1.5 0.4 0.3 0.3 0.3 1.2 0.1 0.1 0.1 0.3
- Debit -1.0 -1.2 -2.9 -3.6 -6.5 -5.2 -1.9 -2.2 -0.7 -0.6 -1.2 -0.7 -3.2 0.0 -0.2 -0.2 -0.4
3.7.3. Miscellaneous business, professional, -36.1 -56.4 -58.2 -29.5 -33.1 -31.3 -17.7 -31.3 -9.8 -9.4 -15.1 -11.3 -45.6 -10.7 -1.1 -3.5 -15.4
and technical services
- Credit 42.9 51.4 56.5 67.9 87.8 108.8 99.5 112.7 26.3 29.1 28.1 36.1 119.6 9.4 10.4 9.0 28.8
- Debit -79.0 -107.8 -114.6 -97.4 -120.9 -140.1 -117.2 -144.0 -36.0 -38.5 -43.3 -47.4 -165.2 -20.1 -11.5 -12.5 -44.1
3.7.3.1. Legal, accounting, management -15.7 -17.2 -17.3 -15.3 -15.5 -30.5 -16.5 -20.5 -7.5 -6.2 -7.4 -11.6 -32.7 -13.0 -2.4 -2.6 -18.1
consulting, and public relations
- Credit 4.2 6.8 11.2 16.2 16.7 22.9 23.4 28.0 6.7 7.8 7.6 9.0 31.0 2.7 2.9 2.6 8.2
- Debit -19.8 -24.0 -28.5 -31.5 -32.2 -53.4 -39.9 -48.5 -14.2 -14.0 -14.9 -20.6 -63.8 -15.7 -5.3 -5.3 -26.3
3.7.3.2. Advertising, market research, -1.0 -3.3 -2.5 2.3 -0.3 -1.5 9.0 0.0 0.5 -1.3 -1.5 -0.5 -2.8 1.4 0.2 0.8 2.4
and public opinion polling
- Credit 9.5 10.8 12.3 15.7 19.3 23.6 22.3 22.6 5.4 4.9 6.0 6.9 23.2 2.9 1.9 2.5 7.3
- Debit -10.5 -14.1 -14.8 -13.4 -19.5 -25.0 -13.3 -22.7 -4.9 -6.2 -7.5 -7.5 -26.1 -1.5 -1.7 -1.7 -4.9
3.7.3.3. Research and development -8.2 -5.8 -2.2 -4.9 -7.5 -3.1 -9.5 -2.6 0.1 0.3 -0.6 0.0 -0.2 0.1 -0.5 0.0 -0.4
- Credit 4.9 4.5 4.6 2.6 3.6 4.1 4.1 3.8 1.0 1.2 1.0 1.3 4.5 0.2 0.3 0.3 0.8
- Debit -13.1 -10.3 -6.7 -7.5 -11.0 -7.2 -13.7 -6.4 -0.9 -0.9 -1.7 -1.3 -4.7 -0.2 -0.8 -0.2 -1.2
3.7.3.4. Architectural, engineering, -5.3 -5.2 -17.9 -4.6 0.3 4.3 -8.6 -17.0 -5.4 -2.3 -6.8 -3.5 -18.1 0.0 -0.5 -3.1 -3.7
and other technical services
- Credit 11.7 15.8 14.1 18.3 28.2 38.6 28.4 36.2 6.9 9.4 8.3 10.6 35.2 2.1 2.5 1.4 6.0
- Debit -17.0 -21.0 -32.0 -23.0 -27.9 -34.3 -36.9 -53.2 -12.2 -11.8 -15.1 -14.2 -53.3 -2.2 -3.0 -4.5 -9.7
3.7.3.5. Agricultural, mining, and 0.0 0.0 -0.1 -0.3 -0.4 -0.2 0.7 -0.6 -0.4 -0.4 -0.2 0.0 -0.9 0.0 0.0 0.0 -0.1
on-site processing services
- Credit 0.1 0.3 0.0 0.0 0.0 0.0 0.8 0.2 0.0 0.0 0.1 0.1 0.1 0.0 0.0 0.0 0.0
- Debit -0.1 -0.3 -0.2 -0.3 -0.4 -0.3 -0.1 -0.8 -0.4 -0.4 -0.2 -0.1 -1.0 0.0 0.0 0.0 -0.1
3.7.3.6. Other business services -5.9 -25.0 -18.2 -6.7 -9.8 -0.3 7.2 9.4 2.8 0.6 1.4 4.3 9.1 0.9 2.1 1.5 4.5
- Credit 12.5 13.2 14.2 15.0 20.0 19.6 20.5 21.9 6.2 5.9 5.2 8.1 25.5 1.5 2.8 2.2 6.5
- Debit -18.4 -38.2 -32.4 -21.7 -29.8 -19.9 -13.3 -12.4 -3.5 -5.2 -3.8 -3.8 -16.3 -0.6 -0.7 -0.7 -2.1
3.8. Personal and cultural services -1.1 1.3 0.7 1.8 4.9 1.1 -1.6 -0.8 -0.5 -0.3 0.9 0.9 1.0 -0.4 -0.6 -0.2 -1.1
- Credit 3.8 5.6 5.7 8.0 12.0 12.4 14.2 15.9 4.1 4.2 5.7 5.7 19.7 0.9 1.0 1.8 3.6
- Debit -4.9 -4.3 -5.1 -6.1 -7.1 -11.2 -15.8 -16.7 -4.6 -4.5 -4.8 -4.7 -18.6 -1.2 -1.6 -1.9 -4.7
3.8.1. Audiovisual and related services -1.5 -0.5 -0.5 0.9 1.4 -0.9 -1.7 -4.8 -2.0 -1.3 -0.6 -1.4 -5.4 -0.5 -0.9 -0.7 -2.1
- Credit 1.6 2.6 2.2 4.0 5.2 5.1 7.2 5.0 1.1 1.2 2.2 1.6 6.1 0.3 0.3 0.5 1.1
- Debit -3.1 -3.2 -2.7 -3.1 -3.9 -6.0 -8.9 -9.8 -3.1 -2.5 -2.9 -3.0 -11.5 -0.8 -1.2 -1.2 -3.2
3.8.2. Other personal and cultural services 0.4 1.8 1.1 0.9 3.5 2.1 0.1 3.9 1.6 1.1 1.5 2.3 6.4 0.1 0.3 0.5 0.9
- Credit 2.2 3.0 3.5 4.0 6.7 7.3 6.9 10.9 3.1 3.0 3.4 4.1 13.6 0.5 0.7 1.3 2.5
- Debit -1.8 -1.1 -2.4 -3.1 -3.2 -5.2 -6.9 -6.9 -1.5 -2.0 -1.9 -1.8 -7.2 -0.4 -0.4 -0.8 -1.5
3.9. Government services, n.i.e. 3.2 1.0 3.5 -6.4 -14.2 -13.1 -12.0 -16.5 -4.2 -3.4 -4.6 -5.0 -17.2 -2.3 -1.8 -2.1 -6.2
- Credit 18.0 19.1 21.3 15.8 13.8 13.5 12.4 10.9 2.5 2.9 2.3 1.4 9.1 0.3 0.3 0.4 1.0
- Debit -14.8 -18.1 -17.7 -22.2 -28.0 -26.6 -24.4 -27.5 -6.6 -6.4 -7.0 -6.3 -26.3 -2.6 -2.1 -2.5 -7.2Source: National Bank of the Republic of Macedonia
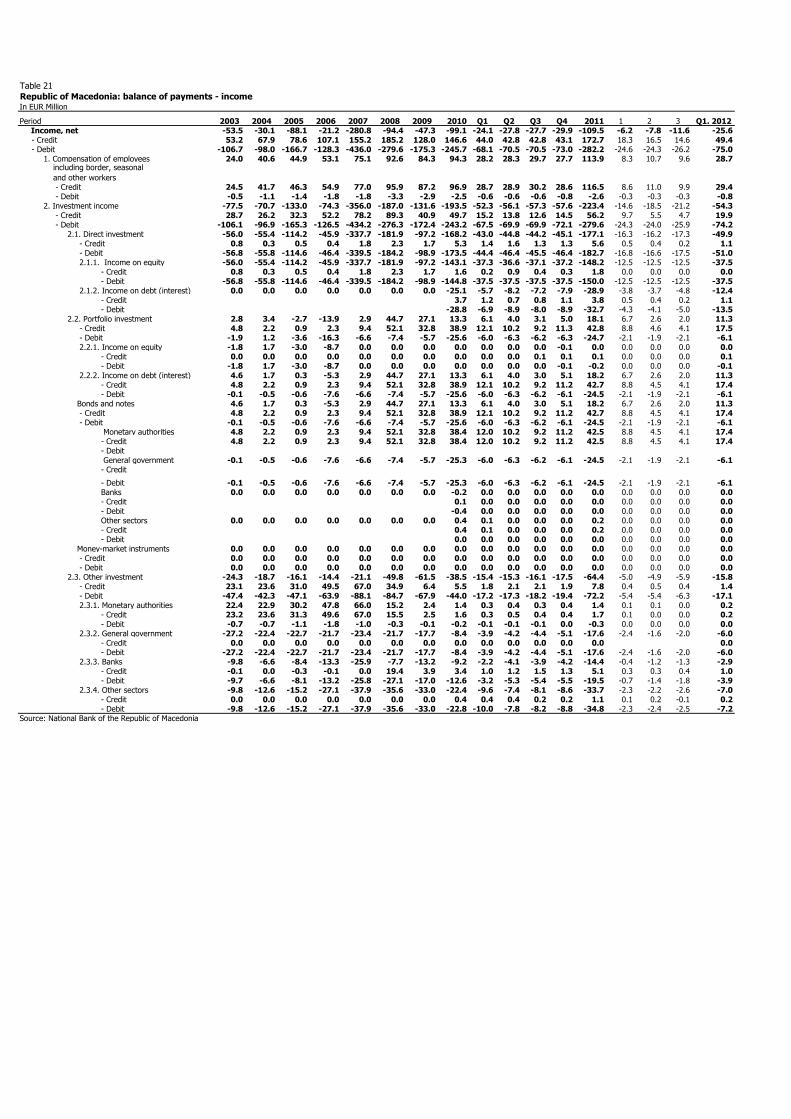
Table 21
Republic of Macedonia: balance of payments - incomeIn EUR Million
Period 2003 2004 2005 2006 2007 2008 2009 2010 Q1 Q2 Q3 Q4 2011 1 2 3 Q1. 2012 Income, net -53.5 -30.1 -88.1 -21.2 -280.8 -94.4 -47.3 -99.1 -24.1 -27.8 -27.7 -29.9 -109.5 -6.2 -7.8 -11.6 -25.6 - Credit 53.2 67.9 78.6 107.1 155.2 185.2 128.0 146.6 44.0 42.8 42.8 43.1 172.7 18.3 16.5 14.6 49.4 - Debit -106.7 -98.0 -166.7 -128.3 -436.0 -279.6 -175.3 -245.7 -68.1 -70.5 -70.5 -73.0 -282.2 -24.6 -24.3 -26.2 -75.0 1. Compensation of employees 24.0 40.6 44.9 53.1 75.1 92.6 84.3 94.3 28.2 28.3 29.7 27.7 113.9 8.3 10.7 9.6 28.7 including border, seasonal
and other workers - Credit 24.5 41.7 46.3 54.9 77.0 95.9 87.2 96.9 28.7 28.9 30.2 28.6 116.5 8.6 11.0 9.9 29.4 - Debit -0.5 -1.1 -1.4 -1.8 -1.8 -3.3 -2.9 -2.5 -0.6 -0.6 -0.6 -0.8 -2.6 -0.3 -0.3 -0.3 -0.8 2. Investment income -77.5 -70.7 -133.0 -74.3 -356.0 -187.0 -131.6 -193.5 -52.3 -56.1 -57.3 -57.6 -223.4 -14.6 -18.5 -21.2 -54.3 - Credit 28.7 26.2 32.3 52.2 78.2 89.3 40.9 49.7 15.2 13.8 12.6 14.5 56.2 9.7 5.5 4.7 19.9 - Debit -106.1 -96.9 -165.3 -126.5 -434.2 -276.3 -172.4 -243.2 -67.5 -69.9 -69.9 -72.1 -279.6 -24.3 -24.0 -25.9 -74.2 2.1. Direct investment -56.0 -55.4 -114.2 -45.9 -337.7 -181.9 -97.2 -168.2 -43.0 -44.8 -44.2 -45.1 -177.1 -16.3 -16.2 -17.3 -49.9 - Credit 0.8 0.3 0.5 0.4 1.8 2.3 1.7 5.3 1.4 1.6 1.3 1.3 5.6 0.5 0.4 0.2 1.1 - Debit -56.8 -55.8 -114.6 -46.4 -339.5 -184.2 -98.9 -173.5 -44.4 -46.4 -45.5 -46.4 -182.7 -16.8 -16.6 -17.5 -51.0 2.1.1. Income on equity -56.0 -55.4 -114.2 -45.9 -337.7 -181.9 -97.2 -143.1 -37.3 -36.6 -37.1 -37.2 -148.2 -12.5 -12.5 -12.5 -37.5 - Credit 0.8 0.3 0.5 0.4 1.8 2.3 1.7 1.6 0.2 0.9 0.4 0.3 1.8 0.0 0.0 0.0 0.0 - Debit -56.8 -55.8 -114.6 -46.4 -339.5 -184.2 -98.9 -144.8 -37.5 -37.5 -37.5 -37.5 -150.0 -12.5 -12.5 -12.5 -37.5 2.1.2. Income on debt (interest) 0.0 0.0 0.0 0.0 0.0 0.0 0.0 -25.1 -5.7 -8.2 -7.2 -7.9 -28.9 -3.8 -3.7 -4.8 -12.4 - Credit 3.7 1.2 0.7 0.8 1.1 3.8 0.5 0.4 0.2 1.1 - Debit -28.8 -6.9 -8.9 -8.0 -8.9 -32.7 -4.3 -4.1 -5.0 -13.5 2.2. Portfolio investment 2.8 3.4 -2.7 -13.9 2.9 44.7 27.1 13.3 6.1 4.0 3.1 5.0 18.1 6.7 2.6 2.0 11.3 - Credit 4.8 2.2 0.9 2.3 9.4 52.1 32.8 38.9 12.1 10.2 9.2 11.3 42.8 8.8 4.6 4.1 17.5 - Debit -1.9 1.2 -3.6 -16.3 -6.6 -7.4 -5.7 -25.6 -6.0 -6.3 -6.2 -6.3 -24.7 -2.1 -1.9 -2.1 -6.1 2.2.1. Income on equity -1.8 1.7 -3.0 -8.7 0.0 0.0 0.0 0.0 0.0 0.0 0.0 -0.1 0.0 0.0 0.0 0.0 0.0 - Credit 0.0 0.0 0.0 0.0 0.0 0.0 0.0 0.0 0.0 0.0 0.1 0.1 0.1 0.0 0.0 0.0 0.1 - Debit -1.8 1.7 -3.0 -8.7 0.0 0.0 0.0 0.0 0.0 0.0 0.0 -0.1 -0.2 0.0 0.0 0.0 -0.1 2.2.2. Income on debt (interest) 4.6 1.7 0.3 -5.3 2.9 44.7 27.1 13.3 6.1 4.0 3.0 5.1 18.2 6.7 2.6 2.0 11.3 - Credit 4.8 2.2 0.9 2.3 9.4 52.1 32.8 38.9 12.1 10.2 9.2 11.2 42.7 8.8 4.5 4.1 17.4 - Debit -0.1 -0.5 -0.6 -7.6 -6.6 -7.4 -5.7 -25.6 -6.0 -6.3 -6.2 -6.1 -24.5 -2.1 -1.9 -2.1 -6.1 Bonds and notes 4.6 1.7 0.3 -5.3 2.9 44.7 27.1 13.3 6.1 4.0 3.0 5.1 18.2 6.7 2.6 2.0 11.3 - Credit 4.8 2.2 0.9 2.3 9.4 52.1 32.8 38.9 12.1 10.2 9.2 11.2 42.7 8.8 4.5 4.1 17.4 - Debit -0.1 -0.5 -0.6 -7.6 -6.6 -7.4 -5.7 -25.6 -6.0 -6.3 -6.2 -6.1 -24.5 -2.1 -1.9 -2.1 -6.1 Monetary authorities 4.8 2.2 0.9 2.3 9.4 52.1 32.8 38.4 12.0 10.2 9.2 11.2 42.5 8.8 4.5 4.1 17.4 - Credit 4.8 2.2 0.9 2.3 9.4 52.1 32.8 38.4 12.0 10.2 9.2 11.2 42.5 8.8 4.5 4.1 17.4 - Debit General government -0.1 -0.5 -0.6 -7.6 -6.6 -7.4 -5.7 -25.3 -6.0 -6.3 -6.2 -6.1 -24.5 -2.1 -1.9 -2.1 -6.1 - Credit
- Debit -0.1 -0.5 -0.6 -7.6 -6.6 -7.4 -5.7 -25.3 -6.0 -6.3 -6.2 -6.1 -24.5 -2.1 -1.9 -2.1 -6.1 Banks 0.0 0.0 0.0 0.0 0.0 0.0 0.0 -0.2 0.0 0.0 0.0 0.0 0.0 0.0 0.0 0.0 0.0 - Credit 0.1 0.0 0.0 0.0 0.0 0.0 0.0 0.0 0.0 0.0 - Debit -0.4 0.0 0.0 0.0 0.0 0.0 0.0 0.0 0.0 0.0 Other sectors 0.0 0.0 0.0 0.0 0.0 0.0 0.0 0.4 0.1 0.0 0.0 0.0 0.2 0.0 0.0 0.0 0.0 - Credit 0.4 0.1 0.0 0.0 0.0 0.2 0.0 0.0 0.0 0.0 - Debit 0.0 0.0 0.0 0.0 0.0 0.0 0.0 0.0 0.0 0.0 Money-market instruments 0.0 0.0 0.0 0.0 0.0 0.0 0.0 0.0 0.0 0.0 0.0 0.0 0.0 0.0 0.0 0.0 0.0 - Credit 0.0 0.0 0.0 0.0 0.0 0.0 0.0 0.0 0.0 0.0 0.0 0.0 0.0 0.0 0.0 0.0 0.0 - Debit 0.0 0.0 0.0 0.0 0.0 0.0 0.0 0.0 0.0 0.0 0.0 0.0 0.0 0.0 0.0 0.0 0.0 2.3. Other investment -24.3 -18.7 -16.1 -14.4 -21.1 -49.8 -61.5 -38.5 -15.4 -15.3 -16.1 -17.5 -64.4 -5.0 -4.9 -5.9 -15.8 - Credit 23.1 23.6 31.0 49.5 67.0 34.9 6.4 5.5 1.8 2.1 2.1 1.9 7.8 0.4 0.5 0.4 1.4 - Debit -47.4 -42.3 -47.1 -63.9 -88.1 -84.7 -67.9 -44.0 -17.2 -17.3 -18.2 -19.4 -72.2 -5.4 -5.4 -6.3 -17.1 2.3.1. Monetary authorities 22.4 22.9 30.2 47.8 66.0 15.2 2.4 1.4 0.3 0.4 0.3 0.4 1.4 0.1 0.1 0.0 0.2 - Credit 23.2 23.6 31.3 49.6 67.0 15.5 2.5 1.6 0.3 0.5 0.4 0.4 1.7 0.1 0.0 0.0 0.2 - Debit -0.7 -0.7 -1.1 -1.8 -1.0 -0.3 -0.1 -0.2 -0.1 -0.1 -0.1 0.0 -0.3 0.0 0.0 0.0 0.0 2.3.2. General government -27.2 -22.4 -22.7 -21.7 -23.4 -21.7 -17.7 -8.4 -3.9 -4.2 -4.4 -5.1 -17.6 -2.4 -1.6 -2.0 -6.0 - Credit 0.0 0.0 0.0 0.0 0.0 0.0 0.0 0.0 0.0 0.0 0.0 0.0 0.0 0.0 - Debit -27.2 -22.4 -22.7 -21.7 -23.4 -21.7 -17.7 -8.4 -3.9 -4.2 -4.4 -5.1 -17.6 -2.4 -1.6 -2.0 -6.0 2.3.3. Banks -9.8 -6.6 -8.4 -13.3 -25.9 -7.7 -13.2 -9.2 -2.2 -4.1 -3.9 -4.2 -14.4 -0.4 -1.2 -1.3 -2.9 - Credit -0.1 0.0 -0.3 -0.1 0.0 19.4 3.9 3.4 1.0 1.2 1.5 1.3 5.1 0.3 0.3 0.4 1.0 - Debit -9.7 -6.6 -8.1 -13.2 -25.8 -27.1 -17.0 -12.6 -3.2 -5.3 -5.4 -5.5 -19.5 -0.7 -1.4 -1.8 -3.9 2.3.4. Other sectors -9.8 -12.6 -15.2 -27.1 -37.9 -35.6 -33.0 -22.4 -9.6 -7.4 -8.1 -8.6 -33.7 -2.3 -2.2 -2.6 -7.0 - Credit 0.0 0.0 0.0 0.0 0.0 0.0 0.0 0.4 0.4 0.4 0.2 0.2 1.1 0.1 0.2 -0.1 0.2 - Debit -9.8 -12.6 -15.2 -27.1 -37.9 -35.6 -33.0 -22.8 -10.0 -7.8 -8.2 -8.8 -34.8 -2.3 -2.4 -2.5 -7.2Source: National Bank of the Republic of Macedonia

Table 22
Republic of Macedonia: balance of payments - current transfers
In EUR Million
Period 2003 2004 2005 2006 2007 2008 2009 2010 Q1 Q2 Q3 Q4 2011 1 2 3 Q1. 2012 Current transfers, net 646.1 628.2 853.3 981.9 1012.4 985.5 1133.3 1367.2 266.0 319.3 440.1 467.3 1492.6 113.6 97.4 119.7 330.7 - Credit 679.5 664.2 887.5 1015.3 1081.3 1033.2 1181.0 1414.0 276.7 331.3 451.8 481.0 1540.8 117.6 101.0 124.1 342.7 - Debit -33.4 -36.0 -34.2 -33.4 -68.9 -47.7 -47.7 -46.9 -10.7 -12.0 -11.7 -13.8 -48.1 -3.9 -3.7 -4.4 -12.0 1. General government - official transfers 89.4 55.5 53.4 58.8 24.3 49.4 35.3 32.0 21.2 14.4 5.9 34.9 76.5 0.2 1.4 1.3 2.9 - Credit 92.9 60.1 60.9 66.3 61.0 62.5 41.2 36.0 22.3 15.9 7.3 35.7 81.1 0.6 2.1 2.0 4.7 - Debit -3.5 -4.7 -7.6 -7.4 -36.7 -13.1 -5.9 -4.0 -1.1 -1.5 -1.3 -0.7 -4.6 -0.4 -0.7 -0.7 -1.8 2. Other sectors - private transfers 556.7 572.7 799.9 923.1 988.2 936.1 1098.1 1335.1 244.8 304.9 434.1 432.3 1416.2 113.4 95.9 118.4 327.8 - Credit 586.6 604.1 826.5 949.0 1020.4 970.7 1139.8 1378.0 254.4 315.4 444.5 445.4 1459.7 117.0 98.9 122.1 338.0 - Debit -29.9 -31.3 -26.6 -25.9 -32.2 -34.6 -41.8 -42.9 -9.6 -10.5 -10.4 -13.0 -43.5 -3.6 -3.0 -3.7 -10.2 2.1. Workers' remittances 115.2 117.9 125.3 144.7 158.1 161.6 170.1 181.8 37.7 48.5 47.8 45.6 179.7 12.0 12.0 15.5 39.4 - Credit 128.9 129.8 136.6 157.1 174.3 180.9 186.2 196.3 40.9 52.1 51.7 49.9 194.6 13.1 13.1 17.0 43.2 - Debit -13.6 -11.9 -11.3 -12.4 -16.2 -19.2 -16.0 -14.5 -3.2 -3.5 -3.9 -4.2 -14.9 -1.2 -1.1 -1.5 -3.8 2.2. Other transfers 441.5 454.8 674.6 778.4 830.1 774.4 927.9 1153.4 207.1 256.3 386.3 386.7 1236.5 101.5 84.0 102.9 288.3 - Credit 457.7 474.3 690.0 791.9 846.0 789.8 953.7 1181.8 213.5 263.3 392.8 395.5 1265.1 103.9 85.8 105.1 294.8 - Debit -16.2 -19.4 -15.3 -13.5 -16.0 -15.4 -25.7 -28.4 -6.4 -6.9 -6.5 -8.8 -28.6 -2.4 -1.9 -2.2 -6.4Source: National Bank of the Republic of Macedonia

Table 23
Republic of Macedonia: balance of payments - capital and financial account
In EUR Million
Period 2003 2004 2005 2006 2007 2008 2009 2010 Q1 Q2 Q3 Q4 2011 1 2 3 Q1. 2012
Capital and financial account 193.9 347.1 127.7 19.6 461.1 886.2 430.0 130.9 224.5 68.4 -70.9 -13.4 208.5 40.6 26.3 37.0 103.9
А. Capital account -5.8 -3.8 -1.7 -0.8 3.7 -12.2 20.2 12.9 9.4 3.4 3.9 4.0 20.9 0.1 2.3 0.7 3.0
- Credit 0.0 0.0 0.0 0.0 0.0 0.0 25.4 25.5 11.9 7.3 7.8 9.2 36.1 1.8 3.1 2.0 6.9
- Debit -5.8 -3.8 -1.7 -0.8 3.7 -12.2 -5.3 -12.6 -2.5 -3.8 -3.9 -5.1 -15.3 -1.8 -0.8 -1.3 -3.9
1. Capital transfers -5.8 -3.8 -1.7 -0.8 1.2 -1.1 12.7 12.9 9.4 3.4 3.9 4.0 20.9 0.0 2.3 0.7 3.0
- Credit 0.0 0.0 0.0 0.0 0.0 0.0 25.4 25.5 11.9 7.3 7.8 9.2 36.1 1.8 3.1 2.0 6.8
- Debit -5.8 -3.8 -1.7 -0.8 1.2 -1.1 -12.8 -12.6 -2.5 -3.8 -3.8 -5.1 -15.3 -1.8 -0.8 -1.3 -3.9
1.1. General government - Official 0.0 0.0 0.0 0.0 0.0 0.0 0.0 0.1 0.2 0.2 0.0 0.0 0.4 -0.1 -0.1 0.0 -0.1
- Credit 0.0 0.0 0.0 0.0 0.0 0.0 0.0 0.1 0.2 0.2 0.0 0.0 0.4 0.0 0.0 0.0 0.0
- Debit 0.0 0.0 0.0 0.0 0.0 0.0 0.0 0.0 0.0 0.0 0.0 0.0 0.0 -0.1 -0.1 0.0 -0.1
1.2. Other sectors - private -5.8 -3.8 -1.7 -0.8 1.2 -1.1 12.7 12.8 9.2 3.3 3.9 4.0 20.5 0.1 2.3 0.7 3.1
- Credit 0.0 0.0 0.0 0.0 0.0 0.0 25.4 25.4 11.7 7.1 7.8 9.2 35.8 1.8 3.1 2.0 6.8
- Debit -5.8 -3.8 -1.7 -0.8 1.2 -1.1 -12.8 -12.6 -2.5 -3.8 -3.8 -5.1 -15.3 -1.7 -0.7 -1.3 -3.7
2. Acquisition/disposal of nonproduced -0.1 0.0 0.0 0.0 2.4 -11.2 7.5 0.0 0.0 0.0 0.0 0.0 0.0 0.1 0.0 0.0 0.1
nonfinancial assets
- Credit 0.0 0.0 0.0 0.0 0.0 0.0 0.0 0.0 0.0 0.0 0.0 0.0 0.0 0.1 0.0 0.0 0.1
- Debit -0.1 0.0 0.0 0.0 2.4 -11.2 7.5 0.0 0.0 0.0 0.0 0.0 0.0 0.0 0.0 0.0 0.0Source: National Bank of the Republic of Macedonia
Period 2003 2004 2005 2006 2007 2008 2009 2010 Q1 Q2 Q3 Q4 2011 1 2 3 Q1. 2012Capital and financial account 193.9 347.1 127.7 19.6 461.1 898.4 430.0 130.9 224.5 68.4 -70.9 -13.4 208.5 40.6 26.3 37.0 103.9 B. Financial account 199.7 350.9 129.4 20.4 457.4 898.4 409.8 118.0 215.0 64.9 -74.8 -17.5 187.6 40.5 24.0 36.3 100.9 1. Direct investment 100.1 259.7 74.9 344.7 506.9 409.4 136.9 157.6 201.6 -62.4 36.6 126.0 301.9 28.3 29.3 6.0 63.6 1.1. Abroad -0.3 -0.9 -2.3 -0.1 0.9 9.5 -8.1 -1.4 -0.3 0.3 -1.0 -0.6 -1.6 -0.5 0.0 -0.1 -0.6 a. Equity capital -0.3 -0.9 -2.3 -0.1 0.9 9.5 -8.1 -1.4 -0.3 0.3 -1.0 -0.6 -1.6 -0.5 0.0 -0.1 -0.6 b. Reinvested earnings 0.0 0.0 0.0 0.0 0.0 0.0 0.0 0.0 0.0 0.0 0.0 0.0 0.0 0.0 0.0 0.0 0.0 c. Other capital 0.0 0.0 0.0 0.0 0.0 0.0 0.0 0.0 0.0 0.0 0.0 0.0 0.0 0.0 0.0 0.0 0.0 1.2. In reporting economy 100.4 260.7 77.2 344.8 506.0 399.9 145.0 159.1 202.0 -62.7 37.6 126.6 303.5 28.8 29.3 6.1 64.2 a. Equity capital 82.6 123.6 78.7 288.8 185.7 206.7 159.3 124.1 143.8 17.5 33.0 168.7 362.9 2.3 18.0 14.7 35.0 b. Reinvested earnings 26.6 0.8 44.9 15.6 183.5 16.7 -113.7 25.6 19.4 -41.7 21.9 32.1 31.7 10.1 11.4 6.9 28.5 c. Other capital -8.8 136.3 -46.4 40.5 136.8 176.6 99.3 9.3 38.8 -38.5 -17.2 -74.2 -91.2 16.4 -0.1 -15.5 0.8 2. Portfolio investment 5.1 8.6 200.8 72.7 114.1 -50.6 104.0 -61.7 -3.2 -4.6 -16.6 -17.7 -42.0 0.2 2.1 0.9 3.1 2.1. Assets 0.3 -0.8 0.7 -0.4 -2.0 -0.5 -37.6 -21.9 -6.6 -5.3 1.1 3.3 -7.6 -0.2 -0.9 -1.5 -2.6 а. Equity securities 0.1 0.1 0.1 0.0 -1.6 -0.1 -22.2 -14.0 -7.2 -5.0 -1.3 3.2 -10.2 -0.4 -0.9 -1.4 -2.7 - Monetary authorities - General government - Banks -0.1 0.0 0.0 0.0 0.0 0.0 0.0 0.0 0.0 0.0 - Other sectors 0.1 0.1 0.1 0.0 -1.6 -0.1 -22.2 -13.9 -7.2 -5.0 -1.3 3.2 -10.2 -0.4 -0.9 -1.4 -2.7 b. Debt securities 0.2 -0.9 0.6 -0.4 -0.3 -0.4 -15.5 -8.0 0.6 -0.3 2.3 0.0 2.6 0.3 0.0 -0.1 0.2 - Bonds and notes 0.2 -0.9 0.6 -0.4 -0.3 -0.4 -15.5 -8.0 0.6 -0.3 2.3 0.0 2.6 0.3 0.0 -0.1 0.2 - Monetary authorities - General government - Banks 0.2 -0.9 0.6 -0.4 -0.3 0.1 -2.6 0.0 0.0 0.0 0.0 0.0 0.0 0.0 0.0 0.0 0.0 - Other sectors 0.0 0.0 0.0 0.0 0.0 -0.5 -12.9 -8.0 0.6 -0.3 2.3 0.0 2.6 0.3 0.0 -0.1 0.2 - Money-market instruments 0.0 0.0 0.0 0.0 0.0 0.0 0.0 0.0 0.0 0.0 0.0 0.0 0.0 0.0 0.0 0.0 0.0 - Monetary authorities - General government - Banks - Other sectors 2.2. Liabilities 4.8 9.3 200.1 73.1 116.1 -50.1 141.7 -39.7 3.5 0.8 -17.7 -20.9 -34.4 0.3 3.0 2.4 5.7 а. Equity securities 2.4 9.8 43.2 67.8 124.8 -34.2 -10.2 -3.0 0.7 0.4 -2.6 -4.2 -5.8 -0.2 -0.5 -0.8 -1.5 - Banks 22.8 64.9 -13.9 -3.7 0.1 0.4 0.8 -0.9 -3.0 -2.7 0.0 -0.5 -0.2 -0.8 - Other sectors 2.4 9.8 43.2 45.0 59.8 -20.3 -6.5 -3.1 0.3 -0.4 -1.8 -1.2 -3.1 -0.1 0.0 -0.6 -0.8 b. Debt securities 2.3 -0.5 157.0 5.3 -8.7 -15.9 151.9 -36.7 2.7 0.4 -15.1 -16.7 -28.6 0.5 3.5 3.2 7.2 - Bonds and notes 2.3 -0.5 157.0 5.3 -8.7 -15.9 151.9 -36.7 2.7 0.4 -15.1 -16.7 -28.6 0.5 3.5 3.2 7.2 - Monetary authorities 0.0 0.0 0.0 0.0 0.0 0.0 0.0 0.0 0.0 0.0 0.0 0.0 0.0 0.0 0.0 0.0 0.0 - General government 2.3 -0.5 157.0 5.3 -8.7 -15.9 151.9 -36.7 2.7 0.4 -15.1 -16.7 -28.6 0.5 3.5 3.2 7.2 - Banks 0.0 0.0 0.0 0.0 0.0 0.0 0.0 0.0 0.0 0.0 0.0 0.0 0.0 0.0 0.0 0.0 0.0 - Other sectors 0.0 0.0 0.0 0.0 0.0 0.0 0.0 0.0 0.0 0.0 0.0 0.0 0.0 0.0 0.0 0.0 0.0 - Money-market instruments 0.0 0.0 0.0 0.0 0.0 0.0 0.0 0.0 0.0 0.0 0.0 0.0 0.0 0.0 0.0 0.0 0.0 - Monetary authorities 0.0 0.0 0.0 0.0 0.0 0.0 0.0 0.0 0.0 0.0 0.0 0.0 0.0 0.0 0.0 0.0 0.0 - General government 0.0 0.0 0.0 0.0 0.0 0.0 0.0 0.0 0.0 0.0 0.0 0.0 0.0 0.0 0.0 0.0 0.0 - Banks 0.0 0.0 0.0 0.0 0.0 0.0 0.0 0.0 0.0 0.0 0.0 0.0 0.0 0.0 0.0 0.0 0.0 - Other sectors 0.0 0.0 0.0 0.0 0.0 0.0 0.0 0.0 0.0 0.0 0.0 0.0 0.0 0.0 0.0 0.0 0.0 2.3. Financial derivatives, net 0.0 0.0 0.0 0.0 0.0 0.0 0.0 0.0 0.0 0.0 0.0 0.0 0.0 0.0 0.0 0.0 0.0

Republic of Macedonia: balance of payments - capital and financial account
In EUR Million
Period 2003 2004 2005 2006 2007 2008 2009 2010 Q1 Q2 Q3 Q4 2011 1 2 3 Q1. 2012 3. Other investment 133.1 98.5 201.6 -100.7 -68.9 464.4 245.8 83.7 226.0 67.9 -121.0 86.2 259.1 -9.1 -6.8 56.5 40.6 3.1. Assets 14.1 7.3 -39.8 -117.6 -61.5 207.4 -107.0 -159.7 -5.4 -151.5 -48.0 -197.0 -401.9 -72.1 25.0 -32.0 -79.1 3.1.1. Trade credits 0.0 0.0 0.0 0.0 0.0 0.0 0.0 0.0 0.0 0.0 0.0 0.0 0.0 0.0 0.0 0.0 0.0 3.1.1.1. General government 0.0 0.0 0.0 0.0 0.0 0.0 0.0 0.0 0.0 0.0 0.0 0.0 0.0 0.0 0.0 0.0 0.0 - Long-term 0.0 0.0 0.0 0.0 0.0 0.0 0.0 0.0 0.0 0.0 0.0 - Short-term 0.0 0.0 0.0 0.0 0.0 0.0 0.0 0.0 0.0 0.0 0.0 3.1.1.2. Other sectors 0.0 0.0 0.0 0.0 0.0 0.0 0.0 0.0 0.0 0.0 0.0 0.0 0.0 0.0 0.0 0.0 0.0 - Long-term 0.0 0.0 0.0 0.0 0.0 0.0 0.0 0.0 0.0 0.0 0.0 - Short-term 0.0 0.0 0.0 0.0 0.0 0.0 0.0 0.0 0.0 0.0 0.0 3.1.2. Loans 1.3 1.5 -7.0 6.0 0.0 -4.7 -19.1 7.3 -2.9 -115.7 29.2 -140.8 -230.2 -83.4 62.8 -49.6 -70.2 3.1.2.1. Monetary authorities 0.0 0.0 0.0 0.0 0.0 0.0 0.0 0.0 0.0 -118.2 29.5 -144.4 -233.1 -83.2 64.8 -45.0 -63.4 - Long-term 0.0 0.0 0.0 0.0 0.0 0.0 0.0 0.0 0.0 0.0 0.0 0.0 0.0 0.0 0.0 - Short-term 0.0 0.0 0.0 0.0 0.0 0.0 0.0 0.0 0.0 -118.2 29.5 -144.4 -233.1 -83.2 64.8 -45.0 -63.4 3.1.2.2. General government 0.0 0.0 0.0 0.0 0.0 0.0 0.0 0.0 0.0 0.0 0.0 0.0 0.0 0.0 0.0 0.0 0.0 - Long-term 0.0 0.0 0.0 0.0 0.0 0.0 0.0 0.0 0.0 0.0 0.0 0.0 0.0 0.0 0.0 0.0 0.0 - Short-term 0.0 0.0 0.0 0.0 0.0 0.0 0.0 0.0 0.0 0.0 0.0 0.0 0.0 0.0 0.0 0.0 0.0 3.1.2.3. Banks 2.4 0.0 -2.8 1.9 0.6 -0.3 -16.0 6.9 -2.5 2.9 -0.7 4.1 3.7 -1.2 -1.6 -4.4 -7.2 - Long-term 0.8 0.0 -2.7 2.3 0.3 -0.4 -3.2 0.7 0.0 1.1 0.0 1.1 2.2 0.0 -0.4 -3.9 -4.3 - Short-term 1.5 0.0 0.0 -0.4 0.3 0.1 -12.8 6.2 -2.5 1.8 -0.7 2.9 1.5 -1.2 -1.1 -0.5 -2.8 3.1.2.4. Other sectors -1.1 1.5 -4.3 4.1 -0.6 -4.4 -3.2 0.4 -0.4 -0.3 0.4 -0.5 -0.9 1.0 -0.4 -0.2 0.4 - Long-term 0.0 0.0 0.0 0.0 0.0 -3.5 -3.3 -0.8 -0.4 -0.1 0.4 -0.5 -0.7 1.0 -0.3 -0.2 0.5 - Short-term -1.1 1.5 -4.3 4.1 -0.6 -0.8 0.1 1.2 0.0 -0.2 0.0 0.0 -0.2 0.0 -0.1 0.0 -0.1 3.1.3. Currency and deposits 14.5 6.2 -35.3 -122.8 -61.8 211.3 -88.1 -167.2 -2.2 -36.0 -77.2 -56.3 -171.6 11.2 -37.9 17.7 -8.9 3.1.3.1. Monetary authorities 15.5 23.2 0.0 -5.7 -0.2 16.0 0.0 0.6 0.1 0.0 0.0 0.0 0.0 0.0 0.0 0.0 0.0 3.1.3.2. General government 0.0 0.0 0.0 0.0 0.0 0.0 0.0 0.0 0.0 0.0 0.0 0.0 0.0 0.0 0.0 0.0 0.0 3.1.3.3. Banks -36.1 -75.9 7.4 -50.1 0.7 238.5 -86.0 -78.6 8.8 -8.5 -39.5 2.8 -36.4 29.0 -19.8 39.8 49.0 3.1.3.4. Other sectors 35.1 58.9 -42.7 -67.0 -62.3 -43.2 -2.0 -89.2 -11.2 -27.4 -37.7 -59.0 -135.3 -17.7 -18.1 -22.1 -57.9 3.1.4. Other assets -1.8 -0.5 2.6 -0.8 0.3 0.8 0.1 0.2 -0.3 0.2 0.0 0.1 -0.1 0.0 0.1 -0.1 0.0 3.1.4.1. Monetary authorities 0.0 0.0 0.0 0.0 0.0 0.0 0.0 0.0 0.0 0.0 0.0 0.0 0.0 0.0 0.0 0.0 0.0 3.1.4.2. General government 0.0 0.0 0.0 0.0 0.0 0.0 0.0 0.0 0.0 0.0 0.0 0.0 0.0 0.0 0.0 0.0 0.0 3.1.4.3. Banks -1.8 -0.5 2.6 -0.8 0.3 0.8 0.1 0.2 -0.3 0.2 0.0 0.1 -0.1 0.0 0.1 -0.1 0.0 3.1.4.4. Other sectors 0.0 0.0 0.0 0.0 0.0 0.0 0.0 0.0 0.0 0.0 0.0 0.0 0.0 0.0 0.0 0.0 0.0 3.2. Liabilities 119.1 91.2 241.4 17.0 -7.5 256.9 352.8 243.4 231.4 219.4 -72.9 283.2 661.0 63.0 -31.8 88.5 119.7 3.2.1. Trade credits 67.4 71.0 105.9 -17.4 -22.7 -4.4 169.1 64.2 -9.8 27.9 -25.4 14.9 7.5 28.8 5.8 32.1 66.7 3.2.1.1. General government 0.0 0.0 0.0 0.0 0.0 0.0 0.0 0.0 0.0 0.0 0.0 0.0 0.0 0.0 0.0 0.0 0.0 3.2.1.2. Other sectors 67.4 71.0 105.9 -17.4 -22.7 -4.4 169.1 64.2 -9.8 27.9 -25.4 14.9 7.5 28.8 5.8 32.1 66.7 3.2.2. Loans 48.5 10.5 105.0 -11.7 -93.8 241.9 69.9 120.3 258.9 168.4 -39.9 275.2 662.7 51.7 -37.6 45.7 59.8 3.2.2.1. Monetary authorities -4.6 -6.7 3.9 -7.6 -41.7 0.0 0.0 0.0 0.0 118.2 -29.5 143.8 232.5 83.1 -64.2 44.8 63.7 а. Use of Fund credit and loans -4.6 -6.7 3.9 -7.6 -41.7 0.0 0.0 0.0 0.0 0.0 0.0 0.0 0.0 0.0 0.0 0.0 0.0 b. Other long-term 0.0 0.0 0.0 0.0 0.0 0.0 0.0 0.0 0.0 0.0 0.0 0.0 0.0 0.0 0.0 0.0 0.0 c. Short-term 0.0 0.0 0.0 0.0 0.0 0.0 0.0 0.0 0.0 118.2 -29.5 143.8 232.5 83.1 -64.2 44.8 63.7 3.2.2.2. General government 27.7 30.5 38.8 -131.6 -121.0 36.1 7.0 37.7 232.9 13.9 2.8 117.0 366.5 0.8 -0.5 1.6 1.8 а. Long-term 27.7 30.5 38.8 -131.6 -121.0 36.1 7.0 37.7 232.9 13.9 2.8 117.0 366.5 0.8 -0.5 1.6 1.8 b. Short-term 0.0 0.0 0.0 0.0 0.0 0.0 0.0 0.0 0.0 0.0 0.0 0.0 0.0 0.0 0.0 0.0 0.0 3.2.2.3. Banks -37.7 -18.3 43.4 38.6 70.3 -17.0 58.9 110.7 21.0 30.4 -24.6 19.9 46.6 -24.8 27.4 -0.7 1.9 а. Long-term -20.2 -13.2 49.0 39.9 53.8 -0.5 18.9 93.5 24.7 10.2 -4.5 19.9 50.3 -24.8 27.4 -0.7 1.9 b. Short-term -17.5 -5.1 -5.6 -1.3 16.5 -16.5 40.0 17.2 -3.7 20.2 -20.2 0.0 -3.7 0.0 0.0 0.0 0.0 3.2.2.4. Other sectors 63.2 4.9 18.9 88.9 -1.4 222.7 4.0 -28.1 5.0 5.9 11.5 -5.4 17.0 -7.4 -0.2 0.0 -7.7 а. Long-term 60.2 26.1 3.5 55.9 -28.9 249.7 14.9 -65.2 24.5 6.2 8.1 2.9 41.8 -7.1 0.0 -0.3 -7.4 b. Short-term 3.0 -21.1 15.4 33.0 27.4 -27.0 -10.9 37.1 -19.5 -0.3 3.4 -8.3 -24.8 -0.3 -0.2 0.3 -0.3 3.2.3. Currency and deposits 8.1 -2.1 20.1 40.3 50.6 12.1 26.0 -2.8 -24.2 11.3 -22.1 -26.9 -61.9 -5.3 0.4 6.7 1.8 3.2.3.1. Monetary authorities 0.0 0.0 0.0 0.0 0.0 0.0 0.0 0.0 0.0 0.0 0.0 0.0 0.0 0.0 3.2.3.2. General government 0.0 0.0 0.0 0.0 0.0 0.0 0.0 0.0 0.0 0.0 0.0 0.0 0.0 0.0 3.2.3.3. Banks 8.1 -2.1 20.1 40.3 50.6 12.1 26.0 -2.8 -24.2 11.3 -22.1 -26.9 -61.9 -5.3 0.4 6.7 1.8 3.2.3.4. Other sectors 0.0 0.0 0.0 0.0 0.0 0.0 0.0 0.0 0.0 0.0 0.0 0.0 0.0 0.0 3.2.4. Other liabilities -4.9 11.7 10.3 5.8 58.5 7.4 87.9 61.7 6.4 11.8 14.5 20.0 52.7 -12.1 -0.4 3.9 -8.6 3.2.4.1. Monetary authorities 0.0 0.0 0.0 0.0 0.0 0.0 62.8 0.0 0.0 0.0 0.0 0.0 0.0 0.0 0.0 0.0 0.0 а. Long-term 0.0 0.0 0.0 0.0 0.0 0.0 62.8 0.0 0.0 0.0 0.0 0.0 0.0 0.0 0.0 0.0 0.0 b. Short-term 0.0 0.0 0.0 0.0 0.0 0.0 0.0 0.0 0.0 0.0 0.0 0.0 0.0 0.0 3.2.4.2. General government -6.7 0.0 0.0 0.0 0.0 0.2 0.0 0.2 1.6 0.4 6.3 4.9 13.1 -7.3 -1.3 0.2 -8.4 а. Long-term 0.0 0.0 0.0 0.0 0.0 0.0 0.0 0.0 0.0 0.0 0.0 0.0 0.0 0.0 b. Short-term -6.7 0.0 0.0 0.0 0.0 0.2 0.0 0.2 1.6 0.4 6.3 4.9 13.1 -7.3 -1.3 0.2 -8.4 3.2.4.3. Banks 0.7 0.9 0.9 1.0 1.0 0.9 0.6 -0.6 -0.1 -0.3 0.6 -0.3 -0.1 0.0 0.0 0.0 -0.1 а. Long-term 0.0 0.0 0.0 0.0 0.0 0.0 0.0 0.0 0.0 0.0 0.0 0.0 0.0 0.0 b. Short-term 0.7 0.9 0.9 1.0 1.0 0.9 0.6 -0.6 -0.1 -0.3 0.6 -0.3 -0.1 0.0 0.0 0.0 -0.1 3.2.4.4. Other sectors 1.1 10.8 9.5 4.8 57.4 6.2 24.5 62.1 4.9 11.6 7.6 15.4 39.6 -4.8 0.9 3.8 -0.1 а. Long-term 0.0 0.0 0.0 0.0 0.0 0.0 0.0 10.6 0.0 0.0 0.0 0.0 0.0 0.0 b. Short-term 1.1 10.8 9.5 4.8 57.4 6.2 24.5 51.5 4.9 11.6 7.6 15.4 39.6 -4.8 0.9 3.8 -0.1 4. Reserve Assets (excluding monetary gold and
exchange rate) -38.6 -15.9 -347.9 -296.4 -94.7 75.3 -76.9 -61.7 -209.4 64.0 26.1 -212.0 -331.3 21.2 -0.5 -27.1 -6.5 4.1. Monetary gold 36.1 -32.7 0.0 0.0 0.0 0.0 0.0 0.0 0.0 0.0 0.0 -1.6 -1.6 1.6 -0.1 1.5 4.2. Special drawing rights 5.1 -0.4 0.0 -1.7 1.2 0.0 -62.5 65.7 0.8 -1.1 -0.2 0.8 0.4 -0.8 0.7 0.0 -0.1 4.3. Reserve position in the Fund 0.0 0.0 0.0 0.0 0.0 0.0 0.0 0.0 0.0 0.0 0.0 0.0 0.0 0.0 0.0 0.0 0.0 4.4. Foreign exchange -79.8 17.2 -347.9 -294.7 -95.8 75.3 -14.3 -127.4 -210.2 65.0 26.3 -211.3 -330.1 20.4 -1.2 -27.1 -7.9 4.4.1. Currency and deposits -5.3 -34.9 -337.5 -163.4 242.8 667.8 -220.3 117.5 -13.7 141.0 -11.9 -178.0 -62.5 231.7 -30.3 -49.6 151.9 4.4.2. Securities -74.4 52.1 -10.4 -131.3 -338.7 -592.5 206.0 -244.9 -196.6 -76.0 38.2 -33.3 -267.6 -211.3 29.0 22.5 -159.8 4.5. Other claims 0.0 0.0 0.0 0.0 0.0 0.0 0.0 0.0 0.0 0.0 0.0 0.0 0.0 0.0 0.0 0.0 0.0Source: National Bank of the Republic of Macedonia

Table 24
Merchandise trade by sections of SITC and by end use
In USD Million
2003 2004 2005 2006 2007 2008 2009 2003 2004 2005 2006 2007 2008 2009
Total Total Total Total Total Total Total Total Total Total Total Total Total Total Q1 Q2 Q3 Q4 Total Q1 Q2 Q3 Q4 Total Q1 Q2 Q3 Q4 Total Q1 Q2 Q3 Q4 Total Q1 Q1
TOTAL 1,367.0 1,675.9 2,042.3 2,415.2 3,398.3 3,990.6 2,708.5 2,306.4 2,931.6 3,232.8 3,752.3 5,280.6 6,882.7 2,708.5 666.7 781.5 887.8 965.8 3,301.8 1,117.4 1,335.5 1,349.4 1,648.4 5,450.7 978.2 1,186.1 1,172.8 1,118.3 4,455.4 1,653.7 1,785.5 1,802.6 1,765.4 7,007.3 920.1 1,486.8
SITC
Food and live animals 92.0 125.6 167.2 192.7 250.4 308.5 283.6 271.2 337.5 343.2 362.4 518.3 620.9 283.6 60.7 80.8 90.3 96.9 328.7 128.4 132.2 127.4 170.1 558.1 68.1 109.2 102.4 93.5 373.2 153.7 159.2 167.7 191.4 672.0 59.8 156.6
Beverages and tobacco 137.1 127.8 163.1 193.6 209.6 218.8 197.1 24.2 28.0 31.1 31.8 38.3 51.2 197.1 44.9 50.9 56.0 50.8 202.5 12.6 13.8 15.9 15.3 57.6 44.8 47.7 66.4 76.1 235.0 10.6 19.8 21.3 17.1 68.9 58.3 18.5
Crude materials, inedible, except fuels 39.9 44.1 67.8 113.6 170.6 272.0 173.7 60.0 77.4 106.7 133.5 298.2 351.0 173.7 64.7 65.7 65.0 64.6 260.0 35.9 70.4 80.8 101.0 288.1 67.0 78.8 77.9 64.6 288.4 76.6 90.5 96.1 102.7 365.9 59.3 65.9
Mineral fuels, lubricants and related materials 73.7 78.3 163.6 225.0 165.3 314.3 202.9 323.1 397.8 619.2 758.9 975.7 1,419.3 202.9 50.3 59.7 83.3 64.1 257.4 197.5 215.1 229.4 324.8 966.8 76.7 112.6 113.3 69.8 372.4 349.2 334.5 370.3 382.9 1,436.9 63.3 406.5
Animal and vegetable oils and fats 0.8 7.0 2.9 2.2 2.5 12.4 8.2 24.5 52.9 30.0 31.4 47.0 67.4 8.2 2.1 2.4 1.8 5.0 11.3 9.1 10.3 13.7 18.7 51.8 2.7 4.1 5.7 5.3 17.8 14.4 15.7 20.6 24.9 75.6 4.5 22.0
Chemical products 70.2 73.4 90.8 100.7 133.1 181.1 172.2 254.9 281.0 334.0 364.5 490.2 614.1 172.2 53.1 81.3 89.8 157.6 381.8 151.2 165.2 177.6 168.6 662.6 198.0 191.3 174.3 183.5 747.1 243.3 207.6 200.9 175.7 827.4 170.4 171.7
Manufactured goods classified chiefly by material 398.1 552.7 682.8 853.8 1,513.2 1,602.8 771.5 333.2 740.8 950.5 1,121.0 1,509.2 1,862.9 771.5 188.5 249.2 265.8 286.5 989.9 259.6 359.1 307.5 448.0 1,374.2 266.7 342.7 310.6 311.5 1,231.5 461.7 517.5 497.9 473.3 1,950.3 233.8 335.2
Machinery and transport equipment 80.6 92.6 109.9 118.7 151.6 186.4 153.3 434.2 504.5 563.1 688.8 1,046.3 1,442.4 153.3 26.1 36.4 43.0 47.2 152.8 234.8 275.8 296.0 284.3 1,090.8 63.0 87.9 95.7 105.9 352.6 259.8 319.9 314.8 278.8 1,173.2 90.1 231.0
Miscellaneous manufactured articles 471.8 570.8 590.5 612.0 800.3 892.8 745.1 128.7 171.9 252.9 257.7 355.9 451.6 745.1 176.1 154.3 192.2 192.4 715.1 84.8 93.2 100.8 116.9 395.6 190.6 210.4 225.8 207.7 834.5 83.6 120.0 112.3 115.8 431.7 180.5 78.8
Commodities and transactions not classified in
SITC 2.7 3.5 3.7 3.0 1.8 1.4 0.8 452.4 340.1 2.1 2.1 1.8 1.7 0.8 0.1 0.7 0.7 0.8 2.4 3.6 0.5 0.3 0.7 5.0 0.6 1.4 0.4 0.5 2.8 0.9 0.8 0.8 2.8 5.3 0.1 0.5
END USE (old classification)
Production materials 669.2 816.2 1,110.4 1,398.9 2,086.1 2,444.1 1,369.3 1,492.5 1,904.7 2,099.0 2,453.5 3,427.8 4,452.7 1,369.3 374.6 474.5 524.0 576.2 1,949.3 678.1 846.7 837.7 1,084.2 3,446.6 621.8 737.1 720.5 659.6 2,739.0 1,178.1 1,183.2 1,212.4 1,184.2 4,757.8
Capital goods 22.3 30.6 39.9 51.5 76.6 133.9 125.8 285.9 312.8 348.5 421.4 643.7 939.1 125.8 18.2 26.8 29.6 30.9 105.5 136.4 143.8 153.3 190.9 624.4 51.9 77.6 68.4 87.2 285.2 158.0 212.6 214.6 180.6 765.8
Consumption goods 674.5 827.7 891.2 964.7 1,235.6 1,412.6 1,213.3 525.2 711.8 783.2 875.3 1,207.5 1,489.2 1,213.3 273.9 280.2 334.2 358.7 1,247.0 299.4 344.5 358.2 372.6 1,374.7 304.1 371.2 383.5 371.3 1,430.0 316.8 388.9 374.8 397.8 1,478.3
Unknown 0.9 1.3 0.8 0.0 0.0 0.0 0.0 2.7 2.3 2.1 2.1 1.7 1.6 0.0 0.0 0.0 0.0 0.0 0.0 3.5 0.4 0.3 0.7 4.9 0.3 0.2 0.4 0.1 1.1 0.9 0.8 0.8 2.8 5.3
2003 2004 2005 2006 2007 2008 2009 2003 2004 2005 2006 2007 2008 2009
Economic categories (new classification) Total Total Total Total Total Total Total Total Total Total Total Total Total Total Q1 Q2 Q3 Q4 Total Q1 Q2 Q3 Q4 Total Q1 Q2 Q3 Q4 Total Q1 Q2 Q3 Q4 Total Q1 Q1
Food and beverages (primary), for industrial use5.9 8.0 52.4 36.6 1.3 1.8 2.3 1.7 7.2 9.2 9.7 8.6 12.0 39.6 1.7 1.7 4.3 1.6 9.2 15.1 10.6 12.3 19.0 57.1 1.3 20.9
Food and beverages (primary),for household 129.3 99.9 60.1 63.7 13.9 41.4 43.6 37.1 136.0 19.1 13.0 10.1 20.0 62.3 22.8 50.4 45.4 32.9 151.5 22.3 16.3 12.5 22.1 73.2 13.7 20.2
Food and beverages (processed),for use in
industry 8.7 8.2 132.7 93.6 2.2 2.4 2.3 3.6 10.5 22.9 25.5 25.0 36.0 109.4 2.5 2.6 3.1 2.8 11.1 32.7 25.8 35.9 38.5 132.9 2.2 34.1
Food and beverages (processed),for household272.8 261.2 436.9 418.3 60.9 59.8 66.5 79.4 266.6 85.6 96.7 102.6 121.5 406.3 58.5 82.0 77.5 83.7 301.7 95.7 123.9 131.7 134.9 486.3 72.0 100.9
Industrial supplies, primary 363.7 257.6 340.6 182.1 86.7 88.9 89.2 85.1 349.9 36.1 65.9 74.0 96.8 272.8 88.1 94.0 111.2 107.7 401.0 74.5 89.4 92.8 101.9 358.5 86.0 70.7
Industrial supplies, processed 1,743.6 891.4 2,360.9 1,646.6 229.9 315.2 338.9 413.7 1,297.7 379.0 503.1 457.1 577.7 1,917.0 449.6 523.9 485.2 478.2 1,936.9 671.4 685.2 670.3 610.0 2,636.9 389.3 462.3
Fuels and lubricants, primary 0.4 1.2 925.1 481.6 0.2 1.1 0.1 0.4 1.8 125.7 133.7 128.6 206.3 594.3 0.2 0.2 0.0 0.5 1.0 228.8 146.4 149.6 155.2 680.0 0.7 166.2
Fuels and lubricants, processed motor gasoline69.4 44.1 1.4 20.9 12.3 11.2 15.3 10.0 48.7 3.0 5.1 9.5 9.1 26.7 12.5 16.3 19.9 9.5 58.1 4.8 7.5 32.9 19.6 64.8 9.5 18.7
Fuels and lubricants, processed, other 236.3 151.7 457.5 291.4 36.1 45.2 66.1 51.7 199.1 64.9 65.5 85.6 105.3 321.4 63.2 92.8 87.1 52.6 295.6 107.7 168.8 173.3 199.4 649.2 52.8 217.8
Investment products (except transport
equipment) 65.3 58.9 786.4 675.2 11.7 18.4 21.5 25.3 76.9 111.3 114.2 122.0 173.7 521.2 25.5 47.4 41.2 55.6 169.8 127.7 165.2 150.2 147.7 590.9 50.8 106.9
Investment products (except transport
equipment), parts and accessory 33.6 43.3 190.4 181.5 15.3 15.6 16.4 21.5 68.8 33.8 41.5 56.8 49.0 181.0 23.4 25.6 24.4 29.0 102.5 50.3 59.4 60.3 56.5 226.4 23.8 47.7
Passenger motor cars 0.8 0.4 256.6 169.2 0.1 0.3 0.3 0.2 0.8 46.6 73.5 76.6 42.8 239.5 0.2 0.1 0.3 0.1 0.7 48.6 51.2 47.8 41.3 189.0 0.2 33.3
Transport equipment, parts and accessories,
industrial 2.5 4.0 166.4 160.3 0.8 2.1 1.9 0.7 5.5 32.4 34.6 37.2 19.1 123.3 0.8 0.8 1.2 1.9 4.7 25.6 34.7 53.3 24.4 138.1 1.4 34.9
Transport equipment, parts and accessories, non-
industrial 3.3 2.5 17.1 9.7 0.3 0.9 0.7 0.6 2.5 1.4 2.9 1.4 0.8 6.4 0.7 0.8 0.5 0.3 2.3 1.1 3.2 1.2 0.5 6.0 0.7 1.5
Transport equipment, parts and accessory 51.0 28.2 68.8 62.2 7.1 8.3 9.5 12.8 37.7 14.4 14.4 14.4 20.7 64.0 8.9 8.9 9.6 9.0 36.4 13.8 18.0 17.7 19.2 68.7 8.9 14.1
Consumption goods (not classified elsewhere),
durable 36.6 36.7 148.4 126.6 5.7 7.0 11.4 13.8 37.9 33.6 33.2 38.2 40.7 145.7 6.5 9.2 12.1 13.8 41.7 26.1 45.6 36.9 39.2 147.9 6.2 27.7
Consumption goods (not classified elsewhere),
semi-durable 796.5 654.0 185.8 156.2 154.9 136.4 173.3 170.0 634.6 34.5 36.7 36.6 42.3 150.1 168.1 182.5 202.6 185.6 738.9 33.3 42.2 39.0 41.1 155.6 159.8 31.1
Consumption goods (not classified elsewhere),
nondurable 168.2 156.3 291.4 286.9 37.4 35.4 39.5 55.4 167.7 65.8 70.3 70.2 80.4 286.6 44.7 46.7 46.7 53.1 191.3 73.4 91.0 84.0 88.2 336.6 40.7 77.2
Other goods 2.6 0.8 2.1 0.1 0.1 0.2 0.7 0.5 1.6 1.0 0.6 0.3 0.2 2.1 0.0 0.0 0.0 0.0 0.0 0.0 0.0 0.0 0.0 0.0 0.0 0.0
Not distributed 0.0 0.0 1.6 9.8 0.0 0.0 0.0 0.0 0.0 3.5 0.4 0.3 0.7 4.9 0.3 0.2 0.4 0.1 1.1 0.9 0.8 0.8 6.8 9.3 0.1 0.5
Total 3,990.6 2,708.5 6,882.7 5,072.8 676.7 791.8 899.6 983.4 3,351.4 1,123.7 1,340.8 1,354.9 1,655.1 5,474.5 978.2 1,186.1 1,172.8 1,118.3 4,455.4 1,653.7 1,785.5 1,802.6 1,765.4 7,007.3 920.1 1,486.8
Source: State Statistical Office of the Republic of Macedonia
EXPORT IMPORT EXPORT IMPORT EXPORT EXPORT IMPORT
2010 2010 2011 2011 2012 2012
IMPORT
EXPORT IMPORT EXPORT IMPORT EXPORT EXPORT IMPORT
2010 2010 2011 2011 2012 2012
IMPORT

Table 25
Foreign trade by countries
In USD Million
2003 2004 2005 2006 2007 2008 2009 2003 2004 2005 2006 2007 2008 2009
Total Total Total Total Total Total Total Total Total Total Total Total Total Total Q1 Q2 Q3 Q4 Total Q1 Q2 Q3 Q4 Total Q1 Q2 Q3 Q4 Total Q1 Q2 Q3 Q4 Total Q1 Q1
TOTAL 1,367.0 1,675.9 2,042.3 2,415.2 3,398.3 3,990.6 2,708.5 2,306.4 2,931.6 3,232.8 3,752.3 5,280.6 6,882.7 5,072.8 676.7 791.8 899.6 983.4 3,351.4 1,123.7 1,340.8 1,354.9 1,655.1 5,474.5 978.2 1,186.1 1,172.8 1,118.3 4,455.4 1,653.7 1,785.5 1,802.6 1,765.4 7,007.3 920.1 1,486.8
Serbia and Montenegro 275.0 347.6 459.7 559.6 212.8 243.7 264.2 283.4
Serbia 644.7 934.8 337.8 454.5 533.1 398.0 46.0 67.1 73.7 85.0 271.8 88.3 102.3 100.1 128.7 419.4 57.8 99.0 83.0 93.5 333.4 111.6 125.5 123.3 137.5 497.9 54.7 116.1
Montenegro 28.0 39.0 24.9 1.4 1.2 1.8 4.9 8.3 7.0 7.2 27.4 0.2 0.3 0.4 0.6 1.4 6.0 10.0 10.1 8.2 34.2 0.2 0.4 0.7 0.7 2.1 6.1 0.3
Germany 279.4 317.2 364.2 381.2 501.8 564.9 455.9 304.8 368.2 336.1 372.3 533.1 652.9 521.7 139.2 148.8 178.0 246.4 712.4 118.0 157.7 164.5 173.4 613.5 301.1 329.8 297.0 314.0 1,241.9 171.2 194.8 183.6 179.4 728.9 297.5 141.3
Greece 180.4 228.8 313.2 361.3 424.7 536.4 291.6 300.6 282.6 297.7 306.4 416.2 511.7 441.9 61.0 67.3 65.7 52.2 246.2 89.0 96.5 105.4 158.0 448.9 43.7 59.2 58.7 53.7 215.2 102.2 158.6 135.7 169.8 566.3 39.2 155.8
Italy 95.4 134.6 169.8 238.5 349.9 321.4 218.3 123.1 168.8 194.1 228.3 313.3 390.2 368.5 49.1 56.6 63.8 65.8 235.4 72.1 91.9 77.1 94.1 335.2 57.3 78.5 82.5 71.5 289.7 70.9 133.8 115.7 98.4 418.8 60.7 77.8
Bulgaria 25.8 51.5 76.1 130.9 243.9 379.3 216.9 149.2 209.7 234.4 251.3 271.1 327.9 244.3 67.8 73.2 76.5 76.5 294.0 55.1 72.8 79.9 94.2 302.0 72.4 85.1 77.7 72.6 307.7 96.2 117.5 131.7 112.3 457.7 63.9 97.0
Croatia 66.2 80.2 81.1 124.7 165.1 230.5 152.7 63.5 65.8 75.3 79.0 110.8 137.8 118.4 31.2 29.1 30.6 32.9 123.7 23.8 27.3 29.8 32.4 113.3 37.1 39.6 33.4 29.5 139.6 27.2 35.9 36.5 33.5 133.1 23.3 24.9
Belgium 9.7 15.2 34.6 83.9 178.1 109.2 36.1 16.7 22.1 27.3 27.0 32.4 42.1 33.7 27.0 18.7 16.5 18.6 80.8 8.2 6.8 8.0 8.4 31.5 19.5 7.0 18.0 18.0 62.5 11.1 9.0 10.4 8.7 39.3 10.2 10.2
Bosnia and Herzegovina 23.8 33.2 50.5 65.8 89.0 104.8 86.7 11.8 16.3 23.6 26.5 34.9 52.6 46.5 15.7 22.7 21.2 25.3 85.0 9.4 11.9 13.9 13.9 49.1 17.1 27.0 24.7 24.3 93.1 16.6 25.1 27.2 21.3 90.1 16.8 10.9
Netherlands 47.3 47.3 44.6 56.5 73.1 70.6 61.7 49.6 57.1 53.3 60.1 75.3 94.1 71.0 14.4 15.8 17.5 22.7 70.4 13.7 16.8 13.8 24.3 68.7 20.9 23.8 23.8 19.0 87.5 15.4 18.2 18.1 17.1 68.8 18.2 16.4
Turkey 32.8 54.0 46.3 55.2 53.8 31.6 40.8 78.8 94.9 113.9 122.5 198.5 272.1 253.4 12.2 10.1 14.1 14.5 50.9 52.5 67.2 61.3 80.8 261.7 19.7 18.0 17.4 18.3 73.3 72.2 94.8 83.4 93.4 343.9 11.0 58.8
Spain 21.3 23.0 14.0 50.4 173.0 77.0 38.8 24.6 31.0 32.4 51.9 52.1 55.6 49.0 9.7 30.1 16.8 17.0 73.7 11.7 14.7 13.3 20.7 60.4 16.1 18.5 12.7 19.0 66.4 10.9 20.6 13.5 17.9 62.9 8.8 15.5
Slovenia 21.3 27.2 31.8 41.4 69.1 65.1 34.3 139.1 140.3 128.0 129.6 156.1 203.4 190.9 9.2 15.9 23.4 20.6 69.1 37.8 35.3 45.0 47.0 165.1 22.6 26.5 23.1 16.0 88.2 39.8 50.3 50.8 44.5 185.4 15.8 34.4
Albanija 17.4 23.6 27.5 40.7 73.1 107.0 84.0 4.0 6.3 9.1 11.7 19.7 35.7 24.1 16.6 16.1 18.5 21.1 72.4 2.7 7.1 7.4 5.8 22.9 18.1 22.3 25.0 21.6 87.1 5.7 11.0 12.6 10.1 39.5 14.6 2.8
G.Britain 35.2 42.5 42.9 36.6 76.0 70.1 42.9 39.5 54.7 44.2 38.2 52.9 70.6 63.6 10.7 10.5 20.4 17.8 59.3 44.0 66.7 56.2 118.7 285.6 12.5 11.8 15.2 14.8 54.2 222.8 130.3 140.8 97.1 591.0 13.4 99.7
Russia 13.7 19.7 21.4 25.6 23.6 32.7 22.5 179.0 271.0 425.2 569.7 638.2 932.0 495.1 4.0 6.4 6.1 10.3 26.7 128.4 130.5 145.2 148.5 552.5 12.6 9.9 8.2 8.9 39.6 210.2 159.9 150.1 163.4 683.7 4.4 163.0
USA 72.8 72.1 44.4 22.4 52.7 11.2 9.5 56.6 48.0 45.2 40.3 78.5 101.6 110.8 2.0 3.3 2.4 6.6 14.2 24.2 23.4 31.8 23.2 102.6 8.4 4.9 5.6 17.1 36.0 16.3 17.0 22.7 32.7 88.7 12.8 14.1
Sweden 5.6 5.7 8.3 19.4 15.2 9.4 9.5 20.2 25.1 20.1 29.6 55.0 53.5 31.6 2.3 3.1 3.4 4.3 13.2 4.5 12.8 7.0 9.5 33.8 2.7 4.5 5.4 4.9 17.4 7.8 8.9 8.4 7.1 32.2 2.3 5.7
Austria 7.7 8.5 9.0 15.0 20.0 22.5 19.1 56.2 68.9 69.2 80.5 102.7 119.9 100.3 6.3 10.3 9.2 11.1 37.0 17.5 23.4 26.0 27.3 94.2 8.8 10.6 10.6 8.2 38.3 25.4 36.8 34.7 36.1 133.1 12.8 26.9
Romania 1.4 1.8 4.2 13.4 19.3 33.5 20.0 14.4 113.1 64.9 91.9 96.7 117.7 108.8 6.2 11.5 21.4 15.2 54.3 34.2 33.7 28.3 30.7 126.8 9.4 13.4 13.4 10.1 46.2 32.3 20.0 24.7 17.3 94.3 10.4 28.0
Czech 3.1 5.4 6.0 10.7 11.3 14.4 9.3 12.0 17.5 23.3 32.9 64.6 65.5 51.9 1.5 3.0 5.8 5.0 15.3 12.3 11.6 13.3 14.2 51.3 2.9 8.7 7.0 4.1 22.7 13.2 14.5 15.5 17.4 60.5 7.5 21.8
France 54.7 77.3 19.9 10.3 16.1 24.3 12.6 51.5 67.5 61.0 66.6 90.8 124.7 91.8 3.7 2.8 3.4 4.1 13.9 18.1 22.2 22.7 22.1 85.0 3.7 4.4 4.4 8.0 20.5 23.3 26.4 38.6 37.5 125.8 3.9 17.8
Switzerland 19.3 6.4 7.5 10.2 10.8 16.2 17.4 27.2 45.7 63.9 59.2 114.7 292.8 124.3 3.6 4.5 5.0 5.6 18.8 21.4 19.5 19.4 39.1 99.4 6.2 9.6 8.3 7.4 31.5 40.9 39.6 41.7 49.8 172.0 7.4 45.3
Hungary 2.8 2.2 2.7 6.5 6.7 7.2 3.8 29.1 31.0 36.3 37.6 55.2 80.6 50.9 2.0 1.5 2.2 3.0 8.6 12.2 11.2 12.5 11.7 47.6 1.7 2.0 2.7 2.0 8.4 10.0 12.1 13.3 14.2 49.7 3.3 13.8
Poland 0.5 2.6 4.0 6.4 11.2 16.8 8.1 26.4 78.3 94.6 117.8 162.7 265.3 83.2 2.4 3.9 10.1 7.8 24.2 12.8 14.7 20.9 21.4 69.8 4.9 9.2 5.9 5.4 25.3 18.9 21.3 20.7 21.1 82.1 3.9 16.0
Cyprus 0.5 4.8 5.5 4.5 3.0 5.5 0.2 4.1 4.7 3.5 1.5 1.9 4.0 1.2 0.2 0.2 0.1 0.1 0.6 0.2 0.2 0.1 0.2 0.7 0.3 0.1 0.1 0.1 0.6 0.1 0.3 0.2 0.1 0.8 3.9 0.2
Australia 2.5 2.5 1.7 2.3 3.6 3.3 3.9 6.7 2.7 4.3 1.8 3.4 3.3 3.1 0.9 0.8 0.7 1.4 3.7 0.6 0.7 0.5 0.7 2.4 1.1 0.9 1.1 1.8 4.9 0.4 1.8 1.6 0.7 4.5 0.8 0.5
Ukraine 1.8 2.2 2.0 1.8 2.0 3.0 10.1 88.0 74.1 72.1 105.7 104.4 203.0 84.5 0.3 5.1 5.7 10.2 21.3 25.5 35.5 22.0 34.6 117.6 26.7 24.7 31.7 12.8 95.8 48.2 35.2 53.3 20.9 157.6 5.1 26.5
Korea 0.1 2.0 1.4 1.7 0.0 0.3 4.6 14.0 23.4 33.7 41.4 55.1 57.7 38.6 0.8 0.2 0.4 0.4 1.8 8.6 11.0 11.4 12.5 43.4 0.5 0.3 3.9 14.8 19.4 8.8 11.7 13.1 12.2 45.8 21.4 5.4
China 14.6 1.4 9.9 1.5 0.6 1.6 3.2 48.3 82.0 115.3 138.6 245.6 315.6 290.1 18.4 15.5 23.2 32.0 89.2 65.9 66.8 70.2 85.9 288.8 15.4 33.1 38.9 40.0 127.5 70.8 90.4 94.5 99.0 354.7 38.0 94.0
Danmark 3.3 2.3 2.8 1.6 3.7 13.8 2.2 11.3 14.8 14.3 16.9 19.5 22.5 19.5 0.8 0.8 1.0 2.0 4.6 4.5 5.9 5.0 5.3 20.7 3.3 3.1 1.6 3.9 11.9 5.2 5.5 5.1 5.9 21.6 1.5 5.3
Japan 5.8 2.7 8.4 1.2 0.7 1.3 3.2 19.3 24.4 22.8 26.9 41.2 58.1 54.6 0.0 0.3 0.1 0.4 0.9 8.5 10.8 11.9 14.1 45.4 0.1 0.7 0.2 0.1 1.1 13.2 12.9 11.2 14.7 52.0 0.2 12.3
Canada 0.5 1.1 1.1 1.0 1.8 1.3 1.4 4.0 8.6 22.3 35.5 15.8 17.4 23.2 0.4 0.4 0.5 0.8 2.0 4.4 3.3 3.5 4.3 15.5 0.5 0.6 0.5 2.2 3.8 5.1 5.1 5.8 5.8 21.8 0.9 5.7
Belarus 0.1 0.2 0.5 0.9 2.6 3.1 0.7 0.6 0.2 0.2 0.2 0.4 1.5 1.1 0.2 1.7 0.9 0.2 3.1 0.1 0.2 0.2 0.2 0.7 0.9 2.8 1.1 0.2 5.1 0.1 0.8 1.0 0.4 2.3 0.7 0.5
Hong Kong 0.2 0.1 0.1 0.2 0.0 0.1 0.4 2.4 3.0 2.6 1.7 13.9 16.1 2.5 0.1 0.2 0.2 0.1 0.6 0.7 0.9 0.5 0.8 2.9 0.1 0.1 0.2 0.3 0.7 0.7 0.7 0.6 0.8 2.9 0.2 0.5
Lihtenstien 0.0 0.3 0.3 0.1 0.0 0.0 0.0 0.7 0.4 0.6 0.2 0.3 0.2 0.1 0.0 0.0 0.0 0.0 0.1 0.0 0.0 0.0 0.0 0.0 0.0 0.0 0.0 0.0 0.0 0.0 0.0 0.0 0.0 0.0 0.0 0.0
Argentina 0.0 0.3 1.6 0.0 0.0 0.0 0.0 5.6 9.9 8.7 10.1 13.4 14.8 15.0 0.0 0.0 0.0 0.0 0.0 4.0 3.3 3.5 3.9 14.8 2.1 1.1 0.2 1.4 4.7 2.8 3.7 4.0 4.7 15.3 1.0 3.1
Bolivia 0.0 0.0 0.0 0.0 0.0 0.0 0.0 3.8 0.0 0.0 0.0 0.0 0.0 0.0 0.0 0.0 0.0 0.0 0.0 0.0 0.0 0.0 0.0 0.0 0.0 0.0 0.0 0.0 0.0 0.0 0.0 0.0 0.0 0.0 0.0 0.0
Brazil 0.0 0.0 0.9 0.0 0.1 0.0 0.0 23.3 41.1 37.7 38.2 75.4 121.7 62.3 0.0 0.0 0.9 0.1 1.0 15.7 16.4 14.4 13.8 60.3 0.0 0.1 1.5 0.2 1.9 16.7 10.8 21.4 18.5 67.4 0.3 18.1
Source: State Statistical Office of the Republic of Macedonia
EXPORT IMPORT EXPORT IMPORT EXPORT EXPORT IMPORT
2010 2010 2011 2011 2012 2012
IMPORT

Table 26
Stock of direct investment in Republic of Macedonia-
by country - 1997 - 2010
in million EUR
2001
Value
Share
(%)
Value
Share
(%)
Value
Share
(%)
Value
Share
(%)
Value
Share
(%)
Value
Share
(%)
Value
Share
(%)
Value
Share
(%)
Value
Share
(%)
Afganistan 0.00 0.00 0.00 0.00 0.00 0.00 0.01 0.00 0.01 0.00 0.01 0.00 0.01 0.00 0.01 0.00 0.02 0.00
Albania 0.03 0.02 0.01 0.01 0.03 0.01 0.11 0.02 0.60 0.06 2.06 0.18 2.04 0.16 4.42 0.27 3.57 0.20
Azerbaijan
Australia -0.08 -0.06 0.15 0.06 0.29 0.08 0.33 0.06 0.44 0.04 1.82 0.16 2.11 0.16 2.10 0.13 2.08 0.12
Austria 17.56 12.43 30.15 11.15 39.47 10.97 32.99 5.69 36.78 3.54 37.69 3.25 42.82 3.31 62.29 3.87 57.72 3.26
Bahamas 0.00 0.00 0.00 0.00 0.00 0.00 0.00 0.00
Barbados
Belgium 0.07 0.05 0.08 0.03 0.04 0.01 0.07 0.01 0.42 0.04 0.50 0.04 1.25 0.10 1.31 0.08 1.28 0.07
Bermudas
Bosnia and Hercegovina 1.57 1.11 2.94 1.09 2.81 0.78 2.72 0.47 2.40 0.23 2.42 0.21 2.36 0.18 0.70 0.04 0.20 0.01
Belize
British Virgin Islands 0.07 0.05 0.15 0.05 0.49 0.14 1.41 0.24 3.86 0.37 7.00 0.60 11.33 0.88 8.72 0.54 11.80 0.67
Bulgaria 2.58 1.83 3.35 1.24 2.90 0.81 3.55 0.61 6.57 0.63 11.68 1.01 23.28 1.80 24.33 1.51 27.36 1.55
Byelorussia 0.01 0.00 0.01 0.00
Canada 0.01 0.01 0.01 0.00 0.05 0.01 0.28 0.05 0.08 0.01 0.10 0.01 0.28 0.02 0.41 0.03 0.47 0.03
Cayman Islands 0.07 0.05 0.06 0.02 0.10 0.03
Central African Republic
Sri Lanka
China 0.01 0.00 0.01 0.00 0.02 0.01 0.04 0.01 0.04 0.00 0.06 0.01 0.22 0.02 0.93 0.06 1.08 0.06
Taiwan 2.77 0.48 4.21 0.41 3.48 0.30 3.28 0.25 2.55 0.16 0.77 0.04
Cuk Islands
Costa Rica
Croatia 5.77 4.09 6.40 2.37 7.58 2.10 8.18 1.41 10.33 0.99 12.33 1.06 10.92 0.85 15.74 0.98 20.34 1.15
Cuba
Cyprus 1.18 0.83 77.11 28.52 92.76 25.77 117.87 20.32 138.70 13.35 141.58 12.20 141.07 10.92 150.53 9.35 160.81 9.09
Czesh Republic 0.01 0.01 0.07 0.02 0.10 0.03 0.13 0.02 0.14 0.01 0.18 0.02 0.22 0.02 0.26 0.02 0.27 0.02
Denmark 0.02 0.01 0.02 0.01 0.02 0.01 0.09 0.02 0.10 0.01 0.10 0.01 0.08 0.01 0.07 0.00
Dominikan Republic -0.01 0.00
El Salvador
Estonia
Finland
France 0.23 0.16 0.35 0.13 0.42 0.12 7.99 1.38 5.89 0.57 10.75 0.93 15.18 1.17 19.58 1.22 1.47 0.08
Gorgia
Germany 9.33 6.61 14.12 5.22 15.92 4.42 50.18 8.65 54.57 5.25 52.47 4.52 57.26 4.43 70.57 4.38 64.07 3.62
Gibraltar 0.31 0.22 0.40 0.15 0.49 0.14 0.88 0.15 0.78 0.08 1.01 0.09 0.35 0.03 0.44 0.03 0.51 0.03
Greece 9.74 6.89 12.77 4.72 20.48 5.69 105.28 18.15 174.21 16.76 213.02 18.35 223.02 17.26 264.10 16.40 279.21 15.78
Hong Kong 0.29 0.08 0.32 0.06
Hungary 0.02 0.01 0.02 0.01 0.02 0.00 0.01 0.00 300.58 28.93 300.10 25.86 313.37 24.25 354.40 22.01 350.01 19.79
Iceland 0.89 0.63 0.12 0.04 0.06 0.02 0.05 0.01 0.04 0.00
India 0.00 0.00 0.00 0.00 0.00 0.00 0.00 0.00 0.00 0.00 0.00 0.00
Iran 0.08 0.06 0.09 0.03 0.10 0.03 0.03 0.01 0.05 0.01 0.01 0.00 0.01 0.00 0.08 0.01 0.04 0.00
Iraq 0.00 0.00 0.01 0.00 0.00 0.00 0.01 0.00 0.04 0.00 0.04 0.00 0.05 0.00 0.02 0.00 0.00 0.00
Ireland 0.00 0.00 -0.05 -0.02 -0.06 -0.02 0.13 0.02 0.65 0.06
Israel 0.15 0.06 0.10 0.03 0.11 0.02
Italy 9.87 6.99 10.96 4.05 11.44 3.18 11.41 1.97 13.88 1.34 16.50 1.42 14.97 1.16 32.09 1.99 37.69 2.13
Japan 0.01 0.00 0.01 0.00
Johanson Island
Jordan 0.03 0.02 0.04 0.01 0.05 0.01 0.06 0.01 0.02 0.00 0.02 0.00
Korea, Republic
Lebanon 0.01 0.00
Libya 0.00 0.00 0.00 0.00
Liechtenstein 0.18 0.12 3.77 1.40 10.24 2.85 4.76 0.82 6.49 0.62 4.07 0.35 22.00 1.70 1.48 0.09 2.46 0.14
Lithuania
Luxembourg 0.20 0.14 1.80 0.66 1.88 0.52 2.28 0.39 2.33 0.22 2.30 0.20 2.24 0.17 10.83 0.67 15.16 0.86
2000
Country
1997 1998 1999 2002 2003 2004 2005

Stock of direct investment in Republic of Macedonia-
by country - 1997 - 2010
in million EUR
2001
Value
Share
(%)
Value
Share
(%)
Value
Share
(%)
Value
Share
(%)
Value
Share
(%)
Value
Share
(%)
Value
Share
(%)
Value
Share
(%)
Value
Share
(%)
2000
Country
1997 1998 1999 2002 2003 2004 2005
Malaysia 0.00 0.00 0.00 0.00
Malta 0.01 0.00 0.03 0.00 -0.03 0.00 -0.12 -0.01 -0.18 -0.01
Mauricius
Mexico -0.91 -0.34 0.15 0.04
Moldova -0.05 0.00
Montenegro
Netherlands 1.43 1.01 4.63 1.71 10.23 2.84 14.70 2.53 15.59 1.50 61.06 5.26 69.72 5.40 103.23 6.41 213.35 12.06
Netherlands Antilles 98.87 6.14 69.52 3.93
Nigeria 0.02 0.01 0.02 0.01 0.01 0.00
Norway 0.02 0.01 0.02 0.00 0.07 0.01 0.05 0.00 0.03 0.00 -0.08 -0.01
Marshall Island 1.25 0.89 0.65 0.24 0.67 0.19 0.11 0.02 0.21 0.02 0.19 0.02 0.25 0.02 0.28 0.02 0.02 0.00
Pakistan 0.00 0.00 0.00 0.00 0.00 0.00 0.00 0.00 -0.01 0.00 -0.01 0.00 0.00 0.00 -0.01 0.00 -0.01 0.00
Panama 2.00 1.42 2.91 1.08 3.10 0.86 3.52 0.61 12.93 1.24 13.30 1.15 13.34 1.03 2.98 0.19 3.24 0.18
Poland 0.00 0.00 0.09 0.02 0.04 0.01 0.00 0.00 0.02 0.00 0.05 0.00 0.06 0.00 0.12 0.01
Portugal
Romania 0.12 0.02 0.14 0.01 0.33 0.03 0.33 0.03 0.47 0.03 0.43 0.02
Russia 3.52 2.50 5.47 2.02 2.51 0.70 0.01 0.00 0.01 0.00 1.29 0.11 1.31 0.10 1.38 0.09 1.34 0.08
St Kitts and Nevis
Saint Vincent and the Grenadines 36.09 2.04
San Marino 0.79 0.07 0.67 0.05 0.70 0.04 0.76 0.04
Saudi Arabija
Serbia
Seychelles 0.05 0.01 0.06 0.01 0.09 0.01 -0.12 -0.01 2.06 0.13 -0.01 0.00
Singapore 0.02 0.00
Slovakia 0.06 0.04 0.06 0.02 0.07 0.02 0.08 0.01 0.02 0.00 0.02 0.00 0.00 0.00 0.07 0.00 0.18 0.01
Slovenia 16.41 11.62 21.18 7.84 43.70 12.14 56.16 9.68 58.83 5.66 66.41 5.72 84.74 6.56 101.85 6.33 106.79 6.04
South Africa 0.01 0.00 0.01 0.00
Spain -0.01 0.00 0.03 0.00 0.02 0.00 -0.04 0.00 -0.04 0.00 0.00 0.00
Sweden 1.40 0.99 1.63 0.60 1.72 0.48 2.21 0.38 1.10 0.11 2.34 0.20 1.96 0.15 2.51 0.16 2.47 0.14
Switzerland 32.14 22.76 40.85 15.11 45.83 12.73 61.48 10.60 79.20 7.62 85.15 7.34 101.85 7.88 143.90 8.94 164.20 9.28
Syria 0.01 0.01 0.01 0.00 0.01 0.00 0.01 0.00 0.09 0.01 0.18 0.02 0.15 0.01 0.15 0.01 0.15 0.01
United Arab Emirates 0.01 0.00 0.04 0.00 0.04 0.00 0.04 0.00 0.06 0.00 0.04 0.00
Turkey 0.70 0.50 1.15 0.42 14.24 3.96 16.12 2.78 16.23 1.56 17.98 1.55 18.86 1.46 26.49 1.65 25.06 1.42
Ukraine 0.01 0.01 0.01 0.00 0.01 0.00 0.01 0.00 0.01 0.00 0.01 0.00 0.18 0.01 0.64 0.04 3.55 0.20
Egypt
Great Britain 5.27 3.73 5.85 2.17 4.19 1.16 30.17 5.20 19.03 1.83 12.75 1.10 23.13 1.79 27.66 1.72 26.37 1.49
Jrsey
Isle of man
United States of America 1.40 0.99 2.37 0.88 4.14 1.15 12.54 2.16 33.96 3.27 41.27 3.56 42.24 3.27 25.62 1.59 29.84 1.69
Virgin Islands of the USA 0.00 0.00 0.00 0.00 0.17 0.02 0.22 0.02 0.48 0.04 0.83 0.05 0.86 0.05
Uzbekistan 0.00 0.00 0.00 0.00
Serbia and Montenegro 15.86 11.23 19.43 7.19 21.12 5.87 19.28 3.32 29.65 2.85 26.68 2.30 29.13 2.25 29.50 1.83 32.83 1.86
International Finance Corporation
Europian Bank for Reconstruction and Development 9.33256 1.61 7.576185 0.73 9.193529 0.79 14.13 1.09 13.17 0.82 13.60 0.77
Central African Cantris development support bank
Northatlantic cooperation aliance
Total 141.22 100.00 270.37 100.00 359.9 100.00 580.05 100.00 1039.153 100.00 1160.707 100.00 1,292.14 #### 1,610.22 100.00 1,768.97 100.00

Table 26
Stock of direct investment in Republic of Macedonia-
by country - 1997 - 2010
in million EUR
AfganistanAlbania
Azerbaijan
Australia
Austria
Bahamas
Barbados
Belgium
Bermudas
Bosnia and Hercegovina
Belize
British Virgin Islands
Bulgaria
Byelorussia
Canada
Cayman Islands
Central African Republic
Sri Lanka
China
Taiwan
Cuk Islands
Costa Rica
Croatia
Cuba
Cyprus
Czesh Republic
Denmark
Dominikan Republic
El Salvador
Estonia
Finland
France
Gorgia
Germany
Gibraltar
Greece
Hong Kong
Hungary
Iceland
India
Iran
Iraq
Ireland
Israel
Italy
Japan
Johanson Island
Jordan
Korea, Republic
Lebanon
Libya
Liechtenstein
Lithuania
Luxembourg
Country
Value
Share
(%)
Value
Share
(%)
Value
Share
(%)
Value
Share
(%)
Value
Share
(%)0.02 0.00 0.03 0.00 0.04 0.00 0.04 0.00 0.01 0.00
11.60 0.55 16.63 0.65 23.90 0.81 27.90 0.89 35.68 1.06
4.02 0.12
2.32 0.11 1.96 0.08 2.40 0.08 2.36 0.08 2.41 0.07
219.41 10.46 238.29 9.36 334.58 11.27 362.58 11.54 371.88 11.10
0.00 0.00
0.41 0.02
0.89 0.04 1.28 0.05 1.17 0.04 1.20 0.04 1.17 0.03
0.00 0.00 0.06 0.00 0.11 0.00 0.13 0.00 0.23 0.01
1.00 0.05 1.32 0.05 1.82 0.06 2.54 0.08 3.39 0.10
0.00 0.00 0.01 0.00 0.03 0.00
15.85 0.76 29.44 1.16 51.31 1.73 58.11 1.85 66.98 2.00
42.79 2.04 62.49 2.46 86.50 2.91 92.29 2.94 116.19 3.47
1.06 0.05 2.33 0.09 3.16 0.11 2.85 0.09 4.13 0.12
-1.00 -0.03 -1.00 -0.03 -1.31 -0.04
0.02 0.00
0.05 0.00
1.41 0.07 1.51 0.06 1.30 0.04 0.95 0.03 1.01 0.03
2.16 0.10 1.57 0.06 0.77 0.03 0.77 0.02
1.17 0.05 1.29 0.04
0.19 0.01 0.19 0.01 0.26 0.01
30.59 1.46 44.27 1.74 53.23 1.79 55.54 1.77 72.27 2.16
0.00 0.00 0.00 0.00 0.00 0.00
182.23 8.68 20.53 0.81 34.90 1.18 47.93 1.53 45.69 1.36
0.29 0.01 7.51 0.30 0.49 0.02 0.51 0.02 2.85 0.09
0.54 0.03 1.24 0.05 1.27 0.04 1.45 0.05 1.90 0.06
0.00 0.00 0.00 0.00
0.00 0.00
0.01 0.00 0.00 0.00 0.01 0.00
0.29 0.01 10.51 0.41 13.04 0.44 26.15 0.83 129.68 3.87
0.00 0.00 0.00
64.08 3.05 85.91 3.38 66.23 2.23 61.98 1.97 71.37 2.13
0.70 0.03 0.79 0.03 0.00
320.40 15.27 387.14 15.21 450.70 15.18 380.31 12.11 431.55 12.88
0.04 0.00 0.05 0.00 0.04 0.00
350.35 16.69 421.25 16.55 410.56 13.83 388.75 12.38 346.77 10.35
8.14 0.32 12.15 0.41 11.62 0.37 3.26 0.10
0.00 0.00 0.00 0.00 0.00 0.00 0.00 0.00 0.02 0.00
0.03 0.00 0.04 0.00 0.04 0.00 0.03 0.00 0.04 0.00
0.04 0.00 -0.02 0.00 0.00 0.00 0.00 0.00 0.00 0.00
0.03 0.00 0.01 0.00 0.40 0.01 0.41 0.01
0.01 0.00 4.27 0.17 4.11 0.14 3.99 0.13 4.39 0.13
44.39 2.12 46.50 1.83 55.54 1.87 55.85 1.78 58.50 1.75
-0.17 -0.01
0.02 0.00
0.00 0.00 0.00 0.00
0.03 0.00
0.00 0.00 0.31 0.01 0.41 0.01
6.70 0.32 1.57 0.06 2.05 0.07 1.65 0.05 18.09 0.54
0.00
25.42 1.21 71.85 2.82 69.14 2.33 62.03 1.97 16.10 0.48
2008 2009 20102006 2007
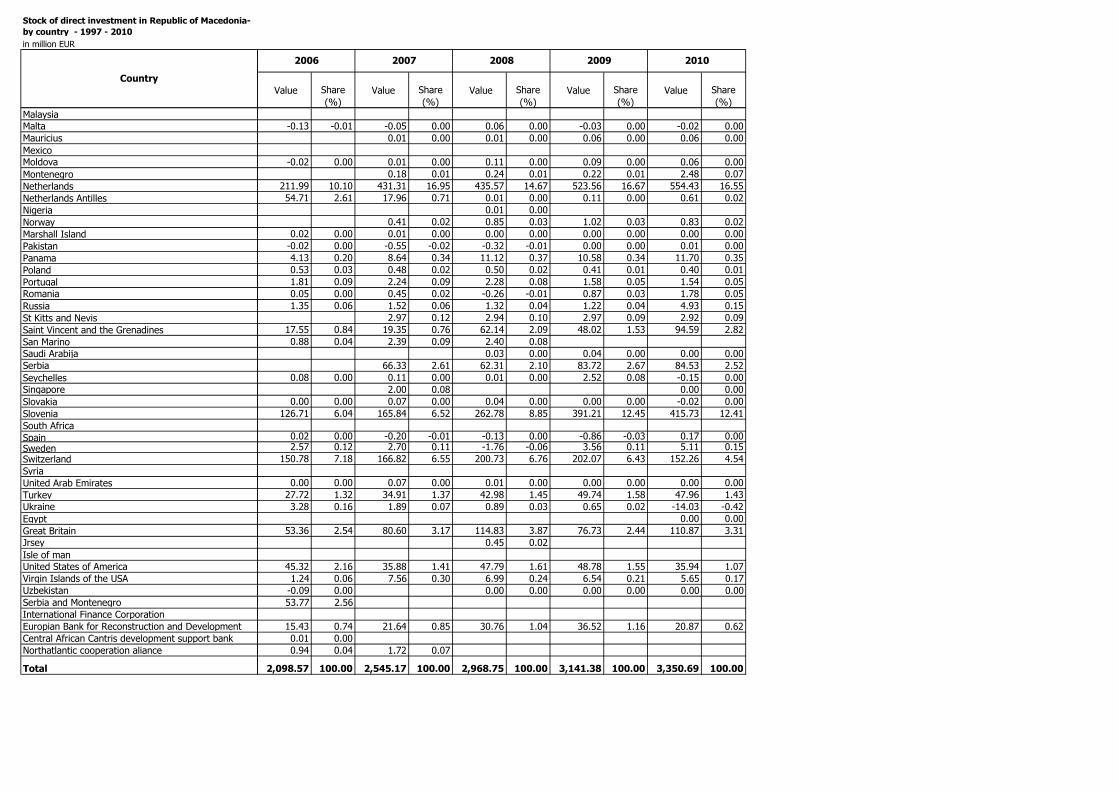
Stock of direct investment in Republic of Macedonia-
by country - 1997 - 2010
in million EUR
Country
Malaysia
Malta
Mauricius
Mexico
Moldova
Montenegro
Netherlands
Netherlands Antilles
Nigeria
Norway
Marshall Island
Pakistan
Panama
Poland
Portugal
Romania
Russia
St Kitts and Nevis
Saint Vincent and the Grenadines
San Marino
Saudi Arabija
Serbia
Seychelles
Singapore
Slovakia
Slovenia
South Africa
SpainSwedenSwitzerland
Syria
United Arab Emirates
Turkey
Ukraine
Egypt
Great Britain
Jrsey
Isle of man
United States of America
Virgin Islands of the USA
Uzbekistan
Serbia and Montenegro
International Finance Corporation
Europian Bank for Reconstruction and Development
Central African Cantris development support bank
Northatlantic cooperation aliance
Total
Value
Share
(%)
Value
Share
(%)
Value
Share
(%)
Value
Share
(%)
Value
Share
(%)
2008 2009 20102006 2007
-0.13 -0.01 -0.05 0.00 0.06 0.00 -0.03 0.00 -0.02 0.00
0.01 0.00 0.01 0.00 0.06 0.00 0.06 0.00
-0.02 0.00 0.01 0.00 0.11 0.00 0.09 0.00 0.06 0.00
0.18 0.01 0.24 0.01 0.22 0.01 2.48 0.07
211.99 10.10 431.31 16.95 435.57 14.67 523.56 16.67 554.43 16.55
54.71 2.61 17.96 0.71 0.01 0.00 0.11 0.00 0.61 0.02
0.01 0.00
0.41 0.02 0.85 0.03 1.02 0.03 0.83 0.02
0.02 0.00 0.01 0.00 0.00 0.00 0.00 0.00 0.00 0.00
-0.02 0.00 -0.55 -0.02 -0.32 -0.01 0.00 0.00 0.01 0.00
4.13 0.20 8.64 0.34 11.12 0.37 10.58 0.34 11.70 0.35
0.53 0.03 0.48 0.02 0.50 0.02 0.41 0.01 0.40 0.01
1.81 0.09 2.24 0.09 2.28 0.08 1.58 0.05 1.54 0.05
0.05 0.00 0.45 0.02 -0.26 -0.01 0.87 0.03 1.78 0.05
1.35 0.06 1.52 0.06 1.32 0.04 1.22 0.04 4.93 0.15
2.97 0.12 2.94 0.10 2.97 0.09 2.92 0.09
17.55 0.84 19.35 0.76 62.14 2.09 48.02 1.53 94.59 2.82
0.88 0.04 2.39 0.09 2.40 0.08
0.03 0.00 0.04 0.00 0.00 0.00
66.33 2.61 62.31 2.10 83.72 2.67 84.53 2.52
0.08 0.00 0.11 0.00 0.01 0.00 2.52 0.08 -0.15 0.00
2.00 0.08 0.00 0.00
0.00 0.00 0.07 0.00 0.04 0.00 0.00 0.00 -0.02 0.00
126.71 6.04 165.84 6.52 262.78 8.85 391.21 12.45 415.73 12.41
0.02 0.00 -0.20 -0.01 -0.13 0.00 -0.86 -0.03 0.17 0.002.57 0.12 2.70 0.11 -1.76 -0.06 3.56 0.11 5.11 0.15
150.78 7.18 166.82 6.55 200.73 6.76 202.07 6.43 152.26 4.54
0.00 0.00 0.07 0.00 0.01 0.00 0.00 0.00 0.00 0.00
27.72 1.32 34.91 1.37 42.98 1.45 49.74 1.58 47.96 1.43
3.28 0.16 1.89 0.07 0.89 0.03 0.65 0.02 -14.03 -0.42
0.00 0.00
53.36 2.54 80.60 3.17 114.83 3.87 76.73 2.44 110.87 3.31
0.45 0.02
45.32 2.16 35.88 1.41 47.79 1.61 48.78 1.55 35.94 1.07
1.24 0.06 7.56 0.30 6.99 0.24 6.54 0.21 5.65 0.17
-0.09 0.00 0.00 0.00 0.00 0.00 0.00 0.00
53.77 2.56
15.43 0.74 21.64 0.85 30.76 1.04 36.52 1.16 20.87 0.62
0.01 0.00
0.94 0.04 1.72 0.07
2,098.57 100.00 2,545.17 100.00 2,968.75 100.00 3,141.38 100.00 3,350.69 100.00

Table 27
Stock of direct investment in Republic of Macedonia - by activity, 2009-2010/1
NACE Rev.2
(in million EUR)
ValueShare
(%)Value
Share
(%)AGRICULTURE, FORESTRY AND FISHING 16.35 0.52 26.97 0.80
Extraction of crude petroleum, natural gas and mining support
service activities 89.32 2.84 133.64 3.99
MINING AND QUARRYING 1.19 0.04 2.13 0.06
MANUFACTURING 953.40 30.35 1,044.46 31.17
Food products, beverages and tabaco products 249.75 7.95 262.75 7.84
TOTAL textiles & wood activities 52.21 1.66 60.47 1.80
Textiles and wearing apparel 37.29 1.19 43.52 1.30
Wood, paper, printing and reproduction 14.92 0.47 16.96 0.51
TOTAL petroleum, chemicals, pharmaceutical products, rubber
& plastic products 125.52 4.00 130.84 3.90
Coke and refined petroleum products 71.04 2.26 73.19 2.18
Chemicals and chemical products 29.35 0.93 30.70 0.92
Rubber and plastic products 5.20 0.17 5.59 0.17
TOTAL metal & machinery products 336.98 10.73 332.62 9.93
Basic metals and fabricated metal products 330.98 10.54 327.36 9.77
Computer, electronic and optical products 0.04 0.00 0.05 0.00
Machinery and equipment n.e.c. 5.95 0.19 5.21 0.16
TOTAL vehicles & other transport equipment 88.41 2.81 164.09 4.90
Motor vehicles, trailers and semitrailers 79.08 2.52 151.67 4.53
Other transport equipment 9.33 0.30 12.42 0.37
TOTAL of other manufaturing 97.31 3.10 90.70 2.71
ELECTRICITY, GAS, STEAM AND AIR CONDITIONING
SUPPLY 228.30 7.27 225.80 6.74
WATER SUPPLY; SEWERAGE, WASTE MANAGEMENT
AND REMEDIATION ACTIVITIES 1.35 0.04 -0.32 -0.01
Water collection, treatment and supply
Sewerage, waste management, remediation activities 0.65 0.02 -0.23 -0.01
CONSTRUCTION 128.99 4.11 152.95 4.56
TOTAL SERVICES 1,722.36 54.83 1,725.07 51.48
WHOLESALE AND RETAIL TRADE; REPAIR OF MOTOR
VEHICLES AND MOTORCYCLES 372.02 11.84 378.26 11.29
Wholesale and retail trade and repair of motor vehicles and
motorcycles 40.54 1.29 39.82 1.19
Wholesale trade, except of motor vehicles and motorcycles 207.94 6.62 210.86 6.29
Retail trade, except of motor vehicles and motorcycles 123.54 3.93 127.58 3.81
TRANSPORTATION AND STORAGE 17.71 0.56 21.02 0.63
TOTAL transport and storage 15.46 0.49 19.34 0.58
Land transport and transport via pipelines 8.81 0.28 9.88 0.29
Water transport
Air transport 1.86 0.06 -0.73 -0.02
Warehousing and support activties for transportation 4.80 0.15 9.28 0.28
Postal and courier activities 2.25 0.07 1.67 0.05
ACCOMMODATION AND FOOD SERVICE ACTIVITIES 47.66 1.52 53.64 1.60
Activity2009 2010

(in million EUR)
ValueShare
(%)Value
Share
(%)
Activity2009 2010
INFORMATION AND COMMUNICATION 188.99 6.02 200.22 5.98
Motion picture, video, television programme production, other
entertainment activities 2.38 0.08 0.94 0.03
Telecommunications 169.78 5.40 179.88 5.37
Other information and communication activities 16.83 0.54 19.44 0.58
FINANCIAL AND INSURANCE ACTIVITIES 910.96 29.00 895.46 26.72
Financial intermediation, except insurance and pension funding 842.72 26.83 827.51 24.70
Activities of holding companies 440.33 14.02 402.81 12.02
Insurance , reinsurance and pension funding, except
compulsory social security 62.77 2.00 62.31 1.86
Other financial activities 5.47 0.17 5.64 0.17
REAL ESTATE ACTIVITIES 66.49 2.12 63.42 1.89
PROFESSIONAL, SCIENTIFIC AND TECHNICAL
ACTIVITIES 34.05 1.08 36.87 1.10
Legal and accounting activities 1.77 0.06 2.14 0.06
Legal activities 1.30 0.04 1.44 0.04
Accounting, bookkeeping and auditing activities; tax
consultancy 0.47 0.01 0.70 0.02
Activities of head offices; management consultancy activities 5.78 0.18 7.51 0.22
Activities of head offices 0.04 0.00 0.00 0.00
Management consultancy activities 5.74 0.18 7.51 0.22
Architecture and engineering activities; technical testing and
analysis 15.56 0.50 15.21 0.45
Scientific research and development 0.01 0.00
Advertising and market research 9.85 0.31 10.58 0.32
Advertising 6.86 0.22 7.13 0.21
Market research and public opinion polling 2.98 0.09 3.45 0.10
Other professional, scientific and technical activities 1.09 0.03 1.43 0.04
ADMINISTRATIVE AND SUPPORT SERVICE ACTIVITIES 32.56 1.04 39.42 1.18
Rental and leasing activities 16.24 0.52 20.22 0.60
Other administrative and suport service activities 16.32 0.52 19.20 0.57
EDUCATION 1.59 0.05 1.59 0.05
HUMAN HEALTH AND SOCIAL WORK ACTIVITIES 4.16 0.13 2.00 0.06
ARTS, ENTERTAINMENT AND RECREATION 42.99 1.37 29.81 0.89
Creative, arts and entertainment activities 0.13 0.00 0.15 0.00
Libraries, archieves, museums and other cultural activities
Sporting and other recreational activities; gambling and betting
activities 42.86 1.36 29.66 0.89
OTHER SERVICE ACTIVITIES 2.94 0.09 3.35 0.10
Activities of membership organizations 0.03 0.00 0.00 0.00
Repair of computers and personal and houshold goods, other
services 2.91 0.09 3.36 0.10
non allocated 1.31 0.04 42.11 1.26
SUB-TOTAL 3,140.06 99.96 3,308.58 98.74
Private purchases and sales of real estate
TOTAL 3,141.38 100.00 3,350.69 100.00
1/ Preliminary data
Source: National Bank of the Republic of Macedonia
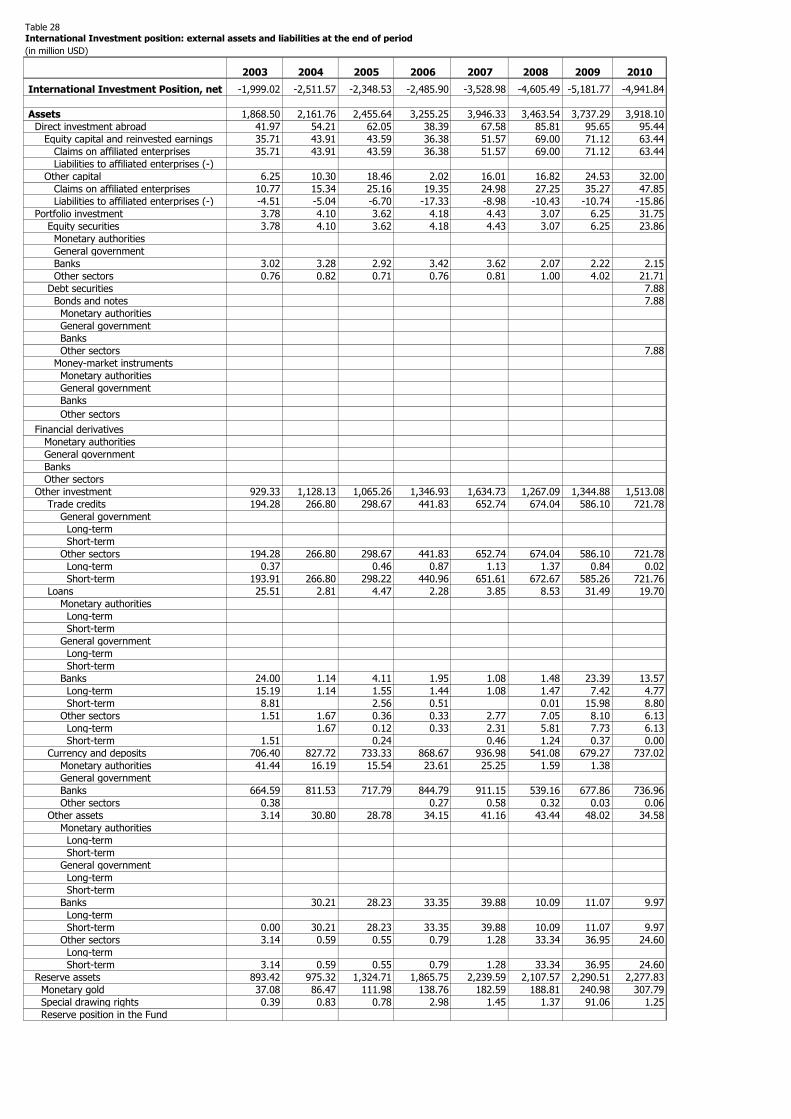
Table 28
International Investment position: external assets and liabilities at the end of period
(in million USD)
2003 2004 2005 2006 2007 2008 2009 2010
International Investment Position, net -1,999.02 -2,511.57 -2,348.53 -2,485.90 -3,528.98 -4,605.49 -5,181.77 -4,941.84
Assets 1,868.50 2,161.76 2,455.64 3,255.25 3,946.33 3,463.54 3,737.29 3,918.10
Direct investment abroad 41.97 54.21 62.05 38.39 67.58 85.81 95.65 95.44
Equity capital and reinvested earnings 35.71 43.91 43.59 36.38 51.57 69.00 71.12 63.44
Claims on affiliated enterprises 35.71 43.91 43.59 36.38 51.57 69.00 71.12 63.44
Liabilities to affiliated enterprises (-)
Other capital 6.25 10.30 18.46 2.02 16.01 16.82 24.53 32.00
Claims on affiliated enterprises 10.77 15.34 25.16 19.35 24.98 27.25 35.27 47.85
Liabilities to affiliated enterprises (-) -4.51 -5.04 -6.70 -17.33 -8.98 -10.43 -10.74 -15.86
Portfolio investment 3.78 4.10 3.62 4.18 4.43 3.07 6.25 31.75
Equity securities 3.78 4.10 3.62 4.18 4.43 3.07 6.25 23.86
Monetary authorities
General government
Banks 3.02 3.28 2.92 3.42 3.62 2.07 2.22 2.15
Other sectors 0.76 0.82 0.71 0.76 0.81 1.00 4.02 21.71
Debt securities 7.88
Bonds and notes 7.88
Monetary authorities
General government
Banks
Other sectors 7.88
Money-market instruments
Monetary authorities
General government
Banks
Other sectors
Financial derivatives
Monetary authorities
General government
Banks
Other sectors
Other investment 929.33 1,128.13 1,065.26 1,346.93 1,634.73 1,267.09 1,344.88 1,513.08
Trade credits 194.28 266.80 298.67 441.83 652.74 674.04 586.10 721.78
General government
Long-term
Short-term
Other sectors 194.28 266.80 298.67 441.83 652.74 674.04 586.10 721.78
Long-term 0.37 0.46 0.87 1.13 1.37 0.84 0.02
Short-term 193.91 266.80 298.22 440.96 651.61 672.67 585.26 721.76
Loans 25.51 2.81 4.47 2.28 3.85 8.53 31.49 19.70
Monetary authorities
Long-term
Short-term
General government
Long-term
Short-term
Banks 24.00 1.14 4.11 1.95 1.08 1.48 23.39 13.57
Long-term 15.19 1.14 1.55 1.44 1.08 1.47 7.42 4.77
Short-term 8.81 2.56 0.51 0.01 15.98 8.80
Other sectors 1.51 1.67 0.36 0.33 2.77 7.05 8.10 6.13
Long-term 1.67 0.12 0.33 2.31 5.81 7.73 6.13
Short-term 1.51 0.24 0.46 1.24 0.37 0.00
Currency and deposits 706.40 827.72 733.33 868.67 936.98 541.08 679.27 737.02
Monetary authorities 41.44 16.19 15.54 23.61 25.25 1.59 1.38
General government
Banks 664.59 811.53 717.79 844.79 911.15 539.16 677.86 736.96
Other sectors 0.38 0.27 0.58 0.32 0.03 0.06
Other assets 3.14 30.80 28.78 34.15 41.16 43.44 48.02 34.58
Monetary authorities
Long-term
Short-term
General government
Long-term
Short-term
Banks 30.21 28.23 33.35 39.88 10.09 11.07 9.97
Long-term
Short-term 0.00 30.21 28.23 33.35 39.88 10.09 11.07 9.97
Other sectors 3.14 0.59 0.55 0.79 1.28 33.34 36.95 24.60
Long-term
Short-term 3.14 0.59 0.55 0.79 1.28 33.34 36.95 24.60
Reserve assets 893.42 975.32 1,324.71 1,865.75 2,239.59 2,107.57 2,290.51 2,277.83
Monetary gold 37.08 86.47 111.98 138.76 182.59 188.81 240.98 307.79
Special drawing rights 0.39 0.83 0.78 2.98 1.45 1.37 91.06 1.25
Reserve position in the Fund

International Investment position: external assets and liabilities at the end of period
(in million USD)
2003 2004 2005 2006 2007 2008 2009 2010
Foreign exchange 855.95 888.02 1,211.95 1,724.01 2,055.55 1,917.38 1,958.47 1,968.79
Currency and deposits 768.61 863.28 1,177.39 1,514.40 1,322.23 345.05 665.53 462.27
With monetary authorities 705.98 685.16 1,073.79 913.94 1,064.78 129.90 665.53 462.27
With banks 62.63 178.12 103.60 600.46 257.45 215.15
Securities 87.34 24.74 34.56 209.61 733.32 1,572.34 1,292.94 1,506.52
Equities
Bonds and notes 87.34 24.74 34.56 209.61 733.32 1,572.34 1,292.94 1,506.52
Money-market instruments
Financial derivatives ,net
Other claims
Liabilities 3,867.52 4,673.33 4,804.17 5,741.15 7,475.31 8,069.03 8,919.06 8,859.94
Direct investment in reporting economy 1,614.65 2,190.55 2,086.86 2,763.82 3,739.36 4,185.34 4,504.11 4,449.71
Equity capital and reinvested earnings 1,477.00 1,858.46 1,863.48 2,454.03 3,271.35 3,393.98 3,557.64 3,509.50
Claims on direct investors (-)
Liabilities to direct investors 1,477.00 1,858.46 1,863.48 2,454.03 3,271.35 3,393.98 3,557.64 3,509.50
Other capital 137.65 332.09 223.38 309.79 468.01 791.36 946.47 940.22
Claims on direct investors (-) -59.96 -49.93 -87.93 -106.56 -155.90 -160.66 -243.69 -305.15
Liabilities to direct investors 197.61 382.02 311.31 416.35 623.91 952.02 1,190.15 1,245.37
Portfolio investment 107.24 71.62 273.93 364.73 445.25 373.49 590.69 524.71
Equity securities 80.48 39.99 52.77 114.01 194.77 187.93 195.57 181.74
Banks 12.60 19.06 29.53 106.21 90.88 99.69 107.12 107.45
Other sectors 67.88 20.94 23.25 7.79 103.89 88.24 88.45 74.30
Debt securities 26.76 31.63 221.15 250.73 250.48 185.55 395.11 342.96
Bonds and notes 26.76 31.63 221.15 250.73 250.48 185.55 395.11 342.96
Monetary authorities
General government 26.76 31.63 221.15 250.73 250.48 185.55 395.11 342.96
Banks
Other sectors
Money-market instruments
Monetary authorities
General government
Banks
Other sectors
Financial derivatives
Monetary authorities
General government
Banks
Other sectors
Other investment 2,145.63 2,411.16 2,443.39 2,612.59 3,290.70 3,510.20 3,824.26 3,885.52
Trade credits 398.16 469.80 441.08 486.21 854.50 914.41 914.57 877.88
General government 4.92 3.53 2.18
Long-term 4.92 3.53 2.18
Short-term
Other sectors 398.16 469.80 441.08 486.21 854.50 909.49 911.04 875.70
Long-term 61.76 30.96 13.02 25.80 21.36 33.23 27.49 18.08
Short-term 336.40 438.84 428.06 460.41 833.14 876.26 883.55 857.62
Loans 1,657.16 1,788.12 1,820.15 1,853.31 1,991.89 2,180.86 2,338.13 2,420.42
Monetary authorities 68.35 62.54 62.13 55.83
Use of Fund credit & loans from the Fund 68.35 62.54 62.13 55.83
Other long-term
Short-term
General government 1,256.52 1,351.15 1,292.19 1,152.62 1,068.43 1,087.27 1,114.92 1,132.21
Long-term 1,256.52 1,351.15 1,292.19 1,152.62 1,068.43 1,087.27 1,114.92 1,132.21
Short-term
Banks 90.92 85.47 127.06 192.69 317.80 283.57 372.93 498.91
Long-term 80.03 75.90 125.52 192.69 293.56 283.57 315.58 493.99
Short-term 10.89 9.57 1.53 24.24 57.35 4.93
Other sectors 241.37 288.96 338.78 452.17 605.66 810.03 850.27 789.30
Long-term 219.85 282.46 276.21 436.82 547.89 789.01 839.39 730.01
Short-term 21.52 6.50 62.56 15.35 57.77 21.02 10.88 59.29
Currency and deposits 68.95 70.55 86.89 148.60 238.27 245.36 284.98 260.04
Monetary authorities
General government
Banks 68.95 70.55 86.89 148.60 238.27 245.36 284.98 260.04
Other sectors
Other liabilities 21.36 82.70 95.26 124.47 206.04 169.57 286.59 327.17
Monetary authorities 13.01 11.97 12.64 13.24 12.90 102.87 101.48
Long-term 13.01 11.97 12.64 13.24 12.90 102.87 101.48
SDR Allocation 13.01 11.97 12.64 13.24 12.90 102.87 101.48
Short-term
General government 0.30 0.55
Long-term
Short-term 0.30 0.55
Banks 11.66 12.57 14.15 13.76 12.55 13.42 6.01
Long-term
Short-term 11.66 12.57 14.15 13.76 12.55 13.42 6.01
Other sectors 21.36 58.03 70.72 97.68 179.04 144.12 170.01 219.14
Long-term 0.53 0.51 0.52 14.41
Short-term 21.36 58.03 70.72 97.68 178.51 143.62 169.49 204.73
Source: National Bank of the Republic of Macedonia

Table 29
International Investment position: external assets and liabilities at the end of period
(in million EUR)
2003 2004 2005 2006 2007 2008 2009 2010
International Investment Position, net -1,599.73 -1,846.20 -1,990.79 -1,887.55 -2,401.97 -3,266.77 -3,614.01 -3,721.27
Assets 1,495.28 1,589.06 2,081.58 2,471.72 2,686.04 2,456.76 2,606.56 2,950.37
Direct investment abroad 33.58 39.85 52.60 29.15 46.00 60.87 66.71 71.87
Equity capital and reinvested earnings 28.58 32.28 36.95 27.62 35.10 48.94 49.60 47.77
Claims on affiliated enterprises 28.58 32.28 36.95 27.62 35.10 48.94 49.60 47.77
Liabilities to affiliated enterprises (-)
Other capital 5.00 7.57 15.65 1.53 10.90 11.93 17.11 24.09
Claims on affiliated enterprises 8.62 11.28 21.33 14.69 17.00 19.33 24.60 36.03
Liabilities to affiliated enterprises (-) -3.61 -3.70 -5.68 -13.16 -6.11 -7.40 -7.49 -11.94
Portfolio investment 3.02 3.02 3.07 3.17 3.02 2.18 4.36 23.91
Equity securities 3.02 3.02 3.07 3.17 3.02 2.18 4.36 17.97
Monetary authorities
General government
Banks 2.42 2.41 2.47 2.59 2.46 1.47 1.55 1.62
Other sectors 0.61 0.60 0.60 0.58 0.55 0.71 2.81 16.35
Debt securities 5.94
Bonds and notes 5.94
Monetary authorities
General government
Banks
Other sectors 5.94
Money-market instruments
Monetary authorities
General government
Banks
Other sectors
Financial derivatives
Monetary authorities
General government
Banks
Other sectors
Other investment 743.70 829.26 902.99 1,022.72 1,112.67 898.77 937.99 1,139.37
Trade credits 155.47 196.12 253.18 335.48 444.28 478.11 408.77 543.51
General government
Long-term
Short-term
Other sectors 155.47 196.12 253.18 335.48 444.28 478.11 408.77 543.51
Long-term 0.30 0.00 0.39 0.66 0.77 0.97 0.58 0.01
Short-term 155.18 196.12 252.79 334.82 443.51 477.14 408.19 543.50
Loans 20.41 2.07 3.79 1.73 2.62 6.05 21.97 14.83
Monetary authorities
Long-term
Short-term
General government
Long-term
Short-term
Banks 19.21 0.84 3.48 1.48 0.74 1.05 16.32 10.22
Long-term 12.16 0.84 1.31 1.09 0.74 1.04 5.17 3.59
Short-term 7.05 2.17 0.39 0.01 11.14 6.63
Other sectors 1.21 1.23 0.31 0.25 1.89 5.00 5.65 4.62
Long-term 0.00 1.23 0.10 0.25 1.57 4.12 5.39 4.62
Short-term 1.21 0.20 0.31 0.88 0.26
Currency and deposits 565.30 608.44 621.63 659.58 637.75 383.80 473.76 554.99
Monetary authorities 33.16 11.90 13.17 17.93 17.19 1.13 0.96
General government
Banks 531.84 596.54 608.45 641.45 620.17 382.44 472.78 554.94
Other sectors 0.30 0.21 0.39 0.23 0.02 0.05
Other assets 2.51 22.64 24.40 25.93 28.02 30.81 33.49 26.04
Monetary authorities
Long-term
Short-term
General government
Long-term
Short-term
Banks 22.21 23.93 25.33 27.14 7.16 7.72 7.51
Long-term
Short-term 22.21 23.93 25.33 27.14 7.16 7.72 7.51
Other sectors 2.51 0.43 0.46 0.60 0.87 23.65 25.77 18.53
Long-term
Short-term 2.51 0.43 0.46 0.60 0.87 23.65 25.77 18.53
Reserve assets 714.97 716.94 1,122.92 1,416.67 1,524.36 1,494.94 1,597.51 1,715.23
Monetary gold 29.67 63.56 94.92 105.36 124.28 133.93 168.07 231.77
Special drawing rights 0.31 0.61 0.66 2.26 0.99 0.97 63.51 0.94
Reserve position in the Fund

(in million EUR)
2003 2004 2005 2006 2007 2008 2009 2010
Foreign exchange 684.98 652.76 1,027.34 1,309.04 1,399.09 1,360.04 1,365.93 1,482.52
Currency and deposits 615.09 634.58 998.04 1,149.89 899.97 244.75 464.17 348.10
With monetary authorities 564.97 503.65 910.22 693.96 724.73 92.14 464.17 348.10
With banks 50.12 130.93 87.82 455.93 175.23 152.61
Securities 69.89 18.19 29.30 159.16 499.13 1,115.29 901.76 1,134.43
Equities
Bonds and notes 69.89 18.19 29.30 159.16 499.13 1,115.29 901.76 1,134.43
Money-market instruments
Financial derivatives ,net
Other claims
Liabilities 3,095.01 3,435.26 4,072.37 4,359.26 5,088.01 5,723.53 6,220.57 6,671.64
Direct investment in reporting economy 1,292.14 1,610.22 1,768.97 2,098.57 2,545.17 2,968.75 3,141.38 3,350.69
Equity capital and reinvested earnings 1,181.98 1,366.11 1,579.62 1,863.35 2,226.62 2,407.42 2,481.27 2,642.69
Claims on direct investors (-)
Liabilities to direct investors 1,181.98 1,366.11 1,579.62 1,863.35 2,226.62 2,407.42 2,481.27 2,642.69
Other capital 110.16 244.11 189.36 235.23 318.55 561.33 660.11 708.00
Claims on direct investors (-) -47.98 -36.70 -74.54 -80.91 -106.11 -113.96 -169.96 -229.78
Liabilities to direct investors 158.14 280.82 263.89 316.14 424.66 675.29 830.07 937.78
Portfolio investment 85.82 52.65 232.20 276.94 303.06 264.92 411.97 395.11
Equity securities 64.40 29.40 44.73 86.57 132.57 133.31 136.40 136.86
Banks 10.08 14.01 25.03 80.65 61.85 70.71 74.71 80.91
Other sectors 54.32 15.39 19.71 5.92 70.71 62.59 61.69 55.95
Debt securities 21.42 23.25 187.47 190.38 170.49 131.62 275.57 258.25
Bonds and notes 21.42 23.25 187.47 190.38 170.49 131.62 275.57 258.25
Monetary authorities
General government 21.42 23.25 187.47 190.38 170.49 131.62 275.57 258.25
Banks
Other sectors
Money-market instruments
Monetary authorities
General government
Banks
Other sectors
Financial derivatives
Monetary authorities
General government
Banks
Other sectors
Other investment 1,717.05 1,772.39 2,071.20 1,983.75 2,239.79 2,489.86 2,667.22 2,925.84
Trade credits 318.63 345.34 373.90 369.18 581.61 648.61 637.86 661.06
General government 3.49 2.46 1.64
Long-term 3.49 2.46 1.64
Short-term
Other sectors 318.63 345.34 373.90 369.18 581.61 645.12 635.40 659.41
Long-term 49.42 22.76 11.04 19.59 14.54 23.57 19.17 13.62
Short-term 269.21 322.58 362.86 349.59 567.07 621.55 616.23 645.80
Loans 1,326.15 1,314.40 1,542.90 1,407.22 1,355.76 1,546.93 1,630.72 1,822.61
Monetary authorities 54.70 45.97 52.67 42.39
Use of Fund credit & loans from the Fund 54.70 45.97 52.67 42.39
Other long-term
Short-term
General government 1,005.54 993.20 1,095.36 875.19 727.22 771.22 777.60 852.57
Long-term 1,005.54 993.20 1,095.36 875.19 727.22 771.22 777.60 852.57
Short-term
Banks 72.76 62.83 107.70 146.31 216.31 201.14 260.10 375.69
Long-term 64.04 55.79 106.40 146.31 199.81 201.14 220.10 371.98
Short-term 8.71 7.04 1.30 16.50 40.00 3.71
Other sectors 193.16 212.41 287.17 343.33 412.24 574.57 593.02 594.35
Long-term 175.94 207.63 234.14 331.68 372.92 559.66 585.43 549.71
Short-term 17.22 4.78 53.03 11.65 39.32 14.91 7.59 44.64
Currency and deposits 55.18 51.86 73.66 112.83 162.18 174.04 198.76 195.82
Monetary authorities
General government
Banks 55.18 51.86 73.66 112.83 162.18 174.04 198.76 195.82
Other sectors
Other liabilities 17.09 60.79 80.75 94.51 140.24 120.28 199.88 246.36
Monetary authorities 9.56 10.14 9.60 9.01 9.15 71.74 76.42
Long-term 9.56 10.14 9.60 9.01 9.15 71.74 76.42
SDR Allocation 9.56 10.14 9.60 9.01 9.15 71.74 76.42
Short-term
General government 0.21 0.41
Long-term
Short-term 0.21 0.41
Banks 8.57 10.66 10.74 9.36 8.90 9.36 4.52
Long-term
Short-term 8.57 10.66 10.74 9.36 8.90 9.36 4.52
Other sectors 17.09 42.66 59.95 74.17 121.86 102.23 118.57 165.01
Long-term 0.36 0.36 0.36 10.85
Short-term 17.09 42.66 59.95 74.17 121.50 101.87 118.21 154.17
Source: National Bank of the Republic of Macedonia

Table 30
Republic of Macedonia: gross external debt/*in EUR Million Preliminary data
31.12.2004 31.12.2005 31.12.2006 31.12.20071) 31.12.2008 31.12.2009 31.03.2010
2) 30.06.2010 30.09.2010 31.12.2010 31.03.2011 30.06.2011 30.09.2011 31.12.2011 31.03.2012
General Government 1,016.46 1,282.82 1,065.56 897.71 906.33 1,055.84 1,077.92 1,117.63 1,087.79 1,112.87 1,330.91 1,328.43 1,339.34 1,463.30 1,450.29
Short-term 0.01 0.00 0.00 0.00 0.00 0.21 0.41 0.64 0.51 0.41 1.26 1.18 6.59 10.88 2.44
Money market instruments 0.01 0.00 0.00 0.00 0.00 0.00 0.00 0.00 0.00 0.00 0.00 0.00 0.00 0.00 0.00
Loans 0.00 0.00 0.00 0.00 0.00 0.00 0.00 0.00 0.00 0.00 0.00 0.00 0.00 0.00 0.00
Trade credits 0.00 0.00 0.00 0.00 0.00 0.00 0.00 0.00 0.00 0.00 0.00 0.00 0.00 0.00 0.00
Other debt liabilities 0.00 0.00 0.00 0.00 0.00 0.21 0.41 0.64 0.51 0.41 1.26 1.18 6.59 10.88 2.44
Arrears 0.00 0.00 0.00 0.00 0.00 0.21 0.41 0.64 0.51 0.41 1.26 1.18 6.59 10.88 2.44
Other 0.00 0.00 0.00 0.00 0.00 0.00 0.00 0.00 0.00 0.00 0.00 0.00 0.00 0.00 0.00
Long-term 1,016.45 1,282.82 1,065.56 897.71 906.33 1,055.64 1,077.50 1,116.99 1,087.27 1,112.46 1,329.64 1,327.24 1,332.75 1,452.42 1,447.86
Bonds and notes 23.25 187.47 190.38 170.49 131.62 275.57 284.80 274.64 265.14 258.25 258.02 249.24 224.47 202.46 218.42
Loans 993.20 1,095.36 875.19 727.22 771.22 777.60 790.45 840.30 820.29 852.57 1,068.78 1,075.66 1,105.58 1,247.75 1,227.72
Trade credits 0.00 0.00 0.00 0.00 3.49 2.46 2.26 2.05 1.85 1.64 2.84 2.35 2.70 2.21 1.72
Other debt liabilities 0.00 0.00 0.00 0.00 0.00 0.00 0.00 0.00 0.00 0.00 0.00 0.00 0.00 0.00 0.00
Monetary Authorities 55.54 62.81 51.99 9.01 9.15 71.74 73.93 79.60 75.06 76.42 73.87 191.12 164.04 310.82 372.37
Short-term 0.00 0.00 0.00 0.00 0.00 0.00 0.00 0.00 0.00 0.00 0.00 118.25 88.71 232.53 296.28
Money market instruments 0.00 0.00 0.00 0.00 0.00 0.00 0.00 0.00 0.00 0.00 0.00 0.00 0.00 0.00 0.00
Loans3)
0.00 0.00 0.00 0.00 0.00 0.00 0.00 0.00 0.00 0.00 0.00 118.25 88.71 232.53 296.28
Currency and deposits 0.00 0.00 0.00 0.00 0.00 0.00 0.00 0.00 0.00 0.00 0.00 0.00 0.00 0.00 0.00
Other debt liabilities 0.00 0.00 0.00 0.00 0.00 0.00 0.00 0.00 0.00 0.00 0.00 0.00 0.00 0.00 0.00
Arrears 0.00 0.00 0.00 0.00 0.00 0.00 0.00 0.00 0.00 0.00 0.00 0.00 0.00 0.00 0.00
Other 0.00 0.00 0.00 0.00 0.00 0.00 0.00 0.00 0.00 0.00 0.00 0.00 0.00 0.00 0.00
Long-term 55.54 62.81 51.99 9.01 9.15 71.74 73.93 79.60 75.06 76.42 73.87 72.87 75.33 78.29 76.10
Bonds and notes 0.00 0.00 0.00 0.00 0.00 0.00 0.00 0.00 0.00 0.00 0.00 0.00 0.00 0.00 0.00
Loans 45.97 52.66 42.39 0.00 0.00 0.00 0.00 0.00 0.00 0.00 0.00 0.00 0.00 0.00 0.00
Currency and deposits 0.00 0.00 0.00 0.00 0.00 0.00 0.00 0.00 0.00 0.00 0.00 0.00 0.00 0.00 0.00
Other debt liabilities 9.56 10.14 9.60 9.01 9.15 71.74 73.93 79.60 75.06 76.42 73.87 72.87 75.33 78.29 76.10
SDR Aloccation 9.56 10.14 9.60 9.01 9.15 71.74 73.93 79.60 75.06 76.42 73.87 72.87 75.33 78.29 76.10
Banks 123.24 192.02 269.88 387.85 384.07 468.22 411.41 458.32 495.56 576.03 574.14 616.93 571.55 564.61 568.32
Short-term 67.32 81.41 115.44 178.12 171.35 222.20 127.52 111.34 146.59 163.19 128.41 156.76 121.42 111.15 115.66
Money market instruments 0.00 0.00 0.00 0.00 0.00 0.00 0.00 0.00 0.00 0.00 0.00 0.00 0.00 0.00 0.00
Loans 7.04 1.30 0.00 16.50 0.00 40.00 22.59 7.55 34.65 3.71 0.00 20.17 0.00 0.00 0.00
Currency and deposits 51.71 69.46 104.70 152.26 162.46 172.84 100.52 98.92 107.58 154.96 121.47 129.74 113.41 103.37 108.06
Other debt liabilities 8.57 10.66 10.74 9.36 8.90 9.36 4.41 4.87 4.36 4.52 6.94 6.85 8.01 7.78 7.60
Arrears 8.57 10.66 10.74 9.36 8.90 9.36 4.41 4.87 4.36 4.52 6.94 6.85 8.01 7.78 7.60
Other 0.00 0.00 0.00 0.00 0.00 0.00 0.00 0.00 0.00 0.00 0.00 0.00 0.00 0.00 0.00
Long-term 55.93 110.60 154.44 209.73 212.72 246.02 283.90 346.98 348.97 412.83 445.73 460.17 450.13 453.47 452.65
Bonds and notes 0.00 0.00 0.00 0.00 0.00 0.00 0.00 0.00 0.00 0.00 0.00 0.00 0.00 0.00 0.00
Loans 55.79 106.40 146.31 199.81 201.14 220.10 226.13 299.36 308.81 371.98 395.87 407.60 402.85 422.79 425.00
Currency and deposits 0.14 4.20 8.13 9.92 11.58 25.92 57.77 47.63 40.16 40.85 49.86 52.57 47.28 30.67 27.65
Other debt liabilities 0.00 0.00 0.00 0.00 0.00 0.00 0.00 0.00 0.00 0.00 0.00 0.00 0.00 0.00 0.00

Table 30
Republic of Macedonia: gross external debt/*in EUR Million Preliminary data
31.12.2004 31.12.2005 31.12.2006 31.12.20071) 31.12.2008 31.12.2009 31.03.2010
2) 30.06.2010 30.09.2010 31.12.2010 31.03.2011 30.06.2011 30.09.2011 31.12.2011 31.03.2012
Other Sectors 600.40 721.01 786.69 1,115.71 1,321.91 1,346.99 1,361.28 1,449.48 1,356.41 1,418.78 1,540.94 1,519.17 1,573.14 1,645.64 1,606.56
Short-term 370.02 475.84 435.42 727.89 738.32 742.04 773.01 859.50 773.95 844.61 904.30 873.34 911.36 973.37 942.99
Money market instruments 0.00 0.00 0.00 0.00 0.00 0.00 0.00 0.00 0.00 0.00 0.00 0.00 0.00 0.00 0.00
Loans 4.78 53.03 11.65 39.32 14.91 7.59 18.50 47.73 39.76 44.64 6.00 5.45 9.00 3.09 3.63
Currency and deposits 0.00 0.00 0.00 0.00 0.00 0.00 0.00 0.00 0.00 0.00 0.00 0.00 0.00 0.00 0.00
Trade credits 322.58 362.86 349.59 567.07 621.55 616.23 632.52 680.49 596.02 645.80 768.38 728.73 760.84 817.15 788.18
Other debt liabilities 42.66 59.95 74.17 121.50 101.87 118.21 122.00 131.28 138.17 154.17 129.93 139.15 141.52 153.13 151.18
Arrears 42.66 58.40 74.17 121.50 101.87 118.21 122.00 131.28 138.17 154.17 129.93 139.15 141.52 153.13 149.46
Other 0.00 1.54 0.00 0.00 0.00 0.00 0.00 0.00 0.00 0.00 0.00 0.00 0.00 0.00 1.72
Long-term 230.39 245.18 351.27 387.81 583.59 604.95 588.27 589.98 582.46 574.17 636.64 645.83 661.78 672.27 663.56
Bonds and notes 0.00 0.00 0.00 0.00 0.00 0.00 0.00 0.00 0.00 0.00 0.00 0.00 0.00 0.00 0.00
Loans 207.63 234.14 331.68 372.92 559.66 585.43 569.51 572.81 566.44 549.71 613.43 624.21 641.50 653.32 646.74
Currency and deposits 0.00 0.00 0.00 0.00 0.00 0.00 0.00 0.00 0.00 0.00 0.00 0.00 0.00 0.00 0.00
Trade credits 22.76 11.04 19.59 14.54 23.57 19.17 18.38 16.79 15.63 13.62 12.82 11.67 10.78 9.87 8.23
Other debt liabilities 0.00 0.00 0.00 0.36 0.36 0.36 0.38 0.39 0.39 10.85 10.40 9.95 9.50 9.07 8.60Direct investment:
Intercompany lending 284.52 269.57 329.30 430.77 682.70 837.56 939.29 955.77 969.13 949.72 976.61 944.06 925.51 890.44 919.96
Debt liabilities to affiliated enterprises 3.70 5.68 13.16 6.11 7.40 7.49 7.89 11.57 9.88 11.94 10.21 11.41 9.87 12.76 16.31
Short-term 2.70 4.68 12.16 5.61 6.54 6.57 6.91 10.55 8.81 10.89 9.13 11.41 9.87 12.76 16.31
Long-term 1.00 1.00 1.00 0.50 0.87 0.92 0.98 1.02 1.07 1.05 1.08 0.00 0.00 0.00 0.00
Debt liabilities to direct investors 280.82 263.89 316.14 424.66 675.29 830.07 931.40 944.20 959.25 937.78 966.40 932.65 915.64 877.68 903.65
Short-term 189.58 112.22 162.51 219.65 246.37 271.24 298.38 311.73 316.75 309.57 273.47 281.40 273.78 308.66 297.18
Long-term 91.23 151.67 153.63 205.01 428.92 558.83 633.02 632.47 642.50 628.21 692.94 651.24 641.86 569.02 606.47
Gross External Debt 2,080.17 2,528.23 2,503.42 2,841.05 3,304.16 3,780.36 3,863.83 4,060.79 3,983.95 4,133.82 4,496.48 4,599.70 4,573.58 4,874.81 4,917.50
Gross external debt-excluding debt of the Monetary Authorities from repo arrangements 4,496.48 4,481.46 4,484.87 4,642.28 4,621.22
Memorandum items
Public debt 1,211.44 1,487.93 1,270.37 1,057.35 1,109.94 1,324.87 1,357.64 1,413.78 1,387.43 1,424.32 1,661.52 1,783.79 1,774.48 2,060.17 2,126.53
Public debt excluding debt of the Monetary Authorities from repo arrangements 1,661.52 1,665.54 1,685.77 1,827.64 1,830.25
Private debt 868.73 1,040.31 1,233.06 1,783.70 2,194.23 2,455.49 2,506.2 2,647.0 2,596.5 2,709.5 2,834.96 2,815.91 2,799.1 2,814.64 2,790.97
Public debt as percentage of GDP 27.27 30.91 24.29 17.73 16.52 19.76 19.66 20.47 20.09 20.63 22.74 24.41 24.28 28.19 28.17
Public debt excluding debt of the Monetary Authorities from repo arrangements % of GDP 22.74 22.79 23.07 25.01 24.25
Private debt as percentage of GDP 19.56 21.61 23.57 29.90 32.65 36.63 36.30 38.33 37.60 39.24 38.80 38.53 38.30 38.52 36.97
Short-term debt 629.63 674.16 725.53 1,131.28 1,162.58 1,242.25 1,206.23 1,293.75 1,246.61 1,328.67 1,316.58 1,442.34 1,411.73 1,649.35 1,670.85
Long-term debt 1,450.54 1,854.08 1,777.89 1,709.77 2,141.58 2,538.11 2,657.61 2,767.04 2,737.33 2,805.15 3,179.90 3,157.36 3,161.85 3,225.46 3,246.64
1) Starting from 2007 data on trade credits are from the KIPO questionnaire.
2) Starting from 2010, the data are presented on accrual basis.
3) Liabilities of the NBRM based on repo arrangements. Taking into consideration the fact that claims from reverse repo arrangements appear in an equal amount in the gross external claims report, these stocks have no effect on net external debt.
*/ Preliminary data
Source: National Bank of the Republic of Macedonia

Table 31
Republic of Macedonia: gross external claims /*in EUR Million Preliminary data
31.12.2004 31.12.2005 31.12.200631.12.20071) 31.12.2008 31.12.200931.03.2010
2) 30.06.2010 30.09.2010 31.12.2010 31.03.2011 30.06.2011 30.09.2011 31.12.2011 31.03.2012
General Government 0.00 0.00 0.00 0.00 0.00 0.00 0.00 0.00 0.00 0.00 0.00 0.00 0.00 0.00 0.00
Short-term 0.00 0.00 0.00 0.00 0.00 0.00 0.00 0.00 0.00 0.00 0.00 0.00 0.00 0.00 0.00
Money market instruments 0.00 0.00 0.00 0.00 0.00 0.00 0.00 0.00 0.00 0.00 0.00 0.00 0.00 0.00 0.00
Loans 0.00 0.00 0.00 0.00 0.00 0.00 0.00 0.00 0.00 0.00 0.00 0.00 0.00 0.00 0.00
Trade credits 0.00 0.00 0.00 0.00 0.00 0.00 0.00 0.00 0.00 0.00 0.00 0.00 0.00 0.00 0.00
Other claims 0.00 0.00 0.00 0.00 0.00 0.00 0.00 0.00 0.00 0.00 0.00 0.00 0.00 0.00 0.00
Arrears 0.00 0.00 0.00 0.00 0.00 0.00 0.00 0.00 0.00 0.00 0.00 0.00 0.00 0.00 0.00
Other 0.00 0.00 0.00 0.00 0.00 0.00 0.00 0.00 0.00 0.00 0.00 0.00 0.00 0.00 0.00
Long-term 0.00 0.00 0.00 0.00 0.00 0.00 0.00 0.00 0.00 0.00 0.00 0.00 0.00 0.00 0.00
Bonds and notes 0.00 0.00 0.00 0.00 0.00 0.00 0.00 0.00 0.00 0.00 0.00 0.00 0.00 0.00 0.00
Loans 0.00 0.00 0.00 0.00 0.00 0.00 0.00 0.00 0.00 0.00 0.00 0.00 0.00 0.00 0.00
Trade credits 0.00 0.00 0.00 0.00 0.00 0.00 0.00 0.00 0.00 0.00 0.00 0.00 0.00 0.00 0.00
Other claims 0.00 0.00 0.00 0.00 0.00 0.00 0.00 0.00 0.00 0.00 0.00 0.00 0.00 0.00 0.00
Monetary Authorities 664.66 1,040.51 1,326.97 1,416.28 1,361.16 1,366.89 1,362.69 1,417.06 1,478.69 1,482.52 1,678.81 1,840.11 1,763.26 2,268.03 2,389.20
Short-term 664.66 1,040.51 1,167.82 917.15 245.87 465.13 341.54 359.75 362.23 348.10 360.51 452.99 406.18 873.10 848.87
Money market instruments 0.00 0.00 0.00 0.00 0.00 0.00 0.00 0.00 0.00 0.00 0.00 0.00 0.00 0.00 0.00
Loans3)
0.00 0.00 0.00 0.00 0.00 0.00 0.00 0.00 0.00 0.00 0.00 118.25 88.71 233.06 296.42
Currency and deposits 664.66 1,040.51 1,167.82 917.15 245.87 465.13 341.54 359.75 362.23 348.10 360.51 334.74 317.47 640.04 552.45
Other claims 0.00 0.00 0.00 0.00 0.00 0.00 0.00 0.00 0.00 0.00 0.00 0.00 0.00 0.00 0.00
Arrears 0.00 0.00 0.00 0.00 0.00 0.00 0.00 0.00 0.00 0.00 0.00 0.00 0.00 0.00 0.00
Other 0.00 0.00 0.00 0.00 0.00 0.00 0.00 0.00 0.00 0.00 0.00 0.00 0.00 0.00 0.00
Long-term 0.00 0.00 159.16 499.13 1,115.29 901.76 1,021.14 1,057.30 1,116.47 1,134.43 1,318.30 1,387.13 1,357.08 1,394.93 1,540.33
Bonds and notes 0.00 0.00 159.16 499.13 1,115.29 901.76 1,021.14 1,057.30 1,116.47 1,134.43 1,318.30 1,387.13 1,357.08 1,394.93 1,540.33
Loans 0.00 0.00 0.00 0.00 0.00 0.00 0.00 0.00 0.00 0.00 0.00 0.00 0.00 0.00 0.00
Currency and deposits 0.00 0.00 0.00 0.00 0.00 0.00 0.00 0.00 0.00 0.00 0.00 0.00 0.00 0.00 0.00
Other claims 0.00 0.00 0.00 0.00 0.00 0.00 0.00 0.00 0.00 0.00 0.00 0.00 0.00 0.00 0.00
0.00 0.00 0.00 0.00 0.00 0.00 0.00 0.00 0.00 0.00 0.00 0.00 0.00 0.00 0.00
Banks 619.59 635.87 668.26 648.05 390.65 496.81 399.39 460.20 468.07 572.67 559.43 565.44 607.38 603.05 560.54
Short-term 618.75 634.56 667.17 631.33 371.12 473.15 375.96 438.04 445.96 550.59 537.37 544.52 586.40 583.16 537.68
Money market instruments 0.00 0.00 0.00 0.00 0.00 0.00 0.00 0.00 0.00 0.00 0.00 0.00 0.00 0.00 0.00
Loans 0.00 2.17 0.39 0.00 0.01 11.14 10.61 9.85 6.78 6.63 8.84 6.95 7.91 5.15 7.83
Currency and deposits 596.54 608.45 641.45 604.19 363.95 454.29 358.37 421.02 431.88 536.45 520.72 529.55 570.33 569.65 521.33
Other claims 22.21 23.93 25.33 27.14 7.16 7.72 6.98 7.17 7.31 7.51 7.82 8.01 8.16 8.37 8.52
Arrears 22.21 23.93 25.33 27.14 7.16 7.72 6.98 7.17 7.31 7.51 7.82 8.01 8.16 8.37 8.52
Other 0.00 0.00 0.00 0.00 0.00 0.00 0.00 0.00 0.00 0.00 0.00 0.00 0.00 0.00 0.00
Long-term 0.84 1.31 1.10 16.72 19.52 23.66 23.43 22.16 22.10 22.08 22.06 20.92 20.97 19.89 22.87
Bonds and notes 0.00 0.00 0.00 0.00 0.00 0.00 0.00 0.00 0.00 0.00 0.00 0.00 0.00 0.00 0.00
Loans 0.84 1.31 1.10 0.74 1.04 5.17 4.24 3.67 3.61 3.59 3.57 2.43 2.49 1.40 5.71
Currency and deposits 0.00 0.00 0.00 15.98 18.49 18.49 19.19 18.49 18.49 18.49 18.49 18.49 18.49 18.49 17.16
Other claims 0.00 0.00 0.00 0.00 0.00 0.00 0.00 0.00 0.00 0.00 0.00 0.00 0.00 0.00 0.00
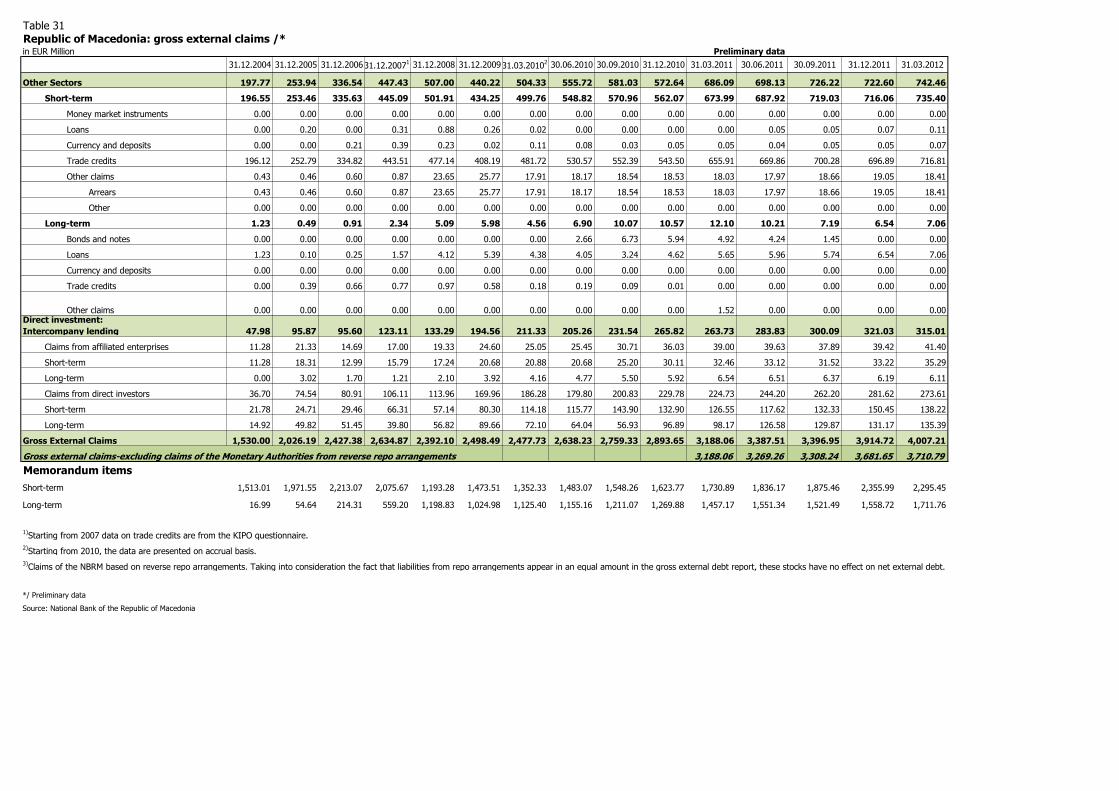
Table 31
Republic of Macedonia: gross external claims /*in EUR Million Preliminary data
31.12.2004 31.12.2005 31.12.200631.12.20071) 31.12.2008 31.12.200931.03.2010
2) 30.06.2010 30.09.2010 31.12.2010 31.03.2011 30.06.2011 30.09.2011 31.12.2011 31.03.2012
Other Sectors 197.77 253.94 336.54 447.43 507.00 440.22 504.33 555.72 581.03 572.64 686.09 698.13 726.22 722.60 742.46
Short-term 196.55 253.46 335.63 445.09 501.91 434.25 499.76 548.82 570.96 562.07 673.99 687.92 719.03 716.06 735.40
Money market instruments 0.00 0.00 0.00 0.00 0.00 0.00 0.00 0.00 0.00 0.00 0.00 0.00 0.00 0.00 0.00
Loans 0.00 0.20 0.00 0.31 0.88 0.26 0.02 0.00 0.00 0.00 0.00 0.05 0.05 0.07 0.11
Currency and deposits 0.00 0.00 0.21 0.39 0.23 0.02 0.11 0.08 0.03 0.05 0.05 0.04 0.05 0.05 0.07
Trade credits 196.12 252.79 334.82 443.51 477.14 408.19 481.72 530.57 552.39 543.50 655.91 669.86 700.28 696.89 716.81
Other claims 0.43 0.46 0.60 0.87 23.65 25.77 17.91 18.17 18.54 18.53 18.03 17.97 18.66 19.05 18.41
Arrears 0.43 0.46 0.60 0.87 23.65 25.77 17.91 18.17 18.54 18.53 18.03 17.97 18.66 19.05 18.41
Other 0.00 0.00 0.00 0.00 0.00 0.00 0.00 0.00 0.00 0.00 0.00 0.00 0.00 0.00 0.00
Long-term 1.23 0.49 0.91 2.34 5.09 5.98 4.56 6.90 10.07 10.57 12.10 10.21 7.19 6.54 7.06
Bonds and notes 0.00 0.00 0.00 0.00 0.00 0.00 0.00 2.66 6.73 5.94 4.92 4.24 1.45 0.00 0.00
Loans 1.23 0.10 0.25 1.57 4.12 5.39 4.38 4.05 3.24 4.62 5.65 5.96 5.74 6.54 7.06
Currency and deposits 0.00 0.00 0.00 0.00 0.00 0.00 0.00 0.00 0.00 0.00 0.00 0.00 0.00 0.00 0.00
Trade credits 0.00 0.39 0.66 0.77 0.97 0.58 0.18 0.19 0.09 0.01 0.00 0.00 0.00 0.00 0.00
Other claims 0.00 0.00 0.00 0.00 0.00 0.00 0.00 0.00 0.00 0.00 1.52 0.00 0.00 0.00 0.00Direct investment:
Intercompany lending 47.98 95.87 95.60 123.11 133.29 194.56 211.33 205.26 231.54 265.82 263.73 283.83 300.09 321.03 315.01
Claims from affiliated enterprises 11.28 21.33 14.69 17.00 19.33 24.60 25.05 25.45 30.71 36.03 39.00 39.63 37.89 39.42 41.40
Short-term 11.28 18.31 12.99 15.79 17.24 20.68 20.88 20.68 25.20 30.11 32.46 33.12 31.52 33.22 35.29
Long-term 0.00 3.02 1.70 1.21 2.10 3.92 4.16 4.77 5.50 5.92 6.54 6.51 6.37 6.19 6.11
Claims from direct investors 36.70 74.54 80.91 106.11 113.96 169.96 186.28 179.80 200.83 229.78 224.73 244.20 262.20 281.62 273.61
Short-term 21.78 24.71 29.46 66.31 57.14 80.30 114.18 115.77 143.90 132.90 126.55 117.62 132.33 150.45 138.22
Long-term 14.92 49.82 51.45 39.80 56.82 89.66 72.10 64.04 56.93 96.89 98.17 126.58 129.87 131.17 135.39
Gross External Claims 1,530.00 2,026.19 2,427.38 2,634.87 2,392.10 2,498.49 2,477.73 2,638.23 2,759.33 2,893.65 3,188.06 3,387.51 3,396.95 3,914.72 4,007.21
Gross external claims-excluding claims of the Monetary Authorities from reverse repo arrangements 3,188.06 3,269.26 3,308.24 3,681.65 3,710.79
Memorandum items
Short-term 1,513.01 1,971.55 2,213.07 2,075.67 1,193.28 1,473.51 1,352.33 1,483.07 1,548.26 1,623.77 1,730.89 1,836.17 1,875.46 2,355.99 2,295.45
Long-term 16.99 54.64 214.31 559.20 1,198.83 1,024.98 1,125.40 1,155.16 1,211.07 1,269.88 1,457.17 1,551.34 1,521.49 1,558.72 1,711.76
1)Starting from 2007 data on trade credits are from the KIPO questionnaire.
2)Starting from 2010, the data are presented on accrual basis.
3)Claims of the NBRM based on reverse repo arrangements. Taking into consideration the fact that liabilities from repo arrangements appear in an equal amount in the gross external debt report, these stocks have no effect on net external debt.
*/ Preliminary data
Source: National Bank of the Republic of Macedonia

Table 32
Republic of Macedonia: net external debt position /*in EUR Million Preliminary data
31.12.2004 31.12.2005 31.12.2006 31.12.2007 31.12.2008 31.12.2009 31.03.2010 30.06.2010 30.09.2010 31.12.20101) 31.03.2011 30.06.2011 30.09.2011 31.12.2011 31.03.2012
General Government 1,016.46 1,282.82 1,065.56 897.71 906.33 1,055.84 1,077.92 1,117.63 1,087.79 1,112.87 1,330.91 1,328.43 1,339.34 1,463.30 1,450.29
Short-term 0.01 0.00 0.00 0.00 0.00 0.21 0.41 0.64 0.51 0.41 1.26 1.18 6.59 10.88 2.44
Money market instruments 0.01 0.00 0.00 0.00 0.00 0.00 0.00 0.00 0.00 0.00 0.00 0.00 0.00 0.00 0.00
Loans 0.00 0.00 0.00 0.00 0.00 0.00 0.00 0.00 0.00 0.00 0.00 0.00 0.00 0.00 0.00
Trade credits 0.00 0.00 0.00 0.00 0.00 0.00 0.00 0.00 0.00 0.00 0.00 0.00 0.00 0.00 0.00
Other debt liabilities 0.00 0.00 0.00 0.00 0.00 0.21 0.41 0.64 0.51 0.41 1.26 1.18 6.59 10.88 2.44
Arrears 0.00 0.00 0.00 0.00 0.00 0.21 0.41 0.64 0.51 0.41 1.26 1.18 6.59 10.88 2.44
Other 0.00 0.00 0.00 0.00 0.00 0.00 0.00 0.00 0.00 0.00 0.00 0.00 0.00 0.00 0.00
Long-term 1,016.45 1,282.82 1,065.56 897.71 906.33 1,055.64 1,077.50 1,116.99 1,087.27 1,112.46 1,329.64 1,327.24 1,332.75 1,452.42 1,447.86
Bonds and notes 23.25 187.47 190.38 170.49 131.62 275.57 284.80 274.64 265.14 258.25 258.02 249.24 224.47 202.46 218.42
Loans 993.20 1,095.36 875.19 727.22 771.22 777.60 790.45 840.30 820.29 852.57 1,068.78 1,075.66 1,105.58 1,247.75 1,227.72
Trade credits 0.00 0.00 0.00 0.00 3.49 2.46 2.26 2.05 1.85 1.64 2.84 2.35 2.70 2.21 1.72
Other debt liabilities 0.00 0.00 0.00 0.00 0.00 0.00 0.00 0.00 0.00 0.00 0.00 0.00 0.00 0.00 0.00
Monetary Authorities -609.12 -977.70 -1,274.98 -1,407.27 -1,352.01 -1,295.15 -1,288.76 -1,337.46 -1,403.63 -1,406.10 -1,604.94 -1,649.00 -1,599.22 -1,957.21 -2,016.83
Short-term -664.66 -1,040.51 -1,167.82 -917.15 -245.87 -465.13 -341.54 -359.75 -362.23 -348.10 -360.51 -334.74 -317.47 -640.57 -552.59
Money market instruments 0.00 0.00 0.00 0.00 0.00 0.00 0.00 0.00 0.00 0.00 0.00 0.00 0.00 0.00 0.00
Loans 0.00 0.00 0.00 0.00 0.00 0.00 0.00 0.00 0.00 0.00 0.00 0.00 0.00 -0.53 -0.14
Currency and deposits -664.66 -1,040.51 -1,167.82 -917.15 -245.87 -465.13 -341.54 -359.75 -362.23 -348.10 -360.51 -334.74 -317.47 -640.04 -552.45
Other debt liabilities 0.00 0.00 0.00 0.00 0.00 0.00 0.00 0.00 0.00 0.00 0.00 0.00 0.00 0.00 0.00
Arrears 0.00 0.00 0.00 0.00 0.00 0.00 0.00 0.00 0.00 0.00 0.00 0.00 0.00 0.00 0.00
Other 0.00 0.00 0.00 0.00 0.00 0.00 0.00 0.00 0.00 0.00 0.00 0.00 0.00 0.00 0.00
Long-term 55.54 62.81 -107.17 -490.11 -1,106.14 -830.02 -947.21 -977.71 -1,041.41 -1,058.01 -1,244.42 -1,314.26 -1,281.75 -1,316.64 -1,464.24
Bonds and notes 0.00 0.00 -159.16 -499.13 -1,115.29 -901.76 -1,021.14 -1,057.30 -1,116.47 -1,134.43 -1,318.30 -1,387.13 -1,357.08 -1,394.93 -1,540.33
Loans 45.97 52.66 42.39 0.00 0.00 0.00 0.00 0.00 0.00 0.00 0.00 0.00 0.00 0.00 0.00
Currency and deposits 0.00 0.00 0.00 0.00 0.00 0.00 0.00 0.00 0.00 0.00 0.00 0.00 0.00 0.00 0.00
Other debt liabilities 9.56 10.14 9.60 9.01 9.15 71.74 73.93 79.60 75.06 76.42 73.87 72.87 75.33 78.29 76.10
SDR Aloccation 9.56 10.14 9.60 9.01 9.15 71.74 73.93 79.60 75.06 76.42 73.87 72.87 75.33 78.29 76.10
Banks -496.34 -443.85 -398.38 -260.20 -6.57 -28.60 12.02 -1.88 27.49 3.36 14.72 51.49 -35.82 -38.44 7.77
Short-term -551.43 -553.14 -551.72 -453.20 -199.77 -250.96 -248.45 -326.70 -299.37 -387.40 -408.96 -387.76 -464.98 -472.02 -422.01
Money market instruments 0.00 0.00 0.00 0.00 0.00 0.00 0.00 0.00 0.00 0.00 0.00 0.00 0.00 0.00 0.00
Loans 7.04 -0.87 -0.39 16.50 -0.01 28.86 11.98 -2.30 27.87 -2.92 -8.84 13.21 -7.91 -5.15 -7.83
Currency and deposits -544.82 -539.00 -536.75 -451.93 -201.49 -281.46 -257.86 -322.10 -324.30 -381.49 -399.24 -399.81 -456.91 -466.28 -413.27
Other debt liabilities -13.64 -13.27 -14.59 -17.78 1.74 1.64 -2.57 -2.30 -2.94 -2.99 -0.88 -1.16 -0.16 -0.59 -0.92
Arrears -13.64 -13.27 -14.59 -17.78 1.74 1.64 -2.57 -2.30 -2.94 -2.99 -0.88 -1.16 -0.16 -0.59 -0.92
Other 0.00 0.00 0.00 0.00 0.00 0.00 0.00 0.00 0.00 0.00 0.00 0.00 0.00 0.00 0.00
Long-term 55.09 109.29 153.34 193.01 193.19 222.36 260.47 324.82 326.86 390.75 423.67 439.25 429.16 433.58 429.79
Bonds and notes 0.00 0.00 0.00 0.00 0.00 0.00 0.00 0.00 0.00 0.00 0.00 0.00 0.00 0.00 0.00
Loans 54.95 105.09 145.21 199.07 200.10 214.92 221.89 295.69 305.19 368.39 392.30 405.16 400.36 421.39 419.29
Currency and deposits 0.14 4.20 8.13 -6.06 -6.91 7.44 38.58 29.14 21.67 22.36 31.38 34.09 28.79 12.18 10.50
Other debt liabilities 0.00 0.00 0.00 0.00 0.00 0.00 0.00 0.00 0.00 0.00 0.00 0.00 0.00 0.00 0.00

Table 32
Republic of Macedonia: net external debt position /*in EUR Million Preliminary data
31.12.2004 31.12.2005 31.12.2006 31.12.2007 31.12.2008 31.12.2009 31.03.2010 30.06.2010 30.09.2010 31.12.20101) 31.03.2011 30.06.2011 30.09.2011 31.12.2011 31.03.2012
Other Sectors 402.63 467.07 450.15 668.28 814.91 906.77 856.96 893.76 775.38 846.14 854.85 821.04 846.92 923.04 864.09
Short-term 173.47 222.38 99.79 282.81 236.41 307.79 273.25 310.67 202.99 282.54 230.31 185.41 192.33 257.32 207.59
Money market instruments 0.00 0.00 0.00 0.00 0.00 0.00 0.00 0.00 0.00 0.00 0.00 0.00 0.00 0.00 0.00
Loans 4.78 52.83 11.65 39.01 14.02 7.33 18.48 47.73 39.76 44.64 6.00 5.40 8.95 3.02 3.52
Currency and deposits 0.00 0.00 -0.21 -0.39 -0.23 -0.02 -0.11 -0.08 -0.03 -0.05 -0.05 -0.04 -0.05 -0.05 -0.07
Trade credits 126.47 110.07 14.77 123.56 144.40 208.04 150.80 149.92 43.63 102.30 112.47 58.87 60.56 120.26 71.37
Other debt liabilities 42.23 59.48 73.57 120.63 78.21 92.44 104.09 113.11 119.63 135.64 111.89 121.18 122.87 134.09 132.77
Arrears 42.23 57.94 73.57 120.63 78.21 92.44 104.09 113.11 119.63 135.64 111.89 121.18 122.87 134.09 131.05
Other 0.00 1.54 0.00 0.00 0.00 0.00 0.00 0.00 0.00 0.00 0.00 0.00 0.00 0.00 1.72
Long-term 229.16 244.69 350.36 385.47 578.50 598.98 583.71 583.08 572.39 563.60 624.54 635.62 654.59 665.72 656.50
Bonds and notes 0.00 0.00 0.00 0.00 0.00 0.00 0.00 -2.66 -6.73 -5.94 -4.92 -4.24 -1.45 0.00 0.00
Loans 206.40 234.04 331.43 371.35 555.54 580.03 565.13 568.76 563.19 545.09 607.78 618.25 635.76 646.78 639.67
Currency and deposits 0.00 0.00 0.00 0.00 0.00 0.00 0.00 0.00 0.00 0.00 0.00 0.00 0.00 0.00 0.00
Trade credits 22.76 10.65 18.93 13.77 22.60 18.58 18.19 16.60 15.54 13.60 12.82 11.67 10.78 9.87 8.23
Other debt liabilities 0.00 0.00 0.00 0.36 0.36 0.36 0.38 0.39 0.39 10.85 8.88 9.95 9.50 9.07 8.60
Direct investment:
Intercompany lending 236.54 173.71 233.70 307.66 549.40 643.00 727.96 750.51 737.59 683.90 712.88 660.23 625.41 569.41 604.95
Debt liabilities to affiliated enterprises -7.57 -15.65 -1.53 -10.89 -11.93 -17.10 -17.16 -13.88 -20.83 -24.09 -28.79 -28.22 -28.03 -26.66 -25.09
Short-term -8.58 -13.63 -0.83 -10.18 -10.70 -14.11 -13.98 -10.13 -16.40 -19.23 -23.32 -21.71 -21.65 -20.47 -18.99
Long-term 1.00 -2.02 -0.70 -0.71 -1.23 -2.99 -3.18 -3.75 -4.43 -4.87 -5.47 -6.51 -6.37 -6.19 -6.11
Debt liabilities to direct investors 244.11 189.36 235.23 318.55 561.33 660.10 745.12 764.40 758.42 708.00 741.68 688.45 653.44 596.07 630.05
Short-term 167.80 87.51 133.05 153.35 189.23 190.94 184.20 195.96 172.85 176.67 146.91 163.78 141.46 158.22 158.97
Long-term 76.31 101.85 102.18 165.20 372.10 469.17 560.92 568.44 585.57 531.32 594.76 524.67 511.99 437.85 471.08
Net External Debt Position 550.17 502.05 76.05 206.18 912.06 1,281.86 1,386.10 1,422.56 1,224.62 1,240.17 1,308.42 1,212.20 1,176.63 960.09 910.29
Memorandum items
Short-term -883.39 -1,297.39 -1,487.53 -944.38 -30.70 -231.27 -146.11 -189.31 -301.64 -295.10 -414.31 -393.82 -463.73 -706.64 -624.59
Long-term 1,433.55 1,799.43 1,563.58 1,150.57 942.75 1,513.13 1,532.21 1,611.88 1,526.26 1,535.27 1,722.73 1,606.02 1,640.36 1,666.73 1,534.88
1) Starting from 2010, the data are presented on accrual basis.
*/ Preliminary data
Source: National Bank of the Republic of Macedonia

Table 33
Official reserves assets/1
In EUR Million
Currency and
depositsSecurities
2003 29.7 0.3 0.0 615.1 69.9 0.0 715.0
2004 63.6 0.6 0.0 635.8 17.0 0.0 716.9
2005 94.9 0.7 0.0 998.7 28.6 0.0 1,122.9
2006 105.4 2.3 0.0 1,150.5 158.5 0.0 1,416.7
2007 124.3 1.0 0.0 900.5 498.5 0.0 1,524.4
2008 133.9 1.0 0.0 245.3 1,114.7 0.0 1,494.9
2009 168.1 63.5 0.0 464.8 901.2 0.0 1,597.5
2010 231.8 0.9 0.0 348.0 1,133.8 0.0 1,714.5
I 212.3 0.1 0.0 263.1 1,231.4 0.0 1,706.8
ll 223.6 0.0 0.0 248.0 1,230.9 0.0 1,702.5
lll 221.7 0.1 0.0 360.5 1,317.7 0.0 1,900.0
IV 224.9 0.5 0.0 290.6 1,361.2 0.0 1,877.2
V 235.0 0.1 0.0 237.2 1,410.4 0.0 1,882.8
VI 228.2 1.2 0.0 216.5 1,386.5 0.0 1,832.4
VII 247.0 1.2 0.0 177.4 1,385.8 0.0 1,811.4
VIII 275.1 0.2 0.0 182.1 1,386.1 0.0 1,843.5
IX 261.1 1.4 0.0 228.8 1,356.5 0.0 1,847.8
X 264.8 1.4 0.0 187.3 1,385.1 0.0 1,838.6
XI 282.5 0.6 0.0 162.3 1,401.1 0.0 1,846.4
XII 267.0 0.6 0.0 407.0 1,394.3 0.0 2,068.9
Q1 221.7 0.1 0.0 360.5 1,317.7 0.0 1,900.0
Q2 228.2 1.2 0.0 216.5 1,386.5 0.0 1,832.4
Q3 261.1 1.4 0.0 228.8 1,356.5 0.0 1,847.8
Q4 267.0 0.6 0.0 407.0 1,394.3 0.0 2,068.9
2011 267.0 0.6 0.0 407.0 1,394.3 0.0 2,068.9
I 289.3 1.4 0.0 176.2 1,600.3 0.0 2,067.2
ll 290.0 0.6 0.0 206.4 1,564.8 0.0 2,061.8
lll 271.5 0.6 0.0 256.0 1,539.7 0.0 2,067.9
Q1. 2012 271.5 0.6 0.0 256.0 1,539.7 0.0 2,067.9
Source: National Bank of the Republic of Macedonia
1/ Preliminary data
Reserve Assets
Monetary gold SDRsReserve Position
in the Fund
Foreign currency reservesOther reserve
assetsTOTAL

Table 34
Exchange rates (average for the period)
100 100 100 100 100 1 1 1 100
ATS FRF ITL DEM CHF GBP USD EUR JPY
1993 /1 2.0127 4.1226 1.4832 14.1617 15.9867 35.3541 23.5722 -
1994 3.7833 7.7828 2.6792 26.6162 31.5905 66.0911 43.2351 -
1995 3.7722 7.6206 2.3369 26.5390 32.1770 60.0303 38.0354 -
1996 3.7787 7.8183 2.5929 26.5848 32.3948 62.4691 39.9935 -
1997 4.0780 8.5259 2.9225 28.6980 34.3423 81.6392 49.8299 -
1998 4.3993 9.2329 3.1357 30.9525 37.5788 90.2462 54.4506 -
1999 4.4052 9.2409 3.1306 30.9927 37.8747 92.0413 56.8964 -
2000 4.4131 9.2575 3.1362 31.0482 38.9892 99.6905 65.8856 60.7250 61.1533
2001 4.4267 9.2862 3.1459 31.1445 40.3381 97.9875 68.0421 60.9133 56.0157
2002 - - - - 41.5689 97.0365 64.7341 60.9783 51.6839
2003 - - - - 40.3117 88.6405 54.3031 61.2639 46.8292
2004 - - - - 39.7337 90.4298 49.4105 61.3377 45.6661
2005 - - - - 39.5872 89.6186 49.2919 61.2958 44.7895
2006 - - - - 38.8981 89.7611 48.7854 61.1885 41.9345
2007 - - - - 37.2534 89.4324 44.7184 61.1838 37.9705
2008 - - - - 38.6300 77.1265 41.8646 61.2654 40.7177
2009 - - - - 40.5769 68.8041 44.0766 61.2728 47.1313
2010 - - - - 44.5956 71.7150 46.4574 61.5150 52.9905
2011 - - - - 49.9881 70.8931 44.2281 61.5289 55.5402
2007 Q1 - - - - 37.8609 91.2615 46.6974 61.1809 39.1234
Q2 - - - - 37.1487 90.0730 45.3961 61.1741 37.6175
Q3 - - - - 37.1335 90.0013 44.5585 61.1750 37.8021
Q4 - - - - 36.8825 86.4403 42.2718 61.2053 37.3601
2008 Q1 - - - - 38.2826 81.0138 40.9350 61.2908 38.8218
Q2 - - - - 38.0241 77.2550 39.2020 61.2579 37.5382
Q3 - - - - 37.9561 76.9805 40.7035 61.1776 37.8493
Q4 - - - - 40.2469 73.3003 46.5786 61.3356 48.6062
2009 Q1 - - - - 41.0135 67.5760 47.0742 61.4067 50.4188
Q2 - - - - 40.5226 69.6867 45.0823 61.3386 46.2837
Q3 - - - - 40.2498 70.2639 42.8182 61.1774 45.7428
Q4 - - - - 40.5307 67.6727 41.4079 61.1720 46.1421
2010 Q1 - - - - 41.9384 69.2109 44.3686 61.4015 48.9037
Q2 - - - - 43.6691 72.0352 48.3614 61.5465 52.4391
Q3 - - - - 46.2249 73.9430 47.7731 61.5522 55.6637
Q4 - - - - 46.4822 71.6201 45.3020 61.5577 54.8607
2011 Q1 - - - - 47.8172 72.0363 45.0214 61.5126 54.7356
Q2 - - - - 49.1081 69.7580 42.7593 61.5531 52.4042
Q3 - - - - 52.9254 70.0699 43.5196 61.5431 55.9701
Q4 - - - - 50.0451 71.7208 45.6134 61.5068 58.9994
2010 1 - - - - 41.4189 69.2566 42.8267 61.1798 46.8747
2 - - - - 41.8753 70.1393 44.9312 61.4225 49.7987
3 - - - - 42.5149 68.3266 45.4022 61.6042 50.1244
4 - - - - 43.0267 70.3153 45.9023 61.5988 49.1079
5 - - - - 43.4104 71.6068 48.7870 61.5285 52.8646
6 - - - - 44.5787 74.1980 50.3806 61.5127 55.3306
7 - - - - 45.7495 73.6661 48.2471 61.5171 55.1205
8 - - - - 45.8521 74.6177 47.7062 61.5102 55.8324
9 - - - - 47.1013 73.5319 47.3526 61.6319 56.0508
10 - - - - 45.8029 70.3719 44.3729 61.6227 54.2038
11 - - - - 45.7145 71.9099 44.9678 61.5474 54.5373
12 - - - - 47.9046 72.5878 46.5545 61.5027 55.8305
2011 1 - - - - 48.1809 72.4702 45.9858 61.5116 55.7828
2 - - - - 47.4083 72.6380 45.0951 61.5075 54.5762
3 - - - - 47.8229 71.0588 43.9906 61.5183 53.8322
4 - - - - 47.4222 69.7080 42.6383 61.5200 51.1740
5 - - - - 49.0049 70.0430 42.8266 61.5297 52.8060
6 - - - - 50.9005 69.5135 42.8109 61.6103 53.2191
7 - - - - 52.2133 69.5330 43.1423 61.6168 54.2742
8 - - - - 55.0191 70.1998 42.9071 61.5086 55.7053
9 - - - - 51.4977 70.4906 44.5426 61.5027 57.9962
10 - - - - 50.0403 70.6839 44.9128 61.5042 58.6108
11 - - - - 49.9897 71.6720 45.3129 61.5025 58.4943
12 - - - - 50.1034 72.8051 46.6049 61.5134 59.8769
2012 1 - - - - 50.7711 73.2688 47.6848 61.5049 61.9147
2 - - - - 50.9539 73.5147 46.5380 61.5024 59.4546
3 - - - - 50.9953 73.6944 46.5718 61.5016 56.5415

Table 35
Mid exchange rates (end of period)
EUR DEM ITL USD ATS FRF GBP CHF
1 100 100 1 100 100 1 100
31.12.1993 2,575.2100 2.6000 44.4600 366.3000 757.7600 65.8200 3,029.4800
31.12.1994 2,621.1400 2.5000 40.6000 372.4900 759.5300 63.4500 3,098.1900
31.12.1995 2,649.4300 2.4000 37.9800 376.5900 775.0400 58.6500 3,299.6000
31.12.1996 2,663.4000 2.7100 41.4100 378.4961 789.1662 69.9596 3,062.9100
31.12.1997 3,092.4800 3.1500 55.4200 439.5300 924.1300 92.2200 3,811.4800
31.12.1998 3,098.3900 3.1294 51.8400 440.4100 923.8800 86.6900 3,786.2300
31.12.1999 60.6173 3,099.3136 3.1306 60.3400 440.5231 924.1000 97.5000 3,776.5400
31.12.2000 60.7878 3,108.0300 3.1400 65.3300 441.7600 926.7000 97.4000 3,990.8000
31.12.2001 60.9610 3,116.8844 3.1484 69.1716 443.0206 929.3438 100.1824 4,110.9286
31.12.2002 61.0707 58.5979 93.9549 4,197.8760
31.12.2003 61.2931 49.0502 87.1136 3,930.5566
31.12.2004 61.3100 45.0676 86.4983 3,970.8549
31.12.2005 61.1779 51.8589 89.2717 3,934.0171
31.12.2006 61.1741 46.4496 91.1007 3,806.9637
31.01.2007 61.2139 47.1893 92.7062 3,770.2575
28.02.2007 61.1773 46.2413 90.8079 3,780.3436
31.03.2007 61.1675 45.9284 89.9787 3,764.8489
30.04.2007 61.1621 44.8304 89.6476 3,722.3602
31.05.2007 61.1920 45.5976 90.0545 3,716.0381
30.06.2007 61.1692 45.2973 90.7555 3,695.3543
31.07.2007 61.1658 44.7806 90.5757 3,721.2265
31.08.2007 61.1716 44.9461 90.2236 3,729.5208
30.09.2007 61.1940 43.1582 87.8215 3,686.1635
31.10.2007 61.1821 42.4669 87.7540 3,652.4446
30.11.2007 61.2935 41.5888 85.7552 3,713.6322
31.12.2007 61.2016 41.6564 83.2901 3,685.9552
31.01.2008 61.4240 41.4747 82.6258 3,806.8795
29.02.2008 61.2338 40.4959 80.4279 3,818.2827
31.03.2008 61.2664 38.7860 77.4740 3,893.6384
30.04.2008 61.3856 39.4230 77.8067 3,800.2600
31.05.2008 61.1654 39.4412 77.8186 3,758.0118
30.06.2008 61.1741 38.8456 77.2059 3,810.7581
31.07.2008 61.1879 39.2507 77.7779 3,750.4076
31.08.2008 61.1642 41.5095 75.9804 3,783.9767
30.09.2008 61.1689 42.6294 76.8550 3,860.4544
31.10.2008 61.4099 47.1115 77.6652 4,149.3176
30.11.2008 61.4030 48.2462 73.9884 3,973.0184
31.12.2008 61.4123 43.5610 63.0387 4,104.2772
31.01.2009 61.4129 47.9189 68.4000 4,129.7088
28.02.2009 61.4129 48.5708 68.7637 4,138.0567
31.03.2009 61.4135 46.5501 66.1000 4,051.2897
30.04.2009 61.4115 46.2924 68.3299 4,076.7061
31.05.2009 61.4128 43.5614 70.3549 4,059.5452
30.06.2009 61.1642 43.5085 72.0724 4,008.1389
31.07.2009 61.1704 43.5284 71.7626 3,994.4103
31.08.2009 61.1761 42.8764 69.4867 4,015.7608
30.09.2009 61.1741 42.0469 67.0916 4,044.8360
31.10.2009 61.1741 41.3339 68.4465 4,045.1035
30.11.2009 61.1741 41.0069 67.2908 4,060.9466
31.12.2009 61.1732 42.6651 67.6695 4,111.6548
31.01.2010 61.3673 43.9405 70.8180 4,185.4658
28.02.2010 61.5058 45.3248 68.8986 42.0179
31.03.2010 61.5200 45.6312 68.8682 42.9729
30.04.2010 61.5628 46.4415 70.9371 42.9069
31.05.2010 61.5025 49.6629 72.3601 43.1354
30.06.2010 61.5467 50.4564 75.9461 46.4223
31.07.2010 61.5063 47.2109 73.6691 45.4223
31.08.2010 61.5814 48.4893 75.4212 47.1707
30.09.2010 61.6363 45.2842 71.5204 46.3605
31.10.2010 61.5838 44.4424 70.9001 44.9254
30.11.2010 61.5044 46.7856 72.8725 46.6437
31.12.2010 61.5050 46.3140 71.5008 49.3026
31.01.2011 61.5050 44.8614 71.4427 47.5236
28.02.2011 61.5050 44.6919 71.9104 48.0545
31.03.2011 61.5162 43.6595 69.2223 47.3456
30.04.2011 61.5125 41.3947 68.9834 47.8064
31.05.2011 61.6141 43.1713 71.0577 50.7237
30.06.2011 61.6200 42.7175 68.4819 51.1964
31.07.2011 61.6029 43.1998 70.4154 53.9524
31.08.2011 61.5063 42.4562 69.5301 52.0182
30.09.2011 61.5040 45.1737 70.6415 50.3842
31.10.2011 61.5050 43.4357 69.9437 50.3685
30.11.2011 61.5114 46.1243 72.0569 50.0826
31.12.2011 61.5050 47.5346 73.6322 50.5964
31.01.2012 61.5050 46.9146 73.5882 51.0584
29.02.2012 61.5000 45.7113 72.5321 51.0373
31.03.2012 61.5050 46.0505 73.7558 51.0627
Source: National Bank of the Republic of Macedonia
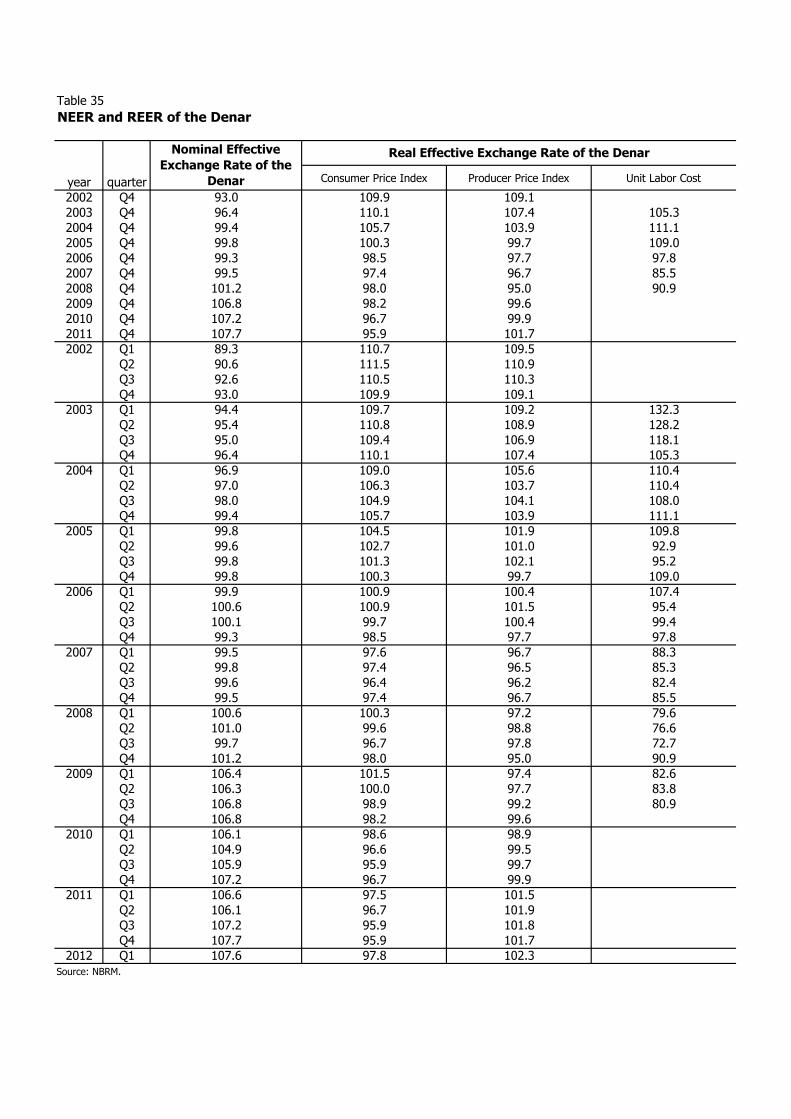
Table 35
NEER and REER of the Denar
year quarter Consumer Price Index Producer Price Index Unit Labor Cost
2002 Q4 93.0 109.9 109.1
2003 Q4 96.4 110.1 107.4 105.3
2004 Q4 99.4 105.7 103.9 111.1
2005 Q4 99.8 100.3 99.7 109.0
2006 Q4 99.3 98.5 97.7 97.8
2007 Q4 99.5 97.4 96.7 85.5
2008 Q4 101.2 98.0 95.0 90.9
2009 Q4 106.8 98.2 99.6
2010 Q4 107.2 96.7 99.9
2011 Q4 107.7 95.9 101.7
2002 Q1 89.3 110.7 109.5
Q2 90.6 111.5 110.9
Q3 92.6 110.5 110.3
Q4 93.0 109.9 109.1
2003 Q1 94.4 109.7 109.2 132.3
Q2 95.4 110.8 108.9 128.2
Q3 95.0 109.4 106.9 118.1
Q4 96.4 110.1 107.4 105.3
2004 Q1 96.9 109.0 105.6 110.4
Q2 97.0 106.3 103.7 110.4
Q3 98.0 104.9 104.1 108.0
Q4 99.4 105.7 103.9 111.1
2005 Q1 99.8 104.5 101.9 109.8
Q2 99.6 102.7 101.0 92.9
Q3 99.8 101.3 102.1 95.2
Q4 99.8 100.3 99.7 109.0
2006 Q1 99.9 100.9 100.4 107.4
Q2 100.6 100.9 101.5 95.4
Q3 100.1 99.7 100.4 99.4
Q4 99.3 98.5 97.7 97.8
2007 Q1 99.5 97.6 96.7 88.3
Q2 99.8 97.4 96.5 85.3
Q3 99.6 96.4 96.2 82.4
Q4 99.5 97.4 96.7 85.5
2008 Q1 100.6 100.3 97.2 79.6
Q2 101.0 99.6 98.8 76.6
Q3 99.7 96.7 97.8 72.7
Q4 101.2 98.0 95.0 90.9
2009 Q1 106.4 101.5 97.4 82.6
Q2 106.3 100.0 97.7 83.8
Q3 106.8 98.9 99.2 80.9
Q4 106.8 98.2 99.6
2010 Q1 106.1 98.6 98.9
Q2 104.9 96.6 99.5
Q3 105.9 95.9 99.7
Q4 107.2 96.7 99.9
2011 Q1 106.6 97.5 101.5
Q2 106.1 96.7 101.9
Q3 107.2 95.9 101.8
Q4 107.7 95.9 101.7
2012 Q1 107.6 97.8 102.3
Source: NBRM.
Nominal Effective
Exchange Rate of the
Denar
Real Effective Exchange Rate of the Denar

METHODOLOGICAL EXPLANATIONS REAL SECTOR
Table no. 1 Gross domestic product
The data for the gross domestic product (GDP) are produced by the State Statistical Office of the Republic of Macedonia (SSO). GDP is computed on the basis of the annual accounts data from the
Central Registry, SSO statistical research, data from the Ministry of Finance, Public Revenue Office and other sources.
Gross domestic product (GDP) at current prices, computed by the production approach, is the
final result of the production activity of the resident production units. GDP is a sum of the gross value
added of the institutional sectors or activities, expressed in basic prices, plus the turnover tax (i.e. value added tax) and import duties, less subsidies on products (which are not allocated to activities).
The GDP data by production approach presented by sectors is according to the National
classification of economic activities (NACE).
Table no. 2 Prices
The price data are from the SSO.
The average monthly retail prices and the structure of the personal consumption are used as
a base for computing the Consumer price index (CPI). The selection of the products whose prices are to be monitored is made on the basis of the
products with a significant share in the retail turnover. Retail prices are the prices at which the products are sold in the retail trade and by the individual producers and service providers. Retail
prices include VAT.
Consumer price index is based on a specific list of products and services for personal
consumption of non-agricultural households and on the average monthly retail prices of those products and services. In other words, the individual price indices of specific products and services are
weighted with their respective share in the personal consumption. In January 2007 two new
categories are added to the CPI structure- "hotels and restaurants" and "miscellaneous services n.e.c".
Producer prices are monitored in the Monthly survey of producer prices of industrial products,
C.41 in 200 industrial enterprises in the Republic of Macedonia. Enterprises are selected on the basis of their importance in the production.
The producer price of the industrial products is the price at which the producer sells the products to the regular buyers on the domestic market, loaded free on rail or truck where the
producer is located, or it is the price based on which the producer deals with other producers in the sphere of trade. This price includes producers subsidies, but excludes commercial rebates, discounts,
cash discounts and similar reductions offered by the seller. VAT is also excluded from the price.
Starting from January 2001 the Producer Price Index is computed in accordance with the
NACE classification.

Table no. 3 Industrial production index
Industrial production data is from the SSORM. The industrial production data is collected by
monthly reports delivered by the enterprises in the industrial sector, as well as by their units.
The production indices are computed on the basis of the monthly reports.
The data was collected according to the Uniform Classification of Economic Activity (UCEA)
with the Annual Industrial Report till 1998 and with the Monthly Industrial report till 1999, whereas starting from 1999 and 2000, respectively, the data from the same reports is collected according to
the National Classification of Economic Activities (NACE).
Production volume index is calculated on the base of production, by allocation of the specific products in appropriate industry, using:
- average monthly final production and production structure in the base year;
- total monthly production in the current year; - nomenclature of industrial products for the monthly industrial production report;
- weighting coefficients for each product; - weighting factors which show the structure of production, i.e. the share of each branch in the
total industrial production in the Republic of Macedonia.
Table no. 4 Employment and productivity in total economy
The source of the presented data for the employment is the Labour Force Survey (LFS) of the
SSORM.
The LFS is the most extensive research of the economic activity of the population and its
demographic, educational and other characteristics, after the Census research. The survey is conducted on the whole territory of the Republic of Macedonia and it is based on a sample of 10.000
households (7.200 households till the 2003) or 1,8% of the total number of households in the country.
Until 2003, the LFS was conducted annually, whereas starting from 2004 it is conducted as a continuous weekly survey throughout the year and the processing of the data is on quarterly and on
annual basis. The units under observation are persons aged from 15 to 79 years and the households. The LFS is prepared in accordance with international recommendations (ILO and Eurostat).
Classifications applied: National classification of activities and National classification of occupations.
Working age population is consisted of all persons aged 15 years and over. Working age
population is divided into active population and inactive population.
Active population (labour force) comprises the employed and the unemployed persons.
Inactive population comprises of:
- pupils and students - retired persons
- housewives - supported persons (by others or by the state or with a different kind of income such as rents
or interests).
The productivity in the economy is calculated in the NBRM and it is based on data from the
SSORM for the total GDP and the total number of employees in the economy (according to the LFS), on a quarterly basis.
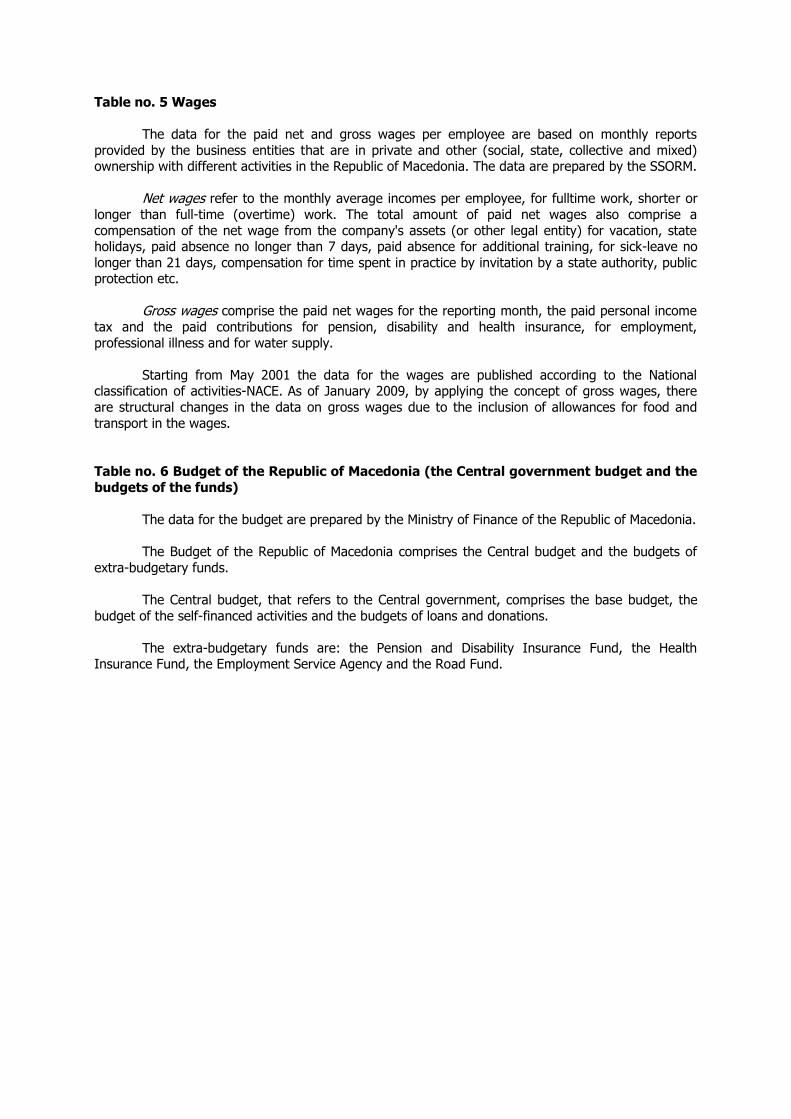
Table no. 5 Wages
The data for the paid net and gross wages per employee are based on monthly reports
provided by the business entities that are in private and other (social, state, collective and mixed) ownership with different activities in the Republic of Macedonia. The data are prepared by the SSORM.
Net wages refer to the monthly average incomes per employee, for fulltime work, shorter or
longer than full-time (overtime) work. The total amount of paid net wages also comprise a
compensation of the net wage from the company's assets (or other legal entity) for vacation, state holidays, paid absence no longer than 7 days, paid absence for additional training, for sick-leave no
longer than 21 days, compensation for time spent in practice by invitation by a state authority, public protection etc.
Gross wages comprise the paid net wages for the reporting month, the paid personal income
tax and the paid contributions for pension, disability and health insurance, for employment,
professional illness and for water supply. Starting from May 2001 the data for the wages are published according to the National
classification of activities-NACE. As of January 2009, by applying the concept of gross wages, there
are structural changes in the data on gross wages due to the inclusion of allowances for food and
transport in the wages.
Table no. 6 Budget of the Republic of Macedonia (the Central government budget and the
budgets of the funds)
The data for the budget are prepared by the Ministry of Finance of the Republic of Macedonia.
The Budget of the Republic of Macedonia comprises the Central budget and the budgets of
extra-budgetary funds.
The Central budget, that refers to the Central government, comprises the base budget, the
budget of the self-financed activities and the budgets of loans and donations.
The extra-budgetary funds are: the Pension and Disability Insurance Fund, the Health Insurance Fund, the Employment Service Agency and the Road Fund.

1
METHODOLOGICAL EXPLANATIONS MONETARY SECTOR
The data in the aggregate balance sheet of other depository corporations (banks and savings
houses) and the balance sheet of the National Bank of the Republic of Macedonia (NBRM) have been
disaggregated in line with the sector and currency criterion and according to the financial instrument underlying the creation of certain claims and liabilities. The data in the presented balance sheets refer
to end balances at the end of the reference period. The amounts denominated in foreign currency have been converted according to the middle Denar exchange rate at the end of the reference period,
applying the indicative NBRM exchange rate.
In the sector-by-sector classification defined in the IMF Monetary and Financial Statistics
Manual (in consistence with the sector delineation provided in SNA93 and ESA95), the clients are divided into two basic groups: residents and nonresidents. The group of residents consists of five
sectors: financial corporations, nonfinancial corporations, government, households and nonprofit institutions serving households.
The financial corporations sector consists of five subsectors:
National Bank of the Republic of Macedonia (monetary authority),
Other depository corporations (banks and savings houses),
Other financial corporations,
Insurance companies and pension funds,
Other financial intermediaries other than insurance companies and pension funds and
auxiliary financial corporations;
Nonfinancial corporations sector consists of two subsectors: public nonfinancial corporations
and private nonfinancial corporations.
Government sector is disaggregated to central government (Budget and central government
bodies, social insurance funds and other funds and agencies, and public sector institutions
(schools, hospitals, etc.)); local government.
Household sector consists of individuals and self-employed individuals.
Sector of nonprofit institutions serving households include nonprofit and nonfinancial
institutions (institutions of social and humanitarian nature, chambers of commerce, political
parties, citizen associations, religious communities, trade unions, Red Cross).
For the purposes of monetary balance sheets, the household sector and the nonprofit
institutions serving households are presented jointly as a sector of other residents.
The National Bank of the Republic of Macedonia and other depository corporations (banks and savings houses) constitute the depository corporations of the Republic of Macedonia.
The depository corporations' assets and liabilities are classified in the following aggregated categories: monetary gold and special drawing rights (SDR), currencies and deposits (including the
transferable deposits and other deposits), securities other than shares, loans, shares and other equities, other claims and liabilities (including the trade credits and other accounts).

2
Table 7. National Bank of the Republic of Macedonia - Balance Sheet
The NBRM balance sheet is prepared on the basis of accounting records of all NBRM assets
and liabilities to other economy sectors, including the nonresident sector. The NBRM balance sheet is published at the end of the month, including data on the preceding month.
A. NBRM balance sheet assets include the following categories: foreign assets, claims on
government and other assets.
The NBRM foreign assets consist of foreign reserves and other foreign assets. Foreign
reserves consists of monetary gold, foreign currency in the form of cash foreign currency, transferable and other NBRM deposits in foreign banks, placements in securities issued by nonresidents (in foreign
currency), placements in foreign currencies with international financial institutions and holding of Special Drawing Rights (SDR). Other foreign assets include other foreign currencies, checks,
transferable and other foreign currency deposits, foreign currency securities and shares and other
claims on nonresidents in Denars and in foreign currency which are not a part of the foreign reserves.
NBRM claims on the Central Government pertain to the relations with IMF (allocation of SDR and claims based on replaced IMF loans) and claims based on placements in securities. The
placements in securities are a specific category. The issue of such securities is one of the mechanisms
in the bank rehabilitation process for assuming the bad placements in the book of one bank. These securities are held by the Bank Rehabilitation Agency. They are depreciated under the agreement
between the Government and the Central Bank.
Other NBRM assets include NBRM claims on other sectors based on its current operations, fixed assets, special purpose assets and according to special regulations, stock, inflows from interests,
doubtful and contested claims on interest and fees.
B. The NBRM balance sheet liabilities consist of reserve money, currency held by other
depository corporations, other NBRM liabilities to other depository corporations, restricted deposits, foreign liabilities, Central Government's deposits and other NBRM liabilities.
Reserve money includes currency in circulation, cash in the vault, banks and savings houses' accounts with the NBRM, other financial institutions' accounts with NBRM (mainly the deposit
insurance fund). The currency in circulation is NBRM liability and includes currency in circulation held by nonbanking entities. The banks' accounts with NBRM consist of banks' accounts with NBRM
(including the savings houses) and deposited Denar reserve requirement of other financial institutions
with NBRM and allocated banks' foreign currency reserve requirement. The reserve requirement is calculated by using the defined reserve requirement rates applied to the average monthly balance of
the respective deposits. Average system form reserve requirement maintenance is in place, according to which the bank may use the reserve requirement to maintain the daily liquidity up to 80% of the
liability. The data on the currency in circulation are taken from the NBRM Central Bank Operations Department, and the data on banks and savings houses' daily liquidity are based on their daily reports
submitted to the NBRM.
Currency held by other depository corporations includes cash in the vault of the banks
and the savings houses.
Other NBRM liabilities to other depository corporations primarily include the NBRM
liabilities on issued CB bills. The CB bills auctions are the basic instrument of the NBRM monetary policy used for regulation of the global liquidity level and interest rates in the banking system, and for
signaling the monetary policy guidelines. They were introduced for the first time in February 1994, and by definition have been intended for withdrawing liquidity from the banking system. The
interventions with this instrument with maturity of 28 days have been carried out by auctions that could be organized as volume tender or interest rate tender (US type). The CB bills auctions lays upon
market and flexible base, which ensures their permanent alteration, for increasing their efficiency and
successful achievement of their established goals.

3
Central Government deposits include government demand deposits in Denars (treasury account of the government and other budget funds) and in foreign currency (deposits for special
purposes on central government level and other deposits). Since March 2006, Denar government
deposits also include cash mobilized through the issue of treasury bills for monetary purposes, deposited on a special account. On March 7, the NBRM in cooperation with the Ministry of Finance
started issuing 3-month treasury bills for monetary purposes. The treasury bills for monetary purposes have been issued on regular government securities auctions, with same features as the regular
government securities. According to the Law on Public Debt, the treasury bills for monetary purposes
are not considered a part of the public debt, because they have been issued for monetary policy purposes. In addition, the government has no right to make the withdrawn funds available by issuing
treasury bills for monetary purposes. The interest rate on treasury bills for monetary purposes has been charged to the NBRM, according to the average interest rate reached at the 3-month treasury
bills. For regulating the mutual relations, the Ministry of Finance and the NBRM have concluded an Agreement on treasury bills for monetary purposes.
Foreign liabilities include NBRM liabilities to nonresidents based on checks and foreign currency L/Cs, and liabilities on used loans from the International Monetary Fund. This category also
includes SDR allocation.
Other NBRM liabilities include capital accounts consisting of NBRM own funds, retained
earnings, current year financial result, general and specific impairment and special reserve and valuation adjustments. This category also unclassified NBRM liabilities arising from various business
relations with resident sector.
Table 8. Report form for other depository corporations (banks and saving houses)
The balance sheet of other depository corporations has been prepared on the basis of accounting records submitted by the banks and the savings houses (KNBIFO), being aggregate
balance sheet assets and liabilities of all other depository corporations. The monthly balance sheet of other depository corporations has been published at the end of the month, containing data on the
preceding month. The balance sheet includes data on the claims and liabilities (holders of monetary
aggregates, as defined by the national definition) of other depository corporations (except for NBRM) to other sectors in the economy, including the nonresident sector. The data have been classified in
standardized components by sector, financial instrument and accounting principle.
A. Assets in the balance sheet of other depository corporations include currencies and
deposits, securities other than shares, loans, shares and other equities, financial derivatives, other claims, nonfinancial assets.
Currencies and deposits have been divided by currency structure in Denars and foreign
currency. Currencies include banknotes and coins in the vaults of other depository corporations issued by the central bank and foreign currencies issued by central banks of foreign states. Deposits consist
of transferable deposits which include current accounts of other depository corporations with NBRM
(which also include their reserve requirement in Denars deposited with NBRM) and bank accounts abroad. The group of deposits includes sight deposits, savings and other deposits (which also include
the banks' compulsory deposit with NBRM).
Securities other than shares have been classified by currency structure and sector and include
CB bills, treasury bills, government bonds, corporate bonds, commercial securities, transferable deposit certificates, etc.
Loans refer to assets provided to various sectors by other depository corporations. Loan data
include accrued interest, whereas the expected losses, loan loss provisions and impairments have been excluded from this category. According to the currency distribution, the loans have been
classified to Denar and foreign currency.

4
Shares and other equity include financial instruments which supply the holder with the right of ownership of the company of issue.
Other claims include trade credits and advances which refer to financial services provided by other depository corporations to other financial and nonfinancial corporations. This category includes
all other items not included in other categories of financial instruments, and consists of dividends, settlement account, items in process of collection, etc.
Nonfinancial assets include tangible (fixed assets, stock, etc.) assets and intangible assets for which no respective liabilities have been recorded (patents, licenses, software, etc.).
B. Liabilities of other depository corporations include liabilities arising from accepted deposits,
received loans, issued securities, other liabilities and shares and other equities.
Deposits are differentiated into deposits included and excluded from the broad money, further
classified into Denar and foreign currency deposits.
Deposits included in the broad money contain transferable deposits and other deposits of domestic depository corporations included in the national definition of broad money. This category
includes deposits of other financial corporations, nonfinancial corporations, households, nonprofit
institutions serving households and local government.
Deposits excluded from the broad money include transferable and other government deposits (except for the local government), depository corporations and nonresidents deposits.
Securities other than shares include commercial securities issued by other depository
corporations for the purposes of strengthening the total financial potential.
Loans include funds provided to other depository corporations by various institutional sectors.
Other liabilities include trade credits (received for purchasing goods and services from
households, nonprofit institutions and nonfinancial corporations) and advances received for current
operations or operations about to start, and advanced payments for goods and services. This category also includes settlement accounts, liabilities on dividends, loss provisions for impaired financial assets,
accumulated depreciation and losses arising from impairment and other liabilities. Other liabilities include all accounts n.e.c. in the balance sheet of other depository corporations.
Shares and other equity have been divided into equity investments, retained earnings, financial result from current year, general and specific impairment of value and special reserve and
valuation adjustments.
Table 9. Depository corporations survey - NBRM, other depository corporations (ODI -
banks and savings houses)
The survey of depository corporations is a consolidated survey of the accounts of banks,
savings houses and NBRM, showing the combined assets and liabilities of the monetary system with respect to other resident and nonresident entities. Basic source of preparation of the survey of
depository corporations are the NBRM survey and the survey of other depository corporations.
As a consolidated balance sheet of the monetary system, it is a basis for its continuous
monitoring. Simultaneously, the survey also provides an analysis of the interactions of the basic macroeconomic sectors: the real, fiscal, external and the monetary sector.
The monthly survey of depository corporations has been published at the end of the month,
containing data on the preceding month.

5
Major components of the Survey of depository corporations are the net foreign assets, domestic credits, money, deposits (restricted and other), liabilities to other financial corporations,
capital accounts and other items (net).
Net foreign assets is the difference between the foreign assets and liabilities of the NBRM and
other depository corporations (banks and savings houses). All foreign assets and liabilities of the NBRM and other depository corporations have been aggregated and presented as net foreign assets
of the monetary system.
Domestic credits include claims of the depository corporations (NBRM, banks and savings
houses) on government (recognized on a net basis), claims on local government, public nonfinancial corporations, private sector and other financial corporations (recognized on a gross basis).
Claims on central government include claims on loans, securities and trade credits and
advances. Sources of loans to the Government include foreign loans, credit lines, deposit potential and
other sources. Claims on Government based on securities include claims on specific securities (issued by the government in the process of rehabilitation of one bank, bonds issued for the old foreign
currency savings).
Claims on local government include claims on local currency credits.
Claims on public nonfinancial corporations include claims on local and foreign currency
loans to public enterprises.
Claims on private sector include total placements of depository corporations to the private sector based on approved loans, placements in securities and shares and other placements. Claims on
private sector contain claims on other nonfinancial corporations, claims on households and claims on
nonprofit institutions serving households.
Claims on other financial corporations include total placements of depository corporations based on approved loans, placements in securities and shares.
Money includes currency in circulation (currency outside other depository corporations), demand deposits of the local government and other financial corporations with NBRM and demand
deposits of the sector of money holders with banks and savings houses.
Restricted deposits include deposits restrictedly used for a purpose specified by regulation.
These deposits are intended for covering open L/Cs in the external payment operations, guarantees, bank remittances, etc.
Other deposits include time, savings and foreign currency deposits of sectors included in the
definition of the broad money, with NBRM, banks and savings houses.
Liabilities to other financial corporations include total depository corporations' liabilities
on deposits, securities and received loans.
Capital accounts unite the capital accounts of NBRM, banks and savings houses.
Other items (net) recognize all categories not included in the previously presented
categories and all unclassified assets and liabilities of the depository corporations.
Table 10. Banks and savings houses' loans
Loans approved by other depository corporations to nongovernment sector have been
classified by currency: loans in Denars and in foreign currency. They are further classified into short-
term and long-term loans, accrued interest and doubtful and contested claims. Short-term and long-term loans have been divided in to loans with and without currency clause. Loans to nongovernment

6
sector include loans to the following sectors: nonfinancial corporations, households, nonprofit institutions serving households, local government and other financial corporations.
Table 11. Monetary aggregates and components thereof (non-government sector)
Monetary aggregates, as a sum of financial instruments classified by liquidity level, have been
defined in a manner compatible with the internationally accepted definitions and criteria (as specified
by the IMF Methodology for monetary and financial statistics). Deposits included in monetary aggregates consist of the following sectors: other financial corporations, local government,
nonfinancial corporations (private and public), households (individuals and self-employed individuals) and nonprofit institutions serving households.
Money supply M1 includes currency in circulation and demand deposits. Demand deposits, however,
include current accounts with banks and savings houses and current accounts of other financial
corporations with NBRM. Currency in circulation is the difference between the total amount of banknotes and coins and the
amount of cash in the banks' vaults, in the NBRM's vault and in the dispersed vaults.
Money supply M2 (liquid assets) includes the monetary aggregate M1 and short-term deposits.
Short-term deposits have been defined as deposits which include sight deposits, time deposits with maturity of up to one year, in Denars and in foreign currency.
Money supply M4 (total deposit potential of the monetary system) includes monetary
aggregate M2 and short-term deposits, i.e. deposits with maturity of over 1 year, in Denars and in foreign currency.
Table 12. Claims of other depository corporations (banks and savings houses)
Claims of other depository corporations include loans, placements in securities, shares and
overdue claims and doubtful and contested claims on loans. Placements of other depository
corporations have been decomposed by sector, maturity and currency. According to the accepted standards of the monetary and financial consolidation statistics i.e. exclusion of the mutual claims and
liabilities within a sector, the placements exclude the interbank claims.
Claims of banks and savings houses on nonfinancial corporations (private and
public) include claims on loans, accrued interest on loans, overdue claims and doubtful and suspicious and contested claims on loans, securities and shares. All categories have been
differentiated by currency, and the loans have also been differentiated by maturity. Other depository corporations approve loans from various sources of funding: deposits, own sources, foreign credits,
received credit lines and other sources. Claims on securities include claims on short-term securities (checks and notes) and claims on long-term securities, i.e. holdings or investments of the banks and
savings houses in securities of nonfinancial corporations. Claims which form the category of shares
include financial instruments which supply other depository corporations with the right of ownership of the issuing nonfinancial entity.
Claims of banks and savings houses on households (individuals and self-employed
individuals) include claims on loans, accrued interest on loans, overdue claims and doubtful and
contested claims on loans. Claims on households have been differentiated by currency, maturity and purpose. By purpose, the loans have been disaggregated to consumer loans, auto loans, housing
loans, credit cards and overdrafts, other loans and loans of self-employed individuals.
Claims of banks and savings houses on nonprofit institutions serving households, other financial corporations and local government include claims on loans, accrued interest on
loans, overdue claims and doubtful and contested claims on loans, claims on securities, and claims on
shares.

7
Claims of other depository corporations on Government include claims on loans, accrued interest on loans, overdue claims and doubtful and contested claims on loans, claims on
securities, and claims on shares. Sources of loans to the Government include foreign loans, credit
lines, deposit potential and other sources. Liabilities on Government based on securities include claims on specific securities.
Table 13. Liabilities of other depository corporations (banks and savings houses)
According to the dominant classic deposit and credit activity of other depository
corporations, the liabilities to nonfinancial corporations include deposits of nonfinancial corporations and loans received from nonfinancial entities. Besides deposits and loans, this category
also includes securities issued by nonfinancial entities. Deposits have been disaggregated by their maturity and currency structure. Loans and securities have been differentiated by their currency
structure.
Liabilities of other depository corporations to households include current accounts,
sight deposits, time deposits (up to three months, over three months, up to one year and over one year) and restricted deposits intended for covering L/Cs in the domestic payment operations.
Liabilities of other depository corporations to other clients - nonprofit institutions serving households, to local government, other financial corporations and liabilities to government,
respectively. The above are liabilities on various types of deposits differentiated by their maturity and currency structure, and liabilities on securities and other loan liabilities in Denars and foreign currency.
Table no. 14 Report of weighted interest rates on granted loans and received deposits of
deposit money banks
Based on a Report on weighted interest rates on deposits and borrowings, which the deposit money banks submit to NBRM on regular monthly basis, aggregated survey on weighted interest rates
of deposits and borrowings in Denar and in foreign currencies is prepared.
Interest rates on Denar credits include: interest rates on Denar credits without FX clause
and interest rates on Denar credits with FX clause.
Interest rates on Denar deposits include: interest rates on Denar deposits without FX
clause and interest rates on Denar deposits with FX clause.
Denar credits/deposits are further categorized by two criteria: sectoral classification and maturity. By sectoral classification, they are divided to: credits/deposits which refer to enterprises,
credits/deposits which refer to the households. By maturity, the credits are divided to: short-term and long-term; and the deposits: sight deposits, short-term and long-term time deposits.
Foreign currency credits/deposits are classified by three criteria: by sector, by currency and by maturity. By sector classification, they are divided to: credits/deposits which refer to
enterprises, credits/deposits referring to households. By maturity, credits are divided to: short-term and long-term; and the deposits to: sight deposits, short-term and long-term time deposits. By
currency, they are divided to: credits/deposits in euros and in USA dollars.
Interest rates on credits and deposits are in percents on annual level.
Table no. 15 Interest rates of the National Bank of the Republic of Macedonia
1. Discount rate is valid interest rate in the current month.

8
2. Interest rate on credits over night - Lombard credit is the valid interest rate in the current month.
3. Interest rate on repo transactions for creating liquidity in the banking system is shown as average weighted interest rate achieved at the auctions in that month.
4. Interest rate on CB bills is shown as average weighted interest rate achieved at the
auctions with maturity of 28 days in that month. The interest rate is differentiated by the type of
tender which can be: volume tender or interest rate tender.
5. Interest rate on repo transactions for liquidity withdrawal from the banking system is shown as average weighted interest rate achieved at the auctions in that month.
Table no. 16 Reserve requirement of banks and saving houses
Banks and saving houses allocate reserve requirement based on the average deposit stock in
the previous month. The period of maintaining the reserve requirements covers the period from the 11th in the current month to the 10th in the following month. The fulfilling of the banks' reserve
requirement in denars is on average basis, whereas the saving houses' reserve requirement in denars
and the banks' reserve requirement in foreign currency are on fixed basis.
Table no.17 Interest rates on Government securities
Interest rates on Government securities are shown as average weighted interest rate achieved
on the auctions in the adequate month with fixed maturity.

1
METHODOLOGICAL EXPLANATIONS FOREIGN EXCHANGE SECTOR
Table no. 18-23 BALANCE OF PAYMENTS
Balance of payments is a statistical statement that systematically summarizes, for a specific
time period, the economic transactions of the Republic of Macedonia with the rest of the world.
According to the Law on the National Bank of the Republic of Macedonia and the regulations
in the area of foreign exchange operations, the National Bank of the Republic of Macedonia (NBRM) is responsible for compiling and monitoring of the execution of the Balance of payments.
Statistics of the Balance of payments of the Republic of Macedonia is prepared basically in
accordance with the methodology of the International Monetary Fund (Balance of Payments Manual,
fifth edition - BPM 5). The data are disseminated (issued) on monthly basis, in millions of euros and USA dollars. The transactions which are denominated in other currencies are converted in euros and
USA dollars equivalent to the exchange rate on the day of the transaction.
The main sources of data for compiling the balance of payments are the following:
– the single administrative document (SAD) for the foreign trade of the Republic of Macedonia;
– the system for reporting on the banks’ international payment operations (ITRS); – the system for reporting on the external debt (from the credit indebtedness);
- the banks’ reports on the stock of assets and liabilities (the banks' report on the deposit
money banks book keeping stock); - the monthly reports on stocks and flows (changes and stocks) on the accounts abroad of the
residents which are not authorized banks and the stock and flow on settlement accounts (monthly reports-MR);
– additional NBRM’s reports on the realized turnover in exchange offices and on the official foreign exchange reserves stock of the Republic of Macedonia;
-data from the annual direct investment survey - DI 22.
BALANCE OF PAYMENTS: SEPARATE ITEMS
CURRENT ACCOUNT
Goods
The source of data on the foreign trade of the Republic of Macedonia is the SAD, which is
prepared by the Customs Administration of the Republic of Macedonia, and it is processed and published by the State Statistical Office of the Republic of Macedonia and the NBRM.
In accordance with the methodology on recording the foreign trade in the trade statistics, the State Statistical Office is publishing the data for the exports on the f.o.b. basis, while regarding the
imports, on the c.i.f. basis.
Adjustment for the coverage and classification are made for good’s item in the balance of
payments in line with the recommendations given in the BPM5, especially regarding the following: – coverage: regarding the return of goods and the invoiced value of the performed service for
the repair of goods;

2
– classification: regarding the c.i.f./f.o.b. factor and processing of goods. In the balance of payments, both the exports and the imports are presented on f.o.b. basis, because of which an
adjustment of the c.i.f. imports for c.i.f./f.o.b. factor is necessary. In the period from 1993 to 1997,
the c.i.f./f.o.b. factor was determined on the basis of the average internationally set rates for calculation of these expenses. Since 1998, the c.i.f./f.o.b. factor is calculated on the basis of
established methodology based on the SAD data on transport and insurance of the parities with a destination in the Republic of Macedonia adjusted to the overall imports.
The item import of goods in ports by carriers is based on data from the monthly reports - MR.
Services
Transportation: The data that refer to the transportation are taken from the ITRS and the
monthly reports MR. There is a possibility for making a desegregation by the type of transport (air, sea, railway and road), and on the basis of the category of services (freight, passengers and other).
The adjustment is made for the outflow of transportation services (transport of goods) regarding the
c.i.f./f.o.b. factor that refers to the costs of transport of goods provided by non-residents.
Travel: The data originate from the ITRS and the monthly reports-MR.
Other services: The data are taken from the ITRS for the receipts from and payments to
non-residents on the basis of type of services: telecommunication, construction, insurance, business, government and other services. The adjustment is made for the insurance outflow regarding the
c.i.f./f.o.b. factor that refers to the costs insurance of the transport of goods. An adjustment is made in financial intermediation services, by redistribution of part of Other investment income, based upon
the calculation of exports and imports of financial intermediation services indirectly measured (FISIM). Additional source on data for certain types of services are the data from the monthly reports – MR.
Income
The income as a balance of payments’ component originates from: compensation of employees (residents employed with non-residents and vice versa) and investment income.
Investment income represents a capital gain from the direct investment, portfolio investment and
other investment (dividends, loan and credit interests, etc.).
Direct investment income: The data include dividends and distributed branch profits, as well as reinvested earnings and undistributed branch profits. Major data source for the receipts and
payments of dividends is the ITRS. For the previous years a basic data source for reinvested earnings
is the annual direct investment survey, while for the current year estimates are based on data from the previous years.
Portfolio investment income: Data on inflow include interest receipts on foreign debt
securities and accrued interest on foreign debt securities as part of the gross official reserves. Data on outflows include dividends paid on equity securities and interest paid on debt securities. The data
sources are the ITRS, the NBRM’s reports on the official foreign exchange reserves stock and the
annual direct investment survey.
Other investment income: The data include received and paid interest on the deposits, short-term and long-term loans. The received interest consists of the inflows of interest on foreign
currency deposits on the foreign accounts (interest on the foreign exchange reserves and on the
foreign exchange assets of the banks). The data sources are the ITRS and the NBRM’s reports on the official foreign exchange reserves stock. Interest paid and received on short-term and long-term loans
is presented on accrual basis. The source of data is external debt reports, which are obligatorily recorded in the NBRM (credit indebtedness). An adjustment is made in Other investment income, by
redistribution of part of this income in the financial intermediation services item, based upon the calculation of exports and imports of financial intermediation services indirectly measured (FISIM).

3
Current transfers
The official transfers mainly refer to the assistance in financial assets and goods received
by foreign governments and international organizations. The source of the data for the transfers in financial assets is the ITRS, while regarding the transfers in goods is the customs administration
documents.
The private transfers consist of: remittances, cash exchanged and other transfers of which
the most are rents. The source of data is the ITRS. Cash exchanged on the exchange market in accordance with the BPM5 should be classified in the capital and financial account of the balance of
payments. However, regarding the fact that the largest part of these assets originates from the residents’ receipts from non-residents on the basis of provided goods and services (unrecorded
transactions) and transfers received in cash foreign currency, these transactions are recorded as a part of the balance of payments’ current account (private transfers).
CAPITAL AND FINANCIAL ACCOUNT
CAPITAL ACCOUNT This account encompasses the capital transfers for which main source of data is the ITRS.
FINANCIAL ACCOUNT
Direct investment: The direct investment include equity, reinvested earnings and other capital. Trade credits, long-term and short-term loans between affiliates are recorded under other
capital. Basic data source for the previous years is the annual direct investment survey DI 22. The source of data for the investment in financial assets is the ITRS, while regarding the investment in
goods is the customs administration documents. For the current year data on reinvested earnings and
other capital are estimates based on data from the previous years. Loans within other capital are based on the system for reporting on the external debt and claims.
Portfolio investment: The source of data for the portfolio investment is the ITRS.
Additional data source for the previous years is the annual direct investment survey DI 22.
Other investment:
Trade credits: The trade credits (extended to and received from foreign countries) represent
a differential between the exports/imports of goods and the corresponding settlements. The estimated
data for the trade credits are derived from the foreign trade data in the administration customs documents and corresponding settlements from the ITRS. If the value of the exported goods is higher
than the value of receipts on exports, the difference is recorded as an extended trade credits (with a negative sign). If the value of imported goods is higher than the payments on the imports, the
difference is recorded as a received trade credits (with a positive sign). Additional source of data are the data from the monthly reports – MR.
Loans: Within the ―loans‖ category, disbursements and amortization on short-term and long-term loans are recorded. Principal and interest arrears are also recorded as a counter-entry in the
category other investment – other. The data are based on the reports on medium-term and long-term public and private external debt prepared by the NBRM, which are obligatory recorded in the NBRM.
Currency and deposits: The data primarily refer to the changes in the foreign exchange assets and foreign exchange liabilities of the banks. The sources of data are the monthly bank’s
reports on the deposit money banks’ book-keeping stock and the ITRS. The changes of foreign exchange assets and foreign exchange liabilities of the banks are showing with partly excluding of
valuation changes. The changes of foreign exchange assets of individuals include net cash deposited on foreign exchange accounts with the banks, reduced for the imports of goods by the individuals.
The source of data for net cash deposited on foreign exchange accounts with the banks is the ITRS
and for imports of goods is the SAD. Additional source of data on currency and deposits for other sectors are the data from the monthly reports – MR.

4
Gross official reserve assets: Transactions are calculated as the changes in the stock of
the particular components of the official foreign exchange reserves, excluding price changes and
exchange rate differentials. The source of data are the reports of the NBRM.
Table no. 24 and 25 Foreign trade
The source of the data regarding the foreign trade is the State Statistical Office of the Republic of Macedonia. The data on the international trade of goods of the Republic of Macedonia is
prepared in accordance with the main statistical standards, definitions and recommendations of the UN regarding the concepts and definitions of the foreign trade statistics. The data relating to the
exports are published on f.o.b., while those relating to the imports, on c.i.f. basis.
Table no. 26 and 27 Stock of foreign direct investment
The calculation and dissemination of foreign direct investment (FDI) data worldwide is based on the methodological recommendations of the Balance of Payments Manual-fifth edition, IMF 1993
and The OECD Benchmark Definition of Foreign Direct Investment-third edition, OECD 1996. In
accordance with these recommendations, FDI include: - equity and reinvested earnings;
- claims on direct investors/affiliates abroad; - liabilities to direct investors/affiliates abroad.
Methodologically, the reinvested earnings include:
- part of the profit distributed in equity;
- part of the profit distributed in reserves; - part of the profit distributed for loss coverage from the previous period;
- undistributed earnings; - uncovered losses;
- losses from previous periods, transformed into claims on the investors;
- earnings from previous periods, transformed into liabilities to the investors.
According to the recommendations of the Balance of Payments Manual-fifth edition, the criterion for classifying a transaction as a direct investment is a minimum 10% of equity participation
on the right to vote. Accordingly, the distinction between a portfolio and direct investor is based on
the percentage of owned shares in the company.
The methodology applied to calculate foreign direct and portfolio investment in the Republic of Macedonia corresponds fully with the methodologies applied by the member countries of the IMF
and OECD.
The FDI data in the Republic of Macedonia are disseminated by the country of the investor
and the type of activity of the direct investment company.
Table no. 28 and 29 International investment position
The international investment position is a statistical report which presents the position and the structure of the financial claims (assets) of residents on non-residents and the financial liabilities of
residents to non-residents arising from their operations. In other words, the international investment position is a balance sheet of the international financial assets and liabilities of a country on a certain
date, often at the end of the year.
International financial assets of the country comprise of the direct and portfolio investments
of resident legal entities and natural persons in other countries including the investments in financial derivatives, other investments of residents abroad in the form of extended loans and credits, foreign

5
assets of resident banks with foreign commercial banks, as well as the official foreign reserves. International financial liabilities of the country comprise of the liabilities based on direct and portfolio
investments of non-resident legal entities and natural persons in the country including the investments
in financial derivatives, liabilities on the basis of other investments of non-residents in the country in the form of used loans and credits, and liabilities on the basis of deposits of foreign legal entities and
natural persons with resident banks.
The difference between the total international financial assets and liabilities presents the net-
international investment position of a country. This means that the international investment position of the Republic of Macedonia is a difference between the investments of residents with non-residents
(its international assets) and the investments of non-residents with residents (its international liabilities).
Direct investments are investments by which the investor intends to establish a permanent
economic link and/or to exercise right to manage the legal entity it invests in. In line with the
international recommendations and standards, a minimum share of 10% in the capital or voting right in the legal entity the investment is made in, is used as a criterion for defining direct investments.
Direct investments include shareholders' capital, reinvested gain and the debt of connected entities. Source of data on direct investments for compiling the international investment position of the
Republic of Macedonia are the questionnaires - reports on the condition and the turnover of the
connected entities which all resident legal entities submit to the NBRM on annual basis, and are related to the investments to and from other countries.
Portfolio investments include the investments in debt securities and in equity instruments,
where the investor owns less than 10% of the shareholders' capital or does not have voting right. Source of data on the investments in equity instruments for compiling the international investment
position of the Republic of Macedonia are the annual questionnaires - reports on the condition and the
turnover of the connected entities, while for the investment in debt securities data are used on the international payment operations of commercial banks (in line with the Reporting system for
international transactions), reports on operations with securities from the authorized participants in the Macedonian Stock exchange, as well as the data base of the Central Securities Depositary. For
calculation of the market value of the securities, data on the market prices from the Macedonian Stock
Exchange are used.
Other investments include the assets and the liabilities on the basis of short-term and long-term financial and trade credits and loans, currencies and deposits and other assets and liabilities. In
line with the Balance of Payments Manual of the IMF, trade credits denote claims and liabilities arising
from international commercial operations of residents (on the basis of import/export of goods and services, advance payment, etc.) Source of data on the trade credits for compiling the international
investment position of the Republic of Macedonia are the quarterly reports on the claims and liabilities on the basis of international commercial operations of residents (KIPO Form), while for the financial
credits and loans records of registered foreign credits are used (KZ and KO Forms). Currencies and deposits include the deposits which resident banks keep abroad, i.e. liabilities of resident banks to
non-residents. Sources of data for this item are the monthly balance sheet of the commercial banks
and international payment operations of banks.
Table no. 30-32 Gross external debt, Gross external claims and Net external debt
1. General methodological notes
The National Bank of the Republic of Macedonia (National Bank) is the institution responsible for recording and monitoring of the external debt of the Republic of Macedonia in accordance with the
legislation i.e. the Law on the National Bank of the Republic of Macedonia and the Foreign Exchange Law.

6
The external debt statistics is prepared in accordance with the External Debt Statistics Guide1 (Guide).
Gross external debt Gross external debt, at any given time, is the outstanding amount of those actual current, and not
contingent, liabilities that require payment(s) of principal and /or interest by the debtor at some point(s) in the future and that are owed to nonresidents by residents of an economy. According to this
definition, gross external debt at a certain date is the stock of all future liabilities of residents to
nonresidents, future installments of principal, arrears in principal and interest, accrued interest costs, as well as late (default) interest, regardless of the type of instrument and maturity.
Gross external claims Gross external claims are the stock of all current, not contingent claims based on debt instruments, of
residents from nonresidents. Basically, the definition of gross external claims is identical with the
definition of gross external debt, having in mind that the claims of one economy are liabilities for other.
Net external debt
Net external debt is defined as the difference between the stock of gross external debt and gross external claims. In its structure, net external debt is identical with the gross external debt, where the
standard presentations contains classification by institutional sectors, maturity and debt instruments.
According to the Guide, the basic classification of debt is among the four basic institutional sectors of an economy:
- general government (government units that exist at each level—central and local—of
government within the national economy and all social security funds operated at each level of government);
- monetary authorities - (the central bank or other institution carrying out the operations of a monetary authority);
- banking sector (financial intermediaries carrying out activities of taking deposits and
extending credits); - other sectors (non-bank financial intermediaries, non-financial corporations, households and
non-profit institutions serving households).
Furthermore, within each of the sectors, debt is classified by maturity, on short term (with original
maturity of one year or less) and long term (maturities of more than one year). On the third level of disaggregation, debt is distributed amongst the standard types of debt instruments, such as:
- trade credits - consist of claims or liabilities arising from the direct extension of credit by suppliers for transactions in goods and services, and advance payment by buyers for goods
and services and for work in progress (or to be undertaken); - loans - include those claims or liabilities created through the direct lending of funds by a
creditor (lender) to a debtor (borrower) based on a credit agreement;
- debt securities - creation of debt or a claim through the issuance/purchasing of securities as part of the portfolio investment in the country, being traded on organized markets or over-
the-counter; - currency and deposits - currency (notes and coins) are claims on a central bank or a
government that have issued them, from the nonresident holders. Liabilities on deposits are
liabilities of the financial institutions that take deposits to nonresident depositors, while claims on deposits arise from the funds deposited with nonresident financial institutions; and
- other - other claims and liabilities, not included under previous debt instruments. An important category within this item are arrears, that have a treatment of short-term claims/liabilities, as
they are considered to be immediately due and are a cumulative amount of arrears on all previously mentioned instruments.
1 External Debt Statistics: Guide for compilers and Users, IMF, 2003

7
Direct investment - intercompany lending claims or liabilities are shown separately. The separation of these claims/liabilities within net external debt is significant in view of the necessary compatibility with
the IIP statement, where these claims/liabilities are incorporated within the item Direct investment
(Other capital).
From the aspect of valuation, the Guide recommends the nominal value to be used for all debt instruments, except debt securities, where it is recommended to use the market value of debt. This is
entirely consistent with the methodological recommendations for the compilation of the IIP of a
country.
Stock data, repayment schedules, arrears, new commitments and accrued interest are converted into the unit of account using the mid exchange rate of the National Bank at the cut-off date. Flow data,
disbursements and repayments, are converted into the unit of account using the mid exchange rate of the National Bank on the day of the transaction.
The stock of debt is a result of disbursements, decreased for the amortization (repayments of principal), increased for the amounts of capitalized interest in arrears, accrued interest and default
interest. Having in mind the fact that stock data are converted using the end period exchange rate, while the flow data are converted using the transaction date exchange rate, discrepancies between
debt stock at end-period and beginning of period differ from the net flows, as they include the
exchange rate differentials as well.
2. Data sources and methodology for compiling net external debt of the Republic of
Macedonia
Data sources for the net external debt of the General Government sector -for the category debt securities (bonds and money market instruments) - for debt securities issued
abroad and bought by nonresidents, data from the reporting system on external debt (ED) and data for debt securities market value at the cut-off date;
-for the category debt securities (bonds and money market instruments) - for debt securities issued
domestically and bought by nonresidents, data from the reports on operations with securities from the authorized participants in the Macedonian Stock exchange, as well as the data base of the Central
Securities Depositary are used, while for calculation of the market value of the securities, data on the market prices from the Macedonian Stock Exchange are used.
- for the category loans the data are used from the reporting system on external debt (ED) -the credit
records statistics is conveyed by the NBRM and is based on a loan-by-loan data base containing various elements. Various data can be obtained from this data base on the stock of external debt,
disbursement, repayments, arrears, accrued interest etc.; and the reporting system on external claims (EC) -the credit records statistics is conveyed by the NBRM and is based on a loan-by-loan data
base containing various elements. Various data can be obtained from this data base on the stock of external claims, disbursement, repayments, arrears, accrued interest etc.;
Data sources for the net external debt of the Monetary Authority sector
-for the category debt securities (bonds and money market instruments) - data from reports of the NBRM on the official foreign reserves of the Republic of Macedonia;
- for the category currency and deposits - data from reports of the NBRM on the official foreign
reserves of the Republic of Macedonia; - for the category loans the data are used from the reporting system on external debt (ED) and data
from reports of the NBRM on the official foreign reserves of the Republic of Macedonia. - for the category other the data are used from the reporting system on external debt (ED) and
include a debt liability for SDR allocations.

8
Data sources for the net external debt of the Banking sector
- for the category loans the data are used from the reporting system on external debt (ED) and the
reporting system on external claims (EC); - for the category currency and deposits - data from reports of the banks on assets and liabilities -
monthly monthly balance sheet of the commercial banks; - for the category other - the data on arrears are used from the reporting system on external debt
(ED) and the reporting system on external claims (EC);
Data sources for the net external debt of the Other sectors -for the category debt securities (bonds and money market instruments) - for foreign debt securities
issued abroad and bought by residents, data on the market value of the purchased debt securities at the cut-off date, is provided by the residents authorized for participation at foreign capital markets;
- for the category loans the data are used from the reporting system on external debt (ED) and the
reporting system on external claims (EC); - for the category currency and deposits - data from the monthly reports of resident accounts held
abroad (MR); -for the category short-term trade credits - data are used from the quarterly reports on the claims and
liabilities on the basis of international commercial operations of residents (KIPO Form). For the current
year, this category is based on estimation of the stock of debt/claims from commercial operations by adding trade credits flows from the balance of payments to the stock at the end of previous quarter.
- for the category long-term trade credits the data are used from the reporting system on external
debt (ED) and the reporting system on external claims (EC); - for the category other - the data on arrears are used from the reporting system on external debt
(ED) and the reporting system on external claims (EC), as well as data from the survey on
debt/claims takeovers among residents and nonresidents (POZ);
Data sources for the net external debt Intercompany lending (Direct investment) - a basic data source for the claims and liabilities based on intercompany lending data are used:
for intercompany lending in the form of loans data are used from the reporting system on
external debt (ED) and the reporting system on external claims (EC), that contain information
on relations between creditors and debtors with regard to ownership; for intercompany lending in the form of trade credits data are used from the quarterly reports
on the claims and liabilities on the basis of international commercial operations of residents
(KIPO Form). For the current year, for this category, estimations on the stock of claims/liabilities from commercial operations are derived from the balance of payments flows
and the stock from the previous reporting period;
for other claims and liabilities, data from the annual direct investment survey - inward (DI 22)
and outward (DI 11), which all resident legal entities submit to the NBRM on annual basis, are used.
Data for the period 2004-2005 are disseminated annually, while starting with 2006 data are
disseminated quarterly, in Euro and US Dollars. Starting as of January 01, 2010, data include accrued
interest.
Table no. 33 Reserve assets
The data reflect the stock of reserve assets.
Reserve assets being those external assets that are readily available to and controlled by the monetary authorities, consist of: monetary gold, SDRs, reserve position in the Fund and foreign
exchange assets.

9
The components of reserve assets are defined in accordance with the methodology of the
International Monetary Fund (Balance of Payments Manual, fifth edition).
The stock of reserve assets is calculated using the mid exchange rate of NBRM on the day for
which the data are disseminated.
Monetary gold
Gold: The category monetary gold encompasses gold handled by the NBRM, consisting of
gold in the NBRM's treasury, gold granulates, monetary gold deposited in foreign banks and monetary gold in transport.
Gold deposits: Gold deposits consist of term deposits in gold with foreign banks for a longer
period of time.
Foreign exchange
Deposits with foreign banks: This category comprises of foreign exchange on nostro
accounts with foreign banks, assets with foreign banks used as coverage for opened letters of credit
and guarantees, placements in subordinated deposits in foreign currencies with non-residents, as well as term foreign exchange deposits abroad.
Cash in treasury: Cash in treasury consists of cash foreign tenders of payment within the
treasury, foreign exchange cheques received at the counter, cheques sent abroad for settlement, as well as cheques received for settlement by domestic banks.
Securities: This category includes the foreign exchange assets placed in debt coupon and discount securities issued or guaranteed by foreign governments, central banks, multilateral
development banks and international financial institutions, as well as foreign exchange assets placed in collateralized and agencies' bonds.
Table no. 34 and 35 Denar exchange rate - average in the period and in the end of the month
The average annual exchange rates are calculated as an arithmetical average of the monthly average rates.
The average quarterly exchange rates are calculated as an arithmetical average of the
average monthly exchange rates in the given quarter.
The average monthly rates are calculated as an arithmetical average of the average daily
exchange rates.
The exchange rates at the end of the month represents the daily middle exchange rate at the exchange rates list of the NBRM for the last day of the month.