Quantitative reconstruction of the Late Miocene monsoon climates of southwest China: A case study of...
10
Quantitative reconstruction of the Late Miocene monsoon climates of southwest China: A case study of the Lincang flora from Yunnan Province Frédéric M.B. Jacques a,b , Shuang-Xing Guo b , Tao Su a,c , Yao-Wu Xing a,c , Yong-Jiang Huang a,c , Yu-Sheng (Christopher) Liu d , David K. Ferguson e , Zhe-Kun Zhou a,f, ⁎ a Key Laboratory of Biodiversity and Biogeography, Kunming Institute of Botany, the Chinese Academy of Sciences, Kunming 650204, Yunnan, PR China b Department of Palaeobotany and Palynology, Nanjing Institute of Geology and Palaeontology, the Chinese Academy of Sciences, Nanjing 210008, Jiangsu, PR China c Graduate University of Chinese Academy of Sciences, Beijing 100049, PR China d Department of Biological Sciences, East Tennessee State University, Johnson City, Tennessee 37614-1730, USA e Institute of Palaeontology, University of Vienna, 1090 Vienna, Austria f Xishuangbanna Tropical Botancial Garden, the Chinese Academy of Sciences, Yunnan, PR China abstract article info Article history: Received 27 November 2009 Received in revised form 24 March 2010 Accepted 15 April 2010 Available online 22 April 2010 Keywords: Miocene Monsoon Palaeoclimate Lincang Yunnan Southwestern China The Miocene Lincang leaf assemblage is used in this paper as proxy data to reconstruct the palaeoclimate of southwestern Yunnan (SW China) and the evolution of monsoon intensity. Three quantitative methods were chosen for this reconstruction, i.e. Leaf Margin Analysis (LMA), Climate Leaf Analysis Multivariate Program (CLAMP), and the Coexistence Approach (CA). These methods, however, yield inconsistent results, particularly for the precipitation, as also shown in European and other East Asian Cenozoic floras. The wide range of the reconstructed climatic parameters includes the Mean Annual Temperature (MAT) of 18.5–24.7 °C and the Mean Annual Precipitation (MAP) of 1213–3711 mm. Compared with the modern Lincang climate (MAT, 17.3 °C; MAP, 1178.7 mm), the Miocene climate is slightly warmer, wetter and has a higher temperature seasonality. A detailed comparison on the palaeoclimatic variables with the coeval Late Miocene Xiaolongtan flora from the eastern part of Yunnan allows us to investigate the development and interactions of both South Asian and East Asian monsoons during the Late Miocene in southwest China, now under strong influence of these monsoon systems. Our results suggest that the monsoon climate has already been established in southwest Yunnan during the Late Miocene. Furthermore, our results support that both Southeast Asian and East Asian monsoons co-occurred in Yunnan during the Late Miocene. © 2010 Elsevier B.V. All rights reserved. 1. Introduction Knowledge about the past climates is crucial for our better understanding of the possible impacts of Global Change (Uhl et al., 2006). Quantitative palaeoclimatic data from the Chinese Neogene sites are still far from satisfactory, although the past decade has seen the large improvement on data accumulation from several individual Neogene floras throughout China. All this is particularly true for Yunnan Province, a province affected by both Southeast Asian and East Asian monsoons. At present, the Chinese climates are mainly shaped by the Asian monsoon which produces two seasons with distinctly different weather patterns. In summer, the Asian monsoon is driven by two major convective heat sources: one developed over the Bay of Bengal– Indian Ocean–Arabian Sea, and the other over the South China Sea and the Philippines Sea (Wang and Fan, 1999). These two sources show poor interannual correlations (Wang and Fan, 1999). They are responsible for the so-called Southeast Asian summer monsoon and East Asian summer monsoon, respectively. These two monsoon systems result in a high precipitation over China in summer. On the other hand, in winter, high pressure over the Siberian–Mongolian regions and low pressure over the northwestern Pacific Ocean, Australasia, and the African continent produce strong northern winds known as the winter monsoon (Ding et al., 1995). These winter winds exert a strong impact on the South Chinese climates (Ding et al., 1995), causing low precipitation across the whole of Asia (Liu and Yin, 2002). The Tibetan Plateau plays an important role in the Asian monsoon circulation patterns (Flohn, 1968; Liu and Yin, 2002). The onset of the Asian monsoon has been linked to the uplift of the Tibetan Plateau and the intensity of the monsoon linked to the height of the Tibetan Plateau. Previous studies showed that the East Asian monsoon was certainly established around 24 Ma (Guo et al., 2002; Garzione et al., 2005; Sun and Wang, 2005; Clift et al., 2008). Studying the mineralogical and sedimentological records from the northern part Palaeogeography, Palaeoclimatology, Palaeoecology 304 (2011) 318–327 ⁎ Corresponding author. Key Laboratory of Biodiversity and Biogeography, Kunming Institute of Botany, the Chinese Academy of Sciences, Kunming 650204, Yunnan, PR China. Tel./fax: +86 871 521 9932. E-mail address: [email protected] (Z.-K. Zhou). 0031-0182/$ – see front matter © 2010 Elsevier B.V. All rights reserved. doi:10.1016/j.palaeo.2010.04.014 Contents lists available at ScienceDirect Palaeogeography, Palaeoclimatology, Palaeoecology journal homepage: www.elsevier.com/locate/palaeo
-
Upload
independent -
Category
Documents
-
view
0 -
download
0
Transcript of Quantitative reconstruction of the Late Miocene monsoon climates of southwest China: A case study of...
Palaeogeography, Palaeoclimatology, Palaeoecology 304 (2011) 318–327
Contents lists available at ScienceDirect
Palaeogeography, Palaeoclimatology, Palaeoecology
j ourna l homepage: www.e lsev ie r.com/ locate /pa laeo
Quantitative reconstruction of the Late Miocene monsoon climates of southwestChina: A case study of the Lincang flora from Yunnan Province
Frédéric M.B. Jacques a,b, Shuang-Xing Guo b, Tao Su a,c, Yao-Wu Xing a,c, Yong-Jiang Huang a,c,Yu-Sheng (Christopher) Liu d, David K. Ferguson e, Zhe-Kun Zhou a,f,⁎a Key Laboratory of Biodiversity and Biogeography, Kunming Institute of Botany, the Chinese Academy of Sciences, Kunming 650204, Yunnan, PR Chinab Department of Palaeobotany and Palynology, Nanjing Institute of Geology and Palaeontology, the Chinese Academy of Sciences, Nanjing 210008, Jiangsu, PR Chinac Graduate University of Chinese Academy of Sciences, Beijing 100049, PR Chinad Department of Biological Sciences, East Tennessee State University, Johnson City, Tennessee 37614-1730, USAe Institute of Palaeontology, University of Vienna, 1090 Vienna, Austriaf Xishuangbanna Tropical Botancial Garden, the Chinese Academy of Sciences, Yunnan, PR China
⁎ Corresponding author. Key Laboratory of BiodiversiInstitute of Botany, the Chinese Academy of Sciences,China. Tel./fax: +86 871 521 9932.
E-mail address: [email protected] (Z.-K. Zhou).
0031-0182/$ – see front matter © 2010 Elsevier B.V. Adoi:10.1016/j.palaeo.2010.04.014
a b s t r a c t
a r t i c l e i n f oArticle history:Received 27 November 2009Received in revised form 24 March 2010Accepted 15 April 2010Available online 22 April 2010
Keywords:MioceneMonsoonPalaeoclimateLincangYunnanSouthwestern China
The Miocene Lincang leaf assemblage is used in this paper as proxy data to reconstruct the palaeoclimate ofsouthwestern Yunnan (SW China) and the evolution of monsoon intensity. Three quantitative methods werechosen for this reconstruction, i.e. Leaf Margin Analysis (LMA), Climate Leaf Analysis Multivariate Program(CLAMP), and the Coexistence Approach (CA). These methods, however, yield inconsistent results, particularlyfor the precipitation, as also shown in European and other East Asian Cenozoic floras. The wide range of thereconstructed climatic parameters includes the Mean Annual Temperature (MAT) of 18.5–24.7 °C and the MeanAnnual Precipitation (MAP) of 1213–3711 mm. Comparedwith themodern Lincang climate (MAT, 17.3 °C;MAP,1178.7 mm), theMiocene climate is slightlywarmer,wetter and has a higher temperature seasonality. A detailedcomparison on the palaeoclimatic variableswith the coeval LateMiocene Xiaolongtanflora from the eastern partof Yunnan allows us to investigate the development and interactions of both South Asian and East Asianmonsoons during the Late Miocene in southwest China, now under strong influence of these monsoon systems.Our results suggest that the monsoon climate has already been established in southwest Yunnan during the LateMiocene. Furthermore, our results support that both Southeast Asian and East Asian monsoons co-occurred inYunnan during the Late Miocene.
ty and Biogeography, KunmingKunming 650204, Yunnan, PR
ll rights reserved.
© 2010 Elsevier B.V. All rights reserved.
1. Introduction
Knowledge about the past climates is crucial for our betterunderstanding of the possible impacts of Global Change (Uhl et al.,2006). Quantitative palaeoclimatic data from the Chinese Neogenesites are still far from satisfactory, although the past decade has seenthe large improvement on data accumulation from several individualNeogene floras throughout China. All this is particularly true forYunnan Province, a province affected by both Southeast Asian andEast Asian monsoons.
At present, the Chinese climates are mainly shaped by the Asianmonsoon which produces two seasons with distinctly differentweather patterns. In summer, the Asian monsoon is driven by twomajor convective heat sources: one developed over the Bay of Bengal–Indian Ocean–Arabian Sea, and the other over the South China Sea and
the Philippines Sea (Wang and Fan, 1999). These two sources showpoor interannual correlations (Wang and Fan, 1999). They areresponsible for the so-called Southeast Asian summer monsoon andEast Asian summer monsoon, respectively. These two monsoonsystems result in a high precipitation over China in summer. On theother hand, in winter, high pressure over the Siberian–Mongolianregions and low pressure over the northwestern Pacific Ocean,Australasia, and the African continent produce strong northernwinds known as the winter monsoon (Ding et al., 1995). Thesewinter winds exert a strong impact on the South Chinese climates(Ding et al., 1995), causing low precipitation across the whole of Asia(Liu and Yin, 2002).
The Tibetan Plateau plays an important role in the Asian monsooncirculation patterns (Flohn, 1968; Liu and Yin, 2002). The onset of theAsianmonsoon has been linked to the uplift of the Tibetan Plateau andthe intensity of the monsoon linked to the height of the TibetanPlateau. Previous studies showed that the East Asian monsoon wascertainly established around 24 Ma (Guo et al., 2002; Garzione et al.,2005; Sun and Wang, 2005; Clift et al., 2008). Studying themineralogical and sedimentological records from the northern part
319F.M.B. Jacques et al. / Palaeogeography, Palaeoclimatology, Palaeoecology 304 (2011) 318–327
of South China Sea, Wan et al. (2007) found that the intensity of theEast Asian monsoon underwent three profound shifts at ∼15 Ma,∼8 Ma and 3 Ma, respectively. The continued uplift of the TibetanPlateau may have played a significant role in strengthening the Asianmonsoon at these times (An et al., 2001). The age of establishment ofthe South Asian monsoon is however controversial (Clift et al., 2008),but it is clear that both East and South Asian monsoon systems hadbeen coupled since at least 17 Ma (Clift et al., 2008).
Parts of western, central and eastern China are under the influenceof the East Asianmonsoon, while western China is under the influenceof the South Asian monsoon. Yunnan Province, located in southwest-ern China, is impacted by bothmonsoon systems. The Ailao Mountain,in central Yunnan, serves as the boundary between west and east ofYunnan (Yang, 1990). In general, eastern Yunnan is under theinfluence of East Asian monsoon, while the western part of theprovince is strongly affected by the South Asian monsoon (Li and Li,1992). Fossil sites from Yunnan enable us to compare the evolution ofboth East Asian and South Asian monsoons using palaeoclimatic data.The Xiaolongtan Late Miocene fossil site, at present mainly under theinfluence of the East Asian monsoon (Li and Li, 1992), has alreadyprovided good palaeoclimatic data (Xia et al., 2009). The Lincang LateMiocene fossil site, at present mainly under the influence of the SouthAsian monsoon (Li and Li, 1992), has a rich palaeoflora (Guo,unpublished data, in preparation). These two coeval fossil assem-blages give a good opportunity to compare the two monsoon systemsin the Late Miocene. The palaeoclimate of the latter flora has not beenreconstructed yet; this reconstruction will be the first goal of thepresent study.
Up to now, three main quantitative methods are available forreconstructing the palaeoclimate using fossil leaves: Leaf MarginAnalysis (LMA (Bailey and Sinnott, 1915, 1916; Wolfe, 1979; Wingand Greenwood, 1993; Wilf, 1997; Greenwood, 2005, 2007)), ClimateLeaf Analysis Multivariate Program (CLAMP (Wolfe, 1993; Wolfe andSpicer, 1999)), and the Coexistence Approach (CA [Mosbrugger and
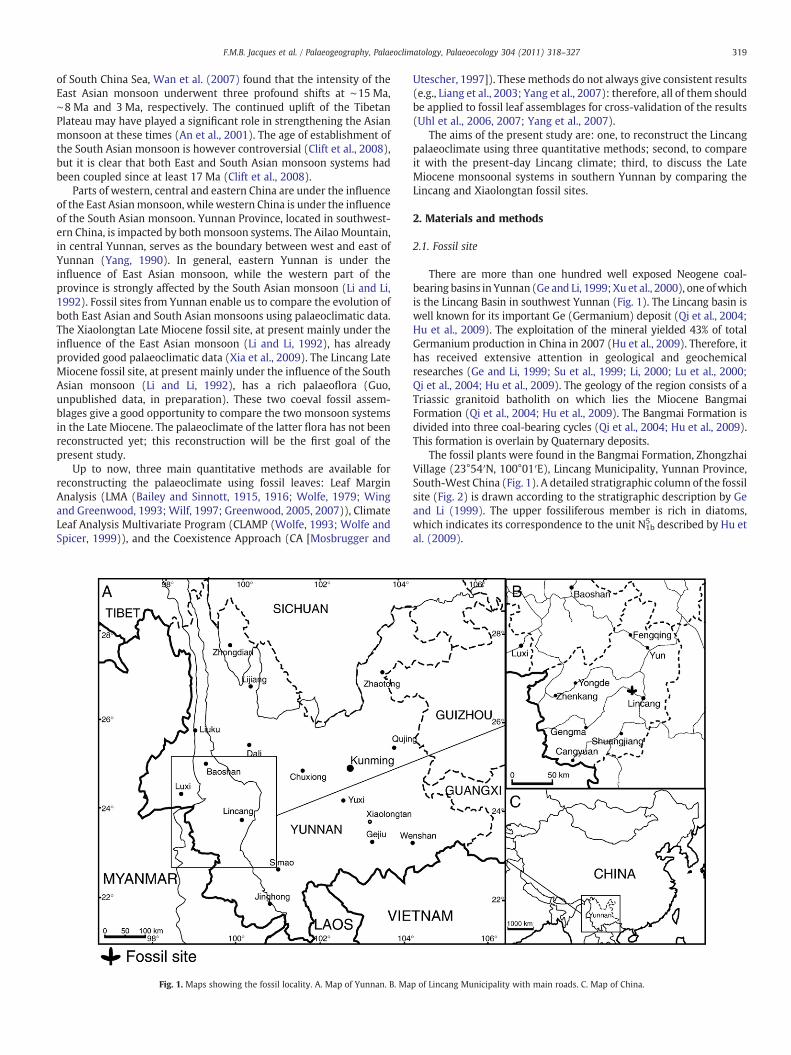
Fig. 1. Maps showing the fossil locality. A. Map of Yunnan. B. Ma
Utescher, 1997]). Thesemethods do not always give consistent results(e.g., Liang et al., 2003; Yang et al., 2007): therefore, all of them shouldbe applied to fossil leaf assemblages for cross-validation of the results(Uhl et al., 2006, 2007; Yang et al., 2007).
The aims of the present study are: one, to reconstruct the Lincangpalaeoclimate using three quantitative methods; second, to compareit with the present-day Lincang climate; third, to discuss the LateMiocene monsoonal systems in southern Yunnan by comparing theLincang and Xiaolongtan fossil sites.
2. Materials and methods
2.1. Fossil site
There are more than one hundred well exposed Neogene coal-bearing basins in Yunnan (Ge and Li, 1999; Xu et al., 2000), one ofwhichis the Lincang Basin in southwest Yunnan (Fig. 1). The Lincang basin iswell known for its important Ge (Germanium) deposit (Qi et al., 2004;Hu et al., 2009). The exploitation of the mineral yielded 43% of totalGermanium production in China in 2007 (Hu et al., 2009). Therefore, ithas received extensive attention in geological and geochemicalresearches (Ge and Li, 1999; Su et al., 1999; Li, 2000; Lu et al., 2000;Qi et al., 2004; Hu et al., 2009). The geology of the region consists of aTriassic granitoid batholith on which lies the Miocene BangmaiFormation (Qi et al., 2004; Hu et al., 2009). The Bangmai Formation isdivided into three coal-bearing cycles (Qi et al., 2004; Hu et al., 2009).This formation is overlain by Quaternary deposits.
The fossil plants were found in the Bangmai Formation, ZhongzhaiVillage (23°54′N, 100°01′E), Lincang Municipality, Yunnan Province,South-West China (Fig. 1). A detailed stratigraphic column of the fossilsite (Fig. 2) is drawn according to the stratigraphic description by Geand Li (1999). The upper fossiliferous member is rich in diatoms,which indicates its correspondence to the unit N1b
5 described by Hu etal. (2009).
p of Lincang Municipality with main roads. C. Map of China.
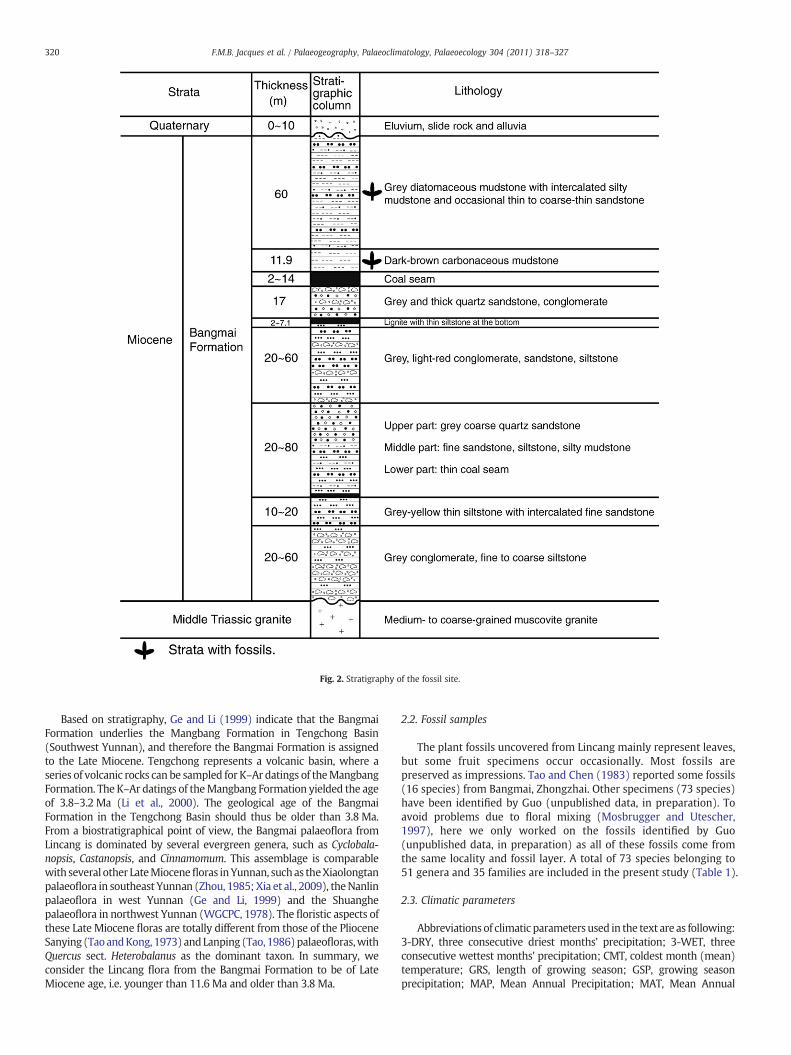
Fig. 2. Stratigraphy of the fossil site.
320 F.M.B. Jacques et al. / Palaeogeography, Palaeoclimatology, Palaeoecology 304 (2011) 318–327
Based on stratigraphy, Ge and Li (1999) indicate that the BangmaiFormation underlies the Mangbang Formation in Tengchong Basin(Southwest Yunnan), and therefore the Bangmai Formation is assignedto the Late Miocene. Tengchong represents a volcanic basin, where aseries of volcanic rocks can be sampled for K–Ar datings of theMangbangFormation. The K–Ar datings of theMangbang Formation yielded the ageof 3.8–3.2 Ma (Li et al., 2000). The geological age of the BangmaiFormation in the Tengchong Basin should thus be older than 3.8 Ma.From a biostratigraphical point of view, the Bangmai palaeoflora fromLincang is dominated by several evergreen genera, such as Cyclobala-nopsis, Castanopsis, and Cinnamomum. This assemblage is comparablewith several other LateMiocenefloras inYunnan, suchas theXiaolongtanpalaeoflora in southeast Yunnan (Zhou, 1985; Xia et al., 2009), theNanlinpalaeoflora in west Yunnan (Ge and Li, 1999) and the Shuanghepalaeoflora in northwest Yunnan (WGCPC, 1978). The floristic aspects ofthese Late Miocene floras are totally different from those of the PlioceneSanying (TaoandKong, 1973) andLanping (Tao, 1986)palaeofloras,withQuercus sect. Heterobalanus as the dominant taxon. In summary, weconsider the Lincang flora from the Bangmai Formation to be of LateMiocene age, i.e. younger than 11.6 Ma and older than 3.8 Ma.
2.2. Fossil samples
The plant fossils uncovered from Lincang mainly represent leaves,but some fruit specimens occur occasionally. Most fossils arepreserved as impressions. Tao and Chen (1983) reported some fossils(16 species) from Bangmai, Zhongzhai. Other specimens (73 species)have been identified by Guo (unpublished data, in preparation). Toavoid problems due to floral mixing (Mosbrugger and Utescher,1997), here we only worked on the fossils identified by Guo(unpublished data, in preparation) as all of these fossils come fromthe same locality and fossil layer. A total of 73 species belonging to51 genera and 35 families are included in the present study (Table 1).
2.3. Climatic parameters
Abbreviations of climatic parameters used in the text are as following:3-DRY, three consecutive driest months' precipitation; 3-WET, threeconsecutive wettest months' precipitation; CMT, coldest month (mean)temperature; GRS, length of growing season; GSP, growing seasonprecipitation; MAP, Mean Annual Precipitation; MAT, Mean Annual
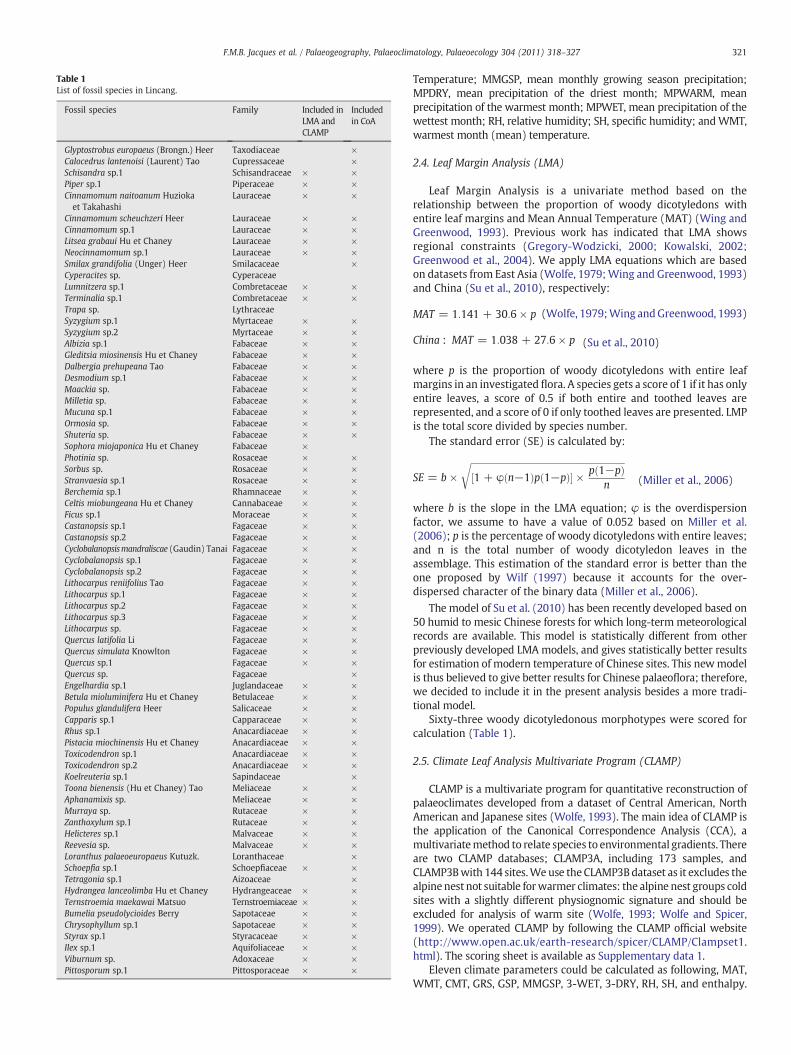
Table 1List of fossil species in Lincang.
Fossil species Family Included inLMA andCLAMP
Includedin CoA
Glyptostrobus europaeus (Brongn.) Heer Taxodiaceae ×Calocedrus lantenoisi (Laurent) Tao Cupressaceae ×Schisandra sp.1 Schisandraceae × ×Piper sp.1 Piperaceae × ×Cinnamomum naitoanum Huziokaet Takahashi
Lauraceae × ×
Cinnamomum scheuchzeri Heer Lauraceae × ×Cinnamomum sp.1 Lauraceae × ×Litsea grabaui Hu et Chaney Lauraceae × ×Neocinnamomum sp.1 Lauraceae × ×Smilax grandifolia (Unger) Heer Smilacaceae ×Cyperacites sp. CyperaceaeLumnitzera sp.1 Combretaceae × ×Terminalia sp.1 Combretaceae × ×Trapa sp. LythraceaeSyzygium sp.1 Myrtaceae × ×Syzygium sp.2 Myrtaceae × ×Albizia sp.1 Fabaceae × ×Gleditsia miosinensis Hu et Chaney Fabaceae × ×Dalbergia prehupeana Tao Fabaceae × ×Desmodium sp.1 Fabaceae × ×Maackia sp. Fabaceae × ×Milletia sp. Fabaceae × ×Mucuna sp.1 Fabaceae × ×Ormosia sp. Fabaceae × ×Shuteria sp. Fabaceae × ×Sophora miojaponica Hu et Chaney Fabaceae ×Photinia sp. Rosaceae × ×Sorbus sp. Rosaceae × ×Stranvaesia sp.1 Rosaceae × ×Berchemia sp.1 Rhamnaceae × ×Celtis miobungeana Hu et Chaney Cannabaceae × ×Ficus sp.1 Moraceae × ×Castanopsis sp.1 Fagaceae × ×Castanopsis sp.2 Fagaceae × ×Cyclobalanopsismandraliscae (Gaudin) Tanai Fagaceae × ×Cyclobalanopsis sp.1 Fagaceae × ×Cyclobalanopsis sp.2 Fagaceae × ×Lithocarpus reniifolius Tao Fagaceae × ×Lithocarpus sp.1 Fagaceae × ×Lithocarpus sp.2 Fagaceae × ×Lithocarpus sp.3 Fagaceae × ×Lithocarpus sp. Fagaceae × ×Quercus latifolia Li Fagaceae × ×Quercus simulata Knowlton Fagaceae × ×Quercus sp.1 Fagaceae × ×Quercus sp. Fagaceae ×Engelhardia sp.1 Juglandaceae × ×Betula mioluminifera Hu et Chaney Betulaceae × ×Populus glandulifera Heer Salicaceae × ×Capparis sp.1 Capparaceae × ×Rhus sp.1 Anacardiaceae × ×Pistacia miochinensis Hu et Chaney Anacardiaceae × ×Toxicodendron sp.1 Anacardiaceae × ×Toxicodendron sp.2 Anacardiaceae × ×Koelreuteria sp.1 Sapindaceae ×Toona bienensis (Hu et Chaney) Tao Meliaceae × ×Aphanamixis sp. Meliaceae × ×Murraya sp. Rutaceae × ×Zanthoxylum sp.1 Rutaceae × ×Helicteres sp.1 Malvaceae × ×Reevesia sp. Malvaceae × ×Loranthus palaeoeuropaeus Kutuzk. Loranthaceae ×Schoepfia sp.1 Schoepfiaceae × ×Tetragonia sp.1 Aizoaceae ×Hydrangea lanceolimba Hu et Chaney Hydrangeaceae × ×Ternstroemia maekawai Matsuo Ternstroemiaceae × ×Bumelia pseudolycioides Berry Sapotaceae × ×Chrysophyllum sp.1 Sapotaceae × ×Styrax sp.1 Styracaceae × ×Ilex sp.1 Aquifoliaceae × ×Viburnum sp. Adoxaceae × ×Pittosporum sp.1 Pittosporaceae × ×
321F.M.B. Jacques et al. / Palaeogeography, Palaeoclimatology, Palaeoecology 304 (2011) 318–327
Temperature; MMGSP, mean monthly growing season precipitation;MPDRY, mean precipitation of the driest month; MPWARM, meanprecipitation of the warmest month; MPWET, mean precipitation of thewettest month; RH, relative humidity; SH, specific humidity; andWMT,warmest month (mean) temperature.
2.4. Leaf Margin Analysis (LMA)
Leaf Margin Analysis is a univariate method based on therelationship between the proportion of woody dicotyledons withentire leaf margins and Mean Annual Temperature (MAT) (Wing andGreenwood, 1993). Previous work has indicated that LMA showsregional constraints (Gregory-Wodzicki, 2000; Kowalski, 2002;Greenwood et al., 2004). We apply LMA equations which are basedon datasets from East Asia (Wolfe, 1979;Wing and Greenwood, 1993)and China (Su et al., 2010), respectively:
MAT = 1:141 + 30:6 × p (Wolfe, 1979;Wing andGreenwood, 1993)
China : MAT = 1:038 + 27:6 × p (Su et al., 2010)
where p is the proportion of woody dicotyledons with entire leafmargins in an investigated flora. A species gets a score of 1 if it has onlyentire leaves, a score of 0.5 if both entire and toothed leaves arerepresented, and a score of 0 if only toothed leaves are presented. LMPis the total score divided by species number.
The standard error (SE) is calculated by:
SE = b ×
ffiffiffiffiffiffiffiffiffiffiffiffiffiffiffiffiffiffiffiffiffiffiffiffiffiffiffiffiffiffiffiffiffiffiffiffiffiffiffiffiffiffiffiffiffiffiffiffiffiffiffiffiffiffiffiffiffiffiffiffiffiffiffiffiffiffiffiffiffiffi1 + φ n−1ð Þp 1−pð Þ½ � × p 1−pð Þ
n
r(Miller et al., 2006)
where b is the slope in the LMA equation; φ is the overdispersionfactor, we assume to have a value of 0.052 based on Miller et al.(2006); p is the percentage of woody dicotyledons with entire leaves;and n is the total number of woody dicotyledon leaves in theassemblage. This estimation of the standard error is better than theone proposed by Wilf (1997) because it accounts for the over-dispersed character of the binary data (Miller et al., 2006).
The model of Su et al. (2010) has been recently developed based on50 humid to mesic Chinese forests for which long-term meteorological
records are available. This model is statistically different from otherpreviously developed LMA models, and gives statistically better resultsfor estimation of modern temperature of Chinese sites. This newmodelis thus believed to give better results for Chinese palaeoflora; therefore,we decided to include it in the present analysis besides a more tradi-tional model.Sixty-three woody dicotyledonous morphotypes were scored forcalculation (Table 1).
2.5. Climate Leaf Analysis Multivariate Program (CLAMP)
CLAMP is a multivariate program for quantitative reconstruction ofpalaeoclimates developed from a dataset of Central American, NorthAmerican and Japanese sites (Wolfe, 1993). The main idea of CLAMP isthe application of the Canonical Correspondence Analysis (CCA), amultivariatemethod to relate species to environmental gradients. Thereare two CLAMP databases; CLAMP3A, including 173 samples, andCLAMP3Bwith 144 sites.We use the CLAMP3Bdataset as it excludes thealpinenest not suitable forwarmer climates: the alpine nest groups coldsites with a slightly different physiognomic signature and should beexcluded for analysis of warm site (Wolfe, 1993; Wolfe and Spicer,1999). We operated CLAMP by following the CLAMP official website(http://www.open.ac.uk/earth-research/spicer/CLAMP/Clampset1.html). The scoring sheet is available as Supplementary data 1.
Eleven climate parameters could be calculated as following, MAT,WMT, CMT, GRS, GSP, MMGSP, 3-WET, 3-DRY, RH, SH, and enthalpy.
322 F.M.B. Jacques et al. / Palaeogeography, Palaeoclimatology, Palaeoecology 304 (2011) 318–327
For meteorological calibration of the dataset, two kinds of data areavailable: the gridded and ungridded meteorological data (Spicer etal., 2009). The ungridded meteorological data were used. As in LMA,63 woody dicotyledonous morphotypes were scored (Table 1).
2.6. Coexistence Approach (CA)
The aim of the Coexistence Approach is to find for a given fossilflora and a given climate parameter the climatic interval in which allnearest living relatives known for a fossil can coexist (Mosbruggerand Utescher, 1997). As the climatic requirements of a fossil speciesare not known, the requirements of the nearest living relative (NLR)are used. To limit the uncertainty in the determination of the NLR, wedecided to work at the generic level (Yang et al., 2007).
We excluded cosmopolitan genera from the analysis, as theyprovide no specific information regarding the climatic requirements(Xia et al., 2009). Other excluded genera include aquatic plants, asthey are less dependent on climatic conditions (Xia et al., 2009). Sixty-nine species were retained for the analysis (Table 1).
The climatic tolerances of each NRL genus were taken from thePalaeoflora database (Mosbrugger and Utescher, 1997) and comple-mented from the Xiaolongtan palaeoclimatic reconstruction (Xia etal., 2009). When the climatic data from the two sources wereinconsistent, the broader intervals were applied. For genera notincluded in both datasets, the standard method of Mosbrugger andUtescher (1997) was followed. We first determined the distributionrange of the genus using various monographs andmanuals of regionalfloras (e.g. Flora of China, Flora Yunnanica, Flora Neotropica, Flora ofNorth America). Then at least ten (or as many as possible) climaticstations were chosen in order to reflect the climatic range of thegenus. The data of the climatic stations were retrieved from Mueller(1996). Their combination represents the climatic tolerance of thegenus. Seven climatic parameters were selected: MAT, WMT, CMT,MAP, MPWET, MPDRY, and MPWARM. The details of the climatic datafor each genus are given in Supplementary data 2.
The coexistence interval for each climatic parameter was calculatedusing the software ClimStat version 1.02 (Heinemann, 1998–1999).
2.7. Monsoon intensity
Wang and Fan (1999) defined a monsoon index; however, as it isbased on climatic data unavailable from the Lincang and Xiaolongtanfossil sites (the difference of 850-hPa westerlies between a southernregion and a northern region), we cannot use it here. Liu and Yin(2002) defined another monsoon index based on mean winter andsummer temperatures and precipitations. As the quantitative meth-ods used only gave the CMT and WMT but not a seasonal mean, wecould not calculate this index either. Therefore, we used the ratio ofMPWET on MAP and MPDRY on MAP as indicators of monsoonstrength. These ratios have been calculated based on CA results only,for Lincang and Xiaolongtan Late Miocene and modern climates.
3. Results
3.1. LMA
When theEast Asian regressionmodelwasused,MATwascalculatedas 24.4±2.07 °C. When the Chinese model was used, MAT wascalculated as 22.0±1.87 °C. Both values indicate a warm climate.
3.2. CLAMP
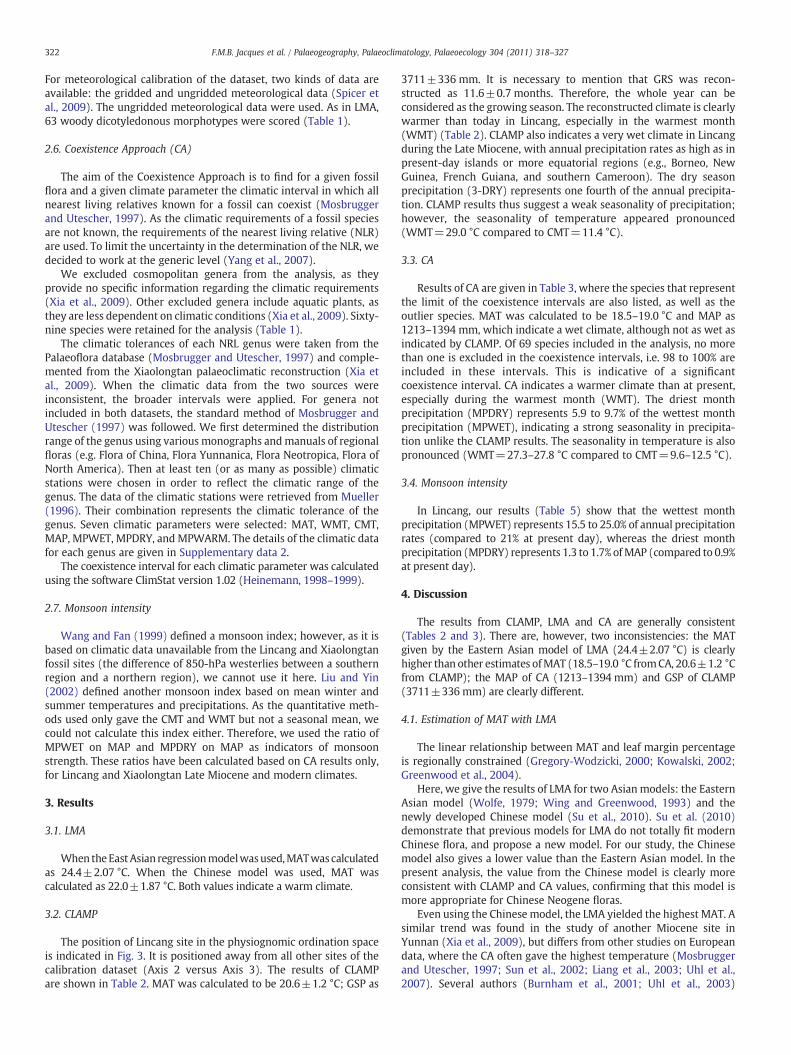
The position of Lincang site in the physiognomic ordination spaceis indicated in Fig. 3. It is positioned away from all other sites of thecalibration dataset (Axis 2 versus Axis 3). The results of CLAMPare shown in Table 2. MAT was calculated to be 20.6±1.2 °C; GSP as
3711±336 mm. It is necessary to mention that GRS was recon-structed as 11.6±0.7 months. Therefore, the whole year can beconsidered as the growing season. The reconstructed climate is clearlywarmer than today in Lincang, especially in the warmest month(WMT) (Table 2). CLAMP also indicates a very wet climate in Lincangduring the Late Miocene, with annual precipitation rates as high as inpresent-day islands or more equatorial regions (e.g., Borneo, NewGuinea, French Guiana, and southern Cameroon). The dry seasonprecipitation (3-DRY) represents one fourth of the annual precipita-tion. CLAMP results thus suggest a weak seasonality of precipitation;however, the seasonality of temperature appeared pronounced(WMT=29.0 °C compared to CMT=11.4 °C).
3.3. CA
Results of CA are given in Table 3, where the species that representthe limit of the coexistence intervals are also listed, as well as theoutlier species. MAT was calculated to be 18.5–19.0 °C and MAP as1213–1394 mm, which indicate a wet climate, although not as wet asindicated by CLAMP. Of 69 species included in the analysis, no morethan one is excluded in the coexistence intervals, i.e. 98 to 100% areincluded in these intervals. This is indicative of a significantcoexistence interval. CA indicates a warmer climate than at present,especially during the warmest month (WMT). The driest monthprecipitation (MPDRY) represents 5.9 to 9.7% of the wettest monthprecipitation (MPWET), indicating a strong seasonality in precipita-tion unlike the CLAMP results. The seasonality in temperature is alsopronounced (WMT=27.3–27.8 °C compared to CMT=9.6–12.5 °C).
3.4. Monsoon intensity
In Lincang, our results (Table 5) show that the wettest monthprecipitation (MPWET) represents 15.5 to 25.0% of annual precipitationrates (compared to 21% at present day), whereas the driest monthprecipitation (MPDRY) represents 1.3 to 1.7% ofMAP (compared to 0.9%at present day).
4. Discussion
The results from CLAMP, LMA and CA are generally consistent(Tables 2 and 3). There are, however, two inconsistencies: the MATgiven by the Eastern Asian model of LMA (24.4±2.07 °C) is clearlyhigher than other estimates ofMAT (18.5–19.0 °C fromCA, 20.6±1.2 °Cfrom CLAMP); the MAP of CA (1213–1394 mm) and GSP of CLAMP(3711±336 mm) are clearly different.
4.1. Estimation of MAT with LMA
The linear relationship between MAT and leaf margin percentageis regionally constrained (Gregory-Wodzicki, 2000; Kowalski, 2002;Greenwood et al., 2004).
Here, we give the results of LMA for two Asian models: the EasternAsian model (Wolfe, 1979; Wing and Greenwood, 1993) and thenewly developed Chinese model (Su et al., 2010). Su et al. (2010)demonstrate that previous models for LMA do not totally fit modernChinese flora, and propose a new model. For our study, the Chinesemodel also gives a lower value than the Eastern Asian model. In thepresent analysis, the value from the Chinese model is clearly moreconsistent with CLAMP and CA values, confirming that this model ismore appropriate for Chinese Neogene floras.
Even using the Chinese model, the LMA yielded the highest MAT. Asimilar trend was found in the study of another Miocene site inYunnan (Xia et al., 2009), but differs from other studies on Europeandata, where the CA often gave the highest temperature (Mosbruggerand Utescher, 1997; Sun et al., 2002; Liang et al., 2003; Uhl et al.,2007). Several authors (Burnham et al., 2001; Uhl et al., 2003)
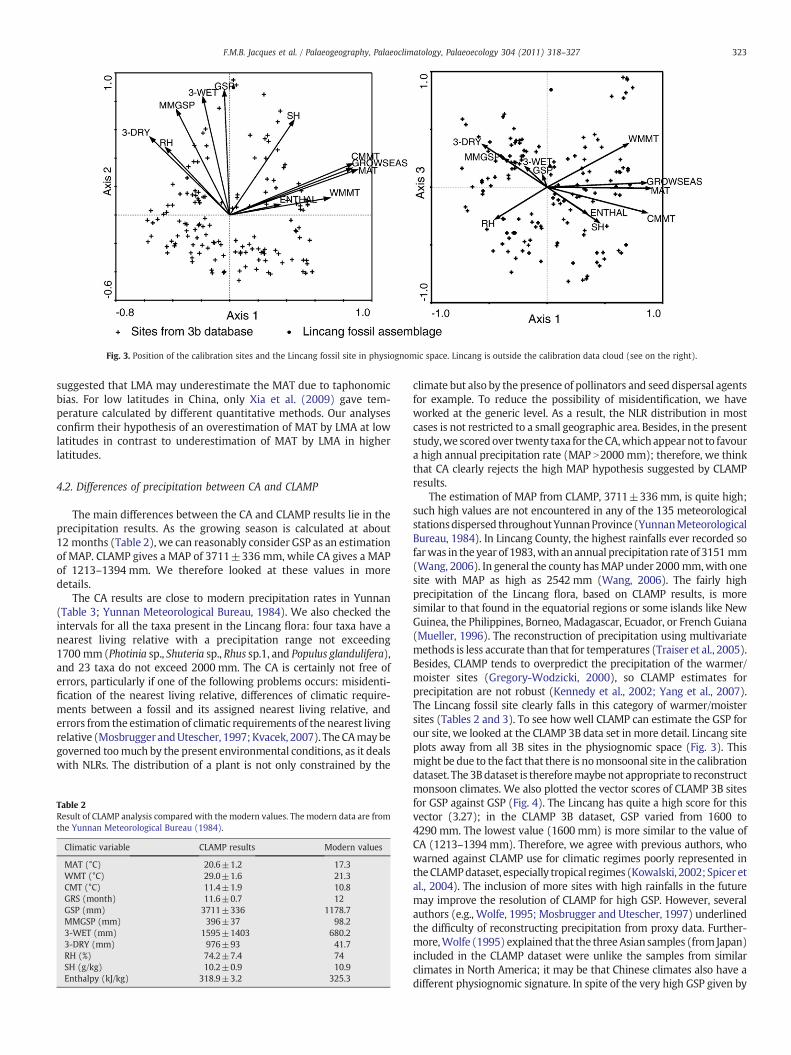
Fig. 3. Position of the calibration sites and the Lincang fossil site in physiognomic space. Lincang is outside the calibration data cloud (see on the right).
323F.M.B. Jacques et al. / Palaeogeography, Palaeoclimatology, Palaeoecology 304 (2011) 318–327
suggested that LMA may underestimate the MAT due to taphonomicbias. For low latitudes in China, only Xia et al. (2009) gave tem-perature calculated by different quantitative methods. Our analysesconfirm their hypothesis of an overestimation of MAT by LMA at lowlatitudes in contrast to underestimation of MAT by LMA in higherlatitudes.
4.2. Differences of precipitation between CA and CLAMP
The main differences between the CA and CLAMP results lie in theprecipitation results. As the growing season is calculated at about12 months (Table 2), we can reasonably consider GSP as an estimationof MAP. CLAMP gives a MAP of 3711±336 mm, while CA gives a MAPof 1213–1394 mm. We therefore looked at these values in moredetails.
The CA results are close to modern precipitation rates in Yunnan(Table 3; Yunnan Meteorological Bureau, 1984). We also checked theintervals for all the taxa present in the Lincang flora: four taxa have anearest living relative with a precipitation range not exceeding1700 mm(Photinia sp., Shuteria sp., Rhus sp.1, and Populus glandulifera),and 23 taxa do not exceed 2000 mm. The CA is certainly not free oferrors, particularly if one of the following problems occurs: misidenti-fication of the nearest living relative, differences of climatic require-ments between a fossil and its assigned nearest living relative, anderrors from the estimation of climatic requirements of the nearest livingrelative (Mosbrugger andUtescher, 1997;Kvacek, 2007). The CAmaybegoverned toomuch by the present environmental conditions, as it dealswith NLRs. The distribution of a plant is not only constrained by the
Table 2Result of CLAMP analysis compared with the modern values. The modern data are fromthe Yunnan Meteorological Bureau (1984).
Climatic variable CLAMP results Modern values
MAT (°C) 20.6±1.2 17.3WMT (°C) 29.0±1.6 21.3CMT (°C) 11.4±1.9 10.8GRS (month) 11.6±0.7 12GSP (mm) 3711±336 1178.7MMGSP (mm) 396±37 98.23-WET (mm) 1595±1403 680.23-DRY (mm) 976±93 41.7RH (%) 74.2±7.4 74SH (g/kg) 10.2±0.9 10.9Enthalpy (kJ/kg) 318.9±3.2 325.3
climate but also by the presence of pollinators and seed dispersal agentsfor example. To reduce the possibility of misidentification, we haveworked at the generic level. As a result, the NLR distribution in mostcases is not restricted to a small geographic area. Besides, in the presentstudy,we scoredover twenty taxa for theCA,whichappearnot to favoura high annual precipitation rate (MAP N2000 mm); therefore, we thinkthat CA clearly rejects the high MAP hypothesis suggested by CLAMPresults.
The estimation of MAP from CLAMP, 3711±336 mm, is quite high;such high values are not encountered in any of the 135 meteorologicalstationsdispersed throughoutYunnanProvince (YunnanMeteorologicalBureau, 1984). In Lincang County, the highest rainfalls ever recorded sofarwas in the year of 1983,with anannual precipitation rate of 3151 mm(Wang, 2006). In general the county hasMAP under 2000mm,with onesite with MAP as high as 2542 mm (Wang, 2006). The fairly highprecipitation of the Lincang flora, based on CLAMP results, is moresimilar to that found in the equatorial regions or some islands like NewGuinea, the Philippines, Borneo, Madagascar, Ecuador, or French Guiana(Mueller, 1996). The reconstruction of precipitation using multivariatemethods is less accurate than that for temperatures (Traiser et al., 2005).Besides, CLAMP tends to overpredict the precipitation of the warmer/moister sites (Gregory-Wodzicki, 2000), so CLAMP estimates forprecipitation are not robust (Kennedy et al., 2002; Yang et al., 2007).The Lincang fossil site clearly falls in this category of warmer/moistersites (Tables 2 and 3). To see how well CLAMP can estimate the GSP forour site, we looked at the CLAMP 3B data set in more detail. Lincang siteplots away from all 3B sites in the physiognomic space (Fig. 3). Thismight be due to the fact that there is nomonsoonal site in the calibrationdataset. The 3Bdataset is thereforemaybenot appropriate to reconstructmonsoon climates. We also plotted the vector scores of CLAMP 3B sitesfor GSP against GSP (Fig. 4). The Lincang has quite a high score for thisvector (3.27); in the CLAMP 3B dataset, GSP varied from 1600 to4290 mm. The lowest value (1600 mm) is more similar to the value ofCA (1213–1394 mm). Therefore, we agree with previous authors, whowarned against CLAMP use for climatic regimes poorly represented intheCLAMPdataset, especially tropical regimes (Kowalski, 2002;Spicer etal., 2004). The inclusion of more sites with high rainfalls in the futuremay improve the resolution of CLAMP for high GSP. However, severalauthors (e.g., Wolfe, 1995; Mosbrugger and Utescher, 1997) underlinedthe difficulty of reconstructing precipitation from proxy data. Further-more,Wolfe (1995) explained that the threeAsian samples (from Japan)included in the CLAMP dataset were unlike the samples from similarclimates in North America; it may be that Chinese climates also have adifferent physiognomic signature. In spite of the very high GSP given by
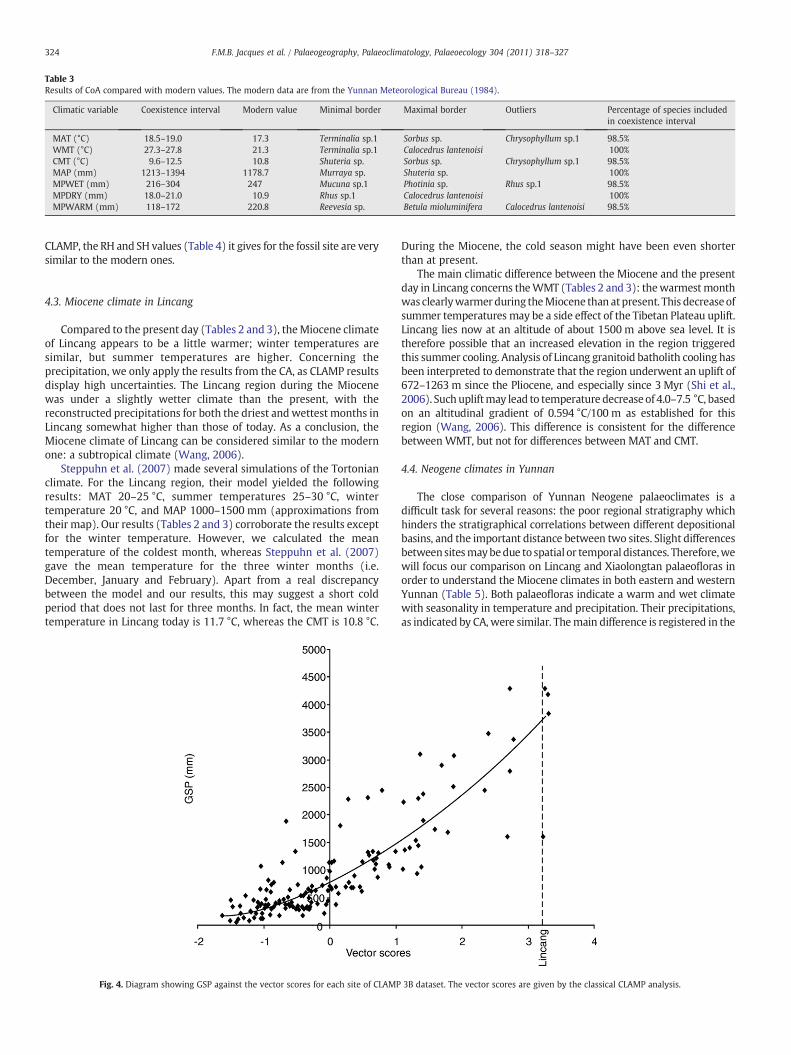
Table 3Results of CoA compared with modern values. The modern data are from the Yunnan Meteorological Bureau (1984).
Climatic variable Coexistence interval Modern value Minimal border Maximal border Outliers Percentage of species includedin coexistence interval
MAT (°C) 18.5–19.0 17.3 Terminalia sp.1 Sorbus sp. Chrysophyllum sp.1 98.5%WMT (°C) 27.3–27.8 21.3 Terminalia sp.1 Calocedrus lantenoisi 100%CMT (°C) 9.6–12.5 10.8 Shuteria sp. Sorbus sp. Chrysophyllum sp.1 98.5%MAP (mm) 1213–1394 1178.7 Murraya sp. Shuteria sp. 100%MPWET (mm) 216–304 247 Mucuna sp.1 Photinia sp. Rhus sp.1 98.5%MPDRY (mm) 18.0–21.0 10.9 Rhus sp.1 Calocedrus lantenoisi 100%MPWARM (mm) 118–172 220.8 Reevesia sp. Betula mioluminifera Calocedrus lantenoisi 98.5%
324 F.M.B. Jacques et al. / Palaeogeography, Palaeoclimatology, Palaeoecology 304 (2011) 318–327
CLAMP, the RH and SH values (Table 4) it gives for the fossil site are verysimilar to the modern ones.
4.3. Miocene climate in Lincang
Compared to the present day (Tables 2 and 3), theMiocene climateof Lincang appears to be a little warmer; winter temperatures aresimilar, but summer temperatures are higher. Concerning theprecipitation, we only apply the results from the CA, as CLAMP resultsdisplay high uncertainties. The Lincang region during the Miocenewas under a slightly wetter climate than the present, with thereconstructed precipitations for both the driest and wettest months inLincang somewhat higher than those of today. As a conclusion, theMiocene climate of Lincang can be considered similar to the modernone: a subtropical climate (Wang, 2006).
Steppuhn et al. (2007) made several simulations of the Tortonianclimate. For the Lincang region, their model yielded the followingresults: MAT 20–25 °C, summer temperatures 25–30 °C, wintertemperature 20 °C, and MAP 1000–1500 mm (approximations fromtheir map). Our results (Tables 2 and 3) corroborate the results exceptfor the winter temperature. However, we calculated the meantemperature of the coldest month, whereas Steppuhn et al. (2007)gave the mean temperature for the three winter months (i.e.December, January and February). Apart from a real discrepancybetween the model and our results, this may suggest a short coldperiod that does not last for three months. In fact, the mean wintertemperature in Lincang today is 11.7 °C, whereas the CMT is 10.8 °C.
Fig. 4. Diagram showing GSP against the vector scores for each site of CLAMP
During the Miocene, the cold season might have been even shorterthan at present.
The main climatic difference between the Miocene and the presentday in Lincang concerns theWMT (Tables 2 and 3): thewarmest monthwas clearlywarmerduring theMiocene than at present. This decreaseofsummer temperatures may be a side effect of the Tibetan Plateau uplift.Lincang lies now at an altitude of about 1500 m above sea level. It istherefore possible that an increased elevation in the region triggeredthis summer cooling. Analysis of Lincang granitoid batholith cooling hasbeen interpreted to demonstrate that the region underwent an uplift of672–1263 m since the Pliocene, and especially since 3 Myr (Shi et al.,2006). Such upliftmay lead to temperature decrease of 4.0–7.5 °C, basedon an altitudinal gradient of 0.594 °C/100 m as established for thisregion (Wang, 2006). This difference is consistent for the differencebetween WMT, but not for differences between MAT and CMT.
4.4. Neogene climates in Yunnan
The close comparison of Yunnan Neogene palaeoclimates is adifficult task for several reasons: the poor regional stratigraphy whichhinders the stratigraphical correlations between different depositionalbasins, and the important distance between two sites. Slight differencesbetweensitesmaybedue to spatial or temporal distances. Therefore,wewill focus our comparison on Lincang and Xiaolongtan palaeofloras inorder to understand the Miocene climates in both eastern and westernYunnan (Table 5). Both palaeofloras indicate a warm and wet climatewith seasonality in temperature and precipitation. Their precipitations,as indicated by CA, were similar. Themain difference is registered in the
3B dataset. The vector scores are given by the classical CLAMP analysis.
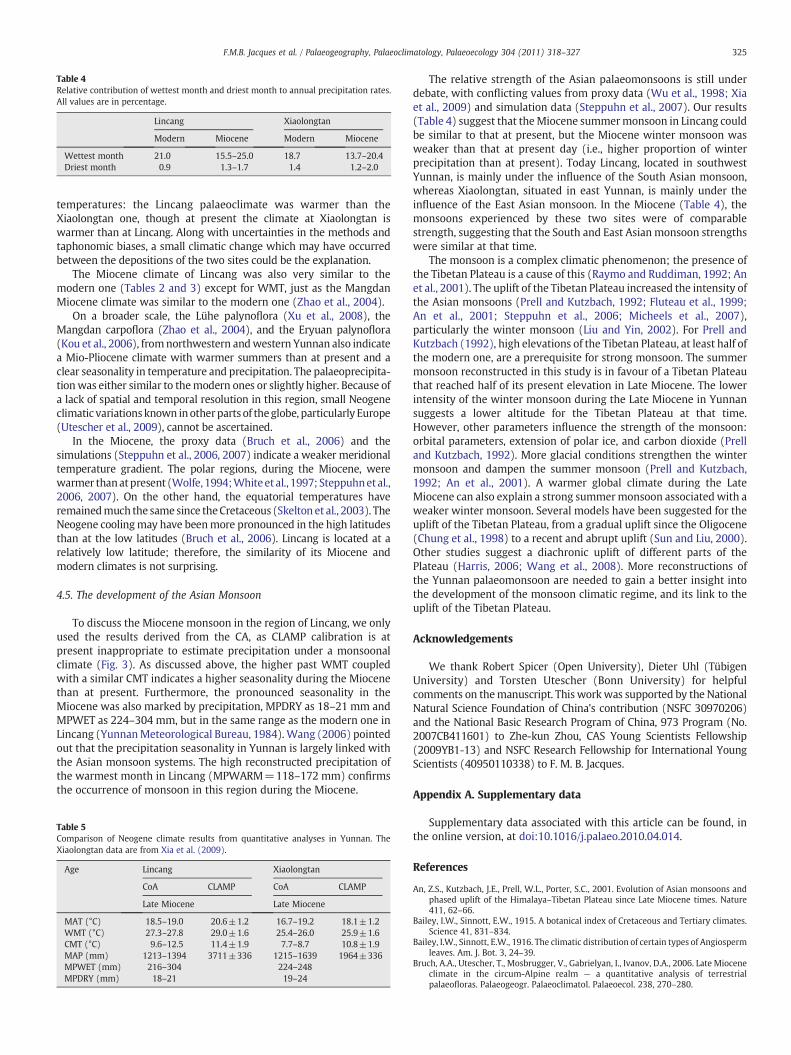
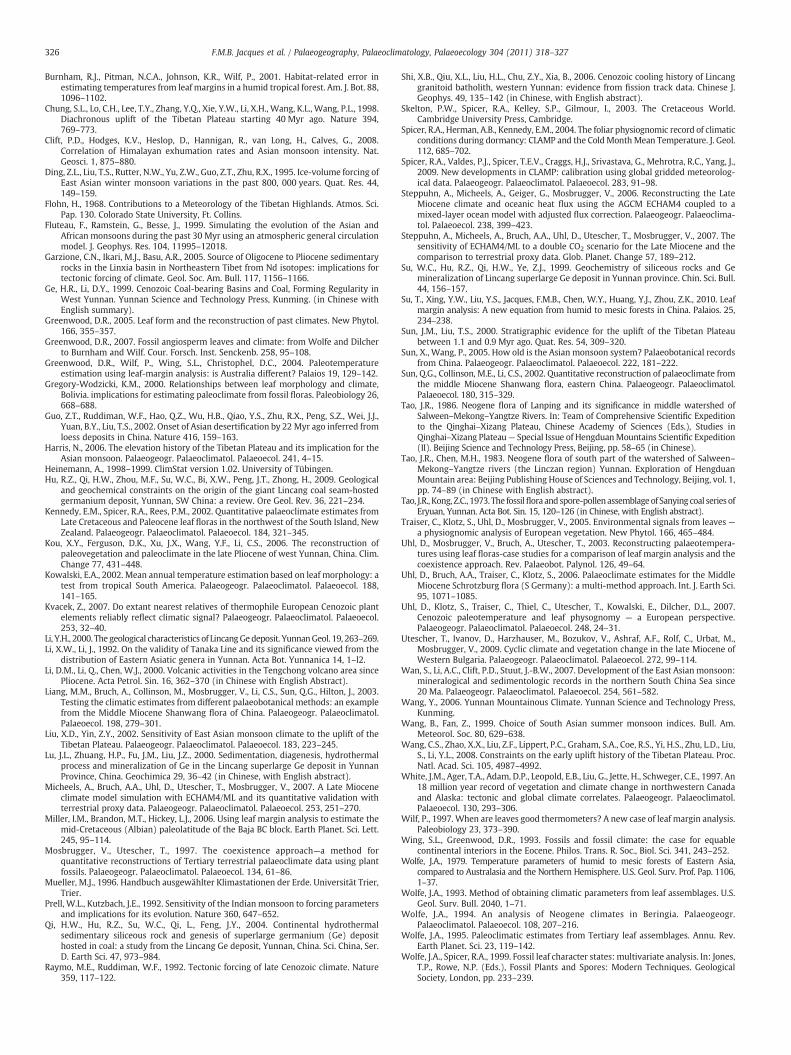
Table 4Relative contribution of wettest month and driest month to annual precipitation rates.All values are in percentage.
Lincang Xiaolongtan
Modern Miocene Modern Miocene
Wettest month 21.0 15.5–25.0 18.7 13.7–20.4Driest month 0.9 1.3–1.7 1.4 1.2–2.0
325F.M.B. Jacques et al. / Palaeogeography, Palaeoclimatology, Palaeoecology 304 (2011) 318–327
temperatures: the Lincang palaeoclimate was warmer than theXiaolongtan one, though at present the climate at Xiaolongtan iswarmer than at Lincang. Along with uncertainties in the methods andtaphonomic biases, a small climatic change which may have occurredbetween the depositions of the two sites could be the explanation.
The Miocene climate of Lincang was also very similar to themodern one (Tables 2 and 3) except for WMT, just as the MangdanMiocene climate was similar to the modern one (Zhao et al., 2004).
On a broader scale, the Lühe palynoflora (Xu et al., 2008), theMangdan carpoflora (Zhao et al., 2004), and the Eryuan palynoflora(Kou et al., 2006), fromnorthwestern andwestern Yunnan also indicatea Mio-Pliocene climate with warmer summers than at present and aclear seasonality in temperature and precipitation. The palaeoprecipita-tionwas either similar to themodern ones or slightly higher. Because ofa lack of spatial and temporal resolution in this region, small Neogeneclimatic variationsknown inotherparts of theglobe, particularly Europe(Utescher et al., 2009), cannot be ascertained.
In the Miocene, the proxy data (Bruch et al., 2006) and thesimulations (Steppuhn et al., 2006, 2007) indicate a weaker meridionaltemperature gradient. The polar regions, during the Miocene, werewarmer thanatpresent (Wolfe, 1994;Whiteet al., 1997; Steppuhnet al.,2006, 2007). On the other hand, the equatorial temperatures haveremainedmuch the samesince theCretaceous (Skelton et al., 2003). TheNeogene coolingmay have beenmore pronounced in the high latitudesthan at the low latitudes (Bruch et al., 2006). Lincang is located at arelatively low latitude; therefore, the similarity of its Miocene andmodern climates is not surprising.
4.5. The development of the Asian Monsoon
To discuss the Miocene monsoon in the region of Lincang, we onlyused the results derived from the CA, as CLAMP calibration is atpresent inappropriate to estimate precipitation under a monsoonalclimate (Fig. 3). As discussed above, the higher past WMT coupledwith a similar CMT indicates a higher seasonality during the Miocenethan at present. Furthermore, the pronounced seasonality in theMiocene was also marked by precipitation, MPDRY as 18–21 mm andMPWET as 224–304 mm, but in the same range as the modern one inLincang (YunnanMeteorological Bureau, 1984).Wang (2006) pointedout that the precipitation seasonality in Yunnan is largely linked withthe Asian monsoon systems. The high reconstructed precipitation ofthe warmest month in Lincang (MPWARM=118–172 mm) confirmsthe occurrence of monsoon in this region during the Miocene.
Table 5Comparison of Neogene climate results from quantitative analyses in Yunnan. TheXiaolongtan data are from Xia et al. (2009).
Age Lincang Xiaolongtan
CoA CLAMP CoA CLAMP
Late Miocene Late Miocene
MAT (°C) 18.5–19.0 20.6±1.2 16.7–19.2 18.1±1.2WMT (°C) 27.3–27.8 29.0±1.6 25.4–26.0 25.9±1.6CMT (°C) 9.6–12.5 11.4±1.9 7.7–8.7 10.8±1.9MAP (mm) 1213–1394 3711±336 1215–1639 1964±336MPWET (mm) 216–304 224–248MPDRY (mm) 18–21 19–24
The relative strength of the Asian palaeomonsoons is still underdebate, with conflicting values from proxy data (Wu et al., 1998; Xiaet al., 2009) and simulation data (Steppuhn et al., 2007). Our results(Table 4) suggest that theMiocene summermonsoon in Lincang couldbe similar to that at present, but the Miocene winter monsoon wasweaker than that at present day (i.e., higher proportion of winterprecipitation than at present). Today Lincang, located in southwestYunnan, is mainly under the influence of the South Asian monsoon,whereas Xiaolongtan, situated in east Yunnan, is mainly under theinfluence of the East Asian monsoon. In the Miocene (Table 4), themonsoons experienced by these two sites were of comparablestrength, suggesting that the South and East Asian monsoon strengthswere similar at that time.
The monsoon is a complex climatic phenomenon; the presence ofthe Tibetan Plateau is a cause of this (Raymo and Ruddiman, 1992; Anet al., 2001). The uplift of the Tibetan Plateau increased the intensity ofthe Asian monsoons (Prell and Kutzbach, 1992; Fluteau et al., 1999;An et al., 2001; Steppuhn et al., 2006; Micheels et al., 2007),particularly the winter monsoon (Liu and Yin, 2002). For Prell andKutzbach (1992), high elevations of the Tibetan Plateau, at least half ofthe modern one, are a prerequisite for strong monsoon. The summermonsoon reconstructed in this study is in favour of a Tibetan Plateauthat reached half of its present elevation in Late Miocene. The lowerintensity of the winter monsoon during the Late Miocene in Yunnansuggests a lower altitude for the Tibetan Plateau at that time.However, other parameters influence the strength of the monsoon:orbital parameters, extension of polar ice, and carbon dioxide (Prelland Kutzbach, 1992). More glacial conditions strengthen the wintermonsoon and dampen the summer monsoon (Prell and Kutzbach,1992; An et al., 2001). A warmer global climate during the LateMiocene can also explain a strong summermonsoon associated with aweaker winter monsoon. Several models have been suggested for theuplift of the Tibetan Plateau, from a gradual uplift since the Oligocene(Chung et al., 1998) to a recent and abrupt uplift (Sun and Liu, 2000).Other studies suggest a diachronic uplift of different parts of thePlateau (Harris, 2006; Wang et al., 2008). More reconstructions ofthe Yunnan palaeomonsoon are needed to gain a better insight intothe development of the monsoon climatic regime, and its link to theuplift of the Tibetan Plateau.
Acknowledgements
We thank Robert Spicer (Open University), Dieter Uhl (TübigenUniversity) and Torsten Utescher (Bonn University) for helpfulcomments on themanuscript. This workwas supported by the NationalNatural Science Foundation of China's contribution (NSFC 30970206)and the National Basic Research Program of China, 973 Program (No.2007CB411601) to Zhe-kun Zhou, CAS Young Scientists Fellowship(2009YB1-13) and NSFC Research Fellowship for International YoungScientists (40950110338) to F. M. B. Jacques.
Appendix A. Supplementary data
Supplementary data associated with this article can be found, inthe online version, at doi:10.1016/j.palaeo.2010.04.014.
References
An, Z.S., Kutzbach, J.E., Prell, W.L., Porter, S.C., 2001. Evolution of Asian monsoons andphased uplift of the Himalaya–Tibetan Plateau since Late Miocene times. Nature411, 62–66.
Bailey, I.W., Sinnott, E.W., 1915. A botanical index of Cretaceous and Tertiary climates.Science 41, 831–834.
Bailey, I.W., Sinnott, E.W., 1916. The climatic distribution of certain types of Angiospermleaves. Am. J. Bot. 3, 24–39.
Bruch, A.A., Utescher, T., Mosbrugger, V., Gabrielyan, I., Ivanov, D.A., 2006. Late Mioceneclimate in the circum-Alpine realm — a quantitative analysis of terrestrialpalaeofloras. Palaeogeogr. Palaeoclimatol. Palaeoecol. 238, 270–280.
326 F.M.B. Jacques et al. / Palaeogeography, Palaeoclimatology, Palaeoecology 304 (2011) 318–327
Burnham, R.J., Pitman, N.C.A., Johnson, K.R., Wilf, P., 2001. Habitat-related error inestimating temperatures from leaf margins in a humid tropical forest. Am. J. Bot. 88,1096–1102.
Chung, S.L., Lo, C.H., Lee, T.Y., Zhang, Y.Q., Xie, Y.W., Li, X.H., Wang, K.L., Wang, P.L., 1998.Diachronous uplift of the Tibetan Plateau starting 40 Myr ago. Nature 394,769–773.
Clift, P.D., Hodges, K.V., Heslop, D., Hannigan, R., van Long, H., Calves, G., 2008.Correlation of Himalayan exhumation rates and Asian monsoon intensity. Nat.Geosci. 1, 875–880.
Ding, Z.L., Liu, T.S., Rutter, N.W., Yu, Z.W., Guo, Z.T., Zhu, R.X., 1995. Ice-volume forcing ofEast Asian winter monsoon variations in the past 800, 000 years. Quat. Res. 44,149–159.
Flohn, H., 1968. Contributions to a Meteorology of the Tibetan Highlands. Atmos. Sci.Pap. 130. Colorado State University, Ft. Collins.
Fluteau, F., Ramstein, G., Besse, J., 1999. Simulating the evolution of the Asian andAfrican monsoons during the past 30 Myr using an atmospheric general circulationmodel. J. Geophys. Res. 104, 11995–12018.
Garzione, C.N., Ikari, M.J., Basu, A.R., 2005. Source of Oligocene to Pliocene sedimentaryrocks in the Linxia basin in Northeastern Tibet from Nd isotopes: implications fortectonic forcing of climate. Geol. Soc. Am. Bull. 117, 1156–1166.
Ge, H.R., Li, D.Y., 1999. Cenozoic Coal-bearing Basins and Coal, Forming Regularity inWest Yunnan. Yunnan Science and Technology Press, Kunming. (in Chinese withEnglish summary).
Greenwood, D.R., 2005. Leaf form and the reconstruction of past climates. New Phytol.166, 355–357.
Greenwood, D.R., 2007. Fossil angiosperm leaves and climate: from Wolfe and Dilcherto Burnham and Wilf. Cour. Forsch. Inst. Senckenb. 258, 95–108.
Greenwood, D.R., Wilf, P., Wing, S.L., Christophel, D.C., 2004. Paleotemperatureestimation using leaf-margin analysis: is Australia different? Palaios 19, 129–142.
Gregory-Wodzicki, K.M., 2000. Relationships between leaf morphology and climate,Bolivia. implications for estimating paleoclimate from fossil floras. Paleobiology 26,668–688.
Guo, Z.T., Ruddiman, W.F., Hao, Q.Z., Wu, H.B., Qiao, Y.S., Zhu, R.X., Peng, S.Z., Wei, J.J.,Yuan, B.Y., Liu, T.S., 2002. Onset of Asian desertification by 22 Myr ago inferred fromloess deposits in China. Nature 416, 159–163.
Harris, N., 2006. The elevation history of the Tibetan Plateau and its implication for theAsian monsoon. Palaeogeogr. Palaeoclimatol. Palaeoecol. 241, 4–15.
Heinemann, A., 1998–1999. ClimStat version 1.02. University of Tübingen.Hu, R.Z., Qi, H.W., Zhou, M.F., Su, W.C., Bi, X.W., Peng, J.T., Zhong, H., 2009. Geological
and geochemical constraints on the origin of the giant Lincang coal seam-hostedgermanium deposit, Yunnan, SW China: a review. Ore Geol. Rev. 36, 221–234.
Kennedy, E.M., Spicer, R.A., Rees, P.M., 2002. Quantitative palaeoclimate estimates fromLate Cretaceous and Paleocene leaf floras in the northwest of the South Island, NewZealand. Palaeogeogr. Palaeoclimatol. Palaeoecol. 184, 321–345.
Kou, X.Y., Ferguson, D.K., Xu, J.X., Wang, Y.F., Li, C.S., 2006. The reconstruction ofpaleovegetation and paleoclimate in the late Pliocene of west Yunnan, China. Clim.Change 77, 431–448.
Kowalski, E.A., 2002. Mean annual temperature estimation based on leaf morphology: atest from tropical South America. Palaeogeogr. Palaeoclimatol. Palaeoecol. 188,141–165.
Kvacek, Z., 2007. Do extant nearest relatives of thermophile European Cenozoic plantelements reliably reflect climatic signal? Palaeogeogr. Palaeoclimatol. Palaeoecol.253, 32–40.
Li, Y.H., 2000. The geological characteristics of LincangGedeposit. YunnanGeol. 19, 263–269.Li, X.W., Li, J., 1992. On the validity of Tanaka Line and its significance viewed from the
distribution of Eastern Asiatic genera in Yunnan. Acta Bot. Yunnanica 14, 1–l2.Li, D.M., Li, Q., Chen, W.J., 2000. Volcanic activities in the Tengchong volcano area since
Pliocene. Acta Petrol. Sin. 16, 362–370 (in Chinese with English Abstract).Liang, M.M., Bruch, A., Collinson, M., Mosbrugger, V., Li, C.S., Sun, Q.G., Hilton, J., 2003.
Testing the climatic estimates from different palaeobotanical methods: an examplefrom the Middle Miocene Shanwang flora of China. Palaeogeogr. Palaeoclimatol.Palaeoecol. 198, 279–301.
Liu, X.D., Yin, Z.Y., 2002. Sensitivity of East Asian monsoon climate to the uplift of theTibetan Plateau. Palaeogeogr. Palaeoclimatol. Palaeoecol. 183, 223–245.
Lu, J.L., Zhuang, H.P., Fu, J.M., Liu, J.Z., 2000. Sedimentation, diagenesis, hydrothermalprocess and mineralization of Ge in the Lincang superlarge Ge deposit in YunnanProvince, China. Geochimica 29, 36–42 (in Chinese, with English abstract).
Micheels, A., Bruch, A.A., Uhl, D., Utescher, T., Mosbrugger, V., 2007. A Late Mioceneclimate model simulation with ECHAM4/ML and its quantitative validation withterrestrial proxy data. Palaeogeogr. Palaeoclimatol. Palaeoecol. 253, 251–270.
Miller, I.M., Brandon, M.T., Hickey, L.J., 2006. Using leaf margin analysis to estimate themid-Cretaceous (Albian) paleolatitude of the Baja BC block. Earth Planet. Sci. Lett.245, 95–114.
Mosbrugger, V., Utescher, T., 1997. The coexistence approach—a method forquantitative reconstructions of Tertiary terrestrial palaeoclimate data using plantfossils. Palaeogeogr. Palaeoclimatol. Palaeoecol. 134, 61–86.
Mueller, M.J., 1996. Handbuch ausgewählter Klimastationen der Erde. Universität Trier,Trier.
Prell, W.L., Kutzbach, J.E., 1992. Sensitivity of the Indian monsoon to forcing parametersand implications for its evolution. Nature 360, 647–652.
Qi, H.W., Hu, R.Z., Su, W.C., Qi, L., Feng, J.Y., 2004. Continental hydrothermalsedimentary siliceous rock and genesis of superlarge germanium (Ge) deposithosted in coal: a study from the Lincang Ge deposit, Yunnan, China. Sci. China, Ser.D. Earth Sci. 47, 973–984.
Raymo, M.E., Ruddiman, W.F., 1992. Tectonic forcing of late Cenozoic climate. Nature359, 117–122.
Shi, X.B., Qiu, X.L., Liu, H.L., Chu, Z.Y., Xia, B., 2006. Cenozoic cooling history of Lincanggranitoid batholith, western Yunnan: evidence from fission track data. Chinese J.Geophys. 49, 135–142 (in Chinese, with English abstract).
Skelton, P.W., Spicer, R.A., Kelley, S.P., Gilmour, I., 2003. The Cretaceous World.Cambridge University Press, Cambridge.
Spicer, R.A., Herman, A.B., Kennedy, E.M., 2004. The foliar physiognomic record of climaticconditions during dormancy: CLAMP and the ColdMonth Mean Temperature. J. Geol.112, 685–702.
Spicer, R.A., Valdes, P.J., Spicer, T.E.V., Craggs, H.J., Srivastava, G., Mehrotra, R.C., Yang, J.,2009. New developments in CLAMP: calibration using global gridded meteorolog-ical data. Palaeogeogr. Palaeoclimatol. Palaeoecol. 283, 91–98.
Steppuhn, A., Micheels, A., Geiger, G., Mosbrugger, V., 2006. Reconstructing the LateMiocene climate and oceanic heat flux using the AGCM ECHAM4 coupled to amixed-layer ocean model with adjusted flux correction. Palaeogeogr. Palaeoclima-tol. Palaeoecol. 238, 399–423.
Steppuhn, A., Micheels, A., Bruch, A.A., Uhl, D., Utescher, T., Mosbrugger, V., 2007. Thesensitivity of ECHAM4/ML to a double CO2 scenario for the Late Miocene and thecomparison to terrestrial proxy data. Glob. Planet. Change 57, 189–212.
Su, W.C., Hu, R.Z., Qi, H.W., Ye, Z.J., 1999. Geochemistry of siliceous rocks and Gemineralization of Lincang superlarge Ge deposit in Yunnan province. Chin. Sci. Bull.44, 156–157.
Su, T., Xing, Y.W., Liu, Y.S., Jacques, F.M.B., Chen, W.Y., Huang, Y.J., Zhou, Z.K., 2010. Leafmargin analysis: A new equation from humid to mesic forests in China. Palaios. 25,234–238.
Sun, J.M., Liu, T.S., 2000. Stratigraphic evidence for the uplift of the Tibetan Plateaubetween 1.1 and 0.9 Myr ago. Quat. Res. 54, 309–320.
Sun, X., Wang, P., 2005. How old is the Asian monsoon system? Palaeobotanical recordsfrom China. Palaeogeogr. Palaeoclimatol. Palaeoecol. 222, 181–222.
Sun, Q.G., Collinson, M.E., Li, C.S., 2002. Quantitative reconstruction of palaeoclimate fromthe middle Miocene Shanwang flora, eastern China. Palaeogeogr. Palaeoclimatol.Palaeoecol. 180, 315–329.
Tao, J.R., 1986. Neogene flora of Lanping and its significance in middle watershed ofSalween–Mekong–Yangtze Rivers. In: Team of Comprehensive Scientific Expeditionto the Qinghai–Xizang Plateau, Chinese Academy of Sciences (Eds.), Studies inQinghai–Xizang Plateau— Special Issue of HengduanMountains Scientific Expedition(II). Beijing Science and Technology Press, Beijing, pp. 58–65 (in Chinese).
Tao, J.R., Chen, M.H., 1983. Neogene flora of south part of the watershed of Salween–Mekong–Yangtze rivers (the Linczan region) Yunnan. Exploration of HengduanMountain area: Beijing Publishing House of Sciences and Technology, Beijing, vol. 1,pp. 74–89 (in Chinese with English abstract).
Tao, J.R., Kong, Z.C., 1973. The fossilflora and spore-pollenassemblageof Sanying coal series ofEryuan, Yunnan. Acta Bot. Sin. 15, 120–126 (in Chinese, with English abstract).
Traiser, C., Klotz, S., Uhl, D., Mosbrugger, V., 2005. Environmental signals from leaves —a physiognomic analysis of European vegetation. New Phytol. 166, 465–484.
Uhl, D., Mosbrugger, V., Bruch, A., Utescher, T., 2003. Reconstructing palaeotempera-tures using leaf floras-case studies for a comparison of leaf margin analysis and thecoexistence approach. Rev. Palaeobot. Palynol. 126, 49–64.
Uhl, D., Bruch, A.A., Traiser, C., Klotz, S., 2006. Palaeoclimate estimates for the MiddleMiocene Schrotzburg flora (S Germany): a multi-method approach. Int. J. Earth Sci.95, 1071–1085.
Uhl, D., Klotz, S., Traiser, C., Thiel, C., Utescher, T., Kowalski, E., Dilcher, D.L., 2007.Cenozoic paleotemperature and leaf physognomy — a European perspective.Palaeogeogr. Palaeoclimatol. Palaeoecol. 248, 24–31.
Utescher, T., Ivanov, D., Harzhauser, M., Bozukov, V., Ashraf, A.F., Rolf, C., Urbat, M.,Mosbrugger, V., 2009. Cyclic climate and vegetation change in the late Miocene ofWestern Bulgaria. Palaeogeogr. Palaeoclimatol. Palaeoecol. 272, 99–114.
Wan, S., Li, A.C., Clift, P.D., Stuut, J.-B.W., 2007. Development of the East Asian monsoon:mineralogical and sedimentologic records in the northern South China Sea since20 Ma. Palaeogeogr. Palaeoclimatol. Palaeoecol. 254, 561–582.
Wang, Y., 2006. Yunnan Mountainous Climate. Yunnan Science and Technology Press,Kunming.
Wang, B., Fan, Z., 1999. Choice of South Asian summer monsoon indices. Bull. Am.Meteorol. Soc. 80, 629–638.
Wang, C.S., Zhao, X.X., Liu, Z.F., Lippert, P.C., Graham, S.A., Coe, R.S., Yi, H.S., Zhu, L.D., Liu,S., Li, Y.L., 2008. Constraints on the early uplift history of the Tibetan Plateau. Proc.Natl. Acad. Sci. 105, 4987–4992.
White, J.M., Ager, T.A., Adam, D.P., Leopold, E.B., Liu, G., Jette, H., Schweger, C.E., 1997. An18 million year record of vegetation and climate change in northwestern Canadaand Alaska: tectonic and global climate correlates. Palaeogeogr. Palaeoclimatol.Palaeoecol. 130, 293–306.
Wilf, P., 1997. When are leaves good thermometers? A new case of leaf margin analysis.Paleobiology 23, 373–390.
Wing, S.L., Greenwood, D.R., 1993. Fossils and fossil climate: the case for equablecontinental interiors in the Eocene. Philos. Trans. R. Soc., Biol. Sci. 341, 243–252.
Wolfe, J.A., 1979. Temperature parameters of humid to mesic forests of Eastern Asia,compared to Australasia and the Northern Hemisphere. U.S. Geol. Surv. Prof. Pap. 1106,1–37.
Wolfe, J.A., 1993. Method of obtaining climatic parameters from leaf assemblages. U.S.Geol. Surv. Bull. 2040, 1–71.
Wolfe, J.A., 1994. An analysis of Neogene climates in Beringia. Palaeogeogr.Palaeoclimatol. Palaeoecol. 108, 207–216.
Wolfe, J.A., 1995. Paleoclimatic estimates from Tertiary leaf assemblages. Annu. Rev.Earth Planet. Sci. 23, 119–142.
Wolfe, J.A., Spicer, R.A., 1999. Fossil leaf character states: multivariate analysis. In: Jones,T.P., Rowe, N.P. (Eds.), Fossil Plants and Spores: Modern Techniques. GeologicalSociety, London, pp. 233–239.

327F.M.B. Jacques et al. / Palaeogeography, Palaeoclimatology, Palaeoecology 304 (2011) 318–327
Writing Group of Cenozoic Plants of China (WGCPC), 1978. Cenozoic Plants from China,Fossil Plants of China, vol. 3. Science Press, Beijing (in Chinese).
Wu, X., Wang, S., An, Z., Jiang, F., Xiao, H., Sun, D., Xue, B., 1998. On tectonoclimatic cycleof quasi-period of 1.2 Ma in the late Cenozoic; examples from Qinghai–XizangPlateau and Loess Plateau, China. J. Geomech. 4, 1–11.
Xia, K., Su, T., Liu, Y.S., Xing, Y.W., Jacques, F.M.B., Zhou, Z.K., 2009. Quantitative climatereconstructions of the late Miocene Xiaolongtan megaflora from Yunnan, southwestChina. Palaeogeogr. Palaeoclimatol. Palaeoecol. 276, 80–86.
Xu, J.X., Wang, Y.F., Yang, J., Pu, G.R., Zhang, C.F., 2000. Advances in the research ofTertiary flora and climate in Yunnan. Chin. Bull. Bot. 17, 84–94 (suppl.), (in Chinesewith English abstract).
Xu, J.K., Ferguson, D.K., Li, C.S.,Wang, Y.F., 2008. LateMiocene vegetation and climate of theLühe region in Yunnan, southwestern China. Rev. Palaeobot. Palynol. 148, 36–59.
Yang, Y.G., 1990. Synthesis of Physical Geography Division of Yunnan. Higher EducationPress, Beijing.
Yang, J., Wang, Y.F., Spicer, R.A., Mosbrugger, V., Li, C.S., Sun, Q.G., 2007. Climaticreconstruction at the Miocene Shanwang Basin, China, using Leaf Margin Analysis,CLAMP, Coexistence Approach, and Overlapping Distribution Analysis. Am. J. Bot.94, 599–608.
YunnanMeteorological Bureau, 1984. Agricultural Climate Database of Yunnan. YunnanPeople's Press, Kunming (in Chinese).
Zhao, L.C., Wang, Y.F., Liu, C.J., Li, C.S., 2004. Climatic implications of fruit and seedassemblage from Miocene of Yunnan, southwestern China. Quat. Int. 117, 81–89.
Zhou, Z.K., 1985. The Miocene Xiaolongtan flora from Kaiyuan, Yunnan Province. In:Tao, J.R. (Ed.), The Evolution of the Late Cretaceous–Cenozoic Floras in China.Science Press, Beijing, pp. 64–72.