Quantitative Analysis of Oxidative Phosphorylation ...
262
7 Quantitative Analysis of Oxidative Phosphorylation Dysfunction in Mitochondrial Myopathy and Ageing Charlotte Warren Bsc (Hons), MRes Thesis submitted to Newcastle University for the Degree of Doctor of Philosophy Institute of Neuroscience Wellcome Centre for Mitochondrial Research September 2019
-
Upload
khangminh22 -
Category
Documents
-
view
0 -
download
0
Transcript of Quantitative Analysis of Oxidative Phosphorylation ...

Chapter 1
7
Quantitative Analysis of Oxidative
Phosphorylation Dysfunction in
Mitochondrial Myopathy and Ageing
Charlotte Warren
Bsc (Hons), MRes
Thesis submitted to Newcastle University for the Degree of Doctor of
Philosophy
Institute of Neuroscience
Wellcome Centre for Mitochondrial Research
September 2019


Author Declaration
This thesis is submitted for the degree of Doctor of Philosophy at Newcastle University. This
research was conducted in the Wellcome Centre for Mitochondrial Research, Institute of
Neuroscience, Newcastle University under the supervision of Prof Sir D M Turnbull, Dr A
Vincent and Dr L Butterworth. I declare that the work described here is my own, unless stated
otherwise. I certify that none of the material presented here has been previously submitted by
me for any degree or qualification at this or any other university.
Charlotte Warren


i
Abstract
Mitochondrial dysfunction not only occurs in patients with mitochondrial diseases, but in other
neuromuscular conditions as well as the normal ageing process. In patients with mitochondrial
disease, both nuclear and mitochondrial genetic defects cause a range of symptoms that are
extremely heterogeneous. These symptoms predominantly affect tissues with a high metabolic
demand such as the skeletal muscle, and often present as oxidative phosphorylation (OXPHOS)
deficiency. This disease phenotype is further complicated by the multicopy nature of
mitochondrial DNA (mtDNA), which means that mtDNA populations can be heteroplasmic,
with variable mutation loads leading to a mosaic pattern of OXPHOS deficiency. This project
aims to understand mitochondrial defects within skeletal muscle in both ageing and
mitochondrial myopathy.
An immunohistochemical investigation was undertaken to assess biochemical changes in
skeletal muscle biopsies from participants aged 84-85. This study provided a more thorough
understanding into what is happening to the muscle with age and revealed that active
participants aged 84-85 have a preserved mitochondrial function comparable to young, healthy
controls. However, although current methods such as immunohistochemistry and
immunocytochemistry can reveal specific aspects of the mitochondrial OXPHOS defect, they
fail to assess individual cell changes in all OXPHOS complexes within a single tissue
cryosection.
The advent of imaging mass cytometry (IMC) addresses this limitation and permits the
investigation of more proteins at a single cell level than is possible with current techniques.
Henceforth, this project was aimed at developing a novel workflow and bespoke analysis for
applying IMC in skeletal muscle to investigate OXPHOS deficiency more thoroughly. Once
optimised, this technique was used to investigate patients with different genetically
characterised mitochondrial diseases, followed by a larger cohort of single, large-scale mtDNA
deletion patients.
There are several novel findings from this work: (i) IMC can be used to successfully quantify
mitochondrial dysfunction in skeletal muscle; (ii) compared to controls and normal muscle
fibres, patients with a deficiency of complex I present with an increase in unaffected respiratory
chain complexes; (iii) complex III and V deficiency occur at low levels in muscle fibres from
some patients with defects in mitochondrial translation; (iv) the successful optimisation and use
of novel antibodies that target mtDNA-encoded subunits; (v) the amount of OXPHOS
deficiency detected in single, large-scale mtDNA deletion patients correlates with the size and
location of the deletions.

ii

iii
Acknowledgements
Firstly I would like to say a huge thank you to all of my supervisors; Professor Sir Doug
Turnbull, Dr Lyndsey Butterworth and Dr Amy Vincent for their unwavering support and
guidance throughout my time at the MRG. Doug, for not only allowing me to undertake this
PhD, but his constant encouragement and advice that has kept me motivated over the last 3
years - I’m glad the gamble on the machine finally paid off – what a relief! Amy, a fantastic
mentor and role model who has helped me tremendously over the last few years in every aspect
of my PhD.
I would also like to thank a few key contributors to my work. Firstly, Dr Conor Lawless who
designed and implemented a great deal of the analysis software used throughout this thesis, his
computer knowledge and stats expertise have been essential throughout this project. As well, a
huge thanks to the flow cytometry core facility – in particular Dr Andy Filby, Dr David
McDonald and Andrew Fuller who have been fantastic sources of knowledge and
encouragement. An extended thank you to ‘The Barbour Foundation’ and the MRC for funding
my studentship and thus allowing me to complete my PhD.
Next come the MRG shout outs. To the wonderful kretins: Hannah, Carla, Nish, Pav, Yas,
Shane, Matt and Adam who have made both work and Newcastle life a better place - thanks for
always saying yes to Friday night bevs and an occasional rum punch (or 5). To the OG badders
squad – my anger would definitely not have been managed half as well if it weren’t for our
badminton sessions over the years and so for that, I think everyone else is grateful! A shout out
to Yas and Ruth – top MRG housemates who have provided much needed thesis therapy
sessions over endless maccys, musicals and hair dying sessions. Finally to Tas (who, second to
thesaurus, has been my email writing saviour!), Lizzie, Julia, Dave and everyone else who have
made the office a nice place to work and who have been continued sources of banter and moral
support over the years.
To the Warren squad (Fudgeums included), who have been/ will always be the best support
system going. Dad, the greatest of role models. Although I may not always show it, I always
take on board your advice (it’s nearly always right!). Thanks for showing me how to work hard
but also for teaching me not to always take life too seriously (walk the line memories coming
back round about now!). Mam – who has been my rant recipient since I came to Newcastle 7
years ago, our phone calls on my way home have become an essential part of my routine.
Thanks for always listening to my complaints/excitements and pointless stories and for always
taking my side even if you had no idea what was going on! Tom – your success in everything

iv
you do has made me a fiercely competitive twin and so I credit a number of my achievements
to you! Thanks for always keeping me grounded when Mam and Dad are boosting my ego and
telling me how good I am – I can always count on you to knock it back down again!! I’m one
degree ahead now which means Mam will be hanging my picture over your Edinburgh
graduation soon so you better start applying for those PhDs!
Finally to my home gals: Zoe, Neeks, Vik, Caro, Jenni and Mads, who despite not having a clue
about what I do, are always there to give me the boost I need. Thanks for your 14 years of
friendship and for always being there whenever I have needed a break from
Newcastle/science/PhD life.

v
List of publications
Warren C, Lawless C, McDonald D, Capaldi R, Deehan D, Taylor RW, Filby A, Turnbull
DM, Vincent AE Understanding multi-dimensional respiratory chain deficiency phenotypes
in single skeletal muscle fibres’ 2019 (Paper submitted)
Vincent AE, White K, Davey T, Philips J, Ogden RT, Lawless C, Warren C, Hall MG, Ng YS,
Falkous G, Holden T, Deehan D, Taylor RW, Turnbull DM, Picard M. Quantitative 3D
Mapping of the Human Skeletal Muscle Mitochondrial Network. Cell Rep. 2019 Apr
2;27(1):321. doi: 10.1016/j.celrep.2019.03.051. Erratum for: Cell Rep. 2019 Jan 22;26(4):996-
1009.e4. PubMed PMID: 30943412; PubMed Central PMCID: PMC6519930
Dodds RM, Davies K, Granic A, Hollingsworth KG, Warren C, Gorman G, Turnbull DM,
Sayer AA. Mitochondrial respiratory chain function and content are preserved in the skeletal
muscle of active very old men and women. Exp Gerontol. 2018 Nov;113:80-85. doi:
10.1016/j.exger.2018.09.020. Epub 2018 Sep 25. PubMed PMID: 30266472; PubMed Central
PMCID: PMC6224654
Njemanze H, Warren C, Eggett C, MacGowan GA, Bates MG, Siervo M, Ivkovic S, Trenell
MI, Jakovljevic DG. Age-related decline in cardiac autonomic function is not attenuated with
increased physical activity. Oncotarget. 2016 Nov 22;7(47):76390-76397. doi:
10.18632/oncotarget.12403. PubMed PMID: 27705949; PubMed Central PMCID:
PMC5363517

vi
Courses and conferences attended
Neuromuscular Translational research conference, Cambridge – Poster presentation (2019)
Fluidigm Northern EU Mass Cytometry Meeting, Cambridge – Oral presentation (2018)
Neuromuscular Translational research conference, Cambridge – Poster presentation (2018)
EMBL, Heidelberg – Oral presentation (2018)
Introduction to Learning and Teaching (ILTHE) workshop – Training course at Newcastle University (2018)
Early Career Mitoscientist conference, Newcastle – Poster presentation (2017)
Light microscopy workshop – Training course at Newcastle University (2016)

vii
Abbreviations
ACh Acetylcholine
ADP Adenosine diphosphate
ATP Adenosine Triphosphate
bp Base pair
Ca2+ Calcium ion
CM Cristae membrane
CO2 Carbon dioxide
COX Cytochrome c oxidase
CPEO Chronic Progressive External Opthalmoplegia
CyTOF Time of flight mass cytometry
Da Dalton
dH2O Distilled water
DNA Deoxyribonucleic acid
Drp1 Dynamin related protein 1
ER Endoplasmic reticulum
ETC Electron transport chain
FADH2 Reduced flavin adenine dinucleotide
Fe-S Iron-sulphur
FFPE Formalin-Fixed Paraffin-Embedded
Fis2 Mitochondrial fission protein
GTP Guanosine triphosphate
H+ Hydrogen
H2O Water
Hcl Hydrochloric acid
viii
HSP Heavy strand promotor
H strand Heavy strand
IBM Inner boundary membrane
IGF1 Insulin-like growth factor 1
IMC Imaging mass cytometry
IMM Inner mitochondrial membrane
IMS Intermembrane space
kb Kilobase
KSS Kearns-Sayre Syndrome
L strand Light strand
LHON Leber’s Hereditary Optic Neuropathy
MELAS Mitochondrial Encephalomyopathy, Lactic acidosis and Stroke-like episodes
MERRF Myoclonic Epilepsy with Ragged Red Fibres
Mff Mitochondrial fission factor
MIDD Maternally Inherited Diabetes and Deafness
MILS Maternally Inherited Leigh syndrome
ml millilitre
mM millimolar
MRC Mitochondrial respiratory chain
mRNA messenger Ribonucleic Acid
mtDNA Mitochondrial DNA
mtSSB Mitochondrial Single Strand Binding protein
MT-TE Mitochondrial-encoded glutamic acid
MT-TG Mitochondrial-encoded glycine
MT-TK Mitochondrial-encoded Lysine

ix
MT-TL1 Mitochondrial-encoded Leucine 1
mt-tRNA mitochondrial transfer Ribonucleic Acid
MT-TW Mitochondrial-encoded Tryptophan
Na+ Sodium
NAD+ Nicotinamide adenine dinucleotide
NARP Neuropathy, ataxia and retinitis pigmentosa
nDNA Nuclear DNA
NGS Normal goat serum
NPC No primary control
OD Optical density
OH Origin of heavy strand replication
OL Origin of light strand replication
OMM Outer mitochondrial membrane
OPA1 Optic Atrophy 1
OXPHOS Oxidative phosphorylation
PBS Phosphate buffered saline
PFA Paraformaldehyde
PGC-1α Peroxisome proliferator-activated receptor gamma co-activator 1α
POLG Polymerase gamma
POLMRT mtRNA polymerase
RAPA Rapid assessment of physical activity
RITOLS RNA incorporation throughout the lagging strand
RNA Ribonucleic acid
ROI Region of interest
ROS Reactive oxygen species

x
RRF Ragged red fibre
RRM2B Ribonucleotide Reductase subunit M2 B
rRNA Ribosomal RNA
RT Room temperature
SDH Succinate Dehydrogenase
SDM Strand displacement model
SKM Skeletal muscle
SMI Skeletal Muscle Index
TBST Tris buffered saline with tween
TCA Tricarboxylic acid
TFAM Mitochondrial transcription factor A
TFB2M Mitochondrial transcription factor B2
TIFF Tagged image file format
TIM Translocase of the inner membrane
TOM Translocase of the outer membrane
tRNA transfer ribonucleic acid
tRNALeu transfer ribonucleic acid Leucine
TWINK Twinkle helicase
VDAC1 Voltage Dependant Anion Channel 1
µm micromolar
µl microlitre

xi
Table of Contents Chapter 1 : Introduction .......................................................................................................... 1
1.1 The origins of mitochondria......................................................................................... 2
1.2 Mitochondrial structure ................................................................................................ 2
1.3 Mitochondrial dynamics .............................................................................................. 4
1.3.1 Fission ................................................................................................................... 4
1.3.2 Fusion ................................................................................................................... 6
1.4 Oxidative phosphorylation and ATP production ......................................................... 7
1.4.1 Glycolysis and the TCA cycle .............................................................................. 7
1.4.2 Oxidative phosphorylation ................................................................................... 8
1.4.3 Complex I ........................................................................................................... 10
1.4.4 Complex II .......................................................................................................... 13
1.4.5 Complex III ........................................................................................................ 15
1.4.6 Complex IV ........................................................................................................ 17
1.4.7 Complex V .......................................................................................................... 19
1.4.8 Supercomplexes .................................................................................................. 21
1.5 Other functions of the mitochondria .......................................................................... 22
1.5.1 Calcium handling ................................................................................................ 22
1.5.2 Fe-S cluster formation ........................................................................................ 22
1.5.3 Reactive oxygen species (ROS) production ....................................................... 23
1.5.4 Apoptotic signalling ........................................................................................... 23
1.6 Mitochondrial turnover .............................................................................................. 24
1.6.1 Mitochondrial biogenesis ................................................................................... 24
1.6.2 Mitophagy ........................................................................................................... 24
1.7 Mitochondrial genetics .............................................................................................. 25
1.7.1 Mitochondrial genome ........................................................................................ 25
1.7.2 Mitochondrial DNA replication.......................................................................... 26
1.7.3 Transcription ....................................................................................................... 28

xii
1.7.4 Translation ......................................................................................................... 29
1.7.5 Heteroplasmy and the threshold effect............................................................... 31
1.7.6 Maternal inheritance and the bottleneck ............................................................ 32
1.7.7 Clonal expansion ................................................................................................ 32
1.8 Mitochondrial DNA mutations .................................................................................. 34
1.8.1 Point mutations .................................................................................................. 34
1.8.2 Single, large-scale mtDNA deletions ................................................................. 36
1.8.3 Nuclear DNA mutations..................................................................................... 36
1.9 Skeletal muscle .......................................................................................................... 39
1.9.1 Skeletal muscle structure ................................................................................... 39
1.9.2 Muscle fibre types .............................................................................................. 40
1.9.3 Skeletal muscle mitochondria ............................................................................ 40
1.10 Skeletal muscle in mitochondrial diseases ............................................................ 41
1.11 Overall aims and objectives ................................................................................... 43
Chapter 2 : Materials and methods ...................................................................................... 45
2.1 Materials .................................................................................................................... 46
2.2 Methods ..................................................................................................................... 49
2.2.1 Ethics .................................................................................................................. 49
2.2.2 Muscle biopsies .................................................................................................. 49
2.2.3 Cryostat sections ................................................................................................ 49
2.2.4 Haematoxylin and eosin ..................................................................................... 49
2.2.5 Immunohistochemistry....................................................................................... 50
2.2.6 Imaging .............................................................................................................. 51
2.2.7 Image analysis .................................................................................................... 51
2.2.8 Quantitative analysis of immunofluorescence ................................................... 51
2.2.9 Statistical analysis .............................................................................................. 52

xiii
Chapter 3 : Using the quadruple immunofluorescent assay to investigate oxidative
phosphorylation deficiency in 85 year old participants. ..................................................... 53
3.1 Introduction ................................................................................................................ 54
3.1.1 The ageing population ........................................................................................ 54
3.1.2 Sarcopenia .......................................................................................................... 54
3.1.3 Identification of sarcopenia ................................................................................ 54
3.1.4 Potential causes of sarcopenia ............................................................................ 55
3.1.5 Mitochondrial involvement in sarcopenia and ageing ........................................ 56
3.1.5.1 The mitochondrial genome ........................................................................................ 56
3.1.5.2 Mitochondrial dynamics ............................................................................................ 57
3.1.5.3 Oxidative damage and ROS production .................................................................... 57
3.1.6 Physical activity and exercise as an intervention for sarcopenia........................ 58
3.2 Aims of this study ...................................................................................................... 59
3.3 Methods ..................................................................................................................... 60
3.3.1 Patient cohort ...................................................................................................... 60
3.3.2 Muscle biopsy and cryo-sectioning .................................................................... 60
3.3.3 Immunofluorescent analysis of respiratory chain protein expression ................ 60
3.4 Results ........................................................................................................................ 62
3.4.1 Immunofluorescent analysis ............................................................................... 62
3.4.2 Validity of results ............................................................................................... 69
3.5 Discussion .................................................................................................................. 70
3.5.1 Identification of sarcopenia ................................................................................ 70
3.5.2 Impact of physical activity on study results ....................................................... 71
3.5.3 Strengths of the study ......................................................................................... 72
3.5.4 Limitations of the study ...................................................................................... 72
3.5.5 Conclusions ........................................................................................................ 73

xiv
Chapter 4 : Development and optimisation of the use and analysis of imaging mass
cytometry to investigate mitochondrial respiratory chain deficiency in single muscle fibres
.................................................................................................................................................. 75
4.1 Introduction ............................................................................................................... 76
4.1.1 Current techniques to assess mitochondrial defects in skeletal muscle. ............ 76
4.1.1.1 COX/SDH histochemistry ......................................................................................... 76
4.1.1.2 Quadruple immunofluorescence ................................................................................ 76
4.1.2 Challenges of current techniques ....................................................................... 77
4.1.3 Imaging mass cytometry .................................................................................... 78
4.2 Aims .......................................................................................................................... 79
4.3 Materials and Methods .............................................................................................. 80
4.3.1 Patient cohort ..................................................................................................... 80
4.3.2 Muscle biopsies and cryo-sectioning ................................................................. 80
4.3.3 Immunohistochemistry and imaging .................................................................. 80
4.3.4 Metal conjugations ............................................................................................. 82
4.3.5 Confirming conjugations had been successful ................................................... 83
4.3.6 Imaging mass cytometry .................................................................................... 84
4.4 Results ....................................................................................................................... 85
4.4.1 Optimisation of muscle sections, antibodies and conjugations for imaging mass
cytometry ......................................................................................................................... 85
4.4.1.1 Optimisation of a muscle fibre membrane marker .................................................... 85
4.4.1.2 Design of antibody panel ........................................................................................... 86
4.4.1.3 Testing antibody binding efficiency after conjugation .............................................. 91
4.4.1.4 Optimisation of a new mass marker .......................................................................... 93
4.4.1.5 Ensuring section thickness has no impact on staining ............................................... 96
4.4.2 Optimisation of staining and development of analysis for imaging mass
cytometry. ........................................................................................................................ 98
4.4.2.1 Preliminary imaging mass cytometry staining .......................................................... 98
4.4.2.2 Development of Mitocyto ........................................................................................ 102
4.4.2.3 Development of plotIMC ......................................................................................... 106
4.5 Discussion ............................................................................................................... 113
4.5.1 Advantages of imaging mass cytometry .......................................................... 113

xv
4.5.2 Limitations of imaging mass cytometry ........................................................... 114
4.5.3 Potential applications ........................................................................................ 116
Chapter 5 : Understanding multi-dimensional respiratory chain deficiency phenotypes in
single skeletal muscle fibres using imaging mass cytometry ............................................ 117
5.1 Introduction .............................................................................................................. 118
5.2 Aims of the study ..................................................................................................... 120
5.3 Methods ................................................................................................................... 121
5.3.1 Patient cohort .................................................................................................... 121
5.3.2 Antibodies and panel design ............................................................................. 121
5.3.3 Muscle biopsy and cryo-sectioning .................................................................. 125
5.3.4 Preparation of samples for immunofluorescence ............................................. 125
5.3.5 Imaging and analysis of samples prepared for immunofluorescence ............... 125
5.3.6 Preparation of samples for imaging mass cytometry........................................ 125
5.3.7 Imaging mass cytometry ................................................................................... 126
5.3.8 Analysis of imaging mass cytometry data ........................................................ 126
5.4 Results ...................................................................................................................... 127
5.4.1 Successful imaging of patient cohort................................................................ 127
5.4.2 Validation of imaging mass cytometry ............................................................. 128
5.4.3 Reproducibility of imaging mass cytometry .................................................... 130
5.4.4 Visualising biochemical phenotypes of mitochondrial patients using IMC ..... 132
5.4.5 Patients with nuclear-encoded complex I variants ........................................... 133
5.4.6 Patients with single, large-scale mtDNA mutations ......................................... 137
5.4.7 Patients with point mutations in mt-encoded tRNA Leucine (MT-TL1) .......... 141
5.4.8 Patients with point mutations in other mt-encoded tRNAs .............................. 146
5.4.9 Genetic thresholds at which OXPHOS deficiency occurs................................ 152
5.4.10 Patients with isolated complex deficiency........................................................ 154
5.4.11 Comparing imaging mass cytometry analysis to z-scores ................................ 161
5.5 Discussion ................................................................................................................ 165

xvi
Chapter 6 : Optimisation of new antibodies targeting mtDNA-encoded proteins for use
with immunofluorescence and imaging mass cytometry .................................................. 171
6.1 Introduction ............................................................................................................. 172
6.1.1 Advent of imaging mass cytometry ................................................................. 172
6.1.2 Limitations of validated antibodies and current imaging mass cytometry
panel…... ........................................................................................................................ 172
6.2 Aims ............................................................................................................................. 173
6.3 Methods ................................................................................................................... 174
6.3.1 Patient cohort ................................................................................................... 174
6.3.2 Antibodies ........................................................................................................ 174
6.3.3 Muscle biopsy and cryosectioning ................................................................... 174
6.3.4 Preparation and imaging of samples for immunofluorescence ........................ 174
6.3.5 Preparation and imaging of samples for imaging mass cytometry .................. 174
6.4 Results ..................................................................................................................... 178
6.4.1 Testing new antibodies on control skeletal muscle tissue................................ 178
6.4.2 Testing new antibodies on patient skeletal muscle tissue ................................ 180
6.4.3 Comparing established OXPHOS antibodies to new antibodies targeting mtDNA-
encoded subunits ............................................................................................................ 182
6.4.4 Expression of antibodies targeting mtDNA-encoded subunits for subsequent
metal conjugation. .......................................................................................................... 186
6.4.5 Running the new antibodies with imaging mass cytometry ............................ 189
6.4.6 PlotIMC profiles from patients with single, large scale mtDNA deletions ..... 191
6.5 Discussion ............................................................................................................... 208
Chapter 7 : Final discussion ................................................................................................ 213
7.1 Main findings .......................................................................................................... 214
7.1.1 Mitochondrial function is preserved in 85 year old adults ............................... 214
7.1.2 Imaging mass cytometry can be used to successfully assess OXPHOS deficiency
in single skeletal muscle fibres and is comparable to other techniques. ........................ 214
7.1.3 IMC can deduce different OXPHOS phenotypes in different patient groups. . 215

xvii
7.1.4 Successful identification and optimisation of antibodies targeting mtDNA-
encoded OXPHOS subunits............................................................................................ 215
7.1.5 The biochemical profiles of single, large-scale mtDNA deletion patients correlate
well with the size and location of the respective deletions............................................. 215
7.2 Advantages of imaging mass cytometry .................................................................. 216
7.3 Disadvantages of imaging mass cytometry.............................................................. 217
7.4 Future work .............................................................................................................. 218
7.5 Final conclusion ....................................................................................................... 219
Chapter 8 : References ......................................................................................................... 220

xviii
List of Figures
Figure 1.1: Schematic representation of mitochondrial structure and organisation. ................ 3
Figure 1.2: Mitochondrial Fission............................................................................................. 5
Figure 1.3: Mitochondrial Fusion. ............................................................................................ 6
Figure 1.4: Oxidative phosphorylation. .................................................................................... 9
Figure 1.5: Complex I ............................................................................................................. 11
Figure 1.6: Complex I assembly ............................................................................................. 12
Figure 1.7: Complex II ............................................................................................................ 13
Figure 1.8: Complex II assembly ............................................................................................ 14
Figure 1.9: Complex III .......................................................................................................... 15
Figure 1.10: Complex III assembly ........................................................................................ 16
Figure 1.11: Complex IV ........................................................................................................ 17
Figure 1.12: Complex IV assembly ........................................................................................ 18
Figure 1.13: Complex V .......................................................................................................... 19
Figure 1.14: Complex V assembly .......................................................................................... 20
Figure 1.15: Mitochondrial genome ........................................................................................ 25
Figure 1.16: Models of mtDNA replication ............................................................................ 27
Figure 1.17: Transcription initiation ....................................................................................... 28
Figure 1.18: Mitochondrial translation. .................................................................................. 30
Figure 1.19: Heteroplasmy and the threshold effect ............................................................... 31
Figure 1.20: Point mutations associated with mitochondrial disease ..................................... 35
Figure 1.21: Skeletal muscle structure .................................................................................... 39
Figure 2.1: Example MRC plot ............................................................................................... 52
Figure 3.1: Quadruple immunofluorescent analysis of mitochondrial respiratory chain
deficiency in participants and controls..................................................................................... 64
Figure 3.2: MRC profiles ........................................................................................................ 65
Figure 3.3: VDAC1 levels of controls .................................................................................... 67
Figure 3.4: VDAC1 levels of participants .............................................................................. 68
Figure 4.1: IMC workflow ...................................................................................................... 78
Figure 4.2: Example FACS plot demonstrating a successful antibody/metal conjugation. .... 83
Figure 4.3: Successful dystrophin staining ............................................................................. 85
Figure 4.4: Testing antibodies on control muscle ................................................................... 86
Figure 4.5: Mass response curve ............................................................................................. 87
Figure 4.6: Expression level of each antibody in the IMC panel............................................ 89

xix
Figure 4.7: TOMM20 expression level ................................................................................... 90
Figure 4.8: Expression levels of metal and non-metal bound protein ..................................... 92
Figure 4.9: TOMM20 staining pre- and post-conjugation ...................................................... 93
Figure 4.10: TOMM22 staining. ............................................................................................. 95
Figure 4.11: Correlation of TOMM22 to other mitochondrial mass markers ......................... 95
Figure 4.12: Quadruple immunofluorescent images to compare different section thicknesses -
6µm v 10µm ............................................................................................................................. 96
Figure 4.13: Comparing different section thicknesses -6µm v 10µm ..................................... 97
Figure 4.14: IMC images from C01 ........................................................................................ 99
Figure 4.15: IMC images at 1/50 dilution ............................................................................. 100
Figure 4.16: Merged IMC images for C01 and P01 .............................................................. 101
Figure 4.17: Matlab image segmentation .............................................................................. 102
Figure 4.18: Development of Mitocyto with addition of further factors ............................... 105
Figure 4.19: PlotIMC 2Dmito plot view showing expression of each antibody against a
surrogate for mitochondrial mass ........................................................................................... 107
Figure 4.20: Secondary data views on PlotIMC displaying mean intensity and theta views 109
Figure 4.21: Example of selected fibres on PlotIMC ............................................................ 110
Figure 4.22: Example correlation matrix generated using PlotIMC ..................................... 111
Figure 4.23: Matrix displaying percentage crosstalk for metal tags ..................................... 115
Figure 5.1: Example patient from each patient group imaged using IMC ............................ 127
Figure 5.2: Comparison of images generated by IHC and IMC............................................ 128
Figure 5.3: Pearson’s correlation of IHC versus IMC ........................................................... 129
Figure 5.4: Correlation plots to determine the reproducibility of IMC experiments ............ 131
Figure 5.5: k-means global clustering ................................................................................... 132
Figure 5.6: Biochemical profile of patients with nuclear-encoded CI variants causing isolated
CI deficiency........................................................................................................................... 134
Figure 5.7: 2Dmito plot from P01 with a TMEM126B mutation affecting complex I ......... 135
Figure 5.8: 2Dmito plot from P02 with a ACAD9 mutation affecting complex I ................ 136
Figure 5.9: Location of single, large-scale mtDNA deletions for P03 and P04 .................... 137
Figure 5.10: 2Dmito plot from P03 with a single, large-scale mtDNA deletion removing
regions m.8929-13301. ........................................................................................................... 138
Figure 5.11: Theta plot of P04 with a single, large-scale deletion removing regions m.7130-
14628 ...................................................................................................................................... 139
Figure 5.12: 2Dmito plot from P04 with a single, large-scale mtDNA deletion removing
regions m.7130-14628. ........................................................................................................... 140

xx
Figure 5.13: Biochemical profile of patients with an m.3243A>G point mutation in MT-TL1
................................................................................................................................................ 141
Figure 5.14: 2Dmito plot from P05 with an m.3243A>G mutation in MT-TL1 .................. 143
Figure 5.15: 2Dmito plot from P06 with an m.3243A>G mutation in MT-TL1 .................. 144
Figure 5.16: 2Dmito plot from P07 with an m.3243A>G mutation in MT-TL1 .................. 145
Figure 5.17: Location of tRNA variants for P08, P09 and P10. ........................................... 146
Figure 5.18: Biochemical profile of patients with a point mutation in other mt-encoded tRNAs
................................................................................................................................................ 147
Figure 5.19: 2Dmito plot from P08 with an m.10010T>C mutation in MT-TG .................. 149
Figure 5.20: 2Dmito plot from P09 with an m.14709T>C mutation in MT-TE ................... 150
Figure 5.21: 2Dmito plot from P10 with an m.5543T>C mutation in MT-TW ................... 151
Figure 5.22: NDUFB8 levels in patients with combined deficiency .................................... 152
Figure 5.23: IMC staining for SDHA in patients with isolated complex II deficiency and
controls ................................................................................................................................... 155
Figure 5.24: IMC staining for MTCO1 in patients with isolated complex IV deficiency and
controls ................................................................................................................................... 156
Figure 5.25: IMC staining for OSCP in patients with isolated complex V deficiency and
controls ................................................................................................................................... 157
Figure 5.26: Mean expression of each antibody in three different regions of the muscle biopsy
................................................................................................................................................ 158
Figure 5.27: Antibody expression in patients with isolated deficiencies.............................. 160
Figure 5.28: z-score v 95% confidence interval ................................................................... 161
Figure 5.29: Correlation of deficient fibres categorised by z-scores or 95% confidence interval
................................................................................................................................................ 164
Figure 6.1: Immunofluorescent staining on a control section using new antibodies targeting
mtDNA-encoded proteins ...................................................................................................... 179
Figure 6.2: Immunofluorescent staining of a patient section using new antibodies that target
mtDNA-encoded proteins ...................................................................................................... 181
Figure 6.3: Immunofluorescent staining of P01 comparing new antibodies targeting mtDNA-
encoded proteins with antibodies targeting nuclear-encoded proteins against the same complex
................................................................................................................................................ 184
Figure 6.4: Antibody correlations ......................................................................................... 185
Figure 6.5: Intensity of new antibodies that target mtDNA-encoded proteins. .................... 186
Figure 6.6: Metal pairings. .................................................................................................... 188
Figure 6.7: IMC images from C03. ....................................................................................... 189

xxi
Figure 6.8: IMC images from P04 ......................................................................................... 190
Figure 6.9: Location of single, large-scale mtDNA deletions for P02, P03 and P04. ........... 191
Figure 6.10: 2Dmito plot from P02 with a single, large-scale mtDNA deletion removing
regions m.8482-13460 ............................................................................................................ 193
Figure 6.11: 2Dmito plot from P03 with a single, large-scale mtDNA deletion removing
regions m.8482-13460 ............................................................................................................ 195
Figure 6.12: 2Dmito plot from P04 with a single, large-scale mtDNA deletion removing
regions m.9498-13739 ............................................................................................................ 197
Figure 6.13: Location of single, large-scale mtDNA deletions for P05, P06 and P07 .......... 198
Figure 6.14: 2Dmito plot from P05 with a single, large-scale mtDNA deletion removing
regions m.10747-15598 .......................................................................................................... 199
Figure 6.15: 2Dmito plot from P06 with a single, large-scale mtDNA deletion removing
regions m.10946-15587 .......................................................................................................... 201
Figure 6.16: 2Dmito plot from P07 with a single, large-scale mtDNA deletion removing
regions m.12113-14421 .......................................................................................................... 203
Figure 6.17: Location of single, large-scale mtDNA deletions for P09 and P10 .................. 204
Figure 6.18: 2Dmito plot from P09 with a single, large-scale mtDNA deletion removing
regions: m.5772-12916 ........................................................................................................... 205
Figure 6.19: 2Dmito plot from P10 with a single, large-scale mtDNA deletion removing
regions: m.6002-11221. .......................................................................................................... 207

xxii
List of Tables
Table 1.1: Nuclear genes linked to mitochondrial disorders................................................... 38
Table 2.1: Primary antibody cocktails used for immunofluorescence. ................................... 50
Table 2.2: Secondary antibody cocktail used for immunofluorescence. ................................ 50
Table 3.1: Subject information ................................................................................................ 61
Table 3.2: Quantification of complex I (NDUFB8) and complex IV (MTCO1) deficiency .. 66
Table 3.3: Percentage difference in re-quantification of levels of deficiency ........................ 69
Table 3.4: RAPA scores of study participants. ....................................................................... 70
Table 4.1: Patient information................................................................................................. 80
Table 4.2: List of antibodies and dilutions used for immunofluorescence. ............................ 81
Table 4.3: Antibodies in IMC panel and corresponding metal lanthanides. ........................... 91
Table 4.4: Example table from PlotIMC displaying 95th percentile predictive interval. ...... 108
Table 4.5: Example table demonstrating overlapping channels ............................................ 108
Table 4.6: Example output from plotIMC displaying a summary of descriptive statistics ... 112
Table 5.1: Patient information............................................................................................... 122
Table 5.2: Patient information............................................................................................... 123
Table 5.3: List of primary and secondary antibodies ............................................................ 124
Table 5.4: Immunofluorescent antibody combinations. ........................................................ 125
Table 5.5: Relationship of complexes in all patients and controls ........................................ 153
Table 5.6: z-scores vs 95% confidence interval .................................................................... 163
Table 6.1: Patient information............................................................................................... 175
Table 6.2: List of primary antibodies .................................................................................... 176
Table 6.3: List of secondary antibodies ................................................................................ 177
Table 6.4: Testing new antibodies using quadruple immunofluorescence ........................... 180
Table 6.5: Comparing antibodies that target mtDNA-encoded proteins with antibodies that
target nuclear-encoded proteins against the same complex. .................................................. 182
Table 6.6: Antibody rankings in muscle. .............................................................................. 187
Table 6.7: Antibodies and corresponding metal lanthanides in new mitochondrial panel .... 188
Table 6.8: tRNAs required for the translation of each mitochondrial gene. ......................... 209

1
Chapter 1 : Introduction

2
1.1 The origins of mitochondria
Mitochondria are highly dynamic, double-membraned organelles present in every nucleated
mammalian cell. Since their evolution, mitochondria have played a central role in many cellular
processes including adenosine triphosphate (ATP) production, iron-sulphur (Fe-S) cluster
formation, calcium handling, apoptosis and haem production (Duchen, 2004).
It is well known that mitochondria arose through an endosymbiotic relationship, however there
is much speculation as to how this origin happened. Two main theories have been proposed:
the first, known as the Archezoan hypotheses (Cavalier-Smith, 1987), postulates the capture of
an α-probacterial endosymbiont by a nucleated archezoa host, and is based on the small subunit
ribosomal RNA (rRNA) phylogenetic tree (Yang et al., 1985); the second, known as the
symbiogenesis hypotheses, suggests an endosymbiotic event took place before the diversion of
eukaryotes from prokaryotes which resulted in subsequent diversion and development of a
nucleus to form the eukaryotic cell (Martin and Müller, 1998). Of these, it is the Archezoan
hypothesis which is considered by most to explain the endosymbiotic origin of mitochondria
(Roger et al., 2017).
1.2 Mitochondrial structure
The structure of a mitochondrion was first explained by Palade (1953) who, using electron
microscopy, recognised a characteristic structural pattern in all mitochondria irrespective of
species or cell type. The mitochondria comprise of two membrane systems (the outer and the
inner membrane), a relatively homogenous and structureless material known as the matrix, and
a system of internal cristae. Palade described the outer mitochondrial membrane (OMM)
enclosing the intermembrane space, and the inner mitochondrial membrane (IMM) enclosing
the matrix. A schematic representation of the mitochondrial structure can be found in Figure
1.1.
The ‘baffle’ model of cristae structure (Palade, 1953) suggested the cristae were formed by
random folds of the IMM, however more advanced microscopy has offered proof against this
theory and provided evidence that the cristae are formed by invaginations of the membrane
which originate at tubular segments known as the cristae junctions (Perkins et al., 1997).

3
Figure 1.1: Schematic representation of mitochondrial structure and organisation.
The double membrane is pivotal for the regulated transport of metabolites and ions both into
and out of the mitochondria. The OMM is relatively porous and is freely traversed by ions and
small, uncharged molecules through pore-forming membrane proteins such as the voltage-
dependant anion channel (VDAC). Other proteins housed on the OMM include protein
transporters such as translocase of the outer mitochondrial membrane (TOMM). Due to its
porosity, there is no membrane potential across the OMM.
The IMM encloses the matrix space and can be subdivided into two distinct domains: the inner
boundary membrane (IBM) and the cristae membrane (CM), with crista junctions connecting
the two. The IBM is situated close to the OMM and is considered a second envelope structure
– interacting heavily with the OMM whilst the CM forms the majority of the IMM surface –
and is rich in proteins that are responsible for a range of processes such as oxidative
phosphorylation, protein transport and protein synthesis (Vogel et al., 2006). In contrast to the
OMM, the IMM is less permeable, and even small solutes such as ions and metabolic substrates
cannot pass through without the assistance of specific transport proteins such as inner
mitochondrial membrane translocases (TIMM)(Kulawiak et al., 2013). With a protein/lipid
ratio of ~ 75:25 (Claypool, 2009), the IMM is relatively rich in protein and harbours the
complexes of the respiratory chain as well as the protein translocases required for the import of
precursor proteins (Bauer et al., 2000).
The mitochondrial matrix contains the mitochondrial genome (mtDNA) along with the
machinery required for transcription and translation. In addition, the matrix is the location of
many biochemical processes such as the TCA cycle, β-oxidation and Fe-S formation.

4
1.3 Mitochondrial dynamics
Although initially depicted in the literature as bean-shaped organelles, it is now well known
that mitochondria have highly dynamic structures with the ability to change both shape and
location inside a cell (Bereiter-Hahn and Vöth, 1994). Furthermore, mitochondria may either
fuse together, helping to mitigate stress by mixing the contents of partially damaged
mitochondria, or separate into two different entities to assist with the selective removal of
damaged mitochondria. These two processes, termed fusion and fission respectively, play a
critical role in maintaining mitochondrial function and are mediated by GTPases in the dynamin
family (Youle and van der Bliek, 2012).
1.3.1 Fission
Fission is the process by which one mitochondrion divides to form two separate mitochondria,
and is mediated primarily by the cystolic Dynamin related protein 1 (Drp1) (Bleazard et al.,
1999, Smirnova et al., 2001) (Figure 1.2). Once recruited from the cytoplasm, Drp1 forms
spirals around mitochondria and, with the further binding and hydrolysis of GTP promoting a
conformational change in Drp1, results in the constriction and severing of both inner and outer
membranes (Mears et al., 2011, Youle and van der Bliek, 2012). The importance of Drp1 in
fission has been supported by many studies and it has been found that loss of this protein can
induce both highly connected networks of mitochondria (Smirnova et al., 2001) and increased
fusion (Lee et al., 2004).
Other membrane proteins associated with fission and thought to play a role in Drp1 recruitment
include mitochondrial fission protein (Fis1), Mitochondrial fission factor (Mff), MiD49 and
MiD51 (Richter et al., 2015). Recent work has also suggested that the endoplasmic reticulum
(ER) has a role in DRP1 recruitment. Studies have shown that the ER wraps around
mitochondria to form mitochondria-ER contacts, initiating mitochondrial constriction at contact
sites before recruitment of Drp1 (Friedman et al., 2011).

5
Figure 1.2: Mitochondrial Fission. Schematic diagram representing mitochondrial fission and demonstrating the localisation of Dynamin related protein 1 (Drp1) and mitochondrial fission 1 protein (Fis1).

6
1.3.2 Fusion
Mitochondrial fusion (Figure 1.3) is the process whereby two mitochondria merge to form a
single mitochondrion. Mitochondrial fusion is controlled, in a double membrane fusion event,
by a number of dynamin-related proteins (DRPs) with GTPase activity. Fusion of the OMM is
regulated by the mitofusin proteins 1 and 2 (Mfn1 and Mfn2), both of which contain two 4,3
hydrophobic heptad repeats (HR1 and HR2) (Koshiba et al., 2004). It has been posited that the
HR2 domain dimerises with another HR2 domain to form a long, antiparallel coil which
functions as a tether between adjacent mitochondria before membrane fusion occurs (Formosa
and Ryan, 2016).
IMM fusion is governed by another DRP called optic atrophy 1 (Opa1), which is localised in
the inner membrane and intermembrane space (Meeusen et al., 2006). Opa1 exists as two
isoforms – one is a long, membrane-anchored isoform (l-Opa1) which protrudes into the IMS
and promotes tethering of the two IMM from fusing mitochondria, whilst the other is a short
isoform (s-Opa1). A combination of both long and short Opa1 isoforms are required for
effective fusion (Mishra et al., 2014, DeVay et al., 2009).
Figure 1.3: Mitochondrial Fusion. Schematic diagram representing mitochondrial fusion. Opa1 coordinates the fusion of the IMM and MFN1/2 coordinates the fusion of the OMM.

7
1.4 Oxidative phosphorylation and ATP production
Mitochondria are key in oxidative metabolism and primarily function to produce cellular energy
in the form of adenosine triphosphate (ATP). The generation of this ATP relies on three major
respiratory pathways: anaerobic glycolysis; the tricarboxylic acid (TCA) cycle; and
mitochondrial electron transport, via the electron transport chain.
1.4.1 Glycolysis and the TCA cycle
The anaerobic process of glycolysis takes place in the cytoplasm and is responsible for the
metabolism of glucose to produce two molecules of pyruvate alongside the net production of
two ATP molecules (Equation 1.1). The pathway is comprised of two stages: stage one begins
with the conversion of glucose to fructose-1,6-bisphosphate, which is then further cleaved into
three carbon fragments (there is no ATP generation in this stage); stage two harvests ATP by
the oxidisation of the three carbon fragments to pyruvate. During stage two, NAD+ is reduced
to NADH. Since limited amounts of NAD+ exist in the body, the final stage is to regenerate
NAD+ through pyruvate metabolism (Berg et al., 2015a).
Glucose + 2 Pi + 2 ADP + 2 NAD+ → 2 pyruvate + 2 ATP + 2 NADH + 2 H+ + 2 H2O Equation 1.1: Glycolysis reaction (Berg et al., 2015a).
The TCA cycle, which takes place in the mitochondrial matrix, is responsible for the aerobic
processing of glucose and functions to harvest electrons which can be used by the electron
transport chain in the production of ATP. Under aerobic conditions the pyruvate generated by
glycolysis is oxidatively decarboxylated to form acetyl coenzyme A, which subsequently feeds
into the TCA cycle. After a series of oxidation and reduction reactions, the production of one
ATP molecule and two molecules of CO2 generates electrons that can be used in the electron
transport chain to power the synthesis of ATP (Equation 1.2) (Berg et al., 2015b).
Acetyl-CoA + 3 NAD+ + FAD + ADP + Pi + 2 H2O → 2 CO2 + 3 NADH + FADH2 + ATP + 2 H+ + CoA Equation 1.2: Net reaction of the TCA cycle (Berg et al., 2015b).

8
1.4.2 Oxidative phosphorylation
Oxidative phosphorylation (OXPHOS) comprises the mitochondrial respiratory chain
complexes (complexes I-IV) and ATP synthase (complex V) (Figure 1.4), embedded in the
inner mitochondrial membrane. Complex I catalyses the first step of OXPHOS and accepts
electrons derived from NADH, with complex II accepting electrons derived from FADH2.
Subsequently, these are transferred along the chain to complex III via coenzyme Q and to
complex IV through cytochrome c. The transfer of these electrons, coupled with the active
pumping of protons from complexes I, III and IV into the intermembrane space, produces a
chemiosmotic gradient which results in the flow of electrons back through ATP synthase,
generating the energy required to drive ATP production (Mitchell, 1961).

9
Figure 1.4: Oxidative phosphorylation. The inner mitochondrial membrane housing complexes I-V. The transfer of electrons through complexes I-IV is coupled
with the pumping of protons from the matrix to the intermembrane space. This creates an electrochemical gradient which causes protons to flow back through
complex V to convert ADP to ATP.

10
1.4.3 Complex I
Complex I, also known as NADH dehydrogenase, is the major entry point for electrons and,
with a molecular mass of ~1000kDa, it is the largest of the five enzyme complexes. It consists
of 45 subunits (Carroll et al., 2006) – of which, seven are encoded by the mtDNA (ND1-ND6
and ND4L) and 38 are nuclear-encoded.
When fully assembled, complex I forms an L shape with a hydrophobic arm embedded in the
IMM and a hydrophilic peripheral arm protruding into the matrix (Hunte et al., 2010).
Schematically represented in Figure 1.5, the complex presents three functional modules: the
N-module, the Q-module and the P-module (Zickermann et al., 2015). The N-module, located
in the matrix arm, contains the NADH oxidation site and transfers electrons from NADH to a
flavin mononucleotide (FMN) to produce FMNH2. The resultant electrons are transferred to Q,
which is also located in the matrix arm, via a chain of Fe-S clusters. The Q-module contains the
ubiquinone reduction site and is responsible for reducing ubiquinone to ubiquinol. The final P-
module, which is embedded in the IMM, holds all the proton pumping machinery necessary for
electrons to move through the complex and contains all of the seven mtDNA encoded subunits
(Mimaki et al., 2012). The overall reaction catalysed by complex I is presented in Equation
1.3.
NADH + Q + 5[H+]matrix → NAD+ + QH2 + 4[H+]cytoplasm Equation 1.3: Complex I reaction (Berg et al., 2015c).

11
Figure 1.5: Complex I. Schematic diagram of the complex I structure. The reduction of NADH allows
electrons to be donated to FMN, passed along a chain of Fe-S clusters, and transferred to ubiquinone
(Q). This shuttling of electrons is coupled to the transfer of a proton from the matrix to the
intermembrane space.
Using a recently developed complexome profiling approach, Guerrero-Castillo et al. (2017)
successfully studied the assembly of complex I and were able to demonstrate a step wise
approach (Figure 1.6). The 45 subunits come together in a regulated fashion with accessory
subunits binding peripherally to the conserved core forming a protective cage-like structure
around it (Formosa et al., 2018).

12
Figure 1.6: Complex I assembly. Schematic diagram showing the assembly of complex I. Image taken from Signes and Fernandez-Vizarra (2018).

13
1.4.4 Complex II
Complex II (succinate dehydrogenase) is the smallest complex of the OXPHOS system
(~123kDa) and is the only complex to be solely encoded by the nuclear genome. The complex
has a duel role: in the Krebs cycle it catalyses the oxidation of succinate to fumarate, generating
FADH2 in the process; within the ETC it transfers electrons from FADH2 to ubiquinone, which
is subsequently reduced to ubiquinol (Cecchini, 2003). The complex consists of four subunits:
SDHA and SDHB are located in the matrix and form the catalytic core, whilst SDHC and
SDHD are embedded in the IMM and anchor the complex to the membrane (Rutter et al., 2010).
A schematic diagram and overall reaction of complex II are presented in Figure 1.7 and
Equation 1.4 respectively. The assembly of complex II is shown in Figure 1.8.
Figure 1.7: Complex II. Schematic diagram of complex II, which is the second point of entry for
electrons. Electrons are passed from succinate to FAD following the oxidation of succinate. Electrons
are then shuttled along Fe-S clusters to ubiquinone (Q).
Succinate + FAD + 2[H+] + Q → Fumarate + FADH2 + Q → Fumarate + FAD + QH2 Equation 1.4: Complex II reaction (Berg et al., 2015a, Berg et al., 2015c) .

14
Figure 1.8: Complex II assembly. Schematic diagram showing the assembly of complex II. Image taken from Signes and Fernandez-Vizarra (2018).

15
1.4.5 Complex III
Complex III (cytochrome c reductase) was first isolated from bovine heart mitochondria in 1961
(Hatefi, 1976). Schematically presented in Figure 1.9, complex III consists of 11 subunits, of
which only one, cytochrome b, is encoded by the mitochondrial genome (Bénit et al., 2009).
The reaction in complex III is a two-step process: first, ubiquinol is oxidised to ubiquinone,
with the release of each electron reducing cytochrome c. This process is coupled with the
translocation of two protons into the intermembrane space which contributes to the proton
motive force (Equation 1.5). The assembly of complex III is shown in Figure 1.10.
Figure 1.9: Complex III. Schematic of complex III showing the transfer of electrons from ubiquinol
(QH2) to ubiquinone (Q) and cytochrome c. The shuttling of electrons is coupled with the translocation
of protons from the matrix to the intermembrane space.
2[QH2] + Q + 2[Cyt c]ox + 2[H+]matrix → 2[Q] + QH2 2[Cyt c]red +[4H+]cytoplasm
Equation 1.5: Complex III reaction (Berg et al., 2015c).

16
Figure 1.10: Complex III assembly. Schematic diagram showing the assembly of complex III. Image taken from Signes and Fernandez-Vizarra (2018).

17
1.4.6 Complex IV
Complex IV, also known as cytochrome c oxidase (COX), is the terminal complex of the
electron transport chain and is responsible for catalysing the reduction of oxygen to water (Li
et al., 2006). The complex (Figure 1.11) comprises 13 subunits, of which three (MTCO1,
MTCO2 and MTCO3) are encoded by the mtDNA and form the functional core of the enzyme.
The assembly of complex IV is shown in Figure 1.12. The complex acts as a dimer
(Shoubridge, 2001) and mediates the transfer of electrons (through various prosthetic groups)
from reduced cytochrome c to molecular oxygen. This oxygen is further reduced to water and
is coupled with the translocation of four protons into the intermembrane space (Equation 1.6)
(Diaz, 2010).
4[Cyt c]red + O2 + 8[H+]matrix → 4[Cyt c]ox + 2H2O + 4[H+]cytoplasm
Equation 1.6: Complex IV reaction (Berg et al., 2015c).
Figure 1.11: Complex IV: Schematic diagram of complex IV demonstrating the transfer of electrons
from cytochrome c through haem groups and copper centres. This transfer of electrons is coupled with
the translocation of protons from the matrix to the intermembrane space.

18
Figure 1.12: Complex IV assembly. Schematic diagram showing the assembly of complex IV. Image taken from Signes and Fernandez-Vizarra (2018).

19
1.4.7 Complex V
Complex V, or ATP synthase, is the final subunit in the OXPHOS system and synthesises ATP
from ADP in the matrix by utilising the energy provided by the proton electrochemical gradient
(Nijtmans et al., 1995). The structure consists of two domains; F0 is located in the inner
mitochondrial membrane, whilst F1 is situated in the mitochondrial matrix (Figure 1.13). The
assembly of complex V is shown in Figure 1.14. The F0 contains subunits a, b, c, d, F6 and
OSCP as well as the accessory subunits e, f, g and A6L which are organised into a ring structure
to form a proton channel allowing the movement of protons across the IMS to the matrix.
Subunits a and A6L are the only subunits to be encoded by mitochondrial genes, ATP6 and
ATP8 respectively (Anderson et al., 1981). F1 is the catalytic unit of complex V and is
comprised of five polypeptide chains – three α, three β, γ, δ and ϵ – which constitute the central
stalk of the complex (γ and δ) connecting both regions together, as well as a hexameric ring
structure to catalyse the synthesis of ATP (α3 β3) (Devenish et al., 2008, Jonckheere et al.,
2012). A proton motive force across the inner membrane drives the c ring rotor, causing
conformational changes in the F1 domain. This turning generates the energy required to
phosphorylate ADP and release ATP, resulting in ATP generation.
Figure 1.13: Complex V. Schematic diagram of complex V (or ATP synthase) showing the structural
subunits that comprise the F0 and F1 sections. Powered by the transport of protons from the
intermembrane space, through the complex, into the matrix, ATP synthase catalyses the synthesis of
ATP from ADP and an inorganic phosphate.

20
Figure 1.14: Complex V assembly. Schematic diagram showing the assembly of complex V. Image taken from Signes and Fernandez-Vizarra (2018).

21
Through the use of electron cryotomography, it has been shown that ATP synthase is arranged
in long rows of dimeric supercomplexes along the tip of the mitochondrial cristae, enforcing a
tight curvature of the structure (Davies et al., 2012). It is thought that this morphology at the
apex of the structure holds a high charge density and therefore has a higher proton-motive force,
pivotal for ATP synthesis (Strauss et al., 2008).
1.4.8 Supercomplexes
It has been demonstrated that respiratory chain complexes can assemble into larger structures
known as supercomplexes, which are believed to improve complex stability and lead to more
efficient substrate channelling. Using BN-page, Schägger et al found that almost all of complex
I associates with complexes III and IV in the stoichiometry I1III2IV1 to form a model known as
the ‘respirasome’ (Schägger and Pfeiffer, 2000, Schagger, 2002). Other supercomplexes have
also been assigned the stoichiometries III2IV1, I1III2 and I2III2IV1-2, known as the respiratory
megacomplex (Guo et al., 2017). The association of individual complexes into supercomplexes
is now well established but their functional role is still undetermined (Acin-Perez and Enriquez,
2014, Milenkovic et al., 2017). Despite this unclear function, it has been hypothesised that the
formation of supercomplexes maximises the efficiency of electron flux across the respiratory
chain (Schägger and Pfeiffer, 2000), and this is supported by experimental evidence
demonstrating that complex I in the stoichiometry I+III2 has half the activity of that in
I+III2+IV1 (Schäfer et al., 2006). Furthermore, it is believed that the formation of
supercomplexes improves the stability of individual components within complexes – complex
I in particular (Schägger et al., 2004) – and also plays a role in the modulation of ROS
production (Maranzana et al., 2013).

22
1.5 Other functions of the mitochondria
Mitochondria are commonly referred to as the “powerhouse of the cell”, however they have
many other functions besides ATP production pivotal to cell survival, including calcium
handling, iron-sulphur cluster formation, ROS production and their role in apoptotic signalling.
1.4.9 Calcium handling
The importance of calcium (Ca2+) in the regulation of many key cellular processes such as
muscle contraction and glycogen breakdown has long been recognised, and as such, the
regulation of calcium is essential. The relationship between mitochondria and calcium was first
discovered in 1961 when Deluca and Engstrom (1961) demonstrated that mitochondria were
able to rapidly take up large quantities of calcium when exposed to Ca2+ pulses. The
mitochondrial uptake of calcium is dependent on the mitochondrial Ca2+ uniporter (MCU),
found on the IMM, alongside an intact mitochondrial membrane potential (Kirichok et al., 2004,
De Stefani et al., 2011). Calcium efflux has been shown to be regulated by two major
transporters, the 2H+/ Ca2+ antiporter and the 3(or 4) Na+/ Ca2+ exchanger, with the latter being
most dominant in excitable tissues (Palty et al., 2010).
Calcium is crucial for muscle contraction; following an action potential which results in
membrane depolarisation and an influx of Ca2+, acetylcholine (ACh) vesicles come into contact
with the membrane and ACh is released into the synaptic cleft where it binds to ACh receptors.
This binding results in depolarisation of the muscle fibre sarcolemma and propagation of an
action potential from the neuromuscular junction (NMJ) outwards, causing the sarcoplasmic
reticulum (SR) to release calcium. The calcium ions bind to troponin (the actin filament
regulatory protein) which releases the inhibition on actin, permitting an interaction between
actin and myosin filaments and resulting in the formation of actin-myosin cross bridging and a
subsequent muscle contraction (Lieber, 2010).
1.4.10 Fe-S cluster formation
Fe-S clusters are involved in many catalytic processes and are particularly fundamental for
OXPHOS. Using an ability to switch between oxidative states +2 and +3, Fe-S clusters can act
as electron donors and acceptors, thus performing a large role in the transfer of electrons along
the respiratory chain (Beinert et al., 1997). Aside from electron transfer, Fe-S clusters are also
involved in binding activation of substrates and stabilisation of radicals (Staples et al., 1996),

23
and play a central role in metabolic catalysis and the sensing of iron and oxygen levels (Beinert
et al., 1997, Cammack, 1992, Muhlenhoff et al., 2002, Lill, 2009).
1.4.11 Reactive oxygen species (ROS) production
Reactive oxygen species are a chemically reactive species that are formed upon the incomplete
reduction of oxygen to generate a number of toxic products, such as the superoxide anion (O2-
), hydrogen peroxide (H2O2) and the hydroxyl radical (HO) (Harman, 1956). Although these
species have the capacity to cause damage to cellular macromolecules such as lipids, proteins
and DNA, they also play important roles in cell signalling (Droge, 2002). Regulation of ROS
are important in a variety of physiological systems such as differentiation, immunity, autophagy
and metabolic adaption (Sena and Chandel, 2012).
1.4.12 Apoptotic signalling
Apoptosis, or programmed cell death, was first described by Kerr et al. (1972) as a process
critical for tissue homeostasis and, since then, it has been shown that mitochondria have a
significant role in the control of this process (Hockenbery et al., 1990). There are two major
pathways associated with apoptosis: the extrinsic pathway, also known as the death receptor-
dependant pathway, is activated from outside the cell by death receptors of the tumour necrosis
factor (TNF) receptor superfamily; the intrinsic pathway, also known as the mitochondrial
pathway – named due to the essential involvement of the mitochondria (Wang and Youle, 2009)
– is stimulated in response to death stimuli such as DNA damage, radiation and hypoxia. These
stimuli cause changes to the inner mitochondrial membrane that results in the opening of the
mitochondrial permeability transition pore (MPTP) and loss of membrane potential. This loss
of membrane potential causes a downstream signalling cascade and the release of proapoptotic
proteins, eventually leading to cell death (Elmore, 2007). Regulation of the intrinsic pathway is
via the BCL-2 family of proteins, which include both the pro-apoptotic Bax and Bak, and the
anti-apoptotic Bcl-2 (Cory and Adams, 2002, Riley et al., 2018).
24
1.6 Mitochondrial turnover
1.6.1 Mitochondrial biogenesis
Biogenesis is defined as the growth and division of pre-existing mitochondria and is tightly
regulated to cater for cell-specific energy requirements. Central to the process is peroxisome
proliferator-activated receptor gamma (PPARγ) coactivator 1-alpha (PGC1α), a co-
transcriptional regulation factor that activates a number of different transcription factors
including nuclear respiratory factor-1 (NRF-1), oestrogen related receptor alpha (ERRα) and
peroxisome proliferator-activated receptor alpha (PPARα) (Wu et al., 1999). The activation of
these factors promotes the expression of mitochondrial transcription factor A (TFAM), driving
transcription and replication of mtDNA (Virbasius and Scarpulla, 1994).
1.6.2 Mitophagy
Mitophagy is the selective degradation of damaged mitochondria and is under the control of
two main proteins, PINK1 and Parkin. Under basal conditions, PINK1 is imported into the IMS
and is rapidly cleaved and degraded by presenilin-associated rhomboid-like protein (PARL)
(Jin et al., 2010). However, in dysfunctional mitochondria, where the membrane potential is
reduced, PINK1 is no longer imported and cleaved but instead accumulates on the OMM where
it recruits the E3 ubiquitin ligase Parkin (Lazarou et al., 2012). This leads to the ubiquitination
of a number of OMM proteins including MFN and VDAC1, which in turn recruit other proteins
to mitochondria to initiate mitophagy through the formation of an autophagosome (Tanaka et
al., 2010, Geisler et al., 2010, Narendra et al., 2008). In addition to the PINK1/Parkin pathway,
there have been several other mitophagy pathways described which occur under different
cellular conditions (reviewed by Palikaras et al. (2018)).

25
1.7 Mitochondrial genetics
1.7.1 Mitochondrial genome
Mitochondria are the only organelles that contain their own genome. Maternally inherited, the
mtDNA is a double-stranded molecule – measuring 16569bp – which encodes 37 genes: 13
OXPHOS subunits, 22 tRNAs and 2 rRNAs (Figure 1.15) (Anderson et al., 1981). The genome
contains a heavy and a light strand and is highly compact, with no introns present and only a
single non-coding region known as the displacement loop (D-loop) to which key transcriptional
machinery bind. It is also the site of origin for heavy strand replication (Shadel and Clayton,
1997).
The genome exists in numerous copies per cell, with the number of copies dependent on the
specific cell type and energy requirement of that cell or tissue. It is estimated that there are
approximately 3600 copies in skeletal muscle fibres (Miller et al., 2003). The mtDNA is
packaged into stable nucleoprotein structures known as nucleoids which are found in the
mitochondrial matrix (Satoh and Kuroiwa, 1991) and have a close association with the inner
mitochondrial membrane (Wang and Bogenhagen, 2006, Albring et al., 1977) .
Figure 1.15: Mitochondrial genome. The genome encodes 37 genes – 13 OXPHOS subunits (complex
I = orange, complex III = pink, complex IV = green, complex V = purple), 22 mt-tRNAs (blue) and 2
mt-rRNAs (grey). Origins of heavy (OH) and light (OL) strand are shown as well as the D-loop.

26
1.7.2 Mitochondrial DNA replication
Replication of mtDNA occurs independently of the cell cycle and is reliant on its own
replication machinery including ‘the minimal replisome’, consisting of the mitochondrial DNA
polymerase gamma (POLG), the DNA helicase twinkle, the single-stranded DNA-binding
protein (mtSSB) and the mitochondrial RNA polymerase (POLRMT) (Milenkovic et al., 2013,
Young and Copeland, 2016). At the core of the replication machinery, POLG is responsible for
the replication of the mtDNA while TWINKLE is the helicase that catalyses the 5’ to 3’
nucleotide triphosphate dependant unwinding of the double stranded mtDNA to single stranded
molecules. The homo-tetrameric mtSSB has a role in stabilising the singe stranded mtDNA and
POLRMT is responsible for synthesising RNA primers to initiate DNA synthesis of the heavy
strand.
A scientific consensus as to how mtDNA replicates is yet to be reached and thus several models
of replication exist (Figure 1.16). The first model, the ‘strand displacement’ model (SDM) (also
known as strand asynchronous replication), was first proposed by Clayton (1982). It suggests
that replication initiates within the D-loop at the origin of heavy strand synthesis (OH), and
proceeds unidirectionally for a distance of two-thirds around the circular genome until the
origin of light strand synthesis (OL) is exposed and light strand replication is initiated (Brown
et al., 2005). Because replication of the light strand lags behind that of the heavy strand, the
strands can also be termed lagging and leading strands.
The next model, the ‘strand coupled’ or ‘synchronous’ model of replication, was initially
proposed by Robberson et al. (1972) and further refined and supported by Holt et al. (2000) by
the use of two-dimensional agarose gel electrophoresis (2D AGE) leading to the discovery of
replication intermediates. The model suggests that replication is initiated at the zone of
replication (OriZ) and proceeds bidirectionally. The OriZ region is thought to encompass the
genes ND5, ND6 and CYB and is present at the same loci for both the leading and lagging
strands (Holt et al., 2000).
The use of 2D agarose gel electrophoresis (AGE) found that replication intermediates were
predominantly double stranded (Holt et al., 2000). Using purer preparations of mitochondria,
these were discovered to contain long stretches of RNA/DNA hybrids (Yang et al., 2002) which
led to the formation of the RNA incorporation throughout the lagging strand (RITOLS) model
(Holt and Reyes, 2012). According to this model, the leading H strand replicates as usual from
OH whereas the lagging strand replicates as short segments of RNA which then hybridise with
the leading strand and subsequently mature to DNA. The RITOLS model is similar to that of

27
the SDM; both initiate at the OH and include unidirectional replication. The main difference is
that the RITOLS model has the RNA incorporation.
Figure 1.16: Models of mtDNA replication. (a) strand-displacement model, (b) RNA incorporation throughout the lagging strand (RITOLS) model, (c) strand-coupled model. Image adapted from McKinney and Oliveira (2013).

28
1.7.3 Transcription
Transcription is the process by which information in a strand of DNA is copied into a molecule
of messenger RNA (mRNA), with transcription of mtDNA dependent on specialized, nuclear-
encoded transcriptional machinery. Transcription of the heavy-strand is initiated in the D-loop
at the heavy-strand promotor (HSP) at two specific sites (HSP1 and HSP2), while light-strand
transcription is initiated at the light-strand promotor. Transcription occurs bidirectionally and
produces polycistronic precursor RNA transcripts which encompass all of the genetic
information encoded in each individual strand. These transcripts are subsequently processed to
produce molecules of mRNA, rRNA and tRNA (reviewed in Falkenberg et al. (2007)).
Transcription is mediated by a number of key proteins: mitochondrial RNA polymerase
(POLRMT), mitochondrial transcription factor A (TFAM) and mitochondrial transcription
factor B2 (TFB2M). POLRMT cannot interact with promotor DNA and initiate transcription
without the assistance of both TFAM and TFB2M. Initially, TFAM binds specifically to a
region 10-15bp upstream of the HSP and LSP, causing unwinding of DNA as well as a
structural alteration in the promotor region. These TFAM-induced changes allow recruitment
of POLRMT to the promotors, where it binds to TFAM and recruits TFB2M thus completing
the transcription complex (Morozov et al., 2015) (Figure 1.17). Following recruitment of
TFB2M, the pre-initiation complex is converted to a transcription competent initiation complex
and the elongation step of transcription is executed. Transcription termination is mediated by
the protein mTERF which binds to a 28bp region in the tRNALeu(UUR) gene, resulting in
unwinding of the DNA molecule and base flipping to cause termination (Yakubovskaya et al.,
2010).
Figure 1.17: Transcription initiation. Transcription is initiated by the binding of TFAM upstream of the promotor region. This facilitates the binding of POLRMT which undergoes a conformational change to allow the binding of TFB2M, generating a fully assembled initiation complex.

29
1.7.4 Translation
Mitochondrial translation differs from cytosolic translation in that the ribosome that facilitates
the process is much smaller. Further to this, the process only requires 22tRNAs due to a
phenomenon known as the ‘wobble hypothesis’. The hypothesis proposes that one tRNA
molecule can recognise and bind to more than one codon due to non-Watson-Crick pairing
between the third base of the mRNA codon and the base at the first position on the tRNA
anticodon (Crick, 1966).
Translation of mitochondrial transcripts is dependent on nuclear-encoded regulatory proteins
and includes three phases: initiation, elongation and termination (Figure 1.18). The process of
translation is reviewed by Mai et al. (2017). Initiation of translation is dependent on two
initiation factors (IFs), IF3 and IF2 (Gaur et al., 2008). Starting the process, IF3 brings the
mRNA into contact with the mitochondrial small subunit (mt-SSU) by positioning the initiation
codons of the mRNA (AUG or AUA) at the peptidyl site of the mt-SSU, thus preventing the
premature association of the large subunit (mt-LSU) (Bhargava and Spremulli, 2005, Haque
and Spremulli, 2008). Following this, in the presence of GTP, IF2 directs the association of
fMet-tRNAMet with the mRNA to form the “mitochondrial monosome” and initiate transcription
(Ma and Spremulli, 1996, Kummer et al., 2018).
The elongation phase of translation is mediated by three mitochondrial elongation factors: EF-
Tu, EF-Ts and EF-G1. EF-Tu, together with GTP and a charged mt-tRNA, form a complex
which is directed towards, and enters, the aminoacyl (A) site. From here, provided the tRNA
base pairs with the mRNA at the codon:anticodon site, GTP is hydrolysed triggering the release
of EF-Tu as an EF-Tu:GDP complex. This allows the tRNA to move to the peptidyl (P) site
(Cai et al., 2000b) and the formation of a peptide bond in the peptidyl transferase centre in the
mt-LSU. The GTP:EFTu complex is re-established by EF-Ts, and the interaction of EF-G1
causes a conformational change that leads to the release of the deacetylated tRNA from the P
site as well as the translocation of the peptidyl-tRNAs from the A and P site to the P site and
exit (E) site (Cai et al., 2000a).
Termination of translation is initiated when a stop codon enters the A site of the mitoribosome
(Richter et al., 2010a). A number of release factors (RFs) have been associated with termination,
including mtRF1, mtRF1a, C12orf65 and ICT1 (Richter et al., 2010b). These factors recognise
the stop codons and promote hydrolysis of the ester bond between the mt-tRNA in the P site
and the polypeptide chain. Following this action, the mitoribosome is recycled by the action of
two ribosome recycling factors mtRRF-1 and mtEF-G2 (Tsuboi et al., 2009).

30
Figure 1.18: Mitochondrial translation. Translation is broken down into three phases: initiation, elongation and termination and recycling. Figure adapted from Mai et al. (2017).
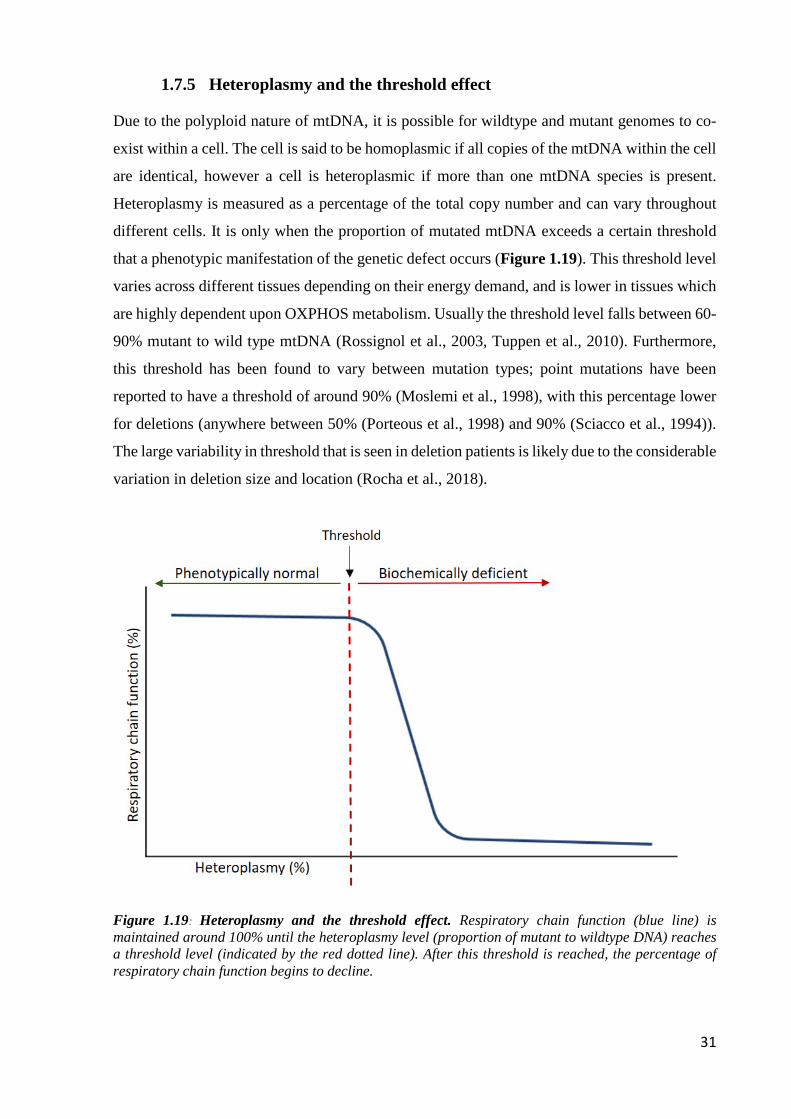
31
1.7.5 Heteroplasmy and the threshold effect
Due to the polyploid nature of mtDNA, it is possible for wildtype and mutant genomes to co-
exist within a cell. The cell is said to be homoplasmic if all copies of the mtDNA within the cell
are identical, however a cell is heteroplasmic if more than one mtDNA species is present.
Heteroplasmy is measured as a percentage of the total copy number and can vary throughout
different cells. It is only when the proportion of mutated mtDNA exceeds a certain threshold
that a phenotypic manifestation of the genetic defect occurs (Figure 1.19). This threshold level
varies across different tissues depending on their energy demand, and is lower in tissues which
are highly dependent upon OXPHOS metabolism. Usually the threshold level falls between 60-
90% mutant to wild type mtDNA (Rossignol et al., 2003, Tuppen et al., 2010). Furthermore,
this threshold has been found to vary between mutation types; point mutations have been
reported to have a threshold of around 90% (Moslemi et al., 1998), with this percentage lower
for deletions (anywhere between 50% (Porteous et al., 1998) and 90% (Sciacco et al., 1994)).
The large variability in threshold that is seen in deletion patients is likely due to the considerable
variation in deletion size and location (Rocha et al., 2018).
Figure 1.19: Heteroplasmy and the threshold effect. Respiratory chain function (blue line) is maintained around 100% until the heteroplasmy level (proportion of mutant to wildtype DNA) reaches a threshold level (indicated by the red dotted line). After this threshold is reached, the percentage of respiratory chain function begins to decline.

32
1.7.6 Maternal inheritance and the bottleneck
In contrast to the nuclear genome, mtDNA is exclusively maternally inherited (Giles et al.,
1980). Although there is some evidence of a paternal contribution of mtDNA in humans (Luo
et al., 2018, Schwartz and Vissing, 2002), this occurrence is rare and maternal inheritance is
still favoured. As a result, pathogenic variants in mtDNA are passed from mother to child but
with great variability in the heteroplasmy levels between individuals (Taylor and Turnbull,
2005), which is attributed to a phenomenon termed the genetic bottleneck. It is suggested that
the bottleneck occurs as a result of an initial reduction in mtDNA copy number during
embryonic development (Cree et al., 2008b), and that heteroplasmy levels in offspring are
determined by random genetic drift (defined as random fluctuations in numbers of gene variants
in a given population over time) occurring in early oogenesis (Jenuth et al., 1996, Brown et al.,
2001).
1.7.7 Clonal expansion
Clonal expansion is described as the process by which a single mtDNA species accumulates to
predominate within a single cell, but there have been a number of different hypotheses
describing the occurrence of this process.
Clonal expansion was initially hypothesised to be driven by a replicative advantage mechanism.
This model, also known as the ‘survival of the smallest’, assumed that smaller mtDNA
molecules carrying a deletion would replicate more quickly than wild-type mtDNA, thus
permitting mtDNA deletion accumulation (Wallace, 1989). However, this theory only explains
the accumulation of mtDNA deletions, and does not fit with the clonal expansion of point
mutations despite this mutation not significantly altering the size of mtDNA molecules.
Furthermore, Campbell et al. (2014) demonstrated that smaller mitochondrial genomes do not
appear to have any replicative advantage in human muscle. An alternative to this theory was
proposed by De Grey (1997), and termed the ‘clonal expansion by selective advantage’ model
or ‘survival of the sickest’. Here, it was suggested that mitochondria with reduced respiratory
function associated with mtDNA damage have reduced free radical production. As such, the
turnover of dysfunctional mitochondria is slower, allowing for the accumulation of mutant
mtDNA. This theory is not widely accepted however as it assumes that mtDNA mutations have
already undergone sufficient clonal expansion to cause a defect in the mitochondrial respiratory
chain.

33
A contrasting theory offered by Elson et al. (2001) suggested that selective advantage is not
necessary for clonal expansion of mutant mtDNA, and that relaxed replication of mtDNA alone
can lead, through random genetic drift, to clonal expansion of a single mtDNA mutation.
Although this is supported by mathematical models – that predict 4% of post-mitotic cells will
be COX-deficient over a span of 80 years – there is some dispute between predictions of COX-
deficiency and physiological observations; Kraytsberg et al. (2006) demonstrates 40% of
substantia nigra neurons COX-deficient at 80 years. Furthermore, random genetic drift assumes
free mixing of mtDNA which is unlikely to be true in muscle where a restriction of
mitochondrial movement is observed (Eisner et al., 2014).
An alternative theory by Kowald and Kirkwood (2014) proposes that it is the connection
between transcription and replication that drives clonal expansion and that transcription rate is
controlled by a negative feedback loop that deceases transcription if there is product in excess.
More recently, to overcome the limitations of previous models using cell populations and
invertebrate models, Vincent et al. (2018) studied muscle fibres from patients with
mitochondrial disease. They looked to address the question of how a single mtDNA mutation
proliferates and expands through post-mitotic cells during clonal expansion, and found that
skeletal muscle mtDNA rearrangements originate as a proliferative perinuclear niche and begin
as subsarcolemmal foci adjacent to the nuclei. Because of this, it has been suggested that the
perinuclear proximity may offer a proliferative advantage which could enable favourable
expansion of the mutated niche. These foci are also associated with increased protein content
and increased copy number, both of which are suggestive of mitochondrial biogenesis.
Furthermore, Vincent et al. (2018) also demonstrated that the spread of the deficiency favours
the transversely orientated mitochondria while propagating more slowly longitudinally along
the length of the myofibres.

34
1.8 Mitochondrial DNA mutations
Genetic defects associated with the human mitochondrial genome were first demonstrated in
1988 (Holt et al., 1988, Wallace et al., 1988), and since then, a vast number of mutations have
been identified and linked with disease. Studies evaluating adults in the North East of England
with suspected mitochondrial disease found the prevalence rate for mtDNA mutations to be 20
per 100,000 (Gorman et al., 2015). The clinical manifestation of mitochondrial disorders is very
heterogeneous and can involve multiple organ systems, particularly those with the highest
energetic demands such as the brain, heart and muscle.
1.8.1 Point mutations
Point mutations are described as a single base pair substitution and are present in the adult
population at a prevalence of 1 in 5000 (Gorman et al., 2015), with 50% reported in tRNA genes
(Schon et al., 2012). These mutations, which can either be maternally inherited or sporadic, are
hugely heterogeneous and cause a vast range of mitochondrial diseases (Figure 1.20). The most
common point mutations, and thus the most well characterised, are those occurring within the
mitochondrial tRNA leucine (m.3243A>G MT-TL1) and the mitochondrial tRNA lysine
(m.8344A>G MT-TK).
The m.3243A>G MT-TL1 mutation is the most prevalent point mutation and is the most
common cause of the mitochondrial encephalopathy, lactic acidosis and stroke-like episodes
(MELAS) phenotype, with 80% of MELAS patients harbouring this defect (Urata et al., 2004).
However, there is great phenotypic variability between m.3243A>G patients (Pickett et al.,
2018) and, aside from MELAS, other phenotypic traits are also displayed such as maternally-
inherited diabetes and deafness (MIDD) and chronic progressive external ophthalmoplegia
(CPEO) (Nesbitt et al., 2013).
The m.8344A>G MT-TK mutation was first characterised in patients presenting with
myoclonic epilepsy and ragged red fibres (MERRF) (Shoffner et al., 1990), and the mutation
found in around 80% of MERRF patients. The minimum prevalence of this mutation is lower
than that of m.3243A>G (0.7/100,000) but similar to the m.3243A>G mutation; there is great
clinical variability between carriers of the same mutation. Patients can present with other
features such as ataxia, diabetes mellitus, optic atrophy, hearing loss and dementia (Mancuso
et al., 2013).

35
Figure 1.20: Point mutations associated with mitochondrial disease. Mutations span a wide range of the mitochondrial genome. Abbreviations: CPEO = chronic progressive external ophthalmoplegia; LHON = Leber’s hereditary optic neuropathy; LS = Leigh’s syndrome; MELAS = mitochondrial encephalopathy, lactic acidosis and stroke-like episodes; MERRF = myoclonic epilepsy and ragged red fibres; MIDD = maternally inherited diabetes and deafness; NARP = neuropathy, ataxia and retinitis pigmentosa; RC = respiratory chain. Image adapted from Tuppen et al. (2010).

36
1.8.2 Single, large-scale mtDNA deletions
Single, large-scale mtDNA deletions are a typical form of mtDNA rearrangement that are
thought to occur sporadically during early stages of development. The most commonly reported
deletion encompasses 4,977bp (Schon et al., 1989), but deletions can vary in size from 1.3 to
10 kb. Accounting for approximately 16% of adult mtDNA mutations and with a prevalence of
1.5/100,000, deletions are a common cause of mitochondrial disease (Gorman et al., 2015).
There are three main clinical syndromes associated with deletions: CPEO, Kearns-Sayre
syndrome (KSS) and Pearson syndrome (Magner et al., 2015). There have been reports of a
correlation between genotype of the deletion and the phenotype of patients, with Yamashita et
al. (2008) demonstrating a moderate correlation between the length of deletion and the age of
onset. Furthermore, in the patients examined, they found that KSS patients appeared to have
significantly longer deletions and more deleted tRNAs than patients with CPEO. These findings
have been confirmed by subsequent studies (López-Gallardo et al., 2009, Grady et al., 2014).
These studies have also demonstrated that deletions including the MT-CYB gene are related to
faster progression and a more severe phenotype.
More recently, Rocha et al. (2018) investigated the relationship between the genetic defect and
molecular phenotype in skeletal muscle of patients with single, large-scale mtDNA deletions,
and found that the pattern of deficiency differed based on size and location of the deletion.
Furthermore, they demonstrated that fibres with greater respiratory chain deficiency harboured
higher levels of the deletion.
1.8.3 Nuclear DNA mutations
Mitochondria are under dual control of both mtDNA and nuclear DNA (nDNA). Although
mtDNA encodes for 37 genes that are critical for protein synthesis, the remaining proteins that
are required for respiratory chain complex assembly, mtDNA replication, repair, transcription
and translation are encoded for by nuclear DNA (nDNA). Currently there are approximately
1100 nuclear genes encoding mitochondrial-localized proteins (Calvo et al., 2016). Therefore,
some mitochondrial diseases are caused by defects in nuclear genes which follow the mendelian
pattern of inheritance. Some of these will have a secondary effect on mtDNA, resulting in
deletions and mtDNA depletion causing a wide range of conditions (Ylikallio and Suomalainen,
2012). The first pathogenic mutation in a nuclear gene associated with mitochondrial disease
was identified by Bourgeron et al. (1995), who reported a mutation in a nuclear-encoded subunit
of succinate dehydrogenase (SDH) in siblings with complex II deficiency presenting with Leigh
syndrome. Those nuclear genes associated with mtDNA deletions encode proteins involved in

37
replication (POLG (Naviaux and Nguyen, 2005), TWNK (Hakonen et al., 2007)), biogenesis
(TFAM (Stiles et al., 2016)), mitochondrial maintenance (RRM2B (Fratter et al., 2011), TK2
(Tyynismaa et al., 2012)) and mitochondrial fusion (OPA1 (Amati-Bonneau et al., 2008) and
MFN2 (Rouzier et al., 2012)).
A recent review by Frazier et al. (2019) reports that, since 2012, an average of 22 nuclear genes
have been discovered per year and have been linked to mitochondrial diseases, totalling 254
identified involved nuclear genes as of 2017. These genes can be further grouped into a number
of different categories: (1) OXPHOS subunits, assembly factors and electron carriers, (2)
mtDNA maintenance, (3) mtDNA expression, (4) Enzyme cofactors, (5) Mitochondrial
homeostasis and quality control and (6) General metabolism. A full list of known nuclear genes
linked to mitochondrial disorders can be found in Table 1.1.

38
Table 1.1: Nuclear genes linked to mitochondrial disorders. Table adapted from Frazier et al. (2019).

39
1.9 Skeletal muscle
1.9.1 Skeletal muscle structure
Skeletal muscle is a highly structured tissue organised into a hierarchical formation. It is
comprised of individual myofibres which themselves consist of myofibrils arranged in parallel.
The myofibres are bundled together into ‘fascicles’ which are held together by a type of
connective tissue known as the perimysium. Each myofibril comprises many repeating
contractile units called sarcomeres, which in turn are made up of thin and thick contractile
myofilaments called actin and myosin respectively (Figure 1.21) (Lieber, 2010).
Figure 1.21: Skeletal muscle structure. Image taken and adapted from van der Made et al. (2017) with permission.

40
1.9.2 Muscle fibre types
In humans, muscle fibres can be grouped into different classes depending on differences in
morphological, contractile and metabolic properties (Lieber, 2010). Type I fibres, also known
as slow twitch fibres, present a high oxidative capacity and have a high mitochondrial content,
but require less ATP and generate less power due to their slow contraction rate. Type II fibres
can be further subdivided into two groups: type IIa, or fast oxidative glycolytic fibres, are an
intermediate between type I and IIx and have a high mitochondrial content as well as high ATP
consumption and a fast contraction rate; type IIx fibres are also fast glycolytic fibres with a high
ATP consumption and fast contraction rate, but have a lower mitochondrial content and are thus
sensitive to fatigue (Lieber, 2010). There is evidence that fibre type properties are modulated
by electronic stimulations from motor neurons, with higher frequencies inducing faster
contracting fibres and lower frequencies inducing slower contracting fibres (Buller et al., 1960).
Skeletal muscle is a heterogeneous tissue and displays variable proportions of each fibre type
which are highly versatile and can shift in response to a number of different factors. This
plasticity in response to stimuli allows for adaption to a number different functional demands
(Pette and Staron, 1997) such as inactivity (Grossman et al., 1998) and age (Lexell, 1995).
1.9.3 Skeletal muscle mitochondria
Skeletal muscle mitochondria can be found in two subcellular populations; 80% are classified
as intermyofibrillar (IMF) mitochondria whilst 20% are classified as the subsarcolemmal (SS)
mitochondria – both are compositionally and biochemically different to each other (Ferreira et
al., 2010). IMF mitochondria are located between the myofibrils, form a rigid lattice structure
and display a distinctly higher mitochondrial inner membrane and matrix enzyme activity to
that of SS mitochondria, which are located just beneath the sarcolemma and are usually found
in small perinuclear clusters (Cogswell et al., 1993, Milner et al., 2000, Alessandro et al., 2005).
Furthermore, studies show that IMF mitochondria are more susceptible to apoptotic stimuli
such as H2O2 and release a greater level of some apoptotic proteins; Cytochrome c levels are 3-
fold greater in IMF compared to SS mitochondria (Peter et al., 2005).

41
1.10 Skeletal muscle in mitochondrial diseases
Although mitochondrial diseases are a clinically heterogeneous group of disorders (Gorman et
al., 2016), muscle is commonly affected. It is thought that this is due to muscle having a high
metabolic demand, thus making it more sensitive to deficiencies of mitochondrial energy
production than other tissues (Larsson and Oldfors, 2001). Skeletal muscle is affected primarily
by defects in respiratory chain function, however this can theoretically give rise to any
symptom, in any tissue and at any age (Munnich et al., 1996).
Due to the clinical and genetic heterogeneity exhibited by mitochondrial myopathies, disease
diagnosis is challenging. However, the introduction of genetic techniques such as next
generation sequencing (NGS) has revolutionised the way in which these diseases are
investigated, and has made the process more simple and less time consuming. The increasing
application of NGS to mitochondrial disease diagnostics has led to an increase in the diagnostic
prevalence of these disorders, from 10-20% pre-NGS to more than 50% in some cohorts post-
NGS (reviewed by Rahman and Rahman (2018)). Although NGS is dominating the
investigative process, in order to gain a greater understanding of the genetic defects a stepwise,
multidisciplinary approach is still needed (McFarland et al., 2010).
Histochemical analysis of skeletal muscle biopsies is still a widely-used diagnostic screen for
detecting mitochondrial abnormalities. One method, the Gomori trichrome stain, shows the
subsarcolemmal regions of mitochondria, which selectively uptake the red component of the
stain. A pathological accumulation of these regions are recognised as a ‘ragged red fibre’ (RRF)
and are often found in many mitochondrial myopathies (Engel and Cunningham, 1963).
Although this technique is still in use, finding methods that assess mitochondrial involvement
by looking at specific mitochondrial enzymes is much more valuable. COX/SDH dual
histochemistry (Old and Johnson, 1989) is a technique that highlights a mosaic pattern of COX
deficiency in fibres by the sequential reaction demonstrating the reactivity of the complex IV
protein COX (producing a brown precipitate) and the complex II protein SDH (producing a
blue precipitate). When COX is absent, due to the lack of brown precipitate, the fibres appear
blue. Although this allows the categorisation of fibres into COX-positive, intermediate or COX-
negative, only complex IV deficiency is evaluated, and so any deficiency in other OXPHOS
complexes such as complex I, III and V cannot be detected.
Nitrotetrazolium blue exclusion (NBTx) is another enzyme histochemical assay that can be
used as an alternative to COX/SDH (Simard et al., 2018). It allows for the direct visualisation
of respiratory-deficient cells by the catalysis of formazin where COX activity is dysfunctional.

42
Because formazin is only catalysed in COX-dysfunctional cells, the advantage of the NBTx
assay is that COX-deficiency can be measured unambiguously. This is in contrast to COX/SDH,
where a reduction in the predicted COX activity is measured (Simard et al., 2018). However,
similar to COX/SDH, deficiency in other respiratory chain complexes will be overlooked.
This issue is addressed by an immunofluorescent technique that quantifies the levels of complex
I and IV together with a marker for mitochondrial mass (Rocha et al., 2015) (discussed further
in section 4.1.1.2). To complement histochemical analysis of patient muscle, biochemical
assessments can be carried out to determine the activity of individual respiratory chain enzyme
complexes, which require fresh tissue homogenates (Taylor et al., 2004). Although the assays
can detect both isolated complex deficiencies and deficiencies in multiple complexes, they may
fail to detect more subtle deficiencies and require a significant amount of tissue (up to 10mg in
size). Further to histochemical and biochemical assessment, genetic tests are undertaken using
small amounts of DNA extracted from muscle homogenates. These include analysis of both
mtDNA, through techniques such as PCR and pyrosequencing, as well as nuclear DNA, through
Sanger and whole exome sequencing (McFarland et al., 2010).
43
1.11 Overall aims and objectives
Due to the increasing prevalence of sarcopenia and age-related conditions, there was a need to
explore the biology of ageing skeletal muscle. This project was designed to investigate the
following areas:
1) Understand what changes occur within skeletal muscle with both age and mitochondrial
myopathy
2) Understand the downstream consequences of mitochondrial respiratory chain deficiency
at the cellular level
Soon after this project started, there was an opportunity to adapt and develop imaging mass
cytometry (IMC) for novel use in skeletal muscle – a novel approach to understand changes
occurring with disease and age. For this reason, the research was refined to meet the following
aims:
1) Optimise mitochondrial markers that can be used with IMC to identify mitochondrial
deficiencies within skeletal muscle
2) Develop a workflow and analysis software (in collaboration with Dr Conor Lawless)
that successfully quantifies mitochondrial dysfunction in diseased and healthy aged
muscle
3) Use the IMC and developed software to identify and quantify mitochondrial dysfunction
in diseased and healthy aged muscle

44

45
Chapter 2 : Materials and methods

46
2.1 Materials
Equipment or Software Supplier
Axio Imager M1 microscope Carl Zeiss
Centrifuge Eppendorf
Cryostat (Cryo-star HM 560M) Microm International
Dry heat block Techne
Helios Imaging Mass Cytometer Fluidigm
MitoCyto In house Python based software
Nanodrop ND-1000 Spectrophotometer Labtech International
3510 pH meter Jenway
Prism v5.0 GraphPad Software Inc.
ImmunoAnalyser In house MatLab (mathworks) based
software
Vortex genie 2 Scientific Industries
Zen 2011 (blue edition) image capture software Carl Zeiss
Consumables Supplier
Aerosol resistant pipette tips Starlab
Coverslips (22x50mm) Merck
Eppendorf tubes (0.6ml, 1.5ml, 2.0ml) Starlab
Falcon tubes (5ml, 15ml, 50ml) BD Biosciences
Gilson pipette (P2, P10, P20, P100, P200, P1000) Anachem
Gloves Starlab
Pasteur pipettes VWR
Superfrost slides Merck
Weigh boats VWR
Whatman filter paper Fisher Scientific

47
Reagents: tissue preparation Supplier
Iso-pentane Merck
Liquid Nitrogen BOC
OCT cryo-embedding matrix Raymond Lamb
Reagents: immunohistochemistry Supplier
Avidin/biotin blocking kit Vector Laboratories
DPX BDH
Eosin Cell path
Ethanol Merck
Haematoxylin TCS Biosciences Ltd.
Histoclear National diagnostics
Hydrochloric acid VWR
Hydrophobic pen Sigma-Aldrich
Methanol Merck
Normal goats serum (NGS) Sigma-Aldrich
4% Paraformaldehyde (PFA) Santa Cruz Biotechnology
Phosphate Buffered Saline Sigma-Aldrich
Prolong gold mounting media Life Technologies
Sodium chloride (NaCl) Sigma-Aldrich
Trizma base Sigma-Aldrich
Tween-20 Sigma-Aldrich

48
Protein target Reagents: Primary antibodies Supplier
Complex I Mouse IgG1 NDUFB8 Abcam (Ab110242)
Complex I Mouse IgG2b NDUFA13 Abcam (Ab110240)
Complex II Mouse IgG1 SDHA Abcam (Ab14715)
Complex III Mouse IgG1 UqCRC2 Abcam (Ab14745)
Complex IV Mouse IgG2a MTCO1 Abcam (Ab14705)
Complex IV Mouse IgG2a COX4+4L2 Abcam (Ab110261)
Complex V Mouse IgG1 ATP5O Abcam (Ab230325)
Mitochondrial mass Mouse IgG2b VDAC1 Abcam (Ab14734)
Membrane marker Mouse IgG1 Dystrophin Merck (MAB1645)
Membrane marker Rabbit polyclonal IgG Laminin Sigma-Aldrich (L9393)
Reagents: Secondary antibodies Supplier
Anti-rabbit Alexa Fluor 405nm Life Technologies
Anti-mouse IgG Alexa Fluor 488nm Life Technologies
Anti-mouse IgG2a Alexa Fluor 488nm Life Technologies
Anti-mouse IgG2b Alexa Fluor 546nm Life Technologies
Anti-mouse IgG1 Alexa Fluor 647nm Life Technologies
Streptavidin Alexa Fluor 647nm Life Technologies
Anti-mouse IgG1 biotin Life Technologies
Solutions Recipe
Tris buffered saline with tween (TBST
pH 7.6) (concentrated 5x)
121 g Trizma Base
90 g NaCl
5 ml Tween
Concentrated HCl
Phosphate Buffered Saline (PBS) 1 tablet / 100mls dH2O

49
2.2 Methods
2.2.1 Ethics
Ethical approval for use of mitochondrial disease patient tissue was granted by the Newcastle
and North Tyneside Local Research Ethics Committee (reference 16NE/0267), and ethical
approval for the project was issued under the generic research tissue bank approval for the
Newcastle Mitochondrial Research Biobank (references 001, 004, 014 and 026). Control tissue
was acquired with prior informed consent from the distal part of the hamstring of people
undergoing anterior cruciate ligament (ACL) surgery, following approval by Newcastle
biobank (NAHPB reference: 042). More detailed information of patients and control cases can
be found in the relevant chapters.
2.2.2 Muscle biopsies
Patient muscle biopsies were taken from the vastus lateralis using the needle biopsy technique
whilst control tissue was acquired from the distal part of the hamstring of people undergoing
ACL surgeryTransversely orientated muscle blocks were snap-frozen in liquid nitrogen cooled
isopentane, frozen muscle was then mounted on Whatman filter paper using OCT cryo-
embedding matrix before cryosectioning.
2.2.3 Cryostat sections
10µm serial sections from transversely orientated muscle blocks were obtained using a cryostat
(Cryo-star HM 560M). Frozen muscle blocks were cut into sections at -20°C and collected onto
superfrost slides (Merck). Sections were then dried at room temperature (RT) for 1h and stored
at -80°C for subsequent use.
2.2.4 Haematoxylin and eosin
Tissue sections were removed from -80°C and air dried for 1h at RT. Slides were immersed in
haematoxylin for 1 minute and washed in water until the water turned clear. A small drop of
ammonia was added and the slides were rinsed again before immersion in eosin for 1 minute
and washed as before until the water turned clear. Sections were then rapidly dehydrated in an
ascending ethanol gradient (70%, 90%, 100%, 100%) and cleared in two washes of histoclear
before mounting in DPX medium.

50
2.2.5 Immunohistochemistry
Tissues were removed from -80°C and aired dried for 1h at RT prior to initiating the protocol.
Slides were labelled as either primary antibody or no primary control (NPC) and sections
encircled using a hydrophobic pen to prevent leakage of medium from each muscle section.
The sections were fixed in cold 4% paraformaldehyde (PFA) at RT for 3 minutes and washed
3 times with 1x TBST for 5 minutes. For permeabilisation of the cell membrane, sections were
dehydrated and rehydrated in a methanol gradient as follows: 70% (10 minutes), 95% (10
minutes), 100% (20 minutes), 95% (10 minutes), 70% (10 minutes), followed by 3 x 5 minute
washes in 1 x TBST. Subsequently, non-specific protein interactions were blocked by
incubation with 10% normal goat serum (NGS) for 1h at RT and endogenous biotin, a
component of many mitochondrial proteins, was blocked using an Avidin D/Biotin blocking kit
(Vector laboratories) when necessary. After 3 x 5 minute washes in 1 x TBST, sections were
either incubated with 100µl primary antibody cocktail or a corresponding NPC cocktail
overnight at 4°C. Both cocktails were made with 10% NGS and primary antibody dilutions
listed in Table 2.1. Sections were washed for 3 x 10 minutes in 1 x TBST and incubated with
a cocktail of diluted secondary antibodies (Table 2.2) at 4°C for 2h. Sections were washed for
3 x 5 minutes and if a streptavidin conjugated secondary antibody was being used, this was
added next and sections incubated for 2h at 4°C. Subsequently slides were washed for 3 x 10
minutes in 1 x TBST and mounted on a coverslip using Prolong Gold mounting medium (Life
Technologies).
Table 2.1: Primary antibody cocktails used for immunofluorescence.
Primary antibody cocktail NPC cocktail Complex I marker: NDUFB8 (dilution 1/100) Complex IV marker: MTCO1 (dilution 1/100)
Mitochondrial mass marker: VDAC1 (dilution 1/100) Fibre membrane marker: Laminin (dilution 1/50)
Laminin (dilution 1/50)
Table 2.2: Secondary antibody cocktail used for immunofluorescence.
Secondary antibody cocktail Anti-Rabbit-Alexa 405 (dilution 1/100) Anti-IgG2a-Alexa 488 (dilution 1/200) Anti-IgG2b-Alexa 546 (dilution 1/200)
Anti-IgG1- biotin (dilution 1/200) Streptavidin- Alexa 647 (dilution 1/100)
51
The antibodies to the mitochondrial proteins have been extensively validated. They were
originally developed by MitoSciences (now supplied by Abcam) and shown by the producers
to selectively immunocapture their target protein/complex. Further, this work and that of others
have shown that the reaction of the antibody in western blot, immunocytochemistry as well as
IF correlates well with the genetic loss of protein as determined spectrophotometrically and by
activity assays (Schilling et al., 2006, Willis et al., 2009).
2.2.6 Imaging
Fluorescent images were acquired at 20x magnification using a Zeiss Axio Imager M1 and Zen
2011 (blue edition) software using four filter cubes which allowed the detection of Alexa Fluor
dyes excited at 405 nm, 488 nm, 546 nm and 647 nm. Automated scanning of the muscle section
was conducted using a motorised stage and software tiling function. Exposure times were set
for each channel to avoid over exposure and to minimise background on no primary controls.
Exposure times were then maintained throughout each experiment for all cases and controls.
Following imaging, .zvi files were stitched to generate a .czi file which was then used for further
analysis.
2.2.7 Image analysis
The software used to analyse single muscle fibres was an in-house software called Quadruple
Immuno Analyser. This software is coded for by Matlab2015a and was designed by Dr John
Grady (Kinghorn Centre for Clinical Genomics Garvan Institute Sydney NSW Australia). The
software was used to quantify fluorescent intensity per fibre for each channel and the individual
fibres isolated using the membrane marker laminin as a template to create surfaces. Unwanted
areas were removed either by thresholding of the analysis or by manual removal.
2.2.8 Quantitative analysis of immunofluorescence
Data generated by analysis of quadruple immunofluorescence using Quadruple Immuno
Analyser was statistically analysed using an R-script written by Dr John Grady. The R-script
corrected for background in each channel by subtracting the average optical density (OD) for
each channel in the no primary control from the values generated from the sections that were
labelled with the primary antibodies. The background corrected values were then log
transformed to normalise data and the distribution of VDAC1 was assessed to ensure data was
normally distributed. Mean and standard deviation of the control population were acquired and
z-scores were determined for complex I, complex IV and VDAC1 based on the expected levels

52
of each, which was calculated using the levels of VDAC1 as a mitochondrial mass marker. z-
scores were generated for each individual fibre of both controls and patients for each channel.
Fibres were then classified based on their z-scores: Normal (z-score > -3SD), Intermediate (+)
(z-score between -3SD and -4.5SD), Intermediate (-) (z-score between -4.5SD and -6SD) and
Negative (z-score < -6SD). Similarly, fibres were group according to their VDAC1 levels: Very
low (<-3SD), low (between -3SD and -2SD), normal (between -2SD and +2SD), high (between
+2SD and +3SD) and very high (above +3SD). This is represented in the mitochondrial
respiratory chain (MRC) profiles. An example plot is shown in Figure 2.1.
Figure 2.1: Example MRC plot. Plots show complex I and complex IV expression. X and Y axis indicate levels of NDUFB8 and MTCO1 respectively. Each dot represents an individual muscle fibre and is colour coded according to levels of mitochondrial mass (blue: very low, light blue: low, light orange: normal, orange: high and red: very high). Coloured boxes indicate classifications of deficiency based on z-scores (green: positive, blue: intermediate positive, pink: intermediate negative, red: negative)
2.2.9 Statistical analysis
Graphs were produced in prism v5.0 or plotIMC (see chapter 4 for more detail) and statistical
analysis was performed in a combination of programmes specific to each chapter.

53
Chapter 3 : Using the quadruple immunofluorescent assay
to investigate oxidative phosphorylation deficiency in 85
year old participants.

54
3.1 Introduction
3.1.1 The ageing population
Life expectancy is a measure of the average length of life within the population (Kirkwood
Thomas, 2017). As life expectancy increases, there is a rapid expansion of the ageing population
within the UK, with the proportion of those aged 65 and over increasing from 15.9% to 18.2%
between the years of 1997 and 2017 (Coates, 2018). In addition, is it expected that by 2039,
more than 1 in 12 of the population will be aged 80 or over (Nash, 2015). The expansion of the
ageing population brings with it a higher prevalence of age-related conditions (Ferrucci et al.,
2008).
3.1.2 Sarcopenia
Sarcopenia is characterised by the age-related involuntary loss of skeletal muscle mass and
function, which is closely associated with physical disability, poor quality of life and death
(Santilli et al., 2014, Chumlea et al., 2011). It is known that muscle mass accounts for up to
60% of body mass and so any changes to skeletal muscle can have a profound effect on an
individual. Evidence suggests that both mass and strength decline in a linear fashion, with up
to 50% of mass being lost by the 8th decade of life (Metter et al., 1997). In addition to its role
in disease progression, loss of strength in sarcopenic muscle decreases the capacity of older
individuals to carry out daily living tasks (Shiozu et al., 2015) and increases exercise difficulty.
3.1.3 Identification of sarcopenia
The European Working Group on Sarcopenia in Older People (EWGSOP) have developed a
diagnostic criteria for age-related sarcopenia which involves various measurements to
determine the presence of low muscle mass and function. Three common measurements
assessed are grip strength, a Timed Up-and-Go (TUG) test and Skeletal Muscle Index (SMI)
(Cruz-Jentoft et al., 2010). In brief, grip strength (kg) is measured with a Jamar handheld
hydraulic dynamometer (Promedics, UK) following a standard protocol (Roberts et al., 2011).
Measurements are taken three times in both hands and the maximum value obtained can be used
for further analysis. During the TUG test, a stopwatch is used to measure the time taken to get
up from a chair and walk as quickly and as safely as possible to and around a marker placed 3m
away, walk back to the chair and sit down. The time is converted to an estimate of gait speed
(m/s) using the following formula:

55
6/ [TUG time]* 1.62 Equation 3.1: Estimate of gait speed. Taken from (Cooper et al., 2011, Cooper et al., 2015).
Total body weight (kg) and estimated appendicular lean mass (kg) are measured using a Tanita
MC-780MA body composition analyser (Tanita Corporation, Arlington Heights, IL). Height is
estimated based on demi-span, measured twice to the nearest millimetre and averaged. Skeletal
Muscle Index (SMI) (kg/m2) is calculated from appendicular lean mass divided by height-
squared. The definition of sarcopenia provided by the European Working Group is applied to
results, using a recognised cut-off for grip strength (< 30 kg and < 20 kg for men and women
respectively), for gait speed (≤ 0.8ms), and for SMI (< 7.26 kg/m2 in men and < 5.45 kg/m2 in
women). Participants with weak grip strength and/or slow gait speed, in combination with low
SMI, are considered sarcopenic.
3.1.4 Potential causes of sarcopenia
Sarcopenia is a multifactorial condition and there are many proposed mechanisms implicated
in its development, including dysregulation of protein synthesis and degradation, satellite cells,
neuronal and mitochondrial dysfunction (Bowen et al., 2015).
Skeletal muscle mass is largely dependent upon protein turnover, that is, the balance between
both synthesis and degradation, and sarcopenia can occur when this balance is disturbed
(Murton, 2015). Amongst other pathways, insulin signalling via IGF-1 is important in the
synthesis of proteins (Musaro et al., 2001), and studies have shown that the IGF-1 pathway can
supress protein breakdown, leading to simulated muscle growth and hypertrophy of the muscle
(Sacheck et al., 2004, Gelfand and Barrett, 1987, Fryburg et al., 1992). It is believed that lower
sensitivity or impairments to the signalling pathways engaged in protein turnover are
contributors to sarcopenia.
Satellite cells, also known as muscle stem cells, are the sole source for the generation of new
myonuclei in skeletal muscle tissue (Allen et al., 1999). As such, these cells are essential for
the maintenance of skeletal muscle. Although usually quiescent, they can activate and
proliferate in response to injury to remove any deleterious effects which have the potential to
cause harm (Alway et al., 2014). Because satellite cells are so heavily responsible for the
maintenance of skeletal muscle, any loss in either their number or function is likely to result in
impaired structure or function of skeletal muscle (Shefer et al., 2006). Studies investigating the
effects of ageing on skeletal muscle satellite cells have reported a decline in the regenerative
function and number of satellite cells in the elderly (Sousa-Victor et al., 2014, Day et al., 2010,

56
Kadi et al., 2004). Further evidence also suggests that a decline in satellite cell number
contributes to fibre atrophy (Brack et al., 2005).
As well as complications with the muscle itself, there are two systems which are heavily
involved in the development of sarcopenia: the nervous system and the connections between
neurons and muscle fibres known as the neuromuscular junctions. Studies undertaken in both
humans and animals have demonstrated that neurons become depleted with age (Rowan et al.,
2012, Tomlinson and Irving, 1977) and the loss of these motor neurons promote a process
known as fibre type grouping. During this process, fibres which have been denervated by loss
of neurons, are reinnervated by neighbouring nerves through a process known as collateral
sprouting. This consequently means that fibres which have been denervated and reinnervated
by neighbouring motor units will possess the same fibre type as its adjacent fibre and eventually
lead to a motor unit group of the same type (Lexell and Downham, 1991). With regards to the
neuromuscular junctions, an age-associated degeneration has been recognised, with changes
being shown both structurally and functionally (Jang and Van Remmen, 2011).
3.1.5 Mitochondrial involvement in sarcopenia and ageing
3.1.5.1 The mitochondrial genome Abnormalities in the mitochondrial genome have been implicated in ageing and there are a vast
number of studies that demonstrate an age-related increase in mtDNA mutations (Brierley et
al., 1998, Bender et al., 2006, Michikawa et al., 1999, Taylor et al., 2003) as well as depletion
of mtDNA (Short et al., 2005, Cree et al., 2008a, Laderman et al., 1996, Kaaman et al., 2007).
In particular, Trifunovic and colleagues, who used a knock in PolgA mutator mouse as a model
for ageing, successfully demonstrated a 3-5 fold increase in point mutations as well as increased
amounts of deleted mtDNA – which were both associated with a premature onset of age-related
phenotypes (Trifunovic et al., 2004). These mtDNA mutations have been shown to cause
respiratory chain defects which subsequently means that many ATP dependant cellular
processes will be impaired, thus contributing to the ageing process (Nooteboom et al., 2010).
Within muscle specifically, the age-related accumulation of mtDNA mutations has been shown
to be concomitant with mitochondrial deficiency. Brierley et al. (1998) studied skeletal muscle
from elderly subjects and demonstrated that individual COX-deficient fibres were associated
with high levels of mutant mtDNA. Furthermore, a study carried out by Bua et al. (2006) found
that ~6% of fibres had some degree of COX-deficiency by 49 years, and this further increased
to ~22% at 67 years and ~31% by 92 years.

57
3.1.5.2 Mitochondrial dynamics Mitochondria are highly dynamic organelles that are known to migrate through the cell, fuse
and divide, undergo morphological changes and regulated turnover (Chen and Chan, 2009).
The process of fission and fusion allows for effective communication and the exchange of
content between individual mitochondria (Chen et al., 2010), and so any alterations in this
process could negatively impact many mitochondrial functions which subsequently leads to
muscle dysfunction with age. Furthermore, fused mitochondria are known to mitigate
dysfunction by sharing their contents in a process called complementation, and so a halt in this
process will increase the likelihood of mitochondrial dysfunction (Ono et al., 2001).
Mitophagy is described as the selective degradation of damaged mitochondria (Kanki and
Klionsky, 2008) and is one of the most efficient methods of removing damage. Mitophagy is
closely linked to mitochondrial dynamics and is dependent on the presence of fission for
subsequent removal of defective proteins or mtDNA (Burman et al., 2017), and so the inhibition
of this process may promote an accumulation of damaged mitochondria within skeletal muscle
(Grumati et al., 2010, Masiero et al., 2009). Further to this, it has been observed that enlarged
mitochondria accumulate in old myocytes (Beregi and Regius, 1987), and it is thought that this
hyperfusion could represent a compensatory mechanism by which the mitochondria attempt to
cope with increased damage by mixing, and thus diluting the mutant contents (Sato et al., 2006).
Supportive of this theory, a study by Chen et al. (2010) demonstrated that disruption of fusion
via the generation of mtDNA mutator knockout mice, leading to a deficiency in MFn1 and
Mfn2, increases mitochondrial dysfunction.
3.1.5.3 Oxidative damage and ROS production Since the link between reactive oxygen species (ROS) and ageing was first proposed by Harman
and colleagues in 1956 (Harman, 1956), there has been further evidence to suggest that
oxidative stress is a key contributor to age-related muscle atrophy and sarcopenia. A number of
studies have demonstrated an increase in markers of oxidative stress with advancing age
(Bellanti et al., 2018, Fanò et al., 2001), as well as altered antioxidant enzyme activities
(Sullivan-Gunn and Lewandowski, 2013). However, there have been a number of studies that
contradict this theory, suggesting evidence against the idea of a universal role of ROS in the
ageing process (reviewed by Gladyshev (2014)).

58
3.1.6 Physical activity and exercise as an intervention for sarcopenia
Inactivity has been proven to be an important contributor to the loss of muscle mass and strength
(Kortebein et al., 2007, Paddon-Jones et al., 2006) and thus it is speculated that physical activity
could be an effective intervention for sarcopenia. The beneficial effects of exercise on the
skeletal muscle, and in particular its effects on mitochondria, have been extensively researched,
with a link between the two first reported by the Holloszy group in 1967, who demonstrated a
rise in respiratory enzyme activity and mitochondrial protein content in response to treadmill
training (Holloszy, 1967). Since then, exercise has proven to be an effective strategy to improve
the oxidative capacity of muscle (Gollnick and Saltin, 1982, Holloszy and Booth, 1976, Howald
et al., 1985), as well as increasing mitochondrial content and electron transport chain activity
(Conley et al., 2013, Menshikova et al., 2006).
There are two main types of training that dominate the literature in regards to benefits. Aerobic
training involves carrying out low intensity exercise for prolonged periods of time and has been
linked to improved cardiorespiratory fitness and endurance capacity in older individuals (Huang
et al., 2016). There is extensive evidence showing the positive impact of aerobic training both
physically and cognitively in older individuals (Blumenthal et al., 1989, Thompson et al., 2003,
Kasch et al., 1999, Spina et al., 1998, Burzynska et al., 2014).
Resistance training has shown the most promise in its effects on the ageing process. Designed
to increase the body’s strength and power, it is most commonly implemented in the form of
weight training and has been shown to protect against skeletal muscle loss, with a number of
studies demonstrating muscle hypertrophy as a result of training (Staron et al., 1990, Taaffe et
al., 2009). This hypertrophy is driven by the addition of satellite cell (SC) nuclei to myofibres.
When the muscle is exercised or injured, SCs become activated and can proliferate, differentiate
or fuse together. Interestingly, the SC-induced hypertrophic response to resistance exercise is
thought to be gender-dependant, and studies show it to be generally higher in males (Kosek et
al., 2006).
Studies have either primarily focussed on resistance training or aerobic training independently,
but no single type of exercise would fully fit the requirements of an exercise intervention for
sarcopenic patients. Aerobic exercise has little effect on muscle mass and strength whereas
resistance exercise fails to target cardiorespiratory fitness and can increase the risk of injury.
As such, it is recommended that exercise interventions consist of a combined programme of
both aerobic and resistance exercises (Takeshima et al., 2004, Gudlaugsson et al., 2013).

59
3.2 Aims of this study
The aim of this chapter is to investigate mitochondrial function and content amongst active 85-
year-olds. The quadruple immunofluorescent work carried out in this chapter is one component
of a larger study which has now been published by Dodds et al. (2018) and I will discuss the
results in the context of the whole study.

60
3.3 Methods
3.3.1 Patient cohort
The selection of participants for this study was carried out by a research team led by Dr Richard
Dodds (University of Southampton). Participants aged 85 years or born in 1931 (in their 85th
year of life), who were registered with a general practice within the North East and North
Cumbria Clinical Research Network, England, were eligible for recruitment. Participants were
excluded if they had a cardiac pacemaker or any other metallic or programmable devices, or
were taking antithrombotic or anticoagulant drugs. Individuals had to be considered suitable for
approach by their general practitioner as well as having the capacity to provide written informed
consent. Ethical approval was granted in the UK by the Tyne and Wear South Research Ethics
Committee (reference 15/NE/0382). Information on controls and participants can be found in
Table 3.1.
Participants were examined for the presence of sarcopenia and this identification of sarcopenia
was carried out by Dr Karen Davies of Newcastle University. Participants with weak grip
strength and/or slow gait speed, in combination with low SMI, were considered sarcopenic.
3.3.2 Muscle biopsy and cryo-sectioning
Biopsies of the vastus lateralis muscle were obtained from 85 year old participants (n=7) using
a Weil Blakesley conchotome. Control tissue (n=5) was acquired with prior informed consent
from the distal part of the hamstring of people undergoing anterior cruciate ligament (ACL)
surgery. Samples were frozen in liquid nitrogen cooled isopentane. Serial sections (10µm
thickness) from transversely orientated muscle blocks were obtained as described in methods
section 2.2.3.
3.3.3 Immunofluorescent analysis of respiratory chain protein expression
Quadruple immunofluorescence was carried out according to the protocol described by Rocha
et al. (2015) (see methods section 2.2.5). Images were acquired using Zeiss Axio Imager M1
and Zen 2011 (Blue edition) and analysis was completed on an in-house software as described
by Ahmed et al. (2017) (see section 2.2.8).
61
Table 3.1: Subject information. Information on controls and participants detailing age, gender and activity levels (measured by RAPA 1 and RAPA2).
Subjects Gender Age at biopsy/years RAPA 1 RAPA 2
Control 1 Male 17 n/a n/a
Control 2 Male 33 n/a n/a
Control 3 Male 28 n/a n/a
Control 4 Female 25 n/a n/a
Control 5 Female 23 n/a n/a
Participant 1 Female 85 6 0
Participant 2 Male 85 6 0
Participant 3 Male 85 7 0
Participant 4 Female 85 3 0
Participant 5 Female 84 5 0
Participant 6 Female 85 6 1
Participant 7 Male 84 3 1

62
3.4 Results
3.4.1 Immunofluorescent analysis
Quadruple immunofluorescence allowed objective quantification of complex I (CI) and
complex IV (CIV) protein abundance and was performed on muscle sections from participants
aged 85 years or in their 85th year of life (n=7). Representative immunofluorescent images from
all controls and participants are presented in Figure 3.1. The mitochondrial respiratory chain
(MRC) profiles from all participants are displayed in Figure 3.2, and demonstrate that the
participants present with very little respiratory chain deficiency - comparable to the control
cohort. This was confirmed quantitatively (Table 3.2), with the most deficient participant for
CI (participant 3) still having 97.19% positive fibres for CI, and the most deficient participant
for CIV (participant 4) having 98.45% positive fibres for CIV.

63

64
Figure 3.1: Quadruple immunofluorescent analysis of mitochondrial respiratory chain deficiency in participants and controls. Representative images of NDUFB8 (complex I) (purple), VDAC1 (mitochondrial mass) (red), MTCO1 (complex IV) (green) and a merge of all channels with fibre boundary marker (white outline). Scale bar: 50µm. Note staining patterns differ between individual fibres according to different fibre types.

65
Figure 3.2: MRC profiles. Plots show complex I and complex IV expression profiles from participants (n=7). X and Y axis indicate levels of NDUFB8 and MTCO1 respectively. Each dot represents an individual muscle fibre and is colour coded according to levels of mitochondrial mass (blue: very low, light blue: low, light orange: normal, orange: high and red: very high).

66
Table 3.2: Quantification of complex I (NDUFB8) and complex IV (MTCO1) deficiency. Percentage of deficient fibres in muscle sections of participants (n=7) and controls (n=5). Fibres are split into categories depending on their deficiency; pos=positive, int(+)=intermediate positive, int(-)=intermediate negative, neg=negative
The distribution of VDAC1 was also investigated as a marker of mitochondrial mass and fibres
were grouped according to their VDAC1 levels as follows: Very low (<-3SD), low (between -
3SD and -2SD), normal (between -2SD and +2SD), high (between +2SD and +3SD) and very
high (above +3SD). Although there was variation in the distribution of VDAC1 between the
controls (Figure 3.3), the majority of fibres in each case (>93%) fell into the “normal” range.
This was the same for most of the aged participants (Figure 3.4), with five out of the seven
participants (71%), having the majority of their fibres (>95%) falling into the “normal” category
– similar to the controls. However, two of the participants (participant 2 and participant 6) had
a lower percentage of fibres normal for VDAC1, with only 75.7% and 84.8% falling into this
category for p2 and p6 respectively. Interestingly, the shift in the distribution of VDAC1 was
not the same in these two participants, with a right shift in participant 2 indicating a higher level
of VDAC1 compared to a left shift in participant 6 demonstrating lower levels of VDAC1
(Figure 3.4).

67
Figure 3.3: VDAC1 levels of controls. z-scores for VDAC1 are displayed on the x-axis the distribution of VDAC1 is grouped into the following: Very low (<-3SD), low (between -3SD and -2SD), normal (between -2SD and +2SD), high (between +2SD and +3SD) and very high (above +3SD). Graphs produced with help from Tasnim Ahmed.

68
Figure 3.4: VDAC1 levels of participants. z-scores for VDAC1 are displayed on the x-axis the distribution of VDAC1 is grouped into the following: Very low (<-3SD), low (between -3SD and -2SD), normal (between -2SD and +2SD), high (between +2SD and +3SD) and very high (above +3SD). Graphs produced with help from Tasnim Ahmed.

69
3.4.2 Validity of results
To ensure there was no interpersonal variability, the results were reanalysed and compared to
the original run – with the percentage difference between the two results displayed in Table
3.3a. The greatest variation that was observed was a difference of 2.5%, which ruled out any
interpersonal variability. Further to this, the results were also reanalysed by an independent
researcher to ensure that there was no intrapersonal variability and the percentage difference
between the two is displayed in Table 3.3b. The greatest variation that was observed was a
difference of 1.06% which ruled out any intrapersonal variability.
Table 3.3: Percentage difference in re-quantification of levels of deficiency. Re-quantification of complex I (NDUFB8) and complex IV (MTCO1) deficiency in muscle sections of participants (n=7) and controls (n=5). Analysis was repeated by (a) researcher 1 and then (b) a further time by another researcher.

70
3.5 Discussion
3.5.1 Identification of sarcopenia
When examined, the clinical measures used as identifiers of sarcopenia were either above the
relevant cut-points (gait speed and SMI) or only just below (grip strength) for all seven
participants. Further to this, the participants in this study had high levels of self-reported
physical function and general health, when compared to normative data for the same age group
(Bowling et al., 1999, Dodds et al., 2018), as well as regularly engaging in aerobic physical
activity – measured by the rapid assessment of physical activity (RAPA) (Topolski et al., 2006).
The RAPA scores for each of the participants are displayed in Table 3.4. RAPA1 is a measure
of aerobic activity and is measured on a scale of 1-7, with sedentary scored as 1 and active
scored as 7. RAPA2 is a measure of strength and flexibility and consists of two statements: “I
do activities to increase muscle strength once a week or more” and “I do activities to improve
flexibility once a week or more”. A score of 3 indicates both these statements are true for an
individual, a score of 2 indicates only the second statement is true, a score of 1 indicates that
only the first statement is true, while a score of 0 indicates none of the above statements are
true.
Table 3.4: RAPA scores of study participants.
Participant RAPA1 (aerobic)
RAPA2 (strength and flexibility)
1 6 0 2 6 0 3 7 0 4 3 0 5 5 0 6 6 1 7 3 1
Because identifiers of sarcopenia were either above the relevant cut-points or only just below
for all seven participants, alongside high RAPA scores, these participants were not deemed
sarcopenic and were in fact considered both healthy and active for their age groups.

71
3.5.2 Impact of physical activity on study results
The participants in this study were not only considered non-sarcopenic, but were also
recognised as being more active than expected for people of their age, and it is this level of
activity that may explain why there was little mitochondrial deficiency throughout the group
despite their age. There have been a plethora of studies that investigate the response of skeletal
muscle mitochondria to exercise (reviewed by Lundby and Jacobs (2016)) and a beneficial
effect has been consistently demonstrated, with exercise stimulating an increase in total
mitochondrial protein and respiratory capacity, as well as triggering mitochondrial hypertrophy
and structural changes. Furthermore, a number of studies have investigated both the effect of
age and activity levels on mitochondrial function and content. Distefano et al. (2018) compared
young active individuals with older active and older sedentary individuals and concluded that
older adults who maintain high levels of physical activity have a mitochondrial capacity
comparable to the younger active group. Similarly St-Jean-Pelletier et al. (2017) found that
physical activity partially protects from the effects of ageing on mitochondrial content.
In this study, there was one participant (p6) that had a lower distribution of VDAC1 than the
other participants and controls. Hypothesising from work above (St-Jean-Pelletier et al., 2017),
it was expected that a low level of physical activity resulting in a less protective effect could
account for this low distribution of VDAC1. However surprisingly p6 had one of the highest
RAPA scores when compared to the participants. There was also one participant (p2) that had
a higher distribution of VDAC1 compared to other participants and controls so it was assumed
that they would have higher levels of physical activity. Although the RAPA score of p2 was
high, it was not significantly higher than other participants in the study. These unexpected
findings could be a consequence of inaccurate self-reported physical activity levels amongst
the individual participants.
Further studies that assessed respiratory chain content in a similar manner to this one
demonstrated that there was a positive association between complex I levels and physical
performance, suggestive that mitochondrial dysfunction may have a role in sarcopenia and that
physical activity may attenuate this (Rygiel et al., 2017). The preservation of respiratory chain
deficiency in this study reinforces this and suggests that the high levels of physical activity may
have attenuated the age-related decline of respiratory chain enzymes. This is further confirmed
by looking at previous data on the general ageing population, with studies demonstrating age-
related respiratory chain deficiency (Muller-Hocker, 1990, Trounce et al., 1989, Cooper et al.,
1992).

72
3.5.3 Strengths of the study
The work carried out for this chapter was part of a larger study to try and better understand
mitochondrial content in participants aged 85 or in their 85th year of life, and is the first study
to successfully investigate individuals of this age using a muscle biopsy technique.
Quadruple immunofluorescent analysis was performed on each biopsy sample and further
reanalysed by the same researcher and an independent researcher to account for any inter- and
intra- individual/researcher variability. Results demonstrated that there was very little
difference between each of the analyses suggesting that the technique is highly reproducible.
3.5.4 Limitations of the study
Although the study was only a pilot, the small sample size meant that no firm associations could
be made between mitochondrial measures and components of sarcopenia. Furthermore, any
observations that were made may not be representative of the general population and further
investigations with an increased sample size will need to be carried out.
A major limitation of this work was the potential of the participant cohort to confound results.
Due to the exclusion criteria of the study, the participants selected for muscle biopsy were
biased towards healthier and more active participants who were capable of coping with the
biopsy procedure and not those that may have better represented the general population of that
age group. Furthermore, physical activity was measured using a RAPA questionnaire. Although
RAPA is an easy-to-use, valid measure of physical activity, it is a qualitative measure that relies
on participants self-reporting. There was no procedure put in place to ensure that participants
were reporting truthfully and correctly, and thus this method may not be entirely accurate and
may explain why such striking similarities were observed in measurements when compared to
young controls. Future studies should look to use an objective measure to assess activity levels
of individuals such as a wearable activity monitor.
Another limitation was the controls that were used, and it is clear that the cohort was not suitable
for this particular study. Firstly, the site of biopsy differed between participants and controls,
with control muscle taken from the hamstring compared to the vastus lateralis in participants.
This could possibly have an impact on the detection of proteins within the muscle and it may
be that measurements could vary between different muscle groups. Another disadvantage of
the control group selected was that the cohort was not aged matched to the experimental group.
The aim of the whole study was to determine whether mitochondrial respiratory chain function
and content were preserved among healthy 85-year-olds and therefore ideally the control cohort

73
should have included matched individuals who fulfil the criteria in regards to age and gender,
but who differ in regards to activity (i.e. sedentary individuals in their 85th year of life). By
matching for age, the effect that maintaining a physically active lifestyle has on respiratory
chain function could be assessed. As it stands, it would be difficult to determine whether it is
exercise alone driving the preservation of mitochondrial respiratory chain deficiency, or
whether there are other factors involved in this. Furthermore, there is no clinical data on the
controls in regards to activity levels and subsequent physical data, and so again it is hard to
make any firm conclusions. That being said, it is very difficult to obtain control tissue that fits
the exact criteria of a study and in regards to looking at mitochondrial respiratory chain
deficiency using the quadruple immunofluorescent assay, the young controls met all
requirements needed to qualify as suitable comparative controls, i.e. they had a good
morphology and normal levels of respiratory chain proteins. If aged controls had been used for
this particular assay, the results may only have been semi-quantitative due to potential
respiratory chain deficiency in the aged individuals.
3.5.5 Conclusions
Although there are fundamental drawbacks in the design of this study, important conclusions
can still be drawn from the findings. When comparing the participants to non-aged matched
controls, it is evident that older adults who maintain high levels of physical activity have a
mitochondrial capacity comparable to the younger control group. This reinforces the
observation that physical activity helps to maintain muscle health in older individuals.

74

75
Chapter 4 : Development and optimisation of the use and
analysis of imaging mass cytometry to investigate
mitochondrial respiratory chain deficiency in single
muscle fibres

76
4.1 Introduction
4.1.1 Current techniques to assess mitochondrial defects in skeletal muscle.
4.1.1.1 COX/SDH histochemistry A simple way to assess mitochondrial dysfunction within skeletal muscle is to observe the
activity of respiratory chain enzymes and this can be done using COX/SDH histochemistry.
Complex IV, or cytochrome c oxidase (COX) is essential for the functioning of mitochondria
and its synthesis relies heavily on the mitochondrial genome meaning that any mutation in
mtDNA present at a high enough mutation load that affects COX synthesis, will often lead to
cells with COX deficiency. In contrast, complex II or succinate dehydrogenase (SDH), is solely
encoded by the nuclear genome and therefore its activity is not usually compromised by
dysfunctional mitochondria. The dual reaction of these two complexes has proven effective in
locating cells with COX deficiency. The technique relies on the electron donor 3, 3’-
diaminobenzidine which will form a brown precipitate in cells with functioning COX. Cells
with dysfunctional COX will not accumulate a brown precipitate thus allowing for the
visualisation of SDH activity by the reduction of an electron acceptor nitroblue tetrazolium, to
produce a blue colour (Ross, 2011, Old and Johnson, 1989, Sciacco and Bonilla, 1996).
Although this technique has been able to detect mosaic COX deficiencies and identify COX-
positive, COX-intermediate and COX-negative fibres, it is both subjective and qualitative.
Furthermore, it does not detect deficiencies in other complexes of the respiratory chain.
4.1.1.2 Quadruple immunofluorescence Rocha et al. (2015) optimised a quadruple immunofluorescent assay to provide an objective and
quantitative assessment of respiratory chain deficiency in skeletal muscle. As described in
section 2.2.5 the technique analyses three mitochondrial proteins (NDUFB8, a subunit of
complex I, MTCO1, a subunit of complex IV and VDAC1, a mitochondrial mass marker), as
well as a cell membrane marker (laminin). Briefly, after fluorescent images are obtained, an in-
house analysis software is used to determine the optical densities of each channel corresponding
to the four antibodies and z-scores are established for VDAC1, MTCO1 and NDUFB8. Fibres
are classified into groups of NDUFB8 and MTCO1 levels based on their standard deviation
(SD) limits and are classed as normal (z-score > -3SD), Intermediate(+) (z-scores between -
3SD and -4.5SD), Intermediate(-) (z-scores between -4.5SD and -6SD) and Negative (z-score
< -6SD). Similarly, fibres are grouped and colour coded according to their VDAC1 levels (very
low (<-3SD), low (between -3SD and -2SD), normal (between -2SD and +2SD), high (Between
+2SD and +3SD) and very high (above +3SD)). This technique has become a valuable

77
diagnostic tool to identify patient-specific patterns of respiratory chain deficiency (Rocha et al.,
2015, Rocha et al., 2018, Ahmed et al., 2017).
4.1.2 Challenges of current techniques
Despite considerable progress being made in the understanding of the biochemical defect in
individual muscle fibres as well as the improved investigation of respiratory chain deficiency
through muscle biopsies, there are still limitations to the techniques that are currently in
practise. The use of fluorophores as reporters in immunofluorescent techniques means that
spectral overlap/bleed through of the wavelengths while imaging limits the number of
parameters that can be measured simultaneously (Tsurui et al., 2000). Furthermore, the use of
multiple secondary antibodies together is only possible if the primary species and isotype are
different from one another, which again limits the number of parameters that can be measured
in one experiment. Additionally, auto-fluorescence of the tissue can affect the detection and
subsequent quantification of the markers.
It is possible to make a greater number of measurements on one muscle section, however
hardware cannot accommodate for making these measurements simultaneously, and so
experimental protocols have to be adapted to allow for this. Sequential staining can be carried
out whereby the section is imaged and subsequently washed and bleached before a new set of
antibodies are added and the process is repeated. However, this strategy is time consuming and
can affect the integrity of the tissue and so is not the most effective solution (Wahlby et al.,
2002). Alternatively serial sections can be used to look at a vast number of different proteins,
however this method is time consuming, costly and requires a greater amount of tissue.
Additionally there is evidence of segmental deficiency whereby the muscle exhibits short
segments of deficiency as opposed to the same level of deficiency throughout the whole fibre
(Murphy et al., 2012, Bua et al., 2006). This could impact results in that if a number of serial
sections are used to measure a number of proteins, the segment of deficiency may be missed or
the level of deficiency may not be consistent throughout the serial sections.
78
4.1.3 Imaging mass cytometry
Imaging mass cytometry (IMC) is a multiplexed ‘single cell omics’ technique that combines
time of flight mass cytometry (CyTOF) and immunohistochemistry with a high resolution
ablation system to enable the simultaneous imaging of up to 40 proteins (Giesen et al., 2014).
In conventional mass cytometry, single cells are labelled with metal-conjugated antibodies, and
following ionization, the quantities of the isotopes bound to each cell are analysed by time of
flight (Bendall et al., 2012). IMC extends the capabilities of CyTOF by the introduction of a
novel laser ablation device to the mass cytometer. In brief, the sample is labelled with antibodies
that are tagged with rare-earth-metal isotopes and placed in a chamber where the tissue is
ablated. Each ablated region is subsequently transported to the mass cytometer and levels of
each labelled protein are quantified. Following data processing, spatially resolved images of
the isotope signals are constructed and are comparable to that produced by light microscopy at
20X magnification (Chang et al., 2017) (Figure 4.1).
Figure 4.1: IMC workflow. Image adapted from Giesen et al. (2014).

79
The advantages of IMC are vast. The use of metals permits a much greater number of
measurements to be made simultaneously without much concern about channel overlap (see
section 4.5.2 for more detail about channel crosstalk). This can be enhanced further by a well-
designed panel. Additionally, as the antibodies are conjugated to rare-earth metals that are not
found in biological tissues, the level of background signal and unspecific binding is very low
when compared to conventional imaging techniques.
Previously, IMC has predominantly been used throughout various oncological and
immunological studies. Giesen et al. (2014) were one of the first groups to apply this technique
to their research and using human breast cancer samples alongside 32 protein markers, were
able to delineate cell subpopulations and cell-cell interactions to highlight tumour
heterogeneity. Following on from this IMC has proven effective in studies involving pancreatic
tissue (Wang et al., 2019), lymph tissue (Singh et al., 2017), and organs such as the kidney,
liver, small intestine and skin (Chang et al., 2016). Although IMC has been used previously
with FFPE tissue, the use of IMC on frozen tissue, and in particular on sections of skeletal
muscle, is novel.
4.2 Aims
To overcome the limitations of other techniques that look at respiratory chain deficiency in
skeletal muscle, the aims of this chapter are as follows:
• Optimise a list of antibodies that can be used with IMC to identify mitochondrial
deficiencies within skeletal muscle.
• Develop a workflow and software that successfully quantifies mitochondrial
dysfunction in skeletal muscle using IMC.

80
4.3 Materials and Methods
4.3.1 Patient cohort
Archived frozen muscle samples derived from healthy controls or patients with clinically and
genetically characterised mitochondrial disease of either mtDNA or nuclear genetic origin were
assessed. Table 4.1 summarises all relevant clinical information for this chapter. Control tissue
was acquired with prior informed consent from the distal region of the hamstring of patients
undergoing anterior cruciate ligament surgery. All ethical approval can be found in section
2.2.1. P01 was a post-mortem biopsy taken from a patient with an inherited variant in the POLG
gene.
Table 4.1: Patient information. Information on controls and patients detailing gender, age at biopsy, clinical information and genetic defect.
Subjects Gender Age Clinical information Genetic defect
Controls
C01 Male 33y n.a n.a
C02 Female 23y n.a n.a
C03 Male 28y n.a n.a
Patient
P01
Male
80
arPEO
POLG p.(Thr251Ile)/p.(Pro587
Leu); p.(Ala467Thr); c.1399G>A
arPEO: autosomal recessive progressive external opthalmoplegia; n.a: not applicable
4.3.2 Muscle biopsies and cryo-sectioning
Serial sections (6µm and 10µm in thickness) were obtained from transversely orientated muscle
blocks as described in section 2.2.3
4.3.3 Immunohistochemistry and imaging
Various immunofluorescent stains were used in order to test and optimise antibodies for
subsequent inclusion to an IMC panel. Immunofluorescence and imaging was carried out as
described in sections 2.2.5 and 2.2.6 following the protocol established by Rocha et al. (2015).
The antibodies and concentrations used for each variation are described in Table 4.2.

81
Table 4.2: List of antibodies and dilutions used for immunofluorescence.
Optimisation of a membrane marker: Primary antibodies/ dilutions used Secondary antibodies/ dilutions used
Mouse IgG1 Dystrophin (1/50) Anti-mouse IgG1 Alexa Fluor 647nm (1/200) Immunofluorescence used in panel design and protein expression levels: Protein target/Primary antibodies (1/100) Secondary antibodies (1/200) Complex I: Mouse IgG1 NDUFB8 Complex I: Mouse IgG2b NDUFA13 Complex II Mouse IgG1 SDHA Complex III: Mouse IgG1 UQCRC2 Complex IV: Mouse IgG2a MTCO1 Complex IV: Mouse IgG2a COX4+4L2 Complex V: Mouse IgG1 OSCP Mitochondrial mass: Mouse IgG2b VDAC1 Mitochondrial mass: Mouse IgG TOMM20
Anti-mouse IgG Alexa Fluor 488nm
Immunofluorescence used in testing antibody binding efficiency: Protein target/ Primary antibodies (1/100) Secondary antibodies (1/200) Metal and non-metal: Complex I: Mouse IgG1 NDUFB8 Complex I: Mouse IgG2b NDUFA13 Complex II: Mouse IgG1 SDHA Complex III: Mouse IgG1 UqCRC2 Complex IV: Mouse IgG2a MTCO1 Complex IV: Mouse IgG2a COX4+4L2 Complex V: Mouse IgG1 OSCP Mitochondrial mass: Mouse IgG2b VDAC1 Mitochondrial mass: Mouse IgG TOMM20
Anti-mouse IgG Alexa Fluor 488nm
Immunofluorescence used in optimisation of a mitochondrial mass marker: Primary antibodies/ dilutions used Secondary antibodies/ dilutions used Mouse IgG TOMM20 (1/50) Mouse IgG2a TOMM22 (1/200, 1/100, 1/50) Mouse IgG2b TIMM23 (1/200, 1/100, 1/50)
Anti-mouse IgG Alexa Fluor 488nm (1/200) Anti-mouse IgG2a Alexa Fluor 488nm (1/200) Anti-mouse IgG2b Alexa Fluor 488nm (1/200)
Immunofluorescence used in comparing section thicknesses: Primary antibodies/ dilutions used Secondary antibodies/ dilutions used Mouse IgG1 NDUFB8 (1/100) Mouse IgG2a MTCO1 (1/100) Mouse IgG2b VDAC1 (1/100) Rabbit polyclonal IgG Laminin (1/50)
Anti-mouse IgG Alexa Fluor 647nm (1/200) Anti-mouse IgG Alexa Fluor 488nm (1/200) Anti-mouse IgG Alexa Fluor 546nm (1/200) Anti-rabbit Alexa Fluor 405nm (1/100)

82
4.3.4 Metal conjugations
Conjugation of the metal Lanthanides to the corresponding antibody was carried out using a
standard MAXPAR® antibody labelling Kit (DVS Sciences). The kit includes all the reagents
(R-Buffer, C-Buffer, L-Buffer, W-Buffer, MAXPAR® polymer, Lanthanide solution, Bond-
Breaker™TCEP solution, antibody stabilizer) and materials (3kDa filters, 30kDa filters)
necessary for the protocol. The protocol comprises of three main steps - in the first instance, a
MAXPAR® polymer is preloaded with the metal Lanthanide. Concurrently, steps are taken to
partially reduce the antibody before the Lanthanide-loaded polymer is then conjugated to the
antibody.
To begin, the MAXPAR® polymer (which is moisture-sensitive) was removed from storage at
-20°C and equilibrated to room temperature before opening to avoid moisture condensation.
The polymer was resuspended with 95µl of L-buffer and mixed thoroughly by pipetting. 5µl of
the assigned Lanthanide metal solution was added to the tube (final concentration of 2.5mM)
and the solution was incubated for 40 minutes at 37°C. Next, the solution was transferred to a
3kDa filter and 200µl of L-buffer was added. The mix was centrifuged at 12000g for 25 minutes
at RT before 300µl of C-buffer was added to the filter and centrifuged again at 30 minutes.
Beginning to partially reduce the antibody to allow exposure of the antibody binding site , using
a 30kDa filter, 300µl of R-buffer was added to 100µl of protein free antibody and centrifuged
at 12000g for 10 minutes at RT. Once the flow-through had been discarded, 100µl of tris(2-
carboxyethyl)phosphine TCEP solution (4mM of stock solution diluted in R-buffer) was added,
mixed by pipetting and incubated at 37°C for 30 minutes. Subsequently the solution was washed
twice by the addition of C-buffer (300µl) and 12000g centrifugation for 10 minutes at RT.
To conjugate the antibody with the Lanthanide-loaded polymer, the polymer was re-suspended
in 100µl of C-buffer and mixed with the partially reduced antibody in the 30kDa filter with a
1.5hr incubation at 37°C. This was followed by 4 washes using 400µl of W-buffer with 12000g
centrifugation for 5 minutes after each wash.
After final washes, the metal conjugated antibody was recovered by rinsing the walls of the
filter with 50µl of W-buffer, inverting the filter over to a new collection tube and centrifuging
at 1000g for 2 minutes. This process was then repeated using a further 50µl of W-buffer. As a
final step, the yield of the antibody was determined (see section 4.3.5) and 100µl of stabilizer
(supplemented with 0.05% sodium azide) was added to the antibody before storage at 4°C.

83
4.3.5 Confirming conjugations had been successful
Initially, the antibodies were tested on a nanodrop both before and after metal conjugation to
test the level of protein present. Briefly, using the ProteinA280 setting, the instrument was
blanked against water followed by the wash buffer used in the conjugation protocol before 1µl
of each antibody was subsequently tested in turn. The instrument calculates the concentration
using mg/ml.
Following from this it was important to test whether the metal had bound to the antibody. 50µl
of distilled PBS and one drop of ebiosciences ultra comp beads (Fluidigm) were added to a tube
containing 1µl of antibody and incubated at RT for 30min. Next, 2mls of PBS was added and
the solution was centrifuged at 1500g for 5min before the supernatant was discarded and the
pellet was re-suspended. 250µl of Ir-intercalator (at a concentration of 125µm) was added and
left to incubate for 30min at RT which allows the nuclear DNA to bind. To wash, 2mls of water
was added and the solution was centrifuged at 1500g for 5 min before the supernatant was
discarded as before. This was repeated three times. As a final step, eq beads (Fluidigm) were
added and the samples were run individually on the CyTOF mass cytometer. A positive signal
was indicative of a successful conjugation (See Figure 4.2 as an example of positive signal).
Figure 4.2: Example FACS plot demonstrating a successful antibody/metal conjugation. A positive signal is shown by the blue circle and is indicative of a successful conjugation.

84
4.3.6 Imaging mass cytometry
The tissue is first labelled with metal-conjugated antibodies. Sections were fixed in 4% PFA
for 3 minutes and permeabilised in a methanol gradient (70% for 10 minutes, 95% for 10
minutes, 100% for 20 minutes, 95% for 10 minutes, 70% for 10 minutes). Next, sections were
blocked for endogenous protein before incubation with the metal-conjugated antibody panel
overnight at 4°C. Following thorough washes, tissue was stained with Ir-intercalator for 30
minutes at RT, washed in ddH2O and air dried. Tissue sections were analysed on the imaging
mass cytometer. The Hyperion Tissue Imaging module was spatially aligned and coupled to the
Helios mass cytometer prior to tuning the instrument at 20Hz laser frequency with a
standardised tuning slide and protocol (Fluidigm). Resolution mass and optimal alignment was
verified using the dual count of lutetium 175 and an acceptable signal cross talk at a 200Hz
laser frequency was verified. Slide libraries were then generated using low resolution images
to guide high resolution epiflourescent panoramas around selected regions of the tissue as
guided by previous IF data. Region sizes to ablate (Regions of interest, ROIs) were set so to
ablate sufficient numbers of fibres for downstream analyses based on a mean fibre density ~15
fibres per mm2 from 10 independent analyses. Prior to ablation, the optimal ablation energy
was empirically determined to ablate the full depth of the tissue. All ablations were performed
according to a pre-generated mass template with a laser frequency of 200Hz. After successful
ablation, files were exported in their native “MCD” file format and processed to single layer
tiffs (16-bit) using MCD viewer software (Fluidigm).
The development of further analysis software used to analyse IMC data (Mitocyto and plotIMC)
was a collaborative effort between myself and Dr Conor Lawless. While I was the biological
input behind the design of the software, the coding was carried out by Dr Lawless. Further
detail on the development of these is described in sections 4.4.2.2 and 4.4.2.3.

85
4.4 Results
4.4.1 Optimisation of muscle sections, antibodies and conjugations for
imaging mass cytometry
4.4.1.1 Optimisation of a muscle fibre membrane marker Availability of antibodies in a protein-free solution, that is, free of any bovine serum albumin
(BSA) or carrier-proteins that are usually added to stabilise the antibody, was a pre-requisite of
including them in the panel design. IMC relies on the segmentation of single cells, and thus the
use of a good membrane marker is essential. The typical muscle membrane marker used
routinely within the research group is laminin, but unfortunately, this could not be obtained in
a protein-free solution and an alternative marker had to be found. Dystrophin is a cytoplasmic
protein that is a vital part of the dystrophin-associated protein complex (DPC) that connects the
cytoskeleton of a muscle fibre to the surrounding extracellular matrix (Blake et al., 2002), and
was therefore tested as a possible alternative to laminin. Immunofluorescence was undertaken
to assess its suitability as a membrane marker (Figure 4.3) and results demonstrate a clear
labelling of fibre boundaries in comparison to the no-primary control (NPC).
Figure 4.3: Successful dystrophin staining. Successful immunofluorescent staining of (a) dystrophin relative to (b) NPC. Sections of C03 were stained at 1/50 and had an exposure time of 90ms. Scale bar: 50µm.

86
4.4.1.2 Design of antibody panel The first step in designing the panel after a membrane marker had been determined, was to
choose which further antibodies were the most appropriate for the question that was being
addressed. Due to the fact that this technique would be used initially to assess respiratory chain
deficiency in skeletal muscle, it was important that the panel include a number of mitochondrial
markers targeting all complexes of the respiratory chain. The successful optimisation and use
of NDUFB8 (complex I), MTCO1 (complex IV) and VDAC1 (mitochondrial mass) in
quadruple immunofluorescence made them a good choice for inclusion in the IMC panel.
Similarly, NDUFA13, another marker of complex I, SDHA (complex II), UQCRC2 (complex
III), COX4+4L2 (complex IV) and OSCP (complex V) had been shown previously within our
lab to work well in skeletal muscle (data not shown) and thus were included in the panel as
further markers of the respiratory chain. Each marker was tested using immunofluorescence at
a dilution of 1/100 to ensure that they worked well on skeletal muscle (Figure 4.4). Further to
this it was decided that TOMM20 (an outer membrane protein) be carried forward as well.
Figure 4.4: Testing antibodies on control muscle. Immunofluorescent staining of included antibodies. Sections of C03 were stained at 1/100 and had an exposure time of 50ms. Scale bar: 50µm.

87
The next step was to assign each antibody to a rare-metal isotope for subsequent conjugation.
Although the CyTOF instrument employs a detector capable of simultaneously detecting over
90+ isotopes which can be separated by their time of flight, the ion optics in the instrument are
tuned for optimal delivery of metals in the 153-176 Da range (Figure 4.5), therefore it was
recommended by the manufacturer that isotopes within this range be chosen as antibody
reporters, particularly those with low abundance targets.
Figure 4.5: Mass response curve. Relative counts (y-axis) of each mass channel (x-axis) detected by the CyTOF instrument. Optimal delivery of ions in the 153-176Da range.

88
To compliment this approach, each antibody in the panel was ranked based on their expression
levels for the targeted protein and this was based on immunofluorescent labelling of control
muscle tissue using the protein-free version of each antibody. In brief, following the protocol
described in section 2.2.5, each muscle biopsy section was incubated with a different antibody
in the panel at a concentration of 1/100, followed by incubation with Alexa-Fluor 488nm. To
keep experimental conditions controlled and to ensure only one parameter was being changed,
it was important that a general secondary antibody was used to account for the different
antibody isotypes. Sections were imaged as described in section 2.2.6, and exposure times were
kept consistent throughout so it was assumed that the higher the intensity of the 488 channel,
the higher the expression of the protein (Figure 4.6).

89
Figure 4.6: Expression level of each antibody in the IMC panel. Graph displaying expression of each protein by measurement of the intensity of the 488 channel. Each antibody is displayed as a separate strip and each dot represents an individual fibre. Red bars show the mean intensity for the given antibody. (a) non-metal bound antibodies and (b) metal-bound antibodies.

90
The results demonstrated varying levels of expression between each of the epitopes, however
it was difficult to determine whether TOMM20 truly had a low expression level or whether the
immunofluorescence had not worked correctly for this antibody. The expression level of
TOMM20 relative to three no-primary controls is displayed in Figure 4.7a and demonstrates a
similar intensity to the NPCs with a mean of 101.2 compared to an average mean of 79.1 for
the NPCs, indicating that the low expression level is not a reliable result but potentially due to
background noise. Based on this, it was decided to re-test TOMM20 at a higher concentration
(1/50) and run it alongside two antibodies of different expression levels which were known to
work optimally. The two antibodies chosen were NDUFB8 and MTCO1. Although the
expression of TOMM20 was low (mean of 108.8) (Figure 4.7b), there is a notable difference
compared to the NPC (mean 67.1), suggesting that at a higher concentration the antibody
staining was successful.
Figure 4.7: TOMM20 expression level. (a) Intensity of TOMM20 relative to NPCs and (b) Repeat of TOMM20 alongside two other mitochondrial markers. Expression levels between all antibodies and NPC are different. Red bars show the mean intensity for the given antibody.
91
Using both the expression level data and the known properties of the metal isotopes, each
antibody was assigned a metal tag (with guidance from Dr Roberto Spada, Fluidigm) (Table
4.3).
Table 4.3: Antibodies in IMC panel and corresponding metal lanthanides.
4.4.1.3 Testing antibody binding efficiency after conjugation
In order to assess whether the addition of the metal lanthanide had affected the binding
efficiency of the antibody, immunofluorescent staining was undertaken on 10µm control
muscle sections for both non-metal and metal-bound antibodies at a concentration of 1/100, and
the intensity of each antibody for each condition was measured (Figure 4.8). There appears to
be differences in protein expressions, with the metal-bound antibodies exhibiting a lower
channel intensity. To account for this difference, it was decided that when using metal-bound
antibodies, a lower dilution of 1/50 be used.

92
Figure 4.8: Expression levels of metal and non-metal bound protein. Intensity of the 488 channel (y) for each metal and non-metal conjugated antibody targeting individual proteins (x). (a) SDHA, (b) NDUFB8, (c) OSCP, (d) COX4+4L2, (e) MTCO1, (f) VDAC1, (g) NDUFA13, (h) UqCRC2. Red bars show the mean intensity for the given antibody.

93
4.4.1.4 Optimisation of a new mass marker Something that became apparent whilst testing whether the conjugation process had affected
the antibodies binding ability, was the unsuccessful staining of TOMM20 (Figure 4.9) both
pre- and post-conjugation. Repeats of this staining verified that TOMM20 was not being
detected in muscle and that the lack of staining was not due to an experimental error.
Figure 4.9: TOMM20 staining pre- and post-conjugation. Unsuccessful staining of both (a) pre-conjugated TOMM20 and (b) metal-conjugated TOMM20 on C03 compared to (c) NPC. Sections were exposed for 300ms. Scale bar: 50µm.

94
The mitochondrial import receptor TOMM20 is a protein that is localised to the outer
mitochondrial membrane, and is therefore used widely in research as a marker of mitochondrial
mass. Although VDAC1 and SDHA are other mitochondrial mass markers that are already
included in the panel, SDHA is part of the respiratory chain complex II and because respiratory
chain protein expression is being measured, is not the most ideal option as a mass marker. With
TOMM20 staining unsuccessfully in skeletal muscle and thus being ineffective as a mass
marker, there was a need to find another, more suitable, replacement. Upon a relevant literature
search it was decided that two more antibodies be tested as potential mass markers that could
replace TOMM20 in the IMC panel – TOMM22 and TIMM23. TOMM22 is a mitochondrial
import receptor and has been shown to share a common signal recognition pathway in
mitochondrial protein import to that of TOMM20 (Yamano et al., 2008). In addition, TIMM23,
a protein import component of the mitochondrial inner membrane was also chosen. Similar to
previous immunofluorescent experiments, control muscle sections were labelled with either an
anti-TOMM22 or anti-TIMM23 antibodies at three different working dilutions (1/50, 1/100 and
1/200) followed by sequential incubation with the appropriate secondary antibody.
TIMM23 was unsuccessful at all working concentrations, and showed no difference to the no-
primary control, with a high exposure time of 1s revealing very little signal throughout the
fibres (data not shown). In contrast, TOMM22 labelling was specific at both 1/100 and 1/50 at
an exposure time of 400ms (Figure 4.10). Moreover, the NPC was entirely devoid of non-
specific signal. Additionally, TOMM22 demonstrated a good correlation with two other
established mitochondrial mass markers in the panel – VDAC1 and SDHA (Figure 4.11).
Based on this it was decided that TOMM22 would replace TOMM20 as a mitochondrial mass
marker in the IMC panel. Subsequently the antibody was conjugated to the 155Gd lanthanide
and tested as described in sections 4.3.4 and 4.3.5. Although the conjugation was a success, the
antibody concentration after conjugation was very low and so staining in muscle was again
unsuccessful, therefore it was decided that it would not be continued as a mass marker.

95
Figure 4.10: TOMM22 staining. Control section (C03) incubated with anti-TOMM22 at working concentrations (a) 1/100, (b) 1/50 and (c) NPC. Exposure time 400ms. Scale bar 50µm.
Figure 4.11: Correlation of TOMM22 to other mitochondrial mass markers. (a) VDAC1 and (b) SDHA.

96
4.4.1.5 Ensuring section thickness has no impact on staining
According to the manufacturer, for IMC to work effectively, it is recommended that thinner
sections be used (an optimal thickness of 6µm), which differs from typical immunofluorescent
work which uses 10µm sections. To ensure that section thickness had no impact on staining,
both 6µm and 10µm sections from two controls and a patient sample were tested using an
immunofluorescent protocol similar to that described in section 2.2.5. The results demonstrate
that section thickness had no impact on staining (Figure 4.12a and 4.12b), with similar
respiratory chain profiles produced for both thicknesses (Figure 4.13a). Quantitatively, there
was very little difference in the percentages of positive fibres between both section thicknesses,
with a difference of 0.67%, 0.22% and 1.5% in complex I positive fibres between 6µm and
10µm for C01, C02 and P01 respectively. Likewise for complex IV positive fibres, there was a
difference of 0.45%, 0.12% and 2.86% between 6µm and 10µm sections for C01, C02 and P01.
Furthermore, histograms displaying the distribution of VDAC1 (Figure 4.13b) showed very
little differences between both section thicknesses for all cases investigated.
Figure 4.12: Quadruple immunofluorescent images to compare different section thicknesses -6µm v 10µm. Representative images of NDUFB8 (complex I) (purple), MTCO1 (complex IV) (green), VDAC1 (mitochondrial mass) (red), and a merge of all channels from serial sections of C01 at 6µm (a) and 10µm (b). Scale bar 50µm.
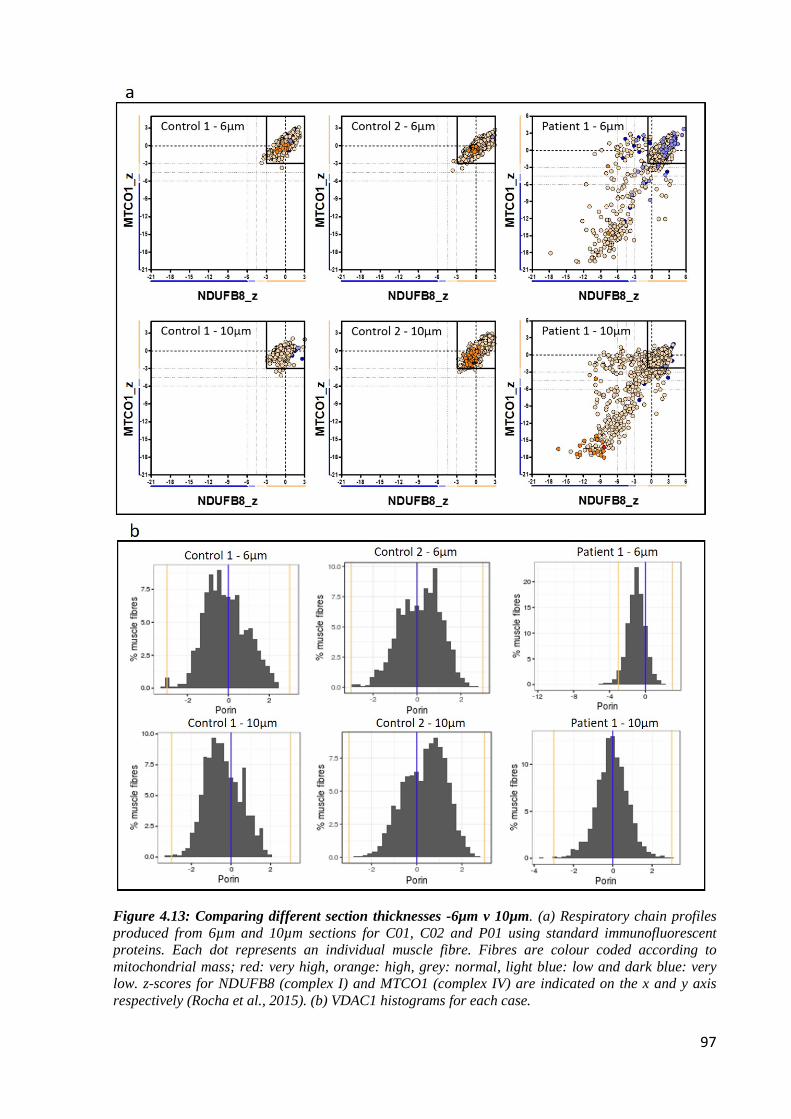
97
Figure 4.13: Comparing different section thicknesses -6µm v 10µm. (a) Respiratory chain profiles produced from 6µm and 10µm sections for C01, C02 and P01 using standard immunofluorescent proteins. Each dot represents an individual muscle fibre. Fibres are colour coded according to mitochondrial mass; red: very high, orange: high, grey: normal, light blue: low and dark blue: very low. z-scores for NDUFB8 (complex I) and MTCO1 (complex IV) are indicated on the x and y axis respectively (Rocha et al., 2015). (b) VDAC1 histograms for each case.

98
4.4.2 Optimisation of staining and development of analysis for imaging
mass cytometry
4.4.2.1 Preliminary imaging mass cytometry staining Nine metal-conjugated antibodies that targeted eight mitochondrial proteins and a fibre cell
membrane marker were used to label frozen skeletal muscle sections. In order to assess the
feasibility of the newly optimised IMC technique on muscle, two controls (C01 and C02) and
a mitochondrial patient (P01) were selected and stained with a protocol adapted from (but
similar to) the established immunofluorescent protocol (See section 2.2.5). The selected patient
was a POLG post-mortem case and was chosen based on its good morphology and because it
had been previously shown to display respiratory chain deficiency using the quadruple
immunofluorescent assay. In brief, sections were fixed, permeabilised and blocked for
endogenous protein as per section 2.2.5, before incubation with the metal-conjugated antibody
panel at three different working concentrations (1/200, 1/100 and 1/50) overnight at 4°C.
Following thorough washes, tissue was stained with Ir-intercalator for 30min at RT and washed
in ddH2O. Finally slides were air dried and placed in sealed slide mailers until required. In the
interest of time, ROI’s of approximately 1mm2 were selected for detection on each slide.
In the first instance, a small area of C01 (ROI around 500µm2) was run on the IMC at all three
dilutions to assess which dilution generated the best results. The data was extracted from the
IMC and uploaded to MCD viewer (Fluidigm) for visual (or qualitative) analysis. To make
visualisation easier, reassembled grayscale images from each individual antibody channel were
pseudo-coloured and the three working dilutions from C01 are presented in Figure 4.14.
After visual inspection of the images, it was decided that a dilution of 1/50 generated the best
results – with the antibodies with the lowest signal presenting with the clearest images at this
dilution (Figure 4.14). Subsequently the rest of the samples were imaged at 1/50 only and
demonstrated that the technique was feasible on skeletal muscle (Figure 4.15), and that there
was a marked difference between the controls and the patient sample when channels were
overlaid for NDUFB8, MTCO1 and VDAC1 (Figure 4.16). This was also true quantitatively
with the patient presenting with 94.31% and 73.24% positive fibres for CI and CIV respectively
compared to 100% positive fibres in the controls.

99
Figure 4.14: IMC images from C01. Pseudo-coloured images of C01 at three different working concentrations: (a) 1/200, (b) 1/100 and (c) 1/50. Each panel displays a different channel containing the 9 different antibodies used. Scale bar 100µm.

100
Figure 4.15: IMC images at 1/50 dilution. Pseudo-coloured images for (a) C01, (b) C02 and (c) P01. Each panel displays a different channel containing the 9 different antibodies used and a DNA intercalator. Scale bar 50µm.

101
Figure 4.16: Merged IMC images for C01 and P01. Images were overlaid for NDUFB8 (complex I) (purple), MTCO1 (complex IV) (green), VDAC1 (mitochondrial mass) (red) and dystrophin (membrane marker) (white) in (a) C01 and (b) P01. An example deficient fibre is highlighted in the patient case by an *.Scale bar: 100µm.

102
4.4.2.2 Development of Mitocyto A problem that hindered the progression of IMC was the lack of an available analysis software.
Analysis software that were previously used by other groups such as MiCAT (Schapiro et al.,
2017), were not commercially available at the time and other packages that were considered
such as cell profiler, were difficult to adapt in order to accommodate for the type of analysis
that was required for IMC in skeletal muscle. Because of this it was decided that a new software
was needed in order to manage the data. The most important aspect of the software would be
the ability to segment the image so that single cell analysis could be undertaken. Enlisting the
help of Dr Yuchun Ding, a Matlab code was written which attempted image segmentation
(example in Figure 4.17), however it was apparent that the software did not easily segment all
fibres of interest and often included areas that were not suitable for analysis, therefore an
alternative analysis programme was developed.
Figure 4.17: Matlab image segmentation. Example segmentation of P01 using a Matlab script. Each segmented region is numbered. Note blank areas of the image that have been picked up for segmentation as well as fibres that have failed to be included (marked with an *). Scale bar: 100µm.

103
Analysis software to accompany IMC must include a number of key features - the most
prominent being a way to effectively segment the fibres for subsequent single cell analysis.
Working alongside Dr Conor Lawless, a computational biologist, a python based software
called Mitocyto was created and further refined for IMC
(https://github.com/CnrLwlss/mitocyto). The design and refinement of Mitocyto was a
collaborative effort while the actual coding of the software was carried out exclusively by Dr
Conor Lawless.
The concept behind Mitocyto is that a map of cell edges (an edgemap) is constructed and used
to identify areas corresponding to individual cells. The edgemap can be constructed
automatically, either directly from an image representing cell membranes (for example using
the dystrophin channel), from a thresholded version of an image, or from a gradient map
automatically constructed from a channel (or from an average of all available channels). The
edgemap can also be drawn by manual tracing over individual channel images (or over an
average of all available channels), using the mouse. Although using multiple channels is often
less successful at segmentation compared to the use of the cell membrane channel, it is valuable
when manually editing the edgemap to only include suitable fibres. Automatic construction of
an edgemap can be improved by manual editing of areas where edge signal is weak. It was
envisaged that the scenario where a first draft of the edgemap is constructed automatically,
followed by manual update, would be the most common workflow. This scenario is based on
past experience where occasionally the quality of the membrane markers have faltered meaning
that manual intervention has been necessary.
The edgemap is then used to identify distinct areas in the source images (also called contours)
corresponding to individual cells. This works by identifying areas in the edgemap which are
completely enclosed by an edge, and filtering these by size (areamin=500, areamax=17500),
circularity (circmin=0.0, circmax=100.0), aspect ratio (ratiomin=0.0, ratiomax=10.0) and
convexity (convexmin=0.75, convexmax=1.0) to ensure that the area morphologies are such
that they are likely, individual, transverse fibres sections. For each cell area and for each
available channel, average intensities are constructed, tabulated and written to an output file
(.csv format).
An example of the initial segmentation outcome is displayed in Figure 4.18a. Although the
software was successful in automatically segmenting the majority of fibres, a method to delete
contours where errors were induced was necessary. Therefore, Mitocyto was updated to allow
for manual deletion of contours. This could be achieved by either removal of the whole contour

104
(Figure 4.18b) which creates a white mask over the unwanted area, or by partial removal of
the fibre edge. Following from this, it was recognised that due to the lack of transparency of the
contours, it was difficult to determine whether selected fibres were suitable for subsequent
analysis. Therefore the software was again updated to include transparent contours which
allowed the fibres to be displayed (Figure 4.18c). Further to this another update permitted the
transparent contour map to be viewed on any channel/view, including the merged gradient map
of all available channels. A feature that the software was lacking was the merging of multiple
output files so that all cases could be read as one single file for subsequent analysis. As before,
this was solved with a new update of Mitocyto allowing the merging of multiple output files
into one large .csv.

105
Figure 4.18: Development of Mitocyto with addition of further factors. (a) Initial automatic segmentation of muscle fibres. (b) Update to include manual deletion of fibres and (c) a further update to include transparent contours.

106
4.4.2.3 Development of plotIMC After the development of Mitocyto permitting successful segmentation of individual muscle
fibres, there was a need to develop a tool that could deal with the increased complexity of the
multi-dimensional data generated by IMC. Again working alongside Dr Conor Lawless,
plotIMC was built - a novel, interactive web-tool using the R package shiny. Similar to before,
the design and any further alterations to plotIMC was a collaborative effort, whilst the actual
coding of the tool was carried out solely by Dr Conor Lawless. The web-tool has three views,
and by default, displays data as 2Dmito plots which are 2D scatter plots comparing the mean
signal intensity observed for one protein marker on the y-axis with a marker for mitochondrial
mass (VDAC1) on the x-axis (example patient in Figure 4.19). In order to account for
mitochondrial mass, using the 1m function in R, a linear regression model is generated between
values observed for the chosen protein marker and VDAC1 in all controls and the 95%
predictive interval around the regression is displayed. It was decided to classify fibres as being
affected by the mutation a patient harbours, if they lie outside the 95% predictive interval for
control fibres.

107
Figure 4.19: PlotIMC 2Dmito plot view showing expression of each antibody against a surrogate for mitochondrial mass. Example patient (P01) visualised in PlotIMC using the default 2Dmito plot view. One single-cell IMC measurement from the patient is represented by a coloured point in each panel. Control observations are in grey. Each plot represents an antibody observed during the IMC run. Points representing patient fibres are coloured for the ratio value (protein/VDAC1) of that fibre. Regression through the control data is drawn as a solid grey line and the 95% predictive interval for control fibres lies between the dashed grey lines. Total number of fibres above and below the confidence interval are written above each panel.

108
In order to quantitatively assess the data, a table is included which summarises the proportion
of fibres above, below or within the 95th percentile predictive interval for each channel
identified (See example Table 4.4). Further to this, due to the nature of respiratory chain
deficiencies, it was important to understand the relationship between the levels of different
proteins in the different channels and so an additional table is included which summarises the
proportion of fibres whose categories overlap pairwise for all proteins examined (see example
Table 4.5)
Table 4.4: Example table from PlotIMC displaying 95th percentile predictive interval. Example table from P01 with a POLG mutation.
Table 4.5: Example table demonstrating overlapping channels. Example table from P01 with a POLG mutation

109
As secondary views, plotIMC also presents data in two further stripchart views. Mean intensity
displays the raw mean intensity for the proteins observed in each fibre during image analysis
(example patient in Figure 4.20a), whilst theta displays the angle (degrees, anticlockwise)
made between coordinates representing each fibre, the origin and the x-axis in 2Dmito plot
(Figure 4.20b). For stripchart views, patient fibres can be coloured according to the expression
of the proteins selected in a ‘colour fibres by channel’ drop down menu with red fibres having
the lowest expression and blue fibres expressing the protein highly. Both examples in Figure
4.20 are coloured according to levels of NDUFB8.
Figure 4.20: Secondary data views on PlotIMC displaying mean intensity and theta views. (a) Mean intensity view on plotIMC and (b) theta view, worked out by calculating the angle (degrees, anticlockwise) made between coordinates representing each fibre, the origin and the x-axis in 2Dmito plot. One single-cell IMC measurement from the patient (P01) is represented by a coloured point in each panel. Control observations are in grey. Each plot represents an antibody observed during the IMC run. Points representing patient fibres are coloured for the ratio value (NDUFB8/VDAC1) for that fibre.

110
It was also important, due to the large multi-dimensional datasets produced by IMC, that
PlotIMC included a feature which allowed the user to independently highlight the most relevant
features. The ability of PlotIMC to select fibres of interest permits the user to not only assess
the link between individual fibres, but also, due to the different views available, observe a
number of different measurements in relation to the selected fibres. The selection of fibres in
one plot causes circles to be drawn around the position of those fibres in all channels throughout
all plots (example in Figure 4.21). Quantitative data for these selected fibres is also generated.
Figure 4.21: Example of selected fibres on PlotIMC. One single-cell IMC measurement from the patient (P01) is represented by a coloured point in each panel. Control observations are in grey. Each plot represents an antibody observed during the IMC run. Data presented using plotIMC theta (VDAC1) view. Points representing patient fibres are coloured for the ratio value (NDUFB8/VDAC1) for that fibre. Fibres of interest are selected and circled.

111
Due to the use of multiple antibodies for some targets, it was thought useful if PlotIMC
displayed a correlation matrix that showed Pearson’s correlation coefficients between channels
(example in Figure 4.22). This correlation changes depending what view is displayed, and also
adjusts when a subset of fibres are selected to include the correlations associated with those
fibres only.
Figure 4.22: Example correlation matrix generated using PlotIMC. Pearson’s correlation coefficients between expression levels of each pair of proteins for all fibres from the selected patient (P01) using the theta view. Points representing patient fibres are coloured for the ratio value (NDUFB8/VDAC1) for that fibre. Matrix coloured according to correlation: red = strong correlation and blue = weak correlation.
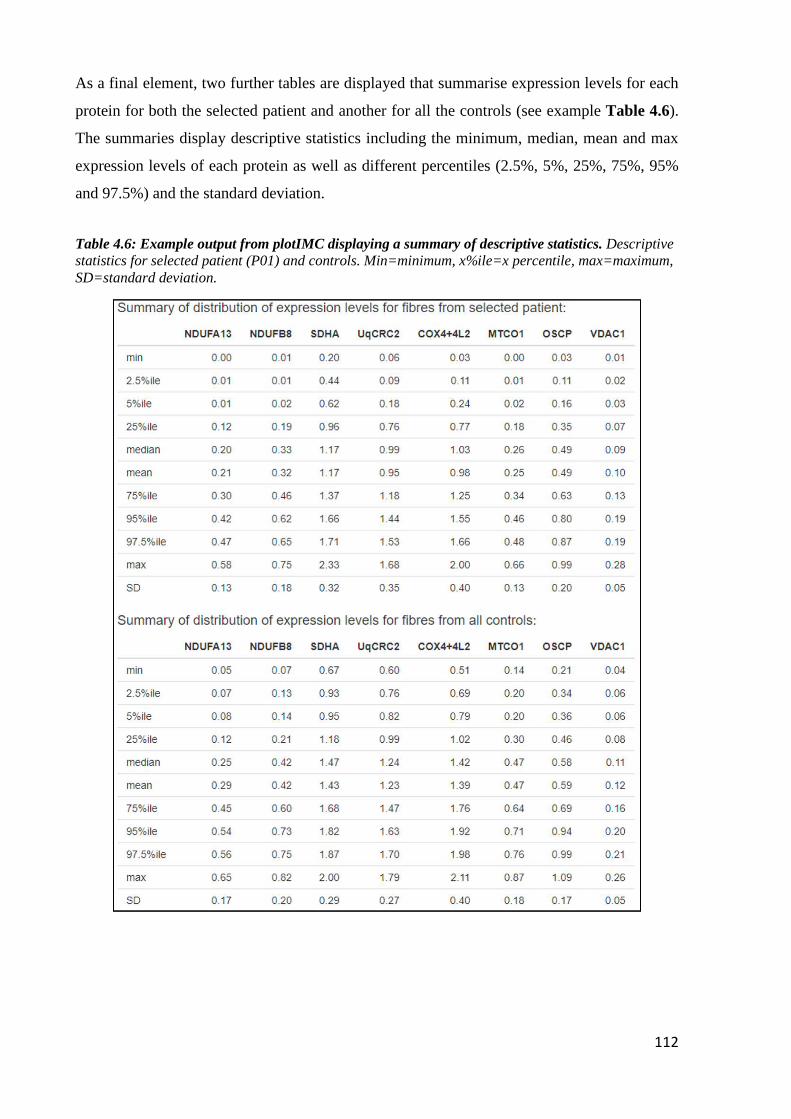
112
As a final element, two further tables are displayed that summarise expression levels for each
protein for both the selected patient and another for all the controls (see example Table 4.6).
The summaries display descriptive statistics including the minimum, median, mean and max
expression levels of each protein as well as different percentiles (2.5%, 5%, 25%, 75%, 95%
and 97.5%) and the standard deviation.
Table 4.6: Example output from plotIMC displaying a summary of descriptive statistics. Descriptive statistics for selected patient (P01) and controls. Min=minimum, x%ile=x percentile, max=maximum, SD=standard deviation.
113
4.5 Discussion
The chapter describes the optimisation of a novel use for imaging mass cytometry and
subsequent bespoke analysis. Exceeding previous techniques, it enables accurate quantification
of OXPHOS proteins spanning all five of the respiratory chain complexes (NDUBF8,
NDUFA13, SDHA, UqCRC2, MTCO1, COX4+4L2, OSCP) as well as a mitochondrial mass
marker (VDAC1), simultaneously in individual muscle fibres using 6µm sections. The use of
dystrophin and subsequent development of Mitocyto to segment individual fibres enables
automatic quantification of proteins with little need for manual intervention. Interacting with
and visualising large multi-dimensional datasets can be challenging, but by the development
and interactive nature of plotIMC, this challenge has been overcome and many different aspects
of IMC data can now be examined simultaneously.
4.5.1 Advantages of imaging mass cytometry
Many studies have assessed mitochondrial dysfunction by quantifying the abundance of
respiratory chain proteins, and in particular complexes I and IV (Rocha et al., 2015, Rocha et
al., 2018, Ahmed et al., 2017). The application of IMC to skeletal muscle accurately quantifies
the abundance of eight mitochondrial markers including proteins from all five complexes of the
respiratory chain in individual muscle fibres without the need for serial sectioning. This is a
huge advantage in that much less of the limited and valuable tissue is required – and this will
only become more evident as more antibodies are added to the panel. Furthermore, the removal
of serial sectioning eliminates the issue of any discrepancies created because of segmental
deficiency (Bua et al., 2006, Murphy et al., 2012). A number of characteristics make IMC
advantageous over other imaging techniques. There is no sample autofluorescence and due to
the use of rare earth metals, there is very little background signal. Furthermore, in contrast to
IHC, there is no need for an amplification step. With regards to sample preparation, the protocol
for IMC is very similar to that of IHC which will subsequently enable rapid implementation of
the new technique into muscle-based experiments. The automated capacity of IMC and
subsequent analysis will minimise user subjectivity and also experiment completion time –
something which will become much more apparent with a larger panel of antibodies. In order
to validate the expression of respiratory chain deficiency using this approach I have compared
the amount of deficiency using both the 95% predictive interval (used in IMC) and z-scores
(used in immunofluorescence). Further detail of this can be found in section 5.4.11.

114
4.5.2 Limitations of imaging mass cytometry
Although there are many advantages to IMC, the technique does not come without its
limitations. To start, a large amount of antibody is lost during the conjugation process with low
recovery rates post-conjugation. This not only has costing implications, but also affects the
binding ability of the antibody, which subsequently means that higher concentrations have to
be used in order for the antibody to work effectively (Han et al., 2018). The recovery rate of the
antibody varies quite heavily both between antibodies and between conjugations, and similar
to this study, other research groups have also struggled with finding the cause of this.
As a result of the conjugations, there were a number of antibodies that had to be removed from
this study due to insufficient staining - one of which being the mass marker TOMM20. As a
future way to counteract this limitation, higher concentrations could be used post conjugation.
Alternatively, after each conjugation, the antibody could be titrated to ensure the optimal
concentration was being used each time.
Another potential limitation of IMC is in the panel design. Although a much greater number of
targets can be assessed simultaneously compared to IHC, panels have to be carefully thought
out to ensure that there is no cross talk of signal between each target (Chevrier et al., 2018).
Cross talk or spill over in IMC is generally minimal in comparison to fluorescence-based
techniques, however the spill over effect still exists between different detection channels and
can be due to a number of different factors including isotope purity, oxide formation (M+16)
and abundance sensitivity (M±1). The percentage overlap of all metal tags in all channels has
been quantified by Fluidigm, and the subsequent matrix is displayed in Figure 4.23. Whilst this
is not a problem for this study currently, as the number of targets included in the panel increases,
this has the potential to become more of an issue and is something to consider in the future.

115
Figure 4.23: Matrix displaying percentage crosstalk for metal tags. The signal overlap is indicated: blue boxes ≥ 0.5%, clear boxes ≤ 0.5%. Mass Channels are in columns and Mass Tag probes are in rows. For Mass Tags: Colour indicates probes that contribute ≥ 0.5% crosstalk into no channels (green), one or two channels (yellow), or more than two channels (orange). For Mass Channels: Colour indicates channels receiving ≥ 0.5% crosstalk from no probes (green), one or two channels (yellow), or more than two channels (orange). Images adapted from Fluidigm with extra information courtesy of FCCF Newcastle.

116
4.5.3 Potential applications
The use of IMC in skeletal muscle has a great potential in future experiments. The ability to
simultaneously measure up to 40 proteins means that a great number of targets can be assessed
with complete certainty that measurements are made from the same muscle fibre. It is
anticipated that IMC be used to not only assess mitochondrial respiratory chain deficiency in
skeletal muscle of patients with various mitochondrial diseases, but with the addition of more
targets, to assess the consequence of respiratory chain deficiency on downstream signalling
pathways within the cell. This assessment of signalling can be coupled to genetic analysis to
investigate the effect of heteroplasmy on the cell.
Imaging mass cytometry can also be used in conjunction with other technologies. RNAscope is
an in situ hybridization assay for detection of target RNA within intact cells (Wang et al., 2012).
Generally, RNAscope employs the use of fluorescent probes however there is potential to
couple this with IMC and replace the fluorescent markers with heavy metals. Again, this would
have a positive impact on the number of targets that can be measured in a single experiment.

117
Chapter 5 : Understanding multi-dimensional respiratory
chain deficiency phenotypes in single skeletal muscle fibres
using imaging mass cytometry

118
5.1 Introduction
Mitochondrial diseases are a heterogeneous group of disorders that are characterised by defects
in oxidative phosphorylation (OXPHOS) and although they can present in any tissue, they
predominantly affect the most energy demanding tissues such as the brain and skeletal muscle
(Gorman et al., 2016). Mitochondrial diseases can either be caused by mutations in
mitochondrial DNA (mtDNA) or nuclear DNA (nDNA) genes.
Both mitochondrial and nuclear genetic variants can lead to either isolated respiratory chain
deficiencies (affecting one complex of the respiratory chain) or combined deficiency (affecting
multiple complexes). With complex I being the largest of the respiratory chain complexes, it is
not surprising that deficiency in this complex is the most common biochemical phenotype in
patients with mitochondrial disease (Janssen et al., 2006). Isolated complex I deficiencies are
the most common OXPHOS defects accounting for up to a third of all OXPHOS disorders
(Loeffen et al., 2000), followed by isolated complex IV deficiencies (Diaz, 2010), and less
commonly in complexes II, III and V. Isolated deficiencies can be attributed to mutations in
structural subunits (of mtDNA or nuclear origin) or in nuclear-encoded assembly factors
necessary for the formation of a complex. Not surprisingly, patients with isolated deficiency
present biochemically with a severe loss of subunit immunoreactivity in the affected complex
(Ahmed et al., 2017).
Combined deficiencies are generally caused by either single, large-scale mtDNA deletions or
point mutations in mt-encoded tRNAs or rRNAs (Chinnery et al., 2000) as well as mutations in
nuclear genes. Single, large-scale mtDNA deletions account for around 16% of all adult
mtDNA mutations (Gorman et al., 2015) and are associated with a number of clinical
phenotypes including CPEO, Pearson’s syndrome and Kearns-Sayre syndrome. The
biochemical phenotype of the patients will not only depend on the size and location of the
deletion but also how many genes are knocked out, and the associations these have to specific
complexes. Rocha et al. (2018) have grouped single, large-scale mtDNA deletions into three
classes with very distinct patterns of respiratory chain deficiency, determined by the size and
location of the mtDNA deletion. In their study, in all patients from class I, the deletions
consistently removed five to six tRNA genes, four to five complex I genes and one complex IV
gene, and patients were shown to have equal downregulation of both complex I and complex
IV. In class II, deletions removed three to four tRNA genes and three to four complex I genes
while all complex IV genes were preserved which explains why these patients had a more
pronounced loss of complex I than complex IV. In class III, the deletions removed six to eight

119
tRNA genes, two to four complex I genes, two complex V genes and all complex IV genes. The
loss of all complex IV genes in class III can explain why these patients had a more severe loss
of complex IV than complex I (Rocha et al., 2018).
The m.3243A>G MT-TL1 point mutation is thought to affect 1 in 12,800 adults and is the most
prevalent point mutation of mtDNA (Gorman et al., 2015). Biochemically, studies identify
reduced activities of both complex I and complex IV in muscle biopsies of patients with
m.3243A>G, with a much more severely affected complex I than complex IV (Rocha et al.,
2015, Mariotti et al., 1995). The effect of the m.3243A>G mutation on both complex II
(encoded by nuclear DNA) and complexes III and V (encoded by mtDNA), is less clear and
although a number of studies demonstrate a decrease in these complexes in response to the
mutation (Jiang et al., 2015, Sasarman et al., 2008), this is often investigated using cell lines
and not directly in patient muscle. Mutations in other mitochondrial-encoded tRNAs present
biochemically with much greater heterogeneity than m.3243A>G mutations and, although
reduced levels of complex I and complex IV are generally observed, the pattern of this
deficiency varies between different mutations (Rocha et al., 2015). Furthermore, the levels of
deficiency will also depend on the amounts of the associated amino acid within each of the mt-
encoded complex I and IV proteins. The heterogeneity of these mutations means that the
resultant biochemical defects vary considerably and there has been no group of studies that
show a very clear pattern of deficiency with regards to the other respiratory chain complexes.
Current techniques used to investigate mitochondrial diseases rely on histochemical and
immunofluorescent methods which have allowed measurements of biochemical deficiency at
both single cell and sub-cellular resolution (Old and Johnson, 1989, Rocha et al., 2015, Vincent
et al., 2018). Although these methods have been used to uncover patient-specific patterns of
respiratory chain deficiency, the limitation of immunofluorescence (IF) and conventional
immunohistochemistry is the small number of proteins that can be assessed at a single cell level
on one tissue section due to the possible bleed through of channels. Furthermore, the use of
secondary antibodies together on one section is only possible if the primary species differ and
because of this, the number of proteins that can be measured simultaneously is limited to four.
To overcome the limitations of other techniques, imaging mass cytometry can be used to
effectively quantify mitochondrial dysfunction in skeletal muscle and to study the relationship
between the individual complexes simultaneously.

120
5.2 Aims of the study
The aims of this chapter were as follows:
• To validate the use of IMC in skeletal muscle by comparing results to the established
immunofluorescent assay
• To use IMC to look at multi-dimensional respiratory chain phenotypes in patients with
various mitochondrial mutations

121
5.3 Methods
5.3.1 Patient cohort
Skeletal muscle samples were taken from the vastus lateralis of patients with clinically and
genetically-characterised mitochondrial diseases of either mtDNA or nuclear genetic origin.
For the initial cohort, patients were grouped based on the type of mutation: single, large-scale
mtDNA deletion (n=2), m.3243A>G MT-TL1 (n=3), mutations in other, less common
mitochondrial-encoded tRNAs (m.10010T>C MT-TG (n=1), m.14709T>C MT-TE (n=1) and
m.5543T>C MT-TW (n=1)) and pathogenic nDNA variants in complex I (CI) assembly factors
(n=2). Additional patients were later included; pathogenic nDNA variants in complex II (CII)
assembly factors (n=2), pathogenic nDNA variants in complex IV (CIV) assembly factors (n=2)
and pathogenic nDNA variants in complex V (CV) assembly factors (n=2).
Ethical approval for use of mitochondrial disease patient tissue was granted by the Newcastle
and North Tyneside Local Research Ethics Committee (reference 16NE/0267). Control tissue
was acquired from the distal part of the hamstring muscle from individuals undergoing anterior
cruciate ligament surgery following approval by the Newcastle and North Tyneside Local
Research Ethics Committee (reference 12/NE/0394). Information about all patients and control
cases presented in this chapter are displayed in Tables 5.1 and 5.2.
5.3.2 Antibodies and panel design
A panel was designed to include antibodies that specifically targeted a number of mitochondrial
proteins as well as a fibre membrane marker. Of the eight mitochondrial antibodies included,
seven targeted proteins involved in complexes I-V (CI-CV) of the mitochondrial oxidative
phosphorylation machinery and one targeted a mitochondrial outer membrane protein which
acted as a surrogate for mitochondrial mass. As described in section 4.4.1.2, before conjugation,
each antibody was ranked based on its expression levels for the targeted protein and based on
these results, was subsequently paired with a metal using the protocol described in section 4.3.4.
A full list of the antibodies used in this chapter is displayed in Table 5.3.

122
Table 5.1: Patient information. Information on patients and controls detailing gender, age at biopsy, clinical information and genetic defect.
Subjects Gender Age Clinical information Genetic defect Heteroplasmy level
Nuclear-encoded mutations affecting complex I (taken from the vastus lateralis)
P01
M
Adult
Exercise intolerance, unable to perform sustained aerobic exercise normal resting lactate, normal CK
TMEM126B Homozygous c.635G>T,
p.(Gly212Val)
n/a
P02
M
Adult
Exercise intolerance, muscle
cramps, elevated serum lactate
ACAD9 Compound heterozygous
c.1150G>A, p.(Val384Met) and c.1168G>A, p.(Ala390Thr)
n/a
Single, large-scale mtDNA mutations (taken from the vastus lateralis)
P03
F
29yrs
CPEO and bilateral ptosis
Deletion size: 4372bp Breakpoints: 8929-13301
mtDNA deletion level: 53%
53%
P04
F
39yrs
CPEO, diplopia
Deletion size: 7498bp Breakpoints: 7130-14628
mtDNA deletion level: 28%
28%
Point mutations in mitochondrial-encoded tRNA leucine (MT-TL1) (taken from the vastus lateralis)
P05 F 25yrs Exercise intolerance, ptosis m.3243A>G MT-TL1 mutation
66%
P06 F 47yrs Modest exercise intolerance m.3243A>G MT-TL1 mutation
34%
P07 M 53yrs CPEO m.3243A>G MT-TL1 mutation
74%
Point mutations in other mitochondrial-encoded tRNAs (taken from the vastus lateralis)
P08 M 33yrs Mitochondrial myopathy m.10010T>C MT-TG mutation
89%
P09 F 35yrs Mild weakness m.14709T>C MT-TE mutation
76%
P10 M 63yrs Exercise intolerance, prominent exertional dyspnea
m.5543T>C MT-TW mutation
n/a
Healthy controls (taken from the tibialis anterior)
C01 M 20yrs Taken during anterior cruciate ligament surgery
C02 M 24yrs Taken during anterior cruciate ligament surgery
C03 F 23yrs Taken during anterior cruciate ligament surgery
CK; Creatine kinase, CPEO; Chronic progressive external ophthalmoplegia, MILS; Maternally inherited Leigh syndrome, n/a; not applicable, NARP; Neuropathy, ataxia and retinitis pigmentosa,

123
Table 5.2: Patient information. Information on patients and controls detailing gender, age at biopsy, clinical information and genetic defect.
Subjects Gender Age Clinical information Genetic defect
Nuclear-encoded mutations affecting complex II (taken from the vastus lateralis)
P11 M 3yrs Cardiomyopathy, hypotonia, myopathy CII SDHB
P12 M 1 day Cardiomyopathy CII SDHD
Nuclear encoded mutations affecting complex IV (taken from the vastus lateralis)
P13 M 6 months NARP/MILS, cardiomyopathy, hypotonia, myopathy
CIV SCO2
P14 F 15 months Encephalopathy, hypotonia CIV SURF1
Nuclear encoded mutations affecting complex V (taken from the vastus lateralis)
P15 F 5 months Cardiomyopathy CV TMEM70
P16 n/a 4 months Congenital lactic acidosis CV TMEM70
Healthy controls (taken from the tibialis anterior)
C03 F 23yrs Taken during anterior cruciate ligament surgery
C04 M 22yrs Taken during anterior cruciate ligament surgery
C05 F 23yrs Taken during anterior cruciate ligament surgery
C06 M 4yrs Taken for diagnostic investigation but no mitochondrial dysfunction present
MILS; Maternally inherited Leigh syndrome, NARP; Neuropathy, ataxia and retinitis pigmentosa,

124
Table 5.3: List of primary and secondary antibodies. Detail on antibody host, dilution and supplier is provided.
Antibodies Host and isotype Dilution Company
Protein target/ Primary antibodies
Membrane marker: Laminin Rabbit 1:50 Sigma-Aldrich (L9393)
Membrane marker: Dystrophin Mouse 1:50 EMD Millipore (Mab 1645)
Complex I: NDUFB8 Mouse IgG1 1:50 (IMC) 1:100 (IF) Abcam (110242)
Complex I: NDUFA13 Mouse IgG2b 1:50 (IMC) 1:100 (IF) Abcam (110240)
Complex II: SDHA Mouse IgG1 1:50 (IMC) 1:100 (IF) Abcam (14715)
Complex III: UqCRC2 Mouse IgG1 1:50 (IMC) 1:100 (IF) Abcam (14745)
Complex IV: MTCO1 Mouse IgG2a 1:50 (IMC) 1:100 (IF) Abcam (14705)
Complex IV: COX4+4L2 Mouse IgG2a 1:50 (IMC) 1:100 (IF) Abcam (110261)
Complex V: OSCP Mouse IgG1 1:50 (IMC) 1:100 (IF) Abcam (110276)
Mass marker: VDAC1 Mouse IgG2b 1:50 (IMC) 1:100 (IF) Abcam (14734)
Secondary antibodies
Anti-rabbit Alexa Fluor 405nm Goat 1:100 Life Technologies (A31556)
Anti-IgG2a Alexa Fluor 488nm Goat 1:200 Life Technologies (A21131)
Anti-IgG2b Alexa Fluor 546nm Goat 1:200 Life Technologies (A21143)
Anti-IgG1 biotin Goat 1:200 Life Technologies (A10519)
Streptavidin Alexa Fluor 647nm Goat 1:100 Life Technologies (S32357)
Anti-IgG1 Alexa Fluor 647nm Goat 1:200 Life Technologies (AA21240)
Anti-mouse IgG Alexa Fluor 488nm
Goat 1:200 Life Technologies (A11001)

125
5.3.3 Muscle biopsy and cryo-sectioning
6µm serial sections were obtained from transversely orientated muscle blocks as described in
section 2.2.3.
5.3.4 Preparation of samples for immunofluorescence
Sections were prepared for immunofluorescence as described in section 2.2.5. Since many of
the antibodies had the same isotypes, serial sections were incubated with five different
combinations of primary antibodies to account for any overlap (see Table 5.4). Each antibody
was diluted at 1:50. Following overnight incubation and subsequent washes, the sections were
incubated with secondary antibodies diluted to a working concentration.
Table 5.4: Immunofluorescent antibody combinations. Combinations of metal-conjugated antibodies used in quadruple immunofluorescence.
Combination 1 Combination 2 Combination 3 Combination 4 Combination 5
Laminin Laminin Laminin Laminin Laminin
NDUFB8 NDUFB8 SDHA OSCP UQCRC2
MTCO1 COX4+4L2 MTCO1 MTCO1 MTCO1
VDAC1 VDAC1 NDUFA13 VDAC1 VDAC1
5.3.5 Imaging and analysis of samples prepared for immunofluorescence
Samples were imaged using the Zeiss Axio Imager M1 as described in section 2.2.6 and images
were segmented using an in-house Quadruple Immunoanalyser Software as previously
described (Ahmed et al., 2017). In brief the software segments muscle fibres based on
membrane labelling and extracts average fluorescent intensities for each single cell.
5.3.6 Preparation of samples for imaging mass cytometry
The protocol used for preparing the samples for IMC (see section 4.3.6) was adapted from the
quadruple IHC protocol (Rocha et al., 2015). In brief, tissues were removed from -80°C storage
and left to air dry for one hour before being fixed with 4% paraformaldehyde (Sigma) for 3
minutes. Next sections were permeabilised by dehydration and rehydration in a methanol
gradient as follows: 70% for 10 minutes, 95% for 10 minutes, 100% for 20 minutes, 95% for
10 minutes, 70% for 10 minutes. Following washes, sections were blocked for any endogenous

126
protein by incubation with 10% normal goat serum (NGS) for one hour at RT before overnight
incubation with the metal-conjugated antibody panel (all antibodies were used after a 1/50
dilution in 10% NGS) at 4°C. Following thorough washes in TBST, sections were stained with
an Ir intercalator for 30 minutes at RT, washed quickly with ddH2O for 5 minutes and air dried
ready for use on the IMC.
5.3.7 Imaging mass cytometry
ROIs were selected for each muscle section and each patient was run in turn on the IMC. In
every case, the ROI covered as much of the tissue section as possible so that fibres could be
matched to their immunofluorescent equivalent on a serial section. The technical set up of the
instrument is described in section 4.3.6. After successful ablation files were exported in their
native “MCD” file format and processed to single layer TIFFs (16-bit) using MCD viewer
software (Fluidigm).
5.3.8 Analysis of imaging mass cytometry data
The data generated from the imaging mass cytometer was initially opened in MCD viewer
(Fluidigm) and subsequently exported as TIFF files for further analysis. Each image had a
resolution of 1 pixel per 1μm2, which is determined by the size of the laser spot. As described
in detail in the previous chapter, images were segmented using the custom-made image analysis
software Mitocyto (mitocyto: https://github.com/CnrLwlss/mitocyto). Image segmentation was
automatically generated using the dystrophin channel or from a map of the mean of all channels.
Segmentation was further refined manually when signal was too weak for identification of cell
membranes. Following segmentation, average signal intensity for each channel and each cell
was reported in an output file for further analysis.
Any further analysis was carried out using the plotIMC web-tool which is described in detail in
chapter 4.

127
5.4 Results
5.4.1 Successful imaging of patient cohort
A cross sectional muscle section from 10 patients with various clinically and genetically-
characterised mitochondrial diseases of either mtDNA or nuclear genetic origin (single, large-
scale mtDNA deletion (n=2), m.3243A>G MT-TL1 (n=3), mutations in other, less common
mitochondrial-encoded tRNAs (m.10010T>C MT-TG (n=1), m.14709T>C MT-TE (n=1) and
m.5543T>C MT-TW (n=1)) and pathogenic nDNA variants in complex I (CI) assembly factors
(n=2)) were run on the imaging mass cytometer alongside three control cases. The subsequent
TIFF files from a representative control and patient from each patient group are displayed in
Figure 5.1. Although all nine proteins are measured, due to the lack of colours available for the
overlay, the images show a merge of the four channels commonly used in immunofluorescence
(NDUFB8, MTCO1, VDAC1 and a membrane marker) and successfully demonstrates the
technique is feasible on human skeletal muscle.
Figure 5.1: Example patient from each patient group imaged using IMC. (a) C03, (b) P07 with a m.3243A>G point mutation in MT-TL1, (c) P04 with a 7498bp single, large-scale deletion from regions 7130-14628, (d) P09 with a m.14709T>C point mutation in other mt-encoded tRNA (MT-TE), (e) P02 with a nuclear-encoded ACAD9 mutation affecting complex I. Image displays merged channels for four proteins: NDUFB8 (purple), MTCO1 (green), VDAC1 (red) and dystrophin (white). Scale bar: 500µm.

128
5.4.2 Validation of imaging mass cytometry
Because IMC has not been used to investigate skeletal muscle previously, it was pivotal that
the results generated by IMC were validated against the established quadruple IHC. To assess
whether quantification of changes in mitochondrial protein expressions were comparable
between IHC and IMC, serial sections were stained with the same cocktail of antibodies and
analysed using the two techniques (example area of a patient section in Figure 5.2). Visually,
both methods appeared to produce reproducible staining patterns (Figure 5.2).
Figure 5.2: Comparison of images generated by IHC and IMC. Intensities scaled for each individual channel to fill bit-depth range for display and then merged. (a) IHC and (b) IMC carried out on serial sections of skeletal muscle tissue from P04 using antibodies recognising the indicated markers and an overlay of all analysed channels. Scale bars; 50 μm. Resolution: 1pixel/µm (IMC), 3.10pixel/µm (IHC).
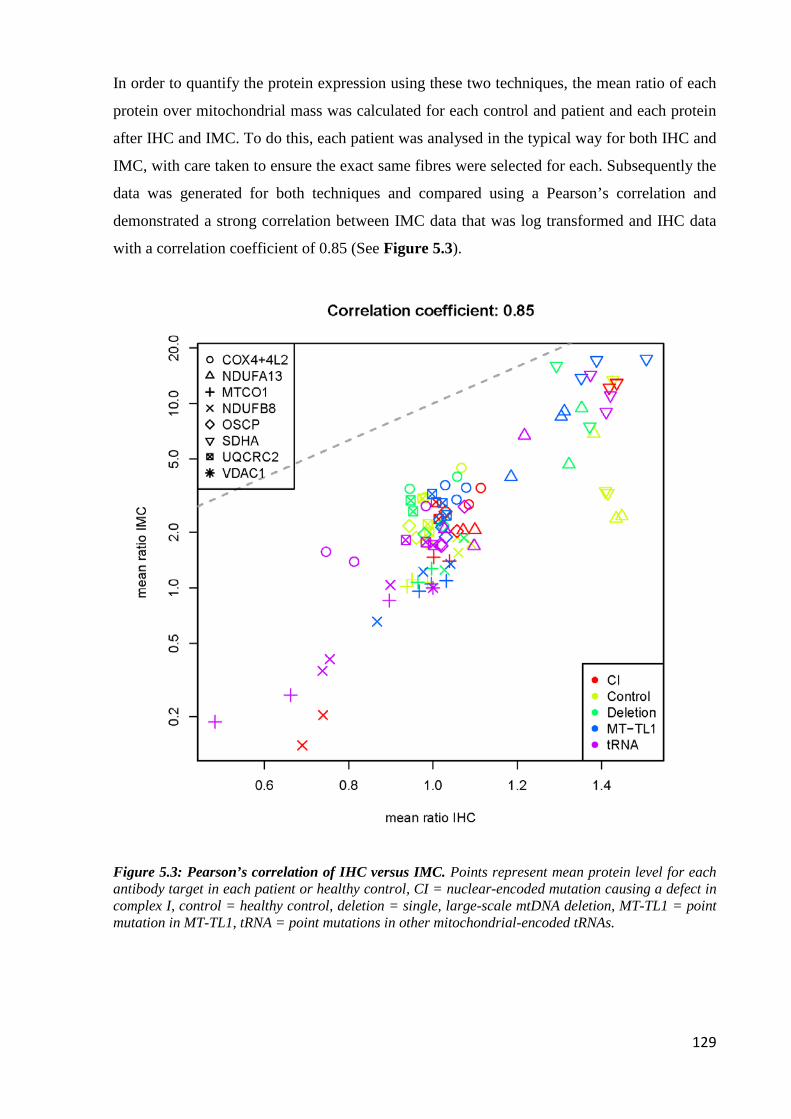
129
In order to quantify the protein expression using these two techniques, the mean ratio of each
protein over mitochondrial mass was calculated for each control and patient and each protein
after IHC and IMC. To do this, each patient was analysed in the typical way for both IHC and
IMC, with care taken to ensure the exact same fibres were selected for each. Subsequently the
data was generated for both techniques and compared using a Pearson’s correlation and
demonstrated a strong correlation between IMC data that was log transformed and IHC data
with a correlation coefficient of 0.85 (See Figure 5.3).
Figure 5.3: Pearson’s correlation of IHC versus IMC. Points represent mean protein level for each antibody target in each patient or healthy control, CI = nuclear-encoded mutation causing a defect in complex I, control = healthy control, deletion = single, large-scale mtDNA deletion, MT-TL1 = point mutation in MT-TL1, tRNA = point mutations in other mitochondrial-encoded tRNAs.

130
5.4.3 Reproducibility of imaging mass cytometry
It was essential to test whether the data that was generated by IMC was reproducible. To
investigate this, three repeats were examined. The first replicate was carried out with one batch
of reagents and conjugations, and the further two replicates were carried out with a different
batch of reagents and conjugations to the first, but identical to one another. Data generated from
the two replicates that used the same batch of conjugations showed excellent reproducibility
with a correlation coefficient of 0.98 (Figure 5.4c). Comparing the first replicate to the further
replicates that used a different batch of conjugations was less reproducible but still
demonstrated positive correlations of 0.87 (between replicate one and replicate two) (Figure
5.4a) and 0.87 (between replicate one and replicate three) (Figure 5.4b).

131
Figure 5.4: Correlation plots to determine the reproducibility of IMC experiments. Scatterplots comparing theta measures of protein expression between two replicate IMC experiments. Pearson’s correlation coefficient reported on top of each panel. Each dot represents the mean theta of one antibody from each control and each patient. Controls are depicted by grey dots and patients are depicted by pink dots. (a) Initial experiment (replicate 1) and replicate 2, (b) Replicate 1 and replicate 3, (c) Replicate 2 and replicate 3. Reagents were kept the same between replicate 2 and replicate 3 but different antibody conjugations were used between replicate 1 and both the repeats (replicates 2 and 3).

132
5.4.4 Visualising biochemical phenotypes of mitochondrial patients using
IMC
After confirming that IMC results were reproducible and consistent with those obtained using
immunofluorescence, the data could then be analysed in more depth. To deal with the increased
complexity and multi-dimensional nature of the IMC data, several different approaches were
investigated.
Data generated from the IMC is similar to the data that is generated in flow cytometry and so
clustering analysis (a standard cytometry methodology) was attempted. Dr Conor Lawless
carried out k-means global clustering on the full IMC dataset but with little success. k-means
identified fibres from patients with nuclear-encoded CI variants (Figure 5.5 cluster 4), but
was unable to identify any other patient groups with mtDNA mutations. It was suspected that
this was because of different mutations loads in individual fibres causing a mosaic pattern of
deficiency rather than the easily classifiable OXPHOS states that are seen with nuclear
mutations.
Figure 5.5: k-means global clustering. k-means clustering of patients and controls using the ratio of each target/VDAC1.

133
Because of this, plotIMC was used for all further data exploration. For detail on the
development of plotIMC see chapter 4. In brief, plotIMC uses two related approaches to
analyse data and account for mitochondrial mass. The first approach is visual inspection of
2Dmito plots which are scatterplots comparing cell-average IMC measurements for each
antibody target observed during the IMC run with a surrogate for mitochondrial mass
(VDAC1). The second approach is to examine the angle (theta) that each fibre in a 2Dmito plot
makes with the origin (0,0) and the x-axis. Theta represents the level of expression relative to
mitochondrial mass. In both views, each point represents a single fibre – grey points represent
fibres from the controls and the patient points can be colour coded according to the expression
of the proteins selected in the ‘colour fibres by channel’ drop down menu.
5.4.5 Patients with nuclear-encoded complex I variants
P01 and P02 presented with nuclear-encoded mutations in assembly factors TMEM126B and
ACAD9 respectively. Assessing their biochemical phenotype using the theta view in plotIMC
demonstrated that both patients had much lower levels of complex I proteins compared to the
controls (Figure 5.6). Quantitatively, 100% of fibres fall below the 95% predictive interval for
both NDUFB8 and NDUFA13. Interestingly both patients exhibit an upregulation of proteins
involved in the other complexes (CII-CV) in response to CI deficiency when compared to
controls. 98.5%, 97.9%, 84.9% and 99.1% of fibres lie above the 95% predictive interval for
SDHA, UqCRC2, MTCO1 and OCSP respectively for P01 (Figure 5.7) and 70.2%, 71%,
88.9% and 61.5% of fibres lie above the 95% predictive interval for SDHA, UqCRC2, MTCO1
and OCSP respectively for P02 (Figure 5.8). Furthermore, there was a very strong correlation
(0.95 and 0.93 for P01 and P02 respectively) between the two CI antibodies NDUFB8 and
NDUFA13.

134
Figure 5.6: Biochemical profile of patients with nuclear-encoded CI variants causing isolated CI deficiency. Data presented using plotIMC theta (VDAC1) view. (a) P01 with a mutation in TMEM126B and (b) P02 with a mutation in ACAD9. One single-cell IMC measurement from the patient is represented by a coloured point in each panel. Control observations are in grey. Each plot represents an antibody observed during the IMC run. Points representing patient fibres are coloured for the NDUFB8 value for that fibre. Images from each patient showing NDUFB8 (purple) and dystrophin (white) staining are also shown. Note the lack of staining for NDUFB8, indicative of complete CI deficiency.

135
Figure 5.7: 2Dmito plot from P01 with a TMEM126B mutation affecting complex I. 2Dmito plots from P01 comparing OXPHOS targets against VDAC1: (a) NDUFA13, (b) NDUFB8, (c) SDHA, (d) UqCRC2, (e) COX4+4L2, (f) MTCO1, (g) OSCP. Individual single-cell IMC measurements from each patient is represented by a coloured point in each panel. Control observations are in grey. Points representing patient fibres are coloured for by theta NDUFB8 for that fibre. Regression through the control data is drawn as a solid grey line and the 95% predictive interval for control fibres lies between the dashed grey lines. Total number of fibres above and below the control predictive interval are written above each panel.

136
Figure 5.8: 2Dmito plot from P02 with a ACAD9 mutation affecting complex I. 2Dmito plots from P01 comparing OXPHOS targets against VDAC1: (a) NDUFA13, (b) NDUFB8, (c) SDHA, (d) UqCRC2, (e) COX4+4L2, (f) MTCO1, (g) OSCP. Individual single-cell IMC measurements from each patient is represented by a coloured point in each panel. Control observations are in grey. Points representing patient fibres are coloured for by theta NDUFB8 for that fibre. Regression through the control data is drawn as a solid grey line and the 95% predictive interval for control fibres lies between the dashed grey lines. Total number of fibres above and below the control predictive interval are written above each panel.

137
5.4.6 Patients with single, large-scale mtDNA mutations
P03 and P04 had heteroplasmic single, large-scale mtDNA deletions removing regions m.8929-
13301 and m.7130-14628, respectively (Figure 5.9). P03 had an mtDNA deletion level of 28%
and P04 had an mtDNA deletion level of 53%.
Figure 5.9: Location of single, large-scale mtDNA deletions for P03 and P04. Location and size of the mtDNA deletion from individual patients: P03 deletion size 4372bp, breakpoints: m.8929-13301, mtDNA deletion level: 28% and P04; deletion size 7498bp, breakpoints: m.7130-14628, mtDNA deletion level: 53%. The mtDNA is colour-coded by gene-type: CI genes; orange, CIII genes; red, CIV genes; green, CV genes; blue and tRNA genes (dark blue).

138
P03 has the smallest deletion removing four CI genes, one CIV gene and five tRNAs and shows
very little deficiency (Figure 5.10), with only 4.6% of fibres falling below the 95% predictive
interval for NDUFB8 (Figure 5.10 panel b) which is lower for NDUFA13 (2.4%) (Figure 5.10
panel a) and MTCO1 (2.7%) (Figure 5.10 panel f).
Figure 5.10: 2Dmito plot from P03 with a single, large-scale mtDNA deletion removing regions m.8929-13301. 2Dmito plots from P03 comparing OXPHOS targets against VDAC1: (a) NDUFA13, (b) NDUFB8, (c) SDHA, (d) UqCRC2, (e) COX4+4L2, (f) MTCO1, (g) OSCP. Individual single-cell IMC measurements from each patient is represented by a coloured point in each panel. Control observations are in grey. Points representing patient fibres are coloured for by theta NDUFB8 for that fibre. Regression through the control data is drawn as a solid grey line and the 95% predictive interval for control fibres lies between the dashed grey lines. Total number of fibres above and below the control predictive interval are written above each panel.

139
P04 (Figure 5.11) has a larger deletion removing four CI genes, two CIV genes, two CV genes
and seven tRNAs. P04 has a more obvious subpopulation of deficient fibres (Figure 5.12) with
a greater percentage (28.3% and 5.5%) of fibres falling below the 95% predictive interval for
NDUFB8 and NDUFA13 respectively and similar to P03, a lower proportion of fibres are
deficient for CIV (5.6% and 6.8% respectively for COX4+4L2 and MTCO1). Interestingly,
discrepancies were observed between the two complex I markers, with NDUFB8 appearing to
be more affected than NDUFA13 in both patients. This is highlighted in P04 with 5.1 times
more fibres falling below the 95% predictive interval for NDUFB8 compared to NDUFA13.
Furthermore, looking at P04 using the ‘colour fibres by channel’ tool it appeared as if there was
an upregulation of complex II in response to CI and IV deficiency. This was confirmed by
selecting fibres with an upregulation in CII (theta > 80° for SDHA). Selecting these fibres
revealed that the fibres presenting with a theta of above 80° for SDHA were the same fibres
demonstrating the most deficiency in CI and IV (theta <40° for NDUFB8 and MTCO1).
Although a slight upregulation of CIII and CV was observed in P04, there is no clear trend in
these complexes in response to deficiency.
Figure 5.11: Theta plot of P04 with a single, large-scale deletion removing regions m.7130-14628. Data presented using plotIMC theta (VDAC1) view. P04 harbouring a deletion affecting breakpoints m.7130-14628. One single-cell IMC measurement from the patient is represented by a coloured point in each panel. Control observations are in grey. Each plot represents an antibody observed during the IMC run. Points representing patient fibres are coloured for the NDUFB8 value for that fibre.

140
Figure 5.12: 2Dmito plot from P04 with a single, large-scale mtDNA deletion removing regions m.7130-14628. 2Dmito plots from P04 comparing OXPHOS targets against VDAC1: (a) NDUFA13, (b) NDUFB8, (c) SDHA, (d) UqCRC2, (e) COX4+4L2, (f) MTCO1, (g) OSCP. Individual single-cell IMC measurements from each patient is represented by a coloured point in each panel. Control observations are in grey. Points representing patient fibres are coloured for by theta NDUFB8 for that fibre. Regression through the control data is drawn as a solid grey line and the 95% predictive interval for control fibres lies between the dashed grey lines. Total number of fibres above and below the control predictive interval are written above each panel.

141
5.4.7 Patients with point mutations in mt-encoded tRNA Leucine (MT-TL1)
P05, P06 and P07 had the common m.3243A>G MT-TL1 mtDNA point mutation affecting the
mitochondrial-encoded tRNA Leucine. Theta plots for each patient are presented in Figure 5.13
and show that each patient within the group have a very similar biochemical profile.
Figure 5.13: Biochemical profile of patients with an m.3243A>G point mutation in MT-TL1. Data presented using plotIMC theta (VDAC1) view. (a) P05, (b) P06 and (c) P07. One single-cell IMC measurement from the patient is represented by a coloured point in each panel. Control observations are in grey. Each plot represents an antibody observed during the IMC run. Points representing patient fibres are coloured for the NDUFB8 value for that fibre.
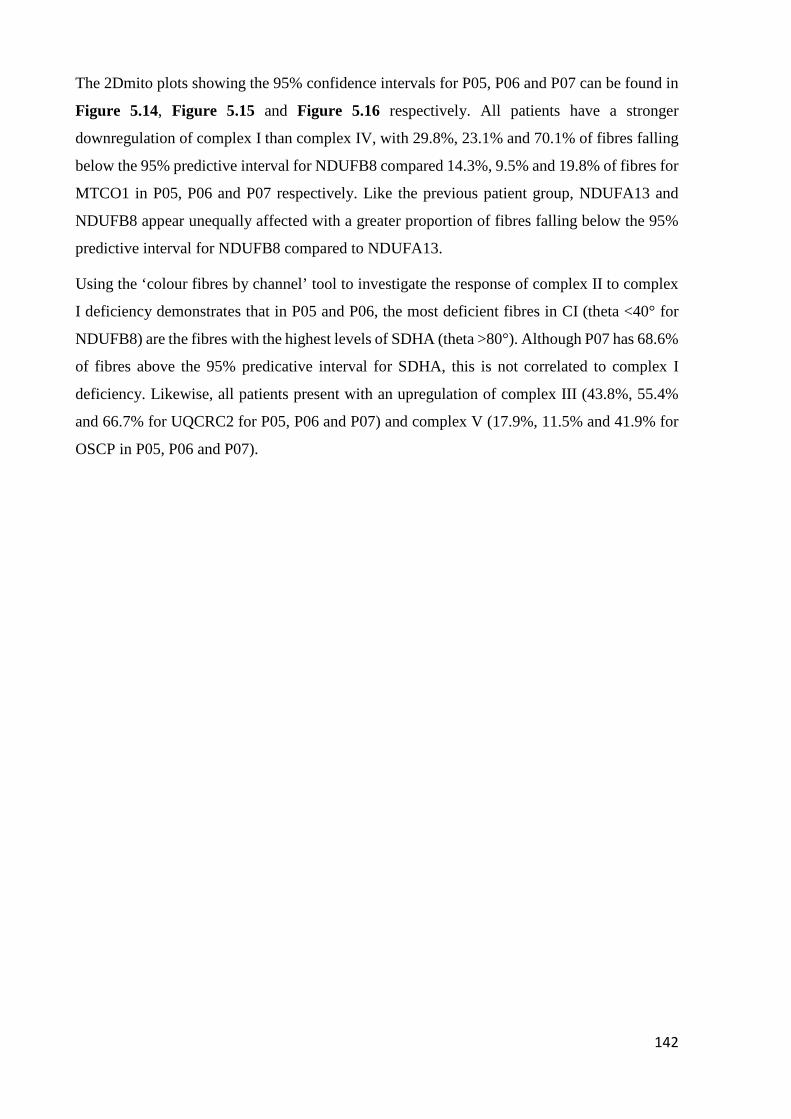
142
The 2Dmito plots showing the 95% confidence intervals for P05, P06 and P07 can be found in
Figure 5.14, Figure 5.15 and Figure 5.16 respectively. All patients have a stronger
downregulation of complex I than complex IV, with 29.8%, 23.1% and 70.1% of fibres falling
below the 95% predictive interval for NDUFB8 compared 14.3%, 9.5% and 19.8% of fibres for
MTCO1 in P05, P06 and P07 respectively. Like the previous patient group, NDUFA13 and
NDUFB8 appear unequally affected with a greater proportion of fibres falling below the 95%
predictive interval for NDUFB8 compared to NDUFA13.
Using the ‘colour fibres by channel’ tool to investigate the response of complex II to complex
I deficiency demonstrates that in P05 and P06, the most deficient fibres in CI (theta <40° for
NDUFB8) are the fibres with the highest levels of SDHA (theta >80°). Although P07 has 68.6%
of fibres above the 95% predicative interval for SDHA, this is not correlated to complex I
deficiency. Likewise, all patients present with an upregulation of complex III (43.8%, 55.4%
and 66.7% for UQCRC2 for P05, P06 and P07) and complex V (17.9%, 11.5% and 41.9% for
OSCP in P05, P06 and P07).

143
Figure 5.14: 2Dmito plot from P05 with an m.3243A>G mutation in MT-TL1. 2Dmito plots from P05 comparing OXPHOS targets against VDAC1: (a) NDUFA13, (b) NDUFB8, (c) SDHA, (d) UqCRC2, (e) COX4+4L2, (f) MTCO1, (g) OSCP. Individual single-cell IMC measurements from each patient is represented by a coloured point in each panel. Control observations are in grey. Points representing patient fibres are coloured for by theta NDUFB8 for that fibre. Regression through the control data is drawn as a solid grey line and the 95% predictive interval for control fibres lies between the dashed grey lines. Total number of fibres above and below the control predictive interval are written above each panel.

144
Figure 5.15: 2Dmito plot from P06 with an m.3243A>G mutation in MT-TL1. 2Dmito plots from P06 comparing OXPHOS targets against VDAC1: (a) NDUFA13, (b) NDUFB8, (c) SDHA, (d) UqCRC2, (e) COX4+4L2, (f) MTCO1, (g) OSCP. Individual single-cell IMC measurements from each patient is represented by a coloured point in each panel. Control observations are in grey. Points representing patient fibres are coloured for by theta NDUFB8 for that fibre. Regression through the control data is drawn as a solid grey line and the 95% predictive interval for control fibres lies between the dashed grey lines. Total number of fibres above and below the control predictive interval are written above each panel.

145
Figure 5.16: 2Dmito plot from P07 with an m.3243A>G mutation in MT-TL1. 2Dmito plots from P07 comparing OXPHOS targets against VDAC1: (a) NDUFA13, (b) NDUFB8, (c) SDHA, (d) UqCRC2, (e) COX4+4L2, (f) MTCO1, (g) OSCP. Individual single-cell IMC measurements from each patient is represented by a coloured point in each panel. Control observations are in grey. Points representing patient fibres are coloured for by theta NDUFB8 for that fibre. Regression through the control data is drawn as a solid grey line and the 95% predictive interval for control fibres lies between the dashed grey lines. Total number of fibres above and below the control predictive interval are written above each panel.

146
5.4.8 Patients with point mutations in other mt-encoded tRNAs
P08, P09 and P10 all had mutations in other mitochondrial tRNA variants (Figure 5.17); P08
with a point mutation in MT-TG (Figure 5.18a), P09 with a point mutation in MT-TE (Figure
5.18b) and P10 with a point mutation in MT-TW (Figure 5.18c). All three variants can affect
the expression of the mitochondrial-encoded subunits of CI, CIII, CIV and CV, however the
effect they have on each of these complexes will differ and will depend on the relative positions
during OXPHOS complex assembly of the mtDNA encoded subunits.
Figure 5.17: Location of tRNA variants for P08, P09 and P10. Location of P08 with a mutation
affecting MT-TG (tRNAGly), P09 with a mutation affecting MT-TE (tRNAGlu) and P10 with mutation in
MT-TW (tRNATrp). The mtDNA is colour-coded by gene-type: CI genes; orange, CIII genes; red, CIV
genes; green, CV genes; blue and tRNA genes (dark blue).

147
Figure 5.18: Biochemical profile of patients with a point mutation in other mt-encoded tRNAs. Data presented using plotIMC theta (VDAC1) view. (a) P08 with a point mutation in mitochondrial-encoded tRNAGly (MT-TG), (b) P09 with a point mutation in mitochondrial-encoded tRNAGlu (MT-TE) and (c) P10 with a point mutation in mitochondrial-encoded tRNATrp (MT-TW). One single-cell IMC measurement from the patient is represented by a coloured point in each panel. Control observations are in grey. Each plot represents an antibody observed during the IMC run. Points representing patient fibres are coloured for the NDUFB8 value for that fibre.
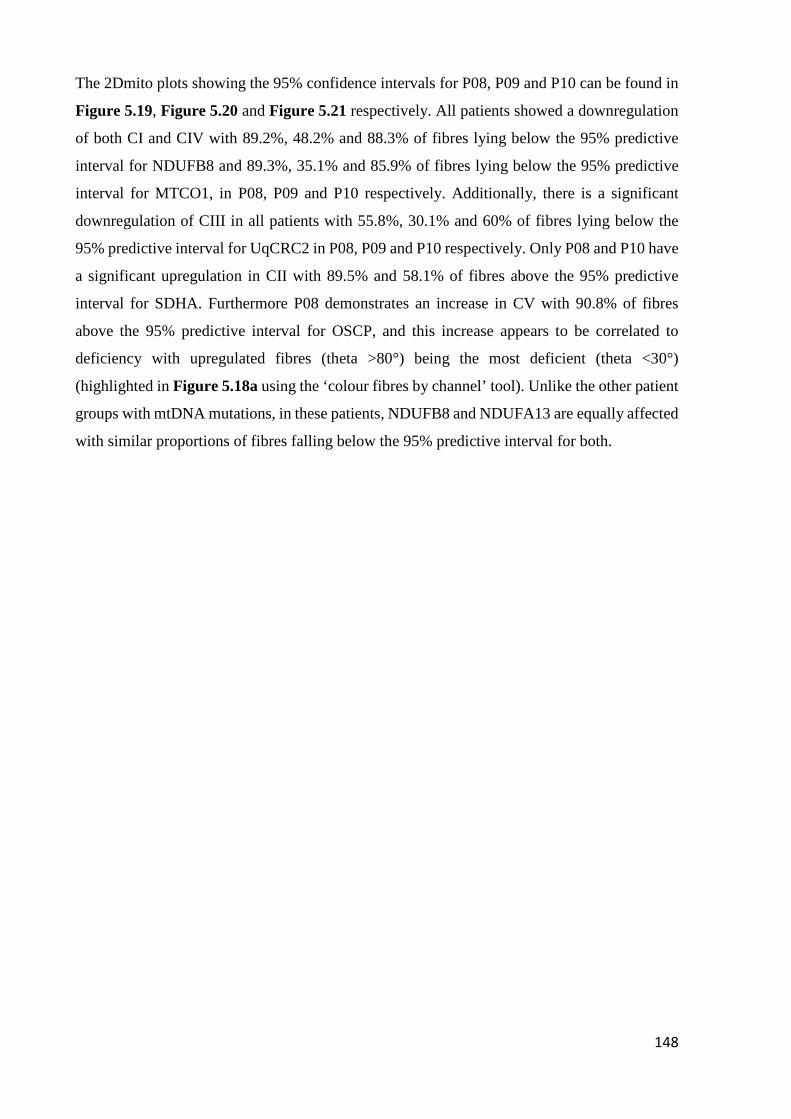
148
The 2Dmito plots showing the 95% confidence intervals for P08, P09 and P10 can be found in
Figure 5.19, Figure 5.20 and Figure 5.21 respectively. All patients showed a downregulation
of both CI and CIV with 89.2%, 48.2% and 88.3% of fibres lying below the 95% predictive
interval for NDUFB8 and 89.3%, 35.1% and 85.9% of fibres lying below the 95% predictive
interval for MTCO1, in P08, P09 and P10 respectively. Additionally, there is a significant
downregulation of CIII in all patients with 55.8%, 30.1% and 60% of fibres lying below the
95% predictive interval for UqCRC2 in P08, P09 and P10 respectively. Only P08 and P10 have
a significant upregulation in CII with 89.5% and 58.1% of fibres above the 95% predictive
interval for SDHA. Furthermore P08 demonstrates an increase in CV with 90.8% of fibres
above the 95% predictive interval for OSCP, and this increase appears to be correlated to
deficiency with upregulated fibres (theta >80°) being the most deficient (theta <30°)
(highlighted in Figure 5.18a using the ‘colour fibres by channel’ tool). Unlike the other patient
groups with mtDNA mutations, in these patients, NDUFB8 and NDUFA13 are equally affected
with similar proportions of fibres falling below the 95% predictive interval for both.

149
Figure 5.19: 2Dmito plot from P08 with an m.10010T>C mutation in MT-TG. 2Dmito plots from P08 comparing OXPHOS targets against VDAC1: (a) NDUFA13, (b) NDUFB8, (c) SDHA, (d) UqCRC2, (e) COX4+4L2, (f) MTCO1, (g) OSCP. Individual single-cell IMC measurements from each patient is represented by a coloured point in each panel. Control observations are in grey. Points representing patient fibres are coloured for by theta NDUFB8 for that fibre. Regression through the control data is drawn as a solid grey line and the 95% predictive interval for control fibres lies between the dashed grey lines. Total number of fibres above and below the control predictive interval are written above each panel.

150
Figure 5.20: 2Dmito plot from P09 with an m.14709T>C mutation in MT-TE. 2Dmito plots from P09 comparing OXPHOS targets against VDAC1: (a) NDUFA13, (b) NDUFB8, (c) SDHA, (d) UqCRC2, (e) COX4+4L2, (f) MTCO1, (g) OSCP. Individual single-cell IMC measurements from each patient is represented by a coloured point in each panel. Control observations are in grey. Points representing patient fibres are coloured for by theta NDUFB8 for that fibre. Regression through the control data is drawn as a solid grey line and the 95% predictive interval for control fibres lies between the dashed grey lines. Total number of fibres above and below the control predictive interval are written above each panel.
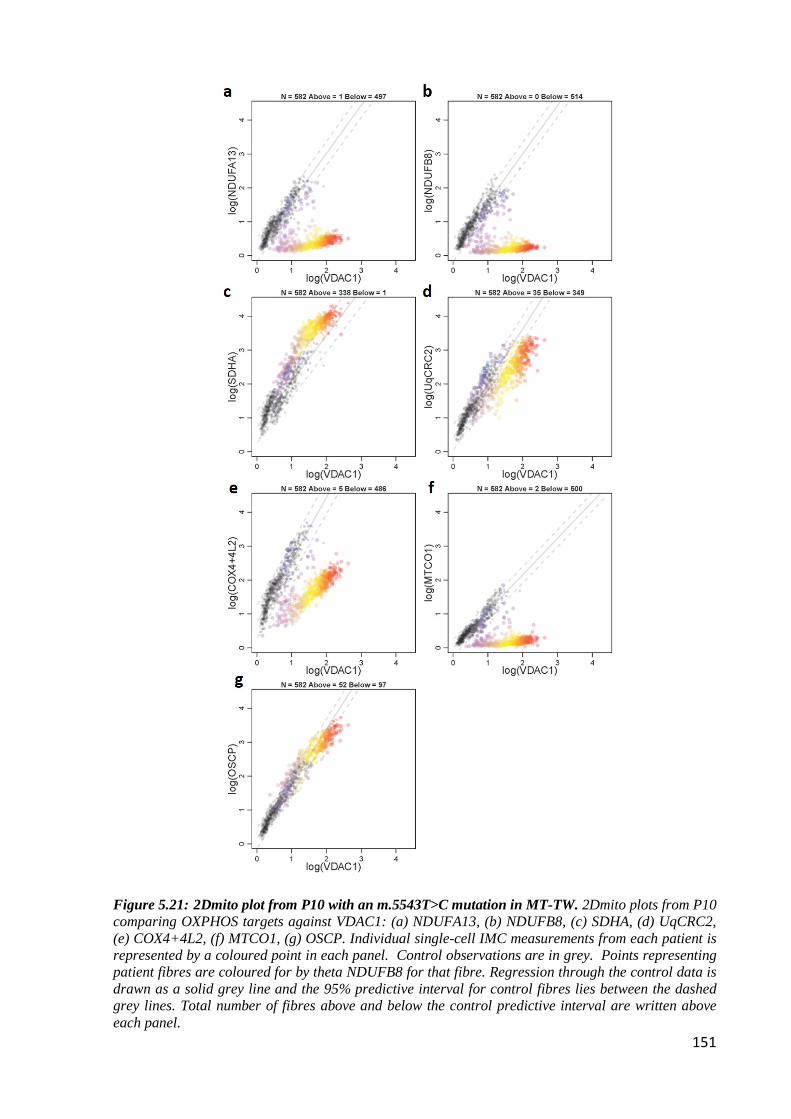
151
Figure 5.21: 2Dmito plot from P10 with an m.5543T>C mutation in MT-TW. 2Dmito plots from P10 comparing OXPHOS targets against VDAC1: (a) NDUFA13, (b) NDUFB8, (c) SDHA, (d) UqCRC2, (e) COX4+4L2, (f) MTCO1, (g) OSCP. Individual single-cell IMC measurements from each patient is represented by a coloured point in each panel. Control observations are in grey. Points representing patient fibres are coloured for by theta NDUFB8 for that fibre. Regression through the control data is drawn as a solid grey line and the 95% predictive interval for control fibres lies between the dashed grey lines. Total number of fibres above and below the control predictive interval are written above each panel.

152
5.4.9 Genetic thresholds at which OXPHOS deficiency occurs
It is known that in patients with mitochondrial disease, a threshold effect occurs whereby a
threshold proportion of mtDNA mutation must be achieved before fibres become deficient
(reviewed in (Rossignol et al., 2003)), but further to this, it is suspected that this threshold varies
for each complex. In line with the idea of a threshold effect, Figure 5.22 shows the 2Dmito
plots for NDUFB8 in all patients with a combined deficiency and demonstrates that the fibres
are split into two groups for CI - one group in which the relationship between CI signal and
VDAC1 signal resembles control patients, and another group where the signal resembles
patients with a nuclear-encoded CI mutation (v-shaped data in Figure 5.22).
Figure 5.22: NDUFB8 levels in patients with combined deficiency. (a) P03, (b) P04, (c) P05, (d) P06, (e) P07, (f) P08, (g) P09 and (h) P10. Individual single-cell IMC measurement from each patient is represented by a coloured point in each panel. Control observations are in grey. Data presented using plotIMC 2Dmito plot view. Points representing patient fibres are coloured for theta NDUFB8 levels for that fibre. Regression through the control data is drawn as a solid grey line and the 95% predictive interval for control fibres lies between the dashed grey lines. Total number of fibres above and below the control predictive interval are written above each panel.

153
This pattern also occurs for MTCO1 but with a smaller proportion of CIV-deficient fibres. In
order to explore this quantitatively, categories of deficient fibres were assessed (Table 5.5) and
highlights that most CIV-deficient fibres are also CI-deficient, suggestive of a higher threshold
for CIV. A similar pattern can be seen between CIII and CIV where most CIII-deficient fibres
are also deficient for CIV.
Table 5.5: Relationship of complexes in all patients and controls. The percentage and number of fibres falling below the 95% predictive interval for NDUFB8 (complex I), MTCO1 (complex IV) and UqCRC2 (complex III) for all patients and controls. Further to this the table displays the percentage of fibres that are deficient for both complexes (NDUFB8 and MTCO1, and MTCO1 and UQCRC2).

154
5.4.10 Patients with isolated complex deficiency
IMC has the capacity to look at multiple targets simultaneously and, although all five complexes
were investigated in the initial cohort of patients, it was decided to further run patients with
isolated deficiencies to ensure that IMC was detecting deficiencies in other, less commonly
affected complexes. Six patients with isolated deficiency (isolated deficiency in CII (n=2),
isolated deficiency in CIV (n=2) and isolated deficiency in CV (n=2)) were run alongside
controls (n=4) and because the patients were all paediatric cases, it was decided that one of the
controls chosen was also paediatric.
As these are isolated cases it is expected that the levels of the protein involved in the affected
complex will be lower. Patients with an isolated defect in CII, CIV and CV were investigated
relative to controls and the expression of each antibody targeting the relevant affected complex
in each case was examined. Figures 5.23 to 5.25 display the patients from each group of
isolated deficiencies as well as all controls examined (isolated complex II deficiency (Figure
5.23), isolated complex IV deficiency (Figure 5.24) and isolated complex V deficiency (Figure
5.25)). Results show that visually, there was a marked decrease in protein levels in each of the
patients with isolated deficiencies in comparison to the controls (highlighted by the weaker
staining in panels e and f of Figures 5.23 to 5.25), suggestive of complex deficiency.

155
Figure 5.23: IMC staining for SDHA in patients with isolated complex II deficiency and controls. SDHA expression from (a) C03 (b) C04, (c) C05, (d) C06, (e) P11 with a defect in SDHB causing isolated CII deficiency (f) P12 with a defect in SDHD causing isolated CII deficiency. Scale bars; 100µm.

156
Figure 5.24: IMC staining for MTCO1 in patients with isolated complex IV deficiency and controls. MTCO1 expression from (a) C03 (b) C04, (c) C05, (d) C06, (e) P13 with a defect in SCO2 causing isolated CIV deficiency (f) P14 with a defect in SURF1 causing isolated CIV deficiency. Scale bars; 100µm.

157
Figure 5.25: IMC staining for OSCP in patients with isolated complex V deficiency and controls. OSCP expression from (a) C03 (b) C04, (c) C05, (d) C06, (e) P15 with a defect in TMEM70 causing isolated CV deficiency (f) P16 with a defect in TMEM70 causing isolated CV deficiency. Scale bars; 100µm.

158
Unfortunately, due to the nature of paediatric samples and because the fibres were so small,
Mitocyto was initially unable to segment individual fibres from these cases. Although the
software is currently being adapted to work with paediatric tissue, this was not an option at the
time and so these patients had to be analysed in a different way. Because it is assumed that
nuclear gene mutations affect all cells in a tissue in a similar way, to quantitatively analyse
these cases, the mean expression of each antibody was taken from the section as a whole and
not from individual fibres.
Before analysis was carried out on these samples, and to confirm the assumption that nuclear
mutations affect all cells in a tissue in a similar way, three different regions of one control
(Figure 5.26a) and one patient (Figure 5.26b) were sampled and the mean expression of each
antibody was taken for each region. Results show that mean expressions did not differ very
much between each region and thus analysing the section as a whole would not affect the results.
Figure 5.26: Mean expression of each antibody in three different regions of the muscle biopsy. Three different regions were selected from (a) C06 and (b) P11 and the mean expression of each antibody in the panel was calculated.

159
P11 and P12 have mutations affecting complex II and presented with nuclear-encoded
mutations in SDHB and SDHD respectively. Assessing the biochemical phenotype
demonstrated that both patients had much lower levels of SDHA compared to the controls
(Figure 5.27a) with fold decreases of 13.3 and 5.4 between the controls and P11 and P12
respectively. Similar to the isolated complex I patients there is an upregulation of proteins
involved in the other complexes (CI, CIII, CIV and CV) in response to CII deficiency (Figure
5.27b). Fold increases of 1.1, 1.2, 1.1 and 1.2 are seen in P11 for NDUFB8, UqCRC2, MTCO1
and OSCP respectively. Generally more pronounced upregulation is seen in P12 with fold
increases of 1.1, 1.3, 1.2 and 3.6 for NDUFB8, UqCRC2, COX4+4L2 and OSCP respectively.
P13 and P14 have mutations affecting complex IV and presented with nuclear-encoded
mutations in SCO2 and SURF1 respectively. Both patients show a downregulation in proteins
associated with CIV (MTCO1 and COX4+4L2) (Figure 5.27c), with fold decreases of 2.2 and
5.5 in MTCO1 and 2.7 and 7.6 in COX4+4L2 for P13 and P14 respectively. Similar to other
isolated deficiencies, an upregulation is seen in proteins associated with other unaffected
complexes (Figure 5.27d). Interestingly P13 has an upregulation of all of the unaffected
complexes, with fold increases of 1.1, 1.1, 1.5 and 1.5 for NDUFB8 (CI), SDHA (CII),
UqCRC2 (CIII) and OSCP (CV) respectively whilst P14 only presents with an upregulation of
complex III (a fold increase of 1.1 in UqCRC2)
P15 and P16 have mutations affecting complex V with a nuclear-encoded mutation in TMEM70.
Both patients present with a severe loss of the CV protein OSCP in comparison to the controls
(Figure 5.27e) (fold decreases of 15.5 and 17.4 in P15 and P16 respectively). An upregulation
of the unaffected CIII is also observed by an increase in UqCRC2 in both patients above the
controls (fold increases of 1.1 and 1.3 for P15 and P16 respectively). Furthermore P15 also
presents with an upregulation in CIV, seen by an increase in COX4+4L2 (Figure 5.27f).
One interesting observation is that for all the patients with isolated complex deficiencies, similar
to other patients in this chapter, there are differences in expression levels between both of the
CI antibodies NDUFB8 and NDUFA13 as well as both of the CIV antibodies MTCO1 and
COX4+4L2. This difference will be discussed further in the discussion.

160
Figure 5.27: Antibody expression in patients with isolated deficiencies. The mean expression of (a) SDHA (CII) in controls and patients with isolated complex II deficiency (P11 and P12), (b) all antibodies measured in controls and patients with isolated complex II deficiency (P11 and P12), (c) MTCO1 and COX4+4L2 (CIV) in controls and patients with isolated complex IV deficiency (P13 and P14), (d) all antibodies measured in controls and patients with isolated complex IV deficiency (P13 and P14), (e) OSCP (CV) in controls and patients with isolated complex V deficiency (P15 and P16) and (f) all antibodies measured in controls and patients with isolated complex V deficiency (P15 and P16).

161
5.4.11 Comparing imaging mass cytometry analysis to z-scores
For data analysed using plotIMC, a fibre was defined as deficient if it falls below the 95%
predictive interval for the controls, however this is not how deficiency has previously been
described. Rocha et al. (2015) assessed z-scores as a measure of deficiency and classified fibres
into four different groups dependant on these z-scores (Positive, int(+), int(-) and negative (see
section 2.2.8 for detail)). A schematic of how z-scores and the 95% confidence interval is
calculated is shown in Figure 5.28.
Figure 5.28: z-score v 95% confidence interval. (a) Classification of deficiency based on z-score calculations; positive (z-score > -3SD), intermediate (+) (z-score between -3SD and -4.5SD), intermediate (-) (z-score between -4.5SD and -6SD) and negative (z-score < -6SD). (b) Classification of deficiency based on 95% confidence intervals. Solid black line indicates the mean of the controls while dashed lines indicates the upper and lower 95% confidence intervals. A fibre is classed as deficient if it lies outside the lower 95% confidence interval and is classified as upregulated if it lies outside the upper 95% confidence interval either above (green) or below (orange) the 95% confidence interval for the controls.

162
Because of this, it was important to check how comparable the methods were by looking at
how the level of deficiency varied in the patients when using both the 95% confidence interval
and z-scores as a measure (Table 5.6). When investigating the z-scores, two groups were
examined; deficient fibres, which were classed as fibres falling into any of the deficient
categories (int(+), int(-) and negative), and negative fibres, which were any fibres falling
exclusively into to the negative category (z-score < -6). Because the software that generates the
z-scores uses a marker of mitochondrial mass to normalise the data, VDAC1 could not be
analysed.
The investigation into how the level of deficiency varied in the patients when using both the
95% confidence interval and z-scores highlighted that the percentage of fibres classed as
deficient did vary between the two methods and generally, the 95% confidence interval
classifies a greater proportion of fibres as deficient compared to the z-scores. This is highlighted
in Table 5.6, with higher percentage displayed in the red rows compared to both the other
groups.
However, the results demonstrate that when exploring the percentage of deficient fibres using
the 95% confidence intervals compared to all the deficient categories using the z-score
calculations (int(+), int(-) and negative), outcomes were similar. For example P01 has 100%
NDUFB8 deficiency using the 95% interval and similarly 99.4% NDUFB8 deficiency when
grouping all deficient z-score categories. This similarity was lost when exploring the 95%
interval and any fibres falling exclusively into to the negative category – with the negative
category producing much lower percentages (65.4% NDUFB8 deficiency in P01).
From this we can conclude that the results generated from the IMC using the 95% confidence
intervals as a cut-off for deficiency were comparable to the z-scores when the all the negative
categories (int(+), int(-) and negative) are grouped together. This is further supported by a
Pearson’s correlation of 0.98 between the two (Figure 5.29).

163
Table 5.6: z-scores vs 95% confidence interval. IMC data from all patients for all proteins analysed using two different methods. Table displays the percentage of fibres below the 95% confidence interval for each protein in each case as well as z-score data (percentage of fibres falling into deficient category (any fibre with z < -3) as well as fibres classifying exclusively as negative (z <-6)).

164
Figure 5.29: Correlation of deficient fibres categorised by z-scores or 95% confidence interval. Each dot represents the percentage of fibres deficient for each protein measured in each patient using either z-scores (x) or the 95% confidence interval (y).

165
5.5 Discussion
The advent of IMC means that many proteins can be targeted simultaneously which will further
the understanding of respiratory chain defects in skeletal muscle and the downstream effects
they may cause. This technique is a major improvement on immunofluorescent techniques; I
have studied the expression of nine proteins simultaneously in thousands of single skeletal
muscle fibres sampled from 10 patients with mitochondrial disease. Furthermore, the bespoke
analysis created for use with IMC moves away from arbitrary z-score classifications that are
used in IF and which fail to allow for the possibility of upregulation or overexpression of
proteins compared to controls.
I demonstrated that the technique was highly reproducible between both repeat runs when using
the same reagents (correlation of 0.98) but was less so between the repeats when different
reagents were used (correlations of 0.87), and it is hypothesised that this difference is due to
differences in antibody batches. As a result of the conjugation process, antibody is lost, and the
recovery rate of each antibody will differ with each conjugation. Because of their limited
supply, each antibody had to be re-conjugated between the initial run and the subsequent repeat
runs and thus the recovery rates will have differed. It is assumed that it is this difference in
antibody recovery that led to the lower correlations between the initial and repeat runs as when
the same antibody batches were used between the repeats, the correlation was strong. This
observation will guide future experiments in ensuring there are sufficient antibodies stored for
a number of linked experiments. Alternatively, each antibody could be titrated to the same
working concentration to ensure the amount of antibody is consistent between experiments
using different conjugation batches.
The quality of the experiment is due, in part, to the quality of the antibodies that are used and
therefore a crucial part in the development of this technique was the design of an antibody panel
to run on the IMC. Since the technique would be used initially to assess respiratory chain
deficiency in skeletal muscle it was important that the panel include a number of mitochondrial
markers that targeted all five complexes of the respiratory chain as well as a good fibre
membrane marker that would allow effective segmentation of individual cells. However all
studies are limited by the antibodies that are available, and this study was no different. A
determining factor in the inclusion of certain antibodies was whether they were available in a
protein-free solution and as such, suitable antibodies may have been unavailable for use on
IMC. Furthermore, as a result of the low recovery rate of some antibodies post-conjugation, a
number of antibodies could not be included in the panel due to insufficient staining (see section

166
4.5.2). Both CI antibodies chosen (NDUFB8 and NDUFA13) target nuclear-encoded accessory
subunits of CI and it has been revealed throughout this chapter that they detect differing levels
of CI deficiency in a number of patients. Schematically shown in Figure 1.6, NDUFA13 is
involved earlier in CI assembly upon the combining of Q and ND1-modules whilst NDUFB8
is involved much later on in the process in the formation of the ND5-module (Guerrero-Castillo
et al., 2017). What is unusual, is that the correlations between NDUFB8 and NDUFA13 vary
between different patient groups; similar expressions of NDUFA13 and NDUFB8 are seen in
fibres from CI patients (P01 and P02) and patients with mutations in other tRNA variants (P08,
P09 and P10), whereas in fibres from the single, large-scale mtDNA deletion (P03 and P04)
and MT-TL1 patients (P05, P06 and P07), NDUFA13 is expressed at higher levels than
NDUFB8. Stroud et al. (2016) have previously demonstrated a stronger correlation of subunit
stability within modules of CI than between modules, and this may explain the differences that
are observed in this study. For m.3243A>G MT-TL1 patients, the only mtDNA encoded subunit
that is incorporated into ND5-module other than NDUFB8 is ND5. The ND5 subunit requires
104 Leucine tRNAs compared to, 12 Tryptophan, 9 Glutamic acid and 26 Glycine tRNAs
meaning that the m.3243A>G MT-TL1 will have a much more substantial effect on this subunit
than the other tRNA variants. Furthermore, because there are fewer (63) Leucine tRNAs
required for ND1 (which is the only mtDNA encoded subunit in the ND1-module alongside
NDUFA13) compared to ND5, it is hypothesised that m.3243A>G should have a greater impact
on NDUFB8 stability than NDUFA13. In the single, large-scale mtDNA deletion patients,
whilst multiple mtDNA encoded CI subunits and tRNAs are deleted, both patients have a
deletion removing ND5 which will affect stability of the ND5-module containing NDUFB8,
but neither affects ND1 which means the ND1-module containing NDUFA13 with be relatively
more stable. Differences in expression were also observed between the two antibodies targeting
CIV proteins (MTCO1 and COX4+4L2). MTCO1 is encoded by mtDNA while COX4 is
nuclear-encoded and thus it not surprising that these antibodies behave different from one
another – with COX4+4L2 revealing less deficiency than MTCO1 (Rahman et al., 2000).
Unfortunately for both CIII and CV there are no good commercially available mitochondrial-
encoded subunit specific antibodies. The antibodies used target the nuclear-encoded proteins of
CIII and CV (the core protein UqCRC2 and the structural protein OSCP respectively), both of
which seem to be stable in the absence of mitochondrial encoded subunits and this may explain
why in this study, and in previous studies using western blotting, both CIII and CV appear to
be less affected in patients with mtDNA disease (Metodiev et al., 2016). Ideally, it is envisaged
that future panels include antibodies that target both mtDNA-encoded and nuclear-encoded
subunits of each complex so that potential discrepancies can be investigated.

167
What is encouraging about the technique is that the results generated in this chapter confirm
biochemical phenotypes that have been previously reported. Here, it is shown that using
plotIMC, patients with nuclear-encoded CI assembly defects have 100% of fibres deficient for
CI, consistent with previous findings (Ahmed et al., 2017, Alston et al., 2016). Although
Mitocyto and plotIMC were not used to analyse the IMC data from patients with other isolated
complex deficiencies (CII, CIV and CV), results still demonstrate a downregulation of proteins
associated with the affected complex and further present with an upregulation in the non-
affected complexes in response to deficiency. P15 and P16 have isolated complex V deficiency
due to a TMEM70 mutation and show a compensatory upregulation of CIII and IV which is
consistent with previous findings (Havlickova Karbanova et al., 2012). Similarly P13 and P14
with mutations affecting complex IV demonstrate an upregulation in CI, CIII and CV which is
also consistent with previous data (Kovarova et al., 2012).
A study by Rocha et al. (2018) found that patients with single, large-scale mtDNA deletions
could be split into different classifications based on the size and location of the deletion and
that these classes had distinct patterns of CI and CIV deficiency. In their work, a class I deletion
caused equal levels of CI and CIV deficiency while a class II deletion caused greater deficiency
in CI than CIV. In the study, P03 was defined as a class I deletion thus it is expected that fibres
would have well correlated levels of CI and CIV deficiency which is consistent with the IMC
data for this patient. Similarly, P04 was defined as a class II deletion, and so it would be
expected that this patient would present with a proportion of fibres with only CI deficiency and
a proportion of fibres with both CI and CIV deficiency and this observation is consistent with
the IMC data also. It is demonstrated in this study that CI is more severely affected than CIV
in patients with the m.3243A>G mutation, consistent with other research into these patients
(Rocha et al., 2015).
With regards to the patients with mutations in other mitochondrial-encoded tRNAs, although
there have been no previous studies assessing the levels of individual complex proteins in
individual muscle fibres, muscle homogenates showed CIV deficiency in patients with mt-
tRNA defects similar to those in this tRNA patient group (MT-TW (Anitori et al., 2005,
Taivassalo et al., 2001), MT-TG (Bidooki et al., 1997) and MT-TE (Hao et al., 1995)).
The direct effect that the tRNA mutation has on the deficiency of specific complexes will
depend on which mtDNA subunits are most affected (based on the frequency at which that
tRNA is required for a subunit). Here, it is interesting that the relative proportion of fibres

168
deficient for a particular complex seems to reflect the relative importance of the tRNA that is
mutated in each complex.
The whole idea that OXPHOS complexes can present a biochemical threshold effect, whereby
a threshold proportion of mtDNA mutation must be achieved before fibres become deficient,
has been described previously (reviewed by Rossignol et al. (2003)). Expanding on this, Rocha
et al. (2018) found that the threshold required for the expression of a respiratory chain
deficiency is different for complex I and complex IV – with a higher threshold needed for CIV.
It appears as if this is paralleled in this study with most CIV-deficient fibres also deficient in
CI in patients with mutations in mt-encoded tRNAs. A pattern is observed whereby fibres have
highest levels of CI deficiency, followed by CIV then CIII. Furthermore, it is shown that a large
proportion of CIV-deficient fibres are also deficient for CI and the same occurring between CIV
and CIII. Although this is suggestive of a threshold mechanism, this is only one of a number of
patterns observed in the data and without genetic analysis to assess the heteroplasmy of the
individual fibres where this effect is occurring, firm conclusions cannot be drawn. That said, it
would be interesting in the future to look at individual fibres at the genetic level so that the idea
of a threshold effect can be investigated more thoroughly.
Through examining further patients with isolated deficiencies, it was revealed that Mitocyto
was not designed to segment fibres from paediatric cases and thus these images could not be
analysed at a single cell level. Instead, the mean expression of each antibody was taken from
the section as a whole, but reassuringly it was found that the expression of the antibodies
targeting the relevant affected complex in each case was decreased below the controls. Similar
to the other patients, differences in expression were observed between the two antibodies
targeting CIV proteins (MTCO1 and COX4+4L2), with less deficiency in COX4+4L2 than
MTCO1. MTCO1 is mtDNA-encoded and is one of the initial subunits incorporated into CIV,
around which the rest of the subunit is built. Although COX4 associates with MTCO1 very
early in complex assembly, it is nuclear-encoded and thus it not surprising that these antibodies
behave different from one another. Furthermore, the COX4+4L2 antibody also targets both the
COX4 and 4L2 isoforms which may explain why levels of COX4 are approximately double
that of MTCO1.
It has been clearly demonstrated that in patients with isolated complex deficiencies as well as
patients with combined deficiencies, in fibres that are deficient in one or more OXPHOS
complexes, there is a compensatory increase in OXPHOS complexes that are not directly
affected by a mutation. Although previous studies report this in patients with isolated

169
deficiencies (CIV (Kovarova et al., 2012) and CV (Havlickova Karbanova et al., 2012)), the
experiments are often carried out on cell lines, not in muscle tissue which is more clinically
relevant, and not at a single cell level like is reported here.
In the first instance, future work will look to optimise further antibodies for inclusion into the
IMC panel. These will include antibodies that target mtDNA-encoded subunits of each
respiratory chain complex in hope that these can be used alongside nuclear-encoded subunits
to investigate respiratory chain deficiency more thoroughly in mitochondrial disease patients.
Looking at these antibodies in patients with mutations such as a single, large-scale deletion will
allow the determination of how the mutation is affecting each complex directly and if the size
and location of the deletion impacts this. Furthermore, the investigation of nuclear-encoded
proteins alongside the mtDNA-encoded proteins will advance the understanding of the
importance of assembly factors to the overall functioning of a complex.
Antibodies targeting a number of proteins involved in various signalling pathways will also be
included to future panels. Signalling pathways to be explored will include biogenesis,
mitophagy, glycolysis, protein synthesis and apoptosis and the investigation of these pathways
will open up the opportunity to assess the downstream effect of respiratory chain deficiency on
the cell. It is known that deletions accumulate during ageing (Cortopassi and Arnheim, 1990)
and thus it would be interesting to investigate both respiratory chain and signalling differences
that are seen in “normal” ageing, compared to a patient with mitochondrial disease. Furthermore
genetically assessing the heteroplasmy levels of these samples and how this correlates to
changes in both respiratory chain deficiency and signalling could also be a direction of future
work.

170

171
Chapter 6 : Optimisation of new antibodies targeting
mtDNA-encoded proteins for use with
immunofluorescence and imaging mass cytometry

172
6.1 Introduction
6.1.1 Advent of imaging mass cytometry
Imaging mass cytometry utilises rare earth metals as reporters on antibodies instead of using
conventional fluorophores (Giesen et al., 2014). This eliminates the complications behind
spectral overlap that has previously resulted in a very limited number of parameters being
investigated at one time and with the expansion of IMC, it is now possible to examine up to
40+ parameters simultaneously (Chevrier et al., 2018).
6.1.2 Limitations of validated antibodies and current imaging mass
cytometry panel
Every study is limited by the antibodies that are available. The OXPHOS system is comprised
of five complexes – four of which are encoded, in part, by the mitochondrial genome. Therefore
it would be ideal to have access to antibodies that target these mtDNA-encoded subunits for
each complex, however to date, there have been no good working antibodies targeting these
subunits for CI, CIII or CV and thus antibodies that target the nuclear-encoded subunits of these
complexes have had to suffice.
Two proteins commonly investigated when assessing CI deficiency are the accessory subunits
NDUFB8 and NDUFA13. During assembly of the complex, NDUFA13 comes at the early
stages of CI assembly where it is involved in the formation of the P-module while NDUFB8,
although still part of the P-module, comes much later on in complex assembly. The findings
from chapter 5 show that in a number of patients, different patterns of deficiency were seen
between the two CI antibodies NDUFB8 and NDUFA13. By carrying out proteomic analysis
on human knockout cell lines, Stroud et al. (2016) had previously demonstrated that accessory
subunits are associated into modules, and that there is a stronger correlation of subunit stability
within a particular module rather than between different modules. Because of the variation
observed between different accessory subunits, it is important to investigate mtDNA-encoded
subunits in patients with mtDNA variants, and so alternative antibodies were suggested. ND2
and ND4 are both mtDNA-encoded core subunits of complex I which are incorporated during
the assembly of the membrane arm, specifically during the formation of the PP-b/PD-a
intermediate (Guerrero-Castillo et al., 2017).
A frequently used target to investigate CIII is the nuclear-encoded core protein UqCRC2 which
is shown to be involved in the dimerization of the complex (reviewed by Signes and Fernandez-
Vizarra (2018)). Although it is demonstrated that CIII is less affected in mitochondrial disease

173
than the other complexes (reviewed by Fernández-Vizarra and Zeviani (2015)), it is still
important to examine the changes seen in response to deficiency. CYB is the only mtDNA-
encoded subunit of CIII and is synthesised at the very start of assembly, therefore it is an ideal
protein to assess CIII deficiency.
CIV is the only complex for which there is a working, commercially-available antibody
targeting an mtDNA-encoded subunit. MTCO1 is the largest catalytic subunit of CIV and is the
“seed” around which the other subunits assemble. COX4 is nuclear-encoded and incorporates
at the very early stages of complex assembly (Nijtmans et al., 1998). The results shown in
chapter 5 highlighted the differences between these two proteins, with MTCO1 proving more
affected than COX4 in disease.
Similar to CIII, CV is less commonly affected in disease and it has been shown that in
mitochondria lacking mtDNA (Rho0 cells), the complex can still assemble (Wittig et al., 2010).
The reason for this may be that there are only two subunits encoded by the mitochondrial
genome – ATP6 and ATP8, both of which are involved in the F0 sector of CV and are added at
the later stages of the assembly process. Although a search was performed to find suitable
antibodies that targeted these two subunits, no options appeared to work in skeletal muscle and
so nuclear-encoded proteins such as OSCP (which is also involved in F0 sector) have been used
to investigate deficiency instead.
I wanted to not only test antibodies that targeted mtDNA-encoded proteins, but also to further
investigate OXPHOS deficiency. One of the most commonly investigated groups of
mitochondrial patients are those that present with single, large-scale mtDNA deletions. Work
from Rocha et al. (2018) previously classified these patients into three classes based on the size
and location of the mtDNA deletion. These classes were also shown to have distinct patterns of
CI and CIV deficiency. More detail on these classes can be found in section 5.1.
6.2 Aims
The aim of this chapter was to optimise a set of new antibodies that target mtDNA-encoded
proteins for use with both immunofluorescence and imaging mass cytometry.

174
6.3 Methods
6.3.1 Patient cohort
Nine patients with single, large-scale mtDNA deletions (n=9) and one patient with multiple
mtDNA deletions due to a nuclear-encoded POLG mutation were assessed alongside healthy
controls. P01 was a post-mortem biopsy taken from a patient who had the defect in the gene
POLG, whilst P02-P10 had a single, large-scale mtDNA deletion. Control tissue was acquired
with prior informed consent from the distal part of the hamstring of patients undergoing anterior
cruciate ligament surgery. Table 6.1 summarises all relevant clinical information for this
chapter. All ethical approval can be found in section 2.2.1.
6.3.2 Antibodies
A full list of the antibodies used in this chapter are shown in Table 6.2 and Table 6.3.
6.3.3 Muscle biopsy and cryosectioning
Serial sections (6µm for IMC and 10µm for IF) were obtained from transversely orientated
frozen muscle blocks as described in section 2.2.3.
6.3.4 Preparation and imaging of samples for immunofluorescence
Sections were prepared for immunofluorescence using the same protocol as described in section
2.2.5 and imaged as described in section 2.2.6, following the protocol established by Rocha et
al. (2015).
6.3.5 Preparation and imaging of samples for imaging mass cytometry
Sections were prepared for IMC using the protocol described in section 4.3.6. The data
generated from the imaging mass cytometer was initially opened in MCD viewer (Fluidigm)
and subsequently exported as TIFF files for further analysis. Segmentation was performed on
Mitocyto and analysis was carried out using the custom-built programme plotIMC as described
in chapter 4.

175
Table 6.1: Patient information. Information on controls and patients detailing age, gender, clinical information and genetic defect.
Subjects Gender Age Clinical information Genetic defect
Controls
C01 Female 23y n.a n.a
C02 Male 22y n.a n.a
C03 Female 23y n.a n.a
Patient
P01 Male 80y arPEO POLG
p.(Thr251Ile)/p.(Pro587 Leu); p.(Ala467Thr)
P02 Female 21y CPEO,myopathy, cerebellar ataxia, short stature (KSS)
Deletion size: 4978bp
Breakpoints: 8482-13460
mtDNA deletion level: 87%
P03 Female 43y CPEO, myopathy
Deletion size: 4978bp
Breakpoints: 8482-13460
mtDNA deletion level: 73%
P04 Female 48y CPEO, myopathy
Deletion size: 4241bp
Breakpoints: 9498-13739
mtDNA deletion level: 39%
P05 Female 26y CPEO, myopathy
Deletion size: 4851bp
Breakpoints: 10747-15598
mtDNA deletion level: 71%
P06 Female 26y CPEO, myopathy, deafness, diabetes
Deletion size: 4641bp
Breakpoints: 10946-15587
mtDNA deletion level: 83%
P07 Female 40y CPEO, myopathy, bulbar
weakness, muscle atrophy, pigmentary retinopathy
Deletion size: 2308bp
Breakpoints: 12113-14421
mtDNA deletion level: 90%
P08 Female 28y CPEO, myopathy
Deletion size: 7648bp
Breakpoints: 6341-13989
mtDNA deletion level: 33%
P09 Male 31-34y CPEO, myopathy
Deletion size: 7144bp
Breakpoints: 5772-12916
mtDNA deletion level: 36%
P10 Male 59y CPEO, myopathy
Deletion size: 5219bp
Breakpoints: 6002-11221
mtDNA deletion level: 15% CPEO; Chronic progressive external ophthalmoplegia, KS; Kearns-Sayre syndrome

176
Table 6.2: List of primary antibodies. Detail on antibody host, dilution and supplier is provided.
Antibodies Host and isotype Dilution Company
Protein target/ Primary antibodies
Complex I: ND2 IgG2a 1:100 Bespoke, courtesy of Dr Mike Marusich, University
of Oregon
Complex I: ND4 IgG2a 1:100 Bespoke, courtesy of Dr Mike Marusich, University
of Oregon
Complex III: CYB IgG2b 1:100 Bespoke, courtesy of Dr Mike Marusich, University
of Oregon
Complex IV: MTCO1 IgG2a 1:100 Bespoke, courtesy of Dr Mike Marusich, University
of Oregon
Complex V: ATP6 IgG2b 1:100 Bespoke, courtesy of Dr Mike Marusich, University
of Oregon
Complex V: ATP8 IgG2b 1:100 Bespoke, courtesy of Dr Mike Marusich, University
of Oregon
Membrane marker: Laminin Rabbit 1:50 Sigma-Aldrich (L9393)
Membrane marker: Dystrophin Mouse 1:50 EMD Millipore (Mab 1645)
Complex I: NDUFB8 Mouse IgG1 1:50 (IMC) 1:100 (IF) Abcam (110242)
Complex I: NDUFA13 Mouse IgG2b 1:50 (IMC) 1:100 (IF) Abcam (110240)
Complex II: SDHA Mouse IgG1 1:50 (IMC) Abcam (14715)
Complex III: UqCRC2 Mouse IgG1 1:50 (IMC) 1:100 (IF) Abcam (14745)
Complex IV: MTCO1 Mouse IgG2a 1:50 (IMC) 1:100 (IF) Abcam (14705)
Complex IV: COX4+4L2 Mouse IgG2a 1:50 (IMC) 1:100 (IF) Abcam (110261)
Complex V: OSCP Mouse IgG1 1:50 (IMC) 1:100 (IF) Abcam (110276)
Complex V: ATPB Mouse IgG1 1:50 (IMC) Abcam (14730)
Mass marker: VDAC1 Mouse IgG2b 1:50 (IMC) 1:100 (IF) Abcam (14734)

177
Table 6.3: List of secondary antibodies. Detail on antibody host, dilution and supplier is provided.
Antibodies Host Dilution Company
Secondary antibodies
Anti-rabbit Alexa Fluor 405nm Goat 1:100 Life Technologies (A31556)
Anti-IgG2a Alexa Fluor 488nm Goat 1:200 Life Technologies (A21131)
Anti-IgG2b Alexa Fluor 546nm Goat 1:200 Life Technologies (A21143)
Anti-IgG1 biotin Goat 1:200 Life Technologies (A10519)
Streptavidin Alexa Fluor 647nm Goat 1:100 Life Technologies (S32357)
Anti-IgG1 Alexa Fluor 647nm Goat 1:200 Life Technologies (AA21240)
Anti-mouse IgG Alexa Fluor 488 Goat 1:200 Life Technologies (A11001)

178
6.4 Results
6.4.1 Testing new antibodies on control skeletal muscle tissue
In the first instance, to assess whether the antibodies that target mtDNA-encoded proteins would
be successful in labelling skeletal muscle tissue, each antibody was tested on control tissue at
three different dilutions (1/200, 1/100 and 1/50) using the standard immunofluorescent protocol
as described in section 2.2.5 (Figure 6.1). Exposure times were set based on there being no
signal for each NPC. ND2 (Figure 6.1a), ND4 (Figure 6.1b), CYB (Figure 6.1c) and ATP8
(Figure 6.1f) labelled specifically at all concentrations. MTCO1 (Figure 6.1d) and ATP6
(Figure 6.1e) demonstrated very weak staining at a concentration of 1/200, but improved at
higher concentrations (1/100 and 1/50).

179
Figure 6.1: Immunofluorescent staining on a control section using new antibodies targeting mtDNA-encoded proteins. (a) ND2, (b) ND4, (c) CYB, (d) MTCO1, (e) ATP6 and (f) ATP8. All antibodies were used at three working concentrations (1/200, 1/100 and 1/50) and exposure times were set so that there was a lack of signal in the corresponding NPC. Scale bars: 50µm.

180
6.4.2 Testing new antibodies on patient skeletal muscle tissue
After staining was successful on control muscle tissue, each antibody was further tested on post-
mortem skeletal muscle sections from a POLG patient at a dilution of 1/100. Each section was
incubated with the antibody of interest and another known mitochondrial antibody for
comparison (either MTCO1 or VDAC1 depending on the subtype of the new antibody). Table
6.4 displays antibodies used in this experiment. The results are displayed in Figure 6.2 and
demonstrate that all antibodies labelled the patient tissue successfully at 1/100; each antibody
gave a good signal, the staining was specific and punctate, and each antibody produced labelling
patterns expected of a patient with multiple mtDNA deletions.
Table 6.4: Testing new antibodies using quadruple immunofluorescence. Each section was incubated with a new antibody that targeted mtDNA-encoded proteins and an old antibody targeting a nuclear-encoded proteins for comparison. Each new antibody of interest is highlighted. Note that both an established MTCO1 and a new MTCO1 were used during this experiment. Antibody subtypes are also stated.
Section 1 Section 2 Section 3 Section 4 Section 5 Section 6
ND2
(IgG2a)
ND4
(IgG2a)
Old MTCO1
(IgG2a)
New MTCO1
(IgG2a)
Old MTCO1
(IgG2a)
Old MTCO1
(IgG2a)
VDAC1
(IgG2b)
VDAC1
(IgG2b)
CYB
(IgG2b)
VDAC1
(IgG2b)
ATP6
(IgG2b)
ATP8
(IgG2b)
Laminin
(rabbit)
Laminin
(rabbit)
Laminin
(rabbit)
Laminin
(rabbit)
Laminin
(rabbit)
Laminin
(rabbit)
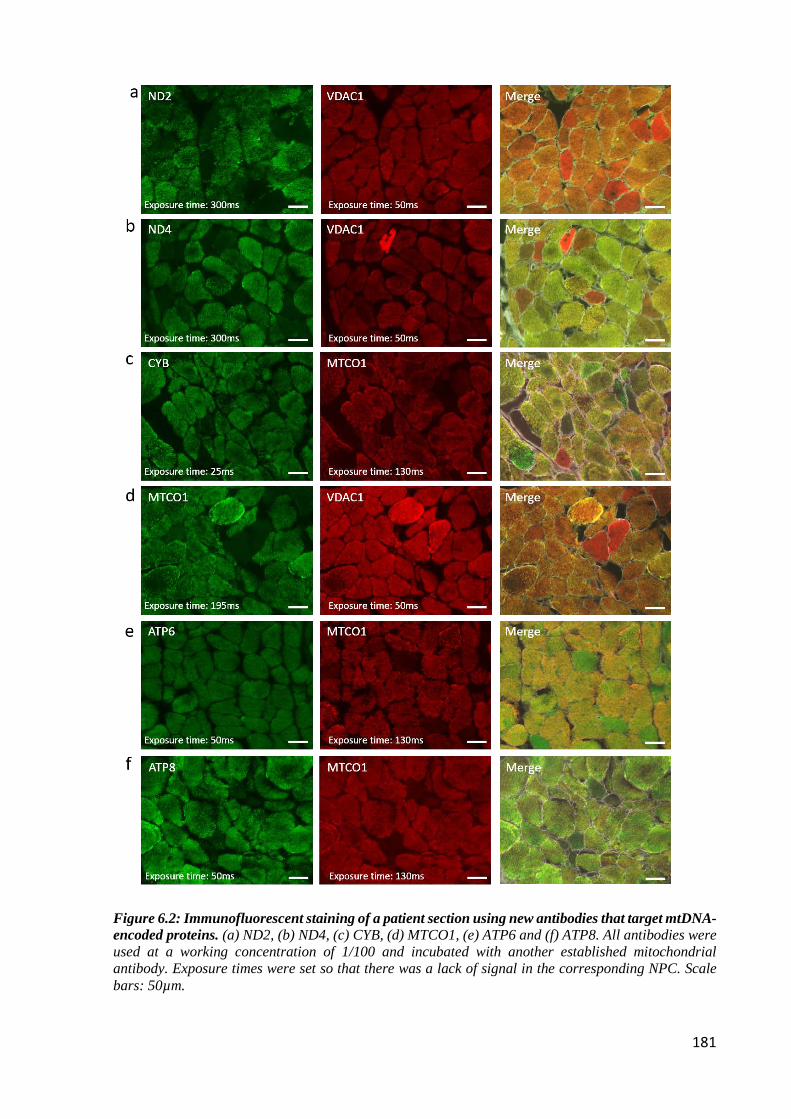
181
Figure 6.2: Immunofluorescent staining of a patient section using new antibodies that target mtDNA-encoded proteins. (a) ND2, (b) ND4, (c) CYB, (d) MTCO1, (e) ATP6 and (f) ATP8. All antibodies were used at a working concentration of 1/100 and incubated with another established mitochondrial antibody. Exposure times were set so that there was a lack of signal in the corresponding NPC. Scale bars: 50µm.

182
6.4.3 Comparing established OXPHOS antibodies to new antibodies
targeting mtDNA-encoded subunits
Although it had now been established that the antibodies worked well in skeletal muscle, an
important next step was to test them alongside recognised antibodies targeting the same
respiratory chain complexes that are routinely used in the laboratory. Sections from a control
and a patient case were incubated with each new antibody and a paired validated antibody
targeting the same respiratory chain complex, at a dilution of 1/100 (Table 6.5) following the
standard immunofluorescent protocol as described in section 2.2.5. It needs to be noted that
because sections 1 and 2 included the NDUFB8 antibody, biotinylation was performed on these
sections following the normal immunofluorescent protocol. Where there was an overlap in
isotypes (for example the two MTCO1 antibodies), the antibody was used on serial sections so
that comparisons could still be made. The sections were subsequently imaged as described in
section 2.2.6 and exposure times were set based on there being no signal for each NPC.
Table 6.5: Comparing antibodies that target mtDNA-encoded proteins with antibodies that target nuclear-encoded proteins against the same complex. Combination of antibodies used and subtype.
Section 1 Section 2 Section 3 Section 4 Section 5
ND2 (IgG2a) ND4 (IgG2a) Old MTCO1 (IgG2a) New MTCO1 (IgG2a) Old MTCO1 (IgG2a)
VDAC1 (IgG2b) VDAC1 (IgG2b) CYB (IgG2b) ATP6 (IgG2b) ATP6 (IgG2b)
NDUFB8 (IgG1) NDUFB8 (IgG1) UqCRC2 (IgG1) OSCP (IgG1) OSCP (IgG1)
Laminin (rabbit) Laminin (rabbit) Laminin (rabbit) Laminin (rabbit) Laminin (rabbit)
Results from the patient case (P01) are displayed in Figure 6.3 and demonstrate that labelling
of the new antibodies targeting mtDNA-encoded proteins produced similar staining patterns to
the old antibodies targeting the same complex when exposure times were kept constant. CYB
and ATP8 were successful at targeting CIII and CV respectively, and worked better than the
other antibodies for these complexes (UqCRC2 and OSCP respectively) (Figure 6.3c and 6.3f).
The new MTCO1 antibody was not as strong as the old MTCO1 antibody in labelling CIV
(Figure 6.3d), and this was the same for the CV antibody ATP6 when compared to OSCP
(Figure 6.3e). ND2 and ND4 were successful in labelling CI (Figure 6.3a and 6.3b) and were
equivalent to that of biotinylated NDUFB8 even without biotinylation.
After imaging, individual fibres were segmented using the software described in section 2.2.7,
and the expression level of each protein for each fibre was plotted. The expression levels from
each new antibody were plotted against the old antibody and correlation coefficients were

183
assessed (Figure 6.4). Both CI antibodies ND2 and ND4 had a good correlations with NDUFB8
(R²=0.91 and 0.84 respectively) (Figure 6.4a and 6.4b). Although still a positive correlation,
CYB and ATP8 had a weaker relationship to their corresponding antibodies (R²=0.72 for CYB
and R²=0.77 for ATP8) (Figure 6.4c and 6.4e). There was also a weak correlation between
ATP6 and OSCP (R²=0.45) (Figure 6.4d). Assessment of the images revealed that the
antibodies showing the lowest correlations (CYB, ATP6 and ATP8) were the same antibodies
that showed the most variation in staining compared to their paired antibody and therefore it
explains why the correlations are not as strong. Although both the validated and new MTCO1
had the same subtype and were assessed on serial sections, correlations could not be acquired
for these two antibodies due to difficulty in fibre matching between the serial sections.

184
Figure 6.3: Immunofluorescent staining of P01 comparing new antibodies targeting mtDNA-encoded proteins with antibodies targeting nuclear-encoded proteins against the same complex. (a) ND2, (b) ND4, (c) CYB, (d) MTCO1, (e) ATP6 and (f) ATP8. All antibodies were used at a dilution of 1/100 and incubated with another antibody targeting the same respiratory chain target. Exposure times were set so that there was a lack of signal in the corresponding NPC. Scale bars: 50µm.

185
Figure 6.4: Antibody correlations. Correlations and subsequent R² values of new antibodies compared to a validated antibody targeting the same complex. (a) ND2 and NDUFB8 of complex I, (b) ND4 and NDUFB8 of complex I, (c) CYB and UqCRC2 of complex III, (d) ATP6 and OSCP of complex V and (e) ATP8 and OSCP of complex V. Each dot represents an individual fibre. Staining and analysis carried out on serial sections from P01 with a POLG mutation.

186
6.4.4 Expression of antibodies targeting mtDNA-encoded subunits for
subsequent metal conjugation.
Similar to the work undertaken in section 4.4.1.2, each new antibody that was included in the
IMC panel were ranked based on their expression levels for the targeted protein. As previous,
this was performed immunofluorescently on control muscle tissue. Following the protocol
described in 2.2.5, each section was incubated with a different antibody at a concentration of
1/100 followed by incubation with Alexa-Fluor 488nm. Sections were imaged as described in
section 2.2.6 and exposure times were kept constant throughout. It was assumed the higher the
intensity of the 488 channel, the higher the expression of the protein (Figure 6.5). As a
comparison, two proteins from the previous panel that had different expression levels
(NDUFA13 and MTCO1) were also included.
Figure 6.5: Intensity of new antibodies that target mtDNA-encoded proteins. A graph displaying intensities of each antibody by measurement of the intensity of the 488nm channel. Each antibody is displayed as a separate strip and each dot represents an individual fibre. Red bars show the mean intensity for the given antibody.

187
Using the expression level data, each antibody was ranked so that an appropriate metal could
be assigned. As there was already a CIV antibody in the panel (old MTCO1) as well as another
CV antibody in the panel that worked better (ATP8), it was decided that MTCO1 and ATP6
would not be included due to their weak staining pre-conjugation.
The rankings of each new antibody alongside two validated antibodies already included in the
panel are shown in Table 6.6.
Table 6.6: Antibody rankings in muscle.
Ranking of antibodies (High to low)
CYB
MTCO1 (old)
ATP8
NDUFA13
ND2
ND4
The idea was to pair these new antibodies to corresponding metals in a way that essentially
allows for three mitochondrial panels to be run – the previously established mitochondrial panel
alone, a panel including the new antibodies that target mtDNA-encoded proteins, and a merge
of the two that will include antibodies that target both a nuclear-encoded and mtDNA-encoded
proteins in each complex. In order for this to be implemented successfully, careful panel design
was needed to ensure that low abundance antibodies were tagged with metals that fell within
the optimal detection range (153-176Da), but ensuring that no channel cross talk occurred.
Figure 6.6 displays all antibodies that are being used with IMC currently alongside the new
antibodies in question; green indicating the previously used antibodies and red indicating the
new antibodies targeting mtDNA-encoded proteins. The panel used in this run is displayed in
Table 6.7 and includes all the working new antibodies alongside the old ones where possible.
Once the antibodies were paired to their respective metals, conjugations and subsequent testing
were carried out as per sections 4.3.4 and 4.3.5.

188
Figure 6.6: Metal pairings. Antibodies and their corresponding metals. Antibodies are colour-coded; previously used antibodies (green) and new antibodies targeting mtDNA-encoded (red). Graph shows the optimum delivery of metals between the 153 and 176 Da range.
Table 6.7: Antibodies and corresponding metal lanthanides in new mitochondrial panel.

189
6.4.5 Running the new antibodies with imaging mass cytometry
A single transverse muscle section from nine patients with a single, large-scale mtDNA deletion
were run on the imaging mass cytometer alongside three control cases. Each antibody was
diluted 1/50. Each antibody from a representative control (Figure 6.7) and patient (Figure 6.8)
is displayed and demonstrates successful staining of both the established antibodies as well as
the antibodies that target mtDNA-encoded proteins.
Figure 6.7: IMC images from C03. Pseudo-coloured images of C03. Each panel displays a different channel containing the 11 different antibodies used. Scale bar 100µm.

190
Figure 6.8: IMC images from P04. Pseudo-coloured images of P04. Each panel displays a different channel containing the 11 different antibodies used. Scale bar 100µm.

191
6.4.6 PlotIMC profiles from patients with single, large scale mtDNA
deletions
After confirming that the new antibodies worked well with both IF and IMC, the data could
then be analysed in more depth. Once the images were segmented using the Mitocyto tool,
plotIMC was used for all further analysis. At this point, it became apparent that the morphology
of P08 was poor and because of this, P08 was removed from any subsequent analysis.
Figure 6.9: Location of single, large-scale mtDNA deletions for P02, P03 and P04. Location and size of the mtDNA deletion from individual patients: P02 deletion size 4978bp, breakpoints: m.8482-13460, P03 deletion size 4978bp, breakpoints: m.8482-13460 and P04; deletion size 4241bp, breakpoints: m.9498-13739. The mtDNA is colour-coded by gene-type: CI genes; orange, CIII genes; red, CIV genes; green, CV genes; blue and tRNA genes (dark blue).
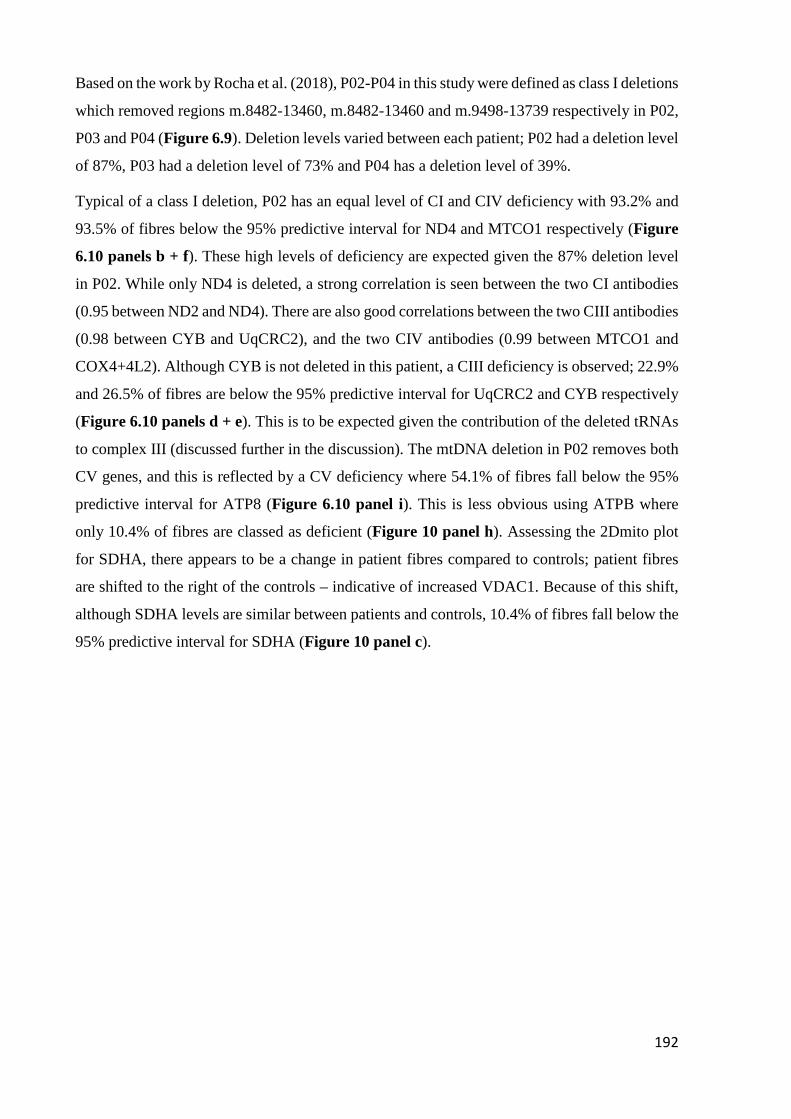
192
Based on the work by Rocha et al. (2018), P02-P04 in this study were defined as class I deletions
which removed regions m.8482-13460, m.8482-13460 and m.9498-13739 respectively in P02,
P03 and P04 (Figure 6.9). Deletion levels varied between each patient; P02 had a deletion level
of 87%, P03 had a deletion level of 73% and P04 has a deletion level of 39%.
Typical of a class I deletion, P02 has an equal level of CI and CIV deficiency with 93.2% and
93.5% of fibres below the 95% predictive interval for ND4 and MTCO1 respectively (Figure
6.10 panels b + f). These high levels of deficiency are expected given the 87% deletion level
in P02. While only ND4 is deleted, a strong correlation is seen between the two CI antibodies
(0.95 between ND2 and ND4). There are also good correlations between the two CIII antibodies
(0.98 between CYB and UqCRC2), and the two CIV antibodies (0.99 between MTCO1 and
COX4+4L2). Although CYB is not deleted in this patient, a CIII deficiency is observed; 22.9%
and 26.5% of fibres are below the 95% predictive interval for UqCRC2 and CYB respectively
(Figure 6.10 panels d + e). This is to be expected given the contribution of the deleted tRNAs
to complex III (discussed further in the discussion). The mtDNA deletion in P02 removes both
CV genes, and this is reflected by a CV deficiency where 54.1% of fibres fall below the 95%
predictive interval for ATP8 (Figure 6.10 panel i). This is less obvious using ATPB where
only 10.4% of fibres are classed as deficient (Figure 10 panel h). Assessing the 2Dmito plot
for SDHA, there appears to be a change in patient fibres compared to controls; patient fibres
are shifted to the right of the controls – indicative of increased VDAC1. Because of this shift,
although SDHA levels are similar between patients and controls, 10.4% of fibres fall below the
95% predictive interval for SDHA (Figure 10 panel c).

193
Figure 6.10: 2Dmito plot from P02 with a single, large-scale mtDNA deletion removing regions m.8482-13460. 2Dmito plots from P02 comparing OXPHOS targets against VDAC1: (a) ND2, (b) ND4, (c) SDHA, (d) UqCRC2, (e) CYB, (f) MTCO1, (g) COX4+4L2, (h) ATPB, (i) ATP8. Individual single-cell IMC measurements from each patient is represented by a coloured point in each panel. Control observations are in grey. Points representing patient fibres are coloured for by theta ND2 for that fibre. Regression through the control data is drawn as a solid grey line and the 95% predictive interval for control fibres lies between the dashed grey lines. Total number of fibres above and below the control predictive interval are written above each panel.

194
Although previously identified as a class I deletion, P03 presents with higher levels of CIV
deficiency (51.7% of fibres below the 95% predictive interval for MTCO1 (Figure 6.11 panel
f)) compared to CI (31.5% of fibres below the 95% confidence interval for ND4 (Figure 6.11
panel b)). Although only ND4 is deleted, there is a good correlation between the two CI
antibodies ND2 and ND4 (0.96), the two CIII antibodies CYB and UqCRC2 (0.94), and the
two CIV antibodies MTCO1 and COX4+4L2 (0.98), as previously seen. Similar to P02,
although CYB is not deleted in this patient, a CIII deficiency is observed (19.9% and 11.1% of
fibres below the 95% predictive interval for UqCRC2 and CYB respectively (Figure 6.11
panels d and e)). Furthermore, as a result of both CV genes being deleted, a downregulation
of CV is demonstrated by 42.3% of fibres below the 95% predictive interval for ATP8 (Figure
6.11 panel i). This is less obvious using ATPB (Figure 6.11 panel h) where only 0.3% of fibres
are classed as deficient. Looking at the 2Dmito plot for SDHA, there is a population of fibres
that have an upregulation in CII above controls; 4.6% of fibres lie above the 95% predictive
interval for SDHA (Figure 6.11 panel c).

195
Figure 6.11: 2Dmito plot from P03 with a single, large-scale mtDNA deletion removing regions m.8482-13460. 2Dmito plots from P03 comparing OXPHOS targets against VDAC1: (a) ND2, (b) ND4, (c) SDHA, (d) UqCRC2, (e) CYB, (f) MTCO1, (g) COX4+4L2, (h) ATPB, (i) ATP8. Individual single-cell IMC measurements from each patient is represented by a coloured point in each panel. Control observations are in grey. Points representing patient fibres are coloured for by theta ND2 for that fibre. Regression through the control data is drawn as a solid grey line and the 95% predictive interval for control fibres lies between the dashed grey lines. Total number of fibres above and below the control predictive interval are written above each panel.

196
P04 follows a more typical biochemical phenotype of a class I deletion; with equal amounts of
CI and CIV deficiency; 29.2% and 22.0% of fibres below the 95% predictive interval for ND4
and MTCO1 respectively (Figure 6.12 panels b and f). Again, there is a strong correlation
between the two CI antibodies ND2 and ND4 (0.96) even though only ND4 is deleted. There
are also strong correlations between the two CIII antibodies CYB and UqCRC2 (0.97) as well
as the two CIV antibodies MTCO1 and COX4+4L2 (0.99). Low levels of deficiency are seen
for both CIII (7.6% and 8.4% of fibres below the predictive interval for UqCRC2 and CYB
respectively (Figure 6.12 panels d and e)) and CV (5.8% of fibres below the 95% predictive
interval for ATP8 (Figure 6.12 panels i)) – however these are expected given the size and level
of the mtDNA deletion. Similar to P01, the 2Dmito plot for SDHA is shifted right for patient
fibres compared to controls which implies that there is an increase in VDAC1. Although it
appears that patient fibres have increased levels of SDHA relative to controls (demonstrated by
an upwards shift in a number of fibres), because of the right shift in VDAC1, 6.2% of fibres
fall below the 95% predicative interval (Figure 6.12 panel c). The lower levels of deficiency
seen in this patient compared to P02 and P03 could be a result of the lower deletion level of
39%.

197
Figure 6.12: 2Dmito plot from P04 with a single, large-scale mtDNA deletion removing regions m.9498-13739. 2Dmito plots from P04 comparing OXPHOS targets against VDAC1: (a) ND2, (b) ND4, (c) SDHA, (d) UqCRC2, (e) CYB, (f) MTCO1, (g) COX4+4L2, (h) ATPB, (i) ATP8. Individual single-cell IMC measurements from each patient is represented by a coloured point in each panel. Control observations are in grey. Points representing patient fibres are coloured for by theta ND2 for that fibre. Regression through the control data is drawn as a solid grey line and the 95% predictive interval for control fibres lies between the dashed grey lines. Total number of fibres above and below the control predictive interval are written above each panel.

198
Figure 6.13: Location of single, large-scale mtDNA deletions for P05, P06 and P07. Location and size of the mtDNA deletion from individual patients: P05 deletion size 4851bp, breakpoints: m.10747-15598, P06 deletion size 4641bp, breakpoints: m.10946-15587 and P07; deletion size 2308bp, breakpoints: m.12113-14421. The mtDNA is colour-coded by gene-type: CI genes; orange, CIII genes; red, CIV genes; green, CV genes; blue and tRNA genes (dark blue).
As shown in the work by Rocha et al. (2018), P05-P07 are defined as class II deletions which
removed regions m.10747-15598, m.10946-15587 and m.12113-14421 in P05, P06 and P07
respectively (Figure 6.13). All patients presented with high deletion levels of 71%, 83% and
90% in P05, P06 and P07 respectively.
As a class II deletion, it is expected that there is a higher level of CI deficiency in comparison
to CIV. This is well exemplified in P05; 65.1% of fibres are below the 95% predictive interval
for ND4 (Figure 6.14 panel b) compared to 33.8% for MTCO1 (Figure 6.14 panel f).
Consistent with previous patients, although only ND4 is deleted, there is strong correlation
between the two CI antibodies ND2 and ND4 (0.97). The two CIII antibodies CYB and
UqCRC2 (0.98), and the two CIV antibodies MTCO1 and COX4+4L2 (0.98) also have strong
correlations. A high level of CIII deficiency is observed with 56.9% of fibres below the 95%
predictive interval for CYB (Figure 6.14 panel e). This is slightly lower than UqCRC2 where
63.8% of fibres fall below the predictive interval (Figure 6.14 panel d). This is unexpected
given that the mtDNA deletion in P05 removes CYB and thus it is anticipated that a CIII
deficiency is displayed – with CYB presenting higher levels than UqCRC2. The mtDNA
deletion does not affect any CV genes and this is reflected by the low levels of CV deficiency

199
observed; only 8.3% of fibres fall below the 95% predictive interval for ATP8, which is thought
to be a result of the deletion of tRNAs that are important for the translation of ATP8 (Figure
6.14 panel i). Although only a small percentage of fibres, a change is seen in CII relative to the
control population, with 1.5% of fibres above and 1.7% of fibres below the 95% predictive
intervals respectively (Figure 6.14 panel c).
Figure 6.14: 2Dmito plot from P05 with a single, large-scale mtDNA deletion removing regions m.10747-15598. 2Dmito plots from P05 comparing OXPHOS targets against VDAC1: (a) ND2, (b) ND4, (c) SDHA, (d) UqCRC2, (e) CYB, (f) MTCO1, (g) COX4+4L2, (h) ATPB, (i) ATP8. Individual single-cell IMC measurements from each patient is represented by a coloured point in each panel. Control observations are in grey. Points representing patient fibres are coloured for by theta ND2 for that fibre. Regression through the control data is drawn as a solid grey line and the 95% predictive interval for control fibres lies between the dashed grey lines. Total number of fibres above and below the control predictive interval are written above each panel.

200
P06 shows the typical biochemical phenotype of a class II deletion; 61.4% of fibres fall below
the 95% predictive interval for ND4 (Figure 6.15 panel b) compared to 36.1% for MTCO1
(Figure 6.15 panel f). The mtDNA deletion removes CYB and thus a CIII deficiency is
observed (51.9% of fibres are below the 95% predicative interval for CYB (Figure 6.15 panel
e)). This is marginally lower using UqCRC2 as a marker (48.7%) (Figure 6.15 panel d), which
is expected given that UqCRC2 is nuclear-encoded. Although both CV genes are preserved, a
complex V deficiency is observed using the mitochondrial marker ATP8 (17.9% of fibres fall
below the 95% predictive interval (Figure 6.15 panel i)) but not when using ATPB (Figure
6.15 panel h). Looking at the 2Dmito plot for SDHA, there is an upwards shift in patient fibres
compared to controls; 5.1% of fibres lie above the 95% predictive interval for SDHA, indicative
of CII upregulation (Figure 6.15 panel c). There is a good correlation between the two
antibodies targeting CI (correlation of 0.97 between ND2 and ND4), CIII (correlation of 0.99
between CYB and UqCRC2), and CIV (correlation of 0.93 between MTCO1 and COX4+4L2).
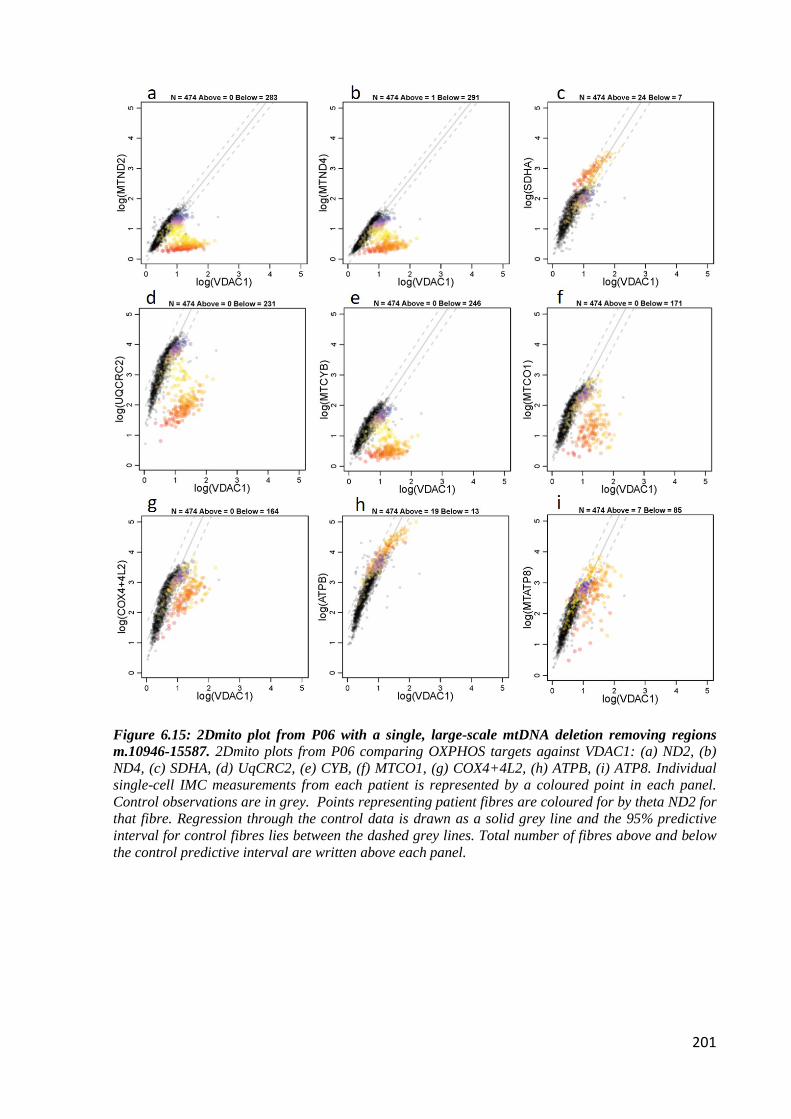
201
Figure 6.15: 2Dmito plot from P06 with a single, large-scale mtDNA deletion removing regions m.10946-15587. 2Dmito plots from P06 comparing OXPHOS targets against VDAC1: (a) ND2, (b) ND4, (c) SDHA, (d) UqCRC2, (e) CYB, (f) MTCO1, (g) COX4+4L2, (h) ATPB, (i) ATP8. Individual single-cell IMC measurements from each patient is represented by a coloured point in each panel. Control observations are in grey. Points representing patient fibres are coloured for by theta ND2 for that fibre. Regression through the control data is drawn as a solid grey line and the 95% predictive interval for control fibres lies between the dashed grey lines. Total number of fibres above and below the control predictive interval are written above each panel.

202
Similar to P05 and P06, P07 has a larger proportion of fibres deficient for CI than CIV (96.4%
of fibres below the 95% predictive interval for ND4 compared to 58.2% for MTCO1 (Figure
6.16 panels b and f)). Although CYB is preserved, a large CIII deficiency is observed; 39.7%
and 47% of fibres are below the 95% predictive interval for UqCRC2 and CYB respectively
(Figure 6.16 panels d and e). There are low levels of CV deficiency (7.8% and 12.5% of fibres
lie below the 95% predictive interval for ATPB and ATP8 respectively (Figure 6.16 panels h
and i)) which is expected given that both ATP6 and ATP8 genes are preserved. VDAC1 is
increased in patient fibres compared to controls and this is demonstrated by a right shift in the
2Dmito plot. Because of this, although a large proportion of patient fibres have an increased
SDHA expression level above the controls (demonstrated by an upwards shift in Figure 6.16
panel c, 12.7% of fibres fall below the 95% predictive interval for SDHA. The correlations
between antibodies targeting the same complexes are strong (0.92 between ND2 and ND4 (CI),
0.97 between CYB and UqCRC2 (CIII) and 0.96 between MTCO1 and COX4+4L2 (CIV)).

203
Figure 6.16: 2Dmito plot from P07 with a single, large-scale mtDNA deletion removing regions m.12113-14421. 2Dmito plots from P07 comparing OXPHOS targets against VDAC1: (a) ND2, (b) ND4, (c) SDHA, (d) UqCRC2, (e) CYB, (f) MTCO1, (g) COX4+4L2, (h) ATPB, (i) ATP8. Individual single-cell IMC measurements from each patient is represented by a coloured point in each panel. Control observations are in grey. Points representing patient fibres are coloured for by theta ND2 for that fibre. Regression through the control data is drawn as a solid grey line and the 95% predictive interval for control fibres lies between the dashed grey lines. Total number of fibres above and below the control predictive interval are written above each panel.
.

204
Figure 6.17: Location of single, large-scale mtDNA deletions for P09 and P10. Location and size of the mtDNA deletion from individual patients: P09 deletion size 7144bp, breakpoints: m.5772-12916 and P10; deletion size 5219bp, breakpoints: m.6002-11221. The mtDNA is colour-coded by gene-type: CI genes; orange, CIII genes; red, CIV genes; green, CV genes; blue and tRNA genes (dark blue).
Based on the work by Rocha et al. (2018), P09 and P10 are defined as class III deletions which
removed regions m.5772-12916 and m.6002-11221 in P09 and P10 respectively (Figure 6.17).
Both patients have low deletion levels of 36% and 15% in P09 and P10 respectively.
Typical of a class III deletion, P09 (Figure 6.18) has higher levels of CIV deficiency than CI;
31.4% of fibres are below the 95% predictive interval for ND4 (Figure 6.18 panel b) compared
to 38.1% for MTCO1 (Figure 6.18 panel f). There is a strong correlation (0.97) between the
two CI antibodies, with both ND2 and ND4 showing equal levels of deficiency despite only
ND4 being deleted. There are also good correlations between both CIII antibodies CYB and
UqCRC2 (1.0) and both CIV antibodies MTCO1 and COX4+4L2 (0.99). CYB is preserved in
this deletion, so it is not surprising that only low levels of CIII deficiency is seen (9.4% and
5.4% of fibres below the 95% predictive interval for UqCRC2 and CYB respectively (Figure
6.18 panels d + e). Although there is some CV deficiency (22.4% of fibres below the 95%
predictive interval for ATP8 (Figure 6.18 panel i)), this is lower than what is expected given
that the mtDNA deletion removes both CV genes. However this result may reflect the mtDNA
deletion level of the patient, with P09 presenting with a low mtDNA deletion level of 36%. A
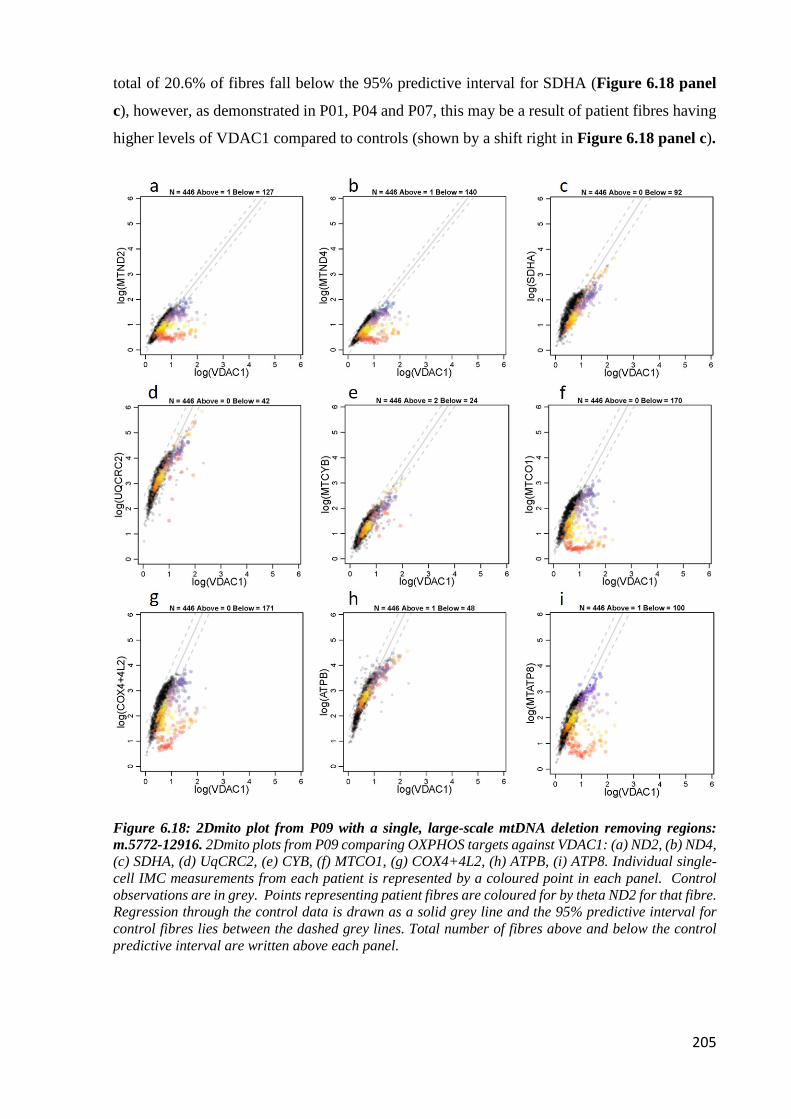
205
total of 20.6% of fibres fall below the 95% predictive interval for SDHA (Figure 6.18 panel
c), however, as demonstrated in P01, P04 and P07, this may be a result of patient fibres having
higher levels of VDAC1 compared to controls (shown by a shift right in Figure 6.18 panel c).
Figure 6.18: 2Dmito plot from P09 with a single, large-scale mtDNA deletion removing regions: m.5772-12916. 2Dmito plots from P09 comparing OXPHOS targets against VDAC1: (a) ND2, (b) ND4, (c) SDHA, (d) UqCRC2, (e) CYB, (f) MTCO1, (g) COX4+4L2, (h) ATPB, (i) ATP8. Individual single-cell IMC measurements from each patient is represented by a coloured point in each panel. Control observations are in grey. Points representing patient fibres are coloured for by theta ND2 for that fibre. Regression through the control data is drawn as a solid grey line and the 95% predictive interval for control fibres lies between the dashed grey lines. Total number of fibres above and below the control predictive interval are written above each panel.

206
Consistent with P09, P10 (Figure 6.19) has a larger proportion of fibres deficient for CIV than
CI (62.1% of fibres fall below the 95% predictive interval for MTCO1 compared to 54.7% for
ND4 (Figures 6.19 panels b and f)). Although there are good correlations between the two CI
antibodies (0.98), higher levels of deficiency are seen with ND4 (54.7%) compared to ND2
(36.7%). This is also the case for both CIV antibodies with COX4+4L2 displaying a higher
level of deficiency than MTCO1 (76% and 62.1% respectively) despite a very strong correlation
(0.99). Although CYB is not deleted, CIII deficiency is observed, however there is great
variability between the two CIII antibodies; UqCRC2 indicates 66.6% of fibres fall below the
95% predictive interval (Figure 6.19 panel d) and this is much lower using CYB (32.2% of
fibres fall below the 95% predictive interval (Figure 6.19 panel e)). This is not reflected in the
correlation matrix, with a strong correlation between the two (0.99). There are high levels of
CV deficiency which is expected given both CV genes are removed; 53.9% of fibres fall below
the 95% predictive interval for ATP8 (Figures 6.19 panel i). 11.2% of fibres fall below the
95% predictive interval for SDHA (Figures 6.19 panel c).

207
Figure 6.19: 2Dmito plot from P10 with a single, large-scale mtDNA deletion removing regions: m.6002-11221. 2Dmito plots from P10 comparing OXPHOS targets against VDAC1: (a) ND2, (b) ND4, (c) SDHA, (d) UqCRC2, (e) CYB, (f) MTCO1, (g) COX4+4L2, (h) ATPB, (i) ATP8. Individual single-cell IMC measurements from each patient is represented by a coloured point in each panel. Control observations are in grey. Points representing patient fibres are coloured for by theta ND2 for that fibre. Regression through the control data is drawn as a solid grey line and the 95% predictive interval for control fibres lies between the dashed grey lines. Total number of fibres above and below the control predictive interval are written above each panel.

208
6.5 Discussion
The aim of this chapter was to optimise six antibodies that targeted mtDNA-encoded proteins
for use with both IF and IMC, and the results presented throughout demonstrate that this aim
was met. Four out of the six antibodies were successful with both immunofluorescence and
IMC, and were comparable with other antibodies that target the same respiratory chain
complexes. Both ND2 and ND4 were better at successfully labelling CI than biotinylated
NDUFB8. Additionally, CYB and ATP8 stained better than both their nuclear-encoded
counterparts (UqCRC2 and OSCP respectively).
The advantages of plotIMC as an analysis tool means that protein levels from all five OXPHOS
complexes are examined in thousands of cell simultaneously. It is reassuring to note that
generally, with the exception of P03, the pattern of CI and CIV deficiency seen in these patients
parallels what is expected given their class of deletion (as determined by Rocha et al. (2018)).
Furthermore, deficiency in the less commonly studied complexes (CIII and CV), fit what is
expected given the size and location of each deletion.
Interestingly, six out of the eight patients (P02, P03, P04, P07, P09 and P10) present with a
down regulation in complex III, despite the relevant deletions having no effect on the CYB
gene. It is hypothesised that this CIII deficiency may be driven by the removal of tRNAs that
are essential for the translation of CYB. Table 6.8 displays each tRNA and their relative
involvement with each of the 13 mitochondrial genes. Of the 380 amino acids that are needed
for CYB to function, P02-P04 have deletions that consistently removes 9% of these (35 tRNAs;
L, S, H R and G), P07 has a deletion that removes 28.4% of these (108 tRNAs; E, L, S and H),
P09 has a deletion that removes 59.7% of these (227 tRNAs; L, S, H, R, G, K, D, S, Y, C, N
and W) and P10 has a deletion that removes 20.8% of these (79 tRNAs; R, G, K, D and S). This
suggests that although the CYB gene is preserved, the elimination of a number of tRNAs
important for the translation of CYB means that CIII is not completely functional, hence why
a deficiency is detected. Furthermore, the percentage of deficiency that is detected will depend
not only on the percentage of tRNAs that are deleted, but also the percentage deletion level as
well.

209
Table 6.8: tRNAs required for the translation of each mitochondrial gene. Each column displays the number of each different tRNA that is needed for the translation of each mitochondrial gene (displayed in each row). The overall number of tRNAs needed for the translation of each gene is also displayed in brackets. Data sourced from Smith and Robinson (2016).
Although well correlated, the level of deficiency detected by the two CIII antibodies UqCRC2
and CYB differs. CYB is encoded by the mtDNA whist UqCRC2 is a nuclear protein, therefore
it is expected that if there are differences in the level of deficiency, because the mtDNA
deletions will most likely affect mtDNA-encoded genes to a greater extent than nuclear genes,
a higher level of deficiency will be detected using CYB compared to UqCRC2. Unusually, this
appears to vary between patients; P02, P04, P06, P07 show higher levels of CIII deficiency
using CYB compared to UqCRC2, whilst P03, P05, P09 and P10 show higher levels of CIII
deficiency using UqCRC2 compared to CYB. It is unclear as to why this occurs and further
investigation will need to be carried out to determine the cause of this.
The results demonstrate a very good correlation between the two CI antibodies ND2 and ND4,
despite ND4 being the only subunit of the two that is deleted in the majority of patients.
Although Stroud et al. (2016) suggests that subunits within the same assembly intermediate
modules will impact one another, ND2 and ND4 are part of different assembly intermediate
modules and thus does not explain why such a good correlation is seen. However, it may be
that the ND4 deletion is having some influence on ND2 expression due to the interaction of the
modules. In support of this observation, previous studies have demonstrated that other complex
I subunits (including ND2) are strongly reduced in cells lacking ND4 (Hofhaus and Attardi,
1993, Hofhaus and Attardi, 1995).
Most intriguingly, a lower level of SDHA relative to VDAC1 was seen in a number of these
patients, compared to the controls. Although there is limited research into CII, this result

210
contradicts previous work that suggests that CII is either typically unaffected by impaired
mtDNA, or increased as a result of mitochondrial biogenesis (Edgar et al., 2009, Ross et al.,
2010). This increase was also demonstrated in the work described in chapter 5.
In this cohort of patients with single, large-scale deletions, there are a number of fibres that fall
below the 95% predictive interval for SDHA. Whilst fibres falling below this interval are
normally classed as deficient, it is hypothesised that for SDHA this may not be true deficiency,
but a result of how the data is statistically analysed. To calculate the 95% predictive intervals,
a crude linear regression is assumed and the model does not take into account that the data may
be different shapes; this will affect how many fibres fall above, below or within the predicative
interval and thus will affect what is classed as SDHA deficient. This is supported by looking
more closely at the 2Dmito plots. Fibres deficient in other complexes arrange in a “v-shaped”
manner, one group in which the relationship between the antibody signal and VDAC1 signal
resembles a control patient, and another group where the signal is much lower (see section
5.4.9). This is not the case for SDHA deficient fibres, which follow the line of the controls but
fall just below the 95% predictive interval. Furthermore, the patients with SDHA deficiency
tend to be the same patients that have a shift in the level of VDAC1 higher than the control
population – indicative of increased mitochondrial mass or ragged red fibres. This shift suggests
that the SDHA deficiency may not be “real” but may be a product of disconnect between SDHA
and VDAC1 expression – with VDAC1 expression increasing disproportionally to SDHA.
Moreover, the analysis used with plotIMC is designed in such a way that all proteins are
corrected for mitochondrial mass by normalising to the VDAC1 channel. This means that
although there may be ragged red fibres present (a common occurrence in patients with single,
large-scale deletions (Pitceathly et al., 2012)), these will not be detected quantitatively and thus
may also be a reason for the disconnect between SDHA and VDAC1. If the 95% predictive
intervals are ignored and the raw shape of the data is examined, selecting CI and CIV deficient
fibres reveals the highest levels of SDHA. This is not entirely consistent between patients, but
is expected given the variation in the size and location of the different deletions – more
consistent with previous work.
The advantages of IMC means that a great number of proteins can be examined simultaneously.
The addition of antibodies targeting mtDNA-encoded proteins together with the panel of
antibodies that target nuclear proteins only strengthens this advantage and allows a number of
different research avenues to be explored.
The analysis carried out in conjunction with plotIMC has proven effective in detecting both
upregulation and downregulation of respiratory chain proteins. However, throughout this

211
chapter there has been evidence indicating that this analysis may present some limitations
moving forward. The way in which the 95% predictive intervals are calculated means that any
data which does not follow a crude linear regression could be affected; impacting the level of
deficiency by influencing how many fibres lie above, below or within the interval. Future work
may look to solve this by deducing an alternative model that classifies dysfunction in ways that
are not solely based on a linear regression.
The work carried out in Chapter 5 revealed that in patients with combined deficiencies,
OXPHOS complexes could present a biochemical threshold effect, whereby a threshold
proportion of mtDNA mutation must be achieved before fibres become deficient. Furthermore,
it was found that this threshold differed for each complex. In line with this work, it would be
interesting to carry out mtDNA threshold analysis in this cohort of single, large-scale mtDNA
patients. This would involve carrying out genetic analysis alongside IMC to determine the
deletion level in single cell fibres with varying levels of deficiency.

212

213
Chapter 7 : Final discussion

214
Mitochondrial diseases are a group of heterogeneous genetic disorders that are characterised by
defects in oxidative phosphorylation and can be attributed to mutations in either mitochondrial
(mtDNA) or nuclear DNA (Gorman et al., 2016). The skeletal muscle is one of the most energy
demanding tissues in the body and because of this, it is not surprising that respiratory chain
deficiency in skeletal muscle is often a consequence of mitochondrial disease. Due to the
heteroplasmic nature of mtDNA, respiratory chain deficiency arises in a mosaic pattern and
these levels of deficiency in individual fibres can now be accurately quantified (Rocha et al.,
2015). However, due to limitations of current techniques, it is still challenging to
simultaneously investigate the OXPHOS deficiency of all complexes. As such, this research
was aimed to develop a technique that overcomes this limitation and successfully quantifies
mitochondrial dysfunction of all complexes simultaneously in human skeletal muscle.
7.1 Main findings
7.1.1 Mitochondrial function is maintained in active 85 year old adults
Previously, research looking into mitochondrial dysfunction in older individuals has
demonstrated increased levels of respiratory chain deficiency with advancing age (reviewed by
Larsson (2010)). Furthermore, it has been shown that physical activity can increase the
oxidative capacity of the muscle (reviewed by Rogers and Evans (1993)), and can attenuate any
age related symptoms. However, there are very few studies that have looked at very old
participants, and often, relevant studies typically have a mean age below 85 years (Spendiff et
al., 2016, Rygiel et al., 2017). The most interesting finding from work presented in Chapter 3
is that active individuals in their 85th year of life and who engage in regular physical activity,
have levels of respiratory chain deficiency comparable to young healthy controls.
7.1.2 Imaging mass cytometry can be used to successfully assess OXPHOS
deficiency in single skeletal muscle fibres and is comparable to other
techniques.
Imaging mass cytometry is a technique that has been adapted to accurately quantify a number
of different proteins simultaneously within skeletal muscle. Furthermore, the development of
subsequent novel analysis has permitted the interactive investigation of these proteins on a
single cell level and offers the opportunity to answer key mechanistic questions such as: which
complex(es) is/are affected by particular nuclear and mtDNA mutations?; what is the
relationship between each of the individual complexes?; is there a change in the unaffected

215
complex(es) in response to respiratory chain deficiency?; is deficiency the same in all fibres or
do individual fibres respond differently?
Regarding the validity of IMC, this work has shown that the technique is comparable to the
established quadruple immunofluorescent assay and demonstrates that the biochemical profiles
from patients with varying mitochondrial mutations are similar between the two methods.
Furthermore, the reproducibility of the technique is strong - particularly between the same
batches of conjugated antibody.
7.1.3 IMC can deduce different OXPHOS phenotypes in different patient
groups.
Through the use of IMC, this work has shown that patients with different nuclear and mtDNA
variants present with different OXPHOS deficiency phenotypes that are reflective of their
respective mutations. Furthermore, for the first time, patients with CI deficiency present with
an upregulation of proteins involved in unaffected respiratory chain complexes and in most
cases, this upregulation correlates with the level of deficiency. Although this occurs in CII-CV,
this is demonstrated most strongly in CII by an increase in SDHA. It could be that this is a
compensatory response to deficiency and is seen more strongly in CII as this complex acts as
the only second entry point for electrons entering the electron transport chain when CI is not
available.
7.1.4 Successful identification and optimisation of antibodies targeting
mtDNA-encoded OXPHOS subunits.
Previously, there have been limited antibodies that target mtDNA-encoded subunits of the
OXPHOS protein complexes efficiently and thus deficiency has been studied primarily using
antibodies that target the nuclear-encoded subunits of each complex. This work has now
identified and optimised working antibodies targeting these mtDNA-encoded subunits and has
shown that they are successful in labelling skeletal muscle using both immunofluorescence and
imaging mass cytometry.
7.1.5 The biochemical profiles of single, large-scale mtDNA deletion
patients correlate well with the size and location of the respective
deletions.
Through IMC, proteins involved in all five complexes of the respiratory chain can now be
examined. The work presented in Chapter 6 investigated a cohort of patients with single, large-

216
scale mtDNA deletions, using antibodies that targeted both nuclear and mtDNA-encoded
proteins. It was revealed that the deficiency observed in these patients matched their respective
mtDNA deletions and correlated well with what genes were affected. Furthermore, complex III
deficiency was detected in patients where the deletion did not encompass CYB. It is
hypothesised that this is caused by the removal of tRNAs that are essential for the translation
of CYB, and thus highlights the importance of tRNA involvement for the functioning of each
complex.
7.2 Advantages of imaging mass cytometry
The main focus of this thesis has been to develop and optimise the use of IMC to examine
proteins within skeletal muscle. There are a number of characteristics that makes IMC
advantageous over other imaging techniques. Because the antibodies are conjugated to heavy
metal isotopes that do not suffer from the same degree of signal overlap as fluorochromes, IMC
allows simultaneous multiplex assessment of many more protein targets than is possible with
immunofluorescent techniques in a single tissue section. This not only preserves valuable
samples by reducing the amount of tissue that is required, but also eliminates the need for serial
sections - removing any potential for discrepancies between sections and the potential for
“batch effects”. The removal of fluorochromes also eliminates any sample autofluorescence
and fluorescent background signal. Moreover, the automated capacity of IMC means that user
subjectivity is minimised and the efficiency of each experiment is improved -with experiments
being completed more quickly.
Alongside Dr Conor Lawless, I have designed and implemented novel analysis tools which
permits the analysis of many targets simultaneously at a single fibre level. Mitocyto enables
successful automatic single fibre segmentation. This means that analysis is more standard
between users and also much quicker than other available software. Furthermore, the tool
permits manual intervention when needed, thus ensuring only fibres that should be included are
further analysed. Additionally, the interactive nature of the plotIMC means that users can
manually select fibres of interest from each patient and examine the protein levels of those
fibres across all of the different channels - allowing thousands of measurements to be extracted
at one time.

217
7.3 Disadvantages of imaging mass cytometry
IMC is not without its limitations and throughout its development, a number of problems have
arisen. Unlike conventional immunohistochemistry, antibodies that are compatible with IMC
are not readily available and often, bespoke antibodies are required, which is both time
consuming and expensive. However, with the expansion of IMC as an imaging technique, it is
envisaged that biotechnology companies will produce more IMC-ready antibodies which will
be more easily accessible and eliminate the need for customised ordering. Furthermore, it has
been found that the conjugations of the metal lanthanides have an impact on the antibodies,
with large amounts being lost during the process. This not only has costing implications, but
also means that higher concentrations need to be used in order for the antibody to work
correctly.
Whilst a much greater number of targets can be assessed simultaneously, there are still
limitations surrounding IMC panel design. Although there is no fluorescent signal overlap
between fluorochromes, there is the potential for cross talk between the different metal
channels. Therefore, it is crucial that panels are carefully considered to minimise this risk, and
it may be that a smaller number of proteins can be assessed in one section than was initially
thought possible.
The protocol for frozen tissue preparation required for IMC is comparable to the preparation
used for immunofluorescence, in that it is both quick and easy to undertake. However, as it is
envisaged that this technique will be used in other tissue types including Formalin-Fixed
Paraffin-Embedded (FFPE) tissue, as well as in cell work, the protocol will require alterations
to accommodate these changes. Furthermore, a number of antibodies that will be included in
future panels (for example antibodies that target phosphorylated targets) will need an alternative
staining preparation compared to the current panel, therefore serial sections will need to be used
to ensure all targeted antibodies can be used.
The development of Mitocyto and plotIMC have surpassed previous analyses software and have
permitted the interactive assessment of many proteins simultaneously. However, throughout
this thesis it has come to light that these analysis programmes also present some disadvantages.
Mitocyto was built to allow automatic segmentation of individual muscle fibres, and although
a larger proportion of fibres are segmented automatically using this compared to other software,
there is still the occasional need for manual intervention. Furthermore, Mitocyto failed to
segment smaller fibres from paediatric cases and thus the software will have to undergo a
number of modification to allow for this.

218
The classification of deficiency is calculated from plotIMC using 95% predictive intervals.
These intervals are based on the data having a crude linear regression and the model does not
take into account that this may not always be the case. Because of this, the classification of
fibres above, below or within the interval may be affected, thus having an effect on what is
classed as deficient.
7.4 Future work
Although respiratory deficiency is well characterised in skeletal muscle, there is very little
investigation into the downstream effect of this deficiency at a single cell level. It is known that
a principle feature of mitochondrial disease is an impairment in OXPHOS, which is thought to
induce an adaptive stress response to trigger a number of signalling pathways. The development
of IMC has provided the opportunity to assess many proteins simultaneously and therefore it is
envisaged that IMC be used to look at the consequence of deficiency on various downstream
signalling pathways that are involved in mitochondrial biology. These pathways include
glycolysis, biogenesis, mitophagy and protein synthesis, which have been reported to have a
response to mitochondrial dysfunction (Hansson et al., 2004, Wu et al., 2015). Identifying
suitable targets for each pathway of interest is a fundamental first step and similar to the work
carried out in this thesis, antibodies targeting each protein must be available in a protein free
solution and work successfully with immunofluorescence before a metal can be assigned, and
the antibody can be conjugated for use with IMC.
There is a hypothesis that different thresholds of deficiency occur for different complexes, and
although work carried out in chapter 5 supports this suggestion, this cannot be confirmed
without further analysis. Therefore future work will involve carrying out genetic analysis on
single fibres with different levels of deficiency to assess the heteroplasmy level and whether
this correlates to the level of deficiency that is observed.
Imaging mass cytometry gives opportunity for further development and refinements. Although
Mitocyto is effective at segmenting single fibres from adult cases, it was unsuccessful at
segmenting smaller fibres from paediatric cases. This may be a result of poorer image resolution
with smaller fibres and thus it is more difficult to use the dystrophin image as fibre boundary
marker as the labelling is not as clear and precise. Therefore tailoring Mitocyto to these needs
will overcome this current limitation. Furthermore, it would be useful to look at alternative
statistical models or an adaptation of the current statistical model to move away from classifying
deficiency solely based on a regressions.

219
Although this thesis has focussed on investigating skeletal muscle, IMC can be applied to a vast
number of research areas both in isolation and in conjunction with other technologies. There is
the potential to adapt IMC to explore other tissues such as the bone - in patients with
osteoporosis, and the brain, where it can be used to look at mitochondrial dysfunction in
Parkinson’s disease or potentially to look at the link between the mitochondria and immune
cells in patients with Multiple Sclerosis.
In pharmaceutical research, high-content screening is crucial and with IMC opening up the
possibility of examining 40+ parameters simultaneously, it is the ideal technique to use in the
early stages of compound discovery where extensive cell-based screening for a number of
different biomarkers is required. Bouzekri et al. (2019) have carried out a proof of concept study
to investigate this and have demonstrated that IMC can be successfully used in the field of cell-
based screening. Currently, a number of different trials are being carried out into mitochondrial
therapeutics and it is envisaged that IMC could assist this process.
7.5 Final conclusion
This work has resolved many of the limitations that were found with previous methods to
investigate mitochondrial function in human skeletal muscle through the optimisation and
validation of a novel technique. The use of the IMC assay has provided greater insights into the
biochemical profiles of patients with a range of mitochondrial disorders and has opened up the
potential to look more broadly at the effects of these defects at a single cell level.

220
Chapter 8 : References ACIN-PEREZ, R. & ENRIQUEZ, J. A. 2014. The function of the respiratory supercomplexes: The
plasticity model. Biochimica et Biophysica Acta (BBA) - Bioenergetics, 1837, 444-450. AHMED, S. T., ALSTON, C. L., HOPTON, S., HE, L., HARGREAVES, I. P., FALKOUS, G.,
OLÁHOVÁ, M., MCFARLAND, R., TURNBULL, D. M., ROCHA, M. C. & TAYLOR, R. W. 2017. Using a quantitative quadruple immunofluorescent assay to diagnose isolated mitochondrial Complex I deficiency. Scientific Reports, 7, 15676.
ALBRING, M., GRIFFITH, J. & ATTARDI, G. 1977. Association of a protein structure of probable membrane derivation with HeLa cell mitochondrial DNA near its origin of replication. Proceedings of the National Academy of Sciences of the United States of America, 74, 1348-1352.
ALESSANDRO, R., BERNARD, T., FELICE, L., EDWIN, V. & CHARLES, H. 2005. Structural differences in two biochemically defined populations of cardiac mitochondria. American Journal of Physiology-Heart and Circulatory Physiology, 289, H868-H872.
ALLEN, D. L., ROY, R. R. & EDGERTON, V. R. 1999. Myonuclear domains in muscle adaptation and disease. Muscle Nerve, 22, 1350-60.
ALSTON, CHARLOTTE L., COMPTON, ALISON G., FORMOSA, LUKE E., STRECKER, V., OLÁHOVÁ, M., HAACK, TOBIAS B., SMET, J., STOUFFS, K., DIAKUMIS, P., CIARA, E., CASSIMAN, D., ROMAIN, N., YARHAM, JOHN W., HE, L., DE PAEPE, B., VANLANDER, ARNAUD V., SENECA, S., FEICHTINGER, RENÉ G., PŁOSKI, R., ROKICKI, D., PRONICKA, E., HALLER, RONALD G., VAN HOVE, JOHAN L. K., BAHLO, M., MAYR, JOHANNES A., VAN COSTER, R., PROKISCH, H., WITTIG, I., RYAN, MICHAEL T., THORBURN, DAVID R. & TAYLOR, ROBERT W. 2016. Biallelic Mutations in TMEM126B Cause Severe Complex I Deficiency with a Variable Clinical Phenotype. The American Journal of Human Genetics, 99, 217-227.
ALWAY, S. E., MYERS, M. J. & MOHAMED, J. S. 2014. Regulation of Satellite Cell Function in Sarcopenia. Frontiers in Aging Neuroscience, 6, 246.
AMATI-BONNEAU, P., VALENTINO, M. L., REYNIER, P., GALLARDO, M. E., BORNSTEIN, B., BOISSIERE, A., CAMPOS, Y., RIVERA, H., DE LA ALEJA, J. G., CARROCCIA, R., IOMMARINI, L., LABAUGE, P., FIGARELLA-BRANGER, D., MARCORELLES, P., FURBY, A., BEAUVAIS, K., LETOURNEL, F., LIGUORI, R., LA MORGIA, C., MONTAGNA, P., LIGUORI, M., ZANNA, C., RUGOLO, M., COSSARIZZA, A., WISSINGER, B., VERNY, C., SCHWARZENBACHER, R., MARTIN, M. A., ARENAS, J., AYUSO, C., GARESSE, R., LENAERS, G., BONNEAU, D. & CARELLI, V. 2008. OPA1 mutations induce mitochondrial DNA instability and optic atrophy 'plus' phenotypes. Brain, 131, 338-51.
ANDERSON, S., BANKIER, A. T., BARRELL, B. G., DE BRUIJN, M. H. L., COULSON, A. R., DROUIN, J., EPERON, I. C., NIERLICH, D. P., ROE, B. A., SANGER, F., SCHREIER, P. H., SMITH, A. J. H., STADEN, R. & YOUNG, I. G. 1981. Sequence and organization of the human mitochondrial genome. Nature, 290, 457.
ANITORI, R., MANNING, K., QUAN, F., WELEBER, R. G., BUIST, N. R., SHOUBRIDGE, E. A. & KENNAWAY, N. G. 2005. Contrasting phenotypes in three patients with novel mutations in mitochondrial tRNA genes. Mol Genet Metab, 84, 176-88.
BAUER, M. F., HOFMANN, S., NEUPERT, W. & BRUNNER, M. 2000. Protein translocation into mitochondria: the role of TIM complexes. Trends Cell Biol, 10, 25-31.
BEINERT, H., HOLM, R. H. & MÜNCK, E. 1997. Iron-Sulfur Clusters: Nature's Modular, Multipurpose Structures. Science, 277, 653-659.
BELLANTI, F., ROMANO, A. D., LO BUGLIO, A., CASTRIOTTA, V., GUGLIELMI, G., GRECO, A., SERVIDDIO, G. & VENDEMIALE, G. 2018. Oxidative stress is increased in sarcopenia and associated with cardiovascular disease risk in sarcopenic obesity. Maturitas, 109, 6-12.
BENDALL, S. C., NOLAN, G. P., ROEDERER, M. & CHATTOPADHYAY, P. K. 2012. A deep profiler's guide to cytometry. Trends in Immunology, 33, 323-332.
BENDER, A., KRISHNAN, K. J., MORRIS, C. M., TAYLOR, G. A., REEVE, A. K., PERRY, R. H., JAROS, E., HERSHESON, J. S., BETTS, J., KLOPSTOCK, T., TAYLOR, R. W. &

221
TURNBULL, D. M. 2006. High levels of mitochondrial DNA deletions in substantia nigra neurons in aging and Parkinson disease. Nat Genet, 38, 515-7.
BÉNIT, P., LEBON, S. & RUSTIN, P. 2009. Respiratory-chain diseases related to complex III deficiency. Biochimica et Biophysica Acta (BBA) - Molecular Cell Research, 1793, 181-185.
BEREGI, E. & REGIUS, O. 1987. Comparative morphological study of age related mitochondrial changes of the lymphocytes and skeletal muscle cells. Acta morphologica Hungarica, 35, 219-224.
BEREITER-HAHN, J. & VÖTH, M. 1994. Dynamics of mitochondria in living cells: Shape changes, dislocations, fusion, and fission of mitochondria. Microscopy Research and Technique, 27, 198-219.
BERG, J. M., TYMOCZKO, J. L., GATTO, G. J. & STRYER, L. 2015a. Biochemistry 8th edition. Glycolysis and gluconeogenesis.
BERG, J. M., TYMOCZKO, J. L., GATTO, G. J. & STRYER, L. 2015b. Biochemistry 8th edition. The Citric Acid Cycle. 495-522.
BERG, J. M., TYMOCZKO, J. L., GATTO, G. J. & STRYER, L. 2015c. Biochemistry 8th edition. Oxidative phosphorylation. 523-563.
BHARGAVA, K. & SPREMULLI, L. L. 2005. Role of the N- and C-terminal extensions on the activity of mammalian mitochondrial translational initiation factor 3. Nucleic Acids Research, 33, 7011-7018.
BIDOOKI, S. K., JOHNSON, M. A., CHRZANOWSKA-LIGHTOWLERS, Z., BINDOFF, L. A. & LIGHTOWLERS, R. N. 1997. Intracellular mitochondrial triplasmy in a patient with two heteroplasmic base changes. Am J Hum Genet, 60, 1430-8.
BLAKE, D. J., WEIR, A., NEWEY, S. E. & DAVIES, K. E. 2002. Function and Genetics of Dystrophin and Dystrophin-Related Proteins in Muscle. Physiological Reviews, 82, 291-329.
BLEAZARD, W., MCCAFFERY, J. M., KING, E. J., BALE, S., MOZDY, A., TIEU, Q., NUNNARI, J. & SHAW, J. M. 1999. The dynamin-related GTPase Dnm1 regulates mitochondrial fission in yeast. Nat Cell Biol, 1, 298-304.
BLUMENTHAL, J. A., EMERY, C. F., MADDEN, D. J., GEORGE, L. K., COLEMAN, R. E., RIDDLE, M. W., MCKEE, D. C., REASONER, J. & WILLIAMS, R. S. 1989. Cardiovascular and Behavioral Effects of Aerobic Exercise Training in Healthy Older Men and Women. Journal of Gerontology, 44, M147-M157.
BOURGERON, T., RUSTIN, P., CHRETIEN, D., BIRCH-MACHIN, M., BOURGEOIS, M., VIEGAS-PEQUIGNOT, E., MUNNICH, A. & ROTIG, A. 1995. Mutation of a nuclear succinate dehydrogenase gene results in mitochondrial respiratory chain deficiency. Nat Genet, 11, 144-9.
BOUZEKRI, A., ESCH, A. & ORNATSKY, O. 2019. Multidimensional profiling of drug-treated cells by Imaging Mass Cytometry. bioRxiv, 549592.
BOWEN, T. S., SCHULER, G. & ADAMS, V. 2015. Skeletal muscle wasting in cachexia and sarcopenia: molecular pathophysiology and impact of exercise training. J Cachexia Sarcopenia Muscle, 6, 197-207.
BOWLING, A., BOND, M., JENKINSON, C. & LAMPING, D. L. 1999. Short Form 36 (SF-36) Health Survey questionnaire: which normative data should be used? Comparisons between the norms provided by the Omnibus Survey in Britain, the Health Survey for England and the Oxford Healthy Life Survey. J Public Health Med, 21, 255-70.
BRACK, A. S., BILDSOE, H. & HUGHES, S. M. 2005. Evidence that satellite cell decrement contributes to preferential decline in nuclear number from large fibres during murine age-related muscle atrophy. J Cell Sci, 118, 4813-21.
BRIERLEY, E. J., JOHNSON, M. A., LIGHTOWLERS, R. N., JAMES, O. F. & TURNBULL, D. M. 1998. Role of mitochondrial DNA mutations in human aging: implications for the central nervous system and muscle. Ann Neurol, 43, 217-23.
BROWN, D. T., SAMUELS, D. C., MICHAEL, E. M., TURNBULL, D. M. & CHINNERY, P. F. 2001. Random genetic drift determines the level of mutant mtDNA in human primary oocytes. American journal of human genetics, 68, 533-536.
BROWN, T. A., CECCONI, C., TKACHUK, A. N., BUSTAMANTE, C. & CLAYTON, D. A. 2005. Replication of mitochondrial DNA occurs by strand displacement with alternative light-strand origins, not via a strand-coupled mechanism. Genes & Development, 19, 2466-2476.

222
BUA, E., JOHNSON, J., HERBST, A., DELONG, B., MCKENZIE, D., SALAMAT, S. & AIKEN, J. M. 2006. Mitochondrial DNA-deletion mutations accumulate intracellularly to detrimental levels in aged human skeletal muscle fibers. American journal of human genetics, 79, 469-480.
BULLER, A. J., ECCLES, J. C. & ECCLES, R. M. 1960. Interactions between motoneurones and muscles in respect of the characteristic speeds of their responses. The Journal of physiology, 150, 417-439.
BURMAN, J. L., PICKLES, S., WANG, C., SEKINE, S., VARGAS, J. N. S., ZHANG, Z., YOULE, A. M., NEZICH, C. L., WU, X., HAMMER, J. A. & YOULE, R. J. 2017. Mitochondrial fission facilitates the selective mitophagy of protein aggregates. The Journal of Cell Biology, 216, 3231-3247.
BURZYNSKA, A. Z., CHADDOCK-HEYMAN, L., VOSS, M. W., WONG, C. N., GOTHE, N. P., OLSON, E. A., KNECHT, A., LEWIS, A., MONTI, J. M., COOKE, G. E., WOJCICKI, T. R., FANNING, J., CHUNG, H. D., AWICK, E., MCAULEY, E. & KRAMER, A. F. 2014. Physical activity and cardiorespiratory fitness are beneficial for white matter in low-fit older adults. PloS one, 9, e107413-e107413.
CAI, Y. C., BULLARD, J., L THOMPSON, N. & SPREMULLI, L. 2000a. Interaction of Mitochondrial Elongation Factor Tu with Aminoacyl-tRNA and Elongation Factor Ts.
CAI, Y. C., BULLARD, J. M., THOMPSON, N. L. & SPREMULLI, L. L. 2000b. Interaction of mitochondrial elongation factor Tu with aminoacyl-tRNA and elongation factor Ts. J Biol Chem, 275, 20308-14.
CALVO, S. E., CLAUSER, K. R. & MOOTHA, V. K. 2016. MitoCarta2.0: an updated inventory of mammalian mitochondrial proteins. Nucleic acids research, 44, D1251-D1257.
CAMMACK, R. 1992. Iron—Sulfur Clusters in Enzymes: Themes and Variations. In: CAMMACK, R. (ed.) Advances in Inorganic Chemistry. Academic Press.
CAMPBELL, G., KRISHNAN, K. J., DESCHAUER, M., TAYLOR, R. W. & TURNBULL, D. M. 2014. Dissecting the mechanisms underlying the accumulation of mitochondrial DNA deletions in human skeletal muscle. Human molecular genetics, 23, 4612-4620.
CARROLL, J., FEARNLEY, I. M., SKEHEL, J. M., SHANNON, R. J., HIRST, J. & WALKER, J. E. 2006. Bovine complex I is a complex of 45 different subunits. J Biol Chem, 281, 32724-7.
CAVALIER-SMITH, T. 1987. The Origin of Eukaryote and Archaebacterial Cells. Annals of the New York Academy of Sciences, 503, 17-54.
CECCHINI, G. 2003. Function and Structure of Complex II of the Respiratory Chain. Annual Review of Biochemistry, 72, 77-109.
CHANG, Q., ORNATSKY, O. I., SIDDIQUI, I., LOBODA, A., BARANOV, V. I. & HEDLEY, D. W. 2017. Imaging Mass Cytometry. Cytometry Part A, 91, 160-169.
CHANG, Q., ORNATSKY, O. I., SIDDIQUI, I., STRAUS, R., BARANOV, V. I. & HEDLEY, D. W. 2016. Biodistribution of cisplatin revealed by imaging mass cytometry identifies extensive collagen binding in tumor and normal tissues. Scientific Reports, 6, 36641.
CHEN, H. & CHAN, D. C. 2009. Mitochondrial dynamics–fusion, fission, movement, and mitophagy–in neurodegenerative diseases. Human Molecular Genetics, 18, R169-R176.
CHEN, H., VERMULST, M., WANG, Y. E., CHOMYN, A., PROLLA, T. A., MCCAFFERY, J. M. & CHAN, D. C. 2010. Mitochondrial fusion is required for mtDNA stability in skeletal muscle and tolerance of mtDNA mutations. Cell, 141, 280-9.
CHEVRIER, S., CROWELL, H. L., ZANOTELLI, V. R. T., ENGLER, S., ROBINSON, M. D. & BODENMILLER, B. 2018. Compensation of Signal Spillover in Suspension and Imaging Mass Cytometry. Cell systems, 6, 612-620.e5.
CHINNERY, P. F., JOHNSON, M. A., WARDELL, T. M., SINGH-KLER, R., HAYES, C., BROWN, D. T., TAYLOR, R. W., BINDOFF, L. A. & TURNBULL, D. M. 2000. The epidemiology of pathogenic mitochondrial DNA mutations. Ann Neurol, 48, 188-93.
CHUMLEA, W. C., CESARI, M., EVANS, W. J., FERRUCCI, L., FIELDING, R. A., PAHOR, M., STUDENSKI, S. & VELLAS, B. 2011. International working group on Sarcopenia. The journal of nutrition, health & aging, 15, 450-455.
CLAYPOOL, S. M. 2009. Cardiolipin, a critical determinant of mitochondrial carrier protein assembly and function. Biochimica et biophysica acta, 1788, 2059-2068.
CLAYTON, D. A. 1982. Replication of animal mitochondrial DNA. Cell, 28, 693-705. COATES, S. 2018. Overview of the UK population: November 2018.

223
COGSWELL, A. M., STEVENS, R. J. & HOOD, D. A. 1993. Properties of skeletal muscle mitochondria isolated from subsarcolemmal and intermyofibrillar regions. American Journal of Physiology-Cell Physiology, 264, C383-C389.
CONLEY, K. E., AMARA, C. E., BAJPEYI, S., COSTFORD, S. R., MURRAY, K., JUBRIAS, S. A., ARAKAKI, L., MARCINEK, D. J. & SMITH, S. R. 2013. Higher Mitochondrial Respiration and Uncoupling with Reduced Electron Transport Chain Content in Vivo in Muscle of Sedentary Versus Active Subjects. The Journal of Clinical Endocrinology and Metabolism, 98, 129-136.
COOPER, J. M., MANN, V. M. & SCHAPIRA, A. H. 1992. Analyses of mitochondrial respiratory chain function and mitochondrial DNA deletion in human skeletal muscle: effect of ageing. J Neurol Sci, 113, 91-8.
COOPER, R., BANN, D., WLOCH, E. G., ADAMS, J. E. & KUH, D. 2015. "Skeletal muscle function deficit" in a nationally representative British birth cohort in early old age. J Gerontol A Biol Sci Med Sci, 70, 604-7.
COOPER, R., HARDY, R., AIHIE SAYER, A., BEN-SHLOMO, Y., BIRNIE, K., COOPER, C., CRAIG, L., DEARY, I. J., DEMAKAKOS, P., GALLACHER, J., MCNEILL, G., MARTIN, R. M., STARR, J. M., STEPTOE, A., KUH, D. & ON BEHALF OF THE, H. S. T. 2011. Age and Gender Differences in Physical Capability Levels from Mid-Life Onwards: The Harmonisation and Meta-Analysis of Data from Eight UK Cohort Studies. PLOS ONE, 6, e27899.
CORTOPASSI, G. A. & ARNHEIM, N. 1990. Detection of a specific mitochondrial DNA deletion in tissues of older humans. Nucleic Acids Research, 18, 6927-6933.
CORY, S. & ADAMS, J. M. 2002. The Bcl2 family: regulators of the cellular life-or-death switch. Nat Rev Cancer, 2, 647-56.
CREE, L. M., PATEL, S. K., PYLE, A., LYNN, S., TURNBULL, D. M., CHINNERY, P. F. & WALKER, M. 2008a. Age-related decline in mitochondrial DNA copy number in isolated human pancreatic islets. Diabetologia, 51, 1440-3.
CREE, L. M., SAMUELS, D. C., DE SOUSA LOPES, S. C., RAJASIMHA, H. K., WONNAPINIJ, P., MANN, J. R., DAHL, H.-H. M. & CHINNERY, P. F. 2008b. A reduction of mitochondrial DNA molecules during embryogenesis explains the rapid segregation of genotypes. Nature Genetics, 40, 249.
CRICK, F. H. C. 1966. Codon—anticodon pairing: The wobble hypothesis. Journal of Molecular Biology, 19, 548-555.
CRUZ-JENTOFT, A. J., BAEYENS, J. P., BAUER, J. M., BOIRIE, Y., CEDERHOLM, T., LANDI, F., MARTIN, F. C., MICHEL, J.-P., ROLLAND, Y., SCHNEIDER, S. M., TOPINKOVÁ, E., VANDEWOUDE, M., ZAMBONI, M. & EUROPEAN WORKING GROUP ON SARCOPENIA IN OLDER, P. 2010. Sarcopenia: European consensus on definition and diagnosis: Report of the European Working Group on Sarcopenia in Older People. Age and ageing, 39, 412-423.
DAVIES, K. M., ANSELMI, C., WITTIG, I., FARALDO-GÓMEZ, J. D. & KÜHLBRANDT, W. 2012. Structure of the yeast F<sub>1</sub>F<sub>o</sub>-ATP synthase dimer and its role in shaping the mitochondrial cristae. Proceedings of the National Academy of Sciences, 109, 13602-13607.
DAY, K., SHEFER, G., SHEARER, A. & YABLONKA-REUVENI, Z. 2010. The depletion of skeletal muscle satellite cells with age is concomitant with reduced capacity of single progenitors to produce reserve progeny. Dev Biol, 340, 330-43.
DE GREY, A. D. N. J. 1997. A proposed refinement of the mitochondrial free radical theory of aging. BioEssays, 19, 161-166.
DE STEFANI, D., RAFFAELLO, A., TEARDO, E., SZABO, I. & RIZZUTO, R. 2011. A forty-kilodalton protein of the inner membrane is the mitochondrial calcium uniporter. Nature, 476, 336-40.
DELUCA, H. F. & ENGSTROM, G. W. 1961. Calcium uptake by rat kidney mitochondria. Proc Natl Acad Sci U S A, 47, 1744-50.
DEVAY, R. M., DOMINGUEZ-RAMIREZ, L., LACKNER, L. L., HOPPINS, S., STAHLBERG, H. & NUNNARI, J. 2009. Coassembly of Mgm1 isoforms requires cardiolipin and mediates mitochondrial inner membrane fusion. J Cell Biol, 186, 793-803.

224
DEVENISH, R. J., PRESCOTT, M. & RODGERS, A. J. W. 2008. The Structure and Function of Mitochondrial F1F0‐ATP Synthases. International Review of Cell and Molecular Biology. Academic Press.
DIAZ, F. 2010. Cytochrome c oxidase deficiency: Patients and animal models. Biochimica et Biophysica Acta (BBA) - Molecular Basis of Disease, 1802, 100-110.
DISTEFANO, G., STANDLEY, R. A., ZHANG, X., CARNERO, E. A., YI, F., CORNNELL, H. H. & COEN, P. M. 2018. Physical activity unveils the relationship between mitochondrial energetics, muscle quality, and physical function in older adults. Journal of Cachexia, Sarcopenia and Muscle, 9, 279-294.
DODDS, R. M., DAVIES, K., GRANIC, A., HOLLINGSWORTH, K. G., WARREN, C., GORMAN, G., TURNBULL, D. M. & SAYER, A. A. 2018. Mitochondrial respiratory chain function and content are preserved in the skeletal muscle of active very old men and women. Exp Gerontol, 113, 80-85.
DROGE, W. 2002. Free radicals in the physiological control of cell function. Physiol Rev, 82, 47-95. DUCHEN, M. R. 2004. Roles of mitochondria in health and disease. Diabetes, 53 Suppl 1, S96-102. EDGAR, D., SHABALINA, I., CAMARA, Y., WREDENBERG, A., CALVARUSO, M. A.,
NIJTMANS, L., NEDERGAARD, J., CANNON, B., LARSSON, N.-G. & TRIFUNOVIC, A. 2009. Random Point Mutations with Major Effects on Protein-Coding Genes Are the Driving Force behind Premature Aging in mtDNA Mutator Mice. Cell Metabolism, 10, 131-138.
EISNER, V., LENAERS, G. & HAJNÓCZKY, G. 2014. Mitochondrial fusion is frequent in skeletal muscle and supports excitation-contraction coupling. The Journal of cell biology, 205, 179-195.
ELMORE, S. 2007. Apoptosis: a review of programmed cell death. Toxicologic pathology, 35, 495-516. ELSON, J. L., SAMUELS, D. C., TURNBULL, D. M. & CHINNERY, P. F. 2001. Random intracellular
drift explains the clonal expansion of mitochondrial DNA mutations with age. American journal of human genetics, 68, 802-806.
ENGEL, W. K. & CUNNINGHAM, G. G. 1963. RAPID EXAMINATION OF MUSCLE TISSUE. AN IMPROVED TRICHROME METHOD FOR FRESH-FROZEN BIOPSY SECTIONS. Neurology, 13, 919-23.
FALKENBERG, M., LARSSON, N.-G. & GUSTAFSSON, C. M. 2007. DNA Replication and Transcription in Mammalian Mitochondria. Annual Review of Biochemistry, 76, 679-699.
FANÒ, G., MECOCCI, P., VECCHIET, J., BELIA, S., FULLE, S., POLIDORI, M. C., FELZANI, G., SENIN, U., VECCHIET, L. & BEAL, M. F. 2001. Age and sex influence on oxidative damage and functional status in human skeletal muscle. Journal of Muscle Research & Cell Motility, 22, 345-351.
FERNÁNDEZ-VIZARRA, E. & ZEVIANI, M. 2015. Nuclear gene mutations as the cause of mitochondrial complex III deficiency. Frontiers in Genetics, 6.
FERREIRA, R., VITORINO, R., ALVES, R. M. P., APPELL, H. J., POWERS, S. K., DUARTE, J. A. & AMADO, F. 2010. Subsarcolemmal and intermyofibrillar mitochondria proteome differences disclose functional specializations in skeletal muscle. PROTEOMICS, 10, 3142-3154.
FERRUCCI, L., GIALLAURIA, F. & GURALNIK, J. M. 2008. Epidemiology of aging. Radiologic clinics of North America, 46, 643-v.
FORMOSA, L. E., DIBLEY, M. G., STROUD, D. A. & RYAN, M. T. 2018. Building a complex complex: Assembly of mitochondrial respiratory chain complex I. Seminars in Cell & Developmental Biology, 76, 154-162.
FORMOSA, L. E. & RYAN, M. T. 2016. Mitochondrial fusion: Reaching the end of mitofusin’s tether. The Journal of Cell Biology, 215, 597-598.
FRATTER, C., RAMAN, P., ALSTON, C. L., BLAKELY, E. L., CRAIG, K., SMITH, C., EVANS, J., SELLER, A., CZERMIN, B., HANNA, M. G., POULTON, J., BRIERLEY, C., STAUNTON, T. G., TURNPENNY, P. D., SCHAEFER, A. M., CHINNERY, P. F., HORVATH, R., TURNBULL, D. M., GORMAN, G. S. & TAYLOR, R. W. 2011. RRM2B mutations are frequent in familial PEO with multiple mtDNA deletions. Neurology, 76, 2032-4.
FRAZIER, A. E., THORBURN, D. R. & COMPTON, A. G. 2019. Mitochondrial energy generation disorders: genes, mechanisms, and clues to pathology. Journal of Biological Chemistry, 294, 5386-5395.

225
FRIEDMAN, J. R., LACKNER, L. L., WEST, M., DIBENEDETTO, J. R., NUNNARI, J. & VOELTZ, G. K. 2011. ER tubules mark sites of mitochondrial division. Science (New York, N.Y.), 334, 358-362.
FRYBURG, D. A., LOUARD, R. J., GEROW, K. E., GELFAND, R. A. & BARRETT, E. J. 1992. Growth hormone stimulates skeletal muscle protein synthesis and antagonizes insulin's antiproteolytic action in humans. Diabetes, 41, 424-9.
GAUR, R., GRASSO, D., DATTA, P. P., KRISHNA, P. D. V., DAS, G., SPENCER, A., AGRAWAL, R. K., SPREMULLI, L. & VARSHNEY, U. 2008. A Single Mammalian Mitochondrial Translation Initiation Factor Functionally Replaces Two Bacterial Factors. Molecular cell, 29, 180-190.
GEISLER, S., HOLMSTROM, K. M., SKUJAT, D., FIESEL, F. C., ROTHFUSS, O. C., KAHLE, P. J. & SPRINGER, W. 2010. PINK1/Parkin-mediated mitophagy is dependent on VDAC1 and p62/SQSTM1. Nat Cell Biol, 12, 119-31.
GELFAND, R. A. & BARRETT, E. J. 1987. Effect of physiologic hyperinsulinemia on skeletal muscle protein synthesis and breakdown in man. J Clin Invest, 80, 1-6.
GIESEN, C., WANG, H. A. O., SCHAPIRO, D., ZIVANOVIC, N., JACOBS, A., HATTENDORF, B., SCHÜFFLER, P. J., GROLIMUND, D., BUHMANN, J. M., BRANDT, S., VARGA, Z., WILD, P. J., GÜNTHER, D. & BODENMILLER, B. 2014. Highly multiplexed imaging of tumor tissues with subcellular resolution by mass cytometry. Nature Methods, 11, 417.
GILES, R. E., BLANC, H., CANN, H. M. & WALLACE, D. C. 1980. Maternal inheritance of human mitochondrial DNA. Proceedings of the National Academy of Sciences, 77, 6715-6719.
GLADYSHEV, V. N. 2014. The free radical theory of aging is dead. Long live the damage theory! Antioxidants & redox signaling, 20, 727-731.
GOLLNICK, P. D. & SALTIN, B. 1982. Significance of skeletal muscle oxidative enzyme enhancement with endurance training. Clin Physiol, 2, 1-12.
GORMAN, G. S., CHINNERY, P. F., DIMAURO, S., HIRANO, M., KOGA, Y., MCFARLAND, R., SUOMALAINEN, A., THORBURN, D. R., ZEVIANI, M. & TURNBULL, D. M. 2016. Mitochondrial diseases. Nat Rev Dis Primers, 2, 16080.
GORMAN, G. S., SCHAEFER, A. M., NG, Y., GOMEZ, N., BLAKELY, E. L., ALSTON, C. L., FEENEY, C., HORVATH, R., YU-WAI-MAN, P., CHINNERY, P. F., TAYLOR, R. W., TURNBULL, D. M. & MCFARLAND, R. 2015. Prevalence of nuclear and mitochondrial DNA mutations related to adult mitochondrial disease. Annals of neurology, 77, 753-759.
GRADY, J. P., CAMPBELL, G., RATNAIKE, T., BLAKELY, E. L., FALKOUS, G., NESBITT, V., SCHAEFER, A. M., MCNALLY, R. J., GORMAN, G. S., TAYLOR, R. W., TURNBULL, D. M. & MCFARLAND, R. 2014. Disease progression in patients with single, large-scale mitochondrial DNA deletions. Brain : a journal of neurology, 137, 323-334.
GROSSMAN, E. J., ROY, R. R., TALMADGE, R. J., ZHONG, H. & EDGERTON, V. R. 1998. Effects of inactivity on myosin heavy chain composition and size of rat soleus fibers. Muscle Nerve, 21, 375-89.
GRUMATI, P., COLETTO, L., SABATELLI, P., CESCON, M., ANGELIN, A., BERTAGGIA, E., BLAAUW, B., URCIUOLO, A., TIEPOLO, T., MERLINI, L., MARALDI, N. M., BERNARDI, P., SANDRI, M. & BONALDO, P. 2010. Autophagy is defective in collagen VI muscular dystrophies, and its reactivation rescues myofiber degeneration. Nat Med, 16, 1313-20.
GUDLAUGSSON, J., ASPELUND, T., GUDNASON, V., OLAFSDOTTIR, A. S., JONSSON, P. V., ARNGRIMSSON, S. A. & JOHANNSSON, E. 2013. [The effects of 6 months' multimodal training on functional performance, strength, endurance, and body mass index of older individuals. Are the benefits of training similar among women and men?]. Laeknabladid, 99, 331-7.
GUERRERO-CASTILLO, S., BAERTLING, F., KOWNATZKI, D., WESSELS, H. J., ARNOLD, S., BRANDT, U. & NIJTMANS, L. 2017. The Assembly Pathway of Mitochondrial Respiratory Chain Complex I. Cell Metabolism, 25, 128-139.
GUO, R., ZONG, S., WU, M., GU, J. & YANG, M. 2017. Architecture of Human Mitochondrial Respiratory Megacomplex I2III2IV2. Cell, 170, 1247-1257.e12.
226
HAKONEN, A. H., ISOHANNI, P., PAETAU, A., HERVA, R., SUOMALAINEN, A. & LONNQVIST, T. 2007. Recessive Twinkle mutations in early onset encephalopathy with mtDNA depletion. Brain, 130, 3032-40.
HAN, G., SPITZER, M. H., BENDALL, S. C., FANTL, W. J. & NOLAN, G. P. 2018. Metal-isotope-tagged monoclonal antibodies for high-dimensional mass cytometry. Nature Protocols, 13, 2121-2148.
HANSSON, A., HANCE, N., DUFOUR, E., RANTANEN, A., HULTENBY, K., CLAYTON, D. A., WIBOM, R. & LARSSON, N.-G. 2004. A switch in metabolism precedes increased mitochondrial biogenesis in respiratory chain-deficient mouse hearts. Proceedings of the National Academy of Sciences of the United States of America, 101, 3136-3141.
HAO, H., BONILLA, E., MANFREDI, G., DIMAURO, S. & MORAES, C. T. 1995. Segregation patterns of a novel mutation in the mitochondrial tRNA glutamic acid gene associated with myopathy and diabetes mellitus. Am J Hum Genet, 56, 1017-25.
HAQUE, M. E. & SPREMULLI, L. L. 2008. Roles of the N- and C-terminal domains of mammalian mitochondrial initiation factor 3 in protein biosynthesis. Journal of molecular biology, 384, 929-940.
HARMAN, D. 1956. Aging: A Theory Based on Free Radical and Radiation Chemistry. Journal of Gerontology, 11, 298-300.
HATEFI, Y. 1976. The Enzymes and the Enzyme Complexes of the Mitochondrial Oxidative Phosphorylation System. In: MARTONOSI, A. N. (ed.) The Enzymes of Biological Membranes: Volume 4: Electron Transport Systems and Receptors. Boston, MA: Springer US.
HAVLICKOVA KARBANOVA, V., CIZKOVA VRBACKA, A., HEJZLAROVA, K., NUSKOVA, H., STRANECKY, V., POTOCKA, A., KMOCH, S. & HOUSTEK, J. 2012. Compensatory upregulation of respiratory chain complexes III and IV in isolated deficiency of ATP synthase due to TMEM70 mutation. Biochim Biophys Acta, 1817, 1037-43.
HOCKENBERY, D., NUNEZ, G., MILLIMAN, C., SCHREIBER, R. D. & KORSMEYER, S. J. 1990. Bcl-2 is an inner mitochondrial membrane protein that blocks programmed cell death. Nature, 348, 334-6.
HOFHAUS, G. & ATTARDI, G. 1993. Lack of assembly of mitochondrial DNA-encoded subunits of respiratory NADH dehydrogenase and loss of enzyme activity in a human cell mutant lacking the mitochondrial ND4 gene product. The EMBO journal, 12, 3043-3048.
HOFHAUS, G. & ATTARDI, G. 1995. Efficient selection and characterization of mutants of a human cell line which are defective in mitochondrial DNA-encoded subunits of respiratory NADH dehydrogenase. Molecular and cellular biology, 15, 964-974.
HOLLOSZY, J. O. 1967. Biochemical adaptations in muscle. Effects of exercise on mitochondrial oxygen uptake and respiratory enzyme activity in skeletal muscle. J Biol Chem, 242, 2278-82.
HOLLOSZY, J. O. & BOOTH, F. W. 1976. Biochemical adaptations to endurance exercise in muscle. Annu Rev Physiol, 38, 273-91.
HOLT, I. J., HARDING, A. E. & MORGAN-HUGHES, J. A. 1988. Deletions of muscle mitochondrial DNA in patients with mitochondrial myopathies. Nature, 331, 717-9.
HOLT, I. J., LORIMER, H. E. & JACOBS, H. T. 2000. Coupled leading- and lagging-strand synthesis of mammalian mitochondrial DNA. Cell, 100, 515-24.
HOLT, I. J. & REYES, A. 2012. Human Mitochondrial DNA Replication. Cold Spring Harbor Perspectives in Biology, 4, a012971.
HOWALD, H., HOPPELER, H., CLAASSEN, H., MATHIEU, O. & STRAUB, R. 1985. Influences of endurance training on the ultrastructural composition of the different muscle fiber types in humans. Pflugers Arch, 403, 369-76.
HUANG, G., WANG, R., CHEN, P., HUANG, S. C., DONNELLY, J. E. & MEHLFERBER, J. P. 2016. Dose–response relationship of cardiorespiratory fitness adaptation to controlled endurance training in sedentary older adults. European Journal of Preventive Cardiology, 23, 518-529.
HUNTE, C., ZICKERMANN, V. & BRANDT, U. 2010. Functional Modules and Structural Basis of Conformational Coupling in Mitochondrial Complex I. Science, 329, 448.
JANG, Y. C. & VAN REMMEN, H. 2011. Age-associated alterations of the neuromuscular junction. Exp Gerontol, 46, 193-8.

227
JANSSEN, R. J. R. J., NIJTMANS, L. G., HEUVEL, L. P. V. D. & SMEITINK, J. A. M. 2006. Mitochondrial complex I: Structure, function and pathology. Journal of Inherited Metabolic Disease, 29, 499-515.
JENUTH, J. P., PETERSON, A. C., FU, K. & SHOUBRIDGE, E. A. 1996. Random genetic drift in the female germline explains the rapid segregation of mammalian mitochondrial DNA. Nature Genetics, 14, 146-151.
JIANG, J., WANG, X. L. & MA, Y. Y. 2015. Respiratory chain complex III deficiency in patients with tRNA-leu mutation.
JIN, S. M., LAZAROU, M., WANG, C., KANE, L. A., NARENDRA, D. P. & YOULE, R. J. 2010. Mitochondrial membrane potential regulates PINK1 import and proteolytic destabilization by PARL. J Cell Biol, 191, 933-42.
JONCKHEERE, A. I., SMEITINK, J. A. M. & RODENBURG, R. J. T. 2012. Mitochondrial ATP synthase: architecture, function and pathology. Journal of Inherited Metabolic Disease, 35, 211-225.
KAAMAN, M., SPARKS, L. M., VAN HARMELEN, V., SMITH, S. R., SJOLIN, E., DAHLMAN, I. & ARNER, P. 2007. Strong association between mitochondrial DNA copy number and lipogenesis in human white adipose tissue. Diabetologia, 50, 2526-33.
KADI, F., CHARIFI, N., DENIS, C. & LEXELL, J. 2004. Satellite cells and myonuclei in young and elderly women and men. Muscle Nerve, 29, 120-7.
KANKI, T. & KLIONSKY, D. J. 2008. Mitophagy in yeast occurs through a selective mechanism. J Biol Chem, 283, 32386-93.
KASCH, F. W., BOYER, J. L., SCHMIDT, P. K., WELLS, R. H., WALLACE, J. P., VERITY, L. S., GUY, H. & SCHNEIDER, D. 1999. Ageing of the cardiovascular system during 33 years of aerobic exercise. Age Ageing, 28, 531-6.
KERR, J. F. R., WYLLIE, A. H. & CURRIE, A. R. 1972. Apoptosis: A Basic Biological Phenomenon with Wide-ranging Implications in Tissue Kinetics. British Journal of Cancer, 26, 239-257.
KIRICHOK, Y., KRAPIVINSKY, G. & CLAPHAM, D. E. 2004. The mitochondrial calcium uniporter is a highly selective ion channel. Nature, 427, 360-4.
KIRKWOOD THOMAS, B. L. 2017. Why and how are we living longer? Experimental Physiology, 102, 1067-1074.
KORTEBEIN, P., FERRANDO, A., LOMBEIDA, J., WOLFE, R. & EVANS, W. J. 2007. Effect of 10 days of bed rest on skeletal muscle in healthy older adults. JAMA, 297, 1769-1774.
KOSEK, D. J., KIM, J. S., PETRELLA, J. K., CROSS, J. M. & BAMMAN, M. M. 2006. Efficacy of 3 days/wk resistance training on myofiber hypertrophy and myogenic mechanisms in young vs. older adults. J Appl Physiol (1985), 101, 531-44.
KOSHIBA, T., DETMER, S. A., KAISER, J. T., CHEN, H., MCCAFFERY, J. M. & CHAN, D. C. 2004. Structural Basis of Mitochondrial Tethering by Mitofusin Complexes. Science, 305, 858-862.
KOVAROVA, N., CIZKOVA VRBACKA, A., PECINA, P., STRANECKY, V., PRONICKA, E., KMOCH, S. & HOUSTEK, J. 2012. Adaptation of respiratory chain biogenesis to cytochrome c oxidase deficiency caused by SURF1 gene mutations. Biochim Biophys Acta, 1822, 1114-24.
KOWALD, A. & KIRKWOOD, T. B. L. 2014. Transcription could be the key to the selection advantage of mitochondrial deletion mutants in aging. Proceedings of the National Academy of Sciences of the United States of America, 111, 2972-2977.
KRAYTSBERG, Y., KUDRYAVTSEVA, E., MCKEE, A. C., GEULA, C., KOWALL, N. W. & KHRAPKO, K. 2006. Mitochondrial DNA deletions are abundant and cause functional impairment in aged human substantia nigra neurons. Nature Genetics, 38, 518.
KULAWIAK, B., HOPKER, J., GEBERT, M., GUIARD, B., WIEDEMANN, N. & GEBERT, N. 2013. The mitochondrial protein import machinery has multiple connections to the respiratory chain. Biochim Biophys Acta, 1827, 612-26.
KUMMER, E., LEIBUNDGUT, M., RACKHAM, O., LEE, R. G., BOEHRINGER, D., FILIPOVSKA, A. & BAN, N. 2018. Unique features of mammalian mitochondrial translation initiation revealed by cryo-EM. Nature, 560, 263-267.
LADERMAN, K. A., PENNY, J. R., MAZZUCCHELLI, F., BRESOLIN, N., SCARLATO, G. & ATTARDI, G. 1996. Aging-dependent functional alterations of mitochondrial DNA (mtDNA) from human fibroblasts transferred into mtDNA-less cells. J Biol Chem, 271, 15891-7.

228
LARSSON, N.-G. 2010. Somatic Mitochondrial DNA Mutations in Mammalian Aging. Annual Review of Biochemistry, 79, 683-706.
LARSSON, N.-G. & OLDFORS, A. 2001. Mitochondrial myopathies. Acta Physiologica Scandinavica, 171, 385-393.
LAZAROU, M., JIN, S. M., KANE, L. A. & YOULE, R. J. 2012. Role of PINK1 binding to the TOM complex and alternate intracellular membranes in recruitment and activation of the E3 ligase Parkin. Dev Cell, 22, 320-33.
LEE, Y.-J., JEONG, S.-Y., KARBOWSKI, M., SMITH, C. L. & YOULE, R. J. 2004. Roles of the mammalian mitochondrial fission and fusion mediators Fis1, Drp1, and Opa1 in apoptosis. Molecular biology of the cell, 15, 5001-5011.
LEXELL, J. 1995. Human aging, muscle mass, and fiber type composition. J Gerontol A Biol Sci Med Sci.
LEXELL, J. & DOWNHAM, D. Y. 1991. The occurrence of fibre-type grouping in healthy human muscle: a quantitative study of cross-sections of whole vastus lateralis from men between 15 and 83 years. Acta Neuropathol, 81, 377-81.
LI, Y., PARK, J.-S., DENG, J.-H. & BAI, Y. 2006. Cytochrome c Oxidase Subunit IV is Essential for Assembly and Respiratory Function of the Enzyme Complex. Journal of bioenergetics and biomembranes, 38, 283-291.
LIEBER, R. L. 2010. Skeletal muscle structure, function, and plasticity, Philadelphia, USA, Lippincott Williams & Wilkins.
LILL, R. 2009. Function and biogenesis of iron–sulphur proteins. Nature, 460, 831. LOEFFEN, J. L. C. M., SMEITINK, J. A. M., TRIJBELS, J. M. F., JANSSEN, A. J. M., TRIEPELS,
R. H., SENGERS, R. C. A. & VAN DEN HEUVEL, L. P. 2000. Isolated complex I deficiency in children: Clinical, biochemical and genetic aspects. Human Mutation, 15, 123-134.
LÓPEZ-GALLARDO, E., LÓPEZ-PÉREZ, M. J., MONTOYA, J. & RUIZ-PESINI, E. 2009. CPEO and KSS differ in the percentage and location of the mtDNA deletion. Mitochondrion, 9, 314-317.
LUNDBY, C. & JACOBS, R. A. 2016. Adaptations of skeletal muscle mitochondria to exercise training. Experimental Physiology, 101, 17-22.
LUO, S., VALENCIA, C. A., ZHANG, J., LEE, N.-C., SLONE, J., GUI, B., WANG, X., LI, Z., DELL, S., BROWN, J., CHEN, S. M., CHIEN, Y.-H., HWU, W.-L., FAN, P.-C., WONG, L.-J., ATWAL, P. S. & HUANG, T. 2018. Biparental Inheritance of Mitochondrial DNA in Humans. Proceedings of the National Academy of Sciences, 115, 13039-13044.
MA, J. & SPREMULLI, L. L. 1996. Expression, Purification, and Mechanistic Studies of Bovine Mitochondrial Translational Initiation Factor 2. Journal of Biological Chemistry, 271, 5805-5811.
MAGNER, M., KOLAROVA, H., HONZIK, T., SVANDOVA, I. & ZEMAN, J. 2015. Clinical manifestation of mitochondrial diseases. Dev Period Med, 19, 441-9.
MAI, N., CHRZANOWSKA-LIGHTOWLERS, Z. M. A. & LIGHTOWLERS, R. N. 2017. The process of mammalian mitochondrial protein synthesis. Cell and Tissue Research, 367, 5-20.
MANCUSO, M., ORSUCCI, D., ANGELINI, C., BERTINI, E., CARELLI, V., COMI, G. P., MINETTI, C., MOGGIO, M., MONGINI, T., SERVIDEI, S., TONIN, P., TOSCANO, A., UZIEL, G., BRUNO, C., CALDARAZZO IENCO, E., FILOSTO, M., LAMPERTI, C., MARTINELLI, D., MORONI, I., MUSUMECI, O., PEGORARO, E., RONCHI, D., SANTORELLI, F. M., SAUCHELLI, D., SCARPELLI, M., SCIACCO, M., SPINAZZI, M., VALENTINO, M. L., VERCELLI, L., ZEVIANI, M. & SICILIANO, G. 2013. Phenotypic heterogeneity of the 8344A>G mtDNA “MERRF” mutation. Neurology, 80, 2049-2054.
MARANZANA, E., BARBERO, G., FALASCA, A. I., LENAZ, G. & GENOVA, M. L. 2013. Mitochondrial Respiratory Supercomplex Association Limits Production of Reactive Oxygen Species from Complex I. Antioxidants & Redox Signaling, 19, 1469-1480.
MARIOTTI, C., SAVARESE, N., SUOMALAINEN, A., RIMOLDI, M., COMI, G., PRELLE, A., ANTOZZI, C., SERVIDEI, S., JARRE, L., DIDONATO, S. & ZEVIANI, M. 1995. Genotype to phenotype correlations in mitochondrial encephalomyopathies associated with the A3243G mutation of mitochondrial DNA. Journal of Neurology, 242, 304-312.
MARTIN, W. & MÜLLER, M. 1998. The hydrogen hypothesis for the first eukaryote. Nature, 392, 37.

229
MASIERO, E., AGATEA, L., MAMMUCARI, C., BLAAUW, B., LORO, E., KOMATSU, M., METZGER, D., REGGIANI, C., SCHIAFFINO, S. & SANDRI, M. 2009. Autophagy is required to maintain muscle mass. Cell Metab, 10, 507-15.
MCFARLAND, R., TAYLOR, R. W. & TURNBULL, D. M. 2010. A neurological perspective on mitochondrial disease. The Lancet Neurology, 9, 829-840.
MCKINNEY, E. A. & OLIVEIRA, M. T. 2013. Replicating animal mitochondrial DNA. Genetics and Molecular Biology, 36, 308-315.
MEARS, J. A., LACKNER, L. L., FANG, S., INGERMAN, E., NUNNARI, J. & HINSHAW, J. E. 2011. Conformational changes in Dnm1 support a contractile mechanism for mitochondrial fission. Nature structural & molecular biology, 18, 20-26.
MEEUSEN, S., DEVAY, R., BLOCK, J., CASSIDY-STONE, A., WAYSON, S., MCCAFFERY, J. M. & NUNNARI, J. 2006. Mitochondrial Inner-Membrane Fusion and Crista Maintenance Requires the Dynamin-Related GTPase Mgm1. Cell, 127, 383-395.
MENSHIKOVA, E. V., RITOV, V. B., FAIRFULL, L., FERRELL, R. E., KELLEY, D. E. & GOODPASTER, B. H. 2006. Effects of Exercise on Mitochondrial Content and Function in Aging Human Skeletal Muscle. The Journals of Gerontology: Series A, 61, 534-540.
METODIEV, M. D., THOMPSON, K., ALSTON, C. L., MORRIS, A. A. M., HE, L., ASSOULINE, Z., RIO, M., BAHI-BUISSON, N., PYLE, A., GRIFFIN, H., SIIRA, S., FILIPOVSKA, A., MUNNICH, A., CHINNERY, P. F., MCFARLAND, R., RÖTIG, A. & TAYLOR, R. W. 2016. Recessive Mutations in TRMT10C Cause Defects in Mitochondrial RNA Processing and Multiple Respiratory Chain Deficiencies. American journal of human genetics, 98, 993-1000.
METTER, E. J., CONWIT, R., TOBIN, J. & FOZARD, J. L. 1997. Age-associated loss of power and strength in the upper extremities in women and men. J Gerontol A Biol Sci Med Sci, 52, B267-76.
MICHIKAWA, Y., MAZZUCCHELLI, F., BRESOLIN, N., SCARLATO, G. & ATTARDI, G. 1999. Aging-dependent large accumulation of point mutations in the human mtDNA control region for replication. Science, 286, 774-9.
MILENKOVIC, D., BLAZA, J. N., LARSSON, N.-G. & HIRST, J. 2017. The Enigma of the Respiratory Chain Supercomplex. Cell Metabolism, 25, 765-776.
MILENKOVIC, D., MATIC, S., KÜHL, I., RUZZENENTE, B., FREYER, C., JEMT, E., PARK, C. B., FALKENBERG, M. & LARSSON, N.-G. 2013. TWINKLE is an essential mitochondrial helicase required for synthesis of nascent D-loop strands and complete mtDNA replication. Human Molecular Genetics, 22, 1983-1993.
MILLER, F. J., ROSENFELDT, F. L., ZHANG, C., LINNANE, A. W. & NAGLEY, P. 2003. Precise determination of mitochondrial DNA copy number in human skeletal and cardiac muscle by a PCR-based assay: lack of change of copy number with age. Nucleic Acids Res, 31, e61.
MILNER, D. J., MAVROIDIS, M., WEISLEDER, N. & CAPETANAKI, Y. 2000. Desmin cytoskeleton linked to muscle mitochondrial distribution and respiratory function. The Journal of cell biology, 150, 1283-1298.
MIMAKI, M., WANG, X., MCKENZIE, M., THORBURN, D. R. & RYAN, M. T. 2012. Understanding mitochondrial complex I assembly in health and disease. Biochimica et Biophysica Acta (BBA) - Bioenergetics, 1817, 851-862.
MISHRA, P., CARELLI, V., MANFREDI, G. & CHAN, D. C. 2014. Proteolytic cleavage of Opa1 stimulates mitochondrial inner membrane fusion and couples fusion to oxidative phosphorylation. Cell metabolism, 19, 630-641.
MITCHELL, P. 1961. Coupling of Phosphorylation to Electron and Hydrogen Transfer by a Chemi-Osmotic type of Mechanism. Nature, 191, 144.
MOROZOV, Y. I., PARSHIN, A. V., AGARONYAN, K., CHEUNG, ALAN C M., ANIKIN, M., CRAMER, P. & TEMIAKOV, D. 2015. A model for transcription initiation in human mitochondria. Nucleic Acids Research, 43, 3726-3735.
MOSLEMI, A.-R., TULINIUS, M., HOLME, E. & OLDFORS, A. 1998. Threshold expression of the tRNALys A8344G mutation in single muscle fibres. Neuromuscular Disorders, 8, 345-349.
MUHLENHOFF, U., RICHHARDT, N., GERBER, J. & LILL, R. 2002. Characterization of iron-sulfur protein assembly in isolated mitochondria. A requirement for ATP, NADH, and reduced iron. J Biol Chem, 277, 29810-6.
230
MULLER-HOCKER, J. 1990. Cytochrome c oxidase deficient fibres in the limb muscle and diaphragm of man without muscular disease: an age-related alteration. J Neurol Sci, 100, 14-21.
MUNNICH, A., RÖTIG, A., CHRETIEN, D., SAUDUBRAY, J., CORMIER, V. & RUSTIN, P. 1996. Clinical presentations and laboratory investigations in respiratory chain deficiency. European Journal of Pediatrics, 155, 262-274.
MURPHY, J. L., RATNAIKE, T. E., SHANG, E., FALKOUS, G., BLAKELY, E. L., ALSTON, C. L., TAIVASSALO, T., HALLER, R. G., TAYLOR, R. W. & TURNBULL, D. M. 2012. Cytochrome c oxidase-intermediate fibres: importance in understanding the pathogenesis and treatment of mitochondrial myopathy. Neuromuscular disorders : NMD, 22, 690-698.
MURTON, A. J. 2015. Muscle protein turnover in the elderly and its potential contribution to the development of sarcopenia. Proc Nutr Soc, 74, 387-96.
MUSARO, A., MCCULLAGH, K., PAUL, A., HOUGHTON, L., DOBROWOLNY, G., MOLINARO, M., BARTON, E. R., SWEENEY, H. L. & ROSENTHAL, N. 2001. Localized Igf-1 transgene expression sustains hypertrophy and regeneration in senescent skeletal muscle. Nat Genet, 27, 195-200.
NARENDRA, D., TANAKA, A., SUEN, D.-F. & YOULE, R. J. 2008. Parkin is recruited selectively to impaired mitochondria and promotes their autophagy. The Journal of cell biology, 183, 795-803.
NASH, A. 2015. National Population Projections: 2014-based Statistical Bulletin. NAVIAUX, R. K. & NGUYEN, K. V. 2005. POLG mutations associated with Alpers syndrome and
mitochondrial DNA depletion. Ann Neurol, 58, 491. NESBITT, V., PITCEATHLY, R. D., TURNBULL, D. M., TAYLOR, R. W., SWEENEY, M. G.,
MUDANOHWO, E. E., RAHMAN, S., HANNA, M. G. & MCFARLAND, R. 2013. The UK MRC Mitochondrial Disease Patient Cohort Study: clinical phenotypes associated with the m.3243A>G mutation--implications for diagnosis and management. J Neurol Neurosurg Psychiatry, 84, 936-8.
NIJTMANS, L. G. J., KLEMENT, P., HOUŠTĚK, J. & VAN DEN BOGERT, C. 1995. Assembly of mitochondrial ATP synthase in cultured human cells: implications for mitochondrial diseases. Biochimica et Biophysica Acta (BBA) - Molecular Basis of Disease, 1272, 190-198.
NIJTMANS, L. G. J., TAANMAN, J.-W., MUIJSERS, A. O., SPEIJER, D. & VAN DEN BOGERT, C. 1998. Assembly of cytochrome-c oxidase in cultured human cells. European Journal of Biochemistry, 254, 389-394.
NOOTEBOOM, M., JOHNSON, R., TAYLOR, R. W., WRIGHT, N. A., LIGHTOWLERS, R. N., KIRKWOOD, T. B. L., MATHERS, J. C., TURNBULL, D. M. & GREAVES, L. C. 2010. Age-associated mitochondrial DNA mutations lead to small but significant changes in cell proliferation and apoptosis in human colonic crypts. Aging cell, 9, 96-99.
OLD, S. L. & JOHNSON, M. A. 1989. Methods of microphotometric assay of succinate dehydrogenase and cytochrome c oxidase activities for use on human skeletal muscle. Histochem J, 21, 545-55.
ONO, T., ISOBE, K., NAKADA, K. & HAYASHI, J. I. 2001. Human cells are protected from mitochondrial dysfunction by complementation of DNA products in fused mitochondria. Nat Genet, 28, 272-5.
PADDON-JONES, D., SHEFFIELD-MOORE, M., CREE, M. G., HEWLINGS, S. J., AARSLAND, A., WOLFE, R. R. & FERRANDO, A. A. 2006. Atrophy and Impaired Muscle Protein Synthesis during Prolonged Inactivity and Stress. The Journal of Clinical Endocrinology & Metabolism, 91, 4836-4841.
PALADE, G. E. 1953. AN ELECTRON MICROSCOPE STUDY OF THE MITOCHONDRIAL STRUCTURE. Journal of Histochemistry & Cytochemistry, 1, 188-211.
PALIKARAS, K., LIONAKI, E. & TAVERNARAKIS, N. 2018. Mechanisms of mitophagy in cellular homeostasis, physiology and pathology. Nature Cell Biology, 20, 1013-1022.
PALTY, R., SILVERMAN, W. F., HERSHFINKEL, M., CAPORALE, T., SENSI, S. L., PARNIS, J., NOLTE, C., FISHMAN, D., SHOSHAN-BARMATZ, V., HERRMANN, S., KHANANSHVILI, D. & SEKLER, I. 2010. NCLX is an essential component of mitochondrial Na(+)/Ca(2+) exchange. Proceedings of the National Academy of Sciences of the United States of America, 107, 436-441.

231
PERKINS, G., RENKEN, C., MARTONE, M. E., YOUNG, S. J., ELLISMAN, M. & FREY, T. 1997. Electron tomography of neuronal mitochondria: three-dimensional structure and organization of cristae and membrane contacts. J Struct Biol, 119, 260-72.
PETER, J. A., VLADIMIR, L., KEIR, J. M. & DAVID, A. H. 2005. Differential susceptibility of subsarcolemmal and intermyofibrillar mitochondria to apoptotic stimuli. American Journal of Physiology-Cell Physiology, 289, C994-C1001.
PETTE, D. & STARON, R. S. 1997. Mammalian skeletal muscle fiber type transitions. Int Rev Cytol, 170, 143-223.
PICKETT, S. J., GRADY, J. P., NG, Y. S., GORMAN, G. S., SCHAEFER, A. M., WILSON, I. J., CORDELL, H. J., TURNBULL, D. M., TAYLOR, R. W. & MCFARLAND, R. 2018. Phenotypic heterogeneity in m.3243A>G mitochondrial disease: The role of nuclear factors. Annals of clinical and translational neurology, 5, 333-345.
PITCEATHLY, R. D. S., RAHMAN, S. & HANNA, M. G. 2012. Single deletions in mitochondrial DNA – Molecular mechanisms and disease phenotypes in clinical practice. Neuromuscular Disorders, 22, 577-586.
PORTEOUS, W. K., JAMES, A. M., SHEARD, P. W., PORTEOUS, C. M., PACKER, M. A., HYSLOP, S. J., MELTON, J. V., PANG, C.-Y., WEI, Y.-H. & MURPHY, M. P. 1998. Bioenergetic consequences of accumulating the common 4977-bp mitochondrial DNA deletion. European Journal of Biochemistry, 257, 192-201.
RAHMAN, J. & RAHMAN, S. 2018. Mitochondrial medicine in the omics era. The Lancet, 391, 2560-2574.
RAHMAN, S., LAKE, B. D., TAANMAN, J.-W., HANNA, M. G., COOPER, J. M., SCHAPIRA, A. H. V. & LEONARD, J. V. 2000. Cytochrome oxidase immunohistochemistry: clues for genetic mechanisms. Brain, 123, 591-600.
RICHTER, R., PAJAK, A., DENNERLEIN, S., ROZANSKA, A., LIGHTOWLERS, ROBERT N. & CHRZANOWSKA-LIGHTOWLERS, ZOFIA M. A. 2010a. Translation termination in human mitochondrial ribosomes. Biochemical Society Transactions, 38, 1523-1526.
RICHTER, R., RORBACH, J., PAJAK, A., SMITH, P. M., WESSELS, H. J., HUYNEN, M. A., SMEITINK, J. A., LIGHTOWLERS, R. N. & CHRZANOWSKA-LIGHTOWLERS, Z. M. 2010b. A functional peptidyl-tRNA hydrolase, ICT1, has been recruited into the human mitochondrial ribosome. The EMBO journal, 29, 1116-1125.
RICHTER, V., SINGH, A. P., KVANSAKUL, M., RYAN, M. T. & OSELLAME, L. D. 2015. Splitting up the powerhouse: structural insights into the mechanism of mitochondrial fission. Cellular and Molecular Life Sciences, 72, 3695-3707.
RILEY, J. S., QUARATO, G., CLOIX, C., LOPEZ, J., O'PREY, J., PEARSON, M., CHAPMAN, J., SESAKI, H., CARLIN, L. M., PASSOS, J. F., WHEELER, A. P., OBERST, A., RYAN, K. M. & TAIT, S. W. 2018. Mitochondrial inner membrane permeabilisation enables mtDNA release during apoptosis. The EMBO Journal, 37, e99238.
ROBBERSON, D. L., KASAMATSU, H. & VINOGRAD, J. 1972. Replication of Mitochondrial DNA. Circular Replicative Intermediates in Mouse L Cells. Proceedings of the National Academy of Sciences of the United States of America, 69, 737-741.
ROBERTS, H. C., DENISON, H. J., MARTIN, H. J., PATEL, H. P., SYDDALL, H., COOPER, C. & SAYER, A. A. 2011. A review of the measurement of grip strength in clinical and epidemiological studies: towards a standardised approach. Age Ageing, 40, 423-9.
ROCHA, M. C., GRADY, J. P., GRÜNEWALD, A., VINCENT, A., DOBSON, P. F., TAYLOR, R. W., TURNBULL, D. M. & RYGIEL, K. A. 2015. A novel immunofluorescent assay to investigate oxidative phosphorylation deficiency in mitochondrial myopathy: understanding mechanisms and improving diagnosis. Scientific Reports, 5, 15037.
ROCHA, M. C., ROSA, H. S., GRADY, J. P., BLAKELY, E. L., HE, L., ROMAIN, N., HALLER, R. G., NEWMAN, J., MCFARLAND, R., NG, Y. S., GORMAN, G. S., SCHAEFER, A. M., TUPPEN, H. A., TAYLOR, R. W. & TURNBULL, D. M. 2018. Pathological mechanisms underlying single large‐scale mitochondrial DNA deletions. Annals of Neurology, 83, 115-130.
ROGER, A. J., MUNOZ-GOMEZ, S. A. & KAMIKAWA, R. 2017. The Origin and Diversification of Mitochondria. Curr Biol, 27, R1177-r1192.
ROGERS, M. A. & EVANS, W. J. 1993. Changes in skeletal muscle with aging: effects of exercise training. Exercise and sport sciences reviews, 21, 65-102.

232
ROSS, J. M. 2011. Visualization of Mitochondrial Respiratory Function using Cytochrome C Oxidase / Succinate Dehydrogenase (COX/SDH) Double-labeling Histochemistry. Journal of Visualized Experiments : JoVE, 3266.
ROSS, J. M., OBERG, J., BRENE, S., COPPOTELLI, G., TERZIOGLU, M., PERNOLD, K., GOINY, M., SITNIKOV, R., KEHR, J., TRIFUNOVIC, A., LARSSON, N. G., HOFFER, B. J. & OLSON, L. 2010. High brain lactate is a hallmark of aging and caused by a shift in the lactate dehydrogenase A/B ratio. Proc Natl Acad Sci U S A, 107, 20087-92.
ROSSIGNOL, R., FAUSTIN, B., ROCHER, C., MALGAT, M., MAZAT, J.-P. & LETELLIER, T. 2003. Mitochondrial threshold effects. The Biochemical journal, 370, 751-762.
ROUZIER, C., BANNWARTH, S., CHAUSSENOT, A., CHEVROLLIER, A., VERSCHUEREN, A., BONELLO-PALOT, N., FRAGAKI, K., CANO, A., POUGET, J., PELLISSIER, J. F., PROCACCIO, V., CHABROL, B. & PAQUIS-FLUCKLINGER, V. 2012. The MFN2 gene is responsible for mitochondrial DNA instability and optic atrophy 'plus' phenotype. Brain, 135, 23-34.
ROWAN, S. L., RYGIEL, K., PURVES-SMITH, F. M., SOLBAK, N. M., TURNBULL, D. M. & HEPPLE, R. T. 2012. Denervation Causes Fiber Atrophy and Myosin Heavy Chain Co-Expression in Senescent Skeletal Muscle. PLOS ONE, 7, e29082.
RUTTER, J., WINGE, D. R. & SCHIFFMAN, J. D. 2010. Succinate Dehydrogenase—Assembly, Regulation and Role in Human Disease. Mitochondrion, 10, 393-401.
RYGIEL, K., DODDS, R., PATEL, H., SYDDALL, H., WESTBURY, L., GRANIC, A., COOPER, C., CLIFF, J., ROCHA, M., TURNBULL, D. & SAYER, A. 2017. Association of mitochondrial respiratory chain deficiency in older men with muscle mass and physical performance: findings from the Hertfordshire Sarcopenia Study. The Lancet, 389, S87.
SACHECK, J. M., OHTSUKA, A., MCLARY, S. C. & GOLDBERG, A. L. 2004. IGF-I stimulates muscle growth by suppressing protein breakdown and expression of atrophy-related ubiquitin ligases, atrogin-1 and MuRF1. Am J Physiol Endocrinol Metab, 287, E591-601.
SANTILLI, V., BERNETTI, A., MANGONE, M. & PAOLONI, M. 2014. Clinical definition of sarcopenia. Clinical Cases in Mineral and Bone Metabolism, 11, 177-180.
SASARMAN, F., ANTONICKA, H. & SHOUBRIDGE, E. A. 2008. The A3243G tRNALeu(UUR) MELAS mutation causes amino acid misincorporation and a combined respiratory chain assembly defect partially suppressed by overexpression of EFTu and EFG2. Human Molecular Genetics, 17, 3697-3707.
SATO, A., NAKADA, K. & HAYASHI, J.-I. 2006. Mitochondrial dynamics and aging: Mitochondrial interaction preventing individuals from expression of respiratory deficiency caused by mutant mtDNA. Biochimica et Biophysica Acta (BBA) - Molecular Cell Research, 1763, 473-481.
SATOH, M. & KUROIWA, T. 1991. Organization of multiple nucleoids and DNA molecules in mitochondria of a human cell. Experimental Cell Research, 196, 137-140.
SCHÄFER, E., SEELERT, H., REIFSCHNEIDER, N. H., KRAUSE, F., DENCHER, N. A. & VONCK, J. 2006. Architecture of Active Mammalian Respiratory Chain Supercomplexes. Journal of Biological Chemistry, 281, 15370-15375.
SCHAGGER, H. 2002. Respiratory chain supercomplexes of mitochondria and bacteria. Biochim Biophys Acta, 1555, 154-9.
SCHÄGGER, H., DE COO, R., BAUER, M. F., HOFMANN, S., GODINOT, C. & BRANDT, U. 2004. Significance of Respirasomes for the Assembly/Stability of Human Respiratory Chain Complex I. Journal of Biological Chemistry, 279, 36349-36353.
SCHÄGGER, H. & PFEIFFER, K. 2000. Supercomplexes in the respiratory chains of yeast and mammalian mitochondria. The EMBO Journal, 19, 1777-1783.
SCHAPIRO, D., JACKSON, H. W., RAGHURAMAN, S., FISCHER, J. R., ZANOTELLI, V. R. T., SCHULZ, D., GIESEN, C., CATENA, R., VARGA, Z. & BODENMILLER, B. 2017. histoCAT: analysis of cell phenotypes and interactions in multiplex image cytometry data. Nature methods, 14, 873-876.
SCHILLING, B., MURRAY, J., YOO, C. B., ROW, R. H., CUSACK, M. P., CAPALDI, R. A. & GIBSON, B. W. 2006. Proteomic analysis of succinate dehydrogenase and ubiquinol-cytochrome c reductase (Complex II and III) isolated by immunoprecipitation from bovine and mouse heart mitochondria. Biochim Biophys Acta, 1762, 213-22.

233
SCHON, E. A., DIMAURO, S. & HIRANO, M. 2012. Human mitochondrial DNA: roles of inherited and somatic mutations. Nature reviews. Genetics, 13, 878-890.
SCHON, E. A., RIZZUTO, R., MORAES, C. T., NAKASE, H., ZEVIANI, M. & DIMAURO, S. 1989. A direct repeat is a hotspot for large-scale deletion of human mitochondrial DNA. Science, 244, 346-9.
SCHWARTZ, M. & VISSING, J. 2002. Paternal Inheritance of Mitochondrial DNA. New England Journal of Medicine, 347, 576-580.
SCIACCO, M. & BONILLA, E. 1996. Cytochemistry and immunocytochemistry of mitochondria in tissue sections. Methods Enzymol, 264, 509-21.
SCIACCO, M., BONILLA, E., SCHON, E. A., DIMAURO, S. & MORAES, C. T. 1994. Distribution of wild-type and common deletion forms of mtDNA in normal and respiration-deficient muscle fibers from patients with mitochondrial myopathy. Hum Mol Genet, 3, 13-9.
SENA, L. A. & CHANDEL, N. S. 2012. Physiological roles of mitochondrial reactive oxygen species. Molecular cell, 48, 158-167.
SHADEL, G. S. & CLAYTON, D. A. 1997. MITOCHONDRIAL DNA MAINTENANCE IN VERTEBRATES. Annual Review of Biochemistry, 66, 409-435.
SHEFER, G., VAN DE MARK, D. P., RICHARDSON, J. B. & YABLONKA-REUVENI, Z. 2006. Satellite-cell pool size does matter: defining the myogenic potency of aging skeletal muscle. Dev Biol, 294, 50-66.
SHIOZU, H., HIGASHIJIMA, M. & KOGA, T. 2015. Association of sarcopenia with swallowing problems, related to nutrition and activities of daily living of elderly individuals. Journal of physical therapy science, 27, 393-396.
SHOFFNER, J. M., LOTT, M. T., LEZZA, A. M., SEIBEL, P., BALLINGER, S. W. & WALLACE, D. C. 1990. Myoclonic epilepsy and ragged-red fiber disease (MERRF) is associated with a mitochondrial DNA tRNA(Lys) mutation. Cell, 61, 931-7.
SHORT, K. R., BIGELOW, M. L., KAHL, J., SINGH, R., COENEN-SCHIMKE, J., RAGHAVAKAIMAL, S. & NAIR, K. S. 2005. Decline in skeletal muscle mitochondrial function with aging in humans. Proc Natl Acad Sci U S A, 102, 5618-23.
SHOUBRIDGE, E. A. 2001. Cytochrome c oxidase deficiency. American Journal of Medical Genetics, 106, 46-52.
SIGNES, A. & FERNANDEZ-VIZARRA, E. 2018. Assembly of mammalian oxidative phosphorylation complexes I–V and supercomplexes. Essays In Biochemistry, 62, 255-270.
SIMARD, M.-L., MOURIER, A., GREAVES, L. C., TAYLOR, R. W. & STEWART, J. B. 2018. A novel histochemistry assay to assess and quantify focal cytochrome c oxidase deficiency. The Journal of pathology, 245, 311-323.
SINGH, M., CHAUDHRY, P., GERDTSSON, E., MAOZ, A., COZEN, W., HICKS, J., KUHN, P., GRUBER, S., SIDDIQI, I. & MERCHANT, A. 2017. Highly Multiplexed Imaging Mass Cytometry Allows Visualization of Tumor and Immune Cell Interactions of the Tumor Microenvironment in FFPE Tissue Sections. Blood, 130, 2751-2751.
SMIRNOVA, E., GRIPARIC, L., SHURLAND, D. L. & VAN DER BLIEK, A. M. 2001. Dynamin-related protein Drp1 is required for mitochondrial division in mammalian cells. Molecular biology of the cell, 12, 2245-2256.
SMITH, A. C. & ROBINSON, A. J. 2016. MitoMiner v3.1, an update on the mitochondrial proteomics database. Nucleic acids research, 44, D1258-D1261.
SOUSA-VICTOR, P., GUTARRA, S., GARCIA-PRAT, L., RODRIGUEZ-UBREVA, J., ORTET, L., RUIZ-BONILLA, V., JARDI, M., BALLESTAR, E., GONZALEZ, S., SERRANO, A. L., PERDIGUERO, E. & MUNOZ-CANOVES, P. 2014. Geriatric muscle stem cells switch reversible quiescence into senescence. Nature, 506, 316-21.
SPENDIFF, S., VUDA, M., GOUSPILLOU, G., AARE, S., PEREZ, A., MORAIS, J. A., JAGOE, R. T., FILION, M.-E., GLICKSMAN, R., KAPCHINSKY, S., MACMILLAN, N. J., PION, C. H., AUBERTIN-LEHEUDRE, M., HETTWER, S., CORREA, J. A., TAIVASSALO, T. & HEPPLE, R. T. 2016. Denervation drives mitochondrial dysfunction in skeletal muscle of octogenarians. The Journal of Physiology, 594, 7361-7379.
SPINA, R. J., TURNER, M. J. & EHSANI, A. A. 1998. Beta-adrenergic-mediated improvement in left ventricular function by exercise training in older men. Am J Physiol, 274, H397-404.

234
ST-JEAN-PELLETIER, F., PION, C. H., LEDUC-GAUDET, J.-P., SGARIOTO, N., ZOVILÉ, I., BARBAT-ARTIGAS, S., REYNAUD, O., ALKATERJI, F., LEMIEUX, F. C., GRENON, A., GAUDREAU, P., HEPPLE, R. T., CHEVALIER, S., BELANGER, M., MORAIS, J. A., AUBERTIN-LEHEUDRE, M. & GOUSPILLOU, G. 2017. The impact of ageing, physical activity, and pre-frailty on skeletal muscle phenotype, mitochondrial content, and intramyocellular lipids in men. Journal of Cachexia, Sarcopenia and Muscle, 8, 213-228.
STAPLES, C. R., AMEYIBOR, E., FU, W., GARDET-SALVI, L., STRITT-ETTER, A. L., SCHURMANN, P., KNAFF, D. B. & JOHNSON, M. K. 1996. The function and properties of the iron-sulfur center in spinach ferredoxin: thioredoxin reductase: a new biological role for iron-sulfur clusters. Biochemistry, 35, 11425-34.
STARON, R. S., MALICKY, E. S., LEONARDI, M. J., FALKEL, J. E., HAGERMAN, F. C. & DUDLEY, G. A. 1990. Muscle hypertrophy and fast fiber type conversions in heavy resistance-trained women. Eur J Appl Physiol Occup Physiol, 60, 71-9.
STILES, A. R., SIMON, M. T., STOVER, A., EFTEKHARIAN, S., KHANLOU, N., WANG, H. L., MAGAKI, S., LEE, H., PARTYNSKI, K., DORRANI, N., CHANG, R., MARTINEZ-AGOSTO, J. A. & ABDENUR, J. E. 2016. Mutations in TFAM, encoding mitochondrial transcription factor A, cause neonatal liver failure associated with mtDNA depletion. Mol Genet Metab, 119, 91-9.
STRAUSS, M., HOFHAUS, G., SCHRÖDER, R. R. & KÜHLBRANDT, W. 2008. Dimer ribbons of ATP synthase shape the inner mitochondrial membrane. The EMBO journal, 27, 1154-1160.
STROUD, D. A., SURGENOR, E. E., FORMOSA, L. E., RELJIC, B., FRAZIER, A. E., DIBLEY, M. G., OSELLAME, L. D., STAIT, T., BEILHARZ, T. H., THORBURN, D. R., SALIM, A. & RYAN, M. T. 2016. Accessory subunits are integral for assembly and function of human mitochondrial complex I. Nature, 538, 123.
SULLIVAN-GUNN, M. J. & LEWANDOWSKI, P. A. 2013. Elevated hydrogen peroxide and decreased catalase and glutathione peroxidase protection are associated with aging sarcopenia. BMC geriatrics, 13, 104-104.
TAAFFE, D. R., HENWOOD, T. R., NALLS, M. A., WALKER, D. G., LANG, T. F. & HARRIS, T. B. 2009. Alterations in muscle attenuation following detraining and retraining in resistance-trained older adults. Gerontology, 55, 217-23.
TAIVASSALO, T., SHOUBRIDGE, E. A., CHEN, J., KENNAWAY, N. G., DIMAURO, S., ARNOLD, D. L. & HALLER, R. G. 2001. Aerobic conditioning in patients with mitochondrial myopathies: physiological, biochemical, and genetic effects. Ann Neurol, 50, 133-41.
TAKESHIMA, N., ROGERS, M. E., ISLAM, M. M., YAMAUCHI, T., WATANABE, E. & OKADA, A. 2004. Effect of concurrent aerobic and resistance circuit exercise training on fitness in older adults. Eur J Appl Physiol, 93, 173-82.
TANAKA, A., CLELAND, M. M., XU, S., NARENDRA, D. P., SUEN, D. F., KARBOWSKI, M. & YOULE, R. J. 2010. Proteasome and p97 mediate mitophagy and degradation of mitofusins induced by Parkin. J Cell Biol, 191, 1367-80.
TAYLOR, R. W., BARRON, M. J., BORTHWICK, G. M., GOSPEL, A., CHINNERY, P. F., SAMUELS, D. C., TAYLOR, G. A., PLUSA, S. M., NEEDHAM, S. J., GREAVES, L. C., KIRKWOOD, T. B. & TURNBULL, D. M. 2003. Mitochondrial DNA mutations in human colonic crypt stem cells. J Clin Invest, 112, 1351-60.
TAYLOR, R. W., SCHAEFER, A. M., BARRON, M. J., MCFARLAND, R. & TURNBULL, D. M. 2004. The diagnosis of mitochondrial muscle disease. Neuromuscular Disorders, 14, 237-245.
TAYLOR, R. W. & TURNBULL, D. M. 2005. Mitochondrial DNA mutations in human disease. Nat Rev Genet, 6, 389-402.
THOMPSON, P. D., BUCHNER, D., PINA, I. L., BALADY, G. J., WILLIAMS, M. A., MARCUS, B. H., BERRA, K., BLAIR, S. N., COSTA, F., FRANKLIN, B., FLETCHER, G. F., GORDON, N. F., PATE, R. R., RODRIGUEZ, B. L., YANCEY, A. K. & WENGER, N. K. 2003. Exercise and physical activity in the prevention and treatment of atherosclerotic cardiovascular disease: a statement from the Council on Clinical Cardiology (Subcommittee on Exercise, Rehabilitation, and Prevention) and the Council on Nutrition, Physical Activity, and Metabolism (Subcommittee on Physical Activity). Circulation, 107, 3109-16.
TOMLINSON, B. E. & IRVING, D. 1977. The numbers of limb motor neurons in the human lumbosacral cord throughout life. J Neurol Sci, 34, 213-9.

235
TOPOLSKI, T. D., LOGERFO, J., PATRICK, D. L., WILLIAMS, B., WALWICK, J. & PATRICK, M. B. 2006. The Rapid Assessment of Physical Activity (RAPA) among older adults. Prev Chronic Dis, 3, A118.
TRIFUNOVIC, A., WREDENBERG, A., FALKENBERG, M., SPELBRINK, J. N., ROVIO, A. T., BRUDER, C. E., BOHLOOLY, Y. M., GIDLOF, S., OLDFORS, A., WIBOM, R., TORNELL, J., JACOBS, H. T. & LARSSON, N. G. 2004. Premature ageing in mice expressing defective mitochondrial DNA polymerase. Nature, 429, 417-23.
TROUNCE, I., BYRNE, E. & MARZUKI, S. 1989. DECLINE IN SKELETAL MUSCLE MITOCHONDRIAL RESPIRATORY CHAIN FUNCTION: POSSIBLE FACTOR IN AGEING. The Lancet, 333, 637-639.
TSUBOI, M., MORITA, H., NOZAKI, Y., AKAMA, K., UEDA, T., ITO, K., NIERHAUS, K. H. & TAKEUCHI, N. 2009. EF-G2mt Is an Exclusive Recycling Factor in Mammalian Mitochondrial Protein Synthesis. Molecular Cell, 35, 502-510.
TSURUI, H., NISHIMURA, H., HATTORI, S., HIROSE, S., OKUMURA, K. & SHIRAI, T. 2000. Seven-color fluorescence imaging of tissue samples based on Fourier spectroscopy and singular value decomposition. J Histochem Cytochem, 48, 653-62.
TUPPEN, H. A. L., BLAKELY, E. L., TURNBULL, D. M. & TAYLOR, R. W. 2010. Mitochondrial DNA mutations and human disease. Biochimica et Biophysica Acta (BBA) - Bioenergetics, 1797, 113-128.
TYYNISMAA, H., SUN, R., AHOLA-ERKKILA, S., ALMUSA, H., POYHONEN, R., KORPELA, M., HONKANIEMI, J., ISOHANNI, P., PAETAU, A., WANG, L. & SUOMALAINEN, A. 2012. Thymidine kinase 2 mutations in autosomal recessive progressive external ophthalmoplegia with multiple mitochondrial DNA deletions. Hum Mol Genet, 21, 66-75.
URATA, M., WADA, Y., KIM, S. H., CHUMPIA, W., KAYAMORI, Y., HAMASAKI, N. & KANG, D. 2004. High-sensitivity detection of the A3243G mutation of mitochondrial DNA by a combination of allele-specific PCR and peptide nucleic acid-directed PCR clamping. Clin Chem, 50, 2045-51.
VAN DER MADE, A. D., REURINK, G., TOL, J. L., MAROTTA, M., RODAS, G. & KERKHOFFS, G. M. 2017. Emerging Biological Approaches to Muscle Injuries. In: GOBBI, A., ESPREGUEIRA-MENDES, J., LANE, J. G. & KARAHAN, M. (eds.) Bio-orthopaedics: A New Approach. Berlin, Heidelberg: Springer Berlin Heidelberg.
VINCENT, A. E., ROSA, H. S., PABIS, K., LAWLESS, C., CHEN, C., GRÜNEWALD, A., RYGIEL, K. A., ROCHA, M. C., REEVE, A. K., FALKOUS, G., PERISSI, V., WHITE, K., DAVEY, T., PETROF, B. J., SAYER, A. A., COOPER, C., DEEHAN, D., TAYLOR, R. W., TURNBULL, D. M. & PICARD, M. 2018. Subcellular origin of mitochondrial DNA deletions in human skeletal muscle. Annals of neurology, 84, 289-301.
VIRBASIUS, J. V. & SCARPULLA, R. C. 1994. Activation of the human mitochondrial transcription factor A gene by nuclear respiratory factors: a potential regulatory link between nuclear and mitochondrial gene expression in organelle biogenesis. Proc Natl Acad Sci U S A, 91, 1309-13.
VOGEL, F., BORNHÖVD, C., NEUPERT, W. & REICHERT, A. S. 2006. Dynamic subcompartmentalization of the mitochondrial inner membrane. The Journal of Cell Biology, 175, 237-247.
WAHLBY, C., ERLANDSSON, F., BENGTSSON, E. & ZETTERBERG, A. 2002. Sequential immunofluorescence staining and image analysis for detection of large numbers of antigens in individual cell nuclei. Cytometry, 47, 32-41.
WALLACE, D. C. 1989. Mitochondrial DNA mutations and neuromuscular disease. Trends in Genetics, 5, 9-13.
WALLACE, D. C., SINGH, G., LOTT, M. T., HODGE, J. A., SCHURR, T. G., LEZZA, A. M., ELSAS, L. J. & NIKOSKELAINEN, E. K. 1988. Mitochondrial DNA mutation associated with Leber's hereditary optic neuropathy. Science, 242, 1427-1430.
WANG, C. & YOULE, R. J. 2009. The Role of Mitochondria in Apoptosis(). Annual review of genetics, 43, 95-118.
WANG, F., FLANAGAN, J., SU, N., WANG, L. C., BUI, S., NIELSON, A., WU, X., VO, H. T., MA, X. J. & LUO, Y. 2012. RNAscope: a novel in situ RNA analysis platform for formalin-fixed, paraffin-embedded tissues. J Mol Diagn, 14, 22-9.

236
WANG, J., TRAUM, D., SCHUG, J., GAO, L., LIU, C., CONSORTIUM, H., ATKINSON, M., POWERS, A., D FELDMAN, M., NAJI, A., CHANG, K.-M. & KAESTNER, K. 2019. Multiplexed in Situ Imaging Mass Cytometry Analysis of the Human Endocrine Pancreas and Immune System in Type 1 Diabetes.
WANG, Y. & BOGENHAGEN, D. F. 2006. Human Mitochondrial DNA Nucleoids Are Linked to Protein Folding Machinery and Metabolic Enzymes at the Mitochondrial Inner Membrane. Journal of Biological Chemistry, 281, 25791-25802.
WILLIS, J. H., CAPALDI, R. A., HUIGSLOOT, M., RODENBURG, R. J., SMEITINK, J. & MARUSICH, M. F. 2009. Isolated deficiencies of OXPHOS complexes I and IV are identified accurately and quickly by simple enzyme activity immunocapture assays. Biochim Biophys Acta, 1787, 533-8.
WITTIG, I., MEYER, B., HEIDE, H., STEGER, M., BLEIER, L., WUMAIER, Z., KARAS, M. & SCHAGGER, H. 2010. Assembly and oligomerization of human ATP synthase lacking mitochondrial subunits a and A6L. Biochim Biophys Acta, 1797, 1004-11.
WU, W., XU, H., WANG, Z., MAO, Y., YUAN, L., LUO, W., CUI, Z., CUI, T., WANG, X. L. & SHEN, Y. H. 2015. PINK1-Parkin-Mediated Mitophagy Protects Mitochondrial Integrity and Prevents Metabolic Stress-Induced Endothelial Injury. PLOS ONE, 10, e0132499.
WU, Z., PUIGSERVER, P., ANDERSSON, U., ZHANG, C., ADELMANT, G., MOOTHA, V., TROY, A., CINTI, S., LOWELL, B., SCARPULLA, R. C. & SPIEGELMAN, B. M. 1999. Mechanisms controlling mitochondrial biogenesis and respiration through the thermogenic coactivator PGC-1. Cell, 98, 115-24.
YAKUBOVSKAYA, E., MEJIA, E., BYRNES, J., HAMBARDJIEVA, E. & GARCIA-DIAZ, M. 2010. Helix unwinding and base flipping enable human MTERF1 to terminate mitochondrial transcription. Cell, 141, 982-993.
YAMANO, K., YATSUKAWA, Y., ESAKI, M., HOBBS, A. E., JENSEN, R. E. & ENDO, T. 2008. Tom20 and Tom22 share the common signal recognition pathway in mitochondrial protein import. J Biol Chem, 283, 3799-807.
YAMASHITA, S., NISHINO, I., NONAKA, I. & GOTO, Y.-I. 2008. Genotype and phenotype analyses in 136 patients with single large-scale mitochondrial DNA deletions. Journal Of Human Genetics, 53, 598.
YANG, D., OYAIZU, Y., OYAIZU, H., OLSEN, G. J. & WOESE, C. R. 1985. Mitochondrial origins. Proc Natl Acad Sci U S A, 82, 4443-7.
YANG, M. Y., BOWMAKER, M., REYES, A., VERGANI, L., ANGELI, P., GRINGERI, E., JACOBS, H. T. & HOLT, I. J. 2002. Biased incorporation of ribonucleotides on the mitochondrial L-strand accounts for apparent strand-asymmetric DNA replication. Cell, 111, 495-505.
YLIKALLIO, E. & SUOMALAINEN, A. 2012. Mechanisms of mitochondrial diseases. Annals of Medicine, 44, 41-59.
YOULE, R. J. & VAN DER BLIEK, A. M. 2012. Mitochondrial fission, fusion, and stress. Science (New York, N.Y.), 337, 1062-1065.
YOUNG, M. J. & COPELAND, W. C. 2016. Human mitochondrial DNA replication machinery and disease. Current Opinion in Genetics & Development, 38, 52-62.
ZICKERMANN, V., WIRTH, C., NASIRI, H., SIEGMUND, K., SCHWALBE, H., HUNTE, C. & BRANDT, U. 2015. Mechanistic insight from the crystal structure of mitochondrial complex I. Science, 347, 44.