Quantitative 3D microstructural analysis of naturally deformed amphibolite from the Southern Alps...
22
1 2 3 4 5 6 7 8 9 10 11 12 13 14 15 16 17 18 19 20 21 22 23 24 25 26 27 28 29 30 31 32 33 34 35 36 37 38 39 40 41 42 43 44 45 46 47 48 49 50 51 52 53 54 55 56 57 58 Quantitative 3D microstructural analysis of naturally deformed amphibolite from the Southern Alps (Italy): microstructures, CPO and seismic anisotropy from a fossil extensional margin MICHELE ZUCALI 1 *, VALENTINA BARBERINI 2 , MARCO VOLTOLINI 3 , BACHIR OULADDIAF 4 , DANIEL CHATEIGNER 5 , LUCIA MANCINI 6 & LUCA LUTTEROTTI 5 1 DST – Dipartimento di Scienze della Terra ‘A. Desio’, Universita ` degli Studi di Milano, Via Mangiagalli 34 – 20133 Milan, Italy 2 Dipartimento di Scienze dell’Ambiente e del Territorio e di Scienze della Terra, Universita ` degli Studi di Milano-Bicocca, Piazza della Scienza 4, 20126 Milan, Italy 3 Earth Science Division, Lawrence Berkeley National Laboratory, #1 Cyclotron Rd., Berkeley, CA 94720, USA 4 Institut Laue-Langevin, 38042 Grenoble Cedex 9 France, 6, Rue Jules Horowitz, B.P.156 5 CRISMAT-ENSICAEN and IUT-Caen, Universite ´ de Caen Basse-Normandie, campus 26, Bd. M. Juin 14050 Caen, France 6 Elettra – Sincrotrone Trieste S.C.p.A., S.S. 14, km 163,5 in Area Science Park, 34149 Basovizza, Trieste, Italy *Corresponding author (e-mail: [email protected]) Abstract: The anisotropy of a rock is intimately related to the development of shape-preferred orientations (SPOs) and crystallographic-preferred orientations (CPOs). Quantifying the three- dimensional (3D) CPOs and SPOs in natural rocks is therefore critical for understanding the pro- cesses underlying the development of anisotropy. In this work, we present a CPO study of six amphibolite samples from the western Southern Alps (Italy) that have been characterized pre- viously. Quantitative texture analyses using neutron diffraction data provided 3D CPOs for amphi- bole and plagioclase and were used to calculate seismic properties. We describe the relations between mesoscopic foliation and lineation, crystallographic fabrics and seismic anisotropies for lower–middle crust amphibolites. Based on these relations and in the context of lower– middle crust within fossil extensional margin, we suggest that seismic profiles should display large-scale geological features commonly present in extensional tectonics, such as folds and shear zones, rather than flat-lying structures. Moreover, from the integration of CPOs with geologi- cal data, we observe that samples from the Strona Ceneri boundary are characterized by a granulite to amphibolite facies transition while those from the Scisti dei Laghi only record the amphibolite facies evolution, supporting the idea of two independent tectono-metamorphic units pre-dating the amphibolite re-equilibration. During large-scale geodynamic processes, the litho- sphere responds to tectonic movement and related directional stresses. This response may vary from mega- to microscopic scales and produces unique structures and anisotropy at all scales. Anisotropy is commonly produced by the rearrangement of the shapes of grains (shape-preferred orientation or SPO) and the crystallographic-preferred orienta- tion (CPO) based on the pressure and temperature conditions during deformation (Babuska and Cara 1991; Tommasi et al. 2001; Ji and Xia 2002; Karato 2008; Liang et al. 2008). Quantifying the three-dimensional (3D) CPOs in natural rocks is crucial to understanding the processes underlying the development of anisotropy. Observed seismic anisotropy is controlled by the properties of rocks and is often used to make inferences on the large- scale behaviour of the Earth’s crust and mantle. In the last two decades, several studies have shown the first-order influence of CPO on seismic From:Faulkner, D. R., Mariani, E. & Mecklenburgh, J. (eds) Rock Deformation from Field, Experiments and Theory: A Volume in Honour of Ernie Rutter. Geological Society, London, Special Publications, 409, http://dx.doi.org/10.1144/SP409.5 # The Geological Society of London 2014. Publishing disclaimer: www.geolsoc.org.uk/pub_ethics
Transcript of Quantitative 3D microstructural analysis of naturally deformed amphibolite from the Southern Alps...

12345678910111213141516171819202122232425262728293031323334353637383940414243444546474849505152535455565758
Quantitative 3D microstructural analysis of naturallydeformed amphibolite from the Southern Alps (Italy):
microstructures, CPO and seismic anisotropy froma fossil extensional margin
MICHELE ZUCALI1*, VALENTINA BARBERINI2, MARCO VOLTOLINI3,
BACHIR OULADDIAF4, DANIEL CHATEIGNER5, LUCIA MANCINI6 &
LUCA LUTTEROTTI5
1DST – Dipartimento di Scienze della Terra ‘A. Desio’, Universita degli Studi di Milano,
Via Mangiagalli 34–20133 Milan, Italy2Dipartimento di Scienze dell’Ambiente e del Territorio e di Scienze della Terra,
Universita degli Studi di Milano-Bicocca, Piazza della Scienza 4, 20126 Milan, Italy3Earth Science Division, Lawrence Berkeley National Laboratory, #1 Cyclotron Rd.,
Berkeley, CA 94720, USA4Institut Laue-Langevin, 38042 Grenoble Cedex 9 France, 6, Rue Jules Horowitz, B.P.156
5CRISMAT-ENSICAEN and IUT-Caen, Universite de Caen Basse-Normandie,
campus 26, Bd. M. Juin 14050 Caen, France6Elettra – Sincrotrone Trieste S.C.p.A., S.S. 14, km 163,5 in Area Science Park,
34149 Basovizza, Trieste, Italy
*Corresponding author (e-mail: [email protected])
Abstract: The anisotropy of a rock is intimately related to the development of shape-preferredorientations (SPOs) and crystallographic-preferred orientations (CPOs). Quantifying the three-dimensional (3D) CPOs and SPOs in natural rocks is therefore critical for understanding the pro-cesses underlying the development of anisotropy. In this work, we present a CPO study of sixamphibolite samples from the western Southern Alps (Italy) that have been characterized pre-viously. Quantitative texture analyses using neutron diffraction data provided 3D CPOs for amphi-bole and plagioclase and were used to calculate seismic properties. We describe the relationsbetween mesoscopic foliation and lineation, crystallographic fabrics and seismic anisotropiesfor lower–middle crust amphibolites. Based on these relations and in the context of lower–middle crust within fossil extensional margin, we suggest that seismic profiles should displaylarge-scale geological features commonly present in extensional tectonics, such as folds andshear zones, rather than flat-lying structures. Moreover, from the integration of CPOs with geologi-cal data, we observe that samples from the Strona Ceneri boundary are characterized by a granuliteto amphibolite facies transition while those from the Scisti dei Laghi only record the amphibolitefacies evolution, supporting the idea of two independent tectono-metamorphic units pre-dating theamphibolite re-equilibration.
During large-scale geodynamic processes, the litho-sphere responds to tectonic movement and relateddirectional stresses. This response may vary frommega- to microscopic scales and produces uniquestructures and anisotropy at all scales. Anisotropyis commonly produced by the rearrangement of theshapes of grains (shape-preferred orientation orSPO) and the crystallographic-preferred orienta-tion (CPO) based on the pressure and temperatureconditions during deformation (Babuska and Cara
1991; Tommasi et al. 2001; Ji and Xia 2002;Karato 2008; Liang et al. 2008). Quantifying thethree-dimensional (3D) CPOs in natural rocks iscrucial to understanding the processes underlyingthe development of anisotropy. Observed seismicanisotropy is controlled by the properties of rocksand is often used to make inferences on the large-scale behaviour of the Earth’s crust and mantle.In the last two decades, several studies haveshown the first-order influence of CPO on seismic
From: Faulkner, D. R., Mariani, E. & Mecklenburgh, J. (eds) Rock Deformation from Field, Experiments andTheory: A Volume in Honour of Ernie Rutter. Geological Society, London, Special Publications, 409,http://dx.doi.org/10.1144/SP409.5# The Geological Society of London 2014. Publishing disclaimer: www.geolsoc.org.uk/pub_ethics

5960616263646566676869707172737475767778798081828384858687888990919293949596979899100101102103104105106107108109110111112113114115116
properties and the importance of describing quanti-tatively the CPO of rock-forming minerals in crustaland mantle rocks (e.g. Mainprice et al. 1993; Rabbeland Mooney 1996; Tatham et al. 2008; Lloydet al. 2011b).
Quantitative CPO studies are typically perfor-med using electron backscatter diffraction (EBSD)and U-stage, commonly devoted to the study ofgrain-scale processes with a very local approach intwo dimensions, or using a statistical approach byX-ray and neutron diffraction, in the latter casesstudying larger volumes (up to 1 cm3). In the firstapproach, EBSD is the most advanced and widelyused technique. It is capable of linking CPO andSPO at the granular scale and it is spatially resolved,but 3D reconstruction of the microstructure canbe lengthy and is often not practical. The secondapproach, which is less commonly used for geolo-gical samples, is devoted to quantitative textureanalyses of rocks and other anisotropic materials.
In this study, we present CPO data obtainedby neutron diffraction. This approach allows usto investigate relatively large volumes of rocks(c. 1 cm3), comparable in size to those investigatedby experimental seismic velocity measurements(Kern et al. 1996, 2009; Kitamura 2006).
In particular, we applied this approach to sixamphibolite samples from the continental crust(Serie dei Laghi and Ivrea Verbano units) of theSouthern Alps that have been studied by Barberiniet al. (2007). Although the seismic velocities ofall samples were measured using the pulse transmis-sion technique (Birch 1960, 1961), two sampleswere studied using the U-stage technique to obtainthe CPO.
To quantify the CPO for all of the samples in3D and compare the results with measured seismicvelocities, we used CPO analyses from neutron dif-fraction data, applying the maximum Entropy-Wil-liams–Imhof–Matthies–Vinel approach (EWIMV;Matthies and Vinel 1982; Sakata et al. 1993) tosolve the orientation distribution function (ODF)from CPO measured on large (c. 1 cm3) samples atthe high-flux neutron source of the Institut LaueLangevin (ILL; Grenoble, France).
The CPO data are constrained by microstruc-tural analysis using a petrographic microscope.Macroscopically, our amphibolite rocks havemillimetre-thick foliation defined by mineral layer-ing (amphibole and plagioclase-rich layers) andthe preferred orientation of amphibole. Amphi-bole-rich layers are characterized by foliated/lineated-to-massive fabrics with relicts of garnetand pyroxene, whereas plagioclase is organized inelongated aggregates.
The CPO analysis results are used to calculateseismic properties, which have also been compu-ted with a thermodynamic approach, using bulk
chemical compositions (Connolly and Kerrick2002; Connolly 2005). The CPOs, seismic proper-ties calculated using CPO measurements, bulk che-mical composition and experimental laboratorymeasurements (Barberini et al. 2007) are discussedin terms of geodynamic processes in an extensionalregime recorded in fossil continental crust (Seriedei Laghi and Ivrea Verbano zone, Southern Alps).
Geological setting and sample description
The samples were collected in the western SouthernAlps (Italy; see Barberini et al. 2007, fig. 1). TheSouthern Alps are interpreted as a portion of thePermo-Triassicpassivemarginwith theAfricanplate(Muttoni et al. 2003). The basement rocks recordpre-Mesozoic metamorphic and magmatic imprints(Peressini et al. 2007) followed by a Permo-Meso-zoic high-temperature imprint, which is likelyrelated to extensional geodynamics leading to theopening of the Tethys Ocean (Spalla and Marotta2007).
The samples were collected in the SouthernAlpine domain of the Western Alps (Fig. 1), in theSerie dei Laghi and Ivrea Verbano units (Borianiet al. 1990c). The Serie dei Laghi consists of twounits: an upper unit (Strona Ceneri) composed ofmeta-siliciclastic sediments and a lower unit (Scistidei Laghi) that mainly consists of medium-gradeschists. In the Strona Ceneri Border Zone, whichdefines the boundary between the two units, bandedamphibolites are associated with paragneisses,quartz schist and garnet–staurolite-bearing mica-schist. Minor lenses of garnet-bearing amphiboliteor retrogressed eclogite, metagabbro, pyroxeniteand spinel peridotite are also present. Pressure andtemperature estimates from amphibolites suggestthat they experienced amphibolite facies meta-morphism at T ≈ 600 8C and P ≈ 6–8 kbar (GiobbiMancini et al. 2003). Northwest of the Serie deiLaghi is the Ivrea Verbano zone which is domi-nated by a thick unit of variably migmatized meta-pelitic schists, known locally as the KinzigiteFormation which forms a layer that varies in thick-ness from few hundred metres to c. 3–4 km trend-ing SW–NE. In the north-western part of the IvreaVerbano zone, high-grade metapelites are inter-layered with bands of 1–200-m-thick amphiboliteand ultramafic rocks. The southern part of theIvrea Verbano zone is dominated by an intrusivelayered mafic complex (‘Mafic Formation’ e.g. Riv-alenti et al. 1981; Zingg 1983; Quick et al. 1994)that is c. 10 km wide and extends along-strike(NE) for nearly 40 km. The estimated conditionsof the Permian metamorphic stage are P of 4.5–8 kbar and T of 650–850 8C (Henk et al. 1997;Vavra et al. 1999).
M. ZUCALI ET AL.

117118119120121122123124125126127128129130131132133134135136137138139140141142143144145146147148149150151152153154155156157158159160161162163164165166167168169170171172173174 F
ig.
1.G
eolo
gic
map
of
the
wes
tern
South
ern
Alp
s(r
edra
wn
afte
rB
arber
ini
etal.
2007).
Sam
ple
loca
tion
isal
sosh
ow
n.
Colo
ur
on
lin
e/co
lou
rh
ard
cop
y
3D MICROSTRUCTURAL ANALYSIS OF SOUTHERN ALPS AMPHIBOLITE

175176177178179180181182183184185186187188189190191192193194195196197198199200201202203204205206207208209210211212213214215216217218219220221222223224225226227228229230231232
Colouronline/colour
hardcopy
M. ZUCALI ET AL.

233234235236237238239240241242243244245246247248249250251252253254255256257258259260261262263264265266267268269270271272273274275276277278279280281282283284285286287288289290
Sample descriptions
The samples were collected in three distinct areasof the Southern Alps and are characterized by dif-ferences in mineralogy and fabric. The samplesof the first group (VA23 and VA25, inner part ofthe Strona Ceneri zone, Fig. 1) are plagioclase +amphibole lineated-foliated (LF)-tectonites (tecto-nites description after Turner and Weiss 1963). Thesamples of the second group (VA26 and VA27)differ in terms of fabric and mineralogy becausegarnet occurs or is replaced by aggregates of plagio-clase, which controls the fabric. The third groupof samples (VA28 and VA29) is similar to thesecond but differs in terms of the fabric, which ismuch weaker. Samples VA26, VA27, VA28 andVA29 were collected near the boundary betweenStrona Ceneri and Ivrea Verbano (Fig. 1).
Cubes of c. 1 × 1 × 1 cm (the same cubes usedfor neutron texture analyses; see the followingparagraph) were analysed using X-ray computedtomography (CT). CT analyses were carried out intwo ways: using standard X-ray laboratory equip-ment at the Department of Earth and Environmen-tal Sciences, University of Milano-Bicocca, Milan,Italy (see Castellanza et al. 2008 for further details)and using synchrotron X-ray micro-tomography(SR-CT) at the SYRMEP beamline of the Elettra-Sincrotrone Trieste laboratory in Basovizza (Tri-este), Italy (for further details see Baker et al. 2012;Zucali et al. 2014).
For both types of analyses, the tomography sliceswere combined using image analysis software(Voltolini et al. 2011). After appropriate filteringand thresholding, 3D reconstructions of the sam-ples were obtained (Fig. 2a, b). Good results wereobtained for samples VA23, VA25, VA26 andVA27, whereas the images for samples VA28 andVA29 were not satisfactory; this is likely becausewithin the sample volume analysed, the density con-trast between the minerals and the crystal size arepoorly suited to producing CT images of goodquality (it was impossible to discriminate everymineral phase from the others).
In the following sections we describe in detailthe microstructure of our samples as observed usingthe petrographic microscope and CT scans.
VA23 + VA25
These samples are characterized by their simple andtypical amphibole + plagioclase association; theyboth contain a penetrative planar fabric marked bythe SPO of amphibole (Fig. 2a) and plagioclaseoccurs either as bands or lenses, displaying onlylocalized SPO. Well-defined mineral layering oc-curs only in VA25 (Fig. 2a); plagioclase is locallysubstituted by thin aggregates of white mica whichdoes not display SPO. The 3D tomographic imagesdescribe the planar fabric in VA25, which is asso-ciated with a mineral lineation marked by the SPOof amphibole grains. A similar mineral lineation isalso visible in VA23, where amphibole SPO con-trols the development of the foliation planes.
VA26 + VA27
These samples have weak preferred orientations inthe form of foliations or lineations. In VA26, theplanar fabric is defined by amphibole aggregates(Fig. 2a) and isolated plagioclase aggregates in flat-tened lenses. The longest axis is parallel to the min-eral lineation, which is best defined by the SPO ofpolycrystalline amphibole aggregates or the local-ized SPO of amphibole grains. In VA27, garnetoccurs in isolated grains or porphyroblasts or iswrapped by the dominant foliation, which is markedby the SPO of amphibole or elongate amphiboleaggregates. Plagioclase may occur as a coronaaround garnet porphyroblasts or as rounded lenses(Fig. 2a). Garnet and plagioclase fabrics are parti-cularly well represented in the false-colour tomo-graphic image, where the light-blue coronas ofplagioclase occur around red garnet grains (Fig. 2a).The described microstructural relations suggestthat garnet occurs as a relict of an older mineralassociation, likely representing the granulite facies
Fig. 2. (a) Microstructures of the studied samples. Left column: optical microphotographs under plane-polarized light.Right column: 3D reconstructions obtained from 2D X-ray CT scans. VA23 and VA25 show Amp and Pl associatedin a penetrative planar fabric defined by Amp SPO, which is also very well described by 3D CT reconstruction.VA26 and VA27 also show planar fabric marked by Amp SPO. Plagioclase crystals are arranged in flattened lenses withthe longest axis parallel to the mineral lineation defined by amphibole-preferred orientation. In addition, withinVA27 garnet occurs as isolated grains, porphyroblasts wrapped by the dominant foliation. Plagioclase may occur ascorona around garnet porphyroblasts or as rounded lenses, as well outlined by 3D CT reconstruction.(b) Microstructures of the studied samples, optical microphotographs under plane-polarized light. VA28 and VA29 aremainly characterized by alternate massive amphibole-rich layers and plagioclase-rich lenses. Plagioclase is replaced bythin aggregates of epidote and albite, amphibole is partly preserved, and chlorite and green-amphibole substitutehornblende grains. These mineralogical variations justify the poorer-quality of the CT images for these samples, notreported here. The table shows modal composition (vol%) of samples, determined with Rietveld method on X-raypowder diffraction data (after Barberini et al. 2007).
3D MICROSTRUCTURAL ANALYSIS OF SOUTHERN ALPS AMPHIBOLITE

291292293294295296297298299300301302303304305306307308309310311312313314315316317318319320321322323324325326327328329330331332333334335336337338339340341342343344345346347348
metamorphic stage that pre-dates the amphibolitefacies stage.
VA28 + VA29
These samples are mainly characterized by alter-nating massive amphibole-rich layers and plagio-clase-rich lenses. The amphibole SPO also marksa mineral lineation (X axis) within the amphibole-rich layers, whereas few plagioclase grains displayan aspect ratio .1 with the long axis parallelto the lineation. Garnet porphyroblasts also occur(VA29) or are partially to completely replacedby fine aggregates of epidote and plagioclase(Fig. 2b). Similarly to VA26 and VA27, the micro-structural features allow us to reconstruct an oldergranulite facies stage, predating the amphibolitefacies metamorphism characterized by amphibole +plagioclase mineral paragenesis.
Neutron diffraction texture analysis (CPO)
Quantitative texture analysis using neutron dif-fraction allows for the investigation of volumes ofrock of the order 1 cm3 in a relatively short time(few hours) due to the high-penetration power ofneutrons in matter and the high flux available atthe nuclear reactor at the ILL (Zucali et al. 2002,2010, 2012; Tartarotti et al. 2011). The latticeplanes of the rock-forming minerals analysed areinvestigated in sample space and represented aspole figures (Fig. 3). Pole figures represent thedirectional distributions of the lattice plane normal(hkl) relative to the sample coordinates (e.g. meso-scopic foliation and lineation). Pole figures useequal-area projections of the orientation sphere anddisplay pole densities in multiples of a random dis-tribution (mrd) (Wenk 2006). Quantitative CPOanalysis is represented as pole figures (hereafterreferred to as PF, where the mesoscopic tectonicfabrics are reported as X, Y and Z directions (Fig.3). The X direction is parallel to the mesoscopicmineral lineation, while the XY plane is the foliationplane. The quality of the refinement and the ODFcalculation is assessed by reliability values (R inTable 1). Quantitative analysis of diffraction datahas been carried out using Maud software (Lutterottiet al. 1999), and data are represented using theBeartex software package (Wenk et al. 1998).
We present the results from the D19 diffract-ometer at the ILL (Fig. 3), where monochromaticradiation is used with a Cu (111) monochromatorwith a wavelength l of 1.46 A, a flux of ≈107 ncm22 s21 (where n ¼ neutrons) and a maximumbeam size of 10 × 10 mm2. The intensities aremeasured by rotating the sample around two axes(w and x) with a texture goniometer (Fig. 3) and
a step interval of 58. A position-sensitive detec-tor (http://www.ill.eu/instruments-support/) withan angular range of 120 × 308 is used to acquiresimultaneously diffracting lattice planes at differentBragg angles.
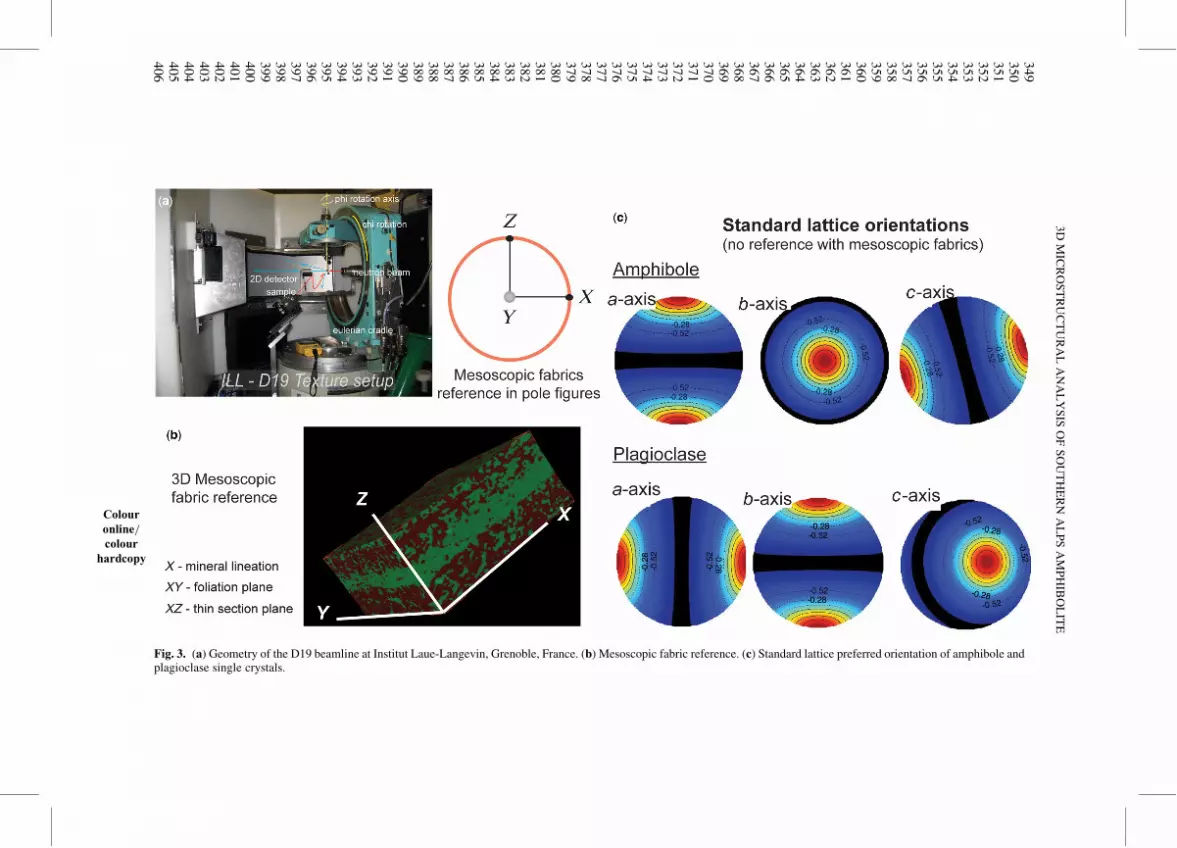
In the PFs presented (Fig. 4), the foliation planetrace (XY plane) is the horizontal diameter. Accord-ing to the crystal symmetry, the PFs may or may notrepresent the direct crystallographic axes; in thepresented cases, only poles to the (010) planes ofamphibole actually correspond to [010] axes. Forall other PFs, the represented directions correspondto the direction normal to the labelled planes, that is[hkl]* reciprocal directions.
Below we describe in detail the CPO of oursamples as obtained from neutron diffraction textureanalyses.
VA23 + VA25
In these samples, amphibole is characterized bysimilar distributions of the main crystallographicplanes. In particular, the (100) poles describe acluster distribution at an angle of c. 35–458 to theX lineation direction and to the XY foliation plane.Conversely, the (010) and (001) poles describethe girdle distributions, particularly (001), whichdescribes a girdle containing Y, with a maximumat an angle of ,308 to the Y axis.
Plagioclase CPOs are defined by weak (100)poles distributed along girdles at low angles to thefoliation plane, whereas the (010) and (001) polesproduce small circles with a rotation axis broadlydistributed at 458 to the X axis within the XY plane.
VA26 + VA27
As these samples do not have well-defined macro-scopic foliation, the mesoscopic fabric orientationsare less reliable. The samples were placed underthe neutron beam with reference to the weak SPOvisible to the naked eye. With this limitation inmind, the (001) poles of amphibole in VA26 areclustered close (,108) to the X mineral lineationdirection, whereas the (100) and (010) poles describegirdle distributions with weak secondary maximathat are parallel to the YZ plane and at an angle of308 to the Z direction. In VA27, the amphibole(001) poles display a similar distribution as forVA26 but with a rotation of c. 308 with respect toY. The (010) and (100) poles also have correspond-ing relations. Plagioclase does not have a strongpreferred orientation and is regarded as having arandom crystallographic orientation distribution inVA26, with a maximum value is 1.09 mrd where arandom distribution would be one. In particular,VA26 has a ring-like distribution around Y, but this
M. ZUCALI ET AL.
349
350
351
352
353
354
355
356
357
358
359
360
361
362
363
364
365
366
367
368
369
370
371
372
373
374
375
376
377
378
379
380
381
382
383
384
385
386
387
388
389
390
391
392
393
394
395
396
397
398
399
400
401
402
403
404
405
406
Fig. 3. (a)
Colouronline/colour
hardcopy
Geometry of the D19 beamline at Institut Laue-Langevin, Grenoble, France. (b) Mesoscopic fabric reference. (c) Standard lattice preferred orientation of amphibole andplagioclase single crystals.
3D
MIC
RO
ST
RU
CT
UR
AL
AN
AL
YS
ISO
FS
OU
TH
ER
NA
LP
SA
MP
HIB
OL
ITE

407408409410411412413414415416417418419420421422423424425426427428429430431432433434435436437438439440441442443444445446447448449450451452453454455456457458459460461462463464
distribution is related to noise during the data acqui-sition and processing.
In VA27, the (100) poles define clusters at 30–08to Z in the XZ plane and close to Y. The (001) polesplot from 458 to 08 to X in the XZ plane.
VA28 + VA29
In VA28, amphibole displays a well-defined (001)maximum in the X direction, whereas the (100)poles are dispersed along a girdle within the YZplane with maxima at approximately 458 to Y. The(010) poles display composite girdle distributions,with one close to the XZ plane and one parallel tothe YZ plane.
In VA29, amphibole is characterized by a less-pronounced CPO. In particular, the (010) polesare nearly randomly distributed whereas the (100)poles describe a cluster at 458 to X within the XZplane and the (001) poles describe a girdle in aplane perpendicular to the XZ plane and at 458 toX, but perpendicular to the cluster of (100) poles.In both VA28 and VA29, the CPO of plagioclaseis close to random as indicated by distribution den-sities below 1.10 mrd (Fig. 4). In VA29 however,the CPO of plagioclase is characterized by twosmall circles of (010) and (001) poles that are char-acterized by a rotation axis c. 208 to Z in the XZplane. As previously described for VA26, nearlyrandom distributions suffer from noise during dataacquisition, which results in a preferred orientationthat wrongly suggests a rotation around Y.
Among the studied samples, only the CPOs ofVA28 and VA29 have been previously described(determined with the U-stage technique, Barberini
et al. 2007). According to Outlaw et al. (2000)and Barberini et al. (2007), [001] of amphibolelies parallel to X (VA28) or may define an angle,commonly ,208 to X (VA29), whereas (100)defines a girdle around (001).
We obtained similar distributions for sam-ples VA26 and VA28. For the other sampleswhere only the new data are available, amphiboleCPOs display similar orientations. Table 1 lists thereliability factors and texture strength factors forthe samples and minerals investigated. The twomethods produce different results for VA29, whichis likely related to the large grain size of thissample and resulting statistics. Due to the largegrain size, the number of grains measured by theU-stage is relatively low, resulting in a statisticallyunreliable preferred orientation. As shown by thereliability factors in Table 1, the number of crystal-lites measured by diffraction is also small, buthigher and more reliable than measurements car-ried out using the U-stage. Low reliability factorsin both techniques may have yielded significantlydifferent CPOs in some cases. We have been ableto measure plagioclase CPOs for all six sampleswith varied results.
VA23 and VA25 are characterized by similarCPOs, in agreement with the described CPOs fordeformed plagioclase (e.g. Ji and Mainprice 1990;Shigematsu and Tanaka 1999; Passchier andTrouw 2005; Barreiro and Catalan 2012). VA26and VA28 display a random distribution for allthe crystallographic planes, whereas VA27 andVA29 are characterized by weak textures thatdiffer from VA23 and VA25, suggesting differentdeformation mechanisms and active slip systems.
Table 1. Refinement and ODF calculation reliability factors
Global factors Single phase factors
Sample GoF RW RB Mineral phase F2 RW RB
VA23 1.08 22.01 17.28 AMP 1.72 44 34PL 1.47 15 10
VA25 1.06 18.92 14.4 AMP 3.16 44 26PL 1.07 27 16
VA26 1.02 11.55 8.68 AMP 2.3 17 13PL 1.04 18 14
VA27 1.01 19.11 14.91 AMP 1.31 25.1 20.33PL 1.15 20.98 18.15
VA28 1.27 19.86 15.09 AMP 2.21 31 26VA29 0.83 13.26 10.21 AMP 1.13 25.53 18.81
Mineral Space group a b c alpha beta beta
Amphibole C2/m 9.8 18.07 5.27 90 105.14Albite P-1 8.14 12.79 7.15 94.33 116.57 87.65
For each sample both global factors and factors for each mineral phase used within the calculations are listed. GoF: goodness of fit; RW:intensity-weighted factor; F2: texture strength in mrd2; RB: R-Bragg factor.
M. ZUCALI ET AL.
465466467468469470471472473474475476477478479480481482483484485486487488489490491492493494495496497498499500501502503504505506507508509510511512513514515516517518519520521522
Microstructural observations may be used to dis-cuss such differences; VA23 and VA25 displayplagioclase layers whereas in the other samples
plagioclase crystals occur in rounded aggregatesclosely related to garnet porphyroblasts or micro-domains. The static recrystallization of plagioclase
Fig. 4. Recalculated pole figures of the main crystallographic planes for amphibole and plagioclase, obtainedfrom quantitative analysis of neutron diffraction data: (a) VA23 and VA25; (b) VA26 and VA27; and (c) VA28and VA29.
Colouronline/colour
hardcopy
3D MICROSTRUCTURAL ANALYSIS OF SOUTHERN ALPS AMPHIBOLITE

523524525526527528529530531532533534535536537538539540541542543544545546547548549550551552553554555556557558559560561562563564565566567568569570571572573574575576577578579580
in samples VA26, VA27, VA28 and VA29 mayexplain the absence of CPOs, whereas weak CPOsmight have developed in domains where defor-mation occurred after plagioclase crystallization.
Seismic properties
In crustal rocks, seismic anisotropy may be causedby composition, mineralogy, CPO and SPO (Lloyd
Fig. 4. Continued.
Colouronline/colour
hardcopy
M. ZUCALI ET AL.

581582583584585586587588589590591592593594595596597598599600601602603604605606607608609610611612613614615616617618619620621622623624625626627628629630631632633634635636637638
et al. 2011a). The petrofabric-derived seismic pro-perties have been shown to match natural sam-ples very well (e.g. Christensen 1984; Mainpriceand Nicolas 1989; Siegesmund et al. 1989; Ji andXia 2002).
In this section, we describe the seismic aniso-tropy of our samples as obtained using two differentapproaches. The first approach uses CPO data thatare quantitatively expressed by the orientation dis-tribution function (ODF) of rock-forming minerals
Fig. 4. Continued.
Colouronline/colour
hardcopy
3D MICROSTRUCTURAL ANALYSIS OF SOUTHERN ALPS AMPHIBOLITE

639640641642643644645646647648649650651652653654655656657658659660661662663664665666667668669670671672673674675676677678679680681682683684685686687688689690691692693694695696
to average the single-crystal stiffness tensors. Thetheory, procedures and successful applications tonatural rocks have been reported over the last twodecades (e.g. Christensen 1984; Mainprice 1990;Lloyd et al. 2011a; Mainprice et al. 2011). In thesecond approach, seismic velocities are computedusing the thermodynamic function G (molar Gibbsfree energy). Within a given pressure and tem-perature interval and a rock system of interest, Gis minimized to establish the stable mineral phases,their amounts and chemical compositions (see Con-nolly 2005 for details). The Perple_X softwarepackage (Connolly and Kerrick 2002; Connolly2005) allows the stability fields and related seismicvelocities to be calculated. The software requiresthe system (chemical) composition as molar unitsor weight fractions (percentage) as input.
This approach greatly differs from the approachthat uses the crystallographic preferred orientationsof rock-forming minerals (Mainprice 1990; Main-price et al. 1993; Christensen and Mooney 1995;Ismaıl and Mainprice 1998). In the latter approach,the elastic properties of the polycrystal is averagedand weighted with the use of the distribution func-tions (ODF) for each mineral, whereas the thermo-dynamic approach assumes an isotropic materialand does not consider the preferred orientation ofminerals.
For stiffness tensors and densities, which arerequired in the first approach, we used those repor-ted by Barberini et al. (2007). To average withrespect to the ODF, we used the approach of Hill(1952). We used the Beartex software package(Wenk et al. 1998) to calculate the seismic veloci-ties from the ODF, and the ODF input was calcu-lated using the Maud software (Lutterotti et al.1999) and neutron diffraction data.
As a reference, we calculated Vp for a simpli-fied amphibolite consisting of a single crystal ofamphibole and one of plagioclase (70% and 30%in volume, respectively). In this approximation, theelastic tensors used for the calculation are those of
the corresponding single crystals. Figure 5 displaysthe calculated Vp in km s21 expected for singlecrystals of amphibole and plagioclase and for themodelled rock, which is obtained by averaging thecontributions of single crystals of amphibole andplagioclase based on their relative volumes. Thecrystallographic axes are also shown for the Vp
plots of amphibole and plagioclase, which allowsthe relations between lattice orientation and Vp ani-sotropy to be defined. Accordingly, the maximumVp occurs parallel to the amphibole c-axis andplagioclase c- and b-axes, as has been shown in pre-vious work (e.g. Siegesmund et al. 1989; Kitamura2006; Barberini et al. 2007; Tatham et al. 2008).
In most samples, the highest Vp is in the planeof the foliation (XY) or at a relatively low angleto it (Fig. 6a, b). The orientation of the highest Vp
is often close to the X direction (VA26, VA27,VA28), with some exceptions (VA23, VA25,VA29) where the maximum Vp are within the XYfoliation plane but parallel to the Y direction.When the higher Vp describe a girdle (VA23,VA25, VA29), it is commonly at 458 between theXY and YZ planes. VA26 has a girdle at 458between the XY and XZ planes. Conversely, inVA27 and VA28, the higher Vp describe clustersat 208 to X within the XZ plane (VA27) or parallelto X (VA28). The averaged Vp are in the range6.2–7.0 km s21 and Vp anisotropy 1.97–3.18%.
Comparing the CPO pole figures with the Vp
poles indicates that the directions normal to the(001) planes are the most important in the defini-tion of the Vp anisotropy of amphiboles and of therocks themselves. The plagioclase CPO is com-monly very low and does not influence the overallVp of the rock.
For the Perple_X calculations, the model systemhas been simplified to CaO-FeO-MgO-Al2O3-SiO2-H2O (CFMASH) (Fig. 7). For solid solutions,we chose those of Dale et al. (2000) for amphibole,Newton et al. (1980) and Holland and Powell(1998) for garnet and that of White et al. (2001)
Fig. 5. 3D P-wave velocity (in km s21) for amphibole and plagioclase single crystals and for a hypothetic whole rock(amphibole 70% and plagioclase 30%). Crystallographic axes are shown for amphibole and plagioclase.
Colouronline/colour
hardcopy
M. ZUCALI ET AL.

697698699700701702703704705706707708709710711712713714715716717718719720721722723724725726727728729730731732733734735736737738739740741742743744745746747748749750751752753754
Fig. 6. (a, b) P-wave velocities distribution (in km s21) calculated from CPO data. Vp are presented separately foramphibole, plagioclase and averaged rock.
Colouronline/colour
hardcopy
3D MICROSTRUCTURAL ANALYSIS OF SOUTHERN ALPS AMPHIBOLITE

755756757758759760761762763764765766767768769770771772773774775776777778779780781782783784785786787788789790791792793794795796797798799800801802803804805806807808809810811812
for granitic melt. Figure 7 presents the weightfractions (percentage) for each oxide used in the cal-culations and the Vp interval calculated in thepressure and temperature box, as inferred from theliterature (see geological setting section).
Figure 8 and Table 2 synthesize the Vp valuesfrom the different methods used. In Figure 8, thesedata are also plotted with respect to the expectedVp range for a variety of amphibolite rocks fromthe middle–lower crust, as reported in the literature
Fig. 7. Vp wave velocities distribution in the P–T field as calculated using Perple_X in the CFMASH modelsystems. Chemical compositions are calculated averaging chemical spot analyses with the modal amount of everymineral phase, in weight percentage (wt%); Vp intervals refers to the minimum and maximum values calculated bythermodynamic modelling; contour lines represents equal Vp lines.
Colouronline/mono
hardcopy
M. ZUCALI ET AL.

813814815816817818819820821822823824825826827828829830831832833834835836837838839840841842843844845846847848849850851852853854855856857858859860861862863864865866867868869870
(Siegesmund et al. 1989; Christensen and Mooney1995; Kitamura 2006; Tatham et al. 2008). Thiscomparison highlights several aspects that deserveto be discussed in further detail.
The mean Vp calculated from the thermodyna-mic modelling are higher in VA23, VA25, VA26and VA27, and they are similar for VA28 andVA29. No maximum or minimum values were cal-culated because the thermodynamic modellingdoes not consider any preferred orientations. InFigure 8, the values from the thermodynamic mod-elling are plotted with respect to the maximum andminimum Vp for reference. The U-stage-derivedvalues agree for VA28 for all methods, but arehigher in VA29. Similarly, the distribution of Vp
derived from neutron data (Fig. 6b) in VA28 andVA29 resemble the distribution shown by Barberiniet al. (2007). In particular, the higher-velocity girdledistribution in Figure 6b and in Barberini et al.(2007) differs by a rotation of 908 around Z. Thisrotation may be due to the poorly developed foli-ation/lineation in this sample. In general, the
measured and neutron-derived Vp values are ingood agreement for most samples, with discrepan-cies of ,0.5 km s21. There is good agreementamong all types of data for VA28, even for aniso-tropy which commonly displays larger differencesbetween calculated and measured orientation data.VA26 also are in good agreement, particularly inthe minimum and mean seismic velocities.
Discussion
Typically, the structures of passive margins arestudied and described in terms of volumes of highor low velocities and densities based on informa-tion from deep seismic investigations coupled withgravimetric data (Contrucci et al. 2004). These stud-ies have the largest impact on petroleum researchalong passive margins, particularly where exten-sional tectonics has created large basins that arenow covered by salt deposits and are likely sitesfor large reservoirs (Lentini et al. 2010).
Fig. 8. Graphical comparison of Vp data as obtained using various approaches described in the text. U-stage dataand measured Vp are from Barberini et al. (2007) while literature velocities are from Siegesmund et al. (1989),Christensen & Mooney (1995), Kitamura (2006) and Tatham et al. (2008).
Colouronline/mono
hardcopy
3D MICROSTRUCTURAL ANALYSIS OF SOUTHERN ALPS AMPHIBOLITE

871872873874875876877878879880881882883884885886887888889890891892893894895896897898899900901902903904905906907908909910911912913914915916917918919920921922923924925926927928 T
able
2.C
om
pari
son
of
Vp
wav
eve
loci
ties
(km
s21)
dat
aobta
ined
from
ult
raso
nic
analy
sis,
neu
tron
dif
frac
tion
analy
sis
and
U-s
tage
CP
O(B
arb
erin
iet
al.
2007).
Vp
mea
sure
dV
pca
lcula
ted
from
LP
O-n
eutr
on
Vp
calc
ula
ted
from
LP
O-U
-sta
ge
x(k
ms2
1)
z(k
ms2
1)
Mea
n(k
ms2
1)
Anis
otr
opy
(%)
Max
(km
s21)
Min
(km
s21)
Mea
n(k
ms2
1)
Anis
otr
opy
(%)
Max
(km
s21)
Min
(km
s21)
Mea
n(k
ms2
1)
Anis
otr
opy
(%)
VA
23
6.9
25.9
66.4
414.9
16.5
86.4
76.5
31.6
9n.a
.n.a
.n.a
.n.a
.V
A25
6.8
35.9
76.4
013.4
46.7
06.4
96.6
03.1
8n.a
.n.a
.n.a
.n.a
.V
A26
6.8
06.1
76.4
99.7
16.4
26.2
46.3
32.8
4n.a
.n.a
.n.a
.n.a
.V
A27
6.2
65.8
26.0
47.2
86.6
86.5
36.6
12.2
7n.a
.n.a
.n.a
.n.a
.V
A28
7.0
36.7
66.9
03.9
27.1
66.8
26.9
94.8
67.1
86.7
26.9
56.6
2V
A29
7.2
76.5
86.9
39.9
66.6
56.5
26.5
91.9
77.2
66.9
27.0
94.8
0
M. ZUCALI ET AL.

929930931932933934935936937938939940941942943944945946947948949950951952953954955956957958959960961962963964965966967968969970971972973974975976977978979980981982983984985986
Most of the published seismic profiles display atransition between oceanic and continental crustthrough an ocean–continent transition, occasionallycalled an OCT, which is characterized by anoma-lous high-velocity/high-density layer(s) (Hirschet al. 2009). The Vp of ‘normal’ continental crustvaries between 5 and 8 km s21, generally increasingwith depth, following a seismic stratigraphy typi-cal of the continental crust (e.g. Christensen andMooney 1995). Anomalous bodies in the ocean–continent transition zones may have a Vp above6.7 km s21 (e.g. Blaich et al. 2011).
Studies of the lithostratigraphy and structuralsetting of fossil passive margins have shown thatlarge- to small-scale folding that may be associatedwith the development of new fabrics is common(e.g. Bertotti et al. 1993; Spalla et al. 2000). Conse-quently, the distribution of lithotypes (i.e. bulk com-position) is not linearly related to depth, such thatmafic rocks (higher density) are more abundant inthe lower crust whereas felsic rocks (lower density)are more common in the upper and intermediatecrust (e.g. Christensen and Mooney 1995; Rudnickand Fountain 1995; Rudnick and Gao 2003).
The Southern Alps are commonly interpreted tobe a portion of a Permo-Mesozoic passive margin ofthe African plate (Boriani et al. 1990a, b, c; Handyet al. 1999), and they are an ideal example for dis-cussing the influence of rock anisotropy on the prop-erties (e.g. seismic) of the rock (e.g. Rutter et al.1999). The western sector of the Southern Alps iscomposed of continental crust rocks, from felsic tointermediate in composition, plus the Ivrea Body,a large mafic to ultramafic body (Bigi et al. 1990).This lithological association is commonly viewedas an outcropping section of the intermediate–lower crust transition (Boriani et al. 1990b; Rutteret al. 2007), tilted to between 20 and 608 duringTriassic and Jurassic time and along the InsubricLine during the Alpine orogenesis (Boriani et al.1990b; Barboza and Bergantz 2000).
The structural and petrological evolution andlarge-scale tectonics of this section have beenstudied as part of lithospheric-scale seismic investi-gations (Handy 1987; Boriani et al. 1990c; Rutteret al. 1999; Khazanehdari et al. 2000). The largeheterogeneities in lithotype and the variety ofscales (metres to kilometres) of folding and intru-sive structures that characterize this fossil conti-nental margin of the Southern Alps result in one ofthe most complex distribution of seismic wavevelocities observed globally (Rutter et al. 1999;Lloyd et al. 2011b).
Modern studies of the distribution and behaviourof seismic velocities in crustal rocks have demon-strated how rock fabrics and folding may be exploi-ted (e.g. using shear-wave splitting), which mayvary due to foliation and CPO regardless of the
bulk composition (Rutter et al. 1999; Ji and Long2006; Tatham et al. 2008; Lloyd et al. 2011a). Asshown for passive margins globally and the South-ern Alps in particular, foliations and CPO havebeen pervasively folded during and after syn-riftingtectonics (e.g. Alpine tectonics in the SouthernAlps; Burlini and Fountain 1993).
The megascopic structural framework shouldbe considered when defining the seismic model forinterpretation. Burlini (1994) demonstrated seismicanisotropy recorded by 5–10-km-thick metapeliticlayers, leading to shear-wave splitting times of upto 1.2 s. This anisotropy is strongly controlledby the CPOs and SPOs of sillimanite and biotitein high-grade melt-bearing metapelites (kinzigite)(Burlini 1994), associated with the amphibolitesstudied here.
We have confirmed that the seismic anisotropyis closely related to the CPO of amphibole in amphi-bolites (Siegesmund et al. 1989; Meissner et al.2006; Tatham et al. 2008). In particular, the mainmesoscopic and microscopic fabrics, which are gen-erally characterized by alternating mineral layers,do not always correspond to the directions of thecrystallographic anisotropy. This observation isdue to the CPO of amphibole, which may be at anangle to the planar or linear fabrics that are welldefined at the outcrop scale in hand samples andin seismic tomography. The SPO and CPO of pla-gioclase, which are the secondary rock-formingmineral in amphibolites, do not significantly affectthe spatial distribution of anisotropy however;this remains controlled by the CPO of amphibole.This observation is in accordance with the ‘recipe’approach by Azpiroz and Lloyd (2010); however,the SPO and CPO of plagioclase do contribute tolowering the average velocity (Tatham et al. 2008).
As shown by Lloyd et al. (2011a, b), shear-wavesplitting and anisotropy may indicate changes in theorientations of rocks with depth. Because the shear-wave splitting of amphibolites is controlled by theCPO of amphibole, the reconstructed directionsfor these samples do not coincide with mesoscopicfoliations or compositional layering; instead, theycoincide with amphibole CPO fabrics. In our workthe foliation plane (XY) and the CPO of amphibolemay display orthorhombic symmetry (e.g. VA26in Fig. 4b and VA28 in Fig. 4c), but they also differby up to 20–308 (VA23 and VA25 in Fig. 4a, VA27in Fig. 4b and VA29 in Fig. 4c), developing a mono-clinic symmetry.
The deep 3D architecture of the western South-ern Alps sector is characterized by large-scalefolds that refold the rock boundaries, producingcomplex patterns of mutually folded layers andlenses of compositionally different rocks (Bigiet al. 1990). Within these crustal-scale lenses orlayers the fabrics are equally complex, recording
3D MICROSTRUCTURAL ANALYSIS OF SOUTHERN ALPS AMPHIBOLITE

987988989990991992993994995996997998999100010011002100310041005100610071008100910101011101210131014101510161017101810191020102110221023102410251026102710281029103010311032103310341035103610371038103910401041104210431044
multiple stages of superimposed deformation (Bur-lini 1994) which led to the development of variousgenerations of foliations and lineations that cross-cut the main lithological boundaries. Several zonesof strain localization are also recorded at differ-ent scales (Handy et al. 1999; Rutter et al. 2007),which developed under different metamorphic con-ditions and at different times during the tectono-metamorphic evolution of the area and wererefolded locally during later stages (Khazanehdariet al. 2000). The ultramafic Ivrea Body occupiesthe south-westernmost part of the sector, adjacentto the Insubric Line, whereas kilometre-scalePermian granitic bodies localize in the eastern partof the sector (Fig. 1). The Ivrea Body is also intern-ally characterized by well-developed fabricsand CPOs (Quick et al. 1995), whereas the intru-sive granitic bodies are mainly isotropic. All theseobservations, together with metamorphic andmagmatic age data of the western Southern Alps(Peressini et al. 2007; Luvizotto and Zack 2009;Mazzucchelli et al. 2010; Wolff et al. 2012),describe Ivrea Zone as constituted by rock unitswith contrasting tectono-metamorphic evolutions.This questions its interpretation as a vertical sec-tion through the lower crust, particularly in lightof similar discussions on the settings of centralportions of the Southern Alps (Spalla et al. 2005,2010). In fact, Late Carboniferous–Early Permiangranulite facies metamorphism and related defor-mation have been reported (Barboza and Bergantz2000; Peressini et al. 2007) for the Ivrea Verbanorocks. Similarly, samples VA26, VA27, VA28 andVA29 collected near or within this unit are charac-terized by garnet relicts that pre-date the growth ofthe amphibolite facies paragenesis (plagioclase +amphibole). The CPOs of these samples also reflectthis evolution; plagioclase is characterized by anabsence or weakness of preferred orientations,whereas amphibole displays similar CPOs to thesample from the Scisti dei Laghi/Strona Ceneri(VA23, VA25). The absence of CPO in plagioclaseis interpreted as linked to the origin of plagioclase,which replaces garnet during the decompressionfrom granulite (eclogite?) to amphibolite conditionsas confirmed by microstructural and tomographicimage analysis (Fig. 2a, b) and thermobarometricestimates from the literature (Giobbi Mancini et al.2003). Conversely, in VA23 and VA25 plagioclaseCPO records the deformation associated with theamphibolite facies imprint, developing preferredorientation characteristic of plastic deformationat amphibolite facies conditions (see Passchier andTrouw 2005).
The combination of structural, metamorphicand petrochronological data, now constrained byCPO analysis, strongly suggest that we shouldinterpret the evolution of western Southern Alps
crust as an active extensional margin since LateCarboniferous–Early Permian time that accommo-dated the opening of the Alpine Tethys (Stampfliand Borel 2002; Handy et al. 2010). The IvreaVerbano granulite imprint was likely related to theonset of the asthenosphere uplift that culminatedwith the intrusion of the Mafic Body (Barboza andBergantz 2000). The amphibolite facies imprintoccurred as the Ivrea Verbano zone reached inter-mediate crustal levels and came into contact withthe Scisti dei Laghi, through the Cossato-Mer-gozzo-Brissago shear zone (Boriani et al. 1990a;Boriani and Burlini 1995).
All these observations present us with a sce-nario that must be considered when interpretingthe seismic data for a section of continental crust,although the general assumption is that exten-sional tectonics result in relatively simple large-scale structures. Firstly, the lithological/chemicalvariations in the crust are not necessarily simplyrelated to depth, but they are uniquely controlledby the folding and deformational history of thepre-existing lithostratigraphy. Secondly, the macro-and microscopic fabrics have been repeatedly fol-ded and locally replaced by new fabrics. Thirdly,the crystallographic fabrics may have orthorhom-bic to monoclinic symmetry with respect to theshape fabric (i.e. foliations and lineations), lead-ing to more complicated relations between seismicanisotropy, crystallographic fabrics and mesoscopic(shape) fabrics.
Conclusions
To quantify the contribution of crystallographicfabric to the bulk seismic properties of rocks, wehave analysed amphibolites from the western South-ern Alps which are considered an example of fossillower crust of the African side of the Tethys passivemargin.
The results demonstrate that the contribution ofCPO is of primary importance if we want to recon-struct fully the tectono-metamorphic evolution ofthe Southern Alps continental rocks. CPOs maygive us clues about the past evolution of the area,which may be successfully used to show the con-trasting geological history of adjacent areas.
Neutron diffraction CPO analysis results in amore reliable and accurate definition of the ODFfor amphibole in 3D and enables the reconstruc-tion of the plagioclase CPO, which was arbitrarilyconsidered random by Barberini et al. (2007) forsamples VA28 and VA29.
The combination of these new data with thosepublished for pelitic rocks in the same area (Burliniand Fountain 1993), together with crustal-scalestructures from this portion of the Southern Alps,
M. ZUCALI ET AL.

1045104610471048104910501051105210531054105510561057105810591060106110621063106410651066106710681069107010711072107310741075107610771078107910801081108210831084108510861087108810891090109110921093109410951096109710981099110011011102
emphasizes the importance of introducing structuraldata, such as crystallographic fabrics, into seismicmodels when reconstructing the structure of conti-nental crust, as suggested by Lloyd et al. (2011a, b).
Future studies should integrate quantitative datafrom shape fabrics, for example from phase-contrastsynchrotron X-ray microtomography (e.g. Bakeret al. 2012; Zucali et al. 2014), into the computationof seismic properties, which will likely produce amore refined model relating the mesoscopic fab-rics, microscopic preferred orientations and latticeanisotropies to the large-scale seismic response.Hopefully, this model will be capable of reprodu-cing structures of various scales, including folds,which are largely preserved in fossil continental crustand represent major structures developed duringdominant geodynamic processes such as rifting.
The manuscript was greatly improved by the detailed com-ments of two anonymous reviewers DC and LL warmlythank the Conseil Regional de Basse-Normandie and theFEDER for the two-years financial of the Chair of Excel-lence of LL at CRISMAT. MZ thanks Geoprob ProjectPRIN2012 for financing.
References
Azpiroz, M. D. & Lloyd, G. E. 2010. The influence ofplagioclase LPO on P-wave anisotropy and seismicreflectivity of metabasites from the lower continentalcrust. Geogaceta, 48, 199–202.
Babuska, V. & Cara, M. 1991. Seismic Anisotropy in theEarth. Springer, Dordrecht, The Netherlands, 10.
Baker, D. R., Mancini, L., Polacci, M. & Higgins, M.D. 2012. An introduction to the application of X-raymicrotomography to the three-dimensional study ofigneous rocks. Lithos, 148, 262–276.
Barberini, V., Burlini, L. & Zappone, A. 2007. Elasticproperties, fabric and seismic anisotropy of amphi-bolites and their contribution to the lower crust reflec-tivity. Tectonophysics, 445, 227–244.
Barboza, S. A. & Bergantz, G. W. 2000. Metamorphismand anatexis in the mafic complex contact aureole,Ivrea Zone, Northern Italy. Journal of Petrology, 41,1307–1327.
Barreiro, J. G. & Catalan, J. R. M. 2012. The Bazarshear zone (NW Spain): microstructural and time-of-flight neutron diffraction analysis. In: Zucali, M.,Spalla, M. I. & Gosso, G. (eds) Multiscale structuresand tectonic trajectories in active margins. Journal ofthe Virtual Explorer, 41, Paper 5, http://dx.doi.org/10.3809/jvirtex.2011.00296
Bertotti, G., Siletto, G. B. & Spalla, M. I. 1993.Deformation and metamorphism associated withcrustal rifting: the Permian to Liassic evolution of theLake Lugano-Lake Como area (Southern Alps). In:Cloetingh, S., Sassi, W. & Horvath, F. (eds) TheOrigin of Sedimentary Basins: Inferences fromQuantitative Modelling and Basin Analysis. Elsevier,Amsterdam, Netherlands, 271–284.
Bigi, G., Castellarin, A., Coli, M., Dal Piaz, G. V.,Sartori, R., Scandone, P. & Vai, G. B. 1990. Struc-tural Model of Italy, sheets 1–2: CNR, Progetto Fina-lizzato Geodinamica.
Birch, F. 1960. The velocity of compressional waves inrocks to 10 kilobars, part 1. Journal of GeophysicalResearch, 65, 1083–1102.
Birch, F. 1961. The velocity of compressional waves inrocks to 10 kilobars: 2. Journal of GeophysicalResearch, 66, 2199–2224.
Blaich, O. A., Faleide, J. I. & Tsikalas, F. 2011. Crus-tal breakup and continent-ocean transition at SouthAtlantic conjugate margins. Journal of GeophysicalResearch, 116, B01402.
Boriani, A. & Burlini, L. 1995. Carta geologica dellaValle Cannobina.: Dipartimento di scienze della terradell’Universita degli studi di Milano. Tav. 1,
Boriani, A., Burlini, L. & Sacchi, R. 1990a. TheCossato-Mergozzo-Brissago Line and the PogalloLine (Southern Alps, Northern Italy) and their relation-ships with the late-Hercynian magmatic and meta-morphic events. Tectonophysics, 140, 193–212.
Boriani, A., Origoni, E. G., Borghi, A. & Caironi, V.1990b. The evolution of the ‘Serie dei Laghi’(Strona-Ceneri and Scisti dei Laghi): the upper component ofthe Ivrea-Verbano crustal section; Southern Alps,North Italy and Ticino, Switzerland. Tectonophysics,182, 103–118.
Boriani, A., Burlini, L. & Sacchi, R. 1990c. TheCossato-Mergozzo-Brissago line and the Pogallo line(Southern Alps, Northern Italy) and their relationshipswith late-Hercynian magmatic and metamorphicevents. Tectonophysics, 140, 193–212.
Burlini, L. 1994. A model for the calculation of the seis-mic properties of geologic units. Surveys in Geophy-sics, 15, 593–617.
Burlini, L. & Fountain, D. M. 1993. Seismic anisotropyof metapelites from the Ivrea-Verbano zone and Seriedei Laghi (northern Italy). Physics of the Earth andPlanetary Interiors, 78, 301–317.
Castellanza, R., Gerolymatou, E. & Nova, R. 2008.An attempt to predict the failure time of abandonedmine pillars. Rock Mechanics and Rock Engineering,41, 377–401.
Christensen, N. I. 1984. The magnitude, symmetry andorigin of upper mantle anisotropy based on fabric ana-lyses of ultramafic tectonites. Geophysical Journal ofthe Royal Astronomical Society, 76, 89–111.
Christensen, N. I. & Mooney, W. D. 1995. Seismicvelocity structure and composition of the conti-nental crust: a global view. Journal of Geophys-ical Research: Solid Earth (1978–2012), 100,9761–9788.
Connolly, J. A. D. 2005. Computation of phase equi-libria by linear programming: A tool for geodynamicmodeling and its application to subduction zone decar-bonation. Earth and Planetary Science Letters, 236,524–541.
Connolly, J. A. D. & Kerrick, D. M. 2002. Metamorphiccontrols on seismic velocity of subducted oceanic crustat 100–250 km depth. Earth and Planetary ScienceLetters, 204, 61–74.
Contrucci, I., Matias, L. et al. 2004. Deep struc-ture of the West African continental margin (Congo,
3D MICROSTRUCTURAL ANALYSIS OF SOUTHERN ALPS AMPHIBOLITE

1103110411051106110711081109111011111112111311141115111611171118111911201121112211231124112511261127112811291130113111321133113411351136113711381139114011411142114311441145114611471148114911501151115211531154115511561157115811591160
Zaire, Angola), between 5 S and 8 S, from reflection/refraction seismics and gravity data. GeophysicalJournal International, 158, 529–553.
Dale, J., Holland, T. & Powell, R. 2000. Hornblende-garnet-plagioclase thermobarometry: a natural assem-blage calibration of the thermodynamics of hornble-nde. Contributions to Mineralogy and Petrology,140, 353–362.
Giobbi Mancini, E., Boriani, A. & Villa, I. 2003. Pre-Alpine ophiolites in the basement of southern Alps; thepresence of a bimodal association (LAG-Leptyno-Amphibolitic Group) in the Serie dei Laghi (N-Italy,Ticino-CH). Rendiconti Fisica Accademia dei Lincei,9, 79–99.
Handy, M. R. 1987. The structure, age and kinemat-ics of the Pogallo fault zone; southern Alps, north-western Italy. Eclogae Geologicae Helvetiae, 80,593–632.
Handy, M. R., Franz, L., Heller, F., Janott, B. &Zurbriggen, R. 1999. Multistage accretion and exhu-mation of the continental crust (Ivrea crust section,Italy and Switzerland). Tectonics, 18, 1154–1177.
Handy, M. R., Schmid, S., Bousquet, R., Kissling, E. &Bernoulli, D. 2010. Reconciling plate-tectonicreconstructions of Alpine Tethys with the geologi-cal–geophysical record of spreading and subductionin the Alps. Earth-Science Reviews, 102, 121–158.
Henk, A., Franz, L., Teufel, S. & Oncken, O. 1997.Magmatic underplating, extension, and crustal reequi-libration: insights from a cross section through theIvrea zone and Strona–Ceneri zone, Northern Italy.Journal of Geology, 105, 367–377.
Hill, R. 1952. The elastic behaviour of a crystalline aggre-gate. Proceedings of the Physical Society of London,65, 351–354.
Hirsch, K. K., Bauer, K. & Scheck-Wenderoth, M.2009. Deep structure of the western South Africanpassive margin – results of a combined approach ofseismic, gravity and isostatic investigations. Tectono-physics, 470, 57–70.
Holland, T. J. B. & Powell, R. 1998. An internally con-sistent thermodynamic data set for phases of petrologi-cal interest. Journal of Metamorphic Geology, 16,309–344.
Ismaıl, W. B. & Mainprice, D. 1998. An olivine fabricdatabase: an overview of upper mantle fabrics andseismic anisotropy. Tectonophysics, 296, 145–157.
Ji, S. & Long, C. 2006. Seismic reflection response offolded structures and implications for the interpretationof deep seismic reflection profiles. Journal of Struc-tural Geology, 28, 1380–1387.
Ji, S. & Mainprice, D. 1990. Recrystallization and fabricdevelopment in plagioclase. Journal of GeologyJournal of Geology, 98, 65–79.
Ji, S. & Xia, B. 2002. Rheology of Polyphase Earth Mate-rials. Polytechnic International Press, Canada, 260 pp.
Karato, S. 2008. Deformation of Earth Materials: AnIntroduction to the Rheology of Solid Earth. Cam-bridge University Press, Cambridge.
Kern, H., Burlini, L. & Ashchepkov, I. V. 1996. Fabric-related seismic anisotropy in upper-mantle xenoliths:evidence from measurements and calculations.Physics of the Earth and Planetary Interiors, 95,195–209.
Kern, H., Mengel, K., Strauss, K. W., Ivankina, T. I.,Nikitin, A. N. & Kukkonen, I. T. 2009. Elastic wavevelocities, chemistry and modal mineralogy of crustalrocks sampled by the Outokumpu scientific drillhole: evidence from lab measurements and modeling.Physics of the Earth and Planetary Interiors, 175,151–166.
Khazanehdari, J., Rutter, E. H. & Brodie, K. H. 2000.High-pressure-high-temperature seismic velocity struc-ture of the midcrustal and lower crustal rocks of theIvrea-Verbano zone and Serie dei Laghi, NW Italy.Journal of Geophysical Research, 105, 13.
Kitamura, K. 2006. Constraint of lattice-preferredorientation (LPO) on Vp anisotropy of amphibole-rich rocks. Geophysical Journal International, 165,1058–1065.
Lentini, M. R., Fraser, S. I., Sumner, H. S. & Davies, R.J. 2010. Geodynamics of the central South Atlanticconjugate margins: implications for hydrocarbonpotential. Petroleum Geoscience, 16, 217–229.
Liang, L., Rinaldi, R. & Schober, H. 2008. NeutronApplications in Earth, Energy and EnvironmentalSciences. Springer-Verlag, New York, USA.
Lloyd, G. E., Butler, R. W. H., Casey, M., Tatham, D.J. & Mainprice, D. 2011a. Constraints on the seis-mic properties of the middle and lower continentalcrust. Prior, D. J., Rutter, E. H. & Tatham, D. J.(eds) Deformation Mechanisms, Rheology and Tec-tonics: Microstructures, Mechanics and Anisotropy.Geological Society, London, Special Publications,360, 7–32.
Lloyd, G. E., Halliday, J. M., Butler, R. W. H., Casey,M., Kendall, J.-M., Wookey, J. & Mainprice, D.2011b. From crystal to crustal: petrofabric-derivedseismic modelling of regional tectonics. In: Prior,D. J., Rutter, E. H. & Tatham, D. J. (eds) Defor-mation Mechanisms, Rheology and Tectonics: Micro-structures, Mechanics and Anisotropy. GeologicalSociety, London, Special Publications, 360, 49–78.
Lutterotti, L., Matthies, S. & Wenk, H. R. 1999.MAUD (Material Analysis Using Diffraction): a userfriendly Java program for Rietveld Texture Analysisand more. Proceedings of the Twelfth InternationalConference on Textures of Materials (ICOTOM-12),2, 1599.
Luvizotto, G. L. & Zack, T. 2009. Nb and Zr behavior inrutile during high-grade metamorphism and retrogres-sion: an example from the Ivrea–Verbano Zone.Chemical Geology, 261, 303–317.
Mainprice, D. 1990. A FORTRAN program to calculateseismic anisotropy from the lattice preferred orien-tation of minerals. Computers & Geosciences, 16,385–393.
Mainprice, D. & Nicolas, A. 1989. Development ofshape and lattice preferred orientations: Applicationto the seismic anisotropy of the lower crust. Journalof Structural Geology, 11, 391–398.
Mainprice, D., Silver, P. G. & Nicolas, A. 1993.Seismic anisotropy in the mantle from petrofabrics.Eos Transactions of American Geophysical Union,74, 203.
Mainprice, D., Hielscher, R. & Schaeben, H. 2011.Calculating anisotropic physical properties fromtexture data using the MTEX open-source package.
M. ZUCALI ET AL.

1161116211631164116511661167116811691170117111721173117411751176117711781179118011811182118311841185118611871188118911901191119211931194119511961197119811991200120112021203120412051206120712081209121012111212121312141215121612171218
In: Prior, D. J., Rutter, E. H. & Tatham, D. J. (eds)Deformation Mechanisms, Rheology and Tectonics:Microstructures, Mechanics and Anisotropy. Geologi-cal Society, London, Special Publications, 360,175–192.
Matthies, S. & Vinel, G. W. 1982. On the reproductionof the orientation distribution function of texturedsamples from reduced pole figures using the conceptof ghost correction. Physica Status Solidi (a), 112,K111–K114.
Mazzucchelli, M., Zanetti, A., Rivalenti, G., Van-nucci, R., Correia, C. T. & Tassinari, C. C. G.2010. Age and geochemistry of mantle peridotitesand diorite dykes from the Baldissero body: insightsinto the Paleozoic–Mesozoic evolution of the South-ern Alps. Lithos, 119, 485–500.
Meissner, R., Rabbel, W. & Kern, H. 2006. Seismiclamination and anisotropy of the lower continentalcrust. Tectonophysics, 416, 81–99.
Muttoni, G., Kent, D. V., Garzanti, E., Brack, P.,Abrahamsen, N. & Gaetani, M. 2003. EarlyPermian Pangea ‘B’ to Late Permian Pangea ‘A’.Earth and Planetary Science Letters, 215, 379–394.
Newton, R. C., Charlu, T. V. & Kleppa, O. J. 1980.Thermochemistry of the high structural state plagio-clases. Geochimica et Cosmochimica Acta, 44,933–941.
Outlaw, R. K., Erickson, R. C. & Deibert, J. 2000. Pet-rology of a meta-anorthositic gabbro block, FranciscanComplex, Sonoma County, California GeologicalSociety of America. In: Weigand, P. W. & Shelle-barger, J. (eds) Cordilleran Section, 97th AnnualMeeting; AAPG Pacific Section, Annual Meeting. Geo-logical Society of America (GSA). Boulder, CO,United States.
Passchier, C. W. & Trouw, R. A. J. , 2005. Microtec-tonics. Springer, Germany.
Peressini, G., Quick, J. E., Sinigoi, S., Hofmann, A. W.& Fanning, M. 2007. Duration of a large maficintrusion and heat transfer in the lower crust: aSHRIMP U–Pb zircon study in the Ivrea–VerbanoZone (Western Alps, Italy). Journal of Petrology, 48,1185.
Quick, J. E., Sinigoi, S. & Mayer, A. 1994. Emplacementdynamics of a large mafic intrusion in the lower crust,Ivrea–Verbano Zone, Northern Italy. Journal ofGeophysical Research, 99, 21 559–21 573.
Quick, J. E., Sinigoi, S. & Mayer, A. 1995. Emplacementof mantle peridotite in the lower continental crust,Ivrea-Verbano zone, northwest Italy. Geology, 23,739–742.
Rabbel, W. & Mooney, W. D. 1996. Seismic anisotropyof the crystalline crust: what does it tell us? TerraNova, 8, 16–21.
Rivalenti, G., Garuti, G., Rossi, A., Siena, F. &Sinigoi, S. 1981. Existence of different peridotitetypes and of a layered igneous complex in the Ivreazone of the Western Alps. Journal of Petrology, 22,127–153.
Rudnick, R. L. & Fountain, D. M. 1995. Nature andcomposition of the continental crust: a lower crustalperspective. Reviews of Geophysics, 33, 267–309.
Rudnick, R. L. & Gao, S. 2003. Composition of the con-tinental crust. Treatise on Geochemistry, 3, 1–64.
Rutter, E., Khazanehdari, J., Brodie, K. H.,Blundell, D. J. & Waltham, D. A. 1999. Syntheticseismic reflection profile through the Ivrea Zone-Serie dei Laghi continental crustal section, northwes-tern Italy. Geology (Boulder), 27, 79–82.
Rutter, E., Brodie, K., James, T. & Burlini, L. 2007.Large-scale folding in the upper part of the Ivrea-Verbano zone, NW Italy. Journal of StructuralGeology, 29, 1–17.
Sakata, M., Uno, T., Takata, M. & Howard, C. J. 1993.Maximum-entropy-method analysis of neutron diffrac-tion data. Journal of Applied Crystallography, 26,159–165.
Shigematsu, N. & Tanaka, H. 1999. Dislocation creepof fine-grained recrystallized plagioclase under low-temperature conditions. Journal of Structural Geology,22, 65–79.
Siegesmund, S., Takeshita, T. & Kern, H. 1989. Aniso-tropy of Vp and Vs in an amphibolite of the deepercrust and its relationship to the mineralogical, micro-structural and textural characteristics of the rock.Tectonophysics, 157, 25–38.
Spalla, M. I. & Marotta, A. M. 2007. P-T evolu-tions v. numerical modelling: a key to unravel thePaleozoic to early-Mesozoic tectonic evolutionof the Alpine area. Periodico di Mineralogia, 76,267–308.
Spalla, M. I., Siletto, G. B., Di Paola, S. & Gosso, G.2000. The role of structural and metamorphic memoryin the distinction of tectono-metamorphic units: thebasement of the Como lake in the Southern Alps.Journal of Geodynamics, 30, 191–204.
Spalla, M. I., Zucali, M., Di Paola, S. & Gosso, G.2005. A critical assessment of the tectono-thermalmemory of rocks and definition of the tectonometa-morphic units: evidence from fabric and degree ofmetamorphic transformations. In: Gapais, D., Brun,J. P. & Cobbold, P. (eds) Deformation Mechanisms,Rheology and Tectonics: from Minerals to the Litho-sphere. Geological Society, London, Special Publi-cations, 243, 227–247.
Spalla, M. I., Gosso, G., Marotta, A. M., Zucali, M. &Salvi, F. 2010. Analysis of natural tectonic systemscoupled with numerical modelling of the polycycliccontinental lithosphere of the Alps. InternationalGeology Review, 52, 1268–1302.
Stampfli, G. M. & Borel, G. D. 2002. A plate tectonicmodel for the Paleozoic and Mesozoic constrained bydynamic plate boundaries and restored syntheticoceanic isochrons. Earth and Planetary ScienceLetters, 196, 17–33.
Tartarotti, P., Zucali, M., Panseri, M., Lissandrelli,S., Capelli, S. & Ouladdiaf, B. 2011. Mantle originof the Antrona serpentinites (Antrona ophiolite,Pennine Alps) as inferred from microstructural, micro-chemical, and neutron diffraction quantitative textureanalysis. Ofioliti, 36, 167–189.
Tatham, D. J., Lloyd, G. E., Butler, R. W. H. & Casey,M. 2008. Amphibole and lower crustal seismic pro-perties. Earth and Planetary Science Letters, 267,118–128.
Tommasi, A., Gilbert, B., Seipold, U. & Mainprice, D.2001. Anisotropy of thermal diffusivity in the uppermantle. Nature, 411, 783–786.
3D MICROSTRUCTURAL ANALYSIS OF SOUTHERN ALPS AMPHIBOLITE

1219122012211222122312241225122612271228122912301231123212331234123512361237123812391240124112421243124412451246124712481249125012511252125312541255125612571258125912601261126212631264126512661267126812691270127112721273127412751276
Turner, F. J. & Weiss, L. E. 1963. Structural Analysis ofMetamorphic Tectonites. MacGraw-Hill, New York.
Vavra, G., Schmid, R. & Gebauer, D. 1999. Internal mor-phology, habit and U–Th–Pb microanalysis of amphi-bolite-to-granulite facies zircons: geochronology ofthe Ivrea Zone (Southern Alps). Contributions toMineralogy and Petrology, 134, 380–404.
Voltolini, M., Zandomeneghi, D., Mancini, L. &Polacci, M. 2011. Texture analysis of volcanic rocksamples: quantitative study of crystals and vesiclesshape preferred orientation from X-ray microtomogra-phy data. Journal of Volcanology and GeothermalResearch, 202, 83–95.
Wenk, H. R. 2006. Neutron diffraction texture analy-sis. In: Wenk, R. (ed.) Neutron Scattering in EarthSciences, Reviews in Mineralogy and Geochemis-try. Mineralogical Society of America, USA, 63,399–426.
Wenk, H. R., Matthies, S., Donovan, J. & Chateigner,D. 1998. Beartex: a Windows-based program systemfor quantitative texture analysis. Journal of AppliedCrystallography, 31, 262–269.
White, R. W., Powell, R. & Holland, T. J. B. 2001.Calculation of partial melting equilibria in the systemNa2O–CaO–K2O–FeO–MgO–Al2O3–SiO2–H2O(NCKFMASH). Journal of Metamorphic Geology, 19,139–153.
Wolff, R., Dunkl, I., Kiesselbach, G., Wemmer, K. &Siegesmund, S. 2012. Thermochronological con-straints on the multiphase exhumation history of theIvrea-Verbano Zone of the Southern Alps. Tectonophy-sics, 579, 104–117.
Zingg, A. 1983. The Ivrea and Strona Ceneri zones(Southern Alps, Ticino and Northern Italy): a review.
Schweizerische Mineralogische petrographische Mit-teilungen, 63, 361–392.
Zucali, M., Chateigner, D., Dugnani, M., Lutterotti,L. & Ouladdiaf, B. 2002. Quantitative texture ana-lysis of naturally deformed hornblendite under eclogitefacies conditions (Sesia-Lanzo Zone, Western Alps):comparison between x-ray and neutron diffractionanalysis. In: De Meer, S., Drury, M. R., DeBresser, J. H. P. & Pennock, G. M. (eds) DeformationMechanisms, Rheology and Tectonics: Current Statusand Future Perspectives, Geological Society, London,Special Publications, 200, 239–253.
Zucali, M., Barberini, V., Chateigner, D., Oulad-diaf, B. & Lutterotti, L. 2010. Brittle plus plasticdeformation of gypsum aggregates experimentallydeformed in torsion to high strains: quantitative micro-structural and texture analysis from optical and dif-fraction data. In: Spalla, M. I., Marotta, A. M. &Gosso, G. (eds) Advances in Interpretation of Geo-logical Processes: Refinement of Multi-scale Dataand Integration in Numerical Modelling. GeologicalSociety, London, Special Publications, 332, 79–98.
Zucali, M., Tartarotti, P., Capelli, S. & Ouladdiaf,B. 2012. Multiscalar structural study of the ultramaficrocks of the Antrona ophiolite (Pennine Alps).Journal of the Virtual Explorer, 41, 4.
Zucali, M., Voltolini, M., Ouladdiaf, B., Mancini, L.& Chateigner, D. 2014. The 3D quantitative latticeand shape preferred orientation of a mylonitised meta-granite from Monte Rosa (Western Alps): combiningneutron diffraction texture analysis and synchrotronX-ray microtomography. Journal of Structural Geol-ogy, 63, 91–105, http://dx.doi.org/10.1016/j.jsg.2014.02.011
M. ZUCALI ET AL.