Scaling and geometric properties of extensional fracture systems in the proterozoic basement of...
18
Scaling and geometric properties of extensional fracture systems in the proterozoic basement of Yemen. Tectonic interpretation and uid ow implications Edouard Le Garzic a, * , Thibaut de L’Hamaide b , Marc Diraison a , Yves Géraud a , Judith Sausse c , Marc de Urreiztieta d, e , Benoît Hauville d , Jean-Michel Champanhet d a Institut de Physique du Globe de Strasbourg, IPGS e UMR 7516, CNRS et Université de Strasbourg (EOST), 1 rue Blessig, 67084 Strasbourg Cedex, France b TTI Production, 2 avenue P. Angot, Technopole Helioparc, 64000 Pau, France c Nancy Université, Département des Sciences de la Terre, UMR CNRS 7566 G2R, BP239, 54506 Vandoeuvre les Nancy, France d Total E&P Yemen, P.O. Box 842, Sana’a, Republic of Yemen e Petronas Carigali SDN. BHD., Petronas Twin Towers, Kuala Lumpur City Centre 50088, Malaysia article info Article history: Received 19 July 2010 Received in revised form 21 January 2011 Accepted 28 January 2011 Available online 4 February 2011 Keywords: Crystalline basement Fractured reservoir Distribution law Hierarchical fault zones geometry Dual porosity model Fluid ow abstract Multi-scale mappings of fracture systems in the crystalline basement of Yemen are presented. Fracture datasets are described through statistical analyses of direction, length, spacing, density, and spatial distribution. Results are combined with eld observations and can be directly used to model the geometry of the fracture networks in analog basement rocks, from multi-kilometric to decametric scales. The fractured reservoir analog is dened with a dual porosity model in which tectonic and joint systems correspond to the basement reservoir “backbone” and “matrix” respectively. These two end-members reveal contrasting geometrical, reservoir, and scaling properties. In tectonic systems, multi-scale geometries are “self-similar”, the fracture network shows fractal behavior (power-law length distribution and clustered spacing), and fault zones show hierarchical organization of geometrical parameters such as length, thickness, and spacing. In joint systems, the fracture network is scale dependent with exponential length distribution, and shows anti-clustered spacing. However, these two end-members have both well- connected properties, with fault zones acting as main drain and joint systems acting as the uid supply. Ó 2011 Elsevier Ltd. All rights reserved. 1. Introduction Recent development of basement fractured reservoirs “in and around igneous rocks” for both oil exploration and geothermal industries have been carried out in recent years (Schutter, 2003). The nature of basement fractured reservoirs implies different exploration and production strategies compared with conventional sedimentary ones. Most of the time, available data are restricted to multiple 1-D datasets (i.e. borehole data including cores, Formation MicroImager (FMI), wireline.) that are difcult to correlate from well to well when attempting to construct a realistic 3-D model of reservoir. Analyses of eld rock analogs are thus required for a better under- standing of the fracture system geometry. The nature and evolution of the fracture systems have direct inuences on the uid ow pathways in low permeability crystalline rocks. As a consequence, the geometrical attributes characterizing the fracture systems such as orientation, length, spacing, spatial distribution and connectivity have to be well constrained. A key point is the correct understanding of the scaling characteristics of different types of fracture systems, which could guide both the interpretation of regional data and its extrapolation to other different scales. In addition, quantitative characterization of the spatial distribution of fault zones are needed to better understand hierarchical organization of structural blocks and the role of fault zones in compartmentalizing elds. The characterization of fractured basements, particularly in crystalline rocks, remains poorly documented by eld examples. However, some authors such as Genter and Castaing (1997), Escuder Viruete et al. (2001), McCaffrey et al. (2003) and Sanders et al. (2003) have proposed statistical descriptions of natural fracture networks occurring in various environments. Several parameters were studied, mainly the spacing, the fault zone thickness and the length distributions of fractures. Velde et al. (1991) characterized the fractal distribution of fracture patterns in granites. Gillespie et al. (1993) compared different types of statistical and geometrical methods for the characterization of the spatial distribution of fractures in 1, 2 and 3D. Other contributions based on natural fracture set studies in * Corresponding author. Fax: þ33 3 68 85 04 02. E-mail address: [email protected] (E. Le Garzic). Contents lists available at ScienceDirect Journal of Structural Geology journal homepage: www.elsevier.com/locate/jsg 0191-8141/$ e see front matter Ó 2011 Elsevier Ltd. All rights reserved. doi:10.1016/j.jsg.2011.01.012 Journal of Structural Geology 33 (2011) 519e536
-
Upload
independent -
Category
Documents
-
view
4 -
download
0
Transcript of Scaling and geometric properties of extensional fracture systems in the proterozoic basement of...
Scaling and geometric properties of extensional fracture systems in theproterozoic basement of Yemen. Tectonic interpretation and !uid !owimplications
Edouard Le Garzic a,*, Thibaut de L’Hamaide b, Marc Diraison a, Yves Géraud a, Judith Sausse c,Marc de Urreiztieta d,e, Benoît Hauville d, Jean-Michel Champanhet da Institut de Physique du Globe de Strasbourg, IPGS e UMR 7516, CNRS et Université de Strasbourg (EOST), 1 rue Blessig, 67084 Strasbourg Cedex, Franceb TTI Production, 2 avenue P. Angot, Technopole Helioparc, 64000 Pau, FrancecNancy Université, Département des Sciences de la Terre, UMR CNRS 7566 G2R, BP239, 54506 Vandoeuvre les Nancy, Franced Total E&P Yemen, P.O. Box 842, Sana’a, Republic of Yemene Petronas Carigali SDN. BHD., Petronas Twin Towers, Kuala Lumpur City Centre 50088, Malaysia
a r t i c l e i n f o
Article history:Received 19 July 2010Received in revised form21 January 2011Accepted 28 January 2011Available online 4 February 2011
Keywords:Crystalline basementFractured reservoirDistribution lawHierarchical fault zones geometryDual porosity modelFluid !ow
a b s t r a c t
Multi-scale mappings of fracture systems in the crystalline basement of Yemen are presented. Fracturedatasets are described through statistical analyses of direction, length, spacing, density, and spatialdistribution. Results are combined with "eld observations and can be directly used to model thegeometry of the fracture networks in analog basement rocks, from multi-kilometric to decametric scales.The fractured reservoir analog is de"ned with a dual porosity model in which tectonic and joint systemscorrespond to the basement reservoir “backbone” and “matrix” respectively. These two end-membersreveal contrasting geometrical, reservoir, and scaling properties. In tectonic systems, multi-scalegeometries are “self-similar”, the fracture network shows fractal behavior (power-law length distributionand clustered spacing), and fault zones show hierarchical organization of geometrical parameters such aslength, thickness, and spacing. In joint systems, the fracture network is scale dependent with exponentiallength distribution, and shows anti-clustered spacing. However, these two end-members have both well-connected properties, with fault zones acting as main drain and joint systems acting as the !uid supply.
! 2011 Elsevier Ltd. All rights reserved.
1. Introduction
Recent development of basement fractured reservoirs “in andaround igneous rocks” for both oil exploration and geothermalindustries have been carried out in recent years (Schutter, 2003). Thenature of basement fractured reservoirs implies different explorationand production strategies compared with conventional sedimentaryones. Most of the time, available data are restricted to multiple 1-Ddatasets (i.e. borehole data including cores, Formation MicroImager(FMI), wireline.) that are dif"cult to correlate from well to wellwhen attempting to construct a realistic 3-D model of reservoir.Analyses of "eld rock analogs are thus required for a better under-standing of the fracture system geometry. The nature and evolutionof the fracture systems have direct in!uences on the !uid !owpathways in low permeability crystalline rocks. As a consequence,the geometrical attributes characterizing the fracture systems such
as orientation, length, spacing, spatial distribution and connectivityhave to bewell constrained. A key point is the correct understandingof the scaling characteristics of different types of fracture systems,which could guide both the interpretation of regional data and itsextrapolation to other different scales. In addition, quantitativecharacterization of the spatial distribution of fault zones are neededto better understand hierarchical organization of structural blocksand the role of fault zones in compartmentalizing "elds.
The characterization of fractured basements, particularly incrystalline rocks, remains poorly documented by "eld examples.However, some authors such as Genter and Castaing (1997), EscuderViruete et al. (2001), McCaffrey et al. (2003) and Sanders et al. (2003)have proposed statistical descriptions of natural fracture networksoccurring in various environments. Several parameters werestudied, mainly the spacing, the fault zone thickness and the lengthdistributions of fractures. Velde et al. (1991) characterized the fractaldistribution of fracture patterns in granites. Gillespie et al. (1993)compared different types of statistical and geometrical methodsfor the characterization of the spatial distribution of fractures in 1, 2and 3D. Other contributions based on natural fracture set studies in
* Corresponding author. Fax: !33 3 68 85 04 02.E-mail address: [email protected] (E. Le Garzic).
Contents lists available at ScienceDirect
Journal of Structural Geology
journal homepage: www.elsevier .com/locate/ jsg
0191-8141/$ e see front matter ! 2011 Elsevier Ltd. All rights reserved.doi:10.1016/j.jsg.2011.01.012
Journal of Structural Geology 33 (2011) 519e536
granites show that the connectivity of the fracture systems is char-acterized by a statistical law deduced from the fracture extensiondistributions and the fact that !uids follow preferential pathwayswithin a fracture network (Long and Witherspoon, 1985; Ledésertet al., 1993a, 1993b; Bour and Davy, 1997; Bour et al., 2002). Anumber of laws are commonly cited to characterize the statisticaldistribution of a fault zone property, as well as the type of rockfragmentation, its development and its maturity. Generally, log-normal, exponential negative or power-law distributions prevail inthe literature (Bonnet et al., 2001).
In this study, the scaling properties of an extensional fracturesystem from the proterozoic basement of Yemen are described forscale studies from meters to pluri-kilometers. The statistical prop-erties of the fracture network are described through series of frac-ture trace maps at different scales that are derived from satelliteimagery interpretation combined with "eld observations. In a "rststep, inspection of structural maps combined with statistical anal-yses allows us to propose a tectonic model for formation of eachfracture set. In a second step, a multi-scale model of the fracturenetwork is proposed and discussed. These results provide insightsconcerning the mechanisms of fracture formation, !uid movementthrough the fracture network and reactivation of pre-existing frac-ture systems. Two types of fracture organization are proposed: somemajor fault zone network and somemicro-block fracture systems are"nally discussed and extrapolated to the reservoir-scale.
2. Regional settings
The present con"guration of the Arabian-Nubian Shield resultsfrom the accretion of low-grade island arcs terranes and high-gradecontinental terranes during the Pan-African orogeny (Fig. 1). Thesecollision events occurred from w750 to w600 Ma (Stoeser andCamp, 1985; Al-Saleh et al., 1998; Blasband et al., 2000; Meert,2003), and gave rise to NeS to NEeSW trending suture zones(Fig. 1). The "nal stage of the Pan-African orogeny is characterizedby a widespread phase of NWeSE extension and by the develop-ment of lithospheric NWeSE trending faults with left-lateral strike-slip, named the Nadj Fault system (Fig. 1).
At the end of the Jurassic and the beginning of the Cretaceous,separation between India-Madagascar plate and African-Arabianmargin (i.e. Somoma Ocean opening) induced reactivation of theinherited Nadj Fault system and development of extensive basins(Redfern and Jones, 1995; Birse et al., 1997). The three major Jurassicand Cretaceous extensive basins of Yemen, fromWest to East, are theMarib-Shabwah-Hajar basin, the Say’unAlMasilahbasin and the Jiza-Qamar basin (Fig. 1). The geometry and sedimentary "lling of theseMesozoic basins vary spatially and temporally from West to East(Bosence, 1997). The Marib-Shabwah-Hajar basin, with the mainstrike NWeSE, follows the Nadj trend of the Precambrian basement(Redfern and Jones, 1995; Birse et al., 1997), and its syn-rift "lling isearly Kimmeridgian to Thitonian in age (Ellis et al., 1996; Holden andKerr, 1997). Toward the East, Say’un Al Masilah basin and Jiza-QamarbasinareprogressivelyorientedmoreEast-West, and rifting initiationbecomesyounger,withKimmeridgian toearlyCretaceous subsidencefor the Say’un Al Masilah basin, and with Hauterivian to Paleogenesubsidence for Jiza-Qamar basin (Redfern and Jones, 1995; Beydounet al., 1996; Bosence, 1997).
Theopeningof theGulf ofAdenwas the latestmajor tectonic eventoccurring in the studied area. It is a young oceanic basin locatedbetween theArabianand theNubia-Somaliaplate (Fig.1). Itsprincipalcharacteristic is the low angle between the general axis rift orienta-tion (N075"E) and spreading direction (N030"E). These features areconsistent with an oblique rifting con"guration (Manighetti et al.,1997; Dauteuil et al., 2001). Syn-rift "lling recorded along thenorthernmarginwasdepositedbetween35Maand20Ma(Watchorn
et al., 1998), while spreading started at 17,6 Ma (Leroy et al., 2004;d’Acremont et al., 2006). Onshore structures related to the openingof Gulf of Aden are complex. Several basins oriented parallel to thecoast (wN075"E) were formed during the Oligocene, and the twomajor ones are the Aden-Abyan and Mukalla-Sayhut basins (Fig. 1).Oligocene extension was also intensively controlled by the reac-tivation of pre-existing structures related to Mesozoic basins(Khanbari, 2000;Huchon andKhanbari, 2003; Bellahsen et al., 2006).The Bahlaf graben, in prolongation of the Marib-Shabwah-Hajarbasin, and the Jiza-Qamar basin are major reactivating structures ofthe Yemenmargin (Brannan et al., 1997; Huchon and Khanbari, 2003and references therein).
3. Zone of study
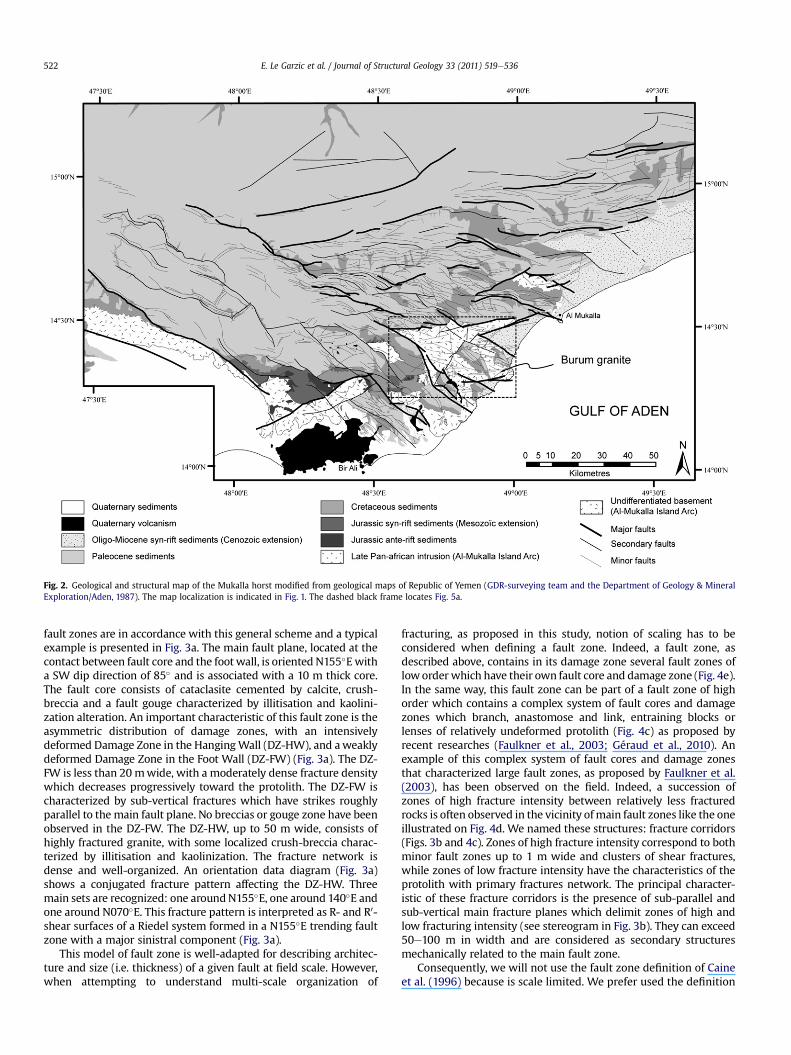
The Mukalla proterozoic basement is located in the south-eastedge of the Mukalla horst, in the linking zone between the Marib-Shabwah-Hajar basin and the Mukalla-Sayut basin (Fig. 1).A geological map of the Mukalla basement area (Fig. 2) was con-structed by integration of existing maps (GDR-surveying team andthe Department of Geology & Mineral Exploration/Aden, 1987), anexisting "eld study (Huchon and Khanbari, 2003), our own "eldsurvey, a satellite imagery interpretation (Aster and Landsat) anda Digital Elevation Model (DEM) interpretation (SRTM 90 m). Thebasement area chosen for satellite analysis is located in the centralzone of this map and is bounded by EeW and NWeSE trendingregional fault zones (Fig. 2).
The Mukalla basement corresponds to a volcano-sedimentarycomplex which is mainly composed of basic rocks related to a back-arc basin system. This volcano-sedimentary complex (undifferen-tiated basement on Fig. 2) is intruded by several late Pan-Africangranitoids, as the Burum granite. Detailed structural analysis wasfocused on this Burum granite because granite texture "ts muchbetter than a complex association of volcanic and sedimentaryrocks to the structural map produced by satellite imagery analysis.
4. Terminology and typology of structures observed in the!eld
A fracture is an approximately planar discontinuity such as joints,faults, dykes or veins (Peacock et al., 2000). For the purpose of thisstudy, we have classi"ed fractures into two main groups: primaryand secondary fractures. On the one hand, we consider primaryfractures as all discontinuities developed during emplacement,cooling and decompression of themagma (Price and Cosgrove,1990;Sanders et al., 2003), like joints, diaclases or aplitic/pegmatitic dykes.On the other hand, secondary fractures result from tectonic forcesand correspond to faults and related fractures. In order to clarifydescription and interpretation of structures through thismanuscript,all the terms used in this paper are each described in this section.De"nitions and descriptions of terms such as joint, fault zone,damage zone or fracture corridor are based on published data andown "eld observations realized in the Burum granite.
4.1. Primary fractures and protolith concept
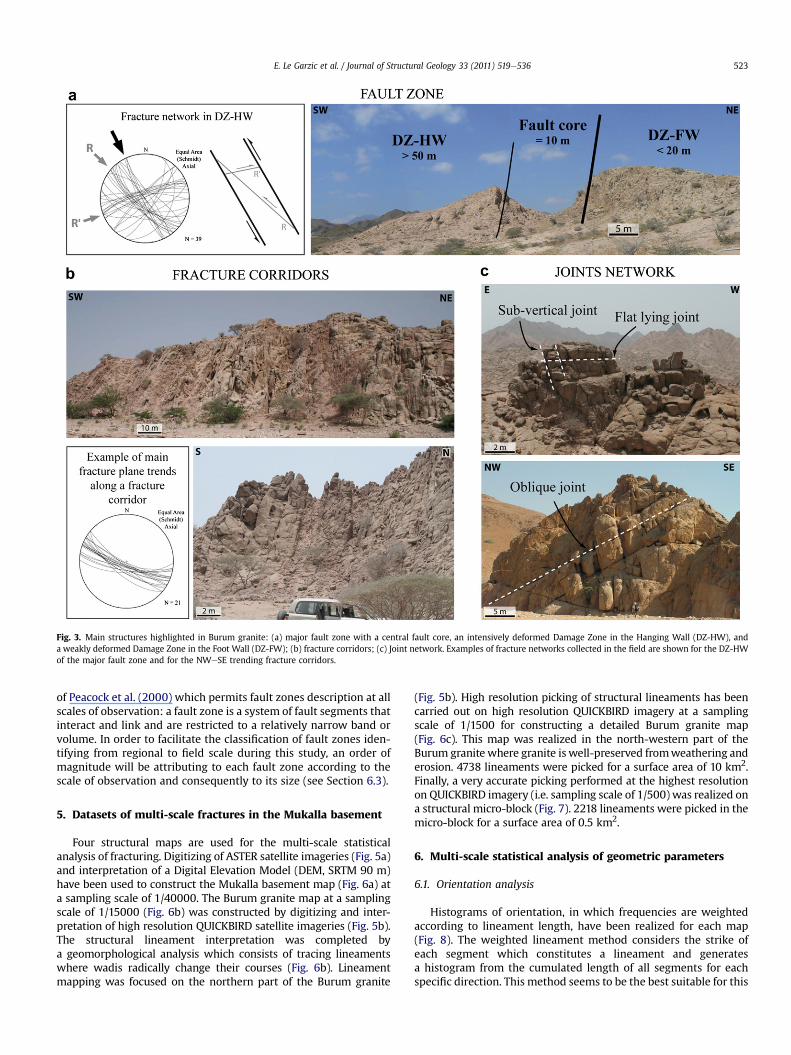
Primary fractures are fractures formed during emplacement,cooling and decompression of the magma in the upper crust. Thesestructures are predominant outside the main deformation zonesand consist of several typical sets of joints: !at-lying joints, sub-vertical orthogonal joints sets, and another joint set often obliquewith a dip angle near 45" (Fig. 3c). Each set rarely presents clustersof fractures and is mostly regularly or randomly spaced. In theBurum granite, these sets are often unmineralized even if aplitic orpegmatitic veins are sometimes observed. The primary fractures
E. Le Garzic et al. / Journal of Structural Geology 33 (2011) 519e536520
are predominantly dilational fractures (or type I fracture) even ifminor shear component is sometimes observed. Areas of granite,where primary fractures prevail, correspond to the protolith (Caineet al., 1996). For the sake of clarity, we will use from now the termjoint for describing primary fractures.
4.2. Secondary fractures and fault zone concept
It has become common in recent years to describe fault zones ascomprising two components (Fig. 4d): a fault core and an associ-ated damage zone (Chester et al., 1993; Caine et al., 1996). The fault
core contains slip surfaces, gouge, cataclasites and breccias, andcorresponds to the zone where most of the displacement isaccommodated. Damage zone is generally taken as the volume ofdeformed wall rocks around a fault core that results from theinitiation, propagation and build-up of slip along faults (Kim et al.,2004). Damage zone thickness corresponds to the zone withinwhich fault and fracture density is higher than the backgrounddensity (Childs et al., 2009).
This simple conceptual model for fault zone structure has beenwidely con"rmed by "eld examples (e.g. Schulz and Evans, 1998;Micarelli et al., 2003; Géraud et al., 2006). In the Burum granite,
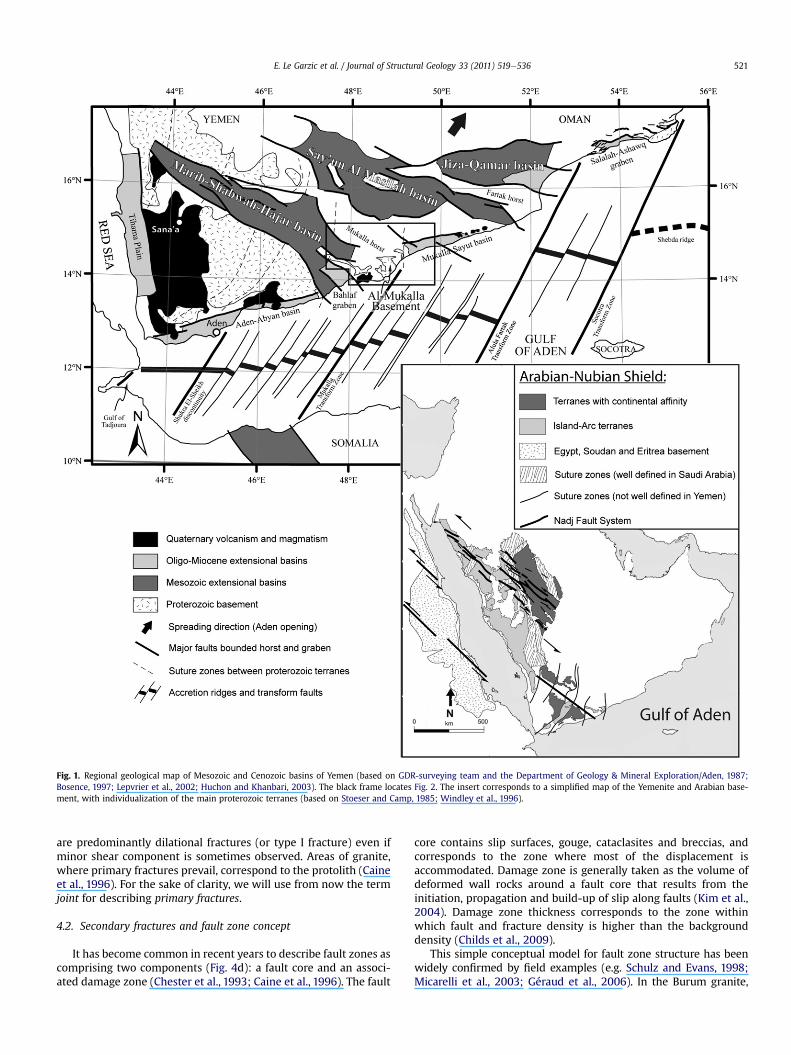
Fig. 1. Regional geological map of Mesozoic and Cenozoic basins of Yemen (based on GDR-surveying team and the Department of Geology & Mineral Exploration/Aden, 1987;Bosence, 1997; Lepvrier et al., 2002; Huchon and Khanbari, 2003). The black frame locates Fig. 2. The insert corresponds to a simpli"ed map of the Yemenite and Arabian base-ment, with individualization of the main proterozoic terranes (based on Stoeser and Camp, 1985; Windley et al., 1996).
E. Le Garzic et al. / Journal of Structural Geology 33 (2011) 519e536 521
fault zones are in accordance with this general scheme and a typicalexample is presented in Fig. 3a. The main fault plane, located at thecontact between fault core and the foot wall, is oriented N155"Ewitha SW dip direction of 85" and is associated with a 10 m thick core.The fault core consists of cataclasite cemented by calcite, crush-breccia and a fault gouge characterized by illitisation and kaolini-zation alteration. An important characteristic of this fault zone is theasymmetric distribution of damage zones, with an intensivelydeformed Damage Zone in the HangingWall (DZ-HW), and aweaklydeformed Damage Zone in the Foot Wall (DZ-FW) (Fig. 3a). The DZ-FW is less than 20 mwide, with a moderately dense fracture densitywhich decreases progressively toward the protolith. The DZ-FW ischaracterized by sub-vertical fractures which have strikes roughlyparallel to the main fault plane. No breccias or gouge zone have beenobserved in the DZ-FW. The DZ-HW, up to 50 m wide, consists ofhighly fractured granite, with some localized crush-breccia charac-terized by illitisation and kaolinization. The fracture network isdense and well-organized. An orientation data diagram (Fig. 3a)shows a conjugated fracture pattern affecting the DZ-HW. Threemain sets are recognized: one aroundN155"E, one around 140"E andone around N070"E. This fracture pattern is interpreted as R- and R0-shear surfaces of a Riedel system formed in a N155"E trending faultzone with a major sinistral component (Fig. 3a).
This model of fault zone is well-adapted for describing architec-ture and size (i.e. thickness) of a given fault at "eld scale. However,when attempting to understand multi-scale organization of
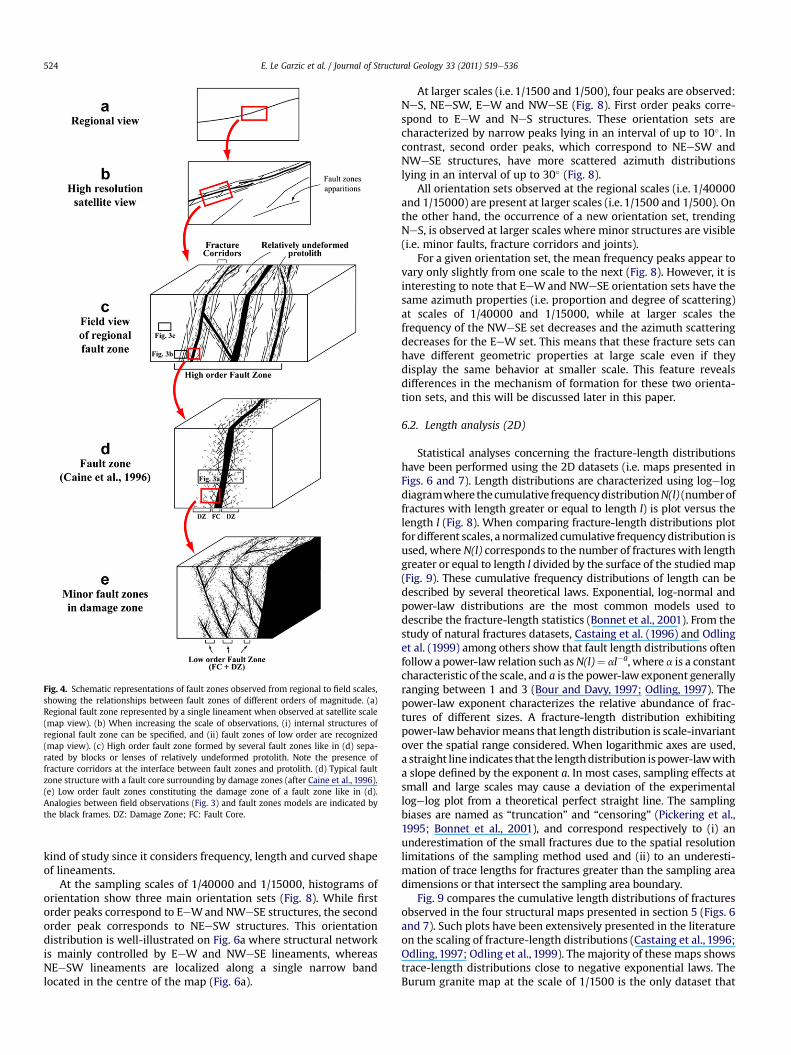
fracturing, as proposed in this study, notion of scaling has to beconsidered when de"ning a fault zone. Indeed, a fault zone, asdescribed above, contains in its damage zone several fault zones ofloworderwhich have their own fault core and damage zone (Fig. 4e).In the same way, this fault zone can be part of a fault zone of highorder which contains a complex system of fault cores and damagezones which branch, anastomose and link, entraining blocks orlenses of relatively undeformed protolith (Fig. 4c) as proposed byrecent researches (Faulkner et al., 2003; Géraud et al., 2010). Anexample of this complex system of fault cores and damage zonesthat characterized large fault zones, as proposed by Faulkner et al.(2003), has been observed on the "eld. Indeed, a succession ofzones of high fracture intensity between relatively less fracturedrocks is often observed in the vicinity ofmain fault zones like the oneillustrated on Fig. 4d. We named these structures: fracture corridors(Figs. 3b and 4c). Zones of high fracture intensity correspond to bothminor fault zones up to 1 m wide and clusters of shear fractures,while zones of low fracture intensity have the characteristics of theprotolith with primary fractures network. The principal character-istic of these fracture corridors is the presence of sub-parallel andsub-vertical main fracture planes which delimit zones of high andlow fracturing intensity (see stereogram in Fig. 3b). They can exceed50e100 m in width and are considered as secondary structuresmechanically related to the main fault zone.
Consequently, we will not use the fault zone de"nition of Caineet al. (1996) because is scale limited. We prefer used the de"nition
Fig. 2. Geological and structural map of the Mukalla horst modi"ed from geological maps of Republic of Yemen (GDR-surveying team and the Department of Geology & MineralExploration/Aden, 1987). The map localization is indicated in Fig. 1. The dashed black frame locates Fig. 5a.
E. Le Garzic et al. / Journal of Structural Geology 33 (2011) 519e536522
of Peacock et al. (2000) which permits fault zones description at allscales of observation: a fault zone is a system of fault segments thatinteract and link and are restricted to a relatively narrow band orvolume. In order to facilitate the classi"cation of fault zones iden-tifying from regional to "eld scale during this study, an order ofmagnitude will be attributing to each fault zone according to thescale of observation and consequently to its size (see Section 6.3).
5. Datasets of multi-scale fractures in the Mukalla basement
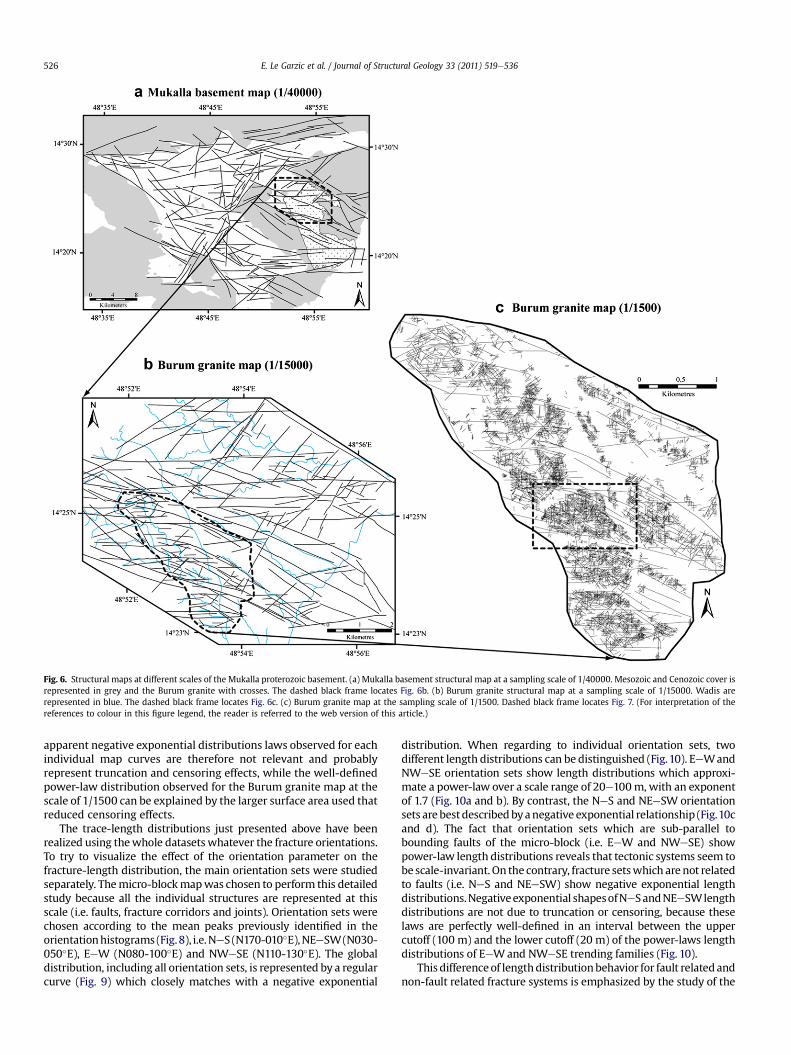
Four structural maps are used for the multi-scale statisticalanalysis of fracturing. Digitizing of ASTER satellite imageries (Fig. 5a)and interpretation of a Digital Elevation Model (DEM, SRTM 90 m)have been used to construct the Mukalla basement map (Fig. 6a) ata sampling scale of 1/40000. The Burum granite map at a samplingscale of 1/15000 (Fig. 6b) was constructed by digitizing and inter-pretation of high resolution QUICKBIRD satellite imageries (Fig. 5b).The structural lineament interpretation was completed bya geomorphological analysis which consists of tracing lineamentswhere wadis radically change their courses (Fig. 6b). Lineamentmapping was focused on the northern part of the Burum granite
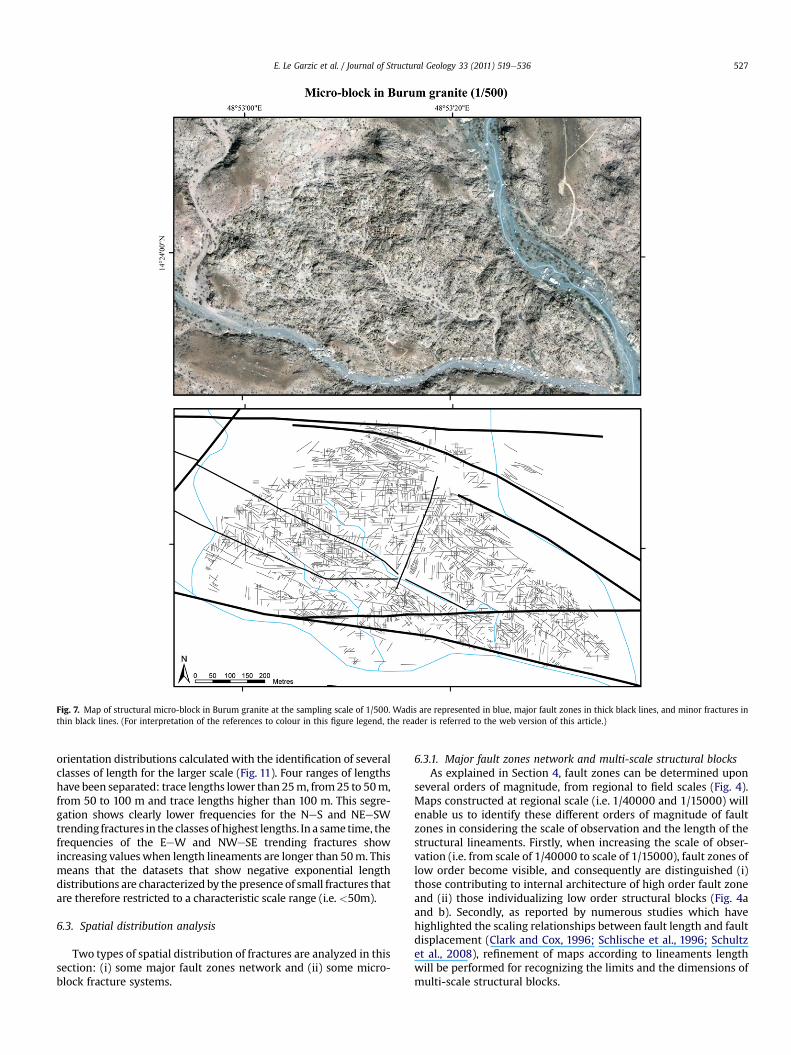
(Fig. 5b). High resolution picking of structural lineaments has beencarried out on high resolution QUICKBIRD imagery at a samplingscale of 1/1500 for constructing a detailed Burum granite map(Fig. 6c). This map was realized in the north-western part of theBurum granite where granite is well-preserved fromweathering anderosion. 4738 lineaments were picked for a surface area of 10 km2.Finally, a very accurate picking performed at the highest resolutionon QUICKBIRD imagery (i.e. sampling scale of 1/500) was realized ona structural micro-block (Fig. 7). 2218 lineaments were picked in themicro-block for a surface area of 0.5 km2.
6. Multi-scale statistical analysis of geometric parameters
6.1. Orientation analysis
Histograms of orientation, in which frequencies are weightedaccording to lineament length, have been realized for each map(Fig. 8). The weighted lineament method considers the strike ofeach segment which constitutes a lineament and generatesa histogram from the cumulated length of all segments for eachspeci"c direction. This method seems to be the best suitable for this
Fig. 3. Main structures highlighted in Burum granite: (a) major fault zone with a central fault core, an intensively deformed Damage Zone in the Hanging Wall (DZ-HW), anda weakly deformed Damage Zone in the Foot Wall (DZ-FW); (b) fracture corridors; (c) Joint network. Examples of fracture networks collected in the "eld are shown for the DZ-HWof the major fault zone and for the NWeSE trending fracture corridors.
E. Le Garzic et al. / Journal of Structural Geology 33 (2011) 519e536 523
kind of study since it considers frequency, length and curved shapeof lineaments.
At the sampling scales of 1/40000 and 1/15000, histograms oforientation show three main orientation sets (Fig. 8). While "rstorder peaks correspond to EeWand NWeSE structures, the secondorder peak corresponds to NEeSW structures. This orientationdistribution is well-illustrated on Fig. 6a where structural networkis mainly controlled by EeW and NWeSE lineaments, whereasNEeSW lineaments are localized along a single narrow bandlocated in the centre of the map (Fig. 6a).
At larger scales (i.e. 1/1500 and 1/500), four peaks are observed:NeS, NEeSW, EeW and NWeSE (Fig. 8). First order peaks corre-spond to EeW and NeS structures. These orientation sets arecharacterized by narrow peaks lying in an interval of up to 10". Incontrast, second order peaks, which correspond to NEeSW andNWeSE structures, have more scattered azimuth distributionslying in an interval of up to 30" (Fig. 8).
All orientation sets observed at the regional scales (i.e. 1/40000and 1/15000) are present at larger scales (i.e. 1/1500 and 1/500). Onthe other hand, the occurrence of a new orientation set, trendingNeS, is observed at larger scales where minor structures are visible(i.e. minor faults, fracture corridors and joints).
For a given orientation set, the mean frequency peaks appear tovary only slightly from one scale to the next (Fig. 8). However, it isinteresting to note that EeWand NWeSE orientation sets have thesame azimuth properties (i.e. proportion and degree of scattering)at scales of 1/40000 and 1/15000, while at larger scales thefrequency of the NWeSE set decreases and the azimuth scatteringdecreases for the EeW set. This means that these fracture sets canhave different geometric properties at large scale even if theydisplay the same behavior at smaller scale. This feature revealsdifferences in the mechanism of formation for these two orienta-tion sets, and this will be discussed later in this paper.
6.2. Length analysis (2D)
Statistical analyses concerning the fracture-length distributionshave been performed using the 2D datasets (i.e. maps presented inFigs. 6 and 7). Length distributions are characterized using logelogdiagramwhere thecumulative frequencydistributionN(l) (numberoffractures with length greater or equal to length l) is plot versus thelength l (Fig. 8). When comparing fracture-length distributions plotfordifferent scales, a normalized cumulative frequencydistribution isused, where N(l) corresponds to the number of fractures with lengthgreater or equal to length l divided by the surface of the studied map(Fig. 9). These cumulative frequency distributions of length can bedescribed by several theoretical laws. Exponential, log-normal andpower-law distributions are the most common models used todescribe the fracture-length statistics (Bonnet et al., 2001). From thestudy of natural fractures datasets, Castaing et al. (1996) and Odlinget al. (1999) among others show that fault length distributions oftenfollow a power-law relation such asN(l)# al$a, where a is a constantcharacteristic of the scale, and a is the power-law exponent generallyranging between 1 and 3 (Bour and Davy, 1997; Odling, 1997). Thepower-law exponent characterizes the relative abundance of frac-tures of different sizes. A fracture-length distribution exhibitingpower-law behaviormeans that length distribution is scale-invariantover the spatial range considered. When logarithmic axes are used,a straight line indicates that the lengthdistribution ispower-lawwitha slope de"ned by the exponent a. In most cases, sampling effects atsmall and large scales may cause a deviation of the experimentallogelog plot from a theoretical perfect straight line. The samplingbiases are named as “truncation” and “censoring” (Pickering et al.,1995; Bonnet et al., 2001), and correspond respectively to (i) anunderestimation of the small fractures due to the spatial resolutionlimitations of the sampling method used and (ii) to an underesti-mation of trace lengths for fractures greater than the sampling areadimensions or that intersect the sampling area boundary.
Fig. 9 compares the cumulative length distributions of fracturesobserved in the four structural maps presented in section 5 (Figs. 6and 7). Such plots have been extensively presented in the literatureon the scaling of fracture-length distributions (Castaing et al., 1996;Odling, 1997; Odling et al., 1999). The majority of these maps showstrace-length distributions close to negative exponential laws. TheBurum granite map at the scale of 1/1500 is the only dataset that
Fig. 4. Schematic representations of fault zones observed from regional to "eld scales,showing the relationships between fault zones of different orders of magnitude. (a)Regional fault zone represented by a single lineament when observed at satellite scale(map view). (b) When increasing the scale of observations, (i) internal structures ofregional fault zone can be speci"ed, and (ii) fault zones of low order are recognized(map view). (c) High order fault zone formed by several fault zones like in (d) sepa-rated by blocks or lenses of relatively undeformed protolith. Note the presence offracture corridors at the interface between fault zones and protolith. (d) Typical faultzone structure with a fault core surrounding by damage zones (after Caine et al., 1996).(e) Low order fault zones constituting the damage zone of a fault zone like in (d).Analogies between "eld observations (Fig. 3) and fault zones models are indicated bythe black frames. DZ: Damage Zone; FC: Fault Core.
E. Le Garzic et al. / Journal of Structural Geology 33 (2011) 519e536524
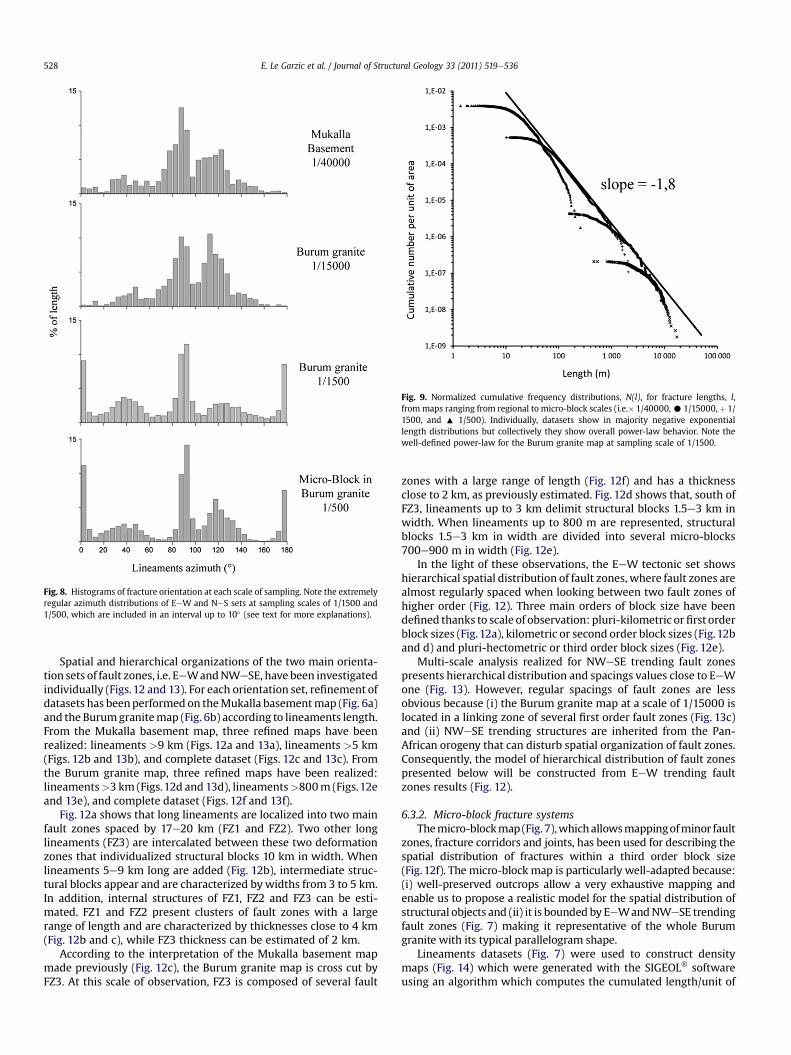
exhibits a well-de"ned power-law length distribution over a scalerange of 100e1000 m, and characterized by an exponent equal to1.8 (Fig. 9). However, when considering the length distributions ofthe overall maps, the logelog plot reveals overlapping curves,whose general envelope is a straight line characterized by a slope of1.8 (Fig. 9). This suggests the presence of an underlying power-law
distribution of the fracture trace-length within the Mukalla base-ment over 3 orders of magnitude (10e10000 m), as alreadyproposed by several previous authors for basement studies(Castaing et al., 1996; Odling, 1997). Correspondence between theslope values for the Burum granite map at scale of 1/1500 and theunderlying power-law con"rms the validity of this power-law. The
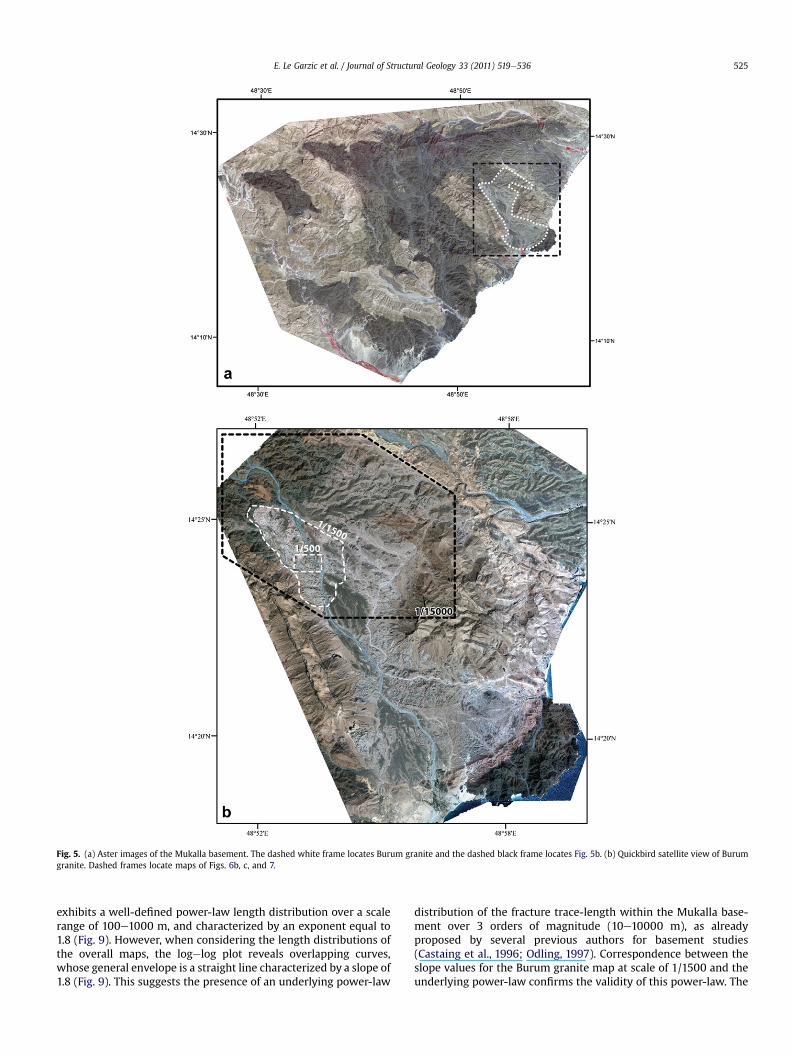
Fig. 5. (a) Aster images of the Mukalla basement. The dashed white frame locates Burum granite and the dashed black frame locates Fig. 5b. (b) Quickbird satellite view of Burumgranite. Dashed frames locate maps of Figs. 6b, c, and 7.
E. Le Garzic et al. / Journal of Structural Geology 33 (2011) 519e536 525
apparent negative exponential distributions laws observed for eachindividual map curves are therefore not relevant and probablyrepresent truncation and censoring effects, while the well-de"nedpower-law distribution observed for the Burum granite map at thescale of 1/1500 can be explained by the larger surface area used thatreduced censoring effects.
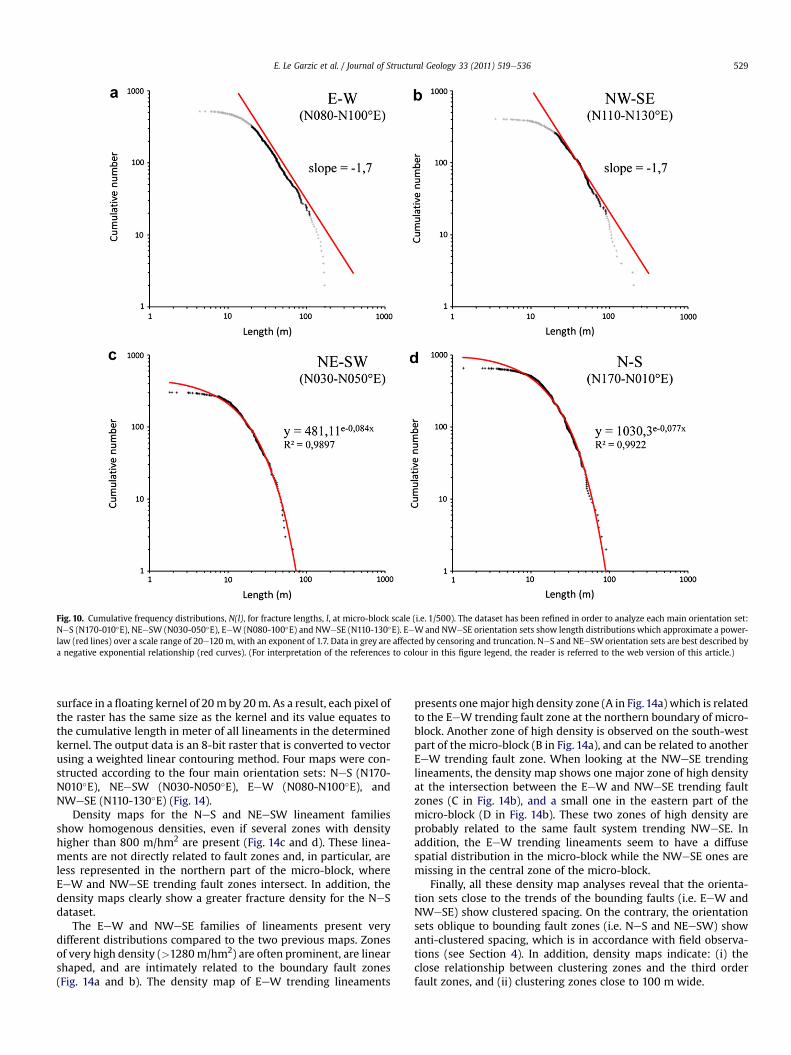
The trace-length distributions just presented above have beenrealized using thewhole datasetswhatever the fracture orientations.To try to visualize the effect of the orientation parameter on thefracture-length distribution, the main orientation sets were studiedseparately. Themicro-blockmapwas chosen to perform this detailedstudy because all the individual structures are represented at thisscale (i.e. faults, fracture corridors and joints). Orientation sets werechosen according to the mean peaks previously identi"ed in theorientationhistograms (Fig.8), i.e.NeS (N170-010"E),NEeSW(N030-050"E), EeW (N080-100"E) and NWeSE (N110-130"E). The globaldistribution, including all orientation sets, is represented by a regularcurve (Fig. 9) which closely matches with a negative exponential
distribution. When regarding to individual orientation sets, twodifferent length distributions can be distinguished (Fig.10). EeWandNWeSE orientation sets show length distributions which approxi-mate a power-law over a scale range of 20e100m, with an exponentof 1.7 (Fig. 10a and b). By contrast, the NeS and NEeSW orientationsets arebestdescribedbyanegative exponential relationship (Fig.10cand d). The fact that orientation sets which are sub-parallel tobounding faults of the micro-block (i.e. EeW and NWeSE) showpower-law length distributions reveals that tectonic systems seem tobe scale-invariant. On the contrary, fracture setswhich arenot relatedto faults (i.e. NeS and NEeSW) show negative exponential lengthdistributions.Negativeexponential shapesofNeSandNEeSWlengthdistributions are not due to truncation or censoring, because theselaws are perfectly well-de"ned in an interval between the uppercutoff (100 m) and the lower cutoff (20 m) of the power-laws lengthdistributions of EeWand NWeSE trending families (Fig. 10).
This differenceof lengthdistributionbehavior for fault relatedandnon-fault related fracture systems is emphasized by the study of the
Fig. 6. Structural maps at different scales of the Mukalla proterozoic basement. (a) Mukalla basement structural map at a sampling scale of 1/40000. Mesozoic and Cenozoic cover isrepresented in grey and the Burum granite with crosses. The dashed black frame locates Fig. 6b. (b) Burum granite structural map at a sampling scale of 1/15000. Wadis arerepresented in blue. The dashed black frame locates Fig. 6c. (c) Burum granite map at the sampling scale of 1/1500. Dashed black frame locates Fig. 7. (For interpretation of thereferences to colour in this "gure legend, the reader is referred to the web version of this article.)
E. Le Garzic et al. / Journal of Structural Geology 33 (2011) 519e536526
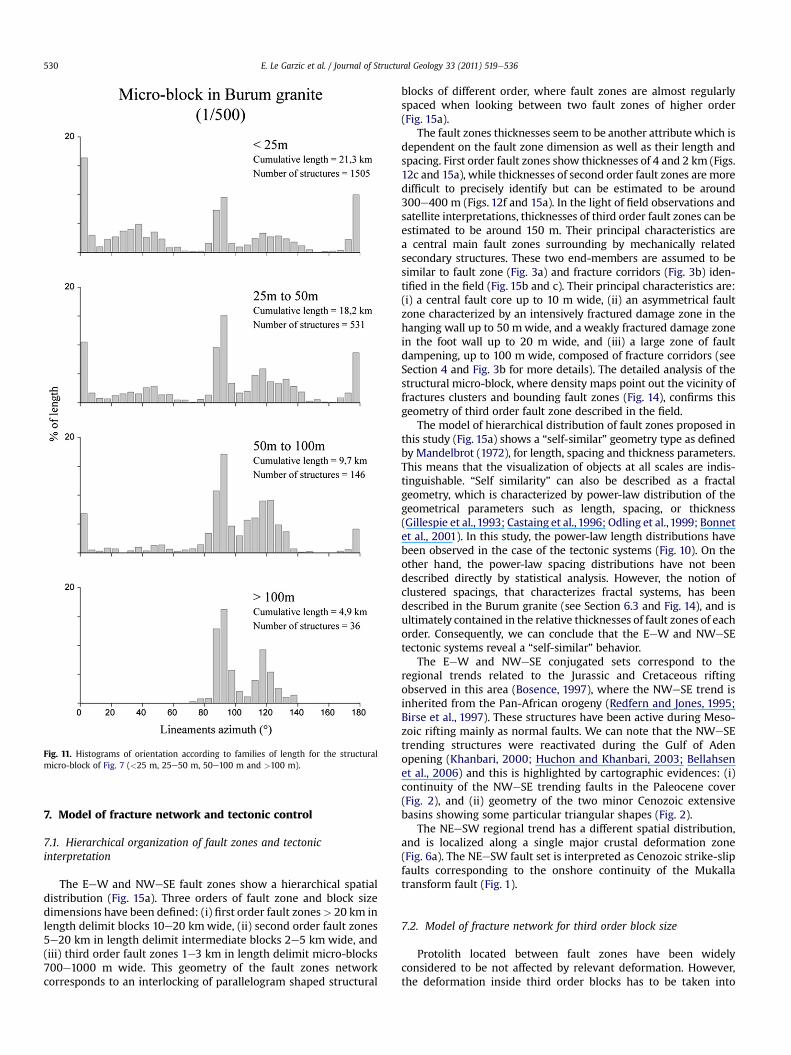
orientation distributions calculated with the identi"cation of severalclasses of length for the larger scale (Fig. 11). Four ranges of lengthshave been separated: trace lengths lower than 25m, from25 to 50m,from 50 to 100 m and trace lengths higher than 100 m. This segre-gation shows clearly lower frequencies for the NeS and NEeSWtrending fractures in the classes ofhighest lengths. In a same time, thefrequencies of the EeW and NWeSE trending fractures showincreasing valueswhen length lineaments are longer than 50m. Thismeans that the datasets that show negative exponential lengthdistributions are characterized by the presence of small fractures thatare therefore restricted to a characteristic scale range (i.e. <50m).
6.3. Spatial distribution analysis
Two types of spatial distribution of fractures are analyzed in thissection: (i) some major fault zones network and (ii) some micro-block fracture systems.
6.3.1. Major fault zones network and multi-scale structural blocksAs explained in Section 4, fault zones can be determined upon
several orders of magnitude, from regional to "eld scales (Fig. 4).Maps constructed at regional scale (i.e. 1/40000 and 1/15000) willenable us to identify these different orders of magnitude of faultzones in considering the scale of observation and the length of thestructural lineaments. Firstly, when increasing the scale of obser-vation (i.e. from scale of 1/40000 to scale of 1/15000), fault zones oflow order become visible, and consequently are distinguished (i)those contributing to internal architecture of high order fault zoneand (ii) those individualizing low order structural blocks (Fig. 4aand b). Secondly, as reported by numerous studies which havehighlighted the scaling relationships between fault length and faultdisplacement (Clark and Cox, 1996; Schlische et al., 1996; Schultzet al., 2008), re"nement of maps according to lineaments lengthwill be performed for recognizing the limits and the dimensions ofmulti-scale structural blocks.
Fig. 7. Map of structural micro-block in Burum granite at the sampling scale of 1/500. Wadis are represented in blue, major fault zones in thick black lines, and minor fractures inthin black lines. (For interpretation of the references to colour in this "gure legend, the reader is referred to the web version of this article.)
E. Le Garzic et al. / Journal of Structural Geology 33 (2011) 519e536 527
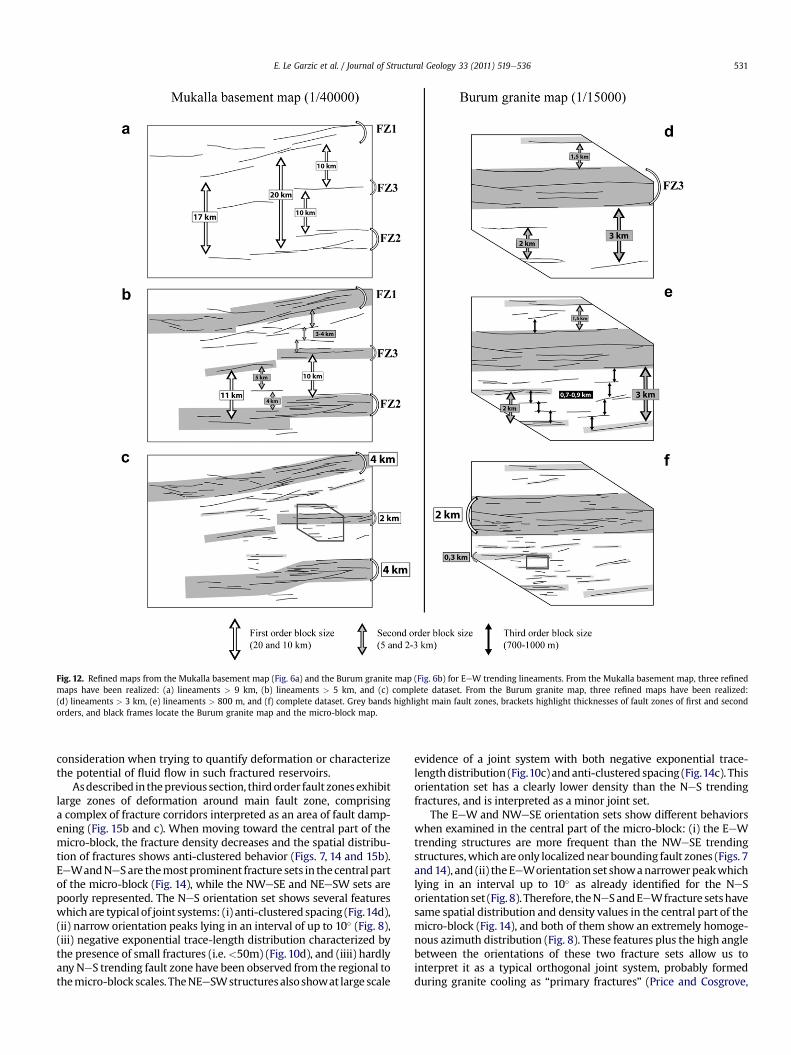
Spatial and hierarchical organizations of the two main orienta-tion sets of fault zones, i.e. EeWandNWeSE, have been investigatedindividually (Figs.12 and 13). For each orientation set, re"nement ofdatasets has beenperformed on theMukalla basementmap (Fig. 6a)and the Burumgranitemap (Fig. 6b) according to lineaments length.From the Mukalla basement map, three re"ned maps have beenrealized: lineaments >9 km (Figs. 12a and 13a), lineaments >5 km(Figs. 12b and 13b), and complete dataset (Figs. 12c and 13c). Fromthe Burum granite map, three re"ned maps have been realized:lineaments>3 km (Figs.12d and 13d), lineaments>800m (Figs.12eand 13e), and complete dataset (Figs. 12f and 13f).
Fig. 12a shows that long lineaments are localized into two mainfault zones spaced by 17e20 km (FZ1 and FZ2). Two other longlineaments (FZ3) are intercalated between these two deformationzones that individualized structural blocks 10 km in width. Whenlineaments 5e9 km long are added (Fig. 12b), intermediate struc-tural blocks appear and are characterized by widths from 3 to 5 km.In addition, internal structures of FZ1, FZ2 and FZ3 can be esti-mated. FZ1 and FZ2 present clusters of fault zones with a largerange of length and are characterized by thicknesses close to 4 km(Fig. 12b and c), while FZ3 thickness can be estimated of 2 km.
According to the interpretation of the Mukalla basement mapmade previously (Fig. 12c), the Burum granite map is cross cut byFZ3. At this scale of observation, FZ3 is composed of several fault
zones with a large range of length (Fig. 12f) and has a thicknessclose to 2 km, as previously estimated. Fig. 12d shows that, south ofFZ3, lineaments up to 3 km delimit structural blocks 1.5e3 km inwidth. When lineaments up to 800 m are represented, structuralblocks 1.5e3 km in width are divided into several micro-blocks700e900 m in width (Fig. 12e).
In the light of these observations, the EeW tectonic set showshierarchical spatial distribution of fault zones, where fault zones arealmost regularly spaced when looking between two fault zones ofhigher order (Fig. 12). Three main orders of block size have beende"ned thanks to scale of observation: pluri-kilometric or"rst orderblock sizes (Fig.12a), kilometric or second order block sizes (Fig.12band d) and pluri-hectometric or third order block sizes (Fig. 12e).
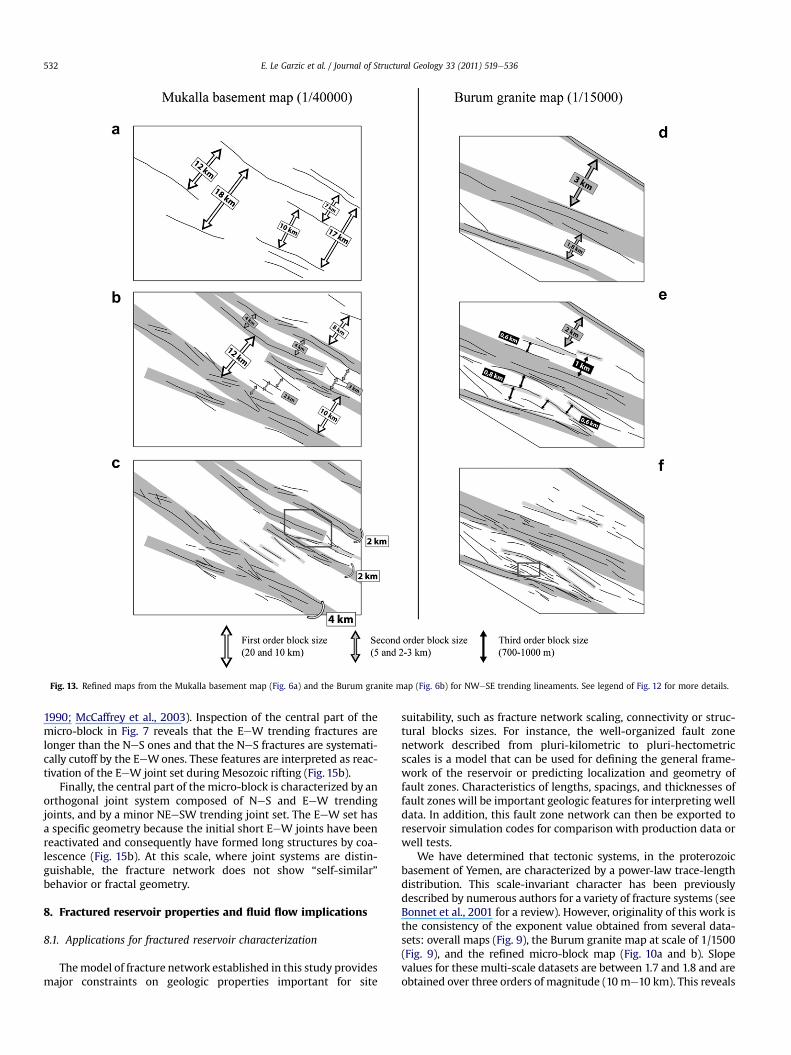
Multi-scale analysis realized for NWeSE trending fault zonespresents hierarchical distribution and spacings values close to EeWone (Fig. 13). However, regular spacings of fault zones are lessobvious because (i) the Burum granite map at a scale of 1/15000 islocated in a linking zone of several "rst order fault zones (Fig. 13c)and (ii) NWeSE trending structures are inherited from the Pan-African orogeny that can disturb spatial organization of fault zones.Consequently, the model of hierarchical distribution of fault zonespresented below will be constructed from EeW trending faultzones results (Fig. 12).
6.3.2. Micro-block fracture systemsThemicro-blockmap (Fig. 7),whichallowsmappingofminor fault
zones, fracture corridors and joints, has been used for describing thespatial distribution of fractures within a third order block size(Fig. 12f). The micro-block map is particularly well-adapted because:(i) well-preserved outcrops allow a very exhaustive mapping andenable us to propose a realistic model for the spatial distribution ofstructural objects and (ii) it is bounded by EeWandNWeSE trendingfault zones (Fig. 7) making it representative of the whole Burumgranite with its typical parallelogram shape.
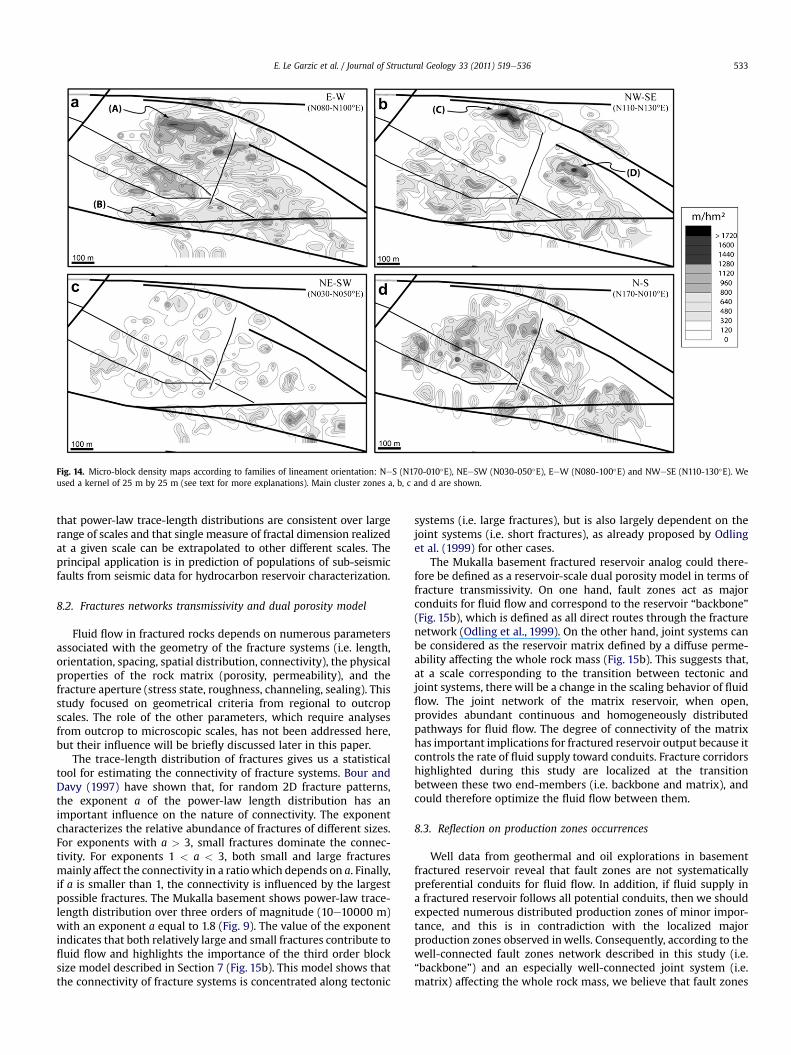
Lineaments datasets (Fig. 7) were used to construct densitymaps (Fig. 14) which were generated with the SIGEOL" softwareusing an algorithm which computes the cumulated length/unit of
Fig. 8. Histograms of fracture orientation at each scale of sampling. Note the extremelyregular azimuth distributions of EeW and NeS sets at sampling scales of 1/1500 and1/500, which are included in an interval up to 10" (see text for more explanations).
Fig. 9. Normalized cumulative frequency distributions, N(l), for fracture lengths, l,from maps ranging from regional to micro-block scales (i.e.% 1/40000,C1/15000, ! 1/1500, and : 1/500). Individually, datasets show in majority negative exponentiallength distributions but collectively they show overall power-law behavior. Note thewell-de"ned power-law for the Burum granite map at sampling scale of 1/1500.
E. Le Garzic et al. / Journal of Structural Geology 33 (2011) 519e536528
surface in a !oating kernel of 20m by 20m. As a result, each pixel ofthe raster has the same size as the kernel and its value equates tothe cumulative length in meter of all lineaments in the determinedkernel. The output data is an 8-bit raster that is converted to vectorusing a weighted linear contouring method. Four maps were con-structed according to the four main orientation sets: NeS (N170-N010"E), NEeSW (N030-N050"E), EeW (N080-N100"E), andNWeSE (N110-130"E) (Fig. 14).
Density maps for the NeS and NEeSW lineament familiesshow homogenous densities, even if several zones with densityhigher than 800 m/hm2 are present (Fig. 14c and d). These linea-ments are not directly related to fault zones and, in particular, areless represented in the northern part of the micro-block, whereEeW and NWeSE trending fault zones intersect. In addition, thedensity maps clearly show a greater fracture density for the NeSdataset.
The EeW and NWeSE families of lineaments present verydifferent distributions compared to the two previous maps. Zonesof very high density (>1280m/hm2) are often prominent, are linearshaped, and are intimately related to the boundary fault zones(Fig. 14a and b). The density map of EeW trending lineaments
presents onemajor high density zone (A in Fig.14a) which is relatedto the EeW trending fault zone at the northern boundary of micro-block. Another zone of high density is observed on the south-westpart of the micro-block (B in Fig. 14a), and can be related to anotherEeW trending fault zone. When looking at the NWeSE trendinglineaments, the density map shows one major zone of high densityat the intersection between the EeW and NWeSE trending faultzones (C in Fig. 14b), and a small one in the eastern part of themicro-block (D in Fig. 14b). These two zones of high density areprobably related to the same fault system trending NWeSE. Inaddition, the EeW trending lineaments seem to have a diffusespatial distribution in the micro-block while the NWeSE ones aremissing in the central zone of the micro-block.
Finally, all these density map analyses reveal that the orienta-tion sets close to the trends of the bounding faults (i.e. EeW andNWeSE) show clustered spacing. On the contrary, the orientationsets oblique to bounding fault zones (i.e. NeS and NEeSW) showanti-clustered spacing, which is in accordance with "eld observa-tions (see Section 4). In addition, density maps indicate: (i) theclose relationship between clustering zones and the third orderfault zones, and (ii) clustering zones close to 100 m wide.
Fig. 10. Cumulative frequency distributions, N(l), for fracture lengths, l, at micro-block scale (i.e. 1/500). The dataset has been re"ned in order to analyze each main orientation set:NeS (N170-010"E), NEeSW (N030-050"E), EeW (N080-100"E) and NWeSE (N110-130"E). EeWand NWeSE orientation sets show length distributions which approximate a power-law (red lines) over a scale range of 20e120 m, with an exponent of 1.7. Data in grey are affected by censoring and truncation. NeS and NEeSWorientation sets are best described bya negative exponential relationship (red curves). (For interpretation of the references to colour in this "gure legend, the reader is referred to the web version of this article.)
E. Le Garzic et al. / Journal of Structural Geology 33 (2011) 519e536 529
7. Model of fracture network and tectonic control
7.1. Hierarchical organization of fault zones and tectonicinterpretation
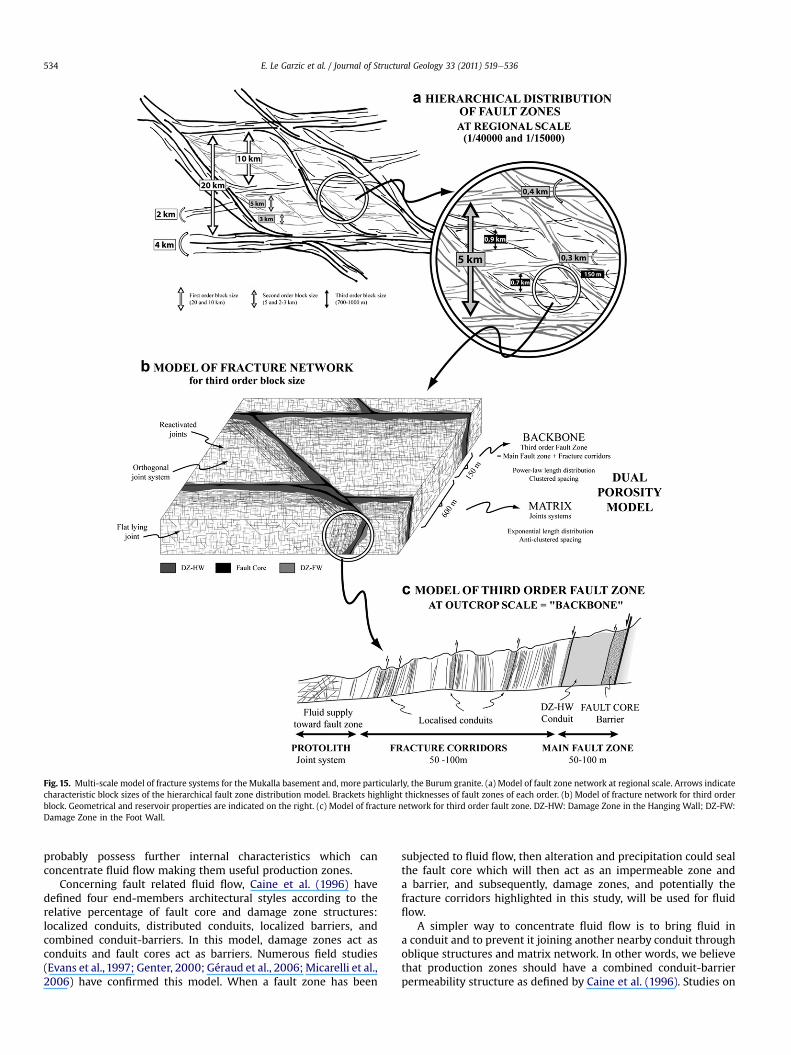
The EeW and NWeSE fault zones show a hierarchical spatialdistribution (Fig. 15a). Three orders of fault zone and block sizedimensions have been de"ned: (i) "rst order fault zones> 20 km inlength delimit blocks 10e20 kmwide, (ii) second order fault zones5e20 km in length delimit intermediate blocks 2e5 km wide, and(iii) third order fault zones 1e3 km in length delimit micro-blocks700e1000 m wide. This geometry of the fault zones networkcorresponds to an interlocking of parallelogram shaped structural
blocks of different order, where fault zones are almost regularlyspaced when looking between two fault zones of higher order(Fig. 15a).
The fault zones thicknesses seem to be another attribute which isdependent on the fault zone dimension as well as their length andspacing. First order fault zones show thicknesses of 4 and 2 km (Figs.12c and 15a), while thicknesses of second order fault zones are moredif"cult to precisely identify but can be estimated to be around300e400 m (Figs. 12f and 15a). In the light of "eld observations andsatellite interpretations, thicknesses of third order fault zones can beestimated to be around 150 m. Their principal characteristics area central main fault zones surrounding by mechanically relatedsecondary structures. These two end-members are assumed to besimilar to fault zone (Fig. 3a) and fracture corridors (Fig. 3b) iden-ti"ed in the "eld (Fig. 15b and c). Their principal characteristics are:(i) a central fault core up to 10 m wide, (ii) an asymmetrical faultzone characterized by an intensively fractured damage zone in thehanging wall up to 50 mwide, and a weakly fractured damage zonein the foot wall up to 20 m wide, and (iii) a large zone of faultdampening, up to 100 m wide, composed of fracture corridors (seeSection 4 and Fig. 3b for more details). The detailed analysis of thestructural micro-block, where density maps point out the vicinity offractures clusters and bounding fault zones (Fig. 14), con"rms thisgeometry of third order fault zone described in the "eld.
The model of hierarchical distribution of fault zones proposed inthis study (Fig. 15a) shows a “self-similar” geometry type as de"nedby Mandelbrot (1972), for length, spacing and thickness parameters.This means that the visualization of objects at all scales are indis-tinguishable. “Self similarity” can also be described as a fractalgeometry, which is characterized by power-law distribution of thegeometrical parameters such as length, spacing, or thickness(Gillespie et al.,1993; Castaing et al.,1996; Odling et al.,1999; Bonnetet al., 2001). In this study, the power-law length distributions havebeen observed in the case of the tectonic systems (Fig. 10). On theother hand, the power-law spacing distributions have not beendescribed directly by statistical analysis. However, the notion ofclustered spacings, that characterizes fractal systems, has beendescribed in the Burum granite (see Section 6.3 and Fig. 14), and isultimately contained in the relative thicknesses of fault zones of eachorder. Consequently, we can conclude that the EeW and NWeSEtectonic systems reveal a “self-similar” behavior.
The EeW and NWeSE conjugated sets correspond to theregional trends related to the Jurassic and Cretaceous riftingobserved in this area (Bosence, 1997), where the NWeSE trend isinherited from the Pan-African orogeny (Redfern and Jones, 1995;Birse et al., 1997). These structures have been active during Meso-zoic rifting mainly as normal faults. We can note that the NWeSEtrending structures were reactivated during the Gulf of Adenopening (Khanbari, 2000; Huchon and Khanbari, 2003; Bellahsenet al., 2006) and this is highlighted by cartographic evidences: (i)continuity of the NWeSE trending faults in the Paleocene cover(Fig. 2), and (ii) geometry of the two minor Cenozoic extensivebasins showing some particular triangular shapes (Fig. 2).
The NEeSW regional trend has a different spatial distribution,and is localized along a single major crustal deformation zone(Fig. 6a). The NEeSW fault set is interpreted as Cenozoic strike-slipfaults corresponding to the onshore continuity of the Mukallatransform fault (Fig. 1).
7.2. Model of fracture network for third order block size
Protolith located between fault zones have been widelyconsidered to be not affected by relevant deformation. However,the deformation inside third order blocks has to be taken into
Fig. 11. Histograms of orientation according to families of length for the structuralmicro-block of Fig. 7 (<25 m, 25e50 m, 50e100 m and >100 m).
E. Le Garzic et al. / Journal of Structural Geology 33 (2011) 519e536530
consideration when trying to quantify deformation or characterizethe potential of !uid !ow in such fractured reservoirs.
Asdescribed in theprevious section, thirdorder fault zonesexhibitlarge zones of deformation around main fault zone, comprisinga complex of fracture corridors interpreted as an area of fault damp-ening (Fig. 15b and c). When moving toward the central part of themicro-block, the fracture density decreases and the spatial distribu-tion of fractures shows anti-clustered behavior (Figs. 7, 14 and 15b).EeWandNeS are themostprominent fracture sets in the central partof the micro-block (Fig. 14), while the NWeSE and NEeSW sets arepoorly represented. The NeS orientation set shows several featureswhich are typical of joint systems: (i) anti-clustered spacing (Fig.14d),(ii) narrow orientation peaks lying in an interval of up to 10" (Fig. 8),(iii) negative exponential trace-length distribution characterized bythe presence of small fractures (i.e.<50m) (Fig. 10d), and (iiii) hardlyany NeS trending fault zone have been observed from the regional tothemicro-block scales. TheNEeSWstructuresalsoshowat large scale
evidence of a joint system with both negative exponential trace-lengthdistribution (Fig.10c)andanti-clustered spacing (Fig.14c). Thisorientation set has a clearly lower density than the NeS trendingfractures, and is interpreted as a minor joint set.
The EeW and NWeSE orientation sets show different behaviorswhen examined in the central part of the micro-block: (i) the EeWtrending structures are more frequent than the NWeSE trendingstructures,which are only localized near bounding fault zones (Figs. 7and14), and (ii) theEeWorientation set showanarrowerpeakwhichlying in an interval up to 10" as already identi"ed for the NeSorientationset (Fig. 8). Therefore, theNeSandEeWfracture setshavesame spatial distribution and density values in the central part of themicro-block (Fig. 14), and both of them show an extremely homoge-nous azimuth distribution (Fig. 8). These features plus the high anglebetween the orientations of these two fracture sets allow us tointerpret it as a typical orthogonal joint system, probably formedduring granite cooling as “primary fractures” (Price and Cosgrove,
Fig. 12. Re"ned maps from the Mukalla basement map (Fig. 6a) and the Burum granite map (Fig. 6b) for EeW trending lineaments. From the Mukalla basement map, three re"nedmaps have been realized: (a) lineaments > 9 km, (b) lineaments > 5 km, and (c) complete dataset. From the Burum granite map, three re"ned maps have been realized:(d) lineaments > 3 km, (e) lineaments > 800 m, and (f) complete dataset. Grey bands highlight main fault zones, brackets highlight thicknesses of fault zones of "rst and secondorders, and black frames locate the Burum granite map and the micro-block map.
E. Le Garzic et al. / Journal of Structural Geology 33 (2011) 519e536 531
1990; McCaffrey et al., 2003). Inspection of the central part of themicro-block in Fig. 7 reveals that the EeW trending fractures arelonger than the NeS ones and that the NeS fractures are systemati-cally cutoff by the EeWones. These features are interpreted as reac-tivation of the EeW joint set during Mesozoic rifting (Fig. 15b).
Finally, the central part of the micro-block is characterized by anorthogonal joint system composed of NeS and EeW trendingjoints, and by a minor NEeSW trending joint set. The EeW set hasa speci"c geometry because the initial short EeW joints have beenreactivated and consequently have formed long structures by coa-lescence (Fig. 15b). At this scale, where joint systems are distin-guishable, the fracture network does not show “self-similar”behavior or fractal geometry.
8. Fractured reservoir properties and "uid "ow implications
8.1. Applications for fractured reservoir characterization
Themodel of fracture network established in this study providesmajor constraints on geologic properties important for site
suitability, such as fracture network scaling, connectivity or struc-tural blocks sizes. For instance, the well-organized fault zonenetwork described from pluri-kilometric to pluri-hectometricscales is a model that can be used for de"ning the general frame-work of the reservoir or predicting localization and geometry offault zones. Characteristics of lengths, spacings, and thicknesses offault zones will be important geologic features for interpreting welldata. In addition, this fault zone network can then be exported toreservoir simulation codes for comparison with production data orwell tests.
We have determined that tectonic systems, in the proterozoicbasement of Yemen, are characterized by a power-law trace-lengthdistribution. This scale-invariant character has been previouslydescribed by numerous authors for a variety of fracture systems (seeBonnet et al., 2001 for a review). However, originality of this work isthe consistency of the exponent value obtained from several data-sets: overall maps (Fig. 9), the Burum granite map at scale of 1/1500(Fig. 9), and the re"ned micro-block map (Fig. 10a and b). Slopevalues for these multi-scale datasets are between 1.7 and 1.8 and areobtained over three orders of magnitude (10 me10 km). This reveals
Fig. 13. Re"ned maps from the Mukalla basement map (Fig. 6a) and the Burum granite map (Fig. 6b) for NWeSE trending lineaments. See legend of Fig. 12 for more details.
E. Le Garzic et al. / Journal of Structural Geology 33 (2011) 519e536532
that power-law trace-length distributions are consistent over largerange of scales and that single measure of fractal dimension realizedat a given scale can be extrapolated to other different scales. Theprincipal application is in prediction of populations of sub-seismicfaults from seismic data for hydrocarbon reservoir characterization.
8.2. Fractures networks transmissivity and dual porosity model
Fluid !ow in fractured rocks depends on numerous parametersassociated with the geometry of the fracture systems (i.e. length,orientation, spacing, spatial distribution, connectivity), the physicalproperties of the rock matrix (porosity, permeability), and thefracture aperture (stress state, roughness, channeling, sealing). Thisstudy focused on geometrical criteria from regional to outcropscales. The role of the other parameters, which require analysesfrom outcrop to microscopic scales, has not been addressed here,but their in!uence will be brie!y discussed later in this paper.
The trace-length distribution of fractures gives us a statisticaltool for estimating the connectivity of fracture systems. Bour andDavy (1997) have shown that, for random 2D fracture patterns,the exponent a of the power-law length distribution has animportant in!uence on the nature of connectivity. The exponentcharacterizes the relative abundance of fractures of different sizes.For exponents with a > 3, small fractures dominate the connec-tivity. For exponents 1 < a < 3, both small and large fracturesmainly affect the connectivity in a ratiowhich depends on a. Finally,if a is smaller than 1, the connectivity is in!uenced by the largestpossible fractures. The Mukalla basement shows power-law trace-length distribution over three orders of magnitude (10e10000 m)with an exponent a equal to 1.8 (Fig. 9). The value of the exponentindicates that both relatively large and small fractures contribute to!uid !ow and highlights the importance of the third order blocksize model described in Section 7 (Fig. 15b). This model shows thatthe connectivity of fracture systems is concentrated along tectonic
systems (i.e. large fractures), but is also largely dependent on thejoint systems (i.e. short fractures), as already proposed by Odlinget al. (1999) for other cases.
The Mukalla basement fractured reservoir analog could there-fore be de"ned as a reservoir-scale dual porosity model in terms offracture transmissivity. On one hand, fault zones act as majorconduits for !uid !ow and correspond to the reservoir “backbone”(Fig. 15b), which is de"ned as all direct routes through the fracturenetwork (Odling et al., 1999). On the other hand, joint systems canbe considered as the reservoir matrix de"ned by a diffuse perme-ability affecting the whole rock mass (Fig. 15b). This suggests that,at a scale corresponding to the transition between tectonic andjoint systems, there will be a change in the scaling behavior of !uid!ow. The joint network of the matrix reservoir, when open,provides abundant continuous and homogeneously distributedpathways for !uid !ow. The degree of connectivity of the matrixhas important implications for fractured reservoir output because itcontrols the rate of !uid supply toward conduits. Fracture corridorshighlighted during this study are localized at the transitionbetween these two end-members (i.e. backbone and matrix), andcould therefore optimize the !uid !ow between them.
8.3. Re!ection on production zones occurrences
Well data from geothermal and oil explorations in basementfractured reservoir reveal that fault zones are not systematicallypreferential conduits for !uid !ow. In addition, if !uid supply ina fractured reservoir follows all potential conduits, then we shouldexpected numerous distributed production zones of minor impor-tance, and this is in contradiction with the localized majorproduction zones observed inwells. Consequently, according to thewell-connected fault zones network described in this study (i.e.“backbone”) and an especially well-connected joint system (i.e.matrix) affecting the whole rock mass, we believe that fault zones
Fig. 14. Micro-block density maps according to families of lineament orientation: NeS (N170-010"E), NEeSW (N030-050"E), EeW (N080-100"E) and NWeSE (N110-130"E). Weused a kernel of 25 m by 25 m (see text for more explanations). Main cluster zones a, b, c and d are shown.
E. Le Garzic et al. / Journal of Structural Geology 33 (2011) 519e536 533
probably possess further internal characteristics which canconcentrate !uid !ow making them useful production zones.
Concerning fault related !uid !ow, Caine et al. (1996) havede"ned four end-members architectural styles according to therelative percentage of fault core and damage zone structures:localized conduits, distributed conduits, localized barriers, andcombined conduit-barriers. In this model, damage zones act asconduits and fault cores act as barriers. Numerous "eld studies(Evans et al., 1997; Genter, 2000; Géraud et al., 2006; Micarelli et al.,2006) have con"rmed this model. When a fault zone has been
subjected to !uid !ow, then alteration and precipitation could sealthe fault core which will then act as an impermeable zone anda barrier, and subsequently, damage zones, and potentially thefracture corridors highlighted in this study, will be used for !uid!ow.
A simpler way to concentrate !uid !ow is to bring !uid ina conduit and to prevent it joining another nearby conduit throughoblique structures and matrix network. In other words, we believethat production zones should have a combined conduit-barrierpermeability structure as de"ned by Caine et al. (1996). Studies on
Fig. 15. Multi-scale model of fracture systems for the Mukalla basement and, more particularly, the Burum granite. (a) Model of fault zone network at regional scale. Arrows indicatecharacteristic block sizes of the hierarchical fault zone distribution model. Brackets highlight thicknesses of fault zones of each order. (b) Model of fracture network for third orderblock. Geometrical and reservoir properties are indicated on the right. (c) Model of fracture network for third order fault zone. DZ-HW: Damage Zone in the Hanging Wall; DZ-FW:Damage Zone in the Foot Wall.
E. Le Garzic et al. / Journal of Structural Geology 33 (2011) 519e536534
fractured reservoirs realized for industrial requirements show thatproduction zones are often spatially associated with mineralization(e.g. calcite), and fracture clusters (e.g. Evans et al., 2005; Sausseet al., 2006; Ledésert et al., 2009). Furthermore, numerousnatural examples show successive paleo-!uid circulations in thesame deformation zone, emphasized by overprinted mineraliza-tion, showing that fault zone could be a zone of mechanicalweakness which can bemore easily activated. As a consequence, wethink that a fault which has already undergone paleo-!uid circu-lation, and consequently alteration and/or precipitation, could bea preferential path for a next !uid !ow. This spatial relationship canbe interpreted as a sealed fault core (i.e. calcite mineralization)acting as a barrier and damage zone (i.e. fracture clusters) acting asa conduit.
9. Conclusions
Multi-scale mappings of fracture systems in the crystallinebasement of Yemen have been described through statistical anal-yses of direction, length, spacing, density, and spatial distribution.These results, combined with "eld observations, have been used tomodel the geometry of the fracture networks in an analog base-ment rocks, from multi-kilometric to decametric scales. Modelsuggests that fractures observed at all scales (regional faults tojoints) in!uence the degree of connectivity of the fractured reser-voir and the !uid !ow behavior.
1. The EeW and NWeSE extensional fault systems show a hier-archical organization of fault zone with characteristicsparameters like length, thickness, and spacing. It presentsa “self-similar” geometry characterized by an interlocking ofparallelogram shaped structural blocks of different order.
2. The EeW and NWeSE extensional fault systems presentevidence of fractal organization: (i) power-law trace-lengthdistribution has been determined over three orders of magni-tude (10e10000 m) with an exponent of 1.8, that reveals scale-invariant behavior, and (ii) we have demonstrated that tectonicsystems showclustered spacing, while joint systems show anti-clustered spacing (i.e. random or regular spatial distribution).
3. When datasets are re"ned by orientation sets, the length pop-ulation technique can potentially distinguish joint systems fromtectonic systems and consequently is a useful tool for structuralnetwork interpretation. Tectonic systems showpower-law trace-length distribution with exponent of 1.7, and seem to be scale-invariant. Joint systems show negative exponential trace-lengthdistribution, and are restricted to a characteristic scale range.
4. EeW and NWeSE trending extensional faults are related toJurassic and Cretaceous rifting, even if the latter is inheritedfrom Pan-African orogeny (i.e. Nadj Fault reactivation). Thesestructures were reactivated during the Gulf of Aden opening.On the regional scale (i.e. 1/40000 and 1/15000), NEeSWorientation sets can be interpreted as Cenozoic strike-slip faultscorresponding to the onshore continuity of the Mukallatransform faults, while on the larger scale (i.e. 1/1500 and 1/500), NEeSW structures present evidence of a joint system. Atypical orthogonal joint system comprised of NeS and EeWsets has been recognized in the Burum granite. Reactivation ofthe EeW trending joint set during Jurassic and Cretaceousrifting have been highlighted.
5. A basement fractured reservoir can be de"ned in a simpler wayas a reservoir-scale dual porosity model. On the one hand,tectonic systems act as major conduits for !uid !ow andcorrespond to the reservoir “backbone”. On the other hand,joint systems can be considered as reservoir matrix de"nes bya diffuse permeability affecting the whole rock mass. We
believe that fault zones should have a combined conduit-barrier permeability structure as de"ned by Caine et al. (1996)in order to be a good production zone. As a consequence, a faultwhich has already undergone paleo-!uid circulation, andconsequently alteration and/or precipitation, could be prefer-ential zone for concentrating !uid !ow.
Acknowledgments
We would like to thank the Block 10 partners in Yemen (Oxy,Kufpec, Sinochem and TOTAL) who have authorized this publica-tion. A special thank to J.P. Gomez (TOTAL, Aberdeen) for his help inthe understanding of the structural patterns in the Burum granite.The interpretation of the satellite images has been realized with thecollaboration and the technical input of TOTAL Pau (thanks to J.P.Xavier) and TTI Production. We are also grateful to Joachim Place(EIfER, Germany) for data processing. The authors want also tothank R.W. Wilson and J.P. Turner for their valuable comments onthe early versions of this manuscript, as well as N. Odling and J.Escuder Viruete for constructive reviews and Tom Blenkinsop forhis editorial support.
References
Al-Saleh, A.M., Boyle, A.P., Mussett, A.E., 1998. Metamorphism and 40Ar/39Ar datingof the Halaban Ophiolite and associated units: evidence for two-stageorogenesis in the eastern Arabian shield. Journal of the Geological Society 155,165e175.
Bellahsen, N., Fournier, M., d’Acremont, E., Leroy, S., Daniel, J.M., 2006. Fault reac-tivation and rift localization: northeastern Gulf of Aden margin. Tectonics 25.doi:10.1029/2004TC001626.
Beydoun, Z.R., As-Saruri, M.L., Baraba, R.S., 1996. Sedimentary basins of the Republicof Yemen: their structural evolution and geological characteristics. Revue del’Institut Français du Pétrole 51, 763e775.
Birse, A.C.R., Bott, W.F., Morrison, J., Samuel, M.A., 1997. The Mesozoic and earlyTertiary tectonic evolution of the Socotra area, eastern Gulf of Aden, Yemen.Marine and Petroleum Geology 14, 675e684.
Blasband, B., White, S., Brooijmans, P., De Boorder, H., Visser, W., 2000. Lateproterozoic extensional collapse in the Arabian-Nubian shield. Journal of theGeological Society 157, 615e628.
Bonnet, E., Bour, O., Odling, N.E., Davy, P., Main, I., Cowie, P., Berkowitz, B., 2001.Scaling of fracture systems in geological media. Reviews of Geophysics 39,347e383.
Bosence, D.W.J., 1997. Mesozoic rift basins of Yemen. Marine and Petroleum Geology14, 611e616.
Bour, O., Davy, P., 1997. Connectivity of random fault networks following a powerlaw fault length distribution. Water Resources Research 33, 1567e1583.
Bour, O., Davy, P., Darcel, C., Odling, N., 2002. A statistical scaling model for fracturenetwork geometry, with validation on a multiscale mapping of a joint network(Hornelen Basin, Norway). Journal of Geophysical Research B: Solid Earth 107.doi:10.1029/2001JB000176.
Brannan, J., Gerdes, K.D., Newth, I.R., 1997. Tectono-stratigraphic development ofthe Qamar basin, Eastern Yemen. Marine and Petroleum Geology 14, 701e730.
Caine, J.S., Evans, J.P., Forster, C.B., 1996. Fault zone architecture and permeabilitystructure. Geology 24, 1025e1028.
Castaing, C., Halawani, M.A., Gervais, F., Chilès, J.P., Genter, A., Bourgine, B.,Ouillon, G., Brosse, J.M., Martin, P., Genna, A., Janjou, D., 1996. Scaling rela-tionships in intraplate fracture systems related to Red Sea rifting. Tectono-physics 261, 291e314.
Chester, F.M., Evans, J.P., Biegel, R.L., 1993. Internal structure and weakeningmechanisms of the San Andreas Fault. Journal of Geophysical Research 98,771e786.
Childs, C., Manzocchi, T., Walsh, J.J., Bonson, C.G., Nicol, A., Schöpfer, M.P.J., 2009.A geometric model of fault zone and fault rock thickness variations. Journal ofStructural Geology 31, 117e127.
Clark, R.M., Cox, S.J.D., 1996. A modern regression approach to determining faultdisplacement-length scaling relationships. Journal of Structural Geology 18,147e152.
d’Acremont, E., Leroy, S., Maia, M., Patriat, P., Beslier, M.O., Bellahsen, N., FournierM.,Gente, P., 2006. Structure and evolution of the eastern Gulf of Aden: insightsfrom magnetic and gravity data (Encens-Sheba MD117 cruise). GeophysicalJournal International 165, 786e803.
Dauteuil, O., Huchon, P., Quemeneur, F., Souriot, T., 2001. Propagation of an obliquespreading centre: the western Gulf of Aden. Tectonophysics 332, 423e442.
Ellis, A.C., Kerr, H.M., Cornwell, C.P., Williams, D.O., 1996. A tectono-stratigraphicframework for Yemen and its implications for hydrocarbon potential. PetroleumGeoscience 2, 29e42.
E. Le Garzic et al. / Journal of Structural Geology 33 (2011) 519e536 535
Evans, J.P., Forster, C.B., Goddard, J.V., 1997. Permeability of fault-related rocks, andimplications for hydraulic structure of fault zones. Journal of Structural Geology19, 1393e1404.
Evans, K.F., Genter, A., Sausse, J., 2005. Permeability creation and damage due tomassive !uid injections into granite at 3.5 km at Soultz: 1. Borehole observa-tions. Journal of Geophysical Research B Solid Earth 110, 1e19.
Faulkner, D.R., Lewis, A.C., Rutter, E.H., 2003. On the internal structure andmechanics of large strike-slip fault zones: "eld observations of the Carbonerasfault in southeastern Spain. Tectonophysics 367, 235e251.
Géraud, Y., Diraison, M., Orellana, N., 2006. Fault zone geometry of a mature activenormal fault: a potential high permeability channel (Pirgaki fault, Corinth rift,Greece). Tectonophysics 426, 61e76.
Géraud, Y., Rosener, M., Surma, F., Place, J., Le Garzic, E., Diraison, M., 2010. Physicalproperties of fault zones within a granite body: example of the Soultz-sous-Forêts geothermal site. Comptes Rendus Geoscience 342, 566e574.
GDR-surveying team and the Department of Geology & Mineral Exploration/Aden,1987. Geological Map of Republic of Yemen (1:100 000).
Genter, A., 2000. Over 10 years of geological investigations within the HDR Soultzproject, France. In: Proceedings, World Geothermal Congress 2000, Kyushu-Tohoku, Japan.
Genter, A., Castaing, C., 1997. Scale effects in the fracturing of granite. Effetsd’échelle dans la fracturation des granites 325, 439e45.
Gillespie, P.A., Howard, C.B., Walsh, J.J., Watterson, J., 1993. Measurement andcharacterisation of spatial distributions of fractures. Tectonophysics 226,113e141.
Holden, A., Kerr, H.M., 1997. A subsurface lithostratigraphic division of the Hau-terivian to Aptian, Furt (informal) and Qishn formations, Yemen. Marine andPetroleum Geology 14, 631e642.
Huchon, P., Khanbari, K., 2003. Rotation of the syn-rift stress "eld of the northernGulf of Aden margin, Yemen. Tectonophysics 364, 147e166.
Khanbari, K., 2000. Propagation d’un rift océanique: le Golfe d’Aden. Ses effetsstructuraux sur la marge Yéménite. Thèse de doctorat de l’Univeristé Paris-Sud(325 pages).
Kim, Y.-S., Peacock, D.C.P., Sanderson, D.J., 2004. Fault damage zones. Journal ofStructural Geology 26, 503e517.
Ledésert, B., Dubois, J., Genter, A., Meunier, A., 1993a. Fractal analysis of fracturesapplied to Soultz-sous-Forets hot dry rock geothermal program. Journal ofVolcanology and Geothermal Research 57, 1e17.
Ledésert, B., Dubois, J., Velde, B., Meunier, A., Genter, A., Badri, A., 1993b. Geometricaland fractal analysis of a three-dimensional hydrothermal vein network in a frac-tured granite. Journal of Volcanology and Geothermal Research 56, 267e280.
Ledésert, B., Hébert, R.L., Grall, C., Genter, A., Dezayes, C., Bartier, D., Gérard, A., 2009.Calcimetry as a useful tool for a better knowledge of !ow pathways in theSoultz-sous-Forêts Enhanced Geothermal System. Journal of Volcanology andGeothermal Research 181, 106e114.
Lepvrier, C., Fournier, M., Bérard, T., Roger, J., 2002. Cenozoic extension in coastalDhofar (southern Oman): implications on the oblique rifting of the Gulf ofAden. Tectonophysics 357, 279e293.
Leroy, S., Gente, P., Fournier, M., d’Acremont, E., Patriat, P., Beslier, M.O.,Bellahsen, N., Maia, M., Blais, A., Perrot, J., Al-Kathiri, A., Merkouriev, S.,Fleury, J.M., Ruellan, P.Y., Lepvrier, C., Huchon, P., 2004. From rifting to spreadingin the eastern Gulf of Aden: a geophysical survey of a young oceanic basin frommargin to margin. Terra Nova 16, 185e192.
Long, J.C.S., Witherspoon, P.A., 1985. The relationship of the degree of intercon-nection to permeability in fracture networks. Journal of Geophysical Research90, 3087e3098.
Mandelbrot, B., 1972. The Fractal Geometry of Nature. W.H. Freeman and Company,New-York.
Manighetti, I., Tapponnier, P., Courtillot, V., Gruszow, S., Gillot, P.Y., 1997. Propaga-tion of rifting along the Arabia-Somalia plate boundary: the Gulfs of Aden andTadjoura. Journal of Geophysical Research B Solid Earth 102, 2681e2710.
McCaffrey, K.J.W., Sleight, J.M., Pugliese, S., Holdsworth, R.E., 2003. FractureFormation and Evolution in Crystalline Rocks: Insights from Attribute Analysis.In: Geological Society, Special Publications, vol. 214 109e124.
Meert, J.G., 2003. A synopsis of events related to the assembly of eastern Gondwana.Tectonophysics 362, 1e40.
Micarelli, L., Moretti, I., Daniel, J.M., 2003. Structural properties of rift-relatednormal faults: the case study of the Gulf of Corinth, Greece. Journal of Geo-dynamics 36, 275e303.
Micarelli, L., Moretti, I., Jaubert, M., Moulouel, H., 2006. Fracture analysis in thesouth-western Corinth rift (Greece) and implications on fault hydraulicbehavior. Tectonophysics 426, 31e59.
Odling, N.E., 1997. Scaling and connectivity of joint systems in sandstones fromwestern Norway. Journal of Structural Geology 19, 1257e1271.
Odling, N.E., Gillespie, P., Bourgine, B., Castaing, C., Chilés, J.P., Christensen, N.P.,Fillion, E., Genter, A., Olsen, C., Thrane, L., Trice, R., Aarseth, E., Walsh, J.J.,Watterson, J., 1999. Variations in fracture system geometry and their implica-tions for !uid !ow in fractured hydrocarbon reservoirs. Petroleum Geoscience5, 373e384.
Peacock, D.C.P., Knipe, R.J., Sanderson, D.J., 2000. Glossary of normal faults. Journalof Structural Geology 22, 291e305.
Pickering, G., Bull, J.M., Sanderson, D.J., 1995. Sampling power-law distributions.Tectonophysics 248, 1e20.
Price, N.J., Cosgrove, J.W., 1990. Analysis of Geological Structures. CambridgeUniversity Press, p. 502.
Redfern, P., Jones, J.A., 1995. The interior rifts of Yemen - Analysis of basin structureand stratigraphy in a regional plate tectonic context. Basin Research 7, 337e356.
Sanders, C.A.E., Fullarton, L., Calvert, S., 2003. Modelling Fracture Systems inExtensional Crystalline Basement. In: Geological Society, Special Publications,vol. 214 221e236.
Sausse, J., Fourar, M., Genter, A., 2006. Permeability and alteration within the Soultzgranite inferred from geophysical and !ow log analysis. Geothermics 35,544e560.
Schlische, R.W., Young, S.S., Ackermann, R.V., Gupta, A., 1996. Geometry and scalingrelations of a population of very small rift-related normal faults. Geology 24,683e686.
Schultz, R.A., Soliva, R., Fossen, H., Okubo, C.H., Reeves, D.M., 2008. Dependence ofdisplacement-length scaling relations for fractures and deformation bands onthe volumetric changes across them. Journal of Structural Geology 30,1405e1411.
Schulz, S.E., Evans, J.P., 1998. Spatial variability in microscopic deformation andcomposition of the Punchbowl fault, southern California: implications formechanisms, !uid-rock interaction, and fault morphology. Tectonophysics 295,223e244.
Schutter, S.R., 2003. Occurrences of hydrocarbons in and around igneous rocks. In:Petford, N., McCaffrey, J.W. (Eds.), Hydrocarbons in Crystalline Rocks. GeologicalSociety, London, Special Publications, vol. 214, pp. 35e68.
Stoeser, D.B., Camp, V.E., 1985. Pan-African microplate accretion of the Arabianshield. Geological Society of America Bulletin 96, 817e826.
Velde, B., Dubois, J., Moore, D., Touchard, G., 1991. Fractal patterns of fractures ingranites. Earth and Planetary Science Letters 104, 25e35.
Escuder Viruete, J., Carbonell, R., Jurado, M.J., Jurado, M.J., Marti, D., Pérez-Estaun, A.,2001. Two-dimensional geostatistical modeling and prediction of the fracturesystem in the Albala Granitic Pluton, SW Iberian Massif, Spain. Journal ofStructural Geology 23, 2011e2023.
Watchorn, F., Nichols, G.J., Bosence, D.W.J., 1998. Rift-related sedimentation andstratigraphy, southern Yemen (Gulf of Aden). In: Purser, B.H., Bosence, D.W.J.(Eds.), Sedimentation and Tectonics of Rift Basins: Red Sea-Gulf of Aden.Chapman & Hall, London, pp. 165e192.
Windley, B.F., Whitehouse, M.J., Ba-Bttat, M.A.O., 1996. Early Precambrian gneissterranes and Pan-African island arcs in Yemen: crustal accretion of the easternArabian shield. Geology 24, 131e134.
E. Le Garzic et al. / Journal of Structural Geology 33 (2011) 519e536536