Quantifying the relation between the morphology and performance of polymer solar cells using Monte...
6
Quantifying the relation between the morphology and performance of polymer solar cells using Monte Carlo simulations Bao Lei, Yan Yao, Ankit Kumar, Yang Yang, a and Vidvuds Ozolins b Department of Materials Science and Engineering, University of California, Los Angeles, Los Angeles, California 90095-1595, USA Received 18 July 2007; accepted 13 May 2008; published online 21 July 2008 Morphology is a crucially important factor determining the efficiency of photocurrent generation in bulk heterojunction polymer solar cells. Morphology, which depends on the characteristics of the polymers as well as on the conditions of phase separation, affects the performance of solar cells by influencing the rate of exciton dissociation and the efficiency of charge carrier transport. Using Monte Carlo simulations, we investigate the effects of annealing time on the morphology of phase separation and charge transfer behavior inside the active layers of polymer solar cells. We find that a suitably defined correlation distance is an effective parameter that quantitatively characterizes different morphologies and can be used to establish a direct link with transmission electron microscopy images of real polymer solar cells. Optimal morphologies have been investigated, showing results that are consistent with experimental data. © 2008 American Institute of Physics. DOI: 10.1063/1.2956689 I. INTRODUCTION The recent surge of interest in the science and technol- ogy of solar cells can be attributed to a growing shortage of fossil fuels, as well as to a need for environmentally friendly clean sources of energy. 1 Polymer photovoltaics are particu- larly attractive because of their ease of fabrication, flexibility, low weight, and low cost. 2,3 Polymer solar cells with dem- onstrated efficiencies of more than 5% are considered to be promising alternatives to their inorganic counterparts. 4–7 Efficiency of polymer solar cells can be enhanced by the bulk heterojunction structure, which consists of blends of electron donor polymers and electron acceptor molecules. 8 The mechanism of photocurrent generation in these systems involves a sequence of steps starting with the generation of excitons by incident photons. Excitons are quasiparticles having short lifetimes of several hundreds of picoseconds 9 and diffusion lengths of about 10 nm. 10 The photogenerated excitons diffuse and, upon reaching the interface between the electron donor and electron acceptor materials, separate into electrons and holes. These charge carriers transfer inside the active layer, under a built-in electric field and/or external bias voltage, until they are extracted by the electrodes and contribute to the photocurrent. The morphology of the two phases in the active layer is therefore of crucial importance for the performance of solar cells. 4,11–15 A morphology that maximizes the interfacial area between the materials will improve the dissociation rate of the excitons, leading to higher efficiencies. 16 On the other hand, too much interfacial area would increase the chances for the electron-hole recombination, as well as make the con- duction path longer, which would lead to a decrease in effi- ciency. Several models are available in the literature to treat this problem. 17,9,18 Sylvester-Hvid et al. developed a two- dimensional 2D model, which was used to establish the morphology dependence of the short circuit current. 17 How- ever, morphology inputs were just ideal 2D matrices and the possibility of network formation was not considered. The Monte Carlo simulations of Watkins et al. 9 covered the full sequence from morphology generation to electron transfer, and the results showed that the quantum efficiency is a func- tion of the donor-acceptor interfacial area. However, the topic of quantitative characterization of the morphology and its relation to the photovoltaic performance remains largely unexplored. In the present work, using Monte Carlo simulations of morphology generation and carrier transport, we correlate the annealing process in the fabrication stage with the photocur- rent and use this relationship to evaluate different morpholo- gies. We introduce the concept of correlation distance as a simple experimentally accessible way of characterizing two- phase morphologies, which allows us to describe the optimal morphology quantitatively. II. MONTE CARLO MODELING OF POLYMER SOLAR CELLS We use a 2D lattice system to model the solar cell de- vice. The active layer of the solar cell is described as a 2D matrix with each element representing an N-type acceptor material or a P-type donor material at its position. The cathode and anode are modeled as two extra rows appended to the top and the bottom of the matrix. A. Morphological evolution The inherent properties of intermolecular interactions and conformational entropies of the electron donor and ac- ceptor molecules in polymer blends are such that molecules of a given kind prefer to be surrounded by molecules of the same kind. Therefore, upon annealing, the system tends to a Electronic mail: [email protected]. b Electronic mail: [email protected]. JOURNAL OF APPLIED PHYSICS 104, 024504 2008 0021-8979/2008/1042/024504/6/$23.00 © 2008 American Institute of Physics 104, 024504-1 Downloaded 21 Jul 2008 to 133.1.187.130. Redistribution subject to AIP license or copyright; see http://jap.aip.org/jap/copyright.jsp
-
Upload
independent -
Category
Documents
-
view
1 -
download
0
Transcript of Quantifying the relation between the morphology and performance of polymer solar cells using Monte...

Quantifying the relation between the morphology and performance ofpolymer solar cells using Monte Carlo simulations
Bao Lei, Yan Yao, Ankit Kumar, Yang Yang,a� and Vidvuds Ozolinsb�
Department of Materials Science and Engineering, University of California, Los Angeles, Los Angeles,California 90095-1595, USA
�Received 18 July 2007; accepted 13 May 2008; published online 21 July 2008�
Morphology is a crucially important factor determining the efficiency of photocurrent generation inbulk heterojunction polymer solar cells. Morphology, which depends on the characteristics of thepolymers as well as on the conditions of phase separation, affects the performance of solar cells byinfluencing the rate of exciton dissociation and the efficiency of charge carrier transport. UsingMonte Carlo simulations, we investigate the effects of annealing time on the morphology of phaseseparation and charge transfer behavior inside the active layers of polymer solar cells. We find thata suitably defined correlation distance is an effective parameter that quantitatively characterizesdifferent morphologies and can be used to establish a direct link with transmission electronmicroscopy images of real polymer solar cells. Optimal morphologies have been investigated,showing results that are consistent with experimental data. © 2008 American Institute of Physics.�DOI: 10.1063/1.2956689�
I. INTRODUCTION
The recent surge of interest in the science and technol-ogy of solar cells can be attributed to a growing shortage offossil fuels, as well as to a need for environmentally friendlyclean sources of energy.1 Polymer photovoltaics are particu-larly attractive because of their ease of fabrication, flexibility,low weight, and low cost.2,3 Polymer solar cells with dem-onstrated efficiencies of more than 5% are considered to bepromising alternatives to their inorganic counterparts.4–7
Efficiency of polymer solar cells can be enhanced by thebulk heterojunction structure, which consists of blends ofelectron donor polymers and electron acceptor molecules.8
The mechanism of photocurrent generation in these systemsinvolves a sequence of steps starting with the generation ofexcitons by incident photons. Excitons are quasiparticleshaving short lifetimes of several hundreds of picoseconds9
and diffusion lengths of about 10 nm.10 The photogeneratedexcitons diffuse and, upon reaching the interface between theelectron donor and electron acceptor materials, separate intoelectrons and holes. These charge carriers transfer inside theactive layer, under a built-in electric field and/or externalbias voltage, until they are extracted by the electrodes andcontribute to the photocurrent.
The morphology of the two phases in the active layer istherefore of crucial importance for the performance of solarcells.4,11–15 A morphology that maximizes the interfacial areabetween the materials will improve the dissociation rate ofthe excitons, leading to higher efficiencies.16 On the otherhand, too much interfacial area would increase the chancesfor the electron-hole recombination, as well as make the con-duction path longer, which would lead to a decrease in effi-ciency.
Several models are available in the literature to treat this
problem.17,9,18 Sylvester-Hvid et al. developed a two-dimensional �2D� model, which was used to establish themorphology dependence of the short circuit current.17 How-ever, morphology inputs were just ideal 2D matrices and thepossibility of network formation was not considered. TheMonte Carlo simulations of Watkins et al.9 covered the fullsequence from morphology generation to electron transfer,and the results showed that the quantum efficiency is a func-tion of the donor-acceptor interfacial area. However, thetopic of quantitative characterization of the morphology andits relation to the photovoltaic performance remains largelyunexplored.
In the present work, using Monte Carlo simulations ofmorphology generation and carrier transport, we correlate theannealing process in the fabrication stage with the photocur-rent and use this relationship to evaluate different morpholo-gies. We introduce the concept of correlation distance as asimple experimentally accessible way of characterizing two-phase morphologies, which allows us to describe the optimalmorphology quantitatively.
II. MONTE CARLO MODELING OF POLYMER SOLARCELLS
We use a 2D lattice system to model the solar cell de-vice. The active layer of the solar cell is described as a 2Dmatrix with each element representing an N-type �acceptor�material or a P-type �donor� material at its position. Thecathode and anode are modeled as two extra rows appendedto the top and the bottom of the matrix.
A. Morphological evolution
The inherent properties of intermolecular interactionsand conformational entropies of the electron donor and ac-ceptor molecules in polymer blends are such that moleculesof a given kind prefer to be surrounded by molecules of thesame kind. Therefore, upon annealing, the system tends to
a�Electronic mail: [email protected]�Electronic mail: [email protected].
JOURNAL OF APPLIED PHYSICS 104, 024504 �2008�
0021-8979/2008/104�2�/024504/6/$23.00 © 2008 American Institute of Physics104, 024504-1
Downloaded 21 Jul 2008 to 133.1.187.130. Redistribution subject to AIP license or copyright; see http://jap.aip.org/jap/copyright.jsp

phase separate and decrease the degree of intermixing be-tween the two phases; the degree of phase separation is com-monly characterized by the total interfacial area between thetwo polymers.
Since the phase separation in polymer systems is usuallya process driven by entropy �which is larger in the phase-separated state than in the mixed state�, we calculate the totalfree energy, F=E−TS, as a product of temperature and en-tropy only, neglecting the energy term altogether. In our 2Dmodel, each grid point on a simple square lattice stands for asite, which can be occupied either by an N- or a P-typemolecule. The entropy and free energy associated with a sitei are calculated using the nearest-neighbor Ising model ex-pression:
Si = J�j
N
sisj ,
Fi = − TS = − TJ�j
N
sisj , �1�
where J is the coupling constant and the discrete spinlikevariables si and sj denote the identities of phases for sites iand j, taking the values of +1 and −1 for the N- and P-typephases, respectively. Since molecules beyond the nearestneighbors will have a relatively small effect on the entropyof site i, their effect is not included in Eq. �1�. Then the totalfree energy is calculated as
Fi = − TJ�i
�j�NNi
sisj . �2�
A standard nearest-neighbor exchange Monte Carlomethod �Kawasaki dynamics� is used to simulate the kineticsof phase separation. We start from a random distribution ofthe two phases on the lattice sites. At each Monte Carlo step,we randomly pick two nearest-neighbor sites, swap them,and calculate the change in the total free energy, �F. Theacceptance probability depends on the change in the totalfree energy as
P��F� =1
1 + exp� �F
kBT� . �3�
The main simplification of our model is the linear tem-perature dependence of the free energy in Eq. �2�, whichresults in a temperature-independent Boltzmann weight inEq. �3�. This leads to computer-generated morphologies thatdepend only on the number of Monte Carlo steps. Tempera-ture enters the kinetics of diffusion via the actual time rep-resented by each Monte Carlo step. However, in real experi-ments, variations in the temperature will influence not onlythe diffusion rate but also the evaporation rate of solvent,crystallinity of the polymer, and many other factors that aredifficult to treat within the simple Ising model. Future studiesconsidering the solvent annealing and evaporation effectswill give a more realistic temperature dependence of mor-phologies. Nevertheless, Eqs. �1�–�3� provide sequences ofprototypical morphologies, which are sufficient for our pur-
pose of establishing the relation between the degree of phaseseparation and the performance of polymer solar cells.
B. Exciton generation and diffusion
For each generated morphology, the established four-step mechanism of photocurrent generation �exciton genera-tion, exciton migration, exciton dissociation into an electron-hole pair, and free carrier transport� is simulated to assess theefficiency of the solar cell. We assume that, under a fixedlight intensity, the excitons are generated at a constant rateand their transport within the cell occurs through diffusion.In our simulation, the diffusion of excitons is simulated usingthe random walk model. The jump frequency of the randomwalk is proportional to the diffusion coefficient D, resultingin an average diffusion distance l that is proportional to thesquare root of the diffusion time t:
l = �4Dt . �4�
C. Transport of charge carriers
It is generally accepted that the free carrier transport inpolymers follows hopping dynamics, which can be simulatedas the hopping of an electron or a hole from one site toanother with a rate decided by the energy difference andhopping distance. We adopt the Gaussian disorder model19
for the distribution of energy states and the Miller–Abrahammodel20 for calculating the hopping rates. The hopping ratecan be written in the following form:
W = W0 exp�−�E
kBT� , �5�
where W0 is a coefficient decided by the carrier mobility andby the distance between the initial and final sites. In theabsence of an electric field, �E is determined by the energydifference between the initial and the final site; in this case,the carrier transport is dominated by diffusion. The hoppingrate can be calculated in a manner similar to the excitonicdiffusion considered in the previous section, while the diffu-sion coefficient can be obtained from the Einstein relation:
D = �kBT
q, �6�
where � is the carrier mobility and q is the charge of anelectron. In the presence of an electric field, which can beintroduced by a work function difference between the elec-trodes and/or by an external bias, the energy change alsodepends on the field and is given by
�E = U2 − U1 − qEd , �7�
where U1 and U2 are the initial potential energies of sites 1and 2, E is the electric field from site 1 to site 2, d is thehopping distance, and q is the carrier charge, which is posi-tive for holes and negative for electrons.
The bimolecular recombination rate of electrons andholes is given by the following relation:21
024504-2 Lei et al. J. Appl. Phys. 104, 024504 �2008�
Downloaded 21 Jul 2008 to 133.1.187.130. Redistribution subject to AIP license or copyright; see http://jap.aip.org/jap/copyright.jsp

R = ��np − nintpint� , �8�
where n and p are the total carrier concentrations, nint and pint
are the intrinsic carrier concentrations, and � is a constantdetermined by the mobilities of electrons and holes. The in-trinsic carriers are neglected here because their concentrationis small in comparison with the concentration of photogener-ated carriers. At every step of the Monte Carlo simulation,each electron is assigned a probability for recombination thatis proportional to the number of holes. Therefore, the overallrecombination rate is proportional to the product of n and p.
A kinetic Monte Carlo approach is used to simulate themovement of electrons and holes in the active layer. At eachtime step, a random move is attempted for each carrier, andthe probability of accepting this move is decided by thechange in the carrier energy according to Eq. �5�. The pho-tocurrent is calculated from the extraction rate of holes andelectrons at the electrodes.
D. Model parameters
In the morphology generation, we set J /kB, the nearest-neighbor interaction in the Ising model, to 1. The value of Jis strongly material dependent and accurate data are difficultto obtain. As discussed in Sec. II A, the morphological evo-lution in our study depends only on the number of MonteCarlo steps and is insensitive to the numerical value of thisparameter.
In our simulations of carrier transport, we used typicalexperimental data for the poly�3-hexylthiophene�/�6,6�-phenyl-C61-butyric acid methyl ester �P3HT/PCBM� sys-tem. Indium in oxide �ITO� is used for anode and calcium isused for cathode. The rate of exciton generation is based on100 mW light injection, and the device thickness is set to100 nm. Input data for our simulations are listed in Table I.
In both morphology generation and charge transport situ-ations, each grid point in the 2D map stands for 1 nm, whichmeans that each site has the statistical properties over a re-gion with side length of 1 nm. The length scale of severalnanometers will be enough for characterizing nanoscalephase separation, as suggested by typical transmission elec-tron microscopy �TEM� or scanning electron microscopy im-ages.
III. RESULTS AND DISCUSSION
A. Phase separation
Figure 1 shows the effect of annealing conditions on themorphology due to different annealing times, as measured bythe number of Monte Carlo steps. Comparison of Figs. 1�a�and 1�b� shows that increasing the annealing time leads tomore phase-separated morphologies. The degree of phaseseparation can be measured quantitatively using the total en-tropy of the Ising model and the interfacial area between thephases �or the interface length in two dimensions�. The in-terface length is measured by simply adding up the sidelengths of cell borders where different phases lie on twosides. Due to the assumptions of our model, the total entropycorrelates very well with the total length of the interface.Figure 2 shows the relation between the area and entropy,exhibiting a highly linear behavior.
TABLE I. Experimental setting for simulation.
Parameter Value Unit
Exciton generation rate 4�1027 m−3 s−1
Exciton lifetime 0.5 nsExciton diffusion length 10 nmCarrier mobility 0.001 cm2 s−1 V−1
Work function of ITO/PEDOT −5.1 eVWork function of Ca −2.9 eVHOMO of P3HT −4.9 eVLUMO of P3HT −3.0 eVHOMO of PCBM −6.3 eVLUMO of PCBM −3.7 eV
FIG. 1. �Color online� Typical simulation results for morphology genera-tion, showing the influence of annealing time: �a� 108 Monte Carlo steps; �b�109 Monte Carlo steps.
FIG. 2. Relation between the Ising model entropy and the interfacial area.
024504-3 Lei et al. J. Appl. Phys. 104, 024504 �2008�
Downloaded 21 Jul 2008 to 133.1.187.130. Redistribution subject to AIP license or copyright; see http://jap.aip.org/jap/copyright.jsp

B. Carrier transport
We have compared the carrier transport behavior for allgenerated morphologies. Figure 3 shows I-V curves for twotypical samples with different morphologies. Since we didnot consider the dark current, i.e., the injection of holes andelectrons from the circuit, the current saturates because of thelimit on the exciton generation. The two curves in Fig. 3correspond to simulations on two cells with different mor-phologies. Obviously, the one with the larger current �mor-phology 2� is more desired.
Figure 4 shows the dependence of the short circuit cur-rent on the interfacial area for all our generated morpholo-gies. There is a clear trend of an optimal range for the inter-facial area, which produces the highest photovoltaic current.Below the optimal range, we have systems with smaller in-terfacial area �higher degree of phase separation� where therate of the electron-hole pair generation constrains the cur-rent. Above the optimal range lie systems with too muchinterface, which are limited by inefficient conducting pathsand high electron-hole recombination rates.9 The error barsin Fig. 4 give the standard deviations of the current andinterfacial area for different runs with the same number ofMonte Carlo steps. The scatter in the simulated photocurrentvalues is due to finite-size effects and morphological infor-mation that is not contained in the interfacial area, i.e., withthe same degree of phase separation, two solar cells mayhave different behaviors depending on the higher-order de-tails of phase distribution in the finite area between the elec-trodes.
C. Correlation distance
Results of the preceding section show that the interfacialarea can be used to characterize the efficiency of solar cells.However, the interfacial area is not a convenient parameterto adopt in practice since it is difficult to measure usingmicroscopy, especially for a three-dimensional system. Herewe introduce a simple scalar function that can be easily cal-culated from a 2D image and assess its efficiency for predict-ing the performance of solar cells.
The correlation distance is obtained from the pair corre-lation function �,22 which is defined as
�ij =sisj − sisj
�si�sj
= sisj , �9�
where �siis the rms fluctuation of the spin variable si. The
correlation function �ij is a function of the distance betweensites i and j, and in practice, it is obtained by averaging theproduct si sj over all pairs separated by a certain distance�Ri−Rj�.
Figure 5 shows the correlation function for a samplemorphology, which was obtained after 1�1010 Monte Carlosteps. It shows that for a phase-separated morphology, thecorrelation drops as distance increases, exhibiting a rela-tively long oscillatory tail. Choosing a threshold in the cor-relation value ��=0.5 in Fig. 5�, we define a correlation dis-tance �, meaning that pairs at distances smaller than thisvalue are strongly correlated. In other words, the correlationdistance gives the characteristic average radius of regionswith high probabilities of finding molecules of one type.
The correlation distance can be used to correlate thesimulated morphologies with TEM images of solar cells.Figure 6 shows TEM images of a solar cell before and afterannealing. This solar cell was found to be one of the mosthighly efficient ones produced in our group.23 After filteringthe low- and high-frequency portions, which are due to non-uniformity of light and due to noise and aliasing,24 respec-tively, we can determine the correlation distance using thesame definition as in the simulation. The results are 2 nmbefore annealing and 3 nm after annealing. The latter valueis close to the optimal correlation distance from our simula-tion, as calculated in the next section.
FIG. 3. �Color online� Simulated photocurrent curves for solar cells withdifferent morphologies.
FIG. 4. Relation between the short circuit current and the interfacial area.
FIG. 5. Correlation function of a sample morphology.
024504-4 Lei et al. J. Appl. Phys. 104, 024504 �2008�
Downloaded 21 Jul 2008 to 133.1.187.130. Redistribution subject to AIP license or copyright; see http://jap.aip.org/jap/copyright.jsp

D. Using the correlation distance
The relation between the correlation distance and theinterfacial area is shown in Fig. 7. There is an approximateinverse relationship between the two, which implies that, fora 2D system of a given size, the product of these parametersis constant. In other words, the reciprocal correlation dis-tance contains almost the same information as the interfacial
area. However, the correlation distance is more useful since�a� the correlation distance can be easily determined fromTEM images, while the interfacial area is difficult to measurefrom microscopy, and �b� the correlation distance is not onlya description of the phase boundaries but also a statisticalparameter considering both the interface and bulk sites. Asshown in Fig. 8, the two morphologies have exactly the sameinterfacial area, but Fig. 8�a� generates more photocurrentthan Fig. 8�b� as a result of a better conduction path. Thisimportant difference is well characterized by the correlationdistance �4.4 nm in �a� and 9.4 nm in �b��.
The correlation distance can also be used to characterizethe kinetics of phase separation. Figure 9 shows the MonteCarlo time dependence of the correlation distance. At longtimes, the rate of increase in � follows the relation
� � t1/2, �10�
which is consistent with theoretical predictions for the kinet-ics of phase separation in two dimensions.25 These resultsshow that by measuring the correlation distance of real sys-tems over time, it should be possible to correlate the degreeof phase separation in experiments with our simulation re-sults.
Figure 10 shows the relation between the short circuitcurrent and the correlation distance. This figure tells a storythat is similar to the plot of the current versus the interfacialarea in Fig. 4, except that we can draw a further quantitativeconclusion that in this case the optimal degree of phase sepa-ration can be characterized by a correlation distance of ap-proximately 4 nm.
FIG. 6. TEM images of a typical PCBM/P3HT solar cell �a� before and �b�after annealing.
FIG. 7. Relation between the correlation distance and reciprocal interfacialarea.
FIG. 8. �Color online� Morphologies with the same interfacial area butdifferent correlation distances.
FIG. 9. Correlation distance as a function of the number of Monte Carlosteps.
024504-5 Lei et al. J. Appl. Phys. 104, 024504 �2008�
Downloaded 21 Jul 2008 to 133.1.187.130. Redistribution subject to AIP license or copyright; see http://jap.aip.org/jap/copyright.jsp
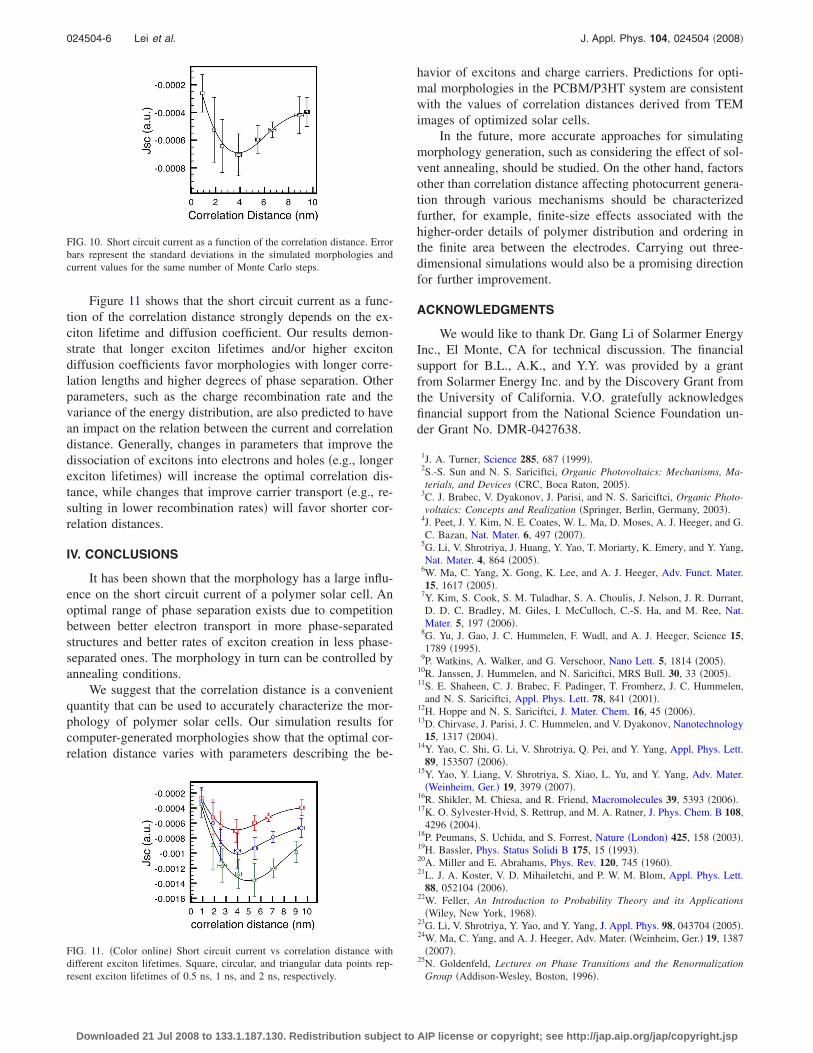
Figure 11 shows that the short circuit current as a func-tion of the correlation distance strongly depends on the ex-citon lifetime and diffusion coefficient. Our results demon-strate that longer exciton lifetimes and/or higher excitondiffusion coefficients favor morphologies with longer corre-lation lengths and higher degrees of phase separation. Otherparameters, such as the charge recombination rate and thevariance of the energy distribution, are also predicted to havean impact on the relation between the current and correlationdistance. Generally, changes in parameters that improve thedissociation of excitons into electrons and holes �e.g., longerexciton lifetimes� will increase the optimal correlation dis-tance, while changes that improve carrier transport �e.g., re-sulting in lower recombination rates� will favor shorter cor-relation distances.
IV. CONCLUSIONS
It has been shown that the morphology has a large influ-ence on the short circuit current of a polymer solar cell. Anoptimal range of phase separation exists due to competitionbetween better electron transport in more phase-separatedstructures and better rates of exciton creation in less phase-separated ones. The morphology in turn can be controlled byannealing conditions.
We suggest that the correlation distance is a convenientquantity that can be used to accurately characterize the mor-phology of polymer solar cells. Our simulation results forcomputer-generated morphologies show that the optimal cor-relation distance varies with parameters describing the be-
havior of excitons and charge carriers. Predictions for opti-mal morphologies in the PCBM/P3HT system are consistentwith the values of correlation distances derived from TEMimages of optimized solar cells.
In the future, more accurate approaches for simulatingmorphology generation, such as considering the effect of sol-vent annealing, should be studied. On the other hand, factorsother than correlation distance affecting photocurrent genera-tion through various mechanisms should be characterizedfurther, for example, finite-size effects associated with thehigher-order details of polymer distribution and ordering inthe finite area between the electrodes. Carrying out three-dimensional simulations would also be a promising directionfor further improvement.
ACKNOWLEDGMENTS
We would like to thank Dr. Gang Li of Solarmer EnergyInc., El Monte, CA for technical discussion. The financialsupport for B.L., A.K., and Y.Y. was provided by a grantfrom Solarmer Energy Inc. and by the Discovery Grant fromthe University of California. V.O. gratefully acknowledgesfinancial support from the National Science Foundation un-der Grant No. DMR-0427638.
1J. A. Turner, Science 285, 687 �1999�.2S.-S. Sun and N. S. Sariciftci, Organic Photovoltaics: Mechanisms, Ma-terials, and Devices �CRC, Boca Raton, 2005�.
3C. J. Brabec, V. Dyakonov, J. Parisi, and N. S. Sariciftci, Organic Photo-voltaics: Concepts and Realization �Springer, Berlin, Germany, 2003�.
4J. Peet, J. Y. Kim, N. E. Coates, W. L. Ma, D. Moses, A. J. Heeger, and G.C. Bazan, Nat. Mater. 6, 497 �2007�.
5G. Li, V. Shrotriya, J. Huang, Y. Yao, T. Moriarty, K. Emery, and Y. Yang,Nat. Mater. 4, 864 �2005�.
6W. Ma, C. Yang, X. Gong, K. Lee, and A. J. Heeger, Adv. Funct. Mater.15, 1617 �2005�.
7Y. Kim, S. Cook, S. M. Tuladhar, S. A. Choulis, J. Nelson, J. R. Durrant,D. D. C. Bradley, M. Giles, I. McCulloch, C.-S. Ha, and M. Ree, Nat.Mater. 5, 197 �2006�.
8G. Yu, J. Gao, J. C. Hummelen, F. Wudl, and A. J. Heeger, Science 15,1789 �1995�.
9P. Watkins, A. Walker, and G. Verschoor, Nano Lett. 5, 1814 �2005�.10R. Janssen, J. Hummelen, and N. Sariciftci, MRS Bull. 30, 33 �2005�.11S. E. Shaheen, C. J. Brabec, F. Padinger, T. Fromherz, J. C. Hummelen,
and N. S. Sariciftci, Appl. Phys. Lett. 78, 841 �2001�.12H. Hoppe and N. S. Sariciftci, J. Mater. Chem. 16, 45 �2006�.13D. Chirvase, J. Parisi, J. C. Hummelen, and V. Dyakonov, Nanotechnology
15, 1317 �2004�.14Y. Yao, C. Shi, G. Li, V. Shrotriya, Q. Pei, and Y. Yang, Appl. Phys. Lett.
89, 153507 �2006�.15Y. Yao, Y. Liang, V. Shrotriya, S. Xiao, L. Yu, and Y. Yang, Adv. Mater.
�Weinheim, Ger.� 19, 3979 �2007�.16R. Shikler, M. Chiesa, and R. Friend, Macromolecules 39, 5393 �2006�.17K. O. Sylvester-Hvid, S. Rettrup, and M. A. Ratner, J. Phys. Chem. B 108,
4296 �2004�.18P. Peumans, S. Uchida, and S. Forrest, Nature �London� 425, 158 �2003�.19H. Bassler, Phys. Status Solidi B 175, 15 �1993�.20A. Miller and E. Abrahams, Phys. Rev. 120, 745 �1960�.21L. J. A. Koster, V. D. Mihailetchi, and P. W. M. Blom, Appl. Phys. Lett.
88, 052104 �2006�.22W. Feller, An Introduction to Probability Theory and its Applications
�Wiley, New York, 1968�.23G. Li, V. Shrotriya, Y. Yao, and Y. Yang, J. Appl. Phys. 98, 043704 �2005�.24W. Ma, C. Yang, and A. J. Heeger, Adv. Mater. �Weinheim, Ger.� 19, 1387
�2007�.25N. Goldenfeld, Lectures on Phase Transitions and the Renormalization
Group �Addison-Wesley, Boston, 1996�.
FIG. 10. Short circuit current as a function of the correlation distance. Errorbars represent the standard deviations in the simulated morphologies andcurrent values for the same number of Monte Carlo steps.
FIG. 11. �Color online� Short circuit current vs correlation distance withdifferent exciton lifetimes. Square, circular, and triangular data points rep-resent exciton lifetimes of 0.5 ns, 1 ns, and 2 ns, respectively.
024504-6 Lei et al. J. Appl. Phys. 104, 024504 �2008�
Downloaded 21 Jul 2008 to 133.1.187.130. Redistribution subject to AIP license or copyright; see http://jap.aip.org/jap/copyright.jsp