Quantifying the Pore Size Spectrum of Macropore-Type Preferential Pathways under Transient Flow
13
Reproduced from Soil Science Society of America Journal. Published by Soil Science Society of America. All copyrights reserved. Quantifying Pore-Size Spectrum of Macropore-Type Preferential Pathways K.-J. S. Kung,* M. Hanke, C. S. Helling, E. J. Kladivko, T. J. Gish, T. S. Steenhuis, and D. B. Jaynes ABSTRACT 1981; Gish and Jury, 1983; Edwards et al., 1993). Both physical and biological processes have temporal and Structural pores associated with macropore-type preferential flow spatial patterns of formation and destruction cycles pathways can accelerate chemical transport in unsaturated soils, thereby potentially causing groundwater contamination. To predict chemical (Gupta et al., 2002). Tillage practices and compaction, transport through these pathways, classical deterministic models de- for example, often destroy the continuity of large struc- pend on soil hydraulic conductivity, which effectively lumps flow con- tural pores (Isensee et al., 1990). The coefficient of vari- tributions from all individual pathways. We contend, however, that quan- ation of soil hydraulic conductivity, which is often dic- tifying the pore spectrum of preferential pathways, without lumping the tated by the soil structural pores, ranged from 100 to contributions of individual pores, is the appropriate method for simu- 400% (Libardi et al., 1980; Warrick and Nielsen, 1980). lating convective chemical transport through macropore-type prefer- This suggests that the spatial variability of soil structural ential pathways. In this study, we conducted field-scale experiments pores measured by using core- or block-sized samples is by using an improved tile drain monitoring protocol to measure the very large. As a result, the size spectrum of large struc- mass flux breakthrough patterns of conservative tracers. The tails of tural pores measured at several random locations by these patterns suggested that the impact of preferential pathways on contaminant transport can be conceptualized as that occurring through small sample sizes in a field may not represent the spec- cylindrical capillary tubes. We then proposed a distribution function trum of the entire field. Temporal extrapolation of mea- bracketed by sharp cut-off points to represent the pore spectrum of surements may be similarly invalid. For these reasons, these tubes. Finally, we used the measured tracer breakthrough curves it is difficult to directly measure the field-scale spectrum (BTCs) as data sources to find the parameters of the proposed func- of the large structural pores, yet this property is among tion. Our results, based on the best fitting, showed that the preferential the most important soil properties when dealing with pathways are naturally clustered into domains; preferential pathways issues related to water quality. with a wide range of pore radii could become active simultaneously Soil characteristic curves and hydraulic conductivity when infiltration rate increases. Because the derived pore spectra si- curves were used in past research from the 1950s and multaneously satisfy both water movement and solute transport, pore 1960s [summarized by Hillel (1980, p. 183–185) and Jury spectra can be used to (i) calculate soil hydraulic conductivity of pref- erential pathways in deterministic approaches, and (ii) construct multi- et al. (1991, p. 89–94)] to quantify the soil pore-size ple probability density functions (PDFs) for the transfer function ap- distribution. However, because these curves were typi- proach, to accommodate different infiltration patterns. cally measured using homogenized soils where the larger soil structural pores were destroyed, these earlier approaches only addressed the matrix pore spectrum T he soil ’ s capacity to store water and nutrients fa- among primary particles after homogenization. Later, in- cilitates the hydrological and biogeochemical cycles tact soil samples such as soil cores or blocks were used; critical for the existence of terrestrial ecosystems. This however, even intact samples cannot capture the vari- capacity hinges on the porous nature of soils. Natural ability and continuity of field-scale, large secondary soils have a spectrum of pores with radii generally rang- structural pores (Shipitalo and Edwards, 1993). ing from 10 3 to 10 7 m. The smaller soil matrix pores Large structural pores can contribute to macropore- are comprised of textural voids among the soil primary type preferential flow, and field experiments confirmed particles, while the larger pores are often made of struc- that flow via such pathways bypassed the far-more-prev- tural voids among the soil secondary structures. The alent soil matrix pores to cause rapid and deep chemical matrix pores are always interconnected and usually self- leaching (Germann and Beven, 1981; Luxmoore, 1991; similar. Large secondary structural pores are likely to Helling and Gish, 1991). Kladivko et al. (1999) showed exhibit more complexity. Their formation is dictated by that 50% of the total annual pesticide loss generally physical (e.g., shrinking and swelling, wetting and dry- occurred during the first major precipitation event of ing, or freezing and thawing) and biological (e.g., pene- 25 mm rain after pesticide application. Fast break- tration and movement of living organisms) forces (Bouma, through patterns of adsorbing chemicals through macro- pore-type preferential flow resembled those of conser- K.-J.S. Kung and M. Hanke, Dep. Soil Science, Univ. of Wisconsin- vative nonadsorbing chemicals (Kladivko et al., 1999; Madison, Madison, WI 53706-1299; C.S. Helling, Sustainable Peren- Kung et al., 2000b; Fortin et al., 2002). In analogous cases, nial Crops Lab., and T.J. Gish, Hydrology Lab., USDA-ARS, BARC-W, deep leaching of P through preferential transport was Beltsville, MD 20705-2350; E.J. Kladivko, Dep. Agronomy, Purdue found, even though P loss is assumed to occur mainly by Univ., West Lafayette, IN 47907; T.S. Steenhuis, Dep. Biological and surface runoff (Hergert et al., 1981; Stamm et al., 1998; Environmental Engineering, Cornell Univ., Ithaca, NY 14850; D.B. Jaynes, National Soil Tilth Lab., USDA-ARS, Ames, IA 50011. Re- and Beauchemin et al., 1998). Beside agrichemicals, ceived 25 June 2004. *Corresponding author ([email protected]). pathogenic microorganisms such as fecal coliforms and Published in Soil Sci. Soc. Am. J. 69:1196–1208 (2005). Soil Physics Abbreviations: 1-D, one-dimensional; BTC, breakthrough curve; CDE, convection–dispersion equation; PDF, probability density function; doi:10.2136/sssaj2004.0208 © Soil Science Society of America PFBA, pentafluorobenzoic acid; o-TFMBA, o-trifluoromethylben- zoic acid. 677 S. Segoe Rd., Madison, WI 53711 USA 1196 Published online June 28, 2005
-
Upload
independent -
Category
Documents
-
view
2 -
download
0
Transcript of Quantifying the Pore Size Spectrum of Macropore-Type Preferential Pathways under Transient Flow
Rep
rodu
ced
from
Soi
l Sci
ence
Soc
iety
of A
mer
ica
Jour
nal.
Pub
lishe
d by
Soi
l Sci
ence
Soc
iety
of A
mer
ica.
All
copy
right
s re
serv
ed.
Quantifying Pore-Size Spectrum of Macropore-Type Preferential Pathways
K.-J. S. Kung,* M. Hanke, C. S. Helling, E. J. Kladivko, T. J. Gish, T. S. Steenhuis, and D. B. Jaynes
ABSTRACT 1981; Gish and Jury, 1983; Edwards et al., 1993). Bothphysical and biological processes have temporal andStructural pores associated with macropore-type preferential flowspatial patterns of formation and destruction cyclespathways can accelerate chemical transport in unsaturated soils, thereby
potentially causing groundwater contamination. To predict chemical (Gupta et al., 2002). Tillage practices and compaction,transport through these pathways, classical deterministic models de- for example, often destroy the continuity of large struc-pend on soil hydraulic conductivity, which effectively lumps flow con- tural pores (Isensee et al., 1990). The coefficient of vari-tributions from all individual pathways. We contend, however, that quan- ation of soil hydraulic conductivity, which is often dic-tifying the pore spectrum of preferential pathways, without lumping the tated by the soil structural pores, ranged from 100 tocontributions of individual pores, is the appropriate method for simu- 400% (Libardi et al., 1980; Warrick and Nielsen, 1980).lating convective chemical transport through macropore-type prefer-
This suggests that the spatial variability of soil structuralential pathways. In this study, we conducted field-scale experimentspores measured by using core- or block-sized samples isby using an improved tile drain monitoring protocol to measure thevery large. As a result, the size spectrum of large struc-mass flux breakthrough patterns of conservative tracers. The tails oftural pores measured at several random locations bythese patterns suggested that the impact of preferential pathways on
contaminant transport can be conceptualized as that occurring through small sample sizes in a field may not represent the spec-cylindrical capillary tubes. We then proposed a distribution function trum of the entire field. Temporal extrapolation of mea-bracketed by sharp cut-off points to represent the pore spectrum of surements may be similarly invalid. For these reasons,these tubes. Finally, we used the measured tracer breakthrough curves it is difficult to directly measure the field-scale spectrum(BTCs) as data sources to find the parameters of the proposed func- of the large structural pores, yet this property is amongtion. Our results, based on the best fitting, showed that the preferential the most important soil properties when dealing withpathways are naturally clustered into domains; preferential pathways
issues related to water quality.with a wide range of pore radii could become active simultaneouslySoil characteristic curves and hydraulic conductivitywhen infiltration rate increases. Because the derived pore spectra si-
curves were used in past research from the 1950s andmultaneously satisfy both water movement and solute transport, pore1960s [summarized by Hillel (1980, p. 183–185) and Juryspectra can be used to (i) calculate soil hydraulic conductivity of pref-
erential pathways in deterministic approaches, and (ii) construct multi- et al. (1991, p. 89–94)] to quantify the soil pore-sizeple probability density functions (PDFs) for the transfer function ap- distribution. However, because these curves were typi-proach, to accommodate different infiltration patterns. cally measured using homogenized soils where the
larger soil structural pores were destroyed, these earlierapproaches only addressed the matrix pore spectrum
The soil’s capacity to store water and nutrients fa- among primary particles after homogenization. Later, in-cilitates the hydrological and biogeochemical cycles tact soil samples such as soil cores or blocks were used;
critical for the existence of terrestrial ecosystems. This however, even intact samples cannot capture the vari-capacity hinges on the porous nature of soils. Natural ability and continuity of field-scale, large secondarysoils have a spectrum of pores with radii generally rang- structural pores (Shipitalo and Edwards, 1993).ing from 10�3 to 10�7 m. The smaller soil matrix pores Large structural pores can contribute to macropore-are comprised of textural voids among the soil primary type preferential flow, and field experiments confirmedparticles, while the larger pores are often made of struc- that flow via such pathways bypassed the far-more-prev-tural voids among the soil secondary structures. The alent soil matrix pores to cause rapid and deep chemicalmatrix pores are always interconnected and usually self- leaching (Germann and Beven, 1981; Luxmoore, 1991;similar. Large secondary structural pores are likely to Helling and Gish, 1991). Kladivko et al. (1999) showedexhibit more complexity. Their formation is dictated by that �50% of the total annual pesticide loss generallyphysical (e.g., shrinking and swelling, wetting and dry- occurred during the first major precipitation event ofing, or freezing and thawing) and biological (e.g., pene- �25 mm rain after pesticide application. Fast break-tration and movement of living organisms) forces (Bouma, through patterns of adsorbing chemicals through macro-
pore-type preferential flow resembled those of conser-K.-J.S. Kung and M. Hanke, Dep. Soil Science, Univ. of Wisconsin- vative nonadsorbing chemicals (Kladivko et al., 1999;Madison, Madison, WI 53706-1299; C.S. Helling, Sustainable Peren- Kung et al., 2000b; Fortin et al., 2002). In analogous cases,nial Crops Lab., and T.J. Gish, Hydrology Lab., USDA-ARS, BARC-W, deep leaching of P through preferential transport wasBeltsville, MD 20705-2350; E.J. Kladivko, Dep. Agronomy, Purdue
found, even though P loss is assumed to occur mainly byUniv., West Lafayette, IN 47907; T.S. Steenhuis, Dep. Biological andsurface runoff (Hergert et al., 1981; Stamm et al., 1998;Environmental Engineering, Cornell Univ., Ithaca, NY 14850; D.B.
Jaynes, National Soil Tilth Lab., USDA-ARS, Ames, IA 50011. Re- and Beauchemin et al., 1998). Beside agrichemicals,ceived 25 June 2004. *Corresponding author ([email protected]). pathogenic microorganisms such as fecal coliforms andPublished in Soil Sci. Soc. Am. J. 69:1196–1208 (2005).Soil Physics Abbreviations: 1-D, one-dimensional; BTC, breakthrough curve; CDE,
convection–dispersion equation; PDF, probability density function;doi:10.2136/sssaj2004.0208© Soil Science Society of America PFBA, pentafluorobenzoic acid; o-TFMBA, o-trifluoromethylben-
zoic acid.677 S. Segoe Rd., Madison, WI 53711 USA
1196
Published online June 28, 2005

Rep
rodu
ced
from
Soi
l Sci
ence
Soc
iety
of A
mer
ica
Jour
nal.
Pub
lishe
d by
Soi
l Sci
ence
Soc
iety
of A
mer
ica.
All
copy
right
s re
serv
ed.
KUNG ET AL.: QUANTIFYING PORE SPECTRUM OF MACROPORE PATHWAYS 1197
viruses (Geohring et al., 1999; Woessner et al., 1998), what were the major findings were described in the Ma-terials and Methods and Results sections, respectively.and antibiotic and hormonal compounds from animal
wastes (Rodvang and Simpkins, 2001), have been trans- Then, a theory was proposed to conceptualize and quan-tify the spectrum of preferential pathways by using theported through preferential flow, thereby causing
groundwater contamination. BTCs as surrogate data sources in the Theory section.Finally, we provided a Discussion to compare our ap-Some lab-scale mapping methods have been devel-
oped to accurately measure pore sizes and connectivity proach with previous chemical transport approaches.of macropore-type preferential pathways (Andersonet al., 2002). However, no instrument is currently avail- MATERIALS AND METHODSable to directly measure the pore spectrum of field-scale, Field experiments were conducted at the Walworth Countymacropore-type preferential pathways. Based on long- Farm in Elkhorn, WI. The research site is located within theterm observations from field experiments, tile-drained Southern Wisconsin and Northern Illinois Drift Plain withplots actually serve as huge intact lysimeters, integrating Pella silt loam soil (fine-silty, mixed, superactive, mesic, Typictotal leaching; therefore, a tile-sampling protocol should Endoaquolls). The tile drain research facility consists of tiles
spaced 18 m apart at a depth of 0.9 to 1.1 m. Two irrigation shedsbe superior to soil coring or suction lysimeter methodswere used, the long side of each shed being parallel to, andfor examining the impact of field-scale macropore-typeoffset 0.3 m from, the center tile line. Within each shed, waterpreferential pathways (Kung et al., 2000a; Kladivkowas applied through eight calibrated nozzles, 2.4 m apart, andet al., 2001; Zehe and Fluhler, 2001; Fortin et al., 2002).mounted on a trolley that oscillated along the length of theNevertheless, these studies were conducted under tran-shed. This design offered high Christiansen uniformity of watersient conditions, where lateral movement of water and application to a 2.7- by 19.2-m area inside the shed under all
chemical among adjacent pathways induced by matric climatic conditions. The layout of tile monitoring procedure,potential gradient would enhance hydrodynamic dis- the irrigation design, and soil properties were described inpersion. To accurately quantify pore spectrum of prefer- detail by Gish et al. (2004) and Hanke et al. (2004).ential pathways, dispersion must be minimized. Three tracer experiments were conducted: two in autumn
2001 and one in spring 2002. In 2001, the long-term steady-Under steady-state conditions, all hydraulically activestate irrigation rate of the first experiment was 1.2 mm h�1,pathways are saturated and could be considered as inde-and 1000 g pentafluorobenzoic acid (PFBA) dissolved in 15 Lpendent pathways where water movement and chemicalof water was applied through the irrigation system. The irriga-transport through each pathway has minimum interac-tion rate of the second 2001 experiment was 2.4 mm h�1, andtion with those in adjacent pathways. In this scenario,500 g o-trifluoromethylbenzoic acid (o-TFMBA) dissolved inthe BTC of a short chemical pulse is the summation of all 15 L of water was applied. In 2002, the irrigation rate was again
BTCs of individual pathways. This suggests that tracer 2.4 mm h�1, with application of 686 g PFBA dissolved in 14 LBTCs measured under different steady-state infiltration of water. There was no residual PFBA detected in tile drain inconditions could serve better to quantify the pore spec- spring 2002. These tracers were chosen because they are con-trum of preferential pathways. On the basis of a tile drain servative and have nearly identical transport properties as bro-
mide in many soils (Jaynes, 1994; Kung et al., 2000a). [Datamonitoring method developed by Richard and Steen-from an earlier experiment conducted by Gish et al. (2004)huis (1988), Gish et al. (2004) measured tracer break-are also included in the overall analyses of tracer mass fluxthrough patterns under two steady-state conditions bybreakthrough patterns in our paper. This study was conductedapplying chemical in a narrow strip, parallel and offseton the same Wisconsin site, using the same techniques, butto a tile line. They found that, at a 0.89 mm h�1 steady-at 4.4 mm h�1.]state infiltration rate, tracer arrival time and peak flux The volumetric flow rate of tile drainage was continuously
time were approximately 90 and 250 h after application, monitored by using a submerged pressure transducer to mea-respectively, and tracer mass flux pattern could be fitted sure water height in a flume with a 15� v-shaped, sharp-edgedperfectly by a one-dimensional (1-D) analytical solution notch. Two days after tile flow reached steady state under aof the convection–dispersion equation (CDE). They con- certain infiltration rate, a short pulse of a conservative tracer
was applied through the irrigation system to the area insidecluded that preferential pathways were not active at thisthe shed, where a valve controlled the water source (eitherinfiltration rate. However, when steady-state infiltrationfrom a tracer tank or from tap water). Water samples were col-rate was increased to 4.4 mm h�1, they found that thelected manually from the tile drain once every 2 min duringtracer was detected in tile drainage only 16 min after ap-the first 2 h and then by samplers every 6 min for the nextplication (Fig. 1) and the breakthrough pattern had a10 h after tracer application to detect the initial tracer break-very early broad peak. This suggested that (i) there was through. The sampling interval gradually increased to every
a threshold, beyond which preferential flow pathways 2 h by the fourth day and was maintained at that interval untilbecame hydraulically active, and (ii) active preferential approximately 25 d after each tracer application.pathways had a wide spectrum of pore radii. A similartrend was observed by Seyfried and Rao (1987).
RESULTSThe objective of this study was to quantify the field-scale pore-size spectrum of macropore-type preferential On the basis of the measured tile flow rate and tracerpathways at different infiltration rates. To explain how concentration in the tile flow, mass flux of each tracerthis goal was accomplished, the rest of the paper has two recovered from the tile drain was calculated and normal-main sections. First, how field experiments were con- ized by the mass of each tracer applied. In the 2.4 mmducted to measure BTCs of conservative tracers under h�1 infiltration study, tracer arrival was detected at ap-
proximately 8 to 10 h after tracer application (or aftertwo different long-term, steady-state infiltration rates and
Rep
rodu
ced
from
Soi
l Sci
ence
Soc
iety
of A
mer
ica
Jour
nal.
Pub
lishe
d by
Soi
l Sci
ence
Soc
iety
of A
mer
ica.
All
copy
right
s re
serv
ed.
1198 SOIL SCI. SOC. AM. J., VOL. 69, JULY–AUGUST 2005
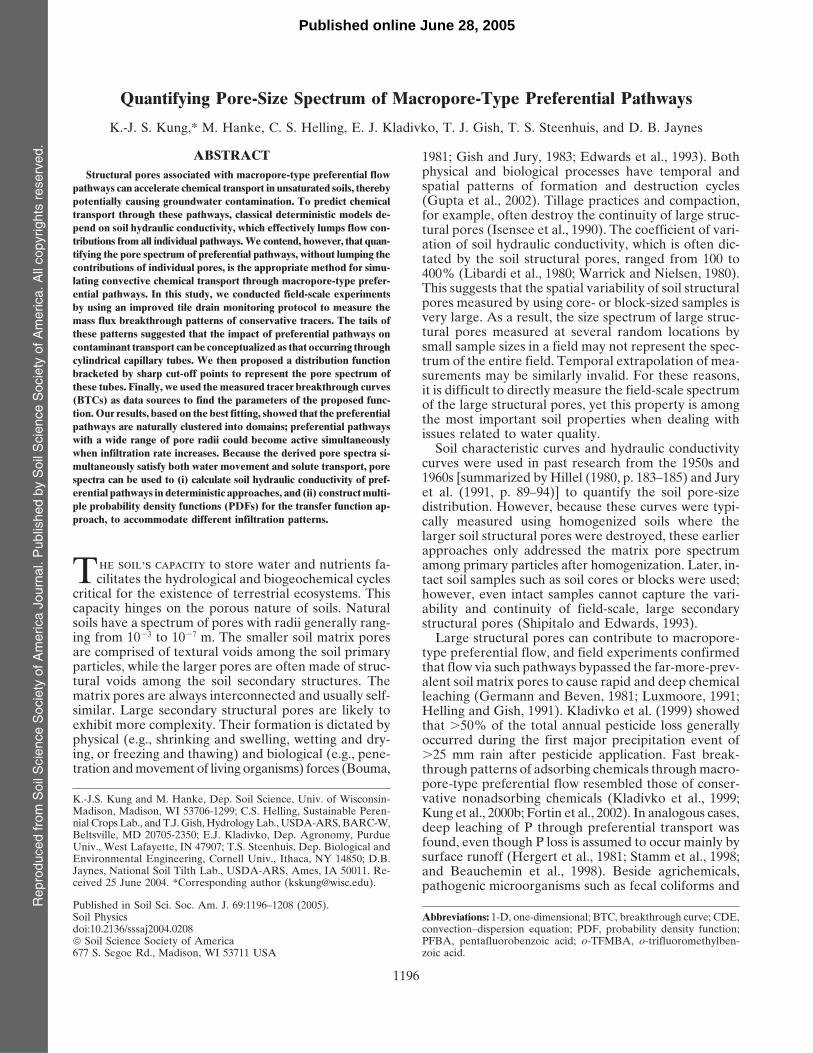
Fig. 1. Bromide breakthrough curve from tile drain under a 4.4 mm h�1 steady-state irrigation rate (from Gish et al., 2004). Calculated curve isbest fit of Eq. [5] to data.
19–24 mm of irrigation); tracer mass flux peaked be- is transported, these results suggest that many preferen-tial pathways with larger pore radii are not hydraulicallytween 75 and 100 h after tracer application (Fig. 2). By
comparison, under the 4.4 mm h�1 steady-state infiltra- active when infiltration rates decreased from 4.4 to2.4 mm h�1.tion rate (Fig. 1 from Gish et al., 2004), the tracer arrived
only 16 min after its application (or after 1.2 mm of ir- To use tracer breakthrough patterns as surrogates toquantify the pore spectrum of preferential pathways, anrigation). Because the arrival time of a conservative tracer
is dictated by pore sizes of pathways in which the tracer area large enough to encompass the spatial variability of
Fig. 2. Tracer breakthrough curves from tile drain under a 2.4 mm h�1 steady-state irrigation rate. The o-TFMBA (o-trifluoromethylbenzoic acid)experiment was conducted in autumn 2001, while the PFBA (pentafluorobenzoic acid) experiment was conducted in spring 2002. Calculatedcurves are best fit of Eq. [5] to data.

Rep
rodu
ced
from
Soi
l Sci
ence
Soc
iety
of A
mer
ica
Jour
nal.
Pub
lishe
d by
Soi
l Sci
ence
Soc
iety
of A
mer
ica.
All
copy
right
s re
serv
ed.
KUNG ET AL.: QUANTIFYING PORE SPECTRUM OF MACROPORE PATHWAYS 1199
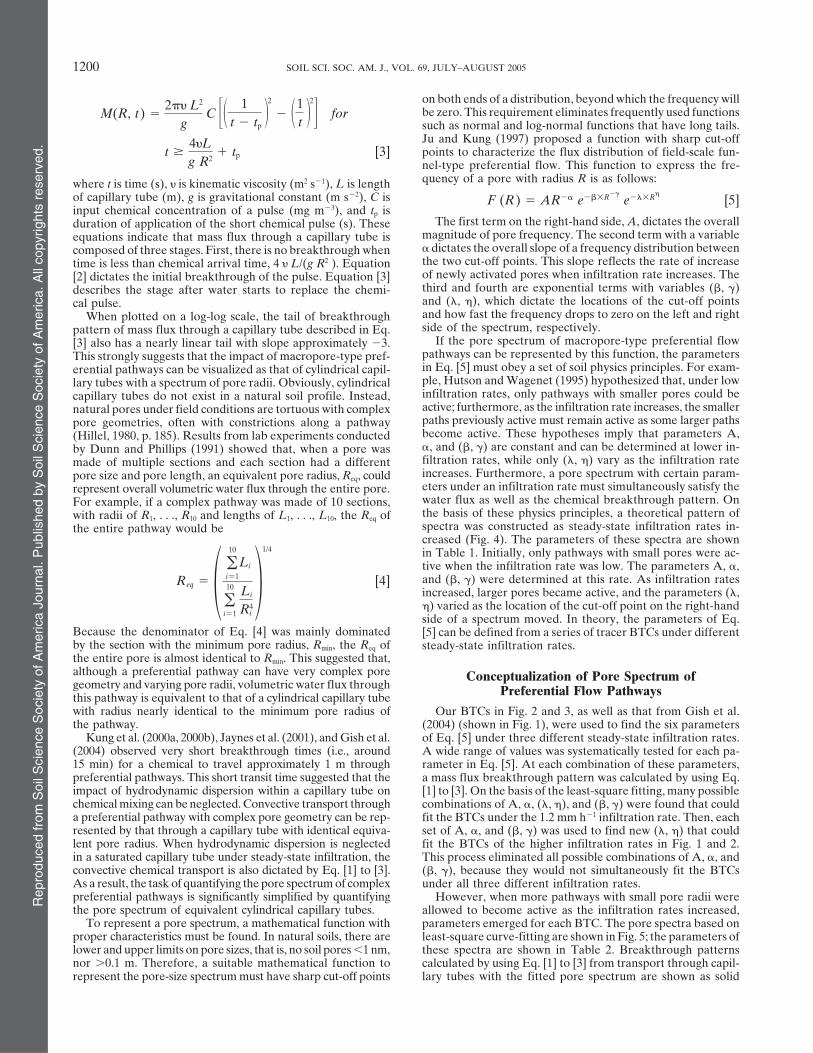
Fig. 3. Pentafluorobenzoic acid (PFBA) breakthrough curve from tile drain under a 1.2 mm h�1 steady-state irrigation rate. Calculated curveis best fit of Eq. [5] to data.
the field-scale preferential pathways should be chosen. the 4 mm h�1 rate (Hanke et al., 2004), water was appliedintermittently under the 1.2 and 2.4 mm h�1 infiltrationHowever, from the literature, the representative area
to sample field-scale preferential pathways is undefined. rates in our experimental design. As explained by Gishet al. (2004), this would cause chemical arrival earlierPublished results addressing the impact of preferential
flow on contaminant transport had significant fluctua- than expected. In Fig. 2, the measured breakthroughpattern under 2.4 mm h�1 infiltration had a small initialtions and variability (Shaw et al., 2000; Williams et al.,
2003). Figure 2 shows that two replicated tracer BTCs arrival from 7 to 10 h. Under the 1.2 mm h�1 infiltrationrate, the measured breakthrough pattern showed twoat 2.4 mm h�1 are very similar. The mass recoveries of
o-TFMBA and PFBA are 87.6 and 90.3% of that applied, distinct slopes, that is, an initial arrival with less-steepslope from 14 to 40 h (Fig. 3). It is assumed that hadrespectively. The o-TFMBA experiment was conducted
after corn harvest in autumn 2001; the PFBA was con- irrigation been applied under a true steady-state rate,these initial breakthroughs would not have happened.ducted in the same field before soybean planting in
spring 2002. Soil temperature at 30 cm dropped below0�C four times during the 2001–2002 winter. The close THEORYmatch of two replicated BTCs indicates that (i) the 2.7 �
Characterization of Pore Spectrum of19.2 m experimental area is representative enough toPreferential Flow Pathwayscapture the field-scale spatial and temporal variability
of preferential pathways, at least at the 2.4 mm h�1 The tails of the tracer BTCs shown in Fig. 1 to 3, as wellas those from Kung et al. (2000a) and Jaynes et al. (2001),rate, and (ii) the field-scale preferential flow pathwaysprovide insight into characterizing the pore spectrum of pref-persisted after several freeze–thaw cycles.erential pathways. These tails plotted on a log-log scale areResults from the 1.2 mm h�1 irrigation are shown innearly linear and have slopes close to �3. For fully developedFig. 3. The PFBA tracer arrived at ≈14 h and peakedlaminar flow through a cylindrical capillary tube with radiusat ≈90 h after tracer application. This again suggestedR (m) under gravitational gradient with negligible entrance-that, as infiltration rates decrease from 2.4 to 1.2 mm length effect and low Reynolds Number (e.g., �0.1), the ana-
h�1, fewer preferential pathways remain hydraulically lytical solution of mass flux M (mg s�1) of a short chemicalactive. Deflections in the BTCs are explainable anoma- pulse by convective transport (i.e., no dispersion) is as followslies, reflective of the difficulties in conducting long-term, (see Appendix A for derivation):steady-state field experiments. For example, fluctuationof o-TFMBA at 20 to 21 h (Fig. 2) occurred when the M(R, t) � 0 for 0 � t �
4�Lg R2
[1]generator used for irrigation was accidentally shut off.The major dip in Fig. 3, at 100 to 200 h, occurred when
M(R, t) � R2 R2g8�
C �1 � �4�LgtR2 �
2
� forthe irrigation system was stopped after an intense thun-derstorm event that caused extensive flooding and sur-face runoff outside the irrigation shed. Furthermore, be- 4�L
g R2 tp � t �
4�Lg R2
[2]cause no nozzles could offer high uniform irrigation below
Rep
rodu
ced
from
Soi
l Sci
ence
Soc
iety
of A
mer
ica
Jour
nal.
Pub
lishe
d by
Soi
l Sci
ence
Soc
iety
of A
mer
ica.
All
copy
right
s re
serv
ed.
1200 SOIL SCI. SOC. AM. J., VOL. 69, JULY–AUGUST 2005
on both ends of a distribution, beyond which the frequency willbe zero. This requirement eliminates frequently used functionsM(R, t) �
2� L2
gC �� 1
t � tp�2
� �1t �
2
� forsuch as normal and log-normal functions that have long tails.Ju and Kung (1997) proposed a function with sharp cut-offpoints to characterize the flux distribution of field-scale fun-t �
4�Lg R2
tp [3]nel-type preferential flow. This function to express the fre-quency of a pore with radius R is as follows:where t is time (s), � is kinematic viscosity (m2 s�1), L is length
of capillary tube (m), g is gravitational constant (m s�2), C is F (R) � AR�� e� �R��e���R�
[5]input chemical concentration of a pulse (mg m�3), and tp is
The first term on the right-hand side, A, dictates the overallduration of application of the short chemical pulse (s). Thesemagnitude of pore frequency. The second term with a variableequations indicate that mass flux through a capillary tube is� dictates the overall slope of a frequency distribution betweencomposed of three stages. First, there is no breakthrough whenthe two cut-off points. This slope reflects the rate of increasetime is less than chemical arrival time, 4 � L/(g R2 ). Equationof newly activated pores when infiltration rate increases. The[2] dictates the initial breakthrough of the pulse. Equation [3]third and fourth are exponential terms with variables ( , �)describes the stage after water starts to replace the chemi-and (�, �), which dictate the locations of the cut-off pointscal pulse.and how fast the frequency drops to zero on the left and rightWhen plotted on a log-log scale, the tail of breakthroughside of the spectrum, respectively.pattern of mass flux through a capillary tube described in Eq.
If the pore spectrum of macropore-type preferential flow[3] also has a nearly linear tail with slope approximately �3.pathways can be represented by this function, the parametersThis strongly suggests that the impact of macropore-type pref-in Eq. [5] must obey a set of soil physics principles. For exam-erential pathways can be visualized as that of cylindrical capil-ple, Hutson and Wagenet (1995) hypothesized that, under lowlary tubes with a spectrum of pore radii. Obviously, cylindricalinfiltration rates, only pathways with smaller pores could becapillary tubes do not exist in a natural soil profile. Instead,active; furthermore, as the infiltration rate increases, the smallernatural pores under field conditions are tortuous with complexpaths previously active must remain active as some larger pathspore geometries, often with constrictions along a pathwaybecome active. These hypotheses imply that parameters A,(Hillel, 1980, p. 185). Results from lab experiments conducted�, and ( , �) are constant and can be determined at lower in-by Dunn and Phillips (1991) showed that, when a pore wasfiltration rates, while only (�, �) vary as the infiltration ratemade of multiple sections and each section had a differentincreases. Furthermore, a pore spectrum with certain param-pore size and pore length, an equivalent pore radius, Req, couldeters under an infiltration rate must simultaneously satisfy therepresent overall volumetric water flux through the entire pore.water flux as well as the chemical breakthrough pattern. OnFor example, if a complex pathway was made of 10 sections,the basis of these physics principles, a theoretical pattern ofwith radii of R1, . . ., R10 and lengths of L1, . . ., L10, the Req ofspectra was constructed as steady-state infiltration rates in-the entire pathway would becreased (Fig. 4). The parameters of these spectra are shownin Table 1. Initially, only pathways with small pores were ac-tive when the infiltration rate was low. The parameters A, �,and ( , �) were determined at this rate. As infiltration ratesReq � � �
10
i�1
Li
�10
i�1
Li
R4i�
1/4
[4]increased, larger pores became active, and the parameters (�,�) varied as the location of the cut-off point on the right-handside of a spectrum moved. In theory, the parameters of Eq.
Because the denominator of Eq. [4] was mainly dominated [5] can be defined from a series of tracer BTCs under differentby the section with the minimum pore radius, Rmin, the Req of steady-state infiltration rates.the entire pore is almost identical to Rmin. This suggested that,although a preferential pathway can have very complex pore Conceptualization of Pore Spectrum ofgeometry and varying pore radii, volumetric water flux through Preferential Flow Pathwaysthis pathway is equivalent to that of a cylindrical capillary tubewith radius nearly identical to the minimum pore radius of Our BTCs in Fig. 2 and 3, as well as that from Gish et al.the pathway. (2004) (shown in Fig. 1), were used to find the six parameters
Kung et al. (2000a, 2000b), Jaynes et al. (2001), and Gish et al. of Eq. [5] under three different steady-state infiltration rates.(2004) observed very short breakthrough times (i.e., around A wide range of values was systematically tested for each pa-15 min) for a chemical to travel approximately 1 m through rameter in Eq. [5]. At each combination of these parameters,preferential pathways. This short transit time suggested that the a mass flux breakthrough pattern was calculated by using Eq.impact of hydrodynamic dispersion within a capillary tube on [1] to [3]. On the basis of the least-square fitting, many possiblechemical mixing can be neglected. Convective transport through combinations of A, �, (�, �), and ( , �) were found that coulda preferential pathway with complex pore geometry can be rep- fit the BTCs under the 1.2 mm h�1 infiltration rate. Then, eachresented by that through a capillary tube with identical equiva- set of A, �, and ( , �) was used to find new (�, �) that couldlent pore radius. When hydrodynamic dispersion is neglected fit the BTCs of the higher infiltration rates in Fig. 1 and 2.in a saturated capillary tube under steady-state infiltration, the This process eliminated all possible combinations of A, �, andconvective chemical transport is also dictated by Eq. [1] to [3]. ( , �), because they would not simultaneously fit the BTCsAs a result, the task of quantifying the pore spectrum of complex under all three different infiltration rates.preferential pathways is significantly simplified by quantifying However, when more pathways with small pore radii werethe pore spectrum of equivalent cylindrical capillary tubes. allowed to become active as the infiltration rates increased,
To represent a pore spectrum, a mathematical function with parameters emerged for each BTC. The pore spectra based onproper characteristics must be found. In natural soils, there are least-square curve-fitting are shown in Fig. 5; the parameters oflower and upper limits on pore sizes, that is, no soil pores �1 nm, these spectra are shown in Table 2. Breakthrough patternsnor �0.1 m. Therefore, a suitable mathematical function to calculated by using Eq. [1] to [3] from transport through capil-
lary tubes with the fitted pore spectrum are shown as solidrepresent the pore-size spectrum must have sharp cut-off points

Rep
rodu
ced
from
Soi
l Sci
ence
Soc
iety
of A
mer
ica
Jour
nal.
Pub
lishe
d by
Soi
l Sci
ence
Soc
iety
of A
mer
ica.
All
copy
right
s re
serv
ed.
KUNG ET AL.: QUANTIFYING PORE SPECTRUM OF MACROPORE PATHWAYS 1201
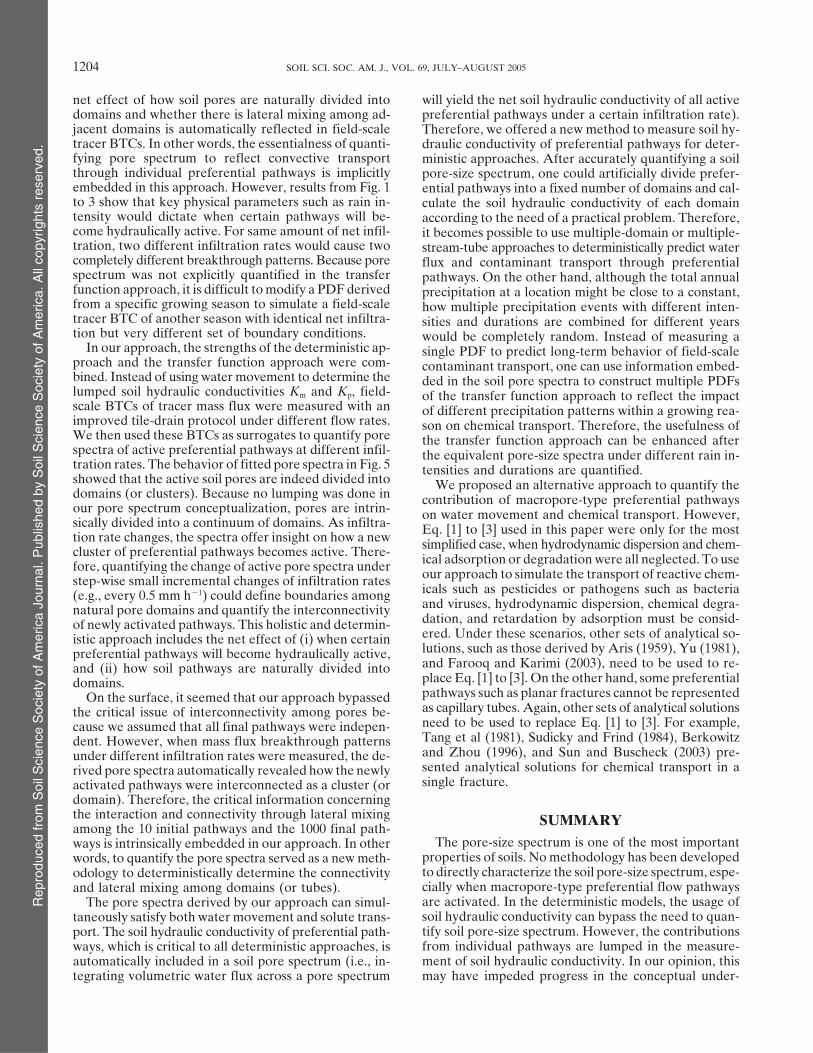
Fig. 4. Theoretical pore spectra based on constraints from conventional conceptualization as steady-state infiltration rates increase.
lines in Fig. 1, 2, and 3. The measured and fitted breakthrough assumed that such stagnant pores were always stagnant. Later,results from Casey et al. (1998) suggested that the immobilepatterns matched well, and each spectrum satisfies both the
water infiltration rate and chemical breakthrough pattern. In water content changed as the flow velocity varied.Our results shed light on how stagnant pores could becomeFig. 2 and 3, because the initial arrival was caused by our
experimental design of intermittent irrigation, the parameters hydraulically active pathways when infiltration rates change.Gish et al. (2004) showed that no preferential pathways werein Table 2 emphasized matching the true arrival of measured
breakthrough patterns. active under 0.89 mm h�1. Figure 5 demonstrates how moreand more preferential pathways become hydraulically activeAt the high flow rate, both Fig. 4 and 5 have �1011 pathways
with pore radii approximately 1 �m, and �100 large pathways when infiltration rates increase to 1.2, 2.4, and 4.4 mm h�1.with pore radii larger than 20 �m. However, how the pore The convective transport through preferential pathways is dic-spectrum changes in Fig. 4 and 5 is completely different. Ac- tated by volumetric flux, which is determined by the fourthcording to the conventional concept undergirding the soil char- power of equivalent pore radius (Jury et al., 1991, p. 76). Whenacteristic curve, small unsaturated pores have more negative a single 10-�m preferential pathway that connects to the soilmatric potentials and should be filled first. Therefore, only the surface becomes hydraulically active, it can contribute to thepatterns of pore spectra shown in Fig. 4 are expected because flow in 104 1-�m preferential pathways, which connect to theall pathways with small pores must become saturated before 10-�m pathway, but are not directly connecting to the soil sur-water and solute can enter into pathways with larger pores. face. This partly explained why preferential pathways with aPatterns based on a wide range of pores becoming hydrau- wide range of pore radii could simultaneously become hydrau-lically active simultaneously as the infiltration rates change lically active. Although Fig. 5 showed that new preferentialare counter-intuitive (shown by two spectra labeled with � in pathways with equivalent pore radii ranging from 0.7 to 6.0 �mFig. 5). These patterns contradicted the hypothesis and con- became active simultaneously when the rate increased fromceptualization proposed by Hutson and Wagenet (1995). Un- 1.2 to 2.4 mm h�1, many of the newly activated preferentialless better physical principles can be found, relaxing the con- pathways were already nearly saturated at 1.2 mm h�1. Thestraints to fit curves immediately jeopardized the validity of reason that they did not appear in the previous pore spectrumour capillary bundle conceptualization. was because they were water-satiated, but not hydraulically
To conceptualize water movement and contaminant trans- active, under 1.2 mm h�1.port through preferential pathways in an unsaturated soil pro- The two pore spectra labeled with � in Fig. 5 show the dif-file, it is important to realize that the derived pore spectra ference between two adjacent spectra. They indicate that (i)shown in Fig. 5 only reflect the pore frequency of hydraulicallyactive preferential pathways, instead of the actual distribution Table 1. Parameters of Eq. [5] for three hypothetical pore spectraof saturated pores reflected in the soil characteristic curve. based on conventional conceptualization.This comprehension is critical because not all water-saturated
Infiltration ratepores are hydraulically active pathways. Under unsaturatedcondition, water should indeed first enter the smaller pores. Parameter High Medium LowBut, most of these smaller pores are water saturated, yet not
A 1.00 � 1012 1.00 � 1012 1.00 � 1012hydraulically active, and hence are not included in Fig. 5.
� 5 5 5In the two-domain approach (van Genuchten and Wierenga, � 1.00 � 10�7 1.00 � 10�5 1.00 � 10�3
� 6 7 81976), the small, nearly saturated pores that are inactive in� 3 3 3solute transport are classified as stagnant pores. Water stored� 8 8 8in these pores is considered as immobile water. Initially, it was

Rep
rodu
ced
from
Soi
l Sci
ence
Soc
iety
of A
mer
ica
Jour
nal.
Pub
lishe
d by
Soi
l Sci
ence
Soc
iety
of A
mer
ica.
All
copy
right
s re
serv
ed.
1202 SOIL SCI. SOC. AM. J., VOL. 69, JULY–AUGUST 2005
Fig. 5. Pore spectra for three infiltration rates based on fitted parameters after relaxing initial constraints. The spectra labeled with � show thedifference between two adjacent spectra.
the preferential pathways are made of assemblages of inter- flow pathways, it becomes more feasible to predict the impactof these pathways on water movement and contaminantconnected pores of different sizes; and (ii) within each assem-
blage, many adjacent preferential pathways are interconnected transport.to form a cluster. Preferential pathways with small pore radiiwithin a cluster become hydraulically active only when their
DISCUSSIONadjacent pathways with larger pore radii become active. Whenthe pathways with larger pore radii are empty, no source of Because volumetric flow is proportional to the fourthwater and solute is available to the pathways with smaller
power of the pore radius, the smaller soil pores serveradii within the same cluster. Then, the pathways with smalleras storage and larger pores are conduits for transportradii are essentially stagnant with respect to contaminant trans-pathways. To predict infiltration, aeration, and deepport, although still water-saturated. Because the smaller, non-leaching of chemicals, it is necessary to characterize theactive pathways remain nearly saturated, the lateral gradient
of matric potential is essentially zero, and the nonactive path- pore spectrum of larger structural pores that constituteways could exist in equilibrium with the other pathways be- preferential pathways. Nevertheless, since the 1960s, nolonging to an adjacent active cluster. This conceptualization methodology has been developed to actually measureexplains why the pathways with small radii in a nonactive pore spectrum of a field soil. In our opinion, this is partlycluster would not induce lateral movement from the active because the soil hydraulic conductivity can be used sat-pathways in an adjacent cluster. isfactorily to estimate water flux in the Darcy Law (orIn short, we propose a new concept to characterize the
Darcy–Buckingham Law) and, on the other hand, thebehavior of field-scale macropore-type preferential pathwaysRichards Equation and CDE based on the Darcy waterand a new approach to quantify their pore spectra. We repre-flux can successfully predict chemical transport in unsat-sent these pathways as assemblages of clustered capillaryurated soils, when by matrix flow is dominant (Casseltubes. The equivalent pore spectrum of these pathways could
be represented by Eq. [5]. By conducting a series of steady- et al., 1975; Wierenga et al., 1991; Gish et al., 2004).state field experiments on tracer breakthrough under different In the measurement of soil hydraulic conductivity, theinfiltration rates, one can determine the six parameters in contributions from all individual pathways are lumpedEq. [5] to characterize the equivalent pore spectrum of these into a single value under an infiltration rate. Therefore,pathways. After quantifying the pore spectrum of preferential there is (in this case) no need to characterize the soil
pore spectrum.Table 2. Parameters based on best-fit of Eq. [5] to measuredHowever, when convective transport through prefer-breakthrough patterns shown in Fig. 1, 2, and 3.
ential pathways was dominant, the lumped soil hydraulicInfiltration rate, mm h�1
conductivity became inadequate. To illustrate the intrin-Parameter 4.4 2.4 1.2 sic drawback embedded in using soil hydraulic conduc-
tivity, we propose a hypothetical soil profile with prefer-A 5.17 � 1011 1.05 � 1012 1.01 � 1012
� 7.09 7.13 7.13 ential pathways made of vertical cylindrical tubes with� 0.0119 0.221 0.325 pore spectrum identical to that shown in Fig. 5. When� 1.84 2.76 4.16� 1.98 2.11 1.99 our hypothetical soil is saturated, the volumetric water� 3.39 6.58 6.58 flux, V, under unit gradient is
Rep
rodu
ced
from
Soi
l Sci
ence
Soc
iety
of A
mer
ica
Jour
nal.
Pub
lishe
d by
Soi
l Sci
ence
Soc
iety
of A
mer
ica.
All
copy
right
s re
serv
ed.
KUNG ET AL.: QUANTIFYING PORE SPECTRUM OF MACROPORE PATHWAYS 1203
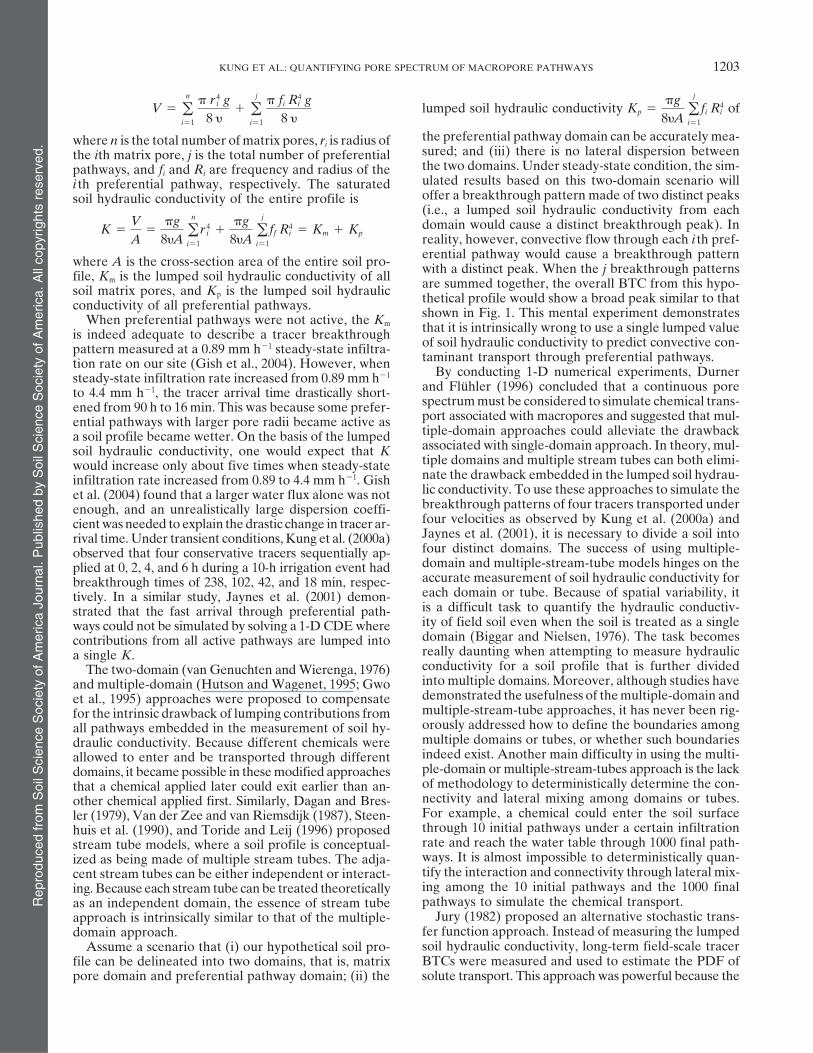
V � �n
i�1
r 4i g
8 � �
j
i�1
fi R4i g
8 �lumped soil hydraulic conductivity Kp �
g8�A �
j
i�1
fi R4i of
the preferential pathway domain can be accurately mea-where n is the total number of matrix pores, ri is radius ofsured; and (iii) there is no lateral dispersion betweenthe ith matrix pore, j is the total number of preferentialthe two domains. Under steady-state condition, the sim-pathways, and fi and Ri are frequency and radius of theulated results based on this two-domain scenario willi th preferential pathway, respectively. The saturatedoffer a breakthrough pattern made of two distinct peakssoil hydraulic conductivity of the entire profile is(i.e., a lumped soil hydraulic conductivity from eachdomain would cause a distinct breakthrough peak). InK �
VA
�g
8�A �n
i�1
r 4i
g8�A �
j
i�1
ff R4i � Km Kp
reality, however, convective flow through each i th pref-erential pathway would cause a breakthrough patternwhere A is the cross-section area of the entire soil pro- with a distinct peak. When the j breakthrough patternsfile, Km is the lumped soil hydraulic conductivity of all are summed together, the overall BTC from this hypo-soil matrix pores, and Kp is the lumped soil hydraulic thetical profile would show a broad peak similar to thatconductivity of all preferential pathways. shown in Fig. 1. This mental experiment demonstratesWhen preferential pathways were not active, the Km that it is intrinsically wrong to use a single lumped valueis indeed adequate to describe a tracer breakthroughof soil hydraulic conductivity to predict convective con-pattern measured at a 0.89 mm h�1 steady-state infiltra-taminant transport through preferential pathways.tion rate on our site (Gish et al., 2004). However, when
By conducting 1-D numerical experiments, Durnersteady-state infiltration rate increased from 0.89 mm h�1
and Fluhler (1996) concluded that a continuous poreto 4.4 mm h�1, the tracer arrival time drastically short-spectrum must be considered to simulate chemical trans-ened from 90 h to 16 min. This was because some prefer-port associated with macropores and suggested that mul-ential pathways with larger pore radii became active astiple-domain approaches could alleviate the drawbacka soil profile became wetter. On the basis of the lumpedassociated with single-domain approach. In theory, mul-soil hydraulic conductivity, one would expect that Ktiple domains and multiple stream tubes can both elimi-would increase only about five times when steady-statenate the drawback embedded in the lumped soil hydrau-infiltration rate increased from 0.89 to 4.4 mm h�1. Gishlic conductivity. To use these approaches to simulate theet al. (2004) found that a larger water flux alone was notbreakthrough patterns of four tracers transported underenough, and an unrealistically large dispersion coeffi-four velocities as observed by Kung et al. (2000a) andcient was needed to explain the drastic change in tracer ar-Jaynes et al. (2001), it is necessary to divide a soil intorival time. Under transient conditions, Kung et al. (2000a)four distinct domains. The success of using multiple-observed that four conservative tracers sequentially ap-domain and multiple-stream-tube models hinges on theplied at 0, 2, 4, and 6 h during a 10-h irrigation event hadaccurate measurement of soil hydraulic conductivity forbreakthrough times of 238, 102, 42, and 18 min, respec-each domain or tube. Because of spatial variability, ittively. In a similar study, Jaynes et al. (2001) demon-is a difficult task to quantify the hydraulic conductiv-strated that the fast arrival through preferential path-ity of field soil even when the soil is treated as a singleways could not be simulated by solving a 1-D CDE wheredomain (Biggar and Nielsen, 1976). The task becomescontributions from all active pathways are lumped intoreally daunting when attempting to measure hydraulica single K.conductivity for a soil profile that is further dividedThe two-domain (van Genuchten and Wierenga, 1976)into multiple domains. Moreover, although studies haveand multiple-domain (Hutson and Wagenet, 1995; Gwodemonstrated the usefulness of the multiple-domain andet al., 1995) approaches were proposed to compensatemultiple-stream-tube approaches, it has never been rig-for the intrinsic drawback of lumping contributions fromorously addressed how to define the boundaries amongall pathways embedded in the measurement of soil hy-multiple domains or tubes, or whether such boundariesdraulic conductivity. Because different chemicals wereindeed exist. Another main difficulty in using the multi-allowed to enter and be transported through differentple-domain or multiple-stream-tubes approach is the lackdomains, it became possible in these modified approachesof methodology to deterministically determine the con-that a chemical applied later could exit earlier than an-nectivity and lateral mixing among domains or tubes.other chemical applied first. Similarly, Dagan and Bres-For example, a chemical could enter the soil surfaceler (1979), Van der Zee and van Riemsdijk (1987), Steen-through 10 initial pathways under a certain infiltrationhuis et al. (1990), and Toride and Leij (1996) proposedrate and reach the water table through 1000 final path-stream tube models, where a soil profile is conceptual-ways. It is almost impossible to deterministically quan-ized as being made of multiple stream tubes. The adja-tify the interaction and connectivity through lateral mix-cent stream tubes can be either independent or interact-ing among the 10 initial pathways and the 1000 finaling. Because each stream tube can be treated theoreticallypathways to simulate the chemical transport.as an independent domain, the essence of stream tube
Jury (1982) proposed an alternative stochastic trans-approach is intrinsically similar to that of the multiple-fer function approach. Instead of measuring the lumpeddomain approach.soil hydraulic conductivity, long-term field-scale tracerAssume a scenario that (i) our hypothetical soil pro-BTCs were measured and used to estimate the PDF offile can be delineated into two domains, that is, matrix
pore domain and preferential pathway domain; (ii) the solute transport. This approach was powerful because the
Rep
rodu
ced
from
Soi
l Sci
ence
Soc
iety
of A
mer
ica
Jour
nal.
Pub
lishe
d by
Soi
l Sci
ence
Soc
iety
of A
mer
ica.
All
copy
right
s re
serv
ed.
1204 SOIL SCI. SOC. AM. J., VOL. 69, JULY–AUGUST 2005
net effect of how soil pores are naturally divided into will yield the net soil hydraulic conductivity of all activedomains and whether there is lateral mixing among ad- preferential pathways under a certain infiltration rate).jacent domains is automatically reflected in field-scale Therefore, we offered a new method to measure soil hy-tracer BTCs. In other words, the essentialness of quanti- draulic conductivity of preferential pathways for deter-fying pore spectrum to reflect convective transport ministic approaches. After accurately quantifying a soilthrough individual preferential pathways is implicitly pore-size spectrum, one could artificially divide prefer-embedded in this approach. However, results from Fig. 1 ential pathways into a fixed number of domains and cal-to 3 show that key physical parameters such as rain in- culate the soil hydraulic conductivity of each domaintensity would dictate when certain pathways will be- according to the need of a practical problem. Therefore,come hydraulically active. For same amount of net infil- it becomes possible to use multiple-domain or multiple-tration, two different infiltration rates would cause two stream-tube approaches to deterministically predict watercompletely different breakthrough patterns. Because pore flux and contaminant transport through preferentialspectrum was not explicitly quantified in the transfer pathways. On the other hand, although the total annualfunction approach, it is difficult to modify a PDF derived precipitation at a location might be close to a constant,from a specific growing season to simulate a field-scale how multiple precipitation events with different inten-tracer BTC of another season with identical net infiltra- sities and durations are combined for different yearstion but very different set of boundary conditions. would be completely random. Instead of measuring a
In our approach, the strengths of the deterministic ap- single PDF to predict long-term behavior of field-scaleproach and the transfer function approach were com- contaminant transport, one can use information embed-bined. Instead of using water movement to determine the ded in the soil pore spectra to construct multiple PDFslumped soil hydraulic conductivities Km and Kp, field- of the transfer function approach to reflect the impactscale BTCs of tracer mass flux were measured with an of different precipitation patterns within a growing rea-improved tile-drain protocol under different flow rates. son on chemical transport. Therefore, the usefulness ofWe then used these BTCs as surrogates to quantify pore the transfer function approach can be enhanced afterspectra of active preferential pathways at different infil- the equivalent pore-size spectra under different rain in-tration rates. The behavior of fitted pore spectra in Fig. 5 tensities and durations are quantified.showed that the active soil pores are indeed divided into We proposed an alternative approach to quantify thedomains (or clusters). Because no lumping was done in contribution of macropore-type preferential pathwaysour pore spectrum conceptualization, pores are intrin- on water movement and chemical transport. However,sically divided into a continuum of domains. As infiltra- Eq. [1] to [3] used in this paper were only for the mosttion rate changes, the spectra offer insight on how a new simplified case, when hydrodynamic dispersion and chem-cluster of preferential pathways becomes active. There- ical adsorption or degradation were all neglected. To usefore, quantifying the change of active pore spectra under our approach to simulate the transport of reactive chem-step-wise small incremental changes of infiltration rates
icals such as pesticides or pathogens such as bacteria(e.g., every 0.5 mm h�1) could define boundaries amongand viruses, hydrodynamic dispersion, chemical degra-natural pore domains and quantify the interconnectivitydation, and retardation by adsorption must be consid-of newly activated pathways. This holistic and determin-ered. Under these scenarios, other sets of analytical so-istic approach includes the net effect of (i) when certainlutions, such as those derived by Aris (1959), Yu (1981),preferential pathways will become hydraulically active,and Farooq and Karimi (2003), need to be used to re-and (ii) how soil pathways are naturally divided intoplace Eq. [1] to [3]. On the other hand, some preferentialdomains.pathways such as planar fractures cannot be representedOn the surface, it seemed that our approach bypassedas capillary tubes. Again, other sets of analytical solutionsthe critical issue of interconnectivity among pores be-need to be used to replace Eq. [1] to [3]. For example,cause we assumed that all final pathways were indepen-Tang et al (1981), Sudicky and Frind (1984), Berkowitzdent. However, when mass flux breakthrough patternsand Zhou (1996), and Sun and Buscheck (2003) pre-under different infiltration rates were measured, the de-sented analytical solutions for chemical transport in arived pore spectra automatically revealed how the newlysingle fracture.activated pathways were interconnected as a cluster (or
domain). Therefore, the critical information concerningthe interaction and connectivity through lateral mixing SUMMARYamong the 10 initial pathways and the 1000 final path-
The pore-size spectrum is one of the most importantways is intrinsically embedded in our approach. In otherproperties of soils. No methodology has been developedwords, to quantify the pore spectra served as a new meth-to directly characterize the soil pore-size spectrum, espe-odology to deterministically determine the connectivitycially when macropore-type preferential flow pathwaysand lateral mixing among domains (or tubes).are activated. In the deterministic models, the usage ofThe pore spectra derived by our approach can simul-soil hydraulic conductivity can bypass the need to quan-taneously satisfy both water movement and solute trans-tify soil pore-size spectrum. However, the contributionsport. The soil hydraulic conductivity of preferential path-from individual pathways are lumped in the measure-ways, which is critical to all deterministic approaches, isment of soil hydraulic conductivity. In our opinion, thisautomatically included in a soil pore spectrum (i.e., in-
tegrating volumetric water flux across a pore spectrum may have impeded progress in the conceptual under-
Rep
rodu
ced
from
Soi
l Sci
ence
Soc
iety
of A
mer
ica
Jour
nal.
Pub
lishe
d by
Soi
l Sci
ence
Soc
iety
of A
mer
ica.
All
copy
right
s re
serv
ed.
KUNG ET AL.: QUANTIFYING PORE SPECTRUM OF MACROPORE PATHWAYS 1205
standing and prediction of field-scale contaminant trans-port through macropore-type preferential pathways.
In this study, we proposed an indirect method to quan-tify equivalent pore spectrum of preferential pathwaysto eliminate this bottleneck. We used an improved tiledrain monitoring protocol, that is, applying tracer to anarrow strip near the tile line, to accurately measurebreakthrough patterns of tracer mass flux. From thetails of these patterns, we found that the impact of pref-erential pathways on contaminant transport can be rep-resented conceptually as flow through a series of cylin-drical capillary tubes. We then proposed a function withsharp cut-off points on both sides of the pore-size distri-bution to represent the pore spectrum of these tubes.Finally, we used the measured BTCs as surrogates tofind the parameters of the proposed function to derivethe pore spectrum of preferential pathways.
Our results—based on data best-fitting—showed thatthe preferential pathways are indeed naturally clustered Fig. A1. Three phases of convective transport of a chemical throughinto domains, and preferential pathways with a wide a capillary tube. r is the distance from the center of the tube (m),range of equivalent pore radii could become active when r1 is the location where the new water front reaches the exit, and
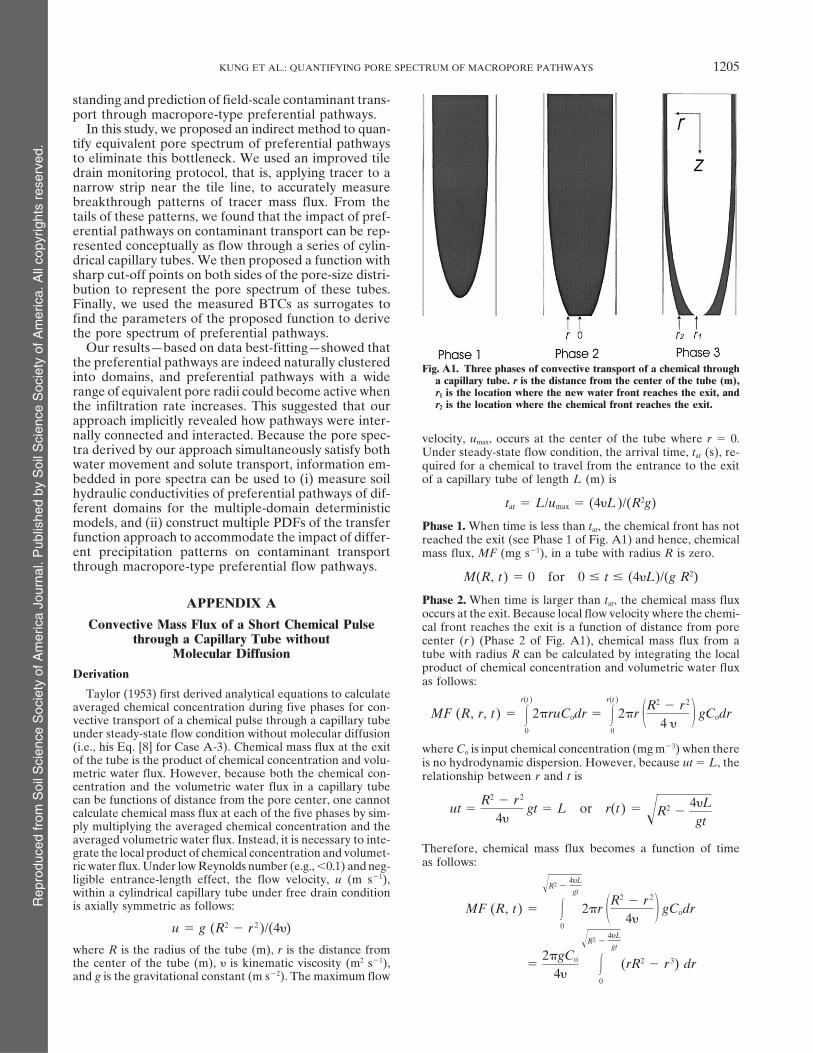
r2 is the location where the chemical front reaches the exit.the infiltration rate increases. This suggested that ourapproach implicitly revealed how pathways were inter-nally connected and interacted. Because the pore spec- velocity, umax, occurs at the center of the tube where r � 0.tra derived by our approach simultaneously satisfy both Under steady-state flow condition, the arrival time, tar (s), re-water movement and solute transport, information em- quired for a chemical to travel from the entrance to the exit
of a capillary tube of length L (m) isbedded in pore spectra can be used to (i) measure soilhydraulic conductivities of preferential pathways of dif-
tar � L/umax � (4�L)/(R2g)ferent domains for the multiple-domain deterministicmodels, and (ii) construct multiple PDFs of the transfer Phase 1. When time is less than tar, the chemical front has notfunction approach to accommodate the impact of differ- reached the exit (see Phase 1 of Fig. A1) and hence, chemicalent precipitation patterns on contaminant transport mass flux, MF (mg s�1), in a tube with radius R is zero.through macropore-type preferential flow pathways.
M(R, t) � 0 for 0 � t � (4�L)/(g R2)
Phase 2. When time is larger than tar, the chemical mass fluxAPPENDIX Aoccurs at the exit. Because local flow velocity where the chemi-
Convective Mass Flux of a Short Chemical Pulse cal front reaches the exit is a function of distance from porethrough a Capillary Tube without center (r) (Phase 2 of Fig. A1), chemical mass flux from a
tube with radius R can be calculated by integrating the localMolecular Diffusionproduct of chemical concentration and volumetric water fluxDerivationas follows:
Taylor (1953) first derived analytical equations to calculateaveraged chemical concentration during five phases for con- MF (R, r, t) � �
r(t )
0
2ruCodr � �r(t )
0
2r �R2 � r 2
4 � � gCodrvective transport of a chemical pulse through a capillary tubeunder steady-state flow condition without molecular diffusion(i.e., his Eq. [8] for Case A-3). Chemical mass flux at the exit where Co is input chemical concentration (mg m�3) when thereof the tube is the product of chemical concentration and volu- is no hydrodynamic dispersion. However, because ut � L, themetric water flux. However, because both the chemical con- relationship between r and t iscentration and the volumetric water flux in a capillary tubecan be functions of distance from the pore center, one cannot
ut �R2 � r 2
4�gt � L or r(t) � �R2 �
4�Lgt
calculate chemical mass flux at each of the five phases by sim-ply multiplying the averaged chemical concentration and theaveraged volumetric water flux. Instead, it is necessary to inte-
Therefore, chemical mass flux becomes a function of timegrate the local product of chemical concentration and volumet-as follows:ric water flux. Under low Reynolds number (e.g., �0.1) and neg-
ligible entrance-length effect, the flow velocity, u (m s�1),within a cylindrical capillary tube under free drain conditionis axially symmetric as follows: MF (R, t) � �
�R2 �4�Lgt
0
2r �R2 � r 2
4� � gCodr
u � g (R2 � r 2 )/(4�)
where R is the radius of the tube (m), r is the distance fromthe center of the tube (m), � is kinematic viscosity (m2 s�1), �
2gCo
4��
�R2 �4�Lgt
0
(rR2 � r 3) drand g is the gravitational constant (m s�2). The maximum flow

Rep
rodu
ced
from
Soi
l Sci
ence
Soc
iety
of A
mer
ica
Jour
nal.
Pub
lishe
d by
Soi
l Sci
ence
Soc
iety
of A
mer
ica.
All
copy
right
s re
serv
ed.
1206 SOIL SCI. SOC. AM. J., VOL. 69, JULY–AUGUST 2005
through a capillary tube without molecular diffusion is madeof three phases as shown in Fig. A2.MF (R, t) �
gCo
2� �2 r 2 R2 � r 4
4 ��0
�R2 �4�Lgt
Discussion�
R4 gCo
8� �1 � �4�LR2gt �
2
� Taylor (1953) first derived analytical equations of averagedchemical concentration for convective transport of a chemical
Phase 3. When a chemical is applied as a short pulse during pulse through a capillary tube without molecular diffusion.a steady-state flow condition and tp is the time of chemical His derivation was based on an experimental design where aapplication, the new water front at the center of the tube plug of chemical was uniformly distributed at the entrance ofarrives the exit of the tube at t � tar tp. The chemical mass a capillary tube at time zero (i.e., A-3 of Fig. 1 on page 189flux at time larger than tar tp is as follows: of his paper). This was because he introduced the chemical into
the tube when the flow was stopped. On the basis of Taylor’sexperimental setup, the total mass entered and transportedMF (R, r1, r2, t) � �
r2
r1
2ruCodrthrough a pore with radius R was proportional to the secondpower of R (i.e., total mass � R2 � Co, where � is the thicknessof the initial uniform plug). This configuration of chemical input� �
r2
r1
2r�R2 � r 2
4� � gCodrwas referred to as “slug input” by Gill and Ananthakrishnan(1967). Therefore, the ratio of total mass transported througha 10-�m capillary pore and a 1-�m capillary pore would bewhere r2 is the location where the chemical front reaches the(10/1)2 or 100.exit and where r1 is the location where the new water front
In our experimental setup, a chemical pulse was applied underreaches the exit (see Phase 3 of Fig. A1). Both r1 and r2 area steady-state flow condition (i.e., a chemical pulse entered arelated to t as follows:pore while water was flowing). As a result, a chemical doesnot enter a pore uniformly as a slug. Because the flow velocityR2 � r 2
2
4�gt � L and
R2 � r 21
4�g (t � tp) � L
is parabolic across the pore radius, much more chemical willenter and be transported through the region near the centerof the pore in our case (see Phase 1 of Fig. A1). On the basisr2 � �R2 �
4�Lgt
and r1 � �R2 �4�L
g (t � tp) of our derivation, the total mass entered a pore with radiusR is the summation from three phases as follows:
�∞
0
MF (t) dt � 0 �tartp
tar
R4 gCo
8� �1 � �4�LR2gt �
2
� dt MF (R, t) � ��R2 �
4�Lgt
�R2 �4�L
(t � tp)
2r �R2 � r 2
4� � gCodr
�∞
tartp
2� L2 Co
g � 1(t � tp)2
�1t2 � dt
�gCo
2� �2 r 2 R2 � r 4
4 ���R2 �
4�Lgt
�R2 �4�L
g(t � tp) � R4 gCo
8�tp � R2 gtp
4�L R2 g tp�
MF (R, t) �2�L2 Co
g � 1(t � tp)2
�1t2 � 2� L2 Co
g �R2 g
4�L �2
tp � 4�L4�L R2 gtp
�On the basis of the derived analytical solutions, the overall
mass breakthrough pattern of convective chemical transport � R4 gCo
8�tp
Therefore, according to our experimental setup, the total masstransported through a pore is proportional to the fourth powerof pore radius R (i.e., total mass � R4 g Co tp /8�). The ratioof total mass transported through a 10-�m capillary pore anda 1-�m capillary pore would be (10/1)4 or 10 000, which is 100times larger than that based on Taylor’s setup.
If a slug of chemical with identical thickness is uniformlydistributed near soil surface in all pores at the beginning ofan infiltration event, Taylor’s derivation should be used tocalculate mass flux of chemical transport. However, if a chemi-cal pulse entered the capillary pores under steady water move-ment, using Taylor’s analytical solution would grossly under-estimate the total convective chemical transport through thelarger capillary pores. When molecular diffusivity is importantin laminar flow through capillary tube, dispersion only smearsthe sharpness of chemical front without altering the velocityfield of the flow. Therefore, this assessment of underestimatingmass ratio through capillary tubes of different radii by Taylor’sderivation is still true when molecular diffusion caused dis-persion as a chemical pulse entered the capillary pores underFig. A2. Typical mass flux breakthrough pattern during the three phases
of convective transport of a chemical through a capillary tube. steady water movement.

Rep
rodu
ced
from
Soi
l Sci
ence
Soc
iety
of A
mer
ica
Jour
nal.
Pub
lishe
d by
Soi
l Sci
ence
Soc
iety
of A
mer
ica.
All
copy
right
s re
serv
ed.
KUNG ET AL.: QUANTIFYING PORE SPECTRUM OF MACROPORE PATHWAYS 1207
Farooq, S., and I.A. Karimi. 2003. Dispersed plug flow model forWhen a chemical was introduced as a uniform slug, a para-steady-state laminar flow in a tube with a first order sink at thebolic flow field within a capillary tube could cause the maxi-wall. Chem. Eng. Sci. 58(1):171–180.mum contact along the surface of a chemical front. In other
Fortin, J., E. Gagnon-Bertrand, L. Vezina, and M. Rompre. 2002.words, a uniform initial slug input in Taylor’s experimentalPreferential bromide and pesticide movement to tile drains undersetup ensured the maximum dispersion in the convection–dis- different cropping practices. J. Environ. Qual. 31:1940–1952.
persion transport phenomenon. In our experimental setup, Geohring, L.D., P.E. Wright, T.S. Steenhuis, and M.F. Walter. 1999.more chemical entered through the region near the center of Fecal coliforms in tile drainage effluent. ASAE Paper No. 99–2203.a pore where the stretching caused by a parabolic flow field ASAE, St. Joseph, MI.
Germann, P.F., and K. Beven. 1981. Water flow in soil macropores. I.was small. As a result, chemicals entered the capillary poresAn experimental approach. J. Soil Sci. 32:1–13.through water movement experienced a minimum dispersion
Gill, W.N., and V. Ananthakrishnan. 1967. Laminar dispersion ineffect in the convection–dispersion transport phenomenon.capillaries. Am. Inst. Chem. Eng. J. 13(4):801–807.Conventional deterministic models were mainly based on solv-
Gish, T.J., and W.A. Jury. 1983. Effect of plant roots and root channelsing Taylor’s CDE (i.e., his Eq. [9]). Because chemical entranceon solute transport. Trans. Am Soc. Agric. Eng. 26(2):440–444, 451.into individual pores of different radii with water was not Gish, T.J., K.-J.S. Kung, D. Perry, J. Posner, G. Bubenzer, C.S. Helling,
considered in conventional deterministic models, the total con- E.J. Kladivko, and T.S. Steenhuis. 2004. Impact of preferential flowvective chemical transport through the larger macropore-type at varying irrigation rates by quantifying mass fluxes. J. Environ.preferential pathways is similarly grossly underestimated by Qual. 33(3):1033–1040.conventional deterministic models. This partly explains why Gupta, S.C., A. Bhattacharjee, J.F. Moncrief, and E.C. Berry. 2002.
Earthworm species and residue placement effects on macroporeunrealistically large dispersivity is a necessity to use determin-characteristics and preferential transport. p. 10. In 17th Worldistic models to simulate the fast convective transport throughCongr. Soil Sci., Bangkok, Thailand. 14–21 Aug. 2002. Symp. 1,preferential pathways such as those observed by Kung et al.Paper No. 263.(2000a) and Jaynes et al. (2001).
Gwo, J.P., P.M. Jardine, G.W. Wilson, and G.T. Yeh. 1995. A multiplepore region concept to modeling mass transfer in subsurface media.
ACKNOWLEDGMENTS J. Hydrol. (Amsterdam) 164:217–237.Hanke, M., D. Perry, K.-J.S. Kung, and G. Bubenzer. 2004. A lowResearch was partly supported by USDA-ARS Specific intensity, high uniformity water application system. Soil Sci. Soc.
Cooperative Agreement 58-1275-9-094. The views and con- Am. J. 68:1833–1837.clusions contained in this document are those of the authors Helling, C.S., and T.J. Gish. 1991. Physical and chemical processesand should not be interpreted as representing the official poli- affecting preferential flow. p. 77–86. In T.J. Gish and A. Shirmo-cies, either expressed or implied, of the funding agencies. Men- hammadi (ed.) Preferential flow. Proc. Natl. Symp., 16–17 Dec.
1991, Chicago, IL. ASAE, St. Joseph, MI.tion of commercial products is for the reader’s convenienceHergert, G.W., D.R. Bouldin, S.D. Klausner, and P.J. Zwerman. 1981.and does not constitute endorsement by the authors or their
Phosphorus concentration—Water flow: Interactions in tile efflu-institutions. The authors thank two anonymous reviewers whoent from manured land. J. Environ. Qual. 10:338–344.offered constructive suggestions and comments.
Hillel, D. 1980. Fundamentals of soil physics. Academic Press, Or-lando, FL.
REFERENCES Hutson, J.L., and R.J. Wagenet. 1995. A multiregion model describingwater flow and solute transport in heterogeneous soils. Soil Sci.Anderson, S.H., H. Wang, R.L. Peyton, and C.J. Gantzer. 2002. Esti-Soc. Am. J. 59:743–751.mation of porosity and hydraulic conductivity from x-ray CT-mea-
Isensee, A.R., R.G. Nash, and C.S. Helling. 1990. Effect of con-sured solute breakthrough. In P. Jacobs (ed.) Applications of com-ventional vs. no-tillage on pesticide leaching to shallow ground-puterized x-ray tomography in geology and related domains. Geol.water. J. Environ. Qual. 19:434–440.Soc., London.
Jaynes, D.B. 1994. Evaluation of fluorobenzoate tracers in surfaceAris, R. 1959. On the dispersion of a solute by diffusion, convectionsoils. Ground Water 32:532–538.and exchange between phases. Proc. R. Soc. London, Ser. A 252:
Jaynes, D.B., S.I. Ahmed, K.-J.S. Kung, and R.S. Kanwar. 2001. Tem-538–550.poral dynamics of preferential flow to a subsurface tile drain. SoilBeauchemin, S., R.R. Simard, and D. Cluis. 1998. Forms and con-Sci. Soc. Am. J. 65:1368–1376.centration of phosphorus in drainage water of twenty-seven tile-
Ju, S.-H., and K.-J.S. Kung. 1997. Steady-state funnel flow: Its charac-drained soils. J. Environ. Qual. 27:721–728.teristics and impact on modeling. Soil Sci. Soc. Am. J. 61:416–427.Berkowitz, B., and J. Zhou. 1996. Reactive solute transport in a single
Jury, W.A. 1982. Simulation of solute transport using a transfer func-fracture. Water Resour. Res. 32:901–915.tion model. Water Resour. Res. 18:363–368.Biggar, J.W., and D.R. Nielsen. 1976. Spatial variability of the leaching
Jury, W.A., W.R. Gardner, and W.H. Gardner. 1991. Soil physics.characteristics of a field soil. Water Resour. Res. 12:78–84.5th ed. John Wiley & Sons, New York.Bouma, J. 1981. Soil morphology and preferential flow along mac-
Kladivko, E.J., L.C. Brown, and J.L. Baker. 2001. Pesticide transportropores. Agric. Water Manage. 3:235–250.to subsurface tile drains in humid regions of North America. Crit.Casey, F.X.M., S.D. Logsdon, R. Horton, and D.B. Jaynes. 1998.Rev. Environ. Sci. Technol. 31:1–62.Measurement of field soil hydraulic and solute transport param-
Kladivko, E.J., J. Grochulska, R.F. Turco, G.E. Van Scoyoc, and J.D.eters. Soil Sci. Soc. Am. J. 62:1172–1178.Eigel. 1999. Pesticide and nitrate transport into subsurface tileCassel, D.K., M.T. van Genuchten, and P.J. Wierenga. 1975. Predictingdrains of different spacings. J. Environ. Qual. 28:997–1004.anion movement in disturbed and undisturbed soils. Soil Sci. Soc.
Kung, K.-J.S., E. Kladivko, T. Gish, T.S. Steenhuis, G. Bubenzer, andAm. J. 39:1015–1023.C.S. Helling. 2000a. Quantifying preferential flow by breakthroughDagan, G., and E. Bresler. 1979. Solute dispersion in unsaturatedof sequentially applied tracers: Silt loam soil. Soil Sci. Soc. Am. J.heterogeneous soil at field scale. I. Theory. Soil Sci. Soc. Am. J.64:1296–1304.43:461–467.
Kung, K.-J.S., T.S. Steenhuis, E.J. Kladivko, T.J. Gish, G. Bubenzer,Dunn, G.H., and R.E. Phillips. 1991. Equivalent diameter of simulatedand C.S. Helling. 2000b. Impact of preferential flow on the transportmacropore systems during saturated flow. Soil Sci. Soc. Am. J. 55:of adsorbing and non-adsorbing tracers. Soil Sci. Soc. Am. J. 64:1244–1248.1290–1296.Durner, W., and H. Fluhler. 1996. Multi-domain model for pore-size
Libardi, P.L., K. Reichardt, D.R. Nelsen, and J.W. Biggar. 1980. Sim-dependent transport of solutes in soils. Geoderma 70:281–297.ple field methods for estimating soil hydraulic conductivity. SoilEdwards, W.M., M.J. Shipitalo, L.B. Owens, and W.A. Dick. 1993.Sci. Soc. Am. J. 44:3–6.Factors affecting preferential flow of water and atrazine through
earthworm burrows under no-till corn. J. Environ. Qual. 22:453–457. Luxmoore, R.J. 1991. On preferential flow and its measurement.
Rep
rodu
ced
from
Soi
l Sci
ence
Soc
iety
of A
mer
ica
Jour
nal.
Pub
lishe
d by
Soi
l Sci
ence
Soc
iety
of A
mer
ica.
All
copy
right
s re
serv
ed.
1208 SOIL SCI. SOC. AM. J., VOL. 69, JULY–AUGUST 2005
p. 113–121. In T.J. Gish and A. Shirmohammadi (ed.) Preferential port in fractured porous media: Analytical solution for a singlefracture. Water Resour. Res. 17(3):555–564.flow. Proc. Natl. Symp., Chicago, IL. 16–17 Dec. 1991. ASAE, St.
Taylor, G.I. 1953. Dispersion of soluble matter in solvent flowingJoseph, MI.slowly through a tube. Proc. R. Soc. London. Ser. A 219:186–203.Richard, T.L., and T.S. Steenhuis. 1988. Tile drain sampling of prefer-
Toride, N., and F.J. Leij. 1996. Convective-dispersive stream tubeential flow on a field scale. In P.F. Germann (ed.) Rapid and farmodel for field-scale solute transport: Moment analysis. Soil Sci.reaching hydrological processes in the vadose zone. J. Contam.Soc. Am. J. 60:342–352.Hydrol. 3:307–325.
Van der Zee, S.E.A.T.M., and W.H. van Riemsdijk. 1987. TransportRodvang, S.J., and W.W. Simpkins. 2001. Agricultural contaminantsof reactive solute in spatially variable soil systems. Water Resour.in Quaternary aquitards: A review of occurrence and fate in NorthRes. 23:2059–2069.America. Hydrogeol. J. 9:44–59. van Genuchten, M.Th., and P.J. Wierenga. 1976. Mass transfer studies
Seyfried, M.S., and P.S.C. Rao. 1987. Solute transport in undisturbed in sorbing porous media: I. Analytical solution. Soil Sci. Soc. Am.columns of an aggregated tropical soil: Preferential flow effects. J. 40:473–480.Soil Sci. Soc. Am. J. 51:1434–1444. Warrick, A.W., and D.R. Nielsen. 1980. Spatial variability of soil
Shaw, J.N., L.T. West, D.E. Radcliffe, and D.D. Bosch. 2000. Preferen- physical properties in the field. p. 327. In D. Hillel (ed.) Applica-tial flow and pedotransfer functions for transport properties in tions of soil physics. Academic Press, New York.sandy Kandiudults. Soil Sci. Soc. Am. J. 64:670–678. Wierenga, P.J., R.G. Hills, and D.B. Hudson. 1991. The Las Cruces
Shipitalo, M.J., and W.M. Edwards. 1993. Seasonal patterns of water trench site: Characterization, experimental results, and one-dimen-sional flow predictions. Water Resour. Res. 27:2695–2705.and chemical movement in tilled and no-till column lysimeters.
Williams, A.G., J.F. Dowd, D. Scholefield, N.M. Holden, and L.K.Soil Sci. Soc. Am. J. 57:218–223.Deeks. 2003. Preferential flow variability in a well-structured soil.Stamm, C., H. Fluhler, R. Gachter, J. Leuenberger, and H. Wunderli.Soil Sci. Soc. Am. J. 67:1272–1281.1998. Preferential transport of phosphorus in drained grassland
Woessner, W.W., T. Troy, P. Ball, and D.C. DeBorde. 1998. Virussoils. J. Environ. Qual. 27:515–522.transport in the capture zone of a well penetrating a high hydraulicSteenhuis, T.S., J.-Y. Parlange, and M.S. Andreini. 1990. A numericalconductivity aquifer containing a preferential flow zone: Challengesmodel for preferential solute movement in structured soils. Geo-to natural disinfection. p. 167–174. In Proc. Source Water Protec-derma 46:193–208. tion Int., Dallas, TX. 28–30 Apr. 1998. National Water Research
Sudicky, E.A., and E.O. Frind. 1984. Contaminant transport in frac- Inst., Fountain Valley, CA.tured porous media: Analytical solution for a two member decay Yu, J-S. 1981. Dispersion in laminar-flow through tubes by simulta-chain in a single fracture. Water Resour. Res. 20:1021–1029. neous diffusion and convection. J. Appl. Mech.–Trans. ASME 48:
Sun, Y., and T.A. Buscheck. 2003. Analytical solutions for reactive 217–223.transport of N-member radionuclide chains in a single fracture. Zehe, E., and H. Fluhler. 2001. Preferential transport of isoproturonJ. Contam. Hydrol. 62:695–712. at a plot scale and a field scale tile-drained site. J. Hydrol. 247(1–2):
100–115.Tang, D.H., E.O. Frind, and E.A. Sudicky. 1981. Contaminant trans-