Quantifying Not Only Bone Loss, but Also Soft Tissue Swelling, in a Murine Inflammatory Arthritis...
9
Quantifying Not Only Bone Loss, but Also Soft Tissue Swelling, in a Murine Inflammatory Arthritis Model Using Micro-Computed Tomography E. Perilli*, M. Cantley†, V. Marino‡, T. N. Crotti†, M. D. Smith§¶, D. R. Haynes† & A. A. S. S. K. Dharmapatni† *Medical Device Research Institute, School of Computer Science, Engineering & Mathematics, Flinders University, Bedford Park, SA, Australia; †Discipline of Anatomy and Pathology, School of Medical Sciences, The University of Adelaide, Adelaide, SA, Australia; ‡School of Dentistry, The University of Adelaide, Adelaide, SA, Australia; §Department of Rheumatology, Flinders Medical Centre and Flinders University, Bedford Park, SA, Australia; and ¶Rheumatology Research Unit, Repatriation Hospital, Daw Park, SA, Australia Received 1 July 2014; Accepted in revised form 12 November 2014 Correspondence to: E. Perilli, Medical Device Research Institute, School of Computer Science, Engineering and Mathematics, Flinders University, GPO Box 2100, Adelaide, SA 5001, Australia. E-mail: egon.perilli@flinders.edu.au Abstract In rodent models of inflammatory arthritis, bone erosion has been non-invasively assessed by micro-computed tomography (micro-CT). However, non-invasive assessments of paw swelling (oedema) are still based on clinical grading by visual evaluation, or measurements by callipers, not always reliable for the tiny mouse paws. The aim of this work was to demonstrate a novel straightforward 3D micro-CT analysis protocol capable of quantifying not only joint bone erosion, but also soft tissue swelling, from the same scans, in a rodent inflammatory arthritis model. Balb/c mice were divided into two groups: collagen antibody- induced arthritis (CAIA) and CAIA treated with prednisolone, the latter reflecting an established treatment in human rheumatoid arthritis. Clinical paw scores were recorded. On day 10, front paws were assessed by micro-CT and histology. Micro-CT measurements included paw volume (bone and soft tissue together) and bone volume at the radiocarpal joint, and bone volume from the radiocarpal to the metacarpophalangeal joint. Micro-CT analysis revealed significantly lower paw volume ( 36%, P < 0.01) and higher bone volume (+17%, P < 0.05) in prednisolone-treated CAIA mice compared with untreated CAIA mice. Paw volume and bone volume assessed by micro-CT correlated significantly with clinical and histological scores (|r| > 0.5, P < 0.01). Untreated CAIA mice showed significantly higher clinical scores, higher inflammation levels histologically, cartilage and bone degradation, and pannus formation, compared with treated mice (P < 0.01). The presented novel micro-CT analysis protocol enables 3D-quantification of paw swelling at the micrometre level, along with the typically assessed bone erosion, using the same images/scans, without altering the scanning procedure or using contrast agents. Introduction Rheumatoid arthritis (RA) is an autoimmune, chronic, destructive inflammatory disease that predominantly affects the synovial joints. Within the affected joints, there is a steady progression of synovial hyperplasia and neovascularization, mixed mononuclear and granulocytic cellular infiltration, damage to articular cartilage, bone remodelling, proliferation and phenotypic changes of synovial fibroblasts [1, 2]. Clinically, this manifests as joint swelling, erythema and pain, which can progress to bone erosion with obvious joint architecture changes and disability [3]. Due to the complexity of RA, various animal models are necessary to increase our understanding of the disease aetiology and to investigate the effects of new drugs on disease initiation and progression. The collagen antibody- induced arthritis (CAIA) mouse model has similar features to human RA that provides a straightforward and rapid means of producing this pathology, bypassing the require- ment for cognate immune response [4–8]. Hence, it is an appropriate model to investigate the effector phase of the disease such as synovitis and bone erosion within the joint. Recent studies, including those in our own laboratory, have utilized micro-computed tomography (micro-CT) to quantify bone erosion in murine models of inflammatory arthritis [9, 10]. Micro-CT allows for the non-destructive quantification and visualization of bone changes at the micrometre level in 3D in in vitro and in vivo studies. It has been extensively used in osteoporosis and osteoarthritis 142 Ó The Authors. Scandinavian Journal of Immunology published by John Wiley & Sons Ltd on behalf of Scandanavian Society of Immunology (SSI) This is an open access article under the terms of the Creative Commons Attribution-NonCommercial License, which permits use, distribution and reproduction in any medium, provided the original work is properly cited and is not used for commercial purposes. METHODOLOGICAL MANUSCRIPT doi: 10.1111/sji.12259 ..................................................................................................................................................................
Transcript of Quantifying Not Only Bone Loss, but Also Soft Tissue Swelling, in a Murine Inflammatory Arthritis...

Quantifying Not Only Bone Loss, but Also Soft TissueSwelling, in a Murine Inflammatory Arthritis ModelUsing Micro-Computed Tomography
E. Perilli*, M. Cantley†, V. Marino‡, T. N. Crotti†, M. D. Smith§¶, D. R. Haynes† &A. A. S. S. K. Dharmapatni†
*Medical Device Research Institute, School of
Computer Science, Engineering & Mathematics,
Flinders University, Bedford Park, SA, Australia;
†Discipline of Anatomy and Pathology, School ofMedical Sciences, The University of Adelaide,
Adelaide, SA, Australia; ‡School of Dentistry,The University of Adelaide, Adelaide, SA,
Australia; §Department of Rheumatology,Flinders Medical Centre and Flinders University,
Bedford Park, SA, Australia; and ¶RheumatologyResearch Unit, Repatriation Hospital, Daw Park,
SA, Australia
Received 1 July 2014; Accepted in revised form12 November 2014
Correspondence to: E. Perilli, Medical Device
Research Institute, School of Computer Science,
Engineering andMathematics, FlindersUniversity,
GPO Box 2100, Adelaide, SA 5001, Australia.
E-mail: [email protected]
Abstract
In rodent models of inflammatory arthritis, bone erosion has been non-invasivelyassessed by micro-computed tomography (micro-CT). However, non-invasiveassessments of paw swelling (oedema) are still based on clinical grading by visualevaluation, or measurements by callipers, not always reliable for the tiny mousepaws. The aim of this work was to demonstrate a novel straightforward 3Dmicro-CT analysis protocol capable of quantifying not only joint bone erosion,but also soft tissue swelling, from the same scans, in a rodent inflammatoryarthritis model. Balb/c mice were divided into two groups: collagen antibody-induced arthritis (CAIA) and CAIA treated with prednisolone, the latterreflecting an established treatment in human rheumatoid arthritis. Clinical pawscores were recorded. On day 10, front paws were assessed by micro-CT andhistology. Micro-CT measurements included paw volume (bone and soft tissuetogether) and bone volume at the radiocarpal joint, and bone volume from theradiocarpal to the metacarpophalangeal joint. Micro-CT analysis revealedsignificantly lower paw volume (�36%, P < 0.01) and higher bone volume(+17%, P < 0.05) in prednisolone-treated CAIA mice compared with untreatedCAIA mice. Paw volume and bone volume assessed by micro-CT correlatedsignificantly with clinical and histological scores (|r| > 0.5, P < 0.01). UntreatedCAIA mice showed significantly higher clinical scores, higher inflammationlevels histologically, cartilage and bone degradation, and pannus formation,compared with treated mice (P < 0.01). The presented novel micro-CT analysisprotocol enables 3D-quantification of paw swelling at the micrometre level,along with the typically assessed bone erosion, using the same images/scans,without altering the scanning procedure or using contrast agents.
Introduction
Rheumatoid arthritis (RA) is an autoimmune, chronic,destructive inflammatory disease that predominantlyaffects the synovial joints. Within the affected joints, thereis a steady progression of synovial hyperplasia andneovascularization, mixed mononuclear and granulocyticcellular infiltration, damage to articular cartilage, boneremodelling, proliferation and phenotypic changes ofsynovial fibroblasts [1, 2]. Clinically, this manifests asjoint swelling, erythema and pain, which can progress tobone erosion with obvious joint architecture changes anddisability [3].
Due to the complexity of RA, various animal models arenecessary to increase our understanding of the disease
aetiology and to investigate the effects of new drugs ondisease initiation and progression. The collagen antibody-induced arthritis (CAIA) mouse model has similar featuresto human RA that provides a straightforward and rapidmeans of producing this pathology, bypassing the require-ment for cognate immune response [4–8]. Hence, it is anappropriate model to investigate the effector phase of thedisease such as synovitis and bone erosion within the joint.
Recent studies, including those in our own laboratory,have utilized micro-computed tomography (micro-CT) toquantify bone erosion in murine models of inflammatoryarthritis [9, 10]. Micro-CT allows for the non-destructivequantification and visualization of bone changes at themicrometre level in 3D in in vitro and in vivo studies. It hasbeen extensively used in osteoporosis and osteoarthritis
142 � The Authors. Scandinavian Journal of Immunology published by John Wiley & Sons Ltd on behalf of Scandanavian Society of Immunology (SSI)This is an open access article under the terms of the Creative Commons Attribution-NonCommercial License, which permits use,
distribution and reproduction in any medium, provided the original work is properly cited and is not used for commercial purposes.
ME THODO L OG I C A L MANU S C R I P T doi: 10.1111/sji.12259..................................................................................................................................................................
studies [11–16] as well as RA [9, 10, 17–19]. However, inRA studies, the typical non-invasive read-outs of thedisease severity in terms of oedema (erythema and swelling)are commonly based on clinical grading, which are themeasurements based on a subjective visual evaluation by anoperator [6, 9, 17, 18, 20–22]. Quantitative methods toassess swelling include measuring paw thickness using acalliper [3] or a plethysmometer [10]. Both these methods,however, might not always be practical and are relativelydifficult particularly due to the small paw size in mice [23].
Studies utilizing micro-CT analysis in rodent models ofRA have focussed on high-resolution quantification of boneerosion. However, precise measurement of oedema (swell-ing) in these models still remains limited and is stillcommonly assessed using other methods as describedabove. Hence, the question arises as to whether the readilyavailable micro-CT images can also be used for quantifyingthe paw swelling in terms of paw volume, at themicrometre level in 3D [9, 10, 18]. Indeed, in soft tissuestudies on mice, micro-CT has been used to visualize andquantify soft tissue such as lungs or body fat, in 3D [24–28]. Hence, micro-CT could also be used to measure softtissue swelling, in rodent models of RA.
Prednisolone is an established RA treatment in humanswhich suppresses inflammation and prevents bone damagein a CAIA mouse model [3, 29]. A comparison of CAIAmice and prednisolone-treated CAIA mice was thereforeused in this study, as it is likely that marked differences inboth joint inflammation and bone erosion would be notedbetween the two mouse groups [3, 29].
The aim of this study was to demonstrate a novel 3Dmicro-CT image analysis protocol capable of visualizingand quantifying both paw swelling and joint bone erosionswithin the same micro-CT scans, in a murine inflammatoryarthritis model. Results were compared with a previouslyestablished clinical paw score method and histologicalassessments [7, 9].
The hypothesis was that there would be a significantlyhigher paw volume (paw swelling) and lower bone volume(bone resorption) as detected by micro-CT in CAIA micecompared with prednisolone-treated CAIA mice, and thatthese changes would correlate with changes in clinical pawscores and histological scores.
Materials and methods
Animals and collagen antibody induced arthritis induction. Allexperiments were performed in accordance with theNHMRC Australian Code of practice for the care and useof animals for scientific purposes, with approval from theAnimal Ethics Committees of both the University ofAdelaide and SA Pathology (Approval Nos M-2009-167and 75/09, respectively). Female Balb/c mice (6–8 weeksold) were divided into two groups: group 1 (CAIA group,n = 10) and group 2 (CAIA treated with prednisolone
group, n = 12). Arthritis was induced using the CAIAprotocol as previously published [9]. Briefly, on day 0, allmice were injected with a 150 ll (1.5 mg) cocktail ofmonoclonal antibody to collagen type 2 (Chondrex Inc.,Redwood, WA, USA) via tail vein. On day 3, mice wereinjected with 20 ll (10 lg) E. Coli LPS intraperitoneally.Prednisolone treatment (10 mg/kg/day) was given to micein group 2 via oral gavage for 7 days, commencing on day4 and continued daily until the study completion at day10. CAIA mice were given vehicle (PBS/10%; EtOH) only.
Clinical paw scoring. Clinical paw scores were recordeddaily from day 0 to 10 by two independent observers thatwere blinded as to the group allocation; groups wererandomly presented to them for scoring, based on thepreviously published methods (total score per paw:0 = normal, 15 = severe) [7]. Each paw was scored accord-ing to the severity of inflammation in the wrist (radiocarpaljoint) or ankle/metatarsal and the involvement of the smalljoints. Briefly, the score ranged between 0 and 5 for severityof wrist/ankle swelling, and was 1 for each digital jointinvolved; hence, a maximal score of 15 for each paw and themaximal score for each mouse could be 60. Daily clinicalobservations of general health including body weight wererecorded on clinical record sheets. After 10 days, mice werehumanely killed using CO2 inhalation, and front paws werecollected for micro-CT and histological analysis. Based onthe clinical scoring, 90% of the CAIA mice demonstratedthe highest scores in the front right paws; therefore, thefront right paws were selected for analysis.
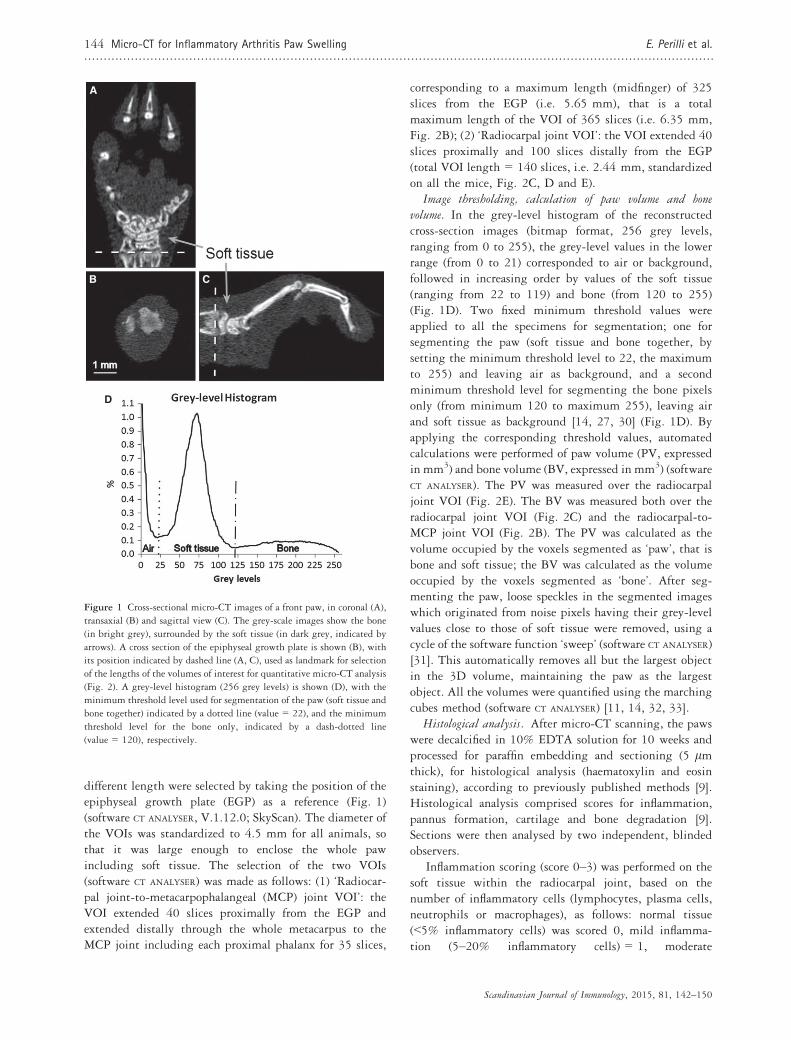
Micro-CT analysis. After collection, the front right pawswere fixed in 10% buffered formalin overnight followed bywashing in phosphate-buffered saline and then wrapped incling wrap for micro-CT scanning the following day(micro-CT SkyScan model 1076; SkyScan-Bruker, Kon-tich, Belgium). During scanning, the paws were placed inthe scanner with the long axis aligned with the axis of thescanner bed. The scanning parameters were as follows: pixelsize 17.4 lm, tube voltage 74 kV, tube current 136 lA,aluminium filter 1.0 mm, rotation step 0.5°, frameaveraging of 1 and scanning time 12 min [9]. The cross-section images were then reconstructed using a filteredback-projection algorithm (NRECON software, V 1.12.04;SkyScan) and saved as 8-bit grey-level files (bitmapformat). For each paw, a stack of up to 475 cross sectionswas reconstructed, with an interslice distance of 1 pixel(17.4 lm), corresponding to a maximum reconstructedheight of 8.3 mm (Fig. 1), recreating the full length of thepaw. For all animals, the reconstructed cross-section imageswere realigned in 3D, with the long axis of the paw alignedalong the vertical (inferior–superior) direction of theimages (software DATAVIEWER, SkyScan) (Fig. 1).
Volume of interest selection. The volume scanned andreconstructed by micro-CT comprised the entire paw(Fig. 1). From the stack of contiguous cross-sectionimages, two cylindrical volumes of interest (VOIs) of
� The Authors. Scandinavian Journal of Immunology published by John Wiley & Sons Ltd on behalf of Scandanavian Society of Immunology (SSI)
E. Perilli et al. Micro-CT for Inflammatory Arthritis Paw Swelling 143..................................................................................................................................................................
different length were selected by taking the position of theepiphyseal growth plate (EGP) as a reference (Fig. 1)(software CT ANALYSER, V.1.12.0; SkyScan). The diameter ofthe VOIs was standardized to 4.5 mm for all animals, sothat it was large enough to enclose the whole pawincluding soft tissue. The selection of the two VOIs(software CT ANALYSER) was made as follows: (1) ‘Radiocar-pal joint-to-metacarpophalangeal (MCP) joint VOI’: theVOI extended 40 slices proximally from the EGP andextended distally through the whole metacarpus to theMCP joint including each proximal phalanx for 35 slices,
corresponding to a maximum length (midfinger) of 325slices from the EGP (i.e. 5.65 mm), that is a totalmaximum length of the VOI of 365 slices (i.e. 6.35 mm,Fig. 2B); (2) ‘Radiocarpal joint VOI’: the VOI extended 40slices proximally and 100 slices distally from the EGP(total VOI length = 140 slices, i.e. 2.44 mm, standardizedon all the mice, Fig. 2C, D and E).
Image thresholding, calculation of paw volume and bonevolume. In the grey-level histogram of the reconstructedcross-section images (bitmap format, 256 grey levels,ranging from 0 to 255), the grey-level values in the lowerrange (from 0 to 21) corresponded to air or background,followed in increasing order by values of the soft tissue(ranging from 22 to 119) and bone (from 120 to 255)(Fig. 1D). Two fixed minimum threshold values wereapplied to all the specimens for segmentation; one forsegmenting the paw (soft tissue and bone together, bysetting the minimum threshold level to 22, the maximumto 255) and leaving air as background, and a secondminimum threshold level for segmenting the bone pixelsonly (from minimum 120 to maximum 255), leaving airand soft tissue as background [14, 27, 30] (Fig. 1D). Byapplying the corresponding threshold values, automatedcalculations were performed of paw volume (PV, expressedin mm3) and bone volume (BV, expressed in mm3) (softwareCT ANALYSER). The PV was measured over the radiocarpaljoint VOI (Fig. 2E). The BV was measured both over theradiocarpal joint VOI (Fig. 2C) and the radiocarpal-to-MCP joint VOI (Fig. 2B). The PV was calculated as thevolume occupied by the voxels segmented as ‘paw’, that isbone and soft tissue; the BV was calculated as the volumeoccupied by the voxels segmented as ‘bone’. After seg-menting the paw, loose speckles in the segmented imageswhich originated from noise pixels having their grey-levelvalues close to those of soft tissue were removed, using acycle of the software function ‘sweep’ (software CT ANALYSER)[31]. This automatically removes all but the largest objectin the 3D volume, maintaining the paw as the largestobject. All the volumes were quantified using the marchingcubes method (software CT ANALYSER) [11, 14, 32, 33].
Histological analysis. After micro-CT scanning, the pawswere decalcified in 10% EDTA solution for 10 weeks andprocessed for paraffin embedding and sectioning (5 lmthick), for histological analysis (haematoxylin and eosinstaining), according to previously published methods [9].Histological analysis comprised scores for inflammation,pannus formation, cartilage and bone degradation [9].Sections were then analysed by two independent, blindedobservers.
Inflammation scoring (score 0–3) was performed on thesoft tissue within the radiocarpal joint, based on thenumber of inflammatory cells (lymphocytes, plasma cells,neutrophils or macrophages), as follows: normal tissue(<5% inflammatory cells) was scored 0, mild inflamma-tion (5–20% inflammatory cells) = 1, moderate
A
B C
D
Figure 1 Cross-sectional micro-CT images of a front paw, in coronal (A),
transaxial (B) and sagittal view (C). The grey-scale images show the bone
(in bright grey), surrounded by the soft tissue (in dark grey, indicated by
arrows). A cross section of the epiphyseal growth plate is shown (B), with
its position indicated by dashed line (A, C), used as landmark for selection
of the lengths of the volumes of interest for quantitative micro-CT analysis
(Fig. 2). A grey-level histogram (256 grey levels) is shown (D), with the
minimum threshold level used for segmentation of the paw (soft tissue and
bone together) indicated by a dotted line (value = 22), and the minimum
threshold level for the bone only, indicated by a dash-dotted line
(value = 120), respectively.
Scandinavian Journal of Immunology, 2015, 81, 142–150
144 Micro-CT for Inflammatory Arthritis Paw Swelling E. Perilli et al...................................................................................................................................................................
inflammation (21–50% inflammatory cells) = 2 andsevere inflammation with a massive immune cell infiltra-tion (>50% of cells) = 3 [9].
Cartilage and bone degradation score (0–3): score0 = normal bone integrity, score 1 = mild cartilage destruc-tion, score 2 = evidence of both cartilage and bone destruc-tion and score 3 = severe cartilage and bone destruction.
Pannus formation (synovial membrane with infiltrationof inflammatory cells): score 0 = no pannus formation;score 1 = pannus formed [9].
Statistical analysis. Differences between groups in clin-ical paw scores, histological scores, PV and BV wereassessed using Mann–Whitney U-test. Correlationsbetween these parameters were analysed using the Pearson’sproduct-moment correlation. The significance level was setto P < 0.05. All statistical analyses were performed usingSPSS version 20 (Chicago, IL, USA).
Results
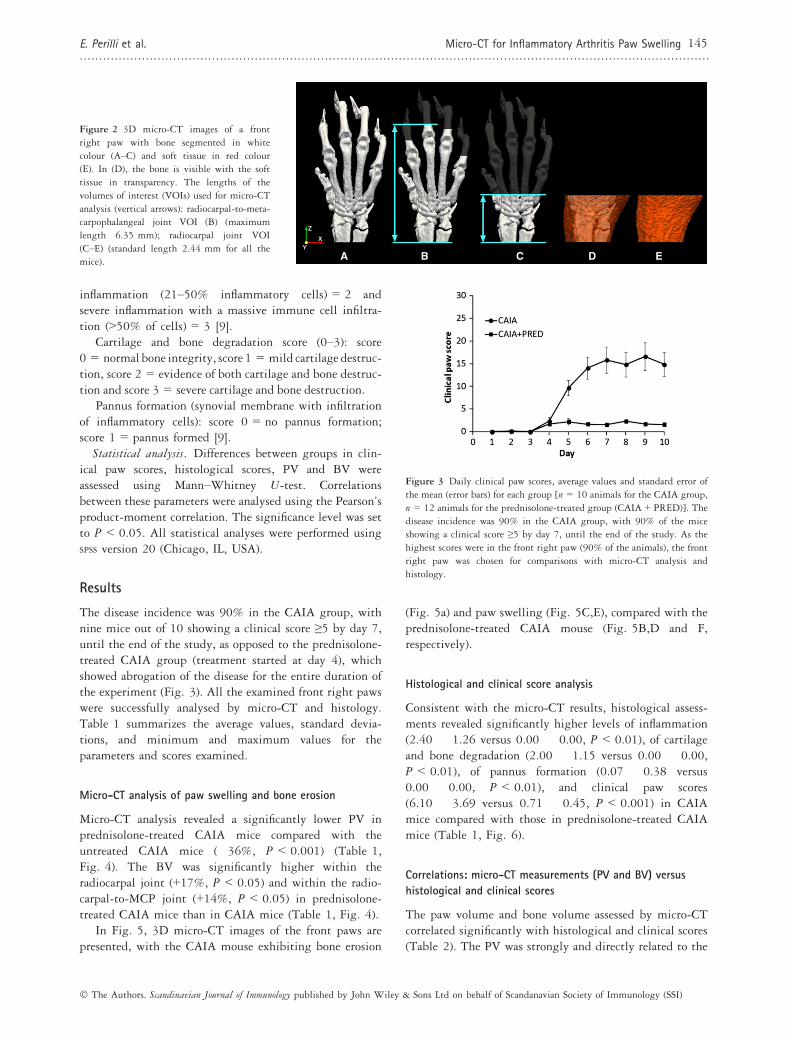
The disease incidence was 90% in the CAIA group, withnine mice out of 10 showing a clinical score ≥5 by day 7,until the end of the study, as opposed to the prednisolone-treated CAIA group (treatment started at day 4), whichshowed abrogation of the disease for the entire duration ofthe experiment (Fig. 3). All the examined front right pawswere successfully analysed by micro-CT and histology.Table 1 summarizes the average values, standard devia-tions, and minimum and maximum values for theparameters and scores examined.
Micro-CT analysis of paw swelling and bone erosion
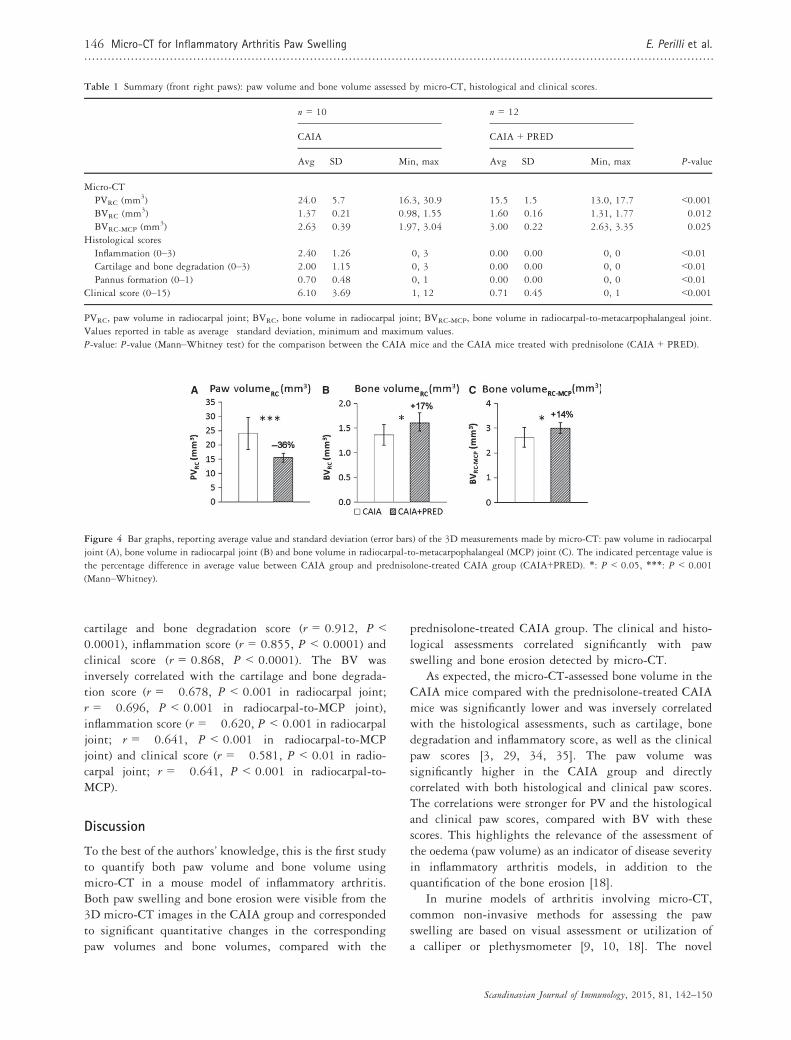
Micro-CT analysis revealed a significantly lower PV inprednisolone-treated CAIA mice compared with theuntreated CAIA mice (�36%, P < 0.001) (Table 1,Fig. 4). The BV was significantly higher within theradiocarpal joint (+17%, P < 0.05) and within the radio-carpal-to-MCP joint (+14%, P < 0.05) in prednisolone-treated CAIA mice than in CAIA mice (Table 1, Fig. 4).
In Fig. 5, 3D micro-CT images of the front paws arepresented, with the CAIA mouse exhibiting bone erosion
(Fig. 5a) and paw swelling (Fig. 5C,E), compared with theprednisolone-treated CAIA mouse (Fig. 5B,D and F,respectively).
Histological and clinical score analysis
Consistent with the micro-CT results, histological assess-ments revealed significantly higher levels of inflammation(2.40 � 1.26 versus 0.00 � 0.00, P < 0.01), of cartilageand bone degradation (2.00 � 1.15 versus 0.00 � 0.00,P < 0.01), of pannus formation (0.07 � 0.38 versus0.00 � 0.00, P < 0.01), and clinical paw scores(6.10 � 3.69 versus 0.71 � 0.45, P < 0.001) in CAIAmice compared with those in prednisolone-treated CAIAmice (Table 1, Fig. 6).
Correlations: micro-CT measurements (PV and BV) versus
histological and clinical scores
The paw volume and bone volume assessed by micro-CTcorrelated significantly with histological and clinical scores(Table 2). The PV was strongly and directly related to the
A B C D E
Figure 2 3D micro-CT images of a front
right paw with bone segmented in white
colour (A–C) and soft tissue in red colour
(E). In (D), the bone is visible with the soft
tissue in transparency. The lengths of the
volumes of interest (VOIs) used for micro-CT
analysis (vertical arrows): radiocarpal-to-meta-
carpophalangeal joint VOI (B) (maximum
length 6.35 mm); radiocarpal joint VOI
(C–E) (standard length 2.44 mm for all the
mice).
Figure 3 Daily clinical paw scores, average values and standard error of
the mean (error bars) for each group [n = 10 animals for the CAIA group,
n = 12 animals for the prednisolone-treated group (CAIA + PRED)]. The
disease incidence was 90% in the CAIA group, with 90% of the mice
showing a clinical score ≥5 by day 7, until the end of the study. As the
highest scores were in the front right paw (90% of the animals), the front
right paw was chosen for comparisons with micro-CT analysis and
histology.
� The Authors. Scandinavian Journal of Immunology published by John Wiley & Sons Ltd on behalf of Scandanavian Society of Immunology (SSI)
E. Perilli et al. Micro-CT for Inflammatory Arthritis Paw Swelling 145..................................................................................................................................................................
cartilage and bone degradation score (r = 0.912, P <0.0001), inflammation score (r = 0.855, P < 0.0001) andclinical score (r = 0.868, P < 0.0001). The BV wasinversely correlated with the cartilage and bone degrada-tion score (r = �0.678, P < 0.001 in radiocarpal joint;r = �0.696, P < 0.001 in radiocarpal-to-MCP joint),inflammation score (r = �0.620, P < 0.001 in radiocarpaljoint; r = �0.641, P < 0.001 in radiocarpal-to-MCPjoint) and clinical score (r = �0.581, P < 0.01 in radio-carpal joint; r = �0.641, P < 0.001 in radiocarpal-to-MCP).
Discussion
To the best of the authors’ knowledge, this is the first studyto quantify both paw volume and bone volume usingmicro-CT in a mouse model of inflammatory arthritis.Both paw swelling and bone erosion were visible from the3D micro-CT images in the CAIA group and correspondedto significant quantitative changes in the correspondingpaw volumes and bone volumes, compared with the
prednisolone-treated CAIA group. The clinical and histo-logical assessments correlated significantly with pawswelling and bone erosion detected by micro-CT.
As expected, the micro-CT-assessed bone volume in theCAIA mice compared with the prednisolone-treated CAIAmice was significantly lower and was inversely correlatedwith the histological assessments, such as cartilage, bonedegradation and inflammatory score, as well as the clinicalpaw scores [3, 29, 34, 35]. The paw volume wassignificantly higher in the CAIA group and directlycorrelated with both histological and clinical paw scores.The correlations were stronger for PV and the histologicaland clinical paw scores, compared with BV with thesescores. This highlights the relevance of the assessment ofthe oedema (paw volume) as an indicator of disease severityin inflammatory arthritis models, in addition to thequantification of the bone erosion [18].
In murine models of arthritis involving micro-CT,common non-invasive methods for assessing the pawswelling are based on visual assessment or utilization ofa calliper or plethysmometer [9, 10, 18]. The novel
A B C
Figure 4 Bar graphs, reporting average value and standard deviation (error bars) of the 3D measurements made by micro-CT: paw volume in radiocarpal
joint (A), bone volume in radiocarpal joint (B) and bone volume in radiocarpal-to-metacarpophalangeal (MCP) joint (C). The indicated percentage value is
the percentage difference in average value between CAIA group and prednisolone-treated CAIA group (CAIA+PRED). *: P < 0.05, ***: P < 0.001
(Mann–Whitney).
Table 1 Summary (front right paws): paw volume and bone volume assessed by micro-CT, histological and clinical scores.
n = 10 n = 12
P-value
CAIA CAIA + PRED
Avg � SD Min, max Avg � SD Min, max
Micro-CT
PVRC (mm3) 24.0 � 5.7 16.3, 30.9 15.5 � 1.5 13.0, 17.7 <0.001BVRC (mm3) 1.37 � 0.21 0.98, 1.55 1.60 � 0.16 1.31, 1.77 0.012
BVRC-MCP (mm3) 2.63 � 0.39 1.97, 3.04 3.00 � 0.22 2.63, 3.35 0.025
Histological scores
Inflammation (0–3) 2.40 � 1.26 0, 3 0.00 � 0.00 0, 0 <0.01Cartilage and bone degradation (0–3) 2.00 � 1.15 0, 3 0.00 � 0.00 0, 0 <0.01Pannus formation (0–1) 0.70 � 0.48 0, 1 0.00 � 0.00 0, 0 <0.01
Clinical score (0–15) 6.10 � 3.69 1, 12 0.71 � 0.45 0, 1 <0.001
PVRC, paw volume in radiocarpal joint; BVRC, bone volume in radiocarpal joint; BVRC-MCP, bone volume in radiocarpal-to-metacarpophalangeal joint.
Values reported in table as average�standard deviation, minimum and maximum values.
P-value: P-value (Mann–Whitney test) for the comparison between the CAIA mice and the CAIA mice treated with prednisolone (CAIA + PRED).
Scandinavian Journal of Immunology, 2015, 81, 142–150
146 Micro-CT for Inflammatory Arthritis Paw Swelling E. Perilli et al...................................................................................................................................................................

micro-CT image analysis protocol developed in this studyquantifies the volumetric soft tissue changes in 3D directlyfrom the same micro-CT images used for quantifying thebone erosion. It is relatively straightforward to perform,and no additional equipment is required. Further to this,no extra preparation or treatment of the sample, such asinjection of any contrast solution, is needed. The imageanalysis for the swelling, a post-processing procedure, canbe carried out directly on the same volume of interest asused for the bone volume calculations, and can be appliedon the same micro-CT scans, without the need of alteringthe scanning settings. In this study, the same in vivo systemand scanning settings were used as in a live animal studypreviously published by our group [9]. Theoretically, thiscould also allow measurements of paw swelling inlongitudinal study designs, where the same animals arescanned over multiple time points while under anaesthesia,
as carried out for bone erosion assessments [9]. After thescan, the paw images can be realigned via software in 3D asdone here, in order to have consistent positions at thedifferent time points. Based on the results presented, thismethod for quantifying swelling could be included as astandard quantitative measurement tool in animal modelsof inflammatory arthritis where micro-CT scans are madefor quantifying bone erosion.
In regard to changes in BV, the differences betweengroups were slightly more pronounced when analysing theradiocarpal region only (+17%), compared with the regionspanning from the radiocarpal joint to the MCP joints(+14%) (Fig. 4). This is likely to be due to the location andsize of the volume considered for quantification; in thelarger region (radiocarpal-to-MCP joint VOI), the decreasein BV due to bone joint erosion is partially compensated bythe larger quantity of bone of the carpal bones themselves,
A B
C D
E F
Figure 5 3D micro-CT images, front right
paws. Top images (A, B): bone in white colour;
the CAIA mouse (A) shows bone erosion
(yellow arrows) compared with the
prednisolone-treated CAIA mouse (CAIA +PRED) (B). Central and bottom images (C, D
and E, F, respectively): paw volume in the
radiocarpal joint in red colour [volume length
2.4 mm, vertical arrows in (E, F)]; in (C, D),
the bone is visible with the soft tissue in
transparency. The CAIA mouse (C, E) shows a
widened paw cross section [green arrows in
(E)] consistent with soft tissue swelling,
compared with the prednisolone-treated
CAIA mouse (CAIA+PRED) (D, F, white
arrows).
� The Authors. Scandinavian Journal of Immunology published by John Wiley & Sons Ltd on behalf of Scandanavian Society of Immunology (SSI)
E. Perilli et al. Micro-CT for Inflammatory Arthritis Paw Swelling 147..................................................................................................................................................................

compared with only the joints [36]. Additional attemptswere also made to assess BV for the MCP joints only, whichrevealed changes in magnitude similar to the radiocarpaljoint VOI (+17%). Hence, considering the MCP jointsseparately, or even the proximal interphalangeal joints as
suggested by Barck et al. [36], may result in a furtherimprovement in the sensitivity of the technique formeasuring BV. However, for more distal joints, this isalso more difficult to perform, as it requires a separate ROIfor each finger; and even if the method could be automated,it still requires more attention for accurate location of theROI in individual joints in more diseased paws [36]. Thus,based on our results regarding changes in BV, it issuggested that selecting the radiocarpal region is anappropriate, straightforward (no selection of fingersrequired) and sensitive method for quantification.
As a limitation of this study, we have compared theeffect of CAIA in mice on PV and BV with those of a CAIAgroup treated with prednisolone, rather than with a normalhealthy control group. Prednisolone, however, is an estab-lished RA treatment with proven efficacy, as shown also bythe histological scores and clinical scores in this study andwork by others [3, 29]; hence, the comparison of diseased
A B
C D
E
Figure 6 (A, B and E): Histologic images,
haematoxylin and eosin staining. The CAIA
mouse [(A) and in the corresponding close up
image (E)] shows bone erosion (arrow head),
cartilage degradation (arrow), pannus
formation (P), compared with the
prednisolone-treated CAIA mouse (B),
consistent with the micro-CT images in
Fig. 5A,B (bone erosion). Images in second
row (C, D): Photographic images of front right
paws; the CAIA mouse (C) shows paw swelling
and redness, compared with the prednisolone-
treated CAIA mouse (D), consistent with the
widening of the paw cross section from micro-
CT images in Fig. 5E versus 5F.
Table 2 Correlations (front right paws): histological and clinical scores
vs. paw volume and bone volume assessed by micro-CT.
PVRC BVRC BVRC-MCP
Cartilage and bone degradation
score
0.912*** �0.678** �0.696**
Inflammation score 0.855*** �0.620*** �0.641**Clinical score 0.868*** �0.581* �0.641**
PVRC, paw volume in radiocarpal joint; BVRC, bone volume in radiocarpal
joint; BVRC-MCP, bone volume in radiocarpal-to-metacarpophalangeal
joint.
Pearson correlation coefficient values (r-values).
*: P < 0.01; **: P < 0.001; ***: P < 0.0001.
Scandinavian Journal of Immunology, 2015, 81, 142–150
148 Micro-CT for Inflammatory Arthritis Paw Swelling E. Perilli et al...................................................................................................................................................................

and treated animals is sufficient to show the validity of thepresented micro-CT method. Also, we have compared andcorrelated the micro-CT measurements with the goldstandard histological scores (scores for inflammation, car-tilage and bone degradation, and pannus formation [9, 37])and the commonly used clinical paw scores [7], but not withother methods, such as plethysmometer or calliper. In thescientific literature, the plethysmometer has been shown tobe able to detect percentage changes in paw volumecomparable to the present study, however mainly in rats,which have bigger paws compared with mice [10, 38, 39].Calliper measurements for measuring changes in pawthickness (i.e. in 2D) were taken for rats and mice [3, 20,23] and have been suggested to be preferable to plethys-mometer measurements in mice [23]. However, thesemethods might not always be available, or even practicaldue to the small paws, particularly in mice. The presentstudy on mice, supported by clinical and histological scoresdata, clearly shows that volumetric differences due to pawswelling can directly be quantified via a post-processingprocedure, from the readily available micro-CT images forstudying the bone, at micrometre resolution in 3D.
In conclusion, we present a novel and simple 3D micro-CT image analysis protocol, capable of visualizing andquantifying within the same scan not only bone erosion butalso soft tissue swelling in a murine model of inflammatoryarthritis. As it does not require modifications of commonmicro-CT scanning procedures or the use of contrastagents, and being a non-destructive imaging and quanti-fication method, it can be easily used in antirheumatic drugstudies aimed at monitoring paw swelling in 3D alongwith the typically assessed bone erosion using micro-CT.
Acknowledgment
The authors gratefully acknowledge Dale Caville, Disci-pline of Anatomy and Pathology, School of MedicalSciences, The University of Adelaide, for assistance withphotography. Egon Perilli, PhD, was supported by a Grantin Aid 2013, Arthritis Australia, donor Zimmer Australia.Anak ASSK. Dharmapatni, PhD, was supported by a Grantin Aid 2012, Arthritis Australia State and TerritoryAffiliates, Arthritis SA.
Conflict of interest
None.
References
1 Goldring SR, Gravallese EM. Pathogenesis of bone lesions in
rheumatoid arthritis. Curr Rheumatol Rep 2002;4:226–31.2 Walsh NC, Crotti TN, Goldring SR, Gravallese EM. Rheumatic
diseases: the effects of inflammation on bone. Immunol Rev
2005;208:228–51.
3 Peterson JD, Labranche TP, Vasquez KO et al. Optical tomographic
imaging discriminates between disease-modifying anti-rheumatic
drug (DMARD) and non-DMARD efficacy in collagen antibody-
induced arthritis. Arthritis Res Ther 2010;12:R105.
4 Khachigian LM. Collagen antibody-induced arthritis. Nat Protoc2006;1:2512–6.
5 Korganow AS, Ji H, Mangialaio S et al. From systemic T cell self-
reactivity to organ-specific autoimmune disease via immunoglobulins.
Immunity 1999;10:451–61.6 Nandakumar KS, Andren M, Martinsson P et al. Induction of
arthritis by single monoclonal IgG anti-collagen type II antibodies
and enhancement of arthritis in mice lacking inhibitory FcgammaR-
IIB. Eur J Immunol 2003b;33:2269–77.7 Nandakumar KS, Svensson L, Holmdahl R. Collagen type II-specific
monoclonal antibody-induced arthritis inmice: description of the disease
and the influence of age, sex, and genes.Am J Pathol 2003;163:1827–37.8 Terato K, Hasty KA, Reife RA, Cremer MA, Kang AH, Stuart JM.
Induction of arthritis with monoclonal antibodies to collagen. J
Immunol 1992;148:2103–8.9 Cantley MD, Haynes DR, Marino V, Bartold PM. Pre-existing
periodontitis exacerbates experimental arthritis in a mouse model. J
Clin Periodontol 2011;38:532–41.10 Silva MD, Savinainen A, Kapadia R et al. Quantitative analysis of
micro-CT imaging and histopathological signatures of experimental
arthritis in rats. Mol Imaging 2004;3:312–8.11 Lane NE, Thompson JM, Haupt D, Kimmel DB, Modin G, Kinney
JH. Acute changes in trabecular bone connectivity and osteoclast
activity in the ovariectomized rat in vivo. J Bone Miner Res
1998;13:229–36.12 Waarsing JH, Day JS, van der Linden JC et al. Detecting and
tracking local changes in the tibiae of individual rats: a novel method
to analyse longitudinal in vivo micro-CT data. Bone 2004;34:163–9.13 Boyd SK, Davison P, M€uller R, Gasser JA. Monitoring individual
morphological changes over time in ovariectomized rats by in vivo
micro-computed tomography. Bone 2006;39:854–62.14 Perilli E, Le V, Ma B, Salmon P, Reynolds K, Fazzalari NL. Detecting
early bone changes using in vivo micro-CT in ovariectomized,
zoledronic acid-treated, and sham-operated rats. Osteoporos Int2010;21:1371–82.
15 Botter SM, van Osch GJ, Waarsing JH et al. Quantification of
subchondral bone changes in a murine osteoarthritis model using
micro-CT. Biorheology 2006;43:379–88.16 Mohan G, Perilli E, Kuliwaba JS, Humphries JM, Parkinson IH,
Fazzalari NL. Application of in vivo micro-computed tomography in
the temporal characterisation of subchondral bone architecture in a rat
model of low-dose monosodium iodoacetate-induced osteoarthritis.
Arthritis Res Ther 2011;13:R210.
17 Nishida S, Tsurukami H, Sakai A et al. Stage-dependent changes in
trabecular bone turnover and osteogenic capacity of marrow cells
during development of type II collagen-induced arthritis in mice.
Bone 2002;30:872–9.18 Chao CC, Chen SJ, Adamopoulos IE et al. Structural, cellular, and
molecular evaluation of bone erosion in experimental models of
rheumatoid arthritis: assessment by muCT, histology, and serum
biomarkers. Autoimmunity 2010;43:642–53.19 Chen XX, Baum W, Dwyer D et al. Sclerostin inhibition reverses
systemic, periarticular and local bone loss in arthritis. Ann Rheum Dis
2013;72:1732–6.20 Lange F, Bajtner E, Rintisch C, Nandakumar KS, Sack U, Holmdahl
R. Methotrexate ameliorates T cell dependent autoimmune arthritis
and encephalomyelitis but not antibody induced or fibroblast induced
arthritis. Ann Rheum Dis 2005;64:599–605.21 Garcia S, Bodano A, Gonzalez A, Forteza J, Gomez-Reino JJ, Conde
C. Partial protection against collagen antibody-induced arthritis in
PARP-1 deficient mice. Arthritis Res Ther 2006;8:R14.
� The Authors. Scandinavian Journal of Immunology published by John Wiley & Sons Ltd on behalf of Scandanavian Society of Immunology (SSI)
E. Perilli et al. Micro-CT for Inflammatory Arthritis Paw Swelling 149..................................................................................................................................................................

22 Garcia S, Forteza J, Lopez-Otin C, Gomez-Reino JJ, Gonzalez A,
Conde C. Matrix metalloproteinase-8 deficiency increases joint
inflammation and bone erosion in the K/BxN serum-transfer arthritis
model. Arthritis Res Ther 2010;12:R224.
23 Sharma JN, Samud AM, Asmawi MZ. Comparison between plethys-
mometer and micrometer methods to measure acute paw oedema for
screening anti-inflammatory activity in mice. Inflammopharmacology
2004;12:89–94.24 De Clerck NM, Meurrens K, Weiler H et al. High-resolution X-ray
microtomography for the detection of lung tumors in living mice.
Neoplasia 2004;6:374–9.25 Haines BB, Bettano KA, Chenard M et al. A quantitative volumetric
micro-computed tomography method to analyze lung tumors in
genetically engineered mouse models. Neoplasia 2009;11:39–47.26 De Langhe E, Vande Velde G, Hostens J et al. Quantification of lung
fibrosis and emphysema in mice using automated micro-computed
tomography. PLoS ONE 2012;7:e43123.
27 Luu YK, Lublinsky S, Ozcivici E et al. In vivo quantification of
subcutaneous and visceral adiposity by micro-computed tomography
in a small animal model. Med Eng Phys 2009;31:34–41.28 Judex S, Luu YK, Ozcivici E, Adler B, Lublinsky S, Rubin CT.
Quantification of adiposity in small rodents using micro-CT. Methods
2010;50:14–9.29 Bender AT, Spyvee M, Satoh T et al. Evaluation of a candidate anti-
arthritic drugusing themouse collagen antibody induced arthritismodel
and clinically relevant biomarkers. Am J Transl Res 2013;5:92–102.30 Perilli E, Baruffaldi F, Visentin M et al. MicroCT examination of
human bone specimens: effects of polymethylmethacrylate embedding
on structural parameters. J Microsc 2007;225:192–200.
31 Skyscan. Description of plug-ins in custom processing, Despeckle
(Sweep). CT Analyser User Manual, Appendix A, 2013:117. http://
www.skyscan.be/next/ctan_usermanual.pdf.
32 Lorensen WE, Cline HE. Marching cubes: a high resolution 3D
surface construction algorithm. Comput Graph 1987;21:163–9.33 Perilli E, Briggs AM, Kantor S et al. Failure strength of human
vertebrae: prediction using bone mineral density measured by DXA
and bone volume by micro-CT. Bone 2012;50:1416–25.34 Hegen M, Keith JC Jr, Collins M, Nickerson-Nutter CL. Utility of
animal models for identification of potential therapeutics for rheu-
matoid arthritis. Ann Rheum Dis 2008;67:1505–15.35 Hurtenbach U, Boggemeyer E, Stehle T, Museteanu C, Del Pozo E,
Simon MM. Prednisolone reduces experimental arthritis, and inflam-
matory tissue destruction in SCID mice infected with Borrelia
burgdorferi. Int J Immunopharmacol 1996;18:281–8.36 Barck KH, Lee WP, Diehl LJ et al. Quantification of cortical bone
loss and repair for therapeutic evaluation in collagen-induced
arthritis, by micro-computed tomography and automated image
analysis. Arthritis Rheum 2004;50:3377–86.37 Tak PP, Smeets TJ, Daha MR et al. Analysis of the synovial cell
infiltrate in early rheumatoid synovial tissue in relation to local
disease activity. Arthritis Rheum 1997;40:217–25.38 Bakhtiarian A, Aarabi Moghaddam F, Zamani MM, Ghamami SG,
Farahanikia B, Khanavi M. Anti-inflammatory effect of thymus
kotschyanus Boiss. & Hohen. extract on rat’s hind paw edema induced
by carrageenan. J Med Plants 2011;10:25–32.39 Gans KR, Galbraith W, Roman RJ et al. Anti-inflammatory and
safety profile of DuP 697, a novel orally effective prostaglandin
synthesis inhibitor. J Pharmacol Exp Ther 1990;254:180–7.
Scandinavian Journal of Immunology, 2015, 81, 142–150
150 Micro-CT for Inflammatory Arthritis Paw Swelling E. Perilli et al...................................................................................................................................................................