Quantification of Slab Influences on the Dynamic Performance of RC Frames against Progressive...
11
Quantification of Slab Influences on the Dynamic Performance of RC Frames against Progressive Collapse Kai Qian, M.ASCE 1 ; and Bing Li 2 Abstract: Numerous studies have indicated that the practice of ignoring the contribution of reinforced concrete (RC) slab in resisting progressive collapse is overconservative; however, the extent of influence of a slab, especially in terms of dynamic responses, have been rarely studied. To quantify this effect, two series of RC beam–column substructures (named DS and DF in this paper), with and without slab respectively were subjected to a series of dynamic tests involving the sudden removal of a corner support. To further elucidate the dynamic response of RC frames against progressive collapse, the experimental data acquired in this study were compared with their respective static responses derived in a previous series of tests published in another paper. The dynamic effects were evaluated by the newly defined term dynamic load increase factor (DLIF), which was defined as the ratio of static ultimate strength (SUS) to dynamic ultimate strength (DUS). The SUS of the test specimens had been captured in their respective static tests; however, the DUS of each specimen could not be determined based on a single dynamic test. Thus, a single-degree-freedom (SDOF) model was validated and used to conduct incremental dynamic analyses for each specimen. DOI: 10.1061/(ASCE)CF.1943-5509.0000488. © 2014 American Society of Civil Engineers. Author keywords: Progressive collapse; Reinforced concrete; Dynamic responses; Slab effects. Introduction Progressive collapse is defined as “the spread of an initial local fail- ure from element to element, eventually resulting in the collapse of an entire structure or a disproportionately large part of it” (ASCE/SEI 2010). After the collapse of the Murrah Federal Building and the World Trade Center towers, there has been a significant increase in the evaluation of the vulnerability of structures against progressive collapse—not only by design engineers but also by government agencies and commercial building owners. To better evaluate the likelihood of collapse in different structural types, several design guidelines [General Services Administration (GSA 2003); Depart- ment of Defense (DoD 2009)] have been proposed. To understand the performance of reinforced concrete (RC) frames in resisting progressive collapse and to refine the design guidelines, a number of analytical studies (Kaewkulchai and Williamson 2004; Marjanishvili 2004; Hayes et al. 2005; Ellingwood 2006; Ruth et al. 2006; Bao et al. 2008) have been conducted in the past decade. In recent years, numerous experimental studies have also been con- ducted to better understand the force redistribution mechanism of RC frames after the loss of one or several columns, such as Orton et al. (2009), Su et al. (2009), Yap and Li (2011), and Qian and Li (2012b). However, most of the previous experimental tests focused solely on beam–column subassemblages without including the con- tribution of RC slabs in redistributing the loads. To date, only Qian and Li (2012c) have conducted two series of tests (S and F) to quan- tify the slab effects on the pushdown performance of RC frames against progressive collapse. S and F represent specimens with and without slab under the pushdown load regime, respectively. The details of the pushdown performance of S- and F-series spec- imens can be found in Qian and Li (2012c). Although it was found that slab could increase the static ultimate strength (SUS) by up to 63%, the influences on dynamic responses are still unclear. As part of this study, two series of specimens with and without slab (DS and DF) were tested at Nanyang Technological University in Singapore. The dimensions and reinforcement details of DS- and DF-series specimens are similar to the corresponding S- and F-series specimens in Qian and Li (2012c), respectively. As the test results of DF-series specimens have already been introduced in Qian and Li (2012c), only the DS-series specimens are fully expounded upon in this study. Studying the results from the DS- and DF-series, the influence of slab on dynamic load redistribution of RC frames against progressive collapse could be quantified. By further comparing the dynamic re- sults with the pushdown performances determined previously in Qian and Li (2012c), the dynamic effects of RC frames against progressive collapse could also be evaluated. The slab contribution to the structural performance is then captured as the dynamic load increase factor (DLIF), defined as the ratio of SUS to dynamic ulti- mate strength (DUS). The static ultimate strength SUS and DUS are defined as the maximum gravity load applied on the structure, which will not result in collapse when some of the columns were removed quasi-statically and simultaneously, respectively. As mentioned pre- viously, the SUS of the test specimens had been measured by cor- responding pushdown tests conducted earlier in Qian and Li (2012c). However, the DUS of each specimen could not be determined based on a single dynamic test. Thus, a single-degree-freedom (SDOF) model was validated and used to conduct incremental dynamic analyses for each specimen. Description of Test Program Tested Specimens Four one-third-scaled RC beam–column substructures were tested to investigate their dynamic response during progressive collapse 1 Research Fellow, Natural Hazards Research Centre (NHRC), Nanyang Technological Univ., Singapore 639798. E-mail: [email protected] 2 Associate Professor and Director, Natural Hazards Research Centre (NHRC), Nanyang Technological Univ., Singapore 639798 (corresponding author). E-mail: [email protected] Note. This manuscript was submitted on November 20, 2012; approved on June 12, 2013; published online on June 15, 2013. Discussion period open until November 12, 2014; separate discussions must be submitted for individual papers. This paper is part of the Journal of Performance of Constructed Facilities, © ASCE, ISSN 0887-3828/04014029(11)/$25.00. © ASCE 04014029-1 J. Perform. Constr. Facil. J. Perform. Constr. Facil. 2015.29.
Transcript of Quantification of Slab Influences on the Dynamic Performance of RC Frames against Progressive...
Quantification of Slab Influences on the DynamicPerformance of RC Frames against Progressive Collapse
Kai Qian, M.ASCE1; and Bing Li2
Abstract: Numerous studies have indicated that the practice of ignoring the contribution of reinforced concrete (RC) slab in resistingprogressive collapse is overconservative; however, the extent of influence of a slab, especially in terms of dynamic responses, have beenrarely studied. To quantify this effect, two series of RC beam–column substructures (named DS and DF in this paper), with and without slabrespectively were subjected to a series of dynamic tests involving the sudden removal of a corner support. To further elucidate the dynamicresponse of RC frames against progressive collapse, the experimental data acquired in this study were compared with their respective staticresponses derived in a previous series of tests published in another paper. The dynamic effects were evaluated by the newly defined termdynamic load increase factor (DLIF), which was defined as the ratio of static ultimate strength (SUS) to dynamic ultimate strength (DUS).The SUS of the test specimens had been captured in their respective static tests; however, the DUS of each specimen could not be determinedbased on a single dynamic test. Thus, a single-degree-freedom (SDOF) model was validated and used to conduct incremental dynamicanalyses for each specimen. DOI: 10.1061/(ASCE)CF.1943-5509.0000488. © 2014 American Society of Civil Engineers.
Author keywords: Progressive collapse; Reinforced concrete; Dynamic responses; Slab effects.
Introduction
Progressive collapse is defined as “the spread of an initial local fail-ure from element to element, eventually resulting in the collapse ofan entire structure or a disproportionately large part of it” (ASCE/SEI2010). After the collapse of the Murrah Federal Building and theWorld Trade Center towers, there has been a significant increasein the evaluation of the vulnerability of structures against progressivecollapse—not only by design engineers but also by governmentagencies and commercial building owners. To better evaluate thelikelihood of collapse in different structural types, several designguidelines [General Services Administration (GSA 2003); Depart-ment of Defense (DoD 2009)] have been proposed. To understandthe performance of reinforced concrete (RC) frames in resistingprogressive collapse and to refine the design guidelines, a numberof analytical studies (Kaewkulchai and Williamson 2004;Marjanishvili 2004; Hayes et al. 2005; Ellingwood 2006; Ruth et al.2006; Bao et al. 2008) have been conducted in the past decade. Inrecent years, numerous experimental studies have also been con-ducted to better understand the force redistribution mechanism ofRC frames after the loss of one or several columns, such as Ortonet al. (2009), Su et al. (2009), Yap and Li (2011), and Qian and Li(2012b). However, most of the previous experimental tests focusedsolely on beam–column subassemblages without including the con-tribution of RC slabs in redistributing the loads. To date, only Qianand Li (2012c) have conducted two series of tests (S and F) to quan-tify the slab effects on the pushdown performance of RC framesagainst progressive collapse. S and F represent specimens with
and without slab under the pushdown load regime, respectively.The details of the pushdown performance of S- and F-series spec-imens can be found in Qian and Li (2012c). Although it was foundthat slab could increase the static ultimate strength (SUS) by up to63%, the influences on dynamic responses are still unclear. As part ofthis study, two series of specimens with and without slab (DS andDF) were tested at Nanyang Technological University in Singapore.The dimensions and reinforcement details of DS- and DF-seriesspecimens are similar to the corresponding S- and F-series specimensin Qian and Li (2012c), respectively. As the test results of DF-seriesspecimens have already been introduced in Qian and Li (2012c),only the DS-series specimens are fully expounded upon in this study.Studying the results from the DS- and DF-series, the influence ofslab on dynamic load redistribution of RC frames against progressivecollapse could be quantified. By further comparing the dynamic re-sults with the pushdown performances determined previously inQian and Li (2012c), the dynamic effects of RC frames againstprogressive collapse could also be evaluated. The slab contributionto the structural performance is then captured as the dynamic loadincrease factor (DLIF), defined as the ratio of SUS to dynamic ulti-mate strength (DUS). The static ultimate strength SUS and DUS aredefined as the maximum gravity load applied on the structure, whichwill not result in collapse when some of the columns were removedquasi-statically and simultaneously, respectively. As mentioned pre-viously, the SUS of the test specimens had been measured by cor-responding pushdown tests conducted earlier in Qian and Li (2012c).However, the DUS of each specimen could not be determined basedon a single dynamic test. Thus, a single-degree-freedom (SDOF)model was validated and used to conduct incremental dynamicanalyses for each specimen.
Description of Test Program
Tested Specimens
Four one-third-scaled RC beam–column substructures were testedto investigate their dynamic response during progressive collapse
1Research Fellow, Natural Hazards Research Centre (NHRC), NanyangTechnological Univ., Singapore 639798. E-mail: [email protected]
2Associate Professor and Director, Natural Hazards Research Centre(NHRC), Nanyang Technological Univ., Singapore 639798 (correspondingauthor). E-mail: [email protected]
Note. This manuscript was submitted on November 20, 2012; approvedon June 12, 2013; published online on June 15, 2013. Discussion periodopen until November 12, 2014; separate discussions must be submitted forindividual papers. This paper is part of the Journal of Performance ofConstructed Facilities, © ASCE, ISSN 0887-3828/04014029(11)/$25.00.
© ASCE 04014029-1 J. Perform. Constr. Facil.
J. Perform. Constr. Facil. 2015.29.
caused by the sudden removal of a corner column. These fourspecimens were categorized into two series (DS and DF). Thedimensions and reinforcement details of each specimen are sum-marized in Table 1. The nonseismically detailed specimens(DS1 and DF1) were designed according to Singapore StandardCP 65 (1999), whereas the seismically detailed specimens (DS2and DF2) were designed according to ACI 318-08 (ACI 2008).
As mentioned previously, the dynamic test specimens DS1, DS2,DF1, and DF2 had similar dimensions and reinforcement details asthe corresponding static test specimens S1, S2, F1, and F2, respec-tively. Thus, for details on the specimen design and detailing,please refer to Qian and Li (2012c).
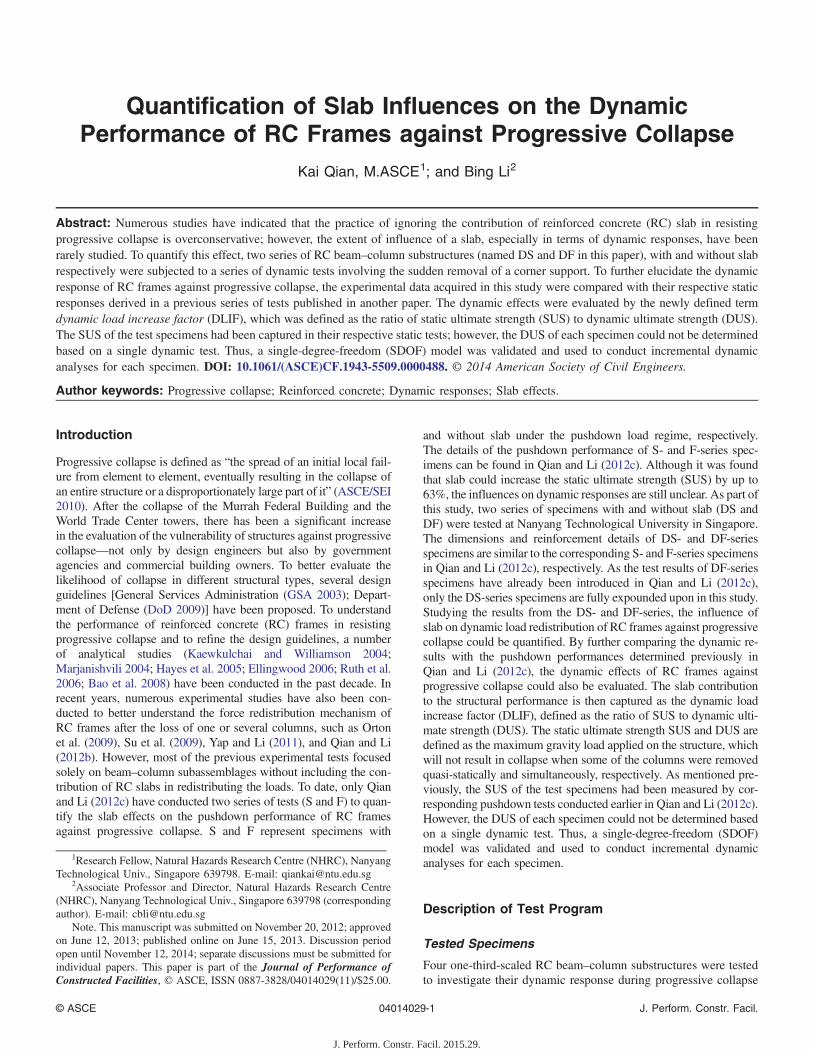
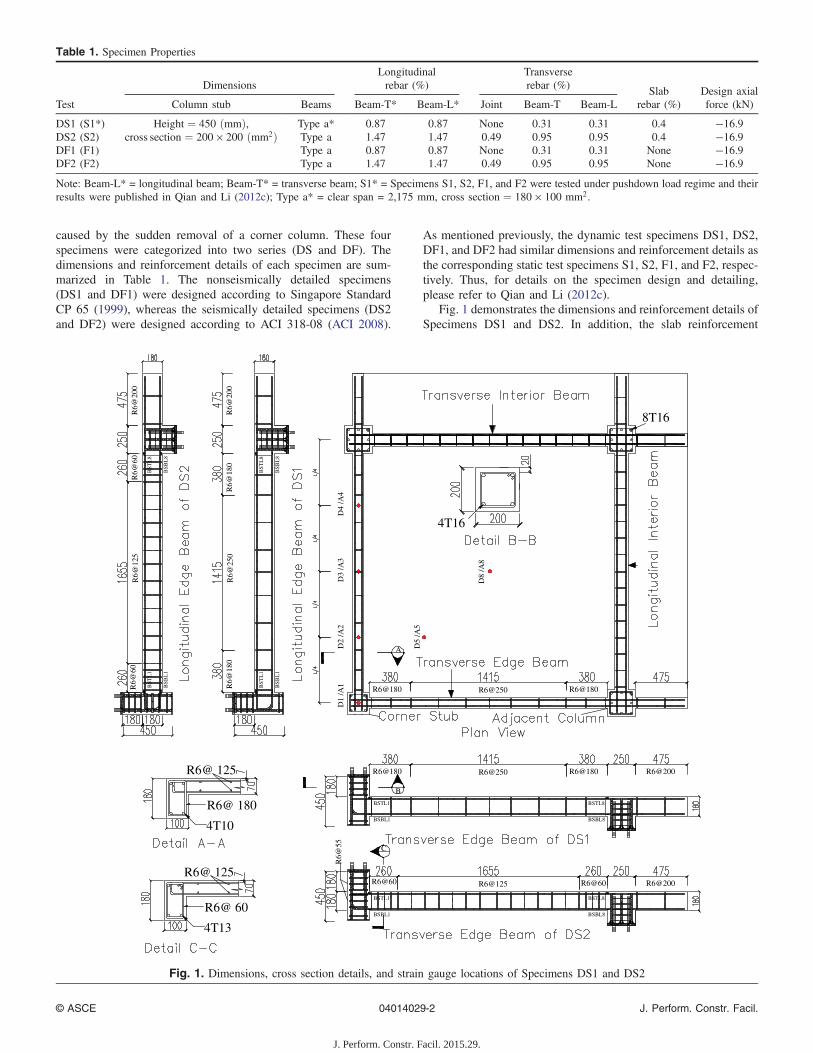
Fig. 1 demonstrates the dimensions and reinforcement details ofSpecimens DS1 and DS2. In addition, the slab reinforcement
Table 1. Specimen Properties
Test
DimensionsLongitudinalrebar (%)
Transverserebar (%) Slab
rebar (%)Design axialforce (kN)Column stub Beams Beam-T* Beam-L* Joint Beam-T Beam-L
DS1 (S1*) Height ¼ 450 ðmmÞ,cross section ¼ 200 × 200 ðmm2Þ
Type a* 0.87 0.87 None 0.31 0.31 0.4 −16.9DS2 (S2) Type a 1.47 1.47 0.49 0.95 0.95 0.4 −16.9DF1 (F1) Type a 0.87 0.87 None 0.31 0.31 None −16.9DF2 (F2) Type a 1.47 1.47 0.49 0.95 0.95 None −16.9Note: Beam-L* = longitudinal beam; Beam-T* = transverse beam; S1* = Specimens S1, S2, F1, and F2 were tested under pushdown load regime and theirresults were published in Qian and Li (2012c); Type a* = clear span = 2,175 mm, cross section ¼ 180 × 100 mm2.
R6@250 081@6R081@6R
B
A
R6@250 081@6R081@6R R6@200
R6@125R6@60 R6@60 R6@200
R6@
55 C
8T16
4T10
R6@ 180
R6@ 125
4T13
R6@ 60
R6@ 125
4T16
D1
/A1
D2
/A2
D3
/A3
D4
/A4
D5
/A5
D8
/A8
BSTL1
BSBL1
BSTL8
BSBL8
BSTL1
BSBL1
BSTL8
BSBL8
R6@
250
081@6
R081
@6R
R6@
200
R6@
125
R6@
60R
6@60
R6@
200
BS
TL
1
BS
BL
1
BS
TL
8
BS
BL
8
BS
TL
1
BS
BL
1
BS
TL
8
BS
BL
8
Fig. 1. Dimensions, cross section details, and strain gauge locations of Specimens DS1 and DS2
© ASCE 04014029-2 J. Perform. Constr. Facil.
J. Perform. Constr. Facil. 2015.29.
details of DS1 and DS2 are shown in Fig. 2. The concrete cover ofthe beam, column, and slab are 10, 20, and 7 mm, respectively. Asshown in Fig. 1, one corner-column stub, three adjacent enlargedcolumns, four RC beams, and a 70-mm-thick RC slab were castmonolithically. The size of the corner column stub was200 mm2, but the adjacent columns were of an enlarged size(250 mm2) to avoid failure. For DF-series specimens, only span-drel beams are modeled. As given in Table 1, the dimensionsand reinforcement details of spandrel beams and corner columnsof DF1 and DF2 were similar to the corresponding DS-seriesspecimens.
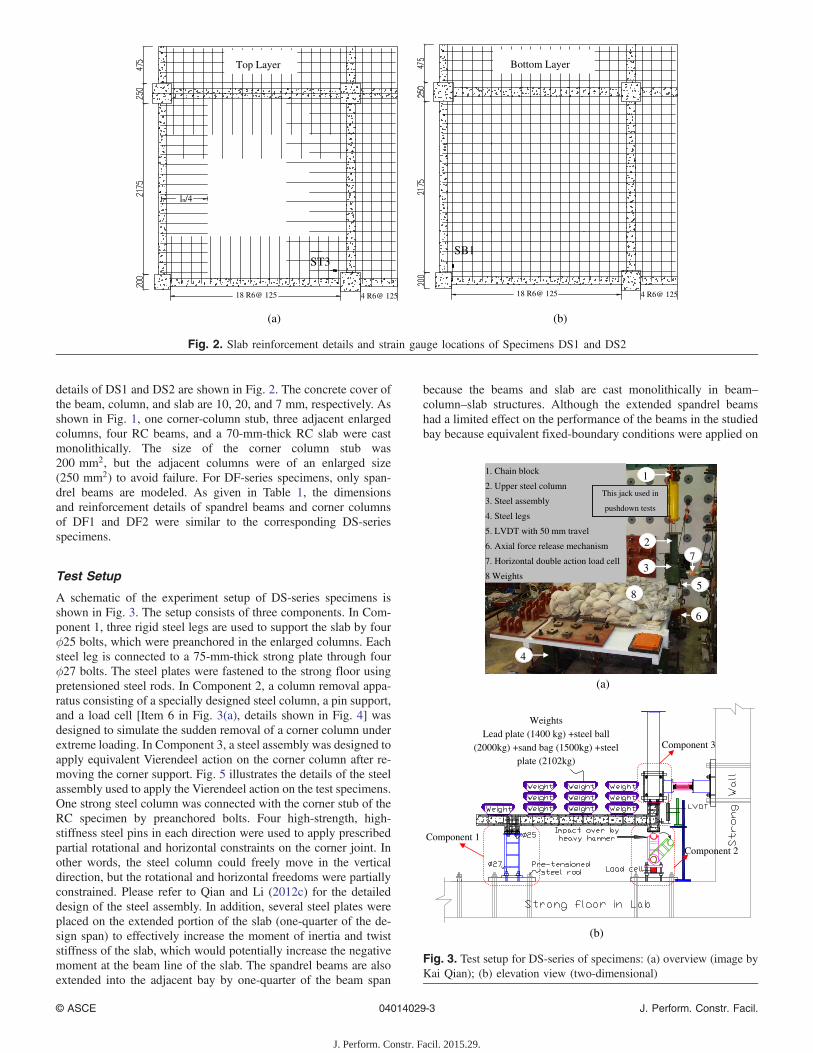
Test Setup
A schematic of the experiment setup of DS-series specimens isshown in Fig. 3. The setup consists of three components. In Com-ponent 1, three rigid steel legs are used to support the slab by fourϕ25 bolts, which were preanchored in the enlarged columns. Eachsteel leg is connected to a 75-mm-thick strong plate through fourϕ27 bolts. The steel plates were fastened to the strong floor usingpretensioned steel rods. In Component 2, a column removal appa-ratus consisting of a specially designed steel column, a pin support,and a load cell [Item 6 in Fig. 3(a), details shown in Fig. 4] wasdesigned to simulate the sudden removal of a corner column underextreme loading. In Component 3, a steel assembly was designed toapply equivalent Vierendeel action on the corner column after re-moving the corner support. Fig. 5 illustrates the details of the steelassembly used to apply the Vierendeel action on the test specimens.One strong steel column was connected with the corner stub of theRC specimen by preanchored bolts. Four high-strength, high-stiffness steel pins in each direction were used to apply prescribedpartial rotational and horizontal constraints on the corner joint. Inother words, the steel column could freely move in the verticaldirection, but the rotational and horizontal freedoms were partiallyconstrained. Please refer to Qian and Li (2012c) for the detaileddesign of the steel assembly. In addition, several steel plates wereplaced on the extended portion of the slab (one-quarter of the de-sign span) to effectively increase the moment of inertia and twiststiffness of the slab, which would potentially increase the negativemoment at the beam line of the slab. The spandrel beams are alsoextended into the adjacent bay by one-quarter of the beam span
because the beams and slab are cast monolithically in beam–column–slab structures. Although the extended spandrel beamshad a limited effect on the performance of the beams in the studiedbay because equivalent fixed-boundary conditions were applied on
18 R6@ 125 4 R6@ 125
SB1
Bottom Layer
ln/4
18 R6@ 125 4 R6@ 125
ST3
Top Layer
(a) (b)
Fig. 2. Slab reinforcement details and strain gauge locations of Specimens DS1 and DS2
(a)
(b)
Weights Lead plate (1400 kg) +steel ball
(2000kg) +sand bag (1500kg) +steel plate (2102kg)
Component 1 Component 2
Component 3
1. Chain block
2. Upper steel column
3. Steel assembly
4. Steel legs
5. LVDT with 50 mm travel
6. Axial force release mechanism
7. Horizontal double action load cell
8 Weights
1
2
3
4
5
6
7
8
This jack used in
pushdown tests
This jack used in
pushdown tests
Fig. 3. Test setup for DS-series of specimens: (a) overview (image byKai Qian); (b) elevation view (two-dimensional)
© ASCE 04014029-3 J. Perform. Constr. Facil.
J. Perform. Constr. Facil. 2015.29.
the adjacent columns, the extended spandrel beams led to the de-velopment of beam longitudinal reinforcement, similar to reality.For details on the setup of the DF-series specimens, please referto Qian and Li (2012c).
Test Procedures
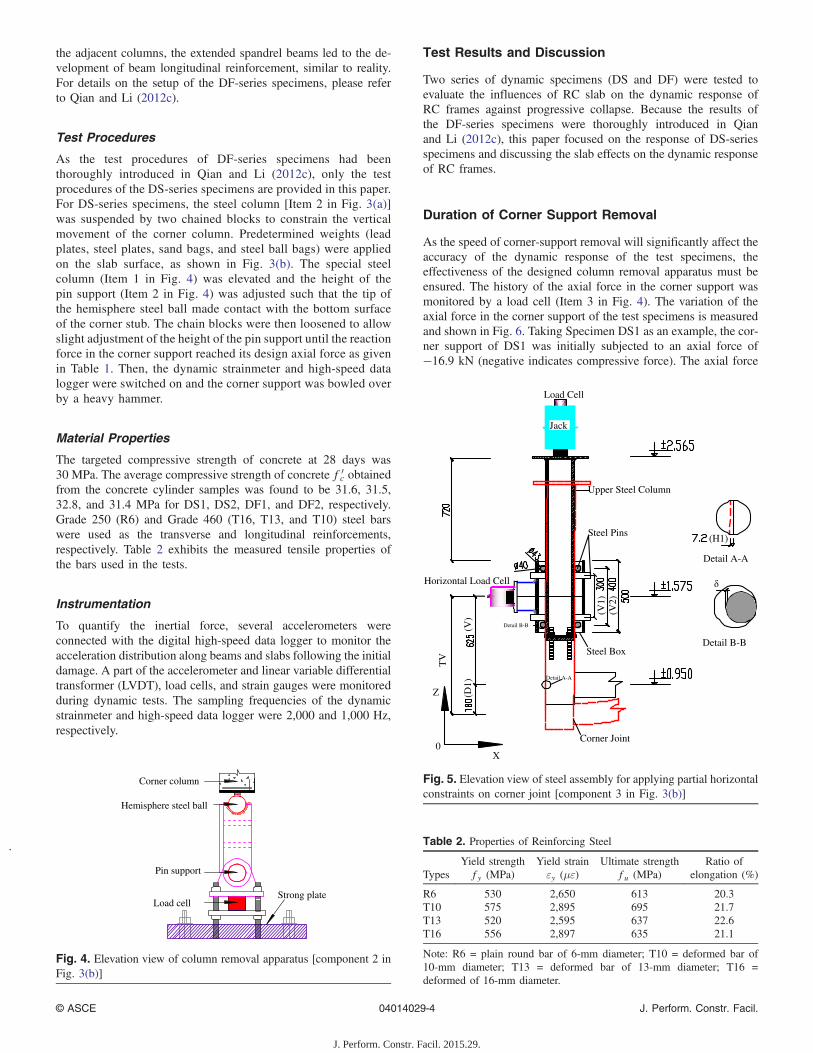
As the test procedures of DF-series specimens had beenthoroughly introduced in Qian and Li (2012c), only the testprocedures of the DS-series specimens are provided in this paper.For DS-series specimens, the steel column [Item 2 in Fig. 3(a)]was suspended by two chained blocks to constrain the verticalmovement of the corner column. Predetermined weights (leadplates, steel plates, sand bags, and steel ball bags) were appliedon the slab surface, as shown in Fig. 3(b). The special steelcolumn (Item 1 in Fig. 4) was elevated and the height of thepin support (Item 2 in Fig. 4) was adjusted such that the tip ofthe hemisphere steel ball made contact with the bottom surfaceof the corner stub. The chain blocks were then loosened to allowslight adjustment of the height of the pin support until the reactionforce in the corner support reached its design axial force as givenin Table 1. Then, the dynamic strainmeter and high-speed datalogger were switched on and the corner support was bowled overby a heavy hammer.
Material Properties
The targeted compressive strength of concrete at 28 days was30 MPa. The average compressive strength of concrete f 0
c obtainedfrom the concrete cylinder samples was found to be 31.6, 31.5,32.8, and 31.4 MPa for DS1, DS2, DF1, and DF2, respectively.Grade 250 (R6) and Grade 460 (T16, T13, and T10) steel barswere used as the transverse and longitudinal reinforcements,respectively. Table 2 exhibits the measured tensile properties ofthe bars used in the tests.
Instrumentation
To quantify the inertial force, several accelerometers wereconnected with the digital high-speed data logger to monitor theacceleration distribution along beams and slabs following the initialdamage. A part of the accelerometer and linear variable differentialtransformer (LVDT), load cells, and strain gauges were monitoredduring dynamic tests. The sampling frequencies of the dynamicstrainmeter and high-speed data logger were 2,000 and 1,000 Hz,respectively.
Test Results and Discussion
Two series of dynamic specimens (DS and DF) were tested toevaluate the influences of RC slab on the dynamic response ofRC frames against progressive collapse. Because the results ofthe DF-series specimens were thoroughly introduced in Qianand Li (2012c), this paper focused on the response of DS-seriesspecimens and discussing the slab effects on the dynamic responseof RC frames.
Duration of Corner Support Removal
As the speed of corner-support removal will significantly affect theaccuracy of the dynamic response of the test specimens, theeffectiveness of the designed column removal apparatus must beensured. The history of the axial force in the corner support wasmonitored by a load cell (Item 3 in Fig. 4). The variation of theaxial force in the corner support of the test specimens is measuredand shown in Fig. 6. Taking Specimen DS1 as an example, the cor-ner support of DS1 was initially subjected to an axial force of−16.9 kN (negative indicates compressive force). The axial force
Corner column
Load cell Strong plate
Hemisphere steel ball
Pin support
Fig. 4. Elevation view of column removal apparatus [component 2 inFig. 3(b)]
(V1)
Upper Steel Column
Steel Pins
Steel Box
(V2)
(V)
X
Z
0
(D1)
(H1)
TV
Corner Joint
Jack
Load Celload C
Horizontal Load Cell
Detail A-A
Detail B-B
Detail B-B
Detail A-A
Fig. 5. Elevation view of steel assembly for applying partial horizontalconstraints on corner joint [component 3 in Fig. 3(b)]
Table 2. Properties of Reinforcing Steel
TypesYield strengthfy (MPa)
Yield strainεy (με)
Ultimate strengthfu (MPa)
Ratio ofelongation (%)
R6 530 2,650 613 20.3T10 575 2,895 695 21.7T13 520 2,595 637 22.6T16 556 2,897 635 21.1
Note: R6 = plain round bar of 6-mm diameter; T10 = deformed bar of10-mm diameter; T13 = deformed bar of 13-mm diameter; T16 =deformed of 16-mm diameter.
© ASCE 04014029-4 J. Perform. Constr. Facil.
J. Perform. Constr. Facil. 2015.29.
.
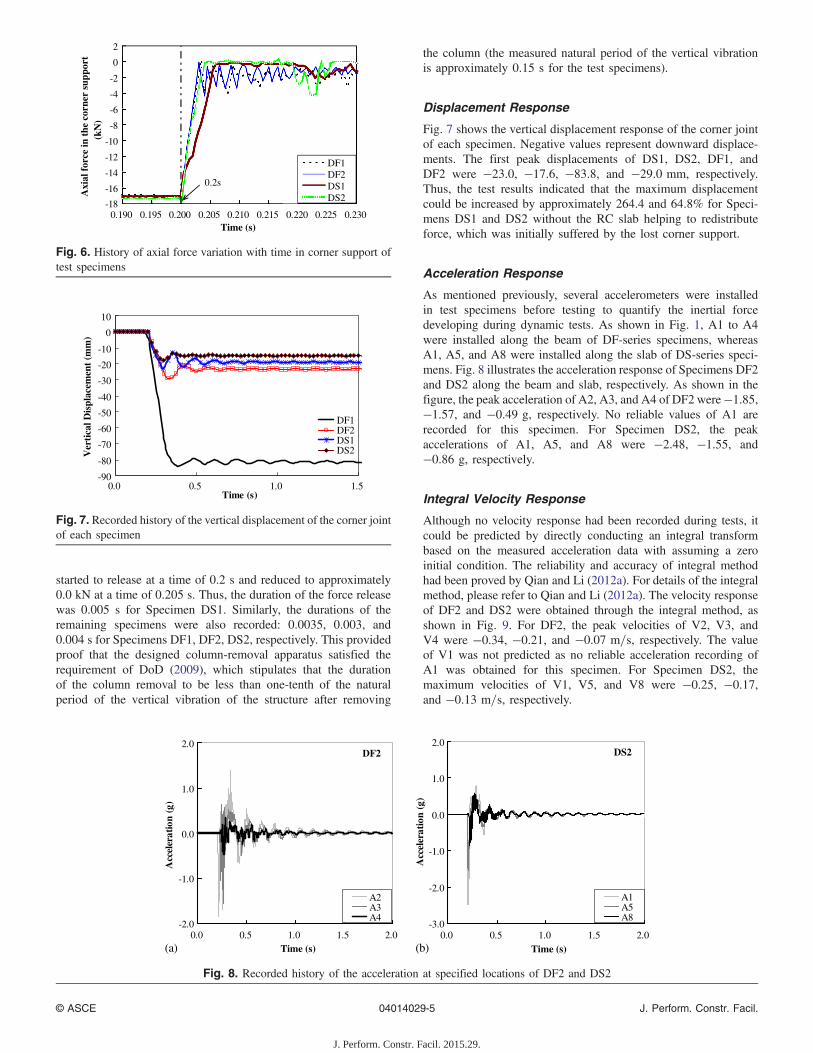
started to release at a time of 0.2 s and reduced to approximately0.0 kN at a time of 0.205 s. Thus, the duration of the force releasewas 0.005 s for Specimen DS1. Similarly, the durations of theremaining specimens were also recorded: 0.0035, 0.003, and0.004 s for Specimens DF1, DF2, DS2, respectively. This providedproof that the designed column-removal apparatus satisfied therequirement of DoD (2009), which stipulates that the durationof the column removal to be less than one-tenth of the naturalperiod of the vertical vibration of the structure after removing
the column (the measured natural period of the vertical vibrationis approximately 0.15 s for the test specimens).
Displacement Response
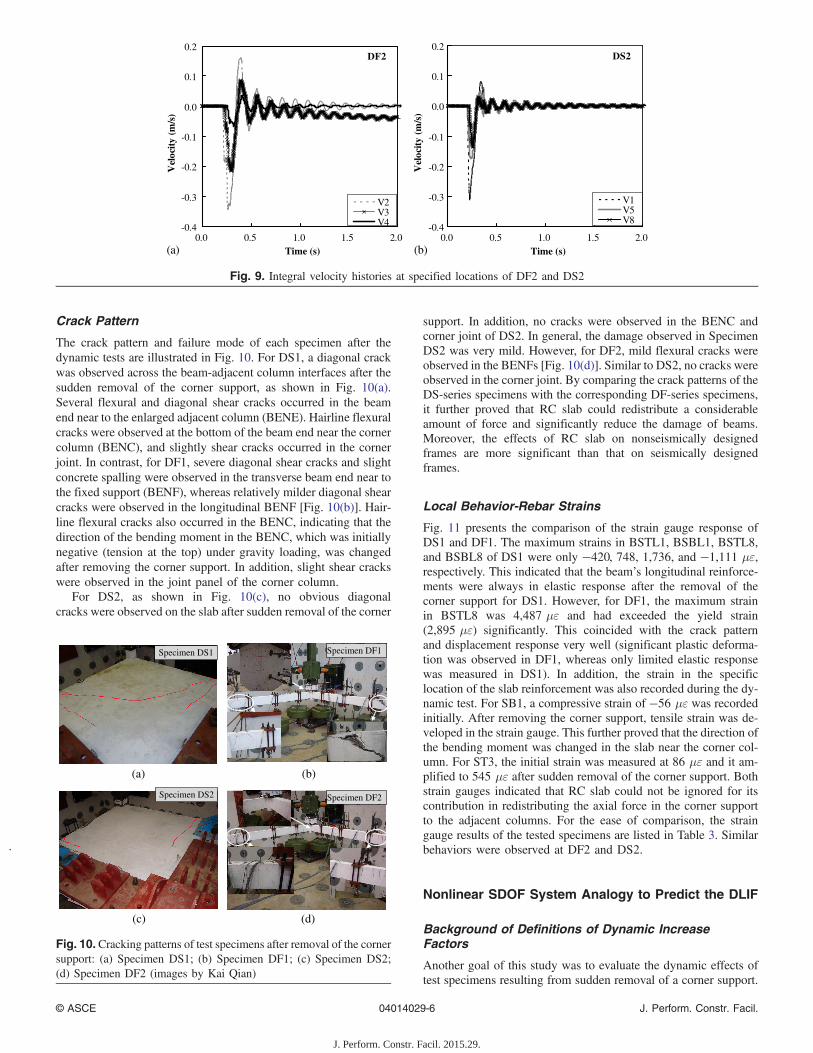
Fig. 7 shows the vertical displacement response of the corner jointof each specimen. Negative values represent downward displace-ments. The first peak displacements of DS1, DS2, DF1, andDF2 were −23.0, −17.6, −83.8, and −29.0 mm, respectively.Thus, the test results indicated that the maximum displacementcould be increased by approximately 264.4 and 64.8% for Speci-mens DS1 and DS2 without the RC slab helping to redistributeforce, which was initially suffered by the lost corner support.
Acceleration Response
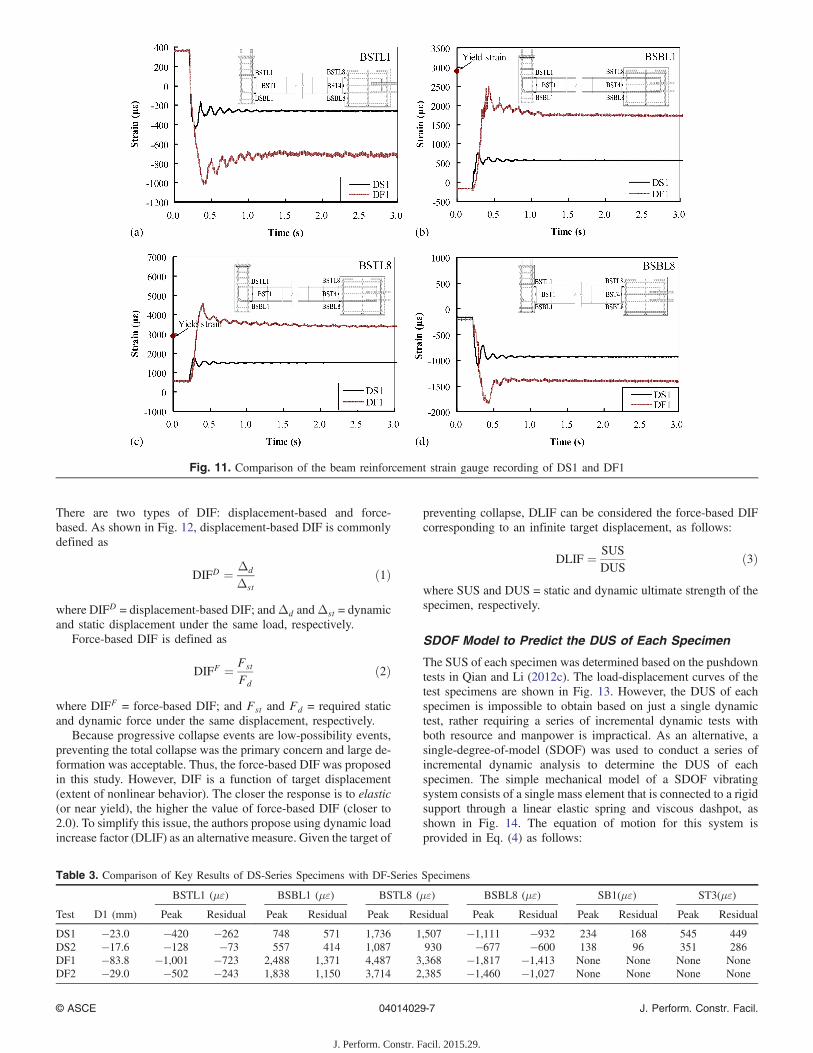
As mentioned previously, several accelerometers were installedin test specimens before testing to quantify the inertial forcedeveloping during dynamic tests. As shown in Fig. 1, A1 to A4were installed along the beam of DF-series specimens, whereasA1, A5, and A8 were installed along the slab of DS-series speci-mens. Fig. 8 illustrates the acceleration response of Specimens DF2and DS2 along the beam and slab, respectively. As shown in thefigure, the peak acceleration of A2, A3, and A4 of DF2 were−1.85,−1.57, and −0.49 g, respectively. No reliable values of A1 arerecorded for this specimen. For Specimen DS2, the peakaccelerations of A1, A5, and A8 were −2.48, −1.55, and−0.86 g, respectively.
Integral Velocity Response
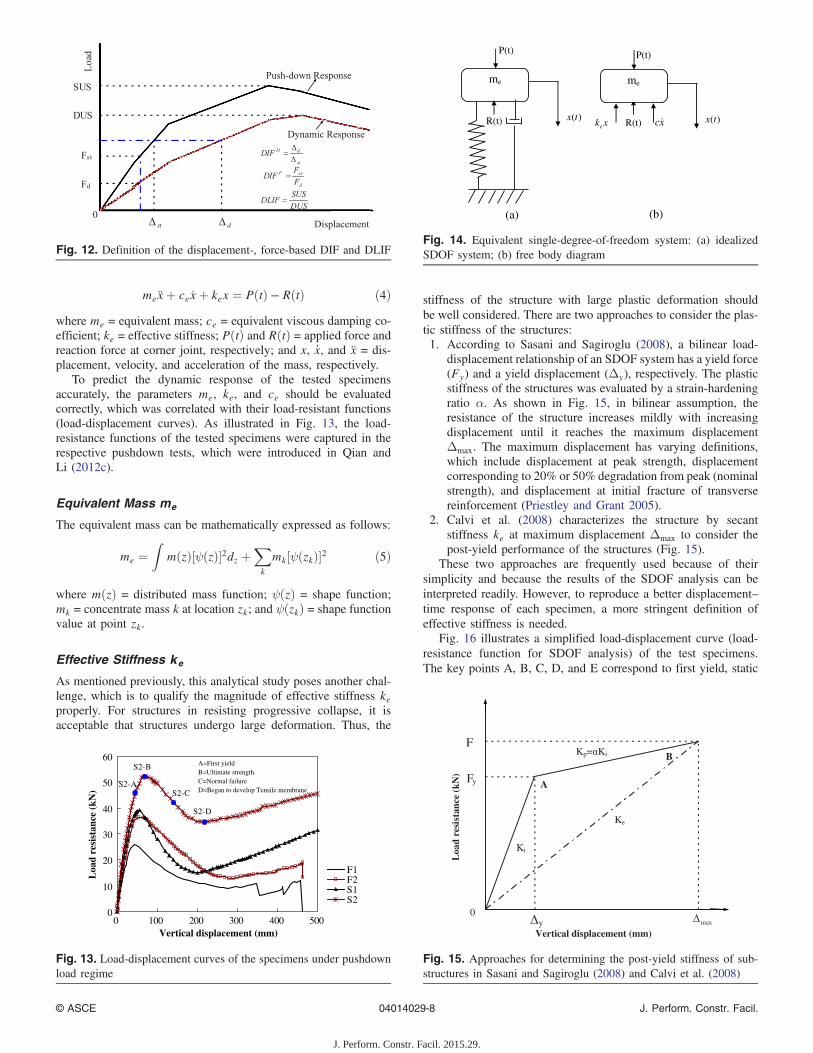
Although no velocity response had been recorded during tests, itcould be predicted by directly conducting an integral transformbased on the measured acceleration data with assuming a zeroinitial condition. The reliability and accuracy of integral methodhad been proved by Qian and Li (2012a). For details of the integralmethod, please refer to Qian and Li (2012a). The velocity responseof DF2 and DS2 were obtained through the integral method, asshown in Fig. 9. For DF2, the peak velocities of V2, V3, andV4 were −0.34, −0.21, and −0.07 m=s, respectively. The valueof V1 was not predicted as no reliable acceleration recording ofA1 was obtained for this specimen. For Specimen DS2, themaximum velocities of V1, V5, and V8 were −0.25, −0.17,and −0.13 m=s, respectively.
-18
-16
-14
-12
-10
-8
-6
-4
-2
0
2
0.190 0.195 0.200 0.205 0.210 0.215 0.220 0.225 0.230Time (s)
Axi
al f
orce
in t
he c
orne
r su
ppor
t(k
N)
DF1DF2DS1DS2
0.2s
Fig. 6. History of axial force variation with time in corner support oftest specimens
-90
-80
-70
-60
-50
-40
-30
-20
-10
0
10
0.0 0.5 1.0 1.5Time (s)
Ver
tica
l Dis
plac
emen
t (m
m)
DF1DF2DS1DS2
Fig. 7. Recorded history of the vertical displacement of the corner jointof each specimen
-2.0
(a) (b)
-1.0
0.0
1.0
2.0
0.0 0.5 1.0 1.5 2.0Time (s)
Acc
eler
atio
n (
g)
A2A3A4
DF2
-3.0
-2.0
-1.0
0.0
1.0
2.0
0.0 0.5 1.0 1.5 2.0Time (s)
Acc
eler
atio
n (g
)
A1A5A8
DS2
Fig. 8. Recorded history of the acceleration at specified locations of DF2 and DS2
© ASCE 04014029-5 J. Perform. Constr. Facil.
J. Perform. Constr. Facil. 2015.29.
Crack Pattern
The crack pattern and failure mode of each specimen after thedynamic tests are illustrated in Fig. 10. For DS1, a diagonal crackwas observed across the beam-adjacent column interfaces after thesudden removal of the corner support, as shown in Fig. 10(a).Several flexural and diagonal shear cracks occurred in the beamend near to the enlarged adjacent column (BENE). Hairline flexuralcracks were observed at the bottom of the beam end near the cornercolumn (BENC), and slightly shear cracks occurred in the cornerjoint. In contrast, for DF1, severe diagonal shear cracks and slightconcrete spalling were observed in the transverse beam end near tothe fixed support (BENF), whereas relatively milder diagonal shearcracks were observed in the longitudinal BENF [Fig. 10(b)]. Hair-line flexural cracks also occurred in the BENC, indicating that thedirection of the bending moment in the BENC, which was initiallynegative (tension at the top) under gravity loading, was changedafter removing the corner support. In addition, slight shear crackswere observed in the joint panel of the corner column.
For DS2, as shown in Fig. 10(c), no obvious diagonalcracks were observed on the slab after sudden removal of the corner
support. In addition, no cracks were observed in the BENC andcorner joint of DS2. In general, the damage observed in SpecimenDS2 was very mild. However, for DF2, mild flexural cracks wereobserved in the BENFs [Fig. 10(d)]. Similar to DS2, no cracks wereobserved in the corner joint. By comparing the crack patterns of theDS-series specimens with the corresponding DF-series specimens,it further proved that RC slab could redistribute a considerableamount of force and significantly reduce the damage of beams.Moreover, the effects of RC slab on nonseismically designedframes are more significant than that on seismically designedframes.
Local Behavior-Rebar Strains
Fig. 11 presents the comparison of the strain gauge response ofDS1 and DF1. The maximum strains in BSTL1, BSBL1, BSTL8,and BSBL8 of DS1 were only −420, 748, 1,736, and −1,111 με,respectively. This indicated that the beam’s longitudinal reinforce-ments were always in elastic response after the removal of thecorner support for DS1. However, for DF1, the maximum strainin BSTL8 was 4,487 με and had exceeded the yield strain(2,895 με) significantly. This coincided with the crack patternand displacement response very well (significant plastic deforma-tion was observed in DF1, whereas only limited elastic responsewas measured in DS1). In addition, the strain in the specificlocation of the slab reinforcement was also recorded during the dy-namic test. For SB1, a compressive strain of −56 με was recordedinitially. After removing the corner support, tensile strain was de-veloped in the strain gauge. This further proved that the direction ofthe bending moment was changed in the slab near the corner col-umn. For ST3, the initial strain was measured at 86 με and it am-plified to 545 με after sudden removal of the corner support. Bothstrain gauges indicated that RC slab could not be ignored for itscontribution in redistributing the axial force in the corner supportto the adjacent columns. For the ease of comparison, the straingauge results of the tested specimens are listed in Table 3. Similarbehaviors were observed at DF2 and DS2.
Nonlinear SDOF System Analogy to Predict the DLIF
Background of Definitions of Dynamic IncreaseFactors
Another goal of this study was to evaluate the dynamic effects oftest specimens resulting from sudden removal of a corner support.
-0.4
(a)
-0.3
-0.2
-0.1
0.0
0.1
0.2
0.0 0.5 1.0 1.5 2.0Time (s)
Vel
ocit
y (m
/s)
V2V3V4
DF2
-0.4
-0.3
-0.2
-0.1
0.0
0.1
0.2
0.0 0.5 1.0 1.5 2.0Time (s)
Vel
ocit
y (m
/s)
V1V5V8
DS2
(b)
Fig. 9. Integral velocity histories at specified locations of DF2 and DS2
(a) (b)
(c) (d)
Specimen DF2
Specimen DS1 Specimen DF1
Specimen DS2
Fig. 10. Cracking patterns of test specimens after removal of the cornersupport: (a) Specimen DS1; (b) Specimen DF1; (c) Specimen DS2;(d) Specimen DF2 (images by Kai Qian)
© ASCE 04014029-6 J. Perform. Constr. Facil.
J. Perform. Constr. Facil. 2015.29.
.
There are two types of DIF: displacement-based and force-based. As shown in Fig. 12, displacement-based DIF is commonlydefined as
DIFD ¼ Δd
Δstð1Þ
where DIFD = displacement-based DIF; andΔd andΔst = dynamicand static displacement under the same load, respectively.
Force-based DIF is defined as
DIFF ¼ Fst
Fdð2Þ
where DIFF = force-based DIF; and Fst and Fd = required staticand dynamic force under the same displacement, respectively.
Because progressive collapse events are low-possibility events,preventing the total collapse was the primary concern and large de-formation was acceptable. Thus, the force-based DIF was proposedin this study. However, DIF is a function of target displacement(extent of nonlinear behavior). The closer the response is to elastic(or near yield), the higher the value of force-based DIF (closer to2.0). To simplify this issue, the authors propose using dynamic loadincrease factor (DLIF) as an alternative measure. Given the target of
preventing collapse, DLIF can be considered the force-based DIFcorresponding to an infinite target displacement, as follows:
DLIF ¼ SUSDUS
ð3Þ
where SUS and DUS = static and dynamic ultimate strength of thespecimen, respectively.
SDOF Model to Predict the DUS of Each Specimen
The SUS of each specimen was determined based on the pushdowntests in Qian and Li (2012c). The load-displacement curves of thetest specimens are shown in Fig. 13. However, the DUS of eachspecimen is impossible to obtain based on just a single dynamictest, rather requiring a series of incremental dynamic tests withboth resource and manpower is impractical. As an alternative, asingle-degree-of-model (SDOF) was used to conduct a series ofincremental dynamic analysis to determine the DUS of eachspecimen. The simple mechanical model of a SDOF vibratingsystem consists of a single mass element that is connected to a rigidsupport through a linear elastic spring and viscous dashpot, asshown in Fig. 14. The equation of motion for this system isprovided in Eq. (4) as follows:
Fig. 11. Comparison of the beam reinforcement strain gauge recording of DS1 and DF1
Table 3. Comparison of Key Results of DS-Series Specimens with DF-Series Specimens
Test D1 (mm)
BSTL1 (με) BSBL1 (με) BSTL8 (με) BSBL8 (με) SB1(με) ST3(με)
Peak Residual Peak Residual Peak Residual Peak Residual Peak Residual Peak Residual
DS1 −23.0 −420 −262 748 571 1,736 1,507 −1,111 −932 234 168 545 449DS2 −17.6 −128 −73 557 414 1,087 930 −677 −600 138 96 351 286DF1 −83.8 −1,001 −723 2,488 1,371 4,487 3,368 −1,817 −1,413 None None None NoneDF2 −29.0 −502 −243 1,838 1,150 3,714 2,385 −1,460 −1,027 None None None None
© ASCE 04014029-7 J. Perform. Constr. Facil.
J. Perform. Constr. Facil. 2015.29.
mexþ cexþ kex ¼ PðtÞ − RðtÞ ð4Þwhere me = equivalent mass; ce = equivalent viscous damping co-efficient; ke = effective stiffness; PðtÞ and RðtÞ = applied force andreaction force at corner joint, respectively; and x, _x, and x = dis-placement, velocity, and acceleration of the mass, respectively.
To predict the dynamic response of the tested specimensaccurately, the parameters me, ke, and ce should be evaluatedcorrectly, which was correlated with their load-resistant functions(load-displacement curves). As illustrated in Fig. 13, the load-resistance functions of the tested specimens were captured in therespective pushdown tests, which were introduced in Qian andLi (2012c).
Equivalent Mass me
The equivalent mass can be mathematically expressed as follows:
me ¼Z
mðzÞ½ψðzÞ�2dz þXk
mk½ψðzkÞ�2 ð5Þ
where mðzÞ = distributed mass function; ψðzÞ = shape function;mk = concentrate mass k at location zk; and ψðzkÞ = shape functionvalue at point zk.
Effective Stiffness ke
As mentioned previously, this analytical study poses another chal-lenge, which is to qualify the magnitude of effective stiffness keproperly. For structures in resisting progressive collapse, it isacceptable that structures undergo large deformation. Thus, the
stiffness of the structure with large plastic deformation shouldbe well considered. There are two approaches to consider the plas-tic stiffness of the structures:1. According to Sasani and Sagiroglu (2008), a bilinear load-
displacement relationship of an SDOF system has a yield force(Fy) and a yield displacement (Δy), respectively. The plasticstiffness of the structures was evaluated by a strain-hardeningratio α. As shown in Fig. 15, in bilinear assumption, theresistance of the structure increases mildly with increasingdisplacement until it reaches the maximum displacementΔmax. The maximum displacement has varying definitions,which include displacement at peak strength, displacementcorresponding to 20% or 50% degradation from peak (nominalstrength), and displacement at initial fracture of transversereinforcement (Priestley and Grant 2005).
2. Calvi et al. (2008) characterizes the structure by secantstiffness ke at maximum displacement Δmax to consider thepost-yield performance of the structures (Fig. 15).
These two approaches are frequently used because of theirsimplicity and because the results of the SDOF analysis can beinterpreted readily. However, to reproduce a better displacement–time response of each specimen, a more stringent definition ofeffective stiffness is needed.
Fig. 16 illustrates a simplified load-displacement curve (load-resistance function for SDOF analysis) of the test specimens.The key points A, B, C, D, and E correspond to first yield, static
Displacement
Load
0
Fst
SUS
Dynamic Response
DUS
Fd
Push-down Response
st d
DUSSUSDLIF
d
stF
FF
DIF
st
dDDIF
Fig. 12. Definition of the displacement-, force-based DIF and DLIF
0
10
20
30
40
50
60
0 100 200 300 400 500Vertical displacement (mm)
Loa
d re
sist
ance
(kN
)
F1F2S1S2
S2-A
S2-B
S2-D
S2-C
A=First yieldB=Ultimate strengthC=Normal failureD=Began to develop Tensile membrane
Fig. 13. Load-displacement curves of the specimens under pushdownload regime
(a) (b)
me
P(t)
)(txR(t)
me
xke)(txR(t)
P(t)
xc
Fig. 14. Equivalent single-degree-of-freedom system: (a) idealizedSDOF system; (b) free body diagram
Vertical displacement (mm)
Loa
d re
sist
ance
(kN
)
B
A
y
Fy
0
Ki
Kp= Ki
Ke
max
F
Fig. 15. Approaches for determining the post-yield stiffness of sub-structures in Sasani and Sagiroglu (2008) and Calvi et al. (2008)
© ASCE 04014029-8 J. Perform. Constr. Facil.
J. Perform. Constr. Facil. 2015.29.
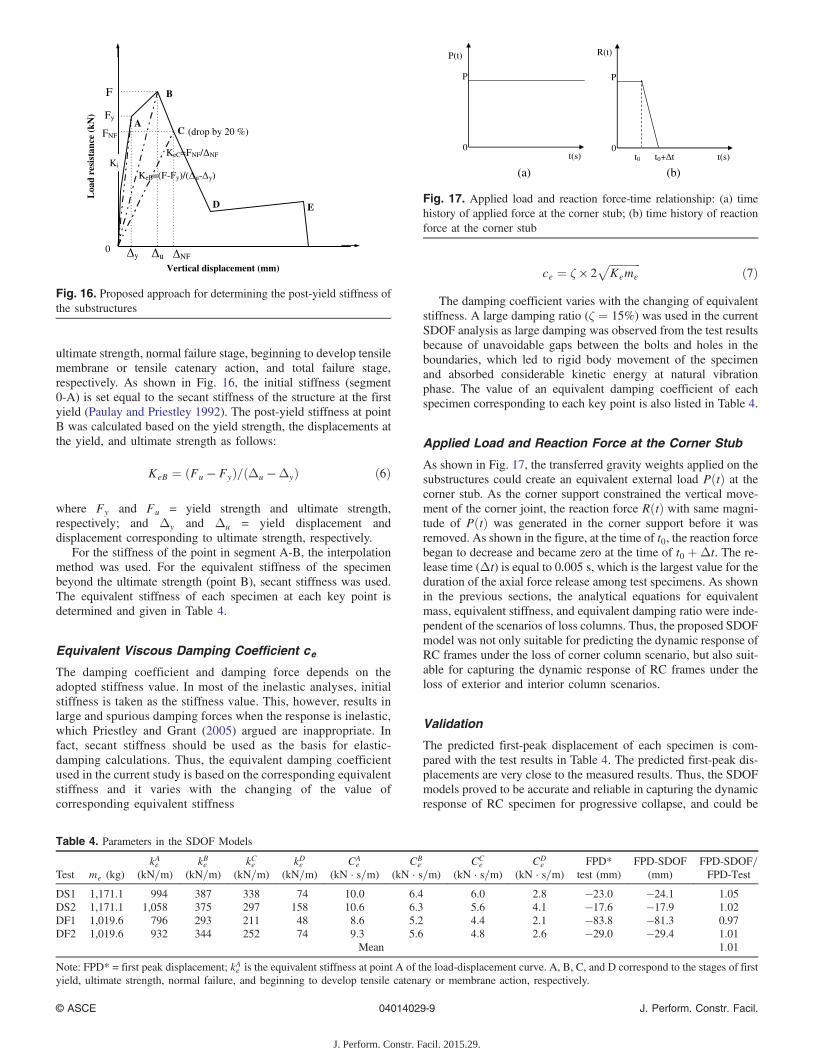
ultimate strength, normal failure stage, beginning to develop tensilemembrane or tensile catenary action, and total failure stage,respectively. As shown in Fig. 16, the initial stiffness (segment0-A) is set equal to the secant stiffness of the structure at the firstyield (Paulay and Priestley 1992). The post-yield stiffness at pointB was calculated based on the yield strength, the displacements atthe yield, and ultimate strength as follows:
KeB ¼ ðFu − FyÞ=ðΔu −ΔyÞ ð6Þ
where Fy and Fu = yield strength and ultimate strength,respectively; and Δy and Δu = yield displacement anddisplacement corresponding to ultimate strength, respectively.
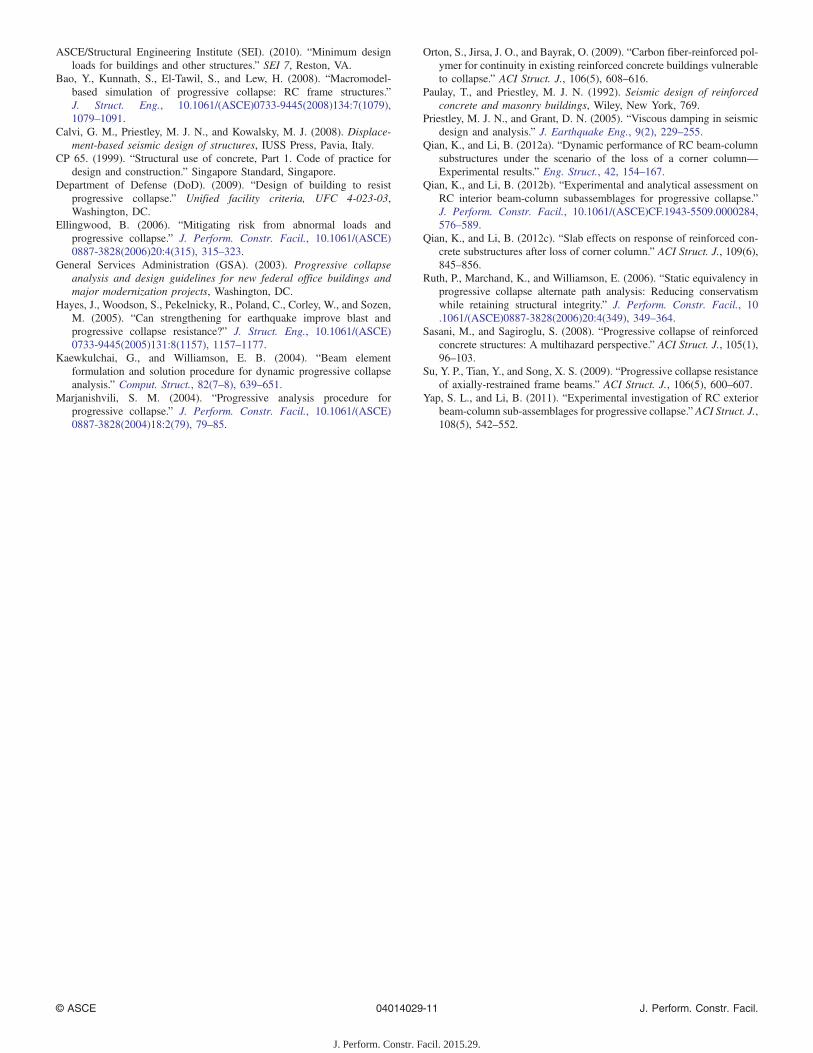
For the stiffness of the point in segment A-B, the interpolationmethod was used. For the equivalent stiffness of the specimenbeyond the ultimate strength (point B), secant stiffness was used.The equivalent stiffness of each specimen at each key point isdetermined and given in Table 4.
Equivalent Viscous Damping Coefficient ce
The damping coefficient and damping force depends on theadopted stiffness value. In most of the inelastic analyses, initialstiffness is taken as the stiffness value. This, however, results inlarge and spurious damping forces when the response is inelastic,which Priestley and Grant (2005) argued are inappropriate. Infact, secant stiffness should be used as the basis for elastic-damping calculations. Thus, the equivalent damping coefficientused in the current study is based on the corresponding equivalentstiffness and it varies with the changing of the value ofcorresponding equivalent stiffness
ce ¼ ζ × 2ffiffiffiffiffiffiffiffiffiffiffiffiKeme
pð7Þ
The damping coefficient varies with the changing of equivalentstiffness. A large damping ratio (ζ ¼ 15%) was used in the currentSDOF analysis as large damping was observed from the test resultsbecause of unavoidable gaps between the bolts and holes in theboundaries, which led to rigid body movement of the specimenand absorbed considerable kinetic energy at natural vibrationphase. The value of an equivalent damping coefficient of eachspecimen corresponding to each key point is also listed in Table 4.
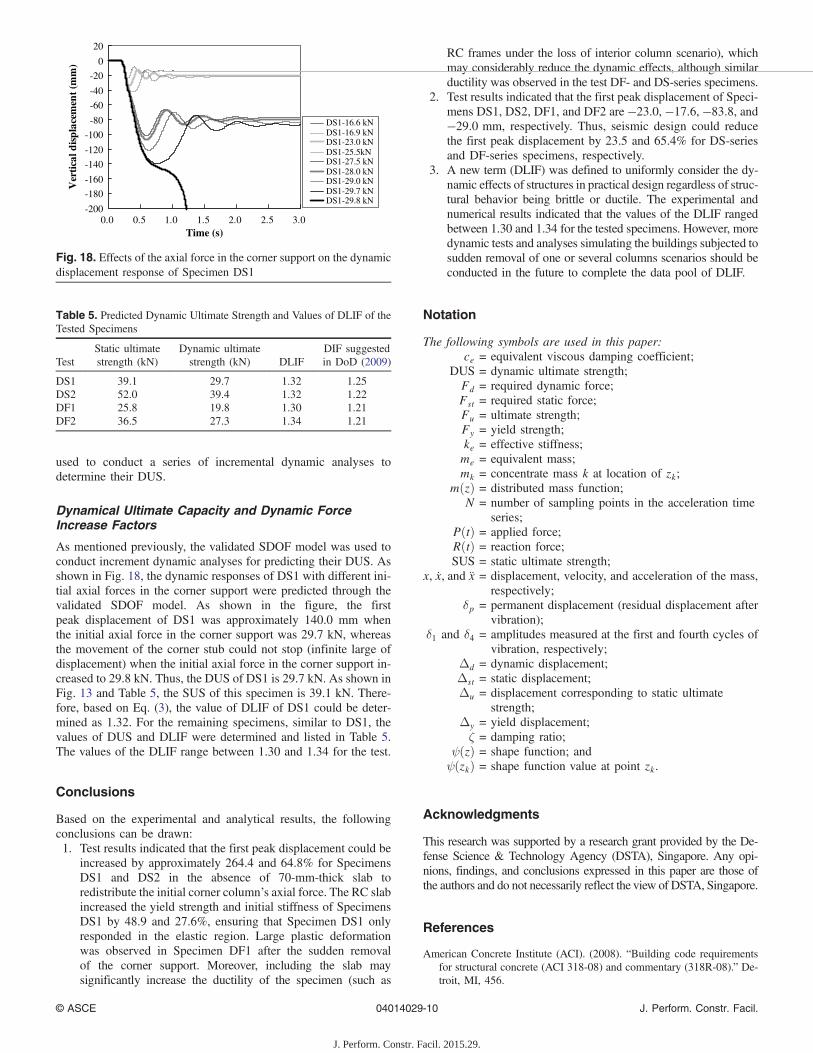
Applied Load and Reaction Force at the Corner Stub
As shown in Fig. 17, the transferred gravity weights applied on thesubstructures could create an equivalent external load PðtÞ at thecorner stub. As the corner support constrained the vertical move-ment of the corner joint, the reaction force RðtÞ with same magni-tude of PðtÞ was generated in the corner support before it wasremoved. As shown in the figure, at the time of t0, the reaction forcebegan to decrease and became zero at the time of t0 þΔt. The re-lease time (Δt) is equal to 0.005 s, which is the largest value for theduration of the axial force release among test specimens. As shownin the previous sections, the analytical equations for equivalentmass, equivalent stiffness, and equivalent damping ratio were inde-pendent of the scenarios of loss columns. Thus, the proposed SDOFmodel was not only suitable for predicting the dynamic response ofRC frames under the loss of corner column scenario, but also suit-able for capturing the dynamic response of RC frames under theloss of exterior and interior column scenarios.
Validation
The predicted first-peak displacement of each specimen is com-pared with the test results in Table 4. The predicted first-peak dis-placements are very close to the measured results. Thus, the SDOFmodels proved to be accurate and reliable in capturing the dynamicresponse of RC specimen for progressive collapse, and could be
Vertical displacement (mm)
Loa
d re
sist
ance
(kN
)B
AC
D E
y u NF
Fy
FNF
0
F
Ki
KeB=(F-Fy)/( u- y)
KeC=FNF/ NF
(drop by 20 %)
Fig. 16. Proposed approach for determining the post-yield stiffness ofthe substructures
Table 4. Parameters in the SDOF Models
Test me (kg)kAe
(kN=m)kBe
(kN=m)kCe
(kN=m)kDe
(kN=m)CAe
(kN · s=m)CBe
(kN · s=m)CCe
(kN · s=m)CDe
(kN · s=m)FPD*
test (mm)FPD-SDOF
(mm)FPD-SDOF=FPD-Test
DS1 1,171.1 994 387 338 74 10.0 6.4 6.0 2.8 −23.0 −24.1 1.05DS2 1,171.1 1,058 375 297 158 10.6 6.3 5.6 4.1 −17.6 −17.9 1.02DF1 1,019.6 796 293 211 48 8.6 5.2 4.4 2.1 −83.8 −81.3 0.97DF2 1,019.6 932 344 252 74 9.3 5.6 4.8 2.6 −29.0 −29.4 1.01
Mean 1.01
Note: FPD* = first peak displacement; kAe is the equivalent stiffness at point A of the load-displacement curve. A, B, C, and D correspond to the stages of firstyield, ultimate strength, normal failure, and beginning to develop tensile catenary or membrane action, respectively.
(a) (b)
R(t)
t(s) 0
P
t0 t0+ t
P(t)
t(s) 0
P
Fig. 17. Applied load and reaction force-time relationship: (a) timehistory of applied force at the corner stub; (b) time history of reactionforce at the corner stub
© ASCE 04014029-9 J. Perform. Constr. Facil.
J. Perform. Constr. Facil. 2015.29.
used to conduct a series of incremental dynamic analyses todetermine their DUS.
Dynamical Ultimate Capacity and Dynamic ForceIncrease Factors
As mentioned previously, the validated SDOF model was used toconduct increment dynamic analyses for predicting their DUS. Asshown in Fig. 18, the dynamic responses of DS1 with different ini-tial axial forces in the corner support were predicted through thevalidated SDOF model. As shown in the figure, the firstpeak displacement of DS1 was approximately 140.0 mm whenthe initial axial force in the corner support was 29.7 kN, whereasthe movement of the corner stub could not stop (infinite large ofdisplacement) when the initial axial force in the corner support in-creased to 29.8 kN. Thus, the DUS of DS1 is 29.7 kN. As shown inFig. 13 and Table 5, the SUS of this specimen is 39.1 kN. There-fore, based on Eq. (3), the value of DLIF of DS1 could be deter-mined as 1.32. For the remaining specimens, similar to DS1, thevalues of DUS and DLIF were determined and listed in Table 5.The values of the DLIF range between 1.30 and 1.34 for the test.
Conclusions
Based on the experimental and analytical results, the followingconclusions can be drawn:1. Test results indicated that the first peak displacement could be
increased by approximately 264.4 and 64.8% for SpecimensDS1 and DS2 in the absence of 70-mm-thick slab toredistribute the initial corner column’s axial force. The RC slabincreased the yield strength and initial stiffness of SpecimensDS1 by 48.9 and 27.6%, ensuring that Specimen DS1 onlyresponded in the elastic region. Large plastic deformationwas observed in Specimen DF1 after the sudden removalof the corner support. Moreover, including the slab maysignificantly increase the ductility of the specimen (such as
RC frames under the loss of interior column scenario), whichmay considerably reduce the dynamic effects, although similarductility was observed in the test DF- and DS-series specimens.
2. Test results indicated that the first peak displacement of Speci-mens DS1, DS2, DF1, and DF2 are −23.0, −17.6, −83.8, and−29.0 mm, respectively. Thus, seismic design could reducethe first peak displacement by 23.5 and 65.4% for DS-seriesand DF-series specimens, respectively.
3. A new term (DLIF) was defined to uniformly consider the dy-namic effects of structures in practical design regardless of struc-tural behavior being brittle or ductile. The experimental andnumerical results indicated that the values of the DLIF rangedbetween 1.30 and 1.34 for the tested specimens. However, moredynamic tests and analyses simulating the buildings subjected tosudden removal of one or several columns scenarios should beconducted in the future to complete the data pool of DLIF.
Notation
The following symbols are used in this paper:ce = equivalent viscous damping coefficient;
DUS = dynamic ultimate strength;Fd = required dynamic force;Fst = required static force;Fu = ultimate strength;Fy = yield strength;ke = effective stiffness;me = equivalent mass;mk = concentrate mass k at location of zk;
mðzÞ = distributed mass function;N = number of sampling points in the acceleration time
series;PðtÞ = applied force;RðtÞ = reaction force;SUS = static ultimate strength;
x, x, and x = displacement, velocity, and acceleration of the mass,respectively;
δp = permanent displacement (residual displacement aftervibration);
δ1 and δ4 = amplitudes measured at the first and fourth cycles ofvibration, respectively;
Δd = dynamic displacement;Δst = static displacement;Δu = displacement corresponding to static ultimate
strength;Δy = yield displacement;ζ = damping ratio;
ψðzÞ = shape function; andψðzkÞ = shape function value at point zk.
Acknowledgments
This research was supported by a research grant provided by the De-fense Science & Technology Agency (DSTA), Singapore. Any opi-nions, findings, and conclusions expressed in this paper are those ofthe authors and do not necessarily reflect the view of DSTA, Singapore.
References
American Concrete Institute (ACI). (2008). “Building code requirementsfor structural concrete (ACI 318-08) and commentary (318R-08).” De-troit, MI, 456.
-200
-180
-160
-140
-120
-100
-80
-60
-40
-20
0
20
0.0 0.5 1.0 1.5 2.0 2.5 3.0Time (s)
Ver
tica
l dis
pla
cem
ent
(mm
)
DS1-16.6 kNDS1-16.9 kNDS1-23.0 kNDS1-25.5kNDS1-27.5 kNDS1-28.0 kNDS1-29.0 kNDS1-29.7 kNDS1-29.8 kN
Fig. 18. Effects of the axial force in the corner support on the dynamicdisplacement response of Specimen DS1
Table 5. Predicted Dynamic Ultimate Strength and Values of DLIF of theTested Specimens
TestStatic ultimatestrength (kN)
Dynamic ultimatestrength (kN) DLIF
DIF suggestedin DoD (2009)
DS1 39.1 29.7 1.32 1.25DS2 52.0 39.4 1.32 1.22DF1 25.8 19.8 1.30 1.21DF2 36.5 27.3 1.34 1.21
© ASCE 04014029-10 J. Perform. Constr. Facil.
J. Perform. Constr. Facil. 2015.29.
ASCE/Structural Engineering Institute (SEI). (2010). “Minimum designloads for buildings and other structures.” SEI 7, Reston, VA.
Bao, Y., Kunnath, S., El-Tawil, S., and Lew, H. (2008). “Macromodel-based simulation of progressive collapse: RC frame structures.”J. Struct. Eng., 10.1061/(ASCE)0733-9445(2008)134:7(1079),1079–1091.
Calvi, G. M., Priestley, M. J. N., and Kowalsky, M. J. (2008). Displace-ment-based seismic design of structures, IUSS Press, Pavia, Italy.
CP 65. (1999). “Structural use of concrete, Part 1. Code of practice fordesign and construction.” Singapore Standard, Singapore.
Department of Defense (DoD). (2009). “Design of building to resistprogressive collapse.” Unified facility criteria, UFC 4-023-03,Washington, DC.
Ellingwood, B. (2006). “Mitigating risk from abnormal loads andprogressive collapse.” J. Perform. Constr. Facil., 10.1061/(ASCE)0887-3828(2006)20:4(315), 315–323.
General Services Administration (GSA). (2003). Progressive collapseanalysis and design guidelines for new federal office buildings andmajor modernization projects, Washington, DC.
Hayes, J., Woodson, S., Pekelnicky, R., Poland, C., Corley, W., and Sozen,M. (2005). “Can strengthening for earthquake improve blast andprogressive collapse resistance?” J. Struct. Eng., 10.1061/(ASCE)0733-9445(2005)131:8(1157), 1157–1177.
Kaewkulchai, G., and Williamson, E. B. (2004). “Beam elementformulation and solution procedure for dynamic progressive collapseanalysis.” Comput. Struct., 82(7–8), 639–651.
Marjanishvili, S. M. (2004). “Progressive analysis procedure forprogressive collapse.” J. Perform. Constr. Facil., 10.1061/(ASCE)0887-3828(2004)18:2(79), 79–85.
Orton, S., Jirsa, J. O., and Bayrak, O. (2009). “Carbon fiber-reinforced pol-ymer for continuity in existing reinforced concrete buildings vulnerableto collapse.” ACI Struct. J., 106(5), 608–616.
Paulay, T., and Priestley, M. J. N. (1992). Seismic design of reinforcedconcrete and masonry buildings, Wiley, New York, 769.
Priestley, M. J. N., and Grant, D. N. (2005). “Viscous damping in seismicdesign and analysis.” J. Earthquake Eng., 9(2), 229–255.
Qian, K., and Li, B. (2012a). “Dynamic performance of RC beam-columnsubstructures under the scenario of the loss of a corner column—Experimental results.” Eng. Struct., 42, 154–167.
Qian, K., and Li, B. (2012b). “Experimental and analytical assessment onRC interior beam-column subassemblages for progressive collapse.”J. Perform. Constr. Facil., 10.1061/(ASCE)CF.1943-5509.0000284,576–589.
Qian, K., and Li, B. (2012c). “Slab effects on response of reinforced con-crete substructures after loss of corner column.” ACI Struct. J., 109(6),845–856.
Ruth, P., Marchand, K., and Williamson, E. (2006). “Static equivalency inprogressive collapse alternate path analysis: Reducing conservatismwhile retaining structural integrity.” J. Perform. Constr. Facil., 10.1061/(ASCE)0887-3828(2006)20:4(349), 349–364.
Sasani, M., and Sagiroglu, S. (2008). “Progressive collapse of reinforcedconcrete structures: A multihazard perspective.” ACI Struct. J., 105(1),96–103.
Su, Y. P., Tian, Y., and Song, X. S. (2009). “Progressive collapse resistanceof axially-restrained frame beams.” ACI Struct. J., 106(5), 600–607.
Yap, S. L., and Li, B. (2011). “Experimental investigation of RC exteriorbeam-column sub-assemblages for progressive collapse.” ACI Struct. J.,108(5), 542–552.
© ASCE 04014029-11 J. Perform. Constr. Facil.
J. Perform. Constr. Facil. 2015.29.