Quantification of adsorbed human serum albumin at solid interfaces: a comparison between...
11
Colloids and Surfaces B: Biointerfaces 18 (2000) 71 – 81 Quantification of adsorbed human serum albumin at solid interfaces: a comparison between radioimmunoassay (RIA) and simple null ellipsometry Johan Benesch *, Agneta Askendal, Pentti Tengvall Laboratory of Applied Physics, Department of Physics and Measurement Technology, Linko ¨pings Uni6ersitet, SE – 581 83 Linko ¨ping, Sweden Received 21 April 1999; accepted 14 September 1999 Abstract Radioimmunoassay (RIA) and null ellipsometry are two common methods to quantify adsorbed proteins. However, the accuracy of null ellipsometry with a constant protein refractive index (n =1.465, k =0) at l =632.8 nm has this far not been explored. The present study compared the methods, and the degree of agreement between the simplified single wavelength null ellipsometry and RIA to quantify adsorbed proteins was explored on different surfaces. The quantification methods agreed well when A , ngstro ¨ m smooth hydrophilic or hydrophobic silicon surfaces, and freshly radio-labelled proteins were used. Some discrepancies were noted when either rough surfaces or stored and aged labelled proteins were used. The differences decreased when the aged protein solution was equilibrated with freshly dissolved proteins at room temperature (RT) for a few hours prior to the surface incubations. Significant differences were also noted between the methods when albumin was adsorbed at it’s iso-electric point (pH 4.8). © 2000 Elsevier Science B.V. All rights reserved. Keywords: RIA; Radioimmunoassay; Ellipsometry; Human serum albumin; Adsorption; Comparison; Hydrophilic; Hydrophobic; Silicon www.elsevier.nl/locate/colsurfb 1. Introduction Null ellipsometry has proven to be an excellent tool for the quantification of adsorbed proteins on optically reflecting surfaces. When combined with antibodies, this method can be used (cf. ELISA) to detect the antigenic expression of ad- sorbed proteins [1]. Ellipsometry can be used for single protein as well as serum and plasma exper- iments. In the latter case it is then possible to study e.g. the activation of different humoral cas- cades like activation of blood coagulation [2] and complement [3]. Another classical method to quantify proteins is radioimmunoassay (RIA). In the present study human serum albumin (HSA) was labelled with 125 I(t 1/2 =60 days) and used in single protein * Corresponding author: Tel.: +46-13-28-26-16; fax: +46- 13-28-89-69. E-mail address: [email protected] (J. Benesch) 0927-7765/00/$ - see front matter © 2000 Elsevier Science B.V. All rights reserved. PII:S0927-7765(99)00136-8
Transcript of Quantification of adsorbed human serum albumin at solid interfaces: a comparison between...

Colloids and Surfaces B: Biointerfaces 18 (2000) 71–81
Quantification of adsorbed human serum albumin at solidinterfaces: a comparison between radioimmunoassay (RIA)
and simple null ellipsometry
Johan Benesch *, Agneta Askendal, Pentti TengvallLaboratory of Applied Physics, Department of Physics and Measurement Technology, Linkopings Uni6ersitet,
SE–581 83 Linkoping, Sweden
Received 21 April 1999; accepted 14 September 1999
Abstract
Radioimmunoassay (RIA) and null ellipsometry are two common methods to quantify adsorbed proteins.However, the accuracy of null ellipsometry with a constant protein refractive index (n=1.465, k=0) at l=632.8 nmhas this far not been explored. The present study compared the methods, and the degree of agreement between thesimplified single wavelength null ellipsometry and RIA to quantify adsorbed proteins was explored on differentsurfaces. The quantification methods agreed well when A, ngstrom smooth hydrophilic or hydrophobic silicon surfaces,and freshly radio-labelled proteins were used. Some discrepancies were noted when either rough surfaces or storedand aged labelled proteins were used. The differences decreased when the aged protein solution was equilibrated withfreshly dissolved proteins at room temperature (RT) for a few hours prior to the surface incubations. Significantdifferences were also noted between the methods when albumin was adsorbed at it’s iso-electric point (pH 4.8).© 2000 Elsevier Science B.V. All rights reserved.
Keywords: RIA; Radioimmunoassay; Ellipsometry; Human serum albumin; Adsorption; Comparison; Hydrophilic; Hydrophobic;Silicon
www.elsevier.nl/locate/colsurfb
1. Introduction
Null ellipsometry has proven to be an excellenttool for the quantification of adsorbed proteinson optically reflecting surfaces. When combinedwith antibodies, this method can be used (cf.ELISA) to detect the antigenic expression of ad-
sorbed proteins [1]. Ellipsometry can be used forsingle protein as well as serum and plasma exper-iments. In the latter case it is then possible tostudy e.g. the activation of different humoral cas-cades like activation of blood coagulation [2] andcomplement [3].
Another classical method to quantify proteins isradioimmunoassay (RIA). In the present studyhuman serum albumin (HSA) was labelled with125I (t1/2=60 days) and used in single protein
* Corresponding author: Tel.: +46-13-28-26-16; fax: +46-13-28-89-69.
E-mail address: [email protected] (J. Benesch)
0927-7765/00/$ - see front matter © 2000 Elsevier Science B.V. All rights reserved.
PII: S0927 -7765 (99 )00136 -8
J. Benesch et al. / Colloids and Surfaces B: Biointerfaces 18 (2000) 71–8172
adsorption experiments. The surface activity afterthe adsorption was a measure of the total amountof adsorbed labelled proteins. This in turn wastranslated into surface mass density.
It was noticed in a recent work with mixtures oflabelled and unlabelled HSA that the 125I-labelledHSA preferentially bound to polystyrene and sili-con rubber surfaces [4]. The reasons for this werenot well understood, but may be due to changesin the protein conformation, hydrophobicity orcharge during the iodination procedure or due tostorage. Therefore, care has to be taken whilemaking experiments with mixed protein solutions.This aspect was also taken into consideration inthis work.
The present study is a comparison between thetwo quantitative methods, and primarily an at-tempt to reveal the validity of the assumption of aconstant protein refractive index (n=1.465, k=0) at l=632.8 nm in null ellipsometry. This is anassumption commonly made in simplified ellipso-metric models. Similar studies with different ap-proaches have been performed previously [5–8],and ellipsometry has also been compared withother methods [9–12]. However, no unequivocalresults were obtained regarding the protein refrac-tive indices of the proteins, nf, in these models.Thus, the goal was to study whether this verysimple ellipsometric model yields an acceptableagreement with RIA. It also turned out, however,that the use of radio labelled proteins is far fromstraightforward and filled with caveats. Subse-quently precautions must be taken using eithermethod.
2. Experimental methods
2.1. Surface preparations
Double sided polished silicon wafers with sur-face roughness Sq=2.8 A, were cut into 5 by 10mm pieces. The samples were cleaned and madehydrophilic by washing in Milli-Q water with 30%H2O2 (Kebo Lab, Sweden), 25% NH4OH (KeboLab) in proportions 5:1:1 for 5–10 min at 80°Cfollowed by Milli-Q H20 with 30% H2O2, 37%HCl (Kebo Lab) in proportions 6:1:1 for 5–10
min at 80°C. The samples were extensively rinsedwith Milli-Q water before and after each washingstep.
In order to prepare hydrophobic surfaces, hy-drophilic silicon was rinsed three times in ethanol(denatured 99.5%, Kemetyl, Sweden) and subse-quently three times in trichlorethylene (Labassco,Sweden). The samples were then placed in a solu-tion of 1% v/v dichlorodimethylsilane (DDS) intrichlororethylene for 5 min, rinsed three-fold intrichlorethylene, followed by three rinses inethanol. The samples were stored in 99.5%ethanol until use.
Pieces of hydrophilic silicon were etched in 40%KOH (Kebo Lab) in order to increase their sur-face roughness to Sq=20 A, . Subsequently thesewere made either hydrophilic or hydrophobic.
Pyrolytic carbon (PC) samples with surfaceroughness Sq=204 A, , were a kind gift fromPacesetter AB, Sweden.
2.2. Radio labelling procedure
The Iodo-Bead iodination method (Pierce,USA) was used for labelling of human serumalbumin (HSA, 96–99%, Sigma, Sweden) withsodium 125iodine. The beads were rinsed in phos-phate-buffered saline (PBS) at pH 6.5. Thesodium iodide was mixed in PBS, and equilibratedfor 5 min. Subsequently HSA (1 mg/ml) in PBSwas added, incubated and gently stirred for 7 min.The solution with labelled HSA (withoutIodobeads) was filtrated in desalting gel colons(Pierce, USA) equilibrated with PBS. From eachfraction a small volume was taken to control theactivity. The two colons with the highest activitywas pooled. The pooled solution was dialysedtogether with 50 mM KI. Dialysis tubings of poresize 3500 D were used. Small volumes were takenfrom the dialysate (1000 ml, PBS) and the activitywas checked. The protein solution was dialyseduntil the activity fell below 5000 CPM for 1 ml ofthe dialysate. The protein concentration was de-termined by spectrophotometry (Shimadzu UV-1601PC, USA) at 280 nm. A series of solutionswith known concentrations of unlabelled HSAwere used for the calibration.
J. Benesch et al. / Colloids and Surfaces B: Biointerfaces 18 (2000) 71–81 73
The protein size and charge were controlledwith SDS-PAGE and IEF (PhastSystem, Pharma-cia, Sweden) before and after the labelling. Thiswas done in order to ensure that the proteins werepure and that the labelling caused minimal effecton the protein charge and stability. No changesdue to the labelling procedure were noted (notshown).
The labelled proteins were aliquoted and storedat −80°C until further use. The aliquots werethawed in a water bath at room temperature(RT).
2.3. AFM
A NanoScope IIIa (Digital Instruments, USA)atomic force microscope (AFM) was run in Tap-ping Mode™. The surface roughness parameters(Sa and Sq) and surface enlargement (DA) werecalculated with the built-in software on imageswith scan sizes 1 and 10 mm after a third degreeplane fit (see Table 1). Three samples of each kindwere analysed.
2.4. Adsorption procedure
Labelled and non-labelled HSA at differentconcentrations were diluted in PBS with 0.1 MNaCl added, at pH 7.4 or 4.8 and equilibrated for
1 h, if not otherwise stated. All experiments wereperformed at RT. The silicon and PC sampleswere placed in PBS buffer a few minutes prior tothe addition of the proteins. After incubation thesamples were rinsed with Milli-Q water and blowndry with nitrogen. To a great extent this precau-tion helps to avoid deposition of salts and parti-cles from the ambient.
2.5. Ellipsometry
After protein incubation, each silicon samplewas rinsed with Milli-Q water and dried withgaseous nitrogen and measured at three locationsin air. The PC samples were measured in situ in aglass cuvette using a Rudolph Research AutoELIII bench ellipsometer at RT.
Non-protein incubated surfaces of each kindwere used as references. The thickness’ of theadsorbed protein films were calculated by thebuilt-in software for air measurements and thealgorithm by McCrackin [13] was used for in situdeterminations. The surface protein concentrationwas calculated according to the method outlinedby Stenberg [14] for air measurements, and deFeijter [15] for in situ measurements. The assumedrefractive indices for protein and buffer were(nf=1.465, kf=0) at l=632.8 nm and (nbuffer=1.335, kbuffer=0), respectively.
2.6. Radioimmunoassay (RIA)
After the ellipsometric determinations of ad-sorbed amounts of HSA the samples were trans-ferred to a gamma counter (Packard Cobra II,Canberra, USA), and the activity of 125I-HSA wasmeasured during 10 min. Samples incubated innon-labelled HSA were used as background refer-ences. In order to correlate the gamma countervalue with the amount of adsorbed protein,known volumes with known concentrations oflabelled proteins were measured in the gammacounter.
Control experiments with the 125I dialysateshowed no, or very low, adsorption of free 125I tothe test surfaces. In order to test a possible uptakeof free 125I by adsorbed and non-labelled HSA,such surfaces were incubated in the 125I-contain-
Table 1Surface roughness (nm) and surface enlargement (%) for thedifferent surfaces used
Scan size (mm) Sa (nm) Sq (nm) DA (%)
Hydrophobic silicon0.221 0.28 0.110.3310 0.42 0.01
Hydrophobic silicon0.290.391 0.31
0.70 1.1810 0.12
Etched silicon1.491 2.02 2.08
10 13.72 17.72 0.52
Pyrolytic carbon1 16.48 20.37 21.95
23.88 12.4810 18.67
J. Benesch et al. / Colloids and Surfaces B: Biointerfaces 18 (2000) 71–8174
Fig. 1.
ing dialysate. No uptake of free iodine by theunlabelled HSA was observed.
2.7. Statistical methods
Since all samples were analysed by both quan-tification methods, a paired test was utilised. Foreach part of the present study the calculatedsurface concentrations on all samples and by bothmethods were included. Tests were made for thenull hypothesis that the two methods yield nodifference. In this case the reported significancelevels indicate the probability that the alternativehypothesis (i.e. that there was a difference be-tween the two methods) was erroneous. The ab-breviations are *=90%, **=95% and ***=99%levels of significance, respectively. The asteriskswere used in the figures when significant differ-ences were observed.
The analysis of the agreement between thequantification methods was performed accordingto Bland and Altman [16–18]. The general idea isthat two methods designed to measure the sametype of quantity will always correlate. This is dueto the fact that samples that cover a broad rangeof values will always show a high correlationbetween methods. When a paired study is per-formed, the plot of difference versus average ofeach pair will yield a better picture of a possibleagreement between them.
3. Results
3.1. Surface roughness
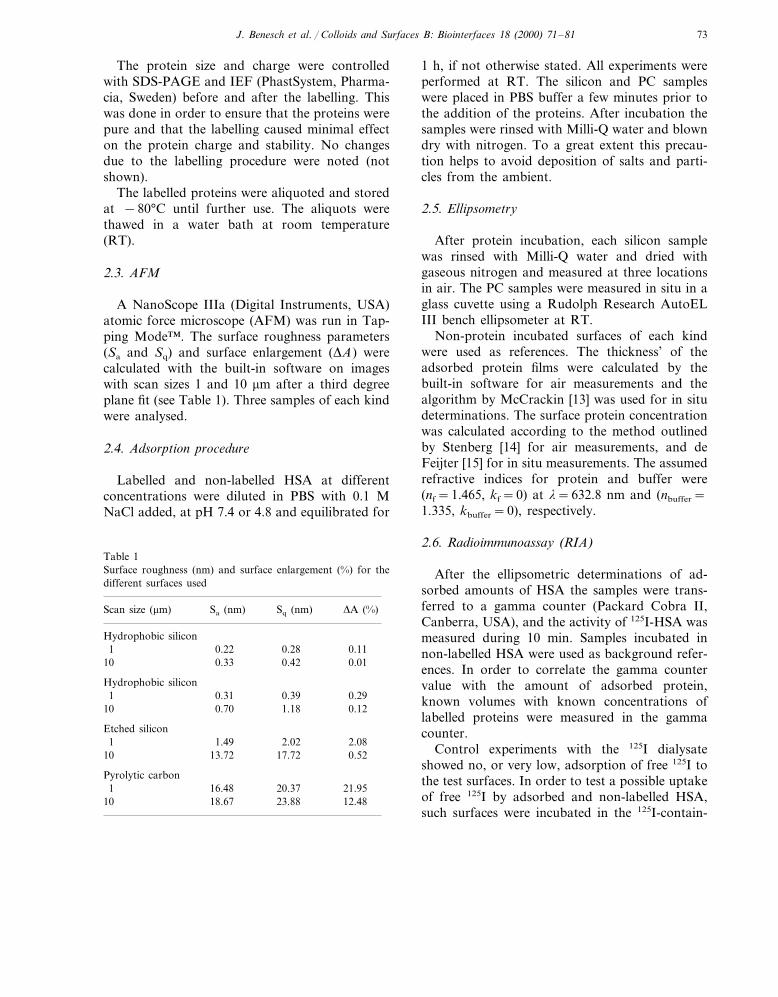
The different samples were measured in Tap-ping Mode AFM at ambient conditions, using 1and 10 mm scan sizes. The results are summarisedin Table 1 and Fig. 1. The surfaces were evaluatedin terms of Sa, Sq and DA. Sa is the mean devia-tion from a theoretically flat surface, and Sq theroot mean square deviation from this surface. The
Fig. 1. AFM images with scan size 1 mm and z-scale 100 nm.(a) hydrophilic silicon, (b) hydrophobic silicon, (c) KOH-etched silicon, (d) pyrolytic carbon.
J. Benesch et al. / Colloids and Surfaces B: Biointerfaces 18 (2000) 71–81 75
surface enlargement, DA, was in all cases toosmall to explain any differences between the meth-ods and was not taken into account when thesurface protein density was calculated. Hy-drophilic and hydrophobic silicon showed similartopographies. After KOH etching of silicon anincrease in all roughness parameters was noted.The higher values at the larger scan size were due
to introduction of a waviness at the 10 mm scaleby the etching. The pyrolytic carbon was muchrougher than the silicon samples, as is also evidentin Fig. 1.
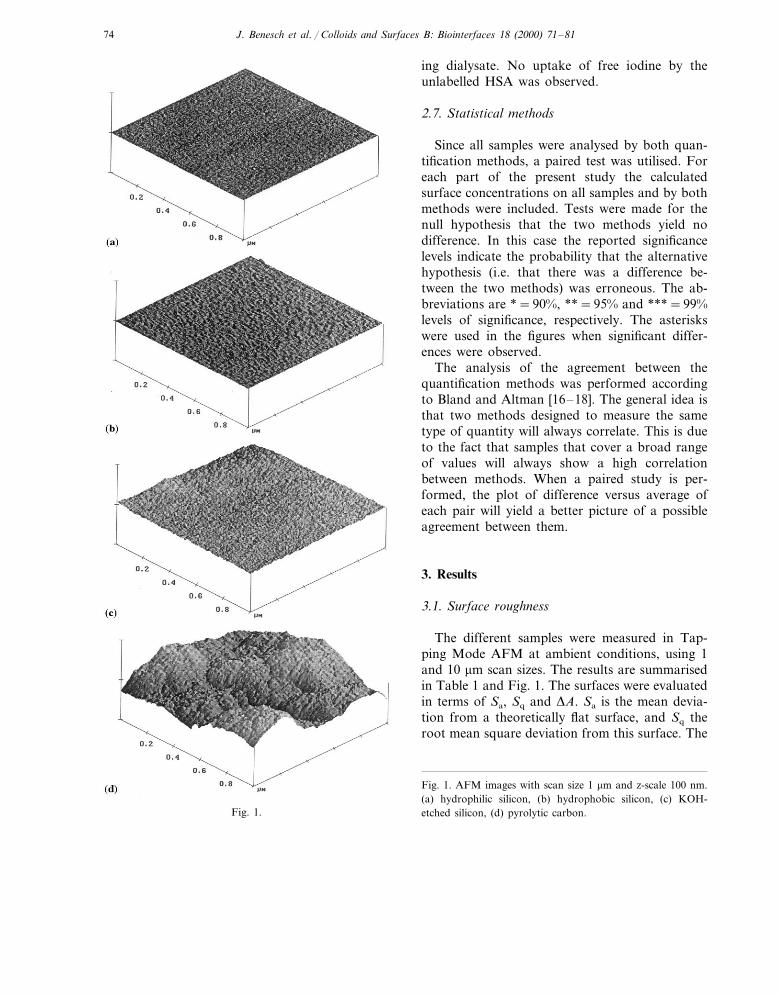
3.2. Time course adsorption study
Hydrophobic and hydrophilic silicon sampleswere incubated for 1, 3 and 6 h in 0.1 mg/mlsolutions of labelled HSA, see Fig. 2.
After 1 and 6 h of incubation of the hydropho-bic silicon and after 1 h of hydrophilic silicon,significant differences were observed between themethods. No other differences were found. Alldifferences between the methods were below 10%on hydrophilic and below 20% on hydrophobicsamples. Thus, a very good methods agreementwas observed on hydrophilic silicon. The hydro-phobic silicon samples showed slightly differentresults. This may be due to a larger extent ofdenaturation of proteins, that may lead tochanges in the protein refractive index, or differ-ent protein packing structures.
3.3. Dilutions of 125I-labelled HSA in unlabelledHSA
Labelled HSA was mixed with unlabelled HSA,and with a constant final concentration of 0.1mg/ml. The calculated adsorbed amounts weresimilar by both methods when freshly labelledHSA, not older than 1 week was used, see Fig. 3.The RIA method indicated slightly lower valuesthan ellipsometry on hydrophilic silicon. Smalldifferences were noted on hydrophobic silicon,although overall a good agreement was observedbetween the methods.
3.4. Adsorption at different pH
Hydrophilic and hydrophobic silicon were incu-bated in 0.1 mg/ ml solutions of 125I-labelled HSAfor 1 h at pH 7.4 and close to the iso-electricpoint (pI) of HSA, pH 4.8. At the iso-electricpoint HSA possesses zero net charge and minimalvolume, and Coulombic interactions between theproteins are then minimised. This led to increasedadsorption on both hydrophilic and hydrophobic
Fig. 2. Adsorbed amounts of HSA to hydrophilic and hydro-phobic silicon after 1, 3 and 6 h of incubation in 0.1 mg/mlHSA, pH 7.4 and at RT. The dotted lines show ellipsometricand solid lines RIA values. The asterisks indicate the levels ofsignificant differences between the methods (*=90%, **=95%, ***=99%). Eighteen samples were incubated for 1 h andsix for 3 and 6 h.
Fig. 3. Determination of adsorbed amounts of HSA afterdilution of 125I-labelled HSA in unlabelled ditto, and withconstant final concentration (0.1 mg/ml) onto hydrophilic andhydrophobic silicon. The surfaces were incubated at RT for 1h in PBS at pH 7.4. The x-axis indicates the dilution factor ofunlabelled HSA to 125I-labelled HSA. Dotted lines show ellip-sometric and solid lines RIA values. Neat-incubations in la-belled HSA only, n=18.

J. Benesch et al. / Colloids and Surfaces B: Biointerfaces 18 (2000) 71–8176
Fig. 4. Deposited amounts of 125I labelled HSA from 0.1mg/ml in PBS onto hydrophilic and hydrophobic silicon at (a)pH 4.8, n=6 and (b) pH 7.4, after 1 h incubation, n=18.
3.6. Adsorption to pyrolytic carbon
Pyrolytic carbon is a material that is used inbiomedical applications such as implantable elec-trodes, i.e. for pacemakers. It is a rough material(Sq=204 A, ) that scatters most of the incidentlight. The adsorbed amounts of protein were mea-sured in situ because of the ill-defined opticalproperties. Drastic quantitative differences werenow found between ellipsometry and RIA. Theellipsometric data indicated too low an adsorp-tion, only 18 and 19% at pH 4.8 and 7.4, respec-tively, of the obtained RIA values, see Fig. 6. Inother words, the indicated adsorbed amount wasfive times larger by RIA than by ellipsometry. Atboth of these pHs there exists a 99% (***) signifi-
Fig. 5. Adsorbed amounts of 125I-HSA onto KOH etchedhydrophilic and hydrophobic silicon after 1 h incubation in 0.1mg/ml in PBS, pH 7.4, at RT. No significant differences werefound between the methods, n=23 at both surfaces.silicon, see Fig. 4. The point of zero charge (pzc)
of hydrophilic silicon is close to pH 2, and thesurface was therefore negatively charged at bothpH values. The ellipsometry and RIA values agreewell at pH 7.4 (B10% difference) on bothhydrophilic and hydrophobic silicon surfaces.
3.5. Etched silicon surfaces
The hydrophilic silicon became rougher afterthe KOH etching (Sq=20 A, ). Ellipsometry nowoverestimated the adsorbed amounts on both hy-drophilic and hydrophobic silicon surfaces com-pared to RIA, see Fig. 5. However, the differenceswere not statistically significant.
Fig. 6. Adsorbed amounts of 125I-HSA onto pyrolytic carbonat pH 4.8, n=10 and pH 7.4, n=6.
J. Benesch et al. / Colloids and Surfaces B: Biointerfaces 18 (2000) 71–81 77
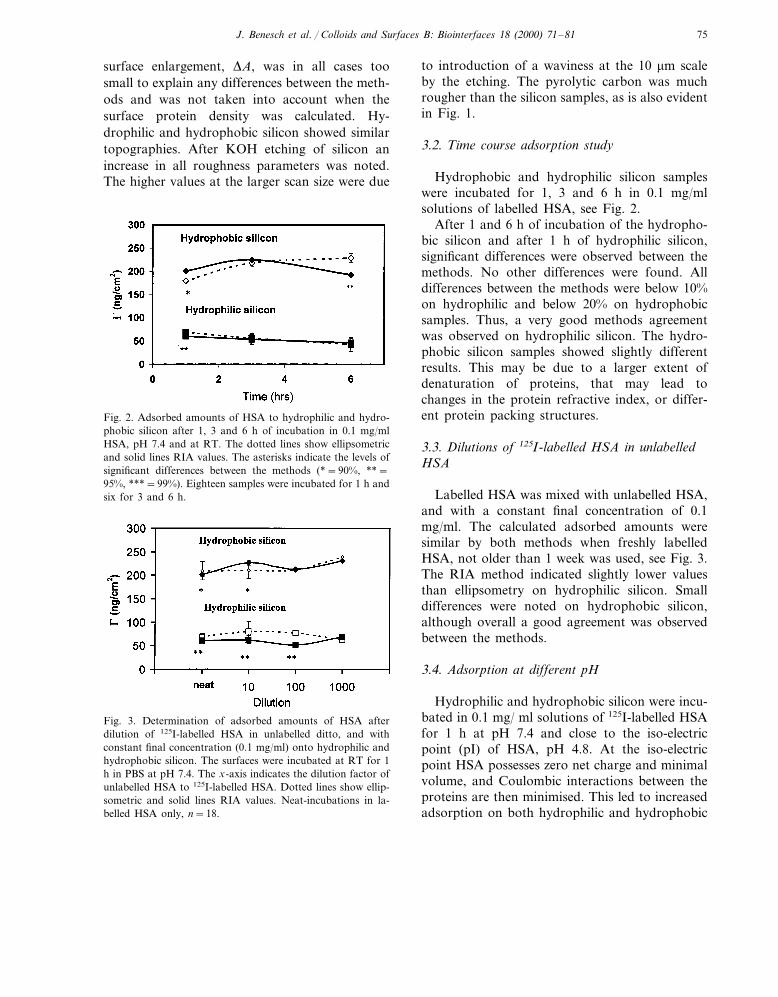
Fig. 7. RIA-determinations of adsorbed amounts of HSA.125I-HSA was diluted in unlabelled HSA at pH 7.4 with a finalconcentration of 0.1 mg/ml. The incubation time was 1 h atRT. (a) hydrophilic silicon incubated in freshly labelled HSAimmediately after thawing and after 5 h of equilibration atRT. (b) same as (a), but with labelled HSA freeze-stored for 2months. (c) freshly labelled and 2 months freeze-stored la-belled HSA adsorbed to hydrophobic silicon. Neat-incubationin labelled HSA only, n=12 except for the equilibrated in (a)and (b) where n=24.
freshly labelled HSA (B1 week) was adsorbedonto hydrophilic silicon immediately after thaw-ing and mixing, after 5 h of equilibration at RT.Fig. 7(b) shows the same as Fig. 7(a), but withthe labelled HSA freeze-stored for 2 months.Fig. 7(c) shows a comparison between adsorp-tion of freshly labelled and freeze-stored (2months) labelled HSA without equilibration timeonto hydrophobic silicon. In Fig. 7(a) the twocurves almost coincide, indicating no change inthe adsorption behaviour after B1 week offreeze-storage of 125I-HSA. In Fig. 7(b) we ob-serve that the non-equilibrated solution de-posited more proteins than the equilibrated ontohydrophilic silicon. The equilibrated solution inFig. 7(b) shows values similar to those in Fig.7(a). The tendency of a higher adsorption of125I-HSA to hydrophobic silicon after proteinfreeze-storage and without a proper relaxationtime (renaturation) is shown in Fig. 7(c) forfreshly labelled and 2 months freeze-stored HSA.Interestingly, the RIA quantifications becamesimilar to the ellipsometric when the proteinswere allowed to equilibrate in solution for atleast 4 h (data not shown).
3.8. Statistical analysis of agreement between singlewa6elength null ellipsometry and RIA
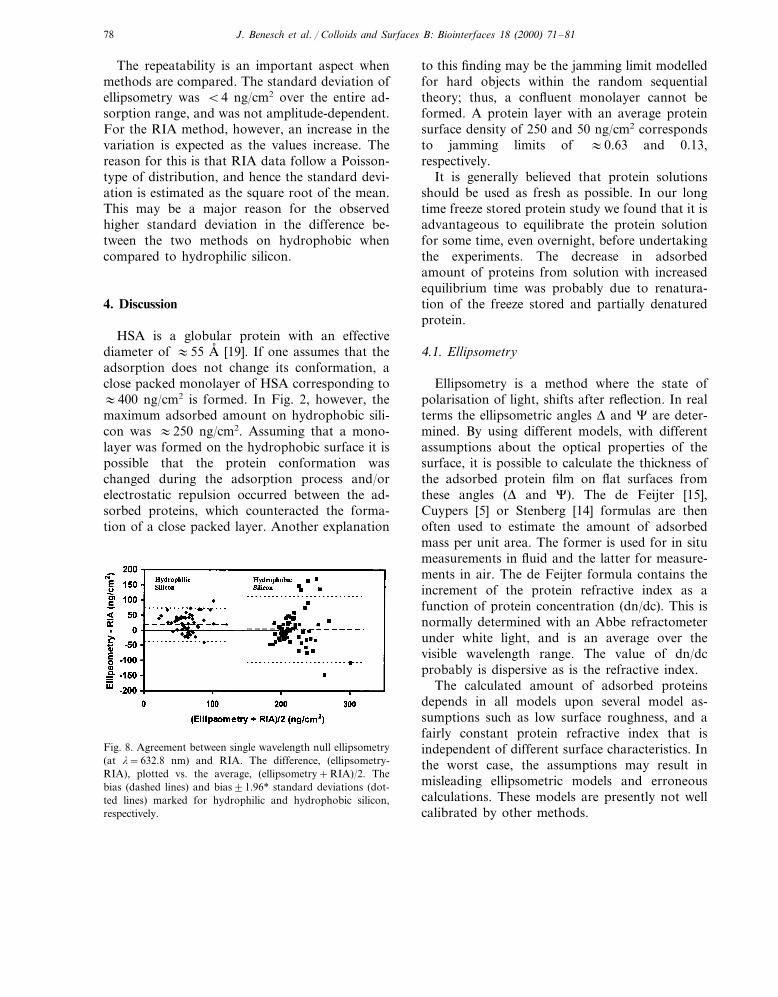
The paired values originating from respectivequantification methods were pooled from thetime study and dilution experiments (see Section3.2 and Section 3.3) with freshly labelled HSAadsorbed onto flat hydrophilic and hydrophobicsilicon at pH 7.4. For each pair of values thedifference within each pair was plotted againstthe average of the pair, see Fig. 8.
The degree of agreement (bias and error) wasevaluated with a paired t-test. For hydrophilicsilicon, the bias and standard errors of themeans were 19.4 and 3.4 and for hydrophobicsilicon 4.6 and 6.7 ng/cm2 respectively. Thus, asignificant (a�0.001) bias was observed for hy-drophilic silicon, but not for hydrophobic silicon(a=0.6). The bias of 19.4 ng/cm2 corresponds1.6 A, and 4.6 ng/cm2 to 0.4 A, thickness of aprotein layer, i.e. the adsorption biases arewithin the noise level of the methods.
cant difference in the determined adsorbedamount of HSA between the two quantificationmethods. At present it is not known whether thisresult is valid for all rough surfaces or if pyrolyticcarbon is unique in this respect.
3.7. The effects of storage on 125I-HSA
Fig. 7(a–b) show the RIA determinedamounts of HSA on hydrophilic silicon when125I-HSA was mixed and diluted in non-labelledHSA, before and after storage of the 125I-HSAfor 2 months in a freezer (−80°C). In Fig. 7(a)
J. Benesch et al. / Colloids and Surfaces B: Biointerfaces 18 (2000) 71–8178
The repeatability is an important aspect whenmethods are compared. The standard deviation ofellipsometry was B4 ng/cm2 over the entire ad-sorption range, and was not amplitude-dependent.For the RIA method, however, an increase in thevariation is expected as the values increase. Thereason for this is that RIA data follow a Poisson-type of distribution, and hence the standard devi-ation is estimated as the square root of the mean.This may be a major reason for the observedhigher standard deviation in the difference be-tween the two methods on hydrophobic whencompared to hydrophilic silicon.
4. Discussion
HSA is a globular protein with an effectivediameter of :55 A, [19]. If one assumes that theadsorption does not change its conformation, aclose packed monolayer of HSA corresponding to:400 ng/cm2 is formed. In Fig. 2, however, themaximum adsorbed amount on hydrophobic sili-con was :250 ng/cm2. Assuming that a mono-layer was formed on the hydrophobic surface it ispossible that the protein conformation waschanged during the adsorption process and/orelectrostatic repulsion occurred between the ad-sorbed proteins, which counteracted the forma-tion of a close packed layer. Another explanation
to this finding may be the jamming limit modelledfor hard objects within the random sequentialtheory; thus, a confluent monolayer cannot beformed. A protein layer with an average proteinsurface density of 250 and 50 ng/cm2 correspondsto jamming limits of :0.63 and 0.13,respectively.
It is generally believed that protein solutionsshould be used as fresh as possible. In our longtime freeze stored protein study we found that it isadvantageous to equilibrate the protein solutionfor some time, even overnight, before undertakingthe experiments. The decrease in adsorbedamount of proteins from solution with increasedequilibrium time was probably due to renatura-tion of the freeze stored and partially denaturedprotein.
4.1. Ellipsometry
Ellipsometry is a method where the state ofpolarisation of light, shifts after reflection. In realterms the ellipsometric angles D and C are deter-mined. By using different models, with differentassumptions about the optical properties of thesurface, it is possible to calculate the thickness ofthe adsorbed protein film on flat surfaces fromthese angles (D and C). The de Feijter [15],Cuypers [5] or Stenberg [14] formulas are thenoften used to estimate the amount of adsorbedmass per unit area. The former is used for in situmeasurements in fluid and the latter for measure-ments in air. The de Feijter formula contains theincrement of the protein refractive index as afunction of protein concentration (dn/dc). This isnormally determined with an Abbe refractometerunder white light, and is an average over thevisible wavelength range. The value of dn/dcprobably is dispersive as is the refractive index.
The calculated amount of adsorbed proteinsdepends in all models upon several model as-sumptions such as low surface roughness, and afairly constant protein refractive index that isindependent of different surface characteristics. Inthe worst case, the assumptions may result inmisleading ellipsometric models and erroneouscalculations. These models are presently not wellcalibrated by other methods.
Fig. 8. Agreement between single wavelength null ellipsometry(at l=632.8 nm) and RIA. The difference, (ellipsometry-RIA), plotted vs. the average, (ellipsometry+RIA)/2. Thebias (dashed lines) and bias91.96* standard deviations (dot-ted lines) marked for hydrophilic and hydrophobic silicon,respectively.

J. Benesch et al. / Colloids and Surfaces B: Biointerfaces 18 (2000) 71–81 79
Null ellipsometry with a single wavelength oflight is often used e.g. in biomaterials research.This implies that assumptions on the refractiveindex (nf) of the adsorbed proteins have to bemade. Often nf is set to :1.5, i.e. kf=0; it isassumed that no adsorption of light takes place.This may cause problems, especially for thin filmswhen the calculated refractive index and the thick-ness of the adsorbed layer are correlated.
In the present study the protein layer refractiveindex was kept constant (nf=1.465, i.e. the sameas for silicon dioxide at l=632.8 nm, 1.96 eV.This is close to the reported value for ovalbumin[20], between 1.4 and 1.5 in the visible range oflight. Smith [10] indicated that the methods usedby Stenberg [14] are relevant even at sub-mono-layer surface coverages. One of the aims of thisstudy was to check the validity of this simplestpossible ellipsometric model in relation to RIA.
The uncertainty in the small changes in theellipsometric angle C, during measurements,makes it difficult to accurately calculate thinprotein film thickness’. On the other hand, byusing the McCrackin algorithm [13] the methodgives a reciprocal correlation between thicknessand refractive index, and a noisy signal in bothvalues. However, due to this reciprocity, the cal-culated amount of adsorbed protein per unit areaobtains a lowered noise level [20]. The refractiveindex of the adsorbed protein layer may hypothet-ically depend on the type of protein, its actualconformation and orientation, buffer, ionicstrength, pH etc. The effective refractive indexmay therefore vary slightly between different ex-perimental set-ups, although it is unknown towhat extent. The details of this were outside thescope of this study.
The pyrolytic carbon had a comparativelyrough surface. Therefore, a space overlap may beformed between the adsorbed protein layer andthe substrate. The effective refractive index in thetransition region will then be higher than that ofthe pure protein layer. This in turn may cause anunderestimation of the protein layer thickness,leading to an underestimation of the surfaceprotein concentration. In other words, the as-sumption used for the Fresnel equations (and thede Feijter formula) of a mathematically flat inter-
face is no longer valid here. Unfortunately it isnot well explored as to how sensitive the Fresnelequations are to variations in surface roughness,although performed simulations indicate thatrougher surfaces will yield differing thickness’[21]. This was confirmed in a study where ellip-sometry was performed on a series of roughenedsilicon surfaces [12]. In the present study ellip-sometry clearly underestimated the adsorbedamount of protein on pyrolytic carbon comparedto RIA.
An attempt was made to calculate the effectivecomplex refractive index (N=nf+ ikf) for the ad-sorbed protein layer on pyrolytic carbon. Whenthe thickness was calculated from the RIA experi-ments (a density of dry protein of 1.37 g/cm3 givesa thickness of :97 A, at pH 4.8 and 56 A, at pH7.4) and the McCrackin algorithm was used, twosolutions N=1.38+0.01i and N=1.58+0.63i,were found. This can be compared with N=1.65+0.7i for pyrolytic carbon. When assumingthat kf=0, then d=107 A, , nf=1.50 at pH 4.8and d=50 A, and nf=1.44 at pH 7.4 respectively.For nf=1.465 the calculations yield a thickness of34 A, at pH 4.8 and 19 A, at pH 7.4, respectively.
Others have discussed the validity of ellipsome-try at low surface coverage [6,10,15,22]. In thepresent study there were many instances with asub-monolayer coverage. The actual measured el-lipsometric thickness’ of the HSA layers (withnf=1.465) were close to 5 A, on hydrophilic sili-con and 20 A, on hydrophobic. Our simple ellipso-metric model apparently agreed well with RIA,when freshly labelled proteins were adsorbed ontosmooth surfaces.
4.2. RIA
Radio labelled proteins certainly are a valuabletool for studies on adsorption processes. Underthe assumptions that no iodine desorbs from the125I labelled proteins, that free iodine has a lowbinding affinity to surfaces and proteins and thatthe labelled protein preserves its nativity, then themeasured activity in this study are supposed to bewell correlated with the ‘true’ amount of adsorbedproteins.
J. Benesch et al. / Colloids and Surfaces B: Biointerfaces 18 (2000) 71–8180
Furthermore, a very low desorption of 125I-la-belled HSA was noted during 20 h of incubationof protein in buffer by van der Scheer [4]. Othershave found protein dimers after 125I-labelling [4],but neither IEF nor SDS-PAGE control experi-ments made in the present study indicated thepresence of protein aggregates (not shown).
However, incubations of surfaces in low proteinconcentration solutions may give misleading re-sults as adsorption to the chamber walls anddiffusion limitations may occur and restrict thenumber of protein collisions with the surface. Thismay then lead to an overestimation of theamounts of adsorbed proteins by RIA. In thepresent study, we used 0.1 mg/ml solutions, whichis a fairly high concentration. No decrease in theactivity in the solutions before and after the incu-bations were observed. Also, a preferential ad-sorption of labelled proteins may be a problem inmixed protein systems; and probably, also in com-plex solutions like plasma [23]. In the presentstudy the apparent adsorbed amounts increased athigh dilutions of 125I-HSA in native HSA, see Fig.7(a). This was, however, most likely a methodo-logical bug because at these dilutions the activitywas close to that of the background. This againunderlines that the experimental set-up and man-ual handling of reagents and samples are ex-tremely important for the final outcome (see alsothe different RIA values for hydrophilic silicon inFigs. 3 and 7(a)). The iodination process includesone oxidation step of the protein in question andexposure of this to high doses of ionising radia-tion. The g-energy of 125I is 35.5 keV, with arelatively high cross section for the uptake bybiological molecules. The probability then in-creases for the creation of Auger electrons whichleads to an increased risk for protein ionisationand destruction. The above mechanism is impor-tant because this may add to the altered biologicalbehaviour and adsorption properties, such asprotein charge, hydrophobicity and flexibility.The g-radiation may also split water, i.e. radicalscould hypothetically disturb the integrity of bio-logical molecules in the solution.
Another important issue is the freeze storage ofproteins [24,25]. During freezing, the pH is low-ered and the process leads to conformational
changes in the protein. Chang suggests that denat-uration of freezed proteins is a result of an in-creased area of the water-ice interface [25]. Thissource of erroneous surface concentration calcula-tion might become highly significant at low 125I-HSA/native HSA ratios (see Fig. 7), and duringshort equilibration times for the thawed proteinmixtures. The reason for this seems to be a highersurface preference of the partly unfolded anddenatured 125I-HSA, an error that may later bemultiplied with the dilution factor. In the presentstudy the observation was that during short equi-libration times of the thawed labelled protein, thecalculated adsorbed amount to hydrophilic siliconwas up to 16 (data not shown) times too high athigh dilutions. This could be corrected for, afteran equilibration time of 4 h or more of the mixedprotein solution at RT.
4.3. Comparison of the quantification methods
The main goal of the present study was tocompare single wave length null ellipsometry witha pre-fixed protein refractive index (nf=1.465,kf=0), and RIA by use of 125I labelled andnon-labelled HSA. The adsorbed amounts weremeasured with both methods. This made it easierto compare the methods, although the size of theprobed area differs in respective case.
The statistical comparison of the methods relieson asking the proper questions, such as what isthe repeatability of the methods and their relativebias [18]. The latter question may be answeredfrom the results in Fig. 8, indicating a very smallbias on flat silicon surfaces. The choice not tomake a correlation analysis was due to the factthat correlation gives a measure of the association[18] and not of the desired agreement between themethods.
There exist many pitfalls for each method, al-though the understanding of them makes it easierto interpret some of the noted deviations. Overall,the methods agreed well on (A, ngstrom scale) flatsurfaces when freshly labelled proteins were used.The pyrolytic carbon surface was no longersmooth as is assumed in the McCrackin al-gorithm, and as expected, the simple model failedon this surface.

J. Benesch et al. / Colloids and Surfaces B: Biointerfaces 18 (2000) 71–81 81
The dilution of 125I-HSA in HSA, and a constanttotal concentration requires careful handling andequilibration or refolding time for the labelledprotein. This can be conveniently arranged, e.g.with over night dialysis of the free iodine at 4°C.
As there inherently exist many difficulties in bothmethods, we do not feel confident with the statisti-cal differences that occasionally show up betweenthem on flat surfaces. On the contrary, in the caseof pyrolytic carbon and aged labelled proteins thereexisted in this study a ‘safe’ significant differencebetween the quantification methods.
4.4. Summary
Simple ellipsometric quantification of adsorbedamounts of HSA was compared with 125I-labelledHSA which was quantified in a scintillation coun-ter. It turned out that the methods agreed well onsmooth hydrophilic and hydrophobic silicon, whenfreshly labelled HSA was used. Under certaincircumstances, when frozen and long time storedlabelled HSA was used, discrepancies appeared.The simple ellipsometric method with fixed proteinrefractive index, nf=1.465, grossly underestimatedthe adsorbed amount on rough pyrolytic carbon ascompared with RIA. Thus, caution should beexercised about ellipsometric determinations ofadsorbed amounts of proteins in such cases.
Overall, RIA and single wavelength null ellip-sometry show a good agreement at smooth hy-drophilic and hydrophobic silicon surfaces and atdifferent pH (4.8 and 7.4).
Labelled proteins that were freeze-stored for 2months indicated higher RIA values than freshlylabelled. The discrepancy could be eliminated whenthe protein mixtures were allowed to settle (refold)for at least 4 h prior to the adsorption experiments.
Acknowledgements
This research was supported by the SwedishBiomaterial Consortium and Forum Scientum,both funded by the Swedish Foundation for Strate-
gic Research (SSF). We want to express our grat-itude to Tobias Nyberg for his assistance with theKOH etching and Dr Tomas Lindahl for hisassistance with the iodination procedures.
References
[1] H. Nygren, M. Stenberg, J. Immunol. Methods 80 (1985)15.
[2] M. Lestelius, Tailor-made Monolayer Assemblies forIn Vitro Studies of Blood Protein-Surface Interactions,Thesis No. 455, Applied Physics, Linkoping, Dept.Physics and Measurement Technology, LinkopingsUniversitet, 1996.
[3] P. Tengvall, A. Askendal, I. Lundstrom, J. Biomed.Mater. Res. 35 (1997) 81.
[4] A.T. van der Scheer, J. Feijen, J.K. Elhorst, P.G.L.C.Krugers Dagneux, C.A. Smolders, J. Colloid InterfaceSci. 66 (1978) 136–145.
[5] P.A. Cuypers, J.W. Corsel, M.P. Janssen, J.M.M. Kop,W.T. Hermens, H.C. Hemker, J. Biol. Chem. 258 (1983)2426.
[6] U. Jonsson, M. Malmqvist, I. Ronnberg, J. Colloid Inter-face Sci. 103 (1985) 360.
[7] J.R. Miller, J.E. Berger, J. Biol. Chem. 70 (1966) 3070.[8] L.S. Bartell, J.F. Betts, J. Biol. Chem. 64 (1964) 1075.[9] V. Hlady, D.R. Reinecke, J.D. Andrade, J. Colloid Inter-
face Sci. 111 (1986) 555.[10] T. Smith, J. Opt. Soc. Am. 58 (1968) 1069.[11] B.J. Bornong, Surf. Sci. 16 (1969) 321.[12] S.J. Fang, W. Chen, T. Yamanaka, C.R. Helms, J. Elec-
trochem. Soc. 144 (1997) L231.[13] F.L. McCrackin, National Bureau of Standards, Note
479 (1980).[14] M. Stenberg, H. Nygren, J. Phys. C10 (1983) 83.[15] J.A. de Feijter, J. Benjamins, F.A. Veer, Biopolymers 17
(1978) 1759.[16] J.M. Bland, D.G. Altman, Lancet 346 (1995) 1085.[17] J.M. Bland, D.G. Altman, Lancet 1 (1986) 307.[18] D.G. Altman, J.M. Bland, The Statistician 32 (1983) 307.[19] A. Tiselius, H. Svensson, Trans. Faraday Soc. 36 (1940)
16.[20] J. Martensson, H. Arwin, Langmuir 11 (1995) 963.[21] C.A. Fenstermaker, F.L. McCrackin, Surf. Sci. 16 (1969)
85.[22] T. Easwarakhantan, P. Alnot, Surf. Inter. Anal. 26 (1998)
1008.[23] J.L. Brash, P. ten Hove, J. Biomed. Mater. Res. 23 (1989)
157.[24] K. Inazu, K. Shima, Dev. Biol. Stand. 74 (1992) 307.[25] B.S. Chang, B.S. Kendrick, J.F. Carpenter, J. Pharm. Sci.
85 (1996) 1325.
.