AKTIVITAS ANTIKANKER DARI EKSTRAK KASAR SAPONIN ASAL AKAR ALANG – ALANG ( Imperata cylindrica )
www.elsevier.com/locate/marpolbul
Marine Pollution Bulletin 46 (2003) 1609–1614
Quantification and classification of ship scraping wasteat Alang–Sosiya, India
M. Srinivasa Reddy, Shaik Basha *, V.G. Sravan Kumar, H.V. Joshi, P.K. Ghosh
Marine Algae & Marine Environment Department, Central Salt and Marine Chemicals Research Institute, Bhavnagar 364002, India
Abstract
Alang–Sosiya located on the Western Coast of Gulf of Cambay, is the largest ship recycling yard in the world. Every year on
average 365 ships having a mean weight (2.10 · 106 ± 7.82· 105 LDT) are scrapped. This industry generates a huge quantity of solid
waste in the form of broken wood, rubber, insulation materials, paper, metals, glass and ceramics, plastics, leather, textiles, food
waste, chemicals, paints, thermocol, sponge, ash, oil mixed sponges, miscellaneous combustible and non-combustible. The quantity
and composition of solid waste was collected for a period of three months and the average values are presented in this work. Sosiya
had the most waste 15.63 kg/m2 compared to Alang 10.19 kg/m2. The combustible solid waste quantity was around 83.0% of the
total solid waste available at the yard, which represents an average weight of 9.807 kg/m2; whereas, non-combustible waste is 1.933
kg/m2. There is not much difference between the average of total solid waste calculated from the sampling data (96.71 MT/day) and
the data provided by the port authorities (96.8 MT/day).
� 2003 Elsevier Ltd. All rights reserved.
Keywords: Alang–Sosiya; Ship scrapping yard; Solid waste; Oiled sponge; Textile waste; Wood pieces
1. Introduction
Wastes in the marine environment include litter as-
sociated with human activities, and are increasingly
being recognized as an international pollution problem.
The amount and nature of solid waste are two factors
which define the severity of the problem (O�Callaghn,1993). Waste posses problems on beaches, where it is
aesthetically displeasing, expensive and difficult to re-
move, causes mortality of coastal wild life, and it ispotentially toxic, especially in the case of medical, mil-
itary and some industrial wastes. The impacts of marine
debris to wild life, tourism and human health are well
documented (Cottinghan, 1989; Joyner and Frew, 1991;
Corbin and Singh, 1993) and not discussed here. Several
workers worldwide have quantified and classified marine
debris on beaches, estuarine coasts etc. Frost and Cullen
(1997) surveyed four beaches on the north coast of NewSouth Wales, Australia and reported the quantitative
and qualitative amount of waste collected. Madzena and
Lasiak (1997) studied the spatial and temporal varia-
*Corresponding author. Tel.: +91-278-2561354; fax: +91-278-
2566970/2567562.
E-mail address: [email protected] (S. Basha).
0025-326X/$ - see front matter � 2003 Elsevier Ltd. All rights reserved.
doi:10.1016/S0025-326X(03)00329-1
tions in beach litter collected on the Transkei coast of
South Africa and reported the composition and quantityof litter, while Thornton and Jackson (1998) studied
debris accumulation in the estuarine shoreline of Cliff-
wood beach, New Jersey, USA. Quantification and
classification of marine litter on the municipal beach of
Ensenada, Mexico was carried out by Iniguez and
Fisher (2003). The deleterious effect of plastic debris on
the marine environment has been carried out by several
workers (Pruter, 1987; Laist, 1987; Stefatos et al., 1999;Derraik, 2002).
However, no work has been carried out on the waste
generated by a ship scrapping industry on the marine
coast. Hence an attempt has been made to study the
various types and amount of solid waste generated by a
ship scrapping industry. Of the approximately 45,000
ocean-going ships in the world, about 700 are taken out
of service every year. To maximize the profits, shipowners send their vessels to scrap yards in Asia. Today,
most (70%) are scrapped in India at Alang. Alang–
Sosiya is the largest ship-scraping yard in the world,
established in 1982. The beach is in fact on one of the
longest continental shelves with the second highest tide
port in the world, a very rare occurrence, which makes
Alang a geographically natural tidal dry port, and ideal
1610 M. Srinivasa Reddy et al. / Marine Pollution Bulletin 46 (2003) 1609–1614
for the ship breaking industry, making Alang a pre-
ferred ship-scrapping destination. There are 192 plots
which carry out ship-recycling activities. Every year an
average of 365 ships having the mean weight2.10 · 106 ± 7.82 · 105 LDT are scrapped. This yard
produces steel for numerous uses. This industry also
generates a huge amount of solid wastes in the form of
scraped wood, plastic, insulation material, glass wool,
sponge, waste paper, oiled rope, cotton waste, etc. The
ship scraping activity forms an industry by itself, as it
provides employment to more than 40,000 workers and
generates steel totaling millions of tons every year with aminimum consumption of electricity. These workers
along with local villagers use the inter-tidal belt for
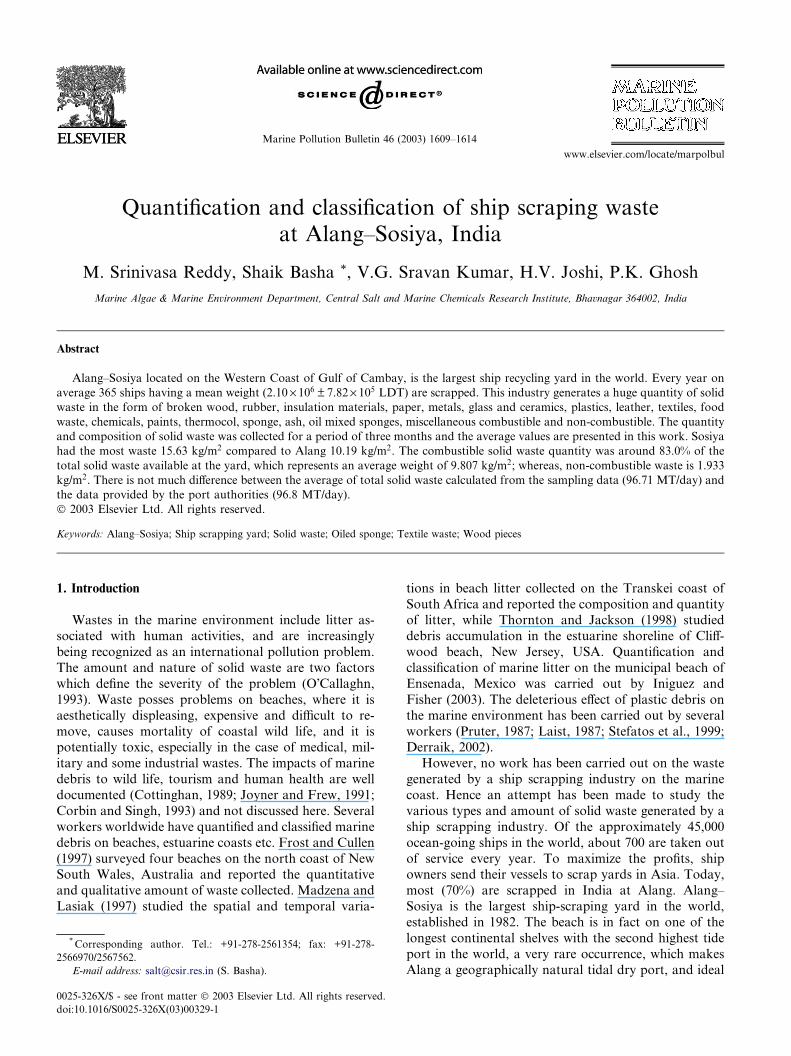
Fig. 1. Location map o
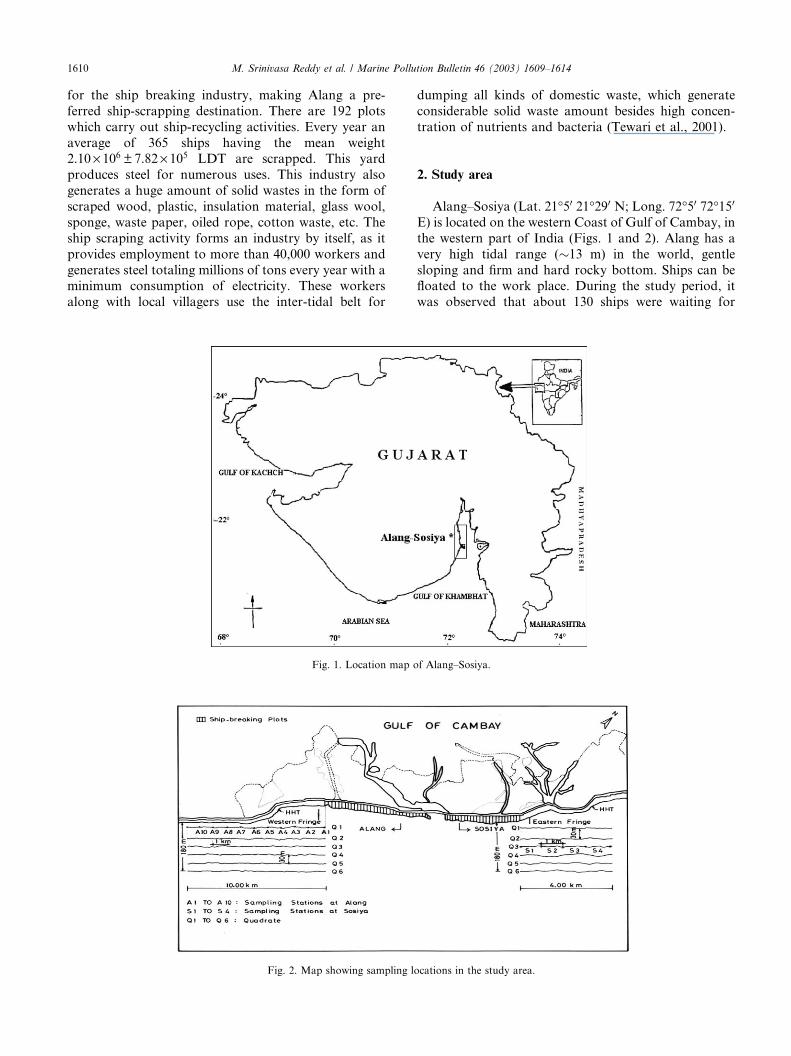
Fig. 2. Map showing sampling l
dumping all kinds of domestic waste, which generate
considerable solid waste amount besides high concen-
tration of nutrients and bacteria (Tewari et al., 2001).
2. Study area
Alang–Sosiya (Lat. 21�50 21�290 N; Long. 72�50 72�150E) is located on the western Coast of Gulf of Cambay, in
the western part of India (Figs. 1 and 2). Alang has a
very high tidal range (�13 m) in the world, gentle
sloping and firm and hard rocky bottom. Ships can befloated to the work place. During the study period, it
was observed that about 130 ships were waiting for
f Alang–Sosiya.
ocations in the study area.
M. Srinivasa Reddy et al. / Marine Pollution Bulletin 46 (2003) 1609–1614 1611
scrapping. Around 300 ships from the US alone are also
waiting for clearance (Pers. Comm., Port officer, Alang).
The yard is about 14.3 km long, north-south, and covers
a total area of approximately 67 km2. There are alto-gether around 112 plots towards Alang and around 80
plots along Sosiya side, varying in length (50–240 m)
and breadth (30–120 m) placed parallel to the coast up
to a distance of 14.3 km. The total number of vessels
beached till March 2002 were 3573 with an LDT of
26.24 million MT, mainly of cargo vessels, oil tankers
and passenger liners with occasional warships. The LDT
of ship ranges from 7000 to 35,000 ton. It takes one orone and half a day to dismantle a normal 10,000–13,000
ton ship (Pers. Comm., Port officer, Alang Yard).
3. Materials and methods
A systematic study has been carried out at Alang–
Sosiya during May to July 2002 to classify the varioustypes as well as to calculate the amount of solid waste
generated. The yard was divided into two areas: Alang
and Sosiya. Different types of solid wastes were collected
at every 1 km interval parallel to the coast covering a
distance of 10 km (A1–A10) at western fringe of Alang
and 4 km (S1–S4) along the eastern fringe of Sosiya (Fig.
2). Composite-Grab (Quadrat) having an area of 9 m2
was deployed at every 30 m on line transects covering adistance of 180 m (Q1–Q6) away from the highest high
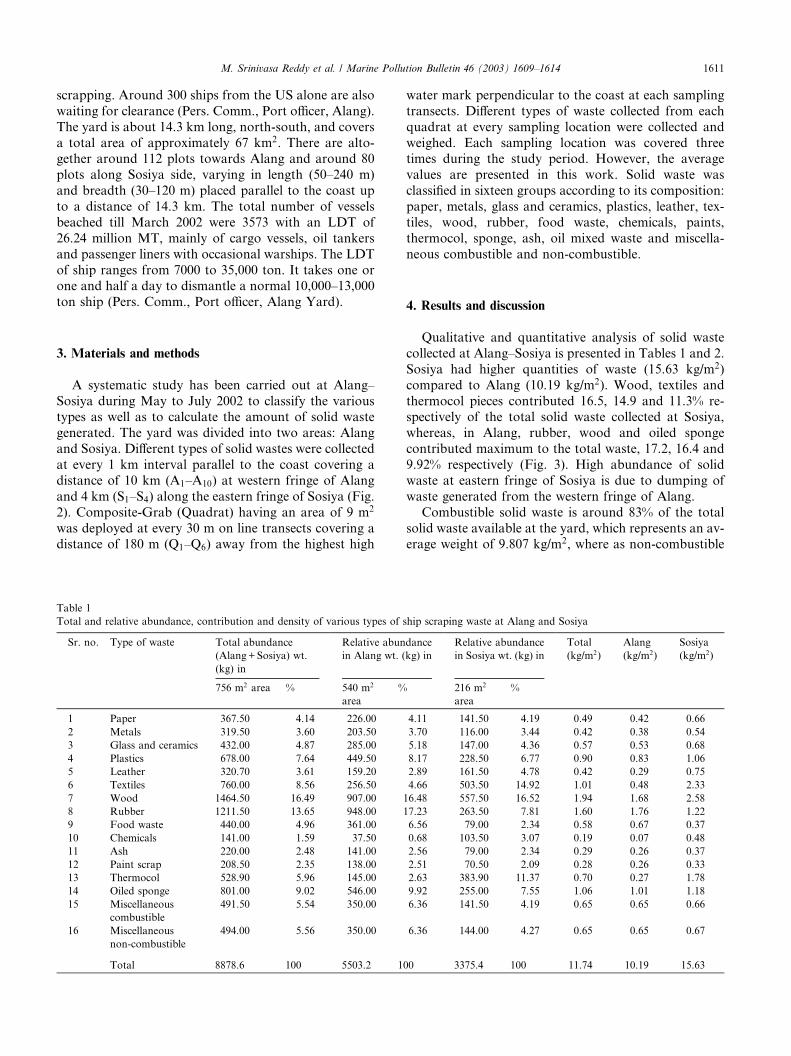
Table 1
Total and relative abundance, contribution and density of various types of s
Sr. no. Type of waste Total abundance
(Alang+Sosiya) wt.
(kg) in
Relative abun
in Alang wt. (
756 m2 area % 540 m2
area
%
1 Paper 367.50 4.14 226.00
2 Metals 319.50 3.60 203.50
3 Glass and ceramics 432.00 4.87 285.00
4 Plastics 678.00 7.64 449.50
5 Leather 320.70 3.61 159.20
6 Textiles 760.00 8.56 256.50
7 Wood 1464.50 16.49 907.00
8 Rubber 1211.50 13.65 948.00
9 Food waste 440.00 4.96 361.00
10 Chemicals 141.00 1.59 37.50
11 Ash 220.00 2.48 141.00
12 Paint scrap 208.50 2.35 138.00
13 Thermocol 528.90 5.96 145.00
14 Oiled sponge 801.00 9.02 546.00
15 Miscellaneous
combustible
491.50 5.54 350.00
16 Miscellaneous
non-combustible
494.00 5.56 350.00
Total 8878.6 100 5503.2 1
water mark perpendicular to the coast at each sampling
transects. Different types of waste collected from each
quadrat at every sampling location were collected and
weighed. Each sampling location was covered threetimes during the study period. However, the average
values are presented in this work. Solid waste was
classified in sixteen groups according to its composition:
paper, metals, glass and ceramics, plastics, leather, tex-
tiles, wood, rubber, food waste, chemicals, paints,
thermocol, sponge, ash, oil mixed waste and miscella-
neous combustible and non-combustible.
4. Results and discussion
Qualitative and quantitative analysis of solid waste
collected at Alang–Sosiya is presented in Tables 1 and 2.
Sosiya had higher quantities of waste (15.63 kg/m2)
compared to Alang (10.19 kg/m2). Wood, textiles and
thermocol pieces contributed 16.5, 14.9 and 11.3% re-spectively of the total solid waste collected at Sosiya,
whereas, in Alang, rubber, wood and oiled sponge
contributed maximum to the total waste, 17.2, 16.4 and
9.92% respectively (Fig. 3). High abundance of solid
waste at eastern fringe of Sosiya is due to dumping of
waste generated from the western fringe of Alang.
Combustible solid waste is around 83% of the total
solid waste available at the yard, which represents an av-erage weight of 9.807 kg/m2, where as non-combustible
hip scraping waste at Alang and Sosiya
dance
kg) in
Relative abundance
in Sosiya wt. (kg) in
Total
(kg/m2)
Alang
(kg/m2)
Sosiya
(kg/m2)
216 m2
area
%
4.11 141.50 4.19 0.49 0.42 0.66
3.70 116.00 3.44 0.42 0.38 0.54
5.18 147.00 4.36 0.57 0.53 0.68
8.17 228.50 6.77 0.90 0.83 1.06
2.89 161.50 4.78 0.42 0.29 0.75
4.66 503.50 14.92 1.01 0.48 2.33
16.48 557.50 16.52 1.94 1.68 2.58
17.23 263.50 7.81 1.60 1.76 1.22
6.56 79.00 2.34 0.58 0.67 0.37
0.68 103.50 3.07 0.19 0.07 0.48
2.56 79.00 2.34 0.29 0.26 0.37
2.51 70.50 2.09 0.28 0.26 0.33
2.63 383.90 11.37 0.70 0.27 1.78
9.92 255.00 7.55 1.06 1.01 1.18
6.36 141.50 4.19 0.65 0.65 0.66
6.36 144.00 4.27 0.65 0.65 0.67
00 3375.4 100 11.74 10.19 15.63
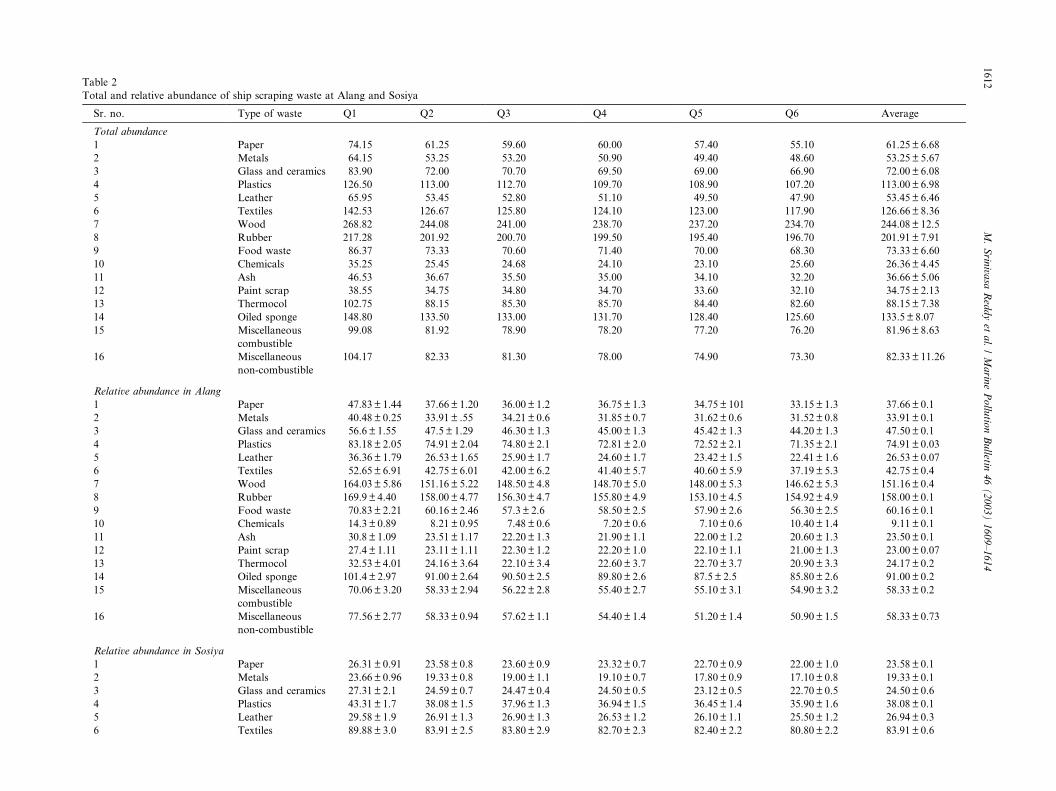
Table 2
Total and relative abundance of ship scraping waste at Alang and Sosiya
Sr. no. Type of waste Q1 Q2 Q3 Q4 Q5 Q6 Average
Total abundance
1 Paper 74.15 61.25 59.60 60.00 57.40 55.10 61.25± 6.68
2 Metals 64.15 53.25 53.20 50.90 49.40 48.60 53.25± 5.67
3 Glass and ceramics 83.90 72.00 70.70 69.50 69.00 66.90 72.00± 6.08
4 Plastics 126.50 113.00 112.70 109.70 108.90 107.20 113.00± 6.98
5 Leather 65.95 53.45 52.80 51.10 49.50 47.90 53.45± 6.46
6 Textiles 142.53 126.67 125.80 124.10 123.00 117.90 126.66± 8.36
7 Wood 268.82 244.08 241.00 238.70 237.20 234.70 244.08± 12.5
8 Rubber 217.28 201.92 200.70 199.50 195.40 196.70 201.91± 7.91
9 Food waste 86.37 73.33 70.60 71.40 70.00 68.30 73.33± 6.60
10 Chemicals 35.25 25.45 24.68 24.10 23.10 25.60 26.36± 4.45
11 Ash 46.53 36.67 35.50 35.00 34.10 32.20 36.66± 5.06
12 Paint scrap 38.55 34.75 34.80 34.70 33.60 32.10 34.75± 2.13
13 Thermocol 102.75 88.15 85.30 85.70 84.40 82.60 88.15± 7.38
14 Oiled sponge 148.80 133.50 133.00 131.70 128.40 125.60 133.5± 8.07
15 Miscellaneous
combustible
99.08 81.92 78.90 78.20 77.20 76.20 81.96± 8.63
16 Miscellaneous
non-combustible
104.17 82.33 81.30 78.00 74.90 73.30 82.33± 11.26
Relative abundance in Alang
1 Paper 47.83± 1.44 37.66± 1.20 36.00± 1.2 36.75± 1.3 34.75± 101 33.15± 1.3 37.66± 0.1
2 Metals 40.48± 0.25 33.91± .55 34.21± 0.6 31.85± 0.7 31.62± 0.6 31.52± 0.8 33.91± 0.1
3 Glass and ceramics 56.6± 1.55 47.5± 1.29 46.30± 1.3 45.00± 1.3 45.42± 1.3 44.20± 1.3 47.50± 0.1
4 Plastics 83.18± 2.05 74.91± 2.04 74.80± 2.1 72.81± 2.0 72.52± 2.1 71.35± 2.1 74.91± 0.03
5 Leather 36.36± 1.79 26.53± 1.65 25.90± 1.7 24.60± 1.7 23.42± 1.5 22.41± 1.6 26.53± 0.07
6 Textiles 52.65± 6.91 42.75± 6.01 42.00± 6.2 41.40± 5.7 40.60± 5.9 37.19± 5.3 42.75± 0.4
7 Wood 164.03± 5.86 151.16± 5.22 148.50± 4.8 148.70± 5.0 148.00± 5.3 146.62± 5.3 151.16± 0.4
8 Rubber 169.9± 4.40 158.00± 4.77 156.30± 4.7 155.80± 4.9 153.10± 4.5 154.92± 4.9 158.00± 0.1
9 Food waste 70.83± 2.21 60.16± 2.46 57.3± 2.6 58.50± 2.5 57.90± 2.6 56.30± 2.5 60.16± 0.1
10 Chemicals 14.3± 0.89 8.21± 0.95 7.48± 0.6 7.20± 0.6 7.10± 0.6 10.40± 1.4 9.11± 0.1
11 Ash 30.8± 1.09 23.51± 1.17 22.20± 1.3 21.90± 1.1 22.00± 1.2 20.60± 1.3 23.50± 0.1
12 Paint scrap 27.4± 1.11 23.11± 1.11 22.30± 1.2 22.20± 1.0 22.10± 1.1 21.00± 1.3 23.00± 0.07
13 Thermocol 32.53± 4.01 24.16± 3.64 22.10± 3.4 22.60± 3.7 22.70± 3.7 20.90± 3.3 24.17± 0.2
14 Oiled sponge 101.4± 2.97 91.00± 2.64 90.50± 2.5 89.80± 2.6 87.5± 2.5 85.80± 2.6 91.00± 0.2
15 Miscellaneous
combustible
70.06± 3.20 58.33± 2.94 56.22± 2.8 55.40± 2.7 55.10± 3.1 54.90± 3.2 58.33± 0.2
16 Miscellaneous
non-combustible
77.56± 2.77 58.33± 0.94 57.62± 1.1 54.40± 1.4 51.20± 1.4 50.90± 1.5 58.33± 0.73
Relative abundance in Sosiya
1 Paper 26.31± 0.91 23.58± 0.8 23.60± 0.9 23.32± 0.7 22.70± 0.9 22.00± 1.0 23.58± 0.1
2 Metals 23.66± 0.96 19.33± 0.8 19.00± 1.1 19.10± 0.7 17.80± 0.9 17.10± 0.8 19.33± 0.1
3 Glass and ceramics 27.31± 2.1 24.59± 0.7 24.47± 0.4 24.50± 0.5 23.12± 0.5 22.70± 0.5 24.50± 0.6
4 Plastics 43.31± 1.7 38.08± 1.5 37.96± 1.3 36.94± 1.5 36.45± 1.4 35.90± 1.6 38.08± 0.1
5 Leather 29.58± 1.9 26.91± 1.3 26.90± 1.3 26.53± 1.2 26.10± 1.1 25.50± 1.2 26.94± 0.3
6 Textiles 89.88± 3.0 83.91± 2.5 83.80± 2.9 82.70± 2.3 82.40± 2.2 80.80± 2.2 83.91± 0.6
1612
M.Srin
ivasa
Reddyet
al./Marin
ePollu
tionBulletin
46(2003)1609–1614
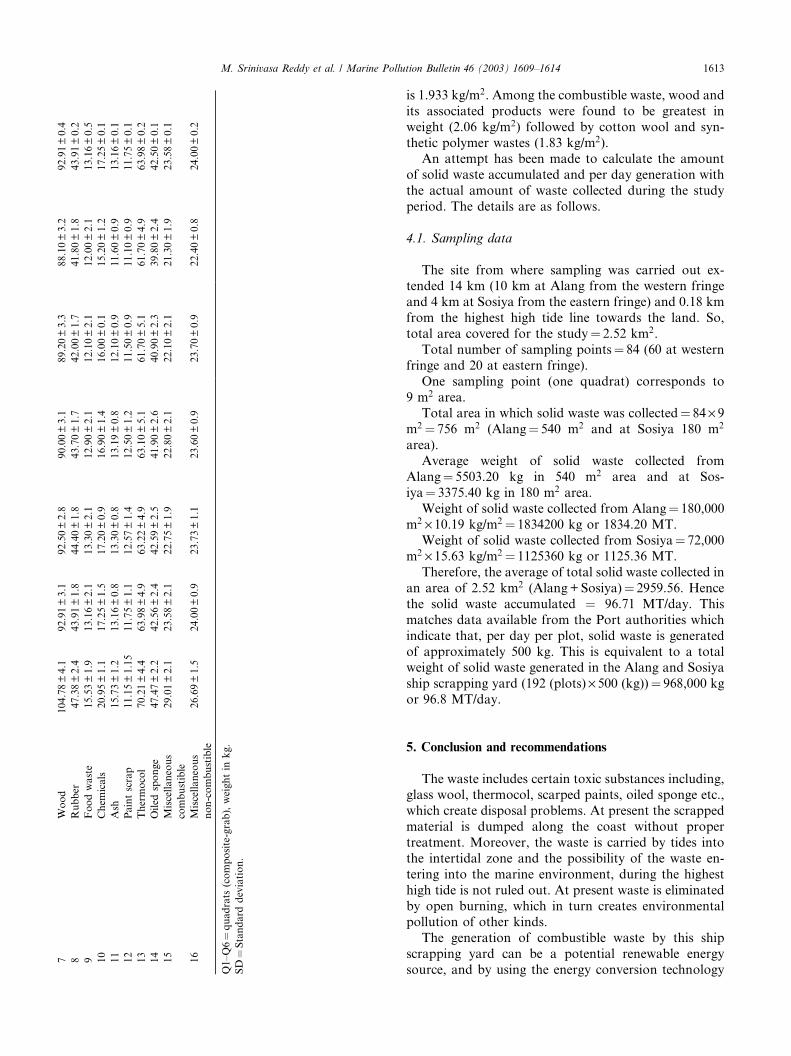
7Wood
104.78±4.1
92.91±3.1
92.50±2.8
90.00±3.1
89.20±3.3
88.10±3.2
92.91±0.4
8Rubber
47.38±2.4
43.91±1.8
44.40±1.8
43.70±1.7
42.00±1.7
41.80±1.8
43.91±0.2
9Foodwaste
15.53±1.9
13.16±2.1
13.30±2.1
12.90±2.1
12.10±2.1
12.00±2.1
13.16±0.5
10
Chem
icals
20.95±1.1
17.25±1.5
17.20±0.9
16.90±1.4
16.00±0.1
15.20±1.2
17.25±0.1
11
Ash
15.73±1.2
13.16±0.8
13.30±0.8
13.19±0.8
12.10±0.9
11.60±0.9
13.16±0.1
12
Paintscrap
11.15±1.15
11.75±1.1
12.57±1.4
12.50±1.2
11.50±0.9
11.10±0.9
11.75±0.1
13
Thermocol
70.21±4.4
63.98±4.9
63.22±4.9
63.10±5.1
61.70±5.1
61.70±4.9
63.98±0.2
14
Oiled
sponge
47.47±2.2
42.56±2.4
42.59±2.5
41.90±2.6
40.90±2.3
39.80±2.4
42.50±0.1
15
Miscellaneous
combustible
29.01±2.1
23.58±2.1
22.75±1.9
22.80±2.1
22.10±2.1
21.30±1.9
23.58±0.1
16
Miscellaneous
non-combustible
26.69±1.5
24.00±0.9
23.73±1.1
23.60±0.9
23.70±0.9
22.40±0.8
24.00±0.2
Q1–Q6¼quadrats
(composite-grab),weightin
kg.
SD¼Standard
deviation.
M. Srinivasa Reddy et al. / Marine Pollution Bulletin 46 (2003) 1609–1614 1613
is 1.933 kg/m2. Among the combustible waste, wood and
its associated products were found to be greatest in
weight (2.06 kg/m2) followed by cotton wool and syn-
thetic polymer wastes (1.83 kg/m2).An attempt has been made to calculate the amount
of solid waste accumulated and per day generation with
the actual amount of waste collected during the study
period. The details are as follows.
4.1. Sampling data
The site from where sampling was carried out ex-tended 14 km (10 km at Alang from the western fringe
and 4 km at Sosiya from the eastern fringe) and 0.18 km
from the highest high tide line towards the land. So,
total area covered for the study¼ 2.52 km2.
Total number of sampling points¼ 84 (60 at western
fringe and 20 at eastern fringe).
One sampling point (one quadrat) corresponds to
9 m2 area.Total area in which solid waste was collected¼ 84 · 9
m2 ¼ 756 m2 (Alang¼ 540 m2 and at Sosiya 180 m2
area).
Average weight of solid waste collected from
Alang¼ 5503.20 kg in 540 m2 area and at Sos-
iya¼ 3375.40 kg in 180 m2 area.
Weight of solid waste collected from Alang¼ 180,000
m2 · 10.19 kg/m2 ¼ 1834200 kg or 1834.20 MT.Weight of solid waste collected from Sosiya¼ 72,000
m2 · 15.63 kg/m2 ¼ 1125360 kg or 1125.36 MT.
Therefore, the average of total solid waste collected in
an area of 2.52 km2 (Alang+Sosiya)¼ 2959.56. Hence
the solid waste accumulated ¼ 96.71 MT/day. This
matches data available from the Port authorities which
indicate that, per day per plot, solid waste is generated
of approximately 500 kg. This is equivalent to a totalweight of solid waste generated in the Alang and Sosiya
ship scrapping yard (192 (plots) · 500 (kg))¼ 968,000 kg
or 96.8 MT/day.
5. Conclusion and recommendations
The waste includes certain toxic substances including,glass wool, thermocol, scarped paints, oiled sponge etc.,
which create disposal problems. At present the scrapped
material is dumped along the coast without proper
treatment. Moreover, the waste is carried by tides into
the intertidal zone and the possibility of the waste en-
tering into the marine environment, during the highest
high tide is not ruled out. At present waste is eliminated
by open burning, which in turn creates environmentalpollution of other kinds.
The generation of combustible waste by this ship
scrapping yard can be a potential renewable energy
source, and by using the energy conversion technology
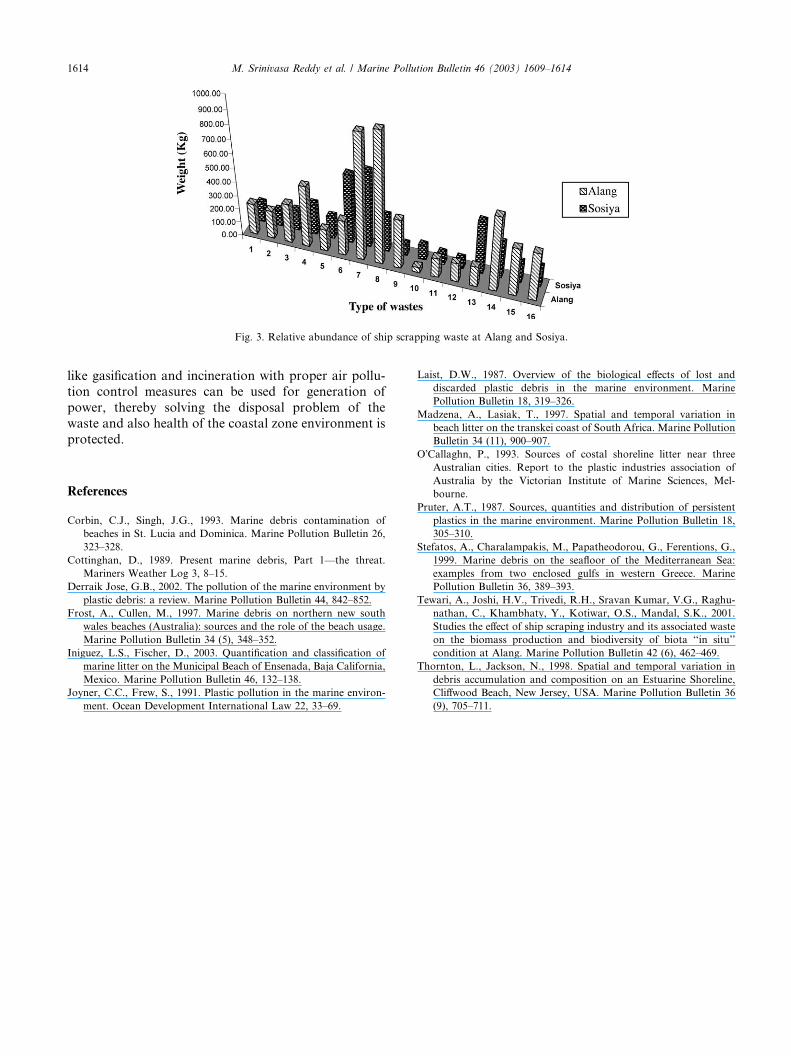
Fig. 3. Relative abundance of ship scrapping waste at Alang and Sosiya.
1614 M. Srinivasa Reddy et al. / Marine Pollution Bulletin 46 (2003) 1609–1614
like gasification and incineration with proper air pollu-tion control measures can be used for generation of
power, thereby solving the disposal problem of the
waste and also health of the coastal zone environment is
protected.
References
Corbin, C.J., Singh, J.G., 1993. Marine debris contamination of
beaches in St. Lucia and Dominica. Marine Pollution Bulletin 26,
323–328.
Cottinghan, D., 1989. Present marine debris, Part 1––the threat.
Mariners Weather Log 3, 8–15.
Derraik Jose, G.B., 2002. The pollution of the marine environment by
plastic debris: a review. Marine Pollution Bulletin 44, 842–852.
Frost, A., Cullen, M., 1997. Marine debris on northern new south
wales beaches (Australia): sources and the role of the beach usage.
Marine Pollution Bulletin 34 (5), 348–352.
Iniguez, L.S., Fischer, D., 2003. Quantification and classification of
marine litter on the Municipal Beach of Ensenada, Baja California,
Mexico. Marine Pollution Bulletin 46, 132–138.
Joyner, C.C., Frew, S., 1991. Plastic pollution in the marine environ-
ment. Ocean Development International Law 22, 33–69.
Laist, D.W., 1987. Overview of the biological effects of lost and
discarded plastic debris in the marine environment. Marine
Pollution Bulletin 18, 319–326.
Madzena, A., Lasiak, T., 1997. Spatial and temporal variation in
beach litter on the transkei coast of South Africa. Marine Pollution
Bulletin 34 (11), 900–907.
O�Callaghn, P., 1993. Sources of costal shoreline litter near three
Australian cities. Report to the plastic industries association of
Australia by the Victorian Institute of Marine Sciences, Mel-
bourne.
Pruter, A.T., 1987. Sources, quantities and distribution of persistent
plastics in the marine environment. Marine Pollution Bulletin 18,
305–310.
Stefatos, A., Charalampakis, M., Papatheodorou, G., Ferentions, G.,
1999. Marine debris on the seafloor of the Mediterranean Sea:
examples from two enclosed gulfs in western Greece. Marine
Pollution Bulletin 36, 389–393.
Tewari, A., Joshi, H.V., Trivedi, R.H., Sravan Kumar, V.G., Raghu-
nathan, C., Khambhaty, Y., Kotiwar, O.S., Mandal, S.K., 2001.
Studies the effect of ship scraping industry and its associated waste
on the biomass production and biodiversity of biota ‘‘in situ’’
condition at Alang. Marine Pollution Bulletin 42 (6), 462–469.
Thornton, L., Jackson, N., 1998. Spatial and temporal variation in
debris accumulation and composition on an Estuarine Shoreline,
Cliffwood Beach, New Jersey, USA. Marine Pollution Bulletin 36
(9), 705–711.
Copyright © 2022 FDOKUMEN