Quality Measurement of Television Picture by Eye Simulation (Applications
10
IEEE TRANSACTIONS ON.BROADCASTING, VOL. BC-28, NO. 1, MARCH 1982 GUALITY MEASUREMENT OF IELEVISION PICTURE BY EYE SIMULATION ANDRE POMERLEAU, DANY SYLVAIN, Student Member Departraent of Electrical Engineering Laval University, Quebec, Canada, GlK 7P4 Abstract - A micro-computer based apparatus has been developed for the measurement of television pic- ture quality when debased by noise. The basic princi- ple is the simulation of the human eye by optical, elec- tronic and software means. The micro-computer measures the standard deviation of light intensity caused bynoi- se. This standard deviation is transformed to give a quality rating. The measurements of quality done with the apparatus agree with the results of subjective tests which have been performed. The main advantage of such an apparatus is that it can measure the picture's qua- lity in a few seconds instead of the many days required for subjective tests. INTRODUCTION The notion of quality for a television picture is dif- ficult to define in words and much more difficult to measure with an apparatus. And yet, this definition is essential for everybody working in this field and even more important for the spectator. Conventionally pic- ture quality is measured by means of subjective tests [1,21 which establish a relationship between picture quality and the importance of the phenomenon causing the degradation. When this relationship is known, only the cause of the degradation is measured and the quali- ty rating is deduced from it. This method is limited to cases where the relation- ship has already been measured and since numerous para- meters are involved, a great number of subjective tests are required. Since these tests necessitate much time and many people, it is easily understood that only a few can be performed. However, the real needs are for a great number of these tests. To try to solve this dilemna, an apparatus has been developped which deduces from the picture available on the screen, the quality rating that subjective tests would have given. The general principle which has guided the develop- ment of the apparatus is the following: the spectator bases his judgment on the light leaving the screen and reaching his eyes. To obtain the same judgment with the apparatus, when placed in the same conditions, the same process must be reproduced. This means that the apparatus has its information from the light coming from the tube and it must also simulate as closely as possible the characteristics of the human eye. Picture degradations can be a different types [31 but the most frequent is degradation by noise. This degra- dation is the one measured by the apparatus. Noise pre- sent at the level of the electrical signal appears on the screen as a random variation of light intensity around a mean value. This random variation is uniform- ly distributed on the screen (neglecting focus and geo- metrical distortions). This means that a small surface can be used as information source. The amplitude of the- vari ation is the parameter which mostly affects the quality rating given by a spectator. This is why the apparatus uses the standard deviation of the light to c iculate the quality rating. EYE CHARACTERISTICS There exists models of varying complexity for the hu- man eye. For the needs of this apparatus and noise mea- surement, a simple model can be used. The main charac- teristics of this model are the following: This work was supported by the Canadian Comu,nication Research Center enter contract number OSU80-00301. Visual acuity In normal conditions of lighting, the eye has a vi- sual acuity of one minute of arc [41 (minimum angular distance between two objects without merging). Color sensitivity Figure 1 shows the spectral response of the eye for the standard observer [5]. Frequency response Temporal variations of light intensity are not equal- ly perceived and the global sensation depends on the variation frequency and the mean light intensity as can be seen on figure 2. These curves show the minimum am- plitude dedectable by the eye, and it is assumed that they can represent the frequency response of the eye[61. Sensitivity variation As seen for the frequency response, the sensitivity of the eye changes with the mean intensity of light. If a graph is traced of the minimum amplitude versus light intensity, figure 3 results. This curve is used by the software to compensate for the frequency response va- riations. Figure 4 presents a general view of the model used for the eye. EYE SIMULATION As previously mentioned, the apparatus must simulate the eye. Figure 5 shows how this has been done. An optical system (is this case a microscope) is placed in front of the screen and transmits the light toward a photocell. This section simulated the visual acuity of the eye. The microscope isolates on the screen a small surface whose diameter corresponds to the minimum dis- tance that the eye can distinguish (normal observation distance and mean contrast). The light stiking the sen- sor has a color sensitivity simular to the eye. After amplification, the signal is filtered to obtain a fre- quency response simular to the eye's response. The si- gnal is then sampled, converted to a numeric value and transmitted to the micro-computer for further proces- sing. In essence the software computes the mean and standard deviation of the signal. With this informa- tion, and by using the curve of sensitivity variation, the micro-computer can deduce the quality rating of the picture. SYSTEM CONSIDERATIONS There are other parameters to be considered in the im- plementation of the simulation. Ambient light in the room reflects on the tube face and reaches the light sensor. To avoid false readings, the ambient light rea- ching the sensor is measured when the picture tube is off during the initialisation of the apparatus. Later, this measurement is used in the calculation of the mean intensity of light. Since the signal to noise ratio on the screen has a wide dynamic range, a variable gain am- plifier, a D/A converter and an inexpensive 8 bit A/D converter are used to replace the 12 or 16 bit A/D con- verter that would otherwise have been needed. The posi- tionning of the microscope is quite critical if the ma-- ximum visual acuity of the eye is used. Tf 6o, the stir-, face must be of a diameter equal to tLie line width, which entails problems in positionning the microscope To solve *this problem, the diametcr of the surface is chosen as to be equal to twice the line width. This 0018-9316/82/0300-0027$00-75© 1982 IEEE
-
Upload
independent -
Category
Documents
-
view
2 -
download
0
Transcript of Quality Measurement of Television Picture by Eye Simulation (Applications
IEEE TRANSACTIONS ON.BROADCASTING, VOL. BC-28, NO. 1, MARCH 1982
GUALITY MEASUREMENT OF IELEVISION PICTURE BY EYE SIMULATIONANDRE POMERLEAU, DANY SYLVAIN, Student Member
Departraent of Electrical EngineeringLaval University, Quebec, Canada, GlK 7P4
Abstract - A micro-computer based apparatus hasbeen developed for the measurement of television pic-ture quality when debased by noise. The basic princi-ple is the simulation of the human eye by optical, elec-tronic and software means. The micro-computer measuresthe standard deviation of light intensity caused bynoi-se. This standard deviation is transformed to give aquality rating. The measurements of quality done withthe apparatus agree with the results of subjective testswhich have been performed. The main advantage of suchan apparatus is that it can measure the picture's qua-lity in a few seconds instead of the many days requiredfor subjective tests.
INTRODUCTION
The notion of quality for a television picture is dif-ficult to define in words and much more difficult tomeasure with an apparatus. And yet, this definition isessential for everybody working in this field and evenmore important for the spectator. Conventionally pic-ture quality is measured by means of subjective tests[1,21 which establish a relationship between picturequality and the importance of the phenomenon causingthe degradation. When this relationship is known, onlythe cause of the degradation is measured and the quali-ty rating is deduced from it.
This method is limited to cases where the relation-ship has already been measured and since numerous para-meters are involved, a great number of subjective testsare required. Since these tests necessitate much timeand many people, it is easily understood that only afew can be performed. However, the real needs are fora great number of these tests. To try to solve thisdilemna, an apparatus has been developped which deducesfrom the picture available on the screen, the qualityrating that subjective tests would have given.
The general principle which has guided the develop-ment of the apparatus is the following: the spectatorbases his judgment on the light leaving the screen andreaching his eyes. To obtain the same judgment withthe apparatus, when placed in the same conditions, thesame process must be reproduced. This means that theapparatus has its information from the light comingfrom the tube and it must also simulate as closely aspossible the characteristics of the human eye.Picture degradations can be a different types [31 but
the most frequent is degradation by noise. This degra-dation is the one measured by the apparatus. Noise pre-sent at the level of the electrical signal appears onthe screen as a random variation of light intensityaround a mean value. This random variation is uniform-ly distributed on the screen (neglecting focus and geo-metrical distortions). This means that a small surfacecan be used as information source. The amplitude ofthe- vari ation is the parameter which mostly affects thequality rating given by a spectator. This is why theapparatus uses the standard deviation of the light toc iculate the quality rating.
EYE CHARACTERISTICS
There exists models of varying complexity for the hu-man eye. For the needs of this apparatus and noise mea-surement, a simple model can be used. The main charac-teristics of this model are the following:This work was supported by the Canadian Comu,nication
Research Center enter contract number OSU80-00301.
Visual acuity
In normal conditions of lighting, the eye has a vi-sual acuity of one minute of arc [41 (minimum angulardistance between two objects without merging).
Color sensitivity
Figure 1 shows the spectral response of the eye forthe standard observer [5].Frequency response
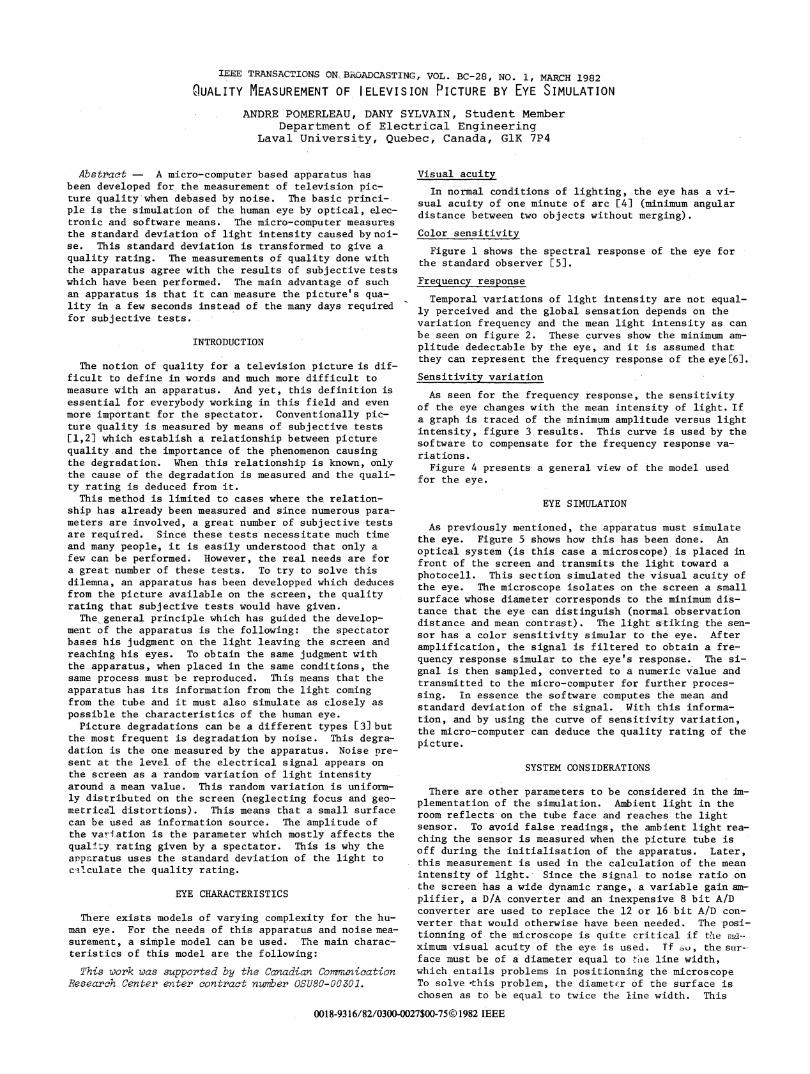
Temporal variations of light intensity are not equal-ly perceived and the global sensation depends on thevariation frequency and the mean light intensity as canbe seen on figure 2. These curves show the minimum am-plitude dedectable by the eye, and it is assumed thatthey can represent the frequency response of the eye[61.Sensitivity variation
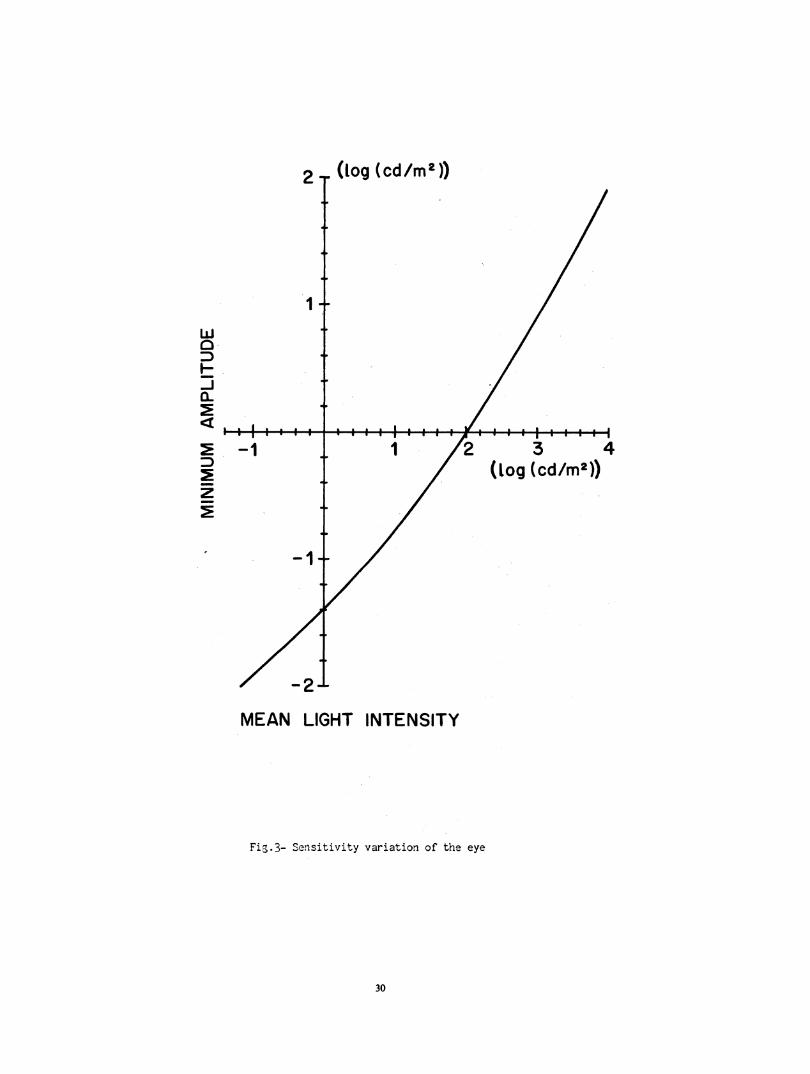
As seen for the frequency response, the sensitivityof the eye changes with the mean intensity of light. Ifa graph is traced of the minimum amplitude versus lightintensity, figure 3 results. This curve is used by thesoftware to compensate for the frequency response va-riations.
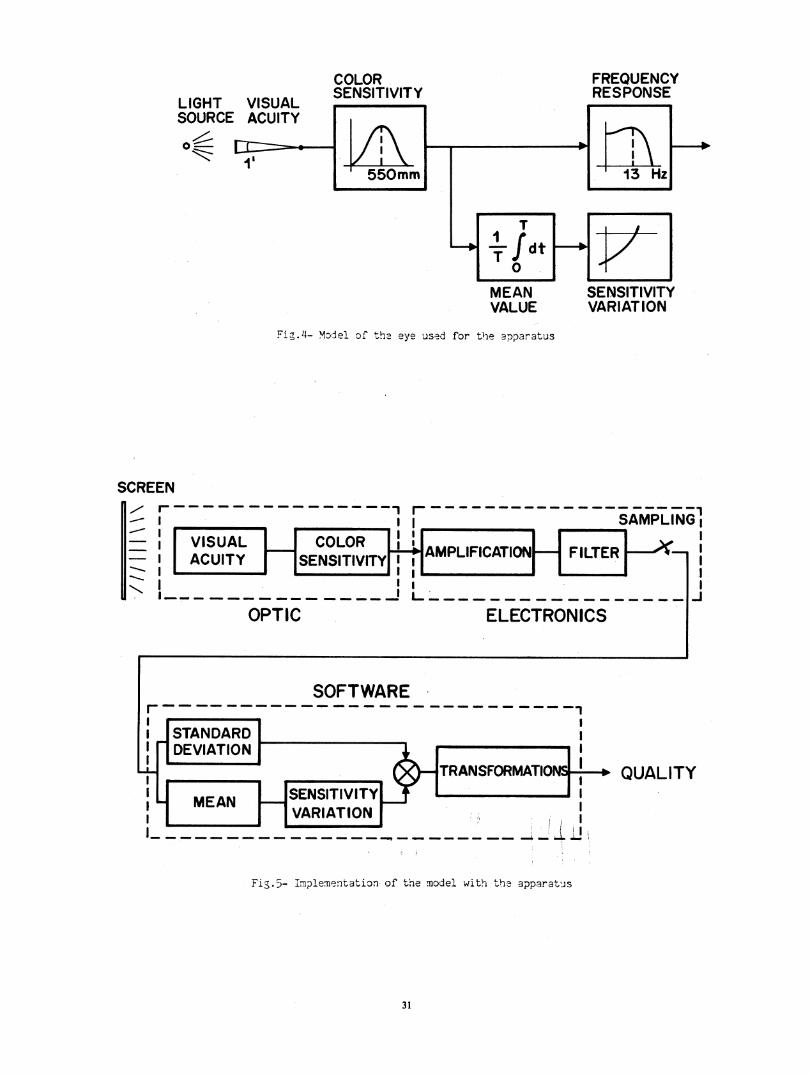
Figure 4 presents a general view of the model usedfor the eye.
EYE SIMULATION
As previously mentioned, the apparatus must simulatethe eye. Figure 5 shows how this has been done. Anoptical system (is this case a microscope) is placed infront of the screen and transmits the light toward aphotocell. This section simulated the visual acuity ofthe eye. The microscope isolates on the screen a smallsurface whose diameter corresponds to the minimum dis-tance that the eye can distinguish (normal observationdistance and mean contrast). The light stiking the sen-sor has a color sensitivity simular to the eye. Afteramplification, the signal is filtered to obtain a fre-quency response simular to the eye's response. The si-gnal is then sampled, converted to a numeric value andtransmitted to the micro-computer for further proces-sing. In essence the software computes the mean andstandard deviation of the signal. With this informa-tion, and by using the curve of sensitivity variation,the micro-computer can deduce the quality rating of thepicture.
SYSTEM CONSIDERATIONS
There are other parameters to be considered in the im-plementation of the simulation. Ambient light in theroom reflects on the tube face and reaches the lightsensor. To avoid false readings, the ambient light rea-ching the sensor is measured when the picture tube isoff during the initialisation of the apparatus. Later,this measurement is used in the calculation of the meanintensity of light. Since the signal to noise ratio onthe screen has a wide dynamic range, a variable gain am-plifier, a D/A converter and an inexpensive 8 bit A/Dconverter are used to replace the 12 or 16 bit A/D con-verter that would otherwise have been needed. The posi-tionning of the microscope is quite critical if the ma--ximum visual acuity of the eye is used. Tf 6o, the stir-,face must be of a diameter equal to tLie line width,which entails problems in positionning the microscopeTo solve *this problem, the diametcr of the surface ischosen as to be equal to twice the line width. This
0018-9316/82/0300-0027$00-75© 1982 IEEE
way the positionning is less critical and the simula-tion of visual acuity is still good. In general, ligh-ting and contrast conditions are non-ideal and cause adecrease in the visual acuity.
The apparatus is based on an AIM-65 micro-computerand all the software is written in BASIC except for afast multiplication routine in Assembler. Figure 6shows a photo of the experimental setup. The only es-sential parts are the micro-computer, the externalboard and the optic sub-system. The resulting appara-tus is quite compact and portable.
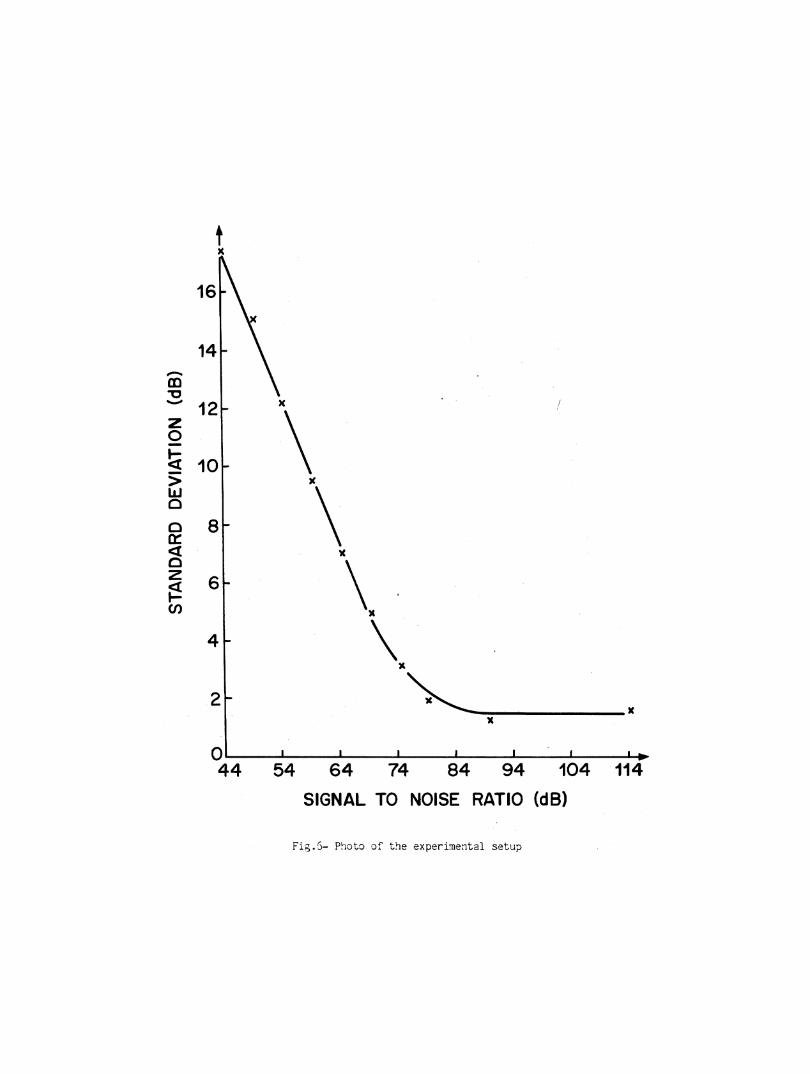
If the value of the standard deviation (dB scale) asmeasured by the apparatus is traced versus the signalto noise ratio at the input of the TV set (ratio bet-ween picture carrier power and mean noise power as seenon a spectrum analyser) figure 7 is obtained. The pla-teau that exists for high signal to noise ratios iscaused by the internal noise of the TV set.
QUALITY CALCULATION
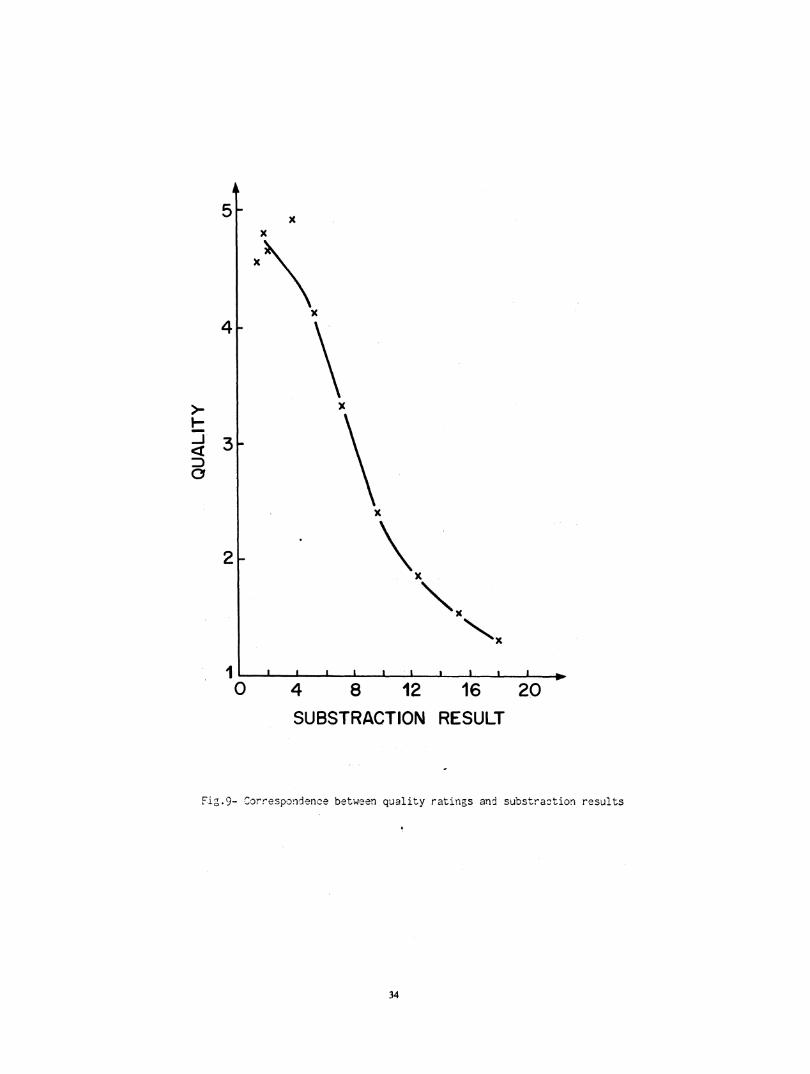
It is now necessary to transform the standard devia-tion measurements into quality ratings. The transfor-mations used to obtain those ratings are illustratedin figure 8. The mean value of the signal is firsttransformed into mean light intensity. , This value isused to find the minimum amplitude of variation withthe curve of figure 3. The minimum amplitude is trans-formed into a basic leval which is substracted fromthe standard deviation expressed in dB. By this method,the variation in sensitivity of the eye is included inthe simulation. The result of the substraction istransformed into a quality rating. This last trans-formation (figure 9) has been found by performing sub-jective tests and comparing with the results of thesubstractions. The final result is a quality ratingranging from 1 for a bad picture to 5 for an excellentone, following the scale proposed by the CCIR [8].
wide screen, etc.)-With modifications to the optics and some new cir-
cuits, it is possible to measure other parameters di-rectly on the screen. Presently work is being done onthe measurement of the frequency response of the sys-tem, including the picture tube. Possibly, differen-tial gain and phase, linearity, sensitivity to ghosts,etc., could be measured with the same basic parts.
REFERENCES
[1] G.L. Fredendall, W.L. Behrend, "Picture 9uality-Procedure for evaluating subjective effects ofinterference", Proc. IRE, vol. 48, no. 6, pp.1030-1034, June 1960.
[2] C.D. Dean, "Measurements of the subjective effectsof interference in television reception", Proc.IRE, vol. 48, no. 6, pp. 1035-1051, June 1960.
[31 A. Pomerleau, R. Brousseau, J. Bouliane, Etude demesures quantitatives de la qualite d'une imagede television, Final Report, Dept. of ElectricalEngineering, Universite Laval, Quebec, March 1979.
[41 R.A. Moses, M. Newman, Adler's Physiology of theeye, Chap. 18: Visual Acuity, Saint Louis, C.V.Mosby, 1975, pp. 500-528.
[51 Commission Internationale de 1'Eclairage, Colori-metrie-Recommandations officielles, PublicationCIE no. 15, Paris, 1971.
[6] R.A. Moses, G.M. Shickman, Adler's Physiology ofthe eye, Chap. 23: Time dependent functions invision, Saint Louis, C.V. Mosby, 1975, pp. 629-683.
[71 D.H. Kelly, "Visual response to time-dependantstimuli. I-Amplitude sensitivity measurements", J.Opt. Soc. Am., Vol. 51 (1961), pp. 422-429.
[81 CCIR, Method for the subjective assessment of thequality of television picture, Doc. 11/1022-E,CCIR XIVth Plenary Assembly, Kyoto, 1978.
EXPERIMENTAL RESULTS
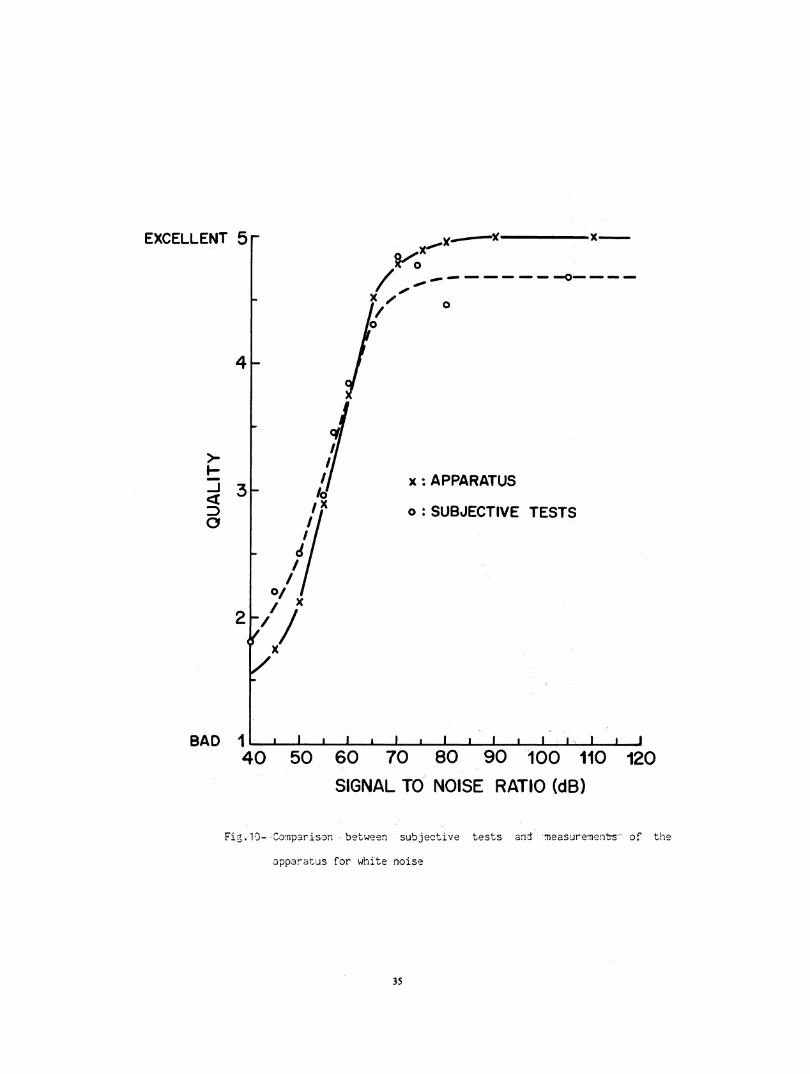
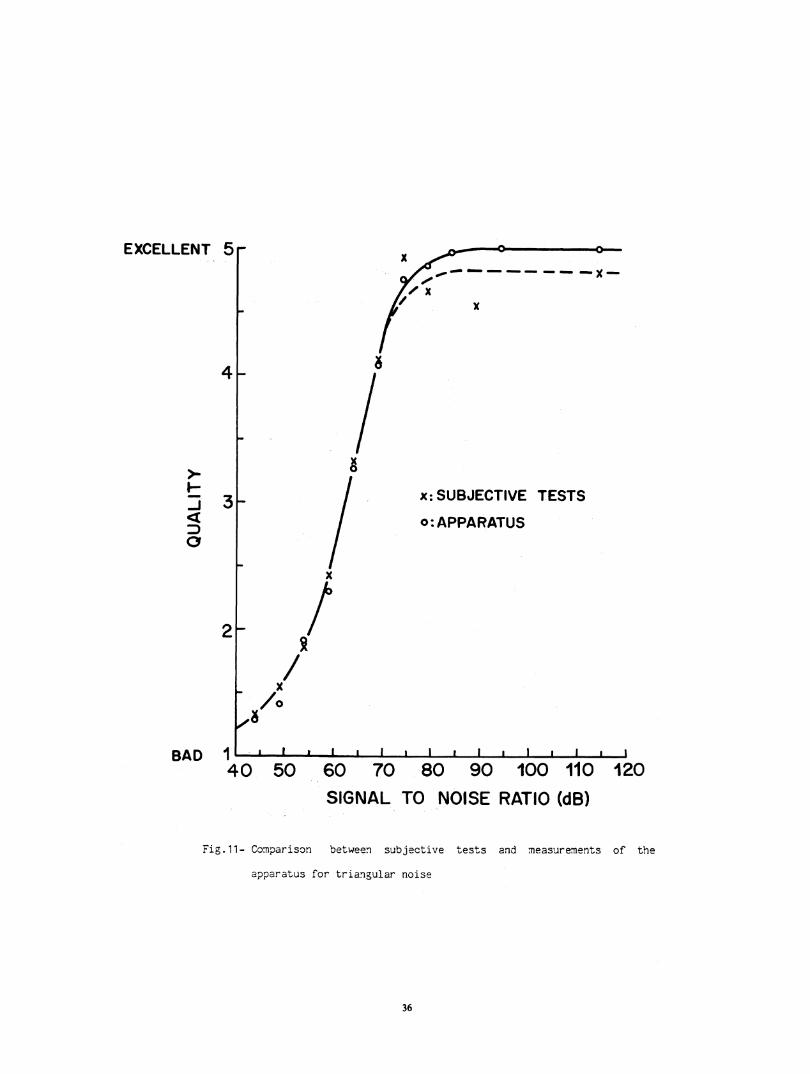
For white noise, the correspondence that exists bet-ween results of subjective tests and measurements bythe apparatus is given by figure 10. As can be seen,the correspondence is very good. For triangular noise(power increasing with the square of frequency), figure11 shows an equally good correspondence between the twocurves. Based on these experimental results and know-ing that the eye is simulated, it is reasonable to as-sume that similar correspondences would be found forother types of noise (impulsive noise for example).
CONCLUSION
A micro-computer based apparatus has been designed toreplace subjective quality measurement tests of noisedebased television pictures. This has been obtained bysimulating the following characteristics of the eye:visual acuity, color sensitivity, frequency responseand sensitivity variation. The only restriction forthe measurement is that the picture must remain unchan-ged for the duration of the test (30 secondes). Theresults given is this article were obtained by using auniform grey level picture. The quality ratings givenby the apparatus agree very well with the results of.he subjective tests.The main advantage of using this apparatus is its ra-
pidity in evaluating picture quality, regardless of theway it is transmitted on the screen. A simple changeof lens adapts the apparatus to any television systemhaving a different spatial resolution. Some of the ma-ny possible applications of such an apparatus are asfollows: verification of television systems and cabledistribution, performance evaluation of different TVsets, development tool for new television systems (sa-tellites, optical fibers, digital transmission, 3D,
28
u38380 460 540 620
WAVELENGHT (mm)700
Fig.1- Color sensitivity of the human eye
7
cd
7
8-3
- 93C
I _ . - -o .I.
U'b
P7
/'\
)0-.
, * t~~~~~~~~I ~ I
1 3 10 30FREQUENCY (Hz)
100
Fig.2- Frequency response of the eye (Data fromn 'Kelly (7))
29
1.0
0.1
0.
O.
0.
Cl)0zLo
0.01
8 I- X-
2Ii10. I I I I %- j f-
O.C
0.03F
0.1k
0.3
1
0-ft
*0
0
0-
HCL
z30
100
300
1000
3
10
2 T (tog (cd/m2))
1w
O-a-
z
-1
(Log (cd/m2))
MEAN LIGHT INTENSITY
Fig.3- Sensitivity variation of the eye
30
COLORSENSITIVITY
FREQUENCYRESPONSE
MEAN SENSITIVITYVALUE VARIATION
Fig.4- Model of the eye used for the aoparatus
SCREEN
- I - I I ~~~~~~~~SAMPLIN~~~~AMPLIFICATION FILTER-
__ACUITY SENSITIVITY
OPTIC ELECTRONICS
SOFTWAREr- -I- ------ _I STANDARD I
DEVIATION r l
IGI
I,.J
1TRANSFORMATIONS QUALITY
f.AI L
.ARIATION
Fic.5- Imple:melation of the model with the apparatus
31
LIGHTSOURCE
0o1-l I
II a A 8- AL dk 6 I
X
x
K
X
54 64 74
SIGNAL TO NOI'
84 94 104
,E RATIO (dB)
Fig.5- Photo of the experimental setup
14
12
10
8
6
m
laJz0
w0
0
zi--MUf)
0-44
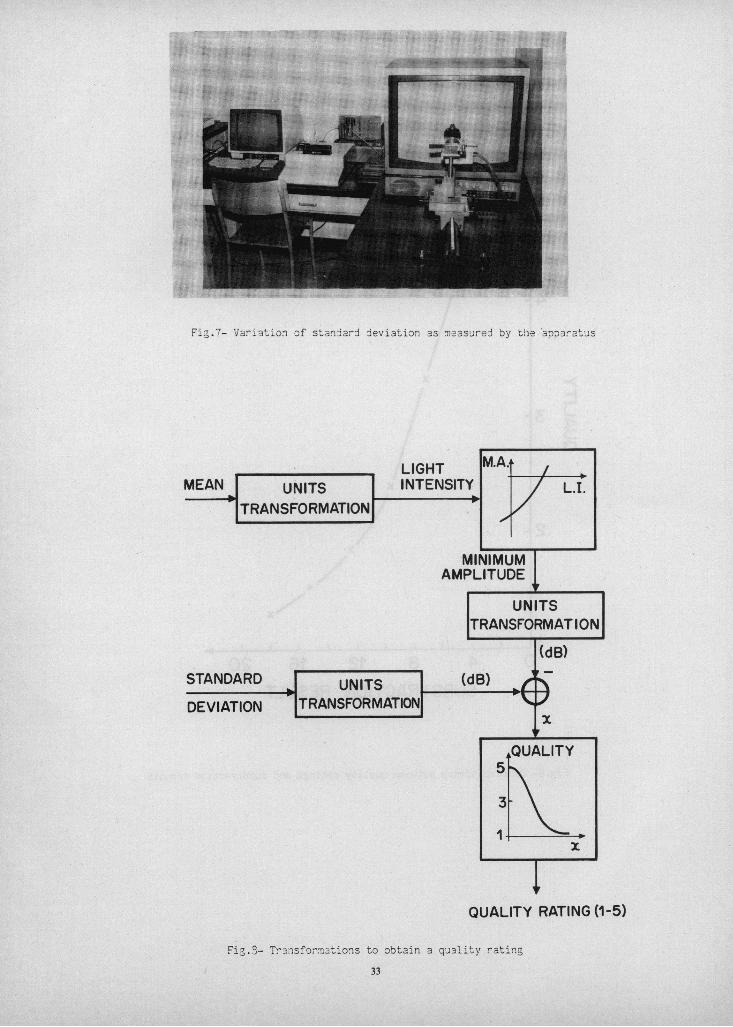
Fig.7- Variation of standard deviation as mneasured by the 'apparatus
MEAN UNITS
TRANSFORMATION
LIGHTINTENSITY
MINIMUMAMPLITUDE
UNITSTRANSFORMATION
STANDARD
DEVIATIONUNITS
TRANSFORMATI(dB) _i'
(dB)
K
!QUALITY
5
3
I
QUALITY RATING (1-5)
Fig.3- Transformations to obtain a quality rating
33
M.A.-
L.I.
5T
x
4
x
3$
C7 \~~~~~~~~~~~~'
2
\x
0 4 8 12 16 20SUBSTRACTION RESULT
Fig. 9- Correspondence betwenr quality ratings and substraction results
34
EXCELLENT 5
4
J 3
a
_-
BAD 140
poe 0
x: APPARATUS
o: SUBJECTIVE TESTS
I I I I I- I I I II I, I_ I 1, I j
50 60 70 80 90 100 110SIGNAL TO NOISE RATIO (dB)
120
Fig.. 10- Comparison - between -subjective test s an rmeasure-nentbs of the
apparatus for white noise
35
xx
4p
3'
21
/R
x
x: SUBJECTIVE TESTS0: APPARATUS
001I '
I II I I I I I I
40 50 60 70 80 90SIGNAL TO NOISE
100 110 120RATIO (dB)
Fig.11- Comparison between subjecctive tests and measurements of the
apparatus for triangular noise
36
EXCELLENT 5x
a--J
BAD
"'P
00, ago& dm.. wm. . . ..X.q/,Oo