
Quality functional deployment as a conceptual aircraft design ...
115
Calhoun: The NPS Institutional Archive Theses and Dissertations Thesis and Dissertation Collection 2000-03 Quality functional deployment as a conceptual aircraft design tool Tan, Rendell Kheng Wah. Monterey, California. Naval Postgraduate School http://hdl.handle.net/10945/7779
-
Upload
khangminh22 -
Category
Documents
-
view
3 -
download
0
Transcript of Quality functional deployment as a conceptual aircraft design ...

Calhoun: The NPS Institutional Archive
Theses and Dissertations Thesis and Dissertation Collection
2000-03
Quality functional deployment as a conceptual
aircraft design tool
Tan, Rendell Kheng Wah.
Monterey, California. Naval Postgraduate School
http://hdl.handle.net/10945/7779


FY KNOX LIBRARY.^GRADUATE SCHOOL
EREYCA 93943-5101


NAVAL POSTGRADUATE SCHOOLMonterey, California
THESIS
QUALITY FUNCTIONAL DEPLOYMENT AS ACONCEPTUAL AIRCRAFT DESIGN TOOL
by
Rendell Kheng Wah Tan
March 2000
Thesis Advisor: Conrad F. Newberry
Approved for public release; distribution is unlimited.


REPORT DOCUMENTATION PAGE Form ApprovedOMB No. 0704-0188
Public reporting burden for this collection of information is estimated to average 1 hour per response, including the time for reviewing instruction, searching existing data sources,
gathering and maintaining the data needed, and completing and reviewing the collection of information. Send comments regarding this burden estimate or any other aspect of this
collection of information, including suggestions for reducing this burden, to Washington headquarters Services, Directorate for Information Operations and Reports, 1215 Jefferson Davis
Highway, Suite 1204, Arlington, VA 22202-4302, and to the Office of Management and Budget, Paperwork Reduction Project (0704-0188) Washington DC 20503.
1. AGENCY USE ONLY (Leave blank) 2. REPORT DATEMarch 2 000
3. REPORT TYPE AND DATES COVEREDMaster's Thesis
4. TITLE AND SUBTITLEQUALITY FUNCTIONAL DEPLOYMENT AS A CONCEPTUAL AIRCRAFTTOOL
DESIGN
6. AUTHOR(S)
Tan, Rendell Kheng Wah
5. FUNDING NUMBERS
7. PERFORMING ORGANIZATION NAME(S) AND ADDRESS(ES)
Naval Postgraduate School
Monterey, CA 93943-5000
8. PERFORMING ORGANIZATIONREPORT NUMBER
9. SPONSORING / MONITORING AGENCY NAME(S) AND ADDRESS(ES) 10. SPONSORING/MONITORINGAGENCY REPORT NUMBER
11. SUPPLEMENTARY NOTESThe views expressed in this thesis are those of the author and do not reflect the official policy or position of the Department of
Defense or the U.S. Government.
12a. DISTRIBUTION / AVAILABILITY STATEMENTApproved for public release; distribution unlimited.
12b. DISTRIBUTION CODE
1 3. ABSTRACT (Maximum 200 words)
Quality Functional Deployment (QFD) methodology was applied as a possible system integration tool for use during the
conceptual configuration design phase of low speed High Altitude Long Endurance (HALE) UAVs. A four-level QFD model was
used to identify important design variables and prioritize those that impact customer attributes. The customer attributes were
deployed into performance parameters. The performance parameters were deployed into UAV part characteristics. The part
characteristics were deployed into manufacturing processes. The manufacturing processes were deployed into process controls.
Based on QFD, the research effort showed that to achieve the customer attributes of high endurance, range, cruise altitude and
payload, the important performance parameters are low gross weight, low CD , high CLand a low life cycle cost. The part
characteristics considered for the conceptual HALE UAV configuration were maximum utilization of composites, thick airfoil (to
increase fuel capacity), high wing fatigue strength and low wing sweep. To achieve the part characteristics, the manufacturing
methods considered were autoclaving and filament winding for composites components; milling and precision forging were
considered for aluminum alloy components. Manufacturing process controls were also identified. In each QFD matrix, the technical
correlations "roof provided an effective mechanism for comparing each design parameter against other design parameters in order
to determine conflicting design requirements.
14. SUBJECT TERMSQuality Function Deployment, Aircraft Design.
15. NUMBER OF PAGES
102
16. PRICE CODE
17. SECURITY CLASSIFICATION OFREPORT
Unclassified
18. SECURITY CLASSIFICATION OFTHIS PAGE
Unclassified
19. SECURITY CLASSIFICATION OFABSTRACT
Unclassified
20. LIMITATION OF ABSTRACT
UL
NSN 7540-01-280-5500 Standard Form 298 (Rev. 2-89)
Prescribed by ANSI Std 239-18


Approved for public release; distribution is unlimited
QUALITY FUNCTION DEPLOYMENT AS A CONCEPTUAL AIRCRAFTDESIGN TOOL
Rendell K. W. Tan
Major, Republic of Singapore Air Force
Bachelor in Mechanical Engineering, Nanyang Technological University, 1995
Submitted in partial fulfillment of the
requirements for the degree of
MASTER OF SCIENCE IN AERONAUTICAL ENGINEERING
from the
NAVAL POSTGRADUATE SCHOOLMarch 2000


ABSTRACT
DUDLEY KNOX UBRARV
Quality Functional Deployment (QFD) methodology was applied as a possible
system integration tool for use during the conceptual configuration design phase of low
speed High Altitude Long Endurance (HALE) UAVs. A four-level QFD model was used
to identify important design variables and prioritize those that impact customer attributes.
The customer attributes were deployed into performance parameters. The performance
parameters were deployed into UAV part characteristics. The part characteristics were
deployed into manufacturing processes. The manufacturing processes were deployed into
process controls. Based on QFD, the research effort showed that to achieve the customer
attributes of high endurance, range, cruise altitude and payload, the important
performance parameters are low gross weight, low CD0 , high CL and a low life cycle
cost. The part characteristics considered for the conceptual HALE UAV configuration
were maximum utilization of composites, thick airfoil (to increase fuel capacity), high
wing fatigue strength and low wing sweep. To achieve the part characteristics, the
manufacturing methods considered were autoclaving and filament winding for
composites components; milling and precision forging were considered for aluminum
alloy components. Manufacturing process controls were also identified. In each QFD
matrix, the technical correlations "roof provided an effective mechanism for comparing
each design parameter against other design parameters in order to determine conflicting
design requirements.

VI

TABLE OF CONTENTS
I. INTRODUCTION 1
A. PURPOSE OF THESIS 1
B. THE FOUR-PHASE QFD MODEL 1
C. APPLICATION OF QFD TO HALE UAV 2
D. MISSION AND CHARACTERISTICS OF THE GLOBALHAWK 3
II. THE QFD PROCESS 5
A. WHAT IS QFD? 5
B. QFD USE TODAY? 7
C. DECISION TOOLS IN QFD 7
D. HOUSE OF QUALITY 9
III. QFD MATRIX 1 : DEPLOYING CUSTOMER ATTRIBUTES TOPERFORMANCE PARAMETERS 13
A. GATHERING THE VOICE OF THE CUSTOMER 13
B. UAV PERFORMANCE PARAMETERS 13
C. ROUGH-ORDER-OF-MAGNITUDE (ROM) ANALYSIS FORHALE UAV 18
D. HUERISTIC ESTIMATES (ROM) 21
E. CONSTRAINT DIAGRAM ANALYSIS 23
F. IMPACT OF QFD MATRIX 1 27
IV. QFD MATRIX 2: DEPLOYING PERFORMANCE PARAMETERS TOPART CHARACTERISTICS 31
A. PARTS DEPLOYMENT 31
B. IMPACT OF QFD MATRIX 2 40
V. QFD MATRIX 3: DEPLOYING PART CHARACTERISTICS TOMANUFACTURING PROCESS CHARACTERISTICS 43
A. PROCESS PLANNING 43
B. COMPOSITE DESIGN CONSIDERATIONS 44
C. COMPOSITE FABRICATION PROCESS 45
D. ALUMINIUM ALLOY FABRICATION 51
E. TITANIUM AND ITS ALLOYS 54
F. IMPACT OF QFD MATRDC 3 54
VI. QFD MATRDC 4: DEPLOYING PROCESS CHARACTERISTICS TOMANUFACTURING OPERATIONS CONTROLS 57
A. CONTROLS IN COMPOSITE FABRICATION 57
B. INSPECTION OF COMPOSITE DEFECTS 59
vn

C. MANUFACTURING CONTROLS IN ALUMINIUM PARTFABRICATION 60
D. SUMMARY OF PROCESSES CONTROLS 61
E. IMPACT OF QFD MATRIX 4 62
VII. CONCLUSIONS 65
VIII. RECOMMENDATIONS 67
A. INTEGRATED TEAM APPROACH 67
B. VALIDATE MANUFACTURING AND PROCESS CONTROLSQFDMATRDC 67
APPENDIX A: MATLAB PROGRAM FOR CDO ESTIMATION 69
APPENDK B: MATLAB PROGRAM FOR CONSTRAINT DIAGRAM 71
APPENDIX C: ROUGH ORDER OF MAGNITUDE (ROM) ANALYSIS 75
APPENDIX D: MATLAB PROGRAM (VARIATIONS OF ACCELERATION) 79
LIST OF REFERENCES 81
INITIAL DISTRIBUTION LIST 85
Vlll

LIST OF FIGURES
Figure 1. Clausing Four-Level QFD Model. [After Ref. 1] 2
Figure 2. Global Hawk. [From Ref. 6] 3
Figure 3. Cost of Changes During Design. [From Ref. 2] 6
Figure 4. House of Quality. [From Ref. 1] 9
Figure 5. Logical Sequence of Developing the QFD Matrix. [From Ref. 1] 10
Figure 6. NACA 66-Series. [From Ref. 25] 15
Figure 7. Constraint Diagram 25
Figure 8. Sustained Turn Constraint Sensitivity Study 26
Figure 9. HALE UAV QFD Matrix 1 30
Figure 10. Increase of Lift with TE Flaps. [From Ref. 26] 33
Figure 11. Impact of Fineness Ratio on CD0 . [From Ref. 30] 34
Figure 12. Weights and Cost Savings Using Composites. [From Ref. 30] 37
Figure 13. Typical S-N Curves. [From Ref. 32] 38
Figure 14. Fatigue Strength of Composites and Aluminum. [From Ref. 39] 39
Figure 15. HALE UAV QFD Matrix 2 42
Figure 16. Utilization of Graphite-Epoxy in F-16. [From Ref. 39] 51
Figure 17. HALE UAV QFD Matrix 3 55
Figure 18. A Typical Autoclave System. [From Ref. 39] 58
Figure 19. A Typical Filament Winding Process. [From Ref. 39] 59
Figure 20. HALE UAV QFD Matrix 4 63
Figure 21. Areas of Emphasis in HALE UAV Design 66

This page is intentionally left blank.

LIST OF TABLES
Table 1. UAV Design Characteristics. [After Ref. 7] 4
Table 2. Rough Order of Magnitude (ROM) Analysis 20
Table 3. ROM Scoring Criteria 20
Table 4. AR and CD0 Sensitivity Constraint Trials on TSL/WT0 26
Table 5. Results of Impact of AR and CD0 on TSLIWT0 27
Table 6. QFD Matrix 1: HALE UAV Design Areas for Trade Studies 29
Table 7. Impact of Fuel Consumption on Engineering Characteristics 35
Table 8. QFD Matrix 2 Roof Analysis 40
Table 9. Summary of Composites Fabrication Processes - Part 1 46
Table 10. Summary of Composites Fabrication Processes - Part II 47
Table 11. Process Manufacturing Requirements and Costs. [From Ref. 33] 48
Table 12. Suitability of Manufacturing Processes to Varying Forms. [From Ref. 33] 49
Table 13. Graphite Composition for a Generic Fighter. [From Ref. 33] 50
Table 14. Summary for Forming Methods for Aircraft Structures. [After Ref. 35] 53
Table 15. Sensitivity of NDI Methods to Different Flaw Types. [From Ref. 33] 60
Table 16. Summary of Key Manufacturing Controls. [After Refs. 37, 38, 39] 61
XI

This page is intentionally left blank.
xn

LIST OF SYMBOLS, ACROYMNS, AND/OR ABBREVIATIONS
r Zero Lift Drag Coefficient
w/s Wing Loading
NACA National Advisory Committee for Aeronautics
Q.™ Maximum Lift Coefficient
cLLift Coefficient
M Mach NumberAR Aspect Ratio
cD Drag Coefficient
e Oswald Efficiency Factor
V Velocity
T Thrust
T5L Thrust, Sea Level
TSFC Thrust, Specific Fuel Consumption (Ct)
WTO Weight, Take-Off
ROM Rough Order of Magnitude
Wt
Weight (without fuel)
E Endurance
D Drag
Ao Availability
a Installed Thrust Lapse
P Instantaneous Weight Fraction
q Dynamic Pressure
s Wing Area
n Load Factor
h Altitude
Ldg Landing
Sus-Tum Sustained Turn
Svc Service
t/c Thickness Over Chord Ratio
A Taper Ratio
A Wing Sweep (quarter chord)
c, Tip Chord
cr
Root Chord
QFD Quality Functional Deployment
ASI American Supplier Institute
UAV Uninhabited Aerial Vehicle
MTTR Mean Time To Repair
MTBF Mean Time Between Failures
Xlll

ERM Elastic Reservoir Molding
CNC Computer Numerical Control
P/M Powder Metallurgy
NDI Non-Destructive Method
xiv

ACKNOWLEDGEMENT
The author would like to thank Professor Conrad F. Newberry and Professor Russ
Duren for their guidance and patience in this thesis effort. Thank you for the countless
times for your expertise and experience in helping me stay the course.
Many, many thanks and gratitude to my lovely wife, Wai Teng for her love,
encouragement, prayers and support. My darling wife, you are my inspiration! My wife
and I are so blessed with three lovely children, i.e., Michelle, Jonathan and Ariel. Our
bedtime stories kept me in perspective! This degree is really a Family Joint Operation!
To God be the glory, honor and praise forever! For it is through His grace that I
have come this far in my military career and His strength that has helped me overcome
every challenge. "Nothing is impossible for my God."
xv

This page is intentionally left blank.

I. INTRODUCTION
A classic story of the application of Quality Functional Deployment (QFD) would
be the dramatic success of Toyota, now an automobile icon and benchmark of quality and
reliability. The Toyota example is indeed indisputable testimony to the application of
QFD to car design that has greatly exceeded customers' expectations [Ref. 5]. This
chapter covers the purpose of the thesis and introduces the application of a Four-Level
QFD model for aircraft conceptualization design.
A. PURPOSE OF THESIS
The purpose this thesis is to develop an approach for the application of the QFD
methodology as a system integration tool during the conceptual design of a generic
aircraft. The thesis will show how the customer attributes, i.e., operational requirements
[based on Request for Proposal (RFP)] can be translated into conceptual design criteria.
A QFD model was used to identify important design variables and prioritize those that
are paramount to the aircraft mission.
B. THE FOUR-PHASE QFD MODEL
The writer notes, as a result of an extensive literature survey [Ref. 1 to 24], that
the QFD concept is consistently reported to be a systematic, structured and an effective
planning and guidance tool which results in a well designed product which usually meets
or exceeds customer requirements. According to Cohen [Ref. 1], probably the most
widely used QFD model in the United States is a four-level model known as the Clausing
model or the American Supplier Institute (ASI) model. However, it must be noted that in
QFD, there is no limit to the number of matrix levels. The four-level QFD model
suggested by Clausing consists of performance parameters, parts deployment,
manufacturing process and controls. The four-level QFD model is shown in Figure 1.

Clausing Four-Level Model
PerformanceParameters
Parts
Characteristics
Manufacturing
ProcessManufacturing
Controls
8
1
Figure 1. Clausing Four-Level QFD Model. [After Ref. 1].
Interestingly, the writer's literature survey on QFD showed that most
organizations do not utilize more than the first QFD matrix, commonly termed a House
of Quality. The writer's opinion is that it is likely that organizations are reluctant to share
their design thought processes openly as these are sometimes regarded as proprietary
knowledge and therefore zealously guarded.
The writer's research goal is to show that QFD can be used effectively during the
conceptual design phase of an aircraft. The outcome of the thesis is a four-level QFD
conceptual design template for a low speed High Altitude Long Endurance (HALE)
Uninhabited Aerial Vehicle (UAV). The Global Hawk design, being a HALE UAV, will
be used as a baseline in developing a HALE UAV QFD template. It is expected that the
HALE UAV QFD template discussed herein will provide aircraft design teams with a
useful tool for the conceptual design of aircraft in general and UAVs in particular.
C. APPLICATION OF QFD TO HALE UAV
To develop the four-level QFD matrix model for the conceptual design of aircraft,
the writer choose to focus on UAV mission requirements similar to those of the Global

Hawk. The reason for selecting a UAV for this four-level QFD model is that UAVs
represent a potentially large future growth in aircraft production quantities due to
potential cost savings and increasing operations requirements. Another reason is that
UAVs are free from constraints imposed by aircrew on board.
D. MISSION AND CHARACTERISTICS OF THE GLOBAL HAWK
A brief background of the Global Hawk concept is presented here. Current
developmental work is being carried out in a bold attempt to replace expensive manned
reconnaissance aircraft, such as the U2 and the SR71, with the Global Hawk (see Figure
2), an autonomous, high altitude long-endurance uninhabited aircraft [Ref. 6].
Figure 2. Global Hawk. [From Ref. 6].
The Global Hawk UAV is a multi-purpose, HALE, broad area theater
reconnaissance and surveillance system. The Global Hawk is designed to provide 24-
hour continuous coverage of interest at long range from the base of operation. The
Global Hawk is to be optimized for supporting low-to-moderate threat, long endurance
surveillance missions in which range, endurance and time on station are paramount. The
survivability of the Global Hawk system is enhanced by its ability to cruise at an altitude

of 65,000 feet, increasing the difficulty for hostile weapon systems' engagement.
[Ref. 6].
For this thesis, the HALE UAV desired characteristics are adapted from the
Global Hawk descriptions presented in the UAV Annual Report FY 1997 [Ref. 7] and
summarized in Table 1 below.
HAE UAV Characteristics
Altitude Maximum (km, ft) 19.8 km; 65,000 ft
Operating (km, ft) 15.2 - 19.8 km; 50,000 - 65,000 ft
Endurance Max (hrs) 40 hrs, 24 hrs at 5.556 km; 3.000 nm
Radius of Action (km. nm) 5556 km; 3,000 nm
Speed Maximum 750 km/h ; 466 mphCruise 600 km/h ; 373 mph
Climb Rate Maximum 1,036 m/min; 3400 fpm
Deployment Self Deployable
Propulsion Engine One Turbofan /
Fuel Heavy Fuel (JP-8)
Weight Payload 889 kg; 19601b
Launch and Recovery Runway 1,524 m /5,000 ft
Load Factor 3 gs (max)
Turn Rate 10 deg/s
TAT 1 hour maximum
Unit Cost Inexpensive
Table 1. UAV Design Characteristics. [After Ref. 7].

II. THE QFD PROCESS
To remain competitive and to sustain continued success in today's environment, a
company must ensure that their products not only meet, but exceed customers
expectations in terms of quality, cost and desired performance. From the company's
perspective, the product is to be built cost-effectively, with optimized resources and
within schedule. This means a careful and acceptable balance of design trade-offs is
required by prioritizing what is most important to the customer against the array of design
characteristics. How can a design team assure that a set of balanced trade-offs will
ultimately achieve a winning product? One effective and proven method of translating
the customer's voice to the actual product is by applying Quality Functional Deployment
(QFD) as a conceptual approach for product system integration.
A. WHAT IS QFD?
To understand QFD, one needs to appreciate its origins. QFD as an approach to
design was a concept first introduced in Japan in 1966 by Dr. Yoji Akao [Ref. 4]. He
was then the Chairman of the QFD Research Committee of the Japanese Society for
Quality Control. QFD is derived from Japanese characters, "hin shitsu" (Qualities); "ki
no" (Function) and "ten kai" (Development, Deployment or Diffusion) [Ref. 1]. The
"House of Quality" is the basic operational concept of the management approach known
as Quality Functional Deployment (QFD). In 1983, Akao introduced QFD into United
States [Ref. 1].
Akao [Ref. 4] emphasized that with each new product, the logical system
integration approach must begin from the conceptualization phase while looking
downstream towards the qualities that customers will demand in the finished product
[Ref. 4]. The customer's voice must be systematically integrated into the design process.
QFD is a means to assure that a design is essentially stable before production begins or
before the prototype is built. QFD, when applied correctly, is the true leverage to a
company being competitive. For example, Figure 3 illustrates the significance in terms

of cost savings (and thus improving cost effectiveness and competitiveness) when
changes are made early in the conceptual design stage.
Cost of
changes
ideal timefor change
ConceptDesign
1 I I I I 1 I I I I 1 I 1 I I I I I II I II
DesignDevelopment
DesignValidation
ProductionDesign
here.
Figure 3. Cost of Changes During Design. [From Ref. 2].
The benefits of QFD are summarized succinctly by Bossert [Ref. 2] and listed
• Customer Driven Attributes
• Creates focus on customer requirements.
• Uses competitive information effectively.
• Prioritizes resources.
• Identifies items that can be acted upon.
• Structures resident experience / information.
• Reduces Implementation Time
• Decreases midstream design change.
• Limits post-introduction problems.
• Avoids future unwanted redundancies.
• Identifies future application opportunities.

• Promotes Teamwork
• Consensus based.
• Creates communications at design interfaces.
• Identifies actions at design interfaces.
• Creates global view out of details.
• Provides Documentation
• Documents the rationale for design.
• Is easy to assimilate.
• Adds structure to information.
• Adapts to changes, a living document.
• Provides a framework for sensitivity analysis.
B. QFD USE TODAY?
The writer's literature survey on QFD revealed wide and varied applications.
Examples noted include aircraft inlet performance, space propulsion system, the
conceptual design of a high speed civil transport, automobile design and software. There
are even typical applications that do not fit the model of product development. For
example, non-product examples quoted by Cohen are course designs, corporate group
strategies, telephone service and response service. These far reaching applications
underline the flexibility of the QFD tool. [Ref. 1].
C. DECISION TOOLS IN QFD
QFD utilizes certain problem-solving and planning devices initially drawn from a
set of tools called the "Seven Management Planning Tools" [Ref. 1]. These devices are
essentially decision-making tools based on the Total Quality Management (TQM)
concepts and only four planning tools are discussed here. However, only the Matrix
Diagram and the Prioritization Diagram devices are used in this thesis.

1. Affinity Diagram
The Affinity Diagram organizes qualitative information and orders the ideas in a
hierarchical fashion, working from lower order ideas to higher ones. The relationships
of the ideas are based on the intuition of the design team. This tool is used to collate and
organize customer attributes, in a bottom-up approach, to establish main categories of
information. For example, take car controls, i.e. turning on the windscreen wipers,
figuring out how to set the car clock, seat adjustments, etc. These can be summed up
under the higher idea of "intuitive car adjustment controls". [Ref. 1].
2. Tree Diagram
The Tree Diagram is also a hierarchy of ideas. However, unlike the Affinity
Diagram the Tree Diagram process flow is built from top down, and is used to complete
and to refine the Affinity Diagram. The reverse of the Affinity diagram is applied in the
Tree Diagram and is used as a means of cross-checking the hierarchy of ideas. [Ref. 1].
3. Matrix Diagram
The Matrix Diagram maps the relationships between the Whats and the Hows list
of ideas or concepts. The matrix is divided into horizontal (Whats) and vertical (Hows)
columns. There may be several Hows to achieve each What. For example, a reliable
mouse trap (What) may be achieved through "Hows" such as a "High Mean Time
between Failures" (MTBF), "time-to-kill" and "dead-mouse-kill / mouse-trap-activation
ratio". The Matrix Diagram is also a means to weigh the relative importance of each
relationship by allocating numerical values to each What and How. For example, for a
reliable mouse trap, the MTBF may be prioritized as a strong positive relationship while
the time-to-kill may be a moderate positive relationship. Each level of relationship is
accorded different numerical values. [Ref. 1].
4. Prioritization Diagram
Based on the computations in the Matrix Diagram, the ideas are prioritized for
further deployment into QFD sub-matrices and treated in the same manner. For example,
8

the bottom rows of the QFD matrix scores will be a means to prioritize the Hows into
Whats of the subsequent QFD matrix.
D. HOUSE OF QUALITY
For this thesis, the QFD process begins with the HALE UAV performance
parameter deployment as the first House of Quality. The first matrix (Performance
Parameters) Hows are then deployed as Whats in the next matrix (Part Characteristics).
This process of deploying the Hows as Whats in subsequent matrices is continued for as
many matrices as required. For the purpose of this thesis, the QFD will be limited to four
levels. The general House of Quality template for all four deployments is shown in
Figure 4.
CustomerNeeds andBenefits
Technical Response(Substitute Quality
Characteristics)
'
//~ Planning Matrix
I
f//
7 4r
*"*"V^ ^"** Response
^^^N. Priorities
Competitive
Technical
Benchmarks
Technical Targets
Figure 4. House of Quality. [From Ref. 1].
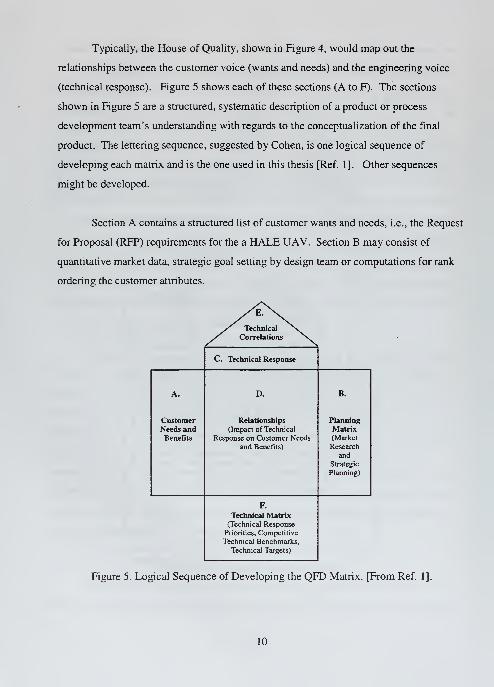
Typically, the House of Quality, shown in Figure 4, would map out the
relationships between the customer voice (wants and needs) and the engineering voice
(technical response). Figure 5 shows each of these sections (A to F). The sections
shown in Figure 5 are a structured, systematic description of a product or process
development team's understanding with regards to the conceptualization of the final
product. The lettering sequence, suggested by Cohen, is one logical sequence of
developing each matrix and is the one used in this thesis [Ref. 1]. Other sequences
might be developed.
Section A contains a structured list of customer wants and needs, i.e., the Request
for Proposal (RFP) requirements for the a HALE UAV. Section B may consist of
quantitative market data, strategic goal setting by design team or computations for rank
ordering the customer attributes.
C. Technical Response
A.
CustomerNeeds andBenefits
D.
Relationships
(Impact of Technical
Response on Customer Needs
and Benefits)
B.
Planning
Matrix(Market
Research
and
Strategic
Planning)
F.
Technical Matrix(Technical Response
Priorities, Competitive
Technical Benchmarks,
Technical Targets)
Figure 5. Logical Sequence of Developing the QFD Matrix. [From Ref. 1].
10

Section C is the technical response by the design team to the customer attributes.
This is in the technical design language describing the product performance parameters.
Section D is the design team's evaluations of the strength of the relationship between
each element of their technical response and each customer attribute. Section E is a
matrix showing the design team's judgments of the implementation interrelationships
between elements of the technical response. This is also often termed the roof of the
house and in essence maps possible trade-off considerations. Section F prioritizes the
technical responses (based on weightings, developed earlier by the design team in Section
D, given to relative importance of customer attributes, benchmarking competition's
current technical performance and the team's technical targets. The writer's research
effort is limited to parts A, C, D, E and, to some degree, F. Market research,
benchmarking and technical targets were not considered to be within the scope of the
thesis.
11

This page is intentionally left blank.
12

III. QFD MATRIX 1: DEPLOYING CUSTOMER ATTRIBUTES TOPERFORMANCE PARAMETERS
This chapter discusses the QFD process for deploying the customer's voice
against HALE UAV system performance parameters. Design features will also be
identified for trade studies.
A. GATHERING THE VOICE OF THE CUSTOMER
Obtaining the customer voice is obviously a crucial step in the formulation of the
QFD process. Since the customer voice decides the final configuration, it is absolutely
critical for the design team to understand and correctly interpret the needs and wants of
the customer. The customer attributes are deliberated and are typically provided in the
RFP (shown earlier at Table 1 in the case of this thesis).
B. UAV PERFORMANCE PARAMETERS
To develop QFD Matrix 1, the writer has translated the customer attributes
(Whats) into performance parameters (Hows). The key consideration when establishing
performance parameters is that they be measurable and able to be translated to
manufacturing requirements. To apply the QFD model to the HALE UAV conceptual
design, the following information and data are drawn from available Global Hawk
literature to form preliminary design information. This will facilitate the deployment of
customer attributes to performance parameters. For example, the Global Hawk aspect
ratio, aircraft dimensions, performance requirements are used to calculate the zero-lift
drag, endurance and range of the conceptual HALE UAV discussed in this thesis. These
calculations will be discussed in more detail in the Rough Order of Magnitude analysis
(shown below) to determine the relationship in terms of numerical impact of each
performance parameter with the RFP system requirements.
1. Major Dimensions
The Global Hawk wing span is 1 16 ft. The wing area is 540 sq. ft. The length of
the fuselage is 44.4 ft and maximum diameter is 4.4 ft. [Ref. 7].
13

2. Gross Weight
The Global Hawk gross weight (maximum take-off) is 25,600 lb. The fuel weight
is 14,700 lb. Therefore the aircraft weight without fuel is approximately 10,900 lb. [Ref.
7].
3. Zero-Lift Drag Coefficient, CD0
The zero-lift drag coefficient is based on the USAF Stability and Control Datcom
method. A MATLAB® program (shown in Appendix A) which performs this calculation
approximated the Global Hawk HALE UAV CD0 at 0.0161 (40,000 ft altitude). This
CD0 of 0.0161 value compares favorably with 0.0197 at 65,000 ft and 0.0137 at sea
level. As a check, this HALE UAV CD0 of 0.0161 compared well with the CD0 (0.015)
of a similar sized long endurance and high altitude UAV design by a Mississippi State
University's student design team submission for the AIAA (1993/94) competition.
4. Wing Loading (W/S)
A MATLAB program was also written to determine the Constraint Diagram
shown in Appendix B. The constraint diagram is discussed in detail in paragraph E of
Chapter III. The optimum wing loading associated with the constraint diagram is 40
—- . The This compares well with the Global Hawk at approximately (25,600 lb, gross
ft
weight) / (540 sq. ft, wing area), i.e. at 47 —-
.
ft
5. Airfoil
The variation of maximum lift coefficient with thickness ratio at Reynolds
Number 1 x 10⁶
is provided by Abbott and von Doenhoff [Ref. 25] . According to
Figure 6, for a thickness ratio of 16%, the NACA 66-series of 0.4 design lift coefficient
offers a good combination of high t/c and C, of 1.60 (section value). With split flaps,
14

the C, (section value) is increased to 2.55. These NACA 66 (see Figure 6) data will be
used as initial values for analyzing the impacts of the performance parameters listed in
the QFD Matrix.
2.8
*»
I 2.0o
8
! 1.2
m
_ Symbols with flags correspond toilraulated split flap deflected &0
, Airfoil withsplit flap
Plain•irfoi 1
h 8 12 16 20
Airfoil thickness, percent of chord
Figure 6. NACA 66-Series. [From Ref. 25].
Figure 6 shows the Ct
(section value) versus the airfoil thickness for the airfoil
and with attached split flaps. There are also different lines to represent the smooth and
the rough surfaces. In general, Figure 6 shows that the C, (section value) increases
with airfoil thickness (expressed as a percent of chord).
6. Aspect Ratio (AR)
As suggested by Equation (3.1), for a constant wing loading, the HALE UAV
would require a relatively higher CL maxat higher altitudes that at sea level. This is due
to the lower densities at higher altitudes.
W0.5pV
slalIS
(3.1)
15

The consequence of a high CL is a high induced drag value. To reduce this
induced drag, the high altitude UAV would need a large aspect ratio. For a first
estimation, the AR is selected to be 25 (similar to the Global Hawk). The Oswald
efficiency is estimated at 0.91.
7. Drag Polar
The HAEL UAV drag polar can be written as
C - C + Cl
7ieAR
Assuming a value of e = 0.91, Equation (3.2) is evaluated as
1.602
(3.2)
0.0161 +;r*0.91*25
= 0.052
8. Jet Aircraft Endurance
According to Anderson [Ref. 26], for maximum endurance for a jet aircraft, we
want minimum thrust-specific fuel consumption, maximum fuel weight and flight at
maximum L/D or
26] is as follows:
c. c n
The jet aircraft endurance equation from Anderson [Ref.
W,
For maximum aerodynamic efficiency [Ref. 26], we consider:
2C
(0.0161x;rx0.91x25)'/2
_
2x0.0161
(3.3)
(3.4)
33.31
16
9. Jet Aircraft Range
According to Anderson [Ref. 26], for maximum range for a jet aircraft, we want
cL
'
minimum thrust-specific fuel consumption, maximum fuel weight, flight at
and flight at high altitudes. Anderson [Ref. 26] provides the range equation for the jet
aircraft as follows:
R =2^=—^(W v2 -WX
V2)
!p„s c, cd
To maximize jet aircraft range [Ref. 26], we consider:
(3.5)
rcr-)
4/3*Cnn
;i/3*0.0161*;r*0.91*25)
4/3*0.016136.66
(3.6)
10. Velocities, V
The HALE UAV V^, is 466 mph or 683.5 feet per second (fps). The cruise
velocity is 373 mph or 546.78 feet per second (fps). These velocities correspond
approximately to the Global Hawk velocities.
11. UAV Thrust
The HALE UAV propulsion thrust is evaluated from the Constraint Diagram (see
Figure 7). The optimum TAVt0 is 0.33. Therefore, an initial estimate of the thrust is 0.33
* 25,600 lb = 8,448 lb. This is close to the Global Hawk required thrust of 7,050 lb.
17

12. TSFC, Ct
Nicolai [Ref. 30] provided a good guide on the range of turbofan TSFC at 0.3 to
1.0 lb fuel / lbf thrust - hour. For this HALE UAV design, the turbofan propulsion TSFC
is estimated at 0.60 lb fuel / lbf thrust - hour.
C. ROUGH-ORDER-OF-MAGNITUDE (ROM) ANALYSIS FOR HALE UAV
With the preliminary FIALE UAV performance data given above, the next step in
QFD Matrix 1 is to select and examine the performance parameters in relation with the
operational requirements (customer attributes). The selected categories are aircraft
performance, stability, engine performance, structural stiffness and life cycle cost
considerations. Using an order-of-magnitude comparison, the performance parameters
(Hows) are examined based on their impact on the customer attributes (Whats).
Interestingly, the writer noted that the idea of comparing the impact of such parameters is
also used by Hale [Ref. 27]. Hale utilizes Figures of Merit for Selection and Design.
The aircraft performance and stability and control equations used for the ROM
analysis are taken from Anderson [Ref. 26] and Hale [Ref. 27] and summarized in Table
2. The results in Table 2 are then translated into the QFD Matrix 1. Examples of the
ROM analysis to produce Table 2 are shown in Appendix C. In the ROM analysis, the
performance parameters are computed individually, while keeping all other parameters
constant to determine the order of magnitude effect of each performance parameter on
each of the customer attributes.
An explanation of Table 2 is necessary here. Take for example the gross HALE
UAV weight (W ) shown in Table 2. The HALE UAV gross weight should be low to
maximize jet endurance. Therefore the down ( I ) arrow implies the design direction to
reduce the gross weight as best as possible. With the first weight estimation of 25,600
Wlbs, the In—— component of the endurance Equation (3.3) is equal to 0.85 (the
18

calculation is shown in Appendix C). This provides a rough order of magnitude of the
weight component in having an impact of reducing the endurance by 0.85. The value of
0.85 would be translated as a negative relationship between weight and endurance. This
is counter-intuitive to the (4> ) arrow of the weight (implying a weight reduction) which
should increase the UAV endurance. The writer would like to reiterate that the reason for
this "counter-intuitive" logic is that the matrix relationships are derived from engineering
equations (examples of such calculations are shown in Appendix C).
For another example, the HALE UAV AR is desired to be high (T ) as shown in
Table 2. The ROM analysis shows that the chosen AR of 25 has an order of magnitude
impact of increasing the endurance by an order of 5, range by 2.24, cruise altitude by 5,
load factor by 5, turn rate by 5 and reducing the runway length by a factor of 5.
For a third example, consider L/D in Table 2. Similarly, the L/D (which the up-
arrow T means we want a highest possible aerodynamic efficiency) has a 33.31 order of
magnitude impact on increasing the HALE UAV endurance. These ROM values in Table
2 are compared with each other and translated into the QFD Matrix 1 into one of four
levels, i.e. strong positive, positive, strong negative and negative.
To ensure that these performance parameters are realistic in the development of
the HALE UAV design template, it is important to validate these numbers where
possible. For example, the endurance of the subject HALE UAV is compared with the
Global Hawk. The maximum HALE UAV endurance is computed in Appendix C to be
47.4 hours which is reasonably close to the Global Hawk's published value endurance of
40 hours [Ref. 6].
19

Performance
Parameters W l
s
L St.
~D ? 4
AR? T/wl c,i
Endurance T0.85 33.31 1.60 7.88 5 1.67
Range t6.25
E(-3)
6.32 1.26 22.12 2.24 1.67
Cruise Alt. T3.9
E(-5)
7.88 5
Max Speed?6.32 7.88 0.57
Climb Rate?6.25
E(-3)
6.32 7.88 0.19
Runway >l25.6
E(3)
47.4 0.63 5 3.03
Load Factor?0.02 1.60 7.88 5 0.33
Turn Rate?0.16 5 0.57
Note: Impact of parameters are computed while keeping the rest of the parameters constant.
Table 2. Rough Order of Magnitude (ROM) Analysis.
The ROM analysis is then translated into the QFD Matrix 1 scores. The
translation criteria adopted is show in Table 3. Take for example, reducing CD0 would
have an impact of a reduction factor of 22.12 on range (shown in Table 2) would be
translated into the QFD Matrix 1 as a strong positive relationship between range and
ROM Analysis
(Magnitude)
QFD Matrix Relationship Score
<0.1 Strong Negative
< 1 Negative
> 1 Positive
> 10 Strong Positive
Table 3. ROM Scoring Criteria.
20

D. HUERISTIC ESTIMATES (ROM)
The writer experienced difficulties in obtaining explicit engineering equations to
determine the ROM impact of HALE UAV payload, self deployment, turnaround time
and availability. In this case, these performance parameter relationships with the
customer requirements are determined based on deliberations with faculty members of
Aeronautical Engineering [Ref. 29] and then recorded in QFD Matrix 1.
1. Stability and Control
The stability and control equations were reviewed in Anderson [Ref.26] and
shown in Equations (3.7) and (3.8). The necessary criteria for longitudinal balance and
dcMcstatic stability are that CM must be positive and that — must be negative. [Ref.26].
daa
CM .
=CMMC„h+VHat
(it+£Q );znd (3.7)
a, ( %dedCM.cg
da.h-h -V„-Ml
a da(3.8)
The stability performance parameter has a positive relationship with endurance,
range and cruise altitude. For example, if the aircraft is not properly trimmed, there
would be unnecessary losses due to excessive pitching moments. Also, excessive trim
drag can, for example, reduce range and endurance. Due to its impact on center of
gravity location, payload has a positive relationship with longitudinal stability. A
properly located payload would minimize the HALE UAV center of gravity shift.
2. Payload
A maximum payload would be positively impacted (more weight means more lift)
by a high aerodynamic efficiency, coefficient of lift and high material specific strength.
A high payload would mean more avionics, and this can be expected to correspond
(correlate positively) to increase in maintainability and a decrease in MTBF. More
avionics parts would likely result in higher failure rate (decrease in MTBF). However,
21

redundant avionics parts may fail without affecting mission success, i.e. MTB Critical
Failures goes up. A low wing loading will mean a larger wing area (for a given weight)
and thus would allow an incremental increase in payload without changing the wing
loading significantly. Conversely, the maximum payload value can be expected to
increase the overall UAV weight and thereby negatively affect a desired low gross UAV
weight value.
3. Self Deployment
Self deployment requires that the HALE UAV be able to take-off from a runway
length of 5000 feet without any assisted boost, e.g. catapult to shorten its take off
distance. The runway length requirement was obtained from the Global Hawk literature
[Ref. 6]. Self deployment is considered to be a positively influenced by a high
aerodynamic efficiency, high coefficient of lift, a high AR, a low engine thrust-to-weight
ratio and negatively impacted by the desired low aircraft take-off weight.
4. Turnaround Time (TAT)
The TAT is defined as the time to required to service the HALE UAV upon
landing for preparation for the next flight. A low TAT would be expected to have a direct
correlation with low aircraft gross weight and low engine thrust-to-weight ratio. For
example, keeping other variables constant a lower weight UAV would imply a smaller
aircraft and therefore less time to prepare the UAV for the next flight.
5. Availability
Higher aircraft availability would suggest higher Mean Time Between Failure
(MTBF) and lower Mean Time To Repair (MTTR) values and likely a higher life cycle
cost [Ref. 40].
MTBFAircraft Availability, An = (3.9)
MTBF + MTTR
22

6. Low Cost
Nicolai [Ref. 30] shows how an initial estimate of the LCC cost can be obtained
based on limited acquisition and performance parameters. However, only the airframe
engineering hours is used in this thesis to indicate the relationship between aircraft
performance and cost.
£ = 0.0396A0791
SI526
<2°183
(3.10)
where A = Aeronautical Manufacturers Planning Report (AMPR) weight.
AMPR weight is defined as the empty aircraft weight less wheels, brakes, tires,
tubes, engines, starter, cooling fluid, rubber or nylon fuel cells, instruments, batteries and
electrical supply, electronics avionics equipment, armament and fire control systems, air
conditioning systems, auxiliary power system and trapped fuel and oil. The preliminary
estimate is approximately 12,800 lbf (as a first estimate, taking 50% of the Global Hawk
gross weight is 25,600 lbf);
S = maximum speed (knots) at best altitude (345 knots); and
Q = number of aircraft to be manufactured (assumed 1000).
Therefore,
A0791 = 1773.08 (low weight has a strong positive relationship with low cost)
It is also reasonable to assume that the initial cost would also decrease with a
lower engine T/W ratio (it is likely that a smaller engine would be less expensive), low
MTTR and high MTBF. It is noted that the low MTTR and high MTBF factors would
hold for small deviations around the design points as they are not necessarily linear with
cost. Conversely, it seems reasonable to assume the cost would increase with stronger
and more advanced materials.
E. CONSTRAINT DIAGRAM ANALYSIS
Thrust-to-weight (TSL IWTO ) ratio and the wing loading are two of the most
important parameters affecting aircraft performance. Hence, to complete the QFD Matrix
23

1 analysis, it is important to consider how a constraint diagram analysis will impact
aircraft performance parameters. The master equation, shown as Equation (3.11), for the
constraint diagram is based on the 1st Law (Conservation of Energy). [Ref. 28].
dt s, dt 2v J
(3.11)
that is; rate of mechanical energy input = storage rate of potential energy +
storage rate of kinetic energy.
Equation (3.8) is further expanded in Mattingly [Ref. 28] to the master equation;
WT
fi\ &CC\pWn q S
+ C, + h +—V dt\ 2g
(3.12)
which includes installed thrust lapse and instantaneous weight lapse equations.
The thrust lapse and weight lapse equations are given by:
W = /3WTO , respectively.
(3.13)
(3.14)
The UAV mission profile consist of ten segments as follows:
• Take Off Ground Roll
• Constant Speed Climb
• Constant Altitude / Speed Cruise
• Constant Altitude / Speed Turn
• Maximum Speed
• Horizontal Acceleration
• Instantaneous Turn
• Service Ceiling
• Sustained Turn
• Landing
Equation (3.12) is specialized for each of these ten mission segments, e.g. dh/dt
for constant altitude flight and dV/dt = for constant velocity flight. The 10 mission
segments are shown in Figure 7. These 10 mission segments curves were generated by
24
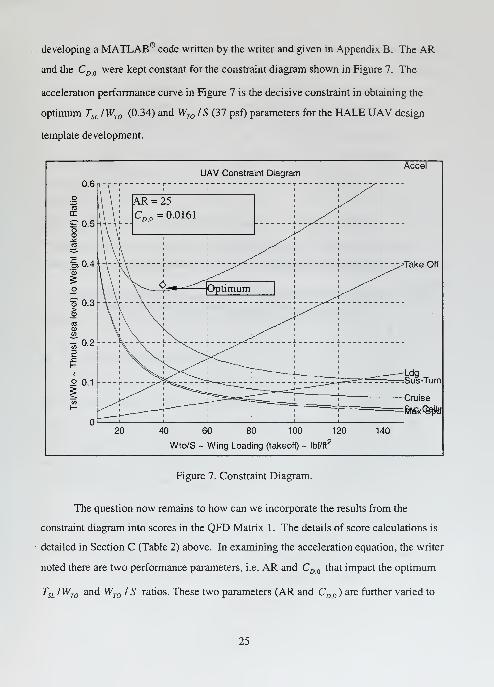
developing a MATLAB® code written by the writer and given in Appendix B. The AR
and the CD0 were kept constant for the constraint diagram shown in Figure 7. The
acceleration performance curve in Figure 7 is the decisive constraint in obtaining the
optimum TSL /WTO (0.34) and WT0 /S (37 psf) parameters for the HALE UAV design
template development.
UAV Constraint Diagram
0.6
0.5
o 0.3>
^ 0.2
2 0.1
20 40 80 100 120
Wto/S ~ Wing Loading (takeoff) ~ Ibf/ft'
Accel
I \ ', i
l\ \
AR = 25
CD)0=0.0161
\\'\-^_i* -^\^^ \
-|Optimum Z3 i
\'\ \ '
'< ^^ '<
¥-A ! -
^^^^======i=:=(
1
-Take Off
-Ldg:Sus-Tum
-Cruise
140
Figure 7. Constraint Diagram.
The question now remains to how can we incorporate the results from the
constraint diagram into scores in the QFD Matrix 1. The details of score calculations is
detailed in Section C (Table 2) above. In examining the acceleration equation, the writer
noted there are two performance parameters, i.e. AR and CD0 that impact the optimum
TSL IWT0 and WTO I S ratios. These two parameters (AR and CDQ ) are further varied to
25

investigate the impact on the constraint plot optimum point. The plan for varying the
AR and CD0 is shown in Table 4 and the results plotted in Figure 8.
Performance
Parameters
Trial 1:
Variation with
120 % AR only
Trial 2:
Variation with
80% CDO only
CI = 1.60 a = i.6o CI = 1.60
AR = 25 AR = 30 AR = 25
CD ,
= 0.0161 CD ,
= 0.0161 CD =0.01288
Table 4. AR and CD0 Sensitivity Constraint Trials on TSL IWT0 .
Another MATLAB® code (see Appendix D) was written to show the impact of
the individual performance parameter on the HALE UAV Acceleration curve as shown in
Figure 8.
0.5
o
cc
1 0.45
«
21D)
'(I)
£ 0.4
o
iS 0.35£2siH
• 0.3o
1CO
0.251
Acceleration Constraint Diagram with Nominal AR = 25, CDO = 0.0161
strn:V .\\
KMJ: >C >\S^~___ ^-jNom inal
:N^fc^: ! _^80% CDC—-^r^Z-—'120% AF
15 20 25 30 35 40 45 50
Wto/S - Wing Loading (takeoff) - lbf/ft2
Figure 8. Sustained Tum Constraint Sensitivity Study.
26

The results of Figure 8 are tabulated in Table 5. The acceleration "trial 1" curve,
i.e., with 120% increase in AR has the effect of a reduction of TSL /WT0 by 93% and
increase the WT0 IS by 106%. Trial 2 acceleration curve, i.e. with a 80% reduction of
CD0 would result in a reduction of TSL IWT0 by 91% and decrease the WT0 IS by 87.5%.
TSLWTO WT0 /S (psf)
Without variations
(Nominal Results)
0.33 40
120 % AR (Trial 1) 0.31 (93 %) i 42.5 (106 %) T
80 % CD0 (Trial 2) 0.30 (91 %) i 35(87.5%)i
Table 5. Results of Impact of AR and CD0 on TSL IWTO .
The impact of AR and CD0 , shown in Table 5, on the engine thrust-to-weight
ratio and the wing loading are then scored in the roof of QFD Matrix 1.
F. IMPACT OF QFD MATRIX 1
The QFD Matrix 1 is assembled in Figure 9. In the column "Importance" of
QFD Matrix 1, Figure 9, the customer attributes are prioritized. For example, the
endurance is weighted highest 13 is the most important customer attribute. The row
"Relative Importance" in Figure 9 is obtained by multiplying the weighted importance
against the individual columns of performance parameters. The relationship symbols used
in the QFD matrices and the corresponding scores are assigned as follows:
• © Strong Positive (+, 2 points)
• O Positive (+, 1 point)
• # Strong Negative (-, 2 points)
• x Negative (-, 1 point)
27

The relative importance is then translated into weight importance of each
performance parameter (Hows) which becomes the Hows weighted importance for the
next QFD matrix. For example, the Relative Importance score of negative 100 for gross
weight (W ), is obtained by multiplying the values of the W column against the values
(weightings) of the Importance column of the customer attributes. This W Relative
Importance score of negative 100 is compared with the other scores of performance
parameters and then the highest absolute scores are prioritized (weighted) highest. In
this case, W which has a score of absolute 100 is weighted highest at the value of
weight of 13.
The arrows in the "direction of improvement" matrix row in Figure 9 documents
the direction that the design should work towards. For example, for the HALE UAV, the
gross weight should be as low as possible ( i ), while the L/D (T ) should be maximized
to achieve the best possible endurance and range.
QFD Matrix 1 shows that to achieve the operational requirements, the design
team has to first focus on ensuring that those performance parameters with highest scores
(in Relative Importance) are given highest priority in the HALE UAV design. QFD
Matrix 1 shows that the four most important performance features that significantly
contribute to the customer requirements are low gross aircraft weight, low zero-lift drag,
high maximum coefficient of lift and low life cycle cost. QFD Matrix 1 identifies the
most important performance parameters (highest scores) and thereby allows the design
team to focus on these parameters that are crucial to meeting the customer requirements
or operational requirements of the HALE UAV. The design team also needs to perform
trade studies where there are conflicting directions of improvement as seen in the QFD
Matrix 1 roof. In addition, the design team needs to review the negative relationships in
the matrix. For example, the significance of the large negative score of the gross weight
component against the customer attributes would be that it may offer an opportunity for
breakthrough ideas to effectively enhance the overall conceptual HALE UAV design.
28

The "roof of the matrix or the Technical Correlations provide a mechanism
where one compares each parameter against another to determine whether or not there are
conflicting design requirements or bottlenecks, and therefore show potentially where
design conflicts need to be evaluated. The design conflicts are summarized in Table 6.
These conflicts must be addressed at the conceptual design stage so as to ensure minimal
changes downstream.
Performance
Parameters
UAV HALE Design Areas To Be Evaluated
W i l/dTNow, to achieve
2C,, max D,0
the design team may select a large Aspect Ratio (holding other
variables constant). The larger AR would likely lead to an
increase in aircraft gross weight.
WIS i LID^ If theW / S is decreased by means of a larger wing area, then the
AR is reduced, which may lead to a lower L / D.
WIS I CD,Q ^ If the W / S is decreased by increasing wing area, the zero-lift
drag will increase due to the dominant factor of friction.
WIS i AfiT If W I S is reduced by means of increasing wing area, S - then
the design team has to note that that AR will be reduced (for b
held constant). This is because AR = b21 S .
cL_ T cD.A Increasing CLvm , say by having a thicker airfoil or requiring
flaps down during cruise, would increase CD0 . The design
team has to be aware that an airfoil offering a higherCtmax would
likely be obtained at the expense of a higher CD0 .
AR T LCC 1 A higher aspect ratio will likely incur a higher cost.
Table 6. QFD Matrix 1: HALE UAV Design Areas for Trade Studies.
29

QFD Performance Parameters Matrix
OIRECHON Of IMPR0VEMEN1 + 1+1+ J-* |+|+|0|+|+|+|+|+| +
\. HOWs
WHAls Nv
1
Peilormonce Poromefets
Performance Prop.
IOps
£o
I<3
§ % 13!
iCO
82E
&s
Eg
B
1
1
S
ogo
3
Enduronce 24 hrs/3000 nm 13 t ® o ® <
Ronqe 3000 nm 12 1 o ® I oCruise All 65000 II 11 1 ® o o r
Poylood 1960 lbs 10 t o o o o « oMax Speed 466 mph 9 o * *
Climb Role 3400 fpm 8 1 o o v oSelf Deploy 7 * ® ® ®Runwoy 5000 (1 6 1 1 V » Y
Load foci or 3 qs 5 1 o o « o olurn Role 10 deq / s 4 v o o *
1A1 mo* 1 hi 3
Hiqh Avoilobilily 2 v ® ®Low Cos! i X
WEIGH1 IMP0R1ANCEr-> «S4
u~>o
OO
RELA1IVE IMP0R1ANCE 8"» s o
a:!o 8 s in GO s ^ R
Figure 9. HALE UAV QFD Matrix 1
30

IV. QFD MATRIX 2: DEPLOYING PERFORMANCE PARAMETERS TOPART CHARACTERISTICS
With QFD Matrix 1 completed, the performance parameters requirements may be
deployed to the part characteristics in QFD Matrix 2. It is emphasized that the design
team frequently reviews completed matrices when new information is added since these
changes may influence the other matrices. In QFD Matrix 2, the design team should
already have some preliminary design ideas and directions as the part characteristics need
to be specific to meet the performance parameters. For example, for a subsonic HALE
UAV, the airfoil may require a high thickness to chord ratio to accommodate more fuel
and one would also expect a small wing sweep angle for a sail-plane wing design [Ref.
34].
A. PARTS DEPLOYMENT
The following key aircraft parts are deemed important when deploying the
performance parameters to part characteristics in the conceptualization stage of the
HALE UAV. Unlike QFD Matrix 1, the writer finds that the relationships between the
performance parameters and the parts characteristics in QFD Matrix 2 are largely
empirical.
1. Airfoil Thickness/Chord ( t/c) Ratio
The coefficient of lift increases with an increase with the airfoil t/c ratio. This is
noted in Abbott and von Doenhoff [Ref. 25] and Nicolai [Ref. 30]. The relationship
between a subsonic aircraft wing and airfoil t/c ratio is as follows [Ref. 30] .
W = 0.00428(5,, )"^:iW)°T (4.D(100?/c)
076(cosA 1/2 )
154
Therefore, for a chosen value of airfoil thickness-to-chord ratio, i.e., 0.16,
Equation (4.1) shows that (holding other variables in the equation constant) the wing
weight is impacted by a factor of 4. Therefore, it is noted that the effect of a thicker
airfoil would result in a decrease in weight. Furthermore, Anderson [Ref. 26] also
31

mentioned that a thicker airfoil (for low Mach cruise) has the advantage of ease in
structural design, lightweight and provides more volume in fuel capacity.
2. Wing Sweep Angle
Nicolai [Ref. 30] provided the relationship between the wing sweep ( A ) and the
aspect ratio, AR, i.e.
tanA L£ =tanAcu +[(l-X)/AR(l + ZJ\ (4.2)
Cwhere A = —'- (taper ratio) (4.3)
For a given taper ratio and a quarter chord sweep angle, Equation (4.2) shows
that an decrease in AR would result in a marginal increase in wing sweep angle. For a
low speed flight such as the Global Hawk, or any high altitude UAV, it is advantageous
to have a high AR. Although wing sweep increases the drag divergence Mach number, it
also serves to decrease coefficient of lift. Also as seen in the Equation (4. 1), a small
decrease in sweep would result in a proportionally small decrease in aircraft weight.
3. Ailerons and Spoilers
Ailerons are "flaps" mounted close to the wing tips for lateral control. The
ailerons would serve to increase or decrease the lift for a specific roll input and would
thereby add to the wing zero-lift drag. Spoilers are "lift dumpers" which would spoil the
lift over the surface immediately behind the spoiler. The deployed spoiler on a HALE
UAV has a negative relationship with the zero-lift drag, i.e., CDQ increases.
4. Trailing Edge (TE) Flaps
To increase lift, the aircraft can increase its angle of attack (AOA) or have a larger
camber or both. Trailing edge flaps provide both these features. The following figure
from Anderson [Ref. 26] illustrates this empirical relationship.
32

Typical values of airfoil maximum lift coefficient for
various types of high-lift devices: ( ! J airfoil only, (2) plain
flap, (3) split flap, (4) leading-edge slat, {5} single-slotted
flap, (6) double-slotted flap, (7) double-slotted flap in
combination wirh a leading-edge slat, (8) addition of
boundary- layer suction at the top of the airfoil. (From
Loftin, NASA SP 468, 1985)
Figure 10. Increase of Lift with TE Flaps. [From Ref. 26].
5. Empennage
It is noted that the Global Hawk has a V-tail and this design is used as a reference
to derived the importance of the empennage. Roskam Part III [Ref. 31] stated that a V-
tail design would result in a smaller wetted area and less weight compared with a
conventional empennage arrangement. The effective function of a tail is to create uplifts
or downlifts to generate a moment about the aircraft center of gravity, thereby
counteracting the moments generated by the wing. Thus it would be expected that the tail
size be related to the wing size.
33

6. Fuselage Fineness Ratio
The fuselage fineness ratio is defined as the fuselage length divided by the
maximum fuselage diameter. Nicolai [Ref. 30] showed a empirical relationship of zero-
lift drag versus the inverse of fineness ration, reproduced in Figure 11.
O.I
\\
"^.
CD e \\
.05
\X\\
i
i
-,,.1 —
pmm1
1
.2 A .6 .8 1.0
(SLENDER)d
(BLUNT)
Figure 11. Impact of Fineness Ratio on CD0 . [From Ref. 30].
It is seen that the CD is predominantly due to viscous separation. The
CD0 (min.) is at fuselage diameter /length of approximately 0.33. The subsonic CDO for
a fuselage is a compromise between skin friction drag coefficient and the pressure drag
coefficient. The fuselage should be a streamlined shape with tapered ends. A blunt aft
fuselage end would cause flow to separate with large increase in CD due to after-body
flow separation.
7. Number of Engines
It is suggested that as the number of engines is increased one would expect to see
a significant increase in life cycle cost, weight, fuel consumption and CD0 . These have
34

the consequence of increased wing loading, and reduced aerodynamic efficiency, i.e.
— if the CD0 increases. However, these factors would have to be studied carefully
in the light of engine reliability. Given a highly reliable engine, the author would be
inclined to select a single engine for reasons mentioned.
8. Engine Type
The thrust of a turbofan engine is a combination of thrust produced by the fan
blades and the thrust of the jet from the primary exhaust nozzle. Consequently, the
efficiency of the turbofan engine offers better specific fuel consumption than the jet
engine. It is noted that the Allison AE 3007 (turbofan) was selected for the Global Hawk.
In order to draw the importance of the turbofan engine with regards to the HALE UAV
performance, the writer selected the best mileage per pound fuel relationship from Hale
[Ref. 27].
Best Mileage/lb fuel for Range =25
C.W
(W/S) e(AR)
C 3(7
(4.4)
Substituting typical numbers into Equation (4.4), allows one to estimate the effect
of the various parameters upon the range (best mileage/lb fuel) of the HALE UAV. The
rough order-of-magnitude (ROM) analysis on Equation (4.4) is shown in Table 7. The
performance parameter values are obtained from Chapter III. Table 7 suggests that the
performance parameter impacts are all positive with a low CD0 having the most
significant impact on increasing HALE UAV range. Also, as expected, the higher the
HALE UAV weight component, the more adverse is the best mileage per pound fuel.
C, W W/S AR r*-T>,0
Performance
Parameters Values
1/0.6 1/25,600 V40 25,/4
1
0.0161374
ROM Impact on
Best Mileage/lb fuel
1.67 3.9
E(-5)
6.32 2.24 22.12
Table 7. Impact of Fuel Consumption on Engineering Characteristics.
35

9. Inlet Design
Roskam [Ref. 31] stated that the objectives of inlets are to provide the correct
amount of airflow to the engine, minimize pressure losses, minimize inlet flow distortion
and to match the inlet flow swirl to the compressor requirements. The detailed design of
the inlet is a strong function of how the engine is integrated into the airframe. Raymer
[Ref. 34] provides a good discussion on the types of buried and podded engines. It is the
writer's opinion that a podded nacelle type would allow easy engine access for
maintenance (lowers the MTTR). However a podded nacelle type engine would likely
increase CD as compared with an buried fuselage engine. A pitot type inlet has the
advantage of not being influenced by the flowfield of other aircraft components, but
requires very long ducts and therefore increases weight and skin friction drag. The
weight of a short duct length is given by Nicolai [Ref. 30] which suggests that the weight
of a external turbofan cowl and duct is directly proportional to Lrf
0731, i.e. (subsonic duct
length, per inlet, ft).
The Global Hawk podded engine is used as a reference in QFD Matrix 2.
Therefore, a podded engine and inlet design is expected to result in lower weight, higher
MTTR but higher CD0 and consequently lower
10. Percentage of Composites
An aircraft designed using advanced composites may have the advantage of
smaller overall design and less weight compared with metallic material. Composites also
offer advantages of reduced number of fasteners, possible increased corrosion resistance
and may have a better potential (than metal parts) for extended operational life. This
increase in capability comes at an increase in cost [Ref. 33]. It is noted from Figure 12
that with greater than 50% composites utilization, the total cost airframe cost begins to
increase. A few reasons for the potentially higher cost of composites are that the
properties of these engineered materials frequently have to be verified. In addition,
36

because of the severe thermal cycling experienced in the autoclave, special tooling with
good durability is required.
S. ^ TOTAL AIRFRAME COST
-z
V> UJ
20
-\\Q^"^^_ —-—"^
v^7 """" "*"»». -J® Sa primary structur^^ • 0"~vA — WEIGHT
^^ — — -A-,-, _5Z. SECONDARY STRUCTV WEIGHT40Qc2h SYMBOL COMPONENT< tf)
—
td O TAILX <60 D WING
UJ UJ
_)0
O FUSELAGEA COMPLETE AIRCRAFT
<t- \7 SECONDARY STRUCTURE
OH 80 -
3<t
l-UJ
OPEN SYMBOLS - PIECES BUILT OR BEING BUILT
100C
- CLOSED SYMBOLS - CONCEPTUAL DESIGN
i i i ( i l i i t i
) 20 40 60 80 100
COMPOSITE UTILIZATION BY WEIGHT, PERCENT
Figure 12. Weights and Cost Savings Using Composites. [From Ref. 30].
Due to better specific strength, a composite wing will also allow a higher AR with
a lower t/c ratio. The flexural strength of a composite component is the resistance to
breakage by bending stresses [Ref. 39]. A case in point is the Global Hawk UAV which
has a graphite composite wing and empennage, but a conventional aluminum fuselage.
In the writer's opinion, a lighter aircraft would also result in a lower T/W ratio and this
could translate to needed a lower required design specific strength and stiffness.
However, it is likely that the MTTR may be higher due to the complexities in repairing
composites.
37

11. Fatigue
There are two distinct types of Stress Amplitude - Cycles behavior, or what is
popularly termed the S-N curves, mentioned in Callister [Ref. 32]. Typical S-N curves
are shown below in Figure 13. For some ferrous and titanium allows, a fatigue limit
exists. This fatigue limit or endurance limit is the stress amplitude below which fatigue
will not occur. This fatigue limit represents the largest value of fluctuating stress that
will not cause failure for essentially an infinite number of cycles.
a6
J Fatigue
jg limit
1 1 1 I 1
11 1 1
1
1 0" io4
to'' 106 10;
Cyrlps to failure. A'
(loear ithmir sralp)
t,i)
l(iK 10° ir h>
a>o
"5.
E
in Sj
Fatigue strengthat /V[ cycles
I 1 [ i I
I
1
1
|\^^
1 1 1 1
1 3>3 104 Fatigue lite io7 N
at stress Si
Cycles to tailure \(logarithmic scale)
(b)
10B 10* 10
Figure 13. Typical S-N Curves. [From Ref. 32].
38

Most non-ferrous alloys, e.g., aluminum, do not have a fatigue limit, i.e., the S-N
curve continues its downward trend to increasing N cycles. For these materials, the
fatigue response is specified as fatigue strength. Fatigue strength is defined as the stress
level at which failure will occur for some specified number of cycles. Another
parameter, fatigue life is the number of cycles to failure at some specified stress level.
Figure 14 shows the comparison of fatigue strength of graphite, steel, fiber glass
and aluminum. It illustrates the constant-amplitude fatigue for higher strength, lower-
cost graphite-epoxy in tension-tension cycling. Figure 14 shows that graphite-epoxy
composite material out-performs aluminum alloy in terms of fatigue strength (cycles to
failure). The percentage of strength retention of graphite-epoxy exceeds that of the
aluminum after 50,000 cycles. Figure 14 serves to reinforce the fact that composites are
an attractive option for aircraft parts that are subject to fatigue stresses.
ionFATIGUE RESISTANCE
PERCENT
OF
ULTIMATE
STRENGTH
o
o
o
o
o
*LUMINIJM «
Gr E f >
STE EL
S Gl.AS > E P
1O 1 102 lO3 104 lO5 106 1
CYCLES TO FAILURE
O?
Figure 14. Fatigue Strength of Composites and Aluminum. [From Ref. 39].
39

12. Fuel Tank Volume
A long endurance UAV will require a large fuel volume capacity. This generally
means a higher gross weight and a higher wing loading (for a constant wing area). It may
be possible that the CD0 may increase if there are external tanks added to the HALE
UAV design or if the fuselage volume is increased to attain sufficient fuel for range and
endurance. Again, a higher CD0 would mean an eroded However, there is a
positive relationship between a thicker airfoil and fuel tank volume since a thicker airfoil
offers more fuel storage volume in the wing structures.
B. IMPACT OF QFD MATRIX 2
The relative importance of the performance parameters in QFD Matrix 2 are
prioritized based on the weight importance computed from QFD Matrix 1. Then based
on the literature survey and empirical relationships where available, the relationship
matrix is scored. Trade studies suggested by the QFD Matrix 2 roof analysis is
summarized in Table 8.
Parts Char. Design Areas To Be Evaluated
Fineness
Ratio T
Inlet Design
Length 4
A preferred longer fineness ratio needs to be evaluated
against a shorter inlet design.
Fineness
Ratio T
Fatigue? A fatigue analysis is required as fineness ratio is increased,
i.e. a longer fuselage may be more fatigue prone in terms of
torsional and bending loads.
Table 8. QFD Matrix 2 Roof Analysis.
QFD Matrix 2 (see Figure 15) shows that the most important parts characteristics
to be considered in meeting operational requirements are utilization of a high percentage
of composites, a large airfoil thickness to chord ratio, a small wing sweep angle, a well-
designed empennage and a wing with high fatigue strength. It is also suggested that
40

increasing the number of engines has an adverse effect on the aircraft design, and the
design team would do well to design the aircraft with only one (highly reliable) engine.
It is noted that there are two design areas identified for trade studies as discussed
in the QFD Matrix 2 roof analysis. This may be expected as the main aircraft design
conflicts are upfront in QFD Matrix 1 where the key performance parameters affect one
another more significantly then downstream deployments of QFD matrices. Thus, it may
be concluded that cost savings appears to be most significant when the conceptual design
is thoroughly deliberated and all trade-off studies are carefully weighed for the desired
operational outcome.
41

QFD Parts Characteristics Matrix
DIRECTION OF IMPROVEMENT + o + + + + I-* + +
N. HOWs
WHATs N.
ceo2
Paris Choroderislics
Aerodynomfcs Propulsion Slruclures O
CI
CD
5;
V)coV-X
2?,32
o£
occ
1
©
o1
c"ci>
o
1o
?5
o
3 C_>
soQ-
o
a>
o§o
Wo 13 ® y 1 1 o ® ® y ®w/s 1 o ® ® y
L/D 6 V o y y
CL, mo* 11 ® o ® ® o ®CD.o 12 y 1 y y o y ® y y
AR 5 ® y y ® ®SloMily 7 ®
Prop.
I / W 3 o ®TSFC, CI 4 o
Mol'l Specific Slrencjlh 2 ® ® ®
sLCC 10 y y y ® y y
MTTR 9 o y o oMTBF 8 o o o
WEIGHT IMPORTANCE o©> 2 to oo oo tO
1--) - C^l
RELATIVE IMPORTANCE
« CDr—
J
CN oCm
COin
:= oor- I
s- OJ r-o
Figure 15. HALE UAV QFD Matrix 2.
42
V. QFD MATRIX 3: DEPLOYING PART CHARACTERISTICS TOMANUFACTURING PROCESS CHARACTERISTICS
The third phase in the UAV conceptual QFD study is the deployment of part
characteristics into possible or representative manufacturing processes. At this stage, one
must be careful to constantly keep the customer attributes in mind as it is easy to lose the
voice of the customer.
A. PROCESS PLANNING
The HALE UAV is a typically large and complex system, consisting of several
major sub-systems, i.e. wings, fuselage, empennage, propulsion, etc. Having surveyed
literature on design for manufacturing [Refs. 35 to 39], the writer is of the opinion that
deploying the QFD matrices from parts to processes must be specific to the aircraft sub-
system. For example, the wing as a sub-system, can be further broken down to longerons,
ribs, stiffeners, integral wing tank, skin, ailerons, spoilers, flaps, etc. In QFD
methodology, each of these wing parts can be deployed against manufacturing processes
and subsequently deployed into production controls.
This specific-part to specific-process QFD Matrix is also adopted in the classic
paper by Hauser and Clausing [Ref. 5]. This paper provides an excellent example in
relating the importance of an extrusion speed of 100 rpm which helps gives a
reproducible diameter for the weather-stripping bulb, resulting in good sealing without
excessive door-closing force. This feature aims to satisfy the customer's desire for a
"dry, quiet car with an easy-to-close door". The Hauser and Clausing paper [Ref. 5]
showed how QFD can systematically translate a customer voice to a key manufacturing
process and control. It is not the intention of this research effort to go into detailed
manufacturing operations of each aircraft part at the conceptual stage. However, it is
acknowledged that the detailed manufacturing process analysis is important and will
impact the successful outcome of the customer attributes, and thus should be a design
consideration.
43

Hence, the objective of QFD Matrix 3 process deployment will focus on
deploying the key HALE UAV airframe parts, i.e., wing structure, airfoil t/c and
contours, wing sweep, empennage design and general structural requirement. QFD
Matrix 2 concluded that utilization of composites in the HALE UAV design significantly
contribute to the customer requirements, QFD Matrix 3 will focus on the importance of
composites fabrication techniques best suited for the key UAV parts. The QFD metal
forming and machining matrices, also deemed important for any aircraft manufacturing,
will also be considered in QFD Matrix 3. However, the discussion will be scoped for
aluminum alloys as this material can be expected to dominate mostly any metal
utilization in HALE UAV aircraft [Ref. 34].
It is interesting to note that conventional aluminum alloys (2000 and 7000 series:
industry designation) are being replaced by aluminum-lithium alloys and titanium alloys,
because of their higher strength-to-weight ratios. Forged parts are being replaced with
powder metallurgy (P/M) parts that are manufactured with better control of impurities
and microstructure. Also, advanced composite materials and honeycomb structures are
replacing traditional aluminum airframe components. [Ref. 34].
The approach to developing QFD Matrix 3 is to deploy the key part
characteristics against different composite manufacturing methods. The objective is to
determine what is the most reasonable or probable manufacturing method for each part
characteristic of the wing, fuselage and empennage system.
B. COMPOSITE DESIGN CONSIDERATIONS
Composite materials provide several advantages over metallic materials, e.g.
tailoring the mechanical properties to meet specific design requirements, possible weight
saving, corrosion resistance, etc. Raymer suggest that in a typical aircraft part, the direct
substitution of graphite-epoxy composite for aluminum may yield a weight savings of 25
% [Ref. 34]. However, it is also noted that there are design concerns and inherent
limitations of the two-phase, orthotropic material composition. For example, the fibers of
44

the composite are strong, stiff and thermally resistant while the composite matrix is
generally weaker, less stiff and more susceptible to corrosion and solvents. The fiber-
matrix inter-phase is also complex and can affect the toughness and damage tolerance of
the composite. In essence, the structural designer must understand the properties of both
fiber and matrix, make careful trade-offs to achieve the desired design outcome. For
example, the designer has to evaluate and factor the higher stress concentrations at edges
of drilled hole compared with metal aircraft parts. The inherent limitations of composites
may also have negative impact on the design of structural attachments and joints. The
fabrication of composites may result in delaminations which will have negative shear and
compressive impacts on the structures. If a composite delamination of a critical length
were to go undetected, the worst case scenario would be a crack propagation and an
ultimate structural failure of the HALE UAV. [Ref. 33]. However, the design
considerations of composite fiber and matrix are not covered in the scope of this thesis.
C. COMPOSITE FABRICATION PROCESS
To gain a better understanding of composite fabrication process, the writer carried
out a literature survey which is summarized in Table 9 and 10. To better understand
Tables 9 and 10, it is instructive to define some composite terminologies here. For
example, Prepeg is ready-to-mold material in sheet form, which may be cloth, mat, or
paper impregnated with resin and stored for use. The resin is partially cured and supplied
to the fabricator, who lays up the finished shape and completes the cure with heat and
pressure. Curing changes the properties of a resin by chemical reaction. Resin is a solid,
semi-solid or pseudo-solid organic material which has an indefinite molecular weight,
and exhibits a tendency to flow when subjected to stress. Resins are mostly polymers.
Most current composite manufacturing methods can start by placing the uncured
composite material into or onto a mold so that the material can be shaped into the final
part. [Ref. 39].
45

Process Description
Autoclave
curing
The prepreg method generally uses both a vacuum and an autoclave to assist in
consolidating and curing the part. Autoclaves allow the simultaneous imposition of
heat, pressure and vacuum. Autoclaves can be as large as 25 ft. (8m) in diameter and
100 ft. (30m) in length. The major difficulty with autoclaves is the high capitalization
cost because autoclaves are pressure vessels and are subjected to stringent pressure code
regulations. However, because many parts can be cured simultaneously in an average
autoclave, labor and cure costs on a per part basis need not be extremely high.
Elastic
Reservoir
Molding (ERM)
ERM produce sandwich components consisting of a rigid polyurethane, foam core with
reinforcing face-sheets. This process can use existing hydraulic presses.
Thermoforming
Thermoplastics
Thermoforming is a series of processes for forming thermoplastic sheet or film over a
mold with the application of heat and pressure differentials.
The process yields nearly finished parts. Typical parts may be complex but generally
small, e.g. refrigerator liners, appliance housings and panels for shower stalls. Parts
with opening or holes cannot be formed because the pressure differential cannot be
maintained during forming.
Injection
Molding
Injection molding produces parts by injecting a measured quantity of resin and chopped
fiber into a molding die cavity that defines the shape of the part. Consolidation occurs
under the application of heat and pressure. Injection molding is essentially a hot-
chamber die casting. This process is also applicable to thermosets and thermoplastics.
Molds are expensive. Typical parts are containers, electrical and communications
components.
Hot Stamping Hot stamping is akin to stamping of hot metal sheets. This process is suitable for
chopped fiber reinforcements. Small to moderate size and complex shapes are possible.
Table 9. Summary of Composites Fabrication Processes - Part I.
[After Refs. 37, 38, 39].
46

Process Description
Thermosets Molding compounds with thermosets, when subjected to heat and pressure within the
confines of a mold, cure or set into an infusible mass. An irreversible chemical change
occurs. Part sizes of thermoset-molded parts vary from miniature insulators to large
structural parts. Fiber-reinforced epoxies have excellent mechanical properties.
Pultrusions This is a relatively low cost production method. Pultrusion employs continuous
processing and uses prepegs or indirect impregnation. Continuous reinforcement fibers
are impregnated with resin, shaped by drawing through a die and then cured. Its major
limitation is that the cross-section normally must be constant. Long shapes with
various constant profiles, e.g. rods or tubings may be made by pultrusion process. The
product is cured during its travel through the die and cut into desired lengths. Pultruded
parts are also used for pressure tanks, aircraft flooring, stringers and stiffeners in
aircraft.
Filament
Winding
Filament Winding can be wound as prepeg or run with direct impregnation.
Axis-symmetric parts, e.g. pipes, as well as asymmetric parts are produced on a rotating
mandrel. The reinforcing filament or tape is wrapped continuously around the form.
The reinforcements are impregnated by passing them through a polymer bath.
Part diameters ranging from 1 in. (23 mm) to 20 ft. (6 m) are common. The only
limitations on size are those dictated by the geometries of the winding machine and the
limitations in mandrel size and weight. Typical asymmetric parts are aircraft engine
ducts, pressure vessels, fuselages, blades and struts.
Table 10. Summary of Composites Fabrication Processes - Part II.
[After Refs. 37,38, 39].
The literature survey summarized in Tables 9 and 10 study provided input to QFD
Matrix 3 regarding the selection of suitable composite manufacturing options for the key
parts characteristics. Tables 9 and 10 suggest that autoclave curing and filament winding
are probable choices for HALE UAV wing, fuselage and empennage parts as these
composite manufacturing methods are able to accommodate large parts and are also
established methods in current aircraft manufacturing industry [Refs. 36 and 39]. The
RAND report [Ref. 33] on Advanced Airframe Structural Materials also has a good
47

discussion on composites manufacturing requirements, cost and suitability to varying
design forms which are summarized in Tables 1 1 and 12.
Table 1 1 provides an overview of composite manufacturing process temperature
and pressure control requirements. Also included are rough estimates of tooling,
production and material costs. Each process is applicable to a limited number of
materials, and the requirements of each material are in terms of temperatures and pressure
controls. Table 1 1 provides input to QFD Matrix 3 on the tooling and production costs
for all the composite manufacturing processes studied for the HALE UAV.
Process Materials
Close
Pressure
Control
Close
Temperature
Control Post Cure
Tooling
Costs
Production
Cost
Material
Cost
Autoclave
curing
Glass, Kevlar, graphite
fabric; thermosets,
thermoplastics
Yes Yes May be
required with
thermosets
High High Low to high;
depends upon
fiber/resin choices
Elastic
reservoir
molding lEKM)
Glass, Kevlar,
graphite fabric,
foams, epoxy resins
Yes Yes May be
required
Low Low
Thermoforining
thermoplastic:)
Glass, Kevlar,
graphite fabric;
thermoplastics
Yes Yes No Low lxiw
Injection
molding
Glass, graphite,
chopped fibers;
thermoplastics,
thermosets
Yes Yes No Depends
upon part
complexity
Low
Hot
stamping
Glass, graphite,
Kevlar fibers;
thermoplastics,Nthermosets
Yes Yes No Moderate Low
Kapid cure
thermosets
Glass, graphite,
Kevlar fibers;
thermosets
Yes Yes No
Pultrusion Glass, graphite,
Kevlar fibers;
thermoplastics
No Yes No Low Low
Filament
winding
Glass, graphite,
Kevlar fibers;
historically with
thermosets;
thermoplastics
developing
No No Some
applications
Low Low
Table 11. Process Manufacturing Requirements and Costs. [From Ref. 33].
48

The form and size of the part to be manufactured will put additional constraints on
the applicable fabrication technique employed. Table 12 shows the suitability of certain
manufacturing techniques to various typical aircraft parts forms. For example, medium
to large parts such as wing and stabilizer skins, fuselage skins and doors can be fabricated
using autoclave curing, elastic reservoir molding, thermoforming (thermoplastics), hot
stamping or rapid cure (thermosets). Table 12 is a useful chart to suggest that autoclave
curing and filament winding are good probable manufacturing choices for HALE UAV
large integral structures, e.g., wing, fuselage and empennage.
Process
Form of Manufactured Component
Large
Integral
Structure*
lisMed/Large
Plain
Panelsc
Closed
Sections
OpenSections*
Detailed
Partsf
Autoclave
coring
Yes Yes Yes Yes Yes Yes
Elastic
reservoir
molding
(ERM)
No No Yes No Yes Possible
Thermo-
forming
thermo-
plastics
No No Yes No Yes No
Injection
molding
No No No Yes Yes Yes
Hot
stamping
No No Yes No Yes Simple
Brackets
Rapid cure
thermosets
No No Yes Yes Yes Simple
Brackets
Pultrusion No No No No Yes No
Filament
winding
Yes Yes No Yes No No
SOURCE: Mahon, personal communication, July 1989.
Includes fuselage skins with stiffeners, wing skins with stiffeners, and bulkheads.
Includes leading edges and fairings,
includes wing skins, stabilizer skins, fuselage skins, and doors.
Includes closed hat section 3tiffeners, ducts, and piping.
Includes stiffeners ("L" shaped and "Z" shaped), beams, ribs, and frames.
Includes fittings and brackets.
Table 12. Suitability of Manufacturing Processes to Varying Forms. [From Ref. 33].
49
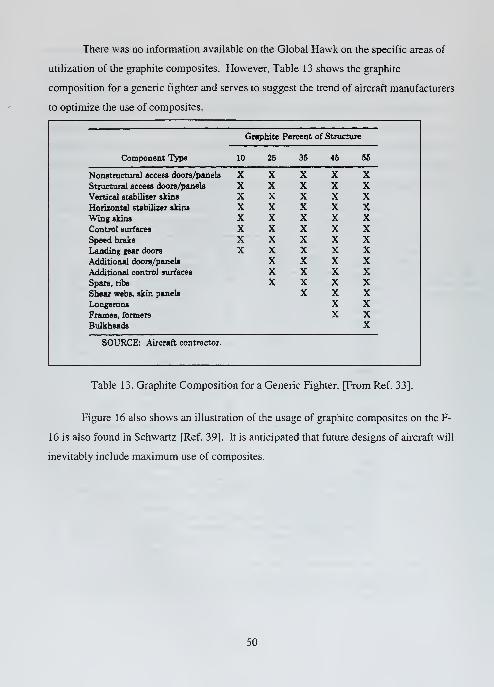
There was no information available on the Global Hawk on the specific areas of
utilization of the graphite composites. However, Table 13 shows the graphite
composition for a generic fighter and serves to suggest the trend of aircraft manufacturers
to optimize the use of composites.
Component Type
Graphite Percent of Structure
10 25 35 45 55
Nonstructural access doors/panels X X X X XStructural access doors/panels X X X X XVertical stabilizer skins X X X X XHorizontal stabilizer skins X X X X XWing skins X X X X XControl surfaces X X X X XSpeed brake X X X X XLanding gear doors X X X X XAdditional doors/panels X X X XAdditional control surfaces X X X XSpars, ribs X X X XShear webs, skin panels X X XLongerons X XFrames, formers X XBulkheads X
SOURCE: Aircraft contractor.
Table 13. Graphite Composition for a Generic Fighter. [From Ref. 33].
Figure 16 also shows an illustration of the usage of graphite composites on the F-
16 is also found in Schwartz [Ref. 39]. It is anticipated that future designs of aircraft wil
inevitably include maximum use of composites.
50

D.
Figure 16. Utilization of Graphite-Epoxy in F-16. [From Ref. 39].
ALUMINIUM ALLOY FABRICATION
The most commonly used material in aircraft structures is aluminum alloys.
Aluminum has an excellent strength-to-weight ratio, is easily formed, of moderate cost
and resistant to chemical corrosion [Ref. 34]. For high-strength applications, the 7075
alloy is widely used. 7075 is alloyed with zinc, magnesium and copper. However it is
interesting to note that 7075 is being replaced by the higher stress corrosion resistant
7049 and 7075 alloys in the Lockheed C-5A and C-5B. Since corrosion resistance is
lessened by alloying, aluminum sheet is frequently clad with a thin layer of pure
aluminum. [Ref. 34].
Bralla [Ref. 35] provides a good description of aluminum design methods for
manufacturability. Structural shapes may be made by the extrusion process. Extrusion is
a process whereby the material is forced through a die. Extruded parts may be round,
rectangular or z-cross sections although other shapes can be drawn. Proper design and
selection of die materials and lubricants are essential to obtaining a product with good
quality and surface finish. Further finishing work will probably be required to achieve a
good aircraft surface finish.
51

Forging is the process whereby the work-piece is shaped by compressive forces
applied through various dies and tools. Forged parts have good strength and toughness,
and are good for highly stressed and critical application, e.g., aircraft landing gear. The
trend today is precision forging whereby the finished product is known as near net-
shaped or net-shaped forging. Special dies allow greater accuracy in manufacturing and
aluminum is a suitable material as it allows lower forging loads and lower temperature.
[Ref. 35].
Milling is a process which a multi-tooth cutter rotates along various axes with
respect to the surface of the work-piece. Milling machines in the aircraft manufacturing
industry are usually computer numerical control (CNC) machines. These CNC machine
tools have the ability to produce complex shapes with good dimensional accuracy,
repeatability, reduced scrap cost, high production rates and product quality. Metal parts
can also be made by compacting metal powders in suitable dies and sintering them
(heating without melting). This process is called powder metallurgy (P/M). Powder
metallurgy has become competitive with processes such as casting, forging and
machining, particularly for relatively complex parts made of high strength and hard
alloys. [Ref. 35].
The forming methods, discussed above, for aircraft structures in terms of process
complexity, dimensional characteristics and tooling / production cost factors [Ref. 35] are
summarized below in Table 14. In the writer's opinion, Table 14 suggests that forging
and profile milling are probable methods for manufacturing large aircraft aluminum alloy
parts employed in the wing, fuselage and empennage. Extrusions are limited to shapes
(such as stringers) based on the die design, while powder metallurgy are limited to
generally smaller parts (less than 75 mm).
52

Type of Part Size and Complexity Dimensional
Characteristics
Cost Factors
Extrusions Constant cross-sections of any length to Tolerances for cross Tooling is low in cost, making the
about 7.5m are feasible. Cross section sectional dimensions range process advantageous for moderately
can be large enough to occupy a circle from i 0.25 to 2.5 mm inlow quantities or more. Economies are
of 250 mm diameter in aluminum or aluminum, depending on thegained when machining is avoided by
150 mm diameter in steel and can be nominal dimensions. the use of extended shapes.
very complex.
Forgings Closed-die forgings can be intricate, but Typical tolerances across the Tooling costs are moderate to high.
secondary machining is normally parting line run from 0.8 depending on the complexity of the
required. The normal upper size limit mm for small forgings of forging. Material loss is high because
is about 1 2 kg. Open-die forgings can easily forged material like of flash and secondary machining.
produce much larger parts (up to 5 aluminum. Labor costs are usually moderate.
tons), but shapes are limited and Forging is most economical for medium
secondary machining are required. and high production levels.
Precision forging offers close Precision forging requires high forces.
tolerances. Machining are often not intricate dies and tooling costs would
necessary and material utilization is be high.
very good.
Profile Milling is an effective means of Surface finishes as low as For numerically controlled mills.
Millingremoving large amounts of material and 5|i m in have been obtained especially the bed types, offer increased
an efficient method of producing highly by milling. The number of rigidity and are capable of production
precise contours and shapes. It is a parts to be produced before accuracy on a continuing-production
versatile process. Aircraft spars, ribs, cutter or insert replacement basis without frequent adjustment.
fittings may be machine milled for is a major factor controlling Tooling costing in such instances can
precision [Ref 36]. the surface finish. range from modest to quite high levels.
Powder Although size and weight are limited. High dimensional control. The P/M process is suitable for mediumMetallurgy
(P/M)the process is capable of producing Tolerances range from to high volume production and has
relatively complex parts economically. i 0.006 mm in small bores competitive advantages over casting.
in net shape form to close tolerances.
P/M parts are normally small (less than
to ±0.13 mm in larger
dimensions.
forging and machining. High
production rate on relatively complex
75 mm). parts. Tooling costs are high and labor
costs are low.
Table 14. Summary for Forming Methods for Aircraft Structures. [After Ref. 35].
53

E. TITANIUM AND ITS ALLOYS
For QFD Matrix 3, only composites and aluminum are considered. However, as
titanium is considered an important metal in the aerospace industry, it shall be briefly
covered here. Bralla [Ref. 35] provides a good discussion of titanium and its alloys.
Titanium is considered a light metal relative to steel. It possesses excellent corrosion
resistance property and a low thermal coefficient of expansion. Titanium is widely used
in the aerospace industry in propulsion components such as compressors and turbines.
F. IMPACT OF QFD MATRIX 3
The manufacturing literature survey by the writer provides data to complete QFD
Matrix 3. If the intended material utilization for the HALE UAV parts is largely
composite, it is critical to ensure that the designed mechanical properties of the composite
parts are achieved by ensuring a suitable and correctly placed fiber as well as matrix
selection considerations. The QFD deployment suggests that autoclave and filament
winding are the most probable composite manufacturing methods for HALE UAV large
integral and highly contoured parts. A detailed and separate study outside the scope of
this thesis, is recommended to decide whether or not, if over the production run, filament
winding is more cost-effective than autoclaving. As for the aluminum alloy components,
QFD Matrix 3 shows that milling and precision forging are possible manufacturing
methods that the design team should consider as good manufacturing options.
QFD Matrix 3 (see Figure 17) also suggests that manufacturing processes like
Elastic Reservoir Molding, thermo-molding, injection molding, hot stamping, rapid cure
thermosets and pultrusion have no relationships with the HALE UAV parts
characteristics. The reason is that these manufacturing methods are more suitable for
smaller parts (as discussed in Tables 9 through 12). It is also noted that there is no
relationship in the QFD Matrix 3 roof as each manufacturing process was considered to
be independent of other processes.
54
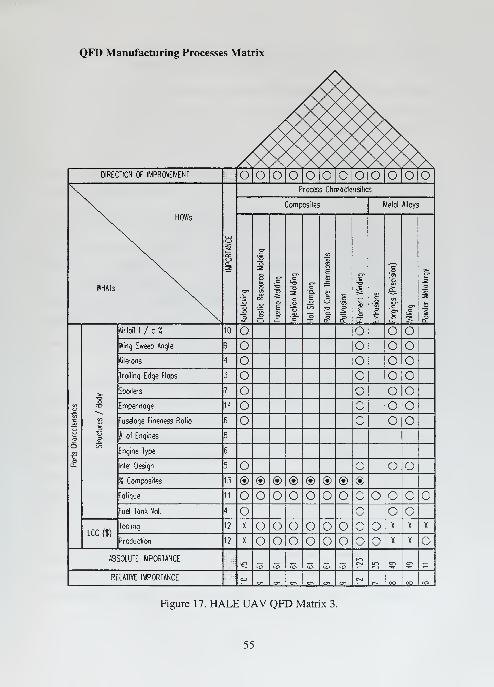
QFD Manufacturing Processes Matrix
DIRECTION OF IMPROVEMENT O O O O O
\^ HOWs
WHAls \^
Process Choroclerisitics
Composiles Melol Alloys
c
I
5
<3".<z0
ce
,0
.if
:§
1J
<7»
1
8
|
c?
.0
1
,sfTO
i
£
.0 c
El
C7*
1
.0
i
6
D-
CD
CI)
AfrfoiT 1 / C % 10
Wing Sweep Angle 9
Ailerons A
Troiling Edge Flops 3
Spoilers 7
Empennoge 14
Fuseloqe Fineness Rolio 6
I of Engines 6
Engine Type 6
Inlel Design 5
% Composiles 13 ® ® ® ® ® ® ® ®Foligue 11 O OFuel Tonk Vol. A
LCC {$}
Tooling 1? X O X X X
Produdion 12 X O X X
ABS0LU1E IMPORTANCEu^,
to CO 5 to <0 to £ <y> Oi:
-
RELATIVE IMPORTANCE CZ>CT> en CT> 0-. <^ c^
C-J ^ OO 00 co
Figure 17. HALE UAV QFD Matrix 3.
55

This page is intentionally left blank.
56

VI. QFD MATRIX 4: DEPLOYING PROCESS CHARACTERISTICS TOMANUFACTURING OPERATIONS CONTROLS
QFD Matrix 3 suggested that the probable manufacturing processes to meeting
the HALE UAV parts characteristics were autoclave molding and filament winding for
composite parts, while milling or precision forging are potential methods for aluminum
parts. The objective of this QFD phase, i.e. QFD Matrix 4, is to deploy the
manufacturing methods for composites and aluminum to determine the manufacturing
operations controls for the HALE UAV production.
A. CONTROLS IN COMPOSITE FABRICATION
The mechanical properties of composite materials are dominated by the fibers.
Fibers are able to withstand greater stresses than metals because of the fiber and matrix
interaction thus resulting in the redistribution of stresses. This higher strength in turn
depends on the effectiveness of the bonding between the fibers and the matrix. Thus, it is
important to place great emphasis on the manufacturing controls to ensure the desired
bonding is achieved. To this end, two key composite processes will be discussed.
Autoclave molding is a combination of a vacuum-bag and pressure-bag molding.
The lay-up (component materials of a laminate) is bagged and evacuated in the vacuum-
bag process to remove trapped air or other volatiles. While under vacuum, it is exposed
to heat and high pressure in an autoclave to produce the most dense parts. The vacuum
and autoclave pressure cycles are adjusted to permit maximum removal of air without
incurring excessive resin material flow. Curing pressures are normally in a range of 50 to
100 psi. [Ref.39].
A typical autoclave consists of a large cylindrical metal pressure vessel
pressurized with air and/or carbon dioxide, thermally insulated, steam-heated with forced
circulating hot air, and a large circular door at the end of the autoclave vessel [Ref. 39].
A typical autoclave system is shown in Figure 18. Schwartz [Ref. 39] discusses the
57

minimum requirements for a typical autoclave system. The curing controls critical to the
quality of the part are temperature control, air circulation to maintain specific curing
temperature of ± 15 °F (8.3 °C ), high capacity pressurization (usually does not exceed
100 psi) and a vacuum control. The literature survey [Refs. 37, 38 and 39] by the writer
on composites manufacturing did not indicate which of the controls are more important.
wft. 3....'•• - r*j&-
:# .iii&&AM iriiU'MHiHf',-4M™TIm. m .
/' \1bLdjj^^. . .
W'\ ' i> rM'.j
'-—•'-. ^...•w
m^mmzFigure 18. A Typical Autoclave System. [From Ref. 39].
Filament winding is a simple and effective method for producing bodies of
revolution in a wide range of sizes. Part diameters ranging from 1 in. (23 mm) to 20 ft. (6
m) are common. The process consists of wrapping bands of continuous fiber or roving
over a mandrel in a single machined-controlled operation. At present, wet winding is the
most common method for reasons of low cost. Producers equipped with resin
formulating facilities have the flexibility of resin formulation to meet specific
requirements for different parts [Ref. 39]. In wet winding, the tension of the roving must
be adjusted as the diameter of the part increases for accurate control of the
resin/reinforcement ratio. Viscosity and pot life of the catalyzed system are also
important processing considerations. The pot life is the length of time a catalyzed resin
system retains a viscosity low enough to be used in processing. A catalyst is a substance
which changes the rate of a chemical reaction without itself undergoing permanent
58

change in its composition. A low viscosity of the resin is required for complete wet-out of
the strands and for removal of trapped air. A pot life of at least several hours is required,
since it is not generally advisable to wind over-gelled or partially gelled resin. Gel time
and flow behavior are also important factors. In some cases, there is also a limit on
temperatures, as lining materials deteriorate above this particular temperature. A typical
filament winding process is shown in Figure 19.
Figure 19. A Typical Filament Winding Process. [From Ref. 39].
B. INSPECTION OF COMPOSITE DEFECTS
Many defect types can affect the quality of a composite structure and no single
nondestructive test can find and isolate all of them [Ref. 33]. Common defects include
delaminations, foreign matter (inclusions), high porosity, honeycomb core damage,
moisture, fiber breaks and matrix cracks. These defects may be the result of inadequate
manufacturing controls or poor workmanship. The RAND report [Ref. 33] summarized
the sensitivity of Non-Destructive Inspection (NDI) methods to different flaw types.
59

Each NDI method has its limitations. Table 15 describes the sensitivity of some
NDI methods to different flaw types. There are three levels of categorization of
sensitivity, i.e. VG, G and L as explained in the legend of Table 15.
NDI Method
X-ray Neutron ThermalUltrasonic Radiog- Radiog- Infra- Tap Eddy
Flaw Type Transmission* raphy raphy Laser red Test Acoustic Current Visual
Porosity VG/G VG L _ _ _ G _ _Foreign material VG/G G L - L — — — —Delamination VG — — - G — L _ —Matrix cracks L G — — — — G/L _ —Fiber breaks — VG — — — — G G —Impact damage G/L — — G G G L - LSkin/skin disbond VG/G G G VG VG VG — — —Skin/core disbond VG/G L L VG VG G G _ _Core damage VG VG — G G — — — —Water intrusion L G VG L L - G - -SOURCE: Meade 1988.
"Ultrasonic transmission includes four types of tests: through transmission. pulse echo. angle, and reao-
nance.
Acoustic includes two types of tests: emission and ultrasonic.
— not applicable.
VG: Good sensitivity and reliability; good candidate for primary method.
G: Less reliability or limited applicability; may be good backup method.
L: Limited applicability; may provide some useful information.
Table 15. Sensitivity of NDI Methods to Different Flaw Types. [From Ref. 33].
The inspection of composite defects can be complicated as there may be several
types of defects present in the manufactured part. To add to the complication, each NDI
technique is not sensitive, or has limited sensitivity to each type of flaw. Thus,
depending on the criticality of the aircraft part, more than one NDI technique is needed.
Table 15 shows that Ultrasonic NDI is sensitive to nine out of ten flaws listed.
C. MANUFACTURING CONTROLS IN ALUMINIUM PARTFABRICATION
Positioning accuracy in NC machines is defined with respect to how close the
machine can be positioned to a certain coordinate system. An NC machine usually has a
positioning accuracy of at least ± 3 u,m (0.0001 in.) [Ref. 35]. Hence, the importance of
repeatability, which is defined as the closeness of agreement of repeated position
60

movements under the same operating conditions of the machine. Repeatability is about
± 8 pn (0.0003 in.). Another control factor is resolution, defined as the smallest
increment of motion of the machine components. This is about 2.5 |o,m. The factors for
maintaining these accuracies are ensuring that a sufficiently high stiffness of the milling
machine tool and that the backlash of the gear drives are eliminated. Also, rapid response
to command signals that incur friction and inertia must be minimized.
In precision forging, special dies allow parts to be machined to greater accuracies.
The process requires higher capacity equipment because of the greater compressive
forces required to achieve the accuracies and details of the design. Aluminum, in
particular, is suitable for precision forging employment due to lower compressive forces
and temperature requirements to forge the material. Consequently, the wear on the
forging die is minimal and product surface finish is good. Precision forging requires
special dies, precise control of material volume and shape, and proper positioning of the
part in the die cavity [Ref. 37].
D. SUMMARY OF PROCESSES CONTROLS
The process controls leading to the desired manufacturing outcomes are shown in
Table 16.
Process Manufacturing Controls Desired Results
Composites
Autoclave 1 . Temperature control
2. Air circulation
3. Pressurization
4. Vacuum control
Designed Bonding Strength and
consequent mechanical properties.
Filament Winding 1. Tension of roving
2. System Viscosity
3. System Pot life
Designed Bonding Strength and
consequent mechanical properties.
AluminumMilling 1. Machine tool stiffness
2. No backlash of gear drives
3. Minimized friction and inertia in tool response
Repeatability in tool movements
and high resolution in tool
incremental movement.
Precision Forging 1 . Design of special dies
2. Control of material volume and shape
3. Positioning of part in the die cavity
Near-net shape product
Table 16. Summary of Key Manufacturing Controls. [After Refs. 37, 38, 39].
61

E. IMPACT OF QFD MATRIX 4
QFD Matrix 4 (see Figure 20) suggests the critical manufacturing operation
control parameters that are important in order to achieve the desired quality of the aircraft
parts. The manufacturing QFD phase forces the design team to ensure that the design
considerations towards meeting the customer requirements are achievable and practical in
the manufacturing environment.
Based on the writer's literature survey, it appears that the filament winding
method may be more cost effective compared with the autoclave method for the
manufacturing of the HALE UAV wing, fuselage and empennage. Of course, the cost
comparison has to be validated in actual trade studies. Thus, in the QFD Matrix 4
"Importance" column, the filament winding is prioritized higher than the autoclave. As
for aluminum alloy fabrication, based on the writer's observation on an Naval
Postgraduate School field trip [Ref. 36], it appears that milling is preferred in the industry
and therefore prioritized higher than forging in the QFD Matrix 4. Also, in the writer's
opinion, NDI is absolutely critical as a quality assurance check and especially so for the
composites parts. Further study is needed to determine if ultrasonic NDI methods are
sufficient or is there a need to further complement with other NDI methods.
The outcome of QFD Matrix 4 is the recognition that the important manufacturing
parameters, e.g. temperature and vacuum control in the autoclave method are carefully
planned for, controlled and achieved in order to ultimately achieve the requirements of
the customer attributes. The roof analysis also suggests a potential trade study area for
critical control in the autoclave method. The pressurization and the vacuum control
aspects of autoclaving require conflicting controls. These parameters should be evaluated
and controlled critically during the curing process. The "Absolute Importance" row of
QFD Matrix 4 suggests that process control parameters such as NDI, roving tension and
viscosity be accorded higher priorities that other parameters.
62
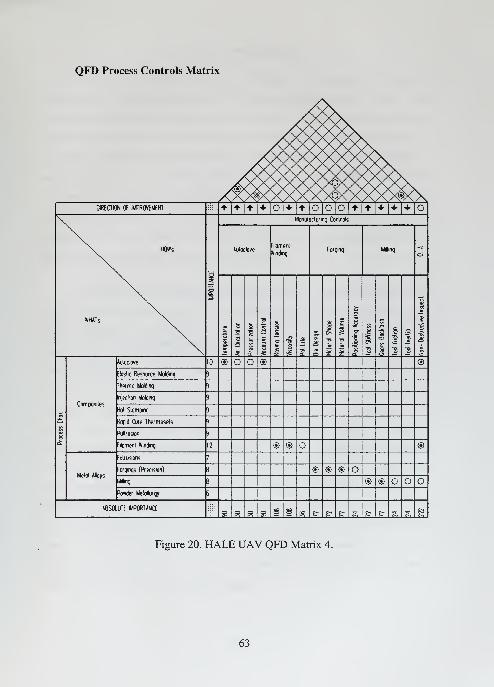
QFD Process Controls Matrix
XX /#\DIREa ION OF IMPROVEMENT 't>|'t-|+|*|0|4'|+|0|0|0|'f|'t|+|+|+|0
\. HONs
WHATs N.
Monulodurmq Controls
Aulodove
: iloment
WindingForqmq Milling
|
1
5
J
s.
"5
S
E
§
1T
fc
5 9?
I
s
I
1 ?
s
i 1
1
i
Composites
Autocide 10 © © ©: loslic Resource Moldmq >
Thermo Moldmq }
njeclion Moldmq }
-lol Slompmq J
?ODid Cure Thermosels }
3ullrusion }
:
ilomenl MVinrJmq 12 © ® o ©
Melol Alloys
: fusions 7
: orqmqs (Precision) I © ® ©Milhnq i © © o3o«der Metallurgy 5
ABSOLUTE IMPORTANCE oR R o S s «o a
Figure 20. HALE UAV QFD Matrix 4.
63

This page is intentionally left blank.
64

VII. CONCLUSIONS
The Four-Level QFD model discussed herein, i.e., performance parameters, part
characteristics, manufacturing processes and process controls have been applied to the
conceptual configuration development of a HALE UAV. The customer attributes are
typically drawn from a Request-for-Proposal and translated into UAV performance
parameters. The performance parameters are prioritized and design areas for trade
studies are identified. The UAV part deployment phase identified the important part
characteristics which were evaluated to best meet the performance parameters. Then
probable manufacturing processes are selected for the fabrication of composite and
aluminum UAV parts. Finally, the probable manufacturing processes are analyzed to
identify process controls to ensure a quality product.
The strength of the four-level QFD analysis is that it requires the design team
adopt a system integration approach at the earliest stage in conceptualizing the aircraft
design configuration to determine which design criteria are important in meeting the
customer voice or attributes. The customer voice has to be clearly understood and
translated to measurable UAV system performance parameters. Design conflicts are
identified early for in-depth trade-off studies. Negative values in the QFD matrices
highlight the opportunities for break-through design approaches. For example, the
weight of the UAV has a high negative value as it has an adverse impact on the many
customer attributes, e.g., endurance and range. QFD Matrix 1 shows that to reduce the
overall UAV weight, the design team has to look at the wing, fuselage and empennage
design parameters in terms of increasing airfoil thickness, maximum utilization of
composites, fuel tank capacity, minimal wing sweep, etc. In addition, the design team
has to also consider the feasibility of their design in terms of cost, manufacturability and
process controls in ensuring that the HALE UAV performance parameters are achieved.
In essence, applying the four-level QFD model permits a total and integrated approach to
product, process and quality assurance design.
65

In essence, the four-level QFD model presented herein shows that to achieve the
customer attributes of maximum endurance, range, cruise altitude and payload, the
important performance parameters are low gross weight, low CD0 , high CL and a low
life cycle cost. The part characteristics QFD matrix suggest a need to maximize
utilization of composites, thick airfoil, high wing fatigue strength and low wing sweep.
To achieve the part characteristics, the manufacturing methods considered were
autoclave curing, filament winding, milling and precision forging. Figure 21 is an
attempt to summarize the 'big picture", utilizing QFD methodology to provide a means
to a powerful, systematic and structured approach to the design and development of a
HALE UAV.
CUSTOMER ATTRIBUTES
•Endurance
•Range
•Cruse Altitude
•Payload
QFD: HALE UAV CONCEPTUAL DESIGN
PERFORMANCE PARAMETERS
•Low Gross Wei ght
•LowZero-LiftDrag
Mb LiftCoeff.
•LowLCC PART CHARACTERISTICS
•Max Composites
•Thick Airfoil
High Fatigue Strength
•Low Wing Sw<
%0j&p&**mim
MANUFACTURING•Autoclave Curing
•Filament Winding
•Milling
PROCESS CONTROLS
•NDI (Quality Assurance)
•Autoclave (Temp. Air Circulation, Pressure, V acuum Controls)
•Filament Winding (Roving Tension, Viscoatjr. Pot Life)
Milling (Tool Stiffness, Gears Backlash. Tool Friction and Inertia)
•Forgmg (Die Design. Material V olume/Shape, Positioning Accuracy)
Figure 21. Areas of Emphasis in HALE UAV Design.
66

VIII. RECOMMENDATIONS
A. INTEGRATED TEAM APPROACH
This thesis effort is based on the writer's research and guidance from faculty
members. It is believed that an integrated team approach will certainly allow a thorough
coverage of every UAV design aspect, i.e., avionics, weights, structures, stability and
controls, propulsion and intake design, life cycle costing, maintainability and so on. It is
recommended that this research effort be used as an introduction to QFD in the Systems
Engineering course in Aeronautical Engineering Department, and be used as a powerful
and integrative approach in the capstone aircraft design class.
B. VALIDATE MANUFACTURING AND PROCESS CONTROLS QFDMATRIX
The QFD Matrix 3 and 4 are largely based on existing text book literature,
discussions with thesis advisors and observations on a field trip [Ref. 36]. As a result, the
writer also faced difficulties when attempting to validate the QFD design guide template
in the areas of manufacturing with the industry. Future research effort may be to work
with aviation manufacturing industries to validate and improve Matrices 3 and 4.
67

This page is left intentionally left blank.
68

APPENDIX A: MATLAB PROGRAM FOR CDO ESTIMATION
The MATLAB code in Appendix A is to estimate the CD0 of the HALE UAV.
The equations are drawn from the USAF DATCOM shown in the AA 2036 course notes,
Aeronautical Curriculum 610.
% CDO UAV Configuration Analysis% Saved as Thesis /CD0_uav.m% Major Rendell Tan - Thesisclcclear
% Parameters
% CDO of Main Wingtc = .16; % thickness ratio of wingV = 683.5; % freestream velocity (ft/s)nu = 5.056e-4; % viscosity (ft /v 2/s)ct = 2.25; % tip chord (ft)
cr = 8.4; % root chord (ft)
lambda = ct/cr; % taper ratioc = 2/3*cr* (l +lambda+lambda /v
2) / (1 + lambda) ; % mean aerodyn chordRe = V*c/nu; % Reynolds NumberCf = .455* (loglO (Re) ) "-2 .58; % Ave. Turbulent Skin Friction CoeffCDOmainwing = 2*Cf * ( l+2*tc+100*tc"4) , % CDO of Wing. Eqn 4.1.5.1a
% Wing Planform Area (given from Teledyne Ryan)Sfpw = 540; % wing area (ft A
2)
% CDO of FuselageLb = 44.4; % length of fuselage (ft)
dmax = 9.12; % max diameter of fuselage (ft)
dbase = 2;% base diameter (ft)
Re = V*Lb/nu; % Reynolds NumberCf = .455* (loglO(Re) ) "-2.58;% Ave. Turbulent Skin Friction CoeffFR = Lb/dmax; % fineness ratiodisp (' fineness ratio: '); % display fineness ratiodisp (FR)
;
SwSb = input ( 'Sw/Sb: '); % Look up chart Fig. 2.3.3 USAF S&C DatComSb = pi* (dmax/2) "2; % frontal area of fuselage (ft A
2)
CDOskinf = 1 . 02*Cf * ( 1+ (1 . 5/ (Lb/dmax) "1 . 5) + (7/ (Lb/dmax) "3 )) *SwSb; % CDO
Skin Friction eqn 4.2.3.1bCDObase = . 029* (dbase/dmax) "3/sqrt (CDOskinf ); % base pressure CDO eqn4.2.3.1bCDOfuselage = (CDOskinf+CD0base) * (Sb/Sfpw) , % CDO of Fuselage
% CDO of Isolated Horizontal Tail
69

Crh = 4.8; % hor. tail root chord (ft)
Cth = 2.4; % hor. tail tip chord (ft)
toch = 0.16; % hor. tail thickness ratioBh2 = 7.2; % hor. tail half spanlambdah = Cth/Crh; % hor. tail taper ratiocbh = (2/3) *Crh*( ( l+lambdah+lambdah" 2 ) / (1+lambdah) ) ; % c bar - hor.tail mean aerodyn chord (ft)
Re = V*cbh/nu; % Reynolds NumberCbfh = 0.455* (loglO (Re)
)
A (-2.58) ; % hor. tail ave . turbulent skinfriction coeff.CDOh = 2*Cbfh* ( 1+ (2*toch) + (100*toch"4) ) ; % CDO of hor. tail area priorto% Multiplication of Hor. Tail Wing Area Ratio eqn . 4.3.3.1a
% Horizontal Tail Planform Area (given)
Sfpht = 42.8; % hor. tail area (ft A2)
% Therefore;CDOhortail = CDOh*Sfpht/Sfpw, % CDO of Horizontal Tail
% Summing Up the Total Aircraft Configuration CDOTotal_Config_CD0 = CDOmainwing + CDOfuselage + CDOhortail, % Total CDO
% Results Printed Below:CDOmainwing = 0.0086
fineness ratio: 4.8684
Sw/Sb: 19.5
CDOfuselage = 0.0068
CDOhortail = 7.3779e-004
Total_Conf ig_CD0 = 0.0161
70

APPENDIX B: MATLAB PROGRAM FOR CONSTRAINT DIAGRAM.
% High Altitude Long Endurance UAV Constraint Analysis% MAJ Rendell Tan - Thesis% Saved as qfd_constraint_2 .m
clear all
% Constants% Maximum Thrust to Weight for ChartsTtoWMax = 0.6;
% Initial EstimatesCDOl = 0.0161; % Coeff of Drag at Zero LiftAR1 = 25; % Aspect RatioCL1 = 1.60; % Max Coeff. of Lifte = 0.9; % Oswald Eff. FactorKl = l/(pi*e*ARl) ; % K ratio
% Wing Loading Range from to 100nPts = 150;WtoS = [0:l:nPts]
;
% Mission #1 Take Off Ground Roll
TakeOff 1 = zeros (nPts)
;
for WtS = lrnPtsTakeOffl(WtS) = ( . 00424*WtS) /CL1
;
end
figureholdplot (TakeOff 1)
holdaxis( [0,nPts,0, TtoWMax]
)
title ('Take Off Ground Roll')xlabeK 'Wto/S ~ Wing Loading (takeoff) ~ lbf/ft A 2')
ylabel ( 'Tsl/Wto ~ Thrust (sea level) to Weight (takeoff) Ratio')
% Mission #2 Constant Altitude / Speed Cruise% Mission #3 Constant Speed Climb (same equation)
Cascl = zeros (nPts);for WtS = lrnPts
Cascl(WtS) = (0.283*Kl*WtS) /AR1 + (354 . 94*CD01) /WtS;end
figureholdplot (Cascl)hold
71

axis( [0,nPts, 0,TtoWMax]
)
title( 'Const Altitide Speed Cruise')xlabel ( 'Wto/S - Wing Loading (takeoff) ~ lbf/ft"2')ylabel ( 'Tsl/Wto ~ Thrust (sea level) to Weight (takeoff) Ratio')%* ************************************
% Mission #4 Sustained Turn, n = 3 g's
figureWtoS = [0:l:nPts]
;
SusTurnl = zeros (nPts)
;
for WtS = l:nPtsSusTurnl (WtS) = ( . 543*Kl*WtS) /AR1 + ( 554 . 72*CD01 ) /WtS;
end
holdplot (SusTurnl)holdaxis ( [0,nPts, 0,TtoWMax]
)
title ( 'Sustained Turn')xlabel ( 'Wto/S - Wing Loading (takeoff) - lbf/ft"2')ylabel ( 'Tsl/Wto ~ Thrust (sea level) to Weight (takeoff) Ratio')
% Mission #5 Maximum Speed
figureWtoS = [0:l:nPts]
;
MaxVl = zeros (nPts);for WtS = l:nPts
MaxVl(WtS) = (18491*K1*CD01) /WtS;end
holdplot(MaxVl)holdaxis ( [0,nPts, 0,TtoWMax]
)
title ( 'Maximum Speed')xlabel ( 'Wto/S ~ Wing Loading (takeoff) ~ lbf/ft A 2')
ylabel ( 'Tsl/Wto ~ Thrust (sea level) to Weight (takeoff) Ratio')
% Mission #6 Acceleration
figureWtoS = [0:l:nPts]
;
Accell = zeros(nPts);for WtS = l:nPts
Accell(WtS) = (0.27*Kl*WtS) + (355*CD01 ) /WtS + .035,
end
72
holdplot (Accell)holdaxis( [0,nPts, 0,TtoWMax]
)
title ( 'Acceleration'
)
xlabeK 'Wto/S ~ Wing Loading (takeoff) - lbf/ft"2')ylabel ( 'Tsl/Wto ~ Thrust (sea level) to Weight (takeoff) Ratio')
% Mission 7 Service Ceiling at 65,000 ft
figureWtoS = [0:l:nPts]
;
Ceilingl = zeros (nPts)
;
for WtS = l:nPtsCeilingl (WtS) = ( . 187*Kl"2*WtS) + 4.302/WtS ;
end
holdplot (Ceilingl)holdaxis ( [ , nPts , , TtoWMax]
)
title (' Service Ceiling')xlabeK 'Wto/S - Wing Loading (takeoff) ~ lbf/ft"2')ylabel ( 'Tsl/Wto ~ Thrust (sea level) to Weight (takeoff) Ratio')
% Mission 8 Instantaneous Turn at 30k ft @ 6g's
figureInsTurnWtoS = 171.4;plot ( [InsTurnWtoS InsTurnWtoS] , [0 TtoWMax])axis ( [20,nPts, 0, TtoWMax]
)
title (' Instantaneous Turn Rate Performance')xlabeK 'Wto/S - Wing Loading (takeoff) - lbf/ft A 2')
ylabel ( 'Tsl/Wto ~ Thrust (sea level) to Weight (takeoff) Ratio')
% Mission 9 Landing
figureWtoS = [0:l:nPts]
;
Landingl = zeros (nPts);for WtS = lmPts
Landingl (WtS) = 0. 00083 *WtS;end
holdplot (Landingl)holdaxis( [0,nPts, 0, TtoWMax]
)
title ( 'Landing'
)
73

xlabeK 'Wto/S ~ Wing Loading (takeoff) - lbf/ft~2')ylabel ( 'Tsl/Wto ~ Thrust (sea level) to Weight (takeoff) Ratio')
% Constraint Analysis Plotsfigureholdplot (TakeOff 1, 'r'
)
text(nPts, TakeOffl(nPts) , 'Take Off)plot (Cascl, 'k'
)
text(nPts, Cascl (nPts), 'Cruise')plot ( SusTurnl ,
'
c'
)
text(nPts, SusTurnl (nPts) , 'Sus-Turn')plot (MaxVl, 'g'
)
text(nPts, MaxVl(nPts), 'Max Spd')plot (Accell, 'm'
)
text(nPts, Accell (nPts) , 'Accel')plot (Ceilingl, 'b')
text(nPts, Ceilingl (nPts) , ' Svc Ceiling')plot ( [InsTurnWtoS InsTurnWtoS] , [0 TtoWMax] , 'b'
)
text (ceil (InsTurnWtoS) , TtoWMax- . 2 , 'Inst Turn')plot (Landingl, 'r')
text(nPts, Landingl (nPts) , 'Ldg')
holdaxis( [10,nPts, 0, TtoWMax]
)
gridtitle('UAV Constraint Diagram')xlabel ( 'Wto/S - Wing Loading (takeoff) ~ lbf/ft~2')ylabel ( 'Tsl/Wto ~ Thrust (sea level) to Weight (takeoff) Ratio')
74

APPENDIX C: ROUGH ORDER OF MAGNITUDE (ROM) ANALYSIS
The aircraft performance equations below are taken from Anderson [Ref. 26] and
Hale [Ref. 27] and used in the evaluation ofROM analyses and in QFD Matrix 1. These
equations are used with the performance data shown in Chapter III of this thesis. The
results are then shown in Table 2 which shows the ROM impact on the HALE UAV
customer attributes by each performance parameter. Three sample calculations of the
ROM using the Endurance, Range and Cruise Altitude equation is shown after the
following equations.
- - c 2
mARW
K LID
(*/C)„« 600(T/WY(W/S)
= 600W 2SC r
R = 2V2"
IpJC, c
1 C,1 ' 2 m i/2
25w,(Wo -W" 2
) OR R= f~(W/b)cr (5CD>0 )
3
1 CMn^ O.SS6(WfIW)
c, c, w,
eAR
h^ceilmg
= 30500 In 0.866(77W)eAR
1.44W
8P~SCL^{T-[D + fir (W-L)l
20(W/S)
cr(T/W)CLm
W 2 WIS
gn P-Cu
2(W/S)OR ft> = 100
eAR(T/W)
(W/S)
75

v___ =
4CD ,
P-Cn20
(T/W)(W/S)
ENDURANCE
The Endurance relationship with regards to the performance parameters order of
magnitude sample analysis is shown.
From Anderson [Ref. 26], we have, for maximum endurance:
E =-U^ ,W 1 ^ 01 x, 25,600 A„ A1_In—2-= (33.3l)ln
—
= 47.4 hoursCACD \ W
x0.6 10,900
Take the impact of fuel consumption of 0.6 lb fuel / lb thrust (see Chapter III,
paragraph B-12);
J_=l/0.6=1.67;
Take the impact ofC ^
' c ^
= 33.31 (see Chapter III, paragraph B-8);
\ ~ u J max
Take the impact of aircraft gross weight;
WIn —2-= 25,600 / 10,900 =0.55
; (see Chapter III, paragraph B-2);W,
The writer mentioned earlier that the known information about Global Hawk is
used as a baseline reference in developing the HALE UAV design template discussed
herein. It is noted that the HALE UAV endurance shown above is in broad agreement to
the Global Hawk's endurance of 40 hours.
76

2. RANGE
The Range relationship with regards to the performance parameters order of
magnitude sample analysis is shown.
From Hale [Ref.27], we have
25w, 1
1/2
e
_(W/b)a_ _(scD , )\
Take the impact of CD0 (see Chapter III, paragraph B-12);
k£d,oj
,
\l/4
22.12(0.0161)
3
Take the impact of Wing Loading (W/S) from the rearranged Range equation
suggested by Hale [Ref. 27] to:
25i
1/2
eAR
.(Co.o)3
.
w- 40'n = 6.32
Take the impact of AR = 25 (see Chapter III, paragraph B-5);
251/4 = 2.24
Take the impact of aircraft gross weight of 25,600 lbs (see Chapter III, paragraph
B-2);
Vw V256006.25x10"
77

3 CRUISE ALTITUDE
The Cruise Altitude relationship with regards to the performance parameters order
of magnitude sample analysis is shown.
From Hale [Ref.27], we have
**.«** = 30500 In O.S66(T/W)eAR
Take the impact of T/W (see Chapter III, paragraph E);
T/W = 0. 33
Take the impact of AR = 25 (see Chapter III, paragraph B-5);
VA^ = V25 = 5
Take the impact of CD0 = 0.0161 (see Chapter III, paragraph B-7);
r . \ l/2
Take the impact of aircraft gross weight of 25,600 lbs (see Chapter III, paragraph
B-2);
W 25,6003.9xl0"5
78

APPENDIX D: MATLAB PROGRAM (VARIATIONS OF ACCELERATION)
This MATLAB code in Appendix D is to explore the impact of AR and CD on
the acceleration performance curve in the constraint diagram.
% Acceleration Analysis% Maj Rendell Tan - Thesisclear all
% Constants% Maximum Thrust to Weight for ChartsTtoWMax = . 5
;
% Create Test Values for CDOCD01 = 0.0161;CD02 = 0.01288;
% Create Test Values for ARAR1 = 25;
AR2 = 30;
% Wing Loading Test ValuesnPts = 50;
WtoS = [0:l:nPts]
;
%Examine Acceleration Performance
% Vary only AR by 12 0%
Accell = zeros (nPts);for WtS = l:nPts
Accell(WtS) = (0.0955*WtS) /AR2 + (355*CD01) /WtS + 0.035,end
% Vary only CDO by 80%Accel2 = zeros (nPts);for WtS = l:nPts
Accel2(WtS) = (0.0955*WtS) /AR1 + (355*CD02 ) /WtS + 0.035,end
% Original EquationAccel3 = zeros (nPts);for WtS = l:nPts
Accel3(WtS) = (0.0955*WtS) /AR1 + (355*CD01) /WtS + 0.035,
end
% Plotting Figures
figure
79

holdplot (Accell, '
r
'
)
text(nPts, Accell (nPts) , '120% AR'
)
plot (Accel2
,
'
c'
)
text(nPts, Accel2 (nPts) , '80% CDO'
)
plot (Accel3 , 'b'
)
text(nPts, Accel3 (nPts) , 'Nominal')holdaxis( [10,nPts,0.25,TtoWMax] )
gridtitle ( 'Acceleration Constraint Diagram with Nominal AR = 25, CDO0.0161')xlabeK 'Wto/S ~ Wing Loading (takeoff) - lbf/ft A 2')
ylabel ( 'Tsl/Wto - Thrust (sea level) to Weight (takeoff) Ratio')
80

LIST OF REFERENCES
1. Cohen, Lou, Quality Functional Deployment - How to Make QFD Workfor You,
Addison-Wesley Publishing Company, Inc., Reading, Massachusetts, 1995.
2. Bossert, James L., QFD - A Practitioner's Approach, ASQC Quality Press,
Milwaukee, Wisconsin, 1991.
3. Bicknell, Barbara A. and Bicknell, Kris D., The Road Map to Repeatable Success -
Using QFD to Implement Change, CRC Press Inc., Boca Raton, Florida, 1995.
4. Akao, Yoji, QFD - Integrating Customer Requirements into Product Design,
Productivity Press, Cambridge, Massachusetts, 1990.
5. Hauser, R. John and Clausing, Don, The House of Quality, Harvard Business
Review, May-June 1988.
6. Head Quarters US Atlantic Command, HAE bAV Joint Employment Concept of
Operations, July 1998.
7. Office of the Under Secretary of Defense, Acquisition & Technology, Annual Report,
Unmanned Aerial Vehicles (UAVs), August 1997.
8. Kopra, L. Timothy et al, Application ofa Concurrent Engineering Methodology to
the Design ofa Dual Use VTOL Aircraft, American Institute of Aeronautics and
Astronautics 94-4329-CP, 5th AIAA/USAF/NASA/ISSMO Symposium on
Multidisciplinary Analysis and Optimization, Panama City Beach, Florida, 7-9
September 1994.
9. Johnson, C. Jon, Advanced Lightweight Aircraft Fuselage Structure - Phase I,
SAWE Paper No. 2341, 55thAnnual Conference of Society of Allied Weight
Engineers, Inc., Atlanta, Georgia, 2-6 June 1996.
10. Wille, R.H., Landing Gear Weight Optimization Using Taguchi's Analysis, SAWEPaper Number 1966, Category Number 11, 49
thAnnual International Conference of
Society of Allied Weight Engineers, Inc., Chandler, Arizona, 14-16 May 1990.
11. Lin, Paul and Jules, Kenol, Optimized Multidisciplinary System Design for Aircraft
and Propulsion Systems, American Institute of Aeronautics and Astronautics 98-
3265, 34th AIAA/ASME/SAE/ASEE Joint Propulsion Conference and Exhibit,
Cleveland, Ohio, 13-15 July 1998.
12. Barnett, B.J. et al, A Frameworkfor Design Traceability , Proceedings of the HumanFactors Society, 36
thAnnual Meeting, 1992.
13. Benjamin, D.C., Performance Studyfor Inlet Installations, NASA-CR 189714, 1992.
81

14. Olds, John Robert, Multidisciplinary Design Techniques Applied to Conceptual
Aerospace Vehicle Design, NASA-CR- 194409, 1993.
15. Georgia Institute of Technology, Integrated Design and Manufacturing for the High
Speed Civil Transport, NASA USRA Advanced Design Program Aeronautics,
NASA-CR- 197 183, June 1994.
16. Scanlan, J.P, et al, Modeling the Design Process within the Aerospace Industry,
Factory 2000-Advanced Factory Automation, Fourth International Conference,
Publication 398, October 1994.
17. Gaffney, K.S. and Morones, P., Advanced-Aircraft Integrated-Diagnostics System
Concept Evaluation, Reliability and Maintainability Symposium Annual
Proceedings, 24-27 January 1994.
18. Dean, E.B., Quality Functional Deploymentfor Large Systems, Engineering
Management Conference, 25-28 October 1992
19. Pohl, E., Robison, D., and Jacobs, J., System Design with Quality Engineering,
Aerospace and Electronics Conference, 22-26 May 1989.
20. Doukas, L., Parkins, W. and Jeyaratnam, C, Integrating Quality Factors into System
Design, Engineering Management Conference, 1995, Global Engineering
management: Emerging Trends in the Asia Pacific, Proceedings of 1995 IEEEAnnual International, 25-28 June 1995.
21. Tran, Tuyet-Lan, QFD Application to a Software-Intensive System Development
Project, JJEMC, 1996.
22. Reed, B.M., Jacobs, D.A. and Dean, E.B., Quality Function Deployment:
Implementation Considerationsfor the Engineering Manager, Engineering
Management Conference 1994, Management in Tranistion: Engineering a Chaing
World, Proceedings of the 1994 IEEE International, 17-19 October 1994.
23. Beskow, C, Johansson, J. and Norell, M., Implementation ofQFD: Identifying
Success Factors, Engineering and Technology Management, IEMC '98, 11-13
October 1998.
24. Corban, R. Robert, NTP System Definition and Comparison Processfor SEI,
American Institute of Physics, Conference 930103, 1993.
25. Abbott, I. H. and Von Doenhoff A. E., Theory of Wing Sections, Dover Publications,
Inc, New York, New York, 1959.
82

26. Anderson, J. D. Junior, Introduction to Flight, 4' Edition, John Wiley and Sons, San
Francisco, California, 1999.
27. Hale, F. J., Aircraft Performance, Selection, and Design, John Wiley and Sons, NewYork, New York, 1984.
28. Mattingly, J. D., Heiser, W. H. and Daley, D. H., Aircraft Engine Design, American
Institute of Aeronautics and Astronautics Education Series, New York, New York,
1987.
29. Discussions with Faculty Members, Aeronautical Department, Naval Postgraduate
School, Monterey, California, 1999.
30. Nicolai, L. M., Fundamentals ofAircraft Design, METS Inc., San Jose, California,
1984.
31. Roskam, J., Airplane Design, Roskam Aviation and Engineering Corporation,
Ottawa, Kansas, 1985.
32. Callister, W. D. J., Materials Science and Engineering - An Introduction, Fourth
Edition, John Wiley and Sons, New York, New York, 1997.
33. Resetar, S. A., Rogers, J.C. and Hess, R.W., Advanced Airframe Structural
Materials - A Primer and Cost Estimating Methodology, RAND R-4016-AF, Santa
Monica, California, 1991.
34. Raymer, D. P., Aircraft Design: A Conceptual Approach, Third Edition, American
Institute of Aeronautics and Astronautics Education Series, Reston, Virginia, 1999.
35. Bralla, J. G., Design for Manufacturing Handbook, Second Edition, McGraw-Hill,
New York, New York, 1998.
36. Author's field trip to the F-18 C/D Manufacturing Plant in Los Angeles, California,
U.S.A., January 1999.
37. Kalpakjian, S., Manufacturing Engineering and Technology, Third Edition, Addison-
Wesley Publishing Company, Reading, Massachusetts, 1995.
38. Strong, A. D., Fundamentals of Composites Manufacturing: Materials, Methods and
Applications, Society of Manufacturing Engineers, Dearborn, Michigan, 1989.
39. Schwartz, M., Composite Materials Handbook, Second Edition, McGraw-Hill, Inc.,
New York, New York, 1992.
40. Blanchard, B. S. and Fabrycky W. J., Systems Engineering and Analysis, Third
Edition, Prentice Hall International (UK) Limited, London, 1997.
83

This page is intentionally left blank.
84

INITIAL DISTRIBUTION LIST
1. Defense Technical Information Center 2
8725, John J. Kingman Rd., STE 0944
STE 0944
Ft. Belvoir, VA 22060-6218
Head Librarian
Defense Technology Towers Library
1 Depot Road, #02-01, Defense Technology Tower ASingapore 109681
Dudley Knox Library
Naval Postgraduate School
411 Dyer Rd.
Monterey, CA 93943-5101
4. Prof. Max F. Platzer
Chairman, Department of Aeronautics and Astronautics
Naval Postgraduate School
Monterey, CA 93943-5106
5. Prof. Conrad F. Newberry
Department of Aeronautics and Astronautics
Naval Postgraduate School
Monterey, CA 93943-5106
6. Mr. Richard A. Smith
Program Manager, AFRL/SNRW Building 620
2241 Avionics Circle Room N3F10Wright-Patterson AFB, OH 45433-7333
7. CDR Osa E. Fitch 1
Code 40T, Naval Air Systems Command, Building 2109
Unit 5 Suite 122, 48150 Shaw Road, Unit 5
Paxtuxent River, MD, 20670-1907
8. Air Logistics Department, HQ Republic of Singapore Air Force 2
Attn: MAJOR Rendell Kheng Wah Tan
AFPN 8060, 303 Gombak Drive, #01-31
Singapore 669645
85


69 290NPGm $