QUALITY ASSURANCE PROJECT PLAN FIELD SAMPLING ...
396
-
Upload
khangminh22 -
Category
Documents
-
view
0 -
download
0
Transcript of QUALITY ASSURANCE PROJECT PLAN FIELD SAMPLING ...
Quality Assurance Project Plan RI Water Column Monitoring/Small Volume Chemical Data Collection Lower Passaic River Restoration Project New Jersey
Q:\mw2007\Projects\60145884\V110\Kris_20120622_CWCM-sv_QAPP_Rev3.docx
Quality Assurance Project Plan/Field Sampling Plan Addendum
Remedial Investigation Water Column Monitoring/Small Volume Chemical Data Collection
Lower Passaic River Restoration Project
July 2012
Revision 3

Quality Assurance Project PlanRI Water Column Monitoring/Small Volume Chemical Data CollectionLower Passaic River Restoration ProjectNew Jersey
Section: ContentsRevision: 2
Date: August 2011Page 1 of 2
J:\Water\ProjectFiles\P120\12182_Passaic\Tasks\CWCM\AECOM QAPP\2011803_Rev2\clean\20110810_CWCM-sv_QAPP_Rev2.docx
ContentsList of Acronyms
Introduction
QAPP Worksheet #1. Title and Approval Page
QAPP Worksheet #2. QAPP Identifying Information
QAPP Worksheet #3. Distribution List
QAPP Worksheet #4. Project Personnel Sign-Off Sheet
QAPP Worksheet #5. Project Organizational Chart
QAPP Worksheet #6. Communication Pathways
QAPP Worksheet #7. Personnel Responsibilities and Qualifications Table
QAPP Worksheet #8. Special Personnel Training Requirements Table
QAPP Worksheet #9. Project Scoping Session Participants Sheet
QAPP Worksheet #10. Problem Definition
QAPP Worksheet #11. Project Quality Objectives/Systematic Planning Process Statements
QAPP Worksheet #12. Measurement Performance Criteria Table
QAPP Worksheet #13. Secondary Data Criteria and Limitations Table
QAPP Worksheet #14. Summary of Project Tasks
QAPP Worksheet #15. Reference Limits and Evaluation Table
QAPP Worksheet #16. Project Schedule/Timeline Table
QAPP Worksheet #17. Sampling Design and Rationale
QAPP Worksheet #18. Sampling Locations and Methods/SOP Requirements Table
QAPP Worksheet #19. Analytical SOP Requirements Table
QAPP Worksheet #20. Field Quality Control Sample Summary Table
QAPP Worksheet #21. Project Sampling SOP Reference Table
QAPP Worksheet #22. Field Equipment Calibration, Maintenance, Testing, and Inspection Table
QAPP Worksheet #23. Analytical SOP Reference Table
QAPP Worksheet #24. Analytical Instrument Calibration Table
QAPP Worksheet #25. Analytical Instrument and Equipment Maintenance, Testing, and Inspection Table
QAPP Worksheet #26 Sample Handling System
QAPP Worksheet #27. Sample Custody Requirements
QAPP Worksheet #28. QC Samples Table
QAPP Worksheet #29. Project Documents and Records Table
QAPP Worksheet #30. Analytical Services Table
Quality Assurance Project PlanRI Water Column Monitoring/Small Volume Chemical Data CollectionLower Passaic River Restoration ProjectNew Jersey
Section: ContentsRevision: 2
Date: August 2011Page 2 of 2
J:\Water\ProjectFiles\P120\12182_Passaic\Tasks\CWCM\AECOM QAPP\2011803_Rev2\clean\20110810_CWCM-sv_QAPP_Rev2.docx
QAPP Worksheet #31. Planned Project Assessment Table
QAPP Worksheet #32. Assessment Findings and Response Actions
QAPP Worksheet #33. QA Management Reports Table
QAPP Worksheet #34. Sampling and Analysis Verification (Step I) Process Table
QAPP Worksheet #35. Sampling and Analysis Validation (Steps IIa and IIb) Process Table
QAPP Worksheet #36. Sampling and Analysis Validation (Steps IIa and IIb) Summary Table
QAPP Worksheet #37. Data Usability Assessment
Attachment 1. References
Appendix A WCM/Chemical Data Collection Field Sampling Plan Addendum 2010-01Lower Passaic River Restoration Project
Appendix B Field Standard Operating Procedures
Appendix C Laboratory Standard Operating Procedures
Quality Assurance Project PlanRI Water Column Monitoring/Small Volume Chemical Data CollectionLower Passaic River Restoration ProjectNew Jersey
Section: List of AcronymsRevision: 2
Date: August 2011Page 1 of 6
J:\Water\ProjectFiles\P120\12182_Passaic\Tasks\CWCM\AECOM QAPP\2011803_Rev2\clean\20110810_CWCM-sv_QAPP_Rev2.docx
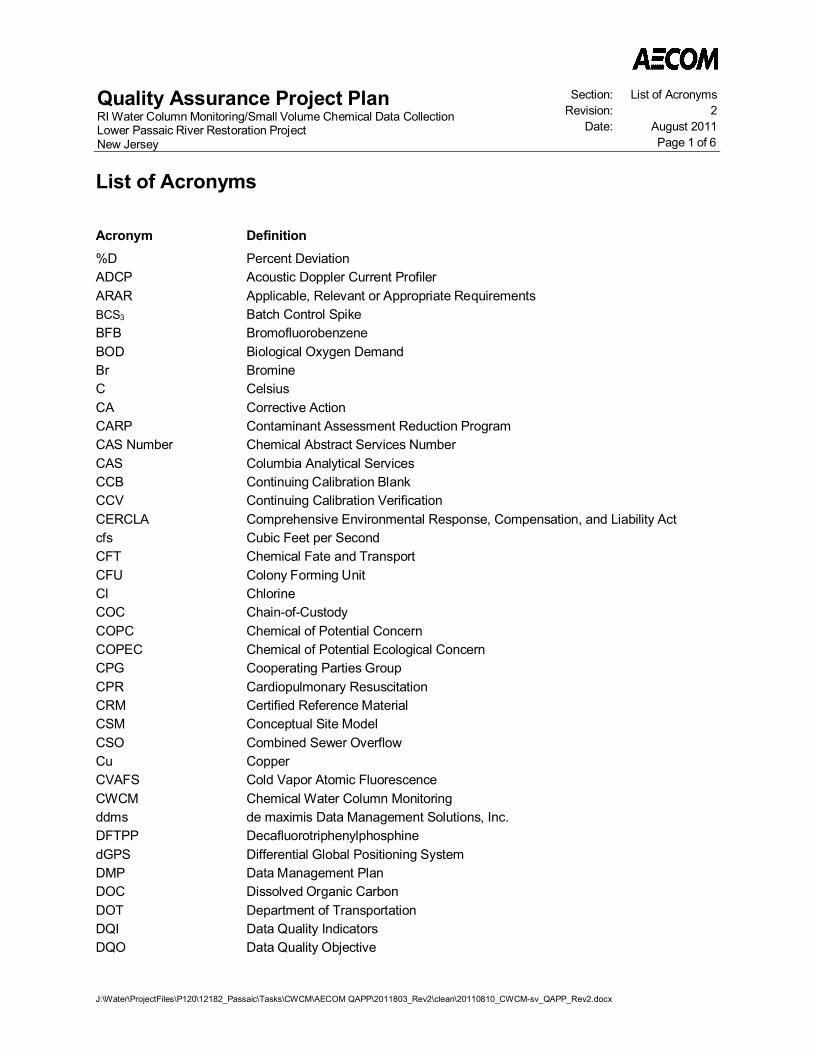
List of Acronyms
Acronym Definition%D Percent DeviationADCP Acoustic Doppler Current ProfilerARAR Applicable, Relevant or Appropriate RequirementsBCS3 Batch Control SpikeBFB BromofluorobenzeneBOD Biological Oxygen DemandBr BromineC CelsiusCA Corrective ActionCARP Contaminant Assessment Reduction ProgramCAS Number Chemical Abstract Services NumberCAS Columbia Analytical ServicesCCB Continuing Calibration BlankCCV Continuing Calibration VerificationCERCLA Comprehensive Environmental Response, Compensation, and Liability Actcfs Cubic Feet per SecondCFT Chemical Fate and TransportCFU Colony Forming UnitCl ChlorineCOC Chain-of-CustodyCOPC Chemical of Potential ConcernCOPEC Chemical of Potential Ecological ConcernCPG Cooperating Parties GroupCPR Cardiopulmonary ResuscitationCRM Certified Reference MaterialCSM Conceptual Site ModelCSO Combined Sewer OverflowCu CopperCVAFS Cold Vapor Atomic FluorescenceCWCM Chemical Water Column Monitoringddms de maximis Data Management Solutions, Inc.DFTPP DecafluorotriphenylphosphinedGPS Differential Global Positioning SystemDMP Data Management PlanDOC Dissolved Organic CarbonDOT Department of TransportationDQI Data Quality IndicatorsDQO Data Quality Objective
Quality Assurance Project PlanRI Water Column Monitoring/Small Volume Chemical Data CollectionLower Passaic River Restoration ProjectNew Jersey
Section: List of AcronymsRevision: 2
Date: August 2011Page 2 of 6
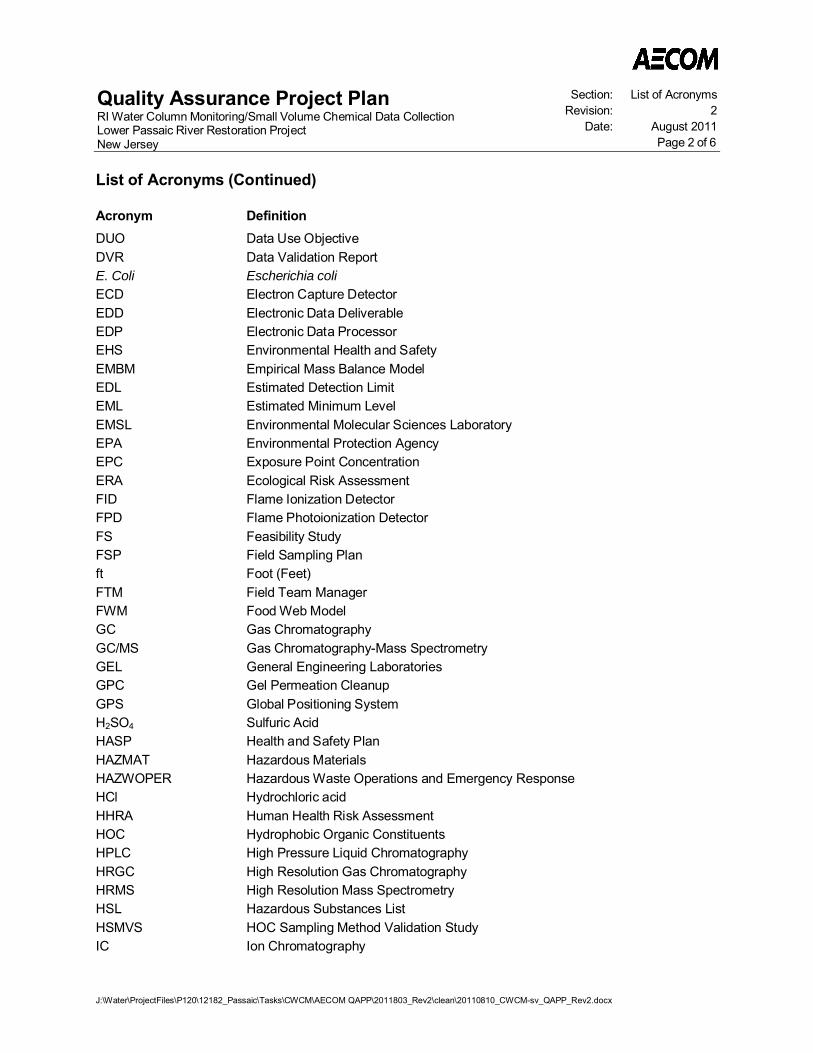
List of Acronyms (Continued)
J:\Water\ProjectFiles\P120\12182_Passaic\Tasks\CWCM\AECOM QAPP\2011803_Rev2\clean\20110810_CWCM-sv_QAPP_Rev2.docx
Acronym DefinitionDUO Data Use ObjectiveDVR Data Validation ReportE. Coli Escherichia coliECD Electron Capture DetectorEDD Electronic Data DeliverableEDP Electronic Data ProcessorEHS Environmental Health and SafetyEMBM Empirical Mass Balance ModelEDL Estimated Detection LimitEML Estimated Minimum LevelEMSL Environmental Molecular Sciences LaboratoryEPA Environmental Protection AgencyEPC Exposure Point ConcentrationERA Ecological Risk AssessmentFID Flame Ionization DetectorFPD Flame Photoionization DetectorFS Feasibility StudyFSP Field Sampling Planft Foot (Feet)FTM Field Team ManagerFWM Food Web ModelGC Gas ChromatographyGC/MS Gas Chromatography-Mass SpectrometryGEL General Engineering LaboratoriesGPC Gel Permeation CleanupGPS Global Positioning SystemH2SO4 Sulfuric AcidHASP Health and Safety PlanHAZMAT Hazardous MaterialsHAZWOPER Hazardous Waste Operations and Emergency ResponseHCl Hydrochloric acidHHRA Human Health Risk AssessmentHOC Hydrophobic Organic ConstituentsHPLC High Pressure Liquid ChromatographyHRGC High Resolution Gas ChromatographyHRMS High Resolution Mass SpectrometryHSL Hazardous Substances ListHSMVS HOC Sampling Method Validation StudyIC Ion Chromatography
Quality Assurance Project PlanRI Water Column Monitoring/Small Volume Chemical Data CollectionLower Passaic River Restoration ProjectNew Jersey
Section: List of AcronymsRevision: 2
Date: August 2011Page 3 of 6
List of Acronyms (Continued)
J:\Water\ProjectFiles\P120\12182_Passaic\Tasks\CWCM\AECOM QAPP\2011803_Rev2\clean\20110810_CWCM-sv_QAPP_Rev2.docx
Acronym DefinitionICAL Initial CalibrationICP Inductively Coupled PlasmaICS Interference Check SampleICP/AES Inductively Coupled Plasma Atomic Emission SpectroscopyICV Initial Calibration VerificationIDW Investigation-Derived WastesIEC Inter Element CorrectionsIPR Internal Precision and RecoveryK&L Gates Kirkpatrick and Lockhart Preston Gates Ellis LLPL LiterLCS Laboratory Control SampleLCSD Laboratory Control Sample DuplicateLFB Laboratory Fortified BlankLIMS Laboratory Information Management SystemLOC Level of ChlorinationLPR Lower Passaic RiverLPRRP Lower Passaic River Restoration ProjectLPRSA Lower Passaic River Study AreaLRMS Low Resolution Mass SpectrometryM MolarMB Method BlankMDL Method Detection LimitMEDD Multi-media Electronic Data Deliverablemg/L Milligrams per Litermin MinutemL MilliliterML Minimum LevelMn Manganesemo MonthMPI Malcolm Pirnie, Inc.mS/cm Micro Siemens per centimeterMS Matrix SpikeMSD Matrix Spike DuplicateNA Not ApplicableNaOH Sodium HydroxideNB Newark BayNBSA Newark Bay Study Areang/L Nanograms per LiterND Not Detected
Quality Assurance Project PlanRI Water Column Monitoring/Small Volume Chemical Data CollectionLower Passaic River Restoration ProjectNew Jersey
Section: List of AcronymsRevision: 2
Date: August 2011Page 4 of 6
List of Acronyms (Continued)
J:\Water\ProjectFiles\P120\12182_Passaic\Tasks\CWCM\AECOM QAPP\2011803_Rev2\clean\20110810_CWCM-sv_QAPP_Rev2.docx
Acronym DefinitionNH3 AmmoniaNIST National Institute of Standards and TechnologyNJDEP New Jersey Department of Environmental ProtectionNJDOT New Jersey Department of TransportationNOAA National Oceanic and Atmospheric AdministrationNS No StandardNY New YorkNY/NJ HEP New York-New Jersey Harbor Estuary ProgramOC OrganochlorineOPR On-going Precision and RecoveryOSI Ocean Surveys, Inc.OU Operable UnitP&T Purge and TrapPAH Polycyclic Aromatic HydrocarbonsPAL Project Action LimitPCB Polychlorinated BiphenylPCDD Polychlorinated Dibenzo-p-dioxinPCDF Polychlorinated DibenzofuranPE Performance EvaluationPFD Problem Formulation DocumentPFK PerfluorokerosenepH Potential HydrogenPID Photoionization DetectorPM Project ManagerPOC Particulate Organic Carbonppth Part per ThousandPQO Project Quality ObjectivesPREmis Passaic River Estuary Management Information SystemPRP Potentially Responsible PartyPTFE PolytetrafluoroethylenePT/PE Performance Testing/ Performance EvaluationPWCM Physical Water Column MonitoringQA Quality AssuranceQAPP Quality Assurance Project PlanQC Quality ControlQCCS Quality Control Check SampleQL Quantitation LimitQMP Quality Management PlanRA Risk Assessment
Quality Assurance Project PlanRI Water Column Monitoring/Small Volume Chemical Data CollectionLower Passaic River Restoration ProjectNew Jersey
Section: List of AcronymsRevision: 2
Date: August 2011Page 5 of 6
List of Acronyms (Continued)
J:\Water\ProjectFiles\P120\12182_Passaic\Tasks\CWCM\AECOM QAPP\2011803_Rev2\clean\20110810_CWCM-sv_QAPP_Rev2.docx
Acronym DefinitionRCL Recovery Control LimitsRF Response FactorsRI Remedial InvestigationRI/FS Remedial Investigation/Feasibility StudyRL Reporting LimitRM River MileRPD Relative Percent DifferenceRPM Remedial Project ManagerRRF Relative Response FactorsRSD Relative Standard DeviationS&A Sampling and AnalyticalS/N Signal to NoiseSAIC Science Applications International CorporationSDG Sample Delivery GroupSIM Selective Ion MonitoringSOP Standard Operating ProcedureSOW Statement of WorkSPCC System Performance Check CompoundsSRM Standard Reference MaterialsSSC Suspended Solids ConcentrationSSO Site Safety OfficerSVCG Small Volume Composite GrabSVOC Semi-Volatile Organic CompoundSWO Stormwater OutfallTAL Target Analyte ListTC Technical CommitteeTCL Target Compound ListTDS Total Dissolved SolidsTIC Tentatively Identified CompoundTKN Total Kjeldahl NitrogenTOC Total Organic CarbonTPH Total Petroleum HydrocarbonsTSS Total Suspended SolidsTSA Technical Surveillance AuditVER Calibration VerificationVOA Volatile Organics AnalysisVOC Volatile Organic CompoundUCL Upper Confidence Limitug/L Microgram per Liter

Quality Assurance Project PlanRI Water Column Monitoring/Small Volume Chemical Data CollectionLower Passaic River Restoration ProjectNew Jersey
Section: List of AcronymsRevision: 2
Date: August 2011Page 6 of 6
List of Acronyms (Continued)
J:\Water\ProjectFiles\P120\12182_Passaic\Tasks\CWCM\AECOM QAPP\2011803_Rev2\clean\20110810_CWCM-sv_QAPP_Rev2.docx
Acronym DefinitionUFP Uniform Federal Policyum MicronUSACE United States Army Corps of EngineersUSEPA United States Environmental Protection AgencyUSFWS United States Fish and Wildlife ServiceUSGS United States Geological ServiceUV-VIS Ultraviolet-Visible Spectrophotometryv/v Volume to VolumeWCM Water Column Monitoring
Quality Assurance Project PlanRI Water Column Monitoring/Small Volume Chemical Data CollectionLower Passaic River Restoration ProjectNew Jersey
Section: IntroductionRevision: 2
Date: August 2011Page 1 of 11
J:\Water\ProjectFiles\P120\12182_Passaic\Tasks\CWCM\AECOM QAPP\2011803_Rev2\clean\20110810_CWCM-sv_QAPP_Rev2.docx
Introduction
This Quality Assurance Project Plan (QAPP) and Field Sampling Plan (FSP) Addendum detail the proposedexecution of a portion of the Water Column Monitoring (WCM) Program of the Remedial Investigation (RI)as outlined in the Lower Passaic River Restoration Project (LPRRP) FSP, Volume 1 (Malcolm Pirnie, Inc.(MPI) 2006). The RI is required by the Administrative Settlement Agreement and Order on Consent forRemedial Investigation/Feasibility Study (RI/FS) (Settlement Agreement [USEPA 2007a] and its Appendix B(i.e., Statement of Work [SOW]). The Cooperating Parties Group (CPG), which included 73 PotentiallyResponsible Parties (PRPs), has entered into the Settlement Agreement (USEPA 2007a) to perform the RI.This document uses applicable worksheets from the United States Environmental Protection Agency(USEPA) Uniform Federal Policy (UFP) on QAPPs [Publication Numbers: EPA: EPA-505-B-04-900A DoD:DTIC ADA 427785] (USEPA 2005). This document includes both the QAPP and the FSP Addendum, whichis included as Appendix A. Appendix B contains the field standard operating procedures (SOPs) andAppendix C contains the laboratory SOPs.
The WCM program has been divided into two subtasks. One subtask, the WCM/Physical Data Collection orPhysical WCM (PWCM) program, includes collection of physical measurements in the water column(currents, temperature, conductivity, turbidity, organic carbon and solids). This subtask has been performedunder the Quality Assurance Project Plan/Field Sampling Plan Addendum, Remedial Investigation WaterColumn Monitoring/Physical Data Collection for the Lower Passaic River, Newark Bay and Wet WeatherMonitoring, Lower Passaic River Restoration Project (AECOM 2010a). The other subtask, WCM/ChemicalData Collection or Chemical Water Column Monitoring (CWCM), a portion of which is addressed in thisQAPP, includes collection of water column samples for chemical analysis. The portion of the CWCM datacollection described in this QAPP covers the small volume sampling phase of the subtask; a high volumesampling phase is currently being planned and will be proposed as a separate QAPP/FSP Addendum. Theinformation collected with respect to the physical characteristics of the Lower Passaic River (LPR) has beenused to aid in the development of the FSP for this phase of the CWCM program.
The proposed investigation includes the collection of small volumes of water (i.e., consistent with SW-846and other federal and state methods) for analysis of the target analytes in whole water, with a subset ofmetals and organic carbon analyzed in the dissolved phase. All proposed analyses have been assigned toone of four groups described in the following paragraphs:
Group A - A list of target physical, and inorganic and organic chemical analyses is proposed for the fullset of events, stations and depths (refer to Worksheet #15). These analytes will be measured in allsamples during each of the eight events and will be used primarily for estimation of exposure pointconcentrations (EPCs) for the human health risk assessment (HHRA), ecological risk assessment(ERA) and food web model (FWM), and in the calibration of the chemical fate and transport (CFT)model. This analyte list is consistent with the Modeling Work Plan (HydroQual, 2006) and includespolychlorinated dibenzo-p-dioxins and polychlorinated dibenzofurans (PCDD/PCDFs), polychlorinatedbiphenyl (PCB) congeners and homologs, and mercury (total and dissolved). Total and dissolvedcadmium, copper and lead will also be included in the Group A list. Supporting parameters to be used inthe CFT model (i.e., dissolved organic carbon (DOC), particulate organic carbon (POC), suspendedsolids concentration (SSC), total organic carbon (TOC), chlorophyll a, alkalinity, sulfate, total sulfide,total dissolved solids (TDS), and chloride) are also included.
Group B - A comprehensive list of physical, and inorganic and organic chemical analyses is proposedfor the full set of stations and depths for a subset of sampling events (refer to Worksheet #15). Theseparameters will be used to support EPC calculations for the HHRA, ERA and FWM, as well as
Quality Assurance Project PlanRI Water Column Monitoring/Small Volume Chemical Data CollectionLower Passaic River Restoration ProjectNew Jersey
Section: IntroductionRevision: 2
Date: August 2011Page 2 of 11
J:\Water\ProjectFiles\P120\12182_Passaic\Tasks\CWCM\AECOM QAPP\2011803_Rev2\clean\20110810_CWCM-sv_QAPP_Rev2.docx
validation of the CFT model, and include target compound list (TCL) semivolatile organic compounds(SVOCs), TCL volatile organic compounds (VOCs), target analyte list (TAL) metals, a subset of TALmetals in dissolved phase (arsenic, cadmium, chromium, copper, lead, nickel, selenium, and zinc),titanium, methyl mercury (total and dissolved), hexavalent chromium (dissolved only), butyltins,organochlorine (OC) pesticides, cyanide, polycyclic aromatic hydrocarbons (PAHs), alkyl PAHs,hardness (calculated), total Kjeldahl nitrogen (TKN), ammonia and total phosphorus. Tentativelyidentified compounds (TICs) will be reported in association with the TCL VOC and SVOC analyses.
Group C - Pathogen analyses are proposed for near-surface samples during one tidal phase orhydrograph stage from five stations in RM 0 - 17.4 of the LPR to determine their relevance in futureinvestigation phases. The five stations, shown in Worksheet #18, were selected by reviewing thesample maps to ensure coverage within the full length of the river, with a focus on areas wherecombined sewer overflows (CSOs) are present and to provide information regarding the input ofpathogens during storm events from off-site sources. Group C will be sampled during spring andsummer routine events, the low flow/spring tide event, and both high flow events and includes totalcoliform and Escherichia coli (E. coli), fecal coliform, fecal streptococci and fecal enterococci bacteria.Analysis of Group C parameters will be conducted outside the RI/FS Trust for the LPRSA.
Group D - Additional pathogen analyses are proposed for near-surface samples during one tidal phaseor hydrograph stage from the five stations in the LPR (RM 0 - 17.4) to determine their relevance infuture investigation phases. Group D includes the protozoans Giardia and cryptosporidium, and will besampled during summer routine events and both high flow events. Analysis of Group D parameters willbe conducted outside the RI/FS Trust for the LPRSA.
Specific stations designated for the additional Group C and D analyses are identified in Worksheet #18.
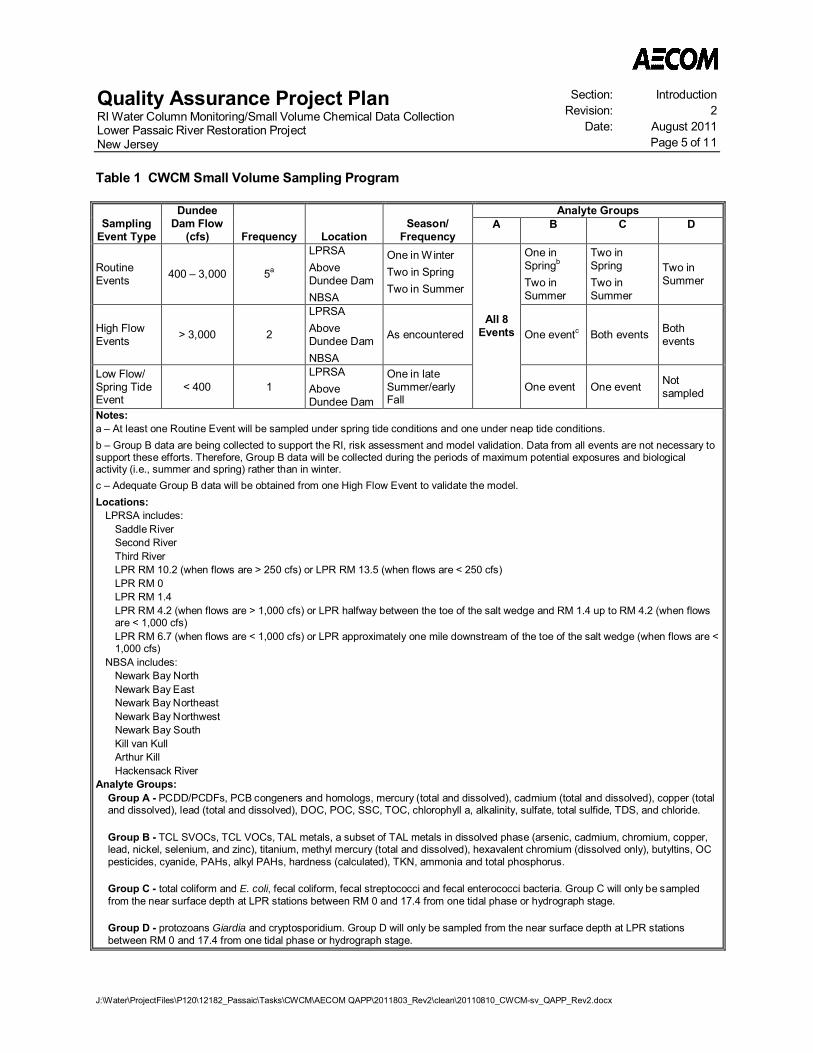
The collection of these water samples occur over the course of eight planned sampling events. The eventsare described below and summarized in Table 1. The flow thresholds for the low flow and high flow eventswere selected from an analysis of the discharge record at Dundee Dam (April 2007 to August 2010). Thelow flow event threshold was identified by conducting an analysis of the number of events satisfying both thedischarge criterion and the spring-tide criterion. The analysis showed that a discharge criterion of <400cubic feet per second (cfs) was satisfied multiple times (i.e., 8-12 times per calendar years 2007-2009) ineach of the years over the period of record at Dundee Dam.
The high flow threshold was identified by conducting a return frequency analysis using the availabledischarge data at Dundee Dam. A flow event with a return period of 3 months (or 4 occurrences per year)was chosen as the flow threshold that can reasonably be expected to be exceeded during the CWCMperiod. Accordingly, the discharge associated with the 1 in 3 months event at Dundee Dam was calculatedto be 3,000 cfs and is proposed as the minimum flow for a high flow event.
Routine Events – Five Routine Events are planned over the course of approximately one year undernormal flow conditions (400 - 3,000 cfs at the gage at Dundee Dam). The five events are planned tooccur in winter (one event), spring (two events) and summer (two events). At least one Routine Eventwill occur under spring tide conditions and one under neap tide conditions. The sample locations willinclude the Lower Passaic River Study Area (LPRSA) (the lower 17.4 miles of the Passaic River and itstributaries), above Dundee Dam, and the Newark Bay Study Area (NBSA), which is defined as includingNewark Bay and its confluences with the Hackensack River, Arthur Kill and Kill van Kull (Worksheet#18). The data collected during the Routine Events will support the exposure point calculations for therisk assessments (RAs) and FWM. The Routine Events are planned to occur under several different
Quality Assurance Project PlanRI Water Column Monitoring/Small Volume Chemical Data CollectionLower Passaic River Restoration ProjectNew Jersey
Section: IntroductionRevision: 2
Date: August 2011Page 3 of 11
J:\Water\ProjectFiles\P120\12182_Passaic\Tasks\CWCM\AECOM QAPP\2011803_Rev2\clean\20110810_CWCM-sv_QAPP_Rev2.docx
flows, ranging from 400 - 3,000 cfs at Dundee Dam. These events are designed to provide informationregarding the variability of chemical concentrations in the study area to support the calibration andvalidation of the CFT model. It is anticipated that the Routine Events will capture data representative ofthe normal influxes and mixing processes in the river and the bay, the deposition of particulates from thewater column to the sediment, and of the preliminary diffusive flux of contaminants from the sedimentsto the water column. One hundred eight (108) samples will be collected during each of the RoutineEvents to be analyzed for target analytes as defined in Worksheet #15. Group A analytes will besampled in each event. Group B analytes will be measured in one spring and two summer events.Shallow (3 feet (ft) below surface) water stations in the five locations in the lower 17.4 miles of the LPRwill be analyzed for pathogens (Groups C and D - Worksheet #15 and #18). Group C analytes (coliformbacteria) will be analyzed in the two spring and two summer events; and Group D analytes (Giardia andcryptosporidium) will be sampled during the summer events. Frequency and type of QC samples areprovided in Worksheet #20.
High Flow Events – Two High Flow Events are planned under storm-induced high flow (i.e., notsustained high flow) conditions (>3,000 cfs at Dundee Dam). The planned sample locations include theLPRSA, above Dundee Dam, and NBSA (Worksheet #18). The data collected during the High FlowEvents will be used to support the exposure point calculations for the RAs and FWM. The data will alsobe used to support the preliminary calibration and validation of the CFT model (e.g., the resuspendedflux from the sediments to the water column, and the subsequent deposition of particle-boundcontaminants from the water column to the sediment). It is also anticipated that during these eventsthere will be a higher loading of suspended sediments (i.e., more contamination on a per unit weightsuspended solids basis may occur since elevated flows associated with storm events will resuspendmore bed sediment). These data will be used in conjunction with CSO and storm water outfall (SWO)data being collected by Tierra Solutions, Inc. (Tierra Solutions, Inc. 2011) to estimate loading using thePassaic Valley Sewer Commissioner’s Storm Water Management Model (SWMM) or empirical loadingcalculations, and for contaminant source identification. The CSO and SWO data to be collected byTierra are being analyzed using analytical techniques, described in the CSO/SWO QAPP (TierraSolutions, Inc. 2011), that are different from those being implemented in the small volume CWCMQAPP and may include larger volumes of water for some analytes. However, differences in theanalytical method will not negate the usefulness of combining these data. The SWMM will be used tocalibrate and validate the external inputs to the system in the CFT model. One hundred fourteen (114)samples will be collected during each of the High Flow Events to be analyzed for target analytes asdefined in Worksheet #15. Group A analytes will be measured during both events. Group B analytes willbe measured in one of the two events. Shallow (3 ft below surface) water stations in the five locations inthe LPR (RM 0 – 17.4) will be analyzed for pathogens (Worksheet #15 and #18). Group C analytes(coliform bacteria) and Group D analytes (Giardia and cryptosporidium) will be sampled during bothevents. Frequency and type of QC samples are provided in Worksheet #20.
Low Flow/Spring Tide Event – One event is planned under low flow conditions (<400 cfs at DundeeDam) during a spring tide in order to capture data representative of periods with greatest tidal mixing.With this discharge, the salt wedge is upstream of the Primary Erosion Zone identified by USEPA (MPI2007a). The sample locations will include the stations in the LPRSA and above Dundee Dam(Worksheet #18). The data collected during the Low Flow/Spring Tide Event will provide additional datain the lower reaches of the river to support the exposure point calculations for the risk assessments andFWM. This event is proposed to include combining low-flow conditions (< 400 cfs at Dundee Dam) witha spring tide in order to measure chemical transport when the highest tidal energies and tidal mixingmay be occurring in the LPRSA; these data will be used to support the calibration and validation of theCFT model. Forty-four (44) samples will be collected during the Low Flow/Spring Tide Event to beanalyzed for Group A and Group B target analytes as defined in Worksheet #15. Shallow (3 ft below
Quality Assurance Project PlanRI Water Column Monitoring/Small Volume Chemical Data CollectionLower Passaic River Restoration ProjectNew Jersey
Section: IntroductionRevision: 2
Date: August 2011Page 4 of 11
J:\Water\ProjectFiles\P120\12182_Passaic\Tasks\CWCM\AECOM QAPP\2011803_Rev2\clean\20110810_CWCM-sv_QAPP_Rev2.docx
surface) water stations in the five locations in the LPR (RM 0 – 17.4) will be analyzed for Group Canalytes (coliform bacteria) (Worksheet #15 and #18). Group D analytes (Giardia and cryptosporidium)will not be sampled during the Low Flow/Spring Tide Event. Frequency and type of QC samples areprovided in Worksheet #20.
The water column chemical and physical data collection activities are important components of the LPRSARI/FS and the NBSA RI/FS, which include characterizing the fate and transport of contaminants within theriver, assessing risks to human health and ecological receptors, calibration and validation of theLPRSA/NBSA CFT model, and assessing the feasibility of remedial alternatives.
During the first Routine Event, a subset of twenty (20) samples will be sent to the laboratory for rapidanalysis and turnaround of Group A parameters. The samples will be used to test the low-end sensitivity ofthe small volume analytical methods. Specifically, these samples will be collected from the followingstations:
RM10.2/13.5 at Low Slack (3 ft below surface) and Max Flood (3 ft below surface)
RM 1.4 at Max Flood (3 ft below surface) and High Slack (3 ft below surface)
RM 6.7/Tidal 2 at Max Ebb (3 ft below surface) and Low Slack (3 ft below surface)
Newark Bay Northeast at High Slack (3 ft below surface) and Max Flood (3 ft below surface)
Newark Bay South at High Slack (3 ft below surface) and Max Flood (3 ft below surface)
Second River
Third River
Saddle River
Above Dundee Dam
Hackensack River at High Slack (3 ft below surface) and Max Ebb (3 ft below surface)
Arthur Kill at Max Flood (3 ft below surface) and Low Slack (3 ft below surface)
Kill van Kull at Max Flood (3 ft below surface) and Low Slack (3 ft below surface)
Upon receipt of the data from the laboratory, USEPA, CPG and Tierra will review the data to determine theefficacy of the small volume methods to achieve the Project Quality Objectives (PQOs). The CPG andTierra will provide opinion to USEPA, who will make the final determination. No additional sampling willoccur until an agreement is reached on the results of the first event Group A sample analyses and theirimplications for ongoing sampling and analysis methods.
Quality Assurance Project PlanRI Water Column Monitoring/Small Volume Chemical Data CollectionLower Passaic River Restoration ProjectNew Jersey
Section: IntroductionRevision: 2
Date: August 2011Page 5 of 11
J:\Water\ProjectFiles\P120\12182_Passaic\Tasks\CWCM\AECOM QAPP\2011803_Rev2\clean\20110810_CWCM-sv_QAPP_Rev2.docx
Table 1 CWCM Small Volume Sampling Program
SamplingEvent Type
DundeeDam Flow
(cfs) Frequency LocationSeason/
Frequency
Analyte GroupsA B C D
RoutineEvents 400 – 3,000 5a
LPRSAAboveDundee DamNBSA
One in W interTwo in SpringTwo in Summer
All 8Events
One inSpringb
Two inSummer
Two inSpringTwo inSummer
Two inSummer
High FlowEvents > 3,000 2
LPRSAAboveDundee DamNBSA
As encountered One eventc Both events Bothevents
Low Flow/Spring TideEvent
< 400 1LPRSAAboveDundee Dam
One in lateSummer/earlyFall
One event One event Notsampled
Notes:a – At least one Routine Event will be sampled under spring tide conditions and one under neap tide conditions.b – Group B data are being collected to support the RI, risk assessment and model validation. Data from all events are not necessary tosupport these efforts. Therefore, Group B data will be collected during the periods of maximum potential exposures and biologicalactivity (i.e., summer and spring) rather than in winter.c – Adequate Group B data will be obtained from one High Flow Event to validate the model.Locations:
LPRSA includes:Saddle RiverSecond RiverThird RiverLPR RM 10.2 (when flows are > 250 cfs) or LPR RM 13.5 (when flows are < 250 cfs)LPR RM 0LPR RM 1.4LPR RM 4.2 (when flows are > 1,000 cfs) or LPR halfway between the toe of the salt wedge and RM 1.4 up to RM 4.2 (when flowsare < 1,000 cfs)LPR RM 6.7 (when flows are < 1,000 cfs) or LPR approximately one mile downstream of the toe of the salt wedge (when flows are <1,000 cfs)
NBSA includes:Newark Bay NorthNewark Bay EastNewark Bay NortheastNewark Bay NorthwestNewark Bay SouthKill van KullArthur KillHackensack River
Analyte Groups:Group A - PCDD/PCDFs, PCB congeners and homologs, mercury (total and dissolved), cadmium (total and dissolved), copper (totaland dissolved), lead (total and dissolved), DOC, POC, SSC, TOC, chlorophyll a, alkalinity, sulfate, total sulfide, TDS, and chloride.
Group B - TCL SVOCs, TCL VOCs, TAL metals, a subset of TAL metals in dissolved phase (arsenic, cadmium, chromium, copper,lead, nickel, selenium, and zinc), titanium, methyl mercury (total and dissolved), hexavalent chromium (dissolved only), butyltins, OCpesticides, cyanide, PAHs, alkyl PAHs, hardness (calculated), TKN, ammonia and total phosphorus.
Group C - total coliform and E. coli, fecal coliform, fecal streptococci and fecal enterococci bacteria. Group C will only be sampledfrom the near surface depth at LPR stations between RM 0 and 17.4 from one tidal phase or hydrograph stage.
Group D - protozoans Giardia and cryptosporidium. Group D will only be sampled from the near surface depth at LPR stationsbetween RM 0 and 17.4 from one tidal phase or hydrograph stage.
Quality Assurance Project PlanRI Water Column Monitoring/Small Volume Chemical Data CollectionLower Passaic River Restoration ProjectNew Jersey
Section: IntroductionRevision: 2
Date: August 2011Page 6 of 11
J:\Water\ProjectFiles\P120\12182_Passaic\Tasks\CWCM\AECOM QAPP\2011803_Rev2\clean\20110810_CWCM-sv_QAPP_Rev2.docx
Environmental History and Setting
The LPRSA and NBSA have been highly modified to accommodate urbanization, including the developmentof residential areas and industrial activities. Changes in the LPR, Newark Bay (NB), and the associatedwatershed that accompanied European settlement and industrialization of the area to the present day arewell chronicled (Iannuzzi et al. 2002). Most of the tidal marsh, mudflats, shallow nearshore areas, and tidalwetlands historically present in the LPRSA and NBSA have been either filled or dredged. Today, themajority of the shoreline in the LPR consists of riprap and sheet pile walls resulting in a highly channelizedriver. Upper portions of the LPR feature generally steeper and less modified shorelines with limited areas ofriparian vegetation.
History of the LPR and Newark Bay
More than 200 years of industrialization and urbanization have had a substantial effect on the LPRwatershed and NB, which were an important location for industry during the American Industrial Revolution(MPI 2007b). These early industries, as well as other industries that developed during the19th and early20th centuries, used the LPR and NB for process water and waste disposal, which adversely affected waterand sediment quality (Iannuzzi and Ludwig 2004). In addition, overall sediment and water quality is impairedas a result of historical direct municipal discharges, historical and continuing surface runoff, and municipalCSOs and SWOs. These impacts to general water quality were reduced in 1970 when the Clean Water Actwas passed (Iannuzzi and Ludwig 2004).
In 1858, the Dundee Dam and associated locks were constructed on the LPR. After the completion of thedam, mills were built along the upper LPR near the City of Passaic (Iannuzzi et al. 2002). Above DundeeDam, the City of Paterson was a significant center of industrialization and manufacturing beginning in thelate 18th Century. In the early 20th Century, Newark, New Jersey, became one of the largest industrial citiesin the United States. Industries included petroleum refineries, shipping facilities, tanneries, and variousmanufacturers (Battelle 2005).
Approximately 88 percent of the wetlands near the LPR and Newark Bay were lost after 1816(Iannuzzi et al. 2002). These wetland areas were ditched, diked, drained, and covered with fill material forvarious purposes including: salt hay production, gardens and dairies, railroad beds, oil storage/refining,shipyards and shipping ports, mosquito control, municipal and industrial waste disposal, and airportdevelopment (Iannuzzi et al. 2002). Dredging in the LPR began in 1874 and continued until 1983, but onlymaintenance dredging occurred after 1940 (Iannuzzi and Ludwig 2004; MPI 2007b). The dredging allowedfor commercial shipping and for deeper-draft ships to dock in the lower section of the LPR. In NB, dredgingbegan in 1860, and between 1891 and 1934, a series of federal navigation channels and the large marineterminal at Port Newark were constructed. The dredge materials were used as fill at Port Newark and alongthe eastern shoreline to facilitate shoreline development. Maintenance dredging began in 1934 andcontinues to present day within NB and its tributaries. The latest dredging project, the New York/New JerseyHarbor Deepening Project, includes dredging in Ambrose Channel, Anchorage Channel, Kill van KullChannel, Newark Bay Channels, the Port Jersey Channel, Arthur Kill (to Howland Hook), and Bay RidgeChannel to 50 feet deep in order to allow safe passage of new large container ships. Of these, Newark BayChannel, Arthur Kill Channel, and Kill van Kull Channel are within the study area for the CWCM program. Inaddition to the Harbor Deepening Project, navigation channels throughout NB and the LPR are subject tomaintenance dredging that may occur periodically, and is dependent on the rate of sediment accumulation.
Quality Assurance Project PlanRI Water Column Monitoring/Small Volume Chemical Data CollectionLower Passaic River Restoration ProjectNew Jersey
Section: IntroductionRevision: 2
Date: August 2011Page 7 of 11
J:\Water\ProjectFiles\P120\12182_Passaic\Tasks\CWCM\AECOM QAPP\2011803_Rev2\clean\20110810_CWCM-sv_QAPP_Rev2.docx
The LPRSA is an operable unit of the Diamond Alkali Superfund Site. The NBSA, having been impacted byhistorical releases of PCDD/Fs and other contaminants due to tidal mixing, is also an operable unit of theDiamond Alkali Superfund Site. In 1984, the Diamond Alkali Superfund Site was placed on the NationalPriorities List as a result of past industrial operations at the Diamond Alkali plant (80-120 Lister Avenue inNewark, New Jersey), which resulted in the release of hazardous substances such as PCDDs andpesticides. Sampling of Passaic River sediments conducted during the RI/FS for the Diamond Alkali plantrevealed numerous organic and inorganic compounds including, but not limited to, PCDD/PCDFs,pesticides, PCBs, PAHs, and metals. In 1994, an investigation of a 6-mile stretch of the Passaic Rivercentered on the Diamond Alkali plant was begun. Extensive sampling showed that the sedimentsthroughout the 6-mile study area were contaminated with organic and inorganic substances. In 2001,USEPA expanded the scope of the Superfund study to encompass the 17.4-mile stretch of the PassaicRiver and added a large number of PRPs for historical releases that potentially contributed to the chemicalsfound in the river.
Physical Setting of the LPRSA and NBSA
The LPRSA can be characterized as a stratified estuary. It receives inflows of marine (salt) water fromNewark Bay and freshwater from the upper Passaic River (above Dundee Dam) and from the tributaries andthe CSO/SWOs located below Dundee Dam. The less dense freshwater flows downstream over the tidallyinfluenced salt water that, on the flood tide, moves upstream from Newark Bay. The current Conceptual SiteModel (CSM) (MPI 2007b) defines the LPRSA based on three salinity regimes specified by river mile (RM):
Freshwater River Section (RM 10–17.4) is the region usually upstream of the salt front (the saltfront rarely extends further upstream than RM 13 and is upstream of RM 10 typically about 10%of the time).
Transitional River Section (RM 6–10) is characterized by the most frequent location of the saltfront with water conditions varying from slightly brackish (or oligohaline, with salinity valuesranging from 0.5 parts per thousand [ppth] to 5 ppth) to moderately brackish (or mesohaline, withsalinity values ranging from 5 ppth to 18 ppth).
Brackish River Section (RM 0–6) is located downstream of the typical location of the salt front andis mesohaline, i.e., with salinity values ranging from 5 ppth to 18 ppth.
The location of the salt wedge (i.e., a wedge-shaped intrusion of salt water into the estuary that slopesdownward in the upstream direction) is dependent on the phase of the tide and the volume of freshwaterflowing downstream. In general, the salt wedge extends further upstream during spring flood tides and lowriver flow, although the leading edge of the wedge is pushed further downstream during high river flowevents, and may intrude into Newark Bay during storm events with very high freshwater flows. Salinitymeasured near RM 10 was shown to have a maximum salinity between 3 and 6 ppth during the summer of2005 (MPI 2007b), whereas preliminary data collected as part of the PWCM program indicate the salinity atRM 10.2 is generally less than 2 ppth under non-low flow conditions. The extent of the salt wedge iscurrently being characterized by data obtained during the PWCM program in conjunction with thehydrodynamic model.
The LPR is relatively shallow, with maximum thalweg (i.e., deepest point, laterally, across the river) depthsranging from a few feet (upper portions below Dundee Dam) to 30 feet near the mouth of the river. Afederally authorized navigation channel exists between the mouth of the river and approximately RM 15.4(United States Army Corps of Engineers [USACE] 2007). Surficial sediment grain size in the main stem ofthe LPRSA gradually transitions from coarse material (gravel or rock) typically occurring in the upstream
Quality Assurance Project PlanRI Water Column Monitoring/Small Volume Chemical Data CollectionLower Passaic River Restoration ProjectNew Jersey
Section: IntroductionRevision: 2
Date: August 2011Page 8 of 11
J:\Water\ProjectFiles\P120\12182_Passaic\Tasks\CWCM\AECOM QAPP\2011803_Rev2\clean\20110810_CWCM-sv_QAPP_Rev2.docx
reach to fine material (silts and fine sand) occurring near the mouth (MPI et al. 2006, AECOM 2010a). Somedeviations from this trend are found in lower areas of the LPRSA where steepened shorelines have beenarmored, in erosional areas associated with bridge abutments, and near river bends.
NB is approximately one mile wide and six miles long. According to USACE (1997), NB is naturally ashallow water body, with navigation channels, turning basins and docking facilities encompassing thedeepest areas of the bay. The eastern side of the bay is very shallow, with depths ranging from 0.5 to 10feet below mean low water. Areas south of Kearny Point and the Elizabeth Channel and along the westernside of the bay above and below Port Newark Channel include other smaller pockets of shallow water.
The Passaic and Hackensack Rivers flow into NB from the north. NOAA (1984) estimates an annualaverage of 1,448 cubic feet per second (cfs) of freshwater discharges to NB from the LPR making it thelargest contributor of freshwater NB; an additional 194 cfs of freshwater enters from the Hackensack River.On the south side of NB, Arthur Kill and Kill van Kull exchange saltwater with NB during tidal cycles.Suszkowski (1978) developed a sediment and water budget for NB that indicated the Kill van Kull is thelargest contributor of inorganic sediments to NB; combined with Arthur Kill, the exchange provides 64% ofinorganic sediments. The LPR and Hackensack River contribute approximately 31% of inorganic sediments.
PWCM Data Collection Subtask
The PWCM subtask was performed during two deployments: October – December 2009 (2009 falldeployment) and March - July 2010 (2010 spring/summer deployment). Data were collected to characterizecurrents and flows, temperature, salinity, and solids in the water column within the LPRSA during 2009 falldeployment, and both the LPRSA and NBSA during the 2010 spring/summer deployment. A detaileddescription of the field activities can be found in the PWCM QAPP and FSP Addendum (AECOM 2010a).These data have been provided to the USEPA and are currently undergoing review and analysis by theUSEPA and CPG Modeling Teams.
The interaction between freshwater and estuarine tidal flows within the LPRSA impacts the fate andtransport of sediment and contaminants. High freshwater flows have the potential to wash sediments intothe LPR from above Dundee Dam, CSOs, SWOs and the LPRSA tributaries, resuspend the sediments, andtransport sediments and constituents bound to those sediments out of the LPRSA and into the NBSA. Themagnitude of tidal flows during a high freshwater flow event will impact channel velocities and transport ofsediments. During low flow events on a flood tide, it may be possible for tidal action to move contaminatedsediments into the LPR from Newark Bay. Flood tidal velocities that exceed ebb tidal velocities can result innet upstream transport during extended periods of low freshwater flows.
Data on the physical characteristics of the LPR have been collected by Tierra Solutions, Inc., RutgersUniversity for New Jersey Department of Transportation (NJDOT), and MPI for the USEPA. The primaryphysical and chemical water column data sets collected during the past 15 years in the LPRSA werereviewed to establish data quality and usability. Attachment 1 of the PWCM QAPP (AECOM 2010a)provides a review of these historic data sets, some examples of the data, a review of data quality, and asummary of their collective ability to address the Data Quality Objectives (DQOs) of the study. These datasets, combined with the data collected by the CPG, were used to feed the sampling design of the programdefined in this QAPP.
The PWCM data were reviewed. These data, including the location of the salt water wedge under differentflow regimes, and the relative and estimated suspended solids concentrations on a temporal and spatialbasis, were used to develop the sampling plan. In addition to data that can be used in the risk assessments
Quality Assurance Project PlanRI Water Column Monitoring/Small Volume Chemical Data CollectionLower Passaic River Restoration ProjectNew Jersey
Section: IntroductionRevision: 2
Date: August 2011Page 9 of 11
J:\Water\ProjectFiles\P120\12182_Passaic\Tasks\CWCM\AECOM QAPP\2011803_Rev2\clean\20110810_CWCM-sv_QAPP_Rev2.docx
and food web model, the number, locations, and timing of samples in the small volume CWCM program areintended to provide data to support the calibration, validation, and sensitivity testing of the CFT model. Thestudy design of the CWCM small volume program will provide the CFT model with data from a variety offlow conditions, including extreme low or high flows.
CWCM Data Collection Subtask
Limited surface water chemical concentration data from the LPRSA have also been collected, but thesedata are much more limited than the existing physical data collected during the PWCM and are not sufficientto meet the needs of the LPR/Newark Bay (NB) Modeling Program. Previous chemical data have beencollected by MPI and the New York and New Jersey Harbor Estuary Program (NY/NJ HEP) and aresummarized in Worksheet #13 of this QAPP. Although the available data provide some understanding of theconcentration of some constituents in the LPR (particularly hydrophobic organic constituents (HOCs)), theyare not sufficient to adequately characterize the chemical concentrations throughout the LPRSA and underdifferent flow regimes for use in the calibration or validation of the CFT model. Specifically, a complete set ofthe required data collected at multiple locations throughout the LPRSA and the NBSA over a range of flowconditions does not exist. Additional data will reduce the level of uncertainty in the LPRSA water columnconcentrations for use in the RAs, FWM and CFT modeling.
The chemical data collection sampling plan presented in this document has been developed to address theidentified data needs and provide the data necessary to characterize chemical concentrations in the watercolumn of the LPRSA and NBSA. The CWCM program is intended to characterize changes in chemicalconcentrations associated with the movement of suspended sediments over a range of tides and flowregimes.
Broadly defined, the goals of the CWCM Data Collection Program are to:
1. Collect data to support the calibration, validation, and sensitivity analysis of the CFT model. Thedata will provide information to develop the inputs to the model and to characterize the transport ofcontaminants in the LPRSA and NBSA, including the preliminary calibration of the flux ofcontaminants from the sediments to the water column through routine monitoring events. Watercolumn contaminant concentration data collected in the LPRSA and NBSA with sufficient spatialcoverage and frequency and over a range of flow conditions will be used to characterize potentialgradients, mixing and general inputs to the system.
2. Collect data to characterize the impacts of storm-related high flow conditions on contaminantsources and transport in which resuspension of contaminants from the sediment bed andsubsequent deposition from the water column are expected to dominate over other transportprocesses. Water column contaminant concentration data collected during high flow conditions willbe used to assess the potential for increased contaminant loading to the water column fromupstream sources and/or through resuspension of existing sediments.
3. Collect data to characterize the transport of contaminants under low flow conditions and maximumtidal excursion, which occurs during low flow conditions at spring tides. Water column contaminantconcentration data collected during a combination of low flow and spring tide conditions will be usedto better assess the up-river transport potential and support the understanding of the fate andtransport for the LPRSA CSM and LPR/NB Model.
4. Estimate average water column concentrations of contaminants in the LPRSA over several seasonsand flows for use in exposure point concentration estimation for the HHRA, ERA and FWM.
Quality Assurance Project PlanRI Water Column Monitoring/Small Volume Chemical Data CollectionLower Passaic River Restoration ProjectNew Jersey
Section: IntroductionRevision: 2
Date: August 2011Page 10 of 11
J:\Water\ProjectFiles\P120\12182_Passaic\Tasks\CWCM\AECOM QAPP\2011803_Rev2\clean\20110810_CWCM-sv_QAPP_Rev2.docx
These monitoring goals have been designed to support the ongoing RI site characterization and modelingefforts. The goals are defined in more detail in Worksheet #11 to this document: PQOs. The PQOs includethe DQOs of the project (i.e., what data are needed and how they will be collected).
The field program to achieve the goals stated above is presented in Appendix A: Field Sampling PlanAddendum, which describes the following elements:
Routine Events - Water sample collection is planned at seventeen locations in the LPRSA (includingthe LPRSA tributaries), above Dundee Dam, Newark Bay, and Newark Bay at its confluences with theHackensack River, Arthur Kill, and Kill van Kull for chemical analysis. A total of five hundred forty(540) samples are planned during five routine events spread over winter, spring and summer. Thesamples will include whole water (unfiltered) and filtered water samples, depending on the analyte.Samples will be filtered for dissolved metals (arsenic, cadmium, chromium, copper, lead, mercury,nickel, selenium, and zinc), dissolved methyl mercury, hexavalent chromium, and dissolved solids.Organic carbon will be analyzed for dissolved, total, and particulate phase. Samples for chlorophyll awill consist of the residue from a filtered aliquot of water (i.e., filtration at the laboratory). All othersamples will be whole water. The sampling events will be conducted during typical medium flows (400- 3,000 cfs at Dundee Dam) and will likely bracket several flow regimes over the tidal cycle as well ascapture spring and neap tide conditions. Samples will be collected from the deepest part of the river(thalweg) and at two depths (surface and near bottom) for the stations in RM 0 – 17.4 of the LPR andNBSA, and at mid-depth for locations above Dundee Dam and the LPRSA tributaries. The proposeddepths (3 feet off the bottom and 3 feet from the surface) were selected with the goal of sampling therelevant layer while avoiding artifacts associated with sampling in close proximity to the sediment bed,the pycnocline, and the water surface. The thalweg will be the targeted location as it is assumed thatthe denser layer with net inflow is located in the deepest part of the cross section. In addition, thehighest velocities are commonly observed at the thalweg so that the rate of discharge (i.e.,volume/time) is highest in that location and the collected samples will best represent the dominant fluxpast that cross-section.
High Flow Event - Water sample collection is planned during high flow conditions (>3,000 cfs atDundee Dam) at seventeen locations in the LPRSA (including the LPRSA tributaries), above DundeeDam, Newark Bay, and Newark Bay at its confluences with the Hackensack River, Arthur Kill, and Killvan Kull for chemical analysis. Stations will be generally co-located with stations occupied during theRoutine Events. Fourteen of the seventeen stations will be sampled four times each throughout thepredicted storm hydrograph; the station above Dundee Dam will be sampled six times throughout thepredicted storm hydrograph. The Arthur Kill and Kill van Kull will be sampled just before high and lowslack tides. A total of two hundred twenty-eight (228) samples will be collected through two separatehigh flow events. The samples will include whole water (unfiltered) and filtered water samples,depending on analyte. Samples will be filtered for dissolved metals (arsenic, cadmium, chromium,copper, lead, mercury, nickel, selenium, and zinc), dissolved methyl mercury, hexavalent chromium,and dissolved solids. Organic carbon will be analyzed for dissolved, total, and particulate phase.Samples for chlorophyll a will consist of the residue from a filtered aliquot of water (i.e., filtration at thelaboratory). All other samples will be whole water. Samples will be collected from two depths (surfaceand near bottom) at the thalweg for the stations in the LPR (RM 0- 17.4) and NBSA, and at mid-depthfor locations above Dundee Dam and the LPRSA tributaries.
Low Flow/Spring Tide Event - Water sample collection is planned during low flow and spring tideconditions at nine locations in the LPRSA and above Dundee Dam for laboratory analysis. Stationswill be generally co-located with Routine Event stations. A total of forty-four (44) samples will becollected during the low flow/spring tide event with each station sampled four times during the tidal
Quality Assurance Project PlanRI Water Column Monitoring/Small Volume Chemical Data CollectionLower Passaic River Restoration ProjectNew Jersey
Section: IntroductionRevision: 2
Date: August 2011Page 11 of 11
J:\Water\ProjectFiles\P120\12182_Passaic\Tasks\CWCM\AECOM QAPP\2011803_Rev2\clean\20110810_CWCM-sv_QAPP_Rev2.docx
cycle. The samples will include whole water (unfiltered) and filtered water samples, depending onanalyte. Samples will be filtered for dissolved metals (arsenic, cadmium, chromium, copper, lead,mercury, nickel, selenium, and zinc), dissolved methyl mercury, hexavalent chromium, and dissolvedsolids. Organic carbon will be analyzed for dissolved, total, and particulate phase. Samples forchlorophyll a will consist of the residue from a filtered aliquot of water (i.e., filtration at the laboratory).All other samples will be whole water. Stations in the lower 17.4 miles of the LPR will be sampled attwo depths; stations above Dundee Dam and in the LPRSA tributaries will be sampled from onedepth.
As described above, the LPRSA encompasses 17.4 miles of the LPR from Newark Bay upstream to theDundee Dam, and three major tributaries (Saddle River, Second River, and Third River). In addition to riverflow originating above the Dundee Dam, the LPR receives flows from tributaries (e.g., Saddle River, SecondRiver, and Third River) and numerous CSOs and SWOs that provide drainage to the adjacent urbanwatershed. To provide information to support the calibration and validation of the LPR/NB CFT model,Newark Bay and its major tributaries (Hackensack River, Arthur Kill and Kill van Kull) have been included inthe planned Routine and High Flow Events.
Quality Assurance Project Plan RI Water Column Monitoring/Small Volume Chemical Data Collection Lower Passaic River Restoration Project New Jersey
Section: Work sheet #1 Revision: 3
Date: July 2012 Page 1 of 1
Q:\mw2007\Projects\60145884\V110\20120717_CWCM-sv_QAPP_Rev3.docx
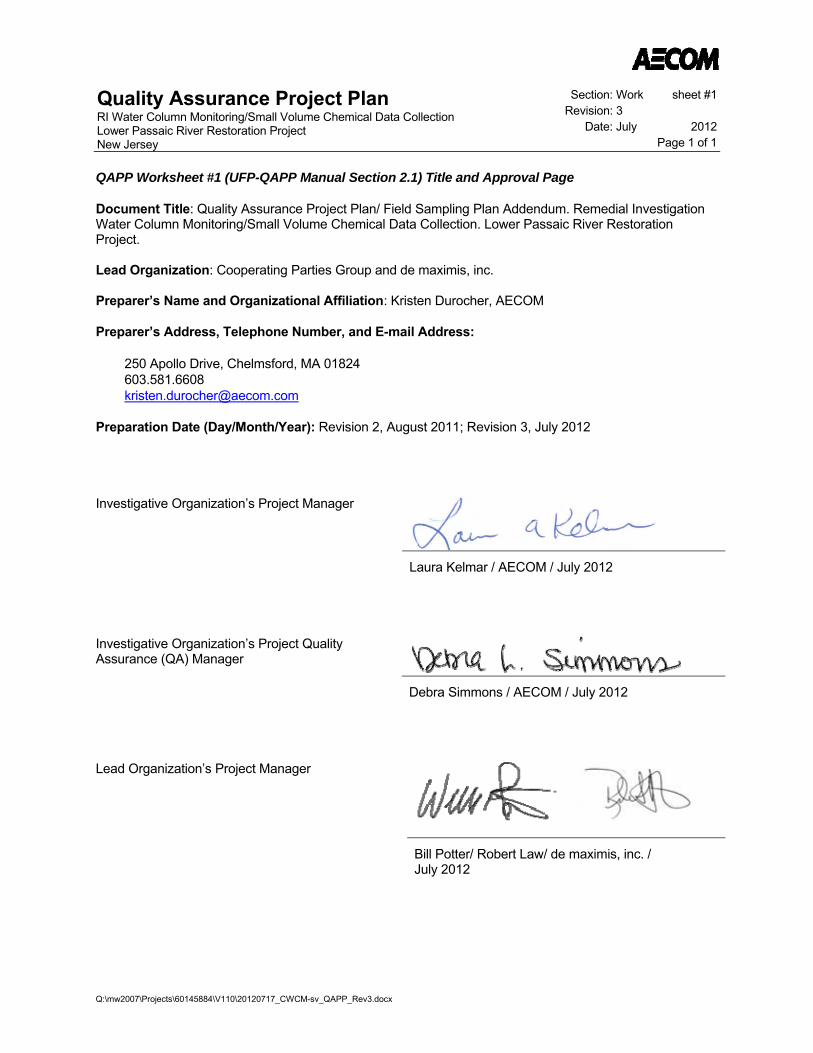
QAPP Worksheet #1 (UFP-QAPP Manual Section 2.1) Title and Approval Page
Document Title: Quality Assurance Project Plan/ Field Sampling Plan Addendum. Remedial Investigation Water Column Monitoring/Small Volume Chemical Data Collection. Lower Passaic River Restoration Project. Lead Organization: Cooperating Parties Group and de maximis, inc. Preparer’s Name and Organizational Affiliation: Kristen Durocher, AECOM Preparer’s Address, Telephone Number, and E-mail Address:
250 Apollo Drive, Chelmsford, MA 01824 603.581.6608 [email protected]
Preparation Date (Day/Month/Year): Revision 2, August 2011; Revision 3, July 2012 Investigative Organization’s Project Manager
Laura Kelmar / AECOM / July 2012 Investigative Organization’s Project Quality Assurance (QA) Manager
Debra Simmons / AECOM / July 2012 Lead Organization’s Project Manager
Bill Potter/ Robert Law/ de maximis, inc. / July 2012
Quality Assurance Project PlanRI Water Column Monitoring/Small Volume Chemical Data CollectionLower Passaic River Restoration ProjectNew Jersey
Section: Worksheet #2Revision: 2
Date: August 2011Page 1 of 5
J:\Water\ProjectFiles\P120\12182_Passaic\Tasks\CWCM\AECOM QAPP\2011803_Rev2\clean\20110810_CWCM-sv_QAPP_Rev2.docx
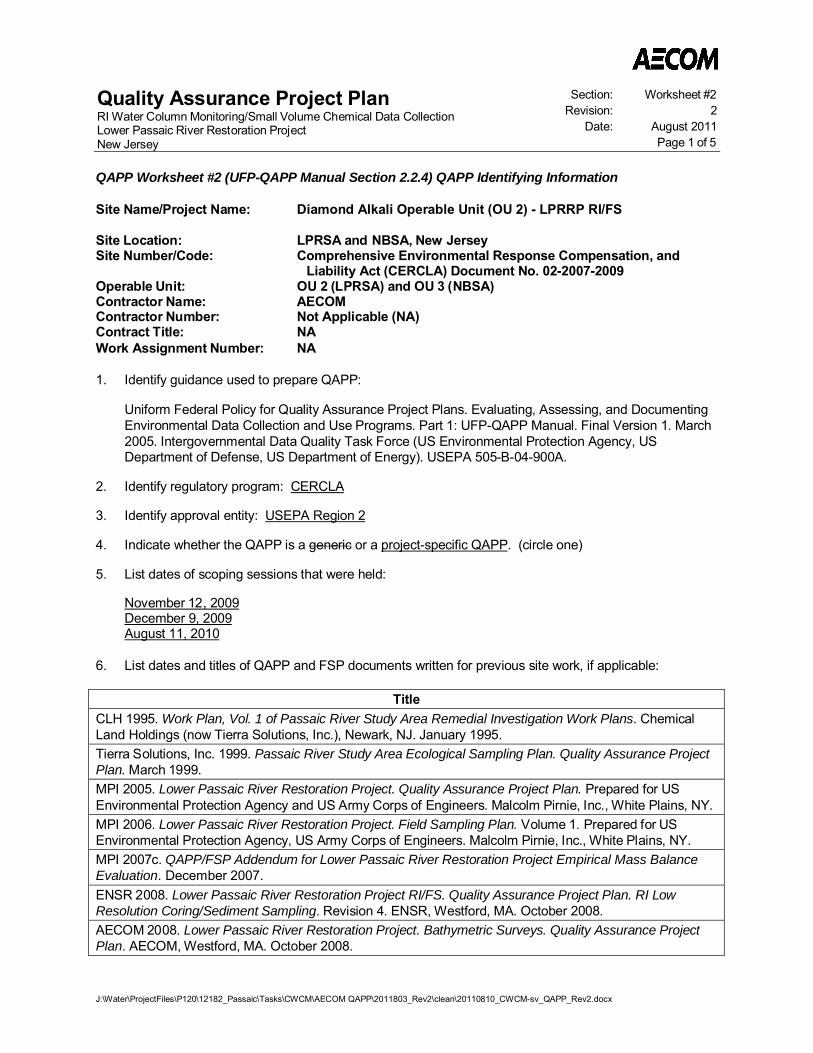
QAPP Worksheet #2 (UFP-QAPP Manual Section 2.2.4) QAPP Identifying Information
Site Name/Project Name: Diamond Alkali Operable Unit (OU 2) - LPRRP RI/FS
Site Location: LPRSA and NBSA, New JerseySite Number/Code: Comprehensive Environmental Response Compensation, and
Liability Act (CERCLA) Document No. 02-2007-2009Operable Unit: OU 2 (LPRSA) and OU 3 (NBSA)Contractor Name: AECOMContractor Number: Not Applicable (NA)Contract Title: NAWork Assignment Number: NA
1. Identify guidance used to prepare QAPP:
Uniform Federal Policy for Quality Assurance Project Plans. Evaluating, Assessing, and DocumentingEnvironmental Data Collection and Use Programs. Part 1: UFP-QAPP Manual. Final Version 1. March2005. Intergovernmental Data Quality Task Force (US Environmental Protection Agency, USDepartment of Defense, US Department of Energy). USEPA 505-B-04-900A.
2. Identify regulatory program: CERCLA
3. Identify approval entity: USEPA Region 2
4. Indicate whether the QAPP is a generic or a project-specific QAPP. (circle one)
5. List dates of scoping sessions that were held:
November 12, 2009December 9, 2009August 11, 2010
6. List dates and titles of QAPP and FSP documents written for previous site work, if applicable:
TitleCLH 1995. Work Plan, Vol. 1 of Passaic River Study Area Remedial Investigation Work Plans. ChemicalLand Holdings (now Tierra Solutions, Inc.), Newark, NJ. January 1995.Tierra Solutions, Inc. 1999. Passaic River Study Area Ecological Sampling Plan. Quality Assurance ProjectPlan. March 1999.MPI 2005. Lower Passaic River Restoration Project. Quality Assurance Project Plan. Prepared for USEnvironmental Protection Agency and US Army Corps of Engineers. Malcolm Pirnie, Inc., White Plains, NY.MPI 2006. Lower Passaic River Restoration Project. Field Sampling Plan. Volume 1. Prepared for USEnvironmental Protection Agency, US Army Corps of Engineers. Malcolm Pirnie, Inc., White Plains, NY.MPI 2007c. QAPP/FSP Addendum for Lower Passaic River Restoration Project Empirical Mass BalanceEvaluation. December 2007.ENSR 2008. Lower Passaic River Restoration Project RI/FS. Quality Assurance Project Plan. RI LowResolution Coring/Sediment Sampling. Revision 4. ENSR, Westford, MA. October 2008.AECOM 2008. Lower Passaic River Restoration Project. Bathymetric Surveys. Quality Assurance ProjectPlan. AECOM, Westford, MA. October 2008.
Quality Assurance Project PlanRI Water Column Monitoring/Small Volume Chemical Data CollectionLower Passaic River Restoration ProjectNew Jersey
Section: Worksheet #2Revision: 2
Date: August 2011Page 2 of 5
QAPP Worksheet #2 (UFP-QAPP Manual Section 2.2.4) QAPP Identifying Information
J:\Water\ProjectFiles\P120\12182_Passaic\Tasks\CWCM\AECOM QAPP\2011803_Rev2\clean\20110810_CWCM-sv_QAPP_Rev2.docx
TitleWindward 2009a. Lower Passaic River Restoration Project. Lower Passaic River Study Area RI/FS. QualityAssurance Project Plan: Fish and Decapod Crustacean Tissue Collection for Chemical Analysis and FishCommunity Survey. Final. Prepared for Cooperating Parties Group, Newark, New Jersey. WindwardEnvironmental LLC, Seattle, WA. August 2009.Windward 2009b. Lower Passaic River Restoration Project. Lower Passaic River Study Area RI/FS. QualityAssurance Project Plan: Surface Sediment Chemical Analyses and Benthic Invertebrate Toxicity andBioaccumulation Testing. Final. Prepared for Cooperating Parties Group, Newark, New Jersey. October 8,2009. Windward Environmental LLC, Seattle, WA. October 2009.AECOM 2010a. Quality Assurance Project Plan/Field Sampling Plan Addendum. Remedial InvestigationWater Column Monitoring/Physical Data Collection for the Lower Passaic River, Newark Bay and WetWeather Monitoring. Lower Passaic River Restoration Project. Revision 4. AECOM, Westford, MA. March2010.Tierra Solutions, Inc. 2011. Combined Sewer Overflow/Stormwater Outfall Investigation Quality AssuranceProject Plan. Lower Passaic River Study Area. Revision 0. May 25, 2011.
7. List organizational partners (stakeholders) and connection with lead organization:
This work will be performed under the requirements of the Settlement Agreement and SOW withoversight conducted by USEPA and its government partners. de maximis, inc. (acting as ProjectCoordinator for the CPG), AECOM, and its subcontractors, are conducting the work on behalf of theCPG and Tierra Solutions, Inc.
8. List data users:__See item #7 above.__
9. If any required QAPP elements and required information are not applicable to the project, then circlethe omitted QAPP elements and required information on the attached table.Provide an explanation for their exclusion below: N/A
Quality Assurance Project PlanRI Water Column Monitoring/Small Volume Chemical Data CollectionLower Passaic River Restoration ProjectNew Jersey
Section: Worksheet #2Revision: 2
Date: August 2011Page 3 of 5
QAPP Worksheet #2 (UFP-QAPP Manual Section 2.2.4) QAPP Identifying Information
J:\Water\ProjectFiles\P120\12182_Passaic\Tasks\CWCM\AECOM QAPP\2011803_Rev2\clean\20110810_CWCM-sv_QAPP_Rev2.docx
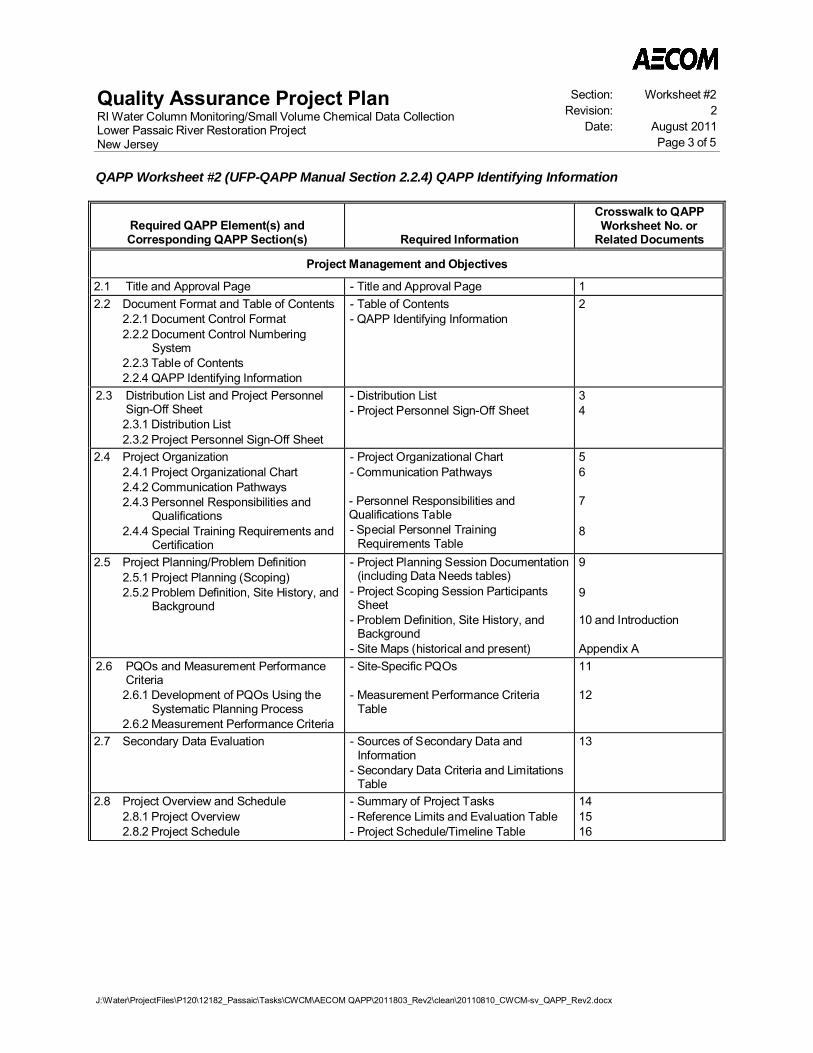
Required QAPP Element(s) andCorresponding QAPP Section(s) Required Information
Crosswalk to QAPPWorksheet No. or
Related Documents
Project Management and Objectives
2.1 Title and Approval Page - Title and Approval Page 12.2 Document Format and Table of Contents
2.2.1 Document Control Format2.2.2 Document Control Numbering
System2.2.3 Table of Contents2.2.4 QAPP Identifying Information
- Table of Contents- QAPP Identifying Information
2
2.3 Distribution List and Project PersonnelSign-Off Sheet2.3.1 Distribution List2.3.2 Project Personnel Sign-Off Sheet
- Distribution List- Project Personnel Sign-Off Sheet
34
2.4 Project Organization2.4.1 Project Organizational Chart2.4.2 Communication Pathways2.4.3 Personnel Responsibilities and
Qualifications2.4.4 Special Training Requirements and
Certification
- Project Organizational Chart- Communication Pathways
- Personnel Responsibilities andQualifications Table- Special Personnel Training
Requirements Table
56
7
8
2.5 Project Planning/Problem Definition2.5.1 Project Planning (Scoping)2.5.2 Problem Definition, Site History, and
Background
- Project Planning Session Documentation(including Data Needs tables)
- Project Scoping Session ParticipantsSheet
- Problem Definition, Site History, andBackground
- Site Maps (historical and present)
9
9
10 and Introduction
Appendix A2.6 PQOs and Measurement Performance
Criteria2.6.1 Development of PQOs Using the
Systematic Planning Process2.6.2 Measurement Performance Criteria
- Site-Specific PQOs
- Measurement Performance CriteriaTable
11
12
2.7 Secondary Data Evaluation - Sources of Secondary Data andInformation
- Secondary Data Criteria and LimitationsTable
13
2.8 Project Overview and Schedule2.8.1 Project Overview2.8.2 Project Schedule
- Summary of Project Tasks- Reference Limits and Evaluation Table- Project Schedule/Timeline Table
141516

Quality Assurance Project PlanRI Water Column Monitoring/Small Volume Chemical Data CollectionLower Passaic River Restoration ProjectNew Jersey
Section: Worksheet #2Revision: 2
Date: August 2011Page 4 of 5
QAPP Worksheet #2 (UFP-QAPP Manual Section 2.2.4) QAPP Identifying Information
J:\Water\ProjectFiles\P120\12182_Passaic\Tasks\CWCM\AECOM QAPP\2011803_Rev2\clean\20110810_CWCM-sv_QAPP_Rev2.docx
Required QAPP Element(s) andCorresponding QAPP Section(s) Required Information
Crosswalk to QAPPWorksheet No. or
Related Documents
Measurement/Data Acquisition
3.1 Sampling Tasks3.1.1 Sampling Process Design and
Rationale3.1.2 Sampling Procedures and
Requirements3.1.2.1 Sampling Collection
Procedures3.1.2.2 Sample Containers, Volume,
and Preservation3.1.2.3 Equipment/Sample
Containers Cleaning andDecontaminationProcedures
3.1.2.4 Field Equipment Calibration,Maintenance, Testing, andInspection Procedures
3.1.2.5 Supply Inspection andAcceptance Procedures
3.1.2.6 Field DocumentationProcedures
- Sampling Design and Rationale- Sample Location Map- Sampling Locations and Methods/
Standard Operating Procedure (SOP)Requirements Table
- Analytical Methods/SOP RequirementsTable
- Field Quality Control (QC) SampleSummary Table
- Sampling SOPs- Project Sampling SOP References Table- Field Equipment Calibration,
Maintenance, Testing, and InspectionTable
17Figure 1, Appendix A18
19
20
Appendix B2122
3.2 Analytical Tasks3.2.1 Analytical SOPs3.2.2 Analytical Instrument Calibration
Procedures3.2.3 Analytical Instrument and
Equipment Maintenance, Testing,and Inspection Procedures
3.2.4 Analytical Supply Inspection andAcceptance Procedures
- Analytical SOPs- Analytical SOP References Table- Analytical Instrument Calibration Table- Analytical Instrument and Equipment
Maintenance, Testing, and InspectionTable
Appendix C232425
3.3 Sample Collection Documentation,Handling, Tracking, and CustodyProcedures3.3.1 Sample Collection Documentation3.3.2 Sample Handling and Tracking
System3.3.3 Sample Custody
- Sample Collection Documentation- Handling, Tracking, and Custody SOPs
- Sample Container Identification- Sample Handling Flow- Example Chain-of-Custody Form and
Seal
26Appendix B
2727Appendix B
3.4 QC Samples3.4.1 Sampling QC Samples3.4.2 Analytical QC Samples
- QC Samples Table 28
3.5 Data Management Tasks3.5.1 Project Documentation and Records3.5.2 Data Package Deliverables3.5.3 Data Reporting Formats3.5.4 Data Handling and Management3.5.5 Data Tracking and Control
- Project Documents and Records Table- Analytical Services Table- Data Management Procedures
2930Data Management Plan(DMP) (AECOM 2010b)
Quality Assurance Project PlanRI Water Column Monitoring/Small Volume Chemical Data CollectionLower Passaic River Restoration ProjectNew Jersey
Section: Worksheet #2Revision: 2
Date: August 2011Page 5 of 5
QAPP Worksheet #2 (UFP-QAPP Manual Section 2.2.4) QAPP Identifying Information
J:\Water\ProjectFiles\P120\12182_Passaic\Tasks\CWCM\AECOM QAPP\2011803_Rev2\clean\20110810_CWCM-sv_QAPP_Rev2.docx
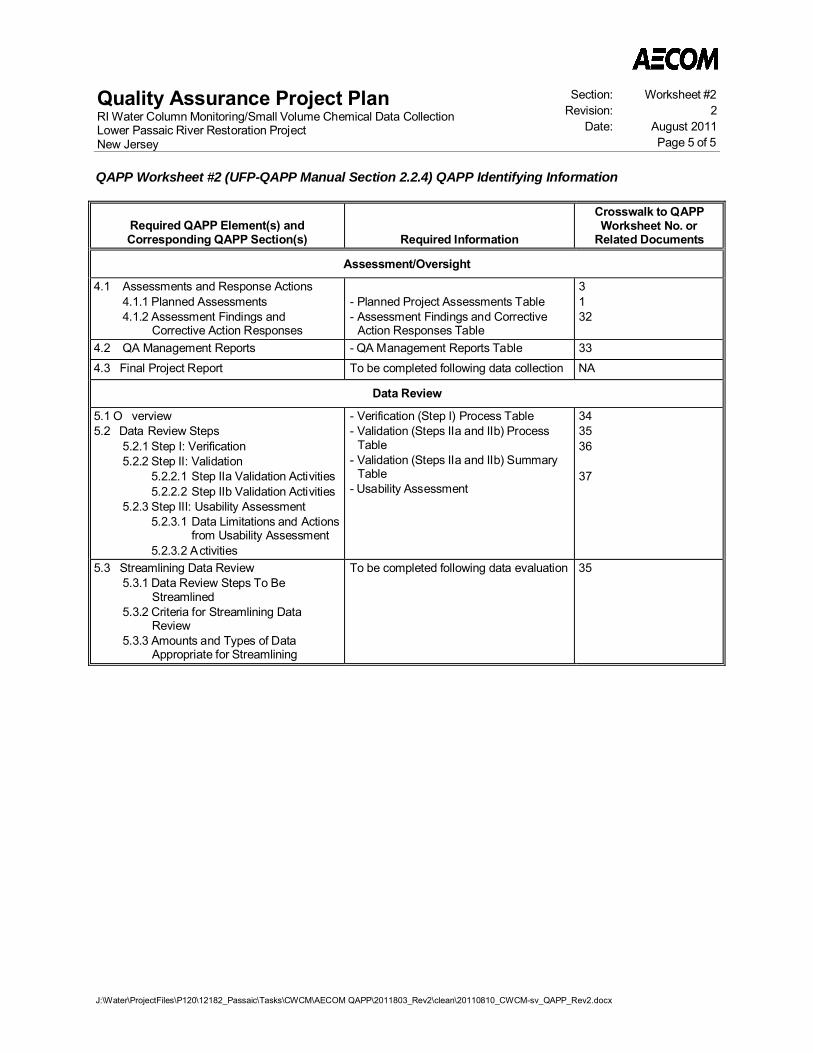
Required QAPP Element(s) andCorresponding QAPP Section(s) Required Information
Crosswalk to QAPPWorksheet No. or
Related Documents
Assessment/Oversight
4.1 Assessments and Response Actions4.1.1 Planned Assessments4.1.2 Assessment Findings and
Corrective Action Responses
- Planned Project Assessments Table- Assessment Findings and Corrective
Action Responses Table
3132
4.2 QA Management Reports - QA Management Reports Table 334.3 Final Project Report To be completed following data collection NA
Data Review
5.1 O verview5.2 Data Review Steps
5.2.1 Step I: Verification5.2.2 Step II: Validation
5.2.2.1 Step IIa Validation Activities5.2.2.2 Step IIb Validation Activities
5.2.3 Step III: Usability Assessment5.2.3.1 Data Limitations and Actions
from Usability Assessment5.2.3.2 Activities
- Verification (Step I) Process Table- Validation (Steps IIa and IIb) Process
Table- Validation (Steps IIa and IIb) Summary
Table- Usability Assessment
343536
37
5.3 Streamlining Data Review5.3.1 Data Review Steps To Be
Streamlined5.3.2 Criteria for Streamlining Data
Review5.3.3 Amounts and Types of Data
Appropriate for Streamlining
To be completed following data evaluation 35
Quality Assurance Project Plan RI Water Column Monitoring/Small Volume Chemical Data Collection Lower Passaic River Restoration Project New Jersey
Section: Work sheet #3 Revision: 2
Date: Augu st 2011 Page 1 of 2
J:\Water\ProjectFiles\P120\12182_Passaic\Tasks\CWCM\AECOM QAPP\2011803_Rev2\clean\20110810_CWCM-sv_QAPP_Rev2.docx
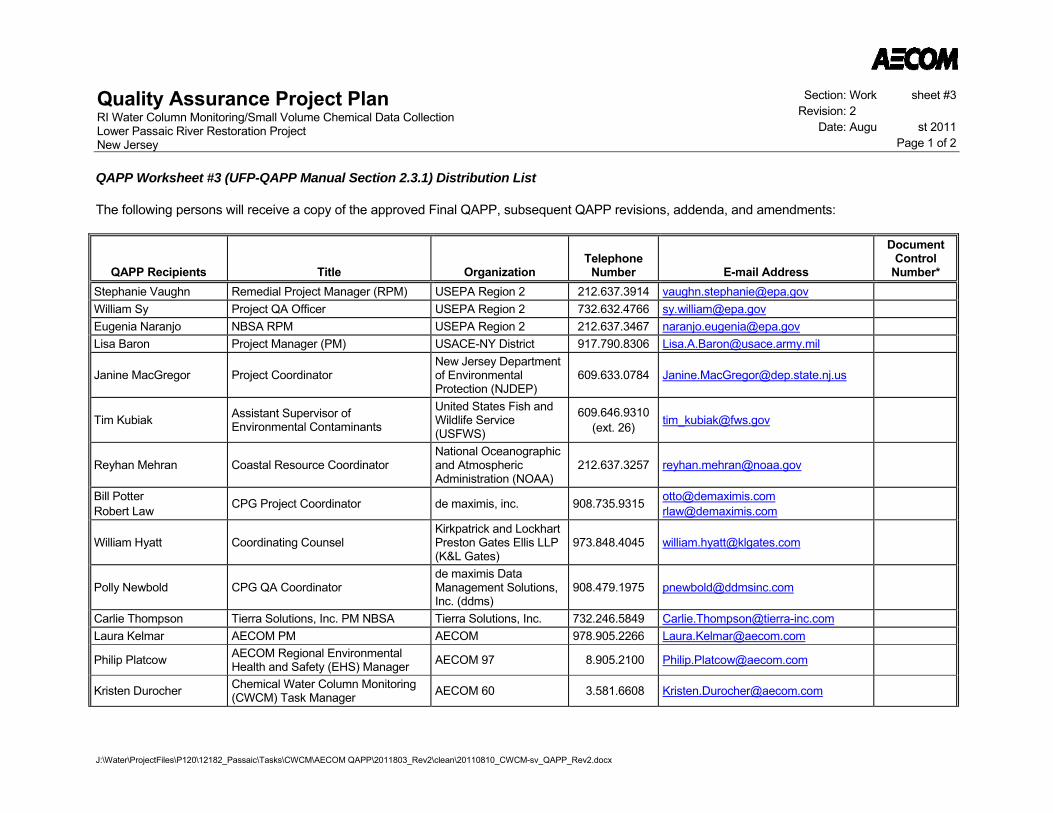
QAPP Worksheet #3 (UFP-QAPP Manual Section 2.3.1) Distribution List
The following persons will receive a copy of the approved Final QAPP, subsequent QAPP revisions, addenda, and amendments:
QAPP Recipients Title Organization Telephone
Number E-mail Address
Document Control
Number* Stephanie Vaughn Remedial Project Manager (RPM) USEPA Region 2 212.637.3914 [email protected] William Sy Project QA Officer USEPA Region 2 732.632.4766 [email protected] Eugenia Naranjo NBSA RPM USEPA Region 2 212.637.3467 [email protected] Lisa Baron Project Manager (PM) USACE-NY District 917.790.8306 [email protected]
Janine MacGregor Project Coordinator New Jersey Department of Environmental Protection (NJDEP)
609.633.0784 [email protected]
Tim Kubiak Assistant Supervisor of Environmental Contaminants
United States Fish and Wildlife Service (USFWS)
609.646.9310 (ext. 26) [email protected]
Reyhan Mehran Coastal Resource Coordinator National Oceanographic and Atmospheric Administration (NOAA)
212.637.3257 [email protected]
Bill Potter Robert Law CPG Project Coordinator de maximis, inc. 908.735.9315 [email protected]
William Hyatt Coordinating Counsel Kirkpatrick and Lockhart Preston Gates Ellis LLP (K&L Gates)
973.848.4045 [email protected]
Polly Newbold CPG QA Coordinator de maximis Data Management Solutions, Inc. (ddms)
908.479.1975 [email protected]
Carlie Thompson Tierra Solutions, Inc. PM NBSA Tierra Solutions, Inc. 732.246.5849 [email protected] Laura Kelmar AECOM PM AECOM 978.905.2266 [email protected]
Philip Platcow AECOM Regional Environmental Health and Safety (EHS) Manager AECOM 97 8.905.2100 [email protected]
Kristen Durocher Chemical Water Column Monitoring (CWCM) Task Manager AECOM 60 3.581.6608 [email protected]

Quality Assurance Project Plan RI Water Column Monitoring/Small Volume Chemical Data Collection Lower Passaic River Restoration Project New Jersey
Section: Work sheet #3 Revision: 2
Date: Augu st 2011 Page 2 of 2
QAPP Worksheet #3 (UFP-QAPP Manual Section 2.3.1) Distribution List
J:\Water\ProjectFiles\P120\12182_Passaic\Tasks\CWCM\AECOM QAPP\2011803_Rev2\clean\20110810_CWCM-sv_QAPP_Rev2.docx
QAPP Recipients Title Organization Telephone
Number E-mail Address
Document Control
Number*
Don Kretchmer Field Team Manager (FTM)/Site Safety Officer (SSO) AECOM 60 3.387.0532 [email protected]
Debra Simmons Project QA Manager AECOM 978.905.2399 [email protected] Bob Shoemaker Robert Kennedy
Project Chemist Alternate Project Chemist AECOM 978.905.2393
978.905.2269 [email protected] [email protected]
James Herberich Data Management Task Manager AECOM 978.905.2243 [email protected] Lisa Krowitz Data Validation Coordinator AECOM 978.905.2278 [email protected] Betsy Ruffle HHRA Task Leader AECOM 978.905.2377 [email protected]
Rafael Canizares Modeling Team Task Leader and Liaison Moffatt & Nichol 212.768.7454 [email protected]
Mike Johns ERA Task Leader Windward Environmental 206.378.1364 [email protected]
Ken Cadmus Vessel Subcontractor Lead Ocean Survey, Inc. (OSI) 860.388.4631 [email protected]
Other project team members and stakeholders
*Uncontrolled electronic copies will be available on www.ourpassaic.org
Quality Assurance Project PlanRI Water Column Monitoring/Small Volume Chemical Data CollectionLower Passaic River Restoration ProjectNew Jersey
Section: Worksheet #4Revision: 2
Date: August 2011Page 1 of 2
J:\Water\ProjectFiles\P120\12182_Passaic\Tasks\CWCM\AECOM QAPP\2011803_Rev2\clean\20110810_CWCM-sv_QAPP_Rev2.docx
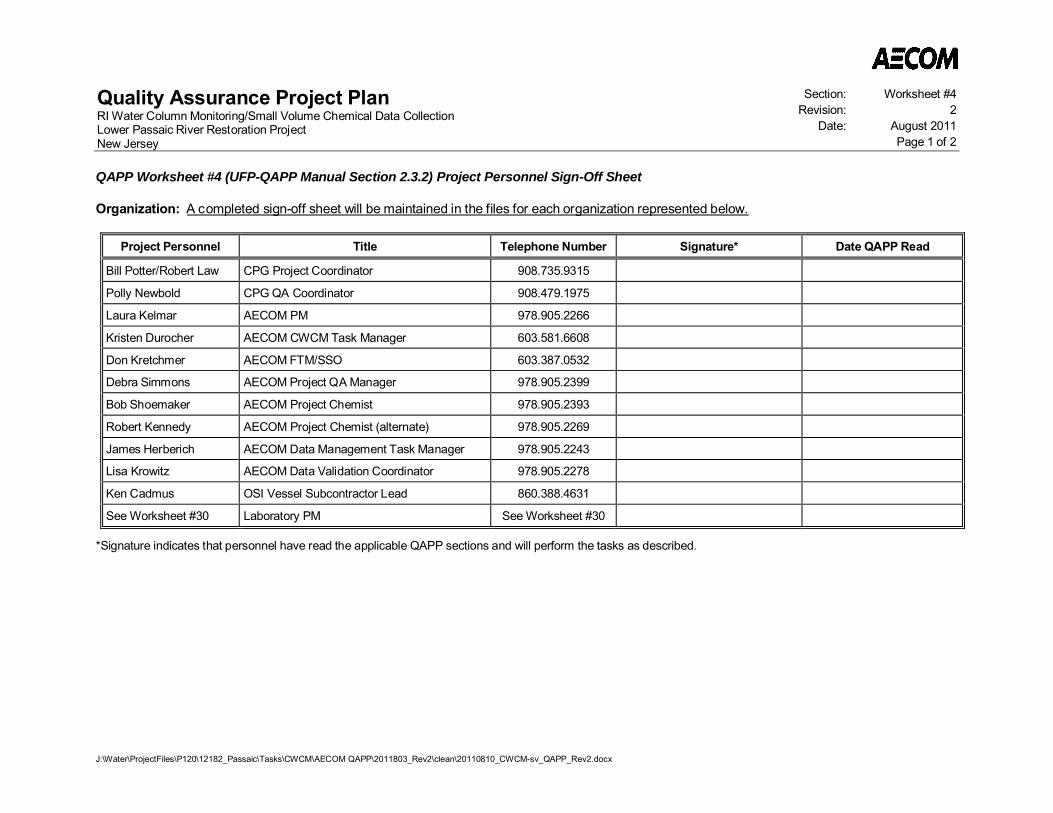
QAPP Worksheet #4 (UFP-QAPP Manual Section 2.3.2) Project Personnel Sign-Off Sheet
Organization: A completed sign-off sheet will be maintained in the files for each organization represented below.
Project Personnel Title Telephone Number Signature* Date QAPP Read
Bill Potter/Robert Law CPG Project Coordinator 908.735.9315
Polly Newbold CPG QA Coordinator 908.479.1975
Laura Kelmar AECOM PM 978.905.2266
Kristen Durocher AECOM CWCM Task Manager 603.581.6608
Don Kretchmer AECOM FTM/SSO 603.387.0532
Debra Simmons AECOM Project QA Manager 978.905.2399
Bob Shoemaker AECOM Project Chemist 978.905.2393
Robert Kennedy AECOM Project Chemist (alternate) 978.905.2269
James Herberich AECOM Data Management Task Manager 978.905.2243
Lisa Krowitz AECOM Data Validation Coordinator 978.905.2278
Ken Cadmus OSI Vessel Subcontractor Lead 860.388.4631
See Worksheet #30 Laboratory PM See Worksheet #30
*Signature indicates that personnel have read the applicable QAPP sections and will perform the tasks as described.
Quality Assurance Project PlanRI Water Column Monitoring/Small Volume Chemical Data CollectionLower Passaic River Restoration ProjectNew Jersey
Section: Worksheet #4Revision: 2
Date: August 2011Page 2 of 2
QAPP Worksheet #4 (UFP-QAPP Manual Section 2.3.2) Project Personnel Sign-Off Sheet
J:\Water\ProjectFiles\P120\12182_Passaic\Tasks\CWCM\AECOM QAPP\2011803_Rev2\clean\20110810_CWCM-sv_QAPP_Rev2.docx
Organization:
Project Personnel Title Telephone Number Signature* Date QAPP Read
*Signature indicates that personnel have read the applicable QAPP sections and will perform the tasks as described.

Quality Assurance Project PlanRI Water Column Monitoring/Small Volume Chemical Data CollectionLower Passaic River Restoration ProjectNew Jersey
Section: Worksheet #5Revision: 2
Date: August 2011Page 1 of 1
J:\Water\ProjectFiles\P120\12182_Passaic\Tasks\CWCM\AECOM QAPP\2011803_Rev2\clean\20110810_CWCM-sv_QAPP_Rev2.docx
QAPP Worksheet #5 (UFP-QAPP Manual Section 2.4.1) Project Organizational Chart

Quality Assurance Project PlanRI Water Column Monitoring/Small Volume Chemical Data CollectionLower Passaic River Restoration ProjectNew Jersey
Section: Worksheet #6Revision: 2
Date: August 2011Page 1 of 5
J:\Water\ProjectFiles\P120\12182_Passaic\Tasks\CWCM\AECOM QAPP\2011803_Rev2\clean\20110810_CWCM-sv_QAPP_Rev2.docx
QAPP Worksheet #6 (UFP-QAPP Manual Section 2.4.2) Communication Pathways
Communication Drivers Responsible Entity Name Phone NumberProcedure
(timing, pathways, etc.)
Field activities status andissues
AECOM FTM Don Kretchmer 603.387.0532 Communicate daily, or as needed, with AECOMfield personnel, subcontractors, and AECOMCWCM Task Manager directly, or via e-mail orphone.Minor work plan deviations and/or proposedrevisions will be documented and communicatedin writing, with a copy sent to USEPA.
CPG Project Coordinator Bill Potter/Robert Law(de maximis, inc.)
908.735.9315 Communicate daily with USEPA RPM via e-mailor phone.
Sampling schedule includingimplementation of flow-dependent sampling
CPG Project Coordinator Bill Potter/Robert Law(de maximis, inc.)
908.735.9315 The USEPA will be notified as soon as the CPGand its contractors confirm that conditions appearto be favorable for a high flow or low flowsampling event.
Sampling progress/laboratorycoordination
AECOM CWCM Task Manager Kristen Durocher 603.581.6608 Communicate daily, or as needed, with AECOMFTM and Project Chemist via e-mail or phone.
Health and safety briefings andupdates
AECOM SSO Don Kretchmer 603.387.0532 Communicate daily, or as needed, with fieldpersonnel and boat operators directly, or via e-mail or phone.
Significant health and safetyconcerns or incidents
AECOM SSO Don Kretchmer 603.387.0532 Communicate immediately with AECOM RegionalEHS Manager, CWCM Task Manager, andAECOM PM.
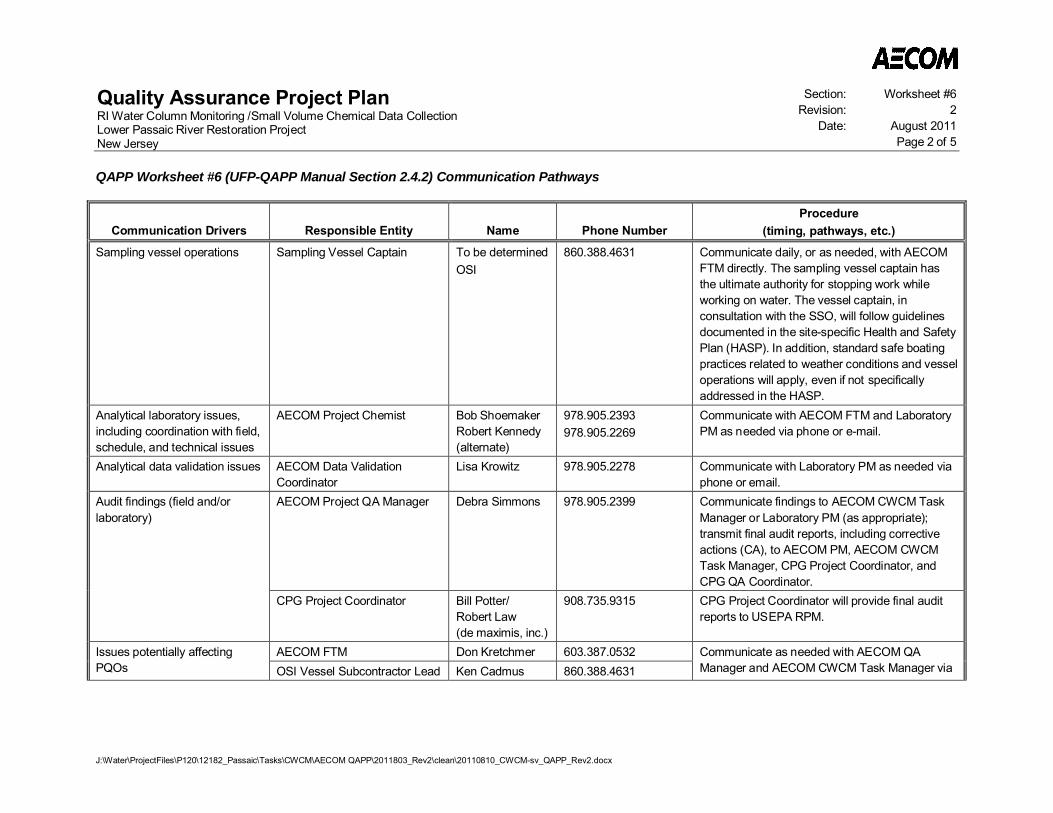
Quality Assurance Project PlanRI Water Column Monitoring /Small Volume Chemical Data CollectionLower Passaic River Restoration ProjectNew Jersey
Section: Worksheet #6Revision: 2
Date: August 2011Page 2 of 5
QAPP Worksheet #6 (UFP-QAPP Manual Section 2.4.2) Communication Pathways
J:\Water\ProjectFiles\P120\12182_Passaic\Tasks\CWCM\AECOM QAPP\2011803_Rev2\clean\20110810_CWCM-sv_QAPP_Rev2.docx
Communication Drivers Responsible Entity Name Phone NumberProcedure
(timing, pathways, etc.)
Sampling vessel operations Sampling Vessel Captain To be determinedOSI
860.388.4631 Communicate daily, or as needed, with AECOMFTM directly. The sampling vessel captain hasthe ultimate authority for stopping work whileworking on water. The vessel captain, inconsultation with the SSO, will follow guidelinesdocumented in the site-specific Health and SafetyPlan (HASP). In addition, standard safe boatingpractices related to weather conditions and vesseloperations will apply, even if not specificallyaddressed in the HASP.
Analytical laboratory issues,including coordination with field,schedule, and technical issues
AECOM Project Chemist Bob ShoemakerRobert Kennedy(alternate)
978.905.2393978.905.2269
Communicate with AECOM FTM and LaboratoryPM as needed via phone or e-mail.
Analytical data validation issues AECOM Data ValidationCoordinator
Lisa Krowitz 978.905.2278 Communicate with Laboratory PM as needed viaphone or email.
Audit findings (field and/orlaboratory)
AECOM Project QA Manager Debra Simmons 978.905.2399 Communicate findings to AECOM CWCM TaskManager or Laboratory PM (as appropriate);transmit final audit reports, including correctiveactions (CA), to AECOM PM, AECOM CWCMTask Manager, CPG Project Coordinator, andCPG QA Coordinator.
CPG Project Coordinator Bill Potter/Robert Law(de maximis, inc.)
908.735.9315 CPG Project Coordinator will provide final auditreports to USEPA RPM.
Issues potentially affectingPQOs
AECOM FTM Don Kretchmer 603.387.0532 Communicate as needed with AECOM QAManager and AECOM CWCM Task Manager viaOSI Vessel Subcontractor Lead Ken Cadmus 860.388.4631
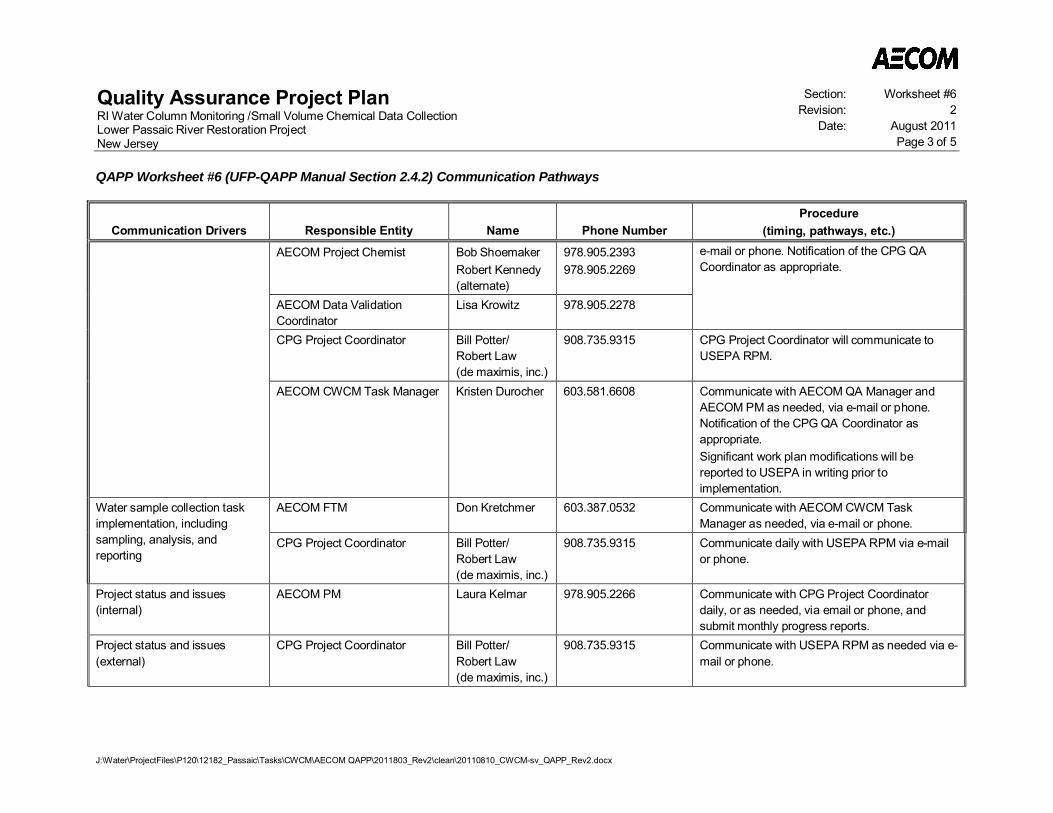
Quality Assurance Project PlanRI Water Column Monitoring /Small Volume Chemical Data CollectionLower Passaic River Restoration ProjectNew Jersey
Section: Worksheet #6Revision: 2
Date: August 2011Page 3 of 5
QAPP Worksheet #6 (UFP-QAPP Manual Section 2.4.2) Communication Pathways
J:\Water\ProjectFiles\P120\12182_Passaic\Tasks\CWCM\AECOM QAPP\2011803_Rev2\clean\20110810_CWCM-sv_QAPP_Rev2.docx
Communication Drivers Responsible Entity Name Phone NumberProcedure
(timing, pathways, etc.)
AECOM Project Chemist Bob ShoemakerRobert Kennedy(alternate)
978.905.2393978.905.2269
e-mail or phone. Notification of the CPG QACoordinator as appropriate.
AECOM Data ValidationCoordinator
Lisa Krowitz 978.905.2278
CPG Project Coordinator Bill Potter/Robert Law(de maximis, inc.)
908.735.9315 CPG Project Coordinator will communicate toUSEPA RPM.
AECOM CWCM Task Manager Kristen Durocher 603.581.6608 Communicate with AECOM QA Manager andAECOM PM as needed, via e-mail or phone.Notification of the CPG QA Coordinator asappropriate.Significant work plan modifications will bereported to USEPA in writing prior toimplementation.
Water sample collection taskimplementation, includingsampling, analysis, andreporting
AECOM FTM Don Kretchmer 603.387.0532 Communicate with AECOM CWCM TaskManager as needed, via e-mail or phone.
CPG Project Coordinator Bill Potter/Robert Law(de maximis, inc.)
908.735.9315 Communicate daily with USEPA RPM via e-mailor phone.
Project status and issues(internal)
AECOM PM Laura Kelmar 978.905.2266 Communicate with CPG Project Coordinatordaily, or as needed, via email or phone, andsubmit monthly progress reports.
Project status and issues(external)
CPG Project Coordinator Bill Potter/Robert Law(de maximis, inc.)
908.735.9315 Communicate with USEPA RPM as needed via e-mail or phone.
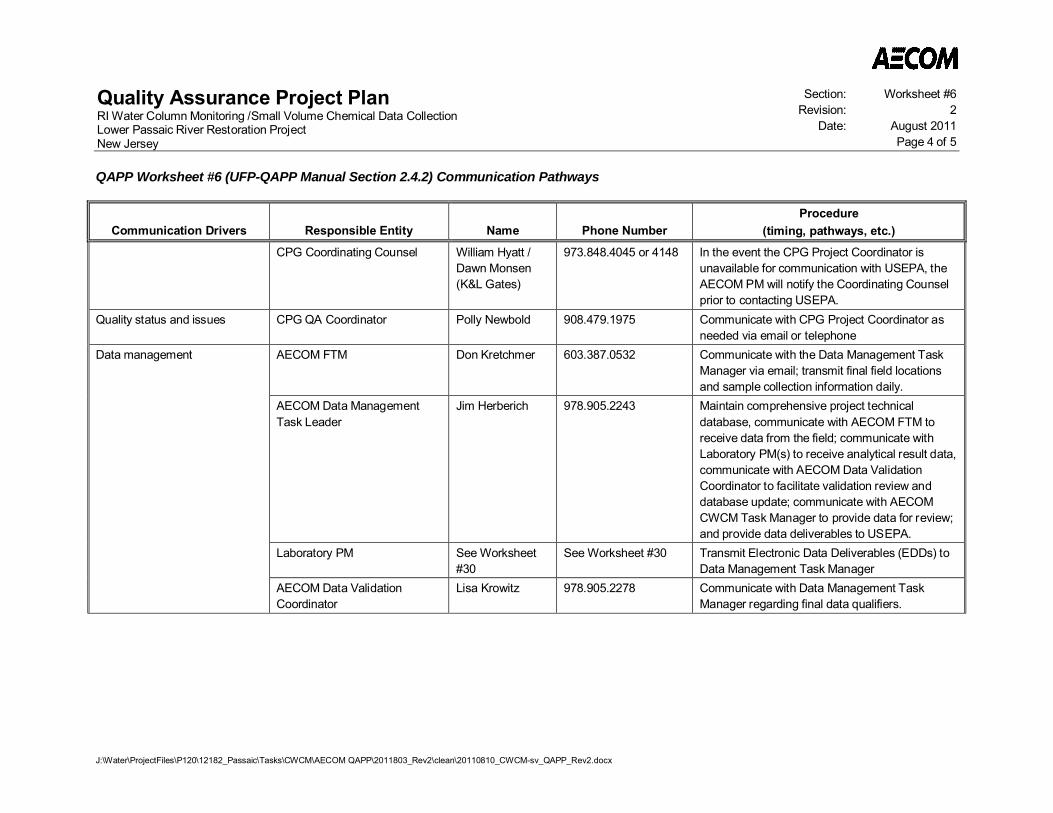
Quality Assurance Project PlanRI Water Column Monitoring /Small Volume Chemical Data CollectionLower Passaic River Restoration ProjectNew Jersey
Section: Worksheet #6Revision: 2
Date: August 2011Page 4 of 5
QAPP Worksheet #6 (UFP-QAPP Manual Section 2.4.2) Communication Pathways
J:\Water\ProjectFiles\P120\12182_Passaic\Tasks\CWCM\AECOM QAPP\2011803_Rev2\clean\20110810_CWCM-sv_QAPP_Rev2.docx
Communication Drivers Responsible Entity Name Phone NumberProcedure
(timing, pathways, etc.)
CPG Coordinating Counsel William Hyatt /Dawn Monsen(K&L Gates)
973.848.4045 or 4148 In the event the CPG Project Coordinator isunavailable for communication with USEPA, theAECOM PM will notify the Coordinating Counselprior to contacting USEPA.
Quality status and issues CPG QA Coordinator Polly Newbold 908.479.1975 Communicate with CPG Project Coordinator asneeded via email or telephone
Data management AECOM FTM Don Kretchmer 603.387.0532 Communicate with the Data Management TaskManager via email; transmit final field locationsand sample collection information daily.
AECOM Data ManagementTask Leader
Jim Herberich 978.905.2243 Maintain comprehensive project technicaldatabase, communicate with AECOM FTM toreceive data from the field; communicate withLaboratory PM(s) to receive analytical result data,communicate with AECOM Data ValidationCoordinator to facilitate validation review anddatabase update; communicate with AECOMCWCM Task Manager to provide data for review;and provide data deliverables to USEPA.
Laboratory PM See Worksheet#30
See Worksheet #30 Transmit Electronic Data Deliverables (EDDs) toData Management Task Manager
AECOM Data ValidationCoordinator
Lisa Krowitz 978.905.2278 Communicate with Data Management TaskManager regarding final data qualifiers.
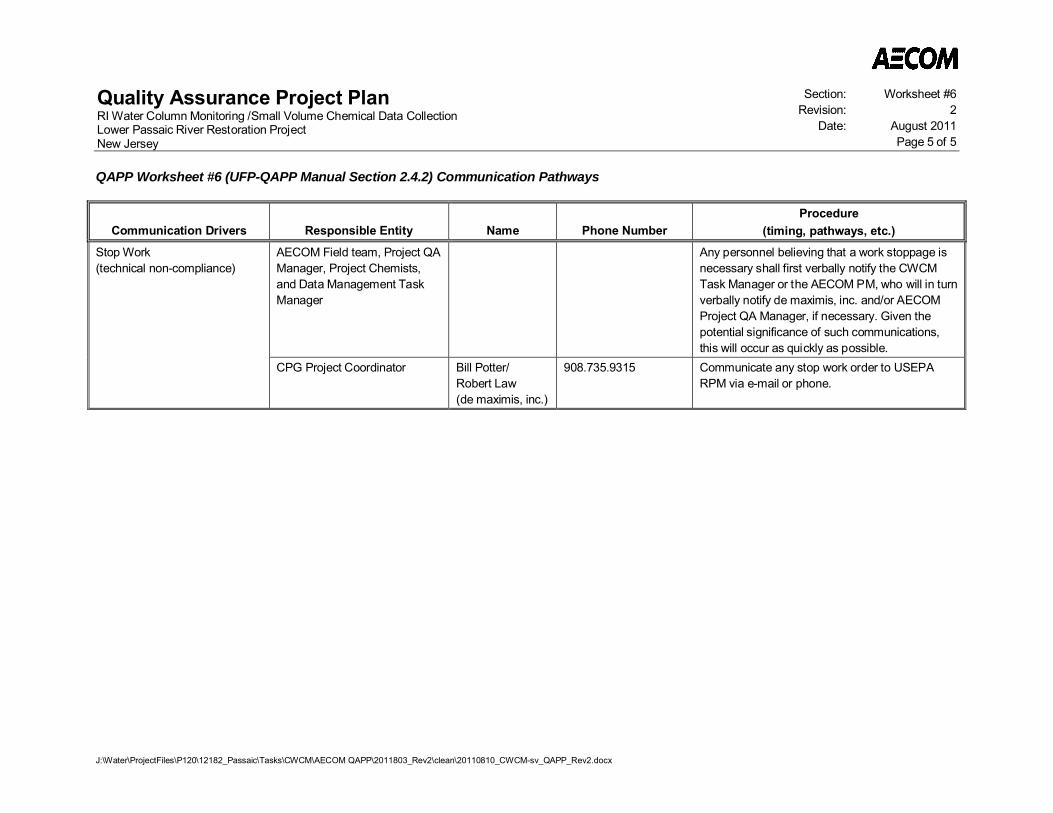
Quality Assurance Project PlanRI Water Column Monitoring /Small Volume Chemical Data CollectionLower Passaic River Restoration ProjectNew Jersey
Section: Worksheet #6Revision: 2
Date: August 2011Page 5 of 5
QAPP Worksheet #6 (UFP-QAPP Manual Section 2.4.2) Communication Pathways
J:\Water\ProjectFiles\P120\12182_Passaic\Tasks\CWCM\AECOM QAPP\2011803_Rev2\clean\20110810_CWCM-sv_QAPP_Rev2.docx
Communication Drivers Responsible Entity Name Phone NumberProcedure
(timing, pathways, etc.)
Stop Work(technical non-compliance)
AECOM Field team, Project QAManager, Project Chemists,and Data Management TaskManager
Any personnel believing that a work stoppage isnecessary shall first verbally notify the CWCMTask Manager or the AECOM PM, who will in turnverbally notify de maximis, inc. and/or AECOMProject QA Manager, if necessary. Given thepotential significance of such communications,this will occur as quickly as possible.
CPG Project Coordinator Bill Potter/Robert Law(de maximis, inc.)
908.735.9315 Communicate any stop work order to USEPARPM via e-mail or phone.

Quality Assurance Project PlanRI Water Column Monitoring/Small Volume Chemical Data CollectionLower Passaic River Restoration ProjectNew Jersey
Section: Worksheet #7Revision: 2
Date: August 2011Page 1 of 4
J:\Water\ProjectFiles\P120\12182_Passaic\Tasks\CWCM\AECOM QAPP\2011803_Rev2\clean\20110810_CWCM-sv_QAPP_Rev2.docx
QAPP Worksheet #7 (UFP-QAPP Manual Section 2.4.3) Personnel Responsibilities and Qualification Table
Name TitleOrganizational
Affiliation ResponsibilitiesEducation and Experience
Qualifications1
Robert Law CPG ProjectCoordinator
de maximis, inc. Overall responsibility for the safe and properexecution of task. Be available to discuss andreview technical and other issues that mayarise during work. Periodically review and auditwork to ensure that work plan, project qualityassurance/quality control (QA/QC), and Healthand Safety including both boating andhazardous materials worker safety proceduresare being followed. All deviations fromapproved project plans will be discussed withand approved by the CPG Project Coordinator.Primary point of contact with the USEPA, itsoversight contractor and the LPRSA PartnerAgencies.
PhD, Geology, 26 years experience
Willard Potter CPG ProjectCoordinator
de maximis, inc. Overall responsibility for the safe and properexecution of task. Be available to discuss andreview technical and other issues that mayarise during work. Periodically review and auditwork to ensure that work plan, project QA/QC,and Health and Safety including both boatingand hazardous materials worker safetyprocedures are being followed. All deviationsfrom approved project plans will be discussedwith and approved by the CPG ProjectCoordinator. Primary point of contact with theUSEPA, its oversight contractor and theLPRSA Partner Agencies.
BS, Chemical Engineering, 36 yearsexperience
Laura Kelmar AECOM PM AECOM Overall responsibility for completion of RI tasksin accordance with SOW requirementsincluding technical, financial, and scheduling.Primary point of contact with CPG ProjectCoordinator.
BS, Chemical Engineering, MS,Environmental Engineering, 20 yearsexperience

Quality Assurance Project PlanRI Water Column Monitoring/Small Volume Chemical Data CollectionLower Passaic River Restoration ProjectNew Jersey
Section: Worksheet #7Revision: 2
Date: August 2011Page 2 of 4
QAPP Worksheet #7 (UFP-QAPP Manual Section 2.4.3) Personnel Responsibilities and Qualification Table
J:\Water\ProjectFiles\P120\12182_Passaic\Tasks\CWCM\AECOM QAPP\2011803_Rev2\clean\20110810_CWCM-sv_QAPP_Rev2.docx
Name TitleOrganizational
Affiliation ResponsibilitiesEducation and Experience
Qualifications1
Kristen Durocher CWCM TaskManager
AECOM Responsible for the execution and completionof the CWCM program, including procurementof subcontractors, review of task deliverables,and serving as the focus for coordination of allfield and laboratory tasks. The CWCM TaskManager will keep the AECOM PM apprised ofthe status of the task, as well communicate anyissues with the schedule, budget, orachievement of the task objectives.
BA Environmental Studies andNorthern Studies, 18 years experience
Don Kretchmer (ordesignee)
FTM AECOM Responsible for implementing field samplingactivities in accordance with the approvedplans (FSP, QAPP, and HASP). Primaryresponsibilities include directing activities onsite, monitoring subcontractor performance inthe field, reviewing field records, andcommunicating daily with the AECOM CWCMTask Manager regarding status, quality, issues,or delays.
BS Natural Resources, MS WaterResource Management,26 years experience
Debra Simmons Project QA Manager AECOM Responsible for reviewing and approving QAprocedures, ensuring that planned QAassessments (e.g., technical surveillance audits[TSA], data validation) are conducted accordingto the QAPP/FSP Addendum and the AECOMQuality Management Plan (QMP), (AECOM2009) and reporting on the adequacy of the QAProgram to the AECOM PM.
BS, Biology, 28 years experience
Philip Platcow Regional EHSManager
AECOM Responsible for ensuring that the objectives ofAECOM’s Health and Safety Program are metand for monitoring task activities forconformance to the HASP.
MS, Industrial Hygiene, 25 yearsexperience
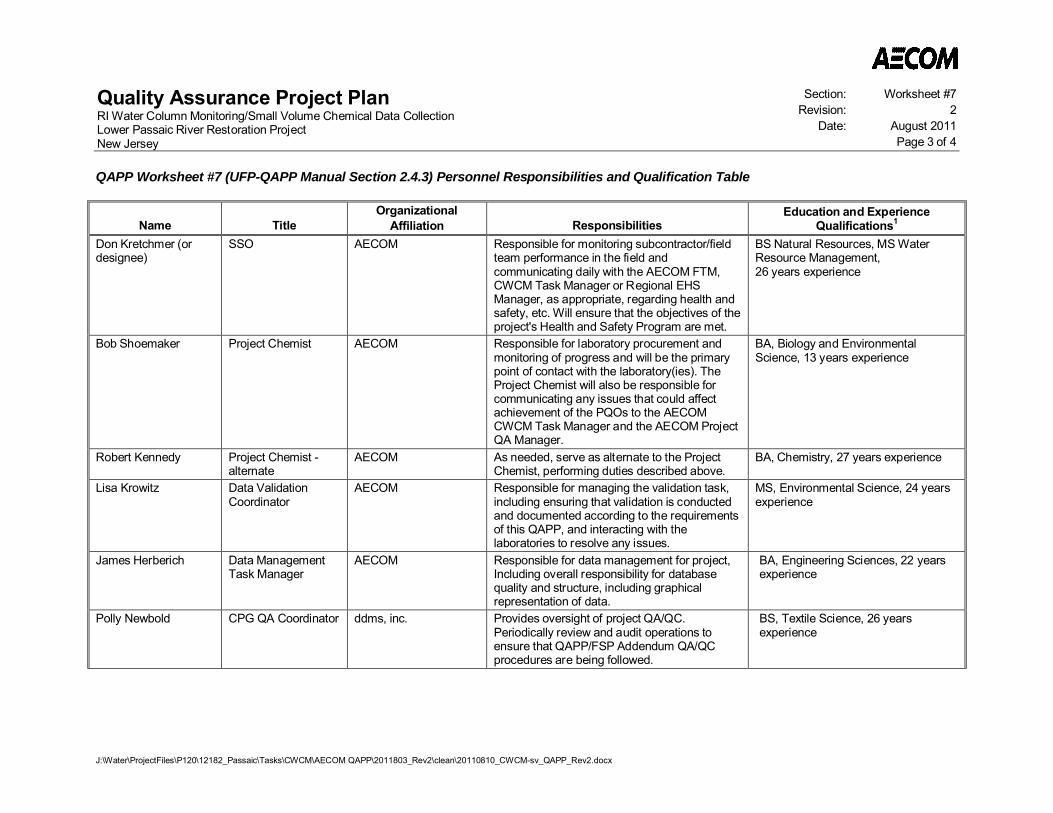
Quality Assurance Project PlanRI Water Column Monitoring/Small Volume Chemical Data CollectionLower Passaic River Restoration ProjectNew Jersey
Section: Worksheet #7Revision: 2
Date: August 2011Page 3 of 4
QAPP Worksheet #7 (UFP-QAPP Manual Section 2.4.3) Personnel Responsibilities and Qualification Table
J:\Water\ProjectFiles\P120\12182_Passaic\Tasks\CWCM\AECOM QAPP\2011803_Rev2\clean\20110810_CWCM-sv_QAPP_Rev2.docx
Name TitleOrganizational
Affiliation ResponsibilitiesEducation and Experience
Qualifications1
Don Kretchmer (ordesignee)
SSO AECOM Responsible for monitoring subcontractor/fieldteam performance in the field andcommunicating daily with the AECOM FTM,CWCM Task Manager or Regional EHSManager, as appropriate, regarding health andsafety, etc. Will ensure that the objectives of theproject's Health and Safety Program are met.
BS Natural Resources, MS WaterResource Management,26 years experience
Bob Shoemaker Project Chemist AECOM Responsible for laboratory procurement andmonitoring of progress and will be the primarypoint of contact with the laboratory(ies). TheProject Chemist will also be responsible forcommunicating any issues that could affectachievement of the PQOs to the AECOMCWCM Task Manager and the AECOM ProjectQA Manager.
BA, Biology and EnvironmentalScience, 13 years experience
Robert Kennedy Project Chemist -alternate
AECOM As needed, serve as alternate to the ProjectChemist, performing duties described above.
BA, Chemistry, 27 years experience
Lisa Krowitz Data ValidationCoordinator
AECOM Responsible for managing the validation task,including ensuring that validation is conductedand documented according to the requirementsof this QAPP, and interacting with thelaboratories to resolve any issues.
MS, Environmental Science, 24 yearsexperience
James Herberich Data ManagementTask Manager
AECOM Responsible for data management for project,Including overall responsibility for databasequality and structure, including graphicalrepresentation of data.
BA, Engineering Sciences, 22 yearsexperience
Polly Newbold CPG QA Coordinator ddms, inc. Provides oversight of project QA/QC.Periodically review and audit operations toensure that QAPP/FSP Addendum QA/QCprocedures are being followed.
BS, Textile Science, 26 yearsexperience
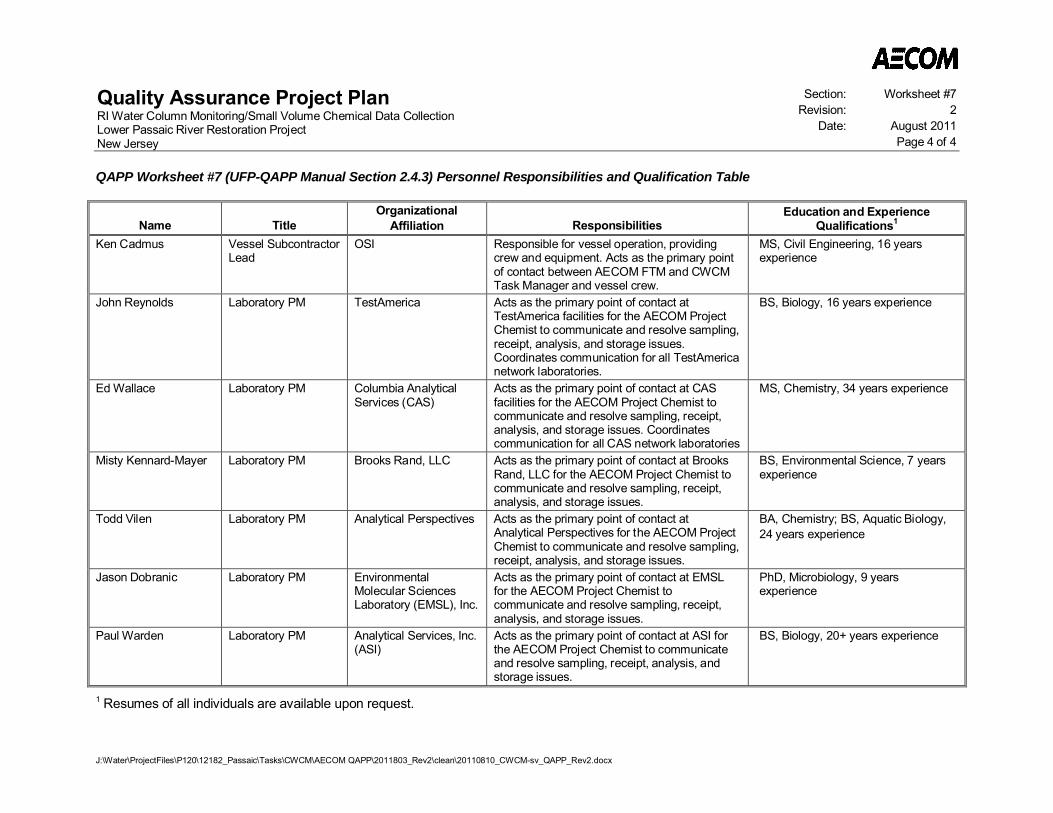
Quality Assurance Project PlanRI Water Column Monitoring/Small Volume Chemical Data CollectionLower Passaic River Restoration ProjectNew Jersey
Section: Worksheet #7Revision: 2
Date: August 2011Page 4 of 4
QAPP Worksheet #7 (UFP-QAPP Manual Section 2.4.3) Personnel Responsibilities and Qualification Table
J:\Water\ProjectFiles\P120\12182_Passaic\Tasks\CWCM\AECOM QAPP\2011803_Rev2\clean\20110810_CWCM-sv_QAPP_Rev2.docx
Name TitleOrganizational
Affiliation ResponsibilitiesEducation and Experience
Qualifications1
Ken Cadmus Vessel SubcontractorLead
OSI Responsible for vessel operation, providingcrew and equipment. Acts as the primary pointof contact between AECOM FTM and CWCMTask Manager and vessel crew.
MS, Civil Engineering, 16 yearsexperience
John Reynolds Laboratory PM TestAmerica Acts as the primary point of contact atTestAmerica facilities for the AECOM ProjectChemist to communicate and resolve sampling,receipt, analysis, and storage issues.Coordinates communication for all TestAmericanetwork laboratories.
BS, Biology, 16 years experience
Ed Wallace Laboratory PM Columbia AnalyticalServices (CAS)
Acts as the primary point of contact at CASfacilities for the AECOM Project Chemist tocommunicate and resolve sampling, receipt,analysis, and storage issues. Coordinatescommunication for all CAS network laboratories
MS, Chemistry, 34 years experience
Misty Kennard-Mayer Laboratory PM Brooks Rand, LLC Acts as the primary point of contact at BrooksRand, LLC for the AECOM Project Chemist tocommunicate and resolve sampling, receipt,analysis, and storage issues.
BS, Environmental Science, 7 yearsexperience
Todd Vilen Laboratory PM Analytical Perspectives Acts as the primary point of contact atAnalytical Perspectives for the AECOM ProjectChemist to communicate and resolve sampling,receipt, analysis, and storage issues.
BA, Chemistry; BS, Aquatic Biology,24 years experience
Jason Dobranic Laboratory PM EnvironmentalMolecular SciencesLaboratory (EMSL), Inc.
Acts as the primary point of contact at EMSLfor the AECOM Project Chemist tocommunicate and resolve sampling, receipt,analysis, and storage issues.
PhD, Microbiology, 9 yearsexperience
Paul Warden Laboratory PM Analytical Services, Inc.(ASI)
Acts as the primary point of contact at ASI forthe AECOM Project Chemist to communicateand resolve sampling, receipt, analysis, andstorage issues.
BS, Biology, 20+ years experience
1 Resumes of all individuals are available upon request.
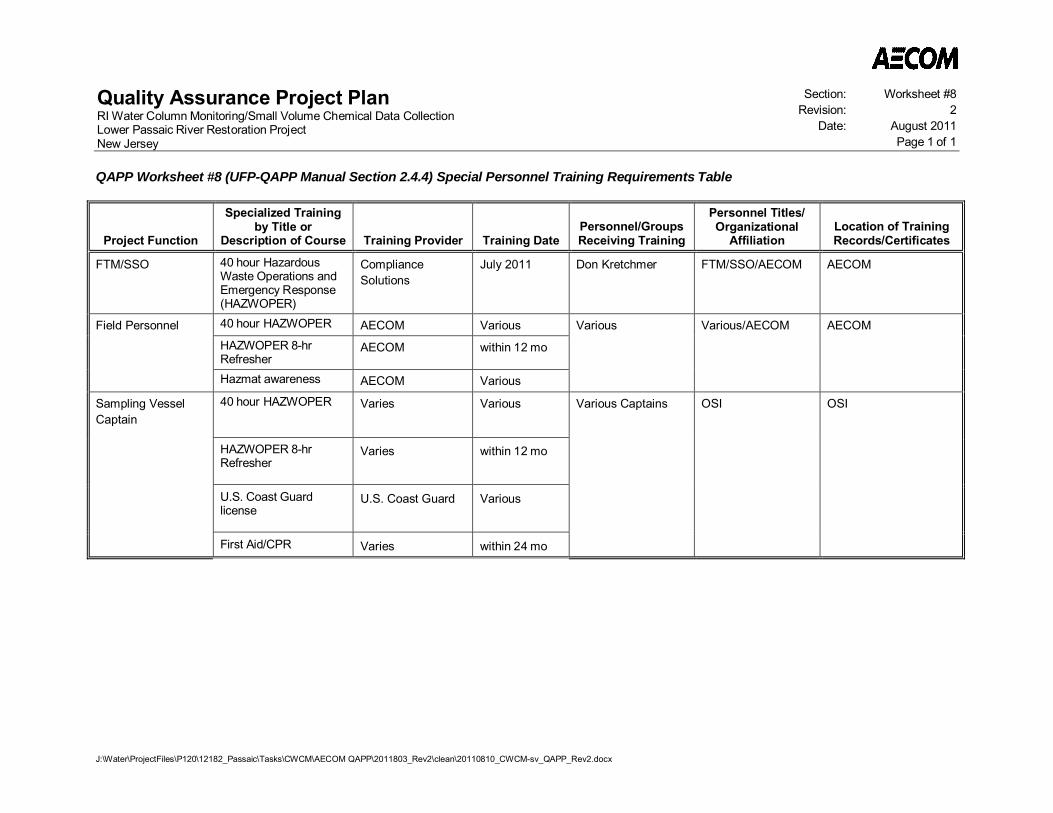
Quality Assurance Project PlanRI Water Column Monitoring/Small Volume Chemical Data CollectionLower Passaic River Restoration ProjectNew Jersey
Section: Worksheet #8Revision: 2
Date: August 2011Page 1 of 1
J:\Water\ProjectFiles\P120\12182_Passaic\Tasks\CWCM\AECOM QAPP\2011803_Rev2\clean\20110810_CWCM-sv_QAPP_Rev2.docx
QAPP Worksheet #8 (UFP-QAPP Manual Section 2.4.4) Special Personnel Training Requirements Table
Project Function
Specialized Trainingby Title or
Description of Course Training Provider Training DatePersonnel/GroupsReceiving Training
Personnel Titles/Organizational
AffiliationLocation of TrainingRecords/Certificates
FTM/SSO 40 hour HazardousWaste Operations andEmergency Response(HAZWOPER)
ComplianceSolutions
July 2011 Don Kretchmer FTM/SSO/AECOM AECOM
Field Personnel 40 hour HAZWOPER AECOM Various Various Various/AECOM AECOMHAZWOPER 8-hrRefresher
AECOM within 12 mo
Hazmat awareness AECOM Various
Sampling VesselCaptain
40 hour HAZWOPER Varies Various Various Captains OSI OSI
HAZWOPER 8-hrRefresher
Varies within 12 mo
U.S. Coast Guardlicense
U.S. Coast Guard Various
First Aid/CPR Varies within 24 mo
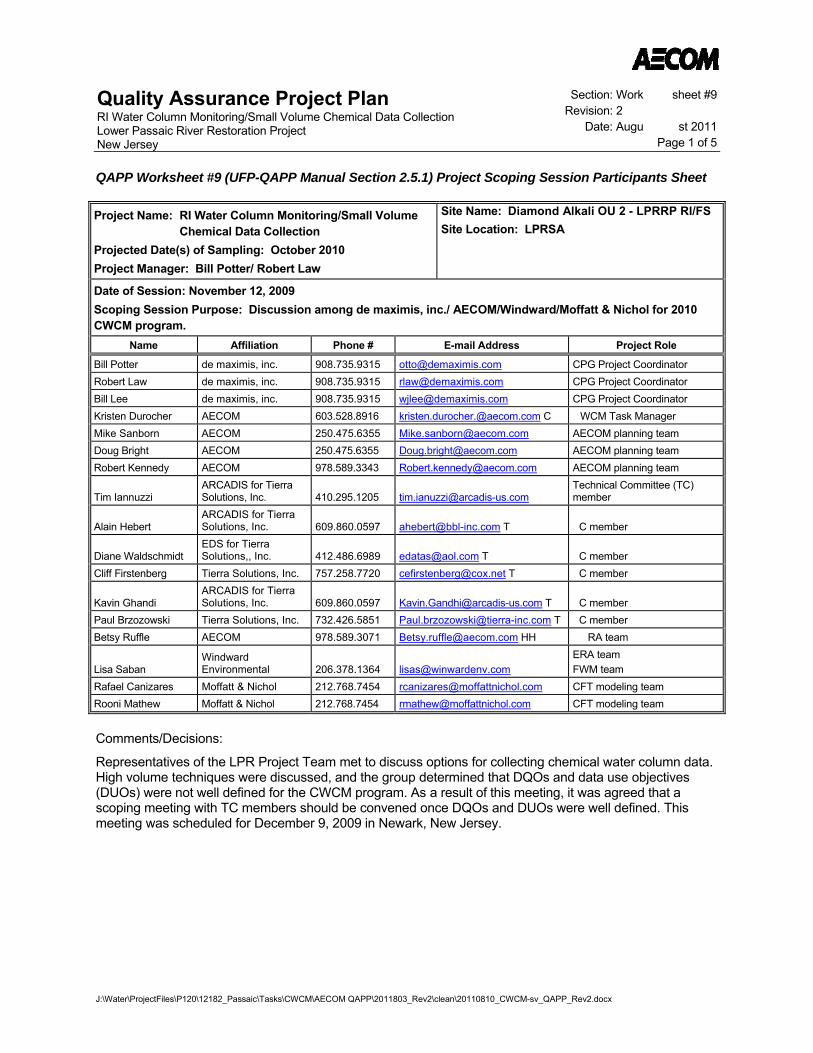
Quality Assurance Project Plan RI Water Column Monitoring/Small Volume Chemical Data Collection Lower Passaic River Restoration Project New Jersey
Section: Work sheet #9 Revision: 2
Date: Augu st 2011 Page 1 of 5
J:\Water\ProjectFiles\P120\12182_Passaic\Tasks\CWCM\AECOM QAPP\2011803_Rev2\clean\20110810_CWCM-sv_QAPP_Rev2.docx
QAPP Worksheet #9 (UFP-QAPP Manual Section 2.5.1) Project Scoping Session Participants Sheet
Project Name: RI Water Column Monitoring/Small Volume Chemical Data Collection
Projected Date(s) of Sampling: October 2010 Project Manager: Bill Potter/ Robert Law
Site Name: Diamond Alkali OU 2 - LPRRP RI/FSSite Location: LPRSA
Date of Session: November 12, 2009 Scoping Session Purpose: Discussion among de maximis, inc./ AECOM/Windward/Moffatt & Nichol for 2010 CWCM program.
Name Affiliation Phone # E-mail Address Project Role
Bill Potter de maximis, inc. 908.735.9315 [email protected] CPG Project Coordinator Robert Law de maximis, inc. 908.735.9315 [email protected] CPG Project Coordinator Bill Lee de maximis, inc. 908.735.9315 [email protected] CPG Project Coordinator Kristen Durocher AECOM 603.528.8916 [email protected] C WCM Task Manager Mike Sanborn AECOM 250.475.6355 [email protected] AECOM planning team Doug Bright AECOM 250.475.6355 [email protected] AECOM planning team Robert Kennedy AECOM 978.589.3343 [email protected] AECOM planning team
Tim Iannuzzi ARCADIS for Tierra Solutions, Inc. 410.295.1205 [email protected]
Technical Committee (TC) member
Alain Hebert ARCADIS for Tierra Solutions, Inc. 609.860.0597 [email protected] T C member
Diane Waldschmidt EDS for Tierra Solutions,, Inc. 412.486.6989 [email protected] T C member
Cliff Firstenberg Tierra Solutions, Inc. 757.258.7720 [email protected] T C member
Kavin Ghandi ARCADIS for Tierra Solutions, Inc. 609.860.0597 [email protected] T C member
Paul Brzozowski Tierra Solutions, Inc. 732.426.5851 [email protected] T C member Betsy Ruffle AECOM 978.589.3071 [email protected] HH RA team
Lisa Saban Windward Environmental 206.378.1364 [email protected]
ERA team FWM team
Rafael Canizares Moffatt & Nichol 212.768.7454 [email protected] CFT modeling team Rooni Mathew Moffatt & Nichol 212.768.7454 [email protected] CFT modeling team
Comments/Decisions:
Representatives of the LPR Project Team met to discuss options for collecting chemical water column data. High volume techniques were discussed, and the group determined that DQOs and data use objectives (DUOs) were not well defined for the CWCM program. As a result of this meeting, it was agreed that a scoping meeting with TC members should be convened once DQOs and DUOs were well defined. This meeting was scheduled for December 9, 2009 in Newark, New Jersey.
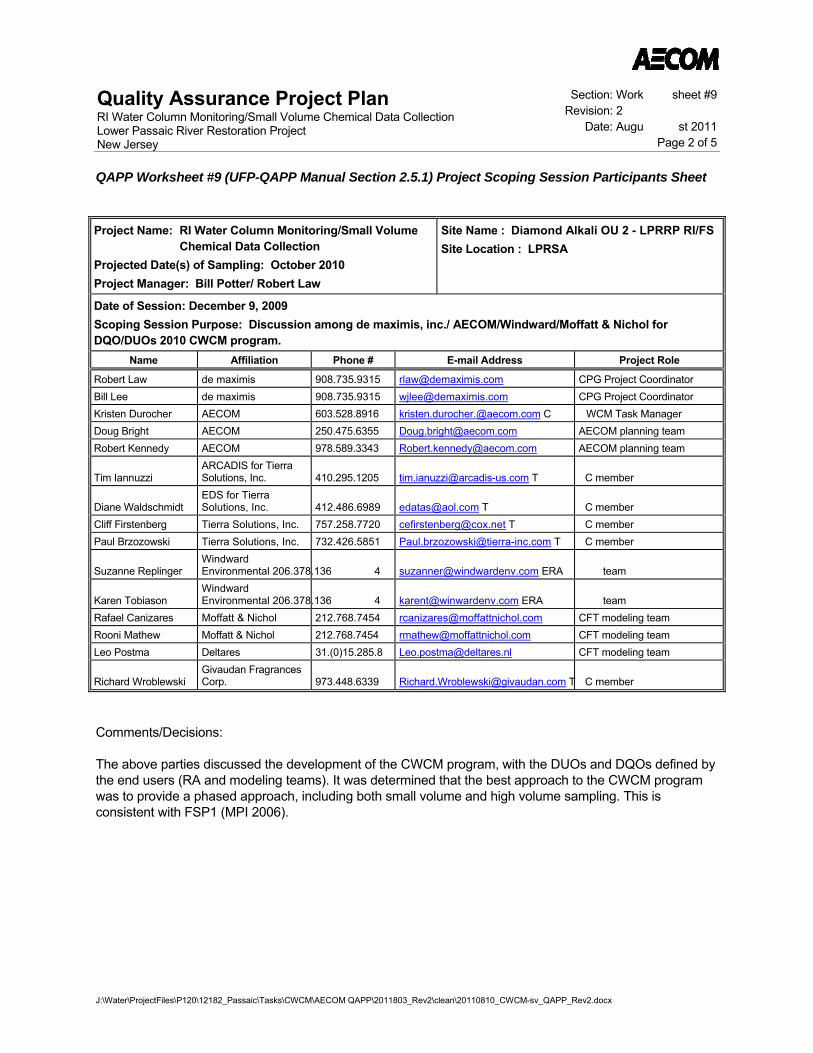
Quality Assurance Project Plan RI Water Column Monitoring/Small Volume Chemical Data Collection Lower Passaic River Restoration Project New Jersey
Section: Work sheet #9 Revision: 2
Date: Augu st 2011 Page 2 of 5
QAPP Worksheet #9 (UFP-QAPP Manual Section 2.5.1) Project Scoping Session Participants Sheet
J:\Water\ProjectFiles\P120\12182_Passaic\Tasks\CWCM\AECOM QAPP\2011803_Rev2\clean\20110810_CWCM-sv_QAPP_Rev2.docx
Project Name: RI Water Column Monitoring/Small Volume
Chemical Data Collection Projected Date(s) of Sampling: October 2010 Project Manager: Bill Potter/ Robert Law
Site Name : Diamond Alkali OU 2 - LPRRP RI/FS Site Location : LPRSA
Date of Session: December 9, 2009 Scoping Session Purpose: Discussion among de maximis, inc./ AECOM/Windward/Moffatt & Nichol for DQO/DUOs 2010 CWCM program.
Name Affiliation Phone # E-mail Address Project Role
Robert Law de maximis 908.735.9315 [email protected] CPG Project Coordinator Bill Lee de maximis 908.735.9315 [email protected] CPG Project Coordinator Kristen Durocher AECOM 603.528.8916 [email protected] C WCM Task Manager Doug Bright AECOM 250.475.6355 [email protected] AECOM planning team Robert Kennedy AECOM 978.589.3343 [email protected] AECOM planning team
Tim Iannuzzi ARCADIS for Tierra Solutions, Inc. 410.295.1205 [email protected] T C member
Diane Waldschmidt EDS for Tierra Solutions, Inc. 412.486.6989 [email protected] T C member
Cliff Firstenberg Tierra Solutions, Inc. 757.258.7720 [email protected] T C member Paul Brzozowski Tierra Solutions, Inc. 732.426.5851 [email protected] T C member
Suzanne Replinger Windward Environmental 206.378.136 4 [email protected] ERA team
Karen Tobiason Windward Environmental 206.378.136 4 [email protected] ERA team
Rafael Canizares Moffatt & Nichol 212.768.7454 [email protected] CFT modeling team Rooni Mathew Moffatt & Nichol 212.768.7454 [email protected] CFT modeling team Leo Postma Deltares 31.(0)15.285.8 [email protected] CFT modeling team
Richard Wroblewski Givaudan Fragrances Corp. 973.448.6339 [email protected] T C member
Comments/Decisions:
The above parties discussed the development of the CWCM program, with the DUOs and DQOs defined by the end users (RA and modeling teams). It was determined that the best approach to the CWCM program was to provide a phased approach, including both small volume and high volume sampling. This is consistent with FSP1 (MPI 2006).
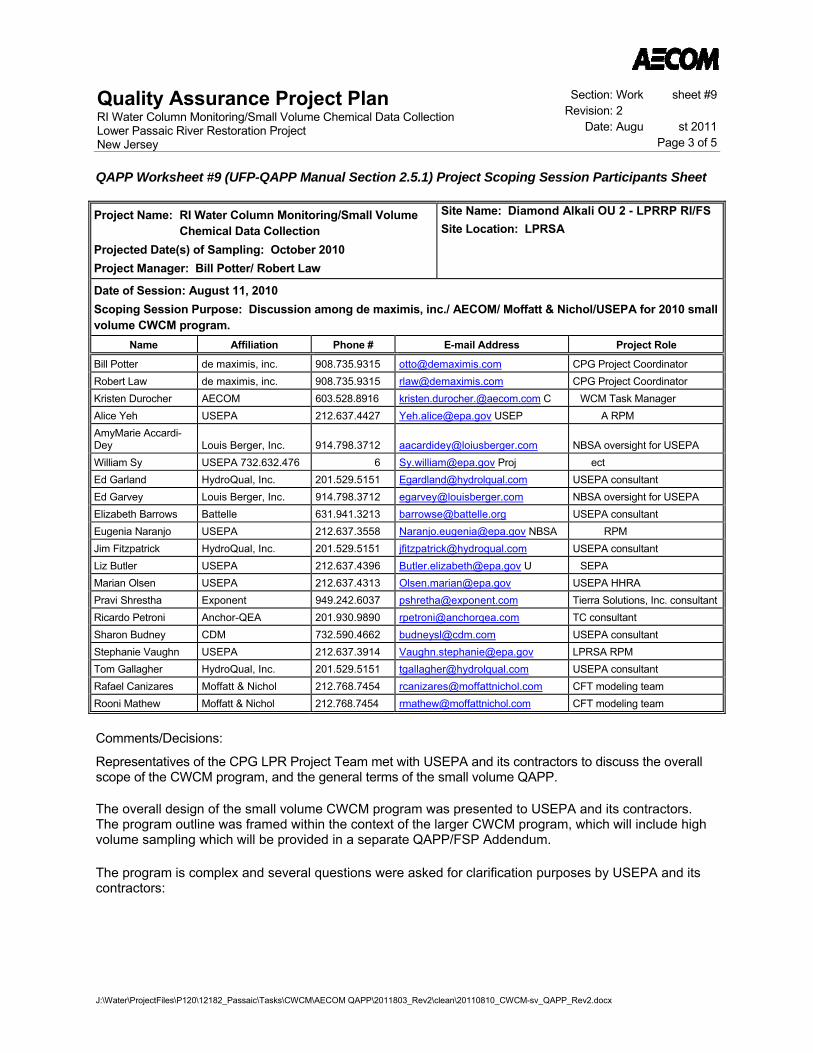
Quality Assurance Project Plan RI Water Column Monitoring/Small Volume Chemical Data Collection Lower Passaic River Restoration Project New Jersey
Section: Work sheet #9 Revision: 2
Date: Augu st 2011 Page 3 of 5
QAPP Worksheet #9 (UFP-QAPP Manual Section 2.5.1) Project Scoping Session Participants Sheet
J:\Water\ProjectFiles\P120\12182_Passaic\Tasks\CWCM\AECOM QAPP\2011803_Rev2\clean\20110810_CWCM-sv_QAPP_Rev2.docx
Project Name: RI Water Column Monitoring/Small Volume Chemical Data Collection
Projected Date(s) of Sampling: October 2010 Project Manager: Bill Potter/ Robert Law
Site Name: Diamond Alkali OU 2 - LPRRP RI/FSSite Location: LPRSA
Date of Session: August 11, 2010 Scoping Session Purpose: Discussion among de maximis, inc./ AECOM/ Moffatt & Nichol/USEPA for 2010 small volume CWCM program.
Name Affiliation Phone # E-mail Address Project Role
Bill Potter de maximis, inc. 908.735.9315 [email protected] CPG Project Coordinator Robert Law de maximis, inc. 908.735.9315 [email protected] CPG Project Coordinator Kristen Durocher AECOM 603.528.8916 [email protected] C WCM Task Manager Alice Yeh USEPA 212.637.4427 [email protected] USEP A RPM AmyMarie Accardi-Dey Louis Berger, Inc. 914.798.3712 [email protected] NBSA oversight for USEPA William Sy USEPA 732.632.476 6 [email protected] Proj ect Ed Garland HydroQual, Inc. 201.529.5151 [email protected] USEPA consultant Ed Garvey Louis Berger, Inc. 914.798.3712 [email protected] NBSA oversight for USEPA Elizabeth Barrows Battelle 631.941.3213 [email protected] USEPA consultant Eugenia Naranjo USEPA 212.637.3558 [email protected] NBSA RPM Jim Fitzpatrick HydroQual, Inc. 201.529.5151 [email protected] USEPA consultant Liz Butler USEPA 212.637.4396 [email protected] U SEPA Marian Olsen USEPA 212.637.4313 [email protected] USEPA HHRA Pravi Shrestha Exponent 949.242.6037 [email protected] Tierra Solutions, Inc. consultantRicardo Petroni Anchor-QEA 201.930.9890 [email protected] TC consultant Sharon Budney CDM 732.590.4662 [email protected] USEPA consultant Stephanie Vaughn USEPA 212.637.3914 [email protected] LPRSA RPM Tom Gallagher HydroQual, Inc. 201.529.5151 [email protected] USEPA consultant Rafael Canizares Moffatt & Nichol 212.768.7454 [email protected] CFT modeling team Rooni Mathew Moffatt & Nichol 212.768.7454 [email protected] CFT modeling team
Comments/Decisions:
Representatives of the CPG LPR Project Team met with USEPA and its contractors to discuss the overall scope of the CWCM program, and the general terms of the small volume QAPP. The overall design of the small volume CWCM program was presented to USEPA and its contractors. The program outline was framed within the context of the larger CWCM program, which will include high volume sampling which will be provided in a separate QAPP/FSP Addendum. The program is complex and several questions were asked for clarification purposes by USEPA and its contractors:
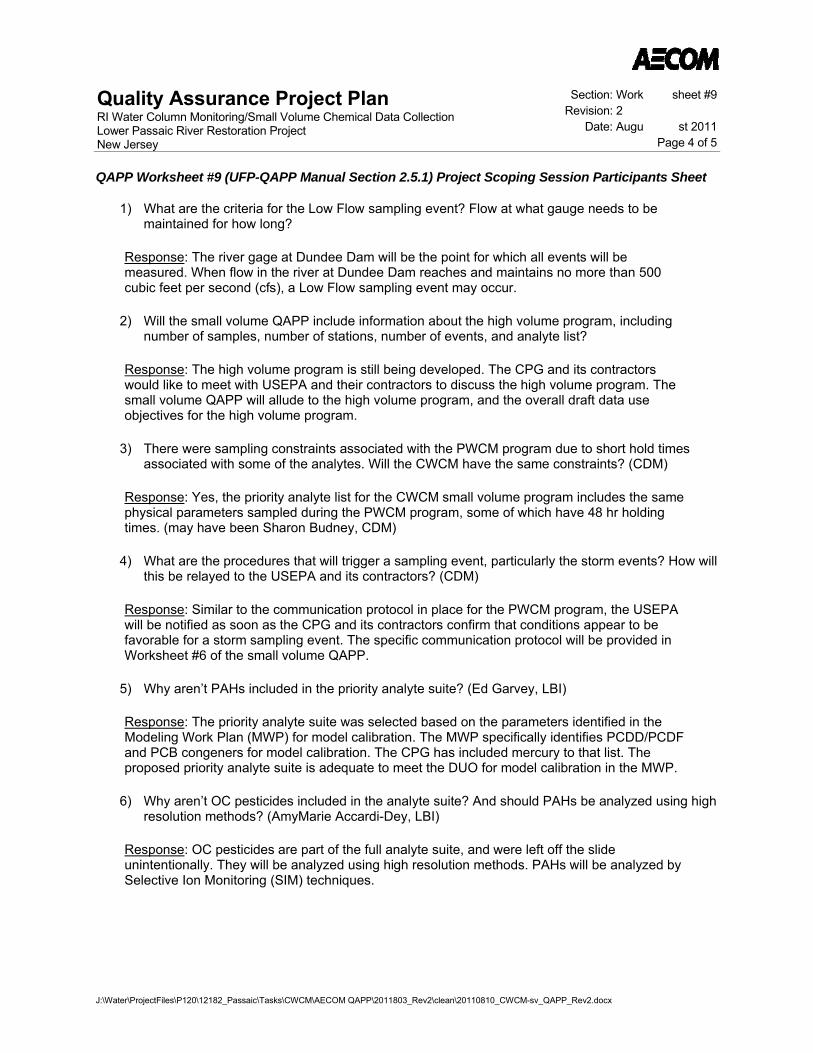
Quality Assurance Project Plan RI Water Column Monitoring/Small Volume Chemical Data Collection Lower Passaic River Restoration Project New Jersey
Section: Work sheet #9 Revision: 2
Date: Augu st 2011 Page 4 of 5
QAPP Worksheet #9 (UFP-QAPP Manual Section 2.5.1) Project Scoping Session Participants Sheet
J:\Water\ProjectFiles\P120\12182_Passaic\Tasks\CWCM\AECOM QAPP\2011803_Rev2\clean\20110810_CWCM-sv_QAPP_Rev2.docx
1) What are the criteria for the Low Flow sampling event? Flow at what gauge needs to be maintained for how long?
Response: The river gage at Dundee Dam will be the point for which all events will be measured. When flow in the river at Dundee Dam reaches and maintains no more than 500 cubic feet per second (cfs), a Low Flow sampling event may occur.
2) Will the small volume QAPP include information about the high volume program, including
number of samples, number of stations, number of events, and analyte list? Response: The high volume program is still being developed. The CPG and its contractors would like to meet with USEPA and their contractors to discuss the high volume program. The small volume QAPP will allude to the high volume program, and the overall draft data use objectives for the high volume program.
3) There were sampling constraints associated with the PWCM program due to short hold times
associated with some of the analytes. Will the CWCM have the same constraints? (CDM) Response: Yes, the priority analyte list for the CWCM small volume program includes the same physical parameters sampled during the PWCM program, some of which have 48 hr holding times. (may have been Sharon Budney, CDM)
4) What are the procedures that will trigger a sampling event, particularly the storm events? How will
this be relayed to the USEPA and its contractors? (CDM) Response: Similar to the communication protocol in place for the PWCM program, the USEPA will be notified as soon as the CPG and its contractors confirm that conditions appear to be favorable for a storm sampling event. The specific communication protocol will be provided in Worksheet #6 of the small volume QAPP.
5) Why aren’t PAHs included in the priority analyte suite? (Ed Garvey, LBI) Response: The priority analyte suite was selected based on the parameters identified in the Modeling Work Plan (MWP) for model calibration. The MWP specifically identifies PCDD/PCDF and PCB congeners for model calibration. The CPG has included mercury to that list. The proposed priority analyte suite is adequate to meet the DUO for model calibration in the MWP.
6) Why aren’t OC pesticides included in the analyte suite? And should PAHs be analyzed using high
resolution methods? (AmyMarie Accardi-Dey, LBI) Response: OC pesticides are part of the full analyte suite, and were left off the slide unintentionally. They will be analyzed using high resolution methods. PAHs will be analyzed by Selective Ion Monitoring (SIM) techniques.
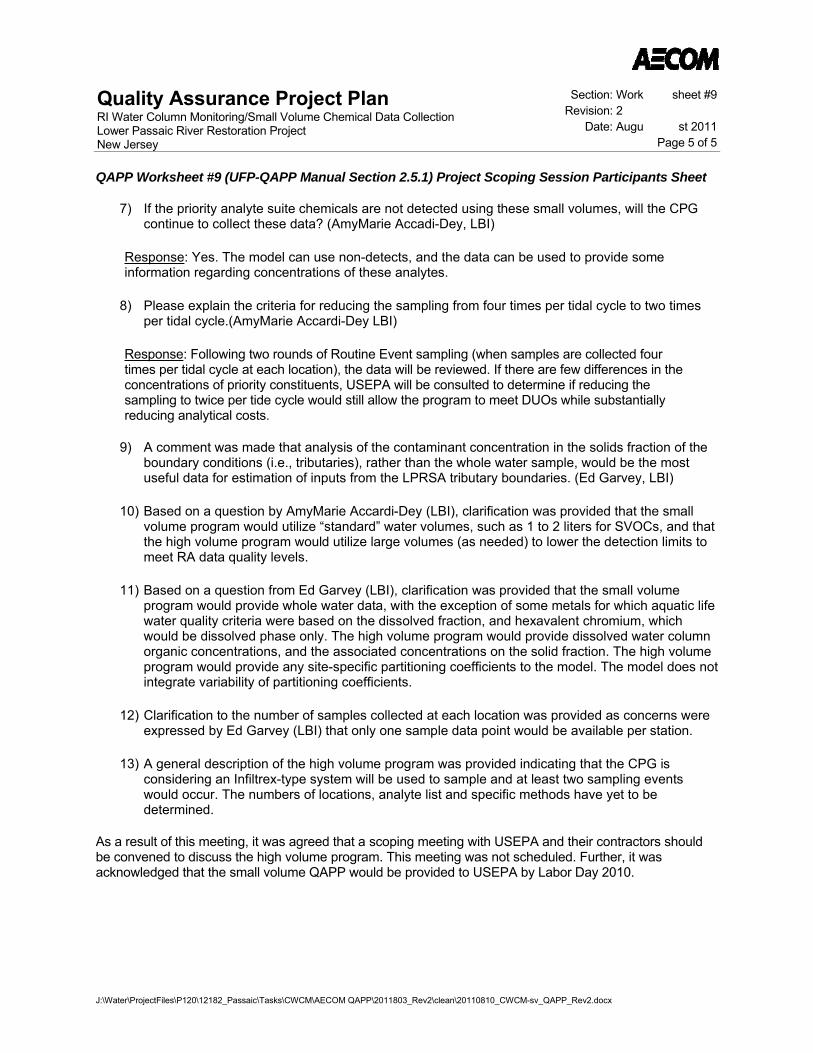
Quality Assurance Project Plan RI Water Column Monitoring/Small Volume Chemical Data Collection Lower Passaic River Restoration Project New Jersey
Section: Work sheet #9 Revision: 2
Date: Augu st 2011 Page 5 of 5
QAPP Worksheet #9 (UFP-QAPP Manual Section 2.5.1) Project Scoping Session Participants Sheet
J:\Water\ProjectFiles\P120\12182_Passaic\Tasks\CWCM\AECOM QAPP\2011803_Rev2\clean\20110810_CWCM-sv_QAPP_Rev2.docx
7) If the priority analyte suite chemicals are not detected using these small volumes, will the CPG continue to collect these data? (AmyMarie Accadi-Dey, LBI)
Response: Yes. The model can use non-detects, and the data can be used to provide some information regarding concentrations of these analytes.
8) Please explain the criteria for reducing the sampling from four times per tidal cycle to two times
per tidal cycle.(AmyMarie Accardi-Dey LBI) Response: Following two rounds of Routine Event sampling (when samples are collected four times per tidal cycle at each location), the data will be reviewed. If there are few differences in the concentrations of priority constituents, USEPA will be consulted to determine if reducing the sampling to twice per tide cycle would still allow the program to meet DUOs while substantially reducing analytical costs.
9) A comment was made that analysis of the contaminant concentration in the solids fraction of the boundary conditions (i.e., tributaries), rather than the whole water sample, would be the most useful data for estimation of inputs from the LPRSA tributary boundaries. (Ed Garvey, LBI)
10) Based on a question by AmyMarie Accardi-Dey (LBI), clarification was provided that the small
volume program would utilize “standard” water volumes, such as 1 to 2 liters for SVOCs, and that the high volume program would utilize large volumes (as needed) to lower the detection limits to meet RA data quality levels.
11) Based on a question from Ed Garvey (LBI), clarification was provided that the small volume
program would provide whole water data, with the exception of some metals for which aquatic life water quality criteria were based on the dissolved fraction, and hexavalent chromium, which would be dissolved phase only. The high volume program would provide dissolved water column organic concentrations, and the associated concentrations on the solid fraction. The high volume program would provide any site-specific partitioning coefficients to the model. The model does not integrate variability of partitioning coefficients.
12) Clarification to the number of samples collected at each location was provided as concerns were
expressed by Ed Garvey (LBI) that only one sample data point would be available per station. 13) A general description of the high volume program was provided indicating that the CPG is
considering an Infiltrex-type system will be used to sample and at least two sampling events would occur. The numbers of locations, analyte list and specific methods have yet to be determined.
As a result of this meeting, it was agreed that a scoping meeting with USEPA and their contractors should be convened to discuss the high volume program. This meeting was not scheduled. Further, it was acknowledged that the small volume QAPP would be provided to USEPA by Labor Day 2010.
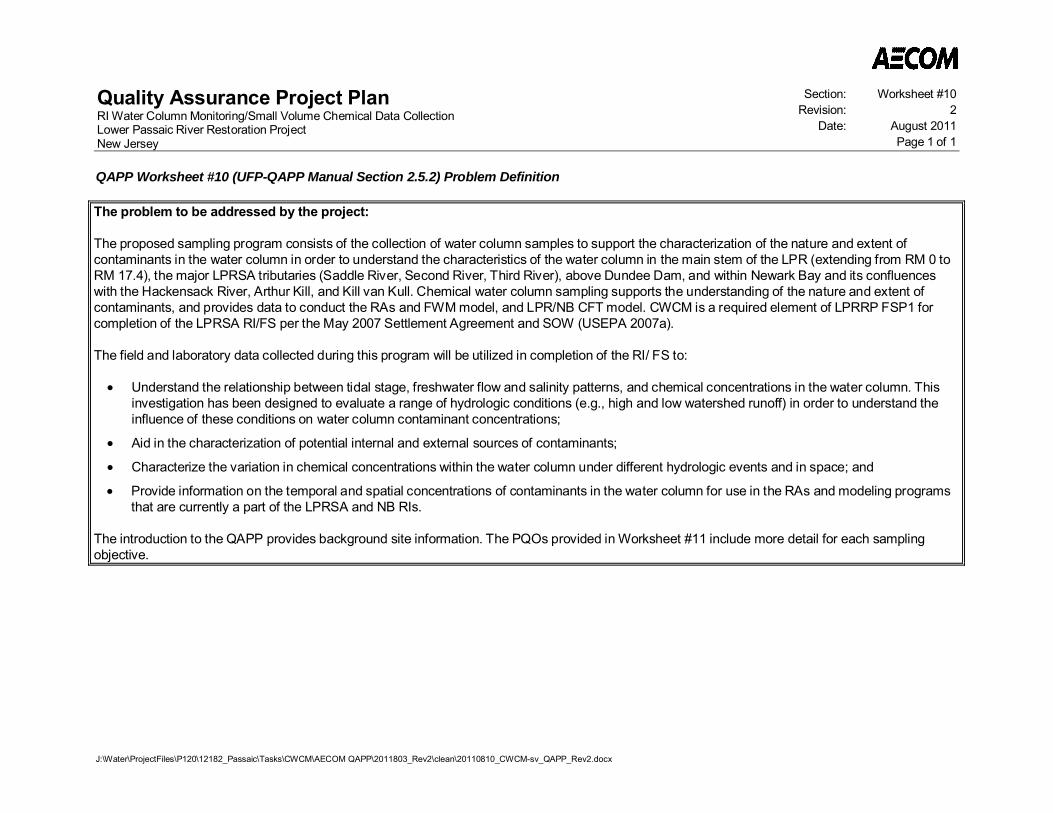
Quality Assurance Project PlanRI Water Column Monitoring/Small Volume Chemical Data CollectionLower Passaic River Restoration ProjectNew Jersey
Section: Worksheet #10Revision: 2
Date: August 2011Page 1 of 1
J:\Water\ProjectFiles\P120\12182_Passaic\Tasks\CWCM\AECOM QAPP\2011803_Rev2\clean\20110810_CWCM-sv_QAPP_Rev2.docx
QAPP Worksheet #10 (UFP-QAPP Manual Section 2.5.2) Problem Definition
The problem to be addressed by the project:
The proposed sampling program consists of the collection of water column samples to support the characterization of the nature and extent ofcontaminants in the water column in order to understand the characteristics of the water column in the main stem of the LPR (extending from RM 0 toRM 17.4), the major LPRSA tributaries (Saddle River, Second River, Third River), above Dundee Dam, and within Newark Bay and its confluenceswith the Hackensack River, Arthur Kill, and Kill van Kull. Chemical water column sampling supports the understanding of the nature and extent ofcontaminants, and provides data to conduct the RAs and FWM model, and LPR/NB CFT model. CWCM is a required element of LPRRP FSP1 forcompletion of the LPRSA RI/FS per the May 2007 Settlement Agreement and SOW (USEPA 2007a).
The field and laboratory data collected during this program will be utilized in completion of the RI/ FS to:
Understand the relationship between tidal stage, freshwater flow and salinity patterns, and chemical concentrations in the water column. Thisinvestigation has been designed to evaluate a range of hydrologic conditions (e.g., high and low watershed runoff) in order to understand theinfluence of these conditions on water column contaminant concentrations;
Aid in the characterization of potential internal and external sources of contaminants;
Characterize the variation in chemical concentrations within the water column under different hydrologic events and in space; and
Provide information on the temporal and spatial concentrations of contaminants in the water column for use in the RAs and modeling programsthat are currently a part of the LPRSA and NB RIs.
The introduction to the QAPP provides background site information. The PQOs provided in Worksheet #11 include more detail for each samplingobjective.
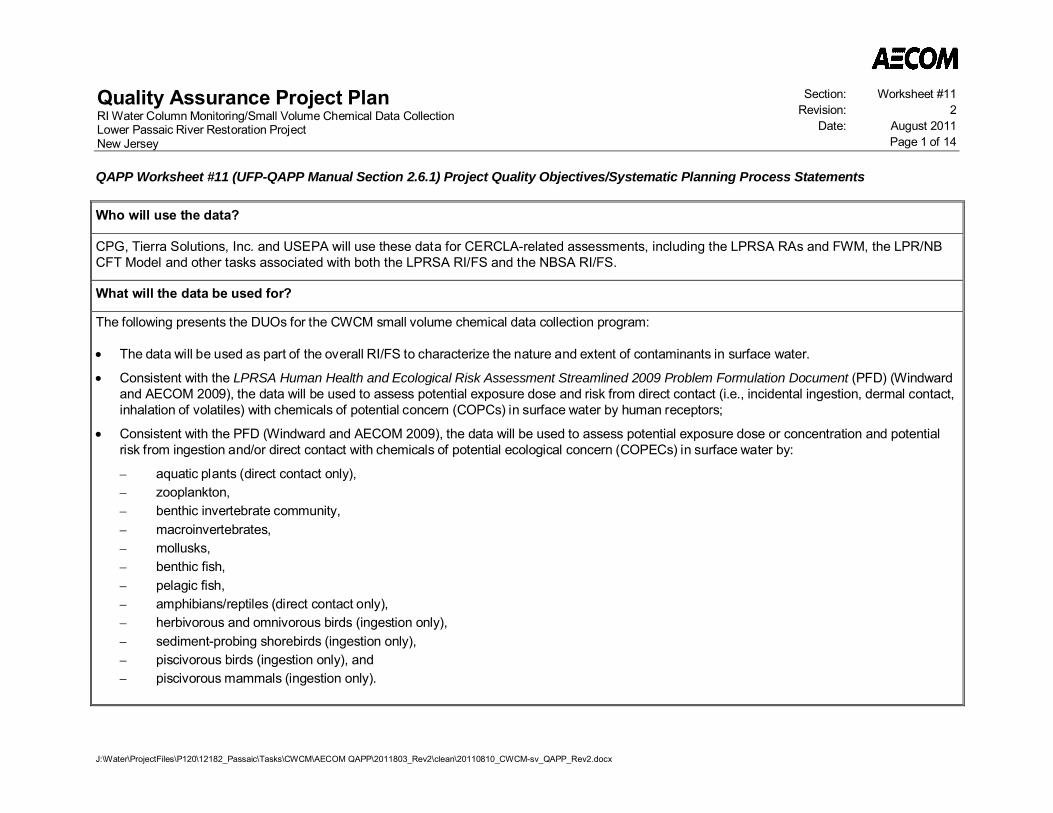
Quality Assurance Project PlanRI Water Column Monitoring/Small Volume Chemical Data CollectionLower Passaic River Restoration ProjectNew Jersey
Section: Worksheet #11Revision: 2
Date: August 2011Page 1 of 14
J:\Water\ProjectFiles\P120\12182_Passaic\Tasks\CWCM\AECOM QAPP\2011803_Rev2\clean\20110810_CWCM-sv_QAPP_Rev2.docx
QAPP Worksheet #11 (UFP-QAPP Manual Section 2.6.1) Project Quality Objectives/Systematic Planning Process Statements
Who will use the data?
CPG, Tierra Solutions, Inc. and USEPA will use these data for CERCLA-related assessments, including the LPRSA RAs and FWM, the LPR/NBCFT Model and other tasks associated with both the LPRSA RI/FS and the NBSA RI/FS.
What will the data be used for?
The following presents the DUOs for the CWCM small volume chemical data collection program:
The data will be used as part of the overall RI/FS to characterize the nature and extent of contaminants in surface water.
Consistent with the LPRSA Human Health and Ecological Risk Assessment Streamlined 2009 Problem Formulation Document (PFD) (Windwardand AECOM 2009), the data will be used to assess potential exposure dose and risk from direct contact (i.e., incidental ingestion, dermal contact,inhalation of volatiles) with chemicals of potential concern (COPCs) in surface water by human receptors;
Consistent with the PFD (Windward and AECOM 2009), the data will be used to assess potential exposure dose or concentration and potentialrisk from ingestion and/or direct contact with chemicals of potential ecological concern (COPECs) in surface water by:
– aquatic plants (direct contact only),– zooplankton,– benthic invertebrate community,– macroinvertebrates,– mollusks,– benthic fish,– pelagic fish,– amphibians/reptiles (direct contact only),– herbivorous and omnivorous birds (ingestion only),– sediment-probing shorebirds (ingestion only),– piscivorous birds (ingestion only), and– piscivorous mammals (ingestion only).

Quality Assurance Project PlanRI Water Column Monitoring/Small Volume Chemical Data CollectionLower Passaic River Restoration ProjectNew Jersey
Section: Worksheet #11Revision: 2
Date: August 2011Page 2 of 14
QAPP Worksheet #11 (UFP-QAPP Manual Section 2.6.1) Project Quality Objectives/Systematic Planning Process Statements
J:\Water\ProjectFiles\P120\12182_Passaic\Tasks\CWCM\AECOM QAPP\2011803_Rev2\clean\20110810_CWCM-sv_QAPP_Rev2.docx
Concentrations of COPCs in surface water will also be compared to applicable, relevant or appropriate requirements (ARARs) (e.g., state orfederal water quality standards).
The data will be used to estimate contribution of COPCs in surface water to the bioaccumulation of COPCs in the food chain.
The data will be used to support the CFT model specifically for:
– Characterization of the initial conditions;
– Calibration, validation and sensitivity testing of the CFT model under various flow conditions; and,
– Development of contaminant loadings to the model.
What types of data are needed (matrix, target analytes, analytical groups, field screening, on-site analytical or off-site laboratorytechniques, sampling techniques)?
Worksheet #15 provides a full list of constituents. The analyte list as outlined in the Fish/Decapod QAPP and Benthic QAPP (Windward 2009a2009b) was used as the basis for the development of the proposed chemistry analyte list for the small volume CWCM program. This list includesthe target analytes for the HHRA, ERA and FWM including PAHs, alkyl PAHS, butyltins, TAL metals, titanium, hexavalent chromium, mercury andmethyl mercury, PCB congeners and homologs, PCDD/PCDFs, OC pesticides, TCL SVOCs (plus TICs), and TCL VOCs (plus TICs). Additionalphysical parameters such as major anions, nitrogen, alkalinity, hardness (as a calculated value), solids fractions, chlorophyll a, phosphorous, andorganic carbon fractions will also be collected to support the FWM and CFT model. All samples submitted for analysis will be analyzed as wholewater except as noted above.
As the initial phase of the CWCM data collection, this investigation will include a number of analyses. All proposed analyses have been assigned toone of four groups described in the following paragraphs:
Group A - A list of target physical, and inorganic and organic chemical analyses is proposed for the full set of stations and depths (refer toWorksheet #15). These analytes will be measured in all samples during each of the eight events and will be used primarily for estimation of EPCsfor the HHRA, ERA and FWM, and in the CFT model calibration. This analyte list is consistent with the Modeling Work Plan (HydroQual, 2006)and includes PCDD/PCDFs, PCB congeners and homologs, mercury (total and dissolved), and supporting parameters to be used in the CFTmodel (i.e., DOC, POC, SSC, TOC, chlorophyll a, alkalinity, sulfate, total sulfide, TDS, and chloride). Total and dissolved cadmium, copper andlead are also included in the Group A list.

Quality Assurance Project PlanRI Water Column Monitoring/Small Volume Chemical Data CollectionLower Passaic River Restoration ProjectNew Jersey
Section: Worksheet #11Revision: 2
Date: August 2011Page 3 of 14
QAPP Worksheet #11 (UFP-QAPP Manual Section 2.6.1) Project Quality Objectives/Systematic Planning Process Statements
J:\Water\ProjectFiles\P120\12182_Passaic\Tasks\CWCM\AECOM QAPP\2011803_Rev2\clean\20110810_CWCM-sv_QAPP_Rev2.docx
Group B - A list of physical, and inorganic and organic chemical analyses is proposed for the full set of stations and depths for a subset ofsampling events (refer to Worksheet #15). These parameters will be used to support EPC calculations for the HHRA, ERA and FWM, as well asvalidation of the CFT model, and include TCL SVOCs, TCL VOCs, TAL metals, a subset of TAL metals in dissolved phase (arsenic, cadmium,chromium, copper, lead, nickel, selenium, and zinc), titanium, methyl mercury (total and dissolved), hexavalent chromium (dissolved only),butyltins, OC pesticides, cyanide, PAHs, alkyl PAHs, hardness (calculated), TKN, ammonia and total phosphorus. TICs reported in associationwith the TCL VOC and SVOC analyses could potentially provide information on the need for alternative methods. Group B analyte data will beused to validate the model and in the RI and RAs. Group B will not be analyzed in winter and spring, as potential exposures and biological activityare lower than in other seasons.
Group C - Pathogen analyses are proposed for near-surface samples during one tidal phase or hydrograph stage from five stations in RM 0 - 17.4of the LPR to determine their relevance in future investigation phases. The five stations, shown in Worksheet #18, were selected by reviewing thesample maps to ensure coverage within the full length of the river, with a focus on areas of where CSOs are present and to provide informationregarding the input of pathogens during storm events from off-site sources. Group C will be sampled during spring and summer routine events,the low flow/spring tide event, and both high flow events and includes total coliform and E. coli, fecal coliform, fecal streptococci and fecalenterococci bacteria.
Group D - Additional pathogen analyses are proposed for near-surface samples during one tidal phase or hydrograph stage from the five stationsin RM 0 - 17.4 of the LPR to determine their relevance in future investigation phases. These five stations are the same stations sampled for GroupC analytes, but during fewer sampling events. Group D includes the protozoans Giardia and cryptosporidium and will be sampled during summerroutine events and both high flow events.
Specific stations designated for the additional Group C and D analyses are noted in Worksheet #18.
Field measurements will include continuous surface to near-bottom measurements of dissolved oxygen, pH, specific conductivity, temperature, andsalinity. Physical, chemical, and biological/pathogen tests will be performed on the water samples at the laboratories identified in Worksheet #30according to methods listed in Worksheet #23.
For the LPRSA RAs and FWM:
Total concentrations of target analytes are needed for evaluation of the ingestion, dermal contact, direct contact, and inhalation (volatilization)pathways.
Quality Assurance Project PlanRI Water Column Monitoring/Small Volume Chemical Data CollectionLower Passaic River Restoration ProjectNew Jersey
Section: Worksheet #11Revision: 2
Date: August 2011Page 4 of 14
QAPP Worksheet #11 (UFP-QAPP Manual Section 2.6.1) Project Quality Objectives/Systematic Planning Process Statements
J:\Water\ProjectFiles\P120\12182_Passaic\Tasks\CWCM\AECOM QAPP\2011803_Rev2\clean\20110810_CWCM-sv_QAPP_Rev2.docx
Dissolved concentrations are needed for evaluation of metals that have water quality criteria that are based on the dissolved fraction. Due to theanalytical method, hexavalent chromium will be collected in filtered samples only (i.e., the dissolved fraction).
To aid in characterizing background conditions, analysis of a subset of samples for bacterial and protozoan pathogens will be included.Characterization will include the variability and short-term (acute) concentrations in human pathogen levels under varying conditions such as flowand seasonality.
Samples that characterize concentrations in the upper few feet of the water column (e.g., 0-3 ft) will be used for evaluating potential humanexposures to COPCs during activities such as swimming or wading. This will be achieved by collecting near surface samples at locations in thetidal part of the river and mid-column samples in the shallower non-tidal part of the river.
Samples that characterize concentrations throughout the water column are appropriate for evaluating potential ecological exposures to COPECs.This will be achieved by collecting near surface and near bottom samples at locations in the tidal part of the river and mid-column samples in theshallower non-tidal part of the river.
For the LPR/NB CFT model:
Total concentrations of target analytes are needed for model calibration, validation, and sensitivity analysis, and for developing contaminantloadings to the model. Specific data usage for calibration and validation is provided in the Modeling Work Plan (HydroQual 2006).
Parameters such as suspended solids, pH, salinity, chlorophyll a, dissolved and particulate organic carbon, major anions (sulfates, chlorides,alkalinity, and sulfide), TDS, temperature, and dissolved oxygen will be measured to aid in characterizing background conditions, as well as foruse in developing inputs of adsorbents to the CFT model.
How “good” do the data need to be in order to support the environmental decision?
The data need to meet project action limits (PALs)) based on the lower of human health and ecological criteria (e.g., national recommended waterquality criteria, New Jersey water quality standards). The PALs are presented in Worksheet #15. Not all PALs will be met in the small volumesampling program. These data will be used to inform the development of the high volume sampling program, which will, in part, address smallvolume data needs where PALs were not achieved. For constituents that meet the PALs, or where frequency of detection is high enough toprovide the data necessary to calibrate and validate the CFT model, additional data needs will be fewer. Where PALs are not met or thefrequency of detection is not adequate to meet the project quality objectives, constituents will be reviewed for inclusion in the high volume

Quality Assurance Project PlanRI Water Column Monitoring/Small Volume Chemical Data CollectionLower Passaic River Restoration ProjectNew Jersey
Section: Worksheet #11Revision: 2
Date: August 2011Page 5 of 14
QAPP Worksheet #11 (UFP-QAPP Manual Section 2.6.1) Project Quality Objectives/Systematic Planning Process Statements
J:\Water\ProjectFiles\P120\12182_Passaic\Tasks\CWCM\AECOM QAPP\2011803_Rev2\clean\20110810_CWCM-sv_QAPP_Rev2.docx
sampling program (in prep). The high volume sampling program PQOs will be determined using the results of the small volume program. At aminimum, high volume sampling data will be collected to augment the development of partitioning parameters for use in the CFT model.
Following the first Routine Event, a subset of 20 samples will be analyzed using rapid turnaround time for the Group A analytes. The results ofthese samples will serve as the first evaluation of the ability of the data to support the environmental decision. Upon receipt of the data from thelaboratory, USEPA, CPG and Tierra will review the data to determine the efficacy of the small volume methods to achieve the PQOs. The CPGand Tierra will provide opinions to USEPA, who will make the final determination. No additional sampling will occur until an agreement is reachedon the results of the first event Group A sample analyses.
Upon completion of the first two Routine Events and throughout the duration of the small volume program, the overall quality of the data will beexamined. If groups of chemicals are undetected or rejected, the small volume program will be re-assessed and may be modified.
The data need to be collected and analyzed in conformance with various USEPA Region 2 quality assurance guidance and manuals(http://www.epa.gov/region2/qa/documents.htm).
How much data are needed (number of samples for each analytical group, matrix, and concentration)?
For the LPRSA RAs and FWM:
Sample collection is planned throughout the LPRSA (RM 0 to 17.4 and the LPRSA tributaries) and above Dundee Dam.
The number of samples for the target analytes is planned to be sufficient to calculate average temporal concentrations as described in the nextsection, including the ability to calculate average concentrations at sampling locations within the potential human or ecological exposure areas inthe river. The definition of exposure areas is ongoing as information regarding access, shoreline characteristics, and human uses is collectedthroughout the RI/FS process. The amount of data being collected from the LPRSA should be sufficient to calculate the necessary exposure pointconcentrations with statistical confidence. Two hundred (200) samples will be collected from the LPR between RM 0 – 17.4 during the smallvolume program; 40 samples from each of the five locations. This number of samples is intended to be sufficient to calculate Upper ConfidenceLimits (UCLs) of average concentrations depending upon the exposure scenario.
For the LPR/NB CFT model:
Samples collection is planned throughout the LPRSA (RM 0 to 17.4 and the LPRSA tributaries), above Dundee Dam, in Newark Bay and itsconfluences with the Hackensack River, Arthur Kill and Kill van Kull.
Quality Assurance Project PlanRI Water Column Monitoring/Small Volume Chemical Data CollectionLower Passaic River Restoration ProjectNew Jersey
Section: Worksheet #11Revision: 2
Date: August 2011Page 6 of 14
QAPP Worksheet #11 (UFP-QAPP Manual Section 2.6.1) Project Quality Objectives/Systematic Planning Process Statements
J:\Water\ProjectFiles\P120\12182_Passaic\Tasks\CWCM\AECOM QAPP\2011803_Rev2\clean\20110810_CWCM-sv_QAPP_Rev2.docx
The data need to be representative of the various processes in the CFT model such that the diffusive flux rate from the sediment to the watercolumn, resuspension/deposition during storm events, tidal mixing and transport through the salt wedge can be characterized to support thepreliminary model calibration and validation. Specifics on the model calibration, validation and sensitivity analysis processes are provided in theModeling Work Plan (HydroQual 2006).
A minimum of eight events are proposed to capture data representative of processes (see HydroQual 2006) to be calibrated and validated in themodel. Multiple stations are proposed within the LPRSA, above Dundee Dam, and NBSA in order to capture spatial patterns in contaminantconcentrations in the study area. It is anticipated that adequate Group B analyte data will be obtained for the model validation from one high flowevent.
The data are intended to provide sufficient temporal (i.e., multiple seasons) coverage to provide an estimate of the contaminant and adsorbentloadings at the model boundaries (i.e., above Dundee Dam, Kill van Kull, Arthur Kill, Hackensack River, Saddle River, Second River, and ThirdRiver) during the monitoring events as well as to develop average or time-variable estimates of boundary loadings under current and futureconditions.
Where, when, and how should the data be collected/generated?
The data need to provide spatial coverage of the study area for ecological exposures, and be representative of locations where human exposureis likely to occur based on access, land use, and shoreline characteristics. Data from the sampling locations closest in proximity to an exposurearea will be used. Exposure areas are generally described in the PFD (Windward and AECOM 2009).
The data are intended to address temporal variability and provide an estimate of long-term (annual) average concentrations. Direct contact withand ingestion of surface water may occur anytime during the year, although human exposure is anticipated to be greater during the warmermonths of the year. Sampling is intended to characterize seasonal variability and provide for estimation of annual average water columnconcentrations. Sampling is planned to characterize water column concentrations during the seasons of the year when human and biologicalactivities on the river are expected to be greatest (e.g., late spring, summer, early fall).
The data are intended to reflect a variety of flow conditions and tidal stages to characterize the variability in influxes and mixing processes in thestudy area. At a minimum, low flow, high flow and typical flow events will be captured.
The data are intended to be collected from locations where suspension of solids in the water column is likely to occur under different flow regimes.

Quality Assurance Project PlanRI Water Column Monitoring/Small Volume Chemical Data CollectionLower Passaic River Restoration ProjectNew Jersey
Section: Worksheet #11Revision: 2
Date: August 2011Page 7 of 14
QAPP Worksheet #11 (UFP-QAPP Manual Section 2.6.1) Project Quality Objectives/Systematic Planning Process Statements
J:\Water\ProjectFiles\P120\12182_Passaic\Tasks\CWCM\AECOM QAPP\2011803_Rev2\clean\20110810_CWCM-sv_QAPP_Rev2.docx
Samples that characterize concentrations in the upper water column are appropriate for evaluating potential human exposures to COPCs duringactivities such as swimming or wading. This will be achieved by collecting near surface (i.e., from 3 ft below surface) samples at locations in thetidal part of the river and mid-column samples in the shallower non-tidal part of the river.
To meet the desired data needs, three types of sampling events are proposed: Routine Events, Low Flow/Spring Tide Events and High FlowEvents. Data from the sampling events will provide some measure of variability and provide the data needed to estimate long term averageconcentrations. The following describes the events.
The flow thresholds for the low flow and high flow events were selected from an analysis of the discharge record at Dundee Dam (April 2007 toAugust 2010). The low flow event threshold was identified by conducting an analysis of the number of events satisfying both the discharge criterionand the spring-tide criterion. The analysis showed that a discharge criterion of <400 cfs sustained over the course of at least 7 days was satisfiedmultiple times (i.e., 8-12 times per calendar years 2007-2009) in each of the years over the period of record at Dundee Dam. Flows of < 400 cfsmaintained for 7 consecutive days and predicted to persist through the sampling period will trigger suitable conditions for the Low Flow Event. Thiswill prevent capture of transient substances from any storm events during the period preceding the sampling event.
The high flow threshold was identified by conducting a return frequency analysis using the available discharge data at Dundee Dam. A flow eventwith a return period of 3 months (or 4 occurrences per year), was chosen as the flow threshold that can reasonably be expected to be exceededduring the CWCM period. Accordingly, the discharge associated with the 1 in 3 months event at Dundee Dam was calculated to be 3,000 cfs andis proposed as the minimum flow for a high flow event. The high flows (exceeding 3,000 cfs) that trigger the High Flow Events are not sustainedhigh flows, but weather-induced flows. The predicted peak discharge of a weather event should exceed the 3,000 cfs criterion to trigger an event.There is no limitation with respect to the duration of the event, but events of such magnitude may occur over the span of several days.
Routine Events (400 - 3,000 cfs at Dundee Dam)
Five Routine Events are planned under different seasonal conditions (i.e., one in winter, two in spring, and two in summer).
One Routine Event will target spring tide conditions and one will target neap tide conditions.
Data collected during these events combined with preliminary partitioning parameters obtained from scientific literature will be used in thepreliminary calibration of the diffusive flux rate from the sediments to the water column, and the deposition of particle-bound contaminants fromthe water column to the sediment.
Five Routine Events under low- to medium-flow conditions (400 - 3,000 cfs at Dundee Dam) are proposed to capture data representative of theinfluxes and mixing processes in the river and the bay, the deposition of particulates from the water column to the sediment, and of the diffusiveflux of contaminants from the sediments to the water column.

Quality Assurance Project PlanRI Water Column Monitoring/Small Volume Chemical Data CollectionLower Passaic River Restoration ProjectNew Jersey
Section: Worksheet #11Revision: 2
Date: August 2011Page 8 of 14
QAPP Worksheet #11 (UFP-QAPP Manual Section 2.6.1) Project Quality Objectives/Systematic Planning Process Statements
J:\Water\ProjectFiles\P120\12182_Passaic\Tasks\CWCM\AECOM QAPP\2011803_Rev2\clean\20110810_CWCM-sv_QAPP_Rev2.docx
Samples will be collected at the following 17 locations:
Above Dundee Dam,
Saddle River,
Second River,
Third River,
Passaic River at RM 10.2 if flow is > 250 cfs at Dundee Dam or RM 13.5 when flow is < 250 cfs at Dundee Dam,
Passaic River at RM 0,
Passaic River at RM 1.4,
Passaic River at RM 6.7 (or approximately one mile downstream of the toe of the salt wedge if flow is < 1,000 cfs at Dundee Dam),
Passaic River at RM 4.2 (or halfway between the toe of the salt wedge and RM 1.4 up to RM 4.2 if flow is < 1,000 cfs at Dundee Dam),
Newark Bay North,
Newark Bay East,
Newark Bay Northeast,
Newark Bay Northwest,
Newark Bay South,
Kill van Kull,
Arthur Kill, and
Hackensack River.
The locations in Newark Bay North, Newark Bay South, Hackensack River, Kill van Kull, Arthur Kill, RM 10.2, and RM 1.4 are the same locationsoccupied in the spring 2010 PWCM program. The location at the toe of the salt wedge will be determined from a lookup table identifying the 2ppth isohaline location as a function of discharge, tidal range (spring/neap), and tidal cycle (high-/low-tide). See Exhibit 1 of Appendix A (FSPAddendum).
Quality Assurance Project PlanRI Water Column Monitoring/Small Volume Chemical Data CollectionLower Passaic River Restoration ProjectNew Jersey
Section: Worksheet #11Revision: 2
Date: August 2011Page 9 of 14
QAPP Worksheet #11 (UFP-QAPP Manual Section 2.6.1) Project Quality Objectives/Systematic Planning Process Statements
J:\Water\ProjectFiles\P120\12182_Passaic\Tasks\CWCM\AECOM QAPP\2011803_Rev2\clean\20110810_CWCM-sv_QAPP_Rev2.docx
Samples will be collected 3 ft below the surface and 3 ft from the bottom of the water column at RM 1.4, RM 10.2, the two locations within the saltwedge in the LPR and at all locations in Newark Bay, Kill van Kull, Arthur Kill, and the Hackensack River in order to characterize concentrationsthrough the water column. At all locations with surface and bottom measurements, the bottom sample will be located 3 ft above the bottom at thethalweg. The proposed depths (3 feet off the bottom and three feet from the surface) were selected to with the goal of sampling the relevant layerwhile avoiding artifacts associated with sampling in close proximity to the sediment bed, the pycnocline, and the water surface. The freshwaterstations (Dundee Dam, Saddle River, Second River, and Third River) will be sampled at mid-depth.
Samples at RM 1.4, RM 10.2, the two locations within the salt wedge in the LPR and at all locations in Newark Bay, Kill van Kull, Arthur Kill, andthe Hackensack River will be collected immediately before high water slack and low water slack, as well as near the maximum velocities of ebband flood tides to characterize contaminant concentrations throughout the tidal cycle. This frequency will be reviewed and discussed with USEPAfollowing the first two events to determine if sampling just high water slack and low water slack will achieve the PQO. Suspended solids are likelyto be higher during maximum flood and ebb velocity and lower during periods of slack tide. Should the concentrations vary by more than 50%between tide stages at any station, this may indicate that intra-tidal variability is a driving factor in overall variability. However, should thedifferences be less than 50%, it is unlikely that intra-tidal variability will impact the model and the frequency of sampling should be revisited.Samples above Dundee Dam and the LPRSA tributaries will be sampled once per event, independent of tide stage.
The sampling will be quasi-synoptic. Specifically, sample collection will be conducted within approximately a four-day time frame, and near thesame phase of the tide for the tidal locations only. Basic meterological conditions such as wind speed, wind direction and precipitation will bemonitored and recorded during each sampling event.
High Flow Events (> 3,000 cfs at Dundee Dam)
Two sampling events are proposed under storm-induced high flow (i.e., not sustained high flow) conditions (>3,000 cfs at Dundee Dam) in orderto capture data under conditions in which resuspension of contaminants from the sediment bed and subsequent deposition from the water columnare expected to dominate over other transport processes. Storm events rather than elevated base-flow conditions are expected to be theconditions under which such processes dominate. During elevated base-flows where the discharge is high over an extended period of time, thesediment is expected to be armored allowing for little suspension. The criterion of 3,000 cfs is the flow under which the salt front is anticipated tobe below RM 1.4 and is the three-month return period event. As described in Appendix A, the high flow event flow criterion may be relaxed if theflows are not achieved such that storm event data may be collected. USEPA will be consulted should the criterion be revisited.
Data collected during these events are intended to be used in the preliminary calibration of the resuspension fluxes from the sediments to thewater column, and the subsequent deposition of particle-bound contaminants from the water column to the sediment. It is also anticipated thatduring these events there will be a higher loading of suspended sediments (i.e., more contamination per unit weight of suspended solids, as thesuspended solids during a storm event would include more bed sediment). The multiple samples during the course of the hydrograph are

Quality Assurance Project PlanRI Water Column Monitoring/Small Volume Chemical Data CollectionLower Passaic River Restoration ProjectNew Jersey
Section: Worksheet #11Revision: 2
Date: August 2011Page 10 of 14
QAPP Worksheet #11 (UFP-QAPP Manual Section 2.6.1) Project Quality Objectives/Systematic Planning Process Statements
J:\Water\ProjectFiles\P120\12182_Passaic\Tasks\CWCM\AECOM QAPP\2011803_Rev2\clean\20110810_CWCM-sv_QAPP_Rev2.docx
intended to provide a better understanding of the changes in suspended solids and its effect on water column concentrations, especially for the
Dundee Dam station. This is intended to permit the development of a rating curve to predict a loading function depending on the hydrograph forthe LPR/NB CFT model.
Samples will be collected at the following 17 locations:
– Above Dundee Dam,
– Saddle River,
– Second River,
– Third River,
– RM 10.2,
– RM 6.7,
– RM 4.2,
– RM 1.4,
– RM 0,
– Newark Bay North,
– Newark Bay East,
– Newark Bay Northeast,
– Newark Bay Northwest,
– Newark Bay South,
– Kill van Kull,
– Arthur Kill, and
– Hackensack River.
Quality Assurance Project PlanRI Water Column Monitoring/Small Volume Chemical Data CollectionLower Passaic River Restoration ProjectNew Jersey
Section: Worksheet #11Revision: 2
Date: August 2011Page 11 of 14
QAPP Worksheet #11 (UFP-QAPP Manual Section 2.6.1) Project Quality Objectives/Systematic Planning Process Statements
J:\Water\ProjectFiles\P120\12182_Passaic\Tasks\CWCM\AECOM QAPP\2011803_Rev2\clean\20110810_CWCM-sv_QAPP_Rev2.docx
The locations in Newark Bay North, Newark Bay South, Hackensack, Kill van Kull, Arthur Kill, and RMs 10.2, 6.7, 4.2, and 1.4 are the samelocations occupied in the spring 2010 PWCM program.
Multiple samples are proposed to be collected over the course of the predicted storm hydrograph. As detailed in the FSP (Appendix A), foursamples over the predicted storm hydrograph are intended to be collected at most stations. Two samples are proposed for collection on the risinglimb on the hydrograph, one near the predicted storm peak, and one on the falling limb of the hydrograph. To capture data on upstreamcontributions to the LPRSA during storm events, six samples are proposed over the predicted storm hydrograph above Dundee Dam; three on therising limb, one near predicted peak, and two on the falling limb of the predicted hydrograph. Arthur Kill and Kill van Kull are proposed to besampled approximately prior to high slack and prior to low slack tide, similar to the Routine Events.
Above Dundee Dam, the Saddle River, Second River, and Third River stations are proposed to be sampled at mid-depth. The remaining stationswill be sampled at both 3 ft below the surface and 3 ft from the bottom of the water column.
The data are unlikely to be truly synoptic, but the goal will be collect samples throughout the period of the predicted storm hydrograph, somewhatevenly distributed at all locations. Basic meterological conditions such as wind speed, wind direction and precipitation will be monitored andrecorded during each sampling event.
Low Flow/Spring Tide Event (< 400 cfs at Dundee Dam)
One monitoring event is proposed during low-flow conditions (<400 cfs at Dundee Dam) in combination with a spring tide, since this combinationis expected to generate the highest tidal energies and tidal mixing as compared to other flow/tide combinations. The 400 cfs criterion is adischarge during which the salt wedge remains upstream of the Primary Erosion Zone.
Data collected during the event will be used in the calibration of tidally-driven resuspension processes, potential for upstream transport ofcontaminants through the salt wedge, and the deposition of particle-bound contaminants from the water column to the sediment.
Samples will be collected at the following nine locations:
– Above Dundee Dam,
– Second River,
– Third River,
– Saddle River,
– RM 0,
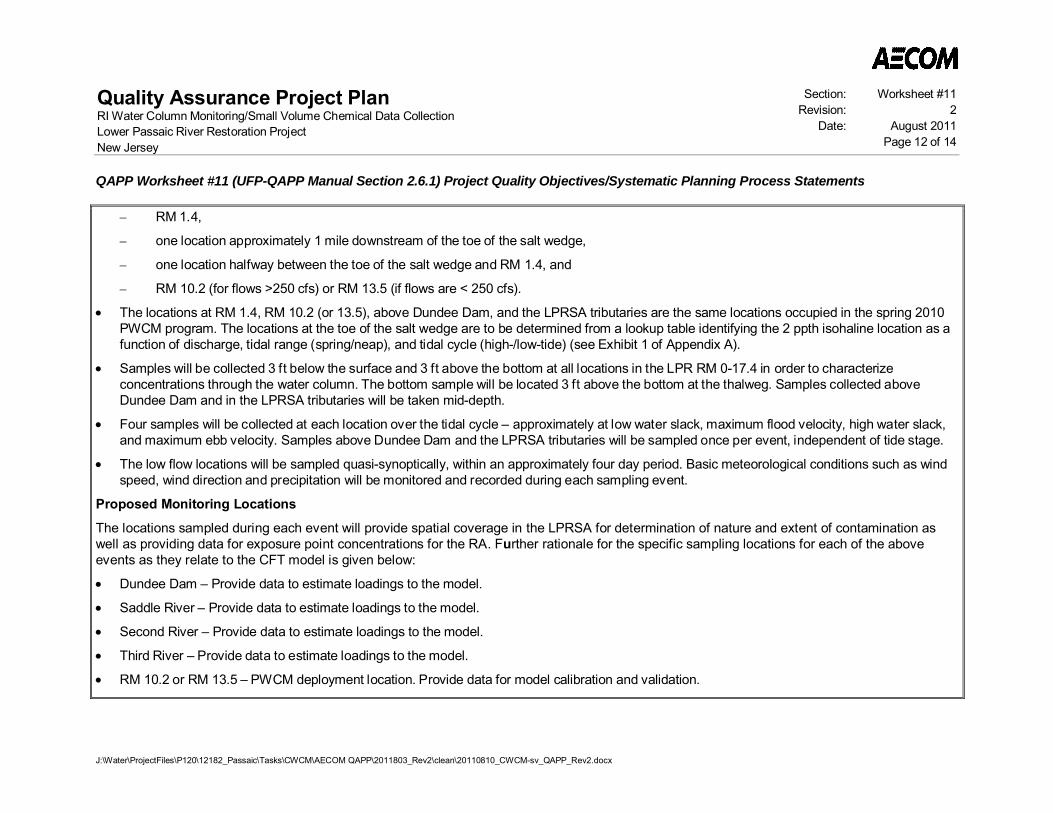
Quality Assurance Project PlanRI Water Column Monitoring/Small Volume Chemical Data CollectionLower Passaic River Restoration ProjectNew Jersey
Section: Worksheet #11Revision: 2
Date: August 2011Page 12 of 14
QAPP Worksheet #11 (UFP-QAPP Manual Section 2.6.1) Project Quality Objectives/Systematic Planning Process Statements
J:\Water\ProjectFiles\P120\12182_Passaic\Tasks\CWCM\AECOM QAPP\2011803_Rev2\clean\20110810_CWCM-sv_QAPP_Rev2.docx
– RM 1.4,
– one location approximately 1 mile downstream of the toe of the salt wedge,
– one location halfway between the toe of the salt wedge and RM 1.4, and
– RM 10.2 (for flows >250 cfs) or RM 13.5 (if flows are < 250 cfs).
The locations at RM 1.4, RM 10.2 (or 13.5), above Dundee Dam, and the LPRSA tributaries are the same locations occupied in the spring 2010PWCM program. The locations at the toe of the salt wedge are to be determined from a lookup table identifying the 2 ppth isohaline location as afunction of discharge, tidal range (spring/neap), and tidal cycle (high-/low-tide) (see Exhibit 1 of Appendix A).
Samples will be collected 3 ft below the surface and 3 ft above the bottom at all locations in the LPR RM 0-17.4 in order to characterizeconcentrations through the water column. The bottom sample will be located 3 ft above the bottom at the thalweg. Samples collected aboveDundee Dam and in the LPRSA tributaries will be taken mid-depth.
Four samples will be collected at each location over the tidal cycle – approximately at low water slack, maximum flood velocity, high water slack,and maximum ebb velocity. Samples above Dundee Dam and the LPRSA tributaries will be sampled once per event, independent of tide stage.
The low flow locations will be sampled quasi-synoptically, within an approximately four day period. Basic meteorological conditions such as windspeed, wind direction and precipitation will be monitored and recorded during each sampling event.
Proposed Monitoring Locations
The locations sampled during each event will provide spatial coverage in the LPRSA for determination of nature and extent of contamination aswell as providing data for exposure point concentrations for the RA. Further rationale for the specific sampling locations for each of the aboveevents as they relate to the CFT model is given below:
Dundee Dam – Provide data to estimate loadings to the model.
Saddle River – Provide data to estimate loadings to the model.
Second River – Provide data to estimate loadings to the model.
Third River – Provide data to estimate loadings to the model.
RM 10.2 or RM 13.5 – PWCM deployment location. Provide data for model calibration and validation.
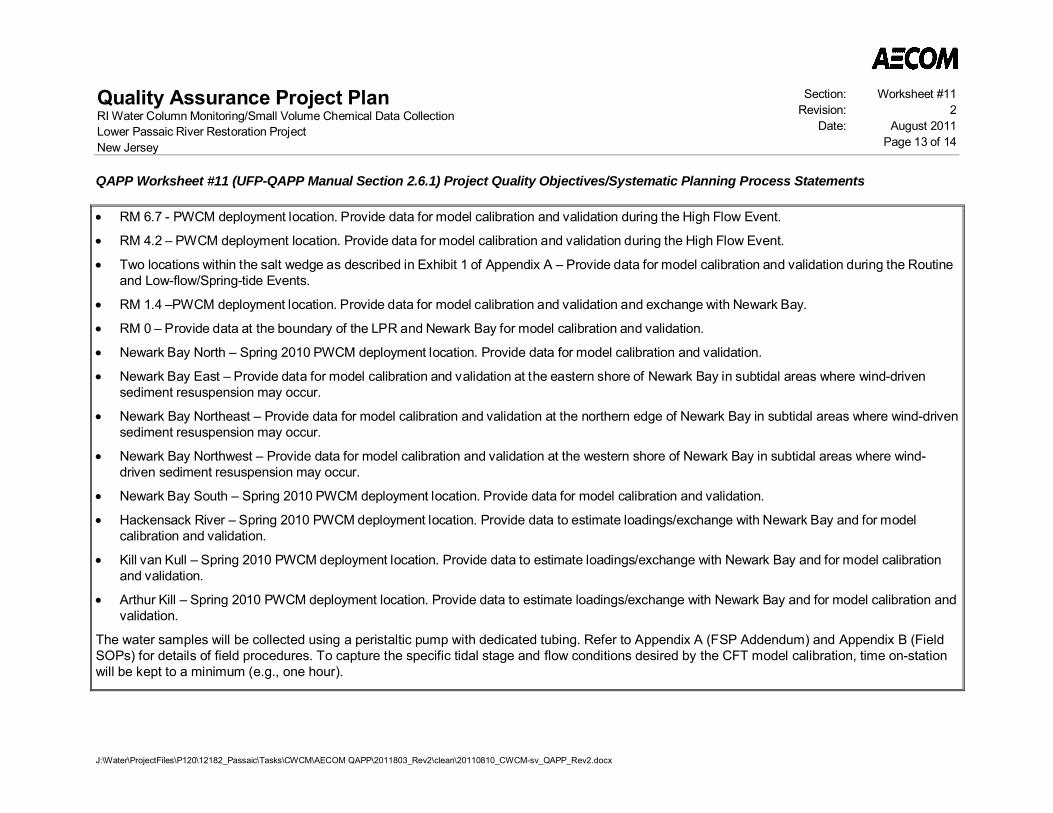
Quality Assurance Project PlanRI Water Column Monitoring/Small Volume Chemical Data CollectionLower Passaic River Restoration ProjectNew Jersey
Section: Worksheet #11Revision: 2
Date: August 2011Page 13 of 14
QAPP Worksheet #11 (UFP-QAPP Manual Section 2.6.1) Project Quality Objectives/Systematic Planning Process Statements
J:\Water\ProjectFiles\P120\12182_Passaic\Tasks\CWCM\AECOM QAPP\2011803_Rev2\clean\20110810_CWCM-sv_QAPP_Rev2.docx
RM 6.7 - PWCM deployment location. Provide data for model calibration and validation during the High Flow Event.
RM 4.2 – PWCM deployment location. Provide data for model calibration and validation during the High Flow Event.
Two locations within the salt wedge as described in Exhibit 1 of Appendix A – Provide data for model calibration and validation during the Routineand Low-flow/Spring-tide Events.
RM 1.4 –PWCM deployment location. Provide data for model calibration and validation and exchange with Newark Bay.
RM 0 – Provide data at the boundary of the LPR and Newark Bay for model calibration and validation.
Newark Bay North – Spring 2010 PWCM deployment location. Provide data for model calibration and validation.
Newark Bay East – Provide data for model calibration and validation at the eastern shore of Newark Bay in subtidal areas where wind-drivensediment resuspension may occur.
Newark Bay Northeast – Provide data for model calibration and validation at the northern edge of Newark Bay in subtidal areas where wind-drivensediment resuspension may occur.
Newark Bay Northwest – Provide data for model calibration and validation at the western shore of Newark Bay in subtidal areas where wind-driven sediment resuspension may occur.
Newark Bay South – Spring 2010 PWCM deployment location. Provide data for model calibration and validation.
Hackensack River – Spring 2010 PWCM deployment location. Provide data to estimate loadings/exchange with Newark Bay and for modelcalibration and validation.
Kill van Kull – Spring 2010 PWCM deployment location. Provide data to estimate loadings/exchange with Newark Bay and for model calibrationand validation.
Arthur Kill – Spring 2010 PWCM deployment location. Provide data to estimate loadings/exchange with Newark Bay and for model calibration andvalidation.
The water samples will be collected using a peristaltic pump with dedicated tubing. Refer to Appendix A (FSP Addendum) and Appendix B (FieldSOPs) for details of field procedures. To capture the specific tidal stage and flow conditions desired by the CFT model calibration, time on-stationwill be kept to a minimum (e.g., one hour).
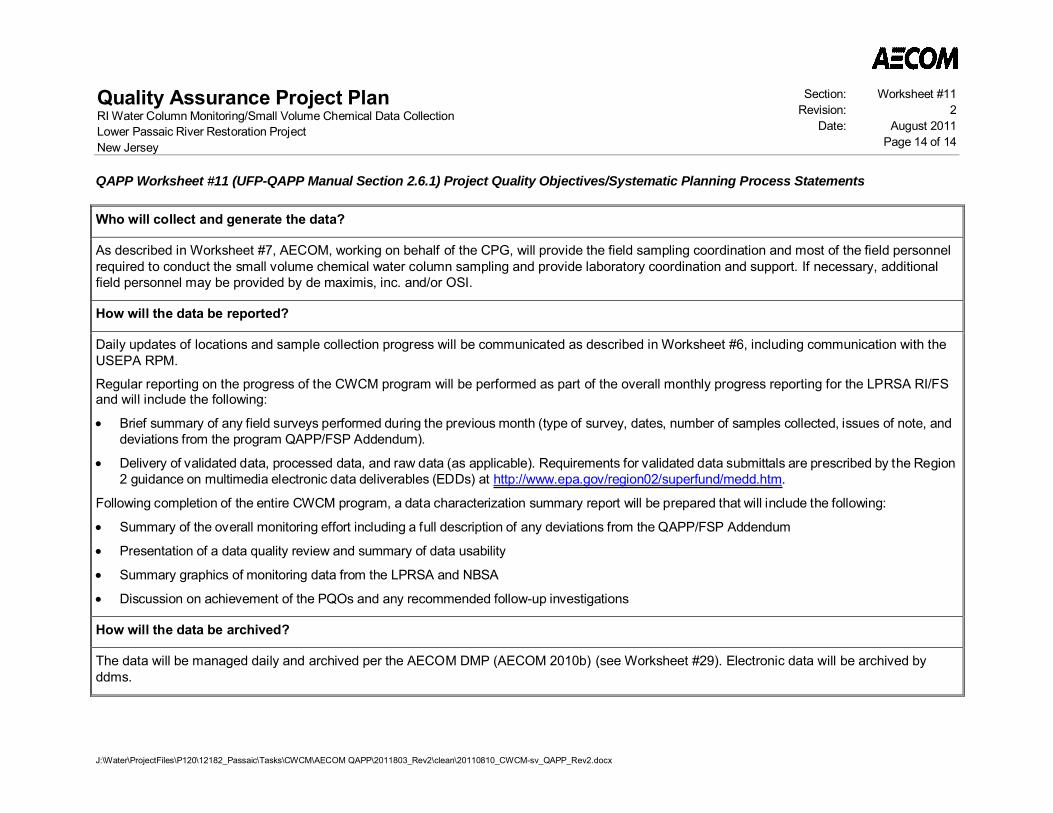
Quality Assurance Project PlanRI Water Column Monitoring/Small Volume Chemical Data CollectionLower Passaic River Restoration ProjectNew Jersey
Section: Worksheet #11Revision: 2
Date: August 2011Page 14 of 14
QAPP Worksheet #11 (UFP-QAPP Manual Section 2.6.1) Project Quality Objectives/Systematic Planning Process Statements
J:\Water\ProjectFiles\P120\12182_Passaic\Tasks\CWCM\AECOM QAPP\2011803_Rev2\clean\20110810_CWCM-sv_QAPP_Rev2.docx
Who will collect and generate the data?
As described in Worksheet #7, AECOM, working on behalf of the CPG, will provide the field sampling coordination and most of the field personnelrequired to conduct the small volume chemical water column sampling and provide laboratory coordination and support. If necessary, additionalfield personnel may be provided by de maximis, inc. and/or OSI.
How will the data be reported?
Daily updates of locations and sample collection progress will be communicated as described in Worksheet #6, including communication with theUSEPA RPM.
Regular reporting on the progress of the CWCM program will be performed as part of the overall monthly progress reporting for the LPRSA RI/FSand will include the following:
Brief summary of any field surveys performed during the previous month (type of survey, dates, number of samples collected, issues of note, anddeviations from the program QAPP/FSP Addendum).
Delivery of validated data, processed data, and raw data (as applicable). Requirements for validated data submittals are prescribed by the Region2 guidance on multimedia electronic data deliverables (EDDs) at http://www.epa.gov/region02/superfund/medd.htm.
Following completion of the entire CWCM program, a data characterization summary report will be prepared that will include the following:
Summary of the overall monitoring effort including a full description of any deviations from the QAPP/FSP Addendum
Presentation of a data quality review and summary of data usability
Summary graphics of monitoring data from the LPRSA and NBSA
Discussion on achievement of the PQOs and any recommended follow-up investigations
How will the data be archived?
The data will be managed daily and archived per the AECOM DMP (AECOM 2010b) (see Worksheet #29). Electronic data will be archived byddms.
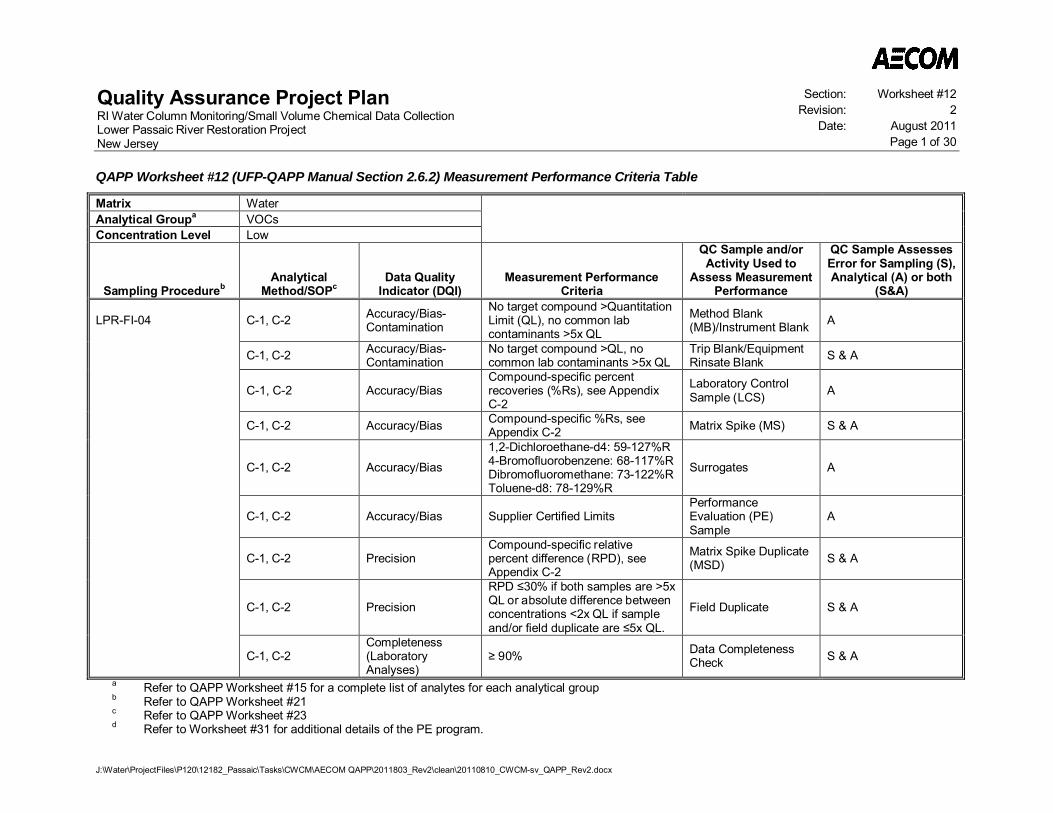
Quality Assurance Project PlanRI Water Column Monitoring/Small Volume Chemical Data CollectionLower Passaic River Restoration ProjectNew Jersey
Section: Worksheet #12Revision: 2
Date: August 2011Page 1 of 30
J:\Water\ProjectFiles\P120\12182_Passaic\Tasks\CWCM\AECOM QAPP\2011803_Rev2\clean\20110810_CWCM-sv_QAPP_Rev2.docx
QAPP Worksheet #12 (UFP-QAPP Manual Section 2.6.2) Measurement Performance Criteria Table
Matrix WaterAnalytical Groupa VOCsConcentration Level Low
Sampling ProcedurebAnalytical
Method/SOPcData Quality
Indicator (DQI)Measurement Performance
Criteria
QC Sample and/orActivity Used to
Assess MeasurementPerformance
QC Sample AssessesError for Sampling (S),Analytical (A) or both
(S&A)
LPR-FI-04 C-1, C-2 Accuracy/Bias-Contamination
No target compound >QuantitationLimit (QL), no common labcontaminants >5x QL
Method Blank(MB)/Instrument Blank A
C-1, C-2 Accuracy/Bias-Contamination
No target compound >QL, nocommon lab contaminants >5x QL
Trip Blank/EquipmentRinsate Blank S & A
C-1, C-2 Accuracy/BiasCompound-specific percentrecoveries (%Rs), see AppendixC-2
Laboratory ControlSample (LCS) A
C-1, C-2 Accuracy/Bias Compound-specific %Rs, seeAppendix C-2 Matrix Spike (MS) S & A
C-1, C-2 Accuracy/Bias
1,2-Dichloroethane-d4: 59-127%R4-Bromofluorobenzene: 68-117%RDibromofluoromethane: 73-122%RToluene-d8: 78-129%R
Surrogates A
C-1, C-2 Accuracy/Bias Supplier Certified LimitsPerformanceEvaluation (PE)Sample
A
C-1, C-2 PrecisionCompound-specific relativepercent difference (RPD), seeAppendix C-2
Matrix Spike Duplicate(MSD) S & A
C-1, C-2 Precision
RPD 30% if both samples are >5xQL or absolute difference betweenconcentrations <2x QL if sampleand/or field duplicate are 5x QL.
Field Duplicate S & A
C-1, C-2Completeness(LaboratoryAnalyses)
90% Data CompletenessCheck S & A
a Refer to QAPP Worksheet #15 for a complete list of analytes for each analytical groupb Refer to QAPP Worksheet #21c Refer to QAPP Worksheet #23d Refer to Worksheet #31 for additional details of the PE program.
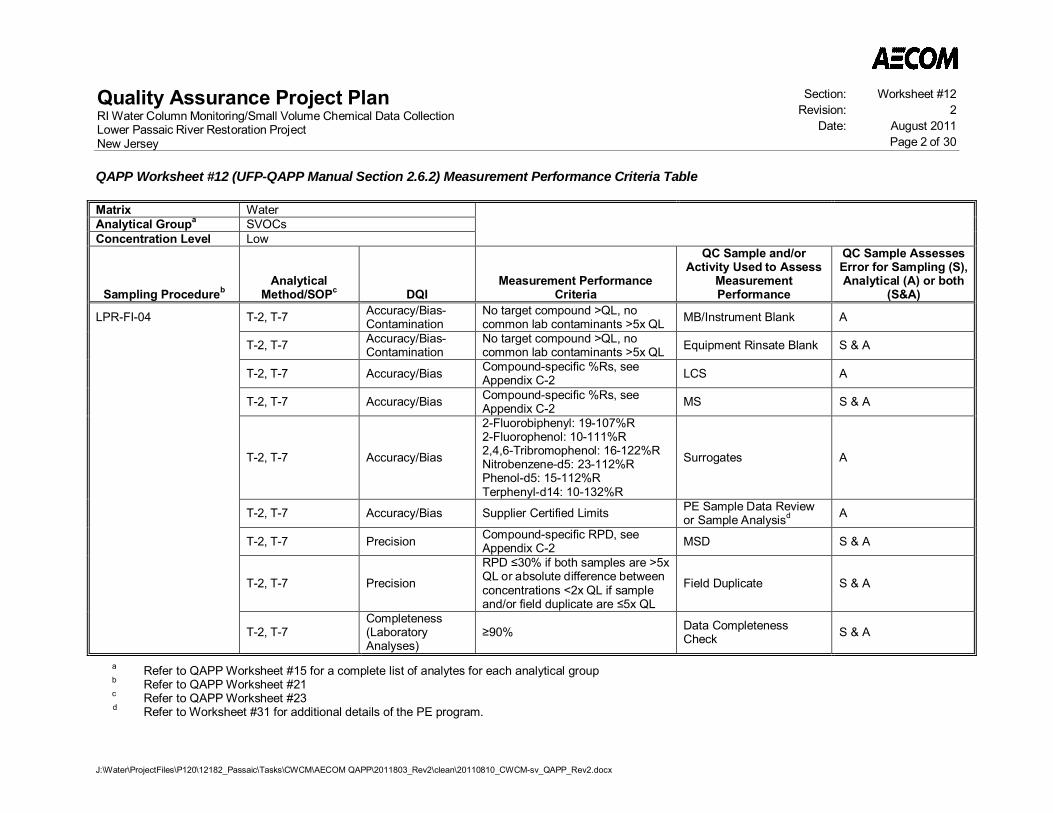
Quality Assurance Project PlanRI Water Column Monitoring/Small Volume Chemical Data CollectionLower Passaic River Restoration ProjectNew Jersey
Section: Worksheet #12Revision: 2
Date: August 2011Page 2 of 30
QAPP Worksheet #12 (UFP-QAPP Manual Section 2.6.2) Measurement Performance Criteria Table
J:\Water\ProjectFiles\P120\12182_Passaic\Tasks\CWCM\AECOM QAPP\2011803_Rev2\clean\20110810_CWCM-sv_QAPP_Rev2.docx
Matrix WaterAnalytical Groupa SVOCsConcentration Level Low
Sampling ProcedurebAnalytical
Method/SOPc DQIMeasurement Performance
Criteria
QC Sample and/orActivity Used to Assess
MeasurementPerformance
QC Sample AssessesError for Sampling (S),Analytical (A) or both
(S&A)
LPR-FI-04 T-2, T-7 Accuracy/Bias-Contamination
No target compound >QL, nocommon lab contaminants >5x QL MB/Instrument Blank A
T-2, T-7 Accuracy/Bias-Contamination
No target compound >QL, nocommon lab contaminants >5x QL Equipment Rinsate Blank S & A
T-2, T-7 Accuracy/Bias Compound-specific %Rs, seeAppendix C-2 LCS A
T-2, T-7 Accuracy/Bias Compound-specific %Rs, seeAppendix C-2 MS S & A
T-2, T-7 Accuracy/Bias
2-Fluorobiphenyl: 19-107%R2-Fluorophenol: 10-111%R2,4,6-Tribromophenol: 16-122%RNitrobenzene-d5: 23-112%RPhenol-d5: 15-112%RTerphenyl-d14: 10-132%R
Surrogates A
T-2, T-7 Accuracy/Bias Supplier Certified Limits PE Sample Data Reviewor Sample Analysisd A
T-2, T-7 Precision Compound-specific RPD, seeAppendix C-2 MSD S & A
T-2, T-7 Precision
RPD 30% if both samples are >5xQL or absolute difference betweenconcentrations <2x QL if sampleand/or field duplicate are 5x QL
Field Duplicate S & A
T-2, T-7Completeness(LaboratoryAnalyses)
90% Data CompletenessCheck S & A
a Refer to QAPP Worksheet #15 for a complete list of analytes for each analytical groupb Refer to QAPP Worksheet #21c Refer to QAPP Worksheet #23d Refer to Worksheet #31 for additional details of the PE program.
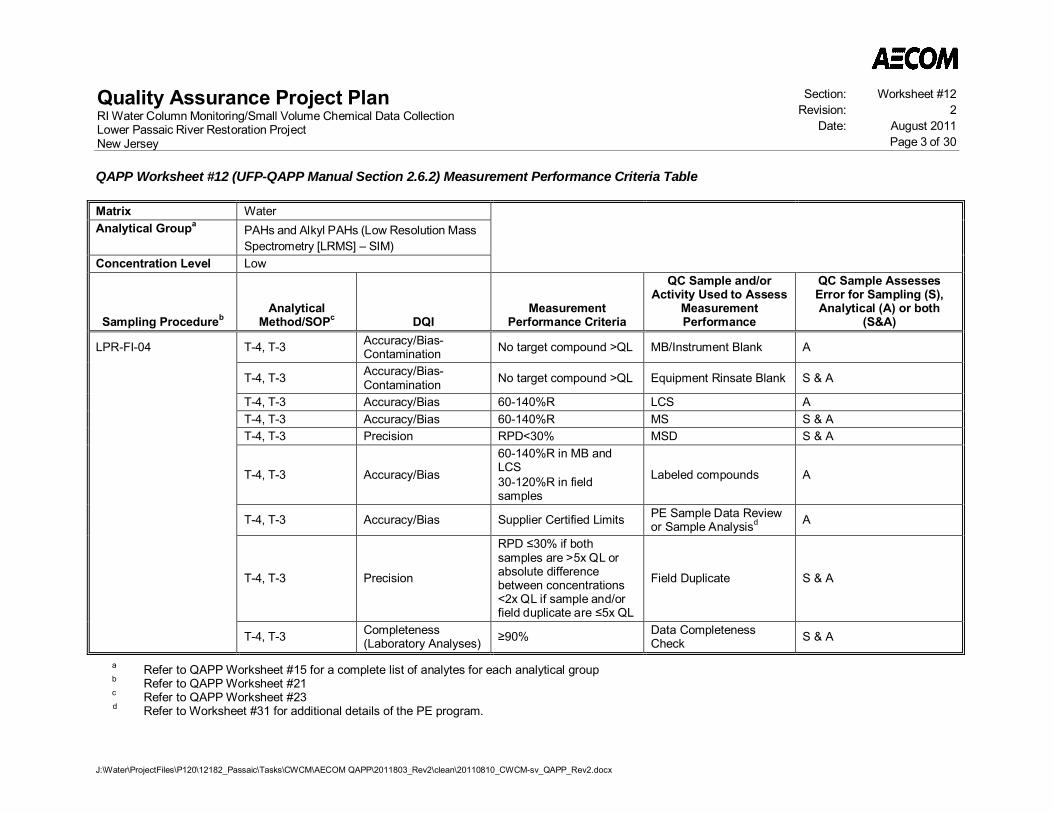
Quality Assurance Project PlanRI Water Column Monitoring/Small Volume Chemical Data CollectionLower Passaic River Restoration ProjectNew Jersey
Section: Worksheet #12Revision: 2
Date: August 2011Page 3 of 30
QAPP Worksheet #12 (UFP-QAPP Manual Section 2.6.2) Measurement Performance Criteria Table
J:\Water\ProjectFiles\P120\12182_Passaic\Tasks\CWCM\AECOM QAPP\2011803_Rev2\clean\20110810_CWCM-sv_QAPP_Rev2.docx
Matrix WaterAnalytical Groupa PAHs and Alkyl PAHs (Low Resolution Mass
Spectrometry [LRMS] – SIM)Concentration Level Low
Sampling ProcedurebAnalytical
Method/SOPc DQIMeasurement
Performance Criteria
QC Sample and/orActivity Used to Assess
MeasurementPerformance
QC Sample AssessesError for Sampling (S),Analytical (A) or both
(S&A)
LPR-FI-04 T-4, T-3 Accuracy/Bias-Contamination No target compound >QL MB/Instrument Blank A
T-4, T-3 Accuracy/Bias-Contamination No target compound >QL Equipment Rinsate Blank S & A
T-4, T-3 Accuracy/Bias 60-140%R LCS AT-4, T-3 Accuracy/Bias 60-140%R MS S & AT-4, T-3 Precision RPD<30% MSD S & A
T-4, T-3 Accuracy/Bias
60-140%R in MB andLCS30-120%R in fieldsamples
Labeled compounds A
T-4, T-3 Accuracy/Bias Supplier Certified Limits PE Sample Data Reviewor Sample Analysisd A
T-4, T-3 Precision
RPD 30% if bothsamples are >5x QL orabsolute differencebetween concentrations<2x QL if sample and/orfield duplicate are 5x QL
Field Duplicate S & A
T-4, T-3 Completeness(Laboratory Analyses) 90% Data Completeness
Check S & A
a Refer to QAPP Worksheet #15 for a complete list of analytes for each analytical groupb Refer to QAPP Worksheet #21c Refer to QAPP Worksheet #23d Refer to Worksheet #31 for additional details of the PE program.
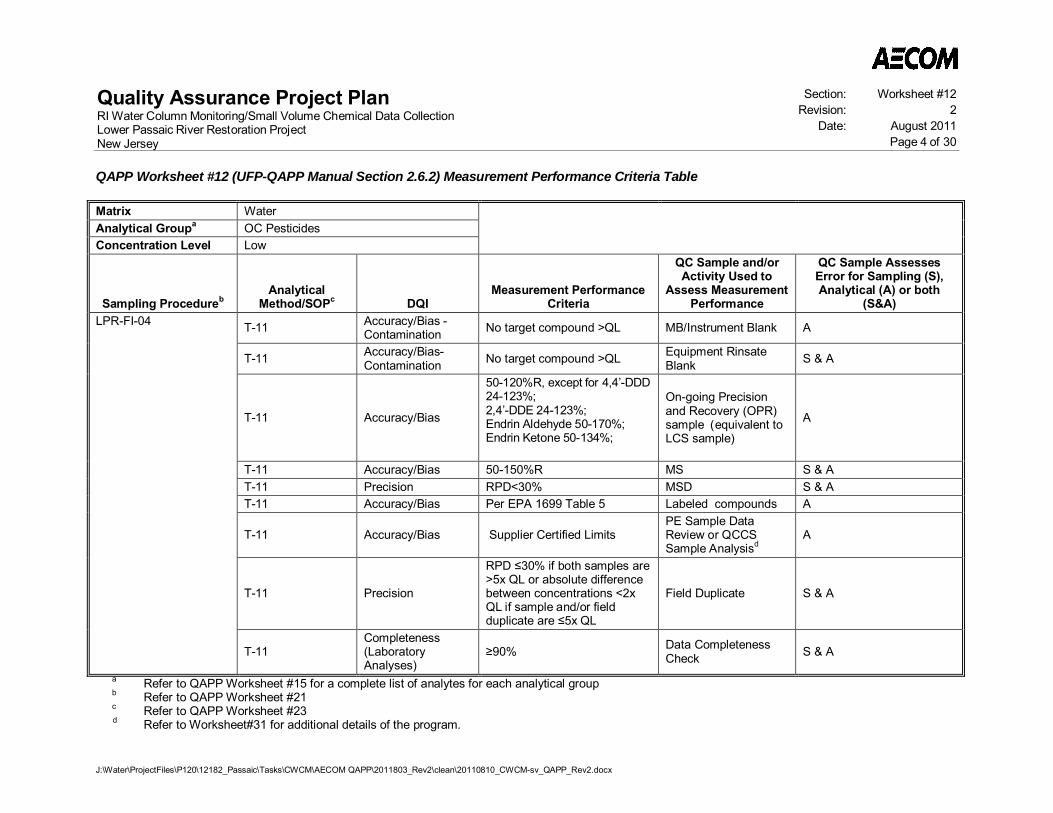
Quality Assurance Project PlanRI Water Column Monitoring/Small Volume Chemical Data CollectionLower Passaic River Restoration ProjectNew Jersey
Section: Worksheet #12Revision: 2
Date: August 2011Page 4 of 30
QAPP Worksheet #12 (UFP-QAPP Manual Section 2.6.2) Measurement Performance Criteria Table
J:\Water\ProjectFiles\P120\12182_Passaic\Tasks\CWCM\AECOM QAPP\2011803_Rev2\clean\20110810_CWCM-sv_QAPP_Rev2.docx
Matrix WaterAnalytical Groupa OC PesticidesConcentration Level Low
Sampling ProcedurebAnalytical
Method/SOPc DQIMeasurement Performance
Criteria
QC Sample and/orActivity Used to
Assess MeasurementPerformance
QC Sample AssessesError for Sampling (S),Analytical (A) or both
(S&A)LPR-FI-04 T-11 Accuracy/Bias -
Contamination No target compound >QL MB/Instrument Blank A
T-11 Accuracy/Bias-Contamination No target compound >QL Equipment Rinsate
Blank S & A
T-11 Accuracy/Bias
50-120%R, except for 4,4’-DDD24-123%;2,4’-DDE 24-123%;Endrin Aldehyde 50-170%;Endrin Ketone 50-134%;
On-going Precisionand Recovery (OPR)sample (equivalent toLCS sample)
A
T-11 Accuracy/Bias 50-150%R MS S & AT-11 Precision RPD<30% MSD S & AT-11 Accuracy/Bias Per EPA 1699 Table 5 Labeled compounds A
T-11 Accuracy/Bias Supplier Certified LimitsPE Sample DataReview or QCCSSample Analysisd
A
T-11 Precision
RPD 30% if both samples are>5x QL or absolute differencebetween concentrations <2xQL if sample and/or fieldduplicate are 5x QL
Field Duplicate S & A
T-11Completeness(LaboratoryAnalyses)
90% Data CompletenessCheck S & A
a Refer to QAPP Worksheet #15 for a complete list of analytes for each analytical groupb Refer to QAPP Worksheet #21c Refer to QAPP Worksheet #23d Refer to Worksheet#31 for additional details of the program.
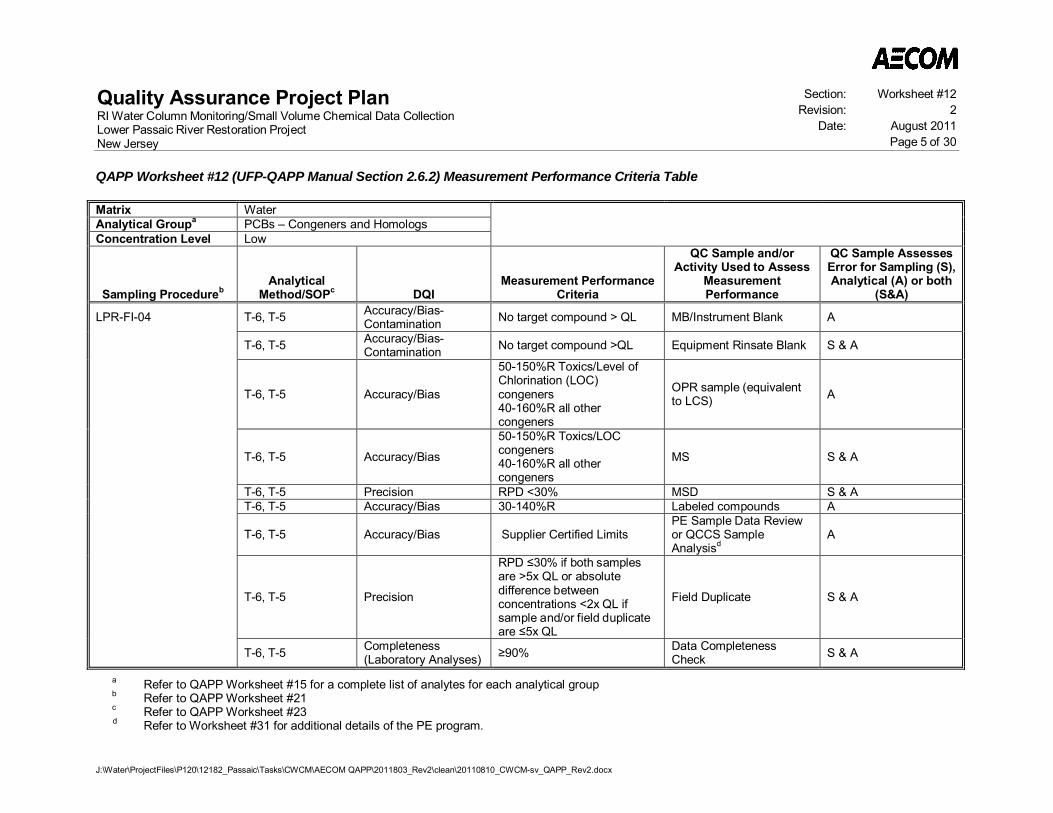
Quality Assurance Project PlanRI Water Column Monitoring/Small Volume Chemical Data CollectionLower Passaic River Restoration ProjectNew Jersey
Section: Worksheet #12Revision: 2
Date: August 2011Page 5 of 30
QAPP Worksheet #12 (UFP-QAPP Manual Section 2.6.2) Measurement Performance Criteria Table
J:\Water\ProjectFiles\P120\12182_Passaic\Tasks\CWCM\AECOM QAPP\2011803_Rev2\clean\20110810_CWCM-sv_QAPP_Rev2.docx
Matrix WaterAnalytical Groupa PCBs – Congeners and HomologsConcentration Level Low
Sampling ProcedurebAnalytical
Method/SOPc DQIMeasurement Performance
Criteria
QC Sample and/orActivity Used to Assess
MeasurementPerformance
QC Sample AssessesError for Sampling (S),Analytical (A) or both
(S&A)
LPR-FI-04 T-6, T-5 Accuracy/Bias-Contamination No target compound > QL MB/Instrument Blank A
T-6, T-5 Accuracy/Bias-Contamination No target compound >QL Equipment Rinsate Blank S & A
T-6, T-5 Accuracy/Bias
50-150%R Toxics/Level ofChlorination (LOC)congeners40-160%R all othercongeners
OPR sample (equivalentto LCS) A
T-6, T-5 Accuracy/Bias
50-150%R Toxics/LOCcongeners40-160%R all othercongeners
MS S & A
T-6, T-5 Precision RPD <30% MSD S & AT-6, T-5 Accuracy/Bias 30-140%R Labeled compounds A
T-6, T-5 Accuracy/Bias Supplier Certified LimitsPE Sample Data Reviewor QCCS SampleAnalysisd
A
T-6, T-5 Precision
RPD 30% if both samplesare >5x QL or absolutedifference betweenconcentrations <2x QL ifsample and/or field duplicateare 5x QL
Field Duplicate S & A
T-6, T-5 Completeness(Laboratory Analyses) 90% Data Completeness
Check S & A
a Refer to QAPP Worksheet #15 for a complete list of analytes for each analytical groupb Refer to QAPP Worksheet #21c Refer to QAPP Worksheet #23d Refer to Worksheet #31 for additional details of the PE program.
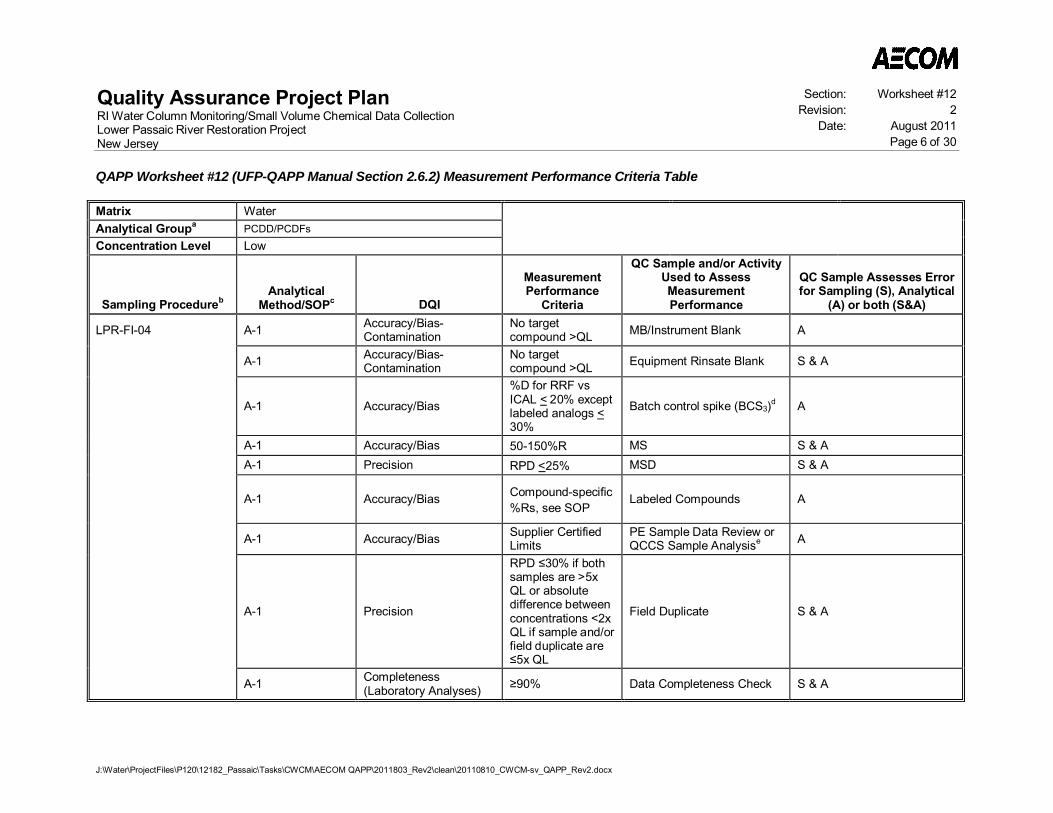
Quality Assurance Project PlanRI Water Column Monitoring/Small Volume Chemical Data CollectionLower Passaic River Restoration ProjectNew Jersey
Section: Worksheet #12Revision: 2
Date: August 2011Page 6 of 30
QAPP Worksheet #12 (UFP-QAPP Manual Section 2.6.2) Measurement Performance Criteria Table
J:\Water\ProjectFiles\P120\12182_Passaic\Tasks\CWCM\AECOM QAPP\2011803_Rev2\clean\20110810_CWCM-sv_QAPP_Rev2.docx
Matrix WaterAnalytical Groupa PCDD/PCDFs
Concentration Level Low
Sampling ProcedurebAnalytical
Method/SOPc DQI
MeasurementPerformance
Criteria
QC Sample and/or ActivityUsed to AssessMeasurementPerformance
QC Sample Assesses Errorfor Sampling (S), Analytical
(A) or both (S&A)
LPR-FI-04 A-1 Accuracy/Bias-Contamination
No targetcompound >QL MB/Instrument Blank A
A-1 Accuracy/Bias-Contamination
No targetcompound >QL Equipment Rinsate Blank S & A
A-1 Accuracy/Bias
%D for RRF vsICAL < 20% exceptlabeled analogs <30%
Batch control spike (BCS3)d A
A-1 Accuracy/Bias 50-150%R MS S & AA-1 Precision RPD <25% MSD S & A
A-1 Accuracy/Bias Compound-specific%Rs, see SOP
Labeled Compounds A
A-1 Accuracy/Bias Supplier CertifiedLimits
PE Sample Data Review orQCCS Sample Analysise A
A-1 Precision
RPD 30% if bothsamples are >5xQL or absolutedifference betweenconcentrations <2xQL if sample and/orfield duplicate are5x QL
Field Duplicate S & A
A-1 Completeness(Laboratory Analyses) 90% Data Completeness Check S & A
Quality Assurance Project PlanRI Water Column Monitoring/Small Volume Chemical Data CollectionLower Passaic River Restoration ProjectNew Jersey
Section: Worksheet #12Revision: 2
Date: August 2011Page 7 of 30
QAPP Worksheet #12 (UFP-QAPP Manual Section 2.6.2) Measurement Performance Criteria Table
J:\Water\ProjectFiles\P120\12182_Passaic\Tasks\CWCM\AECOM QAPP\2011803_Rev2\clean\20110810_CWCM-sv_QAPP_Rev2.docx
a Refer to QAPP Worksheet #15 for a complete list of analytes for each analytical groupb Refer to QAPP Worksheet #21c Refer to QAPP Worksheet #23d The BCS3 is a special QC sample prepared with each 20 sample batch that combines all the spike solutions used on field samples with target analytes. It is
analyzed at the beginning and end of each analytical sequence containing the associated samples.e Refer to Worksheet#31 for additional details of the PE program.
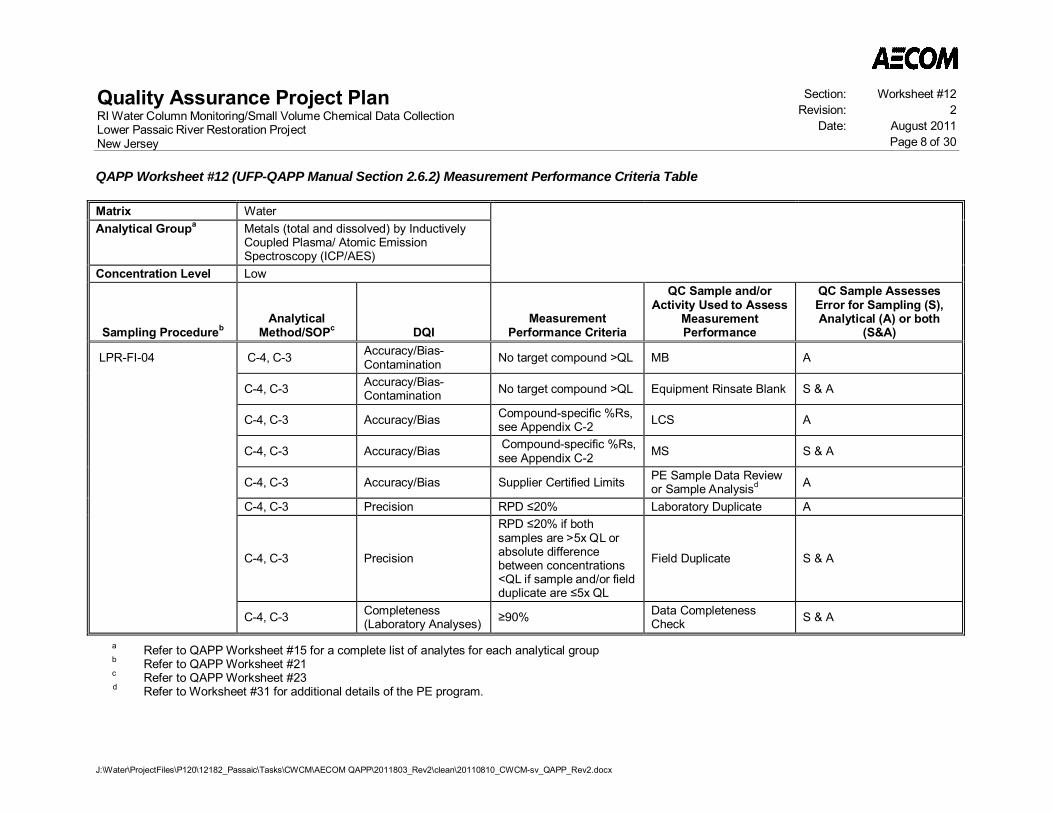
Quality Assurance Project PlanRI Water Column Monitoring/Small Volume Chemical Data CollectionLower Passaic River Restoration ProjectNew Jersey
Section: Worksheet #12Revision: 2
Date: August 2011Page 8 of 30
QAPP Worksheet #12 (UFP-QAPP Manual Section 2.6.2) Measurement Performance Criteria Table
J:\Water\ProjectFiles\P120\12182_Passaic\Tasks\CWCM\AECOM QAPP\2011803_Rev2\clean\20110810_CWCM-sv_QAPP_Rev2.docx
Matrix WaterAnalytical Groupa Metals (total and dissolved) by Inductively
Coupled Plasma/ Atomic EmissionSpectroscopy (ICP/AES)
Concentration Level Low
Sampling ProcedurebAnalytical
Method/SOPc DQIMeasurement
Performance Criteria
QC Sample and/orActivity Used to Assess
MeasurementPerformance
QC Sample AssessesError for Sampling (S),Analytical (A) or both
(S&A)
LPR-FI-04 C-4, C-3 Accuracy/Bias-Contamination No target compound >QL MB A
C-4, C-3 Accuracy/Bias-Contamination No target compound >QL Equipment Rinsate Blank S & A
C-4, C-3 Accuracy/Bias Compound-specific %Rs,see Appendix C-2 LCS A
C-4, C-3 Accuracy/Bias Compound-specific %Rs,see Appendix C-2 MS S & A
C-4, C-3 Accuracy/Bias Supplier Certified Limits PE Sample Data Reviewor Sample Analysisd A
C-4, C-3 Precision RPD 20% Laboratory Duplicate A
C-4, C-3 Precision
RPD 20% if bothsamples are >5x QL orabsolute differencebetween concentrations<QL if sample and/or fieldduplicate are 5x QL
Field Duplicate S & A
C-4, C-3 Completeness(Laboratory Analyses) 90% Data Completeness
Check S & A
a Refer to QAPP Worksheet #15 for a complete list of analytes for each analytical groupb Refer to QAPP Worksheet #21c Refer to QAPP Worksheet #23d Refer to Worksheet #31 for additional details of the PE program.
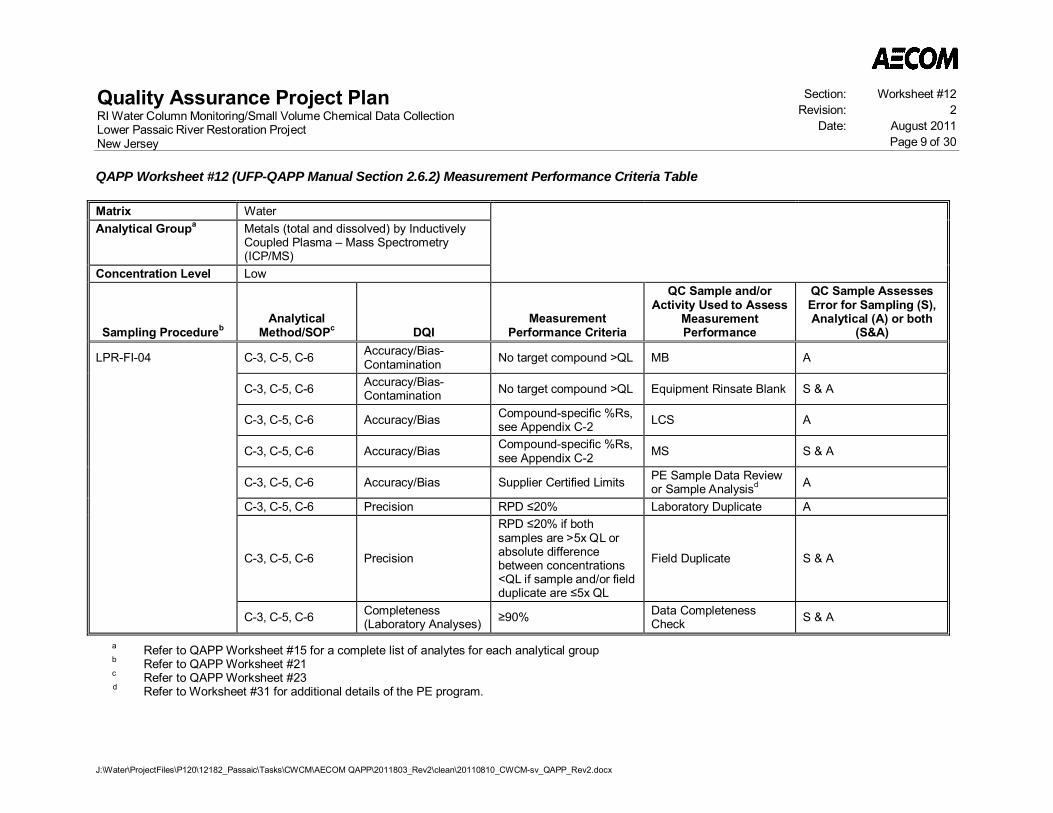
Quality Assurance Project PlanRI Water Column Monitoring/Small Volume Chemical Data CollectionLower Passaic River Restoration ProjectNew Jersey
Section: Worksheet #12Revision: 2
Date: August 2011Page 9 of 30
QAPP Worksheet #12 (UFP-QAPP Manual Section 2.6.2) Measurement Performance Criteria Table
J:\Water\ProjectFiles\P120\12182_Passaic\Tasks\CWCM\AECOM QAPP\2011803_Rev2\clean\20110810_CWCM-sv_QAPP_Rev2.docx
Matrix WaterAnalytical Groupa Metals (total and dissolved) by Inductively
Coupled Plasma – Mass Spectrometry(ICP/MS)
Concentration Level Low
Sampling ProcedurebAnalytical
Method/SOPc DQIMeasurement
Performance Criteria
QC Sample and/orActivity Used to Assess
MeasurementPerformance
QC Sample AssessesError for Sampling (S),Analytical (A) or both
(S&A)
LPR-FI-04 C-3, C-5, C-6 Accuracy/Bias-Contamination No target compound >QL MB A
C-3, C-5, C-6 Accuracy/Bias-Contamination No target compound >QL Equipment Rinsate Blank S & A
C-3, C-5, C-6 Accuracy/Bias Compound-specific %Rs,see Appendix C-2 LCS A
C-3, C-5, C-6 Accuracy/Bias Compound-specific %Rs,see Appendix C-2 MS S & A
C-3, C-5, C-6 Accuracy/Bias Supplier Certified Limits PE Sample Data Reviewor Sample Analysisd A
C-3, C-5, C-6 Precision RPD 20% Laboratory Duplicate A
C-3, C-5, C-6 Precision
RPD 20% if bothsamples are >5x QL orabsolute differencebetween concentrations<QL if sample and/or fieldduplicate are 5x QL
Field Duplicate S & A
C-3, C-5, C-6 Completeness(Laboratory Analyses) 90% Data Completeness
Check S & A
a Refer to QAPP Worksheet #15 for a complete list of analytes for each analytical groupb Refer to QAPP Worksheet #21c Refer to QAPP Worksheet #23d Refer to Worksheet #31 for additional details of the PE program.
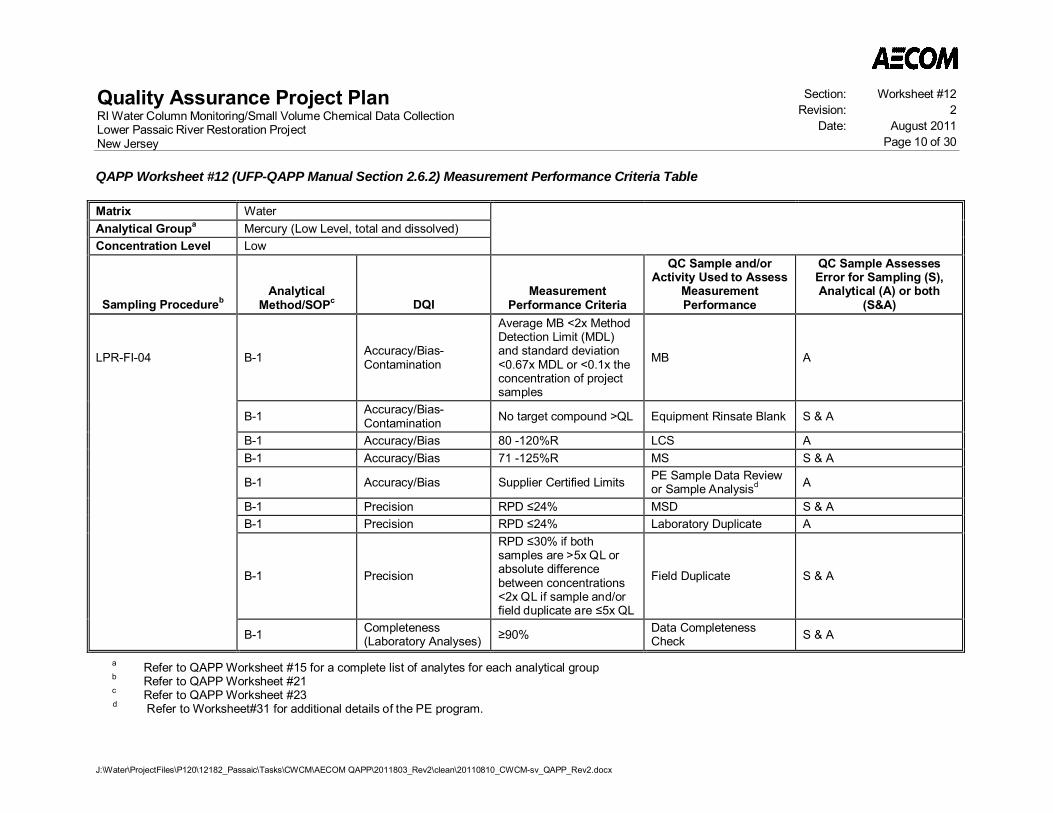
Quality Assurance Project PlanRI Water Column Monitoring/Small Volume Chemical Data CollectionLower Passaic River Restoration ProjectNew Jersey
Section: Worksheet #12Revision: 2
Date: August 2011Page 10 of 30
QAPP Worksheet #12 (UFP-QAPP Manual Section 2.6.2) Measurement Performance Criteria Table
J:\Water\ProjectFiles\P120\12182_Passaic\Tasks\CWCM\AECOM QAPP\2011803_Rev2\clean\20110810_CWCM-sv_QAPP_Rev2.docx
Matrix WaterAnalytical Groupa Mercury (Low Level, total and dissolved)Concentration Level Low
Sampling ProcedurebAnalytical
Method/SOPc DQIMeasurement
Performance Criteria
QC Sample and/orActivity Used to Assess
MeasurementPerformance
QC Sample AssessesError for Sampling (S),Analytical (A) or both
(S&A)
LPR-FI-04 B-1 Accuracy/Bias-Contamination
Average MB <2x MethodDetection Limit (MDL)and standard deviation<0.67x MDL or <0.1x theconcentration of projectsamples
MB A
B-1 Accuracy/Bias-Contamination No target compound >QL Equipment Rinsate Blank S & A
B-1 Accuracy/Bias 80 -120%R LCS AB-1 Accuracy/Bias 71 -125%R MS S & A
B-1 Accuracy/Bias Supplier Certified Limits PE Sample Data Reviewor Sample Analysisd A
B-1 Precision RPD 24% MSD S & AB-1 Precision RPD 24% Laboratory Duplicate A
B-1 Precision
RPD 30% if bothsamples are >5x QL orabsolute differencebetween concentrations<2x QL if sample and/orfield duplicate are 5x QL
Field Duplicate S & A
B-1 Completeness(Laboratory Analyses) 90% Data Completeness
Check S & A
a Refer to QAPP Worksheet #15 for a complete list of analytes for each analytical groupb Refer to QAPP Worksheet #21c Refer to QAPP Worksheet #23d Refer to Worksheet#31 for additional details of the PE program.
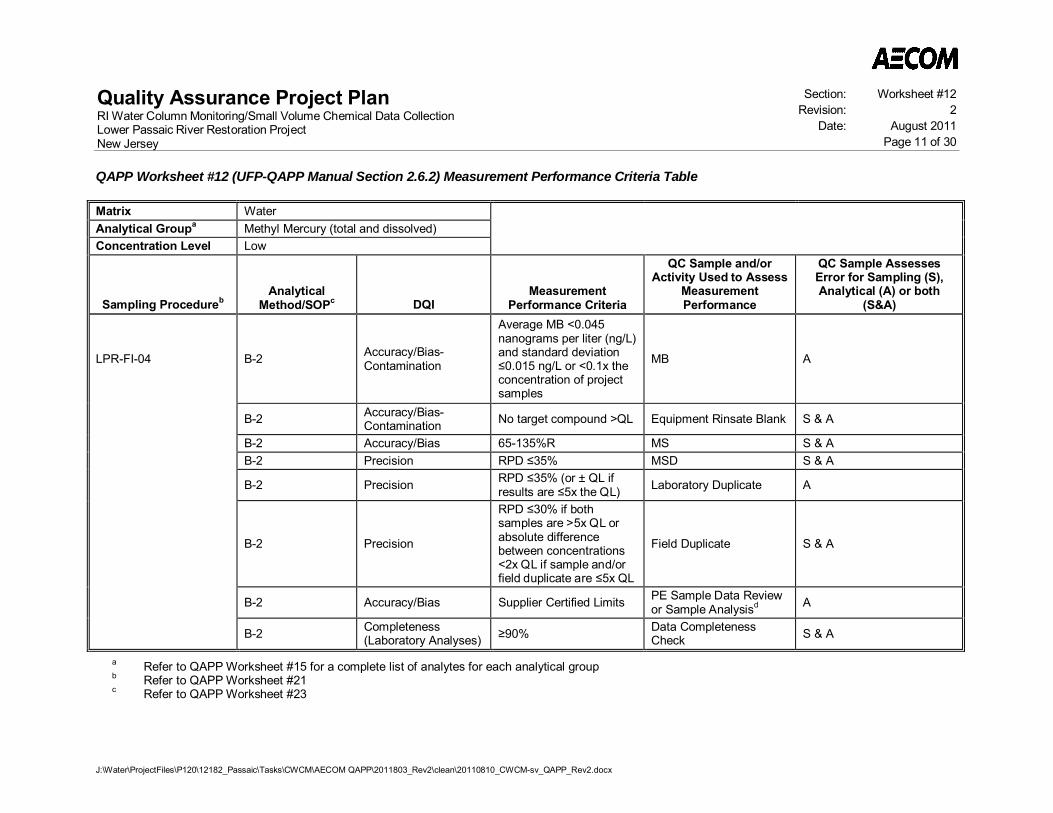
Quality Assurance Project PlanRI Water Column Monitoring/Small Volume Chemical Data CollectionLower Passaic River Restoration ProjectNew Jersey
Section: Worksheet #12Revision: 2
Date: August 2011Page 11 of 30
QAPP Worksheet #12 (UFP-QAPP Manual Section 2.6.2) Measurement Performance Criteria Table
J:\Water\ProjectFiles\P120\12182_Passaic\Tasks\CWCM\AECOM QAPP\2011803_Rev2\clean\20110810_CWCM-sv_QAPP_Rev2.docx
Matrix WaterAnalytical Groupa Methyl Mercury (total and dissolved)Concentration Level Low
Sampling ProcedurebAnalytical
Method/SOPc DQIMeasurement
Performance Criteria
QC Sample and/orActivity Used to Assess
MeasurementPerformance
QC Sample AssessesError for Sampling (S),Analytical (A) or both
(S&A)
LPR-FI-04 B-2 Accuracy/Bias-Contamination
Average MB <0.045nanograms per liter (ng/L)and standard deviation0.015 ng/L or <0.1x the
concentration of projectsamples
MB A
B-2 Accuracy/Bias-Contamination No target compound >QL Equipment Rinsate Blank S & A
B-2 Accuracy/Bias 65-135%R MS S & AB-2 Precision RPD 35% MSD S & A
B-2 Precision RPD 35% (or ± QL ifresults are 5x the QL) Laboratory Duplicate A
B-2 Precision
RPD 30% if bothsamples are >5x QL orabsolute differencebetween concentrations<2x QL if sample and/orfield duplicate are 5x QL
Field Duplicate S & A
B-2 Accuracy/Bias Supplier Certified Limits PE Sample Data Reviewor Sample Analysisd A
B-2 Completeness(Laboratory Analyses) 90% Data Completeness
Check S & A
a Refer to QAPP Worksheet #15 for a complete list of analytes for each analytical groupb Refer to QAPP Worksheet #21c Refer to QAPP Worksheet #23
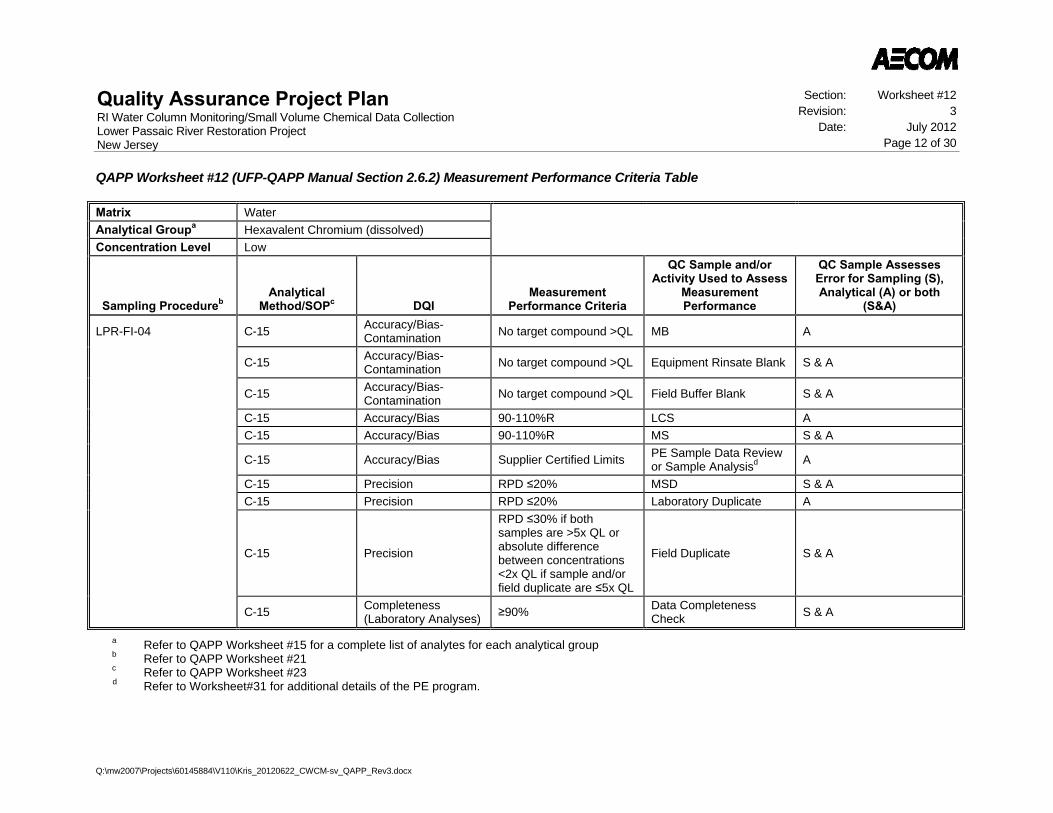
Quality Assurance Project Plan RI Water Column Monitoring/Small Volume Chemical Data Collection Lower Passaic River Restoration Project New Jersey
Section: Worksheet #12 Revision: 3
Date: July 2012 Page 12 of 30
QAPP Worksheet #12 (UFP-QAPP Manual Section 2.6.2) Measurement Performance Criteria Table
Q:\mw2007\Projects\60145884\V110\Kris_20120622_CWCM-sv_QAPP_Rev3.docx
Matrix Water
Analytical Groupa Hexavalent Chromium (dissolved)
Concentration Level Low
Sampling Procedureb Analytical
Method/SOPc DQI Measurement
Performance Criteria
QC Sample and/or Activity Used to Assess
Measurement Performance
QC Sample Assesses Error for Sampling (S), Analytical (A) or both
(S&A)
LPR-FI-04 C-15 Accuracy/Bias-Contamination
No target compound >QL MB A
C-15 Accuracy/Bias-Contamination
No target compound >QL Equipment Rinsate Blank S & A
C-15 Accuracy/Bias-Contamination
No target compound >QL Field Buffer Blank S & A
C-15 Accuracy/Bias 90-110%R LCS A
C-15 Accuracy/Bias 90-110%R MS S & A
C-15 Accuracy/Bias Supplier Certified Limits PE Sample Data Review or Sample Analysisd
A
C-15 Precision RPD ≤20% MSD S & A
C-15 Precision RPD ≤20% Laboratory Duplicate A
C-15 Precision
RPD ≤30% if both samples are >5x QL or absolute difference between concentrations <2x QL if sample and/or field duplicate are ≤5x QL
Field Duplicate S & A
C-15 Completeness (Laboratory Analyses)
≥90% Data Completeness Check
S & A
a Refer to QAPP Worksheet #15 for a complete list of analytes for each analytical group b Refer to QAPP Worksheet #21 c Refer to QAPP Worksheet #23 d Refer to Worksheet#31 for additional details of the PE program.

Quality Assurance Project PlanRI Water Column Monitoring/Small Volume Chemical Data CollectionLower Passaic River Restoration ProjectNew Jersey
Section: Worksheet #12Revision: 2
Date: August 2011Page 13 of 30
QAPP Worksheet #12 (UFP-QAPP Manual Section 2.6.2) Measurement Performance Criteria Table
J:\Water\ProjectFiles\P120\12182_Passaic\Tasks\CWCM\AECOM QAPP\2011803_Rev2\clean\20110810_CWCM-sv_QAPP_Rev2.docx
Matrix WaterAnalytical Groupa ButyltinsConcentration Level Low
Sampling ProcedurebAnalytical
Method/SOPc DQIMeasurement
Performance Criteria
QC Sample and/orActivity Used to Assess
MeasurementPerformance
QC Sample AssessesError for Sampling (S),Analytical (A) or both
(S&A)
LPR-FI-04 C-8, C-7 Accuracy/Bias-Contamination No target compound >QL MB A
C-8, C-7 Accuracy/Bias-Contamination No target compound >QL Equipment Rinsate Blank S & A
C-8, C-7 Accuracy/Bias Tripropyltin: 24-142%R Surrogate A
C-8, C-7 Accuracy/Bias
Monobutyltin: 40-165%RDibutyltin: 18-128%RTributyltin: 30-120%RTetrabutyltin: 24-104%R
LCS A
C-8, C-7 Accuracy/Bias
Monobutyltin: 40-165%RDibutyltin: 18-128%RTributyltin: 30-120%RTetrabutyltin: 24-104%R
MS S & A
C-8, C-7 Accuracy/Bias Supplier Certified Limits PE Sample Data Reviewor Sample Analysisd A
C-8, C-7 Precision RPD 30% MSD S & A
C-8, C-7 Precision
RPD 30% if bothsamples are >5x QL orabsolute differencebetween concentrations<2x QL if sample and/orfield duplicate are 5x QL
Field Duplicate S & A
C-8, C-7 Completeness(Laboratory Analyses) 90% Data Completeness
Check S & Aa Refer to QAPP Worksheet #15 for a complete list of analytes for each analytical groupb Refer to QAPP Worksheet #21c Refer to QAPP Worksheet #23d Refer to Worksheet#31 for additional details of the PE program.

Quality Assurance Project PlanRI Water Column Monitoring/Small Volume Chemical Data CollectionLower Passaic River Restoration ProjectNew Jersey
Section: Worksheet #12Revision: 2
Date: August 2011Page 14 of 30
QAPP Worksheet #12 (UFP-QAPP Manual Section 2.6.2) Measurement Performance Criteria Table
J:\Water\ProjectFiles\P120\12182_Passaic\Tasks\CWCM\AECOM QAPP\2011803_Rev2\clean\20110810_CWCM-sv_QAPP_Rev2.docx
Matrix WaterAnalytical Groupa General Chemistry - SulfideConcentration Level Low
Sampling ProcedurebAnalytical
Method/SOPc DQIMeasurement
Performance Criteria
QC Sample and/orActivity Used to Assess
MeasurementPerformance
QC Sample AssessesError for Sampling (S),Analytical (A) or both
(S&A)
LPR-FI-04 C-14 Accuracy/Bias-Contamination No target compound >QL MB A
C-14 Accuracy/Bias-Contamination No target compound >QL Equipment Rinsate Blank S & A
C-14 Accuracy/Bias 74-122%R LCS AC-14 Accuracy/Bias 74-122%R MS S & A
C-14 Accuracy/Bias Supplier Certified Limits PE Sample Data Reviewor Sample Analysisd A
C-14 Precision RPD 20% Laboratory Duplicate A
C-14 Precision
RPD 30% if bothsamples are >5x QL orabsolute differencebetween concentrations<2x QL if sample and/orfield duplicate are 5x QL
Field Duplicate S & A
C-14 Completeness(Laboratory Analyses) 90% Data Completeness
Check S & A
a Refer to QAPP Worksheet #15 for a complete list of analytes for each analytical groupb Refer to QAPP Worksheet #21c Refer to QAPP Worksheet #23d Refer to Worksheet#31 for additional details of the PE program.
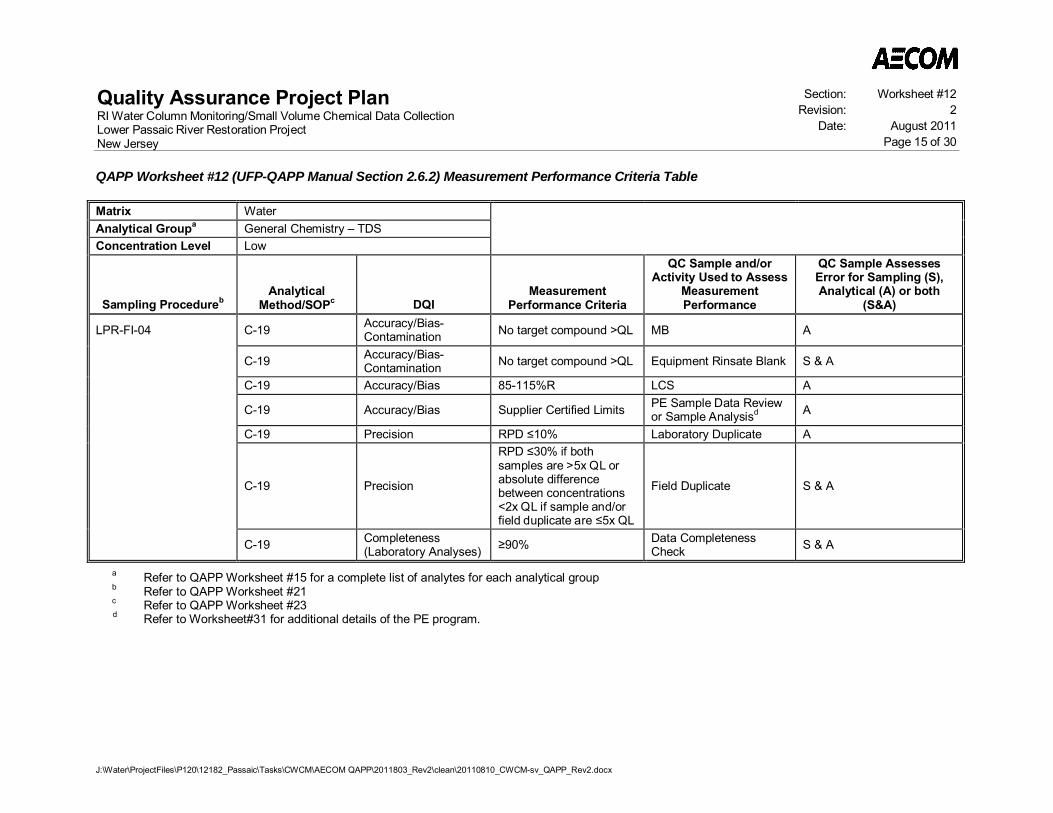
Quality Assurance Project PlanRI Water Column Monitoring/Small Volume Chemical Data CollectionLower Passaic River Restoration ProjectNew Jersey
Section: Worksheet #12Revision: 2
Date: August 2011Page 15 of 30
QAPP Worksheet #12 (UFP-QAPP Manual Section 2.6.2) Measurement Performance Criteria Table
J:\Water\ProjectFiles\P120\12182_Passaic\Tasks\CWCM\AECOM QAPP\2011803_Rev2\clean\20110810_CWCM-sv_QAPP_Rev2.docx
Matrix WaterAnalytical Groupa General Chemistry – TDSConcentration Level Low
Sampling ProcedurebAnalytical
Method/SOPc DQIMeasurement
Performance Criteria
QC Sample and/orActivity Used to Assess
MeasurementPerformance
QC Sample AssessesError for Sampling (S),Analytical (A) or both
(S&A)
LPR-FI-04 C-19 Accuracy/Bias-Contamination No target compound >QL MB A
C-19 Accuracy/Bias-Contamination No target compound >QL Equipment Rinsate Blank S & A
C-19 Accuracy/Bias 85-115%R LCS A
C-19 Accuracy/Bias Supplier Certified Limits PE Sample Data Reviewor Sample Analysisd A
C-19 Precision RPD 10% Laboratory Duplicate A
C-19 Precision
RPD 30% if bothsamples are >5x QL orabsolute differencebetween concentrations<2x QL if sample and/orfield duplicate are 5x QL
Field Duplicate S & A
C-19 Completeness(Laboratory Analyses) 90% Data Completeness
Check S & A
a Refer to QAPP Worksheet #15 for a complete list of analytes for each analytical groupb Refer to QAPP Worksheet #21c Refer to QAPP Worksheet #23d Refer to Worksheet#31 for additional details of the PE program.

Quality Assurance Project PlanRI Water Column Monitoring/Small Volume Chemical Data CollectionLower Passaic River Restoration ProjectNew Jersey
Section: Worksheet #12Revision: 2
Date: August 2011Page 16 of 30
QAPP Worksheet #12 (UFP-QAPP Manual Section 2.6.2) Measurement Performance Criteria Table
J:\Water\ProjectFiles\P120\12182_Passaic\Tasks\CWCM\AECOM QAPP\2011803_Rev2\clean\20110810_CWCM-sv_QAPP_Rev2.docx
Matrix WaterAnalytical Groupa General Chemistry – Ammonia-NConcentration Level Low
Sampling ProcedurebAnalytical
Method/SOPc DQIMeasurement
Performance Criteria
QC Sample and/orActivity Used to Assess
MeasurementPerformance
QC Sample AssessesError for Sampling (S),Analytical (A) or both
(S&A)
LPR-FI-04 C-9 Accuracy/Bias-Contamination No target compound >QL MB A
C-9 Accuracy/Bias-Contamination No target compound >QL Equipment Rinsate Blank S & A
C-9 Accuracy/Bias 90-112%R LCS A
C-9 Accuracy/Bias 90-112%R MS S & A
C-9 Accuracy/Bias Supplier Certified Limits PE Sample Data Reviewor Sample Analysisd A
C-9 Precision RPD 20% Laboratory Duplicate A
C-9 Precision
RPD 30% if bothsamples are >5x QL orabsolute differencebetween concentrations<2x QL if sample and/orfield duplicate are 5x QL
Field Duplicate S & A
C-9 Completeness(Laboratory Analyses) 90% Data Completeness
Check S & A
a Refer to QAPP Worksheet #15 for a complete list of analytes for each analytical groupb Refer to QAPP Worksheet #21c Refer to QAPP Worksheet #23d Refer to Worksheet #31 for additional details of the PE program.

Quality Assurance Project PlanRI Water Column Monitoring/Small Volume Chemical Data CollectionLower Passaic River Restoration ProjectNew Jersey
Section: Worksheet #12Revision: 2
Date: August 2011Page 17 of 30
QAPP Worksheet #12 (UFP-QAPP Manual Section 2.6.2) Measurement Performance Criteria Table
J:\Water\ProjectFiles\P120\12182_Passaic\Tasks\CWCM\AECOM QAPP\2011803_Rev2\clean\20110810_CWCM-sv_QAPP_Rev2.docx
Matrix WaterAnalytical Groupa General Chemistry – CyanideConcentration Level Low
Sampling ProcedurebAnalytical
Method/SOPc DQIMeasurement
Performance Criteria
QC Sample and/orActivity Used to Assess
MeasurementPerformance
QC Sample AssessesError for Sampling (S),Analytical (A) or both
(S&A)
LPR-FI-04 C-10 Accuracy/Bias-Contamination No detection >QL MB A
C-10 Accuracy/Bias-Contamination No detection >QL Equipment Rinsate Blank S & A
C-10 Accuracy/Bias 83 – 116%R LCS AC-10 Accuracy/Bias 35 -144%R MS S & A
C-10 Accuracy/Bias Supplier Certified Limits PE Sample Data Reviewor Sample Analysisd A
C-10 Precision RPD 20% Laboratory Duplicate A
C-10 Precision
RPD 20% if bothsamples are >5x QL orabsolute differencebetween concentrations<QL if sample and/or fieldduplicate are 5x QL
Field Duplicate S & A
C-10 Completeness(Laboratory Analyses) 90% Data Completeness
Check S & A
a Refer to QAPP Worksheet #15 for a complete list of analytes for each analytical groupb Refer to QAPP Worksheet #21c Refer to QAPP Worksheet #23d Refer to Worksheet #31 for additional details of the PE program.
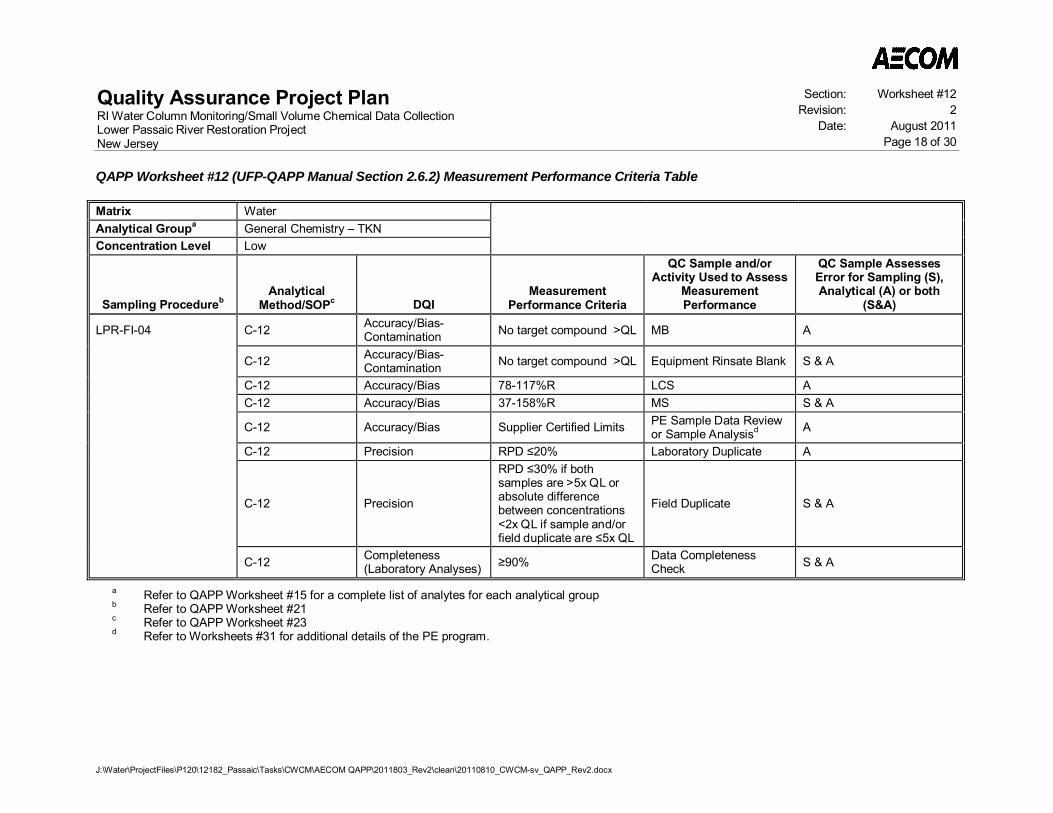
Quality Assurance Project PlanRI Water Column Monitoring/Small Volume Chemical Data CollectionLower Passaic River Restoration ProjectNew Jersey
Section: Worksheet #12Revision: 2
Date: August 2011Page 18 of 30
QAPP Worksheet #12 (UFP-QAPP Manual Section 2.6.2) Measurement Performance Criteria Table
J:\Water\ProjectFiles\P120\12182_Passaic\Tasks\CWCM\AECOM QAPP\2011803_Rev2\clean\20110810_CWCM-sv_QAPP_Rev2.docx
Matrix WaterAnalytical Groupa General Chemistry – TKNConcentration Level Low
Sampling ProcedurebAnalytical
Method/SOPc DQIMeasurement
Performance Criteria
QC Sample and/orActivity Used to Assess
MeasurementPerformance
QC Sample AssessesError for Sampling (S),Analytical (A) or both
(S&A)
LPR-FI-04 C-12 Accuracy/Bias-Contamination No target compound >QL MB A
C-12 Accuracy/Bias-Contamination No target compound >QL Equipment Rinsate Blank S & A
C-12 Accuracy/Bias 78-117%R LCS AC-12 Accuracy/Bias 37-158%R MS S & A
C-12 Accuracy/Bias Supplier Certified Limits PE Sample Data Reviewor Sample Analysisd A
C-12 Precision RPD 20% Laboratory Duplicate A
C-12 Precision
RPD 30% if bothsamples are >5x QL orabsolute differencebetween concentrations<2x QL if sample and/orfield duplicate are 5x QL
Field Duplicate S & A
C-12 Completeness(Laboratory Analyses) 90% Data Completeness
Check S & A
a Refer to QAPP Worksheet #15 for a complete list of analytes for each analytical groupb Refer to QAPP Worksheet #21c Refer to QAPP Worksheet #23d Refer to Worksheets #31 for additional details of the PE program.

Quality Assurance Project PlanRI Water Column Monitoring/Small Volume Chemical Data CollectionLower Passaic River Restoration ProjectNew Jersey
Section: Worksheet #12Revision: 2
Date: August 2011Page 19 of 30
QAPP Worksheet #12 (UFP-QAPP Manual Section 2.6.2) Measurement Performance Criteria Table
J:\Water\ProjectFiles\P120\12182_Passaic\Tasks\CWCM\AECOM QAPP\2011803_Rev2\clean\20110810_CWCM-sv_QAPP_Rev2.docx
Matrix WaterAnalytical Groupa General Chemistry – Total PhosphorusConcentration Level Low
Sampling ProcedurebAnalytical
Method/SOPc DQIMeasurement
Performance Criteria
QC Sample and/orActivity Used to Assess
MeasurementPerformance
QC Sample AssessesError for Sampling (S),Analytical (A) or both
(S&A)
LPR-FI-04 C-11 Accuracy/Bias-Contamination No target compound >QL MB A
C-11 Accuracy/Bias-Contamination No target compound >QL Equipment Rinsate Blank S & A
C-11 Accuracy/Bias 88- 113%R LCS AC-11 Accuracy/Bias 50 -144%R MS S & A
C-11 Accuracy/Bias Supplier Certified Limits PE Sample Data Reviewor Sample Analysisd A
C-11 Precision RPD 20% Laboratory Duplicate A
C-11 Precision
RPD 30% if bothsamples are >5x QL orabsolute differencebetween concentrations<2x QL if sample and/orfield duplicate are 5x QL
Field Duplicate S & A
C-11 Completeness(Laboratory Analyses) 90% Data Completeness
Check S & A
a Refer to QAPP Worksheet #15 for a complete list of analytes for each analytical groupb Refer to QAPP Worksheet #21c Refer to QAPP Worksheet #23d Refer to Worksheet #31 for additional details of the PE program.
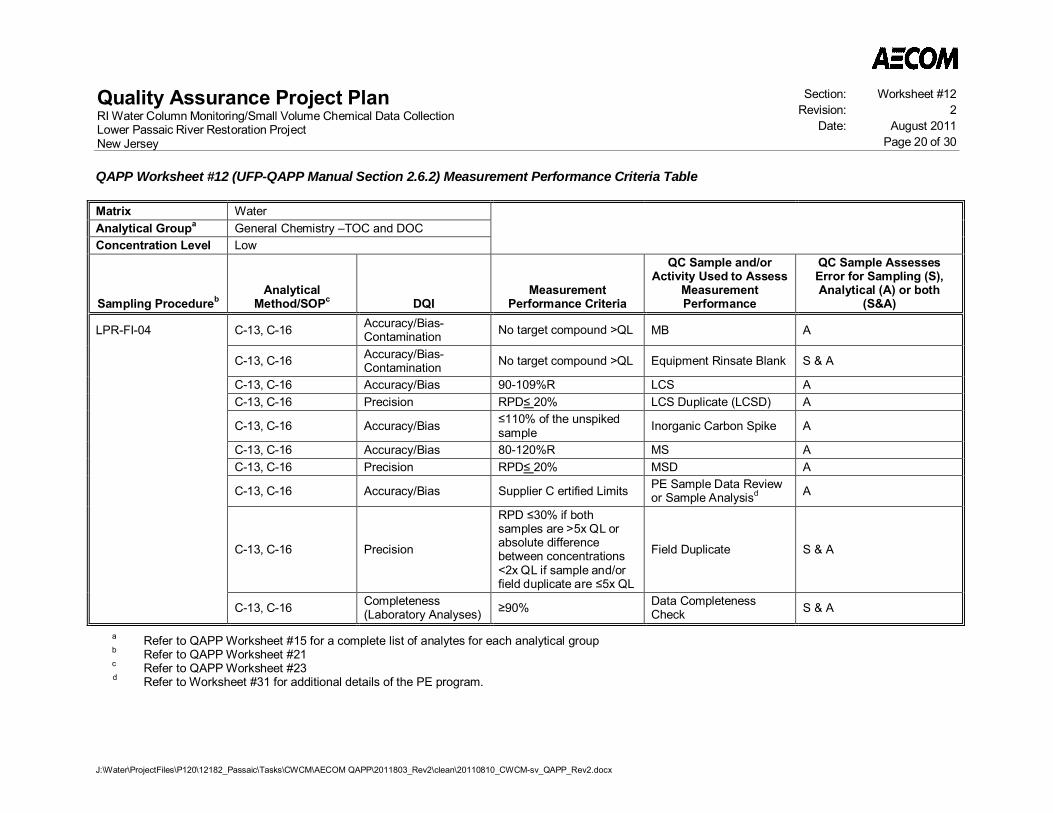
Quality Assurance Project PlanRI Water Column Monitoring/Small Volume Chemical Data CollectionLower Passaic River Restoration ProjectNew Jersey
Section: Worksheet #12Revision: 2
Date: August 2011Page 20 of 30
QAPP Worksheet #12 (UFP-QAPP Manual Section 2.6.2) Measurement Performance Criteria Table
J:\Water\ProjectFiles\P120\12182_Passaic\Tasks\CWCM\AECOM QAPP\2011803_Rev2\clean\20110810_CWCM-sv_QAPP_Rev2.docx
Matrix WaterAnalytical Groupa General Chemistry –TOC and DOCConcentration Level Low
Sampling ProcedurebAnalytical
Method/SOPc DQIMeasurement
Performance Criteria
QC Sample and/orActivity Used to Assess
MeasurementPerformance
QC Sample AssessesError for Sampling (S),Analytical (A) or both
(S&A)
LPR-FI-04 C-13, C-16 Accuracy/Bias-Contamination No target compound >QL MB A
C-13, C-16 Accuracy/Bias-Contamination No target compound >QL Equipment Rinsate Blank S & A
C-13, C-16 Accuracy/Bias 90-109%R LCS AC-13, C-16 Precision RPD 20% LCS Duplicate (LCSD) A
C-13, C-16 Accuracy/Bias 110% of the unspikedsample Inorganic Carbon Spike A
C-13, C-16 Accuracy/Bias 80-120%R MS AC-13, C-16 Precision RPD 20% MSD A
C-13, C-16 Accuracy/Bias Supplier C ertified Limits PE Sample Data Reviewor Sample Analysisd A
C-13, C-16 Precision
RPD 30% if bothsamples are >5x QL orabsolute differencebetween concentrations<2x QL if sample and/orfield duplicate are 5x QL
Field Duplicate S & A
C-13, C-16 Completeness(Laboratory Analyses) 90% Data Completeness
Check S & A
a Refer to QAPP Worksheet #15 for a complete list of analytes for each analytical groupb Refer to QAPP Worksheet #21c Refer to QAPP Worksheet #23d Refer to Worksheet #31 for additional details of the PE program.
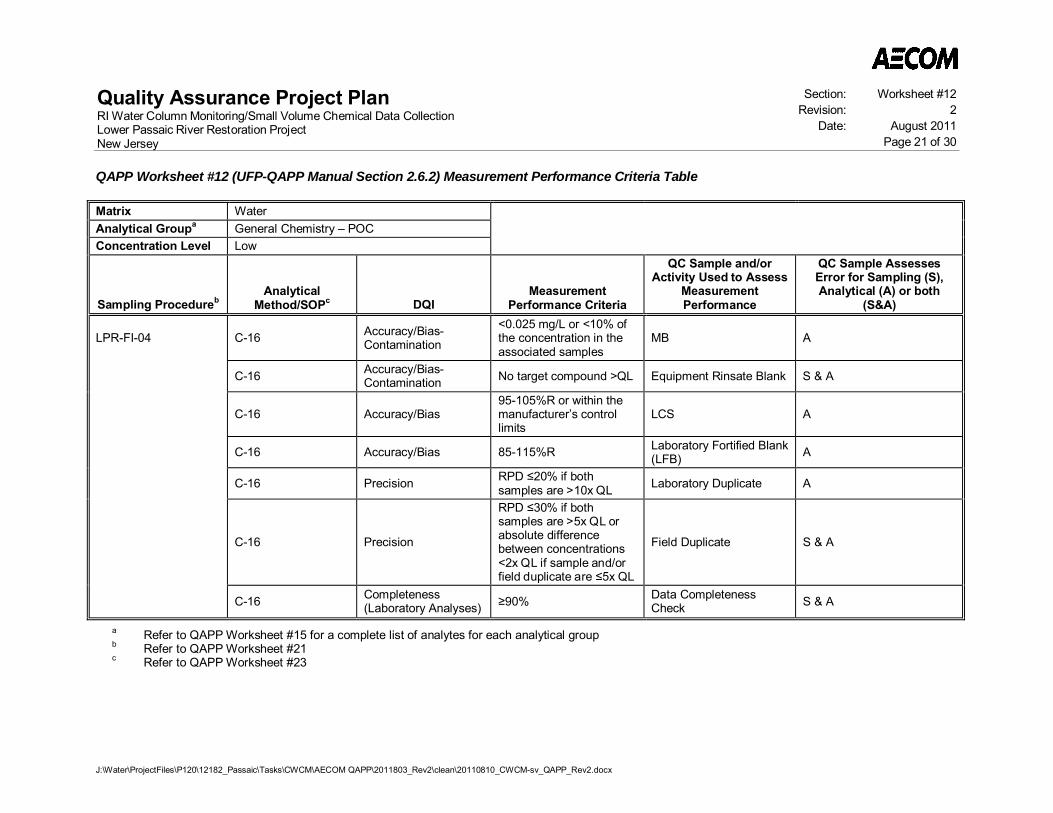
Quality Assurance Project PlanRI Water Column Monitoring/Small Volume Chemical Data CollectionLower Passaic River Restoration ProjectNew Jersey
Section: Worksheet #12Revision: 2
Date: August 2011Page 21 of 30
QAPP Worksheet #12 (UFP-QAPP Manual Section 2.6.2) Measurement Performance Criteria Table
J:\Water\ProjectFiles\P120\12182_Passaic\Tasks\CWCM\AECOM QAPP\2011803_Rev2\clean\20110810_CWCM-sv_QAPP_Rev2.docx
Matrix WaterAnalytical Groupa General Chemistry – POCConcentration Level Low
Sampling ProcedurebAnalytical
Method/SOPc DQIMeasurement
Performance Criteria
QC Sample and/orActivity Used to Assess
MeasurementPerformance
QC Sample AssessesError for Sampling (S),Analytical (A) or both
(S&A)
LPR-FI-04 C-16 Accuracy/Bias-Contamination
<0.025 mg/L or <10% ofthe concentration in theassociated samples
MB A
C-16 Accuracy/Bias-Contamination No target compound >QL Equipment Rinsate Blank S & A
C-16 Accuracy/Bias95-105%R or within themanufacturer’s controllimits
LCS A
C-16 Accuracy/Bias 85-115%R Laboratory Fortified Blank(LFB) A
C-16 Precision RPD 20% if bothsamples are >10x QL Laboratory Duplicate A
C-16 Precision
RPD 30% if bothsamples are >5x QL orabsolute differencebetween concentrations<2x QL if sample and/orfield duplicate are 5x QL
Field Duplicate S & A
C-16 Completeness(Laboratory Analyses) 90% Data Completeness
Check S & A
a Refer to QAPP Worksheet #15 for a complete list of analytes for each analytical groupb Refer to QAPP Worksheet #21c Refer to QAPP Worksheet #23
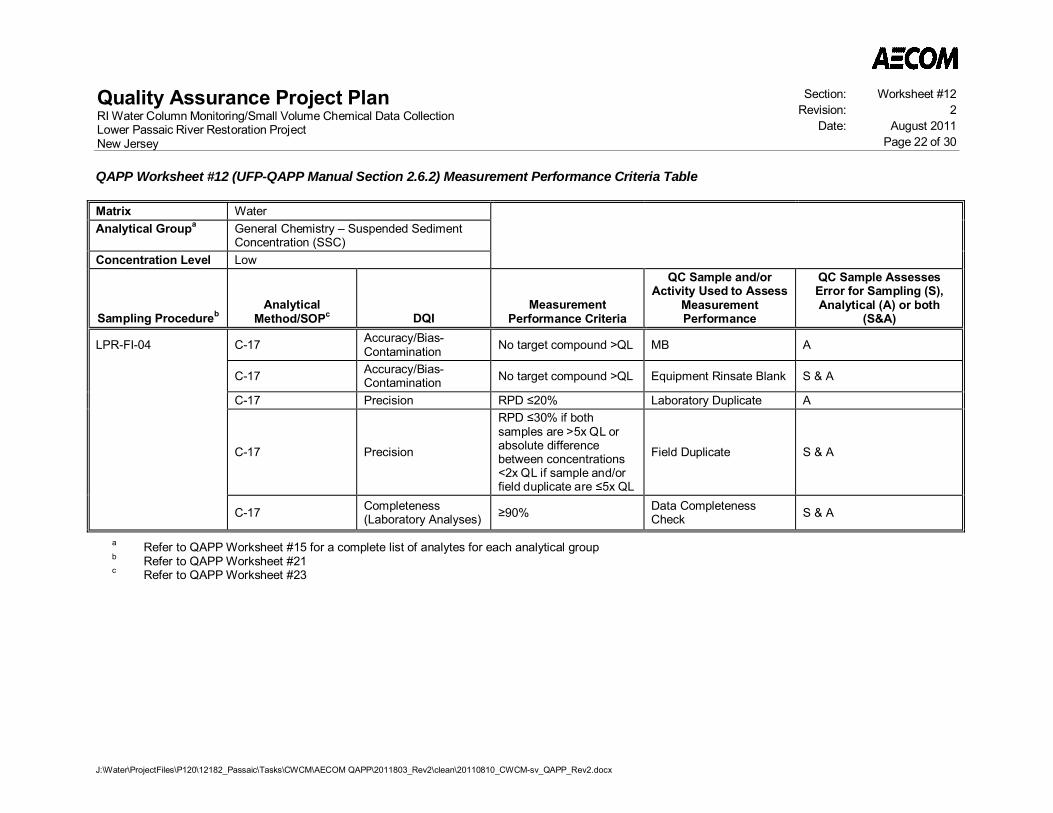
Quality Assurance Project PlanRI Water Column Monitoring/Small Volume Chemical Data CollectionLower Passaic River Restoration ProjectNew Jersey
Section: Worksheet #12Revision: 2
Date: August 2011Page 22 of 30
QAPP Worksheet #12 (UFP-QAPP Manual Section 2.6.2) Measurement Performance Criteria Table
J:\Water\ProjectFiles\P120\12182_Passaic\Tasks\CWCM\AECOM QAPP\2011803_Rev2\clean\20110810_CWCM-sv_QAPP_Rev2.docx
Matrix WaterAnalytical Groupa General Chemistry – Suspended Sediment
Concentration (SSC)Concentration Level Low
Sampling ProcedurebAnalytical
Method/SOPc DQIMeasurement
Performance Criteria
QC Sample and/orActivity Used to Assess
MeasurementPerformance
QC Sample AssessesError for Sampling (S),Analytical (A) or both
(S&A)
LPR-FI-04 C-17 Accuracy/Bias-Contamination No target compound >QL MB A
C-17 Accuracy/Bias-Contamination No target compound >QL Equipment Rinsate Blank S & A
C-17 Precision RPD 20% Laboratory Duplicate A
C-17 Precision
RPD 30% if bothsamples are >5x QL orabsolute differencebetween concentrations<2x QL if sample and/orfield duplicate are 5x QL
Field Duplicate S & A
C-17 Completeness(Laboratory Analyses) 90% Data Completeness
Check S & A
a Refer to QAPP Worksheet #15 for a complete list of analytes for each analytical groupb Refer to QAPP Worksheet #21c Refer to QAPP Worksheet #23
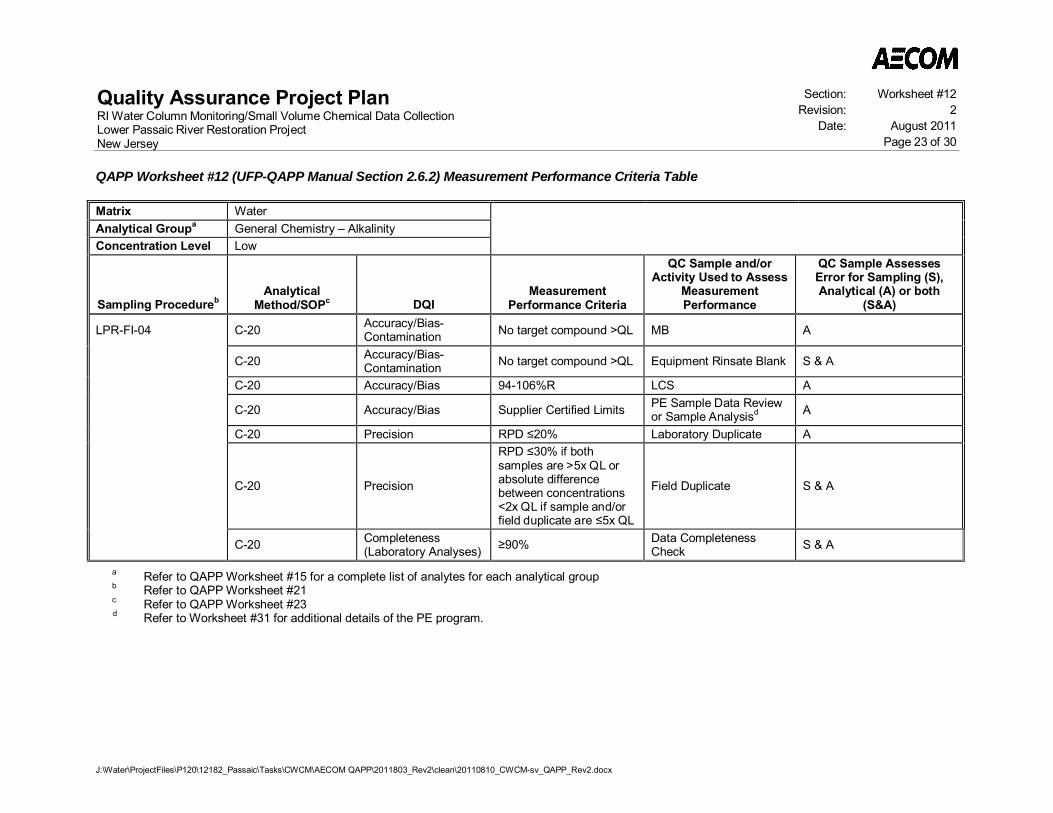
Quality Assurance Project PlanRI Water Column Monitoring/Small Volume Chemical Data CollectionLower Passaic River Restoration ProjectNew Jersey
Section: Worksheet #12Revision: 2
Date: August 2011Page 23 of 30
QAPP Worksheet #12 (UFP-QAPP Manual Section 2.6.2) Measurement Performance Criteria Table
J:\Water\ProjectFiles\P120\12182_Passaic\Tasks\CWCM\AECOM QAPP\2011803_Rev2\clean\20110810_CWCM-sv_QAPP_Rev2.docx
Matrix WaterAnalytical Groupa General Chemistry – AlkalinityConcentration Level Low
Sampling ProcedurebAnalytical
Method/SOPc DQIMeasurement
Performance Criteria
QC Sample and/orActivity Used to Assess
MeasurementPerformance
QC Sample AssessesError for Sampling (S),Analytical (A) or both
(S&A)
LPR-FI-04 C-20 Accuracy/Bias-Contamination No target compound >QL MB A
C-20 Accuracy/Bias-Contamination No target compound >QL Equipment Rinsate Blank S & A
C-20 Accuracy/Bias 94-106%R LCS A
C-20 Accuracy/Bias Supplier Certified Limits PE Sample Data Reviewor Sample Analysisd A
C-20 Precision RPD 20% Laboratory Duplicate A
C-20 Precision
RPD 30% if bothsamples are >5x QL orabsolute differencebetween concentrations<2x QL if sample and/orfield duplicate are 5x QL
Field Duplicate S & A
C-20 Completeness(Laboratory Analyses) 90% Data Completeness
Check S & A
a Refer to QAPP Worksheet #15 for a complete list of analytes for each analytical groupb Refer to QAPP Worksheet #21c Refer to QAPP Worksheet #23d Refer to Worksheet #31 for additional details of the PE program.
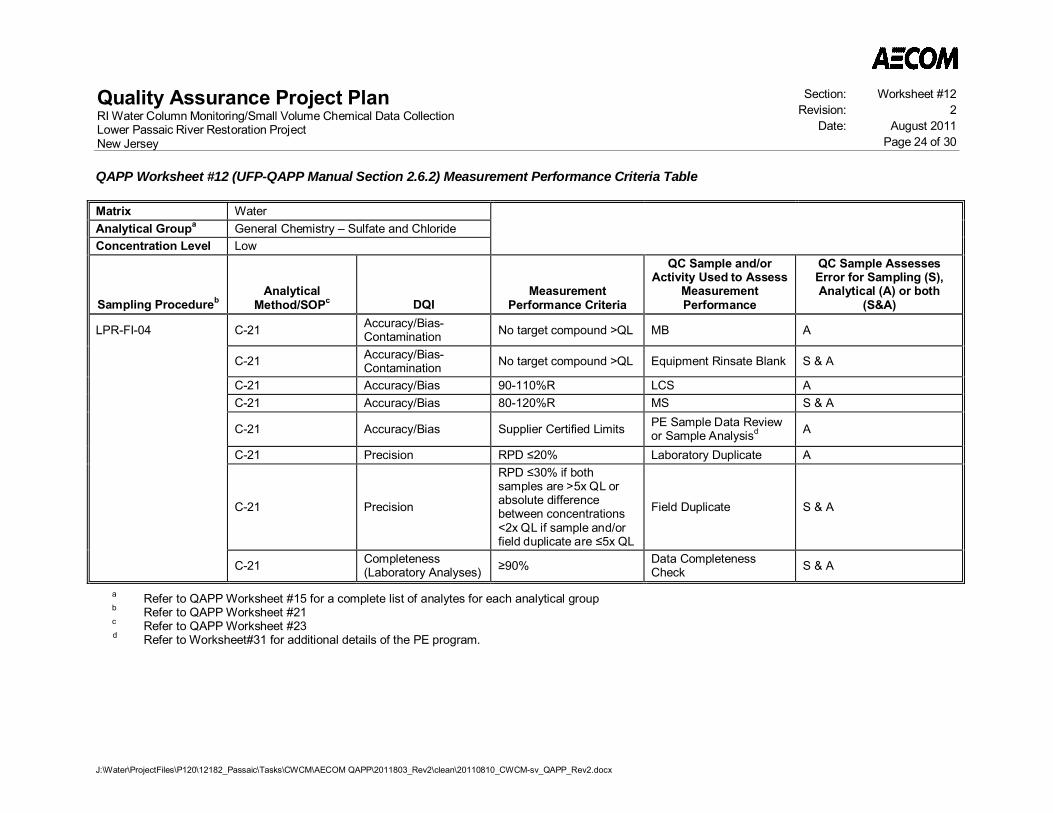
Quality Assurance Project PlanRI Water Column Monitoring/Small Volume Chemical Data CollectionLower Passaic River Restoration ProjectNew Jersey
Section: Worksheet #12Revision: 2
Date: August 2011Page 24 of 30
QAPP Worksheet #12 (UFP-QAPP Manual Section 2.6.2) Measurement Performance Criteria Table
J:\Water\ProjectFiles\P120\12182_Passaic\Tasks\CWCM\AECOM QAPP\2011803_Rev2\clean\20110810_CWCM-sv_QAPP_Rev2.docx
Matrix WaterAnalytical Groupa General Chemistry – Sulfate and ChlorideConcentration Level Low
Sampling ProcedurebAnalytical
Method/SOPc DQIMeasurement
Performance Criteria
QC Sample and/orActivity Used to Assess
MeasurementPerformance
QC Sample AssessesError for Sampling (S),Analytical (A) or both
(S&A)
LPR-FI-04 C-21 Accuracy/Bias-Contamination No target compound >QL MB A
C-21 Accuracy/Bias-Contamination No target compound >QL Equipment Rinsate Blank S & A
C-21 Accuracy/Bias 90-110%R LCS AC-21 Accuracy/Bias 80-120%R MS S & A
C-21 Accuracy/Bias Supplier Certified Limits PE Sample Data Reviewor Sample Analysisd A
C-21 Precision RPD 20% Laboratory Duplicate A
C-21 Precision
RPD 30% if bothsamples are >5x QL orabsolute differencebetween concentrations<2x QL if sample and/orfield duplicate are 5x QL
Field Duplicate S & A
C-21 Completeness(Laboratory Analyses) 90% Data Completeness
Check S & A
a Refer to QAPP Worksheet #15 for a complete list of analytes for each analytical groupb Refer to QAPP Worksheet #21c Refer to QAPP Worksheet #23d Refer to Worksheet#31 for additional details of the PE program.
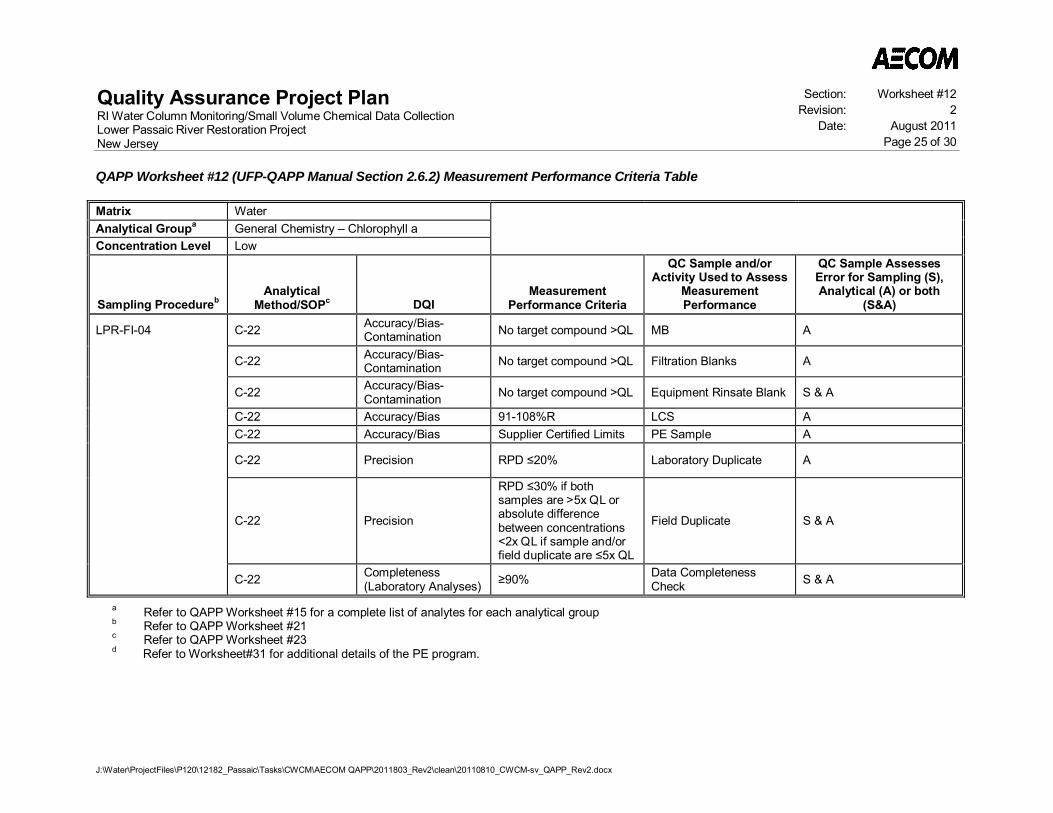
Quality Assurance Project PlanRI Water Column Monitoring/Small Volume Chemical Data CollectionLower Passaic River Restoration ProjectNew Jersey
Section: Worksheet #12Revision: 2
Date: August 2011Page 25 of 30
QAPP Worksheet #12 (UFP-QAPP Manual Section 2.6.2) Measurement Performance Criteria Table
J:\Water\ProjectFiles\P120\12182_Passaic\Tasks\CWCM\AECOM QAPP\2011803_Rev2\clean\20110810_CWCM-sv_QAPP_Rev2.docx
Matrix WaterAnalytical Groupa General Chemistry – Chlorophyll aConcentration Level Low
Sampling ProcedurebAnalytical
Method/SOPc DQIMeasurement
Performance Criteria
QC Sample and/orActivity Used to Assess
MeasurementPerformance
QC Sample AssessesError for Sampling (S),Analytical (A) or both
(S&A)
LPR-FI-04 C-22 Accuracy/Bias-Contamination No target compound >QL MB A
C-22 Accuracy/Bias-Contamination No target compound >QL Filtration Blanks A
C-22 Accuracy/Bias-Contamination No target compound >QL Equipment Rinsate Blank S & A
C-22 Accuracy/Bias 91-108%R LCS AC-22 Accuracy/Bias Supplier Certified Limits PE Sample A
C-22 Precision RPD 20% Laboratory Duplicate A
C-22 Precision
RPD 30% if bothsamples are >5x QL orabsolute differencebetween concentrations<2x QL if sample and/orfield duplicate are 5x QL
Field Duplicate S & A
C-22 Completeness(Laboratory Analyses) 90% Data Completeness
Check S & A
a Refer to QAPP Worksheet #15 for a complete list of analytes for each analytical groupb Refer to QAPP Worksheet #21c Refer to QAPP Worksheet #23d Refer to Worksheet#31 for additional details of the PE program.
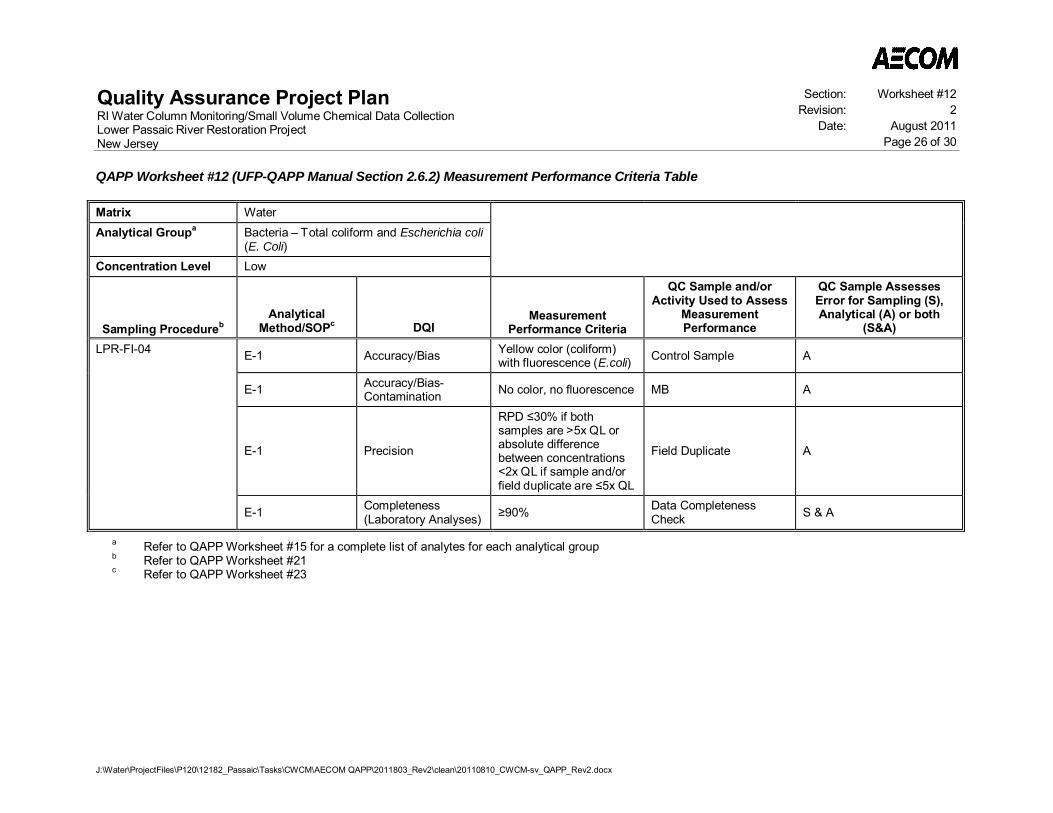
Quality Assurance Project PlanRI Water Column Monitoring/Small Volume Chemical Data CollectionLower Passaic River Restoration ProjectNew Jersey
Section: Worksheet #12Revision: 2
Date: August 2011Page 26 of 30
QAPP Worksheet #12 (UFP-QAPP Manual Section 2.6.2) Measurement Performance Criteria Table
J:\Water\ProjectFiles\P120\12182_Passaic\Tasks\CWCM\AECOM QAPP\2011803_Rev2\clean\20110810_CWCM-sv_QAPP_Rev2.docx
Matrix WaterAnalytical Groupa Bacteria – Total coliform and Escherichia coli
(E. Coli)Concentration Level Low
Sampling ProcedurebAnalytical
Method/SOPc DQIMeasurement
Performance Criteria
QC Sample and/orActivity Used to Assess
MeasurementPerformance
QC Sample AssessesError for Sampling (S),Analytical (A) or both
(S&A)
LPR-FI-04 E-1 Accuracy/Bias Yellow color (coliform)with fluorescence (E.coli) Control Sample A
E-1 Accuracy/Bias-Contamination No color, no fluorescence MB A
E-1 Precision
RPD 30% if bothsamples are >5x QL orabsolute differencebetween concentrations<2x QL if sample and/orfield duplicate are 5x QL
Field Duplicate A
E-1 Completeness(Laboratory Analyses) 90% Data Completeness
Check S & A
a Refer to QAPP Worksheet #15 for a complete list of analytes for each analytical groupb Refer to QAPP Worksheet #21c Refer to QAPP Worksheet #23
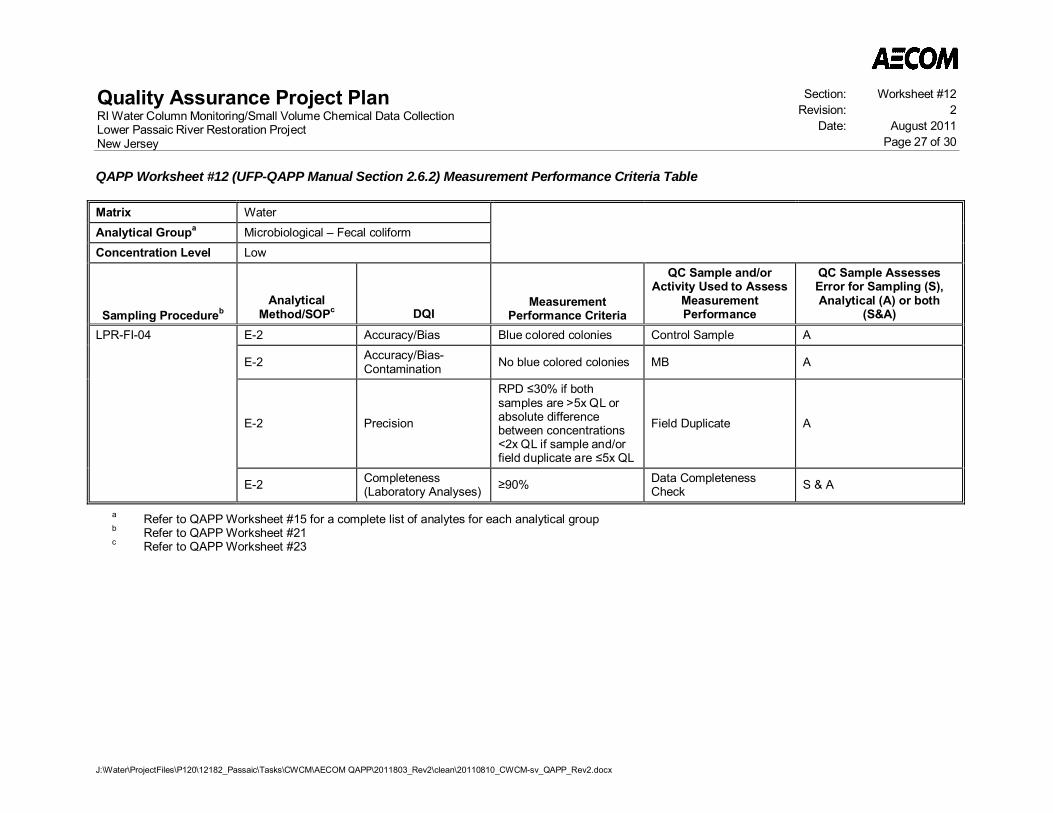
Quality Assurance Project PlanRI Water Column Monitoring/Small Volume Chemical Data CollectionLower Passaic River Restoration ProjectNew Jersey
Section: Worksheet #12Revision: 2
Date: August 2011Page 27 of 30
QAPP Worksheet #12 (UFP-QAPP Manual Section 2.6.2) Measurement Performance Criteria Table
J:\Water\ProjectFiles\P120\12182_Passaic\Tasks\CWCM\AECOM QAPP\2011803_Rev2\clean\20110810_CWCM-sv_QAPP_Rev2.docx
Matrix WaterAnalytical Groupa Microbiological – Fecal coliformConcentration Level Low
Sampling ProcedurebAnalytical
Method/SOPc DQIMeasurement
Performance Criteria
QC Sample and/orActivity Used to Assess
MeasurementPerformance
QC Sample AssessesError for Sampling (S),Analytical (A) or both
(S&A)LPR-FI-04 E-2 Accuracy/Bias Blue colored colonies Control Sample A
E-2 Accuracy/Bias-Contamination No blue colored colonies MB A
E-2 Precision
RPD 30% if bothsamples are >5x QL orabsolute differencebetween concentrations<2x QL if sample and/orfield duplicate are 5x QL
Field Duplicate A
E-2 Completeness(Laboratory Analyses) 90% Data Completeness
Check S & A
a Refer to QAPP Worksheet #15 for a complete list of analytes for each analytical groupb Refer to QAPP Worksheet #21c Refer to QAPP Worksheet #23
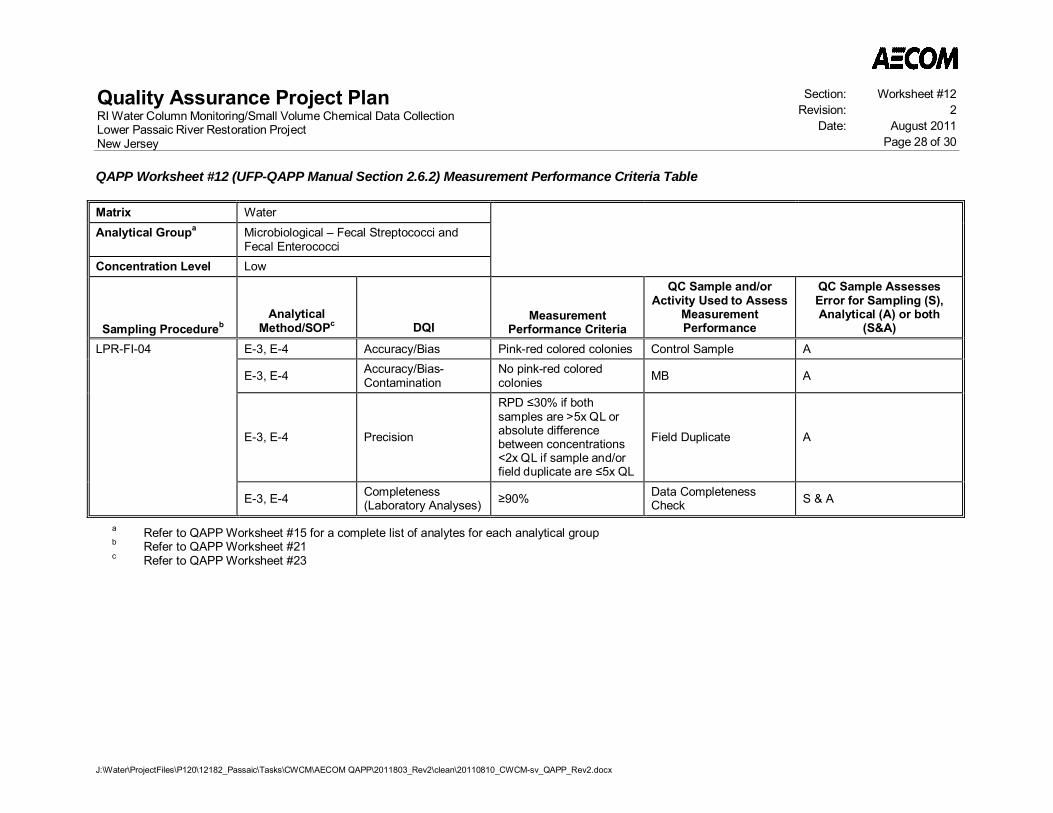
Quality Assurance Project PlanRI Water Column Monitoring/Small Volume Chemical Data CollectionLower Passaic River Restoration ProjectNew Jersey
Section: Worksheet #12Revision: 2
Date: August 2011Page 28 of 30
QAPP Worksheet #12 (UFP-QAPP Manual Section 2.6.2) Measurement Performance Criteria Table
J:\Water\ProjectFiles\P120\12182_Passaic\Tasks\CWCM\AECOM QAPP\2011803_Rev2\clean\20110810_CWCM-sv_QAPP_Rev2.docx
Matrix WaterAnalytical Groupa Microbiological – Fecal Streptococci and
Fecal EnterococciConcentration Level Low
Sampling ProcedurebAnalytical
Method/SOPc DQIMeasurement
Performance Criteria
QC Sample and/orActivity Used to Assess
MeasurementPerformance
QC Sample AssessesError for Sampling (S),Analytical (A) or both
(S&A)
LPR-FI-04 E-3, E-4 Accuracy/Bias Pink-red colored colonies Control Sample A
E-3, E-4 Accuracy/Bias-Contamination
No pink-red coloredcolonies MB A
E-3, E-4 Precision
RPD 30% if bothsamples are >5x QL orabsolute differencebetween concentrations<2x QL if sample and/orfield duplicate are 5x QL
Field Duplicate A
E-3, E-4 Completeness(Laboratory Analyses) 90% Data Completeness
Check S & A
a Refer to QAPP Worksheet #15 for a complete list of analytes for each analytical groupb Refer to QAPP Worksheet #21c Refer to QAPP Worksheet #23
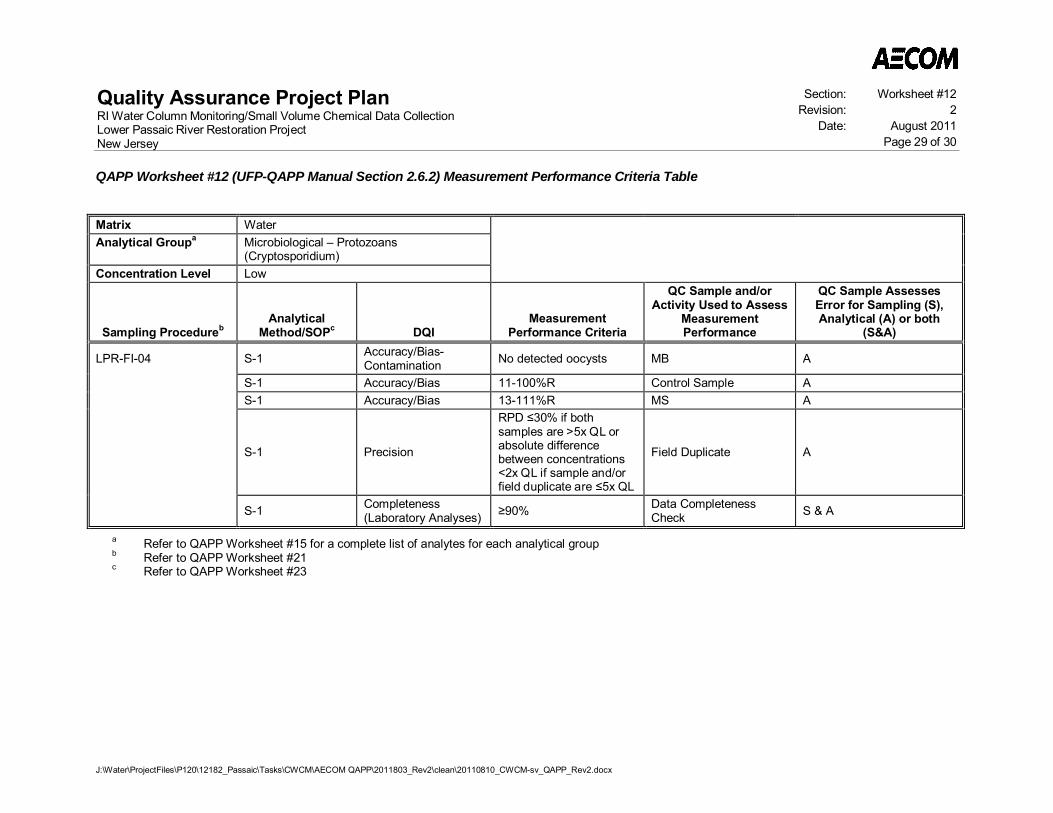
Quality Assurance Project PlanRI Water Column Monitoring/Small Volume Chemical Data CollectionLower Passaic River Restoration ProjectNew Jersey
Section: Worksheet #12Revision: 2
Date: August 2011Page 29 of 30
QAPP Worksheet #12 (UFP-QAPP Manual Section 2.6.2) Measurement Performance Criteria Table
J:\Water\ProjectFiles\P120\12182_Passaic\Tasks\CWCM\AECOM QAPP\2011803_Rev2\clean\20110810_CWCM-sv_QAPP_Rev2.docx
Matrix WaterAnalytical Groupa Microbiological – Protozoans
(Cryptosporidium)Concentration Level Low
Sampling ProcedurebAnalytical
Method/SOPc DQIMeasurement
Performance Criteria
QC Sample and/orActivity Used to Assess
MeasurementPerformance
QC Sample AssessesError for Sampling (S),Analytical (A) or both
(S&A)
LPR-FI-04 S-1 Accuracy/Bias-Contamination No detected oocysts MB A
S-1 Accuracy/Bias 11-100%R Control Sample AS-1 Accuracy/Bias 13-111%R MS A
S-1 Precision
RPD 30% if bothsamples are >5x QL orabsolute differencebetween concentrations<2x QL if sample and/orfield duplicate are 5x QL
Field Duplicate A
S-1 Completeness(Laboratory Analyses) 90% Data Completeness
Check S & A
a Refer to QAPP Worksheet #15 for a complete list of analytes for each analytical groupb Refer to QAPP Worksheet #21c Refer to QAPP Worksheet #23
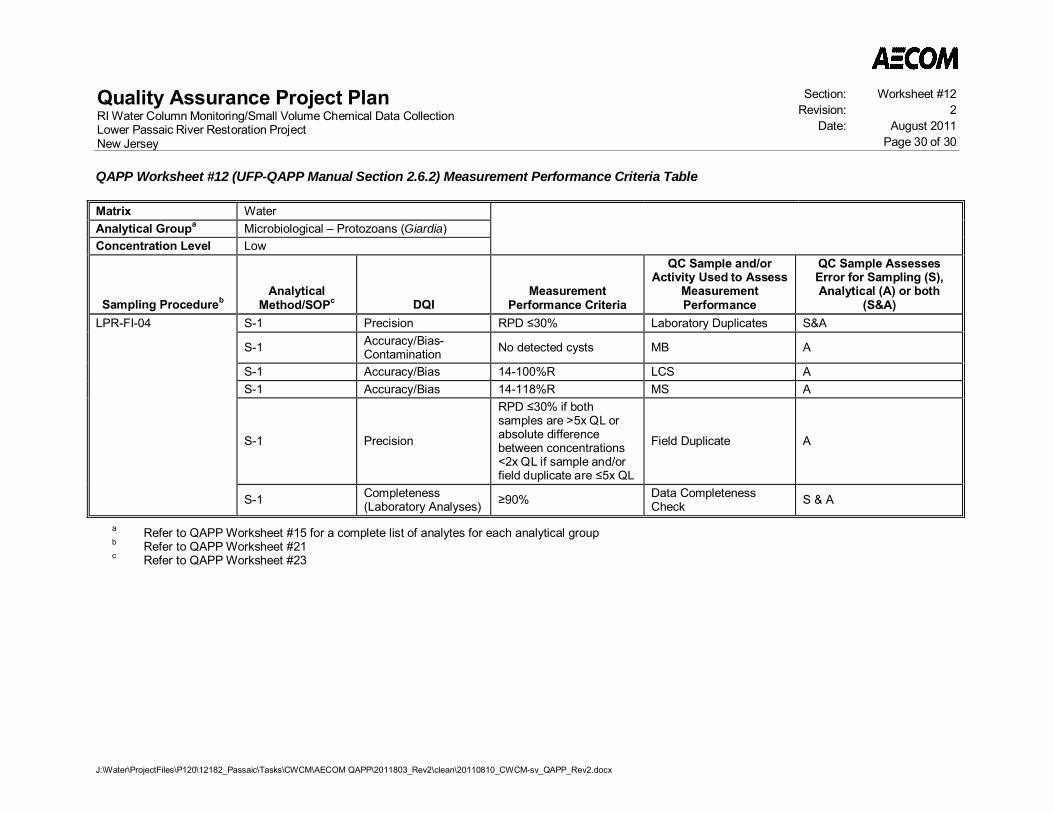
Quality Assurance Project PlanRI Water Column Monitoring/Small Volume Chemical Data CollectionLower Passaic River Restoration ProjectNew Jersey
Section: Worksheet #12Revision: 2
Date: August 2011Page 30 of 30
QAPP Worksheet #12 (UFP-QAPP Manual Section 2.6.2) Measurement Performance Criteria Table
J:\Water\ProjectFiles\P120\12182_Passaic\Tasks\CWCM\AECOM QAPP\2011803_Rev2\clean\20110810_CWCM-sv_QAPP_Rev2.docx
Matrix WaterAnalytical Groupa Microbiological – Protozoans (Giardia)Concentration Level Low
Sampling ProcedurebAnalytical
Method/SOPc DQIMeasurement
Performance Criteria
QC Sample and/orActivity Used to Assess
MeasurementPerformance
QC Sample AssessesError for Sampling (S),Analytical (A) or both
(S&A)LPR-FI-04 S-1 Precision RPD 30% Laboratory Duplicates S&A
S-1 Accuracy/Bias-Contamination No detected cysts MB A
S-1 Accuracy/Bias 14-100%R LCS AS-1 Accuracy/Bias 14-118%R MS A
S-1 Precision
RPD 30% if bothsamples are >5x QL orabsolute differencebetween concentrations<2x QL if sample and/orfield duplicate are 5x QL
Field Duplicate A
S-1 Completeness(Laboratory Analyses) 90% Data Completeness
Check S & A
a Refer to QAPP Worksheet #15 for a complete list of analytes for each analytical groupb Refer to QAPP Worksheet #21c Refer to QAPP Worksheet #23
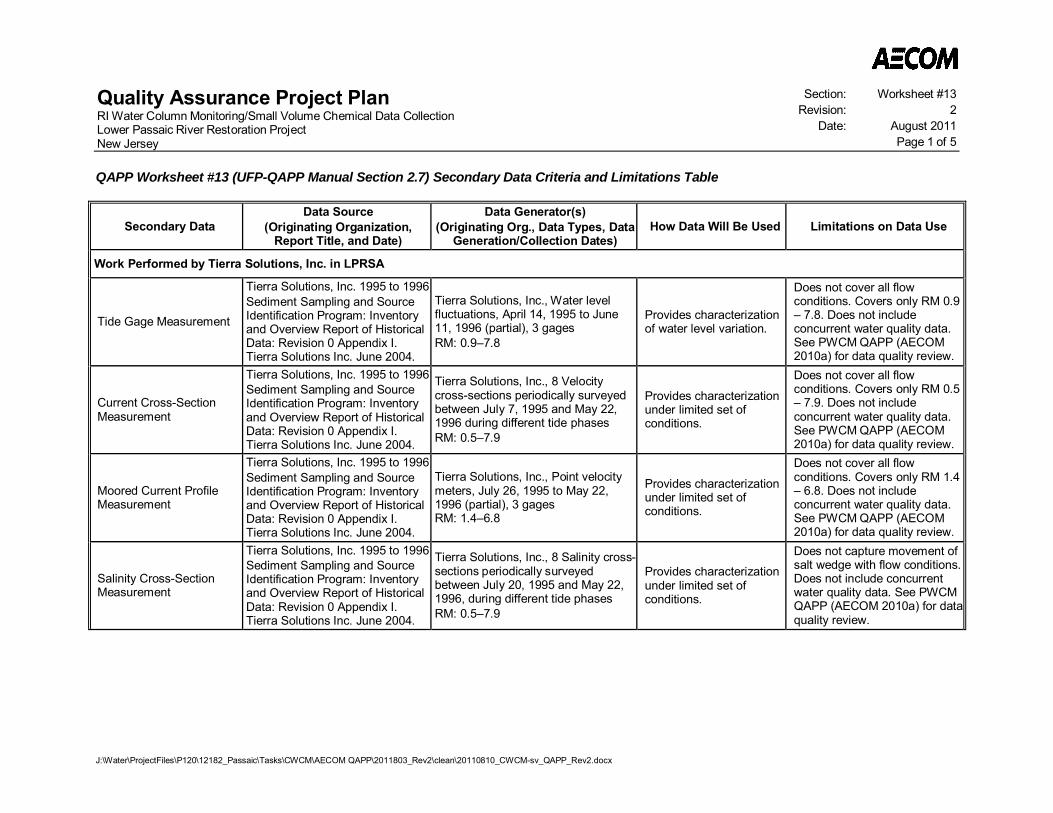
Quality Assurance Project PlanRI Water Column Monitoring/Small Volume Chemical Data CollectionLower Passaic River Restoration ProjectNew Jersey
Section: Worksheet #13Revision: 2
Date: August 2011Page 1 of 5
J:\Water\ProjectFiles\P120\12182_Passaic\Tasks\CWCM\AECOM QAPP\2011803_Rev2\clean\20110810_CWCM-sv_QAPP_Rev2.docx
QAPP Worksheet #13 (UFP-QAPP Manual Section 2.7) Secondary Data Criteria and Limitations Table
Secondary DataData Source
(Originating Organization,Report Title, and Date)
Data Generator(s)(Originating Org., Data Types, Data
Generation/Collection Dates)How Data Will Be Used Limitations on Data Use
Work Performed by Tierra Solutions, Inc. in LPRSA
Tide Gage Measurement
Tierra Solutions, Inc. 1995 to 1996Sediment Sampling and SourceIdentification Program: Inventoryand Overview Report of HistoricalData: Revision 0 Appendix I.Tierra Solutions Inc. June 2004.
Tierra Solutions, Inc., Water levelfluctuations, April 14, 1995 to June11, 1996 (partial), 3 gagesRM: 0.9–7.8
Provides characterizationof water level variation.
Does not cover all flowconditions. Covers only RM 0.9– 7.8. Does not includeconcurrent water quality data.See PWCM QAPP (AECOM2010a) for data quality review.
Current Cross-SectionMeasurement
Tierra Solutions, Inc. 1995 to 1996Sediment Sampling and SourceIdentification Program: Inventoryand Overview Report of HistoricalData: Revision 0 Appendix I.Tierra Solutions Inc. June 2004.
Tierra Solutions, Inc., 8 Velocitycross-sections periodically surveyedbetween July 7, 1995 and May 22,1996 during different tide phasesRM: 0.5–7.9
Provides characterizationunder limited set ofconditions.
Does not cover all flowconditions. Covers only RM 0.5– 7.9. Does not includeconcurrent water quality data.See PWCM QAPP (AECOM2010a) for data quality review.
Moored Current ProfileMeasurement
Tierra Solutions, Inc. 1995 to 1996Sediment Sampling and SourceIdentification Program: Inventoryand Overview Report of HistoricalData: Revision 0 Appendix I.Tierra Solutions Inc. June 2004.
Tierra Solutions, Inc., Point velocitymeters, July 26, 1995 to May 22,1996 (partial), 3 gagesRM: 1.4–6.8
Provides characterizationunder limited set ofconditions.
Does not cover all flowconditions. Covers only RM 1.4– 6.8. Does not includeconcurrent water quality data.See PWCM QAPP (AECOM2010a) for data quality review.
Salinity Cross-SectionMeasurement
Tierra Solutions, Inc. 1995 to 1996Sediment Sampling and SourceIdentification Program: Inventoryand Overview Report of HistoricalData: Revision 0 Appendix I.Tierra Solutions Inc. June 2004.
Tierra Solutions, Inc., 8 Salinity cross-sections periodically surveyedbetween July 20, 1995 and May 22,1996, during different tide phasesRM: 0.5–7.9
Provides characterizationunder limited set ofconditions.
Does not capture movement ofsalt wedge with flow conditions.Does not include concurrentwater quality data. See PWCMQAPP (AECOM 2010a) for dataquality review.
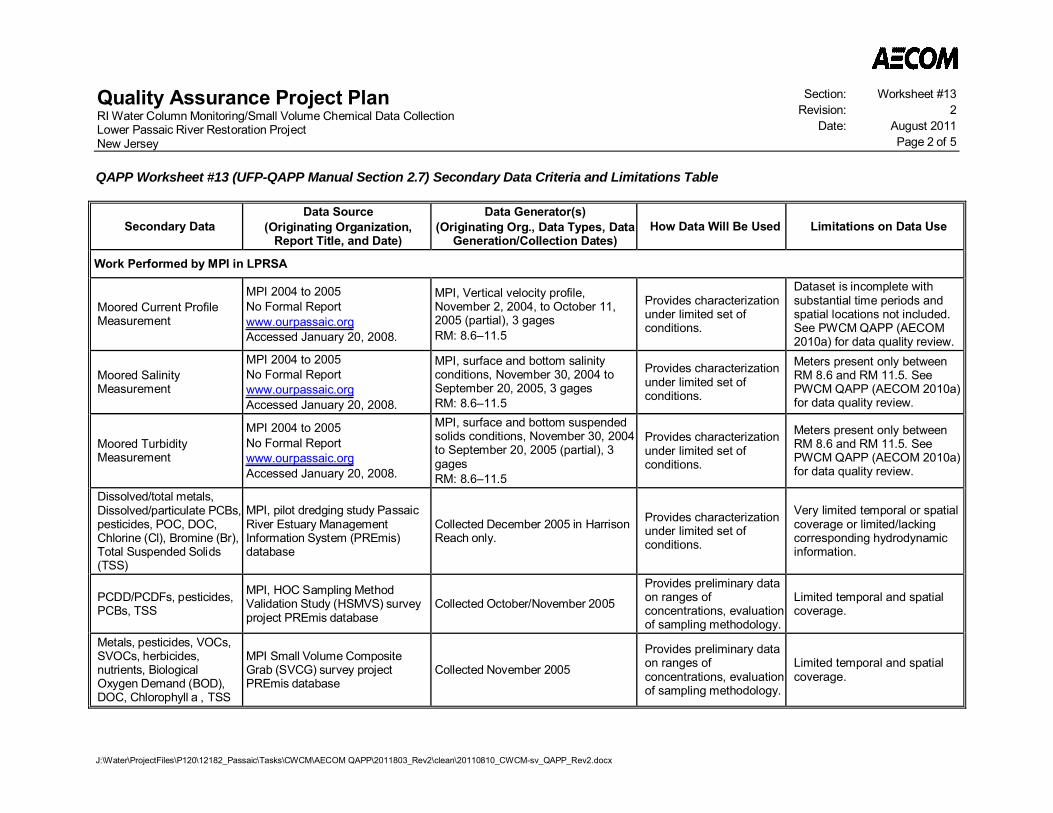
Quality Assurance Project PlanRI Water Column Monitoring/Small Volume Chemical Data CollectionLower Passaic River Restoration ProjectNew Jersey
Section: Worksheet #13Revision: 2
Date: August 2011Page 2 of 5
QAPP Worksheet #13 (UFP-QAPP Manual Section 2.7) Secondary Data Criteria and Limitations Table
J:\Water\ProjectFiles\P120\12182_Passaic\Tasks\CWCM\AECOM QAPP\2011803_Rev2\clean\20110810_CWCM-sv_QAPP_Rev2.docx
Secondary DataData Source
(Originating Organization,Report Title, and Date)
Data Generator(s)(Originating Org., Data Types, Data
Generation/Collection Dates)How Data Will Be Used Limitations on Data Use
Work Performed by MPI in LPRSA
Moored Current ProfileMeasurement
MPI 2004 to 2005No Formal Reportwww.ourpassaic.orgAccessed January 20, 2008.
MPI, Vertical velocity profile,November 2, 2004, to October 11,2005 (partial), 3 gagesRM: 8.6–11.5
Provides characterizationunder limited set ofconditions.
Dataset is incomplete withsubstantial time periods andspatial locations not included.See PWCM QAPP (AECOM2010a) for data quality review.
Moored SalinityMeasurement
MPI 2004 to 2005No Formal Reportwww.ourpassaic.orgAccessed January 20, 2008.
MPI, surface and bottom salinityconditions, November 30, 2004 toSeptember 20, 2005, 3 gagesRM: 8.6–11.5
Provides characterizationunder limited set ofconditions.
Meters present only betweenRM 8.6 and RM 11.5. SeePWCM QAPP (AECOM 2010a)for data quality review.
Moored TurbidityMeasurement
MPI 2004 to 2005No Formal Reportwww.ourpassaic.orgAccessed January 20, 2008.
MPI, surface and bottom suspendedsolids conditions, November 30, 2004to September 20, 2005 (partial), 3gagesRM: 8.6–11.5
Provides characterizationunder limited set ofconditions.
Meters present only betweenRM 8.6 and RM 11.5. SeePWCM QAPP (AECOM 2010a)for data quality review.
Dissolved/total metals,Dissolved/particulate PCBs,pesticides, POC, DOC,Chlorine (Cl), Bromine (Br),Total Suspended Solids(TSS)
MPI, pilot dredging study PassaicRiver Estuary ManagementInformation System (PREmis)database
Collected December 2005 in HarrisonReach only.
Provides characterizationunder limited set ofconditions.
Very limited temporal or spatialcoverage or limited/lackingcorresponding hydrodynamicinformation.
PCDD/PCDFs, pesticides,PCBs, TSS
MPI, HOC Sampling MethodValidation Study (HSMVS) surveyproject PREmis database
Collected October/November 2005
Provides preliminary dataon ranges ofconcentrations, evaluationof sampling methodology.
Limited temporal and spatialcoverage.
Metals, pesticides, VOCs,SVOCs, herbicides,nutrients, BiologicalOxygen Demand (BOD),DOC, Chlorophyll a , TSS
MPI Small Volume CompositeGrab (SVCG) survey projectPREmis database
Collected November 2005
Provides preliminary dataon ranges ofconcentrations, evaluationof sampling methodology.
Limited temporal and spatialcoverage.

Quality Assurance Project PlanRI Water Column Monitoring/Small Volume Chemical Data CollectionLower Passaic River Restoration ProjectNew Jersey
Section: Worksheet #13Revision: 2
Date: August 2011Page 3 of 5
QAPP Worksheet #13 (UFP-QAPP Manual Section 2.7) Secondary Data Criteria and Limitations Table
J:\Water\ProjectFiles\P120\12182_Passaic\Tasks\CWCM\AECOM QAPP\2011803_Rev2\clean\20110810_CWCM-sv_QAPP_Rev2.docx
Secondary DataData Source
(Originating Organization,Report Title, and Date)
Data Generator(s)(Originating Org., Data Types, Data
Generation/Collection Dates)How Data Will Be Used Limitations on Data Use
Empirical Mass BalanceModel (EMBM) SamplingProgram - Water ColumnSuspended SedimentSampling on Tributariesand Upper PassaicRiver
PREmis database Collected Winter 2008
Provides preliminary dataon ranges ofconcentrations, evaluationof sampling methodology
Limited temporal and spatialcoverage. No report availableproviding methodology.
Work Performed by Rutgers University Coastal Ocean Observation Lab in LPRSA and/or NBSA
Moored SalinityMeasurement
Rutgers 2004 to 2005No Formal Reportwww.marine.rutgers.edu/cool/passaic/Accessed January 20, 2008
Rutgers, surface and bottom salinity,August 18, 2004 to September 12,2005, 5 mooringsRM: 1.0–7.8
Provides characterizationunder limited set ofconditions
Does not cover all flowconditions. See PWCM QAPP(AECOM 2010a) for dataquality review.
Moored Current ProfileMeasurement
Rutgers 2004 to 2005No Formal Reportwww.marine.rutgers.edu/cool/passaic/Accessed January 20, 2008
Rutgers, Vertical velocity profile,August 18, 2004 to September 3,2005RM: 2.8
Provides insight toappropriate mooringlocations for futuresynoptic data
Available for single location atapproximately RM 3. SeePWCM QAPP (AECOM 2010a)for data quality review.
Salinity Profile TransectMeasurement
Rutgers 2004 to 2005No Formal Reportwww.marine.rutgers.edu/cool/passaic/Accessed January 20, 2008
Rutgers, 13 Salinity transects, June23, 2004 to August 18, 2005.RM: 0.0–8.0
Provides characterizationunder limited set ofconditions
Covers only lower 8 miles ofriver. Synoptic nature of dataunconfirmed. See PWCMQAPP (AECOM 2010a) for dataquality review.
Current Profile TransectMeasurement
Rutgers 2004 to 2005No Formal Reportwww.marine.rutgers.edu/cool/passaic/Accessed January 20, 2008
Rutgers, Velocity cross-section,September 23, 2004 to August 18,2005, 13 transectsRM: 0.0–8.0
Will not be used
Data not corrected for magneticinfluence on instrumentationcompass, or used to monitordye study, therefore notsynoptic. See PWCM QAPP(AECOM 2010a) for dataquality review.
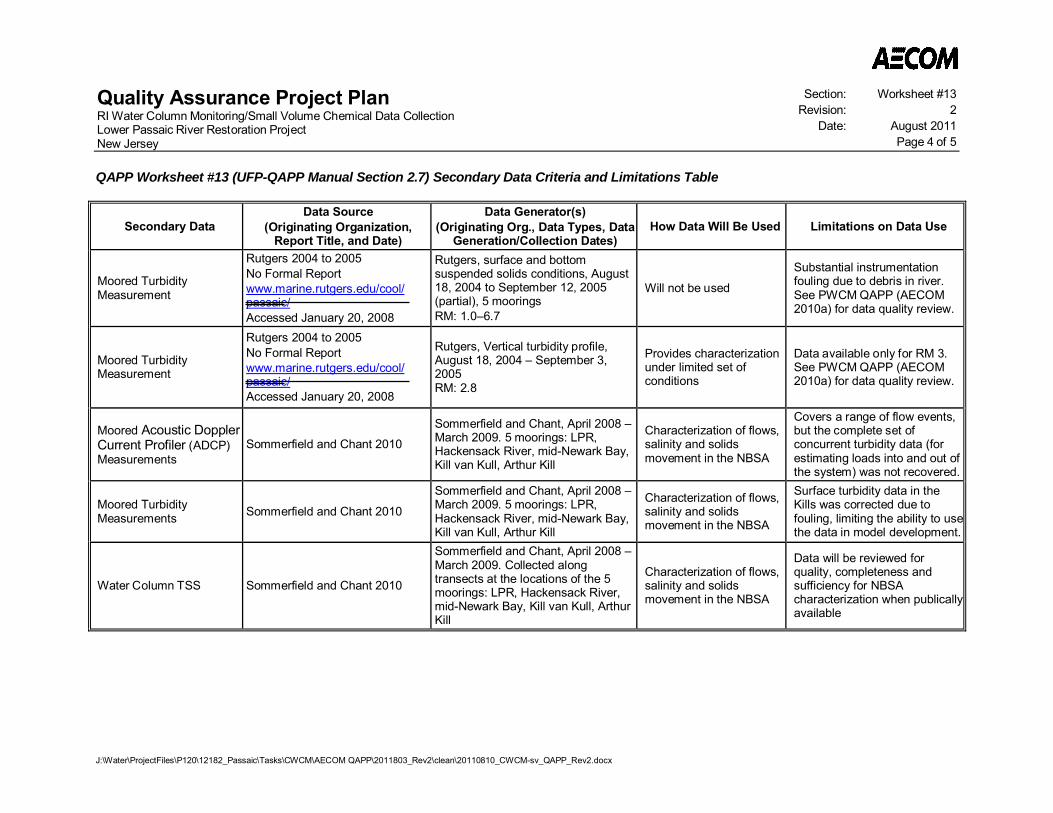
Quality Assurance Project PlanRI Water Column Monitoring/Small Volume Chemical Data CollectionLower Passaic River Restoration ProjectNew Jersey
Section: Worksheet #13Revision: 2
Date: August 2011Page 4 of 5
QAPP Worksheet #13 (UFP-QAPP Manual Section 2.7) Secondary Data Criteria and Limitations Table
J:\Water\ProjectFiles\P120\12182_Passaic\Tasks\CWCM\AECOM QAPP\2011803_Rev2\clean\20110810_CWCM-sv_QAPP_Rev2.docx
Secondary DataData Source
(Originating Organization,Report Title, and Date)
Data Generator(s)(Originating Org., Data Types, Data
Generation/Collection Dates)How Data Will Be Used Limitations on Data Use
Moored TurbidityMeasurement
Rutgers 2004 to 2005No Formal Reportwww.marine.rutgers.edu/cool/passaic/Accessed January 20, 2008
Rutgers, surface and bottomsuspended solids conditions, August18, 2004 to September 12, 2005(partial), 5 mooringsRM: 1.0–6.7
Will not be used
Substantial instrumentationfouling due to debris in river.See PWCM QAPP (AECOM2010a) for data quality review.
Moored TurbidityMeasurement
Rutgers 2004 to 2005No Formal Reportwww.marine.rutgers.edu/cool/passaic/Accessed January 20, 2008
Rutgers, Vertical turbidity profile,August 18, 2004 – September 3,2005RM: 2.8
Provides characterizationunder limited set ofconditions
Data available only for RM 3.See PWCM QAPP (AECOM2010a) for data quality review.
Moored Acoustic DopplerCurrent Profiler (ADCP)Measurements
Sommerfield and Chant 2010
Sommerfield and Chant, April 2008 –March 2009. 5 moorings: LPR,Hackensack River, mid-Newark Bay,Kill van Kull, Arthur Kill
Characterization of flows,salinity and solidsmovement in the NBSA
Covers a range of flow events,but the complete set ofconcurrent turbidity data (forestimating loads into and out ofthe system) was not recovered.
Moored TurbidityMeasurements Sommerfield and Chant 2010
Sommerfield and Chant, April 2008 –March 2009. 5 moorings: LPR,Hackensack River, mid-Newark Bay,Kill van Kull, Arthur Kill
Characterization of flows,salinity and solidsmovement in the NBSA
Surface turbidity data in theKills was corrected due tofouling, limiting the ability to usethe data in model development.
Water Column TSS Sommerfield and Chant 2010
Sommerfield and Chant, April 2008 –March 2009. Collected alongtransects at the locations of the 5moorings: LPR, Hackensack River,mid-Newark Bay, Kill van Kull, ArthurKill
Characterization of flows,salinity and solidsmovement in the NBSA
Data will be reviewed forquality, completeness andsufficiency for NBSAcharacterization when publicallyavailable
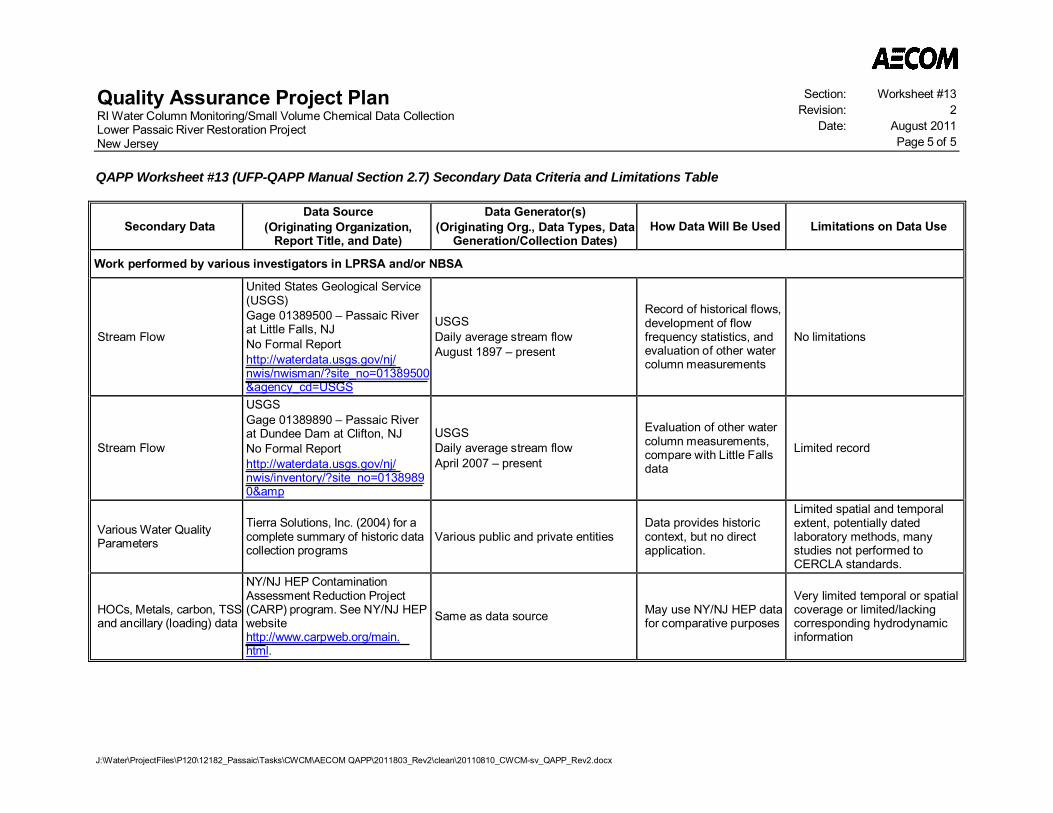
Quality Assurance Project PlanRI Water Column Monitoring/Small Volume Chemical Data CollectionLower Passaic River Restoration ProjectNew Jersey
Section: Worksheet #13Revision: 2
Date: August 2011Page 5 of 5
QAPP Worksheet #13 (UFP-QAPP Manual Section 2.7) Secondary Data Criteria and Limitations Table
J:\Water\ProjectFiles\P120\12182_Passaic\Tasks\CWCM\AECOM QAPP\2011803_Rev2\clean\20110810_CWCM-sv_QAPP_Rev2.docx
Secondary DataData Source
(Originating Organization,Report Title, and Date)
Data Generator(s)(Originating Org., Data Types, Data
Generation/Collection Dates)How Data Will Be Used Limitations on Data Use
Work performed by various investigators in LPRSA and/or NBSA
Stream Flow
United States Geological Service(USGS)Gage 01389500 – Passaic Riverat Little Falls, NJNo Formal Reporthttp://waterdata.usgs.gov/nj/nwis/nwisman/?site_no=01389500&agency_cd=USGS
USGSDaily average stream flowAugust 1897 – present
Record of historical flows,development of flowfrequency statistics, andevaluation of other watercolumn measurements
No limitations
Stream Flow
USGSGage 01389890 – Passaic Riverat Dundee Dam at Clifton, NJNo Formal Reporthttp://waterdata.usgs.gov/nj/nwis/inventory/?site_no=01389890&
USGSDaily average stream flowApril 2007 – present
Evaluation of other watercolumn measurements,compare with Little Fallsdata
Limited record
Various Water QualityParameters
Tierra Solutions, Inc. (2004) for acomplete summary of historic datacollection programs
Various public and private entitiesData provides historiccontext, but no directapplication.
Limited spatial and temporalextent, potentially datedlaboratory methods, manystudies not performed toCERCLA standards.
HOCs, Metals, carbon, TSSand ancillary (loading) data
NY/NJ HEP ContaminationAssessment Reduction Project(CARP) program. See NY/NJ HEPwebsitehttp://www.carpweb.org/main.html.
Same as data source May use NY/NJ HEP datafor comparative purposes
Very limited temporal or spatialcoverage or limited/lackingcorresponding hydrodynamicinformation
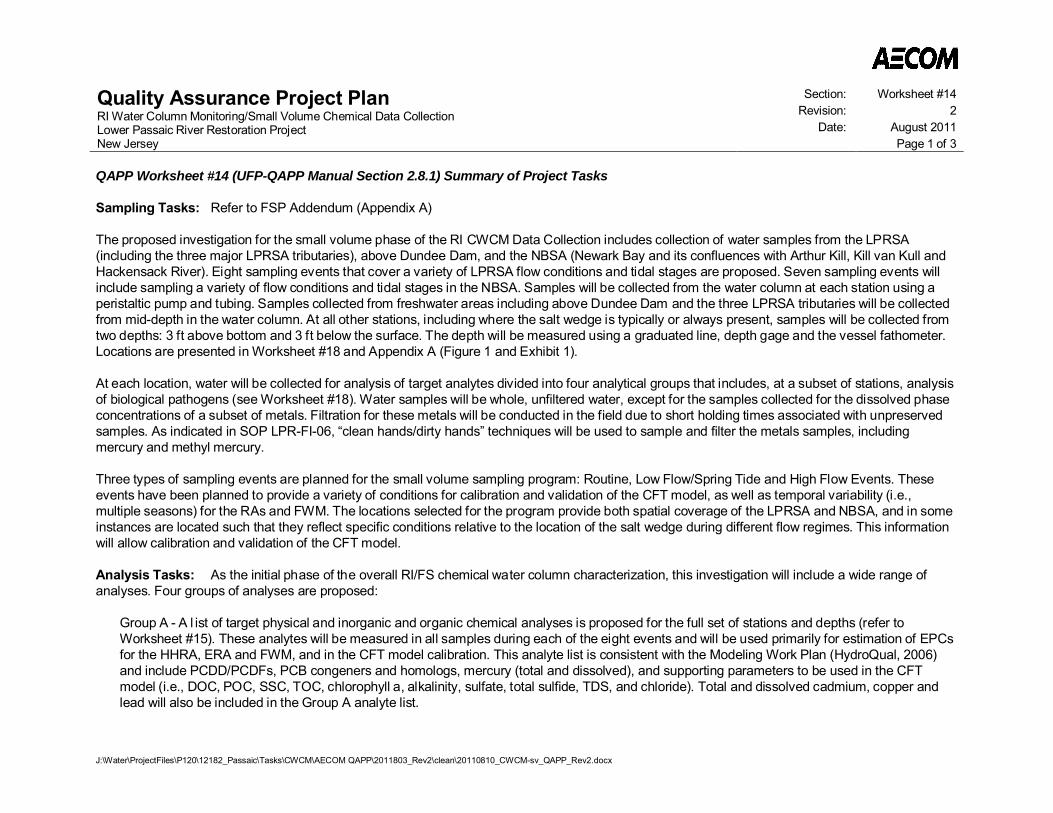
Quality Assurance Project PlanRI Water Column Monitoring/Small Volume Chemical Data CollectionLower Passaic River Restoration ProjectNew Jersey
Section: Worksheet #14Revision: 2
Date: August 2011Page 1 of 3
J:\Water\ProjectFiles\P120\12182_Passaic\Tasks\CWCM\AECOM QAPP\2011803_Rev2\clean\20110810_CWCM-sv_QAPP_Rev2.docx
QAPP Worksheet #14 (UFP-QAPP Manual Section 2.8.1) Summary of Project Tasks
Sampling Tasks: Refer to FSP Addendum (Appendix A)
The proposed investigation for the small volume phase of the RI CWCM Data Collection includes collection of water samples from the LPRSA(including the three major LPRSA tributaries), above Dundee Dam, and the NBSA (Newark Bay and its confluences with Arthur Kill, Kill van Kull andHackensack River). Eight sampling events that cover a variety of LPRSA flow conditions and tidal stages are proposed. Seven sampling events willinclude sampling a variety of flow conditions and tidal stages in the NBSA. Samples will be collected from the water column at each station using aperistaltic pump and tubing. Samples collected from freshwater areas including above Dundee Dam and the three LPRSA tributaries will be collectedfrom mid-depth in the water column. At all other stations, including where the salt wedge is typically or always present, samples will be collected fromtwo depths: 3 ft above bottom and 3 ft below the surface. The depth will be measured using a graduated line, depth gage and the vessel fathometer.Locations are presented in Worksheet #18 and Appendix A (Figure 1 and Exhibit 1).
At each location, water will be collected for analysis of target analytes divided into four analytical groups that includes, at a subset of stations, analysisof biological pathogens (see Worksheet #18). Water samples will be whole, unfiltered water, except for the samples collected for the dissolved phaseconcentrations of a subset of metals. Filtration for these metals will be conducted in the field due to short holding times associated with unpreservedsamples. As indicated in SOP LPR-FI-06, “clean hands/dirty hands” techniques will be used to sample and filter the metals samples, includingmercury and methyl mercury.
Three types of sampling events are planned for the small volume sampling program: Routine, Low Flow/Spring Tide and High Flow Events. Theseevents have been planned to provide a variety of conditions for calibration and validation of the CFT model, as well as temporal variability (i.e.,multiple seasons) for the RAs and FWM. The locations selected for the program provide both spatial coverage of the LPRSA and NBSA, and in someinstances are located such that they reflect specific conditions relative to the location of the salt wedge during different flow regimes. This informationwill allow calibration and validation of the CFT model.
Analysis Tasks: As the initial phase of the overall RI/FS chemical water column characterization, this investigation will include a wide range ofanalyses. Four groups of analyses are proposed:
Group A - A l ist of target physical and inorganic and organic chemical analyses is proposed for the full set of stations and depths (refer toWorksheet #15). These analytes will be measured in all samples during each of the eight events and will be used primarily for estimation of EPCsfor the HHRA, ERA and FWM, and in the CFT model calibration. This analyte list is consistent with the Modeling Work Plan (HydroQual, 2006)and include PCDD/PCDFs, PCB congeners and homologs, mercury (total and dissolved), and supporting parameters to be used in the CFTmodel (i.e., DOC, POC, SSC, TOC, chlorophyll a, alkalinity, sulfate, total sulfide, TDS, and chloride). Total and dissolved cadmium, copper andlead will also be included in the Group A analyte list.
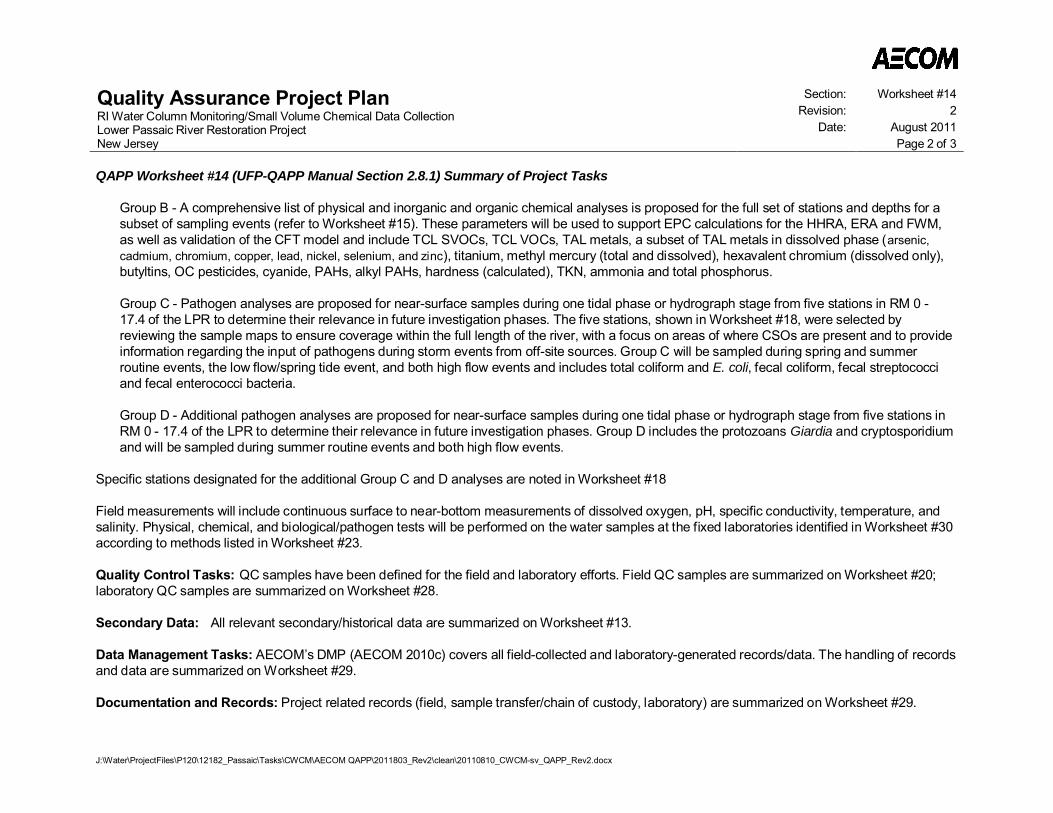
Quality Assurance Project PlanRI Water Column Monitoring/Small Volume Chemical Data CollectionLower Passaic River Restoration ProjectNew Jersey
Section: Worksheet #14Revision: 2
Date: August 2011Page 2 of 3
QAPP Worksheet #14 (UFP-QAPP Manual Section 2.8.1) Summary of Project Tasks
J:\Water\ProjectFiles\P120\12182_Passaic\Tasks\CWCM\AECOM QAPP\2011803_Rev2\clean\20110810_CWCM-sv_QAPP_Rev2.docx
Group B - A comprehensive list of physical and inorganic and organic chemical analyses is proposed for the full set of stations and depths for asubset of sampling events (refer to Worksheet #15). These parameters will be used to support EPC calculations for the HHRA, ERA and FWM,as well as validation of the CFT model and include TCL SVOCs, TCL VOCs, TAL metals, a subset of TAL metals in dissolved phase (arsenic,cadmium, chromium, copper, lead, nickel, selenium, and zinc), titanium, methyl mercury (total and dissolved), hexavalent chromium (dissolved only),butyltins, OC pesticides, cyanide, PAHs, alkyl PAHs, hardness (calculated), TKN, ammonia and total phosphorus.
Group C - Pathogen analyses are proposed for near-surface samples during one tidal phase or hydrograph stage from five stations in RM 0 -17.4 of the LPR to determine their relevance in future investigation phases. The five stations, shown in Worksheet #18, were selected byreviewing the sample maps to ensure coverage within the full length of the river, with a focus on areas of where CSOs are present and to provideinformation regarding the input of pathogens during storm events from off-site sources. Group C will be sampled during spring and summerroutine events, the low flow/spring tide event, and both high flow events and includes total coliform and E. coli, fecal coliform, fecal streptococciand fecal enterococci bacteria.
Group D - Additional pathogen analyses are proposed for near-surface samples during one tidal phase or hydrograph stage from five stations inRM 0 - 17.4 of the LPR to determine their relevance in future investigation phases. Group D includes the protozoans Giardia and cryptosporidiumand will be sampled during summer routine events and both high flow events.
Specific stations designated for the additional Group C and D analyses are noted in Worksheet #18
Field measurements will include continuous surface to near-bottom measurements of dissolved oxygen, pH, specific conductivity, temperature, andsalinity. Physical, chemical, and biological/pathogen tests will be performed on the water samples at the fixed laboratories identified in Worksheet #30according to methods listed in Worksheet #23.
Quality Control Tasks: QC samples have been defined for the field and laboratory efforts. Field QC samples are summarized on Worksheet #20;laboratory QC samples are summarized on Worksheet #28.
Secondary Data: All relevant secondary/historical data are summarized on Worksheet #13.
Data Management Tasks: AECOM’s DMP (AECOM 2010c) covers all field-collected and laboratory-generated records/data. The handling of recordsand data are summarized on Worksheet #29.
Documentation and Records: Project related records (field, sample transfer/chain of custody, laboratory) are summarized on Worksheet #29.
Quality Assurance Project PlanRI Water Column Monitoring/Small Volume Chemical Data CollectionLower Passaic River Restoration ProjectNew Jersey
Section: Worksheet #14Revision: 2
Date: August 2011Page 3 of 3
QAPP Worksheet #14 (UFP-QAPP Manual Section 2.8.1) Summary of Project Tasks
J:\Water\ProjectFiles\P120\12182_Passaic\Tasks\CWCM\AECOM QAPP\2011803_Rev2\clean\20110810_CWCM-sv_QAPP_Rev2.docx
Assessment/Audit Tasks: Field and laboratory audits are scheduled in accordance with Worksheet #31.
Data Review Tasks: Field data will be reviewed as described in Worksheet #34. Laboratories are contractually required to verify all laboratory dataincluding EDDs as summarized in Worksheet #34. Data validation and usability assessments will be conducted as detailed in Worksheets #35, 36,and 37.
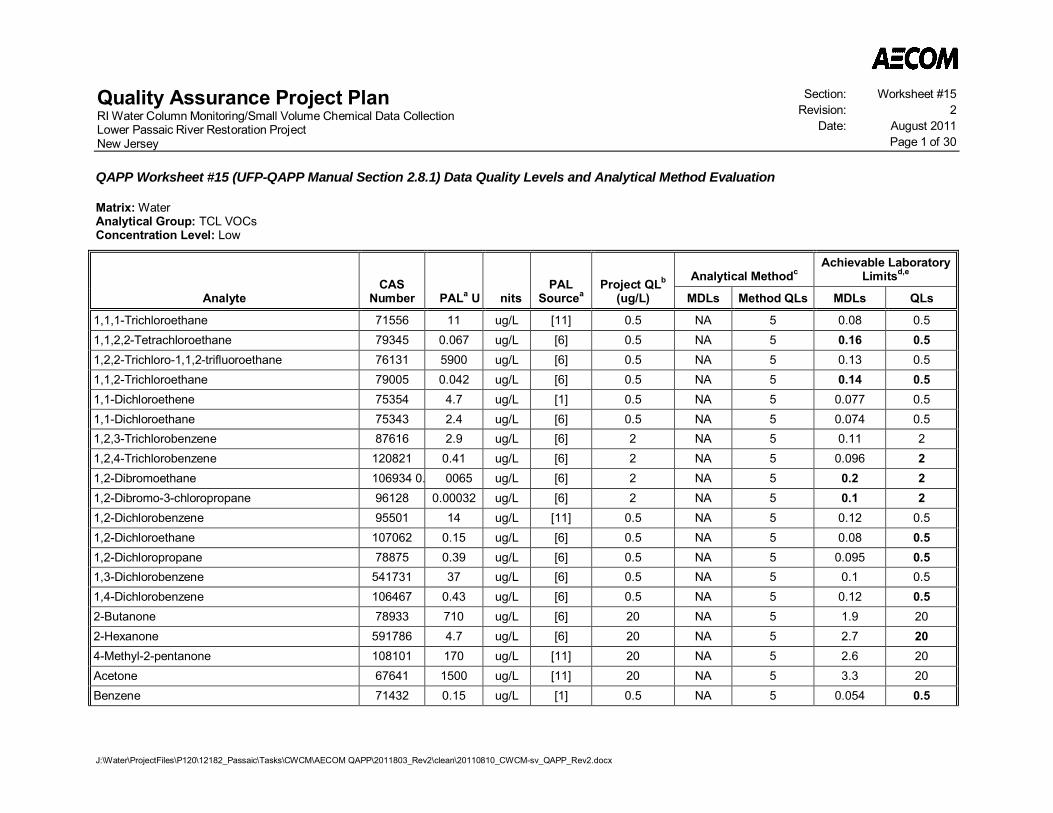
Quality Assurance Project PlanRI Water Column Monitoring/Small Volume Chemical Data CollectionLower Passaic River Restoration ProjectNew Jersey
Section: Worksheet #15Revision: 2
Date: August 2011Page 1 of 30
J:\Water\ProjectFiles\P120\12182_Passaic\Tasks\CWCM\AECOM QAPP\2011803_Rev2\clean\20110810_CWCM-sv_QAPP_Rev2.docx
QAPP Worksheet #15 (UFP-QAPP Manual Section 2.8.1) Data Quality Levels and Analytical Method Evaluation
Matrix: WaterAnalytical Group: TCL VOCsConcentration Level: Low
AnalyteCAS
Number PALa U nitsPAL
SourceaProject QLb
(ug/L)
Analytical MethodcAchievable Laboratory
Limitsd,e
MDLs Method QLs MDLs QLs
1,1,1-Trichloroethane 71556 11 ug/L [11] 0.5 NA 5 0.08 0.51,1,2,2-Tetrachloroethane 79345 0.067 ug/L [6] 0.5 NA 5 0.16 0.51,2,2-Trichloro-1,1,2-trifluoroethane 76131 5900 ug/L [6] 0.5 NA 5 0.13 0.51,1,2-Trichloroethane 79005 0.042 ug/L [6] 0.5 NA 5 0.14 0.51,1-Dichloroethene 75354 4.7 ug/L [1] 0.5 NA 5 0.077 0.51,1-Dichloroethane 75343 2.4 ug/L [6] 0.5 NA 5 0.074 0.51,2,3-Trichlorobenzene 87616 2.9 ug/L [6] 2 NA 5 0.11 21,2,4-Trichlorobenzene 120821 0.41 ug/L [6] 2 NA 5 0.096 21,2-Dibromoethane 106934 0. 0065 ug/L [6] 2 NA 5 0.2 21,2-Dibromo-3-chloropropane 96128 0.00032 ug/L [6] 2 NA 5 0.1 21,2-Dichlorobenzene 95501 14 ug/L [11] 0.5 NA 5 0.12 0.51,2-Dichloroethane 107062 0.15 ug/L [6] 0.5 NA 5 0.08 0.51,2-Dichloropropane 78875 0.39 ug/L [6] 0.5 NA 5 0.095 0.51,3-Dichlorobenzene 541731 37 ug/L [6] 0.5 NA 5 0.1 0.51,4-Dichlorobenzene 106467 0.43 ug/L [6] 0.5 NA 5 0.12 0.52-Butanone 78933 710 ug/L [6] 20 NA 5 1.9 202-Hexanone 591786 4.7 ug/L [6] 20 NA 5 2.7 204-Methyl-2-pentanone 108101 170 ug/L [11] 20 NA 5 2.6 20Acetone 67641 1500 ug/L [11] 20 NA 5 3.3 20Benzene 71432 0.15 ug/L [1] 0.5 NA 5 0.054 0.5

Quality Assurance Project PlanRI Water Column Monitoring/Small Volume Chemical Data CollectionLower Passaic River Restoration ProjectNew Jersey
Section: Worksheet #15Revision: 2
Date: August 2011Page 2 of 30
QAPP Worksheet #15 (UFP-QAPP Manual Section 2.8.1) Data Quality Levels and Analytical Method Evaluation
J:\Water\ProjectFiles\P120\12182_Passaic\Tasks\CWCM\AECOM QAPP\2011803_Rev2\clean\20110810_CWCM-sv_QAPP_Rev2.docx
AnalyteCAS
Number PALa U nitsPAL
SourceaProject QLb
(ug/L)
Analytical MethodcAchievable Laboratory
Limitsd,e
MDLs Method QLs MDLs QLs
Bromochloromethane 74975 0.55 ug/L [1][3] 0.5 NA 5 0.16 0.5Bromodichloromethane 75274 0.12 ug/L [6] 0.5 NA 5 0.091 0.5Bromoform 75252 4.3 ug/L [1][3] 0.5 NA 5 0.16 0.5Bromomethane 74839 0.87 ug/L [6] 0.5 NA 5 0.09 0.5Carbon disulfide 75150 0.92 ug/L [11] 0.5 NA 5 0.055 0.5Carbon tetrachloride 56235 0.23 ug/L [3] 0.5 NA 5 0.096 0.5Chlorobenzene 108907 9.1 ug/L [6] 0.5 NA 5 0.11 0.5Chloroethane 75003 2100 ug/L [6] 0.5 NA 5 0.16 0.5Chloroform 67663 0.19 ug/L [6] 0.5 NA 5 0.072 0.5Chloromethane 74873 19 ug/L [6] 0.5 NA 5 0.068 0.5cis-1,2-Dichloroethene 156592 7.3 ug/L [6] 0.5 NA 5 0.067 0.5cis-1,3-Dichloropropene 10061015 0.34 ug/L [1][3] 0.5 NA 5 0.18 0.5Cyclohexane 110827 1300 ug/L [6] 1 NA 5 0.1 1Dibromochloromethane 124481 0.15 ug/L [6] 0.5 NA 5 0.14 0.5Dichorodifluoromethane 75718 20 ug/L [6] 0.5 NA 5 0.13 0.5Ethylbenzene 100414 1.5 ug/L [6] 0.5 NA 5 0.05 0.5Isopropylbenzene 98828 68 ug/L [6] 2 NA 5 0.051 2Methyl acetate 79209 3700 ug/L [6] 1 NA 5 0.15 1Methyl tert-Butyl Ether 1634044 12 ug/L [6] 0.5 NA 5 0.11 0.5Methylcyclohexane 108872 NA ug/L NA 1 NA 5 0.086 1Methylene chloride 75092 2.5 ug/L [1] 2 NA 5 0.1 2Styrene 100425 100 ug/L [5] 0.5 NA 5 0.089 0.5Tetrachloroethene 127184 0.11 ug/L [6] 0.5 NA 5 0.099 0.5
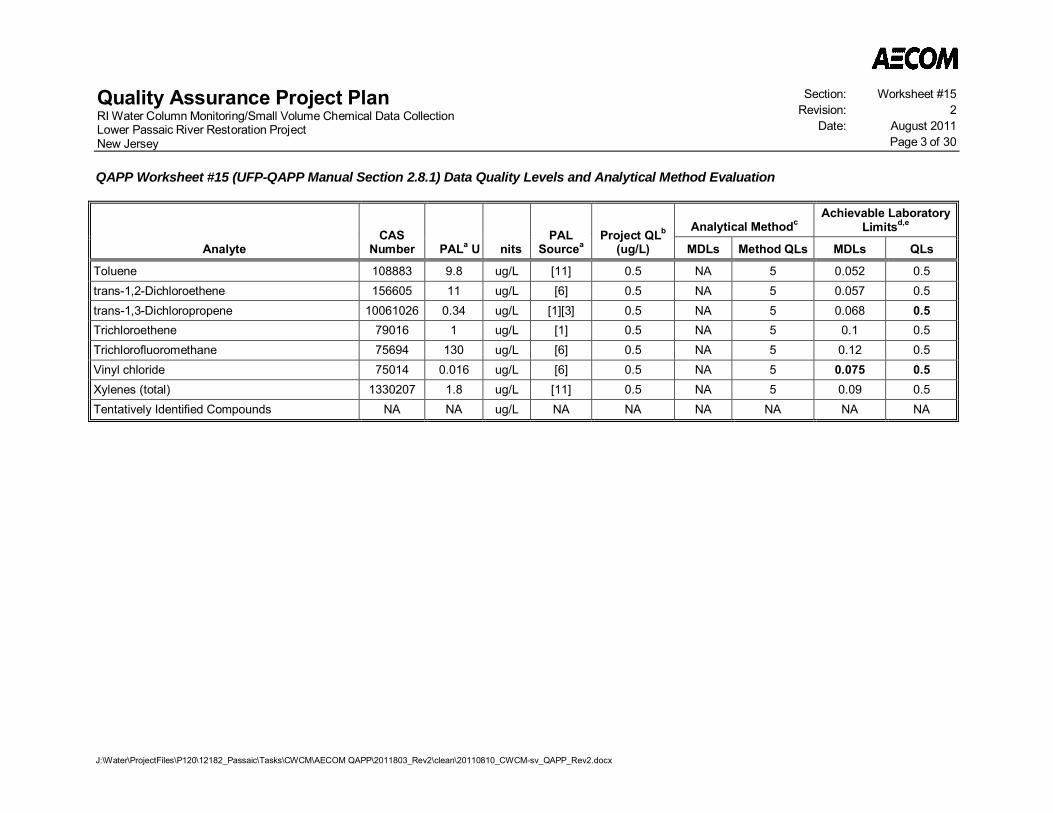
Quality Assurance Project PlanRI Water Column Monitoring/Small Volume Chemical Data CollectionLower Passaic River Restoration ProjectNew Jersey
Section: Worksheet #15Revision: 2
Date: August 2011Page 3 of 30
QAPP Worksheet #15 (UFP-QAPP Manual Section 2.8.1) Data Quality Levels and Analytical Method Evaluation
J:\Water\ProjectFiles\P120\12182_Passaic\Tasks\CWCM\AECOM QAPP\2011803_Rev2\clean\20110810_CWCM-sv_QAPP_Rev2.docx
AnalyteCAS
Number PALa U nitsPAL
SourceaProject QLb
(ug/L)
Analytical MethodcAchievable Laboratory
Limitsd,e
MDLs Method QLs MDLs QLs
Toluene 108883 9.8 ug/L [11] 0.5 NA 5 0.052 0.5trans-1,2-Dichloroethene 156605 11 ug/L [6] 0.5 NA 5 0.057 0.5trans-1,3-Dichloropropene 10061026 0.34 ug/L [1][3] 0.5 NA 5 0.068 0.5Trichloroethene 79016 1 ug/L [1] 0.5 NA 5 0.1 0.5Trichlorofluoromethane 75694 130 ug/L [6] 0.5 NA 5 0.12 0.5Vinyl chloride 75014 0.016 ug/L [6] 0.5 NA 5 0.075 0.5Xylenes (total) 1330207 1.8 ug/L [11] 0.5 NA 5 0.09 0.5Tentatively Identified Compounds NA NA ug/L NA NA NA NA NA NA
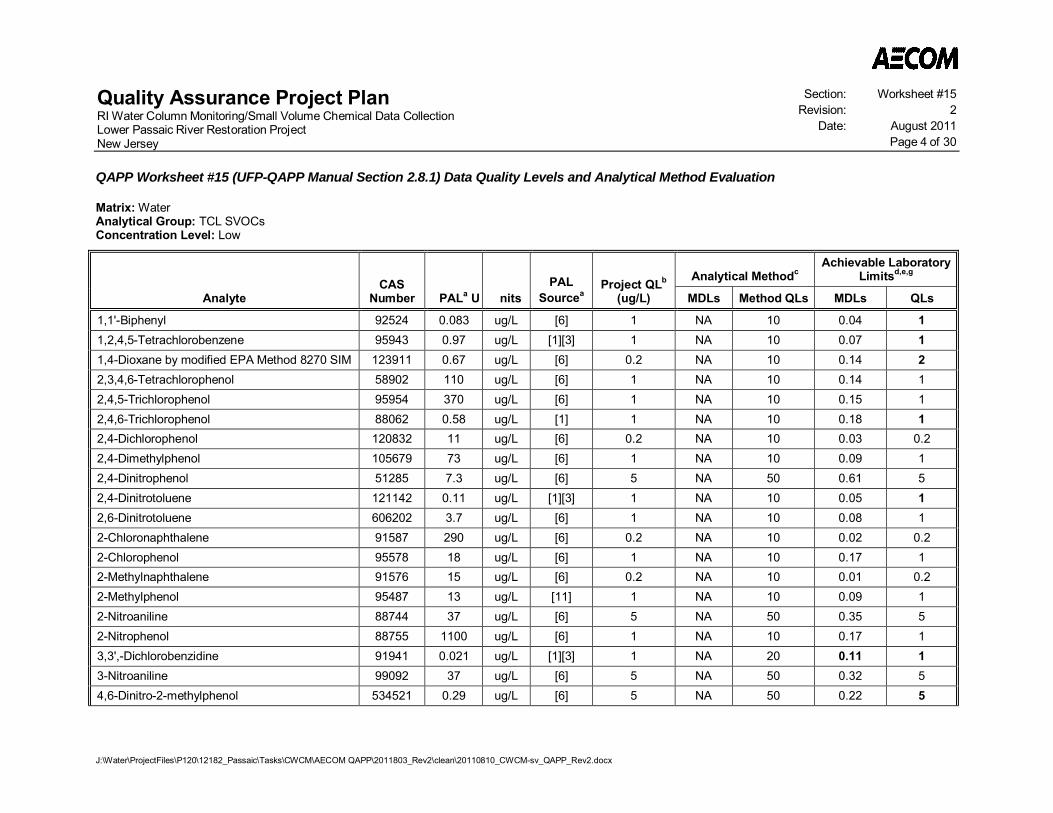
Quality Assurance Project PlanRI Water Column Monitoring/Small Volume Chemical Data CollectionLower Passaic River Restoration ProjectNew Jersey
Section: Worksheet #15Revision: 2
Date: August 2011Page 4 of 30
QAPP Worksheet #15 (UFP-QAPP Manual Section 2.8.1) Data Quality Levels and Analytical Method Evaluation
J:\Water\ProjectFiles\P120\12182_Passaic\Tasks\CWCM\AECOM QAPP\2011803_Rev2\clean\20110810_CWCM-sv_QAPP_Rev2.docx
Matrix: WaterAnalytical Group: TCL SVOCsConcentration Level: Low
AnalyteCAS
Number PALa U nitsPAL
SourceaProject QLb
(ug/L)
Analytical MethodcAchievable Laboratory
Limitsd,e,g
MDLs Method QLs MDLs QLs
1,1'-Biphenyl 92524 0.083 ug/L [6] 1 NA 10 0.04 11,2,4,5-Tetrachlorobenzene 95943 0.97 ug/L [1][3] 1 NA 10 0.07 11,4-Dioxane by modified EPA Method 8270 SIM 123911 0.67 ug/L [6] 0.2 NA 10 0.14 22,3,4,6-Tetrachlorophenol 58902 110 ug/L [6] 1 NA 10 0.14 12,4,5-Trichlorophenol 95954 370 ug/L [6] 1 NA 10 0.15 12,4,6-Trichlorophenol 88062 0.58 ug/L [1] 1 NA 10 0.18 12,4-Dichlorophenol 120832 11 ug/L [6] 0.2 NA 10 0.03 0.22,4-Dimethylphenol 105679 73 ug/L [6] 1 NA 10 0.09 12,4-Dinitrophenol 51285 7.3 ug/L [6] 5 NA 50 0.61 52,4-Dinitrotoluene 121142 0.11 ug/L [1][3] 1 NA 10 0.05 12,6-Dinitrotoluene 606202 3.7 ug/L [6] 1 NA 10 0.08 12-Chloronaphthalene 91587 290 ug/L [6] 0.2 NA 10 0.02 0.22-Chlorophenol 95578 18 ug/L [6] 1 NA 10 0.17 12-Methylnaphthalene 91576 15 ug/L [6] 0.2 NA 10 0.01 0.22-Methylphenol 95487 13 ug/L [11] 1 NA 10 0.09 12-Nitroaniline 88744 37 ug/L [6] 5 NA 50 0.35 52-Nitrophenol 88755 1100 ug/L [6] 1 NA 10 0.17 13,3',-Dichlorobenzidine 91941 0.021 ug/L [1][3] 1 NA 20 0.11 13-Nitroaniline 99092 37 ug/L [6] 5 NA 50 0.32 54,6-Dinitro-2-methylphenol 534521 0.29 ug/L [6] 5 NA 50 0.22 5
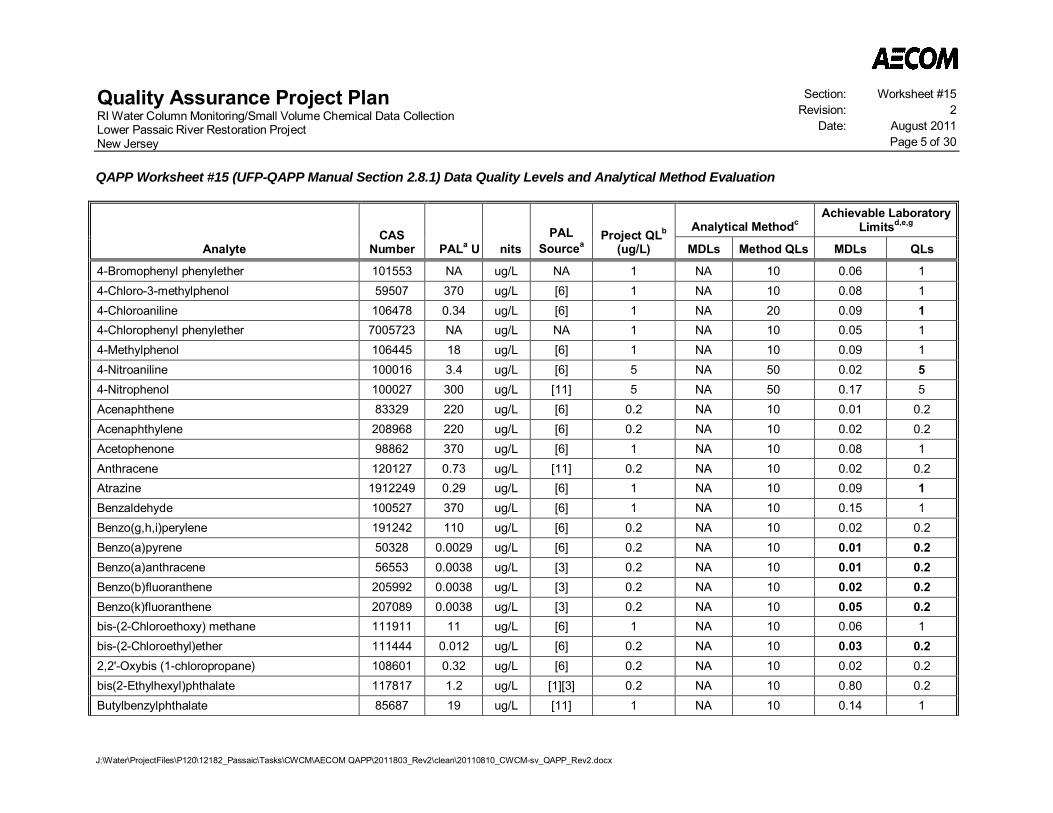
Quality Assurance Project PlanRI Water Column Monitoring/Small Volume Chemical Data CollectionLower Passaic River Restoration ProjectNew Jersey
Section: Worksheet #15Revision: 2
Date: August 2011Page 5 of 30
QAPP Worksheet #15 (UFP-QAPP Manual Section 2.8.1) Data Quality Levels and Analytical Method Evaluation
J:\Water\ProjectFiles\P120\12182_Passaic\Tasks\CWCM\AECOM QAPP\2011803_Rev2\clean\20110810_CWCM-sv_QAPP_Rev2.docx
AnalyteCAS
Number PALa U nitsPAL
SourceaProject QLb
(ug/L)
Analytical MethodcAchievable Laboratory
Limitsd,e,g
MDLs Method QLs MDLs QLs
4-Bromophenyl phenylether 101553 NA ug/L NA 1 NA 10 0.06 14-Chloro-3-methylphenol 59507 370 ug/L [6] 1 NA 10 0.08 14-Chloroaniline 106478 0.34 ug/L [6] 1 NA 20 0.09 14-Chlorophenyl phenylether 7005723 NA ug/L NA 1 NA 10 0.05 14-Methylphenol 106445 18 ug/L [6] 1 NA 10 0.09 14-Nitroaniline 100016 3.4 ug/L [6] 5 NA 50 0.02 54-Nitrophenol 100027 300 ug/L [11] 5 NA 50 0.17 5Acenaphthene 83329 220 ug/L [6] 0.2 NA 10 0.01 0.2Acenaphthylene 208968 220 ug/L [6] 0.2 NA 10 0.02 0.2Acetophenone 98862 370 ug/L [6] 1 NA 10 0.08 1Anthracene 120127 0.73 ug/L [11] 0.2 NA 10 0.02 0.2Atrazine 1912249 0.29 ug/L [6] 1 NA 10 0.09 1Benzaldehyde 100527 370 ug/L [6] 1 NA 10 0.15 1Benzo(g,h,i)perylene 191242 110 ug/L [6] 0.2 NA 10 0.02 0.2Benzo(a)pyrene 50328 0.0029 ug/L [6] 0.2 NA 10 0.01 0.2Benzo(a)anthracene 56553 0.0038 ug/L [3] 0.2 NA 10 0.01 0.2Benzo(b)fluoranthene 205992 0.0038 ug/L [3] 0.2 NA 10 0.02 0.2Benzo(k)fluoranthene 207089 0.0038 ug/L [3] 0.2 NA 10 0.05 0.2bis-(2-Chloroethoxy) methane 111911 11 ug/L [6] 1 NA 10 0.06 1bis-(2-Chloroethyl)ether 111444 0.012 ug/L [6] 0.2 NA 10 0.03 0.22,2'-Oxybis (1-chloropropane) 108601 0.32 ug/L [6] 0.2 NA 10 0.02 0.2bis(2-Ethylhexyl)phthalate 117817 1.2 ug/L [1][3] 0.2 NA 10 0.80 0.2Butylbenzylphthalate 85687 19 ug/L [11] 1 NA 10 0.14 1

Quality Assurance Project PlanRI Water Column Monitoring/Small Volume Chemical Data CollectionLower Passaic River Restoration ProjectNew Jersey
Section: Worksheet #15Revision: 2
Date: August 2011Page 6 of 30
QAPP Worksheet #15 (UFP-QAPP Manual Section 2.8.1) Data Quality Levels and Analytical Method Evaluation
J:\Water\ProjectFiles\P120\12182_Passaic\Tasks\CWCM\AECOM QAPP\2011803_Rev2\clean\20110810_CWCM-sv_QAPP_Rev2.docx
AnalyteCAS
Number PALa U nitsPAL
SourceaProject QLb
(ug/L)
Analytical MethodcAchievable Laboratory
Limitsd,e,g
MDLs Method QLs MDLs QLs
Caprolactam 105602 1800 ug/L [6] 1 NA 10 1.19 1Carbazole 86748 NA ug/L NA 5 NA 10 0.02 5Chrysene 218019 0.0038 ug/L [3] 0.2 NA 10 0.01 0.2Dibenzo(a,h)anthracene 53703 0.0029 ug/L [6] 0.2 NA 10 0.02 0.2Dibenzofuran 132649 3.7 ug/L [6] 1 NA 10 0.06 1Diethylphthalate 84662 210 ug/L [11] 1 NA 10 0.15 1Dimethylphthalate 131113 270000 ug/L [3] 1 NA 10 0.08 1Di-n-Butylphthalate 84742 35 ug/L [11] 1 NA 10 0.13 1Di-n-octylphthalate 117840 NA ug/L NA 1 NA 10 0.21 1Fluoranthene 206440 130 ug/L [1][3] 0.2 NA 10 0.02 0.2Fluorene 86737 3.9 ug/L [11] 0.2 NA 10 0.02 0.2Hexachlorobenzene 118741 0.00028 ug/L [1][3] 0.2 NA 10 0.02 0.2Hexachlorobutadiene 87683 0.44 ug/L [1][3] 0.2 NA 10 0.02 0.2Hexchlorocyclopentadiene 77474 22 ug/L [6] 1 NA 10 0.05 1Hexachloroethane 67721 1.4 ug/L [1][3] 1 NA 10 0.06 1Indeno(1,2,3-cd)pyrene 193395 0.0038 ug/L [3] 0.2 NA 10 0.02 0.2Isophorone 78591 35 ug/L [1][3] 1 NA 10 0.06 1Naphthalene 91203 0.14 ug/L [6] 0.2 NA 10 0.01 0.2Nitrobenzene 98953 0.12 ug/L [6] 0.2 NA 10 0.08 0.2N-Nitrosodi-n-propylamine 621647 0.005 ug/L [1][3] 0.2 NA 10 0.03 0.2n-Nitrosodiphenylamine 86306 3.3 ug/L [1][3] 0.2 NA 10 0.09 0.2Pentachlorophenol 87865 0.17 ug/L [6] 1 NA 50 0.07 1Phenanthrene 85018 1100 ug/L [6] 0.2 NA 10 0.04 0.2
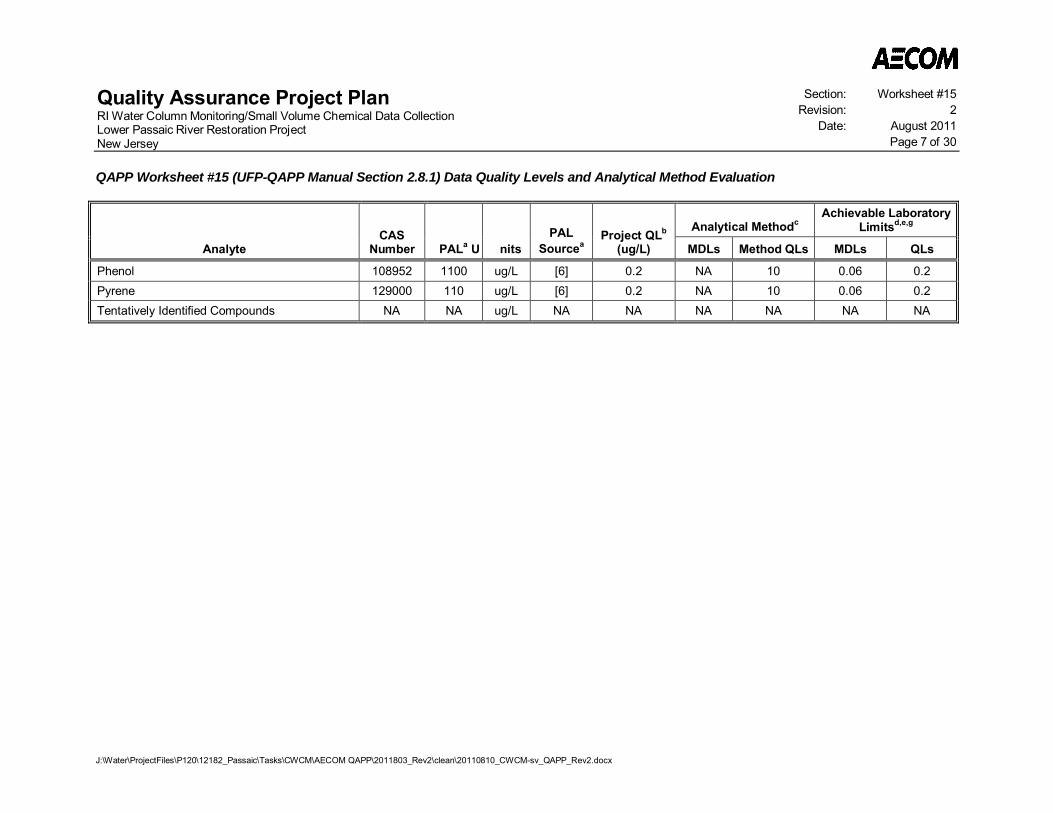
Quality Assurance Project PlanRI Water Column Monitoring/Small Volume Chemical Data CollectionLower Passaic River Restoration ProjectNew Jersey
Section: Worksheet #15Revision: 2
Date: August 2011Page 7 of 30
QAPP Worksheet #15 (UFP-QAPP Manual Section 2.8.1) Data Quality Levels and Analytical Method Evaluation
J:\Water\ProjectFiles\P120\12182_Passaic\Tasks\CWCM\AECOM QAPP\2011803_Rev2\clean\20110810_CWCM-sv_QAPP_Rev2.docx
AnalyteCAS
Number PALa U nitsPAL
SourceaProject QLb
(ug/L)
Analytical MethodcAchievable Laboratory
Limitsd,e,g
MDLs Method QLs MDLs QLs
Phenol 108952 1100 ug/L [6] 0.2 NA 10 0.06 0.2Pyrene 129000 110 ug/L [6] 0.2 NA 10 0.06 0.2Tentatively Identified Compounds NA NA ug/L NA NA NA NA NA NA
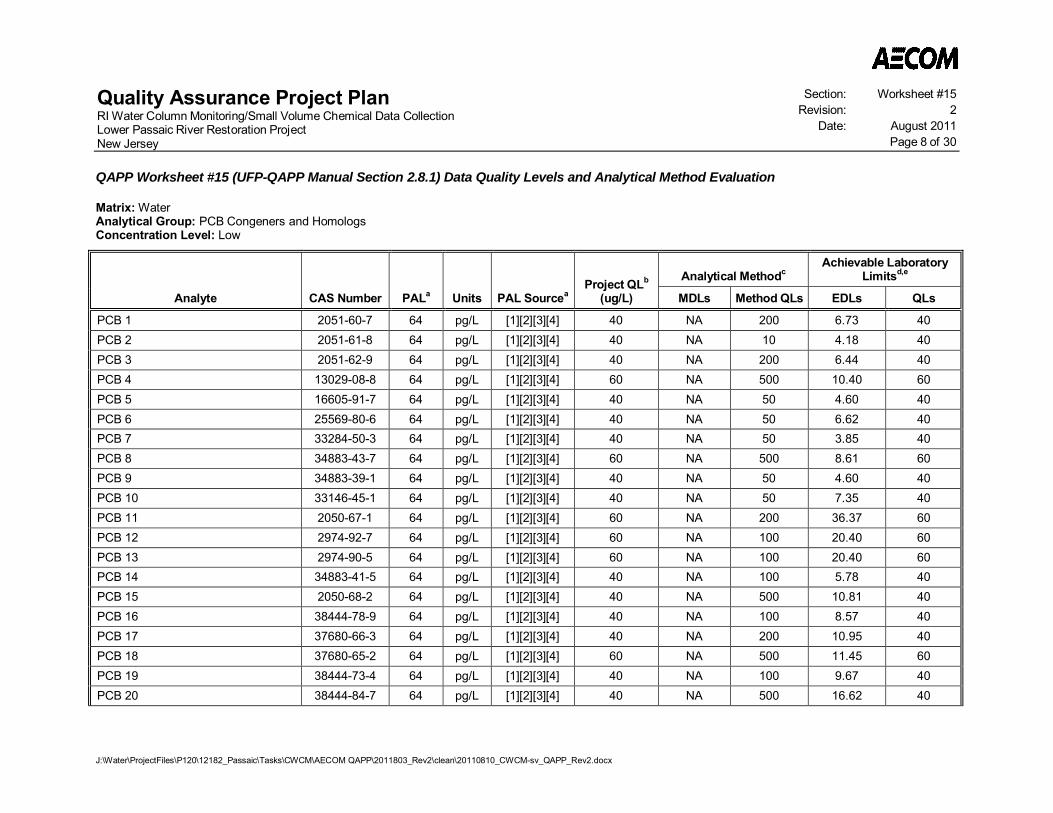
Quality Assurance Project PlanRI Water Column Monitoring/Small Volume Chemical Data CollectionLower Passaic River Restoration ProjectNew Jersey
Section: Worksheet #15Revision: 2
Date: August 2011Page 8 of 30
QAPP Worksheet #15 (UFP-QAPP Manual Section 2.8.1) Data Quality Levels and Analytical Method Evaluation
J:\Water\ProjectFiles\P120\12182_Passaic\Tasks\CWCM\AECOM QAPP\2011803_Rev2\clean\20110810_CWCM-sv_QAPP_Rev2.docx
Matrix: WaterAnalytical Group: PCB Congeners and HomologsConcentration Level: Low
Analyte CAS Number PALa Units PAL SourceaProject QLb
(ug/L)
Analytical MethodcAchievable Laboratory
Limitsd,e
MDLs Method QLs EDLs QLs
PCB 1 2051-60-7 64 pg/L [1][2][3][4] 40 NA 200 6.73 40PCB 2 2051-61-8 64 pg/L [1][2][3][4] 40 NA 10 4.18 40PCB 3 2051-62-9 64 pg/L [1][2][3][4] 40 NA 200 6.44 40PCB 4 13029-08-8 64 pg/L [1][2][3][4] 60 NA 500 10.40 60PCB 5 16605-91-7 64 pg/L [1][2][3][4] 40 NA 50 4.60 40PCB 6 25569-80-6 64 pg/L [1][2][3][4] 40 NA 50 6.62 40PCB 7 33284-50-3 64 pg/L [1][2][3][4] 40 NA 50 3.85 40PCB 8 34883-43-7 64 pg/L [1][2][3][4] 60 NA 500 8.61 60PCB 9 34883-39-1 64 pg/L [1][2][3][4] 40 NA 50 4.60 40PCB 10 33146-45-1 64 pg/L [1][2][3][4] 40 NA 50 7.35 40PCB 11 2050-67-1 64 pg/L [1][2][3][4] 60 NA 200 36.37 60PCB 12 2974-92-7 64 pg/L [1][2][3][4] 60 NA 100 20.40 60PCB 13 2974-90-5 64 pg/L [1][2][3][4] 60 NA 100 20.40 60PCB 14 34883-41-5 64 pg/L [1][2][3][4] 40 NA 100 5.78 40PCB 15 2050-68-2 64 pg/L [1][2][3][4] 40 NA 500 10.81 40PCB 16 38444-78-9 64 pg/L [1][2][3][4] 40 NA 100 8.57 40PCB 17 37680-66-3 64 pg/L [1][2][3][4] 40 NA 200 10.95 40PCB 18 37680-65-2 64 pg/L [1][2][3][4] 60 NA 500 11.45 60PCB 19 38444-73-4 64 pg/L [1][2][3][4] 40 NA 100 9.67 40PCB 20 38444-84-7 64 pg/L [1][2][3][4] 40 NA 500 16.62 40

Quality Assurance Project PlanRI Water Column Monitoring/Small Volume Chemical Data CollectionLower Passaic River Restoration ProjectNew Jersey
Section: Worksheet #15Revision: 2
Date: August 2011Page 9 of 30
QAPP Worksheet #15 (UFP-QAPP Manual Section 2.8.1) Data Quality Levels and Analytical Method Evaluation
J:\Water\ProjectFiles\P120\12182_Passaic\Tasks\CWCM\AECOM QAPP\2011803_Rev2\clean\20110810_CWCM-sv_QAPP_Rev2.docx
Analyte CAS Number PALa Units PAL SourceaProject QLb
(ug/L)
Analytical MethodcAchievable Laboratory
Limitsd,e
MDLs Method QLs EDLs QLs
PCB 21 55702-46-0 64 pg/L [1][2][3][4] 40 NA 200 12.64 40PCB 22 38444-85-8 64 pg/L [1][2][3][4] 40 NA 200 9.92 40PCB 23 55720-44-0 64 pg/L [1][2][3][4] 40 NA 200 3.16 40PCB 24 55702-45-9 64 pg/L [1][2][3][4] 40 NA 200 11.22 40PCB 25 55712-37-3 64 pg/L [1][2][3][4] 40 NA 200 7.67 40PCB 26 38444-81-4 64 pg/L [1][2][3][4] 40 NA 200 9.05 40PCB 27 38444-76-7 64 pg/L [1][2][3][4] 40 NA 200 5.63 40PCB 28 7012-37-5 64 pg/L [1][2][3][4] 40 NA 500 16.62 40PCB 29 15862-07-4 64 pg/L [1][2][3][4] 40 NA 200 9.05 40PCB 30 35693-92-6 64 pg/L [1][2][3][4] 60 NA 500 11.45 60PCB 31 16606-02-3 64 pg/L [1][2][3][4] 40 NA 500 10.12 40PCB 32 38444-77-8 64 pg/L [1][2][3][4] 40 NA 200 5.67 40PCB 33 38444-86-9 64 pg/L [1][2][3][4] 40 NA 200 12.64 40PCB 34 37680-68-5 64 pg/L [1][2][3][4] 40 NA 200 3.38 40PCB 35 37680-69-6 64 pg/L [1][2][3][4] 40 NA 200 9.58 40PCB 36 38444-87-0 64 pg/L [1][2][3][4] 40 NA 200 7.49 40PCB 37 38444-90-5 64 pg/L [1][2][3][4] 40 NA 500 8.96 40PCB 38 53555-66-1 64 pg/L [1][2][3][4] 40 NA 200 4.65 40PCB 39 38444-88-1 64 pg/L [1][2][3][4] 40 NA 200 7.33 40PCB 40 38444-93-8 64 pg/L [1][2][3][4] 40 NA 500 6.45 40PCB 41 52663-59-9 64 pg/L [1][2][3][4] 40 NA 500 6.45 40PCB 42 36559-22-5 64 pg/L [1][2][3][4] 40 NA 200 4.04 40PCB 43 70362-46-8 64 pg/L [1][2][3][4] 40 NA 200 9.35 40

Quality Assurance Project PlanRI Water Column Monitoring/Small Volume Chemical Data CollectionLower Passaic River Restoration ProjectNew Jersey
Section: Worksheet #15Revision: 2
Date: August 2011Page 10 of 30
QAPP Worksheet #15 (UFP-QAPP Manual Section 2.8.1) Data Quality Levels and Analytical Method Evaluation
J:\Water\ProjectFiles\P120\12182_Passaic\Tasks\CWCM\AECOM QAPP\2011803_Rev2\clean\20110810_CWCM-sv_QAPP_Rev2.docx
Analyte CAS Number PALa Units PAL SourceaProject QLb
(ug/L)
Analytical MethodcAchievable Laboratory
Limitsd,e
MDLs Method QLs EDLs QLs
PCB 44 41464-39-5 64 pg/L [1][2][3][4] 40 NA 500 10.67 40PCB 45 70362-45-7 64 pg/L [1][2][3][4] 40 NA 200 12.06 40PCB 46 41464-47-5 64 pg/L [1][2][3][4] 40 NA 200 2.62 40PCB 47 2437-79-8 64 pg/L [1][2][3][4] 40 NA 500 10.67 40PCB 48 70362-47-9 64 pg/L [1][2][3][4] 40 NA 200 2.55 40PCB 49 41464-40-8 64 pg/L [1][2][3][4] 40 NA 500 8.53 40PCB 50 62796-65-0 64 pg/L [1][2][3][4] 40 NA 200 9.16 40PCB 51 68194-04-7 64 pg/L [1][2][3][4] 40 NA 200 12.06 40PCB 52 35693-99-3 64 pg/L [1][2][3][4] 40 NA 500 7.50 40PBB 53 41464419 64 pg/L [1][2][3][4] 40 NA 500 9.16 40PCB 54 15968-05-5 64 pg/L [1][2][3][4] 40 NA 500 4.69 40PCB 55 74338-24-2 64 pg/L [1][2][3][4] 40 NA 500 6.13 40PCB 56 41464-43-1 64 pg/L [1][2][3][4] 40 NA 200 4.97 40PCB 57 70424-67-8 64 pg/L [1][2][3][4] 40 NA 500 4.62 40PCB 58 41464-49-7 64 pg/L [1][2][3][4] 40 NA 500 2.76 40PCB 59 74472-33-6 64 pg/L [1][2][3][4] 40 NA 200 11.65 40PCB 60 33025-41-1 64 pg/L [1][2][3][4] 40 NA 500 4.84 40PCB 61 33284-53-6 64 pg/L [1][2][3][4] 40 NA 500 23.80 40PCB 62 54230-22-7 64 pg/L [1][2][3][4] 40 NA 200 11.65 40PCB 63 74472-34-7 64 pg/L [1][2][3][4] 40 NA 500 4.77 40PCB 64 52663-58-8 64 pg/L [1][2][3][4] 40 NA 200 4.99 40PCB 65 33284-54-7 64 pg/L [1][2][3][4] 40 NA 500 10.67 40PCB 66 32598-10-0 64 pg/L [1][2][3][4] 40 NA 500 12.05 40

Quality Assurance Project PlanRI Water Column Monitoring/Small Volume Chemical Data CollectionLower Passaic River Restoration ProjectNew Jersey
Section: Worksheet #15Revision: 2
Date: August 2011Page 11 of 30
QAPP Worksheet #15 (UFP-QAPP Manual Section 2.8.1) Data Quality Levels and Analytical Method Evaluation
J:\Water\ProjectFiles\P120\12182_Passaic\Tasks\CWCM\AECOM QAPP\2011803_Rev2\clean\20110810_CWCM-sv_QAPP_Rev2.docx
Analyte CAS Number PALa Units PAL SourceaProject QLb
(ug/L)
Analytical MethodcAchievable Laboratory
Limitsd,e
MDLs Method QLs EDLs QLs
PCB 67 73575-53-8 64 pg/L [1][2][3][4] 40 NA 500 5.69 40PCB 68 73575-52-7 64 pg/L [1][2][3][4] 40 NA 500 3.86 40PCB 69 60233-24-1 64 pg/L [1][2][3][4] 40 NA 500 8.53 40PCB 70 32598-11-1 64 pg/L [1][2][3][4] 40 NA 500 23.80 40PCB 71 41464-46-4 64 pg/L [1][2][3][4] 40 NA 500 6.45 40PCB 72 41464-42-0 64 pg/L [1][2][3][4] 40 NA 500 3.67 40PCB 73 74338-23-1 64 pg/L [1][2][3][4] 40 NA 500 9.35 40PCB 74 32690-93-0 64 pg/L [1][2][3][4] 40 NA 500 23.80 40PCB 75 32598-12-2 64 pg/L [1][2][3][4] 40 NA 500 11.65 40PCB 76 70362-48-0 64 pg/L [1][2][3][4] 40 NA 500 23.80 40PCB 77 32598-13-3 50 pg/L [1][3] 40 NA 500 4.36 40PCB 78 70362-49-1 64 pg/L [1][2][3][4] 40 NA 500 4.43 40PCB 79 41464-48-6 64 pg/L [1][2][3][4] 40 NA 500 3.15 40PCB 80 33284-52-5 64 pg/L [1][2][3][4] 40 NA 500 3.59 40PCB 81 70362-50-4 17 pg/L [1][3] 40 NA 500 3.41 40PCB 82 52663-62-4 64 pg/L [1][2][3][4] 40 NA 500 8.29 40PCB 83 60145-20-2 64 pg/L [1][2][3][4] 40 NA 500 9.28 40PCB 84 52663-60-2 64 pg/L [1][2][3][4] 40 NA 500 5.97 40PCB 85 65510-45-4 64 pg/L [1][2][3][4] 40 NA 500 8.37 40PCB 86 55312-69-1 64 pg/L [1][2][3][4] 40 NA 500 10.46 40PCB 87 38380-02-8 64 pg/L [1][2][3][4] 40 NA 500 10.46 40PCB 88 55215-17-3 64 pg/L [1][2][3][4] 40 NA 500 7.37 40PCB 89 73575-57-2 64 pg/L [1][2][3][4] 40 NA 500 5.57 40

Quality Assurance Project PlanRI Water Column Monitoring/Small Volume Chemical Data CollectionLower Passaic River Restoration ProjectNew Jersey
Section: Worksheet #15Revision: 2
Date: August 2011Page 12 of 30
QAPP Worksheet #15 (UFP-QAPP Manual Section 2.8.1) Data Quality Levels and Analytical Method Evaluation
J:\Water\ProjectFiles\P120\12182_Passaic\Tasks\CWCM\AECOM QAPP\2011803_Rev2\clean\20110810_CWCM-sv_QAPP_Rev2.docx
Analyte CAS Number PALa Units PAL SourceaProject QLb
(ug/L)
Analytical MethodcAchievable Laboratory
Limitsd,e
MDLs Method QLs EDLs QLs
PCB 90 68194-07-0 64 pg/L [1][2][3][4] 40 NA 500 4.70 40PCB 91 68194-05-8 64 pg/L [1][2][3][4] 40 NA 500 7.37 40PCB 92 52663-61-3 64 pg/L [1][2][3][4] 40 NA 500 3.67 40PCB 93 73575-56-1 64 pg/L [1][2][3][4] 40 NA 500 7.55 40PCB 94 73575-55-0 64 pg/L [1][2][3][4] 40 NA 500 4.51 40PCB 95 38379-99-6 64 pg/L [1][2][3][4] 40 NA 500 6.75 40PCB 96 73575-54-9 64 pg/L [1][2][3][4] 40 NA 500 2.64 40PCB 97 41464-51-1 64 pg/L [1][2][3][4] 40 NA 500 10.46 40PCB 98 60233-25-2 64 pg/L [1][2][3][4] 40 NA 500 12.09 40PCB 99 38380-01-7 64 pg/L [1][2][3][4] 40 NA 500 17.70 40PCB 100 39485-83-1 64 pg/L [1][2][3][4] 40 NA 500 7.55 40PCB 101 37680-73-2 64 pg/L [1][2][3][4] 40 NA 1000 4.70 40PCB 102 68194-06-9 64 pg/L [1][2][3][4] 40 NA 500 12.09 40PCB 103 60145-21-3 64 pg/L [1][2][3][4] 40 NA 500 2.52 40PCB 104 56558-16-8 64 pg/L [1][2][3][4] 40 NA 500 5.75 40PCB 105 32598-14-4 167 pg/L [1][3] 40 NA 200 4.45 40PCB 106 70424-69-0 64 pg/L [1][2][3][4] 40 NA 500 5.80 40PCB 107 70424-68-9 64 pg/L [1][2][3][4] 40 NA 200 3.72 40PCB 108 70362-41-3 64 pg/L [1][2][3][4] 40 NA 1000 22.86 40PCB 109 74472-35-8 64 pg/L [1][2][3][4] 40 NA 500 10.46 40PCB 110 38380-03-9 64 pg/L [1][2][3][4] 40 NA 1000 7.25 40PCB 111 39635-32-0 64 pg/L [1][2][3][4] 40 NA 1000 3.43 40PCB 112 74472-36-9 64 pg/L [1][2][3][4] 40 NA 1000 17.70 40
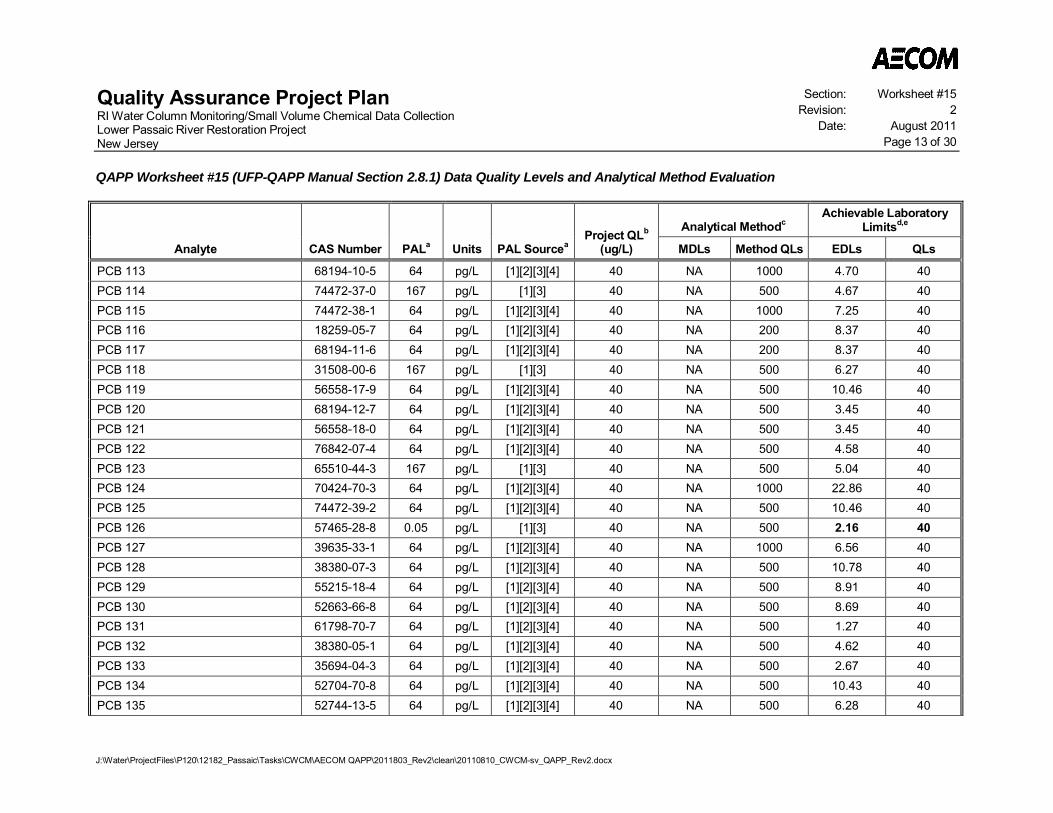
Quality Assurance Project PlanRI Water Column Monitoring/Small Volume Chemical Data CollectionLower Passaic River Restoration ProjectNew Jersey
Section: Worksheet #15Revision: 2
Date: August 2011Page 13 of 30
QAPP Worksheet #15 (UFP-QAPP Manual Section 2.8.1) Data Quality Levels and Analytical Method Evaluation
J:\Water\ProjectFiles\P120\12182_Passaic\Tasks\CWCM\AECOM QAPP\2011803_Rev2\clean\20110810_CWCM-sv_QAPP_Rev2.docx
Analyte CAS Number PALa Units PAL SourceaProject QLb
(ug/L)
Analytical MethodcAchievable Laboratory
Limitsd,e
MDLs Method QLs EDLs QLs
PCB 113 68194-10-5 64 pg/L [1][2][3][4] 40 NA 1000 4.70 40PCB 114 74472-37-0 167 pg/L [1][3] 40 NA 500 4.67 40PCB 115 74472-38-1 64 pg/L [1][2][3][4] 40 NA 1000 7.25 40PCB 116 18259-05-7 64 pg/L [1][2][3][4] 40 NA 200 8.37 40PCB 117 68194-11-6 64 pg/L [1][2][3][4] 40 NA 200 8.37 40PCB 118 31508-00-6 167 pg/L [1][3] 40 NA 500 6.27 40PCB 119 56558-17-9 64 pg/L [1][2][3][4] 40 NA 500 10.46 40PCB 120 68194-12-7 64 pg/L [1][2][3][4] 40 NA 500 3.45 40PCB 121 56558-18-0 64 pg/L [1][2][3][4] 40 NA 500 3.45 40PCB 122 76842-07-4 64 pg/L [1][2][3][4] 40 NA 500 4.58 40PCB 123 65510-44-3 167 pg/L [1][3] 40 NA 500 5.04 40PCB 124 70424-70-3 64 pg/L [1][2][3][4] 40 NA 1000 22.86 40PCB 125 74472-39-2 64 pg/L [1][2][3][4] 40 NA 500 10.46 40PCB 126 57465-28-8 0.05 pg/L [1][3] 40 NA 500 2.16 40PCB 127 39635-33-1 64 pg/L [1][2][3][4] 40 NA 1000 6.56 40PCB 128 38380-07-3 64 pg/L [1][2][3][4] 40 NA 500 10.78 40PCB 129 55215-18-4 64 pg/L [1][2][3][4] 40 NA 500 8.91 40PCB 130 52663-66-8 64 pg/L [1][2][3][4] 40 NA 500 8.69 40PCB 131 61798-70-7 64 pg/L [1][2][3][4] 40 NA 500 1.27 40PCB 132 38380-05-1 64 pg/L [1][2][3][4] 40 NA 500 4.62 40PCB 133 35694-04-3 64 pg/L [1][2][3][4] 40 NA 500 2.67 40PCB 134 52704-70-8 64 pg/L [1][2][3][4] 40 NA 500 10.43 40PCB 135 52744-13-5 64 pg/L [1][2][3][4] 40 NA 500 6.28 40
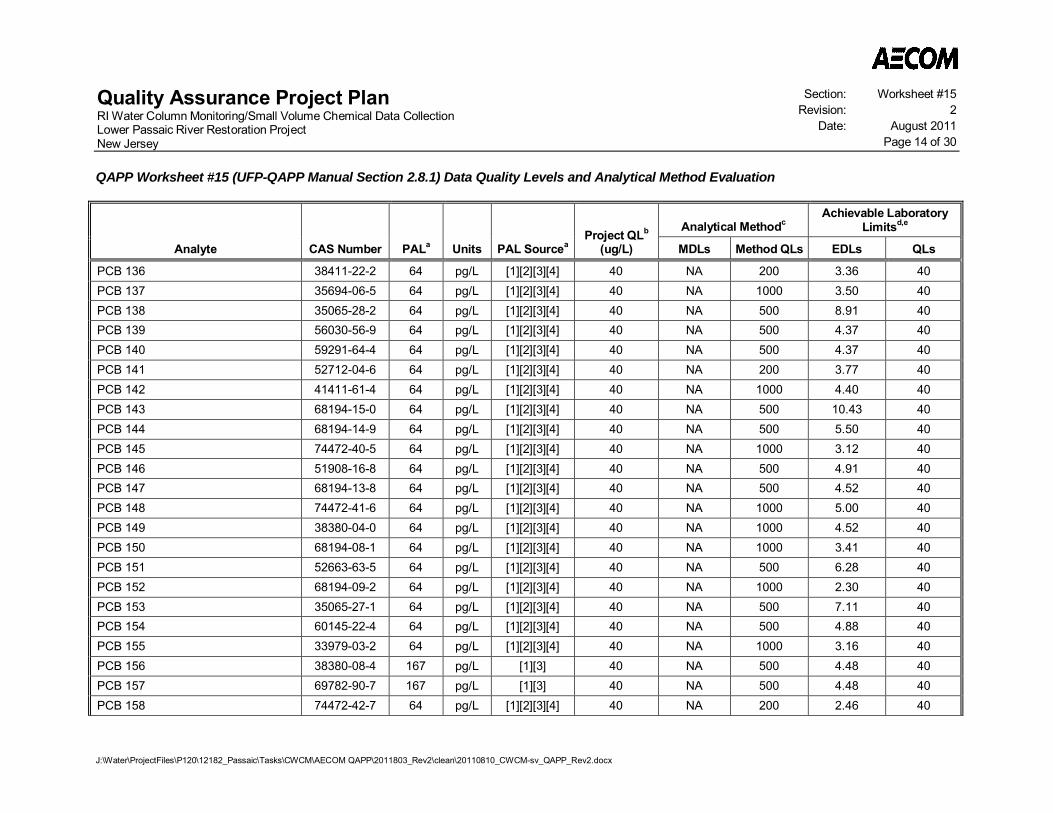
Quality Assurance Project PlanRI Water Column Monitoring/Small Volume Chemical Data CollectionLower Passaic River Restoration ProjectNew Jersey
Section: Worksheet #15Revision: 2
Date: August 2011Page 14 of 30
QAPP Worksheet #15 (UFP-QAPP Manual Section 2.8.1) Data Quality Levels and Analytical Method Evaluation
J:\Water\ProjectFiles\P120\12182_Passaic\Tasks\CWCM\AECOM QAPP\2011803_Rev2\clean\20110810_CWCM-sv_QAPP_Rev2.docx
Analyte CAS Number PALa Units PAL SourceaProject QLb
(ug/L)
Analytical MethodcAchievable Laboratory
Limitsd,e
MDLs Method QLs EDLs QLs
PCB 136 38411-22-2 64 pg/L [1][2][3][4] 40 NA 200 3.36 40PCB 137 35694-06-5 64 pg/L [1][2][3][4] 40 NA 1000 3.50 40PCB 138 35065-28-2 64 pg/L [1][2][3][4] 40 NA 500 8.91 40PCB 139 56030-56-9 64 pg/L [1][2][3][4] 40 NA 500 4.37 40PCB 140 59291-64-4 64 pg/L [1][2][3][4] 40 NA 500 4.37 40PCB 141 52712-04-6 64 pg/L [1][2][3][4] 40 NA 200 3.77 40PCB 142 41411-61-4 64 pg/L [1][2][3][4] 40 NA 1000 4.40 40PCB 143 68194-15-0 64 pg/L [1][2][3][4] 40 NA 500 10.43 40PCB 144 68194-14-9 64 pg/L [1][2][3][4] 40 NA 500 5.50 40PCB 145 74472-40-5 64 pg/L [1][2][3][4] 40 NA 1000 3.12 40PCB 146 51908-16-8 64 pg/L [1][2][3][4] 40 NA 500 4.91 40PCB 147 68194-13-8 64 pg/L [1][2][3][4] 40 NA 500 4.52 40PCB 148 74472-41-6 64 pg/L [1][2][3][4] 40 NA 1000 5.00 40PCB 149 38380-04-0 64 pg/L [1][2][3][4] 40 NA 1000 4.52 40PCB 150 68194-08-1 64 pg/L [1][2][3][4] 40 NA 1000 3.41 40PCB 151 52663-63-5 64 pg/L [1][2][3][4] 40 NA 500 6.28 40PCB 152 68194-09-2 64 pg/L [1][2][3][4] 40 NA 1000 2.30 40PCB 153 35065-27-1 64 pg/L [1][2][3][4] 40 NA 500 7.11 40PCB 154 60145-22-4 64 pg/L [1][2][3][4] 40 NA 500 4.88 40PCB 155 33979-03-2 64 pg/L [1][2][3][4] 40 NA 1000 3.16 40PCB 156 38380-08-4 167 pg/L [1][3] 40 NA 500 4.48 40PCB 157 69782-90-7 167 pg/L [1][3] 40 NA 500 4.48 40PCB 158 74472-42-7 64 pg/L [1][2][3][4] 40 NA 200 2.46 40

Quality Assurance Project PlanRI Water Column Monitoring/Small Volume Chemical Data CollectionLower Passaic River Restoration ProjectNew Jersey
Section: Worksheet #15Revision: 2
Date: August 2011Page 15 of 30
QAPP Worksheet #15 (UFP-QAPP Manual Section 2.8.1) Data Quality Levels and Analytical Method Evaluation
J:\Water\ProjectFiles\P120\12182_Passaic\Tasks\CWCM\AECOM QAPP\2011803_Rev2\clean\20110810_CWCM-sv_QAPP_Rev2.docx
Analyte CAS Number PALa Units PAL SourceaProject QLb
(ug/L)
Analytical MethodcAchievable Laboratory
Limitsd,e
MDLs Method QLs EDLs QLs
PCB 159 39635-35-3 64 pg/L [1][2][3][4] 40 NA 1000 3.38 40PCB 160 41411-62-5 64 pg/L [1][2][3][4] 40 NA 500 7.22 40PCB 161 74472-43-8 64 pg/L [1][2][3][4] 40 NA 1000 2.62 40PCB 162 39635-34-2 64 pg/L [1][2][3][4] 40 NA 1000 4.07 40PCB 163 74472-44-9 64 pg/L [1][2][3][4] 40 NA 500 8.91 40PCB 164 74472-45-0 64 pg/L [1][2][3][4] 40 NA 500 3.50 40PCB 165 74472-46-1 64 pg/L [1][2][3][4] 40 NA 1000 4.06 40PCB 166 41411-63-6 64 pg/L [1][2][3][4] 40 NA 500 10.78 40PCB 167 52663-72-6 167 pg/L [1][3] 40 NA 500 4.96 40PCB 168 59291-65-5 64 pg/L [1][2][3][4] 40 NA 500 7.11 40PCB 169 32774-16-6 0.167 pg/L [1][3] 40 NA 500 3.63 40PCB 170 35065-30-6 64 pg/L [1][2][3][4] 40 NA 500 2.91 40PCB 171 52663-71-5 64 pg/L [1][2][3][4] 40 NA 1000 7.80 40PCB 172 52663-74-8 64 pg/L [1][2][3][4] 40 NA 1000 3.37 40PCB 173 68194-16-1 64 pg/L [1][2][3][4] 40 NA 1000 7.80 40PCB 174 38411-25-5 64 pg/L [1][2][3][4] 40 NA 500 6.46 40PCB 175 40186-70-7 64 pg/L [1][2][3][4] 40 NA 1000 5.63 40PCB 176 52663-65-7 64 pg/L [1][2][3][4] 40 NA 1000 2.20 40PCB 177 52663-70-4 64 pg/L [1][2][3][4] 40 NA 500 2.24 40PCB 178 52663-67-9 64 pg/L [1][2][3][4] 40 NA 500 2.88 40PCB 179 52663-64-6 64 pg/L [1][2][3][4] 40 NA 500 2.47 40PCB 180 35065-29-3 64 pg/L [1][2][3][4] 40 NA 500 7.77 40PCB 181 74472-47-2 64 pg/L [1][2][3][4] 40 NA 1000 5.44 40

Quality Assurance Project PlanRI Water Column Monitoring/Small Volume Chemical Data CollectionLower Passaic River Restoration ProjectNew Jersey
Section: Worksheet #15Revision: 2
Date: August 2011Page 16 of 30
QAPP Worksheet #15 (UFP-QAPP Manual Section 2.8.1) Data Quality Levels and Analytical Method Evaluation
J:\Water\ProjectFiles\P120\12182_Passaic\Tasks\CWCM\AECOM QAPP\2011803_Rev2\clean\20110810_CWCM-sv_QAPP_Rev2.docx
Analyte CAS Number PALa Units PAL SourceaProject QLb
(ug/L)
Analytical MethodcAchievable Laboratory
Limitsd,e
MDLs Method QLs EDLs QLs
PCB 182 60145-23-5 64 pg/L [1][2][3][4] 40 NA 1000 3.59 40PCB 183 52663-69-1 64 pg/L [1][2][3][4] 40 NA 1000 4.27 40PCB 184 74472-48-3 64 pg/L [1][2][3][4] 40 NA 1000 3.31 40PCB 185 52712-05-7 64 pg/L [1][2][3][4] 40 NA 1000 4.27 40PCB 186 74472-49-4 64 pg/L [1][2][3][4] 40 NA 1000 4.18 40PCB 187 52663-68-0 64 pg/L [1][2][3][4] 40 NA 500 4.50 40PCB 188 74487-85-7 64 pg/L [1][2][3][4] 40 NA 500 4.32 40PCB 189 39635-31-9 167 pg/L [1][3] 40 NA 500 2.80 40PCB 190 41411-64-7 64 pg/L [1][2][3][4] 40 NA 500 2.46 40PCB 191 74472-50-7 64 pg/L [1][2][3][4] 40 NA 1000 3.13 40PCB 192 74472-51-8 64 pg/L [1][2][3][4] 40 NA 1000 3.67 40PCB 193 69782-91-8 64 pg/L [1][2][3][4] 40 NA 500 7.77 40PCB 194 35694-08-7 64 pg/L [1][2][3][4] 40 NA 500 4.98 40PCB 195 52663-78-2 64 pg/L [1][2][3][4] 40 NA 1000 6.21 40PCB 196 42740-50-1 64 pg/L [1][2][3][4] 40 NA 1000 6.18 40PCB 197 33091-17-7 64 pg/L [1][2][3][4] 40 NA 1000 5.59 40PCB 198 68194-17-2 64 pg/L [1][2][3][4] 40 NA 500 12.97 40PCB 199 52663-75-9 64 pg/L [1][2][3][4] 40 NA 500 12.97 40PCB 200 52663-73-7 64 pg/L [1][2][3][4] 40 NA 1000 5.59 40PCB 201 40186-71-8 64 pg/L [1][2][3][4] 40 NA 1000 4.29 40PCB 202 2136-99-4 64 pg/L [1][2][3][4] 40 NA 1000 3.91 40PCB 203 52663-76-0 64 pg/L [1][2][3][4] 40 NA 1000 4.91 40PCB 204 74472-52-9 64 pg/L [1][2][3][4] 40 NA 1000 3.06 40
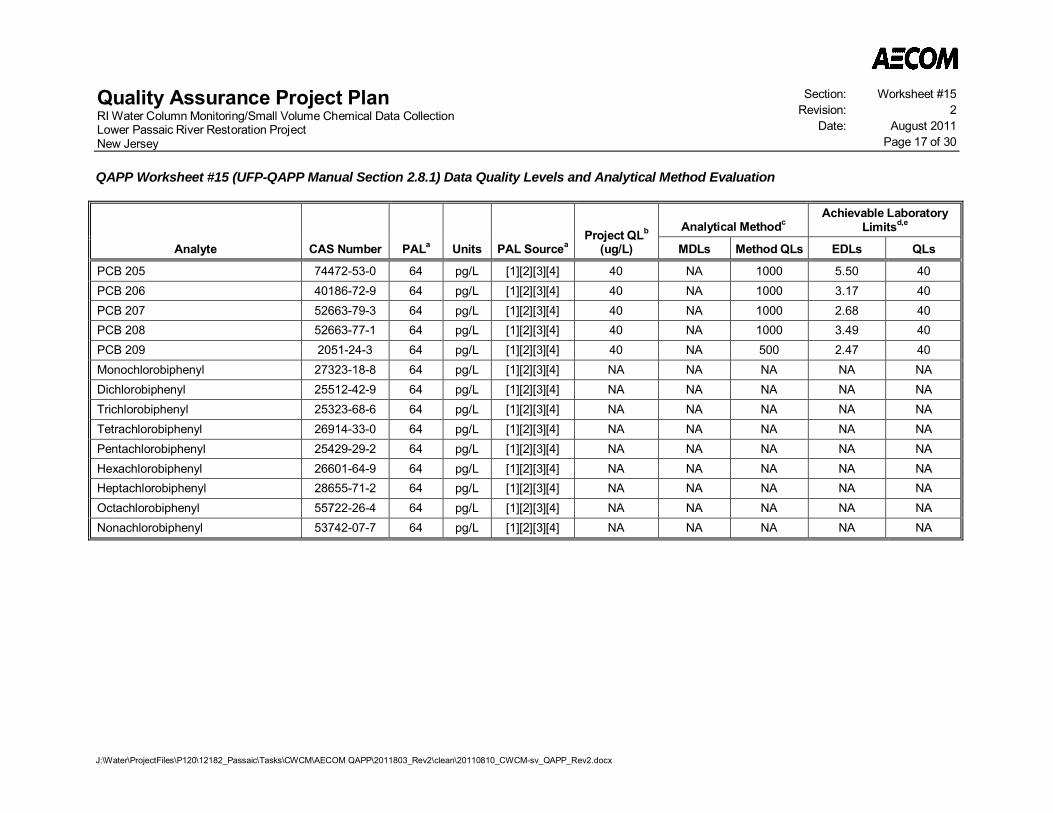
Quality Assurance Project PlanRI Water Column Monitoring/Small Volume Chemical Data CollectionLower Passaic River Restoration ProjectNew Jersey
Section: Worksheet #15Revision: 2
Date: August 2011Page 17 of 30
QAPP Worksheet #15 (UFP-QAPP Manual Section 2.8.1) Data Quality Levels and Analytical Method Evaluation
J:\Water\ProjectFiles\P120\12182_Passaic\Tasks\CWCM\AECOM QAPP\2011803_Rev2\clean\20110810_CWCM-sv_QAPP_Rev2.docx
Analyte CAS Number PALa Units PAL SourceaProject QLb
(ug/L)
Analytical MethodcAchievable Laboratory
Limitsd,e
MDLs Method QLs EDLs QLs
PCB 205 74472-53-0 64 pg/L [1][2][3][4] 40 NA 1000 5.50 40PCB 206 40186-72-9 64 pg/L [1][2][3][4] 40 NA 1000 3.17 40PCB 207 52663-79-3 64 pg/L [1][2][3][4] 40 NA 1000 2.68 40PCB 208 52663-77-1 64 pg/L [1][2][3][4] 40 NA 1000 3.49 40PCB 209 2051-24-3 64 pg/L [1][2][3][4] 40 NA 500 2.47 40Monochlorobiphenyl 27323-18-8 64 pg/L [1][2][3][4] NA NA NA NA NADichlorobiphenyl 25512-42-9 64 pg/L [1][2][3][4] NA NA NA NA NATrichlorobiphenyl 25323-68-6 64 pg/L [1][2][3][4] NA NA NA NA NATetrachlorobiphenyl 26914-33-0 64 pg/L [1][2][3][4] NA NA NA NA NAPentachlorobiphenyl 25429-29-2 64 pg/L [1][2][3][4] NA NA NA NA NAHexachlorobiphenyl 26601-64-9 64 pg/L [1][2][3][4] NA NA NA NA NAHeptachlorobiphenyl 28655-71-2 64 pg/L [1][2][3][4] NA NA NA NA NAOctachlorobiphenyl 55722-26-4 64 pg/L [1][2][3][4] NA NA NA NA NANonachlorobiphenyl 53742-07-7 64 pg/L [1][2][3][4] NA NA NA NA NA
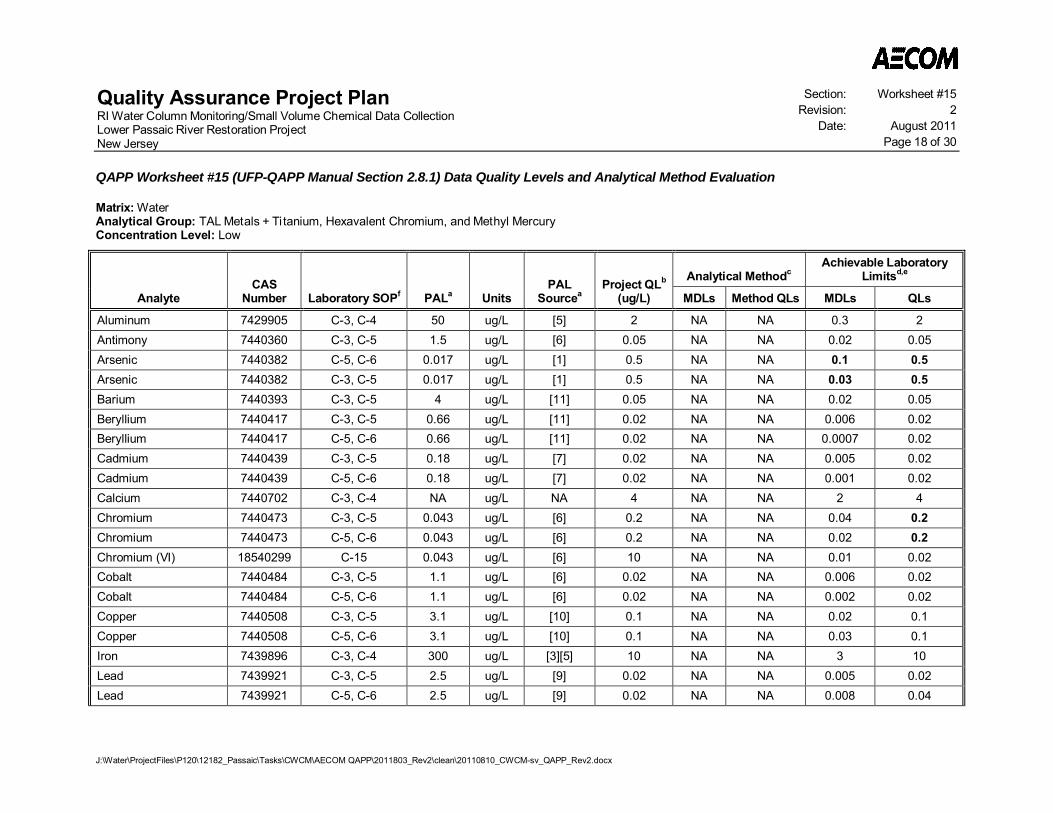
Quality Assurance Project PlanRI Water Column Monitoring/Small Volume Chemical Data CollectionLower Passaic River Restoration ProjectNew Jersey
Section: Worksheet #15Revision: 2
Date: August 2011Page 18 of 30
QAPP Worksheet #15 (UFP-QAPP Manual Section 2.8.1) Data Quality Levels and Analytical Method Evaluation
J:\Water\ProjectFiles\P120\12182_Passaic\Tasks\CWCM\AECOM QAPP\2011803_Rev2\clean\20110810_CWCM-sv_QAPP_Rev2.docx
Matrix: WaterAnalytical Group: TAL Metals + Ti tanium, Hexavalent Chromium, and Methyl MercuryConcentration Level: Low
AnalyteCAS
Number Laboratory SOPf PALa UnitsPAL
SourceaProject QLb
(ug/L)
Analytical MethodcAchievable Laboratory
Limitsd,e
MDLs Method QLs MDLs QLs
Aluminum 7429905 C-3, C-4 50 ug/L [5] 2 NA NA 0.3 2Antimony 7440360 C-3, C-5 1.5 ug/L [6] 0.05 NA NA 0.02 0.05Arsenic 7440382 C-5, C-6 0.017 ug/L [1] 0.5 NA NA 0.1 0.5Arsenic 7440382 C-3, C-5 0.017 ug/L [1] 0.5 NA NA 0.03 0.5Barium 7440393 C-3, C-5 4 ug/L [11] 0.05 NA NA 0.02 0.05Beryllium 7440417 C-3, C-5 0.66 ug/L [11] 0.02 NA NA 0.006 0.02Beryllium 7440417 C-5, C-6 0.66 ug/L [11] 0.02 NA NA 0.0007 0.02Cadmium 7440439 C-3, C-5 0.18 ug/L [7] 0.02 NA NA 0.005 0.02Cadmium 7440439 C-5, C-6 0.18 ug/L [7] 0.02 NA NA 0.001 0.02Calcium 7440702 C-3, C-4 NA ug/L NA 4 NA NA 2 4Chromium 7440473 C-3, C-5 0.043 ug/L [6] 0.2 NA NA 0.04 0.2Chromium 7440473 C-5, C-6 0.043 ug/L [6] 0.2 NA NA 0.02 0.2Chromium (VI) 18540299 C-15 0.043 ug/L [6] 10 NA NA 0.01 0.02Cobalt 7440484 C-3, C-5 1.1 ug/L [6] 0.02 NA NA 0.006 0.02Cobalt 7440484 C-5, C-6 1.1 ug/L [6] 0.02 NA NA 0.002 0.02Copper 7440508 C-3, C-5 3.1 ug/L [10] 0.1 NA NA 0.02 0.1Copper 7440508 C-5, C-6 3.1 ug/L [10] 0.1 NA NA 0.03 0.1Iron 7439896 C-3, C-4 300 ug/L [3][5] 10 NA NA 3 10Lead 7439921 C-3, C-5 2.5 ug/L [9] 0.02 NA NA 0.005 0.02Lead 7439921 C-5, C-6 2.5 ug/L [9] 0.02 NA NA 0.008 0.04
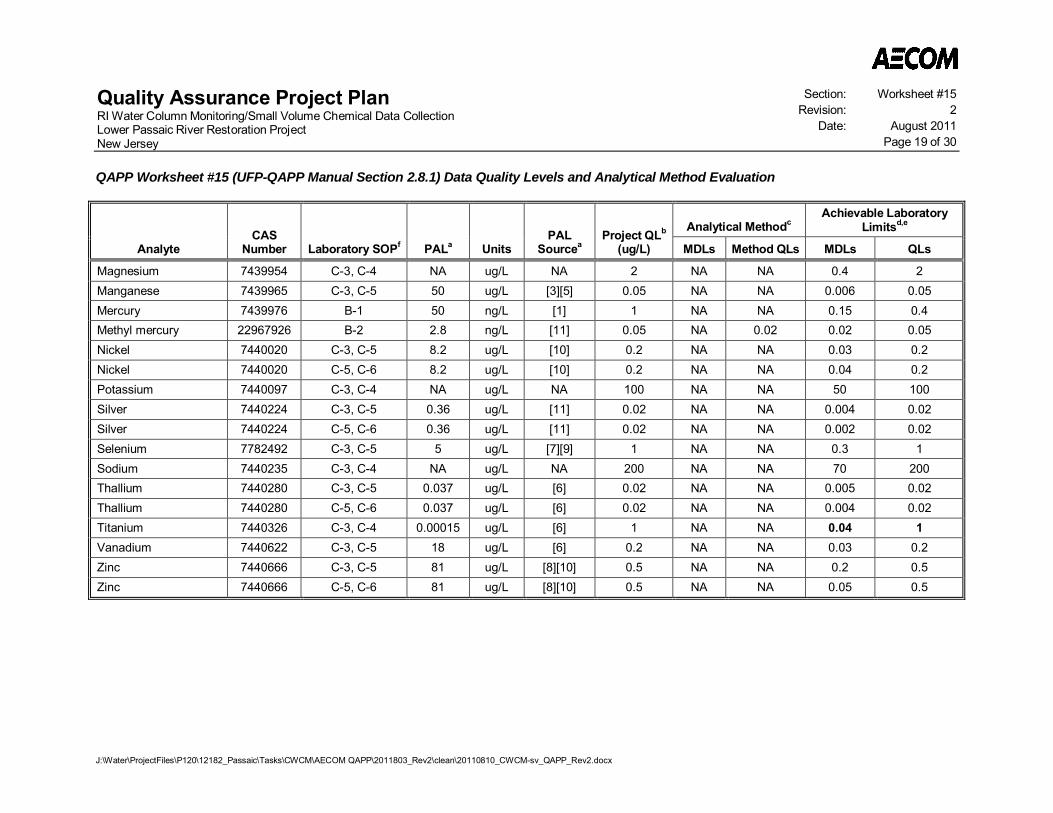
Quality Assurance Project PlanRI Water Column Monitoring/Small Volume Chemical Data CollectionLower Passaic River Restoration ProjectNew Jersey
Section: Worksheet #15Revision: 2
Date: August 2011Page 19 of 30
QAPP Worksheet #15 (UFP-QAPP Manual Section 2.8.1) Data Quality Levels and Analytical Method Evaluation
J:\Water\ProjectFiles\P120\12182_Passaic\Tasks\CWCM\AECOM QAPP\2011803_Rev2\clean\20110810_CWCM-sv_QAPP_Rev2.docx
AnalyteCAS
Number Laboratory SOPf PALa UnitsPAL
SourceaProject QLb
(ug/L)
Analytical MethodcAchievable Laboratory
Limitsd,e
MDLs Method QLs MDLs QLs
Magnesium 7439954 C-3, C-4 NA ug/L NA 2 NA NA 0.4 2Manganese 7439965 C-3, C-5 50 ug/L [3][5] 0.05 NA NA 0.006 0.05Mercury 7439976 B-1 50 ng/L [1] 1 NA NA 0.15 0.4Methyl mercury 22967926 B-2 2.8 ng/L [11] 0.05 NA 0.02 0.02 0.05Nickel 7440020 C-3, C-5 8.2 ug/L [10] 0.2 NA NA 0.03 0.2Nickel 7440020 C-5, C-6 8.2 ug/L [10] 0.2 NA NA 0.04 0.2Potassium 7440097 C-3, C-4 NA ug/L NA 100 NA NA 50 100Silver 7440224 C-3, C-5 0.36 ug/L [11] 0.02 NA NA 0.004 0.02Silver 7440224 C-5, C-6 0.36 ug/L [11] 0.02 NA NA 0.002 0.02Selenium 7782492 C-3, C-5 5 ug/L [7][9] 1 NA NA 0.3 1Sodium 7440235 C-3, C-4 NA ug/L NA 200 NA NA 70 200Thallium 7440280 C-3, C-5 0.037 ug/L [6] 0.02 NA NA 0.005 0.02Thallium 7440280 C-5, C-6 0.037 ug/L [6] 0.02 NA NA 0.004 0.02Titanium 7440326 C-3, C-4 0.00015 ug/L [6] 1 NA NA 0.04 1Vanadium 7440622 C-3, C-5 18 ug/L [6] 0.2 NA NA 0.03 0.2Zinc 7440666 C-3, C-5 81 ug/L [8][10] 0.5 NA NA 0.2 0.5Zinc 7440666 C-5, C-6 81 ug/L [8][10] 0.5 NA NA 0.05 0.5
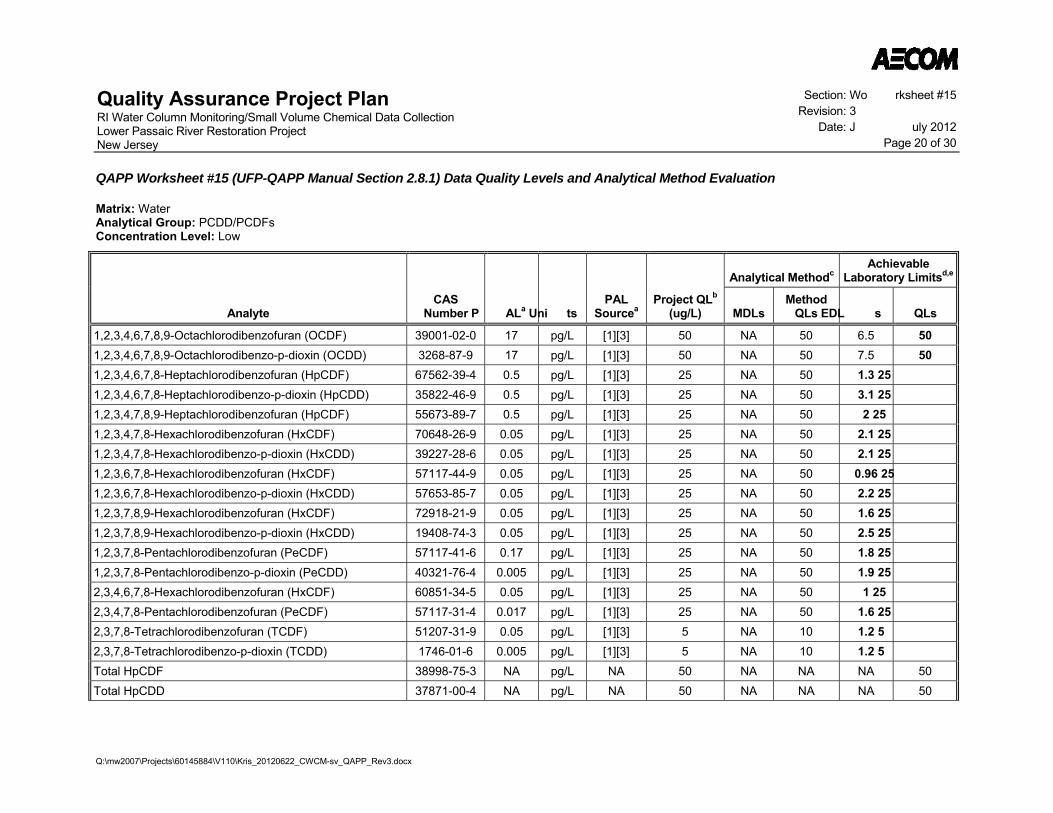
Quality Assurance Project Plan RI Water Column Monitoring/Small Volume Chemical Data Collection Lower Passaic River Restoration Project New Jersey
Section: Wo rksheet #15 Revision: 3
Date: J uly 2012 Page 20 of 30
QAPP Worksheet #15 (UFP-QAPP Manual Section 2.8.1) Data Quality Levels and Analytical Method Evaluation
Q:\mw2007\Projects\60145884\V110\Kris_20120622_CWCM-sv_QAPP_Rev3.docx
Matrix: Water Analytical Group: PCDD/PCDFs Concentration Level: Low
Analyte CAS
Number P ALa Uni ts PAL
Sourcea Project QLb
(ug/L)
Analytical MethodcAchievable
Laboratory Limitsd,e
MDLs Method
QLs EDL s QLs
1,2,3,4,6,7,8,9-Octachlorodibenzofuran (OCDF) 39001-02-0 17 pg/L [1][3] 50 NA 50 6.5 50 1,2,3,4,6,7,8,9-Octachlorodibenzo-p-dioxin (OCDD) 3268-87-9 17 pg/L [1][3] 50 NA 50 7.5 50 1,2,3,4,6,7,8-Heptachlorodibenzofuran (HpCDF) 67562-39-4 0.5 pg/L [1][3] 25 NA 50 1.3 25 1,2,3,4,6,7,8-Heptachlorodibenzo-p-dioxin (HpCDD) 35822-46-9 0.5 pg/L [1][3] 25 NA 50 3.1 25 1,2,3,4,7,8,9-Heptachlorodibenzofuran (HpCDF) 55673-89-7 0.5 pg/L [1][3] 25 NA 50 2 25 1,2,3,4,7,8-Hexachlorodibenzofuran (HxCDF) 70648-26-9 0.05 pg/L [1][3] 25 NA 50 2.1 25 1,2,3,4,7,8-Hexachlorodibenzo-p-dioxin (HxCDD) 39227-28-6 0.05 pg/L [1][3] 25 NA 50 2.1 25 1,2,3,6,7,8-Hexachlorodibenzofuran (HxCDF) 57117-44-9 0.05 pg/L [1][3] 25 NA 50 0.96 25 1,2,3,6,7,8-Hexachlorodibenzo-p-dioxin (HxCDD) 57653-85-7 0.05 pg/L [1][3] 25 NA 50 2.2 25 1,2,3,7,8,9-Hexachlorodibenzofuran (HxCDF) 72918-21-9 0.05 pg/L [1][3] 25 NA 50 1.6 25 1,2,3,7,8,9-Hexachlorodibenzo-p-dioxin (HxCDD) 19408-74-3 0.05 pg/L [1][3] 25 NA 50 2.5 25 1,2,3,7,8-Pentachlorodibenzofuran (PeCDF) 57117-41-6 0.17 pg/L [1][3] 25 NA 50 1.8 25 1,2,3,7,8-Pentachlorodibenzo-p-dioxin (PeCDD) 40321-76-4 0.005 pg/L [1][3] 25 NA 50 1.9 25 2,3,4,6,7,8-Hexachlorodibenzofuran (HxCDF) 60851-34-5 0.05 pg/L [1][3] 25 NA 50 1 25 2,3,4,7,8-Pentachlorodibenzofuran (PeCDF) 57117-31-4 0.017 pg/L [1][3] 25 NA 50 1.6 25 2,3,7,8-Tetrachlorodibenzofuran (TCDF) 51207-31-9 0.05 pg/L [1][3] 5 NA 10 1.2 5 2,3,7,8-Tetrachlorodibenzo-p-dioxin (TCDD) 1746-01-6 0.005 pg/L [1][3] 5 NA 10 1.2 5 Total HpCDF 38998-75-3 NA pg/L NA 50 NA NA NA 50 Total HpCDD 37871-00-4 NA pg/L NA 50 NA NA NA 50
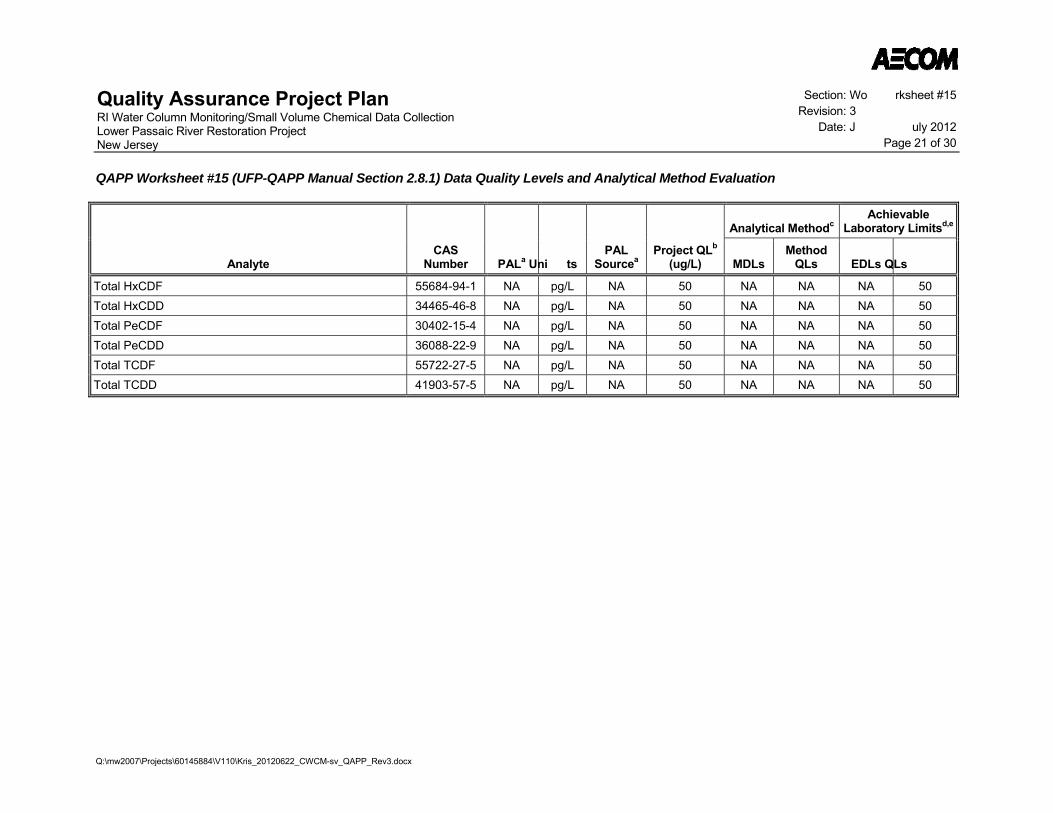
Quality Assurance Project Plan RI Water Column Monitoring/Small Volume Chemical Data Collection Lower Passaic River Restoration Project New Jersey
Section: Wo rksheet #15 Revision: 3
Date: J uly 2012 Page 21 of 30
QAPP Worksheet #15 (UFP-QAPP Manual Section 2.8.1) Data Quality Levels and Analytical Method Evaluation
Q:\mw2007\Projects\60145884\V110\Kris_20120622_CWCM-sv_QAPP_Rev3.docx
Analyte CAS
Number PALa Uni ts PAL
Sourcea Project QLb
(ug/L)
Analytical MethodcAchievable
Laboratory Limitsd,e
MDLs Method
QLs EDLs QLs
Total HxCDF 55684-94-1 NA pg/L NA 50 NA NA NA 50 Total HxCDD 34465-46-8 NA pg/L NA 50 NA NA NA 50 Total PeCDF 30402-15-4 NA pg/L NA 50 NA NA NA 50 Total PeCDD 36088-22-9 NA pg/L NA 50 NA NA NA 50 Total TCDF 55722-27-5 NA pg/L NA 50 NA NA NA 50 Total TCDD 41903-57-5 NA pg/L NA 50 NA NA NA 50
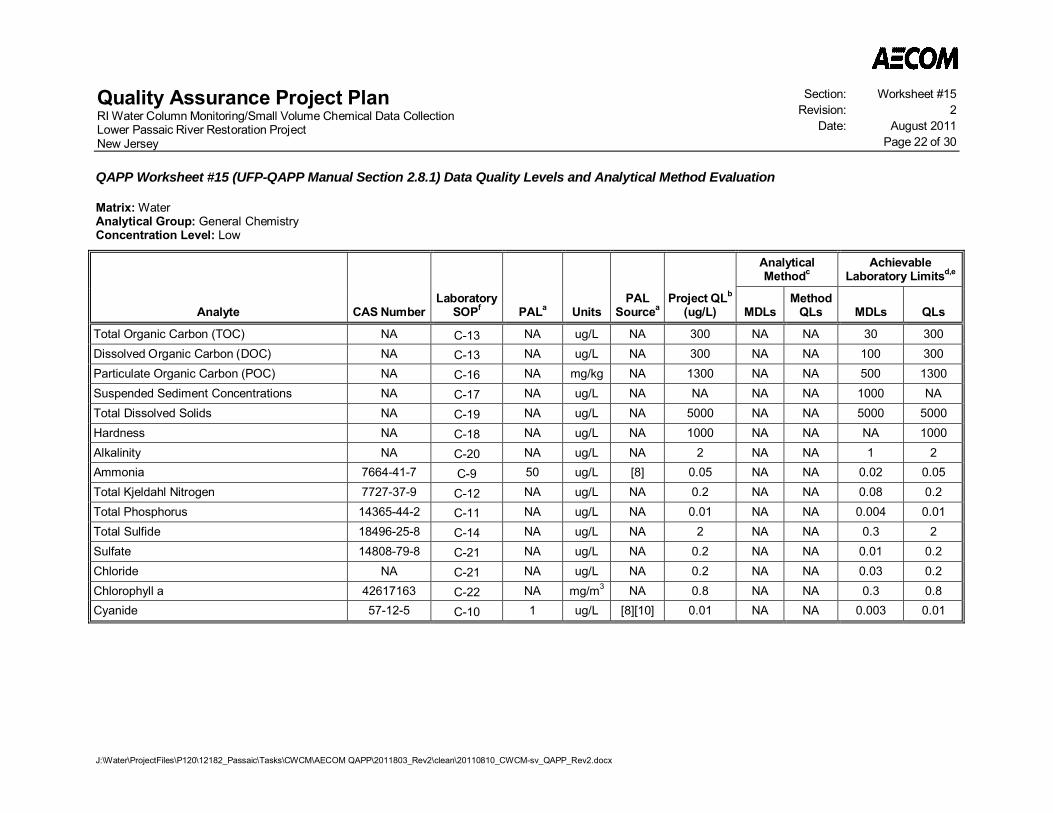
Quality Assurance Project PlanRI Water Column Monitoring/Small Volume Chemical Data CollectionLower Passaic River Restoration ProjectNew Jersey
Section: Worksheet #15Revision: 2
Date: August 2011Page 22 of 30
QAPP Worksheet #15 (UFP-QAPP Manual Section 2.8.1) Data Quality Levels and Analytical Method Evaluation
J:\Water\ProjectFiles\P120\12182_Passaic\Tasks\CWCM\AECOM QAPP\2011803_Rev2\clean\20110810_CWCM-sv_QAPP_Rev2.docx
Matrix: WaterAnalytical Group: General ChemistryConcentration Level: Low
Analyte CAS NumberLaboratory
SOPf PALa UnitsPAL
SourceaProject QLb
(ug/L)
AnalyticalMethodc
AchievableLaboratory Limitsd,e
MDLsMethod
QLs MDLs QLs
Total Organic Carbon (TOC) NA C-13 NA ug/L NA 300 NA NA 30 300Dissolved Organic Carbon (DOC) NA C-13 NA ug/L NA 300 NA NA 100 300Particulate Organic Carbon (POC) NA C-16 NA mg/kg NA 1300 NA NA 500 1300Suspended Sediment Concentrations NA C-17 NA ug/L NA NA NA NA 1000 NATotal Dissolved Solids NA C-19 NA ug/L NA 5000 NA NA 5000 5000Hardness NA C-18 NA ug/L NA 1000 NA NA NA 1000Alkalinity NA C-20 NA ug/L NA 2 NA NA 1 2Ammonia 7664-41-7 C-9 50 ug/L [8] 0.05 NA NA 0.02 0.05Total Kjeldahl Nitrogen 7727-37-9 C-12 NA ug/L NA 0.2 NA NA 0.08 0.2Total Phosphorus 14365-44-2 C-11 NA ug/L NA 0.01 NA NA 0.004 0.01Total Sulfide 18496-25-8 C-14 NA ug/L NA 2 NA NA 0.3 2Sulfate 14808-79-8 C-21 NA ug/L NA 0.2 NA NA 0.01 0.2Chloride NA C-21 NA ug/L NA 0.2 NA NA 0.03 0.2Chlorophyll a 42617163 C-22 NA mg/m3 NA 0.8 NA NA 0.3 0.8Cyanide 57-12-5 C-10 1 ug/L [8][10] 0.01 NA NA 0.003 0.01
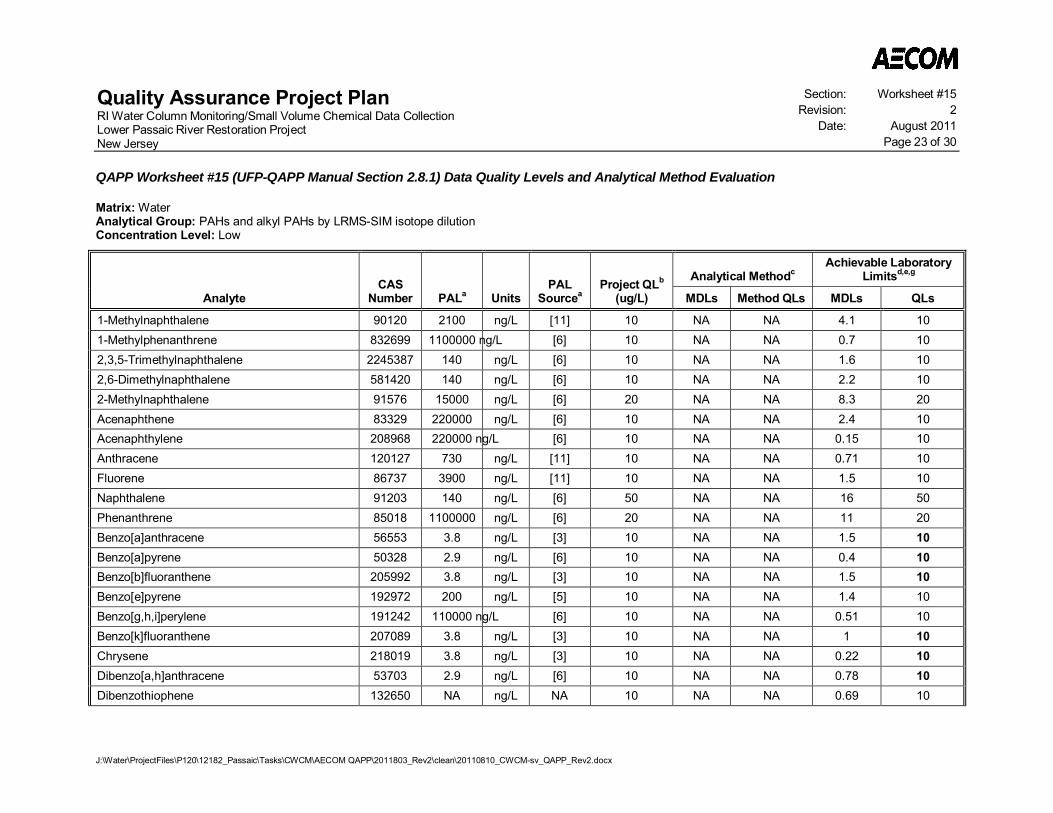
Quality Assurance Project PlanRI Water Column Monitoring/Small Volume Chemical Data CollectionLower Passaic River Restoration ProjectNew Jersey
Section: Worksheet #15Revision: 2
Date: August 2011Page 23 of 30
QAPP Worksheet #15 (UFP-QAPP Manual Section 2.8.1) Data Quality Levels and Analytical Method Evaluation
J:\Water\ProjectFiles\P120\12182_Passaic\Tasks\CWCM\AECOM QAPP\2011803_Rev2\clean\20110810_CWCM-sv_QAPP_Rev2.docx
Matrix: WaterAnalytical Group: PAHs and alkyl PAHs by LRMS-SIM isotope dilutionConcentration Level: Low
AnalyteCAS
Number PALa UnitsPAL
SourceaProject QLb
(ug/L)
Analytical MethodcAchievable Laboratory
Limitsd,e,g
MDLs Method QLs MDLs QLs
1-Methylnaphthalene 90120 2100 ng/L [11] 10 NA NA 4.1 101-Methylphenanthrene 832699 1100000 ng/L [6] 10 NA NA 0.7 102,3,5-Trimethylnaphthalene 2245387 140 ng/L [6] 10 NA NA 1.6 102,6-Dimethylnaphthalene 581420 140 ng/L [6] 10 NA NA 2.2 102-Methylnaphthalene 91576 15000 ng/L [6] 20 NA NA 8.3 20Acenaphthene 83329 220000 ng/L [6] 10 NA NA 2.4 10Acenaphthylene 208968 220000 ng/L [6] 10 NA NA 0.15 10Anthracene 120127 730 ng/L [11] 10 NA NA 0.71 10Fluorene 86737 3900 ng/L [11] 10 NA NA 1.5 10Naphthalene 91203 140 ng/L [6] 50 NA NA 16 50Phenanthrene 85018 1100000 ng/L [6] 20 NA NA 11 20Benzo[a]anthracene 56553 3.8 ng/L [3] 10 NA NA 1.5 10Benzo[a]pyrene 50328 2.9 ng/L [6] 10 NA NA 0.4 10Benzo[b]fluoranthene 205992 3.8 ng/L [3] 10 NA NA 1.5 10Benzo[e]pyrene 192972 200 ng/L [5] 10 NA NA 1.4 10Benzo[g,h,i]perylene 191242 110000 ng/L [6] 10 NA NA 0.51 10Benzo[k]fluoranthene 207089 3.8 ng/L [3] 10 NA NA 1 10Chrysene 218019 3.8 ng/L [3] 10 NA NA 0.22 10Dibenzo[a,h]anthracene 53703 2.9 ng/L [6] 10 NA NA 0.78 10Dibenzothiophene 132650 NA ng/L NA 10 NA NA 0.69 10
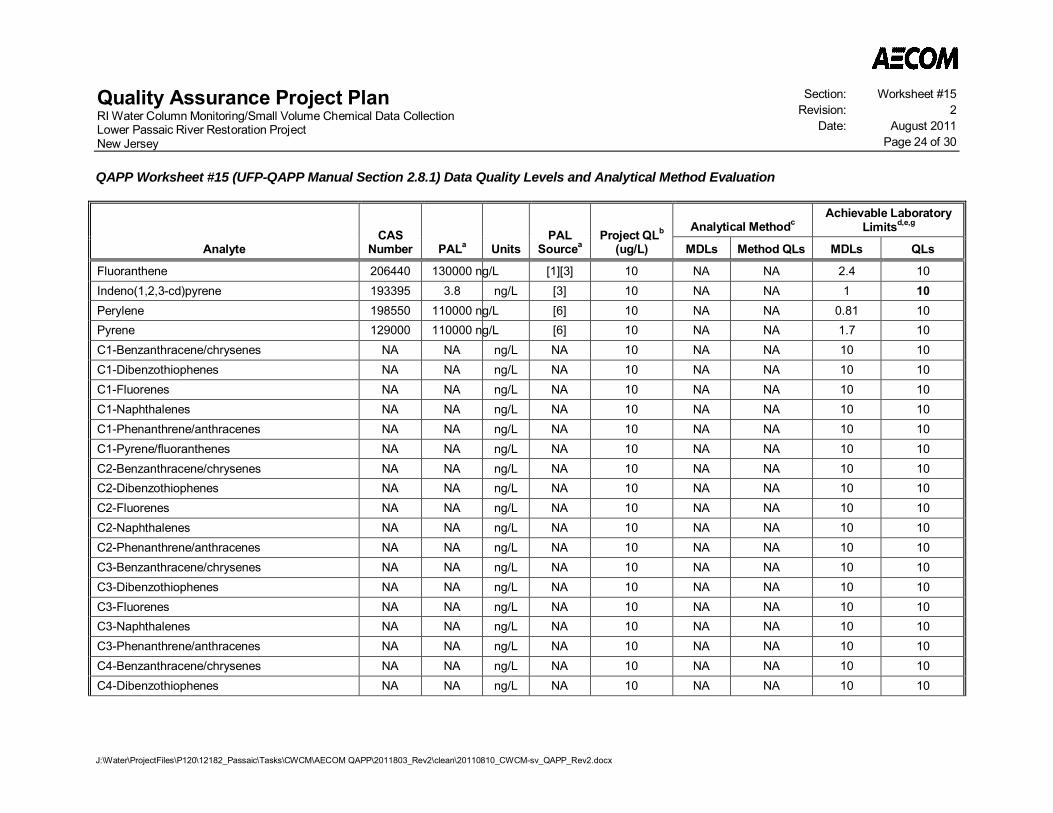
Quality Assurance Project PlanRI Water Column Monitoring/Small Volume Chemical Data CollectionLower Passaic River Restoration ProjectNew Jersey
Section: Worksheet #15Revision: 2
Date: August 2011Page 24 of 30
QAPP Worksheet #15 (UFP-QAPP Manual Section 2.8.1) Data Quality Levels and Analytical Method Evaluation
J:\Water\ProjectFiles\P120\12182_Passaic\Tasks\CWCM\AECOM QAPP\2011803_Rev2\clean\20110810_CWCM-sv_QAPP_Rev2.docx
AnalyteCAS
Number PALa UnitsPAL
SourceaProject QLb
(ug/L)
Analytical MethodcAchievable Laboratory
Limitsd,e,g
MDLs Method QLs MDLs QLs
Fluoranthene 206440 130000 ng/L [1][3] 10 NA NA 2.4 10Indeno(1,2,3-cd)pyrene 193395 3.8 ng/L [3] 10 NA NA 1 10Perylene 198550 110000 ng/L [6] 10 NA NA 0.81 10Pyrene 129000 110000 ng/L [6] 10 NA NA 1.7 10C1-Benzanthracene/chrysenes NA NA ng/L NA 10 NA NA 10 10C1-Dibenzothiophenes NA NA ng/L NA 10 NA NA 10 10C1-Fluorenes NA NA ng/L NA 10 NA NA 10 10C1-Naphthalenes NA NA ng/L NA 10 NA NA 10 10C1-Phenanthrene/anthracenes NA NA ng/L NA 10 NA NA 10 10C1-Pyrene/fluoranthenes NA NA ng/L NA 10 NA NA 10 10C2-Benzanthracene/chrysenes NA NA ng/L NA 10 NA NA 10 10C2-Dibenzothiophenes NA NA ng/L NA 10 NA NA 10 10C2-Fluorenes NA NA ng/L NA 10 NA NA 10 10C2-Naphthalenes NA NA ng/L NA 10 NA NA 10 10C2-Phenanthrene/anthracenes NA NA ng/L NA 10 NA NA 10 10C3-Benzanthracene/chrysenes NA NA ng/L NA 10 NA NA 10 10C3-Dibenzothiophenes NA NA ng/L NA 10 NA NA 10 10C3-Fluorenes NA NA ng/L NA 10 NA NA 10 10C3-Naphthalenes NA NA ng/L NA 10 NA NA 10 10C3-Phenanthrene/anthracenes NA NA ng/L NA 10 NA NA 10 10C4-Benzanthracene/chrysenes NA NA ng/L NA 10 NA NA 10 10C4-Dibenzothiophenes NA NA ng/L NA 10 NA NA 10 10
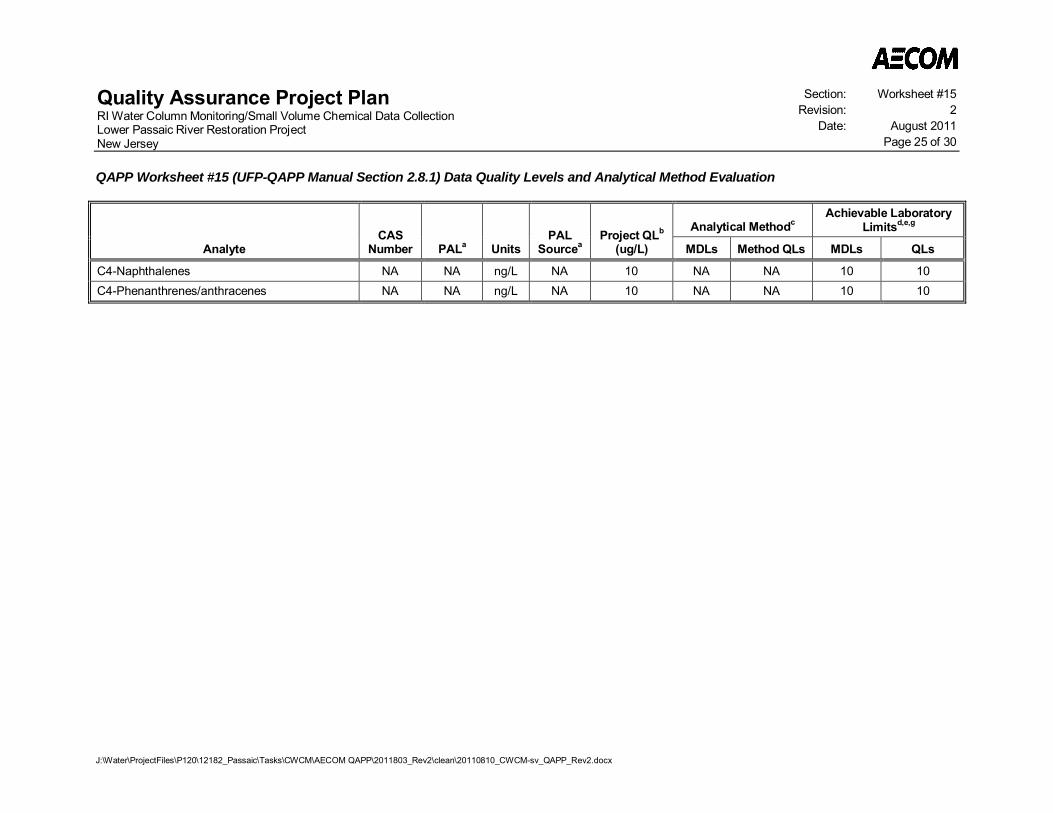
Quality Assurance Project PlanRI Water Column Monitoring/Small Volume Chemical Data CollectionLower Passaic River Restoration ProjectNew Jersey
Section: Worksheet #15Revision: 2
Date: August 2011Page 25 of 30
QAPP Worksheet #15 (UFP-QAPP Manual Section 2.8.1) Data Quality Levels and Analytical Method Evaluation
J:\Water\ProjectFiles\P120\12182_Passaic\Tasks\CWCM\AECOM QAPP\2011803_Rev2\clean\20110810_CWCM-sv_QAPP_Rev2.docx
AnalyteCAS
Number PALa UnitsPAL
SourceaProject QLb
(ug/L)
Analytical MethodcAchievable Laboratory
Limitsd,e,g
MDLs Method QLs MDLs QLs
C4-Naphthalenes NA NA ng/L NA 10 NA NA 10 10C4-Phenanthrenes/anthracenes NA NA ng/L NA 10 NA NA 10 10
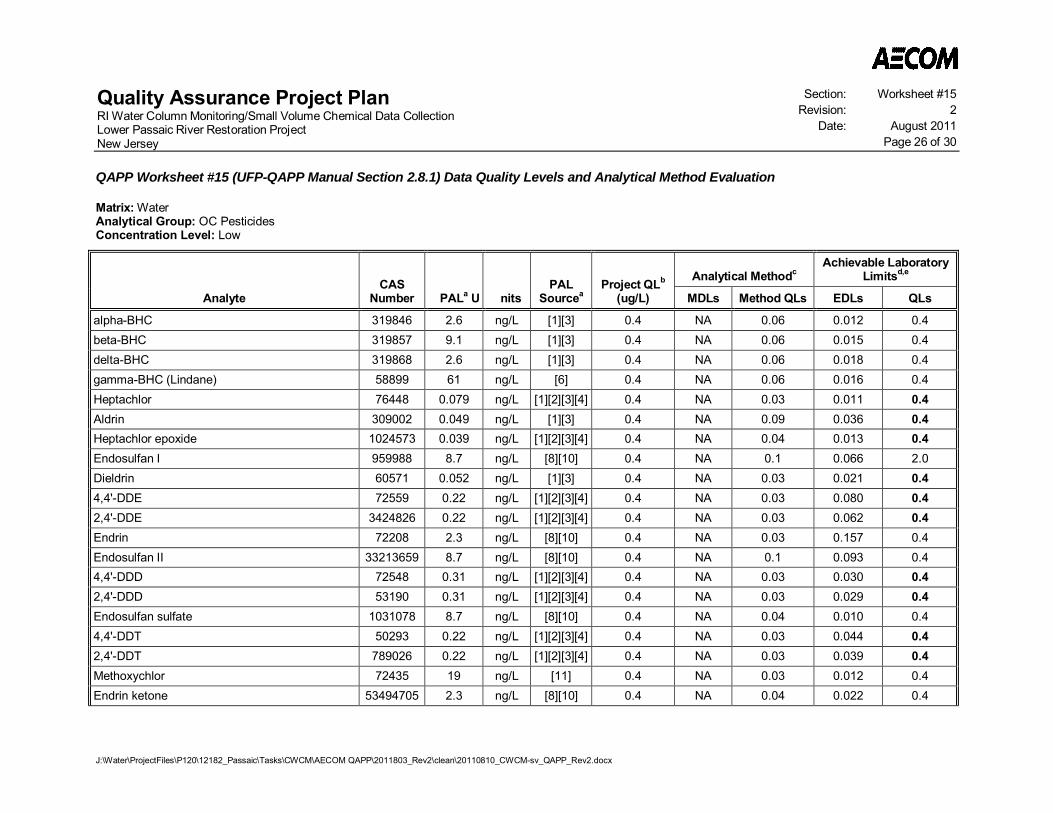
Quality Assurance Project PlanRI Water Column Monitoring/Small Volume Chemical Data CollectionLower Passaic River Restoration ProjectNew Jersey
Section: Worksheet #15Revision: 2
Date: August 2011Page 26 of 30
QAPP Worksheet #15 (UFP-QAPP Manual Section 2.8.1) Data Quality Levels and Analytical Method Evaluation
J:\Water\ProjectFiles\P120\12182_Passaic\Tasks\CWCM\AECOM QAPP\2011803_Rev2\clean\20110810_CWCM-sv_QAPP_Rev2.docx
Matrix: WaterAnalytical Group: OC PesticidesConcentration Level: Low
AnalyteCAS
Number PALa U nitsPAL
SourceaProject QLb
(ug/L)
Analytical MethodcAchievable Laboratory
Limitsd,e
MDLs Method QLs EDLs QLs
alpha-BHC 319846 2.6 ng/L [1][3] 0.4 NA 0.06 0.012 0.4beta-BHC 319857 9.1 ng/L [1][3] 0.4 NA 0.06 0.015 0.4delta-BHC 319868 2.6 ng/L [1][3] 0.4 NA 0.06 0.018 0.4gamma-BHC (Lindane) 58899 61 ng/L [6] 0.4 NA 0.06 0.016 0.4Heptachlor 76448 0.079 ng/L [1][2][3][4] 0.4 NA 0.03 0.011 0.4Aldrin 309002 0.049 ng/L [1][3] 0.4 NA 0.09 0.036 0.4Heptachlor epoxide 1024573 0.039 ng/L [1][2][3][4] 0.4 NA 0.04 0.013 0.4Endosulfan I 959988 8.7 ng/L [8][10] 0.4 NA 0.1 0.066 2.0Dieldrin 60571 0.052 ng/L [1][3] 0.4 NA 0.03 0.021 0.44,4'-DDE 72559 0.22 ng/L [1][2][3][4] 0.4 NA 0.03 0.080 0.42,4'-DDE 3424826 0.22 ng/L [1][2][3][4] 0.4 NA 0.03 0.062 0.4Endrin 72208 2.3 ng/L [8][10] 0.4 NA 0.03 0.157 0.4Endosulfan II 33213659 8.7 ng/L [8][10] 0.4 NA 0.1 0.093 0.44,4'-DDD 72548 0.31 ng/L [1][2][3][4] 0.4 NA 0.03 0.030 0.42,4'-DDD 53190 0.31 ng/L [1][2][3][4] 0.4 NA 0.03 0.029 0.4Endosulfan sulfate 1031078 8.7 ng/L [8][10] 0.4 NA 0.04 0.010 0.44,4'-DDT 50293 0.22 ng/L [1][2][3][4] 0.4 NA 0.03 0.044 0.42,4'-DDT 789026 0.22 ng/L [1][2][3][4] 0.4 NA 0.03 0.039 0.4Methoxychlor 72435 19 ng/L [11] 0.4 NA 0.03 0.012 0.4Endrin ketone 53494705 2.3 ng/L [8][10] 0.4 NA 0.04 0.022 0.4
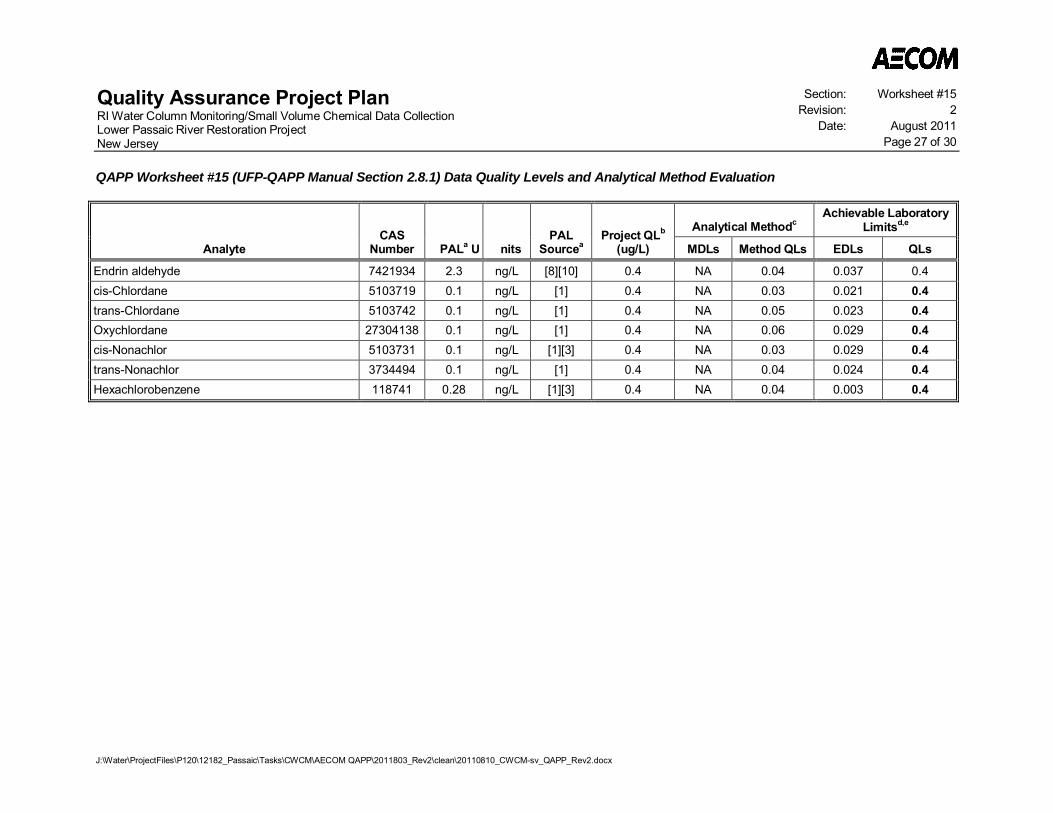
Quality Assurance Project PlanRI Water Column Monitoring/Small Volume Chemical Data CollectionLower Passaic River Restoration ProjectNew Jersey
Section: Worksheet #15Revision: 2
Date: August 2011Page 27 of 30
QAPP Worksheet #15 (UFP-QAPP Manual Section 2.8.1) Data Quality Levels and Analytical Method Evaluation
J:\Water\ProjectFiles\P120\12182_Passaic\Tasks\CWCM\AECOM QAPP\2011803_Rev2\clean\20110810_CWCM-sv_QAPP_Rev2.docx
AnalyteCAS
Number PALa U nitsPAL
SourceaProject QLb
(ug/L)
Analytical MethodcAchievable Laboratory
Limitsd,e
MDLs Method QLs EDLs QLs
Endrin aldehyde 7421934 2.3 ng/L [8][10] 0.4 NA 0.04 0.037 0.4cis-Chlordane 5103719 0.1 ng/L [1] 0.4 NA 0.03 0.021 0.4trans-Chlordane 5103742 0.1 ng/L [1] 0.4 NA 0.05 0.023 0.4Oxychlordane 27304138 0.1 ng/L [1] 0.4 NA 0.06 0.029 0.4cis-Nonachlor 5103731 0.1 ng/L [1][3] 0.4 NA 0.03 0.029 0.4trans-Nonachlor 3734494 0.1 ng/L [1] 0.4 NA 0.04 0.024 0.4Hexachlorobenzene 118741 0.28 ng/L [1][3] 0.4 NA 0.04 0.003 0.4
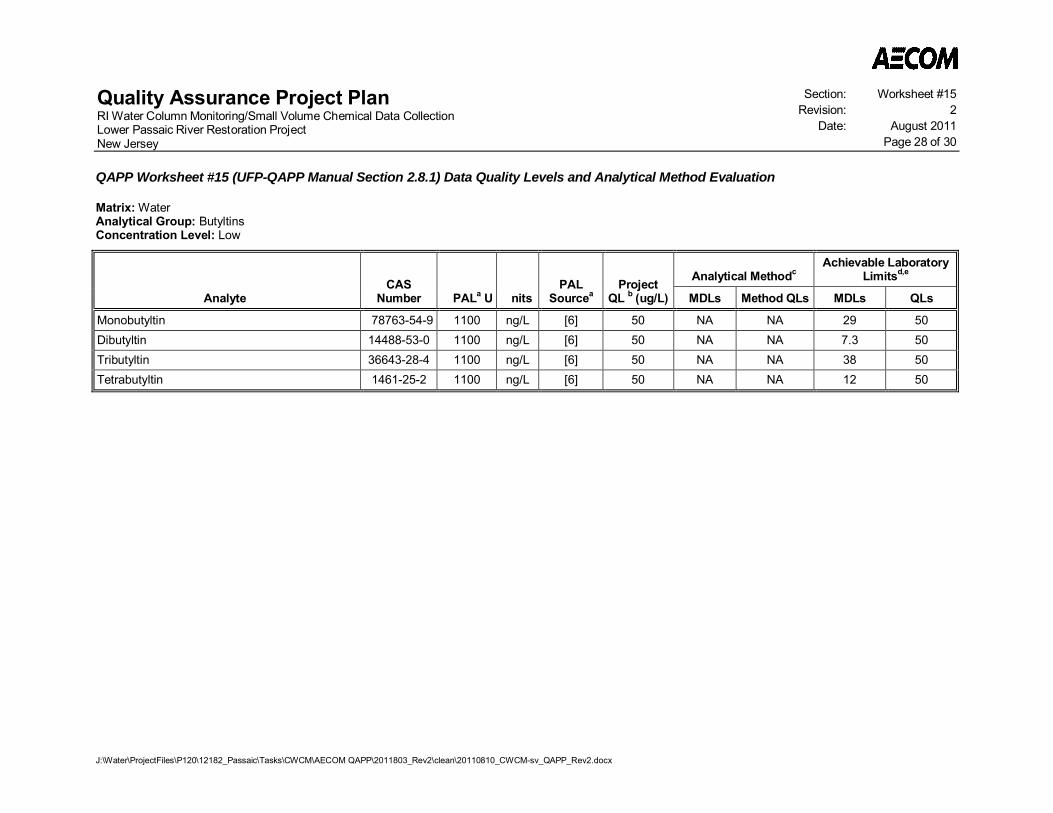
Quality Assurance Project PlanRI Water Column Monitoring/Small Volume Chemical Data CollectionLower Passaic River Restoration ProjectNew Jersey
Section: Worksheet #15Revision: 2
Date: August 2011Page 28 of 30
QAPP Worksheet #15 (UFP-QAPP Manual Section 2.8.1) Data Quality Levels and Analytical Method Evaluation
J:\Water\ProjectFiles\P120\12182_Passaic\Tasks\CWCM\AECOM QAPP\2011803_Rev2\clean\20110810_CWCM-sv_QAPP_Rev2.docx
Matrix: WaterAnalytical Group: ButyltinsConcentration Level: Low
AnalyteCAS
Number PALa U nitsPAL
SourceaProject
QL b (ug/L)
Analytical MethodcAchievable Laboratory
Limitsd,e
MDLs Method QLs MDLs QLs
Monobutyltin 78763-54-9 1100 ng/L [6] 50 NA NA 29 50Dibutyltin 14488-53-0 1100 ng/L [6] 50 NA NA 7.3 50Tributyltin 36643-28-4 1100 ng/L [6] 50 NA NA 38 50Tetrabutyltin 1461-25-2 1100 ng/L [6] 50 NA NA 12 50
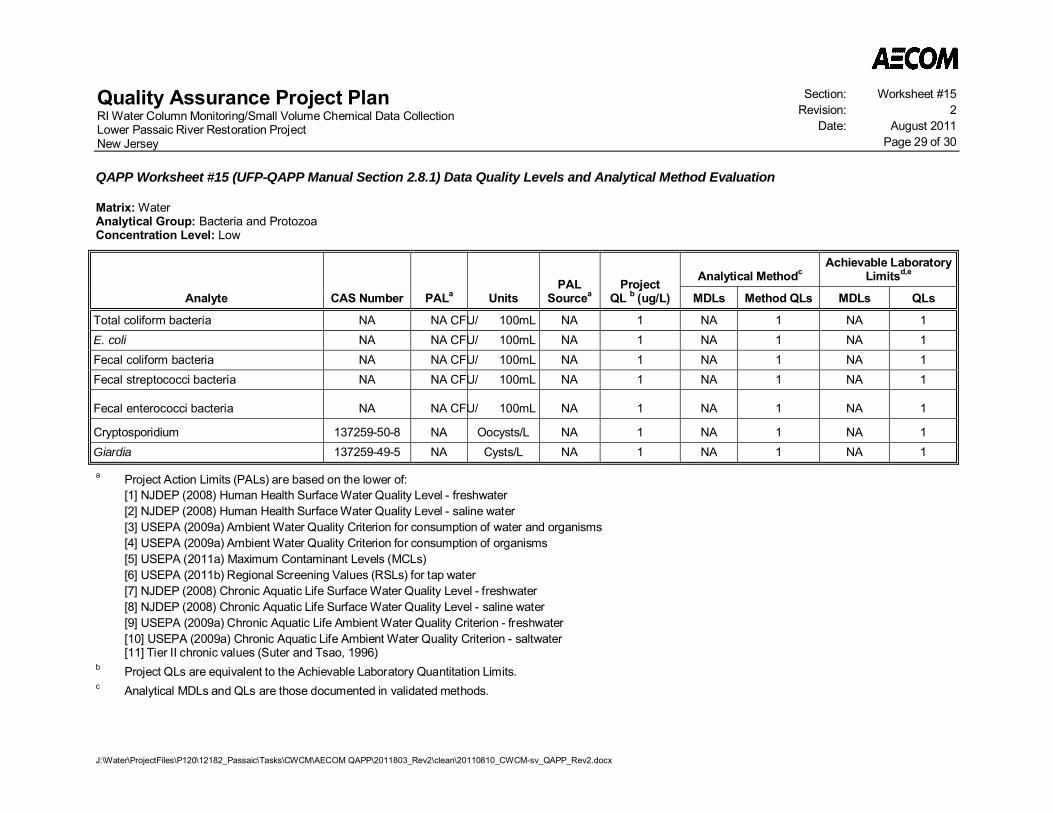
Quality Assurance Project PlanRI Water Column Monitoring/Small Volume Chemical Data CollectionLower Passaic River Restoration ProjectNew Jersey
Section: Worksheet #15Revision: 2
Date: August 2011Page 29 of 30
QAPP Worksheet #15 (UFP-QAPP Manual Section 2.8.1) Data Quality Levels and Analytical Method Evaluation
J:\Water\ProjectFiles\P120\12182_Passaic\Tasks\CWCM\AECOM QAPP\2011803_Rev2\clean\20110810_CWCM-sv_QAPP_Rev2.docx
Matrix: WaterAnalytical Group: Bacteria and ProtozoaConcentration Level: Low
Analyte CAS Number PALa UnitsPAL
SourceaProject
QL b (ug/L)
Analytical MethodcAchievable Laboratory
Limitsd,e
MDLs Method QLs MDLs QLs
Total coliform bacteria NA NA CFU/ 100mL NA 1 NA 1 NA 1E. coli NA NA CFU/ 100mL NA 1 NA 1 NA 1Fecal coliform bacteria NA NA CFU/ 100mL NA 1 NA 1 NA 1Fecal streptococci bacteria NA NA CFU/ 100mL NA 1 NA 1 NA 1
Fecal enterococci bacteria NA NA CFU/ 100mL NA 1 NA 1 NA 1
Cryptosporidium 137259-50-8 NA Oocysts/L NA 1 NA 1 NA 1Giardia 137259-49-5 NA Cysts/L NA 1 NA 1 NA 1
a Project Action Limits (PALs) are based on the lower of:[1] NJDEP (2008) Human Health Surface Water Quality Level - freshwater[2] NJDEP (2008) Human Health Surface Water Quality Level - saline water[3] USEPA (2009a) Ambient Water Quality Criterion for consumption of water and organisms[4] USEPA (2009a) Ambient Water Quality Criterion for consumption of organisms[5] USEPA (2011a) Maximum Contaminant Levels (MCLs)[6] USEPA (2011b) Regional Screening Values (RSLs) for tap water[7] NJDEP (2008) Chronic Aquatic Life Surface Water Quality Level - freshwater[8] NJDEP (2008) Chronic Aquatic Life Surface Water Quality Level - saline water[9] USEPA (2009a) Chronic Aquatic Life Ambient Water Quality Criterion - freshwater[10] USEPA (2009a) Chronic Aquatic Life Ambient Water Quality Criterion - saltwater[11] Tier II chronic values (Suter and Tsao, 1996)
b Project QLs are equivalent to the Achievable Laboratory Quantitation Limits.c Analytical MDLs and QLs are those documented in validated methods.
Quality Assurance Project PlanRI Water Column Monitoring/Small Volume Chemical Data CollectionLower Passaic River Restoration ProjectNew Jersey
Section: Worksheet #15Revision: 2
Date: August 2011Page 30 of 30
QAPP Worksheet #15 (UFP-QAPP Manual Section 2.8.1) Data Quality Levels and Analytical Method Evaluation
J:\Water\ProjectFiles\P120\12182_Passaic\Tasks\CWCM\AECOM QAPP\2011803_Rev2\clean\20110810_CWCM-sv_QAPP_Rev2.docx
d Achievable MDLs and QLs are limits that the selected laboratory can achieve when performing the specified methods (Worksheet #23) with nominal samplevolumes in the absence of interferences. Actual MDLs and QLs will vary based on sample specific factors. QLs listed for PCBs are equivalent to the MinimumLevel (ML) per reference method definitions and may not be based on the low point of calibration. EDLs for isotope dilution methods are based on average blankEDL results. The actual reporting limits for isotope dilution methods will be the sample specific EDL rather than QL. All results between the MDL (or EDL) and QLwill be reported as estimated values (J qualifier). The reporting limit will be the QL for all methods except isotope dilution methods.
e Achievable laboratory limits that are greater than the PALs are presented in boldface text. f Refer to Worksheet #23 for Laboratory SOPs.g Note the PAHs in both the TCL SVOC and LRMS-SIM isotope dilution methods will both be reported separately.
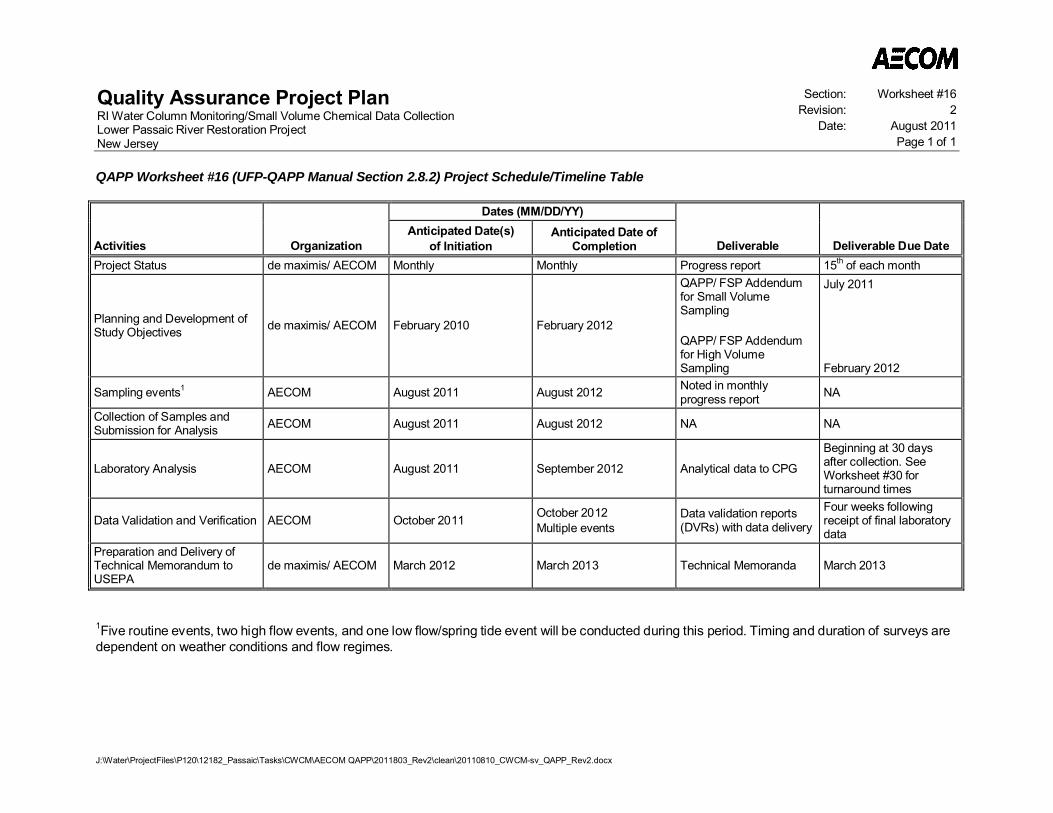
Quality Assurance Project PlanRI Water Column Monitoring/Small Volume Chemical Data CollectionLower Passaic River Restoration ProjectNew Jersey
Section: Worksheet #16Revision: 2
Date: August 2011Page 1 of 1
J:\Water\ProjectFiles\P120\12182_Passaic\Tasks\CWCM\AECOM QAPP\2011803_Rev2\clean\20110810_CWCM-sv_QAPP_Rev2.docx
QAPP Worksheet #16 (UFP-QAPP Manual Section 2.8.2) Project Schedule/Timeline Table
Activities Organization
Dates (MM/DD/YY)
Deliverable Deliverable Due DateAnticipated Date(s)
of InitiationAnticipated Date of
CompletionProject Status de maximis/ AECOM Monthly Monthly Progress report 15th of each month
Planning and Development ofStudy Objectives de maximis/ AECOM February 2010 February 2012
QAPP/ FSP Addendumfor Small VolumeSampling
QAPP/ FSP Addendumfor High VolumeSampling
July 2011
February 2012
Sampling events1 AECOM August 2011 August 2012 Noted in monthlyprogress report NA
Collection of Samples andSubmission for Analysis AECOM August 2011 August 2012 NA NA
Laboratory Analysis AECOM August 2011 September 2012 Analytical data to CPG
Beginning at 30 daysafter collection. SeeWorksheet #30 forturnaround times
Data Validation and Verification AECOM October 2011 October 2012Multiple events
Data validation reports(DVRs) with data delivery
Four weeks followingreceipt of final laboratorydata
Preparation and Delivery ofTechnical Memorandum toUSEPA
de maximis/ AECOM March 2012 March 2013 Technical Memoranda March 2013
1Five routine events, two high flow events, and one low flow/spring tide event will be conducted during this period. Timing and duration of surveys aredependent on weather conditions and flow regimes.
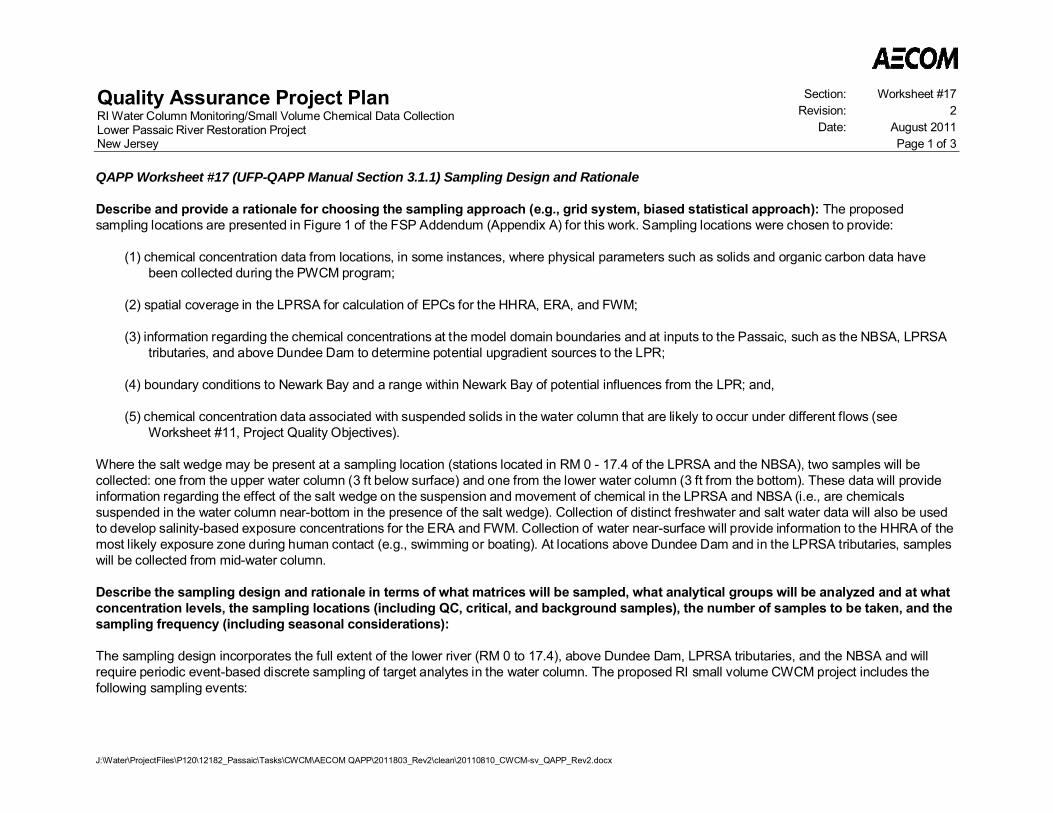
Quality Assurance Project PlanRI Water Column Monitoring/Small Volume Chemical Data CollectionLower Passaic River Restoration ProjectNew Jersey
Section: Worksheet #17Revision: 2
Date: August 2011Page 1 of 3
J:\Water\ProjectFiles\P120\12182_Passaic\Tasks\CWCM\AECOM QAPP\2011803_Rev2\clean\20110810_CWCM-sv_QAPP_Rev2.docx
QAPP Worksheet #17 (UFP-QAPP Manual Section 3.1.1) Sampling Design and Rationale
Describe and provide a rationale for choosing the sampling approach (e.g., grid system, biased statistical approach): The proposedsampling locations are presented in Figure 1 of the FSP Addendum (Appendix A) for this work. Sampling locations were chosen to provide:
(1) chemical concentration data from locations, in some instances, where physical parameters such as solids and organic carbon data havebeen collected during the PWCM program;
(2) spatial coverage in the LPRSA for calculation of EPCs for the HHRA, ERA, and FWM;
(3) information regarding the chemical concentrations at the model domain boundaries and at inputs to the Passaic, such as the NBSA, LPRSAtributaries, and above Dundee Dam to determine potential upgradient sources to the LPR;
(4) boundary conditions to Newark Bay and a range within Newark Bay of potential influences from the LPR; and,
(5) chemical concentration data associated with suspended solids in the water column that are likely to occur under different flows (seeWorksheet #11, Project Quality Objectives).
Where the salt wedge may be present at a sampling location (stations located in RM 0 - 17.4 of the LPRSA and the NBSA), two samples will becollected: one from the upper water column (3 ft below surface) and one from the lower water column (3 ft from the bottom). These data will provideinformation regarding the effect of the salt wedge on the suspension and movement of chemical in the LPRSA and NBSA (i.e., are chemicalssuspended in the water column near-bottom in the presence of the salt wedge). Collection of distinct freshwater and salt water data will also be usedto develop salinity-based exposure concentrations for the ERA and FWM. Collection of water near-surface will provide information to the HHRA of themost likely exposure zone during human contact (e.g., swimming or boating). At locations above Dundee Dam and in the LPRSA tributaries, sampleswill be collected from mid-water column.
Describe the sampling design and rationale in terms of what matrices will be sampled, what analytical groups will be analyzed and at whatconcentration levels, the sampling locations (including QC, critical, and background samples), the number of samples to be taken, and thesampling frequency (including seasonal considerations):
The sampling design incorporates the full extent of the lower river (RM 0 to 17.4), above Dundee Dam, LPRSA tributaries, and the NBSA and willrequire periodic event-based discrete sampling of target analytes in the water column. The proposed RI small volume CWCM project includes thefollowing sampling events:
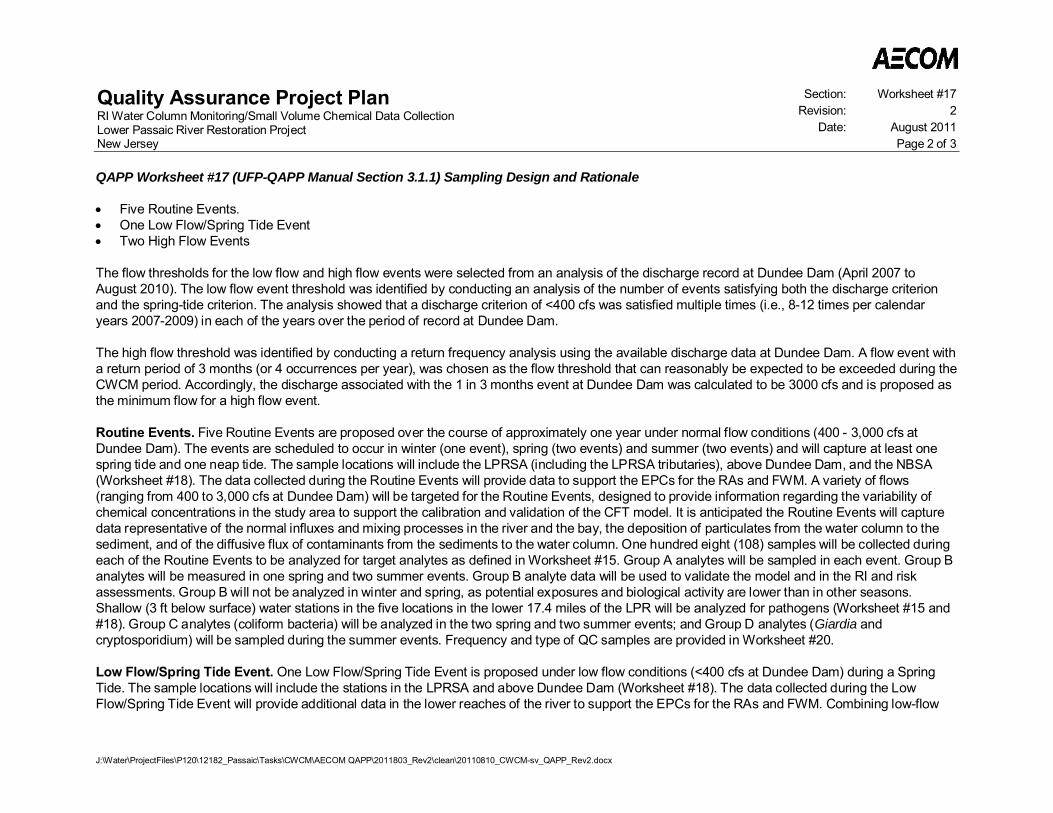
Quality Assurance Project PlanRI Water Column Monitoring/Small Volume Chemical Data CollectionLower Passaic River Restoration ProjectNew Jersey
Section: Worksheet #17Revision: 2
Date: August 2011Page 2 of 3
QAPP Worksheet #17 (UFP-QAPP Manual Section 3.1.1) Sampling Design and Rationale
J:\Water\ProjectFiles\P120\12182_Passaic\Tasks\CWCM\AECOM QAPP\2011803_Rev2\clean\20110810_CWCM-sv_QAPP_Rev2.docx
Five Routine Events. One Low Flow/Spring Tide Event Two High Flow Events
The flow thresholds for the low flow and high flow events were selected from an analysis of the discharge record at Dundee Dam (April 2007 toAugust 2010). The low flow event threshold was identified by conducting an analysis of the number of events satisfying both the discharge criterionand the spring-tide criterion. The analysis showed that a discharge criterion of <400 cfs was satisfied multiple times (i.e., 8-12 times per calendaryears 2007-2009) in each of the years over the period of record at Dundee Dam.
The high flow threshold was identified by conducting a return frequency analysis using the available discharge data at Dundee Dam. A flow event witha return period of 3 months (or 4 occurrences per year), was chosen as the flow threshold that can reasonably be expected to be exceeded during theCWCM period. Accordingly, the discharge associated with the 1 in 3 months event at Dundee Dam was calculated to be 3000 cfs and is proposed asthe minimum flow for a high flow event.
Routine Events. Five Routine Events are proposed over the course of approximately one year under normal flow conditions (400 - 3,000 cfs atDundee Dam). The events are scheduled to occur in winter (one event), spring (two events) and summer (two events) and will capture at least onespring tide and one neap tide. The sample locations will include the LPRSA (including the LPRSA tributaries), above Dundee Dam, and the NBSA(Worksheet #18). The data collected during the Routine Events will provide data to support the EPCs for the RAs and FWM. A variety of flows(ranging from 400 to 3,000 cfs at Dundee Dam) will be targeted for the Routine Events, designed to provide information regarding the variability ofchemical concentrations in the study area to support the calibration and validation of the CFT model. It is anticipated the Routine Events will capturedata representative of the normal influxes and mixing processes in the river and the bay, the deposition of particulates from the water column to thesediment, and of the diffusive flux of contaminants from the sediments to the water column. One hundred eight (108) samples will be collected duringeach of the Routine Events to be analyzed for target analytes as defined in Worksheet #15. Group A analytes will be sampled in each event. Group Banalytes will be measured in one spring and two summer events. Group B analyte data will be used to validate the model and in the RI and riskassessments. Group B will not be analyzed in winter and spring, as potential exposures and biological activity are lower than in other seasons.Shallow (3 ft below surface) water stations in the five locations in the lower 17.4 miles of the LPR will be analyzed for pathogens (Worksheet #15 and#18). Group C analytes (coliform bacteria) will be analyzed in the two spring and two summer events; and Group D analytes (Giardia andcryptosporidium) will be sampled during the summer events. Frequency and type of QC samples are provided in Worksheet #20.
Low Flow/Spring Tide Event. One Low Flow/Spring Tide Event is proposed under low flow conditions (<400 cfs at Dundee Dam) during a SpringTide. The sample locations will include the stations in the LPRSA and above Dundee Dam (Worksheet #18). The data collected during the LowFlow/Spring Tide Event will provide additional data in the lower reaches of the river to support the EPCs for the RAs and FWM. Combining low-flow
Quality Assurance Project PlanRI Water Column Monitoring/Small Volume Chemical Data CollectionLower Passaic River Restoration ProjectNew Jersey
Section: Worksheet #17Revision: 2
Date: August 2011Page 3 of 3
QAPP Worksheet #17 (UFP-QAPP Manual Section 3.1.1) Sampling Design and Rationale
J:\Water\ProjectFiles\P120\12182_Passaic\Tasks\CWCM\AECOM QAPP\2011803_Rev2\clean\20110810_CWCM-sv_QAPP_Rev2.docx
conditions with a spring tide will provide data to the CFT model when the highest tidal energies and tidal mixing may occur. Forty-four (44) sampleswill be collected during the Low Flow/Spring Tide Event to be analyzed for Group A and Group B target analytes as defined in Worksheet #15.Shallow (3 ft below surface) water stations in the five locations in the lower 17.4 miles of the LPR will be analyzed for Group C analytes (coliformbacteria) (Worksheet #15 and #18). Group D analytes (Giardia and cryptosporidium) will not be sampled during the low flow/spring tide event.Frequency and type of QC samples are provided in Worksheet #20.
High Flow Events. Two High Flow Events are proposed under storm-induced high flow (i.e., not sustained high flow) conditions (>3,000 cfs atDundee Dam). The sample locations will include the LPRSA (including the LPRSA tributaries), above the Dundee Dam, and the NBSA (Worksheet#18). The data collected during the High Flow Events will provide data to support the EPCs for the RAs and FWM. The data will also be used toprovide the CFT model preliminary information to calibrate and validate the resuspension fluxes from the sediments to the water column, and thesubsequent deposition of particle-bound contaminants from the water column to the sediment under conditions where bed sediment is likely to besuspended. It is anticipated that during these events there will be a higher loading of suspended sediments (i.e., more contamination on a per unitweight suspended solids basis may occur since elevated flows associated with storm events will resuspend more bed sediment). One hundredfourteen (114) samples will be collected during each of the High Flow Events to be analyzed for target analytes as defined in Worksheet #15. Group Aanalytes will be measured during both events. Group B analytes will be measured in one of the two events; it is anticipated that adequate informationwill be obtained for the model validation from one high flow event. Shallow (3 ft below surface) water stations in the five locations in the lower 17.4miles of the LPR will be analyzed for pathogens (Worksheet #15 and #18). Group C analytes (coliform bacteria) and Group D analytes (Giardia andcryptosporidium) will be sampled during both events. Frequency and type of QC samples are provided in Worksheet #20.
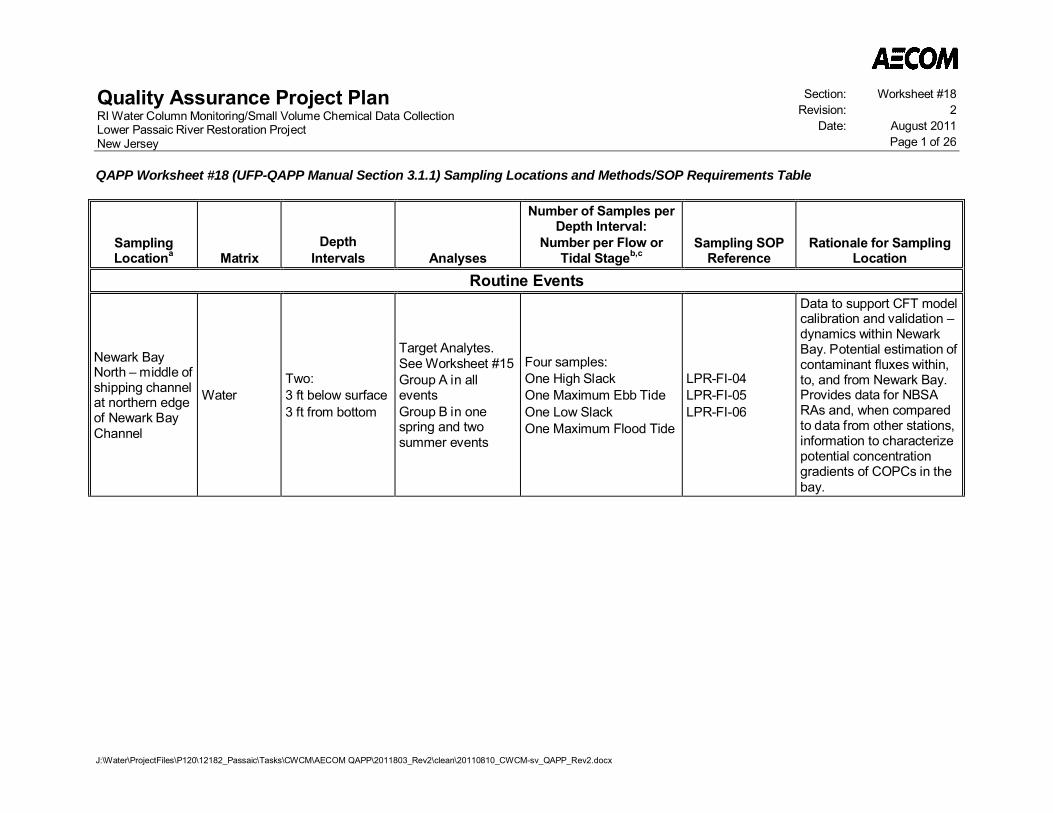
Quality Assurance Project PlanRI Water Column Monitoring/Small Volume Chemical Data CollectionLower Passaic River Restoration ProjectNew Jersey
Section: Worksheet #18Revision: 2
Date: August 2011Page 1 of 26
J:\Water\ProjectFiles\P120\12182_Passaic\Tasks\CWCM\AECOM QAPP\2011803_Rev2\clean\20110810_CWCM-sv_QAPP_Rev2.docx
QAPP Worksheet #18 (UFP-QAPP Manual Section 3.1.1) Sampling Locations and Methods/SOP Requirements Table
SamplingLocationa Matrix
DepthIntervals Analyses
Number of Samples perDepth Interval:
Number per Flow orTidal Stageb,c
Sampling SOPReference
Rationale for SamplingLocation
Routine Events
Newark BayNorth – middle ofshipping channelat northern edgeof Newark BayChannel
WaterTwo:3 ft below surface3 ft from bottom
Target Analytes.See Worksheet #15Group A in alleventsGroup B in onespring and twosummer events
Four samples:One High SlackOne Maximum Ebb TideOne Low SlackOne Maximum Flood Tide
LPR-FI-04LPR-FI-05LPR-FI-06
Data to support CFT modelcalibration and validation –dynamics within NewarkBay. Potential estimation ofcontaminant fluxes within,to, and from Newark Bay.Provides data for NBSARAs and, when comparedto data from other stations,information to characterizepotential concentrationgradients of COPCs in thebay.

Quality Assurance Project PlanRI Water Column Monitoring/Small Volume Chemical Data CollectionLower Passaic River Restoration ProjectNew Jersey
Section: Worksheet #18Revision: 2
Date: August 2011Page 2 of 26
QAPP Worksheet #18 (UFP-QAPP Manual Section 3.1.1) Sampling Locations and Methods/SOP Requirements Table
J:\Water\ProjectFiles\P120\12182_Passaic\Tasks\CWCM\AECOM QAPP\2011803_Rev2\clean\20110810_CWCM-sv_QAPP_Rev2.docx
SamplingLocationa Matrix
DepthIntervals Analyses
Number of Samples perDepth Interval:
Number per Flow orTidal Stageb,c
Sampling SOPReference
Rationale for SamplingLocation
Newark BayEast – subtidalarea midwaybetween NewarkBay South andNewark BayNortheast,across from PortNewark
WaterTwo:3 ft below surface3 ft from bottom
Target Analytes.See Worksheet #15Group A in alleventsGroup B in onespring and twosummer events
Four samples:One High SlackOne Maximum Ebb TideOne Low SlackOne Maximum Flood Tide
LPR-FI-04LPR-FI-05LPR-FI-06
Data to support CFT modelcalibration and validation –dynamics within NewarkBay. Potential estimation ofcontaminant fluxes within,to, and from Newark Baywhere wind-drivensuspension may occur.Provides data for NBSARAs and, when comparedto data from other stations,information to characterizepotential concentrationgradients of COPCs in thebay.
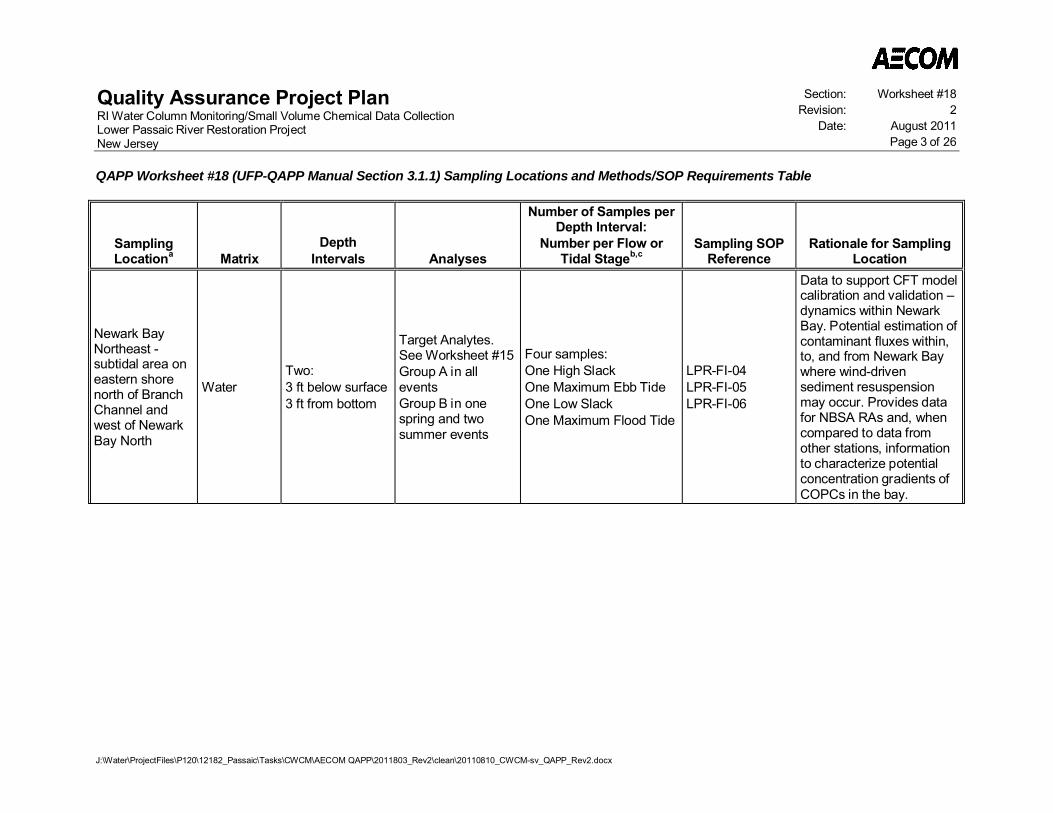
Quality Assurance Project PlanRI Water Column Monitoring/Small Volume Chemical Data CollectionLower Passaic River Restoration ProjectNew Jersey
Section: Worksheet #18Revision: 2
Date: August 2011Page 3 of 26
QAPP Worksheet #18 (UFP-QAPP Manual Section 3.1.1) Sampling Locations and Methods/SOP Requirements Table
J:\Water\ProjectFiles\P120\12182_Passaic\Tasks\CWCM\AECOM QAPP\2011803_Rev2\clean\20110810_CWCM-sv_QAPP_Rev2.docx
SamplingLocationa Matrix
DepthIntervals Analyses
Number of Samples perDepth Interval:
Number per Flow orTidal Stageb,c
Sampling SOPReference
Rationale for SamplingLocation
Newark BayNortheast -subtidal area oneastern shorenorth of BranchChannel andwest of NewarkBay North
WaterTwo:3 ft below surface3 ft from bottom
Target Analytes.See Worksheet #15Group A in alleventsGroup B in onespring and twosummer events
Four samples:One High SlackOne Maximum Ebb TideOne Low SlackOne Maximum Flood Tide
LPR-FI-04LPR-FI-05LPR-FI-06
Data to support CFT modelcalibration and validation –dynamics within NewarkBay. Potential estimation ofcontaminant fluxes within,to, and from Newark Baywhere wind-drivensediment resuspensionmay occur. Provides datafor NBSA RAs and, whencompared to data fromother stations, informationto characterize potentialconcentration gradients ofCOPCs in the bay.
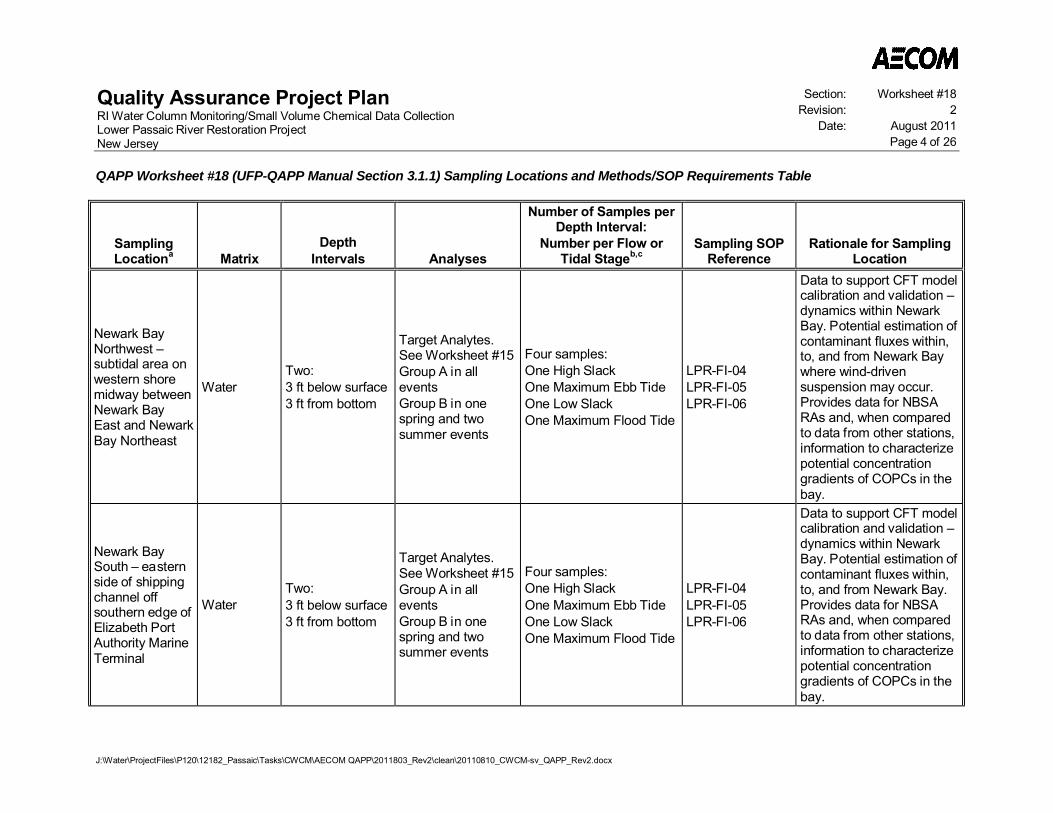
Quality Assurance Project PlanRI Water Column Monitoring/Small Volume Chemical Data CollectionLower Passaic River Restoration ProjectNew Jersey
Section: Worksheet #18Revision: 2
Date: August 2011Page 4 of 26
QAPP Worksheet #18 (UFP-QAPP Manual Section 3.1.1) Sampling Locations and Methods/SOP Requirements Table
J:\Water\ProjectFiles\P120\12182_Passaic\Tasks\CWCM\AECOM QAPP\2011803_Rev2\clean\20110810_CWCM-sv_QAPP_Rev2.docx
SamplingLocationa Matrix
DepthIntervals Analyses
Number of Samples perDepth Interval:
Number per Flow orTidal Stageb,c
Sampling SOPReference
Rationale for SamplingLocation
Newark BayNorthwest –subtidal area onwestern shoremidway betweenNewark BayEast and NewarkBay Northeast
WaterTwo:3 ft below surface3 ft from bottom
Target Analytes.See Worksheet #15Group A in alleventsGroup B in onespring and twosummer events
Four samples:One High SlackOne Maximum Ebb TideOne Low SlackOne Maximum Flood Tide
LPR-FI-04LPR-FI-05LPR-FI-06
Data to support CFT modelcalibration and validation –dynamics within NewarkBay. Potential estimation ofcontaminant fluxes within,to, and from Newark Baywhere wind-drivensuspension may occur.Provides data for NBSARAs and, when comparedto data from other stations,information to characterizepotential concentrationgradients of COPCs in thebay.
Newark BaySouth – easternside of shippingchannel offsouthern edge ofElizabeth PortAuthority MarineTerminal
WaterTwo:3 ft below surface3 ft from bottom
Target Analytes.See Worksheet #15Group A in alleventsGroup B in onespring and twosummer events
Four samples:One High SlackOne Maximum Ebb TideOne Low SlackOne Maximum Flood Tide
LPR-FI-04LPR-FI-05LPR-FI-06
Data to support CFT modelcalibration and validation –dynamics within NewarkBay. Potential estimation ofcontaminant fluxes within,to, and from Newark Bay.Provides data for NBSARAs and, when comparedto data from other stations,information to characterizepotential concentrationgradients of COPCs in thebay.

Quality Assurance Project PlanRI Water Column Monitoring/Small Volume Chemical Data CollectionLower Passaic River Restoration ProjectNew Jersey
Section: Worksheet #18Revision: 2
Date: August 2011Page 5 of 26
QAPP Worksheet #18 (UFP-QAPP Manual Section 3.1.1) Sampling Locations and Methods/SOP Requirements Table
J:\Water\ProjectFiles\P120\12182_Passaic\Tasks\CWCM\AECOM QAPP\2011803_Rev2\clean\20110810_CWCM-sv_QAPP_Rev2.docx
SamplingLocationa Matrix
DepthIntervals Analyses
Number of Samples perDepth Interval:
Number per Flow orTidal Stageb,c
Sampling SOPReference
Rationale for SamplingLocation
Arthur Kill nearArthur Kill Park Water
Two:3 ft below surface3 ft from bottom
Target Analytes.See Worksheet #15Group A in alleventsGroup B in onespring and twosummer events
Four samples:One High SlackOne Maximum Ebb TideOne Low SlackOne Maximum Flood Tide
LPR-FI-04LPR-FI-05LPR-FI-06
Data to support CFT modelcalibration and validation –exchange with the ArthurKill. Potential estimation ofcontaminant fluxesbetween Newark Bay andthe Arthur Kill.
Kill van Kull neareastern edge ofMayor Dennis P.Collins Park
WaterTwo:3 ft below surface3 ft from bottom
Target Analytes.See Worksheet #15Group A in alleventsGroup B in onespring and twosummer events
Four samples:One High SlackOne Maximum Ebb TideOne Low SlackOne Maximum Flood Tide
LPR-FI-04LPR-FI-05LPR-FI-06
Data to support CFT modelcalibration and validation –exchange with the Kill vanKull. Potential estimation ofcontaminant fluxesbetween Newark Bay andthe Kill van Kull.
HackensackRiver north ofthe PulaskiSkyway
WaterTwo:3 ft below surface3 ft from bottom
Target Analytes.See Worksheet #15Group A in alleventsGroup B in onespring and twosummer events
Four samples:One High SlackOne Maximum Ebb TideOne Low SlackOne Maximum Flood Tide
LPR-FI-04LPR-FI-05LPR-FI-06
Data to support CFT modelcalibration and validation –exchange with theHackensack River.Potential estimation ofcontaminant fluxesbetween Newark Bay andthe Hackensack River.
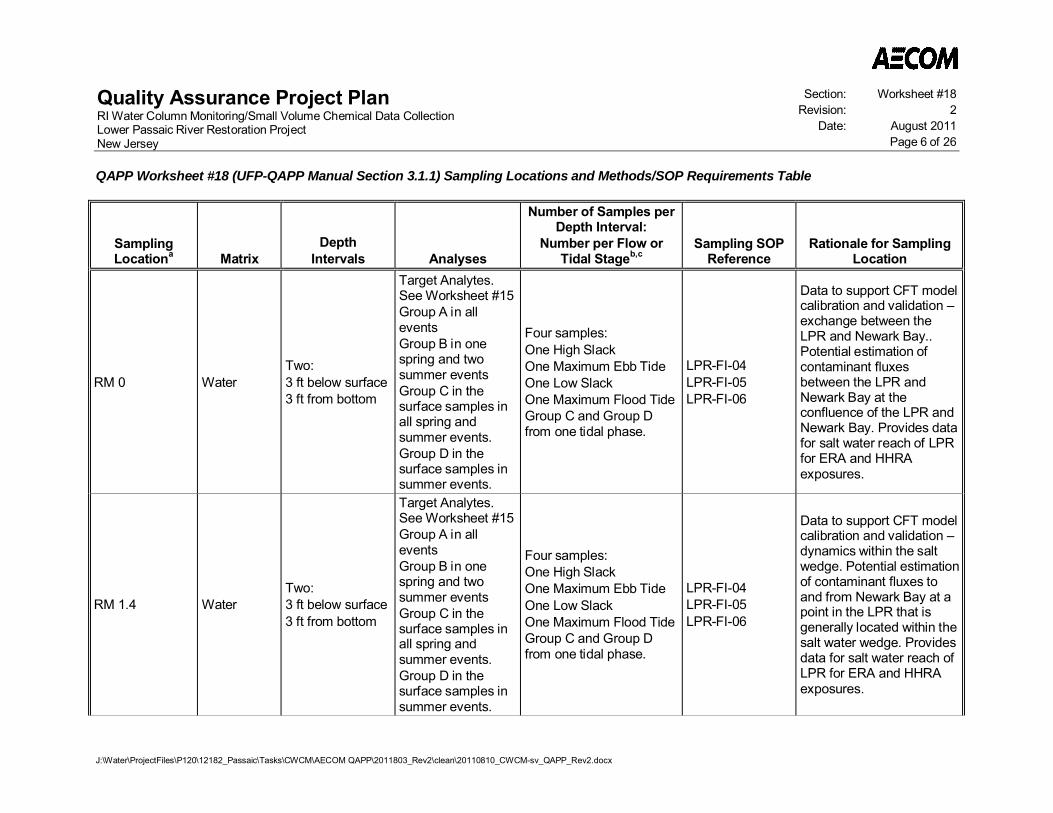
Quality Assurance Project PlanRI Water Column Monitoring/Small Volume Chemical Data CollectionLower Passaic River Restoration ProjectNew Jersey
Section: Worksheet #18Revision: 2
Date: August 2011Page 6 of 26
QAPP Worksheet #18 (UFP-QAPP Manual Section 3.1.1) Sampling Locations and Methods/SOP Requirements Table
J:\Water\ProjectFiles\P120\12182_Passaic\Tasks\CWCM\AECOM QAPP\2011803_Rev2\clean\20110810_CWCM-sv_QAPP_Rev2.docx
SamplingLocationa Matrix
DepthIntervals Analyses
Number of Samples perDepth Interval:
Number per Flow orTidal Stageb,c
Sampling SOPReference
Rationale for SamplingLocation
RM 0 WaterTwo:3 ft below surface3 ft from bottom
Target Analytes.See Worksheet #15Group A in alleventsGroup B in onespring and twosummer eventsGroup C in thesurface samples inall spring andsummer events.Group D in thesurface samples insummer events.
Four samples:One High SlackOne Maximum Ebb TideOne Low SlackOne Maximum Flood TideGroup C and Group Dfrom one tidal phase.
LPR-FI-04LPR-FI-05LPR-FI-06
Data to support CFT modelcalibration and validation –exchange between theLPR and Newark Bay..Potential estimation ofcontaminant fluxesbetween the LPR andNewark Bay at theconfluence of the LPR andNewark Bay. Provides datafor salt water reach of LPRfor ERA and HHRAexposures.
RM 1.4 WaterTwo:3 ft below surface3 ft from bottom
Target Analytes.See Worksheet #15Group A in alleventsGroup B in onespring and twosummer eventsGroup C in thesurface samples inall spring andsummer events.Group D in thesurface samples insummer events.
Four samples:One High SlackOne Maximum Ebb TideOne Low SlackOne Maximum Flood TideGroup C and Group Dfrom one tidal phase.
LPR-FI-04LPR-FI-05LPR-FI-06
Data to support CFT modelcalibration and validation –dynamics within the saltwedge. Potential estimationof contaminant fluxes toand from Newark Bay at apoint in the LPR that isgenerally located within thesalt water wedge. Providesdata for salt water reach ofLPR for ERA and HHRAexposures.
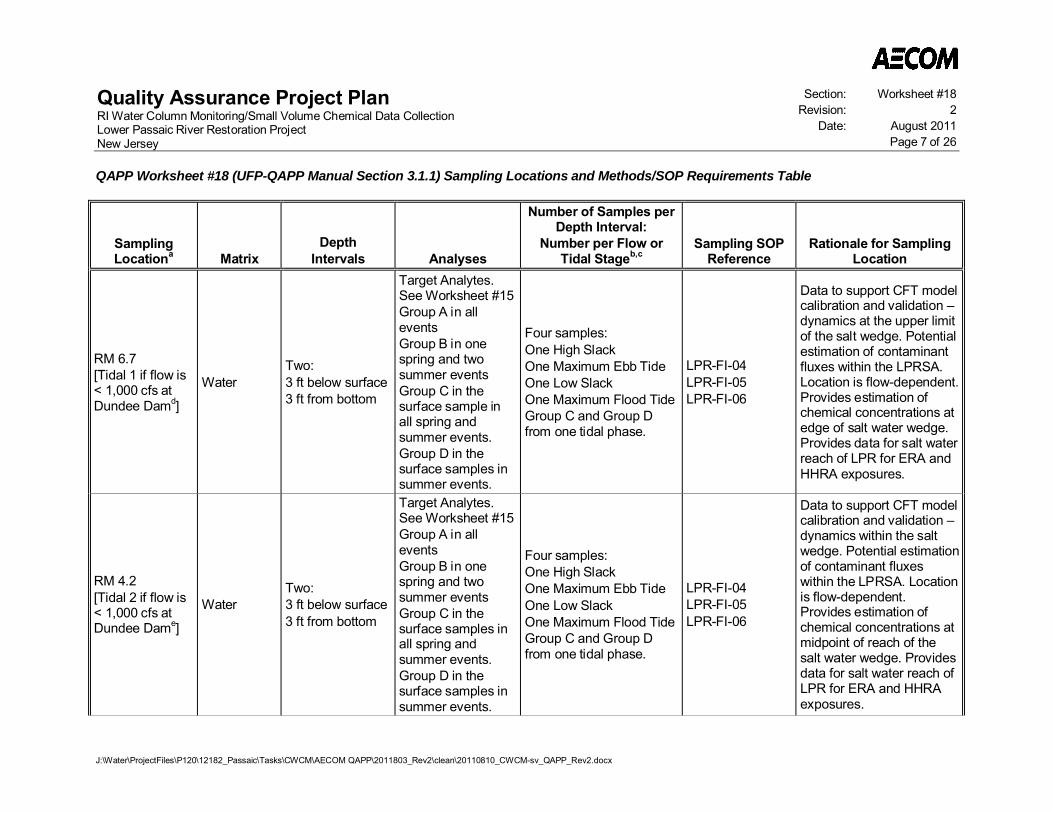
Quality Assurance Project PlanRI Water Column Monitoring/Small Volume Chemical Data CollectionLower Passaic River Restoration ProjectNew Jersey
Section: Worksheet #18Revision: 2
Date: August 2011Page 7 of 26
QAPP Worksheet #18 (UFP-QAPP Manual Section 3.1.1) Sampling Locations and Methods/SOP Requirements Table
J:\Water\ProjectFiles\P120\12182_Passaic\Tasks\CWCM\AECOM QAPP\2011803_Rev2\clean\20110810_CWCM-sv_QAPP_Rev2.docx
SamplingLocationa Matrix
DepthIntervals Analyses
Number of Samples perDepth Interval:
Number per Flow orTidal Stageb,c
Sampling SOPReference
Rationale for SamplingLocation
RM 6.7[Tidal 1 if flow is< 1,000 cfs atDundee Damd]
WaterTwo:3 ft below surface3 ft from bottom
Target Analytes.See Worksheet #15Group A in alleventsGroup B in onespring and twosummer eventsGroup C in thesurface sample inall spring andsummer events.Group D in thesurface samples insummer events.
Four samples:One High SlackOne Maximum Ebb TideOne Low SlackOne Maximum Flood TideGroup C and Group Dfrom one tidal phase.
LPR-FI-04LPR-FI-05LPR-FI-06
Data to support CFT modelcalibration and validation –dynamics at the upper limitof the salt wedge. Potentialestimation of contaminantfluxes within the LPRSA.Location is flow-dependent.Provides estimation ofchemical concentrations atedge of salt water wedge.Provides data for salt waterreach of LPR for ERA andHHRA exposures.
RM 4.2[Tidal 2 if flow is< 1,000 cfs atDundee Dame]
WaterTwo:3 ft below surface3 ft from bottom
Target Analytes.See Worksheet #15Group A in alleventsGroup B in onespring and twosummer eventsGroup C in thesurface samples inall spring andsummer events.Group D in thesurface samples insummer events.
Four samples:One High SlackOne Maximum Ebb TideOne Low SlackOne Maximum Flood TideGroup C and Group Dfrom one tidal phase.
LPR-FI-04LPR-FI-05LPR-FI-06
Data to support CFT modelcalibration and validation –dynamics within the saltwedge. Potential estimationof contaminant fluxeswithin the LPRSA. Locationis flow-dependent.Provides estimation ofchemical concentrations atmidpoint of reach of thesalt water wedge. Providesdata for salt water reach ofLPR for ERA and HHRAexposures.
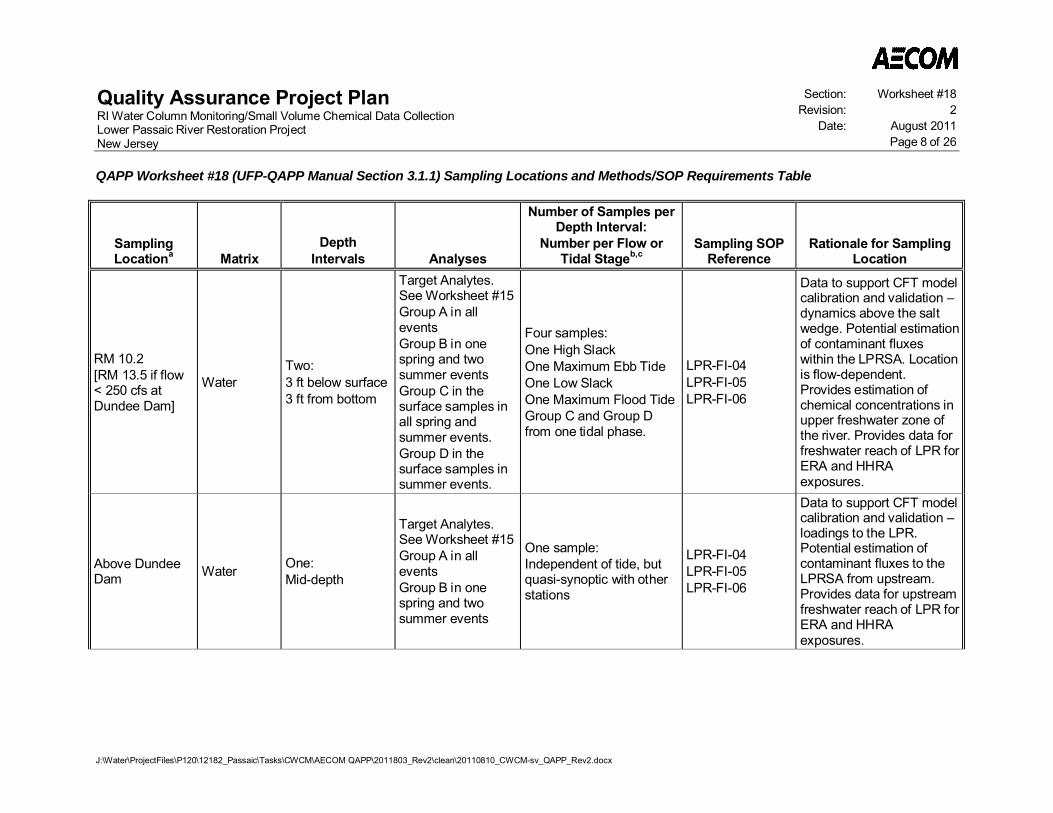
Quality Assurance Project PlanRI Water Column Monitoring/Small Volume Chemical Data CollectionLower Passaic River Restoration ProjectNew Jersey
Section: Worksheet #18Revision: 2
Date: August 2011Page 8 of 26
QAPP Worksheet #18 (UFP-QAPP Manual Section 3.1.1) Sampling Locations and Methods/SOP Requirements Table
J:\Water\ProjectFiles\P120\12182_Passaic\Tasks\CWCM\AECOM QAPP\2011803_Rev2\clean\20110810_CWCM-sv_QAPP_Rev2.docx
SamplingLocationa Matrix
DepthIntervals Analyses
Number of Samples perDepth Interval:
Number per Flow orTidal Stageb,c
Sampling SOPReference
Rationale for SamplingLocation
RM 10.2[RM 13.5 if flow< 250 cfs atDundee Dam]
WaterTwo:3 ft below surface3 ft from bottom
Target Analytes.See Worksheet #15Group A in alleventsGroup B in onespring and twosummer eventsGroup C in thesurface samples inall spring andsummer events.Group D in thesurface samples insummer events.
Four samples:One High SlackOne Maximum Ebb TideOne Low SlackOne Maximum Flood TideGroup C and Group Dfrom one tidal phase.
LPR-FI-04LPR-FI-05LPR-FI-06
Data to support CFT modelcalibration and validation –dynamics above the saltwedge. Potential estimationof contaminant fluxeswithin the LPRSA. Locationis flow-dependent.Provides estimation ofchemical concentrations inupper freshwater zone ofthe river. Provides data forfreshwater reach of LPR forERA and HHRAexposures.
Above DundeeDam Water One:
Mid-depth
Target Analytes.See Worksheet #15Group A in alleventsGroup B in onespring and twosummer events
One sample:Independent of tide, butquasi-synoptic with otherstations
LPR-FI-04LPR-FI-05LPR-FI-06
Data to support CFT modelcalibration and validation –loadings to the LPR.Potential estimation ofcontaminant fluxes to theLPRSA from upstream.Provides data for upstreamfreshwater reach of LPR forERA and HHRAexposures.
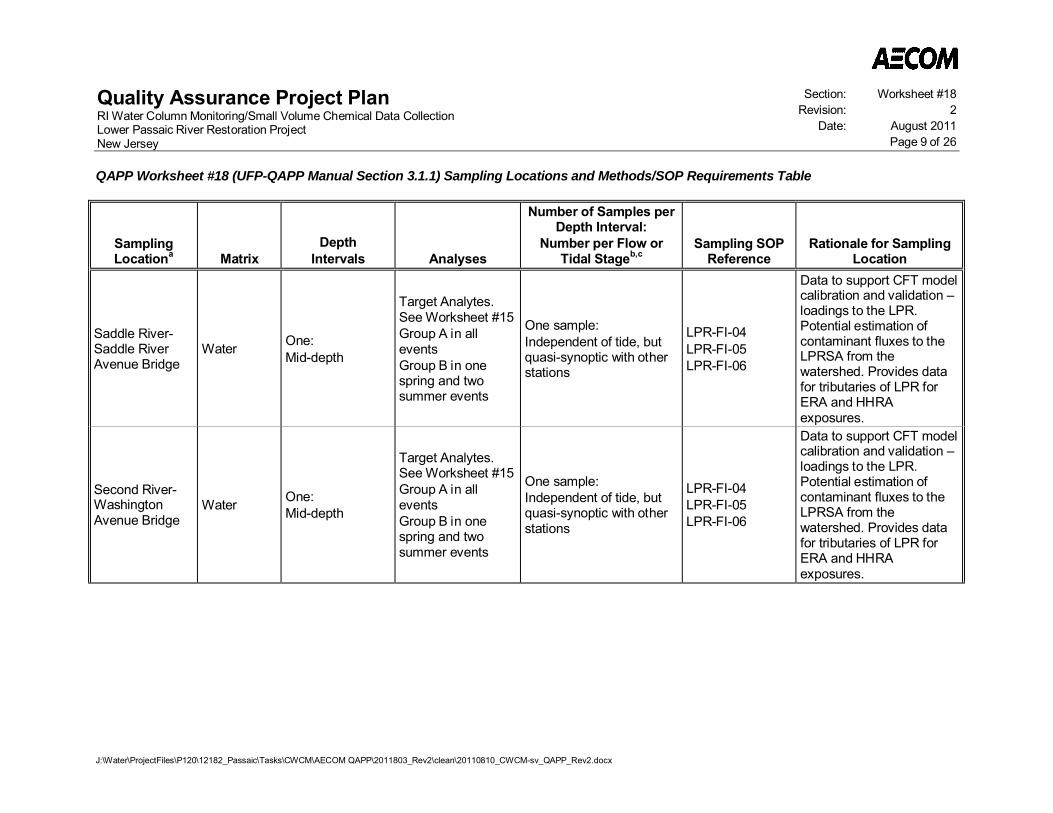
Quality Assurance Project PlanRI Water Column Monitoring/Small Volume Chemical Data CollectionLower Passaic River Restoration ProjectNew Jersey
Section: Worksheet #18Revision: 2
Date: August 2011Page 9 of 26
QAPP Worksheet #18 (UFP-QAPP Manual Section 3.1.1) Sampling Locations and Methods/SOP Requirements Table
J:\Water\ProjectFiles\P120\12182_Passaic\Tasks\CWCM\AECOM QAPP\2011803_Rev2\clean\20110810_CWCM-sv_QAPP_Rev2.docx
SamplingLocationa Matrix
DepthIntervals Analyses
Number of Samples perDepth Interval:
Number per Flow orTidal Stageb,c
Sampling SOPReference
Rationale for SamplingLocation
Saddle River-Saddle RiverAvenue Bridge
Water One:Mid-depth
Target Analytes.See Worksheet #15Group A in alleventsGroup B in onespring and twosummer events
One sample:Independent of tide, butquasi-synoptic with otherstations
LPR-FI-04LPR-FI-05LPR-FI-06
Data to support CFT modelcalibration and validation –loadings to the LPR.Potential estimation ofcontaminant fluxes to theLPRSA from thewatershed. Provides datafor tributaries of LPR forERA and HHRAexposures.
Second River-WashingtonAvenue Bridge
Water One:Mid-depth
Target Analytes.See Worksheet #15Group A in alleventsGroup B in onespring and twosummer events
One sample:Independent of tide, butquasi-synoptic with otherstations
LPR-FI-04LPR-FI-05LPR-FI-06
Data to support CFT modelcalibration and validation –loadings to the LPR.Potential estimation ofcontaminant fluxes to theLPRSA from thewatershed. Provides datafor tributaries of LPR forERA and HHRAexposures.
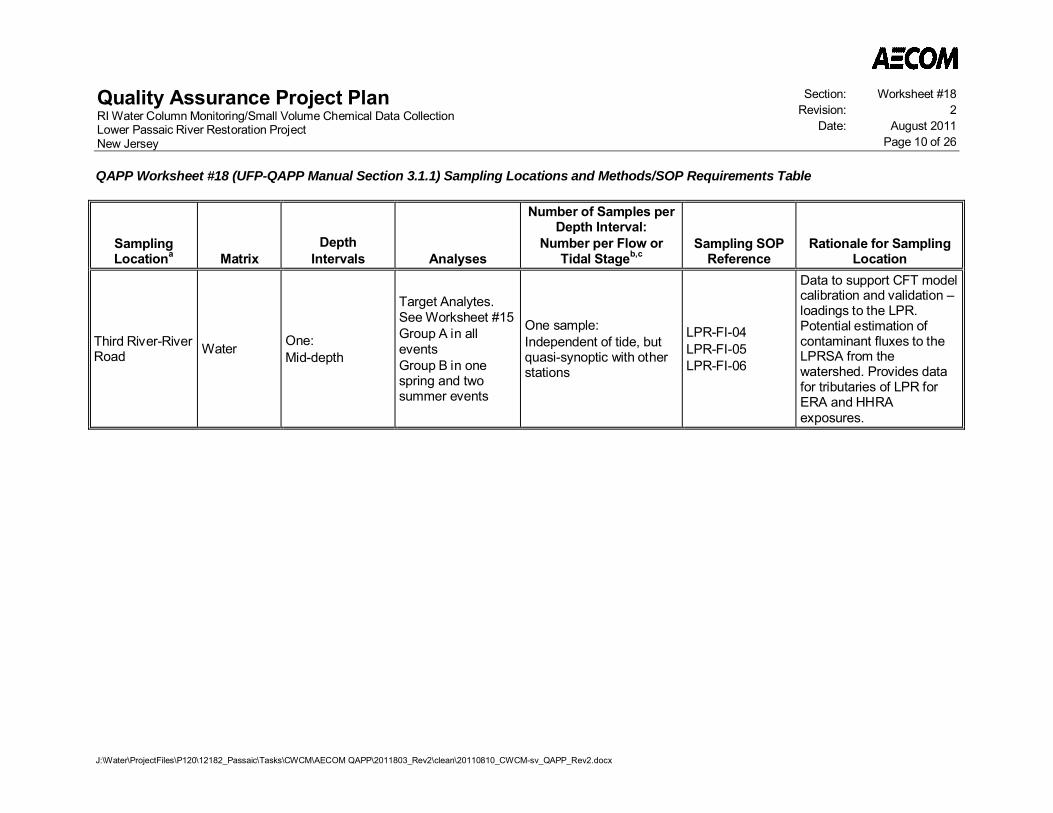
Quality Assurance Project PlanRI Water Column Monitoring/Small Volume Chemical Data CollectionLower Passaic River Restoration ProjectNew Jersey
Section: Worksheet #18Revision: 2
Date: August 2011Page 10 of 26
QAPP Worksheet #18 (UFP-QAPP Manual Section 3.1.1) Sampling Locations and Methods/SOP Requirements Table
J:\Water\ProjectFiles\P120\12182_Passaic\Tasks\CWCM\AECOM QAPP\2011803_Rev2\clean\20110810_CWCM-sv_QAPP_Rev2.docx
SamplingLocationa Matrix
DepthIntervals Analyses
Number of Samples perDepth Interval:
Number per Flow orTidal Stageb,c
Sampling SOPReference
Rationale for SamplingLocation
Third River-RiverRoad Water One:
Mid-depth
Target Analytes.See Worksheet #15Group A in alleventsGroup B in onespring and twosummer events
One sample:Independent of tide, butquasi-synoptic with otherstations
LPR-FI-04LPR-FI-05LPR-FI-06
Data to support CFT modelcalibration and validation –loadings to the LPR.Potential estimation ofcontaminant fluxes to theLPRSA from thewatershed. Provides datafor tributaries of LPR forERA and HHRAexposures.
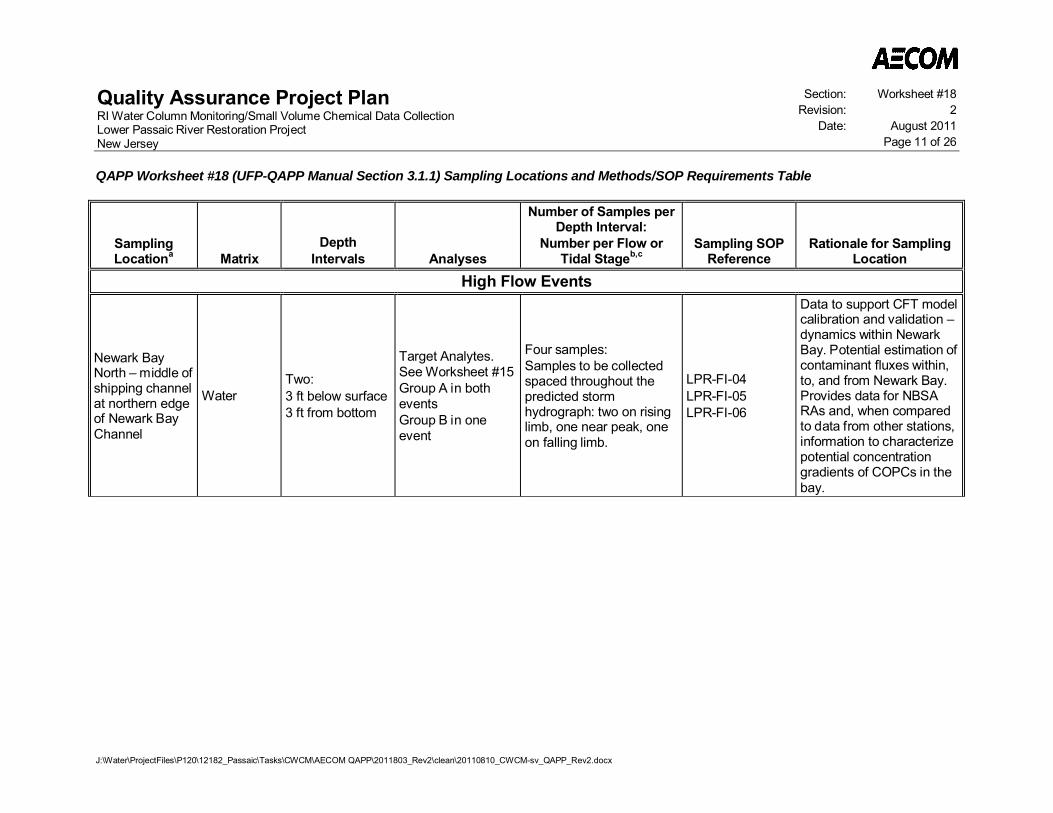
Quality Assurance Project PlanRI Water Column Monitoring/Small Volume Chemical Data CollectionLower Passaic River Restoration ProjectNew Jersey
Section: Worksheet #18Revision: 2
Date: August 2011Page 11 of 26
QAPP Worksheet #18 (UFP-QAPP Manual Section 3.1.1) Sampling Locations and Methods/SOP Requirements Table
J:\Water\ProjectFiles\P120\12182_Passaic\Tasks\CWCM\AECOM QAPP\2011803_Rev2\clean\20110810_CWCM-sv_QAPP_Rev2.docx
SamplingLocationa Matrix
DepthIntervals Analyses
Number of Samples perDepth Interval:
Number per Flow orTidal Stageb,c
Sampling SOPReference
Rationale for SamplingLocation
High Flow Events
Newark BayNorth – middle ofshipping channelat northern edgeof Newark BayChannel
WaterTwo:3 ft below surface3 ft from bottom
Target Analytes.See Worksheet #15Group A in botheventsGroup B in oneevent
Four samples:Samples to be collectedspaced throughout thepredicted stormhydrograph: two on risinglimb, one near peak, oneon falling limb.
LPR-FI-04LPR-FI-05LPR-FI-06
Data to support CFT modelcalibration and validation –dynamics within NewarkBay. Potential estimation ofcontaminant fluxes within,to, and from Newark Bay.Provides data for NBSARAs and, when comparedto data from other stations,information to characterizepotential concentrationgradients of COPCs in thebay.

Quality Assurance Project PlanRI Water Column Monitoring/Small Volume Chemical Data CollectionLower Passaic River Restoration ProjectNew Jersey
Section: Worksheet #18Revision: 2
Date: August 2011Page 12 of 26
QAPP Worksheet #18 (UFP-QAPP Manual Section 3.1.1) Sampling Locations and Methods/SOP Requirements Table
J:\Water\ProjectFiles\P120\12182_Passaic\Tasks\CWCM\AECOM QAPP\2011803_Rev2\clean\20110810_CWCM-sv_QAPP_Rev2.docx
SamplingLocationa Matrix
DepthIntervals Analyses
Number of Samples perDepth Interval:
Number per Flow orTidal Stageb,c
Sampling SOPReference
Rationale for SamplingLocation
Newark BayEast – subtidalarea midwaybetween NewarkBay South andNewark BayNortheast,across from PortNewark
WaterTwo:3 ft below surface3 ft from bottom
Target Analytes.See Worksheet #15Group A in botheventsGroup B in oneevent
Four samples:Samples to be collectedspaced throughout thepredicted stormhydrograph: two on risinglimb, one near peak, oneon falling limb.
LPR-FI-04LPR-FI-05LPR-FI-06
Data to support CFT modelcalibration and validation –dynamics within NewarkBay. Potential estimation ofcontaminant fluxes within,to, and from Newark Baywhere wind-drivensediment resuspensionmay occur. Provides datafor NBSA RAs and, whencompared to data fromother stations, informationto characterize potentialconcentration gradients ofCOPCs in the bay.
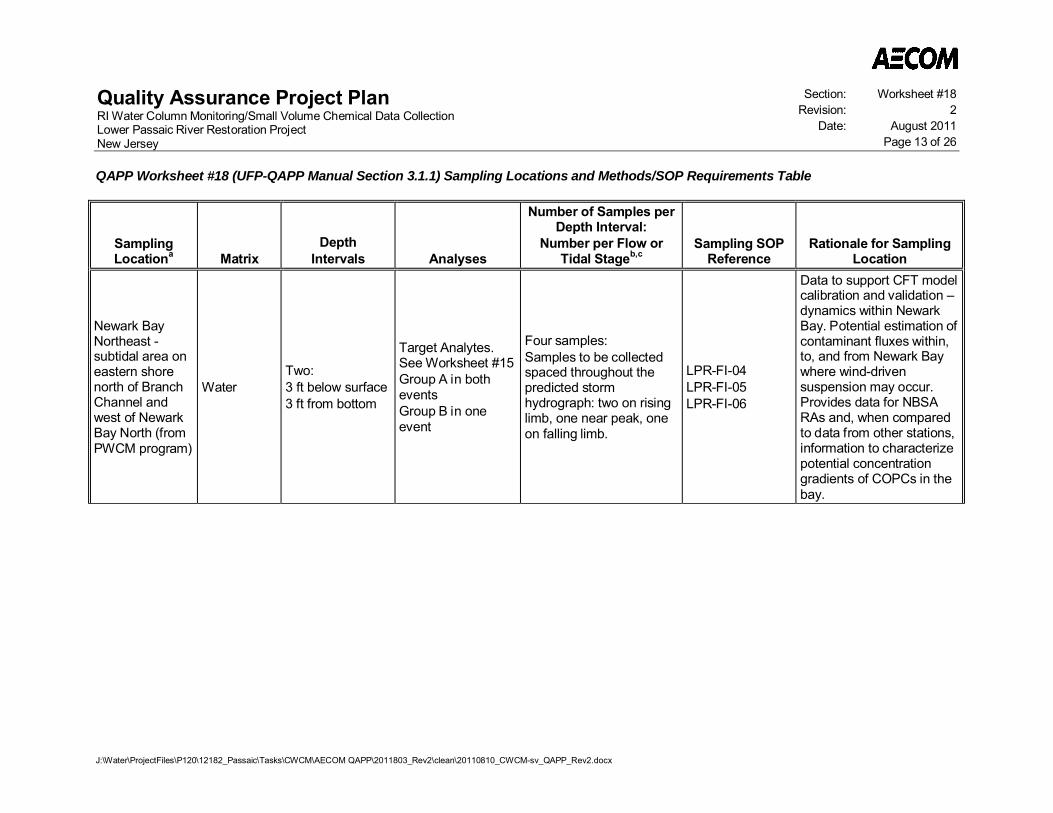
Quality Assurance Project PlanRI Water Column Monitoring/Small Volume Chemical Data CollectionLower Passaic River Restoration ProjectNew Jersey
Section: Worksheet #18Revision: 2
Date: August 2011Page 13 of 26
QAPP Worksheet #18 (UFP-QAPP Manual Section 3.1.1) Sampling Locations and Methods/SOP Requirements Table
J:\Water\ProjectFiles\P120\12182_Passaic\Tasks\CWCM\AECOM QAPP\2011803_Rev2\clean\20110810_CWCM-sv_QAPP_Rev2.docx
SamplingLocationa Matrix
DepthIntervals Analyses
Number of Samples perDepth Interval:
Number per Flow orTidal Stageb,c
Sampling SOPReference
Rationale for SamplingLocation
Newark BayNortheast -subtidal area oneastern shorenorth of BranchChannel andwest of NewarkBay North (fromPWCM program)
WaterTwo:3 ft below surface3 ft from bottom
Target Analytes.See Worksheet #15Group A in botheventsGroup B in oneevent
Four samples:Samples to be collectedspaced throughout thepredicted stormhydrograph: two on risinglimb, one near peak, oneon falling limb.
LPR-FI-04LPR-FI-05LPR-FI-06
Data to support CFT modelcalibration and validation –dynamics within NewarkBay. Potential estimation ofcontaminant fluxes within,to, and from Newark Baywhere wind-drivensuspension may occur.Provides data for NBSARAs and, when comparedto data from other stations,information to characterizepotential concentrationgradients of COPCs in thebay.
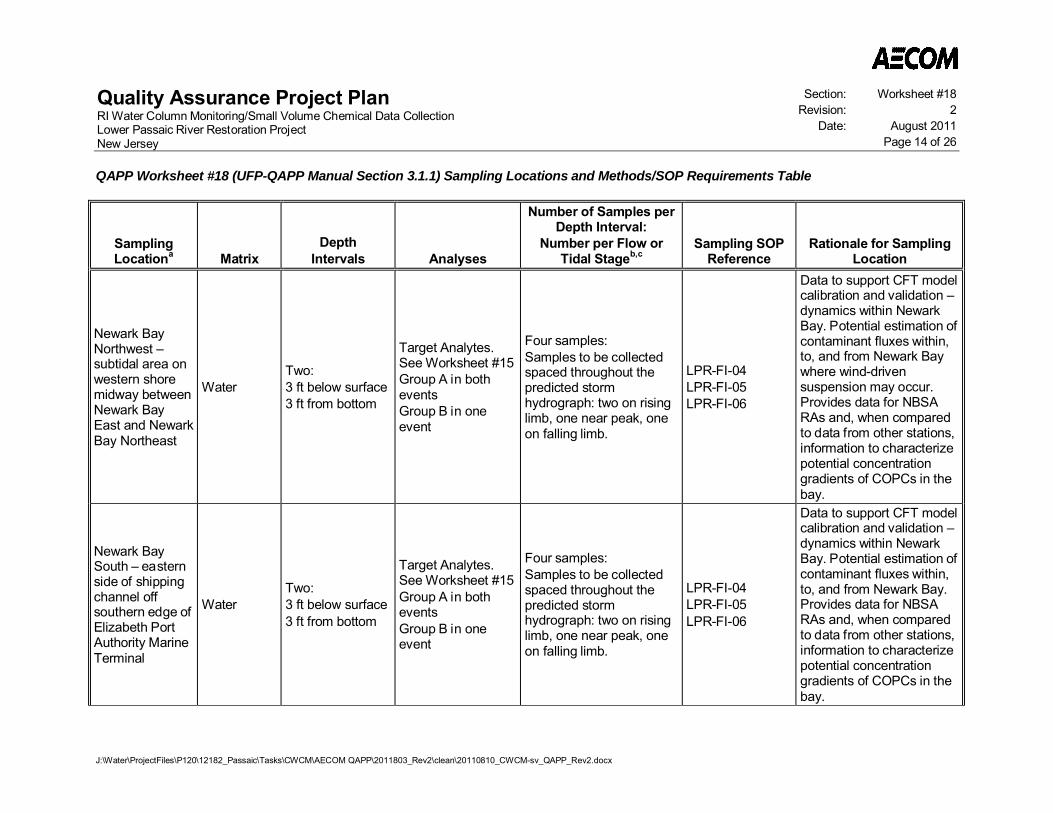
Quality Assurance Project PlanRI Water Column Monitoring/Small Volume Chemical Data CollectionLower Passaic River Restoration ProjectNew Jersey
Section: Worksheet #18Revision: 2
Date: August 2011Page 14 of 26
QAPP Worksheet #18 (UFP-QAPP Manual Section 3.1.1) Sampling Locations and Methods/SOP Requirements Table
J:\Water\ProjectFiles\P120\12182_Passaic\Tasks\CWCM\AECOM QAPP\2011803_Rev2\clean\20110810_CWCM-sv_QAPP_Rev2.docx
SamplingLocationa Matrix
DepthIntervals Analyses
Number of Samples perDepth Interval:
Number per Flow orTidal Stageb,c
Sampling SOPReference
Rationale for SamplingLocation
Newark BayNorthwest –subtidal area onwestern shoremidway betweenNewark BayEast and NewarkBay Northeast
WaterTwo:3 ft below surface3 ft from bottom
Target Analytes.See Worksheet #15Group A in botheventsGroup B in oneevent
Four samples:Samples to be collectedspaced throughout thepredicted stormhydrograph: two on risinglimb, one near peak, oneon falling limb.
LPR-FI-04LPR-FI-05LPR-FI-06
Data to support CFT modelcalibration and validation –dynamics within NewarkBay. Potential estimation ofcontaminant fluxes within,to, and from Newark Baywhere wind-drivensuspension may occur.Provides data for NBSARAs and, when comparedto data from other stations,information to characterizepotential concentrationgradients of COPCs in thebay.
Newark BaySouth – easternside of shippingchannel offsouthern edge ofElizabeth PortAuthority MarineTerminal
WaterTwo:3 ft below surface3 ft from bottom
Target Analytes.See Worksheet #15Group A in botheventsGroup B in oneevent
Four samples:Samples to be collectedspaced throughout thepredicted stormhydrograph: two on risinglimb, one near peak, oneon falling limb.
LPR-FI-04LPR-FI-05LPR-FI-06
Data to support CFT modelcalibration and validation –dynamics within NewarkBay. Potential estimation ofcontaminant fluxes within,to, and from Newark Bay.Provides data for NBSARAs and, when comparedto data from other stations,information to characterizepotential concentrationgradients of COPCs in thebay.

Quality Assurance Project PlanRI Water Column Monitoring/Small Volume Chemical Data CollectionLower Passaic River Restoration ProjectNew Jersey
Section: Worksheet #18Revision: 2
Date: August 2011Page 15 of 26
QAPP Worksheet #18 (UFP-QAPP Manual Section 3.1.1) Sampling Locations and Methods/SOP Requirements Table
J:\Water\ProjectFiles\P120\12182_Passaic\Tasks\CWCM\AECOM QAPP\2011803_Rev2\clean\20110810_CWCM-sv_QAPP_Rev2.docx
SamplingLocationa Matrix
DepthIntervals Analyses
Number of Samples perDepth Interval:
Number per Flow orTidal Stageb,c
Sampling SOPReference
Rationale for SamplingLocation
Arthur Kill nearArthur Kill Park Water
Two:3 ft below surface3 ft from bottom
Target Analytes.See Worksheet #15Group A in botheventsGroup B in oneevent
Two samples:One High SlackOne Low Slack
LPR-FI-04LPR-FI-05LPR-FI-06
Data to support CFT modelcalibration and validation –exchange with the ArthurKill. Potential estimation ofcontaminant fluxesbetween Newark Bay andthe Arthur Kill.
Kill van Kull neareastern edge ofMayor Dennis P.Collins Park
WaterTwo:3 ft below surface3 ft from bottom
Target Analytes.See Worksheet #15Group A in botheventsGroup B in oneevent
Two samples:One High SlackOne Low Slack
LPR-FI-04LPR-FI-05LPR-FI-06
Data to support CFT modelcalibration and validation –exchange with the Kill vanKull. Potential estimation ofcontaminant fluxesbetween Newark Bay andthe Kill van Kull.
HackensackRiver north ofthe PulaskiSkyway
WaterTwo:3 ft below surface3 ft from bottom
Target Analytes.See Worksheet #15Group A in botheventsGroup B in oneevent
Four samples:Samples to be collectedspaced throughout thepredicted stormhydrograph: two on risinglimb, one near peak, oneon falling limb.
LPR-FI-04LPR-FI-05LPR-FI-06
Data to support CFT modelcalibration and validation-exchange with theHackensack River.Potential estimation ofcontaminant fluxesbetween Newark Bay andthe Hackensack River.
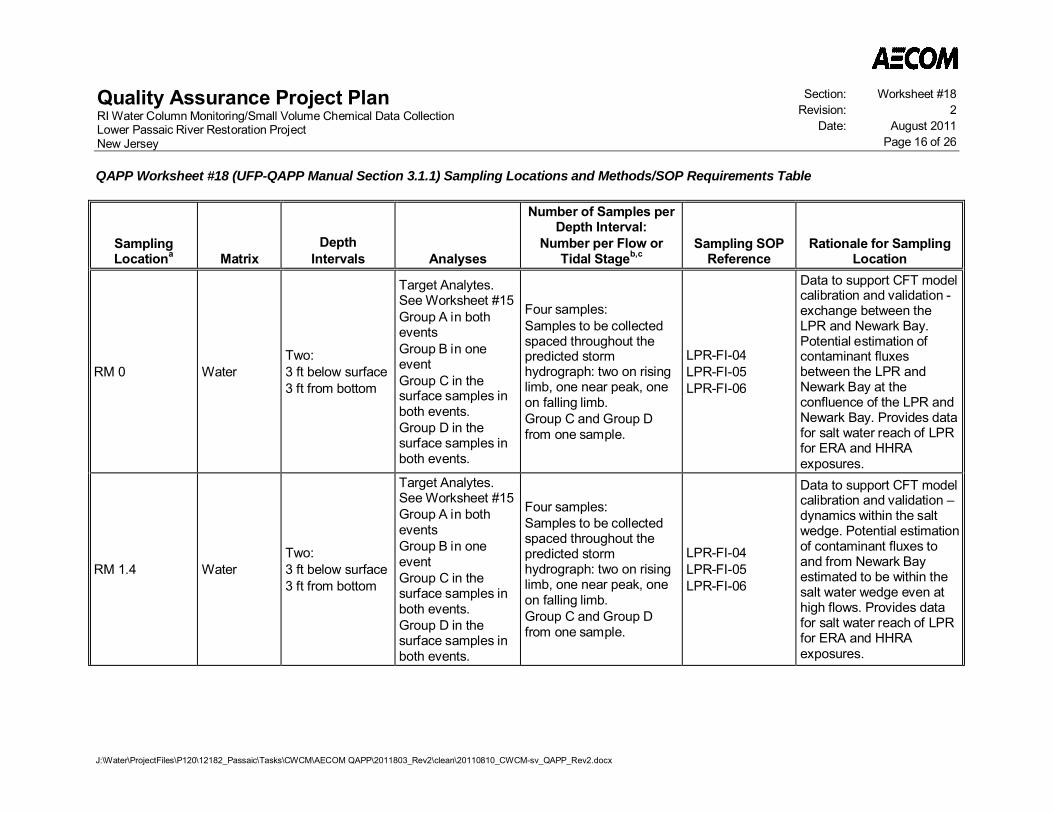
Quality Assurance Project PlanRI Water Column Monitoring/Small Volume Chemical Data CollectionLower Passaic River Restoration ProjectNew Jersey
Section: Worksheet #18Revision: 2
Date: August 2011Page 16 of 26
QAPP Worksheet #18 (UFP-QAPP Manual Section 3.1.1) Sampling Locations and Methods/SOP Requirements Table
J:\Water\ProjectFiles\P120\12182_Passaic\Tasks\CWCM\AECOM QAPP\2011803_Rev2\clean\20110810_CWCM-sv_QAPP_Rev2.docx
SamplingLocationa Matrix
DepthIntervals Analyses
Number of Samples perDepth Interval:
Number per Flow orTidal Stageb,c
Sampling SOPReference
Rationale for SamplingLocation
RM 0 WaterTwo:3 ft below surface3 ft from bottom
Target Analytes.See Worksheet #15Group A in botheventsGroup B in oneeventGroup C in thesurface samples inboth events.Group D in thesurface samples inboth events.
Four samples:Samples to be collectedspaced throughout thepredicted stormhydrograph: two on risinglimb, one near peak, oneon falling limb.Group C and Group Dfrom one sample.
LPR-FI-04LPR-FI-05LPR-FI-06
Data to support CFT modelcalibration and validation -exchange between theLPR and Newark Bay.Potential estimation ofcontaminant fluxesbetween the LPR andNewark Bay at theconfluence of the LPR andNewark Bay. Provides datafor salt water reach of LPRfor ERA and HHRAexposures.
RM 1.4 WaterTwo:3 ft below surface3 ft from bottom
Target Analytes.See Worksheet #15Group A in botheventsGroup B in oneeventGroup C in thesurface samples inboth events.Group D in thesurface samples inboth events.
Four samples:Samples to be collectedspaced throughout thepredicted stormhydrograph: two on risinglimb, one near peak, oneon falling limb.Group C and Group Dfrom one sample.
LPR-FI-04LPR-FI-05LPR-FI-06
Data to support CFT modelcalibration and validation –dynamics within the saltwedge. Potential estimationof contaminant fluxes toand from Newark Bayestimated to be within thesalt water wedge even athigh flows. Provides datafor salt water reach of LPRfor ERA and HHRAexposures.
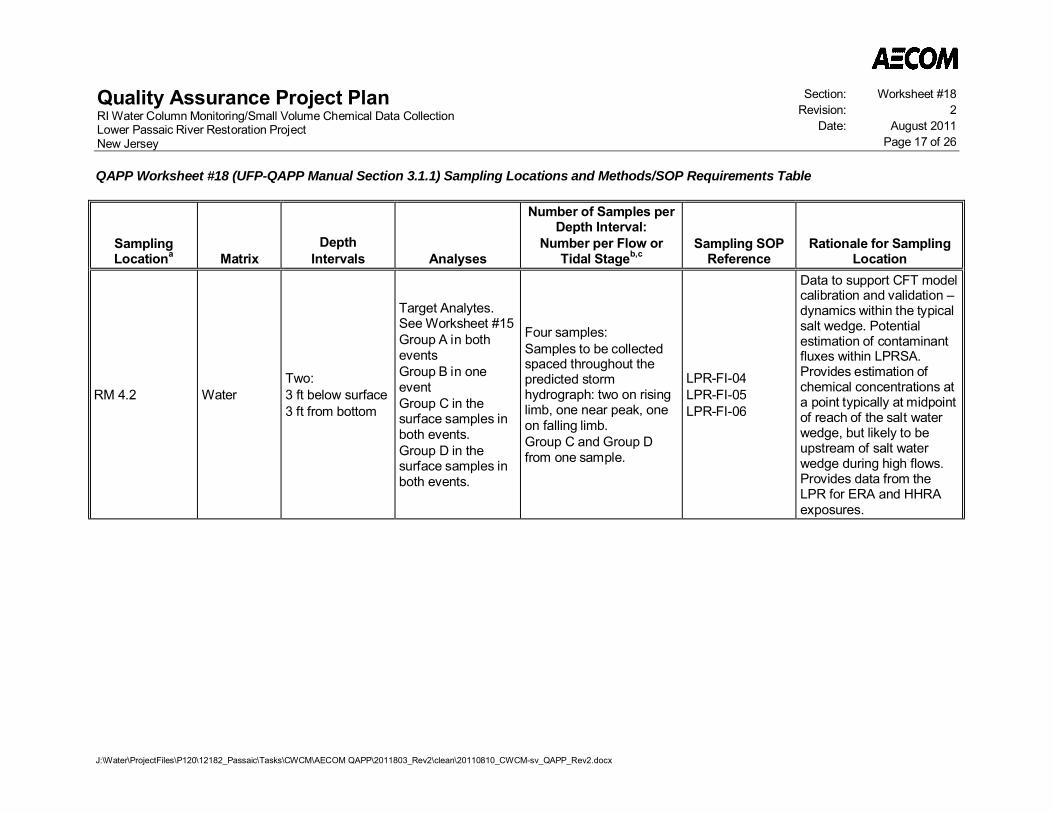
Quality Assurance Project PlanRI Water Column Monitoring/Small Volume Chemical Data CollectionLower Passaic River Restoration ProjectNew Jersey
Section: Worksheet #18Revision: 2
Date: August 2011Page 17 of 26
QAPP Worksheet #18 (UFP-QAPP Manual Section 3.1.1) Sampling Locations and Methods/SOP Requirements Table
J:\Water\ProjectFiles\P120\12182_Passaic\Tasks\CWCM\AECOM QAPP\2011803_Rev2\clean\20110810_CWCM-sv_QAPP_Rev2.docx
SamplingLocationa Matrix
DepthIntervals Analyses
Number of Samples perDepth Interval:
Number per Flow orTidal Stageb,c
Sampling SOPReference
Rationale for SamplingLocation
RM 4.2 WaterTwo:3 ft below surface3 ft from bottom
Target Analytes.See Worksheet #15Group A in botheventsGroup B in oneeventGroup C in thesurface samples inboth events.Group D in thesurface samples inboth events.
Four samples:Samples to be collectedspaced throughout thepredicted stormhydrograph: two on risinglimb, one near peak, oneon falling limb.Group C and Group Dfrom one sample.
LPR-FI-04LPR-FI-05LPR-FI-06
Data to support CFT modelcalibration and validation –dynamics within the typicalsalt wedge. Potentialestimation of contaminantfluxes within LPRSA.Provides estimation ofchemical concentrations ata point typically at midpointof reach of the salt waterwedge, but likely to beupstream of salt waterwedge during high flows.Provides data from theLPR for ERA and HHRAexposures.
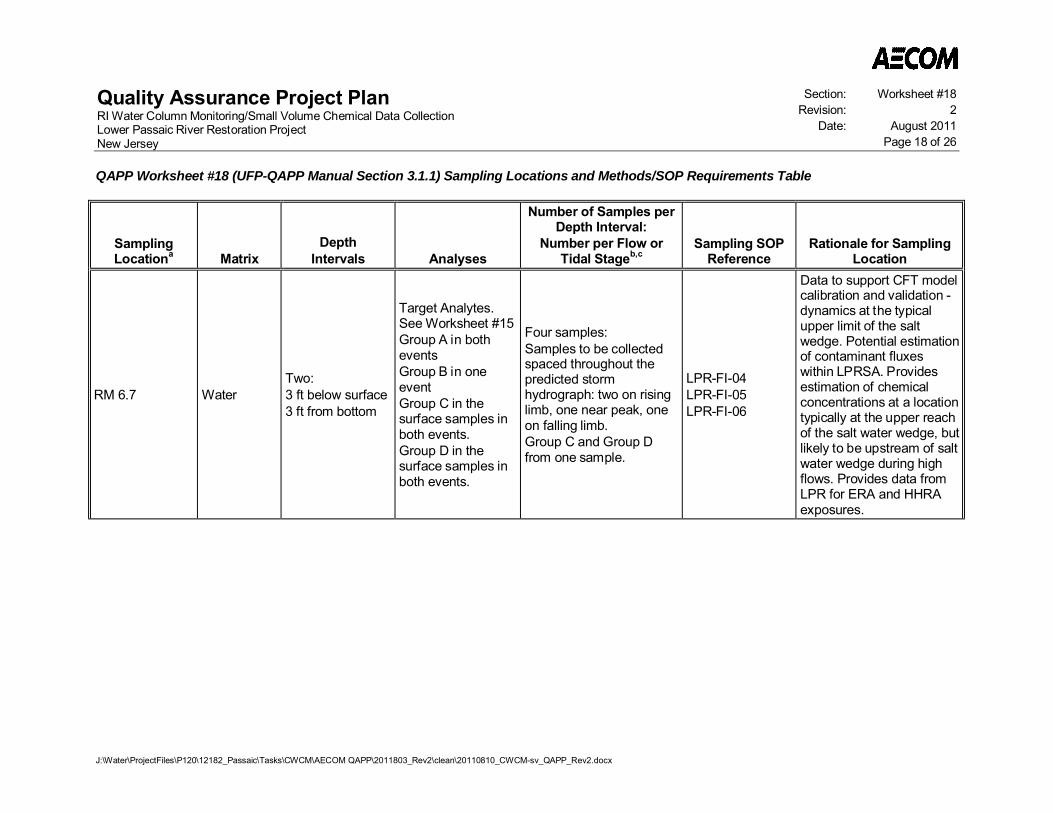
Quality Assurance Project PlanRI Water Column Monitoring/Small Volume Chemical Data CollectionLower Passaic River Restoration ProjectNew Jersey
Section: Worksheet #18Revision: 2
Date: August 2011Page 18 of 26
QAPP Worksheet #18 (UFP-QAPP Manual Section 3.1.1) Sampling Locations and Methods/SOP Requirements Table
J:\Water\ProjectFiles\P120\12182_Passaic\Tasks\CWCM\AECOM QAPP\2011803_Rev2\clean\20110810_CWCM-sv_QAPP_Rev2.docx
SamplingLocationa Matrix
DepthIntervals Analyses
Number of Samples perDepth Interval:
Number per Flow orTidal Stageb,c
Sampling SOPReference
Rationale for SamplingLocation
RM 6.7 WaterTwo:3 ft below surface3 ft from bottom
Target Analytes.See Worksheet #15Group A in botheventsGroup B in oneeventGroup C in thesurface samples inboth events.Group D in thesurface samples inboth events.
Four samples:Samples to be collectedspaced throughout thepredicted stormhydrograph: two on risinglimb, one near peak, oneon falling limb.Group C and Group Dfrom one sample.
LPR-FI-04LPR-FI-05LPR-FI-06
Data to support CFT modelcalibration and validation -dynamics at the typicalupper limit of the saltwedge. Potential estimationof contaminant fluxeswithin LPRSA. Providesestimation of chemicalconcentrations at a locationtypically at the upper reachof the salt water wedge, butlikely to be upstream of saltwater wedge during highflows. Provides data fromLPR for ERA and HHRAexposures.
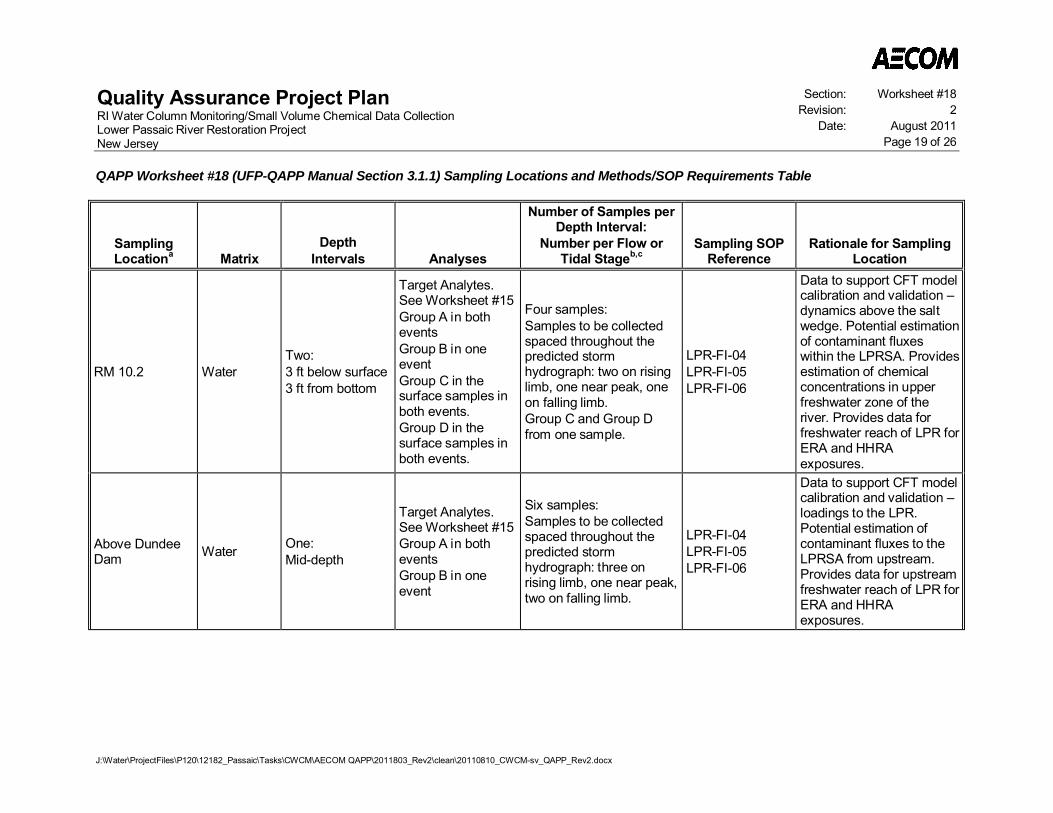
Quality Assurance Project PlanRI Water Column Monitoring/Small Volume Chemical Data CollectionLower Passaic River Restoration ProjectNew Jersey
Section: Worksheet #18Revision: 2
Date: August 2011Page 19 of 26
QAPP Worksheet #18 (UFP-QAPP Manual Section 3.1.1) Sampling Locations and Methods/SOP Requirements Table
J:\Water\ProjectFiles\P120\12182_Passaic\Tasks\CWCM\AECOM QAPP\2011803_Rev2\clean\20110810_CWCM-sv_QAPP_Rev2.docx
SamplingLocationa Matrix
DepthIntervals Analyses
Number of Samples perDepth Interval:
Number per Flow orTidal Stageb,c
Sampling SOPReference
Rationale for SamplingLocation
RM 10.2 WaterTwo:3 ft below surface3 ft from bottom
Target Analytes.See Worksheet #15Group A in botheventsGroup B in oneeventGroup C in thesurface samples inboth events.Group D in thesurface samples inboth events.
Four samples:Samples to be collectedspaced throughout thepredicted stormhydrograph: two on risinglimb, one near peak, oneon falling limb.Group C and Group Dfrom one sample.
LPR-FI-04LPR-FI-05LPR-FI-06
Data to support CFT modelcalibration and validation –dynamics above the saltwedge. Potential estimationof contaminant fluxeswithin the LPRSA. Providesestimation of chemicalconcentrations in upperfreshwater zone of theriver. Provides data forfreshwater reach of LPR forERA and HHRAexposures.
Above DundeeDam Water One:
Mid-depth
Target Analytes.See Worksheet #15Group A in botheventsGroup B in oneevent
Six samples:Samples to be collectedspaced throughout thepredicted stormhydrograph: three onrising limb, one near peak,two on falling limb.
LPR-FI-04LPR-FI-05LPR-FI-06
Data to support CFT modelcalibration and validation –loadings to the LPR.Potential estimation ofcontaminant fluxes to theLPRSA from upstream.Provides data for upstreamfreshwater reach of LPR forERA and HHRAexposures.

Quality Assurance Project PlanRI Water Column Monitoring/Small Volume Chemical Data CollectionLower Passaic River Restoration ProjectNew Jersey
Section: Worksheet #18Revision: 2
Date: August 2011Page 20 of 26
QAPP Worksheet #18 (UFP-QAPP Manual Section 3.1.1) Sampling Locations and Methods/SOP Requirements Table
J:\Water\ProjectFiles\P120\12182_Passaic\Tasks\CWCM\AECOM QAPP\2011803_Rev2\clean\20110810_CWCM-sv_QAPP_Rev2.docx
SamplingLocationa Matrix
DepthIntervals Analyses
Number of Samples perDepth Interval:
Number per Flow orTidal Stageb,c
Sampling SOPReference
Rationale for SamplingLocation
Saddle River-Saddle RiverAvenue Bridge
Water One:Mid-depth
Target Analytes.See Worksheet #15Group A in botheventsGroup B in oneevent
Four samples:Samples to be collectedspaced throughout thepredicted stormhydrograph: two on risinglimb, one near peak, oneon falling limb.
LPR-FI-04LPR-FI-05LPR-FI-06
Data to support CFT modelcalibration and validation –loadings to the LPR.Potential estimation ofcontaminant fluxes to theLPRSA from thewatershed. Provides datafor tributaries of LPR forERA and HHRAexposures.
Second River-WashingtonAvenue Bridge
Water One:Mid-depth
Target Analytes.See Worksheet #15Group A in botheventsGroup B in oneevent
Four samples:Samples to be collectedspaced throughout thepredicted stormhydrograph: two on risinglimb, one near peak, oneon falling limb.
LPR-FI-04LPR-FI-05LPR-FI-06
Data to support CFT modelcalibration and validation –loadings to the LPR.Potential estimation ofcontaminant fluxes to theLPRSA from thewatershed. Provides datafor tributaries of LPR forERA and HHRAexposures.
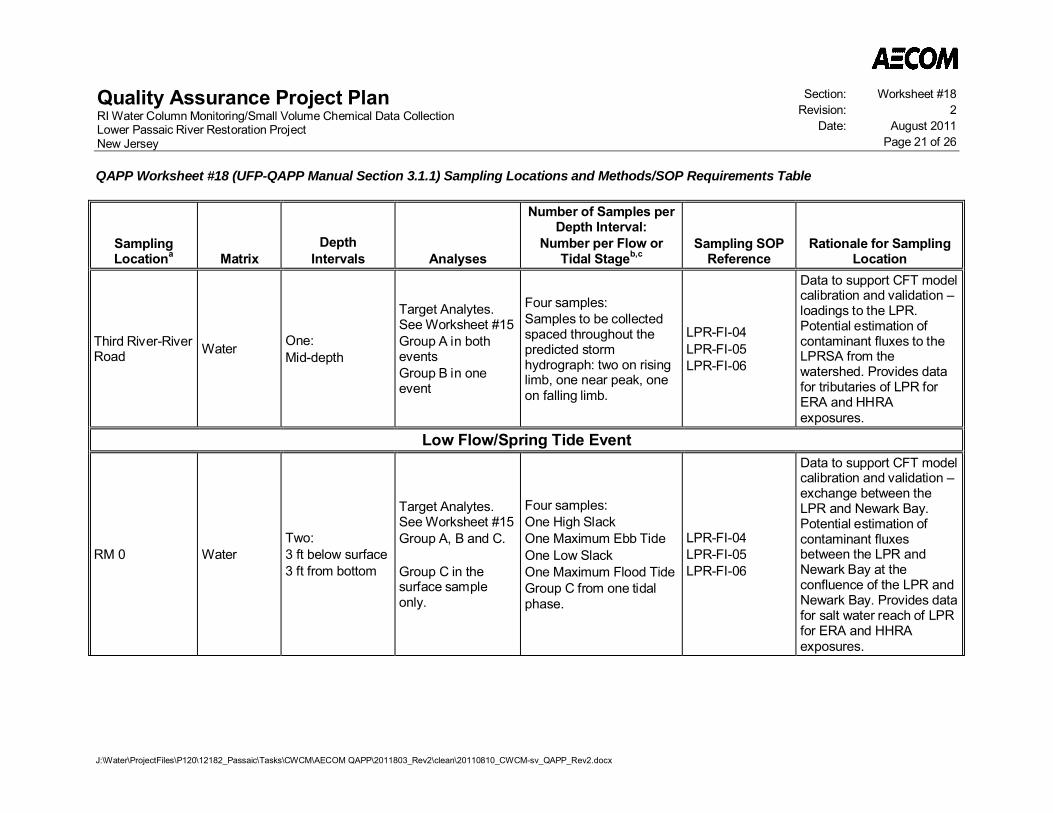
Quality Assurance Project PlanRI Water Column Monitoring/Small Volume Chemical Data CollectionLower Passaic River Restoration ProjectNew Jersey
Section: Worksheet #18Revision: 2
Date: August 2011Page 21 of 26
QAPP Worksheet #18 (UFP-QAPP Manual Section 3.1.1) Sampling Locations and Methods/SOP Requirements Table
J:\Water\ProjectFiles\P120\12182_Passaic\Tasks\CWCM\AECOM QAPP\2011803_Rev2\clean\20110810_CWCM-sv_QAPP_Rev2.docx
SamplingLocationa Matrix
DepthIntervals Analyses
Number of Samples perDepth Interval:
Number per Flow orTidal Stageb,c
Sampling SOPReference
Rationale for SamplingLocation
Third River-RiverRoad Water One:
Mid-depth
Target Analytes.See Worksheet #15Group A in botheventsGroup B in oneevent
Four samples:Samples to be collectedspaced throughout thepredicted stormhydrograph: two on risinglimb, one near peak, oneon falling limb.
LPR-FI-04LPR-FI-05LPR-FI-06
Data to support CFT modelcalibration and validation –loadings to the LPR.Potential estimation ofcontaminant fluxes to theLPRSA from thewatershed. Provides datafor tributaries of LPR forERA and HHRAexposures.
Low Flow/Spring Tide Event
RM 0 WaterTwo:3 ft below surface3 ft from bottom
Target Analytes.See Worksheet #15Group A, B and C.
Group C in thesurface sampleonly.
Four samples:One High SlackOne Maximum Ebb TideOne Low SlackOne Maximum Flood TideGroup C from one tidalphase.
LPR-FI-04LPR-FI-05LPR-FI-06
Data to support CFT modelcalibration and validation –exchange between theLPR and Newark Bay.Potential estimation ofcontaminant fluxesbetween the LPR andNewark Bay at theconfluence of the LPR andNewark Bay. Provides datafor salt water reach of LPRfor ERA and HHRAexposures.
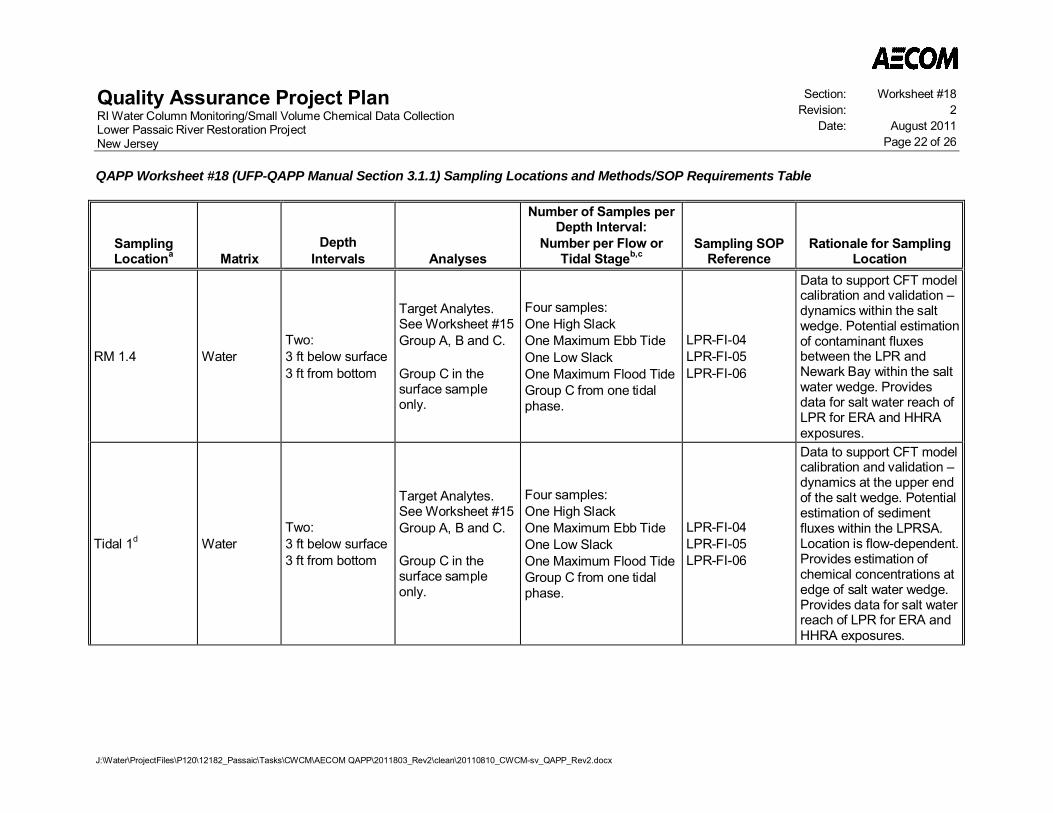
Quality Assurance Project PlanRI Water Column Monitoring/Small Volume Chemical Data CollectionLower Passaic River Restoration ProjectNew Jersey
Section: Worksheet #18Revision: 2
Date: August 2011Page 22 of 26
QAPP Worksheet #18 (UFP-QAPP Manual Section 3.1.1) Sampling Locations and Methods/SOP Requirements Table
J:\Water\ProjectFiles\P120\12182_Passaic\Tasks\CWCM\AECOM QAPP\2011803_Rev2\clean\20110810_CWCM-sv_QAPP_Rev2.docx
SamplingLocationa Matrix
DepthIntervals Analyses
Number of Samples perDepth Interval:
Number per Flow orTidal Stageb,c
Sampling SOPReference
Rationale for SamplingLocation
RM 1.4 WaterTwo:3 ft below surface3 ft from bottom
Target Analytes.See Worksheet #15Group A, B and C.
Group C in thesurface sampleonly.
Four samples:One High SlackOne Maximum Ebb TideOne Low SlackOne Maximum Flood TideGroup C from one tidalphase.
LPR-FI-04LPR-FI-05LPR-FI-06
Data to support CFT modelcalibration and validation –dynamics within the saltwedge. Potential estimationof contaminant fluxesbetween the LPR andNewark Bay within the saltwater wedge. Providesdata for salt water reach ofLPR for ERA and HHRAexposures.
Tidal 1d WaterTwo:3 ft below surface3 ft from bottom
Target Analytes.See Worksheet #15Group A, B and C.
Group C in thesurface sampleonly.
Four samples:One High SlackOne Maximum Ebb TideOne Low SlackOne Maximum Flood TideGroup C from one tidalphase.
LPR-FI-04LPR-FI-05LPR-FI-06
Data to support CFT modelcalibration and validation –dynamics at the upper endof the salt wedge. Potentialestimation of sedimentfluxes within the LPRSA.Location is flow-dependent.Provides estimation ofchemical concentrations atedge of salt water wedge.Provides data for salt waterreach of LPR for ERA andHHRA exposures.
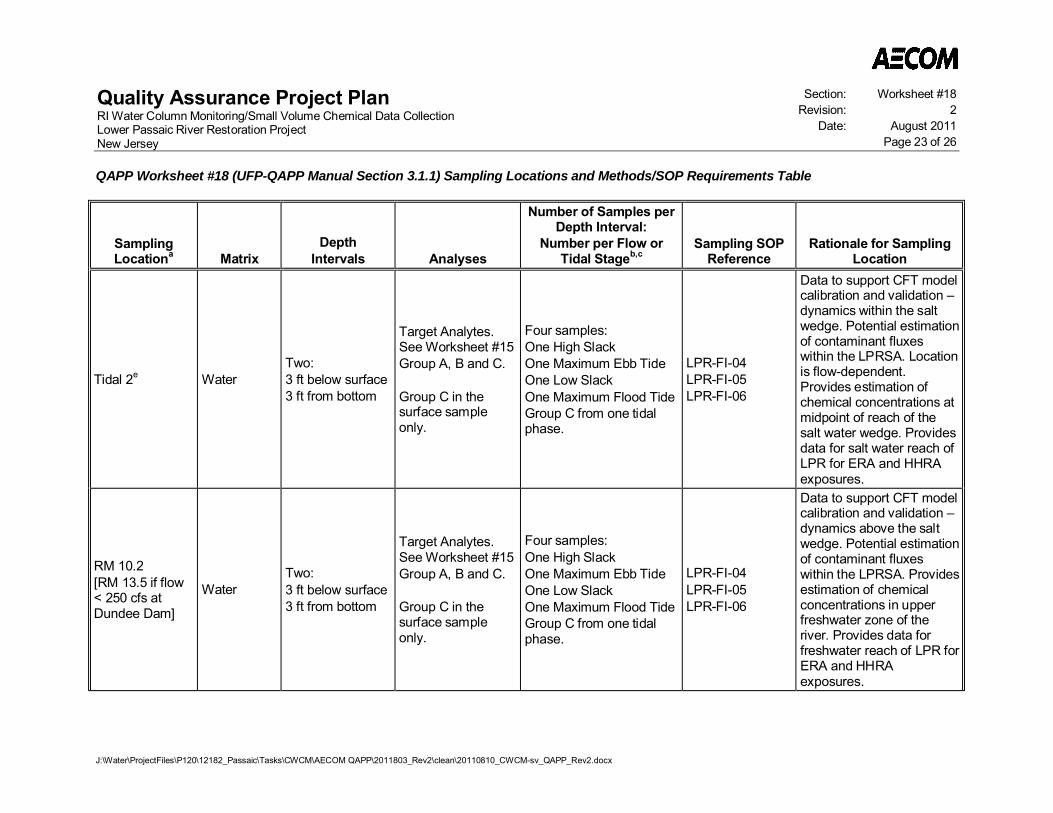
Quality Assurance Project PlanRI Water Column Monitoring/Small Volume Chemical Data CollectionLower Passaic River Restoration ProjectNew Jersey
Section: Worksheet #18Revision: 2
Date: August 2011Page 23 of 26
QAPP Worksheet #18 (UFP-QAPP Manual Section 3.1.1) Sampling Locations and Methods/SOP Requirements Table
J:\Water\ProjectFiles\P120\12182_Passaic\Tasks\CWCM\AECOM QAPP\2011803_Rev2\clean\20110810_CWCM-sv_QAPP_Rev2.docx
SamplingLocationa Matrix
DepthIntervals Analyses
Number of Samples perDepth Interval:
Number per Flow orTidal Stageb,c
Sampling SOPReference
Rationale for SamplingLocation
Tidal 2e WaterTwo:3 ft below surface3 ft from bottom
Target Analytes.See Worksheet #15Group A, B and C.
Group C in thesurface sampleonly.
Four samples:One High SlackOne Maximum Ebb TideOne Low SlackOne Maximum Flood TideGroup C from one tidalphase.
LPR-FI-04LPR-FI-05LPR-FI-06
Data to support CFT modelcalibration and validation –dynamics within the saltwedge. Potential estimationof contaminant fluxeswithin the LPRSA. Locationis flow-dependent.Provides estimation ofchemical concentrations atmidpoint of reach of thesalt water wedge. Providesdata for salt water reach ofLPR for ERA and HHRAexposures.
RM 10.2[RM 13.5 if flow< 250 cfs atDundee Dam]
WaterTwo:3 ft below surface3 ft from bottom
Target Analytes.See Worksheet #15Group A, B and C.
Group C in thesurface sampleonly.
Four samples:One High SlackOne Maximum Ebb TideOne Low SlackOne Maximum Flood TideGroup C from one tidalphase.
LPR-FI-04LPR-FI-05LPR-FI-06
Data to support CFT modelcalibration and validation –dynamics above the saltwedge. Potential estimationof contaminant fluxeswithin the LPRSA. Providesestimation of chemicalconcentrations in upperfreshwater zone of theriver. Provides data forfreshwater reach of LPR forERA and HHRAexposures.

Quality Assurance Project PlanRI Water Column Monitoring/Small Volume Chemical Data CollectionLower Passaic River Restoration ProjectNew Jersey
Section: Worksheet #18Revision: 2
Date: August 2011Page 24 of 26
QAPP Worksheet #18 (UFP-QAPP Manual Section 3.1.1) Sampling Locations and Methods/SOP Requirements Table
J:\Water\ProjectFiles\P120\12182_Passaic\Tasks\CWCM\AECOM QAPP\2011803_Rev2\clean\20110810_CWCM-sv_QAPP_Rev2.docx
SamplingLocationa Matrix
DepthIntervals Analyses
Number of Samples perDepth Interval:
Number per Flow orTidal Stageb,c
Sampling SOPReference
Rationale for SamplingLocation
Above DundeeDam Water One:
Mid-depth
Target Analytes.See Worksheet #15Group A and B
One sample:Independent of tide, butquasi-synoptic with otherstations
LPR-FI-04LPR-FI-05LPR-FI-06
Data to support CFT modelcalibration and validation –loadings to the LPR.Potential estimation ofcontaminant fluxes to theLPRSA from upstream.Provides data for upstreamfreshwater reach of LPR forERA and HHRAexposures.
Saddle River-Saddle RiverAvenue Bridge
Water One:Mid-depth
Target Analytes.See Worksheet #15Group A and B
One sample:Independent of tide, butquasi-synoptic with otherstations
LPR-FI-04LPR-FI-05LPR-FI-06
Data to support CFT modelcalibration and validation –loadings to the LPR.Potential estimation ofcontaminant fluxes to theLPRSA from thewatershed. Provides datafor tributaries of LPR forERA and HHRAexposures.
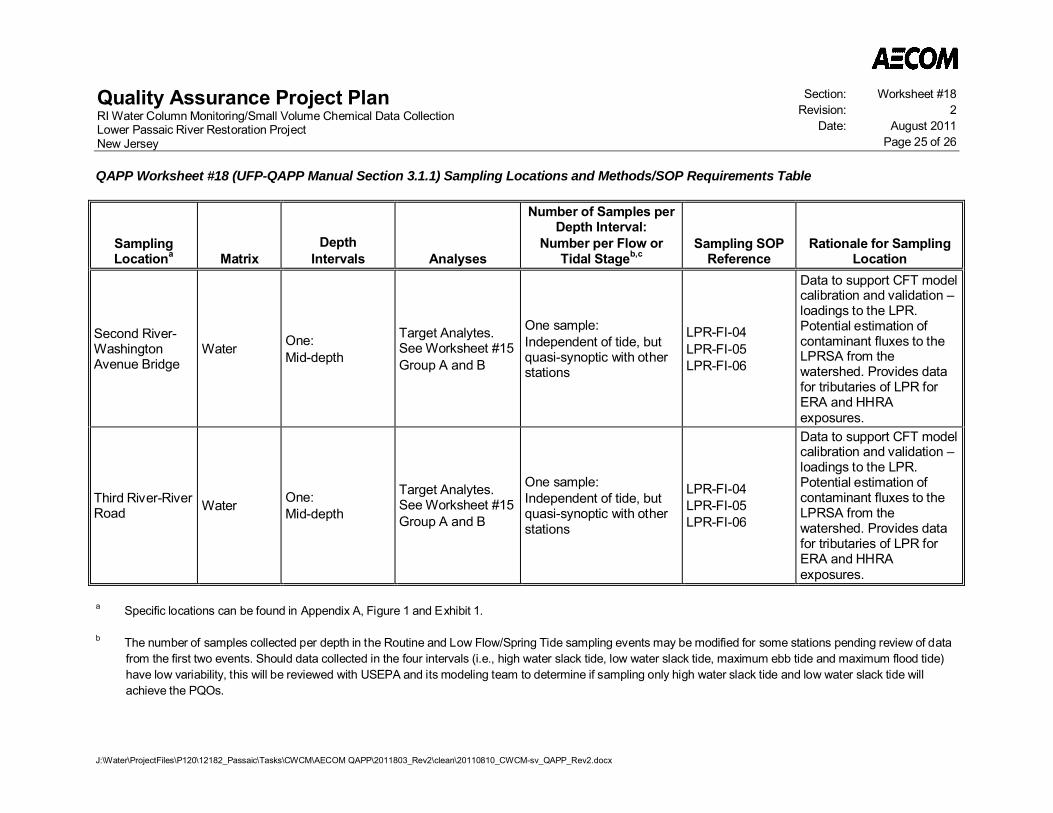
Quality Assurance Project PlanRI Water Column Monitoring/Small Volume Chemical Data CollectionLower Passaic River Restoration ProjectNew Jersey
Section: Worksheet #18Revision: 2
Date: August 2011Page 25 of 26
QAPP Worksheet #18 (UFP-QAPP Manual Section 3.1.1) Sampling Locations and Methods/SOP Requirements Table
J:\Water\ProjectFiles\P120\12182_Passaic\Tasks\CWCM\AECOM QAPP\2011803_Rev2\clean\20110810_CWCM-sv_QAPP_Rev2.docx
SamplingLocationa Matrix
DepthIntervals Analyses
Number of Samples perDepth Interval:
Number per Flow orTidal Stageb,c
Sampling SOPReference
Rationale for SamplingLocation
Second River-WashingtonAvenue Bridge
Water One:Mid-depth
Target Analytes.See Worksheet #15Group A and B
One sample:Independent of tide, butquasi-synoptic with otherstations
LPR-FI-04LPR-FI-05LPR-FI-06
Data to support CFT modelcalibration and validation –loadings to the LPR.Potential estimation ofcontaminant fluxes to theLPRSA from thewatershed. Provides datafor tributaries of LPR forERA and HHRAexposures.
Third River-RiverRoad Water One:
Mid-depth
Target Analytes.See Worksheet #15Group A and B
One sample:Independent of tide, butquasi-synoptic with otherstations
LPR-FI-04LPR-FI-05LPR-FI-06
Data to support CFT modelcalibration and validation –loadings to the LPR.Potential estimation ofcontaminant fluxes to theLPRSA from thewatershed. Provides datafor tributaries of LPR forERA and HHRAexposures.
a Specific locations can be found in Appendix A, Figure 1 and Exhibit 1.
b The number of samples collected per depth in the Routine and Low Flow/Spring Tide sampling events may be modified for some stations pending review of datafrom the first two events. Should data collected in the four intervals (i.e., high water slack tide, low water slack tide, maximum ebb tide and maximum flood tide)have low variability, this will be reviewed with USEPA and its modeling team to determine if sampling only high water slack tide and low water slack tide willachieve the PQOs.
Quality Assurance Project PlanRI Water Column Monitoring/Small Volume Chemical Data CollectionLower Passaic River Restoration ProjectNew Jersey
Section: Worksheet #18Revision: 2
Date: August 2011Page 26 of 26
QAPP Worksheet #18 (UFP-QAPP Manual Section 3.1.1) Sampling Locations and Methods/SOP Requirements Table
J:\Water\ProjectFiles\P120\12182_Passaic\Tasks\CWCM\AECOM QAPP\2011803_Rev2\clean\20110810_CWCM-sv_QAPP_Rev2.docx
c The number of stations in Newark Bay may be modified pending review of data from the first event. Should data collected from the stations indicate low variabilitybetween Newark Bay stations, this will be reviewed with USEPA and its modeling team to determine if fewer locations will achieve the PQOs.
d The location of Tidal 1 (applicable when flows are < 1,000 cfs) is based on the location of the salt wedge. Tidal 1 will be located approximately one miledownstream of the predicted location of the salt wedge. See Exhibit 1 of the FSP Addendum (Appendix A).
e The location of Tidal 2 (applicable when flows are < 1,000 cfs) is based on the location of the salt wedge and the location of Tidal 1. Tidal 2 will be locatedhalfway between Tidal 1 and RM 1.4, but not upstream of RM 4.2. See Exhibit 1 of the FSP Addendum (Appendix A).

Quality Assurance Project PlanRI Water Column Monitoring/Small Volume Chemical Data CollectionLower Passaic River Restoration ProjectNew Jersey
Section: Worksheet #19Revision: 2
Date: August 2011Page 1 of 5
J:\Water\ProjectFiles\P120\12182_Passaic\Tasks\CWCM\AECOM QAPP\2011803_Rev2\clean\20110810_CWCM-sv_QAPP_Rev2.docx
QAPP Worksheet #19 (UFP-QAPP Manual Section 3.1.1) Analytical SOP Requirements Table
Matrix Analytical GroupConcentration
Level
Analytical andPreparationMethod/SOPReferencea Sample Sizeb
Containers(number, size, and
type)Preservation
Requirements
Maximum HoldingTime
(preparation/ analysis)
Water VOCs Low C-1, C-2 120 milliliter(mL)
3 x 40mL VolatileOrganics Analysis(VOA) vials
4±2°Celsius (C) ,hydrochloric acid(HCl) to pH <2, storein the dark
14 days for preparationand analysis
Water SVOCs Low T-7, T-2 2 Liters (L)2 x 1L amber glass withPolytetrafluoroethylene(PTFE)-lined lid
4±2°C;store in the dark
7 days to preparation;40 days frompreparation to analysis
WaterPAHs(LRMS-SIM)
Low T-3, T-4 2 L 2 x 1L amber glass withPTFE-lined lid
4±2°C;store in the dark
7 days to preparation;40 days frompreparation to analysis
Water OC Pesticides Low T-11, T-12 2 L 2 x 1L amber glass withPTFE-lined lid
4±2°C;store in the dark
7 days to preparation;40 days frompreparation to analysis
Water PCBs (Homologsand Congeners) Low T-5,T-6 2 L 2 x 1L amber glass with
PTFE-lined lid4±2°C; store in thedark
365 days for preparationand analysis
Water PCDD/PCDFs Low A-1 2 L 2 x 1L amber glass withPTFE-lined lid
4±2°C;store in the dark
365 days for preparationand analysis
WaterTAL Metals andTitanium (excludesmercury )
Low C-3, C-4, C-5,C-6 2 L 2 x 1L plasticc Nitric acid (HNO3) to
pH<2
180 days (6 months) forpreparation andanalysis
Water Metalsd, excludingmercury (dissolved)
Low C-3, C-4, C-5,C-6
2 L 2 x 1L plasticc
Field filter (0.45micron [um]) andpreserve with HNO3
to pH<2
180 days (6 months) forpreparation andanalysis
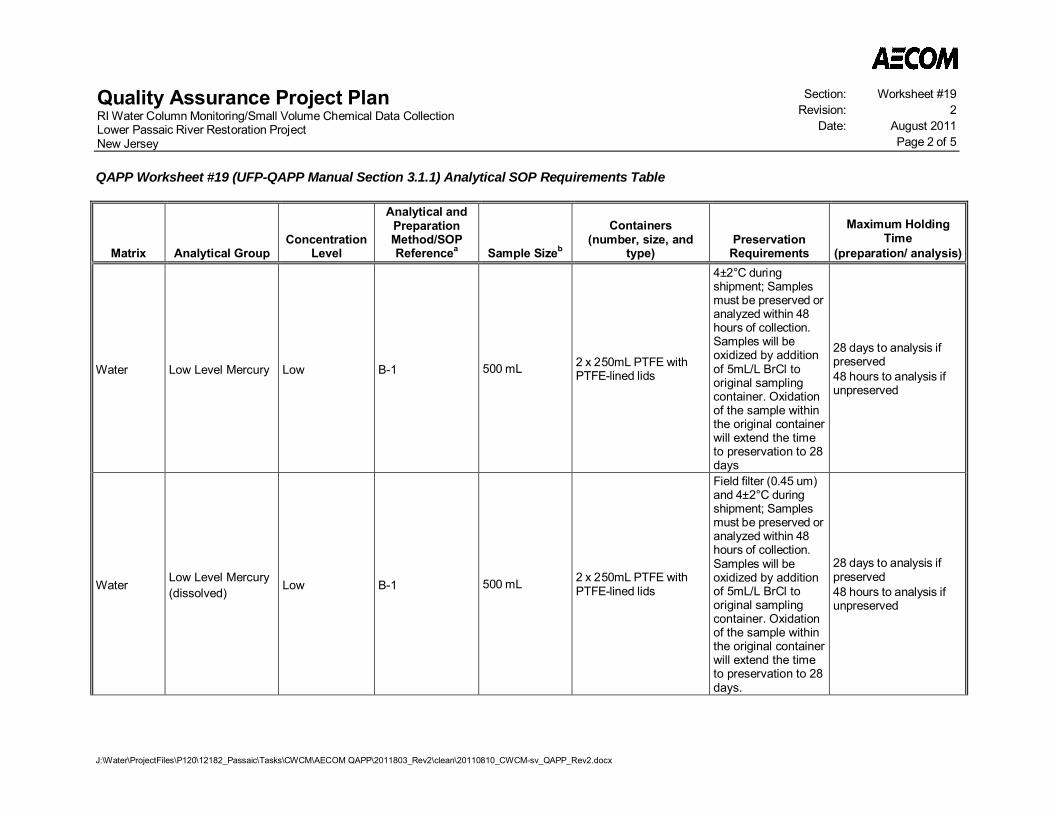
Quality Assurance Project PlanRI Water Column Monitoring/Small Volume Chemical Data CollectionLower Passaic River Restoration ProjectNew Jersey
Section: Worksheet #19Revision: 2
Date: August 2011Page 2 of 5
QAPP Worksheet #19 (UFP-QAPP Manual Section 3.1.1) Analytical SOP Requirements Table
J:\Water\ProjectFiles\P120\12182_Passaic\Tasks\CWCM\AECOM QAPP\2011803_Rev2\clean\20110810_CWCM-sv_QAPP_Rev2.docx
Matrix Analytical GroupConcentration
Level
Analytical andPreparationMethod/SOPReferencea Sample Sizeb
Containers(number, size, and
type)Preservation
Requirements
Maximum HoldingTime
(preparation/ analysis)
Water Low Level Mercury Low B-1 500 mL 2 x 250mL PTFE withPTFE-lined lids
4±2°C duringshipment; Samplesmust be preserved oranalyzed within 48hours of collection.Samples will beoxidized by additionof 5mL/L BrCl tooriginal samplingcontainer. Oxidationof the sample withinthe original containerwill extend the timeto preservation to 28days
28 days to analysis ifpreserved48 hours to analysis ifunpreserved
Water Low Level Mercury(dissolved) Low B-1 500 mL 2 x 250mL PTFE with
PTFE-lined lids
Field filter (0.45 um)and 4±2°C duringshipment; Samplesmust be preserved oranalyzed within 48hours of collection.Samples will beoxidized by additionof 5mL/L BrCl tooriginal samplingcontainer. Oxidationof the sample withinthe original containerwill extend the timeto preservation to 28days.
28 days to analysis ifpreserved48 hours to analysis ifunpreserved
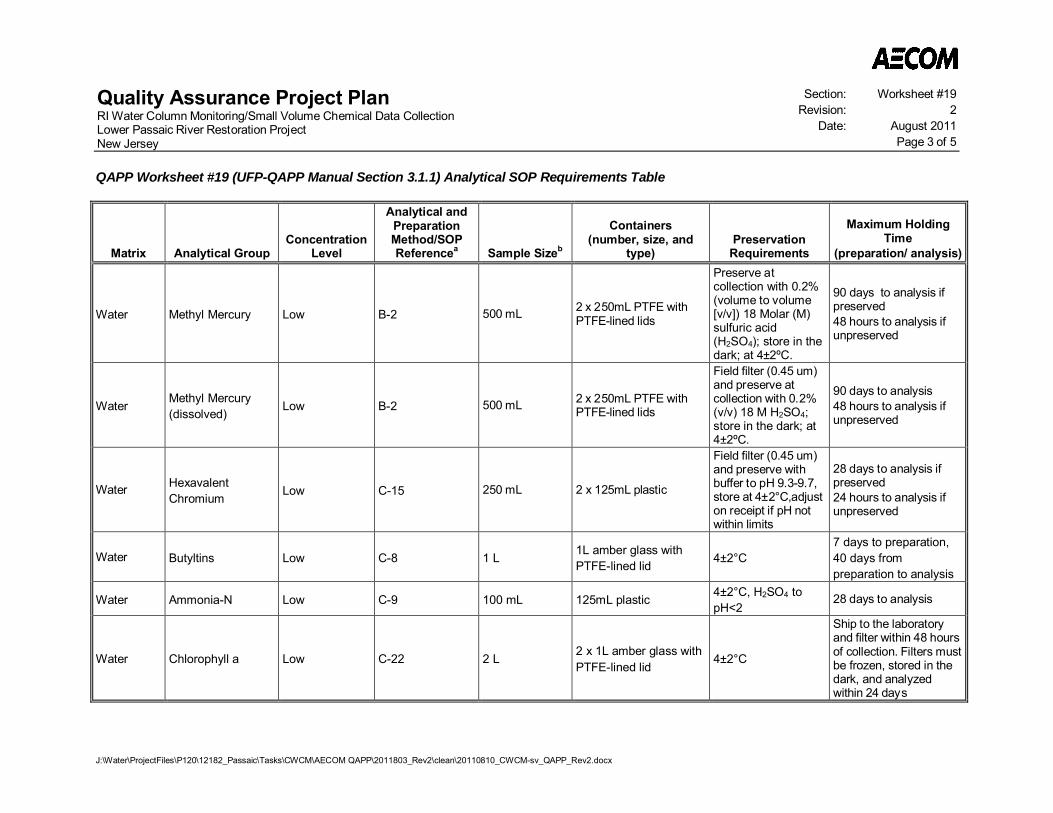
Quality Assurance Project PlanRI Water Column Monitoring/Small Volume Chemical Data CollectionLower Passaic River Restoration ProjectNew Jersey
Section: Worksheet #19Revision: 2
Date: August 2011Page 3 of 5
QAPP Worksheet #19 (UFP-QAPP Manual Section 3.1.1) Analytical SOP Requirements Table
J:\Water\ProjectFiles\P120\12182_Passaic\Tasks\CWCM\AECOM QAPP\2011803_Rev2\clean\20110810_CWCM-sv_QAPP_Rev2.docx
Matrix Analytical GroupConcentration
Level
Analytical andPreparationMethod/SOPReferencea Sample Sizeb
Containers(number, size, and
type)Preservation
Requirements
Maximum HoldingTime
(preparation/ analysis)
Water Methyl Mercury Low B-2 500 mL 2 x 250mL PTFE withPTFE-lined lids
Preserve atcollection with 0.2%(volume to volume[v/v]) 18 Molar (M)sulfuric acid(H2SO4); store in thedark; at 4±2ºC.
90 days to analysis ifpreserved48 hours to analysis ifunpreserved
Water Methyl Mercury(dissolved) Low B-2 500 mL 2 x 250mL PTFE with
PTFE-lined lids
Field filter (0.45 um)and preserve atcollection with 0.2%(v/v) 18 M H2SO4;store in the dark; at4±2ºC.
90 days to analysis48 hours to analysis ifunpreserved
Water HexavalentChromium Low C-15 250 mL 2 x 125mL plastic
Field filter (0.45 um)and preserve withbuffer to pH 9.3-9.7,store at 4±2°C,adjuston receipt if pH notwithin limits
28 days to analysis ifpreserved24 hours to analysis ifunpreserved
Water Butyltins Low C-8 1 L 1L amber glass withPTFE-lined lid 4±2°C
7 days to preparation,40 days frompreparation to analysis
Water Ammonia-N Low C-9 100 mL 125mL plastic 4±2°C, H2SO4 topH<2
28 days to analysis
Water Chlorophyll a Low C-22 2 L 2 x 1L amber glass withPTFE-lined lid
4±2°C
Ship to the laboratoryand filter within 48 hoursof collection. Filters mustbe frozen, stored in thedark, and analyzedwithin 24 days

Quality Assurance Project PlanRI Water Column Monitoring/Small Volume Chemical Data CollectionLower Passaic River Restoration ProjectNew Jersey
Section: Worksheet #19Revision: 2
Date: August 2011Page 4 of 5
QAPP Worksheet #19 (UFP-QAPP Manual Section 3.1.1) Analytical SOP Requirements Table
J:\Water\ProjectFiles\P120\12182_Passaic\Tasks\CWCM\AECOM QAPP\2011803_Rev2\clean\20110810_CWCM-sv_QAPP_Rev2.docx
Matrix Analytical GroupConcentration
Level
Analytical andPreparationMethod/SOPReferencea Sample Sizeb
Containers(number, size, and
type)Preservation
Requirements
Maximum HoldingTime
(preparation/ analysis)
Water Cyanide Low C-10 500 mL 2 x 250mL glass orplastic
4±2 C, sodiumhydroxide (NaOH) topH > 12
14 days to analysis
Water TKN Low C-12 1 L 1L glass or plastic 4±2°C, H2SO4 topH<2
28 days to analysis
Water Total Phosphorus Low C-11 250 mL 250mL glass or plastic 4±2 C; H2SO4 to pH< 2
28 days to analysis
Water TOC Low C-13 120 mL3 x 40mL amber glassvials with PTFE-linedlids
4±2 C; H2SO4 to pH< 2
28 days to analysis
Water POC/DOC Low C-13, C-16 600 mL 3 x 200mL plastic 4±2°C
Ship to the laboratoryand filter using a 0.7umglass fiber filter within48 hours. Filters andfiltrates must beanalyzed within 28 days
Water Total Sulfide Low C-14 100 mL 125mL plastic 4±2°C , NaOH to pH>9 +/Zinc Acetate 7 days to analysis
Water SSC Low C-17 2 L Two tared 1-L plastic
4±2°C; store in thedark; weigh entiresample bottle tonearest 0.1 g andrecord weight uponreceipt at laboratory
28 days to analysis
Water TDS Low C-19 400 mL 2 x 250mL glass orplastic
4±2°C 7 days to analysis
Water Alkalinity Low C-20 400 mL 2 x 250mL glass orplastic 4±2°C 14 days to analysis

Quality Assurance Project PlanRI Water Column Monitoring/Small Volume Chemical Data CollectionLower Passaic River Restoration ProjectNew Jersey
Section: Worksheet #19Revision: 2
Date: August 2011Page 5 of 5
QAPP Worksheet #19 (UFP-QAPP Manual Section 3.1.1) Analytical SOP Requirements Table
J:\Water\ProjectFiles\P120\12182_Passaic\Tasks\CWCM\AECOM QAPP\2011803_Rev2\clean\20110810_CWCM-sv_QAPP_Rev2.docx
Matrix Analytical GroupConcentration
Level
Analytical andPreparationMethod/SOPReferencea Sample Sizeb
Containers(number, size, and
type)Preservation
Requirements
Maximum HoldingTime
(preparation/ analysis)
Water Sulfate, Chloride Low C-21 50 mL 125mL glass or plastic 4±2°C 28 days to analysis
Water Bacteria Low E-1, E-2, E-3, E-4 400 mL 4 x 125mL glass orplastic sterile containers 1-10°C 6 hours to analysis
Water Protozoans Low S-1 1-10Le 1 x 10L carboy 1-20°C 96 hours from collectionto filtration
a Refer to Worksheet #23 for SOP titles and methodsb Sample size is the minimum requested by each laboratory to perform the requested analysis; minimum sample size requirements reflect the additional sample
needed to permit re-extraction and re-analysis . Additional sample volume is needed for field QC samples (e.g., matrix spikes).c High or low density polyethylene or polypropylene plastics will be acceptable.d Metals to be analyzed in filtered samples are arsenic, cadmium, chromium, copper, lead, nickel, selenium, and zinc.e Exact sample size collected and filtered is dependent on suspended sediment concentration.
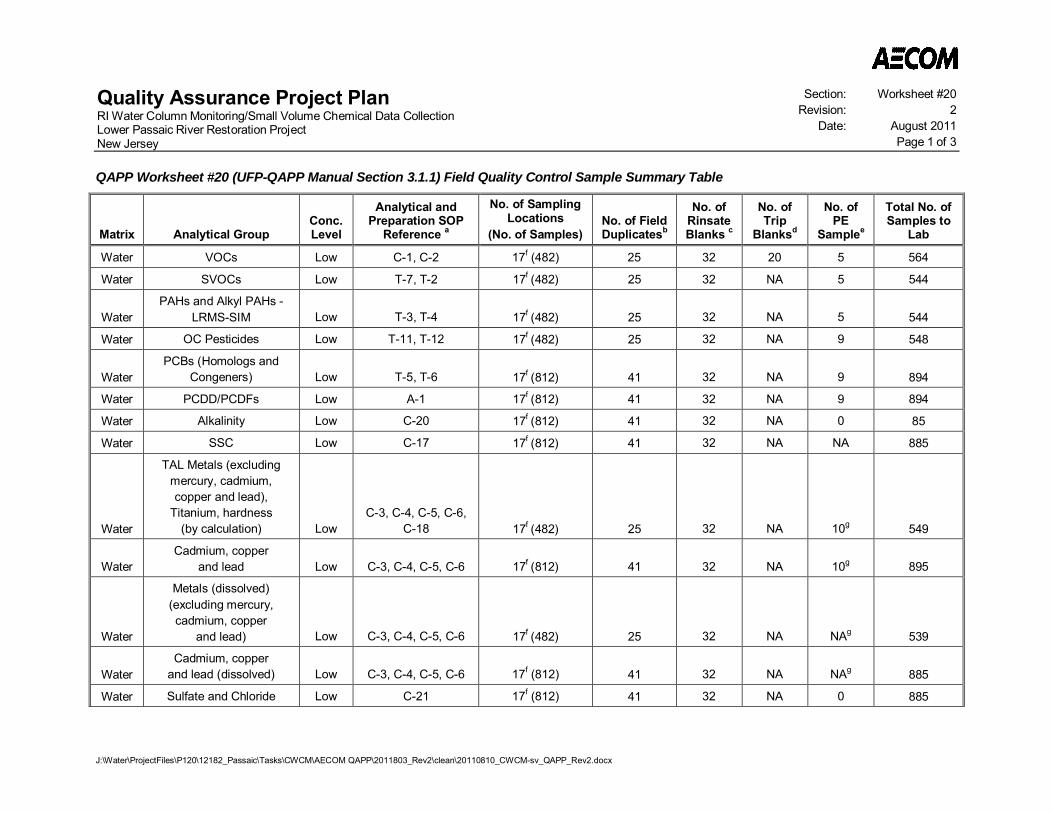
Quality Assurance Project PlanRI Water Column Monitoring/Small Volume Chemical Data CollectionLower Passaic River Restoration ProjectNew Jersey
Section: Worksheet #20Revision: 2
Date: August 2011Page 1 of 3
J:\Water\ProjectFiles\P120\12182_Passaic\Tasks\CWCM\AECOM QAPP\2011803_Rev2\clean\20110810_CWCM-sv_QAPP_Rev2.docx
QAPP Worksheet #20 (UFP-QAPP Manual Section 3.1.1) Field Quality Control Sample Summary Table
Matrix Analytical GroupConc.Level
Analytical andPreparation SOP
Reference a
No. of SamplingLocations
(No. of Samples)No. of FieldDuplicatesb
No. ofRinsateBlanks c
No. ofTrip
Blanksd
No. ofPE
Samplee
Total No. ofSamples to
Lab
Water VOCs Low C-1, C-2 17f (482) 25 32 20 5 564
Water SVOCs Low T-7, T-2 17f (482) 25 32 NA 5 544
WaterPAHs and Alkyl PAHs -
LRMS-SIM Low T-3, T-4 17f (482) 25 32 NA 5 544
Water OC Pesticides Low T-11, T-12 17f (482) 25 32 NA 9 548
WaterPCBs (Homologs and
Congeners) Low T-5, T-6 17f (812) 41 32 NA 9 894
Water PCDD/PCDFs Low A-1 17f (812) 41 32 NA 9 894
Water Alkalinity Low C-20 17f (812) 41 32 NA 0 85
Water SSC Low C-17 17f (812) 41 32 NA NA 885
Water
TAL Metals (excludingmercury, cadmium,copper and lead),
Titanium, hardness(by calculation) Low
C-3, C-4, C-5, C-6,C-18 17f (482) 25 32 NA 10g 549
WaterCadmium, copper
and lead Low C-3, C-4, C-5, C-6 17f (812) 41 32 NA 10g 895
Water
Metals (dissolved)(excluding mercury,cadmium, copper
and lead) Low C-3, C-4, C-5, C-6 17f (482) 25 32 NA NAg 539
WaterCadmium, copper
and lead (dissolved) Low C-3, C-4, C-5, C-6 17f (812) 41 32 NA NAg 885
Water Sulfate and Chloride Low C-21 17f (812) 41 32 NA 0 885
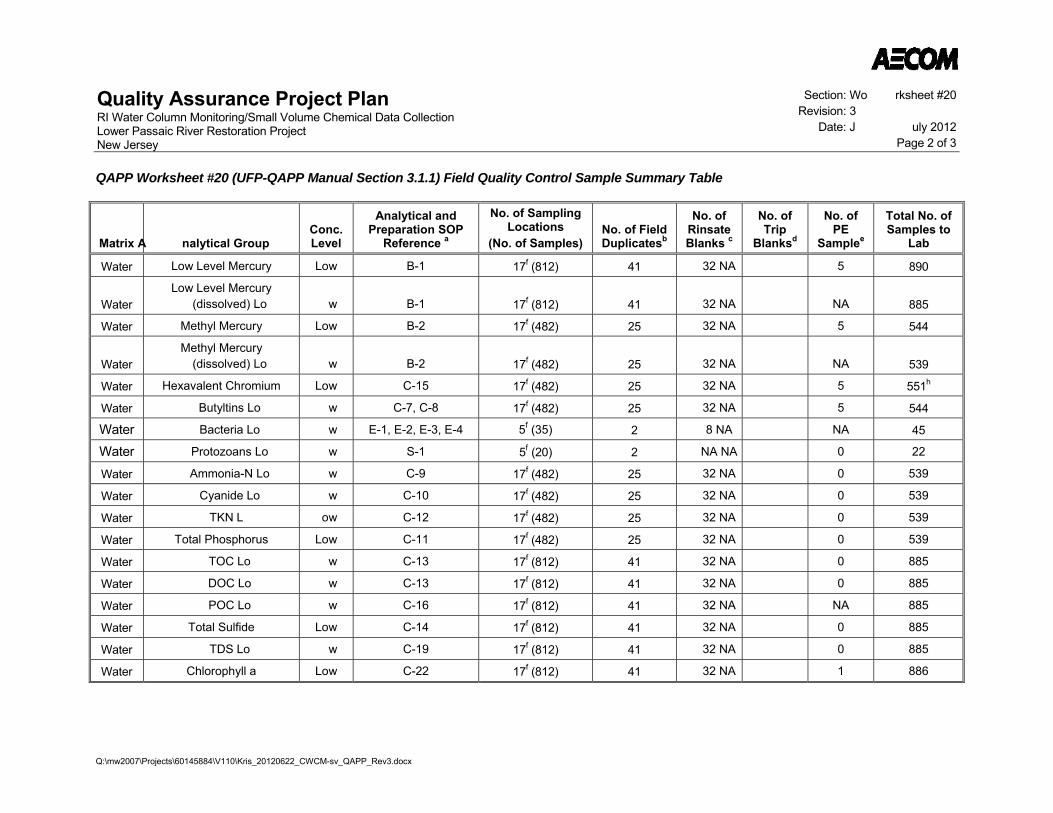
Quality Assurance Project Plan RI Water Column Monitoring/Small Volume Chemical Data Collection Lower Passaic River Restoration Project New Jersey
Section: Wo rksheet #20 Revision: 3
Date: J uly 2012 Page 2 of 3
QAPP Worksheet #20 (UFP-QAPP Manual Section 3.1.1) Field Quality Control Sample Summary Table
Q:\mw2007\Projects\60145884\V110\Kris_20120622_CWCM-sv_QAPP_Rev3.docx
Matrix A nalytical Group Conc. Level
Analytical and Preparation SOP
Reference a
No. of Sampling Locations
(No. of Samples) No. of Field Duplicatesb
No. of Rinsate Blanks c
No. of Trip
Blanksd
No. of PE
Samplee
Total No. of Samples to
Lab
Water Low Level Mercury Low B-1 17f (812) 41 32 NA 5 890
Water Low Level Mercury
(dissolved) Lo w B-1 17f (812) 41 32 NA NA 885
Water Methyl Mercury Low B-2 17f (482) 25 32 NA 5 544
Water Methyl Mercury
(dissolved) Lo w B-2 17f (482) 25 32 NA NA 539
Water Hexavalent Chromium Low C-15 17f (482) 25 32 NA 5 551h
Water Butyltins Lo w C-7, C-8 17f (482) 25 32 NA 5 544 Water Bacteria Lo w E-1, E-2, E-3, E-4 5f (35) 2 8 NA NA 45 Water Protozoans Lo w S-1 5f (20) 2 NA NA 0 22
Water Ammonia-N Lo w C-9 17f (482) 25 32 NA 0 539
Water Cyanide Lo w C-10 17f (482) 25 32 NA 0 539
Water TKN L ow C-12 17f (482) 25 32 NA 0 539
Water Total Phosphorus Low C-11 17f (482) 25 32 NA 0 539
Water TOC Lo w C-13 17f (812) 41 32 NA 0 885
Water DOC Lo w C-13 17f (812) 41 32 NA 0 885
Water POC Lo w C-16 17f (812) 41 32 NA NA 885
Water Total Sulfide Low C-14 17f (812) 41 32 NA 0 885
Water TDS Lo w C-19 17f (812) 41 32 NA 0 885
Water Chlorophyll a Low C-22 17f (812) 41 32 NA 1 886
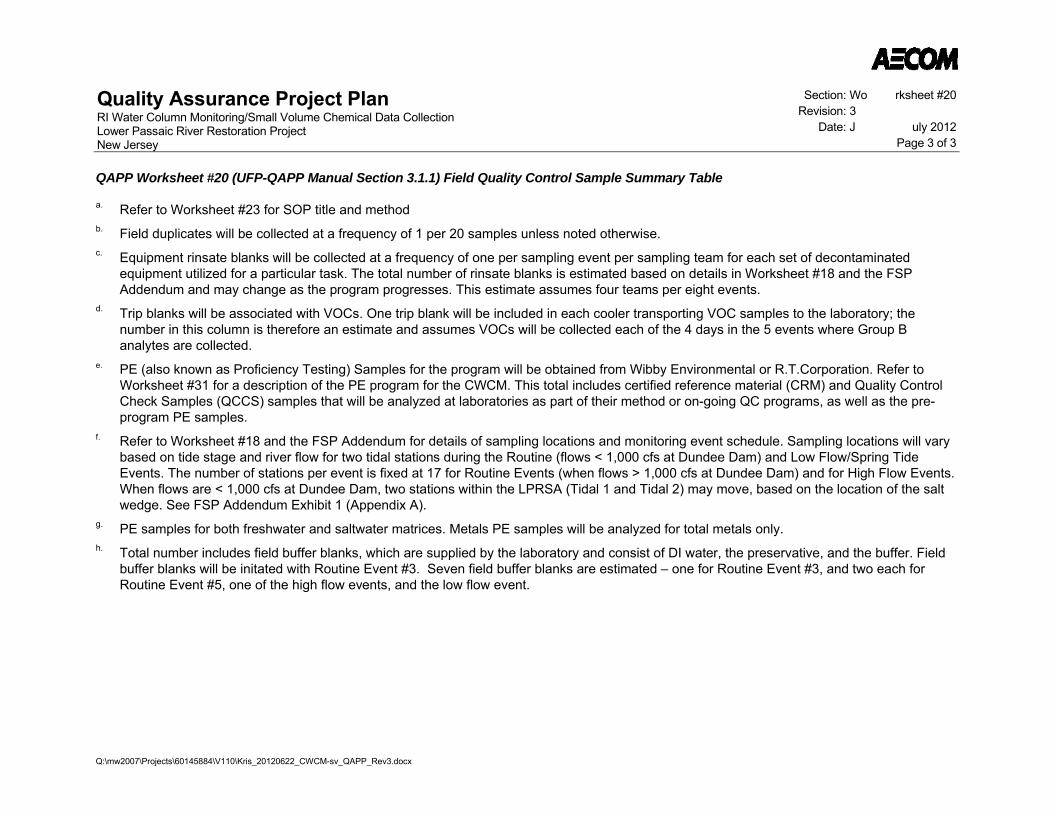
Quality Assurance Project Plan RI Water Column Monitoring/Small Volume Chemical Data Collection Lower Passaic River Restoration Project New Jersey
Section: Wo rksheet #20 Revision: 3
Date: J uly 2012 Page 3 of 3
QAPP Worksheet #20 (UFP-QAPP Manual Section 3.1.1) Field Quality Control Sample Summary Table
Q:\mw2007\Projects\60145884\V110\Kris_20120622_CWCM-sv_QAPP_Rev3.docx
a. Refer to Worksheet #23 for SOP title and method b. Field duplicates will be collected at a frequency of 1 per 20 samples unless noted otherwise. c. Equipment rinsate blanks will be collected at a frequency of one per sampling event per sampling team for each set of decontaminated
equipment utilized for a particular task. The total number of rinsate blanks is estimated based on details in Worksheet #18 and the FSP Addendum and may change as the program progresses. This estimate assumes four teams per eight events.
d. Trip blanks will be associated with VOCs. One trip blank will be included in each cooler transporting VOC samples to the laboratory; the number in this column is therefore an estimate and assumes VOCs will be collected each of the 4 days in the 5 events where Group B analytes are collected.
e. PE (also known as Proficiency Testing) Samples for the program will be obtained from Wibby Environmental or R.T.Corporation. Refer to Worksheet #31 for a description of the PE program for the CWCM. This total includes certified reference material (CRM) and Quality Control Check Samples (QCCS) samples that will be analyzed at laboratories as part of their method or on-going QC programs, as well as the pre-program PE samples.
f. Refer to Worksheet #18 and the FSP Addendum for details of sampling locations and monitoring event schedule. Sampling locations will vary based on tide stage and river flow for two tidal stations during the Routine (flows < 1,000 cfs at Dundee Dam) and Low Flow/Spring Tide Events. The number of stations per event is fixed at 17 for Routine Events (when flows > 1,000 cfs at Dundee Dam) and for High Flow Events. When flows are < 1,000 cfs at Dundee Dam, two stations within the LPRSA (Tidal 1 and Tidal 2) may move, based on the location of the salt wedge. See FSP Addendum Exhibit 1 (Appendix A).
g. PE samples for both freshwater and saltwater matrices. Metals PE samples will be analyzed for total metals only. h. Total number includes field buffer blanks, which are supplied by the laboratory and consist of DI water, the preservative, and the buffer. Field
buffer blanks will be initated with Routine Event #3. Seven field buffer blanks are estimated – one for Routine Event #3, and two each for Routine Event #5, one of the high flow events, and the low flow event.
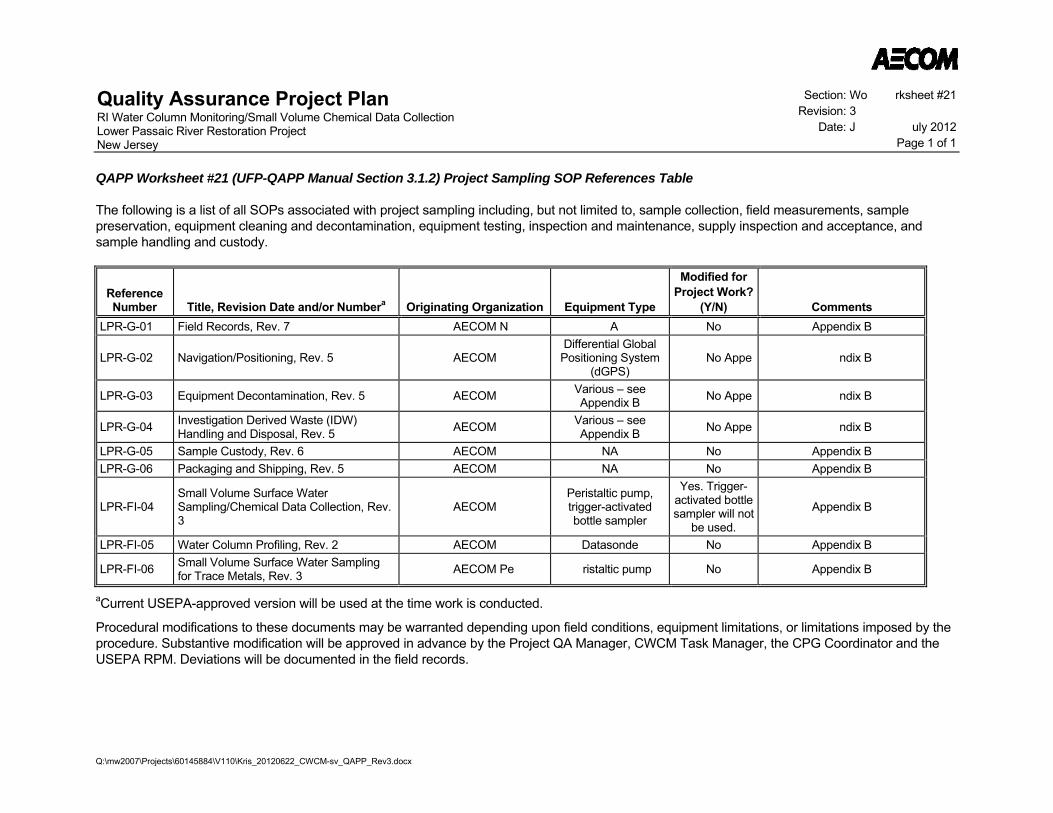
Quality Assurance Project Plan RI Water Column Monitoring/Small Volume Chemical Data Collection Lower Passaic River Restoration Project New Jersey
Section: Wo rksheet #21 Revision: 3
Date: J uly 2012 Page 1 of 1
Q:\mw2007\Projects\60145884\V110\Kris_20120622_CWCM-sv_QAPP_Rev3.docx
QAPP Worksheet #21 (UFP-QAPP Manual Section 3.1.2) Project Sampling SOP References Table
The following is a list of all SOPs associated with project sampling including, but not limited to, sample collection, field measurements, sample preservation, equipment cleaning and decontamination, equipment testing, inspection and maintenance, supply inspection and acceptance, and sample handling and custody.
Reference Number Title, Revision Date and/or Numbera Originating Organization Equipment Type
Modified for Project Work?
(Y/N) Comments LPR-G-01 Field Records, Rev. 7 AECOM N A No Appendix B
LPR-G-02 Navigation/Positioning, Rev. 5 AECOM Differential Global
Positioning System (dGPS)
No Appe ndix B
LPR-G-03 Equipment Decontamination, Rev. 5 AECOM Various – see Appendix B No Appe ndix B
LPR-G-04 Investigation Derived Waste (IDW) Handling and Disposal, Rev. 5 AECOM Various – see
Appendix B No Appe ndix B
LPR-G-05 Sample Custody, Rev. 6 AECOM NA No Appendix B LPR-G-06 Packaging and Shipping, Rev. 5 AECOM NA No Appendix B
LPR-FI-04 Small Volume Surface Water Sampling/Chemical Data Collection, Rev. 3
AECOM Peristaltic pump, trigger-activated bottle sampler
Yes. Trigger-activated bottle sampler will not
be used.
Appendix B
LPR-FI-05 Water Column Profiling, Rev. 2 AECOM Datasonde No Appendix B
LPR-FI-06 Small Volume Surface Water Sampling for Trace Metals, Rev. 3 AECOM Pe ristaltic pump No Appendix B
aCurrent USEPA-approved version will be used at the time work is conducted.
Procedural modifications to these documents may be warranted depending upon field conditions, equipment limitations, or limitations imposed by the procedure. Substantive modification will be approved in advance by the Project QA Manager, CWCM Task Manager, the CPG Coordinator and the USEPA RPM. Deviations will be documented in the field records.
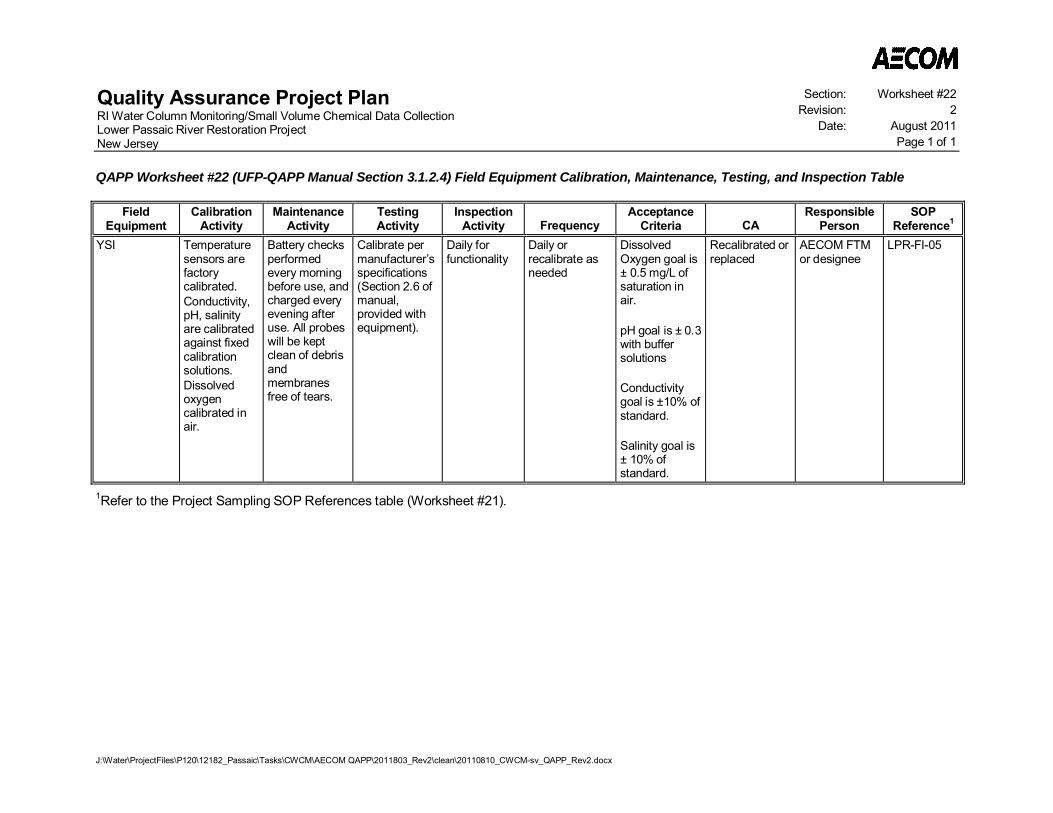
Quality Assurance Project PlanRI Water Column Monitoring/Small Volume Chemical Data CollectionLower Passaic River Restoration ProjectNew Jersey
Section: Worksheet #22Revision: 2
Date: August 2011Page 1 of 1
J:\Water\ProjectFiles\P120\12182_Passaic\Tasks\CWCM\AECOM QAPP\2011803_Rev2\clean\20110810_CWCM-sv_QAPP_Rev2.docx
QAPP Worksheet #22 (UFP-QAPP Manual Section 3.1.2.4) Field Equipment Calibration, Maintenance, Testing, and Inspection Table
FieldEquipment
CalibrationActivity
MaintenanceActivity
TestingActivity
InspectionActivity Frequency
AcceptanceCriteria CA
ResponsiblePerson
SOPReference1
YSI Temperaturesensors arefactorycalibrated.Conductivity,pH, salinityare calibratedagainst fixedcalibrationsolutions.Dissolvedoxygencalibrated inair.
Battery checksperformedevery morningbefore use, andcharged everyevening afteruse. All probeswill be keptclean of debrisandmembranesfree of tears.
Calibrate permanufacturer’sspecifications(Section 2.6 ofmanual,provided withequipment).
Daily forfunctionality
Daily orrecalibrate asneeded
DissolvedOxygen goal is± 0.5 mg/L ofsaturation inair.
pH goal is ± 0.3with buffersolutions
Conductivitygoal is ±10% ofstandard.
Salinity goal is± 10% ofstandard.
Recalibrated orreplaced
AECOM FTMor designee
LPR-FI-05
1Refer to the Project Sampling SOP References table (Worksheet #21).

Quality Assurance Project PlanRI Water Column Monitoring/Small Volume Chemical Data CollectionLower Passaic River Restoration ProjectNew Jersey
Section: Worksheet #23Revision: 2
Date: August 2011Page 1 of 9
J:\Water\ProjectFiles\P120\12182_Passaic\Tasks\CWCM\AECOM QAPP\2011803_Rev2\clean\20110810_CWCM-sv_QAPP_Rev2.docx
QAPP Worksheet #23 (UFP-QAPP Manual Section 3.2.1) Analytical SOP References Tablea
ReferenceNumber
PrimaryMethod
Referenceb
Laboratory SOPc
Title, Revision Date, and/orNumber
Definitive orScreening
DataAnalytical
Group Instruments
OrganizationPerforming
AnalysisModified for Project
work? (Y/N)
C-1 EPA 8260B dVolatile Organic Compoundsby GC/MS, VOC 8260, Rev.14, 11/20/2009
DefinitiveOrganics(VOCsAnalysis)
GC/MS CAS-Kelso, WA Y, Use low standard toreduce QL.
C-2 EPA 5030dPurge and Trap for AqueousSamples, VOC-5030, Rev.4,4/3/2007
DefinitiveOrganics(VOCs SamplePreparation)
P&T CAS-Kelso, WA N
T-2 EPA 8270C d
Semivolatile Organic Analysisby GC/MS: Method(s): SW-846 8270C and EPA 625, PT-MS-001, Rev.11,11/17/2009
Definitive Organics(SVOCs) GC/MS TestAmerica-
Pittsburgh, PA N
T-3 EPA 3520C d
Extraction of SelectedSemivolatile OrganicCompounds and AlkylatedPAHs for Analysis by GC/MS-SIM, KNOX-OP-0023, Rev. 0,1/12/2010
DefinitiveOrganics(SamplePreparation)
N/A TestAmerica-Knoxville, TN
Y, Cleanup by GelPermeation Cleanup(GPC) and silica gel
C-3 EPA 3010A d Metals Digestion, MET-3010A, Rev. 10, 7/12/2007 Definitive
Metals (SamplePreparation-Aqueous)
N/A CAS-Kelso, WA N
T-4 CARB 429e
Isotope Dilution Analysis ofSelected SemivolatileOrganic Compounds andAlkylated PAHs by GasChromatography/MassSpectrometry-Selected IonMonitoring (GC/MS-SIM),KNOX-ID-0016, Rev. 8,8/13/2010
Definitive Organics(PAHs)
High ResolutionGasChromatography,Low ResolutionMass Spectrometryvia Selected IonMonitoring(HRGC/LRMS-SIM)
TestAmerica-Knoxville, TN N
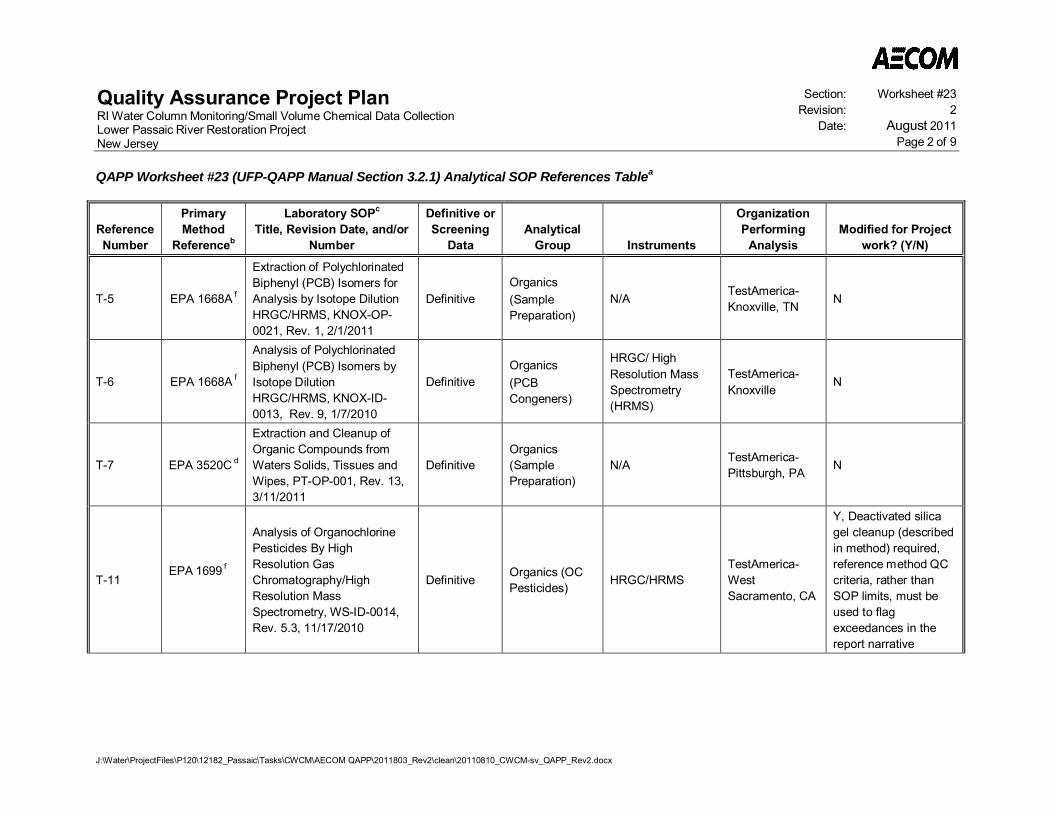
Quality Assurance Project PlanRI Water Column Monitoring/Small Volume Chemical Data CollectionLower Passaic River Restoration ProjectNew Jersey
Section: Worksheet #23Revision: 2
Date: August 2011Page 2 of 9
QAPP Worksheet #23 (UFP-QAPP Manual Section 3.2.1) Analytical SOP References Tablea
J:\Water\ProjectFiles\P120\12182_Passaic\Tasks\CWCM\AECOM QAPP\2011803_Rev2\clean\20110810_CWCM-sv_QAPP_Rev2.docx
ReferenceNumber
PrimaryMethod
Referenceb
Laboratory SOPc
Title, Revision Date, and/orNumber
Definitive orScreening
DataAnalytical
Group Instruments
OrganizationPerforming
AnalysisModified for Project
work? (Y/N)
T-5 EPA 1668A f
Extraction of PolychlorinatedBiphenyl (PCB) Isomers forAnalysis by Isotope DilutionHRGC/HRMS, KNOX-OP-0021, Rev. 1, 2/1/2011
DefinitiveOrganics(SamplePreparation)
N/A TestAmerica-Knoxville, TN N
T-6 EPA 1668A f
Analysis of PolychlorinatedBiphenyl (PCB) Isomers byIsotope DilutionHRGC/HRMS, KNOX-ID-0013, Rev. 9, 1/7/2010
DefinitiveOrganics(PCBCongeners)
HRGC/ HighResolution MassSpectrometry(HRMS)
TestAmerica-Knoxville
N
T-7 EPA 3520C d
Extraction and Cleanup ofOrganic Compounds fromWaters Solids, Tissues andWipes, PT-OP-001, Rev. 13,3/11/2011
DefinitiveOrganics(SamplePreparation)
N/A TestAmerica-Pittsburgh, PA N
T-11EPA 1699 f
Analysis of OrganochlorinePesticides By HighResolution GasChromatography/HighResolution MassSpectrometry, WS-ID-0014,Rev. 5.3, 11/17/2010
Definitive Organics (OCPesticides) HRGC/HRMS
TestAmerica-WestSacramento, CA
Y, Deactivated silicagel cleanup (describedin method) required,reference method QCcriteria, rather thanSOP limits, must beused to flagexceedances in thereport narrative
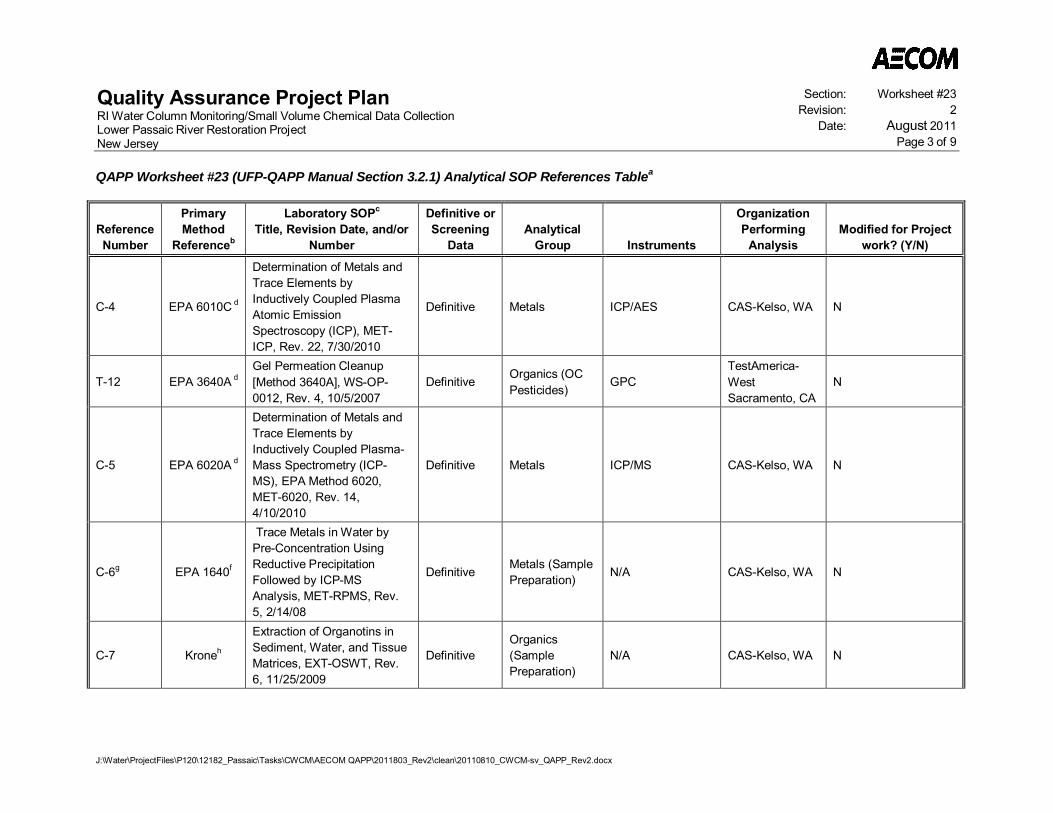
Quality Assurance Project PlanRI Water Column Monitoring/Small Volume Chemical Data CollectionLower Passaic River Restoration ProjectNew Jersey
Section: Worksheet #23Revision: 2
Date: August 2011Page 3 of 9
QAPP Worksheet #23 (UFP-QAPP Manual Section 3.2.1) Analytical SOP References Tablea
J:\Water\ProjectFiles\P120\12182_Passaic\Tasks\CWCM\AECOM QAPP\2011803_Rev2\clean\20110810_CWCM-sv_QAPP_Rev2.docx
ReferenceNumber
PrimaryMethod
Referenceb
Laboratory SOPc
Title, Revision Date, and/orNumber
Definitive orScreening
DataAnalytical
Group Instruments
OrganizationPerforming
AnalysisModified for Project
work? (Y/N)
C-4 EPA 6010C d
Determination of Metals andTrace Elements byInductively Coupled PlasmaAtomic EmissionSpectroscopy (ICP), MET-ICP, Rev. 22, 7/30/2010
Definitive Metals ICP/AES CAS-Kelso, WA N
T-12 EPA 3640A dGel Permeation Cleanup[Method 3640A], WS-OP-0012, Rev. 4, 10/5/2007
Definitive Organics (OCPesticides)
GPCTestAmerica-WestSacramento, CA
N
C-5 EPA 6020A d
Determination of Metals andTrace Elements byInductively Coupled Plasma-Mass Spectrometry (ICP-MS), EPA Method 6020,MET-6020, Rev. 14,4/10/2010
Definitive Metals ICP/MS CAS-Kelso, WA N
C-6g EPA 1640f
Trace Metals in Water byPre-Concentration UsingReductive PrecipitationFollowed by ICP-MSAnalysis, MET-RPMS, Rev.5, 2/14/08
Definitive Metals (SamplePreparation) N/A CAS-Kelso, WA N
C-7 Kroneh
Extraction of Organotins inSediment, Water, and TissueMatrices, EXT-OSWT, Rev.6, 11/25/2009
DefinitiveOrganics(SamplePreparation)
N/A CAS-Kelso, WA N
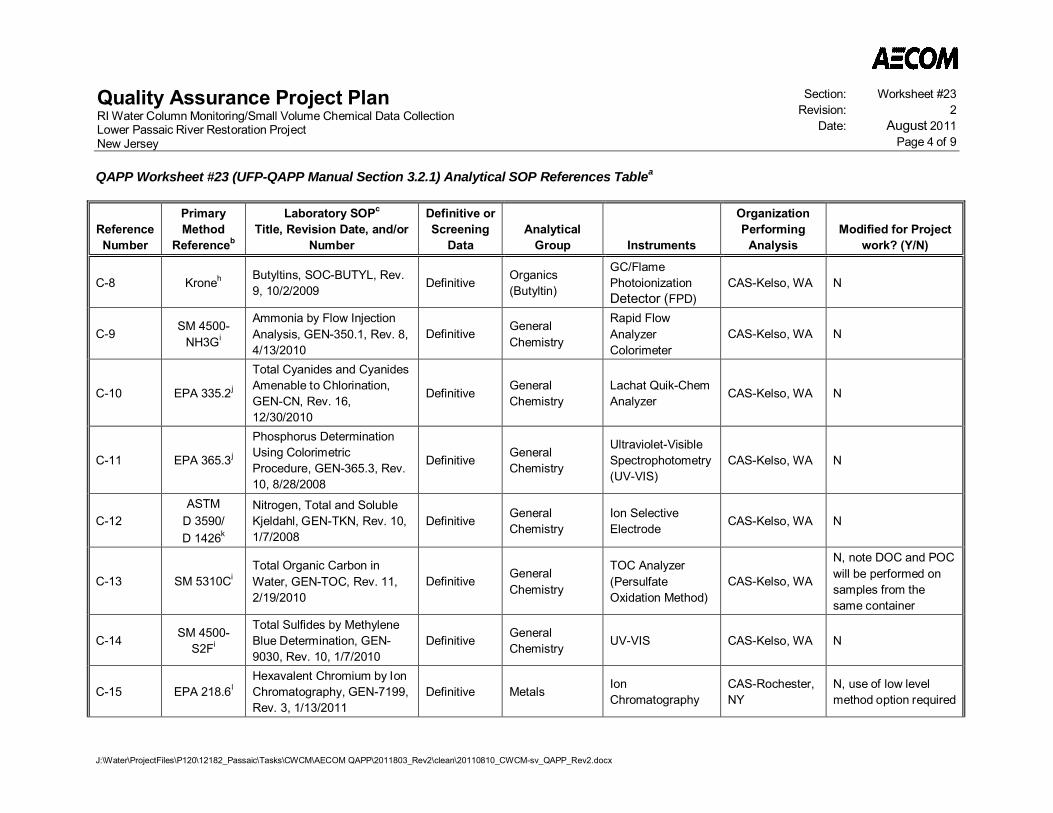
Quality Assurance Project PlanRI Water Column Monitoring/Small Volume Chemical Data CollectionLower Passaic River Restoration ProjectNew Jersey
Section: Worksheet #23Revision: 2
Date: August 2011Page 4 of 9
QAPP Worksheet #23 (UFP-QAPP Manual Section 3.2.1) Analytical SOP References Tablea
J:\Water\ProjectFiles\P120\12182_Passaic\Tasks\CWCM\AECOM QAPP\2011803_Rev2\clean\20110810_CWCM-sv_QAPP_Rev2.docx
ReferenceNumber
PrimaryMethod
Referenceb
Laboratory SOPc
Title, Revision Date, and/orNumber
Definitive orScreening
DataAnalytical
Group Instruments
OrganizationPerforming
AnalysisModified for Project
work? (Y/N)
C-8 Kroneh Butyltins, SOC-BUTYL, Rev.9, 10/2/2009 Definitive Organics
(Butyltin)
GC/FlamePhotoionizationDetector (FPD)
CAS-Kelso, WA N
C-9 SM 4500-NH3Gi
Ammonia by Flow InjectionAnalysis, GEN-350.1, Rev. 8,4/13/2010
Definitive GeneralChemistry
Rapid FlowAnalyzerColorimeter
CAS-Kelso, WA N
C-10 EPA 335.2j
Total Cyanides and CyanidesAmenable to Chlorination,GEN-CN, Rev. 16,12/30/2010
Definitive GeneralChemistry
Lachat Quik-ChemAnalyzer CAS-Kelso, WA N
C-11 EPA 365.3j
Phosphorus DeterminationUsing ColorimetricProcedure, GEN-365.3, Rev.10, 8/28/2008
Definitive GeneralChemistry
Ultraviolet-VisibleSpectrophotometry(UV-VIS)
CAS-Kelso, WA N
C-12ASTM
D 3590/D 1426k
Nitrogen, Total and SolubleKjeldahl, GEN-TKN, Rev. 10,1/7/2008
Definitive GeneralChemistry
Ion SelectiveElectrode CAS-Kelso, WA N
C-13 SM 5310CiTotal Organic Carbon inWater, GEN-TOC, Rev. 11,2/19/2010
Definitive GeneralChemistry
TOC Analyzer(PersulfateOxidation Method)
CAS-Kelso, WA
N, note DOC and POCwill be performed onsamples from thesame container
C-14 SM 4500-S2Fi
Total Sulfides by MethyleneBlue Determination, GEN-9030, Rev. 10, 1/7/2010
Definitive GeneralChemistry UV-VIS CAS-Kelso, WA N
C-15 EPA 218.6lHexavalent Chromium by IonChromatography, GEN-7199,Rev. 3, 1/13/2011
Definitive Metals IonChromatography
CAS-Rochester,NY
N, use of low levelmethod option required
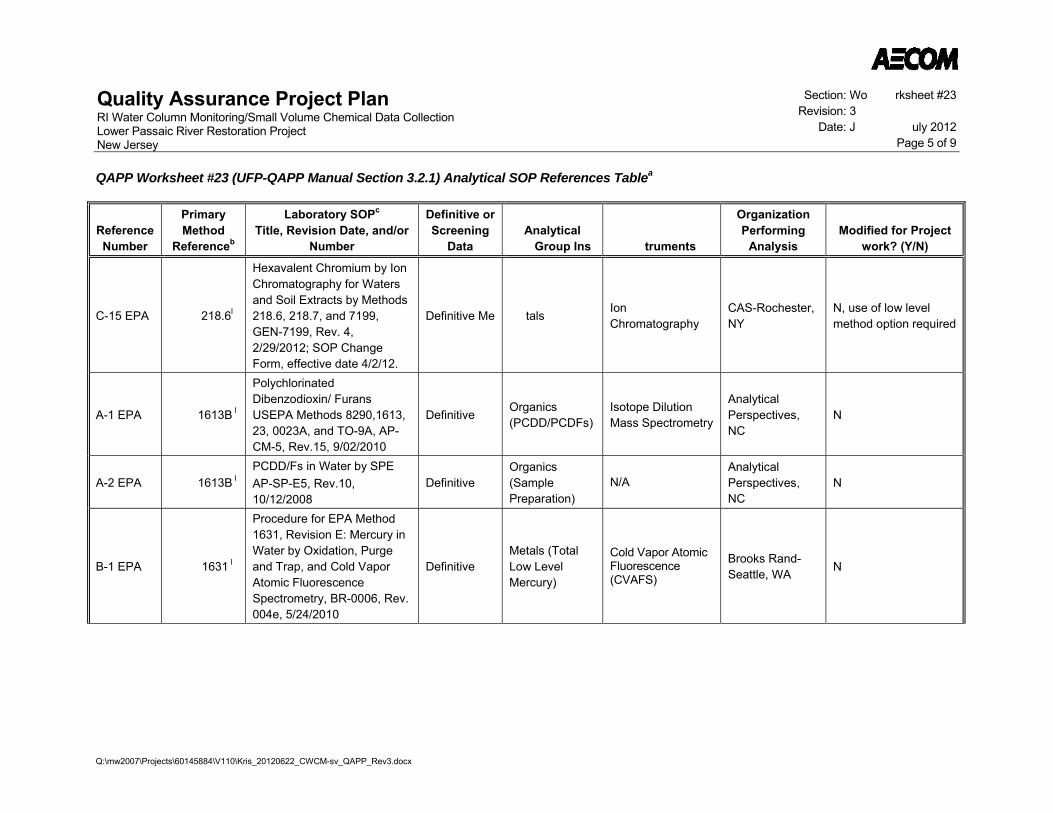
Quality Assurance Project Plan RI Water Column Monitoring/Small Volume Chemical Data Collection Lower Passaic River Restoration Project New Jersey
Section: Wo rksheet #23 Revision: 3
Date: J uly 2012 Page 5 of 9
QAPP Worksheet #23 (UFP-QAPP Manual Section 3.2.1) Analytical SOP References Tablea
Q:\mw2007\Projects\60145884\V110\Kris_20120622_CWCM-sv_QAPP_Rev3.docx
Reference Number
Primary Method
Referenceb
Laboratory SOPc Title, Revision Date, and/or
Number
Definitive or Screening
Data Analytical
Group Ins truments
Organization Performing
Analysis Modified for Project
work? (Y/N)
C-15 EPA 218.6l
Hexavalent Chromium by Ion Chromatography for Waters and Soil Extracts by Methods 218.6, 218.7, and 7199, GEN-7199, Rev. 4, 2/29/2012; SOP Change Form, effective date 4/2/12.
Definitive Me tals Ion Chromatography
CAS-Rochester, NY
N, use of low level method option required
A-1 EPA 1613B l
Polychlorinated Dibenzodioxin/ Furans USEPA Methods 8290,1613, 23, 0023A, and TO-9A, AP-CM-5, Rev.15, 9/02/2010
Definitive Organics (PCDD/PCDFs)
Isotope Dilution Mass Spectrometry
Analytical Perspectives, NC
N
A-2 EPA 1613B l PCDD/Fs in Water by SPE AP-SP-E5, Rev.10, 10/12/2008
Definitive Organics (Sample Preparation)
N/A Analytical Perspectives, NC
N
B-1 EPA 1631 l
Procedure for EPA Method 1631, Revision E: Mercury in Water by Oxidation, Purge and Trap, and Cold Vapor Atomic Fluorescence Spectrometry, BR-0006, Rev. 004e, 5/24/2010
Definitive Metals (Total Low Level Mercury)
Cold Vapor Atomic Fluorescence (CVAFS)
Brooks Rand- Seattle, WA N

Quality Assurance Project PlanRI Water Column Monitoring/Small Volume Chemical Data CollectionLower Passaic River Restoration ProjectNew Jersey
Section: Worksheet #23Revision: 2
Date: August 2011Page 6 of 9
QAPP Worksheet #23 (UFP-QAPP Manual Section 3.2.1) Analytical SOP References Tablea
J:\Water\ProjectFiles\P120\12182_Passaic\Tasks\CWCM\AECOM QAPP\2011803_Rev2\clean\20110810_CWCM-sv_QAPP_Rev2.docx
ReferenceNumber
PrimaryMethod
Referenceb
Laboratory SOPc
Title, Revision Date, and/orNumber
Definitive orScreening
DataAnalytical
Group Instruments
OrganizationPerforming
AnalysisModified for Project
work? (Y/N)
C-16 EPA 440m
Sample Preparation forParticulate Carbon andNitrogen and ParticulateOrganic Carbon in Water byCombustion / Thermo-Conductivity or InfraredDetection, GEN-PC PN POCPREP, Rev. 01, 7/3/09
Definitive GeneralChemistry TOC Analyzer CAS-Tucson, AZ
N, note the nominalpore size of the GF/Ffilter used must be 0.7um. POC and DOC willbe performed onsample from the samecontainer,
C-17ASTM
D 3977 k
Standard Test Methods forDetermining SedimentConcentration in WaterSamples, GEN-3977, Rev. 0,7/11/2011
Definitive GeneralChemistry
Gravimetric CAS-Kelso, WA
N, Note Test Option Bwithout the 14 daysettling time will beused. The nominalpore size of the GF/Ffilter used must be 0.7um.
C-18 SM 2340Bi Hardness, Total, GEN-2340,Rev. 7,12/18/2009 Definitive General
Chemistry Calculation CAS-Kelso, WA N
C-19 SM 2540CiSolids, Total Dissolved(TDS), GEN-TDS, Rev. 8,3/19/2010
Definitive GeneralChemistry Gravimetric CAS-Kelso, WA N
C-20 SM 2320Bi Alkalinity, Total, GEN-2320,Rev. 7, 3/1/2010 Definitive General
Chemistry Titrimetric CAS-Kelso, WA N
C-21 EPA 9056A d Ion Chromatography, GEN-IONC, Rev.14, 3/1/2010 Definitive General
Chemistry
IonChromatography(IC)
CAS-Kelso, WA N

Quality Assurance Project PlanRI Water Column Monitoring/Small Volume Chemical Data CollectionLower Passaic River Restoration ProjectNew Jersey
Section: Worksheet #23Revision: 2
Date: August 2011Page 7 of 9
QAPP Worksheet #23 (UFP-QAPP Manual Section 3.2.1) Analytical SOP References Tablea
J:\Water\ProjectFiles\P120\12182_Passaic\Tasks\CWCM\AECOM QAPP\2011803_Rev2\clean\20110810_CWCM-sv_QAPP_Rev2.docx
ReferenceNumber
PrimaryMethod
Referenceb
Laboratory SOPc
Title, Revision Date, and/orNumber
Definitive orScreening
DataAnalytical
Group Instruments
OrganizationPerforming
AnalysisModified for Project
work? (Y/N)
C-22 SM 10200-HiChlorophyll a by Colorimetry,GEN-CHLOR, Rev. 0,5/25/2010
Definitive GeneralChemistry
UV-VISSpectrophotometer CAS-Kelso, WA N
E-1 SM 9223BiChromogenic SubstrateColiform Test – Colilert,M017, Rev. 4, 3/10/2010
Definitive Microbiological(Bacteria)
Incubator,Ultraviolet Lamp,Thermometer, pHMeter
EMSL, NJ N
E-2 SM 9222Di
Standard OperatingProcedure for Fecal Coliformby Membrane Filtration,M019, Rev.1.3, 1/1/2008
Definitive Microbiological(Bacteria)
Incubator,Thermometer, pHMeter
EMSL, NJ N
E-3 SM 9230Ci
Standard OperatingProcedure for the Detectionand Enumeration of FecalStreptococci in Water byMembrane Filtration Using m-Enterococcus Agar, M020,Rev.1.2, 3/1/2006
Definitive Microbiological(Bacteria)
Incubator,Thermometer, pHMeter
EMSL, NJ N
E-4 SM 9230Ci
Standard OperatingProcedure for The Detectionand Enumeration ofEnterococci in Water byMembrane Filtration Usingmembrane-Enterococcus-Esculin Iron Agar (mE-EIA),M029, Rev.1.1 3/1/2006
Definitive Microbiological(Bacteria)
Incubator,Thermometer, pHMeter
EMSL, NJ N
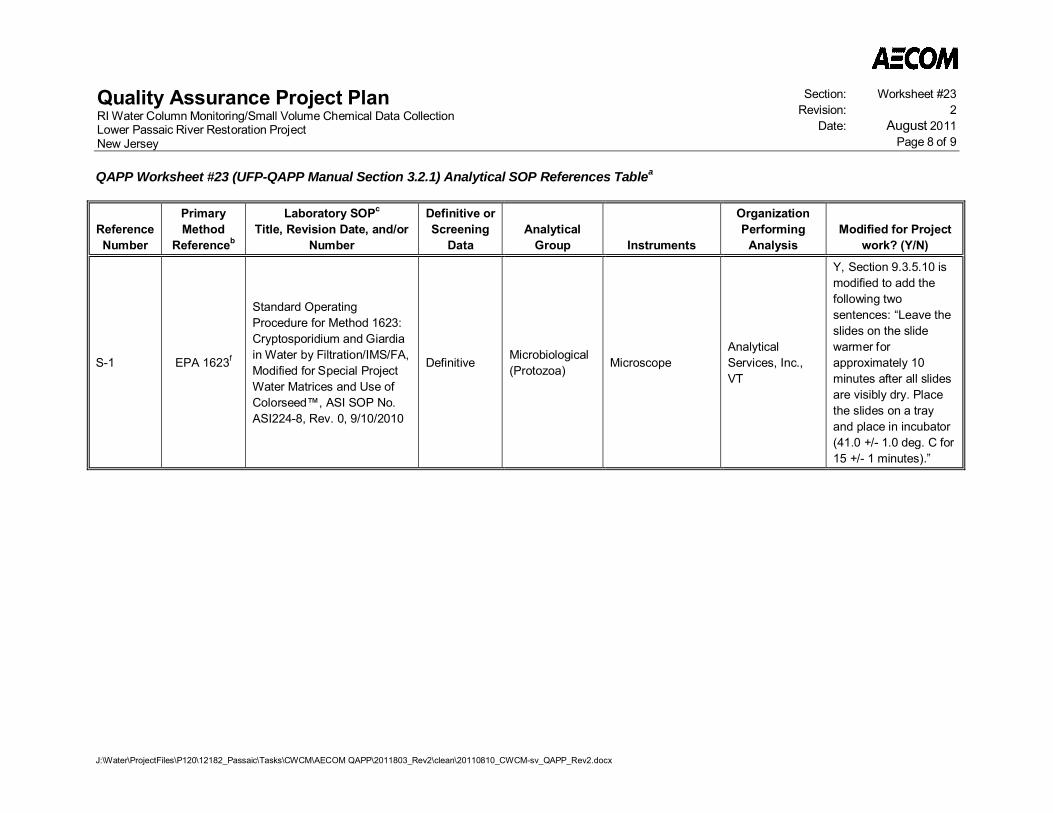
Quality Assurance Project PlanRI Water Column Monitoring/Small Volume Chemical Data CollectionLower Passaic River Restoration ProjectNew Jersey
Section: Worksheet #23Revision: 2
Date: August 2011Page 8 of 9
QAPP Worksheet #23 (UFP-QAPP Manual Section 3.2.1) Analytical SOP References Tablea
J:\Water\ProjectFiles\P120\12182_Passaic\Tasks\CWCM\AECOM QAPP\2011803_Rev2\clean\20110810_CWCM-sv_QAPP_Rev2.docx
ReferenceNumber
PrimaryMethod
Referenceb
Laboratory SOPc
Title, Revision Date, and/orNumber
Definitive orScreening
DataAnalytical
Group Instruments
OrganizationPerforming
AnalysisModified for Project
work? (Y/N)
S-1 EPA 1623f
Standard OperatingProcedure for Method 1623:Cryptosporidium and Giardiain Water by Filtration/IMS/FA,Modified for Special ProjectWater Matrices and Use ofColorseed™, ASI SOP No.ASI224-8, Rev. 0, 9/10/2010
Definitive Microbiological(Protozoa) Microscope
AnalyticalServices, Inc.,VT
Y, Section 9.3.5.10 ismodified to add thefollowing twosentences: “Leave theslides on the slidewarmer forapproximately 10minutes after all slidesare visibly dry. Placethe slides on a trayand place in incubator(41.0 +/- 1.0 deg. C for15 +/- 1 minutes).”
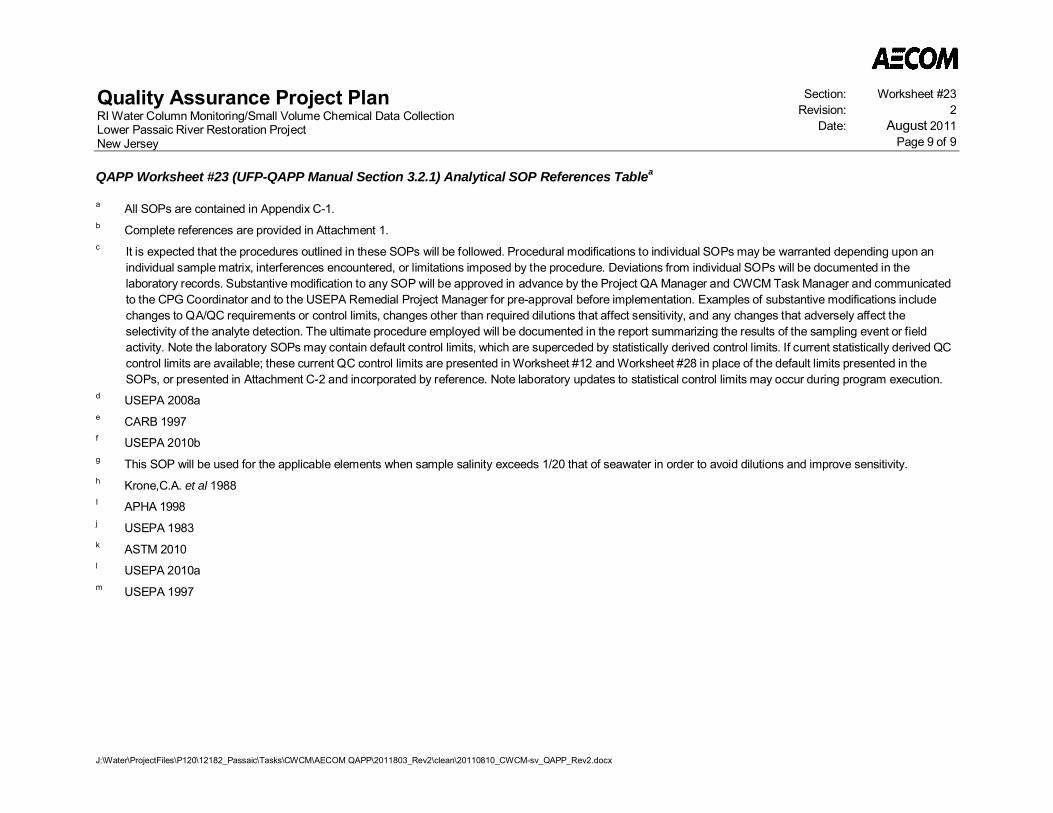
Quality Assurance Project PlanRI Water Column Monitoring/Small Volume Chemical Data CollectionLower Passaic River Restoration ProjectNew Jersey
Section: Worksheet #23Revision: 2
Date: August 2011Page 9 of 9
QAPP Worksheet #23 (UFP-QAPP Manual Section 3.2.1) Analytical SOP References Tablea
J:\Water\ProjectFiles\P120\12182_Passaic\Tasks\CWCM\AECOM QAPP\2011803_Rev2\clean\20110810_CWCM-sv_QAPP_Rev2.docx
a All SOPs are contained in Appendix C-1.b Complete references are provided in Attachment 1.c It is expected that the procedures outlined in these SOPs will be followed. Procedural modifications to individual SOPs may be warranted depending upon an
individual sample matrix, interferences encountered, or limitations imposed by the procedure. Deviations from individual SOPs will be documented in thelaboratory records. Substantive modification to any SOP will be approved in advance by the Project QA Manager and CWCM Task Manager and communicatedto the CPG Coordinator and to the USEPA Remedial Project Manager for pre-approval before implementation. Examples of substantive modifications includechanges to QA/QC requirements or control limits, changes other than required dilutions that affect sensitivity, and any changes that adversely affect theselectivity of the analyte detection. The ultimate procedure employed will be documented in the report summarizing the results of the sampling event or fieldactivity. Note the laboratory SOPs may contain default control limits, which are superceded by statistically derived control limits. If current statistically derived QCcontrol limits are available; these current QC control limits are presented in Worksheet #12 and Worksheet #28 in place of the default limits presented in theSOPs, or presented in Attachment C-2 and incorporated by reference. Note laboratory updates to statistical control limits may occur during program execution.
d USEPA 2008ae CARB 1997f USEPA 2010bg This SOP will be used for the applicable elements when sample salinity exceeds 1/20 that of seawater in order to avoid dilutions and improve sensitivity.h Krone,C.A. et al 1988I APHA 1998j USEPA 1983k ASTM 2010l USEPA 2010am USEPA 1997
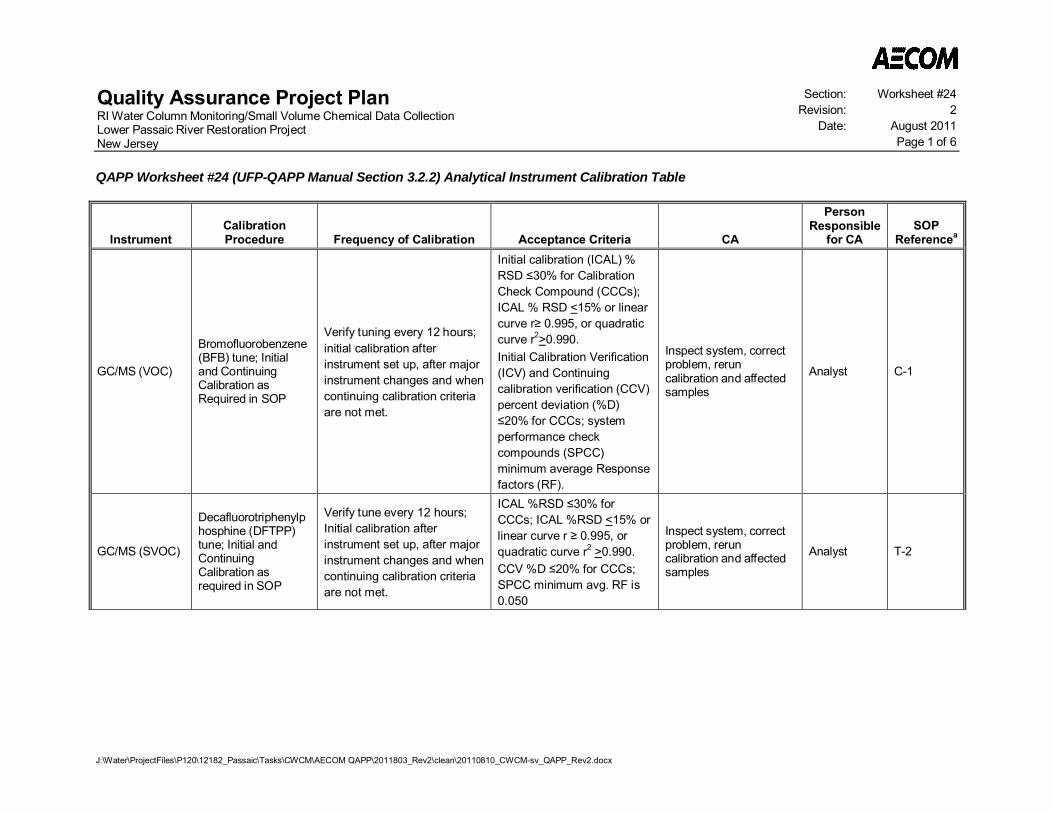
Quality Assurance Project PlanRI Water Column Monitoring/Small Volume Chemical Data CollectionLower Passaic River Restoration ProjectNew Jersey
Section: Worksheet #24Revision: 2
Date: August 2011Page 1 of 6
J:\Water\ProjectFiles\P120\12182_Passaic\Tasks\CWCM\AECOM QAPP\2011803_Rev2\clean\20110810_CWCM-sv_QAPP_Rev2.docx
QAPP Worksheet #24 (UFP-QAPP Manual Section 3.2.2) Analytical Instrument Calibration Table
InstrumentCalibrationProcedure Frequency of Calibration Acceptance Criteria CA
PersonResponsible
for CASOP
Referencea
GC/MS (VOC)
Bromofluorobenzene(BFB) tune; Initialand ContinuingCalibration asRequired in SOP
Verify tuning every 12 hours;initial calibration afterinstrument set up, after majorinstrument changes and whencontinuing calibration criteriaare not met.
Initial calibration (ICAL) %RSD 30% for CalibrationCheck Compound (CCCs);ICAL % RSD <15% or linearcurve r 0.995, or quadraticcurve r2>0.990.Initial Calibration Verification(ICV) and Continuingcalibration verification (CCV)percent deviation (%D)20% for CCCs; system
performance checkcompounds (SPCC)minimum average Responsefactors (RF).
Inspect system, correctproblem, reruncalibration and affectedsamples
Analyst C-1
GC/MS (SVOC)
Decafluorotriphenylphosphine (DFTPP)tune; Initial andContinuingCalibration asrequired in SOP
Verify tune every 12 hours;Initial calibration afterinstrument set up, after majorinstrument changes and whencontinuing calibration criteriaare not met.
ICAL %RSD 30% forCCCs; ICAL %RSD <15% orlinear curve r 0.995, orquadratic curve r2 >0.990.CCV %D 20% for CCCs;SPCC minimum avg. RF is0.050
Inspect system, correctproblem, reruncalibration and affectedsamples
Analyst T-2
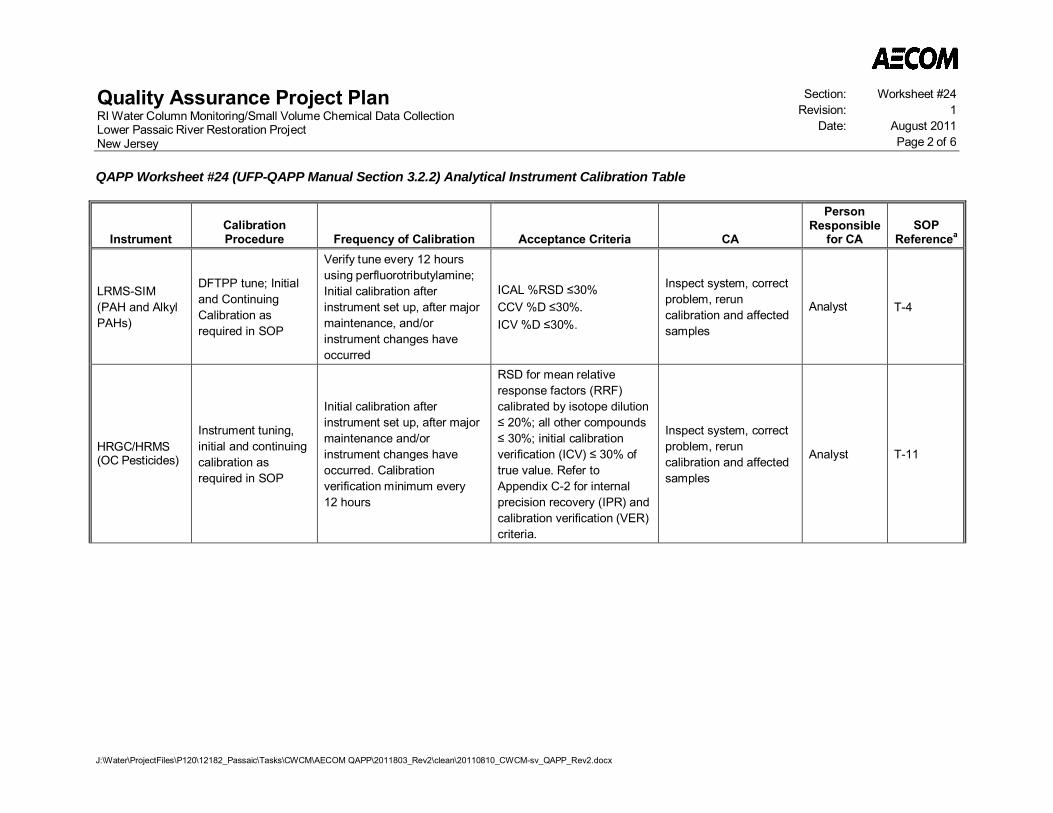
Quality Assurance Project PlanRI Water Column Monitoring/Small Volume Chemical Data CollectionLower Passaic River Restoration ProjectNew Jersey
Section: Worksheet #24Revision: 1
Date: August 2011Page 2 of 6
QAPP Worksheet #24 (UFP-QAPP Manual Section 3.2.2) Analytical Instrument Calibration Table
J:\Water\ProjectFiles\P120\12182_Passaic\Tasks\CWCM\AECOM QAPP\2011803_Rev2\clean\20110810_CWCM-sv_QAPP_Rev2.docx
InstrumentCalibrationProcedure Frequency of Calibration Acceptance Criteria CA
PersonResponsible
for CASOP
Referencea
LRMS-SIM(PAH and AlkylPAHs)
DFTPP tune; Initialand ContinuingCalibration asrequired in SOP
Verify tune every 12 hoursusing perfluorotributylamine;Initial calibration afterinstrument set up, after majormaintenance, and/orinstrument changes haveoccurred
ICAL %RSD 30%CCV %D 30%.ICV %D 30%.
Inspect system, correctproblem, reruncalibration and affectedsamples
Analyst T-4
HRGC/HRMS(OC Pesticides)
Instrument tuning,initial and continuingcalibration asrequired in SOP
Initial calibration afterinstrument set up, after majormaintenance and/orinstrument changes haveoccurred. Calibrationverification minimum every12 hours
RSD for mean relativeresponse factors (RRF)calibrated by isotope dilution 20%; all other compounds 30%; initial calibration
verification (ICV) 30% oftrue value. Refer toAppendix C-2 for internalprecision recovery (IPR) andcalibration verification (VER)criteria.
Inspect system, correctproblem, reruncalibration and affectedsamples
Analyst T-11

Quality Assurance Project PlanRI Water Column Monitoring/Small Volume Chemical Data CollectionLower Passaic River Restoration ProjectNew Jersey
Section: Worksheet #24Revision: 1
Date: August 2011Page 3 of 6
QAPP Worksheet #24 (UFP-QAPP Manual Section 3.2.2) Analytical Instrument Calibration Table
J:\Water\ProjectFiles\P120\12182_Passaic\Tasks\CWCM\AECOM QAPP\2011803_Rev2\clean\20110810_CWCM-sv_QAPP_Rev2.docx
InstrumentCalibrationProcedure Frequency of Calibration Acceptance Criteria CA
PersonResponsible
for CASOP
Referencea
HRGC/HRMS(PCBCongeners andHomologs)
Retention timecalibration, initialcalibration,continuing calibrationas required in SOP
Initial calibration afterinstrument set up, after majorinstrument changes and whencontinuing calibration criteriaare not met. Calibrationverification minimum every12 hours
ICAL %RSD < 20% fortarget analytes calculated byisotope dilution.ICV %D < 50% for all targetsand <35% for all but 4 targetanalytes%RSD < 35% for targetanalytes calculated byinternal standard.CCV < 30% Drift for Toxicsand LOC congenersCCV 40-160% for non-Toxiccongeners. Refer toAppendix C-2 forIPR and VER criteria.
Inspect system, correctproblem, reruncalibration and affectedsamples
Analyst T-6
Isotope DilutionMassSpectrometry(PCDD/PCDFs)
Perfluorokerosene(PFK) Tune; initialand continuingcalibration asrequired in SOP
Initial calibration afterinstrument set up, after majorinstrument changes and whencontinuing calibration criteriaare not met. Continuingcalibration minimum every12 hours
%RSD for mean response ofunlabeled standards < 10%;labeled referencecompounds ± 20%Continuing calibration usingBatch Control Spike (BCS3)per SOP. Refer to AppendixC-2 for IPR criteria.
Inspect system, correctproblem, reruncalibration and affectedsamples
Analyst A-1
ICP/AES(Metals)
Initial and continuingcalibration per SOP
Profile instrument;Copper/Manganese (Cu/Mn)ratio daily; blank, RL and highstandard daily; InterferenceCheck Sample (ICS) at startand every 8 hours;Continuous calibration check(CCB), CCV every 10samples
Cu/Mn ratio within 20% ofvalue at time interelementcorrections (IECs)determined. ICV, CCV ±10% of true value; ICSAB ±20% of true value
Inspect system, correctproblem, reruncalibration and affectedsamples
Analyst C-4
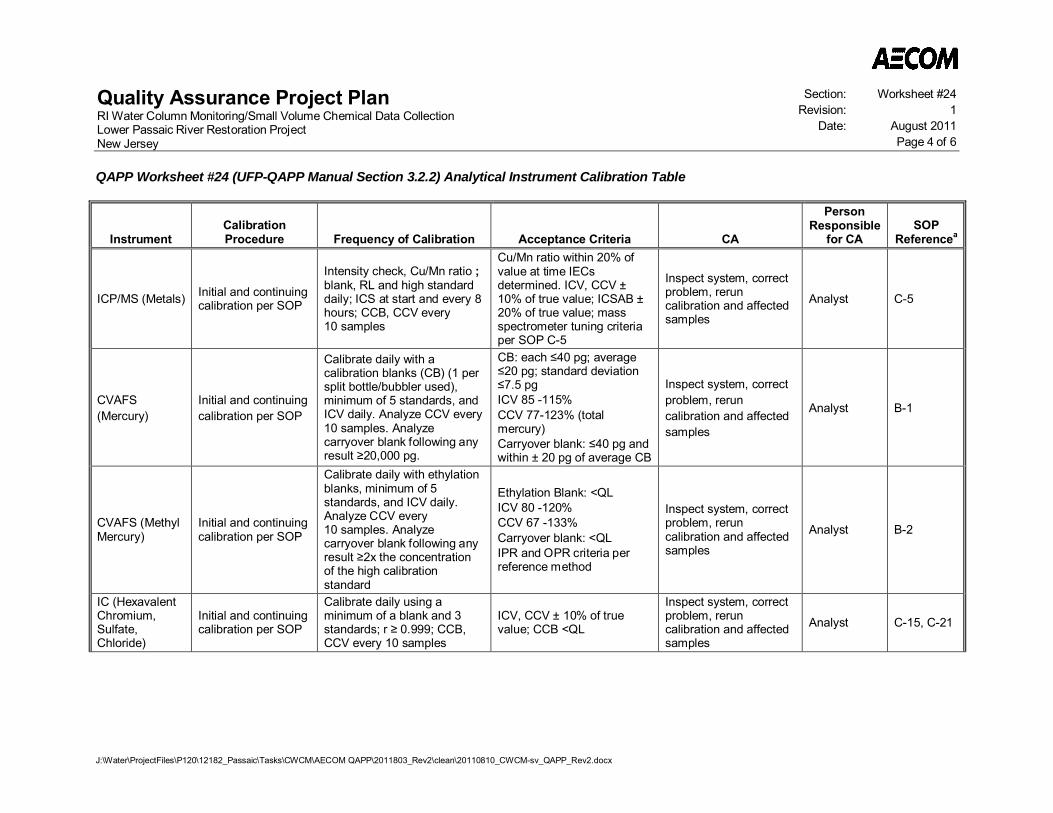
Quality Assurance Project PlanRI Water Column Monitoring/Small Volume Chemical Data CollectionLower Passaic River Restoration ProjectNew Jersey
Section: Worksheet #24Revision: 1
Date: August 2011Page 4 of 6
QAPP Worksheet #24 (UFP-QAPP Manual Section 3.2.2) Analytical Instrument Calibration Table
J:\Water\ProjectFiles\P120\12182_Passaic\Tasks\CWCM\AECOM QAPP\2011803_Rev2\clean\20110810_CWCM-sv_QAPP_Rev2.docx
InstrumentCalibrationProcedure Frequency of Calibration Acceptance Criteria CA
PersonResponsible
for CASOP
Referencea
ICP/MS (Metals) Initial and continuingcalibration per SOP
Intensity check, Cu/Mn ratio ;blank, RL and high standarddaily; ICS at start and every 8hours; CCB, CCV every10 samples
Cu/Mn ratio within 20% ofvalue at time IECsdetermined. ICV, CCV ±10% of true value; ICSAB ±20% of true value; massspectrometer tuning criteriaper SOP C-5
Inspect system, correctproblem, reruncalibration and affectedsamples
Analyst C-5
CVAFS(Mercury)
Initial and continuingcalibration per SOP
Calibrate daily with acalibration blanks (CB) (1 persplit bottle/bubbler used),minimum of 5 standards, andICV daily. Analyze CCV every10 samples. Analyzecarryover blank following anyresult 20,000 pg.
CB: each 40 pg; average20 pg; standard deviation7.5 pg
ICV 85 -115%CCV 77-123% (totalmercury)Carryover blank: 40 pg andwithin ± 20 pg of average CB
Inspect system, correctproblem, reruncalibration and affectedsamples
Analyst B-1
CVAFS (MethylMercury)
Initial and continuingcalibration per SOP
Calibrate daily with ethylationblanks, minimum of 5standards, and ICV daily.Analyze CCV every10 samples. Analyzecarryover blank following anyresult 2x the concentrationof the high calibrationstandard
Ethylation Blank: <QLICV 80 -120%CCV 67 -133%Carryover blank: <QLIPR and OPR criteria perreference method
Inspect system, correctproblem, reruncalibration and affectedsamples
Analyst B-2
IC (HexavalentChromium,Sulfate,Chloride)
Initial and continuingcalibration per SOP
Calibrate daily using aminimum of a blank and 3standards; r 0.999; CCB,CCV every 10 samples
ICV, CCV ± 10% of truevalue; CCB <QL
Inspect system, correctproblem, reruncalibration and affectedsamples
Analyst C-15, C-21
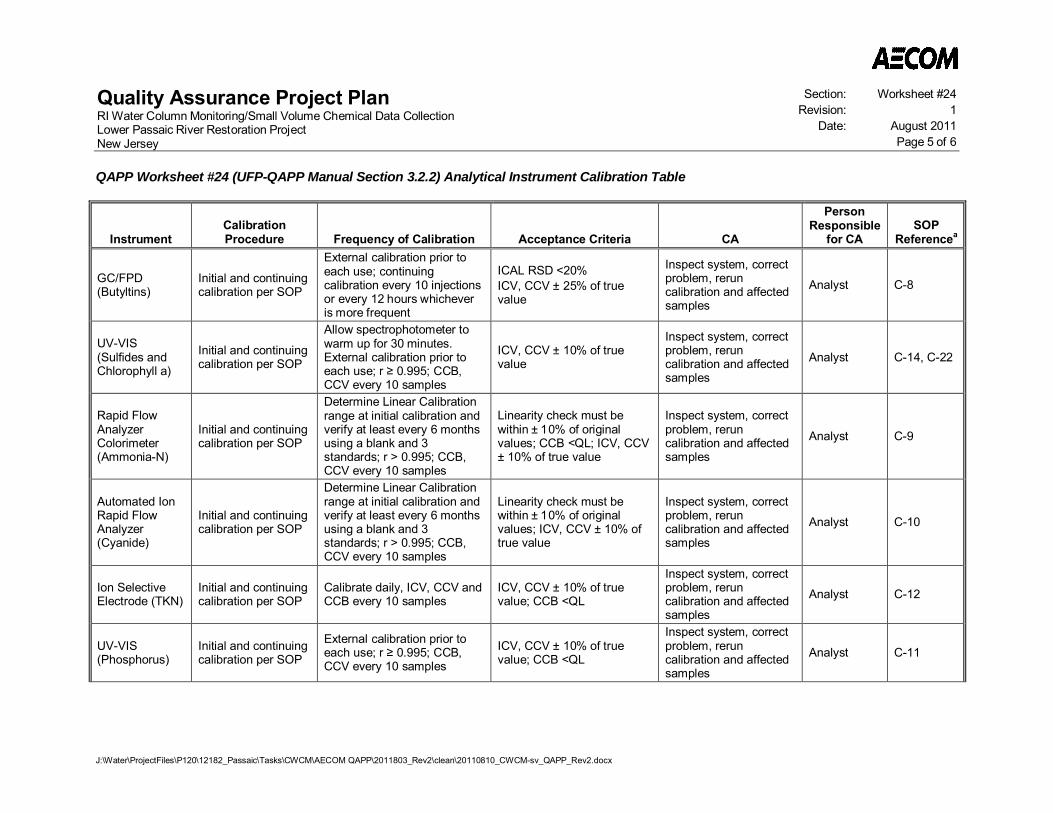
Quality Assurance Project PlanRI Water Column Monitoring/Small Volume Chemical Data CollectionLower Passaic River Restoration ProjectNew Jersey
Section: Worksheet #24Revision: 1
Date: August 2011Page 5 of 6
QAPP Worksheet #24 (UFP-QAPP Manual Section 3.2.2) Analytical Instrument Calibration Table
J:\Water\ProjectFiles\P120\12182_Passaic\Tasks\CWCM\AECOM QAPP\2011803_Rev2\clean\20110810_CWCM-sv_QAPP_Rev2.docx
InstrumentCalibrationProcedure Frequency of Calibration Acceptance Criteria CA
PersonResponsible
for CASOP
Referencea
GC/FPD(Butyltins)
Initial and continuingcalibration per SOP
External calibration prior toeach use; continuingcalibration every 10 injectionsor every 12 hours whicheveris more frequent
ICAL RSD <20%ICV, CCV ± 25% of truevalue
Inspect system, correctproblem, reruncalibration and affectedsamples
Analyst C-8
UV-VIS(Sulfides andChlorophyll a)
Initial and continuingcalibration per SOP
Allow spectrophotometer towarm up for 30 minutes.External calibration prior toeach use; r 0.995; CCB,CCV every 10 samples
ICV, CCV ± 10% of truevalue
Inspect system, correctproblem, reruncalibration and affectedsamples
Analyst C-14, C-22
Rapid FlowAnalyzerColorimeter(Ammonia-N)
Initial and continuingcalibration per SOP
Determine Linear Calibrationrange at initial calibration andverify at least every 6 monthsusing a blank and 3standards; r > 0.995; CCB,CCV every 10 samples
Linearity check must bewithin ± 10% of originalvalues; CCB <QL; ICV, CCV± 10% of true value
Inspect system, correctproblem, reruncalibration and affectedsamples
Analyst C-9
Automated IonRapid FlowAnalyzer(Cyanide)
Initial and continuingcalibration per SOP
Determine Linear Calibrationrange at initial calibration andverify at least every 6 monthsusing a blank and 3standards; r > 0.995; CCB,CCV every 10 samples
Linearity check must bewithin ± 10% of originalvalues; ICV, CCV ± 10% oftrue value
Inspect system, correctproblem, reruncalibration and affectedsamples
Analyst C-10
Ion SelectiveElectrode (TKN)
Initial and continuingcalibration per SOP
Calibrate daily, ICV, CCV andCCB every 10 samples
ICV, CCV ± 10% of truevalue; CCB <QL
Inspect system, correctproblem, reruncalibration and affectedsamples
Analyst C-12
UV-VIS(Phosphorus)
Initial and continuingcalibration per SOP
External calibration prior toeach use; r 0.995; CCB,CCV every 10 samples
ICV, CCV ± 10% of truevalue; CCB <QL
Inspect system, correctproblem, reruncalibration and affectedsamples
Analyst C-11
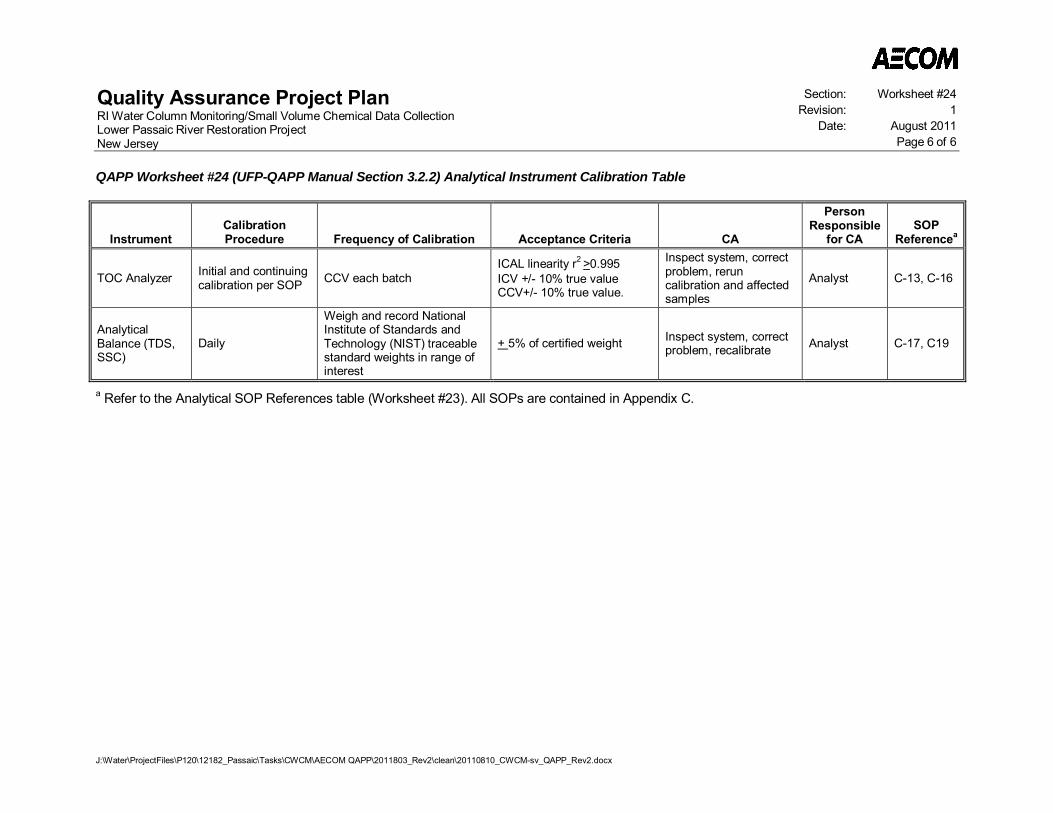
Quality Assurance Project PlanRI Water Column Monitoring/Small Volume Chemical Data CollectionLower Passaic River Restoration ProjectNew Jersey
Section: Worksheet #24Revision: 1
Date: August 2011Page 6 of 6
QAPP Worksheet #24 (UFP-QAPP Manual Section 3.2.2) Analytical Instrument Calibration Table
J:\Water\ProjectFiles\P120\12182_Passaic\Tasks\CWCM\AECOM QAPP\2011803_Rev2\clean\20110810_CWCM-sv_QAPP_Rev2.docx
InstrumentCalibrationProcedure Frequency of Calibration Acceptance Criteria CA
PersonResponsible
for CASOP
Referencea
TOC Analyzer Initial and continuingcalibration per SOP CCV each batch
ICAL linearity r2 >0.995ICV +/- 10% true valueCCV+/- 10% true value.
Inspect system, correctproblem, reruncalibration and affectedsamples
Analyst C-13, C-16
AnalyticalBalance (TDS,SSC)
Daily
Weigh and record NationalInstitute of Standards andTechnology (NIST) traceablestandard weights in range ofinterest
+ 5% of certified weight Inspect system, correctproblem, recalibrate Analyst C-17, C19
a Refer to the Analytical SOP References table (Worksheet #23). All SOPs are contained in Appendix C.

Quality Assurance Project PlanRI Water Column Monitoring/Small Volume Chemical Data CollectionLower Passaic River Restoration ProjectNew Jersey
Section: Worksheet #25Revision: 2
Date: August 2011Page 1 of 4
J:\Water\ProjectFiles\P120\12182_Passaic\Tasks\CWCM\AECOM QAPP\2011803_Rev2\clean\20110810_CWCM-sv_QAPP_Rev2.docx
QAPP Worksheet #25 (UFP-QAPP Manual Section 3.2.2) Analytical Instrument and Equipment Maintenance, Testing, and Inspection Table
Instrument/Equipment
MaintenanceActivity
TestingActivity
InspectionActivity Frequency
AcceptanceCriteria CA
ResponsiblePerson
SOPReferencea
GC/MS (VOC andSVOC)
Clean sources andquadrupole rods;maintain vacuumpumps; tune massspectrometer asneeded
TuningInstrumentperformanceand sensitivity
Service vacuumpumps twice peryear; othermaintenance asneeded
See SOP See SOPAnalyst orSectionSupervisor
C-1, T-2
HRGC/LRMS-SIM(PAH and AlkylPAHs)
Clean sources andquadrupole rods;maintain vacuumpumps
TuningInstrumentperformanceand sensitivity
Service vacuumpumps once peryear; othermaintenance asneeded
See SOP See SOPAnalyst orSectionSupervisor
T-4
HRGC/HRMS (OCPesticides)
Clean sources andquadrupole rods;maintain vacuumpumps
TuningInstrumentperformanceand sensitivity
Service vacuumpumps twice peryear; othermaintenance asneeded
See SOP See SOPAnalyst orSectionSupervisor
T-11
HRGC/HRMS(PCB Congenersand Homologs)
Clean sources;maintain vacuumpumps
TuningInstrumentperformanceand sensitivity
Service vacuumpumps once peryear; othermaintenance asneeded
See SOP See SOPAnalyst orSectionSupervisor
T-6
Isotope DilutionMassSpectrometry(PCDD/PCDFs)
Clean sources andquadrupole rods;maintain vacuumpumps
TuningInstrumentperformanceand sensitivity
Service vacuumpumps twiceper year; othermaintenance asneeded
See SOP See SOPAnalyst orSectionSupervisor
A-1
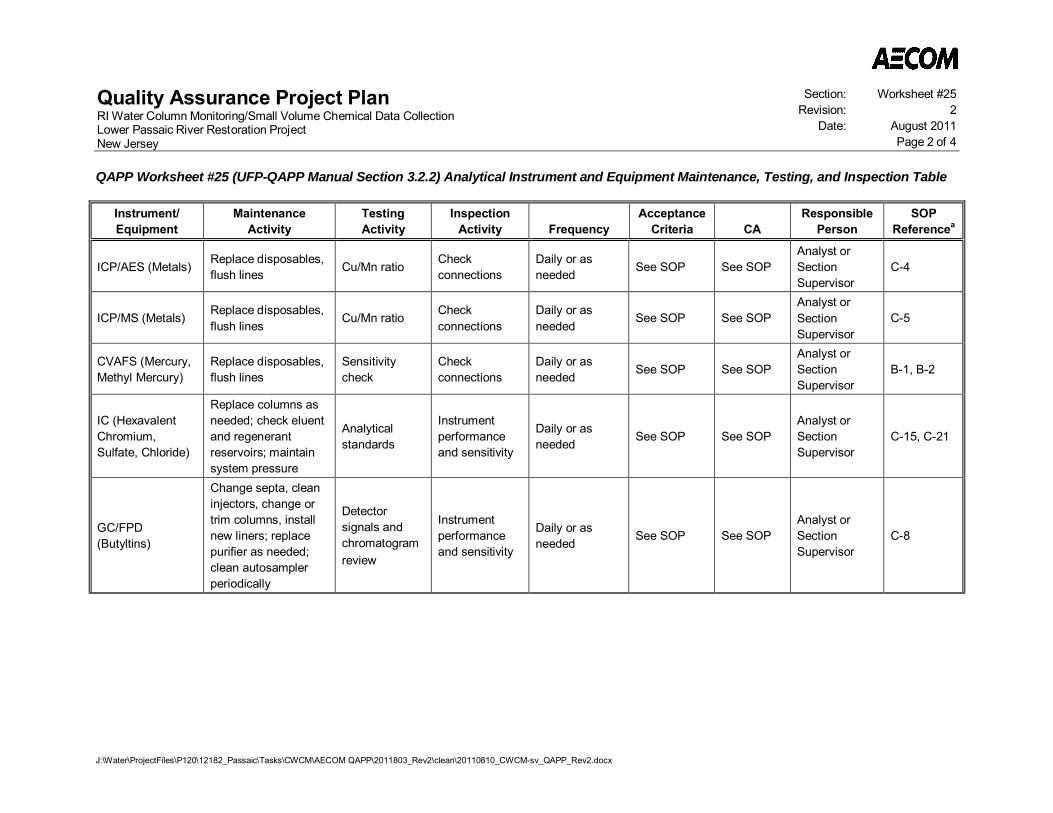
Quality Assurance Project PlanRI Water Column Monitoring/Small Volume Chemical Data CollectionLower Passaic River Restoration ProjectNew Jersey
Section: Worksheet #25Revision: 2
Date: August 2011Page 2 of 4
QAPP Worksheet #25 (UFP-QAPP Manual Section 3.2.2) Analytical Instrument and Equipment Maintenance, Testing, and Inspection Table
J:\Water\ProjectFiles\P120\12182_Passaic\Tasks\CWCM\AECOM QAPP\2011803_Rev2\clean\20110810_CWCM-sv_QAPP_Rev2.docx
Instrument/Equipment
MaintenanceActivity
TestingActivity
InspectionActivity Frequency
AcceptanceCriteria CA
ResponsiblePerson
SOPReferencea
ICP/AES (Metals) Replace disposables,flush lines Cu/Mn ratio Check
connectionsDaily or asneeded See SOP See SOP
Analyst orSectionSupervisor
C-4
ICP/MS (Metals) Replace disposables,flush lines
Cu/Mn ratio Checkconnections
Daily or asneeded
See SOP See SOPAnalyst orSectionSupervisor
C-5
CVAFS (Mercury,Methyl Mercury)
Replace disposables,flush lines
Sensitivitycheck
Checkconnections
Daily or asneeded See SOP See SOP
Analyst orSectionSupervisor
B-1, B-2
IC (HexavalentChromium,Sulfate, Chloride)
Replace columns asneeded; check eluentand regenerantreservoirs; maintainsystem pressure
Analyticalstandards
Instrumentperformanceand sensitivity
Daily or asneeded See SOP See SOP
Analyst orSectionSupervisor
C-15, C-21
GC/FPD(Butyltins)
Change septa, cleaninjectors, change ortrim columns, installnew liners; replacepurifier as needed;clean autosamplerperiodically
Detectorsignals andchromatogramreview
Instrumentperformanceand sensitivity
Daily or asneeded See SOP See SOP
Analyst orSectionSupervisor
C-8
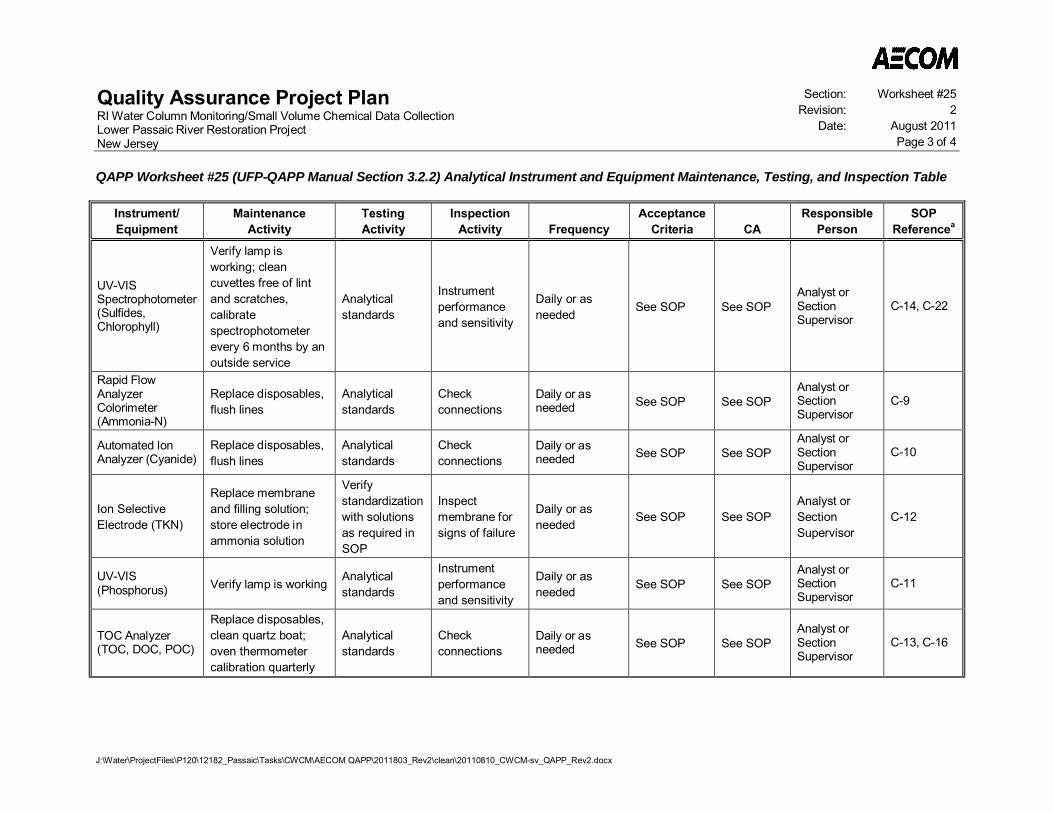
Quality Assurance Project PlanRI Water Column Monitoring/Small Volume Chemical Data CollectionLower Passaic River Restoration ProjectNew Jersey
Section: Worksheet #25Revision: 2
Date: August 2011Page 3 of 4
QAPP Worksheet #25 (UFP-QAPP Manual Section 3.2.2) Analytical Instrument and Equipment Maintenance, Testing, and Inspection Table
J:\Water\ProjectFiles\P120\12182_Passaic\Tasks\CWCM\AECOM QAPP\2011803_Rev2\clean\20110810_CWCM-sv_QAPP_Rev2.docx
Instrument/Equipment
MaintenanceActivity
TestingActivity
InspectionActivity Frequency
AcceptanceCriteria CA
ResponsiblePerson
SOPReferencea
UV-VISSpectrophotometer(Sulfides,Chlorophyll)
Verify lamp isworking; cleancuvettes free of lintand scratches,calibratespectrophotometerevery 6 months by anoutside service
Analyticalstandards
Instrumentperformanceand sensitivity
Daily or asneeded See SOP See SOP
Analyst orSectionSupervisor
C-14, C-22
Rapid FlowAnalyzerColorimeter(Ammonia-N)
Replace disposables,flush lines
Analyticalstandards
Checkconnections
Daily or asneeded See SOP See SOP
Analyst orSectionSupervisor
C-9
Automated IonAnalyzer (Cyanide)
Replace disposables,flush lines
Analyticalstandards
Checkconnections
Daily or asneeded See SOP See SOP
Analyst orSectionSupervisor
C-10
Ion SelectiveElectrode (TKN)
Replace membraneand filling solution;store electrode inammonia solution
Verifystandardizationwith solutionsas required inSOP
Inspectmembrane forsigns of failure
Daily or asneeded See SOP See SOP
Analyst orSectionSupervisor
C-12
UV-VIS(Phosphorus) Verify lamp is working Analytical
standards
Instrumentperformanceand sensitivity
Daily or asneeded See SOP See SOP
Analyst orSectionSupervisor
C-11
TOC Analyzer(TOC, DOC, POC)
Replace disposables,clean quartz boat;oven thermometercalibration quarterly
Analyticalstandards
Checkconnections
Daily or asneeded See SOP See SOP
Analyst orSectionSupervisor
C-13, C-16
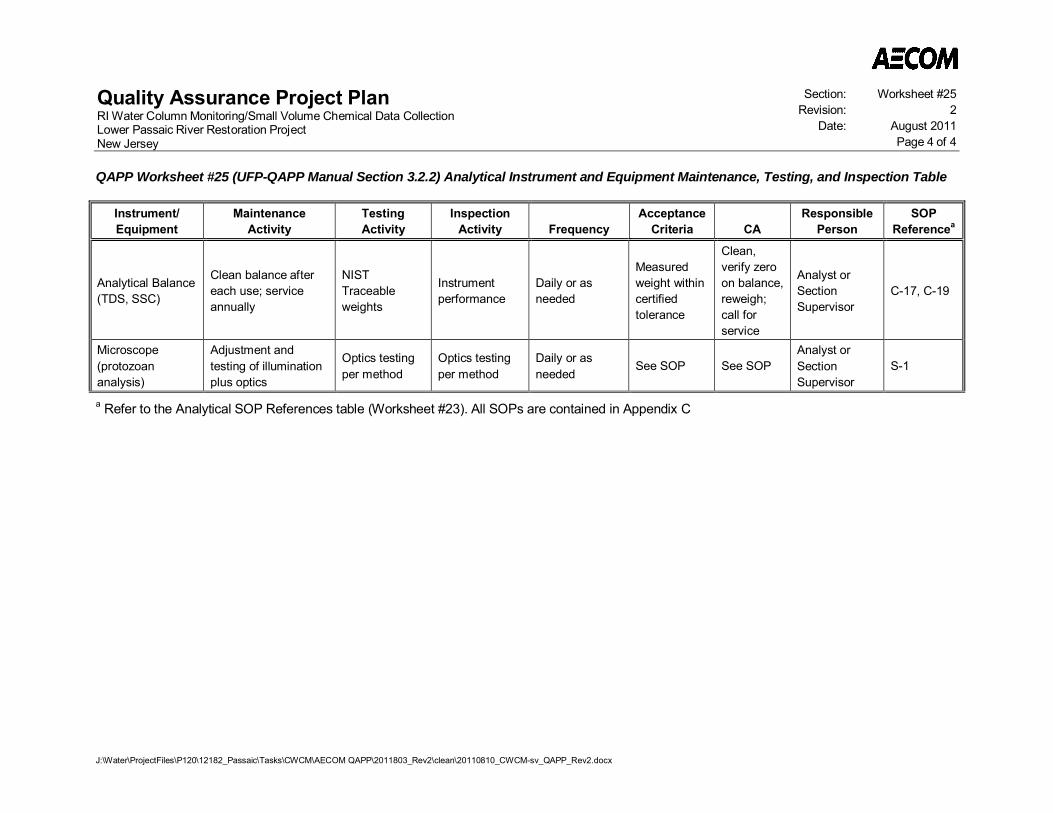
Quality Assurance Project PlanRI Water Column Monitoring/Small Volume Chemical Data CollectionLower Passaic River Restoration ProjectNew Jersey
Section: Worksheet #25Revision: 2
Date: August 2011Page 4 of 4
QAPP Worksheet #25 (UFP-QAPP Manual Section 3.2.2) Analytical Instrument and Equipment Maintenance, Testing, and Inspection Table
J:\Water\ProjectFiles\P120\12182_Passaic\Tasks\CWCM\AECOM QAPP\2011803_Rev2\clean\20110810_CWCM-sv_QAPP_Rev2.docx
Instrument/Equipment
MaintenanceActivity
TestingActivity
InspectionActivity Frequency
AcceptanceCriteria CA
ResponsiblePerson
SOPReferencea
Analytical Balance(TDS, SSC)
Clean balance aftereach use; serviceannually
NISTTraceableweights
Instrumentperformance
Daily or asneeded
Measuredweight withincertifiedtolerance
Clean,verify zeroon balance,reweigh;call forservice
Analyst orSectionSupervisor
C-17, C-19
Microscope(protozoananalysis)
Adjustment andtesting of illuminationplus optics
Optics testingper method
Optics testingper method
Daily or asneeded
See SOP See SOPAnalyst orSectionSupervisor
S-1
a Refer to the Analytical SOP References table (Worksheet #23). All SOPs are contained in Appendix C
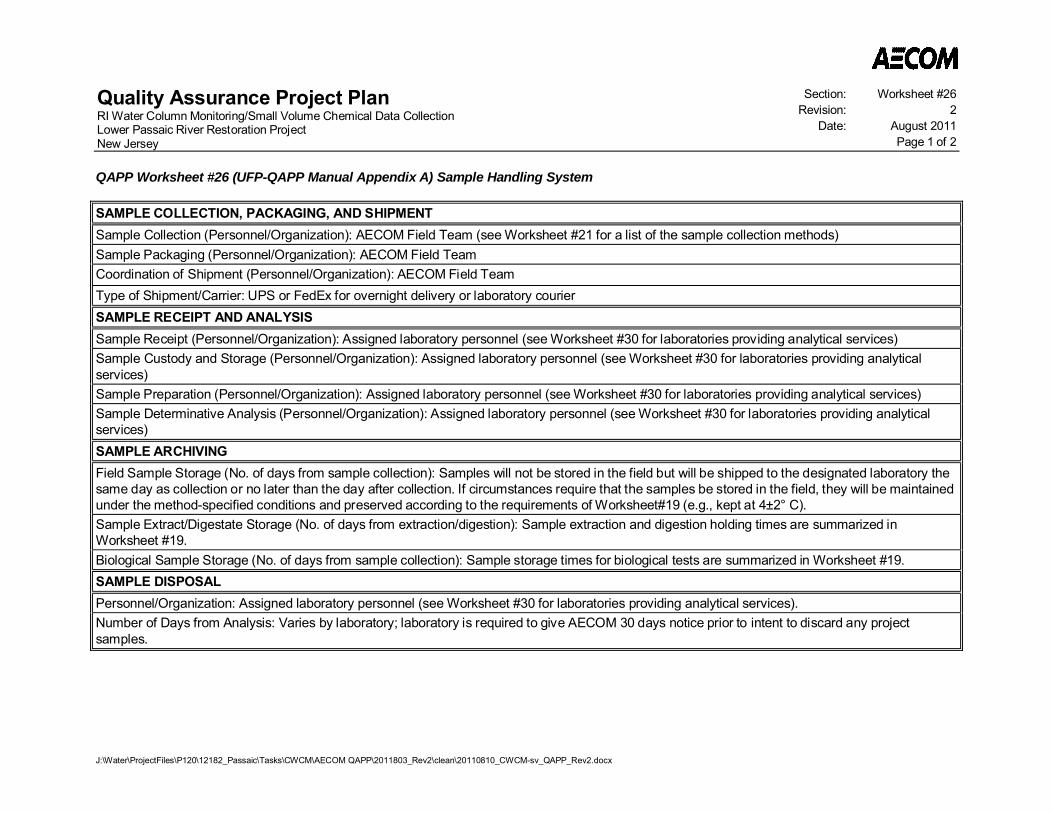
Quality Assurance Project PlanRI Water Column Monitoring/Small Volume Chemical Data CollectionLower Passaic River Restoration ProjectNew Jersey
Section: Worksheet #26Revision: 2
Date: August 2011Page 1 of 2
J:\Water\ProjectFiles\P120\12182_Passaic\Tasks\CWCM\AECOM QAPP\2011803_Rev2\clean\20110810_CWCM-sv_QAPP_Rev2.docx
QAPP Worksheet #26 (UFP-QAPP Manual Appendix A) Sample Handling System
SAMPLE COLLECTION, PACKAGING, AND SHIPMENTSample Collection (Personnel/Organization): AECOM Field Team (see Worksheet #21 for a list of the sample collection methods)Sample Packaging (Personnel/Organization): AECOM Field TeamCoordination of Shipment (Personnel/Organization): AECOM Field TeamType of Shipment/Carrier: UPS or FedEx for overnight delivery or laboratory courierSAMPLE RECEIPT AND ANALYSISSample Receipt (Personnel/Organization): Assigned laboratory personnel (see Worksheet #30 for laboratories providing analytical services)Sample Custody and Storage (Personnel/Organization): Assigned laboratory personnel (see Worksheet #30 for laboratories providing analyticalservices)Sample Preparation (Personnel/Organization): Assigned laboratory personnel (see Worksheet #30 for laboratories providing analytical services)Sample Determinative Analysis (Personnel/Organization): Assigned laboratory personnel (see Worksheet #30 for laboratories providing analyticalservices)SAMPLE ARCHIVINGField Sample Storage (No. of days from sample collection): Samples will not be stored in the field but will be shipped to the designated laboratory thesame day as collection or no later than the day after collection. If circumstances require that the samples be stored in the field, they will be maintainedunder the method-specified conditions and preserved according to the requirements of Worksheet#19 (e.g., kept at 4±2° C).Sample Extract/Digestate Storage (No. of days from extraction/digestion): Sample extraction and digestion holding times are summarized inWorksheet #19.Biological Sample Storage (No. of days from sample collection): Sample storage times for biological tests are summarized in Worksheet #19.SAMPLE DISPOSALPersonnel/Organization: Assigned laboratory personnel (see Worksheet #30 for laboratories providing analytical services).Number of Days from Analysis: Varies by laboratory; laboratory is required to give AECOM 30 days notice prior to intent to discard any projectsamples.
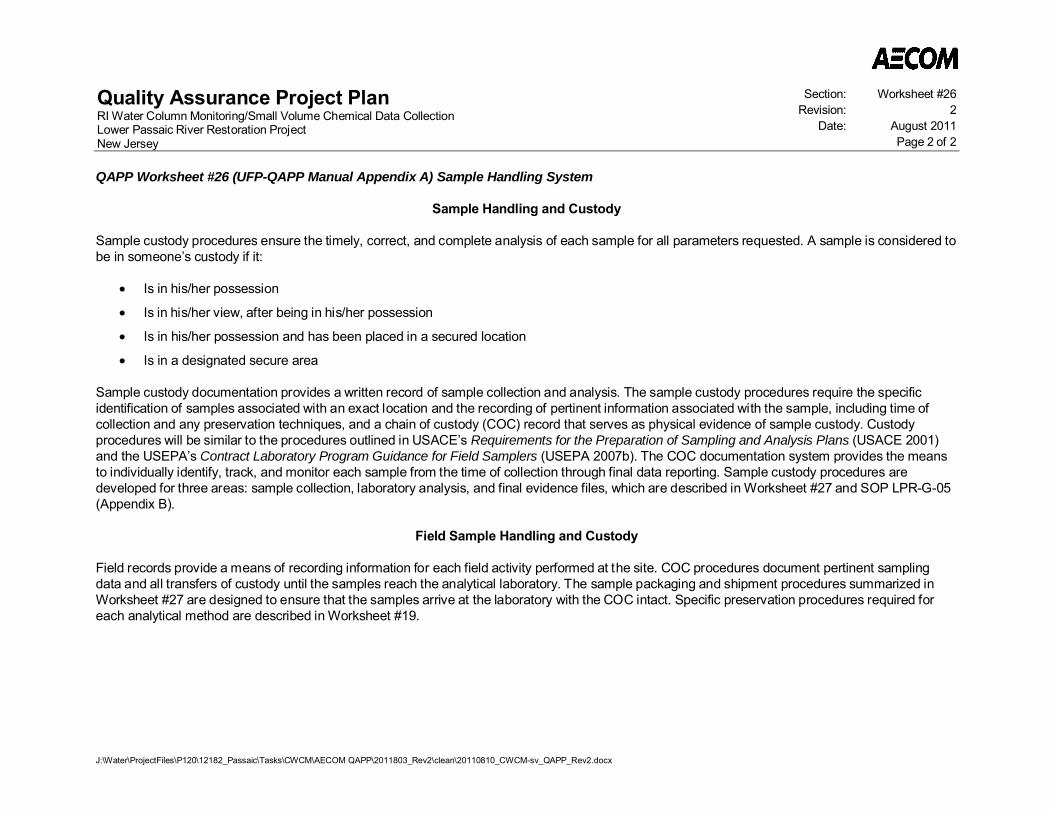
Quality Assurance Project PlanRI Water Column Monitoring/Small Volume Chemical Data CollectionLower Passaic River Restoration ProjectNew Jersey
Section: Worksheet #26Revision: 2
Date: August 2011Page 2 of 2
QAPP Worksheet #26 (UFP-QAPP Manual Appendix A) Sample Handling System
J:\Water\ProjectFiles\P120\12182_Passaic\Tasks\CWCM\AECOM QAPP\2011803_Rev2\clean\20110810_CWCM-sv_QAPP_Rev2.docx
Sample Handling and Custody
Sample custody procedures ensure the timely, correct, and complete analysis of each sample for all parameters requested. A sample is considered tobe in someone’s custody if it:
Is in his/her possession
Is in his/her view, after being in his/her possession
Is in his/her possession and has been placed in a secured location
Is in a designated secure area
Sample custody documentation provides a written record of sample collection and analysis. The sample custody procedures require the specificidentification of samples associated with an exact location and the recording of pertinent information associated with the sample, including time ofcollection and any preservation techniques, and a chain of custody (COC) record that serves as physical evidence of sample custody. Custodyprocedures will be similar to the procedures outlined in USACE’s Requirements for the Preparation of Sampling and Analysis Plans (USACE 2001)and the USEPA’s Contract Laboratory Program Guidance for Field Samplers (USEPA 2007b). The COC documentation system provides the meansto individually identify, track, and monitor each sample from the time of collection through final data reporting. Sample custody procedures aredeveloped for three areas: sample collection, laboratory analysis, and final evidence files, which are described in Worksheet #27 and SOP LPR-G-05(Appendix B).
Field Sample Handling and Custody
Field records provide a means of recording information for each field activity performed at the site. COC procedures document pertinent samplingdata and all transfers of custody until the samples reach the analytical laboratory. The sample packaging and shipment procedures summarized inWorksheet #27 are designed to ensure that the samples arrive at the laboratory with the COC intact. Specific preservation procedures required foreach analytical method are described in Worksheet #19.

Quality Assurance Project Plan RI Water Column Monitoring/Small Volume Chemical Data Collection Lower Passaic River Restoration Project New Jersey
Section: Wo rksheet #27 Revision: 3
Date: J uly 2012 Page 1 of 4
Q:\mw2007\Projects\60145884\V110\Kris_20120622_CWCM-sv_QAPP_Rev3.docx
QAPP Worksheet #27 (UFP-QAPP Manual Section 3.3.3) Sample Custody Requirements
Field Sample Custody Procedures (sample collection, packaging, shipment, and delivery to laboratory): The field sample custody procedures including sample packing, shipment, and delivery requirements, are discussed in Worksheet #26. Sample management information is also provided in SOPs LPR-G-05 and LPR-G-06 (Appendix B).
Laboratory Sample Custody Procedures (receipt of samples, archiving, disposal): Each laboratory has a sample custodian who accepts custody of the samples and verifies that the information on the sample labels matches the information on the COC. The sample custodian will document any discrepancies, document sample condition upon receipt at the laboratory and will sign and date all appropriate receiving documents. Additional information on laboratory sample receiving procedures is provided in the text below this summary table.
Sample Identification Procedures: Each sample will be assigned a unique sample identification number using the Lower Passaic River Data Management System. This identification nomenclature will consist of an alphanumeric code that identifies the program, sample location (including depth interval if needed), and sample type. Details of sample identification are provided below.
Chain-of-Custody Procedures: A COC will accompany all samples from the time of sampling through all custody transfers. Examples of the COC forms are provided in SOP LPR-G-05 (Appendix B); the COC procedures are summarized below and in SOP LPR-G-05.
Sample Identification
Samples will be uniquely identified at the time of collection. The sample identifiers will be assigned according to the following pattern:
Program-Eve nt-Station-Depth-Type
Where:
Program Two-digit year plus sequence letter to distinguish sampling programs: “11A” for the first event of the CWCM program, assuming an August 2011 event.
Event “CE” plus two-digit sequence number: Event will define tide stage or hydrographic period for the sample. It is not linked directly to a survey but a range of event numbers will all belong to one survey (e.g., CE01 may be high slack, CE02 may be low slack, and CE03 may non-tidal during a survey). For Routine Events, a specific event code will be linked to each tidal phase as follows: CE01 – low slack tide, CE02 – flood tide, CE03 – high slack tide, and CE04 – ebb tide. For the High Flow sampling event, the samples that are hydrograph dependent will be assigned sequential event codes, starting with CE11 for the samples collected on the rising limb. The sample collected at the peak of the hydrograph will be CE20, and the samples collected during the falling limb will begin with CE21.
Station “T” plus three-digit representation of RM by tenths” “T014” for station at RM 1.4
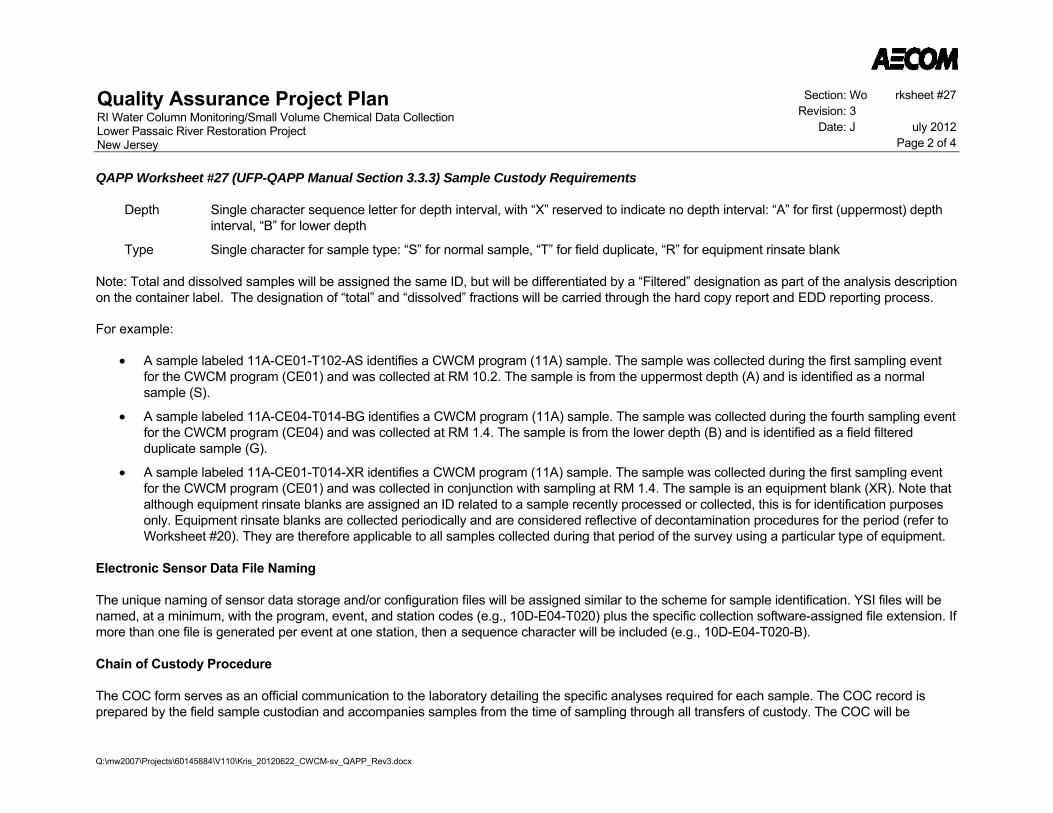
Quality Assurance Project Plan RI Water Column Monitoring/Small Volume Chemical Data Collection Lower Passaic River Restoration Project New Jersey
Section: Wo rksheet #27 Revision: 3
Date: J uly 2012 Page 2 of 4
QAPP Worksheet #27 (UFP-QAPP Manual Section 3.3.3) Sample Custody Requirements
Q:\mw2007\Projects\60145884\V110\Kris_20120622_CWCM-sv_QAPP_Rev3.docx
Depth Single character sequence letter for depth interval, with “X” reserved to indicate no depth interval: “A” for first (uppermost) depth interval, “B” for lower depth
Type Single character for sample type: “S” for normal sample, “T” for field duplicate, “R” for equipment rinsate blank
Note: Total and dissolved samples will be assigned the same ID, but will be differentiated by a “Filtered” designation as part of the analysis description on the container label. The designation of “total” and “dissolved” fractions will be carried through the hard copy report and EDD reporting process.
For example:
A sample labeled 11A-CE01-T102-AS identifies a CWCM program (11A) sample. The sample was collected during the first sampling event for the CWCM program (CE01) and was collected at RM 10.2. The sample is from the uppermost depth (A) and is identified as a normal sample (S).
A sample labeled 11A-CE04-T014-BG identifies a CWCM program (11A) sample. The sample was collected during the fourth sampling event for the CWCM program (CE04) and was collected at RM 1.4. The sample is from the lower depth (B) and is identified as a field filtered duplicate sample (G).
A sample labeled 11A-CE01-T014-XR identifies a CWCM program (11A) sample. The sample was collected during the first sampling event for the CWCM program (CE01) and was collected in conjunction with sampling at RM 1.4. The sample is an equipment blank (XR). Note that although equipment rinsate blanks are assigned an ID related to a sample recently processed or collected, this is for identification purposes only. Equipment rinsate blanks are collected periodically and are considered reflective of decontamination procedures for the period (refer to Worksheet #20). They are therefore applicable to all samples collected during that period of the survey using a particular type of equipment.
Electronic Sensor Data File Naming
The unique naming of sensor data storage and/or configuration files will be assigned similar to the scheme for sample identification. YSI files will be named, at a minimum, with the program, event, and station codes (e.g., 10D-E04-T020) plus the specific collection software-assigned file extension. If more than one file is generated per event at one station, then a sequence character will be included (e.g., 10D-E04-T020-B).
Chain of Custody Procedure
The COC form serves as an official communication to the laboratory detailing the specific analyses required for each sample. The COC record is prepared by the field sample custodian and accompanies samples from the time of sampling through all transfers of custody. The COC will be
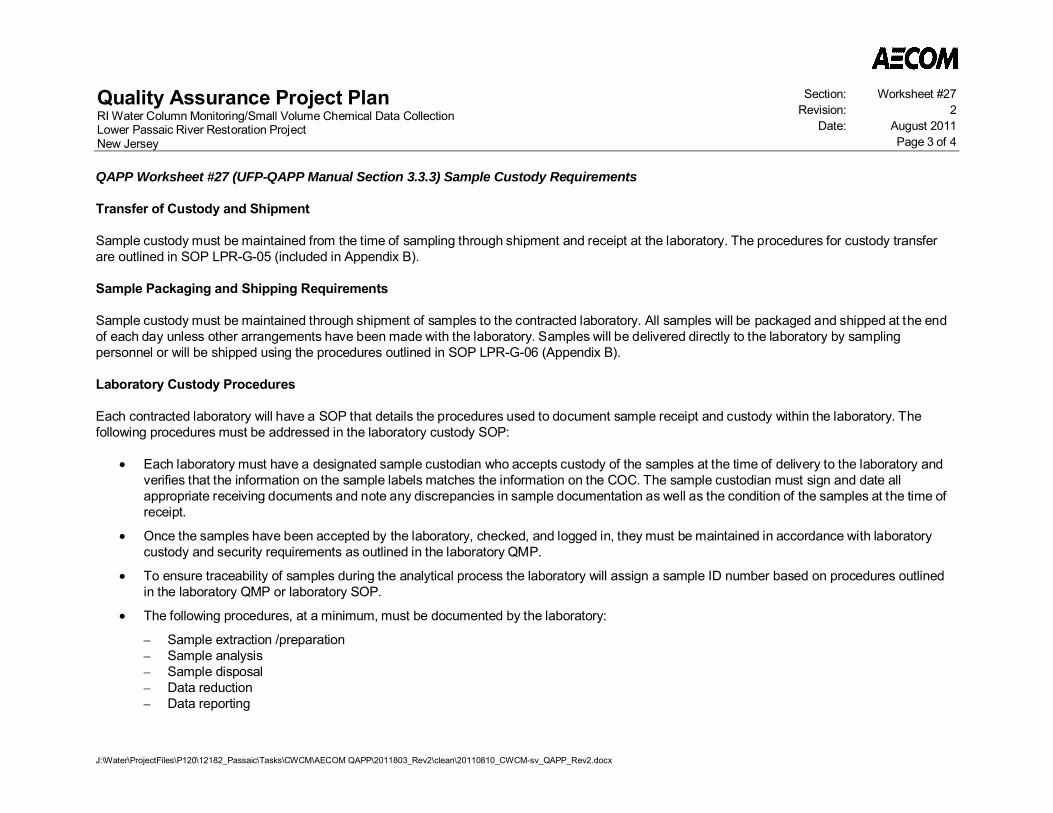
Quality Assurance Project PlanRI Water Column Monitoring/Small Volume Chemical Data CollectionLower Passaic River Restoration ProjectNew Jersey
Section: Worksheet #27Revision: 2
Date: August 2011Page 3 of 4
QAPP Worksheet #27 (UFP-QAPP Manual Section 3.3.3) Sample Custody Requirements
J:\Water\ProjectFiles\P120\12182_Passaic\Tasks\CWCM\AECOM QAPP\2011803_Rev2\clean\20110810_CWCM-sv_QAPP_Rev2.docx
Transfer of Custody and Shipment
Sample custody must be maintained from the time of sampling through shipment and receipt at the laboratory. The procedures for custody transferare outlined in SOP LPR-G-05 (included in Appendix B).
Sample Packaging and Shipping Requirements
Sample custody must be maintained through shipment of samples to the contracted laboratory. All samples will be packaged and shipped at the endof each day unless other arrangements have been made with the laboratory. Samples will be delivered directly to the laboratory by samplingpersonnel or will be shipped using the procedures outlined in SOP LPR-G-06 (Appendix B).
Laboratory Custody Procedures
Each contracted laboratory will have a SOP that details the procedures used to document sample receipt and custody within the laboratory. Thefollowing procedures must be addressed in the laboratory custody SOP:
Each laboratory must have a designated sample custodian who accepts custody of the samples at the time of delivery to the laboratory andverifies that the information on the sample labels matches the information on the COC. The sample custodian must sign and date allappropriate receiving documents and note any discrepancies in sample documentation as well as the condition of the samples at the time ofreceipt.
Once the samples have been accepted by the laboratory, checked, and logged in, they must be maintained in accordance with laboratorycustody and security requirements as outlined in the laboratory QMP.
To ensure traceability of samples during the analytical process the laboratory will assign a sample ID number based on procedures outlinedin the laboratory QMP or laboratory SOP.
The following procedures, at a minimum, must be documented by the laboratory:
– Sample extraction /preparation– Sample analysis– Sample disposal– Data reduction– Data reporting
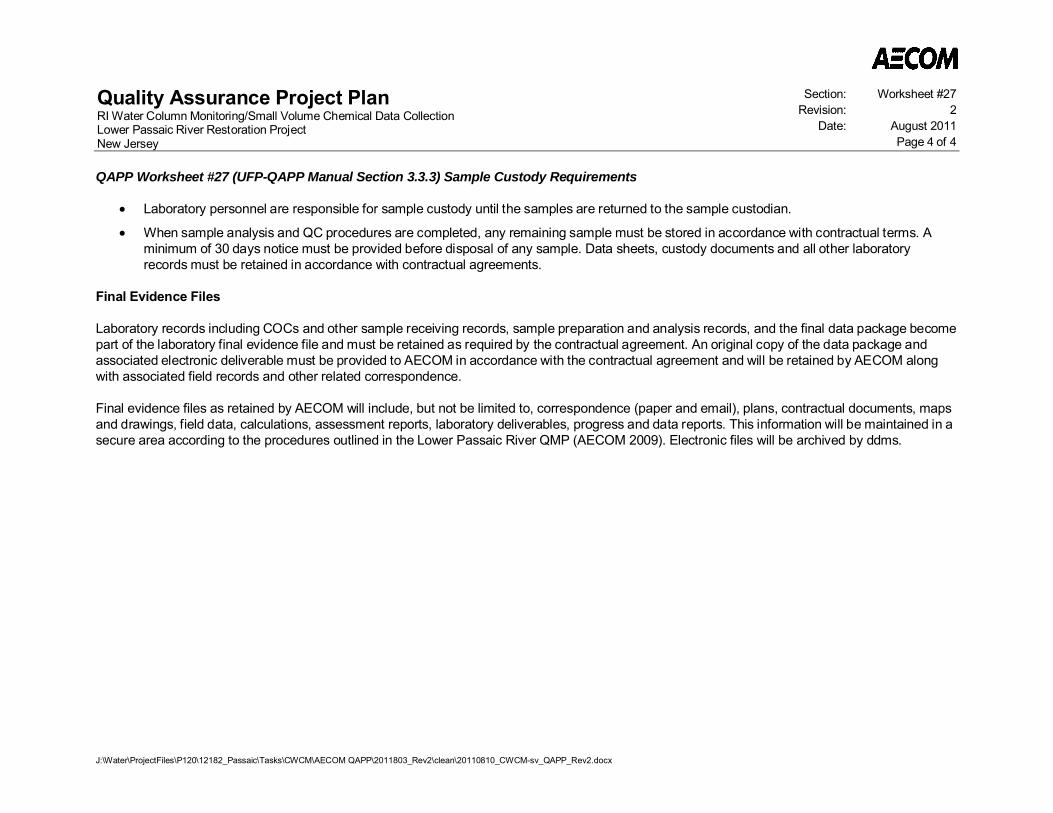
Quality Assurance Project PlanRI Water Column Monitoring/Small Volume Chemical Data CollectionLower Passaic River Restoration ProjectNew Jersey
Section: Worksheet #27Revision: 2
Date: August 2011Page 4 of 4
QAPP Worksheet #27 (UFP-QAPP Manual Section 3.3.3) Sample Custody Requirements
J:\Water\ProjectFiles\P120\12182_Passaic\Tasks\CWCM\AECOM QAPP\2011803_Rev2\clean\20110810_CWCM-sv_QAPP_Rev2.docx
Laboratory personnel are responsible for sample custody until the samples are returned to the sample custodian.
When sample analysis and QC procedures are completed, any remaining sample must be stored in accordance with contractual terms. Aminimum of 30 days notice must be provided before disposal of any sample. Data sheets, custody documents and all other laboratoryrecords must be retained in accordance with contractual agreements.
Final Evidence Files
Laboratory records including COCs and other sample receiving records, sample preparation and analysis records, and the final data package becomepart of the laboratory final evidence file and must be retained as required by the contractual agreement. An original copy of the data package andassociated electronic deliverable must be provided to AECOM in accordance with the contractual agreement and will be retained by AECOM alongwith associated field records and other related correspondence.
Final evidence files as retained by AECOM will include, but not be limited to, correspondence (paper and email), plans, contractual documents, mapsand drawings, field data, calculations, assessment reports, laboratory deliverables, progress and data reports. This information will be maintained in asecure area according to the procedures outlined in the Lower Passaic River QMP (AECOM 2009). Electronic files will be archived by ddms.
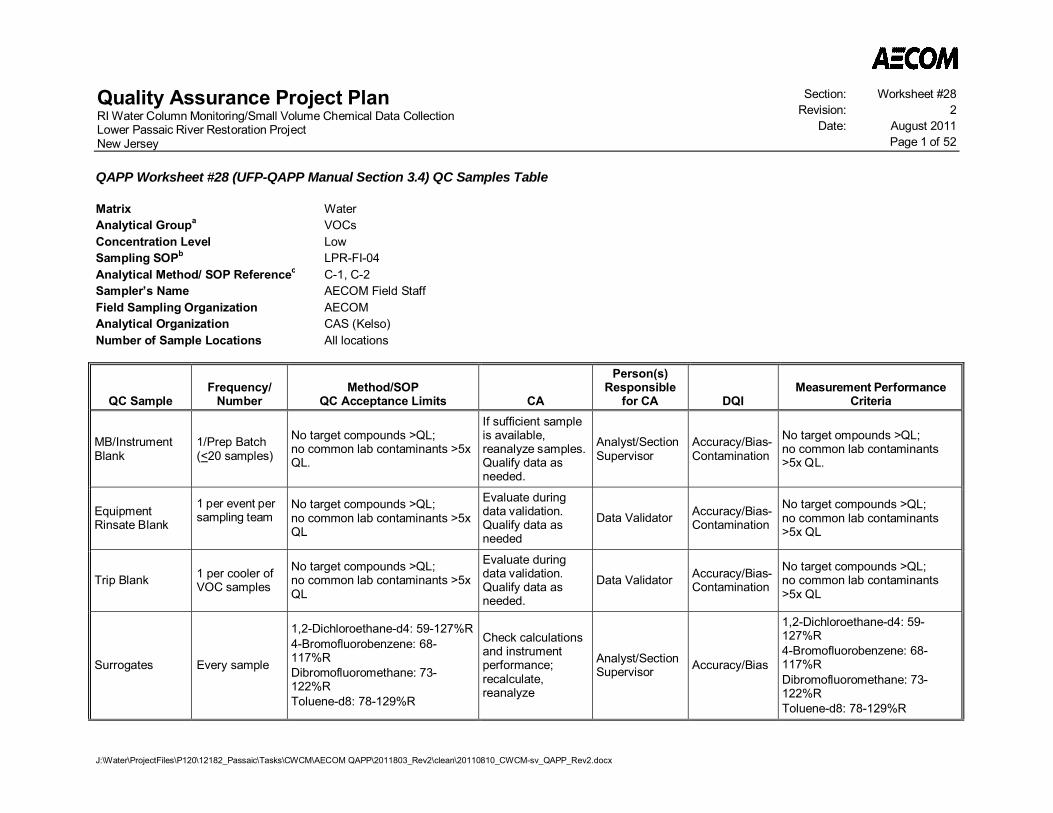
Quality Assurance Project PlanRI Water Column Monitoring/Small Volume Chemical Data CollectionLower Passaic River Restoration ProjectNew Jersey
Section: Worksheet #28Revision: 2
Date: August 2011Page 1 of 52
J:\Water\ProjectFiles\P120\12182_Passaic\Tasks\CWCM\AECOM QAPP\2011803_Rev2\clean\20110810_CWCM-sv_QAPP_Rev2.docx
QAPP Worksheet #28 (UFP-QAPP Manual Section 3.4) QC Samples Table
Matrix WaterAnalytical Groupa VOCsConcentration Level LowSampling SOPb LPR-FI-04Analytical Method/ SOP Referencec C-1, C-2Sampler’s Name AECOM Field StaffField Sampling Organization AECOMAnalytical Organization CAS (Kelso)Number of Sample Locations All locations
QC SampleFrequency/
NumberMethod/SOP
QC Acceptance Limits CA
Person(s)Responsible
for CA DQIMeasurement Performance
Criteria
MB/InstrumentBlank
1/Prep Batch(<20 samples)
No target compounds >QL;no common lab contaminants >5xQL.
If sufficient sampleis available,reanalyze samples.Qualify data asneeded.
Analyst/SectionSupervisor
Accuracy/Bias-Contamination
No target ompounds >QL;no common lab contaminants>5x QL.
EquipmentRinsate Blank
1 per event persampling team
No target compounds >QL;no common lab contaminants >5xQL
Evaluate duringdata validation.Qualify data asneeded
Data Validator Accuracy/Bias-Contamination
No target compounds >QL;no common lab contaminants>5x QL
Trip Blank 1 per cooler ofVOC samples
No target compounds >QL;no common lab contaminants >5xQL
Evaluate duringdata validation.Qualify data asneeded.
Data Validator Accuracy/Bias-Contamination
No target compounds >QL;no common lab contaminants>5x QL
Surrogates Every sample
1,2-Dichloroethane-d4: 59-127%R4-Bromofluorobenzene: 68-117%RDibromofluoromethane: 73-122%RToluene-d8: 78-129%R
Check calculationsand instrumentperformance;recalculate,reanalyze
Analyst/SectionSupervisor Accuracy/Bias
1,2-Dichloroethane-d4: 59-127%R4-Bromofluorobenzene: 68-117%RDibromofluoromethane: 73-122%RToluene-d8: 78-129%R
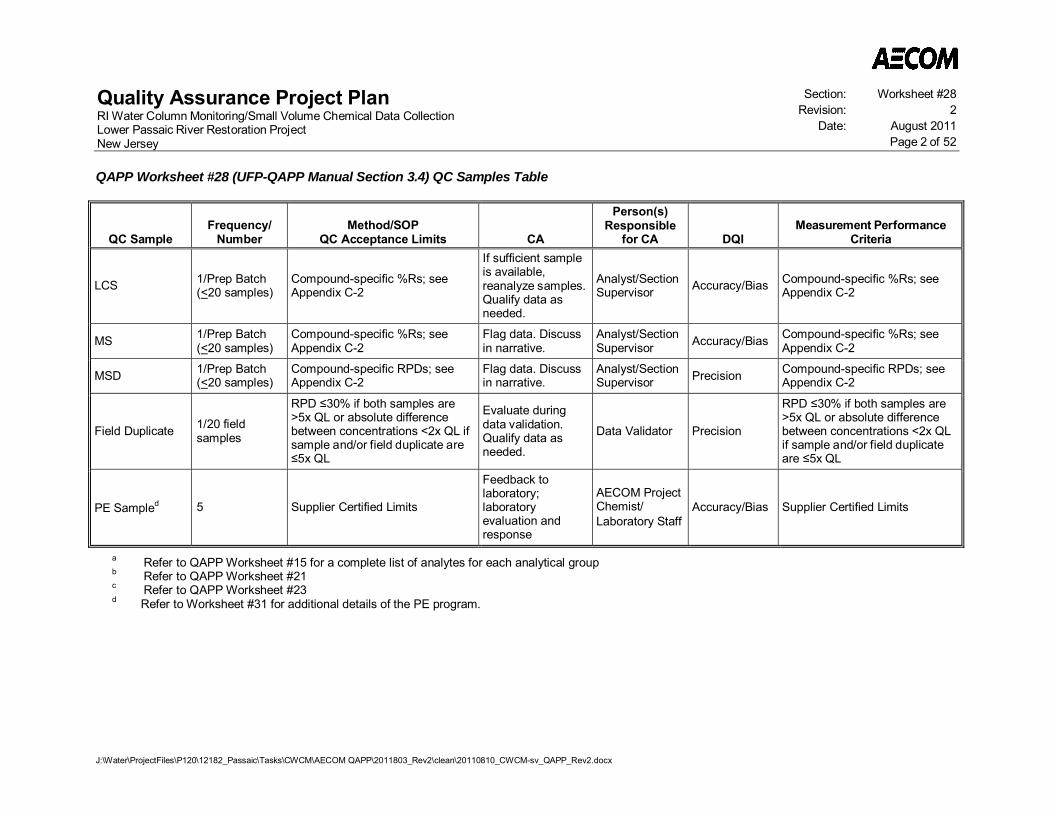
Quality Assurance Project PlanRI Water Column Monitoring/Small Volume Chemical Data CollectionLower Passaic River Restoration ProjectNew Jersey
Section: Worksheet #28Revision: 2
Date: August 2011Page 2 of 52
QAPP Worksheet #28 (UFP-QAPP Manual Section 3.4) QC Samples Table
J:\Water\ProjectFiles\P120\12182_Passaic\Tasks\CWCM\AECOM QAPP\2011803_Rev2\clean\20110810_CWCM-sv_QAPP_Rev2.docx
QC SampleFrequency/
NumberMethod/SOP
QC Acceptance Limits CA
Person(s)Responsible
for CA DQIMeasurement Performance
Criteria
LCS 1/Prep Batch(<20 samples)
Compound-specific %Rs; seeAppendix C-2
If sufficient sampleis available,reanalyze samples.Qualify data asneeded.
Analyst/SectionSupervisor Accuracy/Bias Compound-specific %Rs; see
Appendix C-2
MS 1/Prep Batch(<20 samples)
Compound-specific %Rs; seeAppendix C-2
Flag data. Discussin narrative.
Analyst/SectionSupervisor Accuracy/Bias Compound-specific %Rs; see
Appendix C-2
MSD 1/Prep Batch(<20 samples)
Compound-specific RPDs; seeAppendix C-2
Flag data. Discussin narrative.
Analyst/SectionSupervisor Precision Compound-specific RPDs; see
Appendix C-2
Field Duplicate 1/20 fieldsamples
RPD 30% if both samples are>5x QL or absolute differencebetween concentrations <2x QL ifsample and/or field duplicate are5x QL
Evaluate duringdata validation.Qualify data asneeded.
Data Validator Precision
RPD 30% if both samples are>5x QL or absolute differencebetween concentrations <2x QLif sample and/or field duplicateare 5x QL
PE Sampled 5 Supplier Certified Limits
Feedback tolaboratory;laboratoryevaluation andresponse
AECOM ProjectChemist/Laboratory Staff
Accuracy/Bias Supplier Certified Limits
a Refer to QAPP Worksheet #15 for a complete list of analytes for each analytical groupb Refer to QAPP Worksheet #21c Refer to QAPP Worksheet #23d Refer to Worksheet #31 for additional details of the PE program.
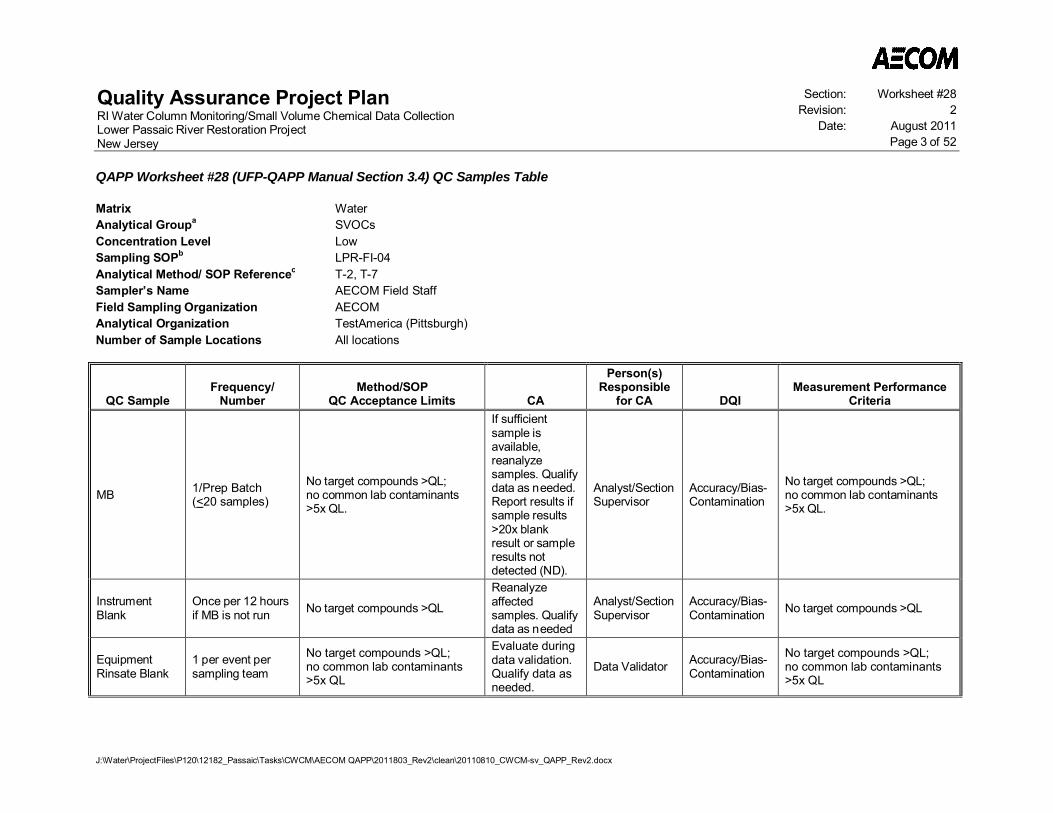
Quality Assurance Project PlanRI Water Column Monitoring/Small Volume Chemical Data CollectionLower Passaic River Restoration ProjectNew Jersey
Section: Worksheet #28Revision: 2
Date: August 2011Page 3 of 52
QAPP Worksheet #28 (UFP-QAPP Manual Section 3.4) QC Samples Table
J:\Water\ProjectFiles\P120\12182_Passaic\Tasks\CWCM\AECOM QAPP\2011803_Rev2\clean\20110810_CWCM-sv_QAPP_Rev2.docx
Matrix WaterAnalytical Groupa SVOCsConcentration Level LowSampling SOPb LPR-FI-04Analytical Method/ SOP Referencec T-2, T-7Sampler’s Name AECOM Field StaffField Sampling Organization AECOMAnalytical Organization TestAmerica (Pittsburgh)Number of Sample Locations All locations
QC SampleFrequency/
NumberMethod/SOP
QC Acceptance Limits CA
Person(s)Responsible
for CA DQIMeasurement Performance
Criteria
MB 1/Prep Batch(<20 samples)
No target compounds >QL;no common lab contaminants>5x QL.
If sufficientsample isavailable,reanalyzesamples. Qualifydata as needed.Report results ifsample results>20x blankresult or sampleresults notdetected (ND).
Analyst/SectionSupervisor
Accuracy/Bias-Contamination
No target compounds >QL;no common lab contaminants>5x QL.
InstrumentBlank
Once per 12 hoursif MB is not run No target compounds >QL
Reanalyzeaffectedsamples. Qualifydata as needed
Analyst/SectionSupervisor
Accuracy/Bias-Contamination No target compounds >QL
EquipmentRinsate Blank
1 per event persampling team
No target compounds >QL;no common lab contaminants>5x QL
Evaluate duringdata validation.Qualify data asneeded.
Data Validator Accuracy/Bias-Contamination
No target compounds >QL;no common lab contaminants>5x QL

Quality Assurance Project PlanRI Water Column Monitoring/Small Volume Chemical Data CollectionLower Passaic River Restoration ProjectNew Jersey
Section: Worksheet #28Revision: 2
Date: August 2011Page 4 of 52
QAPP Worksheet #28 (UFP-QAPP Manual Section 3.4) QC Samples Table
J:\Water\ProjectFiles\P120\12182_Passaic\Tasks\CWCM\AECOM QAPP\2011803_Rev2\clean\20110810_CWCM-sv_QAPP_Rev2.docx
QC SampleFrequency/
NumberMethod/SOP
QC Acceptance Limits CA
Person(s)Responsible
for CA DQIMeasurement Performance
Criteria
Surrogates Every sample
2-Fluorobiphenyl: 19-107%R2-Fluorophenol: 10-111%R2,4,6-Tribromophenol: 16-122%RNitrobenzene-d5: 23-112%RPhenol-d5: 15-112%RTerphenyl-d14: 10-132%R
Checkcalculations andinstrumentperformance;recalculate,reanalyze
Analyst/SectionSupervisor Accuracy/Bias
2-Fluorobiphenyl: 19-107%R2-Fluorophenol: 10-111%R2,4,6-Tribromophenol: 16-122%RNitrobenzene-d5: 23-112%RPhenol-d5: 15-112%RTerphenyl-d14: 10-132%R
LCS 1/Prep Batch(<20 samples)
Compound-specific %Rs; seeAppendix C-2
If sufficientsample isavailable,reanalyzesamples. Qualifydata as needed.
Analyst/SectionSupervisor Accuracy/Bias Compound-specific %Rs; see
Appendix C-2
MS 1/Prep Batch(<20 samples)
Compound-specific %Rs; seeAppendix C-2
Flag data.Discuss innarrative.
Analyst/SectionSupervisor Accuracy/Bias Compound-specific %Rs; see
Appendix C-2
MSD 1/Prep Batch(<20 samples)
Compound-specific RPDs; seeAppendix C-2
Flag data.Discuss innarrative.
Analyst/SectionSupervisor Precision Compound-specific RPDs; see
Appendix C-2
Field Duplicate 1/20 field samples
RPD 30% if both samples are>5x QL or absolute differencebetween concentrations <2x QLif sample and/or field duplicateare 5x QL
Evaluate duringdata validation.Qualify data asneeded.
Data Validator Precision
RPD 30% if both samples are>5x QL or absolute differencebetween concentrations <2x QLif sample and/or field duplicateare 5x QL
PE Sampled 5 Supplier Certified Limits
Feedback tolaboratory;laboratoryevaluation andresponse
AECOMProjectChemist/LaboratoryStaff
Accuracy/Bias Supplier Certified Limits
a Refer to QAPP Worksheet #15 for a complete list of analytes for each analytical groupb Refer to QAPP Worksheet #21c Refer to QAPP Worksheet #23d Refer to Worksheet #31 for additional details of the PE program.
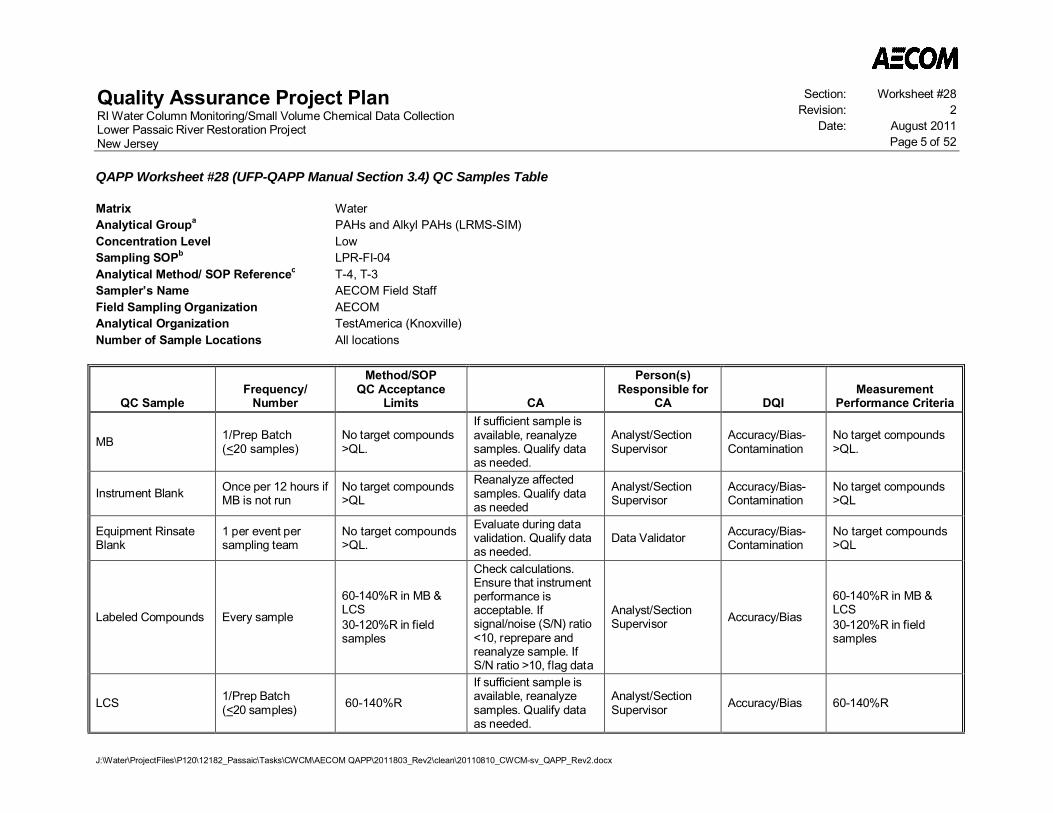
Quality Assurance Project PlanRI Water Column Monitoring/Small Volume Chemical Data CollectionLower Passaic River Restoration ProjectNew Jersey
Section: Worksheet #28Revision: 2
Date: August 2011Page 5 of 52
QAPP Worksheet #28 (UFP-QAPP Manual Section 3.4) QC Samples Table
J:\Water\ProjectFiles\P120\12182_Passaic\Tasks\CWCM\AECOM QAPP\2011803_Rev2\clean\20110810_CWCM-sv_QAPP_Rev2.docx
Matrix WaterAnalytical Groupa PAHs and Alkyl PAHs (LRMS-SIM)Concentration Level LowSampling SOPb LPR-FI-04Analytical Method/ SOP Referencec T-4, T-3Sampler’s Name AECOM Field StaffField Sampling Organization AECOMAnalytical Organization TestAmerica (Knoxville)Number of Sample Locations All locations
QC SampleFrequency/
Number
Method/SOPQC Acceptance
Limits CA
Person(s)Responsible for
CA DQIMeasurement
Performance Criteria
MB 1/Prep Batch(<20 samples)
No target compounds>QL.
If sufficient sample isavailable, reanalyzesamples. Qualify dataas needed.
Analyst/SectionSupervisor
Accuracy/Bias-Contamination
No target compounds>QL.
Instrument Blank Once per 12 hours ifMB is not run
No target compounds>QL
Reanalyze affectedsamples. Qualify dataas needed
Analyst/SectionSupervisor
Accuracy/Bias-Contamination
No target compounds>QL
Equipment RinsateBlank
1 per event persampling team
No target compounds>QL.
Evaluate during datavalidation. Qualify dataas needed.
Data Validator Accuracy/Bias-Contamination
No target compounds>QL
Labeled Compounds Every sample
60-140%R in MB &LCS30-120%R in fieldsamples
Check calculations.Ensure that instrumentperformance isacceptable. Ifsignal/noise (S/N) ratio<10, reprepare andreanalyze sample. IfS/N ratio >10, flag data
Analyst/SectionSupervisor Accuracy/Bias
60-140%R in MB &LCS30-120%R in fieldsamples
LCS 1/Prep Batch(<20 samples) 60-140%R
If sufficient sample isavailable, reanalyzesamples. Qualify dataas needed.
Analyst/SectionSupervisor Accuracy/Bias 60-140%R
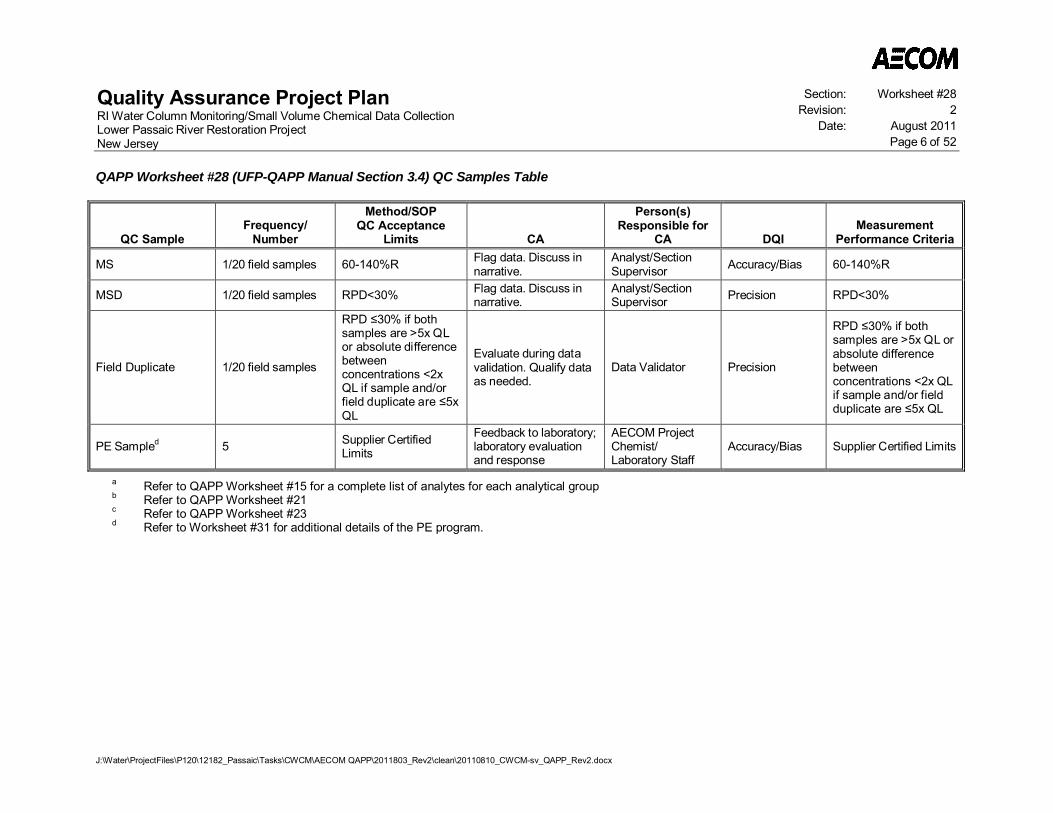
Quality Assurance Project PlanRI Water Column Monitoring/Small Volume Chemical Data CollectionLower Passaic River Restoration ProjectNew Jersey
Section: Worksheet #28Revision: 2
Date: August 2011Page 6 of 52
QAPP Worksheet #28 (UFP-QAPP Manual Section 3.4) QC Samples Table
J:\Water\ProjectFiles\P120\12182_Passaic\Tasks\CWCM\AECOM QAPP\2011803_Rev2\clean\20110810_CWCM-sv_QAPP_Rev2.docx
QC SampleFrequency/
Number
Method/SOPQC Acceptance
Limits CA
Person(s)Responsible for
CA DQIMeasurement
Performance Criteria
MS 1/20 field samples 60-140%R Flag data. Discuss innarrative.
Analyst/SectionSupervisor Accuracy/Bias 60-140%R
MSD 1/20 field samples RPD<30% Flag data. Discuss innarrative.
Analyst/SectionSupervisor Precision RPD<30%
Field Duplicate 1/20 field samples
RPD 30% if bothsamples are >5x QLor absolute differencebetweenconcentrations <2xQL if sample and/orfield duplicate are 5xQL
Evaluate during datavalidation. Qualify dataas needed.
Data Validator Precision
RPD 30% if bothsamples are >5x QL orabsolute differencebetweenconcentrations <2x QLif sample and/or fieldduplicate are 5x QL
PE Sampled 5 Supplier CertifiedLimits
Feedback to laboratory;laboratory evaluationand response
AECOM ProjectChemist/Laboratory Staff
Accuracy/Bias Supplier Certified Limits
a Refer to QAPP Worksheet #15 for a complete list of analytes for each analytical groupb Refer to QAPP Worksheet #21c Refer to QAPP Worksheet #23d Refer to Worksheet #31 for additional details of the PE program.
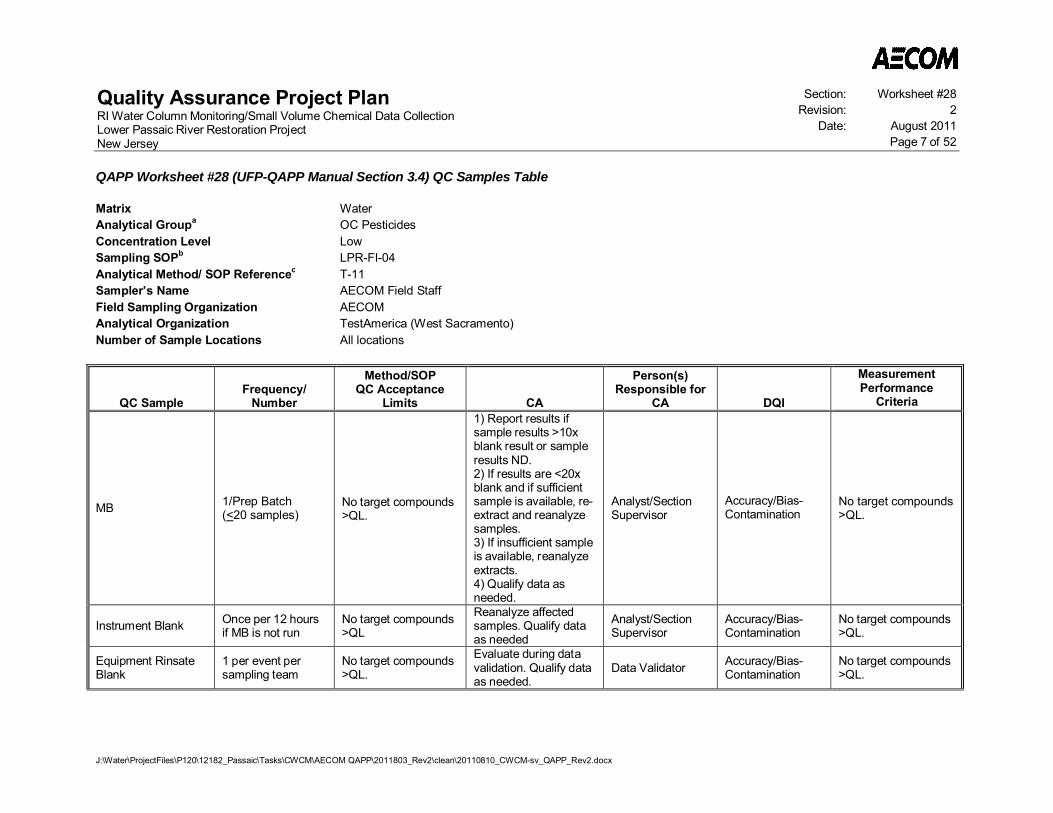
Quality Assurance Project PlanRI Water Column Monitoring/Small Volume Chemical Data CollectionLower Passaic River Restoration ProjectNew Jersey
Section: Worksheet #28Revision: 2
Date: August 2011Page 7 of 52
QAPP Worksheet #28 (UFP-QAPP Manual Section 3.4) QC Samples Table
J:\Water\ProjectFiles\P120\12182_Passaic\Tasks\CWCM\AECOM QAPP\2011803_Rev2\clean\20110810_CWCM-sv_QAPP_Rev2.docx
Matrix WaterAnalytical Groupa OC PesticidesConcentration Level LowSampling SOPb LPR-FI-04Analytical Method/ SOP Referencec T-11Sampler’s Name AECOM Field StaffField Sampling Organization AECOMAnalytical Organization TestAmerica (West Sacramento)Number of Sample Locations All locations
QC SampleFrequency/
Number
Method/SOPQC Acceptance
Limits CA
Person(s)Responsible for
CA DQI
MeasurementPerformance
Criteria
MB 1/Prep Batch(<20 samples)
No target compounds>QL.
1) Report results ifsample results >10xblank result or sampleresults ND.2) If results are <20xblank and if sufficientsample is available, re-extract and reanalyzesamples.3) If insufficient sampleis available, reanalyzeextracts.4) Qualify data asneeded.
Analyst/SectionSupervisor
Accuracy/Bias-Contamination
No target compounds>QL.
Instrument Blank Once per 12 hoursif MB is not run
No target compounds>QL
Reanalyze affectedsamples. Qualify dataas needed
Analyst/SectionSupervisor
Accuracy/Bias-Contamination
No target compounds>QL.
Equipment RinsateBlank
1 per event persampling team
No target compounds>QL.
Evaluate during datavalidation. Qualify dataas needed.
Data Validator Accuracy/Bias-Contamination
No target compounds>QL.
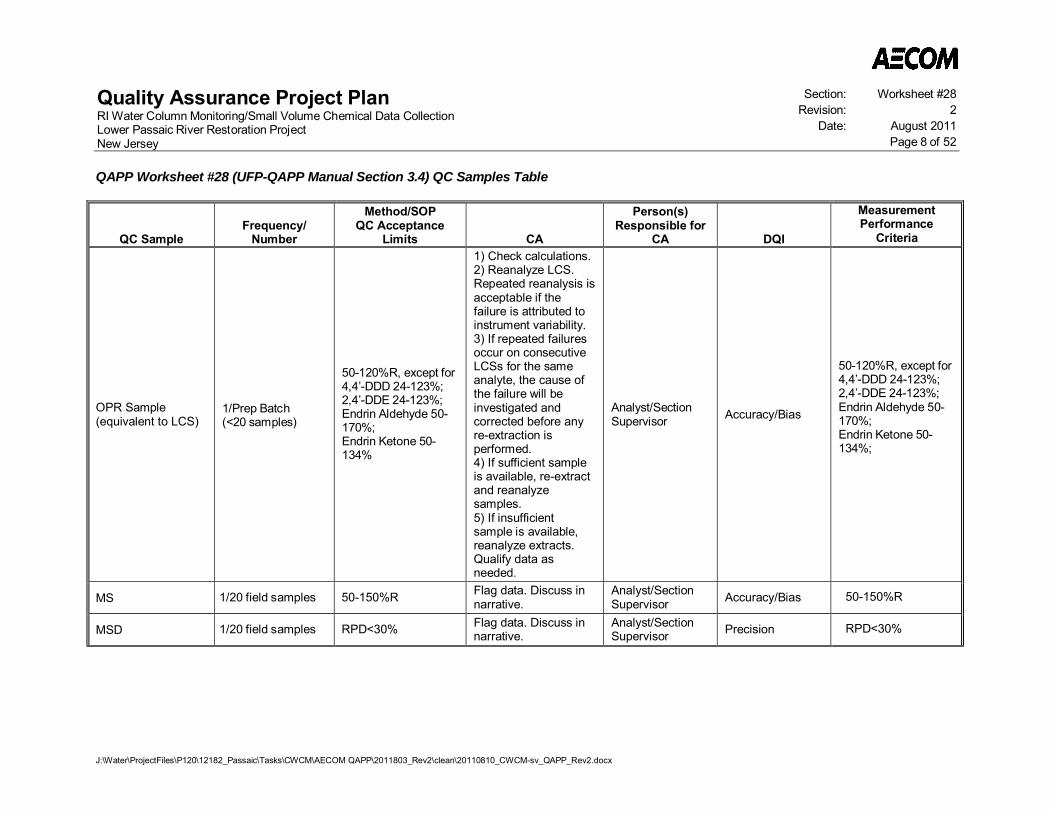
Quality Assurance Project PlanRI Water Column Monitoring/Small Volume Chemical Data CollectionLower Passaic River Restoration ProjectNew Jersey
Section: Worksheet #28Revision: 2
Date: August 2011Page 8 of 52
QAPP Worksheet #28 (UFP-QAPP Manual Section 3.4) QC Samples Table
J:\Water\ProjectFiles\P120\12182_Passaic\Tasks\CWCM\AECOM QAPP\2011803_Rev2\clean\20110810_CWCM-sv_QAPP_Rev2.docx
QC SampleFrequency/
Number
Method/SOPQC Acceptance
Limits CA
Person(s)Responsible for
CA DQI
MeasurementPerformance
Criteria
OPR Sample(equivalent to LCS)
1/Prep Batch(<20 samples)
50-120%R, except for4,4’-DDD 24-123%;2,4’-DDE 24-123%;Endrin Aldehyde 50-170%;Endrin Ketone 50-134%
1) Check calculations.2) Reanalyze LCS.Repeated reanalysis isacceptable if thefailure is attributed toinstrument variability.3) If repeated failuresoccur on consecutiveLCSs for the sameanalyte, the cause ofthe failure will beinvestigated andcorrected before anyre-extraction isperformed.4) If sufficient sampleis available, re-extractand reanalyzesamples.5) If insufficientsample is available,reanalyze extracts.Qualify data asneeded.
Analyst/SectionSupervisor Accuracy/Bias
50-120%R, except for4,4’-DDD 24-123%;2,4’-DDE 24-123%;Endrin Aldehyde 50-170%;Endrin Ketone 50-134%;
MS 1/20 field samples 50-150%R Flag data. Discuss innarrative.
Analyst/SectionSupervisor Accuracy/Bias 50-150%R
MSD 1/20 field samples RPD<30% Flag data. Discuss innarrative.
Analyst/SectionSupervisor Precision RPD<30%
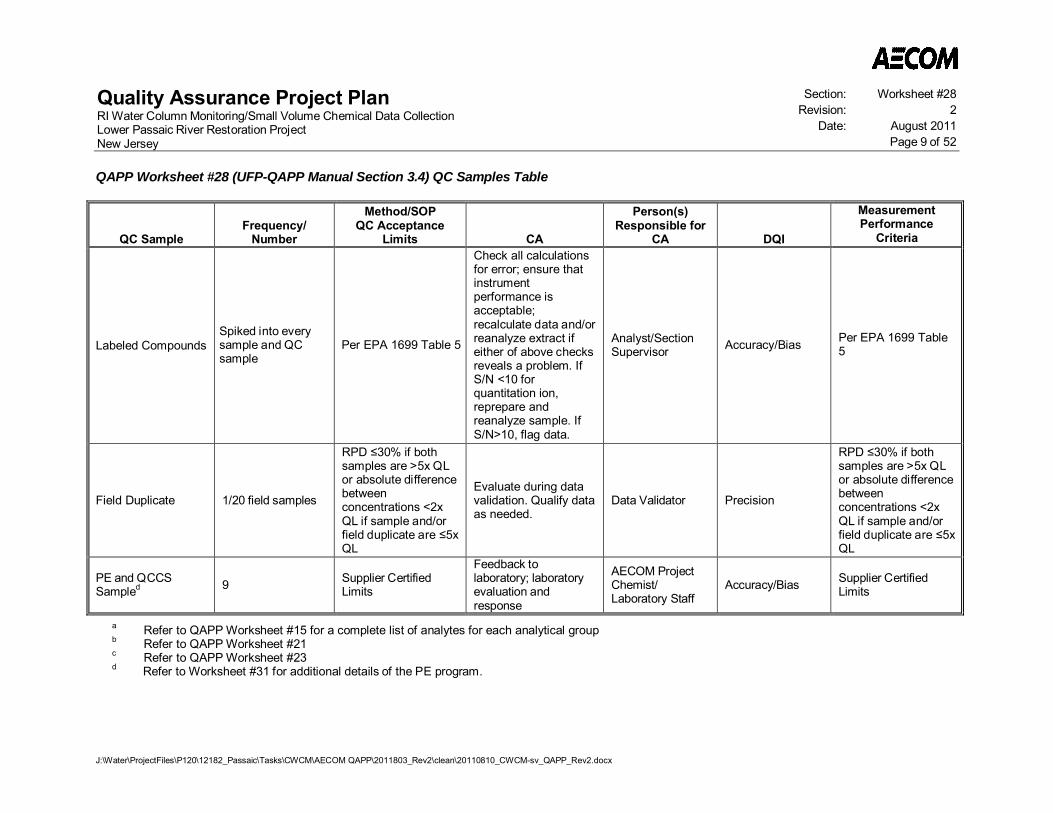
Quality Assurance Project PlanRI Water Column Monitoring/Small Volume Chemical Data CollectionLower Passaic River Restoration ProjectNew Jersey
Section: Worksheet #28Revision: 2
Date: August 2011Page 9 of 52
QAPP Worksheet #28 (UFP-QAPP Manual Section 3.4) QC Samples Table
J:\Water\ProjectFiles\P120\12182_Passaic\Tasks\CWCM\AECOM QAPP\2011803_Rev2\clean\20110810_CWCM-sv_QAPP_Rev2.docx
QC SampleFrequency/
Number
Method/SOPQC Acceptance
Limits CA
Person(s)Responsible for
CA DQI
MeasurementPerformance
Criteria
Labeled CompoundsSpiked into everysample and QCsample
Per EPA 1699 Table 5
Check all calculationsfor error; ensure thatinstrumentperformance isacceptable;recalculate data and/orreanalyze extract ifeither of above checksreveals a problem. IfS/N <10 forquantitation ion,reprepare andreanalyze sample. IfS/N>10, flag data.
Analyst/SectionSupervisor Accuracy/Bias Per EPA 1699 Table
5
Field Duplicate 1/20 field samples
RPD 30% if bothsamples are >5x QLor absolute differencebetweenconcentrations <2xQL if sample and/orfield duplicate are 5xQL
Evaluate during datavalidation. Qualify dataas needed.
Data Validator Precision
RPD 30% if bothsamples are >5x QLor absolute differencebetweenconcentrations <2xQL if sample and/orfield duplicate are 5xQL
PE and QCCSSampled 9 Supplier Certified
Limits
Feedback tolaboratory; laboratoryevaluation andresponse
AECOM ProjectChemist/Laboratory Staff
Accuracy/Bias Supplier CertifiedLimits
a Refer to QAPP Worksheet #15 for a complete list of analytes for each analytical groupb Refer to QAPP Worksheet #21c Refer to QAPP Worksheet #23d Refer to Worksheet #31 for additional details of the PE program.
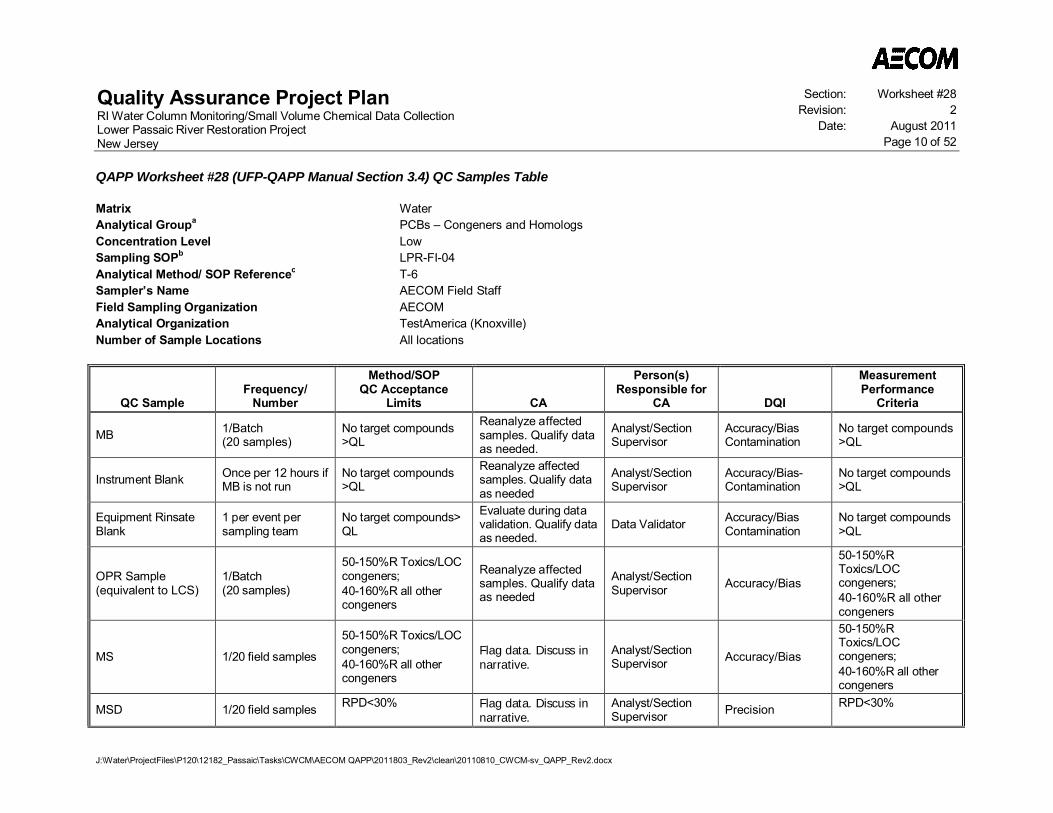
Quality Assurance Project PlanRI Water Column Monitoring/Small Volume Chemical Data CollectionLower Passaic River Restoration ProjectNew Jersey
Section: Worksheet #28Revision: 2
Date: August 2011Page 10 of 52
QAPP Worksheet #28 (UFP-QAPP Manual Section 3.4) QC Samples Table
J:\Water\ProjectFiles\P120\12182_Passaic\Tasks\CWCM\AECOM QAPP\2011803_Rev2\clean\20110810_CWCM-sv_QAPP_Rev2.docx
Matrix WaterAnalytical Groupa PCBs – Congeners and HomologsConcentration Level LowSampling SOPb LPR-FI-04Analytical Method/ SOP Referencec T-6Sampler’s Name AECOM Field StaffField Sampling Organization AECOMAnalytical Organization TestAmerica (Knoxville)Number of Sample Locations All locations
QC SampleFrequency/
Number
Method/SOPQC Acceptance
Limits CA
Person(s)Responsible for
CA DQI
MeasurementPerformance
Criteria
MB 1/Batch(20 samples)
No target compounds>QL
Reanalyze affectedsamples. Qualify dataas needed.
Analyst/SectionSupervisor
Accuracy/BiasContamination
No target compounds>QL
Instrument Blank Once per 12 hours ifMB is not run
No target compounds>QL
Reanalyze affectedsamples. Qualify dataas needed
Analyst/SectionSupervisor
Accuracy/Bias-Contamination
No target compounds>QL
Equipment RinsateBlank
1 per event persampling team
No target compounds>QL
Evaluate during datavalidation. Qualify dataas needed.
Data Validator Accuracy/BiasContamination
No target compounds>QL
OPR Sample(equivalent to LCS)
1/Batch(20 samples)
50-150%R Toxics/LOCcongeners;40-160%R all othercongeners
Reanalyze affectedsamples. Qualify dataas needed
Analyst/SectionSupervisor Accuracy/Bias
50-150%RToxics/LOCcongeners;40-160%R all othercongeners
MS 1/20 field samples
50-150%R Toxics/LOCcongeners;40-160%R all othercongeners
Flag data. Discuss innarrative.
Analyst/SectionSupervisor Accuracy/Bias
50-150%RToxics/LOCcongeners;40-160%R all othercongeners
MSD 1/20 field samples RPD<30% Flag data. Discuss innarrative.
Analyst/SectionSupervisor Precision RPD<30%
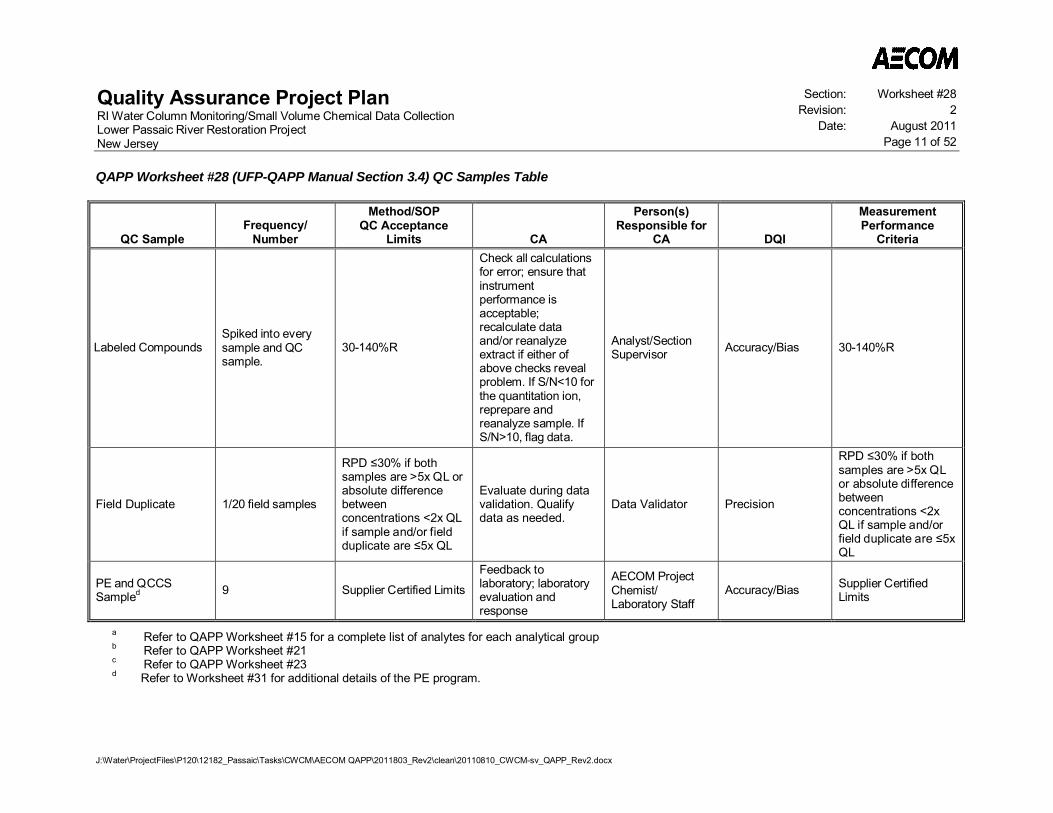
Quality Assurance Project PlanRI Water Column Monitoring/Small Volume Chemical Data CollectionLower Passaic River Restoration ProjectNew Jersey
Section: Worksheet #28Revision: 2
Date: August 2011Page 11 of 52
QAPP Worksheet #28 (UFP-QAPP Manual Section 3.4) QC Samples Table
J:\Water\ProjectFiles\P120\12182_Passaic\Tasks\CWCM\AECOM QAPP\2011803_Rev2\clean\20110810_CWCM-sv_QAPP_Rev2.docx
QC SampleFrequency/
Number
Method/SOPQC Acceptance
Limits CA
Person(s)Responsible for
CA DQI
MeasurementPerformance
Criteria
Labeled CompoundsSpiked into everysample and QCsample.
30-140%R
Check all calculationsfor error; ensure thatinstrumentperformance isacceptable;recalculate dataand/or reanalyzeextract if either ofabove checks revealproblem. If S/N<10 forthe quantitation ion,reprepare andreanalyze sample. IfS/N>10, flag data.
Analyst/SectionSupervisor Accuracy/Bias 30-140%R
Field Duplicate 1/20 field samples
RPD 30% if bothsamples are >5x QL orabsolute differencebetweenconcentrations <2x QLif sample and/or fieldduplicate are 5x QL
Evaluate during datavalidation. Qualifydata as needed.
Data Validator Precision
RPD 30% if bothsamples are >5x QLor absolute differencebetweenconcentrations <2xQL if sample and/orfield duplicate are 5xQL
PE and QCCSSampled 9 Supplier Certified Limits
Feedback tolaboratory; laboratoryevaluation andresponse
AECOM ProjectChemist/Laboratory Staff
Accuracy/Bias Supplier CertifiedLimits
a Refer to QAPP Worksheet #15 for a complete list of analytes for each analytical groupb Refer to QAPP Worksheet #21c Refer to QAPP Worksheet #23d Refer to Worksheet #31 for additional details of the PE program.
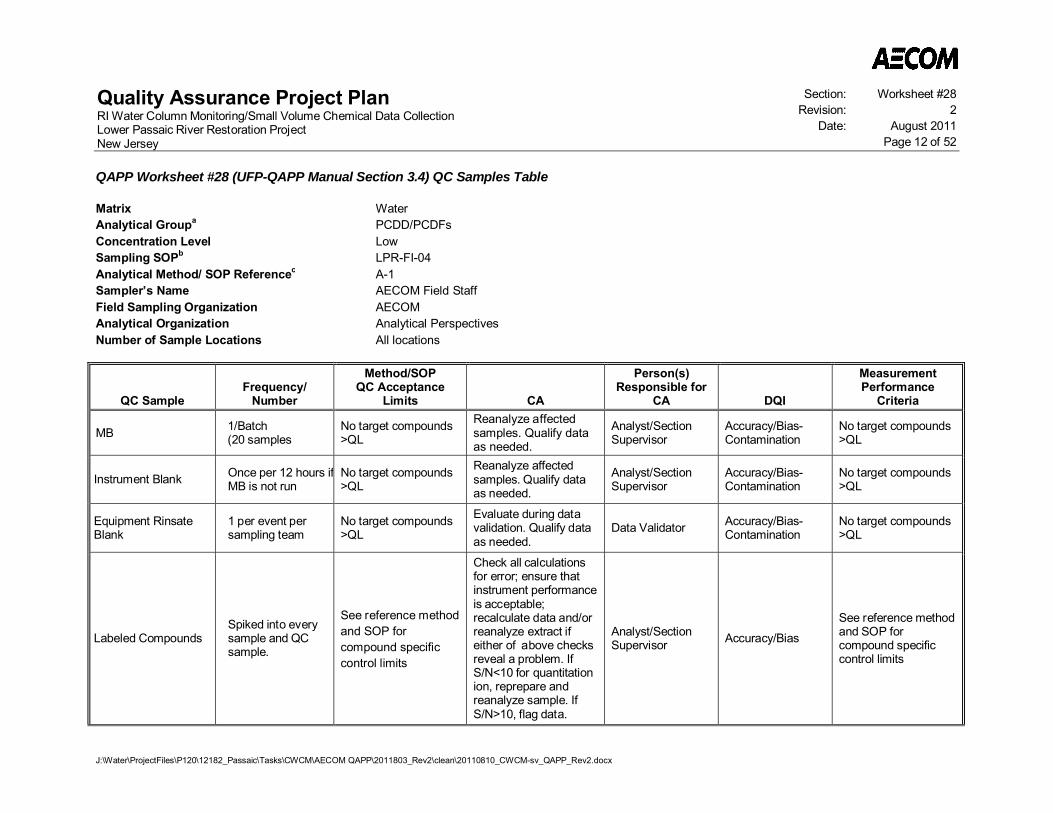
Quality Assurance Project PlanRI Water Column Monitoring/Small Volume Chemical Data CollectionLower Passaic River Restoration ProjectNew Jersey
Section: Worksheet #28Revision: 2
Date: August 2011Page 12 of 52
QAPP Worksheet #28 (UFP-QAPP Manual Section 3.4) QC Samples Table
J:\Water\ProjectFiles\P120\12182_Passaic\Tasks\CWCM\AECOM QAPP\2011803_Rev2\clean\20110810_CWCM-sv_QAPP_Rev2.docx
Matrix WaterAnalytical Groupa PCDD/PCDFsConcentration Level LowSampling SOPb LPR-FI-04Analytical Method/ SOP Referencec A-1Sampler’s Name AECOM Field StaffField Sampling Organization AECOMAnalytical Organization Analytical PerspectivesNumber of Sample Locations All locations
QC SampleFrequency/
Number
Method/SOPQC Acceptance
Limits CA
Person(s)Responsible for
CA DQI
MeasurementPerformance
Criteria
MB 1/Batch(20 samples
No target compounds>QL
Reanalyze affectedsamples. Qualify dataas needed.
Analyst/SectionSupervisor
Accuracy/Bias-Contamination
No target compounds>QL
Instrument Blank Once per 12 hours ifMB is not run
No target compounds>QL
Reanalyze affectedsamples. Qualify dataas needed.
Analyst/SectionSupervisor
Accuracy/Bias-Contamination
No target compounds>QL
Equipment RinsateBlank
1 per event persampling team
No target compounds>QL
Evaluate during datavalidation. Qualify dataas needed.
Data Validator Accuracy/Bias-Contamination
No target compounds>QL
Labeled CompoundsSpiked into everysample and QCsample.
See reference methodand SOP forcompound specificcontrol limits
Check all calculationsfor error; ensure thatinstrument performanceis acceptable;recalculate data and/orreanalyze extract ifeither of above checksreveal a problem. IfS/N<10 for quantitationion, reprepare andreanalyze sample. IfS/N>10, flag data.
Analyst/SectionSupervisor Accuracy/Bias
See reference methodand SOP forcompound specificcontrol limits
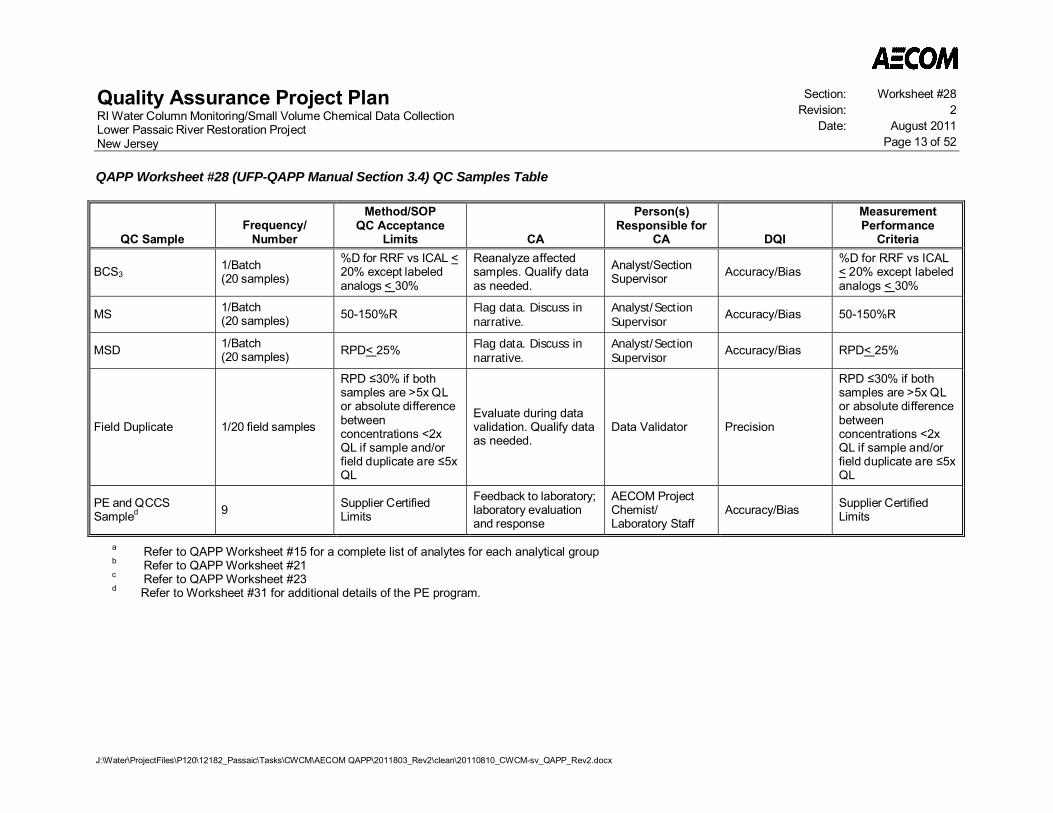
Quality Assurance Project PlanRI Water Column Monitoring/Small Volume Chemical Data CollectionLower Passaic River Restoration ProjectNew Jersey
Section: Worksheet #28Revision: 2
Date: August 2011Page 13 of 52
QAPP Worksheet #28 (UFP-QAPP Manual Section 3.4) QC Samples Table
J:\Water\ProjectFiles\P120\12182_Passaic\Tasks\CWCM\AECOM QAPP\2011803_Rev2\clean\20110810_CWCM-sv_QAPP_Rev2.docx
QC SampleFrequency/
Number
Method/SOPQC Acceptance
Limits CA
Person(s)Responsible for
CA DQI
MeasurementPerformance
Criteria
BCS31/Batch(20 samples)
%D for RRF vs ICAL <20% except labeledanalogs < 30%
Reanalyze affectedsamples. Qualify dataas needed.
Analyst/SectionSupervisor Accuracy/Bias
%D for RRF vs ICAL< 20% except labeledanalogs < 30%
MS 1/Batch(20 samples) 50-150%R Flag data. Discuss in
narrative.Analyst/SectionSupervisor
Accuracy/Bias 50-150%R
MSD 1/Batch(20 samples) RPD< 25% Flag data. Discuss in
narrative.Analyst/SectionSupervisor
Accuracy/Bias RPD< 25%
Field Duplicate 1/20 field samples
RPD 30% if bothsamples are >5x QLor absolute differencebetweenconcentrations <2xQL if sample and/orfield duplicate are 5xQL
Evaluate during datavalidation. Qualify dataas needed.
Data Validator Precision
RPD 30% if bothsamples are >5x QLor absolute differencebetweenconcentrations <2xQL if sample and/orfield duplicate are 5xQL
PE and QCCSSampled 9 Supplier Certified
Limits
Feedback to laboratory;laboratory evaluationand response
AECOM ProjectChemist/Laboratory Staff
Accuracy/Bias Supplier CertifiedLimits
a Refer to QAPP Worksheet #15 for a complete list of analytes for each analytical groupb Refer to QAPP Worksheet #21c Refer to QAPP Worksheet #23d Refer to Worksheet #31 for additional details of the PE program.
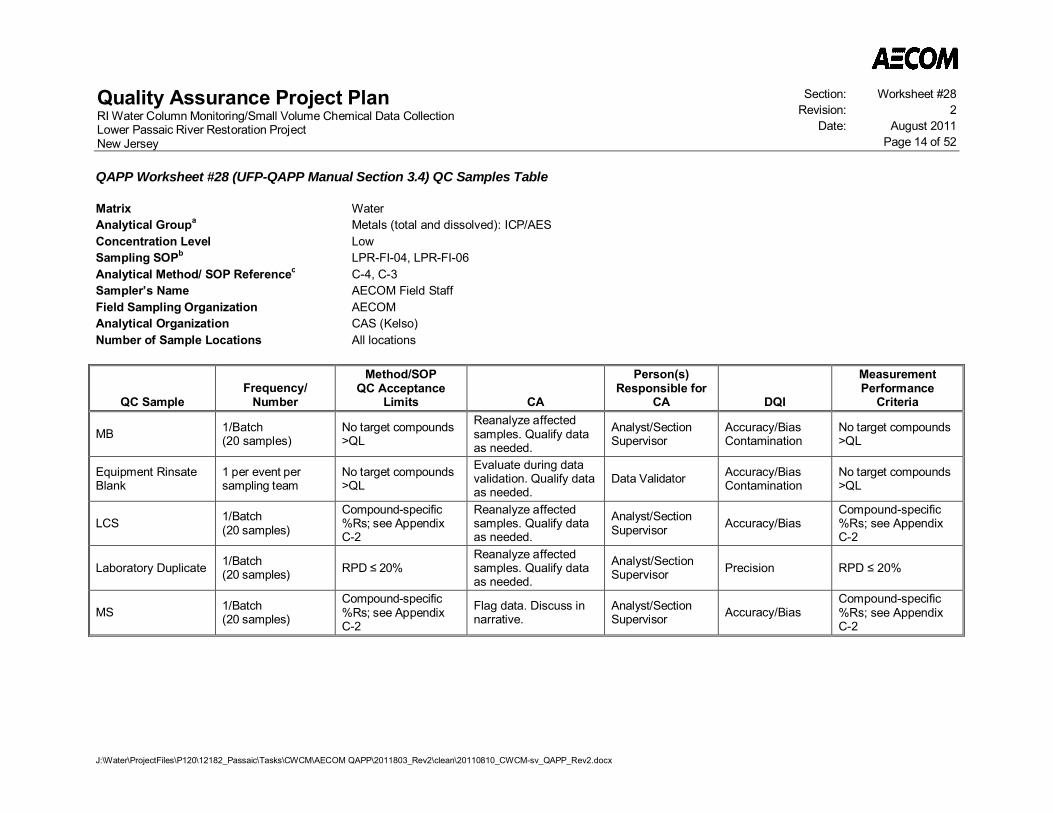
Quality Assurance Project PlanRI Water Column Monitoring/Small Volume Chemical Data CollectionLower Passaic River Restoration ProjectNew Jersey
Section: Worksheet #28Revision: 2
Date: August 2011Page 14 of 52
QAPP Worksheet #28 (UFP-QAPP Manual Section 3.4) QC Samples Table
J:\Water\ProjectFiles\P120\12182_Passaic\Tasks\CWCM\AECOM QAPP\2011803_Rev2\clean\20110810_CWCM-sv_QAPP_Rev2.docx
Matrix WaterAnalytical Groupa Metals (total and dissolved): ICP/AESConcentration Level LowSampling SOPb LPR-FI-04, LPR-FI-06Analytical Method/ SOP Referencec C-4, C-3Sampler’s Name AECOM Field StaffField Sampling Organization AECOMAnalytical Organization CAS (Kelso)Number of Sample Locations All locations
QC SampleFrequency/
Number
Method/SOPQC Acceptance
Limits CA
Person(s)Responsible for
CA DQI
MeasurementPerformance
Criteria
MB 1/Batch(20 samples)
No target compounds>QL
Reanalyze affectedsamples. Qualify dataas needed.
Analyst/SectionSupervisor
Accuracy/BiasContamination
No target compounds>QL
Equipment RinsateBlank
1 per event persampling team
No target compounds>QL
Evaluate during datavalidation. Qualify dataas needed.
Data Validator Accuracy/BiasContamination
No target compounds>QL
LCS 1/Batch(20 samples)
Compound-specific%Rs; see AppendixC-2
Reanalyze affectedsamples. Qualify dataas needed.
Analyst/SectionSupervisor Accuracy/Bias
Compound-specific%Rs; see AppendixC-2
Laboratory Duplicate 1/Batch(20 samples) RPD 20%
Reanalyze affectedsamples. Qualify dataas needed.
Analyst/SectionSupervisor Precision RPD 20%
MS 1/Batch(20 samples)
Compound-specific%Rs; see AppendixC-2
Flag data. Discuss innarrative.
Analyst/SectionSupervisor Accuracy/Bias
Compound-specific%Rs; see AppendixC-2

Quality Assurance Project PlanRI Water Column Monitoring/Small Volume Chemical Data CollectionLower Passaic River Restoration ProjectNew Jersey
Section: Worksheet #28Revision: 2
Date: August 2011Page 15 of 52
QAPP Worksheet #28 (UFP-QAPP Manual Section 3.4) QC Samples Table
J:\Water\ProjectFiles\P120\12182_Passaic\Tasks\CWCM\AECOM QAPP\2011803_Rev2\clean\20110810_CWCM-sv_QAPP_Rev2.docx
QC SampleFrequency/
Number
Method/SOPQC Acceptance
Limits CA
Person(s)Responsible for
CA DQI
MeasurementPerformance
Criteria
Field Duplicate 1/20 field samples
RPD 20% if bothsamples are >5x QLor absolute differencebetweenconcentrations <QL ifsample and/or fieldduplicate are 5x QL
Evaluate during datavalidation. Qualify dataas needed.
Data Validator Precision
RPD 20% if bothsamples are >5x QLor absolute differencebetweenconcentrations <QL ifsample and/or fieldduplicate are 5x QL
PE Sampled10 (total only; bothfreshwater andsaltwater matrices)
Supplier CertifiedLimits
Feedback to laboratory;laboratory evaluationand response
AECOM ProjectChemist/Laboratory Staff
Accuracy/Bias Supplier CertifiedLimits
a Refer to QAPP Worksheet #15 for a complete list of analytes for each analytical groupb Refer to QAPP Worksheet #21c Refer to QAPP Worksheet #23d Refer to Worksheet #31 for additional details of the PE program.
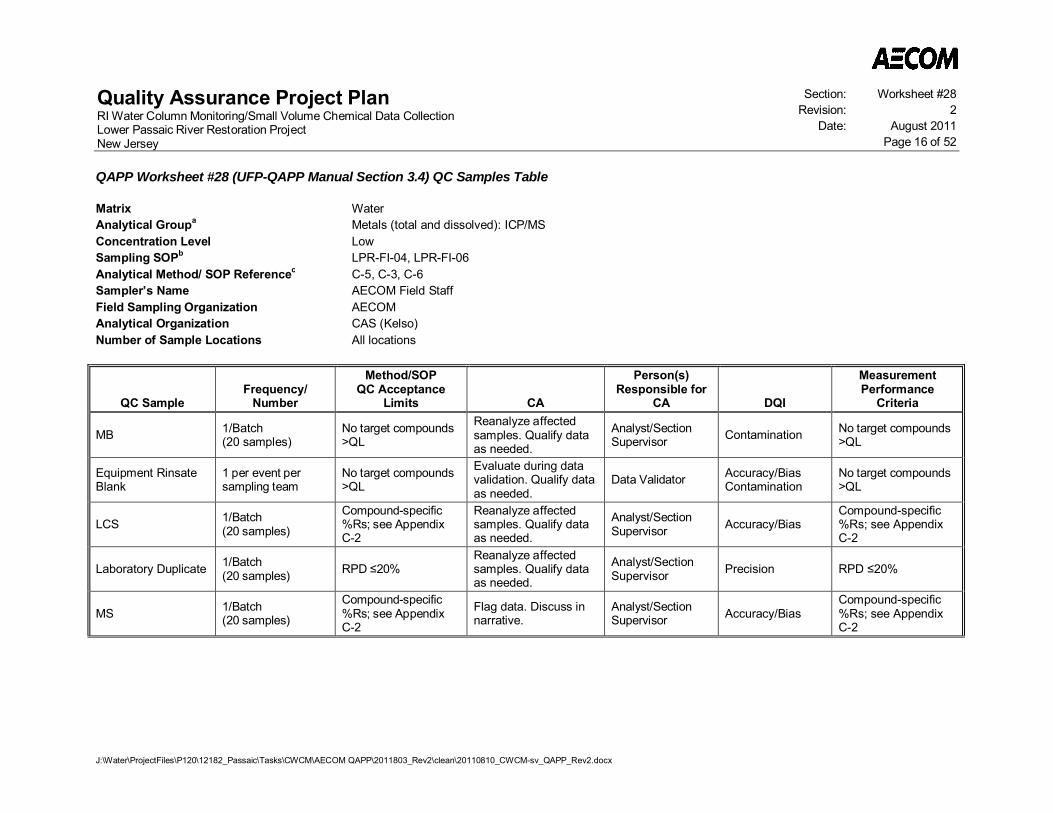
Quality Assurance Project PlanRI Water Column Monitoring/Small Volume Chemical Data CollectionLower Passaic River Restoration ProjectNew Jersey
Section: Worksheet #28Revision: 2
Date: August 2011Page 16 of 52
QAPP Worksheet #28 (UFP-QAPP Manual Section 3.4) QC Samples Table
J:\Water\ProjectFiles\P120\12182_Passaic\Tasks\CWCM\AECOM QAPP\2011803_Rev2\clean\20110810_CWCM-sv_QAPP_Rev2.docx
Matrix WaterAnalytical Groupa Metals (total and dissolved): ICP/MSConcentration Level LowSampling SOPb LPR-FI-04, LPR-FI-06Analytical Method/ SOP Referencec C-5, C-3, C-6Sampler’s Name AECOM Field StaffField Sampling Organization AECOMAnalytical Organization CAS (Kelso)Number of Sample Locations All locations
QC SampleFrequency/
Number
Method/SOPQC Acceptance
Limits CA
Person(s)Responsible for
CA DQI
MeasurementPerformance
Criteria
MB 1/Batch(20 samples)
No target compounds>QL
Reanalyze affectedsamples. Qualify dataas needed.
Analyst/SectionSupervisor Contamination No target compounds
>QL
Equipment RinsateBlank
1 per event persampling team
No target compounds>QL
Evaluate during datavalidation. Qualify dataas needed.
Data Validator Accuracy/BiasContamination
No target compounds>QL
LCS 1/Batch(20 samples)
Compound-specific%Rs; see AppendixC-2
Reanalyze affectedsamples. Qualify dataas needed.
Analyst/SectionSupervisor Accuracy/Bias
Compound-specific%Rs; see AppendixC-2
Laboratory Duplicate 1/Batch(20 samples) RPD 20%
Reanalyze affectedsamples. Qualify dataas needed.
Analyst/SectionSupervisor Precision RPD 20%
MS 1/Batch(20 samples)
Compound-specific%Rs; see AppendixC-2
Flag data. Discuss innarrative.
Analyst/SectionSupervisor Accuracy/Bias
Compound-specific%Rs; see AppendixC-2
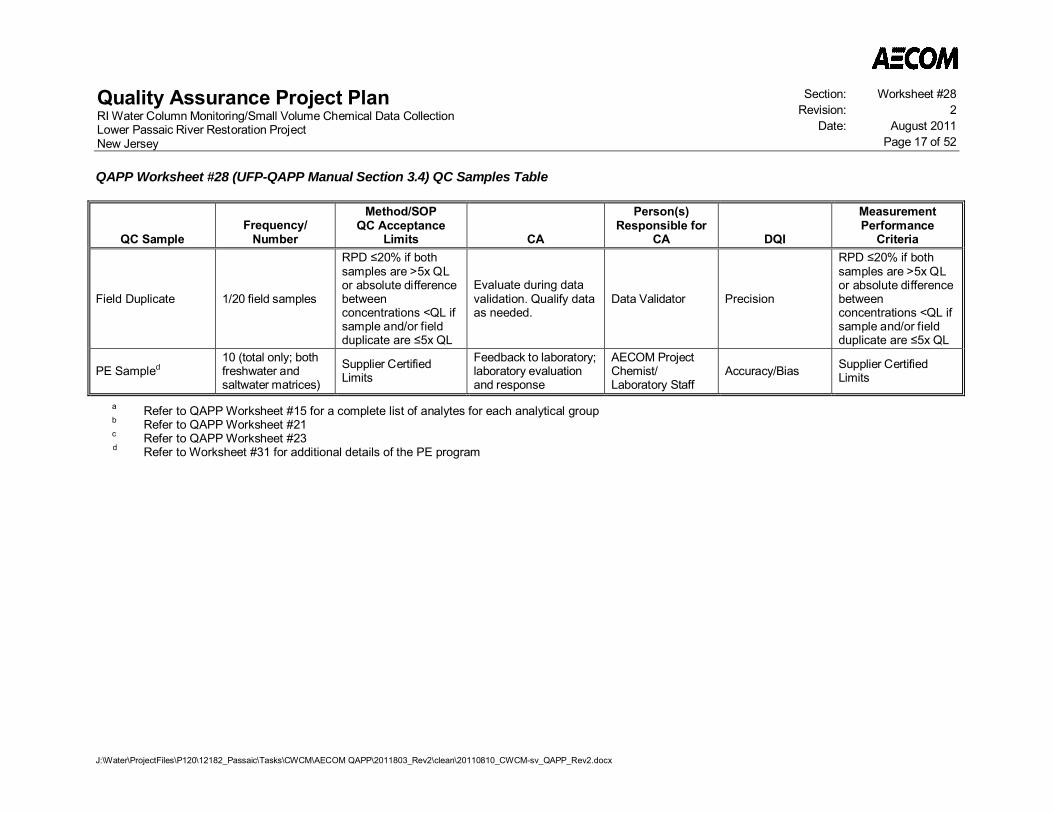
Quality Assurance Project PlanRI Water Column Monitoring/Small Volume Chemical Data CollectionLower Passaic River Restoration ProjectNew Jersey
Section: Worksheet #28Revision: 2
Date: August 2011Page 17 of 52
QAPP Worksheet #28 (UFP-QAPP Manual Section 3.4) QC Samples Table
J:\Water\ProjectFiles\P120\12182_Passaic\Tasks\CWCM\AECOM QAPP\2011803_Rev2\clean\20110810_CWCM-sv_QAPP_Rev2.docx
QC SampleFrequency/
Number
Method/SOPQC Acceptance
Limits CA
Person(s)Responsible for
CA DQI
MeasurementPerformance
Criteria
Field Duplicate 1/20 field samples
RPD 20% if bothsamples are >5x QLor absolute differencebetweenconcentrations <QL ifsample and/or fieldduplicate are 5x QL
Evaluate during datavalidation. Qualify dataas needed.
Data Validator Precision
RPD 20% if bothsamples are >5x QLor absolute differencebetweenconcentrations <QL ifsample and/or fieldduplicate are 5x QL
PE Sampled10 (total only; bothfreshwater andsaltwater matrices)
Supplier CertifiedLimits
Feedback to laboratory;laboratory evaluationand response
AECOM ProjectChemist/Laboratory Staff
Accuracy/Bias Supplier CertifiedLimits
a Refer to QAPP Worksheet #15 for a complete list of analytes for each analytical groupb Refer to QAPP Worksheet #21c Refer to QAPP Worksheet #23d Refer to Worksheet #31 for additional details of the PE program
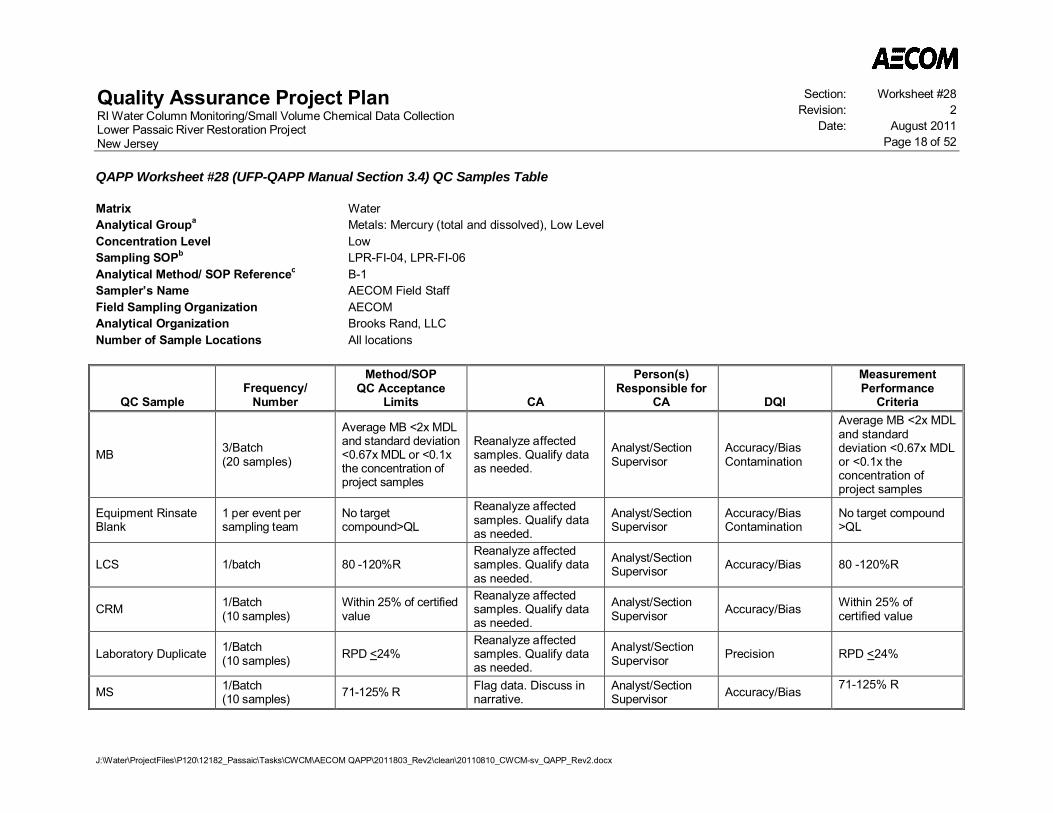
Quality Assurance Project PlanRI Water Column Monitoring/Small Volume Chemical Data CollectionLower Passaic River Restoration ProjectNew Jersey
Section: Worksheet #28Revision: 2
Date: August 2011Page 18 of 52
QAPP Worksheet #28 (UFP-QAPP Manual Section 3.4) QC Samples Table
J:\Water\ProjectFiles\P120\12182_Passaic\Tasks\CWCM\AECOM QAPP\2011803_Rev2\clean\20110810_CWCM-sv_QAPP_Rev2.docx
Matrix WaterAnalytical Groupa Metals: Mercury (total and dissolved), Low LevelConcentration Level LowSampling SOPb LPR-FI-04, LPR-FI-06Analytical Method/ SOP Referencec B-1Sampler’s Name AECOM Field StaffField Sampling Organization AECOMAnalytical Organization Brooks Rand, LLCNumber of Sample Locations All locations
QC SampleFrequency/
Number
Method/SOPQC Acceptance
Limits CA
Person(s)Responsible for
CA DQI
MeasurementPerformance
Criteria
MB 3/Batch(20 samples)
Average MB <2x MDLand standard deviation<0.67x MDL or <0.1xthe concentration ofproject samples
Reanalyze affectedsamples. Qualify dataas needed.
Analyst/SectionSupervisor
Accuracy/BiasContamination
Average MB <2x MDLand standarddeviation <0.67x MDLor <0.1x theconcentration ofproject samples
Equipment RinsateBlank
1 per event persampling team
No targetcompound>QL
Reanalyze affectedsamples. Qualify dataas needed.
Analyst/SectionSupervisor
Accuracy/BiasContamination
No target compound>QL
LCS 1/batch 80 -120%RReanalyze affectedsamples. Qualify dataas needed.
Analyst/SectionSupervisor Accuracy/Bias 80 -120%R
CRM 1/Batch(10 samples)
Within 25% of certifiedvalue
Reanalyze affectedsamples. Qualify dataas needed.
Analyst/SectionSupervisor Accuracy/Bias Within 25% of
certified value
Laboratory Duplicate 1/Batch(10 samples) RPD <24%
Reanalyze affectedsamples. Qualify dataas needed.
Analyst/SectionSupervisor Precision RPD <24%
MS 1/Batch(10 samples) 71-125% R Flag data. Discuss in
narrative.Analyst/SectionSupervisor Accuracy/Bias 71-125% R

Quality Assurance Project PlanRI Water Column Monitoring/Small Volume Chemical Data CollectionLower Passaic River Restoration ProjectNew Jersey
Section: Worksheet #28Revision: 2
Date: August 2011Page 19 of 52
QAPP Worksheet #28 (UFP-QAPP Manual Section 3.4) QC Samples Table
J:\Water\ProjectFiles\P120\12182_Passaic\Tasks\CWCM\AECOM QAPP\2011803_Rev2\clean\20110810_CWCM-sv_QAPP_Rev2.docx
QC SampleFrequency/
Number
Method/SOPQC Acceptance
Limits CA
Person(s)Responsible for
CA DQI
MeasurementPerformance
Criteria
MSD 1/Batch(10 samples) 24% RPD Flag data. Discuss in
narrative.Analyst/SectionSupervisor Precision 24% RPD
Field Duplicate 1/20 field samples
RPD 30% if bothsamples are >5x QLor absolute differencebetweenconcentrations <2x QLif sample and/or fieldduplicate are 5x QL
Evaluate during datavalidation. Qualify dataas needed
Data Validator Precision
RPD 30% if bothsamples are >5x QLor absolute differencebetweenconcentrations <2xQL if sample and/orfield duplicate are 5xQL
PE Sampled 5 (total only) Supplier CertifiedLimits
Feedback to laboratory;laboratory evaluationand response
AECOM ProjectChemist/Laboratory Staff
Accuracy/Bias Supplier CertifiedLimits
a Refer to QAPP Worksheet #15 for a complete list of analytes for each analytical groupb Refer to QAPP Worksheet #21c Refer to QAPP Worksheet #23d Refer to Worksheet #31 for additional details of the PE program
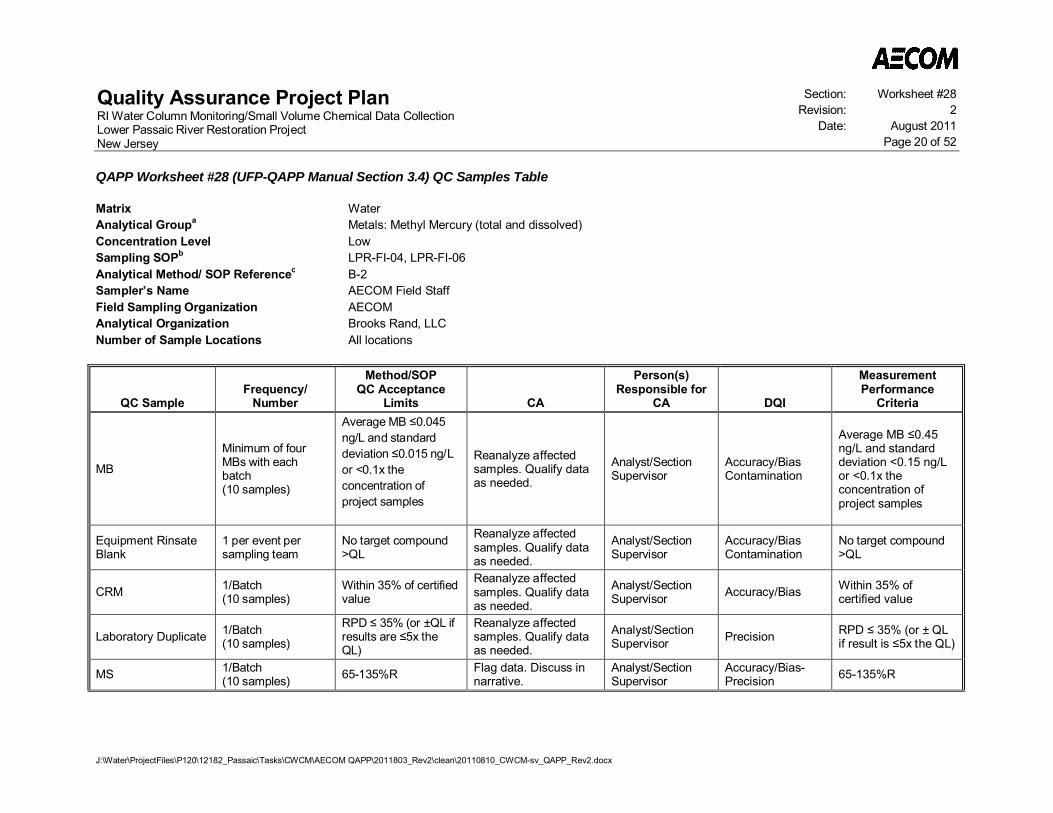
Quality Assurance Project PlanRI Water Column Monitoring/Small Volume Chemical Data CollectionLower Passaic River Restoration ProjectNew Jersey
Section: Worksheet #28Revision: 2
Date: August 2011Page 20 of 52
QAPP Worksheet #28 (UFP-QAPP Manual Section 3.4) QC Samples Table
J:\Water\ProjectFiles\P120\12182_Passaic\Tasks\CWCM\AECOM QAPP\2011803_Rev2\clean\20110810_CWCM-sv_QAPP_Rev2.docx
Matrix WaterAnalytical Groupa Metals: Methyl Mercury (total and dissolved)Concentration Level LowSampling SOPb LPR-FI-04, LPR-FI-06Analytical Method/ SOP Referencec B-2Sampler’s Name AECOM Field StaffField Sampling Organization AECOMAnalytical Organization Brooks Rand, LLCNumber of Sample Locations All locations
QC SampleFrequency/
Number
Method/SOPQC Acceptance
Limits CA
Person(s)Responsible for
CA DQI
MeasurementPerformance
Criteria
MB
Minimum of fourMBs with eachbatch(10 samples)
Average MB 0.045ng/L and standarddeviation 0.015 ng/Lor <0.1x theconcentration ofproject samples
Reanalyze affectedsamples. Qualify dataas needed.
Analyst/SectionSupervisor
Accuracy/BiasContamination
Average MB 0.45ng/L and standarddeviation <0.15 ng/Lor <0.1x theconcentration ofproject samples
Equipment RinsateBlank
1 per event persampling team
No target compound>QL
Reanalyze affectedsamples. Qualify dataas needed.
Analyst/SectionSupervisor
Accuracy/BiasContamination
No target compound>QL
CRM 1/Batch(10 samples)
Within 35% of certifiedvalue
Reanalyze affectedsamples. Qualify dataas needed.
Analyst/SectionSupervisor Accuracy/Bias Within 35% of
certified value
Laboratory Duplicate 1/Batch(10 samples)
RPD 35% (or ±QL ifresults are 5x theQL)
Reanalyze affectedsamples. Qualify dataas needed.
Analyst/SectionSupervisor Precision RPD 35% (or ± QL
if result is 5x the QL)
MS 1/Batch(10 samples) 65-135%R Flag data. Discuss in
narrative.Analyst/SectionSupervisor
Accuracy/Bias-Precision 65-135%R

Quality Assurance Project PlanRI Water Column Monitoring/Small Volume Chemical Data CollectionLower Passaic River Restoration ProjectNew Jersey
Section: Worksheet #28Revision: 2
Date: August 2011Page 21 of 52
QAPP Worksheet #28 (UFP-QAPP Manual Section 3.4) QC Samples Table
J:\Water\ProjectFiles\P120\12182_Passaic\Tasks\CWCM\AECOM QAPP\2011803_Rev2\clean\20110810_CWCM-sv_QAPP_Rev2.docx
QC SampleFrequency/
Number
Method/SOPQC Acceptance
Limits CA
Person(s)Responsible for
CA DQI
MeasurementPerformance
Criteria
MSD 1/Batch(10 samples) 35% RPD Flag data. Discuss in
narrative.Analyst/SectionSupervisor Precision <24% RPD
Field Duplicate 1/20 field samples
RPD 30% if bothsamples are >5x QLor absolute differencebetweenconcentrations <2x QLif sample and/or fieldduplicate are 5x QL
Evaluate during datavalidation. Qualify dataas needed
Data Validator Precision
RPD 30% if bothsamples are >5x QLor absolute differencebetweenconcentrations <2xQL if sample and/orfield duplicate are 5xQL
PE Sampled 5 (total only) Supplier CertifiedLimits
Feedback tolaboratory; laboratoryevaluation andresponse
AECOM ProjectChemist/Laboratory Staff
Accuracy/Bias Supplier CertifiedLimits
a Refer to QAPP Worksheet #15 for a complete list of analytes for each analytical groupb Refer to QAPP Worksheet #21c Refer to QAPP Worksheet #23d Refer to Worksheet #31 for additional details of the PE program.
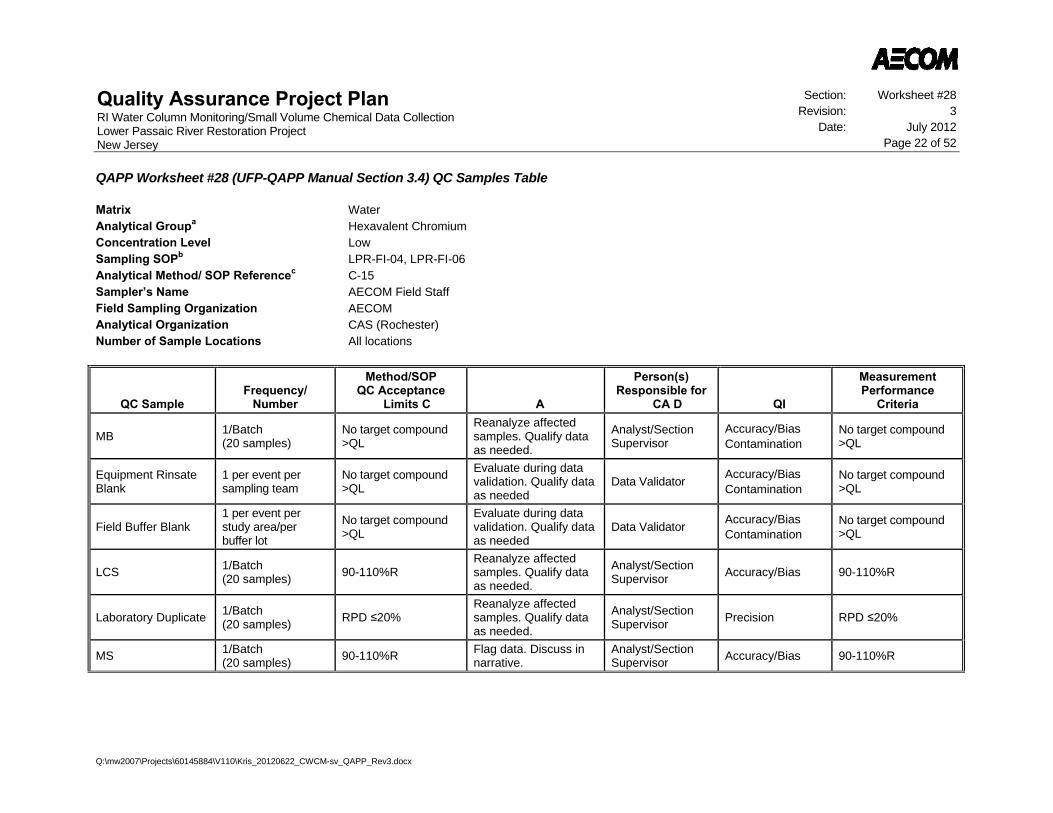
Quality Assurance Project Plan RI Water Column Monitoring/Small Volume Chemical Data Collection Lower Passaic River Restoration Project New Jersey
Section: Worksheet #28 Revision: 3
Date: July 2012 Page 22 of 52
QAPP Worksheet #28 (UFP-QAPP Manual Section 3.4) QC Samples Table
Q:\mw2007\Projects\60145884\V110\Kris_20120622_CWCM-sv_QAPP_Rev3.docx
Matrix Water Analytical Groupa Hexavalent Chromium Concentration Level Low Sampling SOPb LPR-FI-04, LPR-FI-06 Analytical Method/ SOP Referencec C-15 Sampler’s Name AECOM Field Staff Field Sampling Organization AECOM Analytical Organization CAS (Rochester) Number of Sample Locations All locations
QC Sample Frequency/
Number
Method/SOP QC Acceptance
Limits C A
Person(s) Responsible for
CA D QI
Measurement Performance
Criteria
MB 1/Batch (20 samples)
No target compound >QL
Reanalyze affected samples. Qualify data as needed.
Analyst/Section Supervisor
Accuracy/Bias Contamination
No target compound >QL
Equipment Rinsate Blank
1 per event per sampling team
No target compound >QL
Evaluate during data validation. Qualify data as needed
Data Validator Accuracy/Bias Contamination
No target compound >QL
Field Buffer Blank 1 per event per study area/per buffer lot
No target compound >QL
Evaluate during data validation. Qualify data as needed
Data Validator Accuracy/Bias Contamination
No target compound >QL
LCS 1/Batch (20 samples)
90-110%R Reanalyze affected samples. Qualify data as needed.
Analyst/Section Supervisor
Accuracy/Bias 90-110%R
Laboratory Duplicate 1/Batch (20 samples)
RPD ≤20% Reanalyze affected samples. Qualify data as needed.
Analyst/Section Supervisor
Precision RPD ≤20%
MS 1/Batch (20 samples)
90-110%R Flag data. Discuss in narrative.
Analyst/Section Supervisor
Accuracy/Bias 90-110%R
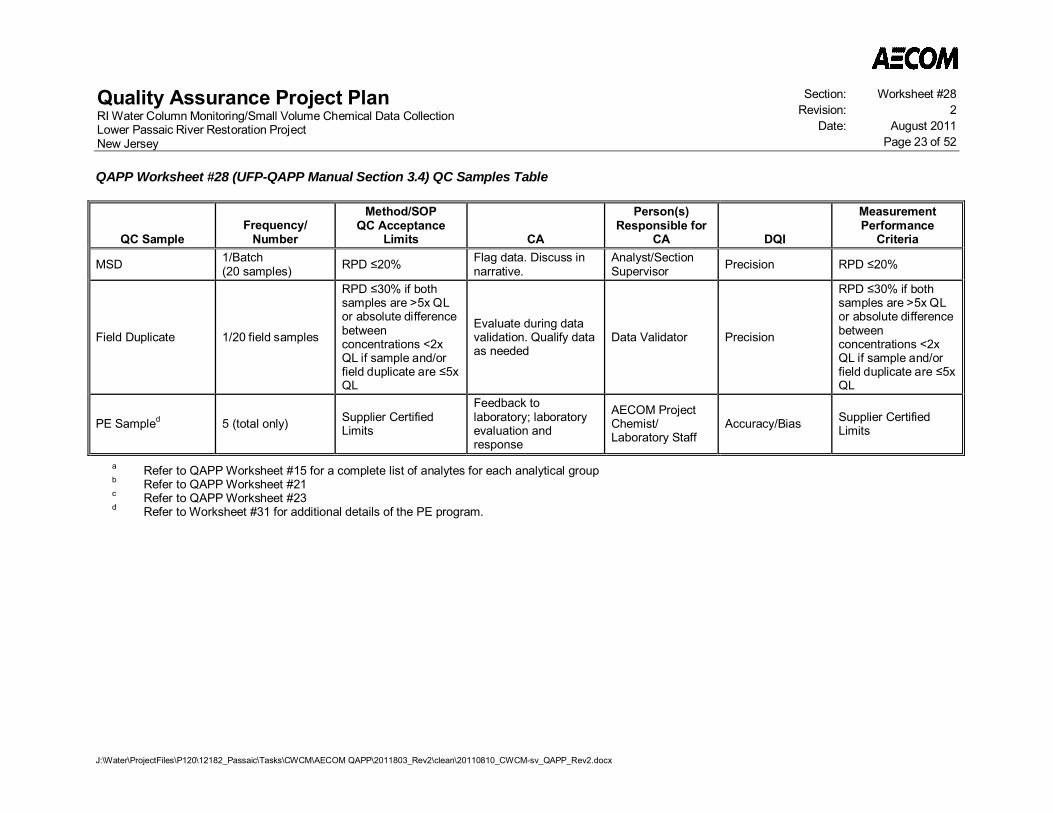
Quality Assurance Project PlanRI Water Column Monitoring/Small Volume Chemical Data CollectionLower Passaic River Restoration ProjectNew Jersey
Section: Worksheet #28Revision: 2
Date: August 2011Page 23 of 52
QAPP Worksheet #28 (UFP-QAPP Manual Section 3.4) QC Samples Table
J:\Water\ProjectFiles\P120\12182_Passaic\Tasks\CWCM\AECOM QAPP\2011803_Rev2\clean\20110810_CWCM-sv_QAPP_Rev2.docx
QC SampleFrequency/
Number
Method/SOPQC Acceptance
Limits CA
Person(s)Responsible for
CA DQI
MeasurementPerformance
Criteria
MSD 1/Batch(20 samples) RPD 20% Flag data. Discuss in
narrative.Analyst/SectionSupervisor Precision RPD 20%
Field Duplicate 1/20 field samples
RPD 30% if bothsamples are >5x QLor absolute differencebetweenconcentrations <2xQL if sample and/orfield duplicate are 5xQL
Evaluate during datavalidation. Qualify dataas needed
Data Validator Precision
RPD 30% if bothsamples are >5x QLor absolute differencebetweenconcentrations <2xQL if sample and/orfield duplicate are 5xQL
PE Sampled 5 (total only) Supplier CertifiedLimits
Feedback tolaboratory; laboratoryevaluation andresponse
AECOM ProjectChemist/Laboratory Staff
Accuracy/Bias Supplier CertifiedLimits
a Refer to QAPP Worksheet #15 for a complete list of analytes for each analytical groupb Refer to QAPP Worksheet #21c Refer to QAPP Worksheet #23d Refer to Worksheet #31 for additional details of the PE program.
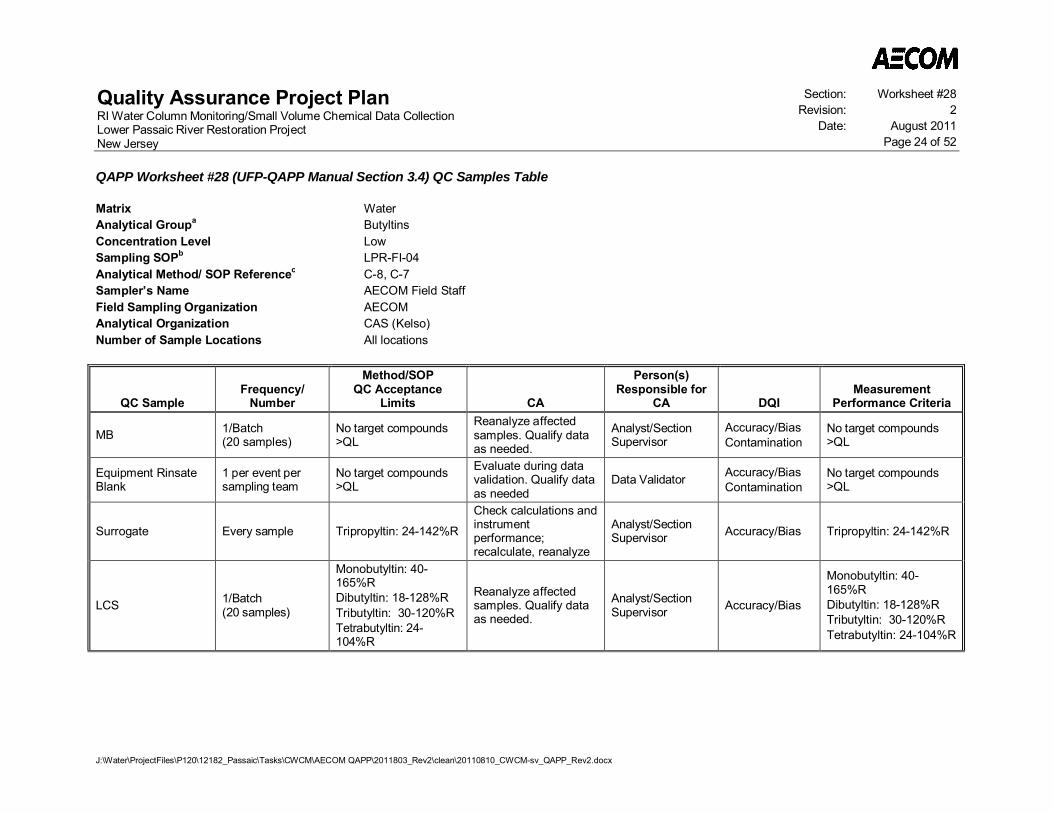
Quality Assurance Project PlanRI Water Column Monitoring/Small Volume Chemical Data CollectionLower Passaic River Restoration ProjectNew Jersey
Section: Worksheet #28Revision: 2
Date: August 2011Page 24 of 52
QAPP Worksheet #28 (UFP-QAPP Manual Section 3.4) QC Samples Table
J:\Water\ProjectFiles\P120\12182_Passaic\Tasks\CWCM\AECOM QAPP\2011803_Rev2\clean\20110810_CWCM-sv_QAPP_Rev2.docx
Matrix WaterAnalytical Groupa ButyltinsConcentration Level LowSampling SOPb LPR-FI-04Analytical Method/ SOP Referencec C-8, C-7Sampler’s Name AECOM Field StaffField Sampling Organization AECOMAnalytical Organization CAS (Kelso)Number of Sample Locations All locations
QC SampleFrequency/
Number
Method/SOPQC Acceptance
Limits CA
Person(s)Responsible for
CA DQIMeasurement
Performance Criteria
MB 1/Batch(20 samples)
No target compounds>QL
Reanalyze affectedsamples. Qualify dataas needed.
Analyst/SectionSupervisor
Accuracy/BiasContamination
No target compounds>QL
Equipment RinsateBlank
1 per event persampling team
No target compounds>QL
Evaluate during datavalidation. Qualify dataas needed
Data Validator Accuracy/BiasContamination
No target compounds>QL
Surrogate Every sample Tripropyltin: 24-142%R
Check calculations andinstrumentperformance;recalculate, reanalyze
Analyst/SectionSupervisor Accuracy/Bias Tripropyltin: 24-142%R
LCS 1/Batch(20 samples)
Monobutyltin: 40-165%RDibutyltin: 18-128%RTributyltin: 30-120%RTetrabutyltin: 24-104%R
Reanalyze affectedsamples. Qualify dataas needed.
Analyst/SectionSupervisor Accuracy/Bias
Monobutyltin: 40-165%RDibutyltin: 18-128%RTributyltin: 30-120%RTetrabutyltin: 24-104%R
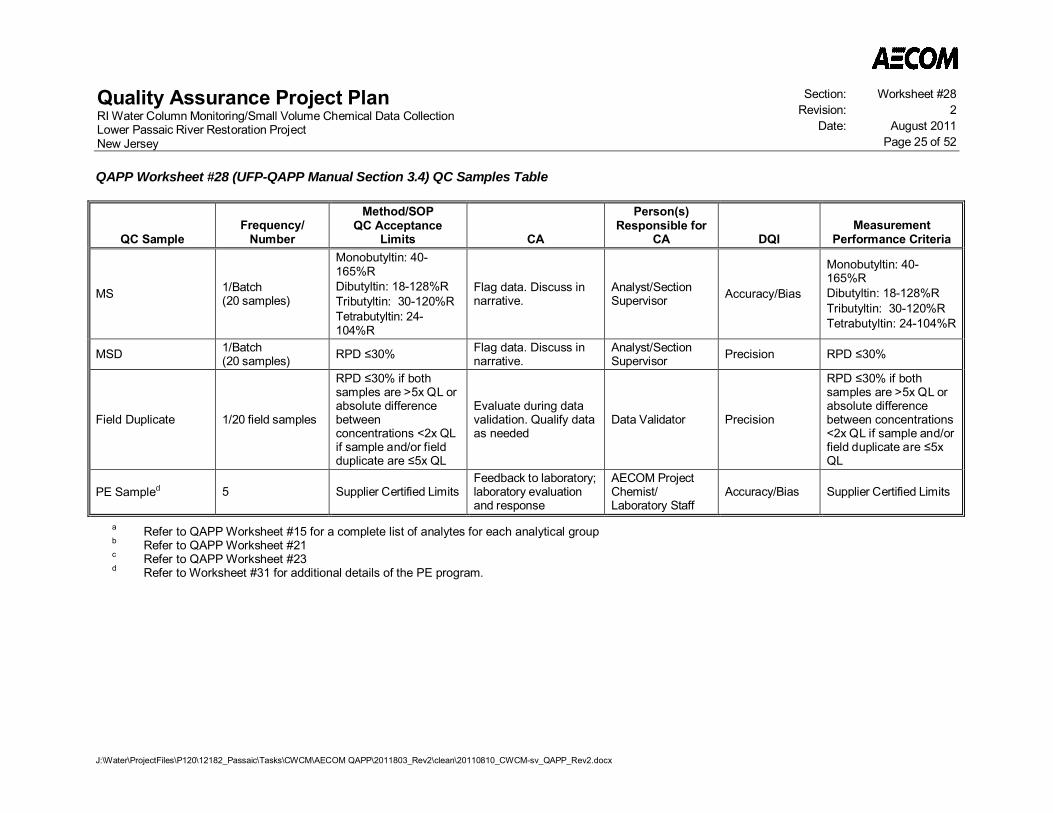
Quality Assurance Project PlanRI Water Column Monitoring/Small Volume Chemical Data CollectionLower Passaic River Restoration ProjectNew Jersey
Section: Worksheet #28Revision: 2
Date: August 2011Page 25 of 52
QAPP Worksheet #28 (UFP-QAPP Manual Section 3.4) QC Samples Table
J:\Water\ProjectFiles\P120\12182_Passaic\Tasks\CWCM\AECOM QAPP\2011803_Rev2\clean\20110810_CWCM-sv_QAPP_Rev2.docx
QC SampleFrequency/
Number
Method/SOPQC Acceptance
Limits CA
Person(s)Responsible for
CA DQIMeasurement
Performance Criteria
MS 1/Batch(20 samples)
Monobutyltin: 40-165%RDibutyltin: 18-128%RTributyltin: 30-120%RTetrabutyltin: 24-104%R
Flag data. Discuss innarrative.
Analyst/SectionSupervisor Accuracy/Bias
Monobutyltin: 40-165%RDibutyltin: 18-128%RTributyltin: 30-120%RTetrabutyltin: 24-104%R
MSD 1/Batch(20 samples) RPD 30% Flag data. Discuss in
narrative.Analyst/SectionSupervisor Precision RPD 30%
Field Duplicate 1/20 field samples
RPD 30% if bothsamples are >5x QL orabsolute differencebetweenconcentrations <2x QLif sample and/or fieldduplicate are 5x QL
Evaluate during datavalidation. Qualify dataas needed
Data Validator Precision
RPD 30% if bothsamples are >5x QL orabsolute differencebetween concentrations<2x QL if sample and/orfield duplicate are 5xQL
PE Sampled 5 Supplier Certified LimitsFeedback to laboratory;laboratory evaluationand response
AECOM ProjectChemist/Laboratory Staff
Accuracy/Bias Supplier Certified Limits
a Refer to QAPP Worksheet #15 for a complete list of analytes for each analytical groupb Refer to QAPP Worksheet #21c Refer to QAPP Worksheet #23d Refer to Worksheet #31 for additional details of the PE program.
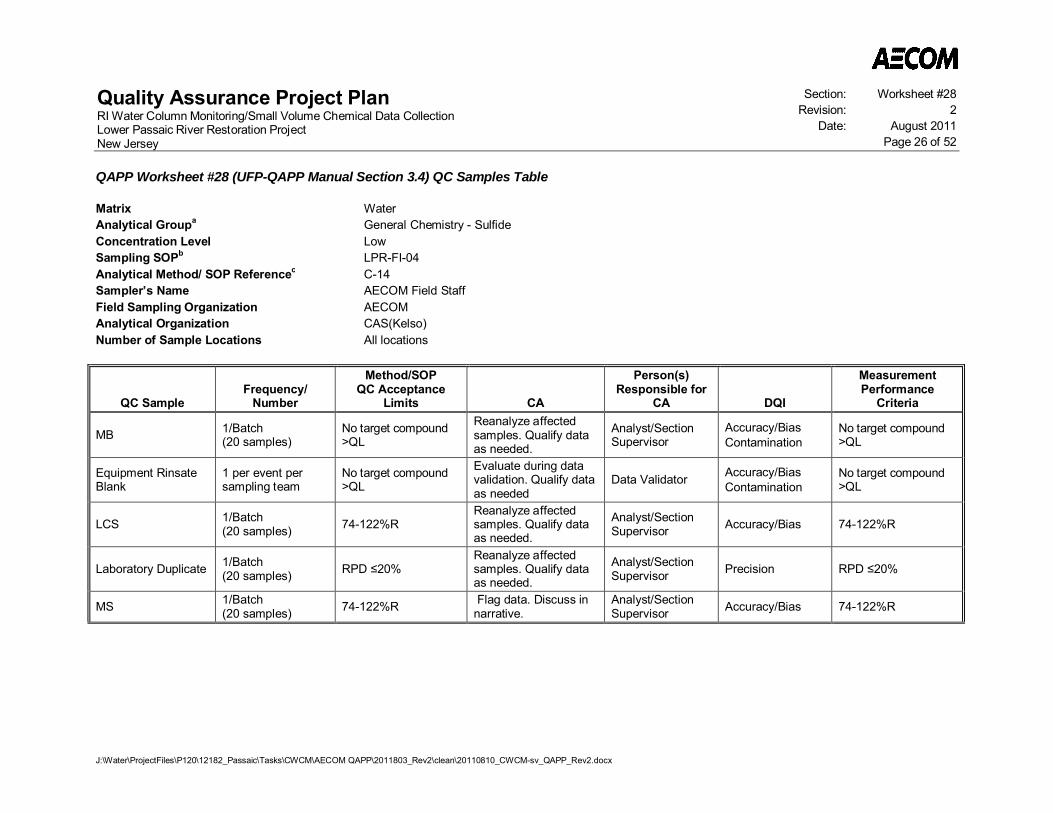
Quality Assurance Project PlanRI Water Column Monitoring/Small Volume Chemical Data CollectionLower Passaic River Restoration ProjectNew Jersey
Section: Worksheet #28Revision: 2
Date: August 2011Page 26 of 52
QAPP Worksheet #28 (UFP-QAPP Manual Section 3.4) QC Samples Table
J:\Water\ProjectFiles\P120\12182_Passaic\Tasks\CWCM\AECOM QAPP\2011803_Rev2\clean\20110810_CWCM-sv_QAPP_Rev2.docx
Matrix WaterAnalytical Groupa General Chemistry - SulfideConcentration Level LowSampling SOPb LPR-FI-04Analytical Method/ SOP Referencec C-14Sampler’s Name AECOM Field StaffField Sampling Organization AECOMAnalytical Organization CAS(Kelso)Number of Sample Locations All locations
QC SampleFrequency/
Number
Method/SOPQC Acceptance
Limits CA
Person(s)Responsible for
CA DQI
MeasurementPerformance
Criteria
MB 1/Batch(20 samples)
No target compound>QL
Reanalyze affectedsamples. Qualify dataas needed.
Analyst/SectionSupervisor
Accuracy/BiasContamination
No target compound>QL
Equipment RinsateBlank
1 per event persampling team
No target compound>QL
Evaluate during datavalidation. Qualify dataas needed
Data Validator Accuracy/BiasContamination
No target compound>QL
LCS 1/Batch(20 samples) 74-122%R
Reanalyze affectedsamples. Qualify dataas needed.
Analyst/SectionSupervisor Accuracy/Bias 74-122%R
Laboratory Duplicate 1/Batch(20 samples) RPD 20%
Reanalyze affectedsamples. Qualify dataas needed.
Analyst/SectionSupervisor Precision RPD 20%
MS 1/Batch(20 samples) 74-122%R Flag data. Discuss in
narrative.Analyst/SectionSupervisor Accuracy/Bias 74-122%R
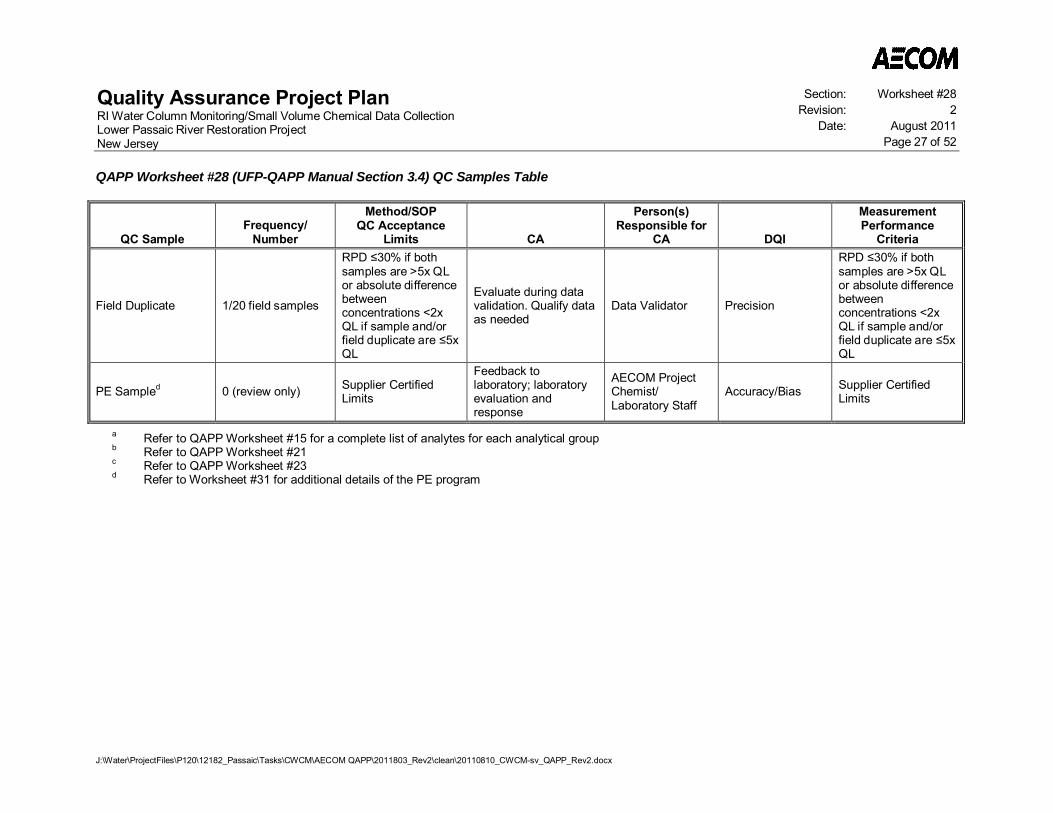
Quality Assurance Project PlanRI Water Column Monitoring/Small Volume Chemical Data CollectionLower Passaic River Restoration ProjectNew Jersey
Section: Worksheet #28Revision: 2
Date: August 2011Page 27 of 52
QAPP Worksheet #28 (UFP-QAPP Manual Section 3.4) QC Samples Table
J:\Water\ProjectFiles\P120\12182_Passaic\Tasks\CWCM\AECOM QAPP\2011803_Rev2\clean\20110810_CWCM-sv_QAPP_Rev2.docx
QC SampleFrequency/
Number
Method/SOPQC Acceptance
Limits CA
Person(s)Responsible for
CA DQI
MeasurementPerformance
Criteria
Field Duplicate 1/20 field samples
RPD 30% if bothsamples are >5x QLor absolute differencebetweenconcentrations <2xQL if sample and/orfield duplicate are 5xQL
Evaluate during datavalidation. Qualify dataas needed
Data Validator Precision
RPD 30% if bothsamples are >5x QLor absolute differencebetweenconcentrations <2xQL if sample and/orfield duplicate are 5xQL
PE Sampled 0 (review only) Supplier CertifiedLimits
Feedback tolaboratory; laboratoryevaluation andresponse
AECOM ProjectChemist/Laboratory Staff
Accuracy/Bias Supplier CertifiedLimits
a Refer to QAPP Worksheet #15 for a complete list of analytes for each analytical groupb Refer to QAPP Worksheet #21c Refer to QAPP Worksheet #23d Refer to Worksheet #31 for additional details of the PE program
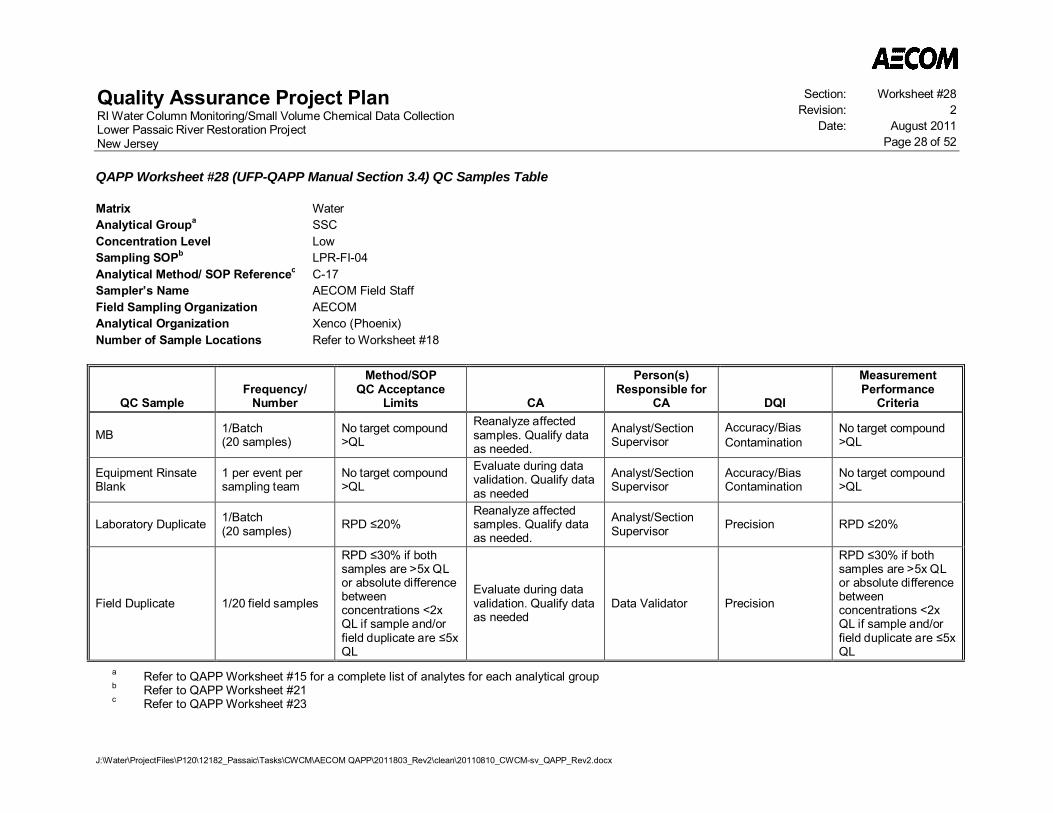
Quality Assurance Project PlanRI Water Column Monitoring/Small Volume Chemical Data CollectionLower Passaic River Restoration ProjectNew Jersey
Section: Worksheet #28Revision: 2
Date: August 2011Page 28 of 52
QAPP Worksheet #28 (UFP-QAPP Manual Section 3.4) QC Samples Table
J:\Water\ProjectFiles\P120\12182_Passaic\Tasks\CWCM\AECOM QAPP\2011803_Rev2\clean\20110810_CWCM-sv_QAPP_Rev2.docx
Matrix WaterAnalytical Groupa SSCConcentration Level LowSampling SOPb LPR-FI-04Analytical Method/ SOP Referencec C-17Sampler’s Name AECOM Field StaffField Sampling Organization AECOMAnalytical Organization Xenco (Phoenix)Number of Sample Locations Refer to Worksheet #18
QC SampleFrequency/
Number
Method/SOPQC Acceptance
Limits CA
Person(s)Responsible for
CA DQI
MeasurementPerformance
Criteria
MB 1/Batch(20 samples)
No target compound>QL
Reanalyze affectedsamples. Qualify dataas needed.
Analyst/SectionSupervisor
Accuracy/BiasContamination
No target compound>QL
Equipment RinsateBlank
1 per event persampling team
No target compound>QL
Evaluate during datavalidation. Qualify dataas needed
Analyst/SectionSupervisor
Accuracy/BiasContamination
No target compound>QL
Laboratory Duplicate 1/Batch(20 samples) RPD 20%
Reanalyze affectedsamples. Qualify dataas needed.
Analyst/SectionSupervisor Precision RPD 20%
Field Duplicate 1/20 field samples
RPD 30% if bothsamples are >5x QLor absolute differencebetweenconcentrations <2xQL if sample and/orfield duplicate are 5xQL
Evaluate during datavalidation. Qualify dataas needed
Data Validator Precision
RPD 30% if bothsamples are >5x QLor absolute differencebetweenconcentrations <2xQL if sample and/orfield duplicate are 5xQL
a Refer to QAPP Worksheet #15 for a complete list of analytes for each analytical groupb Refer to QAPP Worksheet #21c Refer to QAPP Worksheet #23
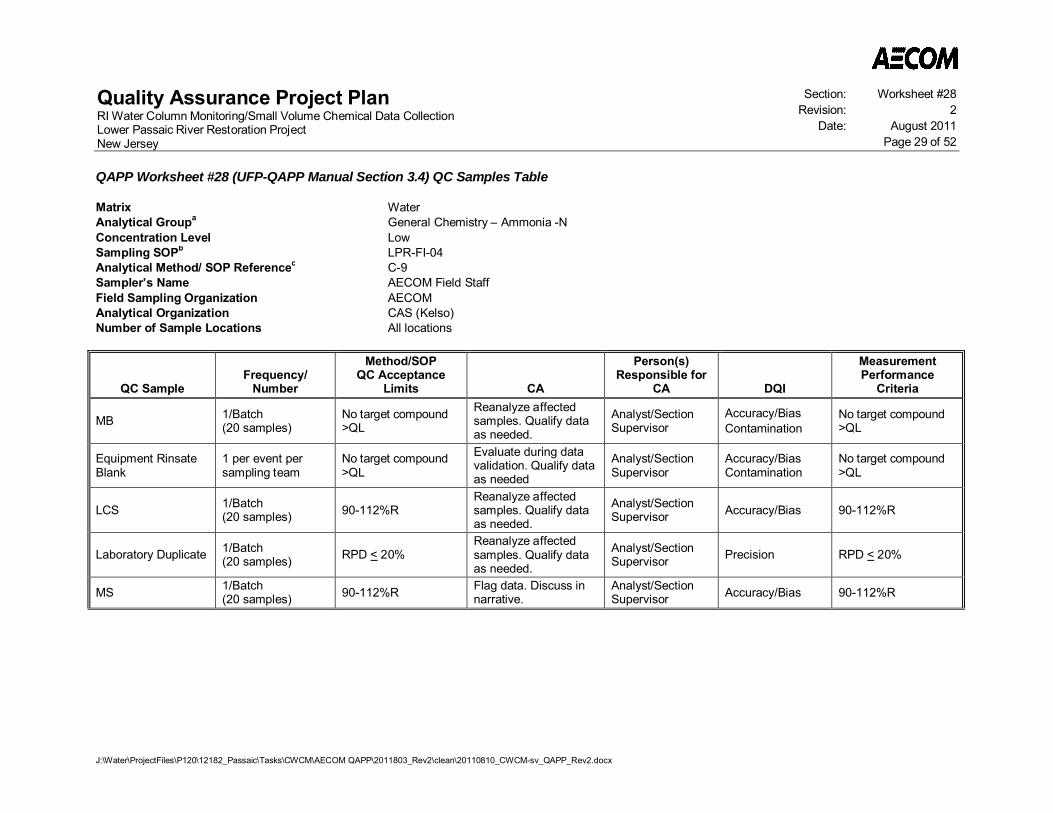
Quality Assurance Project PlanRI Water Column Monitoring/Small Volume Chemical Data CollectionLower Passaic River Restoration ProjectNew Jersey
Section: Worksheet #28Revision: 2
Date: August 2011Page 29 of 52
QAPP Worksheet #28 (UFP-QAPP Manual Section 3.4) QC Samples Table
J:\Water\ProjectFiles\P120\12182_Passaic\Tasks\CWCM\AECOM QAPP\2011803_Rev2\clean\20110810_CWCM-sv_QAPP_Rev2.docx
Matrix WaterAnalytical Groupa General Chemistry – Ammonia -NConcentration Level LowSampling SOPb LPR-FI-04Analytical Method/ SOP Referencec C-9Sampler’s Name AECOM Field StaffField Sampling Organization AECOMAnalytical Organization CAS (Kelso)Number of Sample Locations All locations
QC SampleFrequency/
Number
Method/SOPQC Acceptance
Limits CA
Person(s)Responsible for
CA DQI
MeasurementPerformance
Criteria
MB 1/Batch(20 samples)
No target compound>QL
Reanalyze affectedsamples. Qualify dataas needed.
Analyst/SectionSupervisor
Accuracy/BiasContamination
No target compound>QL
Equipment RinsateBlank
1 per event persampling team
No target compound>QL
Evaluate during datavalidation. Qualify dataas needed
Analyst/SectionSupervisor
Accuracy/BiasContamination
No target compound>QL
LCS 1/Batch(20 samples) 90-112%R
Reanalyze affectedsamples. Qualify dataas needed.
Analyst/SectionSupervisor Accuracy/Bias 90-112%R
Laboratory Duplicate 1/Batch(20 samples) RPD < 20%
Reanalyze affectedsamples. Qualify dataas needed.
Analyst/SectionSupervisor Precision RPD < 20%
MS 1/Batch(20 samples) 90-112%R Flag data. Discuss in
narrative.Analyst/SectionSupervisor Accuracy/Bias 90-112%R
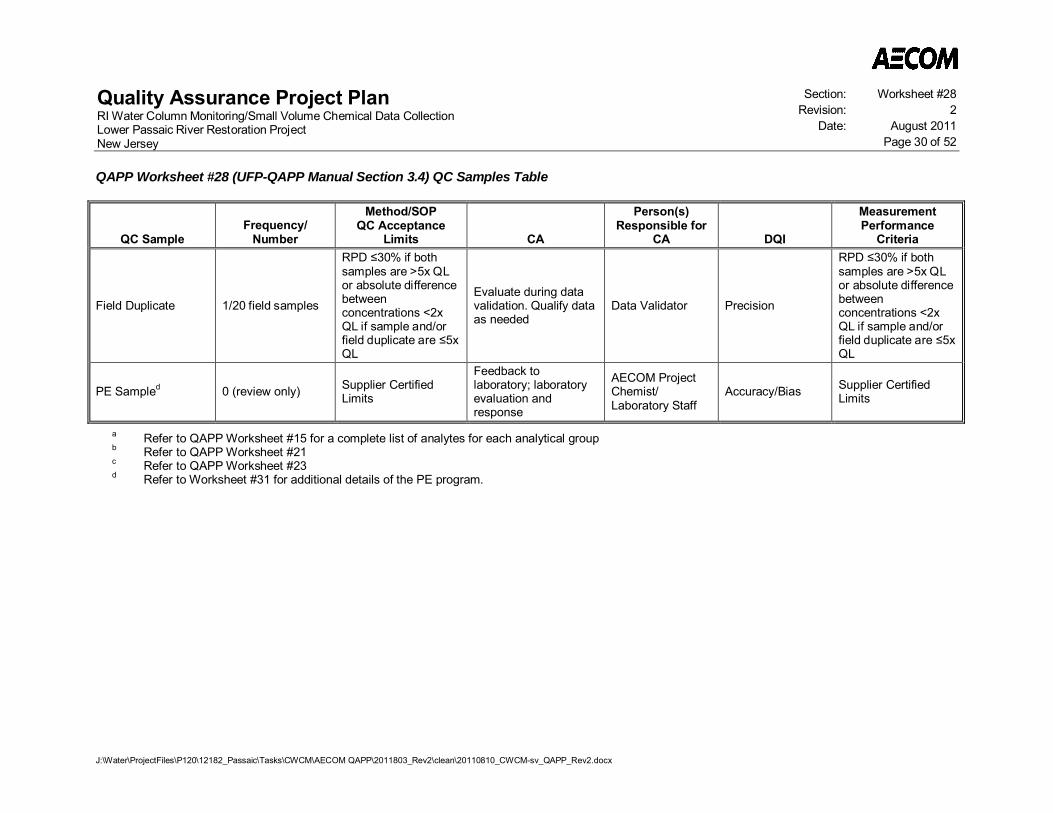
Quality Assurance Project PlanRI Water Column Monitoring/Small Volume Chemical Data CollectionLower Passaic River Restoration ProjectNew Jersey
Section: Worksheet #28Revision: 2
Date: August 2011Page 30 of 52
QAPP Worksheet #28 (UFP-QAPP Manual Section 3.4) QC Samples Table
J:\Water\ProjectFiles\P120\12182_Passaic\Tasks\CWCM\AECOM QAPP\2011803_Rev2\clean\20110810_CWCM-sv_QAPP_Rev2.docx
QC SampleFrequency/
Number
Method/SOPQC Acceptance
Limits CA
Person(s)Responsible for
CA DQI
MeasurementPerformance
Criteria
Field Duplicate 1/20 field samples
RPD 30% if bothsamples are >5x QLor absolute differencebetweenconcentrations <2xQL if sample and/orfield duplicate are 5xQL
Evaluate during datavalidation. Qualify dataas needed
Data Validator Precision
RPD 30% if bothsamples are >5x QLor absolute differencebetweenconcentrations <2xQL if sample and/orfield duplicate are 5xQL
PE Sampled 0 (review only) Supplier CertifiedLimits
Feedback tolaboratory; laboratoryevaluation andresponse
AECOM ProjectChemist/Laboratory Staff
Accuracy/Bias Supplier CertifiedLimits
a Refer to QAPP Worksheet #15 for a complete list of analytes for each analytical groupb Refer to QAPP Worksheet #21c Refer to QAPP Worksheet #23d Refer to Worksheet #31 for additional details of the PE program.
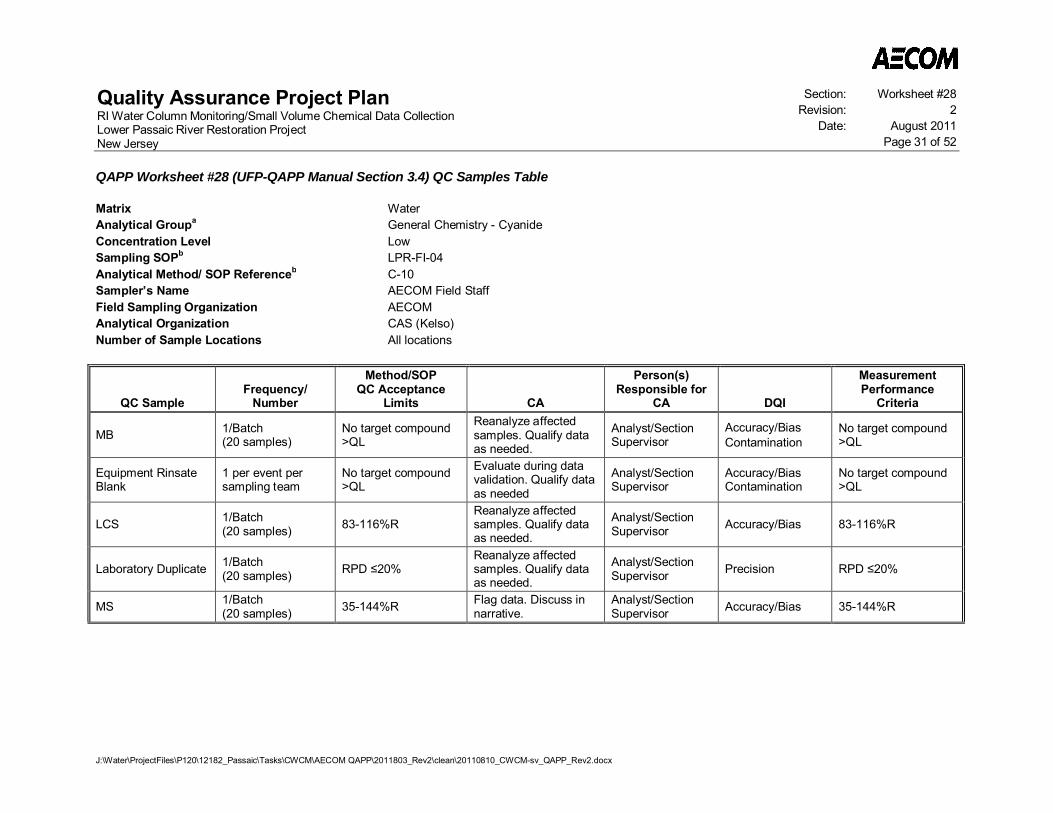
Quality Assurance Project PlanRI Water Column Monitoring/Small Volume Chemical Data CollectionLower Passaic River Restoration ProjectNew Jersey
Section: Worksheet #28Revision: 2
Date: August 2011Page 31 of 52
QAPP Worksheet #28 (UFP-QAPP Manual Section 3.4) QC Samples Table
J:\Water\ProjectFiles\P120\12182_Passaic\Tasks\CWCM\AECOM QAPP\2011803_Rev2\clean\20110810_CWCM-sv_QAPP_Rev2.docx
Matrix WaterAnalytical Groupa General Chemistry - CyanideConcentration Level LowSampling SOPb LPR-FI-04Analytical Method/ SOP Referenceb C-10Sampler’s Name AECOM Field StaffField Sampling Organization AECOMAnalytical Organization CAS (Kelso)Number of Sample Locations All locations
QC SampleFrequency/
Number
Method/SOPQC Acceptance
Limits CA
Person(s)Responsible for
CA DQI
MeasurementPerformance
Criteria
MB 1/Batch(20 samples)
No target compound>QL
Reanalyze affectedsamples. Qualify dataas needed.
Analyst/SectionSupervisor
Accuracy/BiasContamination
No target compound>QL
Equipment RinsateBlank
1 per event persampling team
No target compound>QL
Evaluate during datavalidation. Qualify dataas needed
Analyst/SectionSupervisor
Accuracy/BiasContamination
No target compound>QL
LCS 1/Batch(20 samples) 83-116%R
Reanalyze affectedsamples. Qualify dataas needed.
Analyst/SectionSupervisor Accuracy/Bias 83-116%R
Laboratory Duplicate 1/Batch(20 samples) RPD 20%
Reanalyze affectedsamples. Qualify dataas needed.
Analyst/SectionSupervisor Precision RPD 20%
MS 1/Batch(20 samples) 35-144%R Flag data. Discuss in
narrative.Analyst/SectionSupervisor Accuracy/Bias 35-144%R
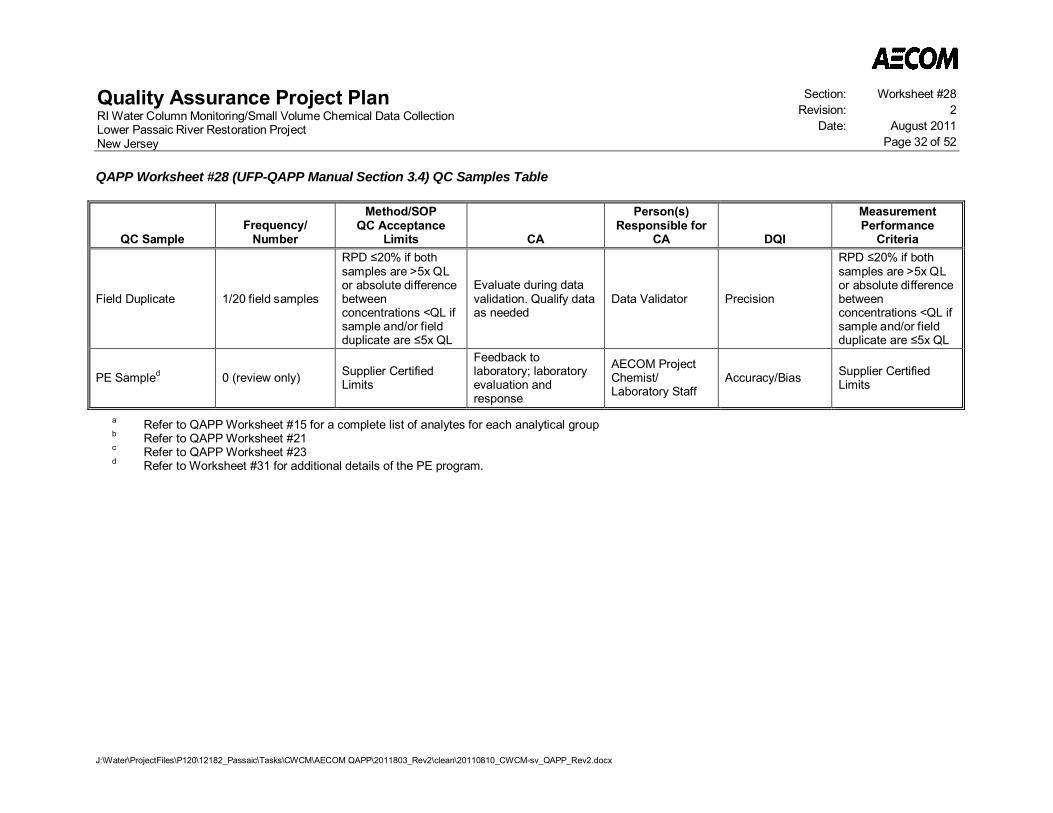
Quality Assurance Project PlanRI Water Column Monitoring/Small Volume Chemical Data CollectionLower Passaic River Restoration ProjectNew Jersey
Section: Worksheet #28Revision: 2
Date: August 2011Page 32 of 52
QAPP Worksheet #28 (UFP-QAPP Manual Section 3.4) QC Samples Table
J:\Water\ProjectFiles\P120\12182_Passaic\Tasks\CWCM\AECOM QAPP\2011803_Rev2\clean\20110810_CWCM-sv_QAPP_Rev2.docx
QC SampleFrequency/
Number
Method/SOPQC Acceptance
Limits CA
Person(s)Responsible for
CA DQI
MeasurementPerformance
Criteria
Field Duplicate 1/20 field samples
RPD 20% if bothsamples are >5x QLor absolute differencebetweenconcentrations <QL ifsample and/or fieldduplicate are 5x QL
Evaluate during datavalidation. Qualify dataas needed
Data Validator Precision
RPD 20% if bothsamples are >5x QLor absolute differencebetweenconcentrations <QL ifsample and/or fieldduplicate are 5x QL
PE Sampled 0 (review only) Supplier CertifiedLimits
Feedback tolaboratory; laboratoryevaluation andresponse
AECOM ProjectChemist/Laboratory Staff
Accuracy/Bias Supplier CertifiedLimits
a Refer to QAPP Worksheet #15 for a complete list of analytes for each analytical groupb Refer to QAPP Worksheet #21c Refer to QAPP Worksheet #23d Refer to Worksheet #31 for additional details of the PE program.

Quality Assurance Project PlanRI Water Column Monitoring/Small Volume Chemical Data CollectionLower Passaic River Restoration ProjectNew Jersey
Section: Worksheet #28Revision: 2
Date: August 2011Page 33 of 52
QAPP Worksheet #28 (UFP-QAPP Manual Section 3.4) QC Samples Table
J:\Water\ProjectFiles\P120\12182_Passaic\Tasks\CWCM\AECOM QAPP\2011803_Rev2\clean\20110810_CWCM-sv_QAPP_Rev2.docx
Matrix WaterAnalytical Groupa General Chemistry - TKNConcentration Level LowSampling SOPb LPR-FI-04Analytical Method/ SOP Referencec C-12Sampler’s Name AECOM Field StaffField Sampling Organization AECOMAnalytical Organization CAS (Kelso)Number of Sample Locations All locations
QC SampleFrequency/
Number
Method/SOPQC Acceptance
Limits CA
Person(s)Responsible for
CA DQI
MeasurementPerformance
Criteria
MB 1/Batch(20 samples)
No target compound>QL
Reanalyze affectedsamples. Qualify dataas needed.
Analyst/SectionSupervisor
Accuracy/BiasContamination
No target compound>QL
Equipment RinsateBlank
1 per event persampling team
No target compound>QL
Evaluate during datavalidation. Qualify dataas needed
Analyst/SectionSupervisor
Accuracy/BiasContamination
No target compound>QL
LCS 1/Batch(20 samples) 78-117%R
Reanalyze affectedsamples. Qualify dataas needed.
Analyst/SectionSupervisor Accuracy/Bias 78-117%R
Laboratory Duplicate 1/Batch(20 samples) RPD 20%
Reanalyze affectedsamples. Qualify dataas needed.
Analyst/SectionSupervisor Precision RPD 20%
MS 1/Batch(20 samples) 37-158%R Flag data. Discuss in
narrative.Analyst/SectionSupervisor Accuracy/Bias 37-158%R

Quality Assurance Project PlanRI Water Column Monitoring/Small Volume Chemical Data CollectionLower Passaic River Restoration ProjectNew Jersey
Section: Worksheet #28Revision: 2
Date: August 2011Page 34 of 52
QAPP Worksheet #28 (UFP-QAPP Manual Section 3.4) QC Samples Table
J:\Water\ProjectFiles\P120\12182_Passaic\Tasks\CWCM\AECOM QAPP\2011803_Rev2\clean\20110810_CWCM-sv_QAPP_Rev2.docx
QC SampleFrequency/
Number
Method/SOPQC Acceptance
Limits CA
Person(s)Responsible for
CA DQI
MeasurementPerformance
Criteria
Field Duplicate 1/20 field samples
RPD 30% if bothsamples are >5x QLor absolute differencebetweenconcentrations <2xQL if sample and/orfield duplicate are 5xQL
Evaluate during datavalidation. Qualify dataas needed
Data Validator Precision
RPD 30% if bothsamples are >5x QLor absolute differencebetweenconcentrations <2xQL if sample and/orfield duplicate are 5xQL
PE Sampled 0 (review only) Supplier CertifiedLimits
Feedback tolaboratory; laboratoryevaluation andresponse
AECOM ProjectChemist/Laboratory Staff
Accuracy/Bias Supplier CertifiedLimits
a Refer to QAPP Worksheet #15 for a complete list of analytes for each analytical groupb Refer to QAPP Worksheet #21c Refer to QAPP Worksheet #23d Refer to Worksheet #31 for additional details of the PE program.
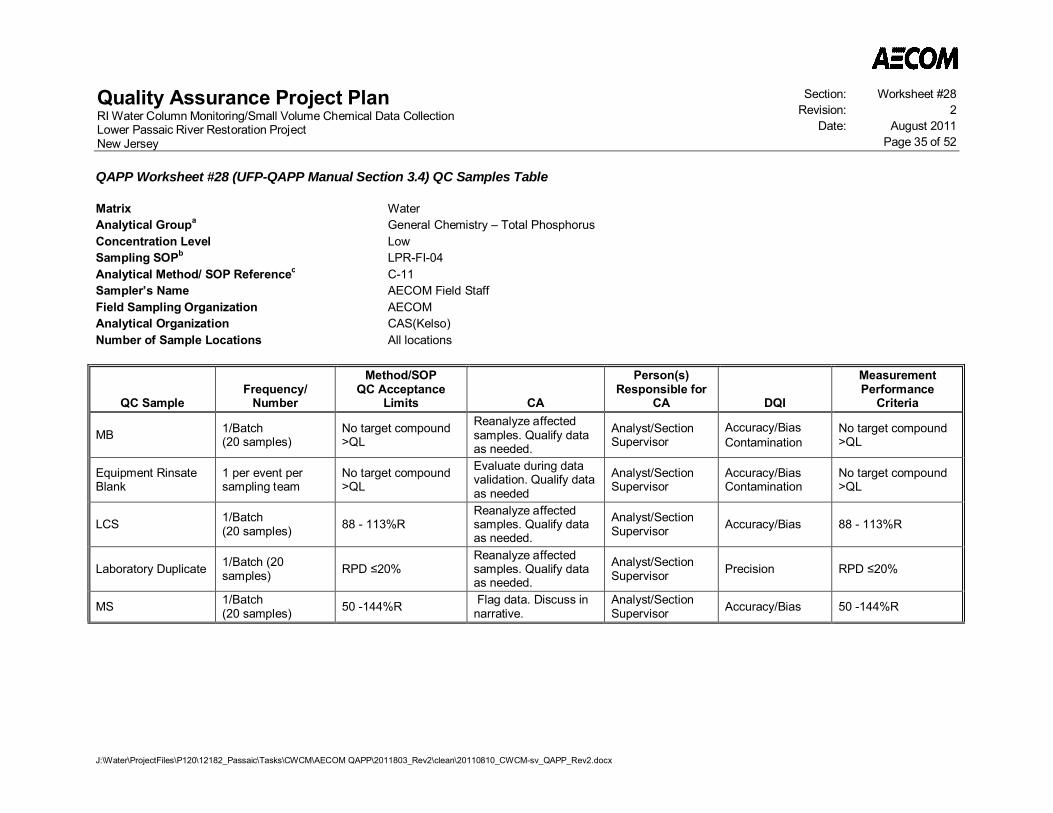
Quality Assurance Project PlanRI Water Column Monitoring/Small Volume Chemical Data CollectionLower Passaic River Restoration ProjectNew Jersey
Section: Worksheet #28Revision: 2
Date: August 2011Page 35 of 52
QAPP Worksheet #28 (UFP-QAPP Manual Section 3.4) QC Samples Table
J:\Water\ProjectFiles\P120\12182_Passaic\Tasks\CWCM\AECOM QAPP\2011803_Rev2\clean\20110810_CWCM-sv_QAPP_Rev2.docx
Matrix WaterAnalytical Groupa General Chemistry – Total PhosphorusConcentration Level LowSampling SOPb LPR-FI-04Analytical Method/ SOP Referencec C-11Sampler’s Name AECOM Field StaffField Sampling Organization AECOMAnalytical Organization CAS(Kelso)Number of Sample Locations All locations
QC SampleFrequency/
Number
Method/SOPQC Acceptance
Limits CA
Person(s)Responsible for
CA DQI
MeasurementPerformance
Criteria
MB 1/Batch(20 samples)
No target compound>QL
Reanalyze affectedsamples. Qualify dataas needed.
Analyst/SectionSupervisor
Accuracy/BiasContamination
No target compound>QL
Equipment RinsateBlank
1 per event persampling team
No target compound>QL
Evaluate during datavalidation. Qualify dataas needed
Analyst/SectionSupervisor
Accuracy/BiasContamination
No target compound>QL
LCS 1/Batch(20 samples) 88 - 113%R
Reanalyze affectedsamples. Qualify dataas needed.
Analyst/SectionSupervisor Accuracy/Bias 88 - 113%R
Laboratory Duplicate 1/Batch (20samples) RPD 20%
Reanalyze affectedsamples. Qualify dataas needed.
Analyst/SectionSupervisor Precision RPD 20%
MS 1/Batch(20 samples) 50 -144%R Flag data. Discuss in
narrative.Analyst/SectionSupervisor Accuracy/Bias 50 -144%R

Quality Assurance Project PlanRI Water Column Monitoring/Small Volume Chemical Data CollectionLower Passaic River Restoration ProjectNew Jersey
Section: Worksheet #28Revision: 2
Date: August 2011Page 36 of 52
QAPP Worksheet #28 (UFP-QAPP Manual Section 3.4) QC Samples Table
J:\Water\ProjectFiles\P120\12182_Passaic\Tasks\CWCM\AECOM QAPP\2011803_Rev2\clean\20110810_CWCM-sv_QAPP_Rev2.docx
QC SampleFrequency/
Number
Method/SOPQC Acceptance
Limits CA
Person(s)Responsible for
CA DQI
MeasurementPerformance
Criteria
Field Duplicate 1/20 field samples
RPD 30% if bothsamples are >5x QLor absolute differencebetweenconcentrations <2xQL if sample and/orfield duplicate are 5xQL
Evaluate during datavalidation. Qualify dataas needed
Data Validator Precision
RPD 30% if bothsamples are >5x QLor absolute differencebetweenconcentrations <2xQL if sample and/orfield duplicate are 5xQL
PE Sampled 0 (review only) Supplier CertifiedLimits
Feedback tolaboratory; laboratoryevaluation andresponse
AECOM ProjectChemist/Laboratory Staff
Accuracy/Bias Supplier CertifiedLimits
a Refer to QAPP Worksheet #15 for a complete list of analytes for each analytical groupb Refer to QAPP Worksheet #21c Refer to QAPP Worksheet #23d Refer to Worksheet #31 for additional details of the PE program.
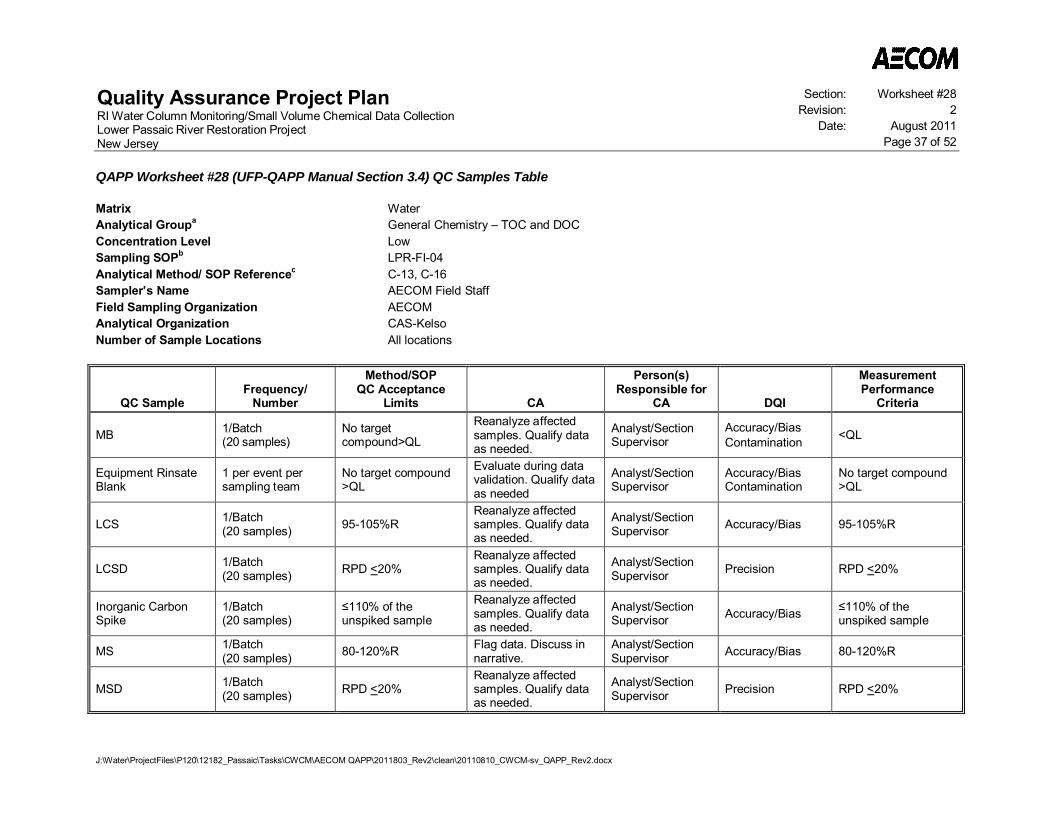
Quality Assurance Project PlanRI Water Column Monitoring/Small Volume Chemical Data CollectionLower Passaic River Restoration ProjectNew Jersey
Section: Worksheet #28Revision: 2
Date: August 2011Page 37 of 52
QAPP Worksheet #28 (UFP-QAPP Manual Section 3.4) QC Samples Table
J:\Water\ProjectFiles\P120\12182_Passaic\Tasks\CWCM\AECOM QAPP\2011803_Rev2\clean\20110810_CWCM-sv_QAPP_Rev2.docx
Matrix WaterAnalytical Groupa General Chemistry – TOC and DOCConcentration Level LowSampling SOPb LPR-FI-04Analytical Method/ SOP Referencec C-13, C-16Sampler’s Name AECOM Field StaffField Sampling Organization AECOMAnalytical Organization CAS-KelsoNumber of Sample Locations All locations
QC SampleFrequency/
Number
Method/SOPQC Acceptance
Limits CA
Person(s)Responsible for
CA DQI
MeasurementPerformance
Criteria
MB 1/Batch(20 samples)
No targetcompound>QL
Reanalyze affectedsamples. Qualify dataas needed.
Analyst/SectionSupervisor
Accuracy/BiasContamination <QL
Equipment RinsateBlank
1 per event persampling team
No target compound>QL
Evaluate during datavalidation. Qualify dataas needed
Analyst/SectionSupervisor
Accuracy/BiasContamination
No target compound>QL
LCS 1/Batch(20 samples) 95-105%R
Reanalyze affectedsamples. Qualify dataas needed.
Analyst/SectionSupervisor Accuracy/Bias 95-105%R
LCSD 1/Batch(20 samples) RPD <20%
Reanalyze affectedsamples. Qualify dataas needed.
Analyst/SectionSupervisor Precision RPD <20%
Inorganic CarbonSpike
1/Batch(20 samples)
110% of theunspiked sample
Reanalyze affectedsamples. Qualify dataas needed.
Analyst/SectionSupervisor Accuracy/Bias 110% of the
unspiked sample
MS 1/Batch(20 samples) 80-120%R Flag data. Discuss in
narrative.Analyst/SectionSupervisor Accuracy/Bias 80-120%R
MSD 1/Batch(20 samples) RPD <20%
Reanalyze affectedsamples. Qualify dataas needed.
Analyst/SectionSupervisor Precision RPD <20%

Quality Assurance Project PlanRI Water Column Monitoring/Small Volume Chemical Data CollectionLower Passaic River Restoration ProjectNew Jersey
Section: Worksheet #28Revision: 2
Date: August 2011Page 38 of 52
QAPP Worksheet #28 (UFP-QAPP Manual Section 3.4) QC Samples Table
J:\Water\ProjectFiles\P120\12182_Passaic\Tasks\CWCM\AECOM QAPP\2011803_Rev2\clean\20110810_CWCM-sv_QAPP_Rev2.docx
QC SampleFrequency/
Number
Method/SOPQC Acceptance
Limits CA
Person(s)Responsible for
CA DQI
MeasurementPerformance
Criteria
Field Duplicate 1/20 field samples
RPD 30% if bothsamples are >5x QLor absolute differencebetweenconcentrations <2xQL if sample and/orfield duplicate are 5xQL
Evaluate during datavalidation. Qualify dataas needed
Data Validator Precision
RPD 30% if bothsamples are >5x QLor absolute differencebetweenconcentrations <2xQL if sample and/orfield duplicate are 5xQL
PE Sampled 0 (review only) Supplier CertifiedLimits
Feedback tolaboratory; laboratoryevaluation andresponse
AECOM ProjectChemist/Laboratory Staff
Accuracy/Bias Supplier CertifiedLimits
a Refer to QAPP Worksheet #15 for a complete list of analytes for each analytical groupb Refer to QAPP Worksheet #21c Refer to QAPP Worksheet #23d Refer to Worksheet #31 for additional details of the PE program
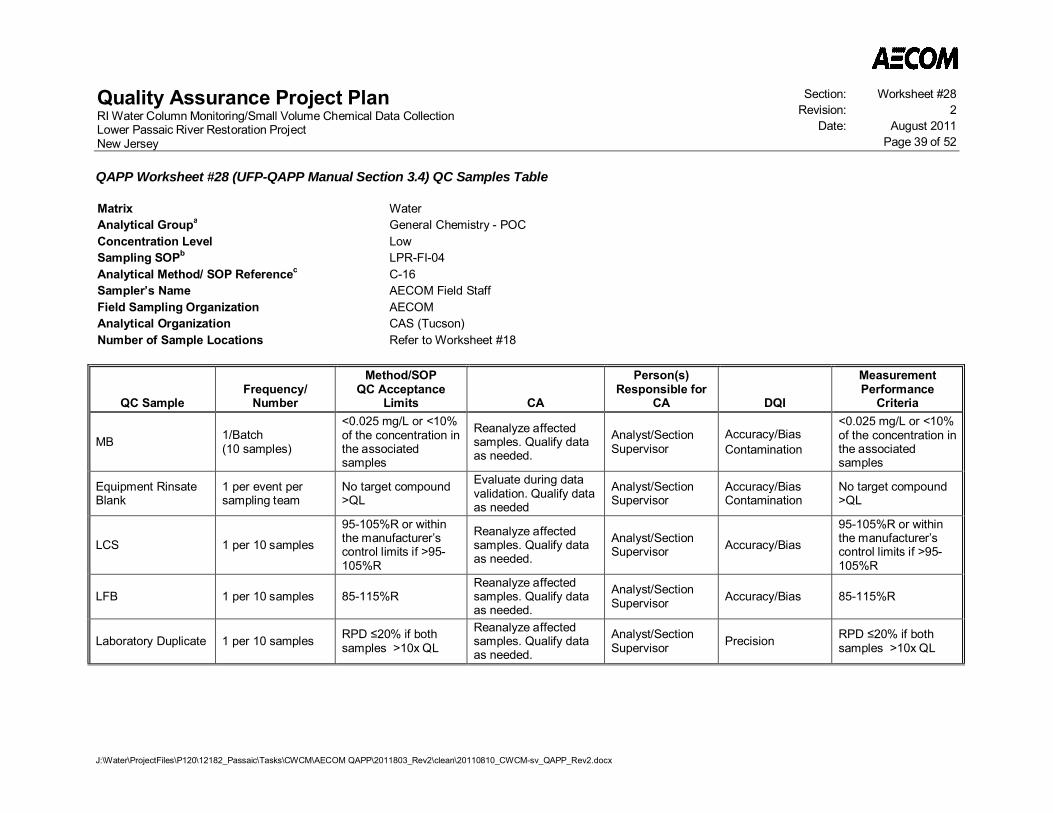
Quality Assurance Project PlanRI Water Column Monitoring/Small Volume Chemical Data CollectionLower Passaic River Restoration ProjectNew Jersey
Section: Worksheet #28Revision: 2
Date: August 2011Page 39 of 52
QAPP Worksheet #28 (UFP-QAPP Manual Section 3.4) QC Samples Table
J:\Water\ProjectFiles\P120\12182_Passaic\Tasks\CWCM\AECOM QAPP\2011803_Rev2\clean\20110810_CWCM-sv_QAPP_Rev2.docx
Matrix WaterAnalytical Groupa General Chemistry - POCConcentration Level LowSampling SOPb LPR-FI-04Analytical Method/ SOP Referencec C-16Sampler’s Name AECOM Field StaffField Sampling Organization AECOMAnalytical Organization CAS (Tucson)Number of Sample Locations Refer to Worksheet #18
QC SampleFrequency/
Number
Method/SOPQC Acceptance
Limits CA
Person(s)Responsible for
CA DQI
MeasurementPerformance
Criteria
MB 1/Batch(10 samples)
<0.025 mg/L or <10%of the concentration inthe associatedsamples
Reanalyze affectedsamples. Qualify dataas needed.
Analyst/SectionSupervisor
Accuracy/BiasContamination
<0.025 mg/L or <10%of the concentration inthe associatedsamples
Equipment RinsateBlank
1 per event persampling team
No target compound>QL
Evaluate during datavalidation. Qualify dataas needed
Analyst/SectionSupervisor
Accuracy/BiasContamination
No target compound>QL
LCS 1 per 10 samples
95-105%R or withinthe manufacturer’scontrol limits if >95-105%R
Reanalyze affectedsamples. Qualify dataas needed.
Analyst/SectionSupervisor Accuracy/Bias
95-105%R or withinthe manufacturer’scontrol limits if >95-105%R
LFB 1 per 10 samples 85-115%RReanalyze affectedsamples. Qualify dataas needed.
Analyst/SectionSupervisor Accuracy/Bias 85-115%R
Laboratory Duplicate 1 per 10 samples RPD 20% if bothsamples >10x QL
Reanalyze affectedsamples. Qualify dataas needed.
Analyst/SectionSupervisor Precision RPD 20% if both
samples >10x QL
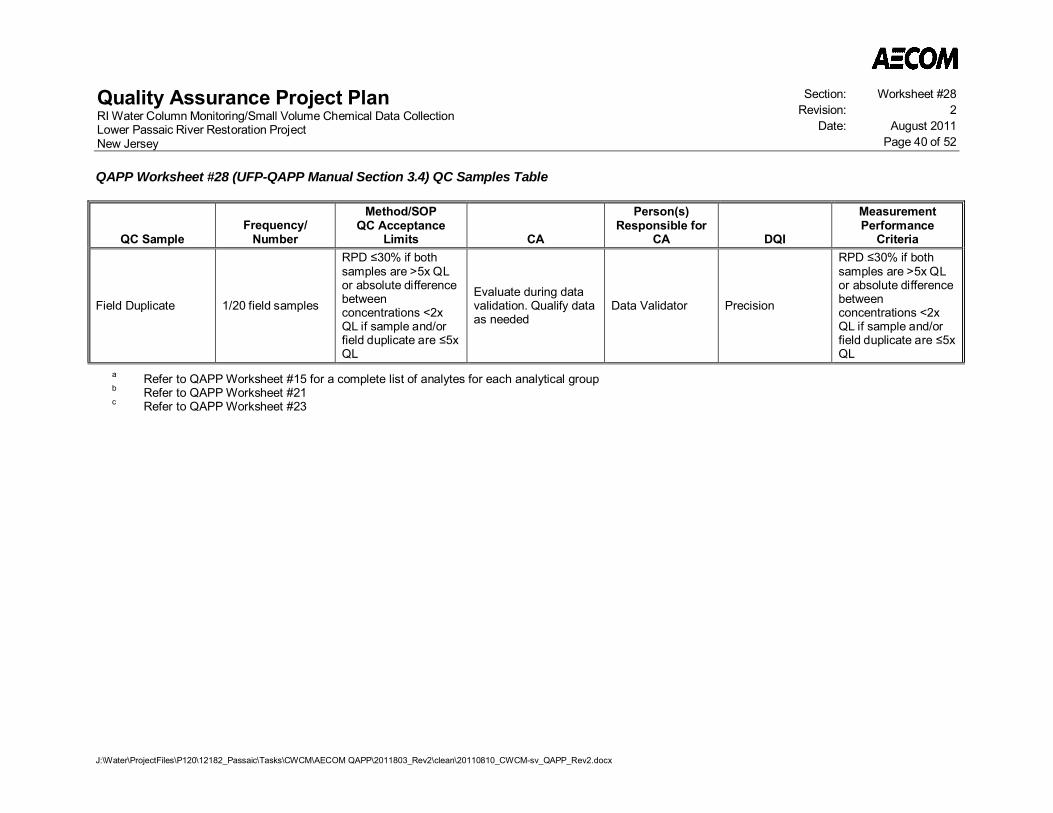
Quality Assurance Project PlanRI Water Column Monitoring/Small Volume Chemical Data CollectionLower Passaic River Restoration ProjectNew Jersey
Section: Worksheet #28Revision: 2
Date: August 2011Page 40 of 52
QAPP Worksheet #28 (UFP-QAPP Manual Section 3.4) QC Samples Table
J:\Water\ProjectFiles\P120\12182_Passaic\Tasks\CWCM\AECOM QAPP\2011803_Rev2\clean\20110810_CWCM-sv_QAPP_Rev2.docx
QC SampleFrequency/
Number
Method/SOPQC Acceptance
Limits CA
Person(s)Responsible for
CA DQI
MeasurementPerformance
Criteria
Field Duplicate 1/20 field samples
RPD 30% if bothsamples are >5x QLor absolute differencebetweenconcentrations <2xQL if sample and/orfield duplicate are 5xQL
Evaluate during datavalidation. Qualify dataas needed
Data Validator Precision
RPD 30% if bothsamples are >5x QLor absolute differencebetweenconcentrations <2xQL if sample and/orfield duplicate are 5xQL
a Refer to QAPP Worksheet #15 for a complete list of analytes for each analytical groupb Refer to QAPP Worksheet #21c Refer to QAPP Worksheet #23
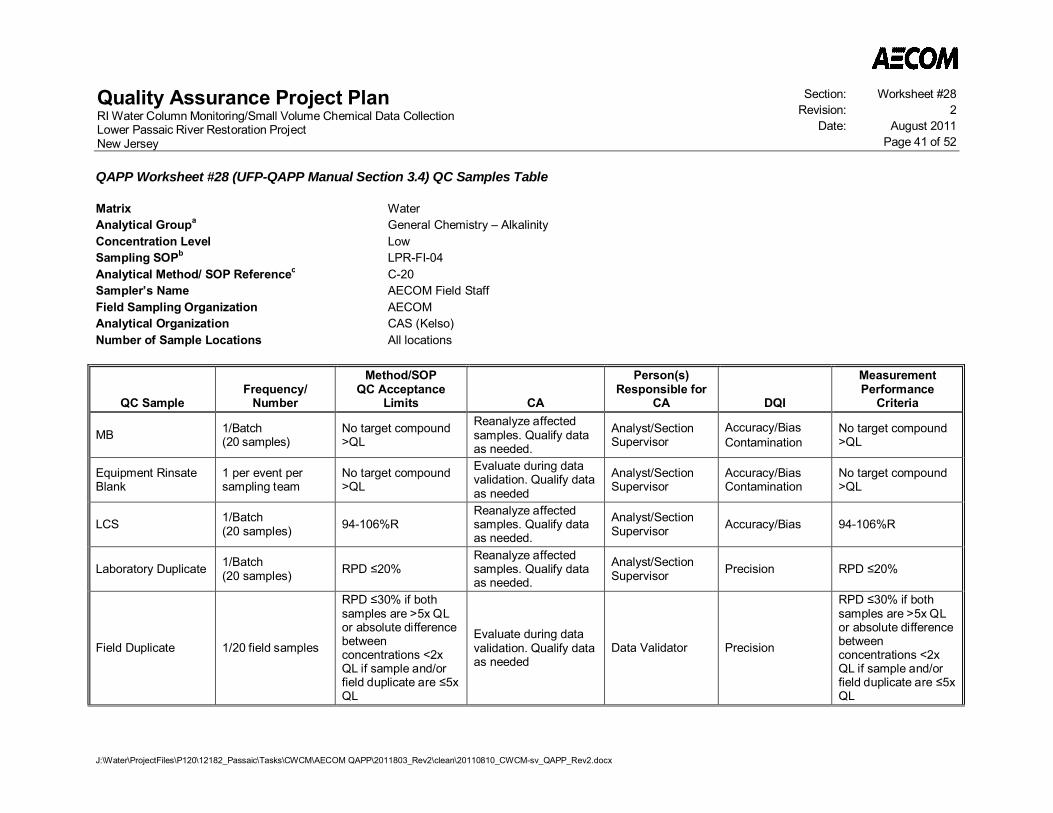
Quality Assurance Project PlanRI Water Column Monitoring/Small Volume Chemical Data CollectionLower Passaic River Restoration ProjectNew Jersey
Section: Worksheet #28Revision: 2
Date: August 2011Page 41 of 52
QAPP Worksheet #28 (UFP-QAPP Manual Section 3.4) QC Samples Table
J:\Water\ProjectFiles\P120\12182_Passaic\Tasks\CWCM\AECOM QAPP\2011803_Rev2\clean\20110810_CWCM-sv_QAPP_Rev2.docx
Matrix WaterAnalytical Groupa General Chemistry – AlkalinityConcentration Level LowSampling SOPb LPR-FI-04Analytical Method/ SOP Referencec C-20Sampler’s Name AECOM Field StaffField Sampling Organization AECOMAnalytical Organization CAS (Kelso)Number of Sample Locations All locations
QC SampleFrequency/
Number
Method/SOPQC Acceptance
Limits CA
Person(s)Responsible for
CA DQI
MeasurementPerformance
Criteria
MB 1/Batch(20 samples)
No target compound>QL
Reanalyze affectedsamples. Qualify dataas needed.
Analyst/SectionSupervisor
Accuracy/BiasContamination
No target compound>QL
Equipment RinsateBlank
1 per event persampling team
No target compound>QL
Evaluate during datavalidation. Qualify dataas needed
Analyst/SectionSupervisor
Accuracy/BiasContamination
No target compound>QL
LCS 1/Batch(20 samples) 94-106%R
Reanalyze affectedsamples. Qualify dataas needed.
Analyst/SectionSupervisor Accuracy/Bias 94-106%R
Laboratory Duplicate 1/Batch(20 samples) RPD 20%
Reanalyze affectedsamples. Qualify dataas needed.
Analyst/SectionSupervisor Precision RPD 20%
Field Duplicate 1/20 field samples
RPD 30% if bothsamples are >5x QLor absolute differencebetweenconcentrations <2xQL if sample and/orfield duplicate are 5xQL
Evaluate during datavalidation. Qualify dataas needed
Data Validator Precision
RPD 30% if bothsamples are >5x QLor absolute differencebetweenconcentrations <2xQL if sample and/orfield duplicate are 5xQL
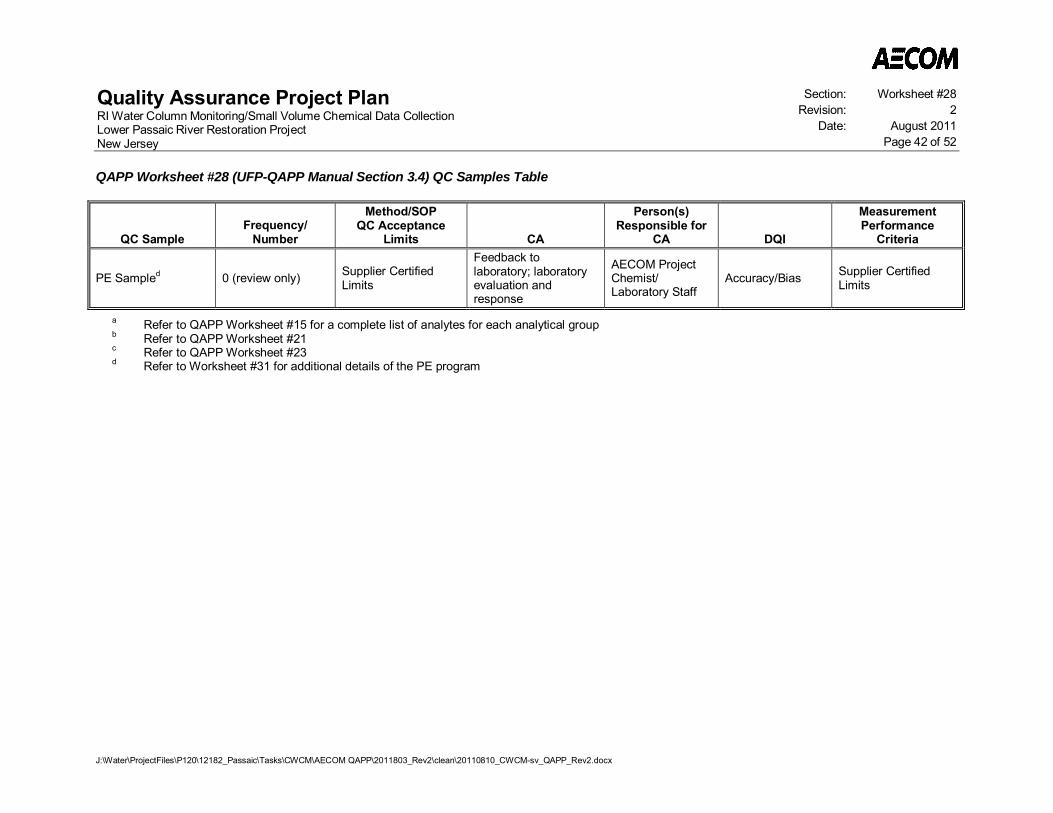
Quality Assurance Project PlanRI Water Column Monitoring/Small Volume Chemical Data CollectionLower Passaic River Restoration ProjectNew Jersey
Section: Worksheet #28Revision: 2
Date: August 2011Page 42 of 52
QAPP Worksheet #28 (UFP-QAPP Manual Section 3.4) QC Samples Table
J:\Water\ProjectFiles\P120\12182_Passaic\Tasks\CWCM\AECOM QAPP\2011803_Rev2\clean\20110810_CWCM-sv_QAPP_Rev2.docx
QC SampleFrequency/
Number
Method/SOPQC Acceptance
Limits CA
Person(s)Responsible for
CA DQI
MeasurementPerformance
Criteria
PE Sampled 0 (review only) Supplier CertifiedLimits
Feedback tolaboratory; laboratoryevaluation andresponse
AECOM ProjectChemist/Laboratory Staff
Accuracy/Bias Supplier CertifiedLimits
a Refer to QAPP Worksheet #15 for a complete list of analytes for each analytical groupb Refer to QAPP Worksheet #21c Refer to QAPP Worksheet #23d Refer to Worksheet #31 for additional details of the PE program
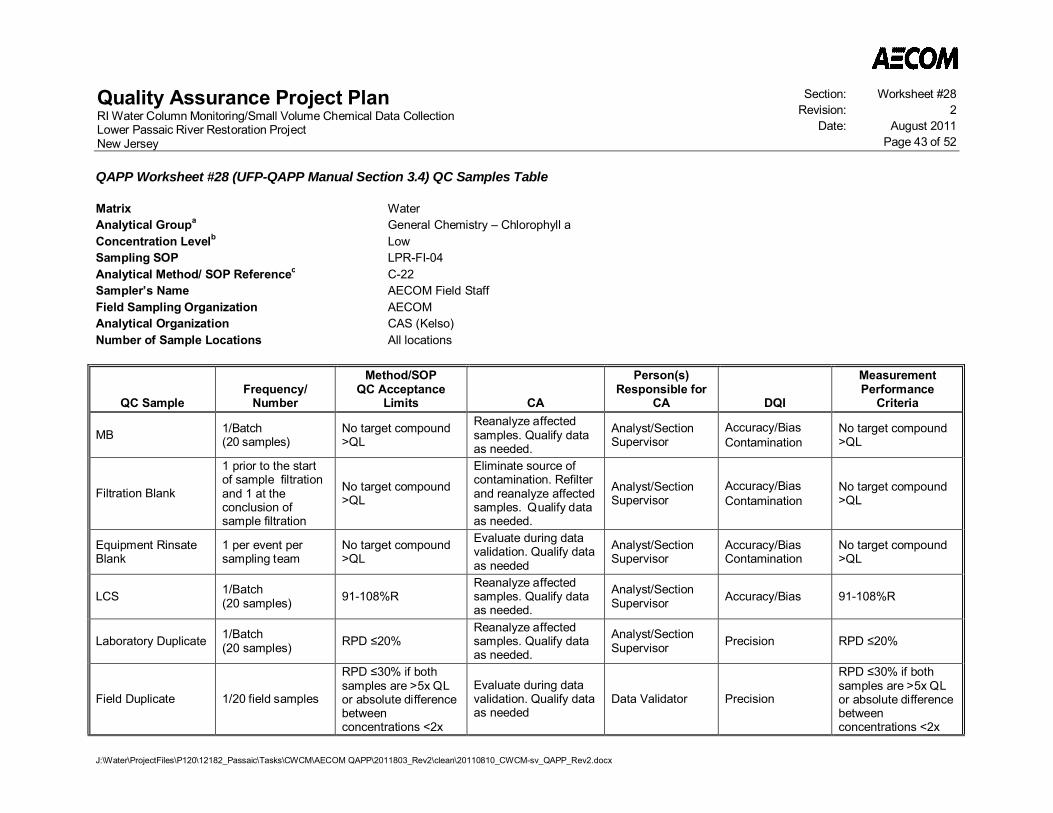
Quality Assurance Project PlanRI Water Column Monitoring/Small Volume Chemical Data CollectionLower Passaic River Restoration ProjectNew Jersey
Section: Worksheet #28Revision: 2
Date: August 2011Page 43 of 52
QAPP Worksheet #28 (UFP-QAPP Manual Section 3.4) QC Samples Table
J:\Water\ProjectFiles\P120\12182_Passaic\Tasks\CWCM\AECOM QAPP\2011803_Rev2\clean\20110810_CWCM-sv_QAPP_Rev2.docx
Matrix WaterAnalytical Groupa General Chemistry – Chlorophyll aConcentration Levelb LowSampling SOP LPR-FI-04Analytical Method/ SOP Referencec C-22Sampler’s Name AECOM Field StaffField Sampling Organization AECOMAnalytical Organization CAS (Kelso)Number of Sample Locations All locations
QC SampleFrequency/
Number
Method/SOPQC Acceptance
Limits CA
Person(s)Responsible for
CA DQI
MeasurementPerformance
Criteria
MB 1/Batch(20 samples)
No target compound>QL
Reanalyze affectedsamples. Qualify dataas needed.
Analyst/SectionSupervisor
Accuracy/BiasContamination
No target compound>QL
Filtration Blank
1 prior to the startof sample filtrationand 1 at theconclusion ofsample filtration
No target compound>QL
Eliminate source ofcontamination. Refilterand reanalyze affectedsamples. Qualify dataas needed.
Analyst/SectionSupervisor
Accuracy/BiasContamination
No target compound>QL
Equipment RinsateBlank
1 per event persampling team
No target compound>QL
Evaluate during datavalidation. Qualify dataas needed
Analyst/SectionSupervisor
Accuracy/BiasContamination
No target compound>QL
LCS 1/Batch(20 samples) 91-108%R
Reanalyze affectedsamples. Qualify dataas needed.
Analyst/SectionSupervisor Accuracy/Bias 91-108%R
Laboratory Duplicate 1/Batch(20 samples) RPD 20%
Reanalyze affectedsamples. Qualify dataas needed.
Analyst/SectionSupervisor Precision RPD 20%
Field Duplicate 1/20 field samples
RPD 30% if bothsamples are >5x QLor absolute differencebetweenconcentrations <2x
Evaluate during datavalidation. Qualify dataas needed
Data Validator Precision
RPD 30% if bothsamples are >5x QLor absolute differencebetweenconcentrations <2x
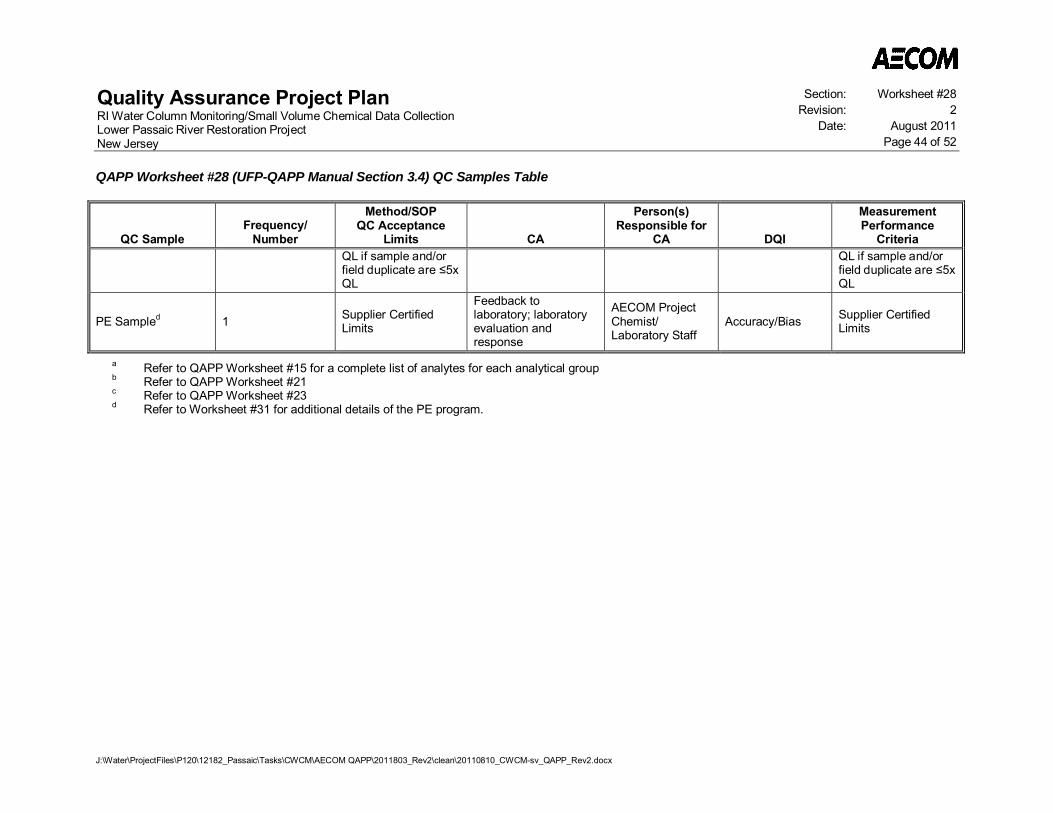
Quality Assurance Project PlanRI Water Column Monitoring/Small Volume Chemical Data CollectionLower Passaic River Restoration ProjectNew Jersey
Section: Worksheet #28Revision: 2
Date: August 2011Page 44 of 52
QAPP Worksheet #28 (UFP-QAPP Manual Section 3.4) QC Samples Table
J:\Water\ProjectFiles\P120\12182_Passaic\Tasks\CWCM\AECOM QAPP\2011803_Rev2\clean\20110810_CWCM-sv_QAPP_Rev2.docx
QC SampleFrequency/
Number
Method/SOPQC Acceptance
Limits CA
Person(s)Responsible for
CA DQI
MeasurementPerformance
CriteriaQL if sample and/orfield duplicate are 5xQL
QL if sample and/orfield duplicate are 5xQL
PE Sampled 1 Supplier CertifiedLimits
Feedback tolaboratory; laboratoryevaluation andresponse
AECOM ProjectChemist/Laboratory Staff
Accuracy/Bias Supplier CertifiedLimits
a Refer to QAPP Worksheet #15 for a complete list of analytes for each analytical groupb Refer to QAPP Worksheet #21c Refer to QAPP Worksheet #23d Refer to Worksheet #31 for additional details of the PE program.
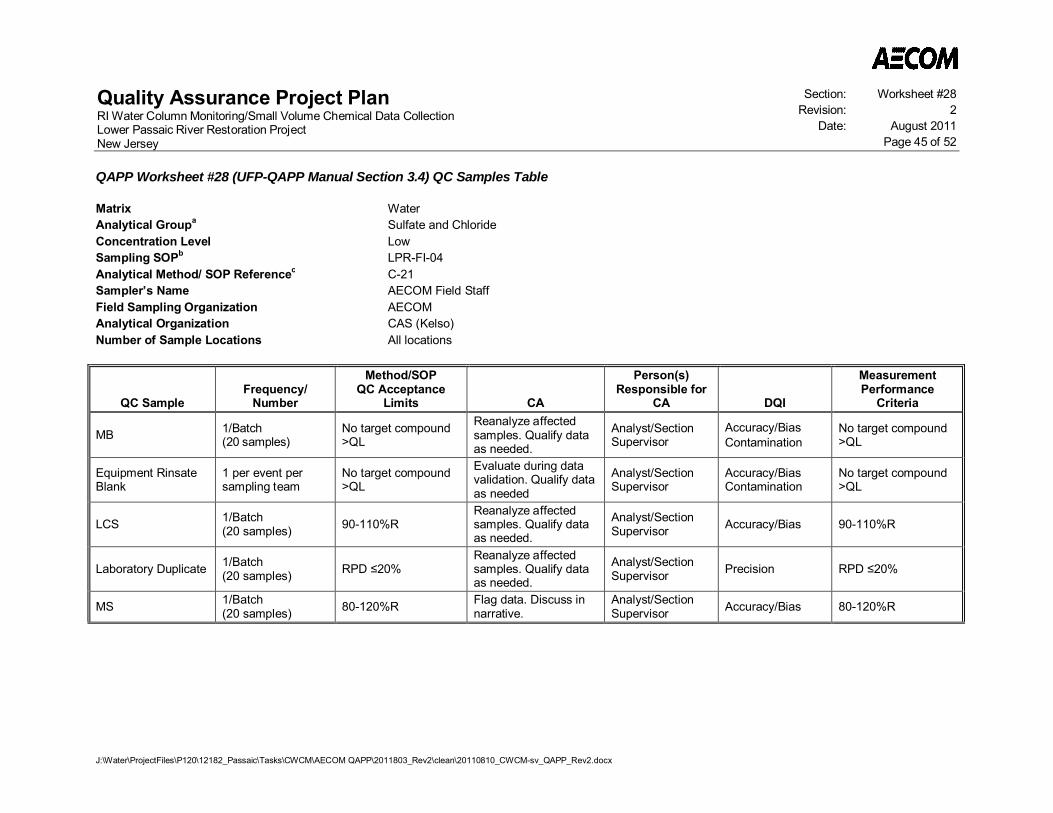
Quality Assurance Project PlanRI Water Column Monitoring/Small Volume Chemical Data CollectionLower Passaic River Restoration ProjectNew Jersey
Section: Worksheet #28Revision: 2
Date: August 2011Page 45 of 52
QAPP Worksheet #28 (UFP-QAPP Manual Section 3.4) QC Samples Table
J:\Water\ProjectFiles\P120\12182_Passaic\Tasks\CWCM\AECOM QAPP\2011803_Rev2\clean\20110810_CWCM-sv_QAPP_Rev2.docx
Matrix WaterAnalytical Groupa Sulfate and ChlorideConcentration Level LowSampling SOPb LPR-FI-04Analytical Method/ SOP Referencec C-21Sampler’s Name AECOM Field StaffField Sampling Organization AECOMAnalytical Organization CAS (Kelso)Number of Sample Locations All locations
QC SampleFrequency/
Number
Method/SOPQC Acceptance
Limits CA
Person(s)Responsible for
CA DQI
MeasurementPerformance
Criteria
MB 1/Batch(20 samples)
No target compound>QL
Reanalyze affectedsamples. Qualify dataas needed.
Analyst/SectionSupervisor
Accuracy/BiasContamination
No target compound>QL
Equipment RinsateBlank
1 per event persampling team
No target compound>QL
Evaluate during datavalidation. Qualify dataas needed
Analyst/SectionSupervisor
Accuracy/BiasContamination
No target compound>QL
LCS 1/Batch(20 samples) 90-110%R
Reanalyze affectedsamples. Qualify dataas needed.
Analyst/SectionSupervisor Accuracy/Bias 90-110%R
Laboratory Duplicate 1/Batch(20 samples) RPD 20%
Reanalyze affectedsamples. Qualify dataas needed.
Analyst/SectionSupervisor Precision RPD 20%
MS 1/Batch(20 samples) 80-120%R Flag data. Discuss in
narrative.Analyst/SectionSupervisor Accuracy/Bias 80-120%R

Quality Assurance Project PlanRI Water Column Monitoring/Small Volume Chemical Data CollectionLower Passaic River Restoration ProjectNew Jersey
Section: Worksheet #28Revision: 2
Date: August 2011Page 46 of 52
QAPP Worksheet #28 (UFP-QAPP Manual Section 3.4) QC Samples Table
J:\Water\ProjectFiles\P120\12182_Passaic\Tasks\CWCM\AECOM QAPP\2011803_Rev2\clean\20110810_CWCM-sv_QAPP_Rev2.docx
QC SampleFrequency/
Number
Method/SOPQC Acceptance
Limits CA
Person(s)Responsible for
CA DQI
MeasurementPerformance
Criteria
Field Duplicate 1/20 field samples
RPD 30% if bothsamples are >5x QLor absolute differencebetweenconcentrations <2xQL if sample and/orfield duplicate are 5xQL
Evaluate during datavalidation. Qualify dataas needed
Data Validator Precision
RPD 30% if bothsamples are >5x QLor absolute differencebetweenconcentrations <2xQL if sample and/orfield duplicate are 5xQL
PE Sampled 0 (review only) Supplier CertifiedLimits
Feedback tolaboratory; laboratoryevaluation andresponse
AECOM ProjectChemist/Laboratory Staff
Accuracy/Bias Supplier CertifiedLimits
a Refer to QAPP Worksheet #15 for a complete list of analytes for each analytical groupb Refer to QAPP Worksheet #21c Refer to QAPP Worksheet #23d Refer to Worksheet #31 for additional details of the PE program

Quality Assurance Project PlanRI Water Column Monitoring/Small Volume Chemical Data CollectionLower Passaic River Restoration ProjectNew Jersey
Section: Worksheet #28Revision: 2
Date: August 2011Page 47 of 52
QAPP Worksheet #28 (UFP-QAPP Manual Section 3.4) QC Samples Table
J:\Water\ProjectFiles\P120\12182_Passaic\Tasks\CWCM\AECOM QAPP\2011803_Rev2\clean\20110810_CWCM-sv_QAPP_Rev2.docx
Matrix WaterAnalytical Groupa General Chemistry – TDSConcentration Level LowSampling SOPb LPR-FI-04Analytical Method/ SOP Referencec C-19Sampler’s Name AECOM Field StaffField Sampling Organization AECOMAnalytical Organization CAS (Kelso)Number of Sample Locations All locations
QC SampleFrequency/
Number
Method/SOPQC Acceptance
Limits CA
Person(s)Responsible for
CA DQI
MeasurementPerformance
Criteria
MB 1/Batch(20 samples)
No target compound>QL
Reanalyze affectedsamples. Qualify dataas needed.
Analyst/SectionSupervisor
Accuracy/BiasContamination
No target compound>QL
Equipment RinsateBlank
1 per event persampling team
No target compound>QL
Evaluate during datavalidation. Qualify dataas needed
Analyst/SectionSupervisor
Accuracy/BiasContamination
No target compound>QL
LCS 1/Batch(20 samples) 85-115%R
Reanalyze affectedsamples. Qualify dataas needed.
Analyst/SectionSupervisor Accuracy/Bias 85-115%R
Laboratory Duplicate 1/Batch(20 samples) RPD <10%
Reanalyze affectedsamples. Qualify dataas needed.
Analyst/SectionSupervisor Precision RPD <10%
Field Duplicate 1/20 field samples
RPD 30% if bothsamples are >5x QLor absolute differencebetweenconcentrations <2xQL if sample and/orfield duplicate are 5xQL
Evaluate during datavalidation. Qualify dataas needed
Data Validator Precision
RPD 30% if bothsamples are >5x QLor absolute differencebetweenconcentrations <2xQL if sample and/orfield duplicate are 5xQL

Quality Assurance Project PlanRI Water Column Monitoring/Small Volume Chemical Data CollectionLower Passaic River Restoration ProjectNew Jersey
Section: Worksheet #28Revision: 2
Date: August 2011Page 48 of 52
QAPP Worksheet #28 (UFP-QAPP Manual Section 3.4) QC Samples Table
J:\Water\ProjectFiles\P120\12182_Passaic\Tasks\CWCM\AECOM QAPP\2011803_Rev2\clean\20110810_CWCM-sv_QAPP_Rev2.docx
QC SampleFrequency/
Number
Method/SOPQC Acceptance
Limits CA
Person(s)Responsible for
CA DQI
MeasurementPerformance
Criteria
PE Sampled 0 (review only) Supplier CertifiedLimits
Feedback tolaboratory; laboratoryevaluation andresponse
AECOM ProjectChemist/Laboratory Staff
Accuracy/Bias Supplier CertifiedLimits
a Refer to QAPP Worksheet #15 for a complete list of analytes for each analytical groupb Refer to QAPP Worksheet #21c Refer to QAPP Worksheet #23d Refer to Worksheet #31 for additional details of the PE program
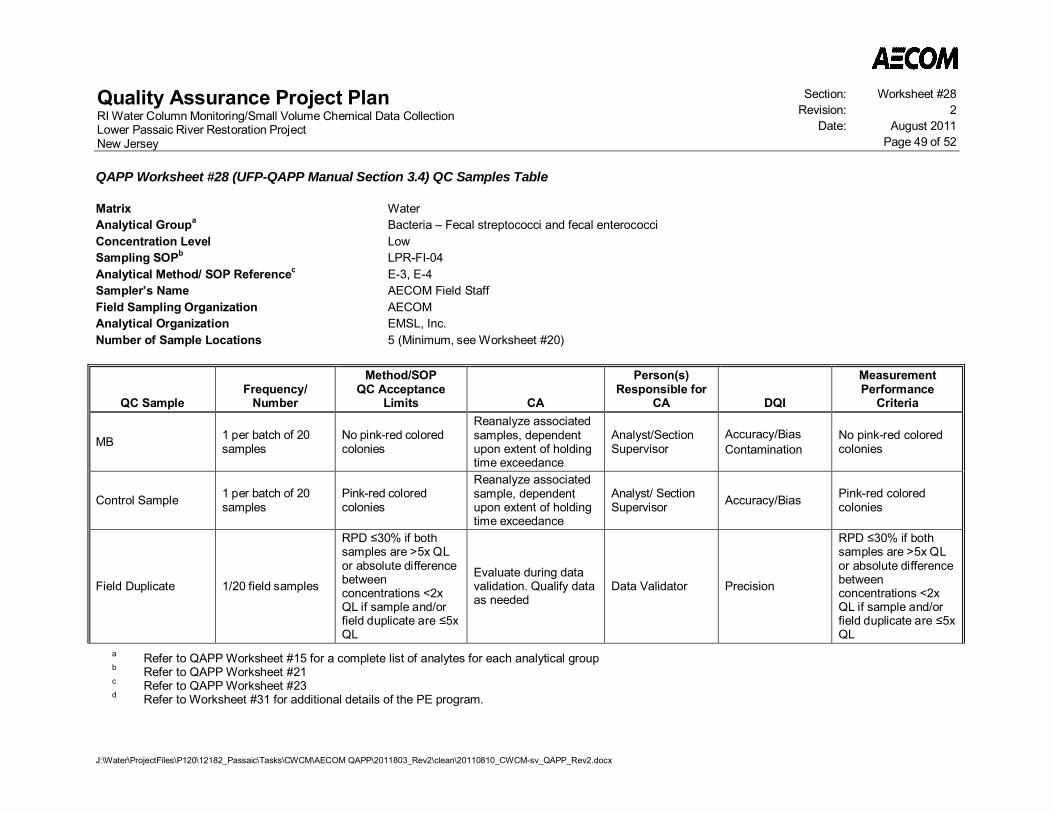
Quality Assurance Project PlanRI Water Column Monitoring/Small Volume Chemical Data CollectionLower Passaic River Restoration ProjectNew Jersey
Section: Worksheet #28Revision: 2
Date: August 2011Page 49 of 52
QAPP Worksheet #28 (UFP-QAPP Manual Section 3.4) QC Samples Table
J:\Water\ProjectFiles\P120\12182_Passaic\Tasks\CWCM\AECOM QAPP\2011803_Rev2\clean\20110810_CWCM-sv_QAPP_Rev2.docx
Matrix WaterAnalytical Groupa Bacteria – Fecal streptococci and fecal enterococciConcentration Level LowSampling SOPb LPR-FI-04Analytical Method/ SOP Referencec E-3, E-4Sampler’s Name AECOM Field StaffField Sampling Organization AECOMAnalytical Organization EMSL, Inc.Number of Sample Locations 5 (Minimum, see Worksheet #20)
QC SampleFrequency/
Number
Method/SOPQC Acceptance
Limits CA
Person(s)Responsible for
CA DQI
MeasurementPerformance
Criteria
MB 1 per batch of 20samples
No pink-red coloredcolonies
Reanalyze associatedsamples, dependentupon extent of holdingtime exceedance
Analyst/SectionSupervisor
Accuracy/BiasContamination
No pink-red coloredcolonies
Control Sample 1 per batch of 20samples
Pink-red coloredcolonies
Reanalyze associatedsample, dependentupon extent of holdingtime exceedance
Analyst/ SectionSupervisor Accuracy/Bias Pink-red colored
colonies
Field Duplicate 1/20 field samples
RPD 30% if bothsamples are >5x QLor absolute differencebetweenconcentrations <2xQL if sample and/orfield duplicate are 5xQL
Evaluate during datavalidation. Qualify dataas needed
Data Validator Precision
RPD 30% if bothsamples are >5x QLor absolute differencebetweenconcentrations <2xQL if sample and/orfield duplicate are 5xQL
a Refer to QAPP Worksheet #15 for a complete list of analytes for each analytical groupb Refer to QAPP Worksheet #21c Refer to QAPP Worksheet #23d Refer to Worksheet #31 for additional details of the PE program.

Quality Assurance Project PlanRI Water Column Monitoring/Small Volume Chemical Data CollectionLower Passaic River Restoration ProjectNew Jersey
Section: Worksheet #28Revision: 2
Date: August 2011Page 50 of 52
QAPP Worksheet #28 (UFP-QAPP Manual Section 3.4) QC Samples Table
J:\Water\ProjectFiles\P120\12182_Passaic\Tasks\CWCM\AECOM QAPP\2011803_Rev2\clean\20110810_CWCM-sv_QAPP_Rev2.docx
Matrix WaterAnalytical Groupa Bacteria –Total coliform and E. coliConcentration Level LowSampling SOPb LPR-FI-04Analytical Method/ SOP Referencec E-1Sampler’s Name AECOM Field StaffField Sampling Organization AECOMAnalytical Organization EMSL, Inc.Number of Sample Locations 5 (Minimum, see Worksheet #20)
QC SampleFrequency/
Number
Method/SOPQC Acceptance
Limits CA
Person(s)Responsible for
CA DQI
MeasurementPerformance
Criteria
MB 1 per batch of 20samples
No color, nofluorescence
Reanalyze associatedsamples, dependentupon extent of holdingtime exceedance
Analyst/SectionSupervisor
Accuracy/BiasContamination
No color, nofluorescence
Control Sample 1 per batch of 20samples
Yellow color (coliform)with fluorescence(E.coli)
Reanalyze associatedsample, dependentupon extent of holdingtime exceedance
Analyst/ SectionSupervisor Accuracy/Bias
Yellow color (coliform)with fluorescence(E.coli)
Field Duplicate 1/20 field samples
RPD 30% if bothsamples are >5x QLor absolute differencebetweenconcentrations <2xQL if sample and/orfield duplicate are 5xQL
Evaluate during datavalidation. Qualify dataas needed
Data Validator Precision
RPD 30% if bothsamples are >5x QLor absolute differencebetweenconcentrations <2xQL if sample and/orfield duplicate are 5xQL
a Refer to QAPP Worksheet #15 for a complete list of analytes for each analytical groupb Refer to QAPP Worksheet #21c Refer to QAPP Worksheet #23d Refer to Worksheet #31 for additional details of the PE program.
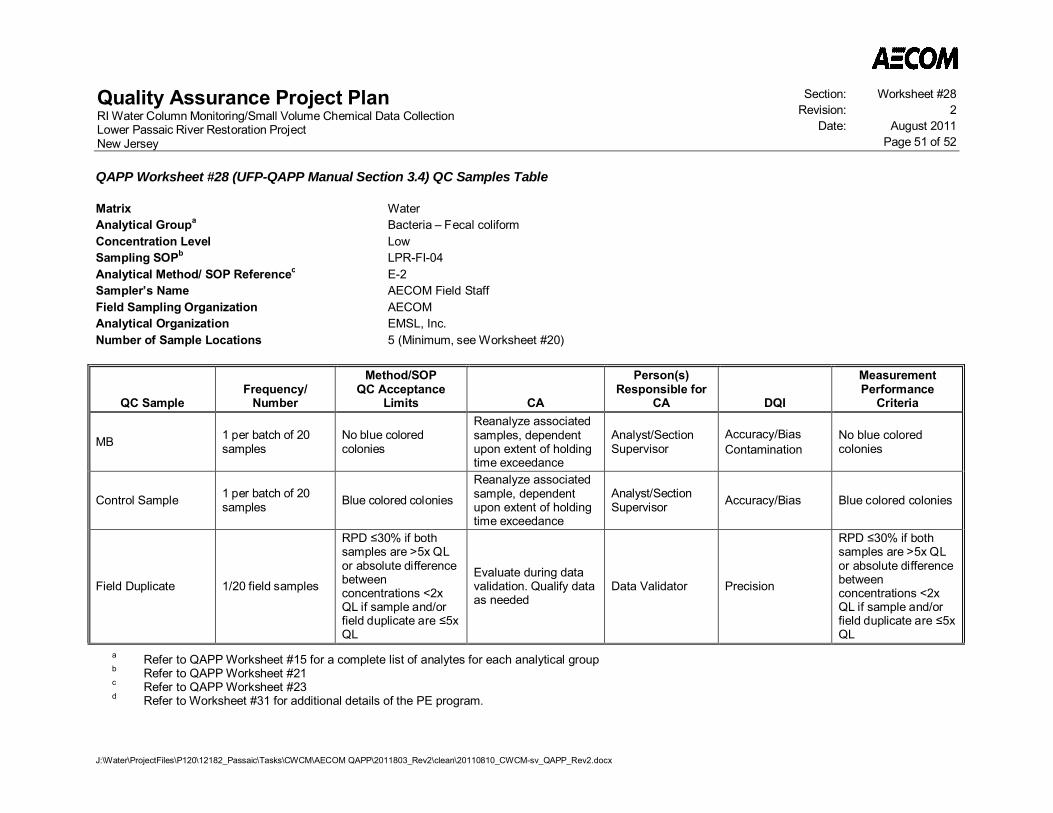
Quality Assurance Project PlanRI Water Column Monitoring/Small Volume Chemical Data CollectionLower Passaic River Restoration ProjectNew Jersey
Section: Worksheet #28Revision: 2
Date: August 2011Page 51 of 52
QAPP Worksheet #28 (UFP-QAPP Manual Section 3.4) QC Samples Table
J:\Water\ProjectFiles\P120\12182_Passaic\Tasks\CWCM\AECOM QAPP\2011803_Rev2\clean\20110810_CWCM-sv_QAPP_Rev2.docx
Matrix WaterAnalytical Groupa Bacteria – Fecal coliformConcentration Level LowSampling SOPb LPR-FI-04Analytical Method/ SOP Referencec E-2Sampler’s Name AECOM Field StaffField Sampling Organization AECOMAnalytical Organization EMSL, Inc.Number of Sample Locations 5 (Minimum, see Worksheet #20)
QC SampleFrequency/
Number
Method/SOPQC Acceptance
Limits CA
Person(s)Responsible for
CA DQI
MeasurementPerformance
Criteria
MB 1 per batch of 20samples
No blue coloredcolonies
Reanalyze associatedsamples, dependentupon extent of holdingtime exceedance
Analyst/SectionSupervisor
Accuracy/BiasContamination
No blue coloredcolonies
Control Sample 1 per batch of 20samples Blue colored colonies
Reanalyze associatedsample, dependentupon extent of holdingtime exceedance
Analyst/SectionSupervisor Accuracy/Bias Blue colored colonies
Field Duplicate 1/20 field samples
RPD 30% if bothsamples are >5x QLor absolute differencebetweenconcentrations <2xQL if sample and/orfield duplicate are 5xQL
Evaluate during datavalidation. Qualify dataas needed
Data Validator Precision
RPD 30% if bothsamples are >5x QLor absolute differencebetweenconcentrations <2xQL if sample and/orfield duplicate are 5xQL
a Refer to QAPP Worksheet #15 for a complete list of analytes for each analytical groupb Refer to QAPP Worksheet #21c Refer to QAPP Worksheet #23d Refer to Worksheet #31 for additional details of the PE program.
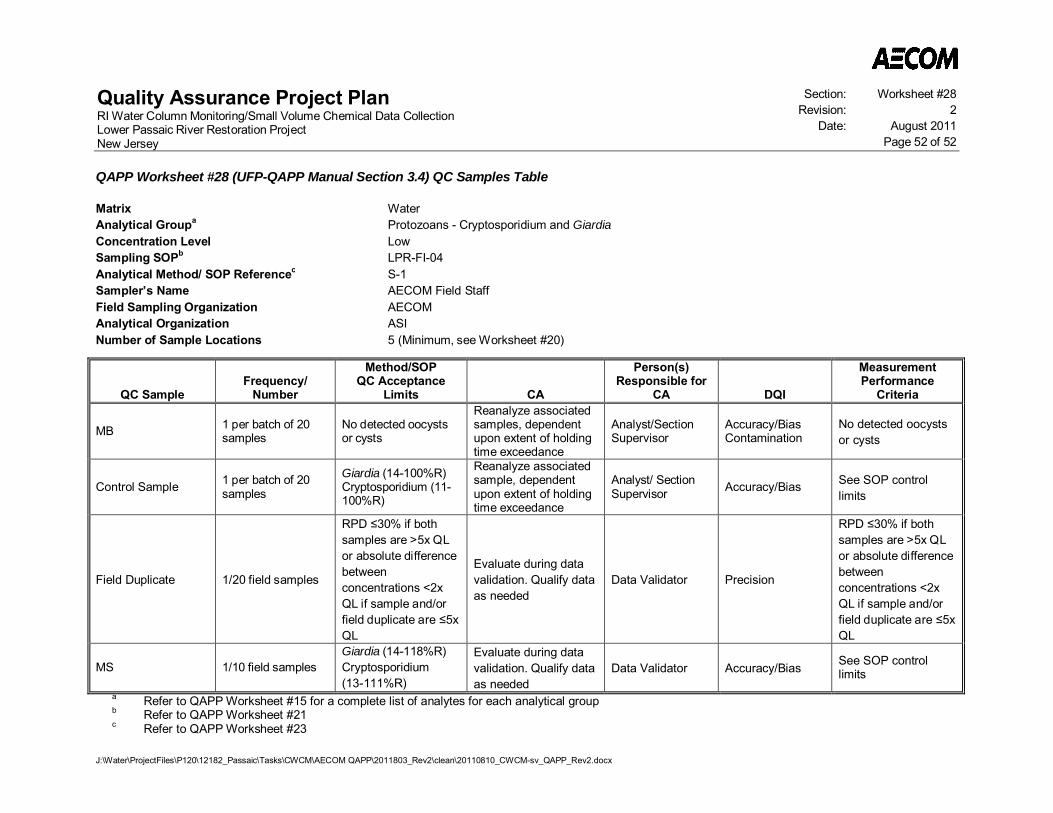
Quality Assurance Project PlanRI Water Column Monitoring/Small Volume Chemical Data CollectionLower Passaic River Restoration ProjectNew Jersey
Section: Worksheet #28Revision: 2
Date: August 2011Page 52 of 52
QAPP Worksheet #28 (UFP-QAPP Manual Section 3.4) QC Samples Table
J:\Water\ProjectFiles\P120\12182_Passaic\Tasks\CWCM\AECOM QAPP\2011803_Rev2\clean\20110810_CWCM-sv_QAPP_Rev2.docx
Matrix WaterAnalytical Groupa Protozoans - Cryptosporidium and GiardiaConcentration Level LowSampling SOPb LPR-FI-04Analytical Method/ SOP Referencec S-1Sampler’s Name AECOM Field StaffField Sampling Organization AECOMAnalytical Organization ASINumber of Sample Locations 5 (Minimum, see Worksheet #20)
QC SampleFrequency/
Number
Method/SOPQC Acceptance
Limits CA
Person(s)Responsible for
CA DQI
MeasurementPerformance
Criteria
MB 1 per batch of 20samples
No detected oocystsor cysts
Reanalyze associatedsamples, dependentupon extent of holdingtime exceedance
Analyst/SectionSupervisor
Accuracy/BiasContamination
No detected oocystsor cysts
Control Sample 1 per batch of 20samples
Giardia (14-100%R)Cryptosporidium (11-100%R)
Reanalyze associatedsample, dependentupon extent of holdingtime exceedance
Analyst/ SectionSupervisor Accuracy/Bias See SOP control
limits
Field Duplicate 1/20 field samples
RPD 30% if bothsamples are >5x QLor absolute differencebetweenconcentrations <2xQL if sample and/orfield duplicate are 5xQL
Evaluate during datavalidation. Qualify dataas needed
Data Validator Precision
RPD 30% if bothsamples are >5x QLor absolute differencebetweenconcentrations <2xQL if sample and/orfield duplicate are 5xQL
MS 1/10 field samplesGiardia (14-118%R)Cryptosporidium(13-111%R)
Evaluate during datavalidation. Qualify dataas needed
Data Validator Accuracy/Bias See SOP controllimits
a Refer to QAPP Worksheet #15 for a complete list of analytes for each analytical groupb Refer to QAPP Worksheet #21c Refer to QAPP Worksheet #23
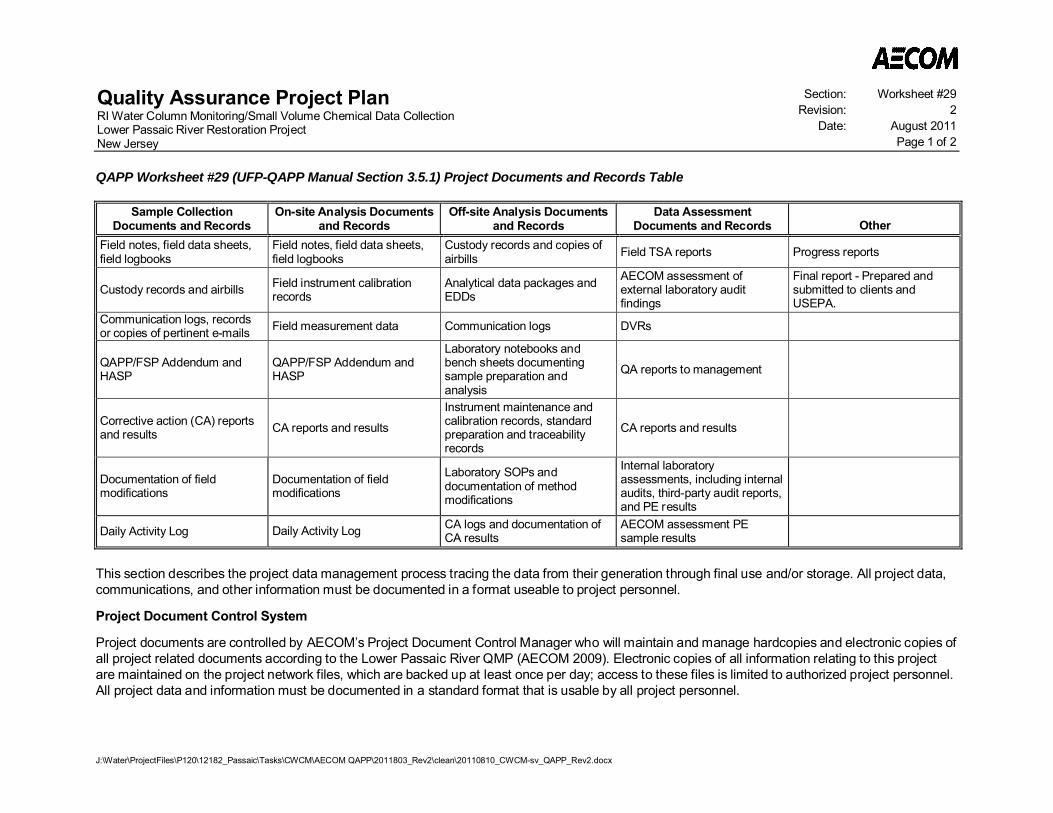
Quality Assurance Project PlanRI Water Column Monitoring/Small Volume Chemical Data CollectionLower Passaic River Restoration ProjectNew Jersey
Section: Worksheet #29Revision: 2
Date: August 2011Page 1 of 2
J:\Water\ProjectFiles\P120\12182_Passaic\Tasks\CWCM\AECOM QAPP\2011803_Rev2\clean\20110810_CWCM-sv_QAPP_Rev2.docx
QAPP Worksheet #29 (UFP-QAPP Manual Section 3.5.1) Project Documents and Records Table
Sample CollectionDocuments and Records
On-site Analysis Documentsand Records
Off-site Analysis Documentsand Records
Data AssessmentDocuments and Records Other
Field notes, field data sheets,field logbooks
Field notes, field data sheets,field logbooks
Custody records and copies ofairbills Field TSA reports Progress reports
Custody records and airbills Field instrument calibrationrecords
Analytical data packages andEDDs
AECOM assessment ofexternal laboratory auditfindings
Final report - Prepared andsubmitted to clients andUSEPA.
Communication logs, recordsor copies of pertinent e-mails Field measurement data Communication logs DVRs
QAPP/FSP Addendum andHASP
QAPP/FSP Addendum andHASP
Laboratory notebooks andbench sheets documentingsample preparation andanalysis
QA reports to management
Corrective action (CA) reportsand results CA reports and results
Instrument maintenance andcalibration records, standardpreparation and traceabilityrecords
CA reports and results
Documentation of fieldmodifications
Documentation of fieldmodifications
Laboratory SOPs anddocumentation of methodmodifications
Internal laboratoryassessments, including internalaudits, third-party audit reports,and PE results
Daily Activity Log Daily Activity Log CA logs and documentation ofCA results
AECOM assessment PEsample results
This section describes the project data management process tracing the data from their generation through final use and/or storage. All project data,communications, and other information must be documented in a format useable to project personnel.
Project Document Control System
Project documents are controlled by AECOM’s Project Document Control Manager who will maintain and manage hardcopies and electronic copies ofall project related documents according to the Lower Passaic River QMP (AECOM 2009). Electronic copies of all information relating to this projectare maintained on the project network files, which are backed up at least once per day; access to these files is limited to authorized project personnel.All project data and information must be documented in a standard format that is usable by all project personnel.
Quality Assurance Project PlanRI Water Column Monitoring/Small Volume Chemical Data CollectionLower Passaic River Restoration ProjectNew Jersey
Section: Worksheet #29Revision: 2
Date: August 2011Page 2 of 2
QAPP Worksheet #29 (UFP-QAPP Manual Section 3.5.1) Project Documents and Records Table
J:\Water\ProjectFiles\P120\12182_Passaic\Tasks\CWCM\AECOM QAPP\2011803_Rev2\clean\20110810_CWCM-sv_QAPP_Rev2.docx
Data Recording
Data generated during this project will be captured electronically or entered by hand into bound field or laboratory logbooks or preprinted forms (referto SOP LPR-G-01 in Appendix B). Computer generated laboratory data will be managed using the laboratory information management system(LIMS); the LIMS used by subcontracted laboratories are described in their QA documentation.
Data Quality Assurance Procedures
AECOM will monitor the progress of sample collection to verify that samples are collected as planned. The progress of sample collection andprocessing will be monitored through the documentation of samples collected and shipped each day. The participating laboratories must maintain aformal QMP to which they adhere and which addresses all data generating aspects of daily operations. A policy of continuous improvement will allowall data generation processes to be reviewed and modified as needed to meet project objectives. Periodic audits of field and laboratory operations willensure that data collection, documentation and QC procedures are being followed.
Laboratory Data Transmittal
Laboratory data are managed by the laboratory’s LIMS beginning with the sample receiving process. Laboratories are required to provide validateddata reports (sample results, QC summary information, and supporting raw data) including EDDs within the turnaround times specified in Worksheet#30. EDDs will be provided in an Earthsoft EQuIS® four-file format (modified by AECOM), using reference file tables provided by AECOM. All EDDswill be checked prior to transmittal to AECOM using current versions of Earthsoft’s Electronic Data Processor (EDP).
Data Storage and Retrieval
Completed forms, logbooks, photographs, data packages, and electronic files will be transmitted regularly to the AECOM Project Document ControlManager. Each laboratory will maintain copies of all documents it generates as well as backup files of all electronic data relating to the analysis ofsamples. Raw data and electronic files of all field samples, QC analyses and blanks must be archived from the date of generation and maintained byeach laboratory in accordance with the terms of the contract between AECOM and the laboratory. Project closeout will be conducted in accordancewith contractual guidance. As required by the Settlement Agreement all data and other project records will be made available to USEPA.
Data transfer to USEPA will include a Multimedia Electronic Data Deliverable (MEDD) that conforms to USEPA Region 2 MEDD format(http://www.epa.gov/region02/superfund/medd.htm). The MEDD will include all qualified and rejected data (including the reported, numerical value forrejected data per the request of USEPA). Laboratory data packages and DVRs will also be transmitted to USEPA monthly.

Quality Assurance Project PlanRI Water Column Monitoring/Small Volume Chemical Data CollectionLower Passaic River Restoration ProjectNew Jersey
Section: Worksheet #30Revision: 2
Date: August 2011Page 1 of 5
J:\Water\ProjectFiles\P120\12182_Passaic\Tasks\CWCM\AECOM QAPP\2011803_Rev2\clean\20110810_CWCM-sv_QAPP_Rev2.docx
QAPP Worksheet #30 (UFP-QAPP Manual Section 3.5.2.3) Analytical Services Table
MatrixAnalytical
GroupConcentration
Level
SampleLocations/ID Number
AnalyticalSOP
Data PackageTurnaround
TimeaLaboratory/
OrganizationBackup Laboratory/
Organization)b
Water VOCs Low All C-1 30 days
CAS1317 South 13th Ave.Kelso, WA 98626Ed Wallace360.577.7222
TestAmerica5815 Middlebrook PikeKnoxville, TN 37921John Reynolds865.291.3000
Water SVOCs Low All T-2 30 days
Test America301 Alpha DrivePittsburgh, PA 15238Chris Kovitch412.963.7058
CAS1317 South 13th Ave.Kelso, WA 98626Ed Wallace360.577.7222
Water PAHs –LRMS SIM Low All T-4 45 days
TestAmerica5815 Middlebrook PikeKnoxville, TN 37921John Reynolds865.291.3000
CAS1317 South 13th Ave.Kelso, WA 98626Ed Wallace360.577.7222
Water OC Pesticides Low All T-11 45 days
TestAmerica880 Riverside ParkwayWest Sacramento, CA95605David Alltucker916.374.4334
Vista Analytical Laboratory1104 WIndfield WayEl Dorado Hills, CA 95762Martha Maier916.673.1520
Water PCBs (Homologsand Congeners) Low All T-6 45 days
TestAmerica5815 Middlebrook PikeKnoxville, TN 37921John Reynolds865.291.3000
Analytical Perspectives2714 Exchange DriveWilmington, NC 28405Todd Vilen910-794-1613
Water PCDD/PCDFs Low All A-1 45 days
Analytical Perspectives2714 Exchange DriveWilmington, NC 28405Todd Vilen910-794-1613
TestAmerica880 Riverside ParkwayWest Sacramento, CA 95605David Alltucker916.374.4334
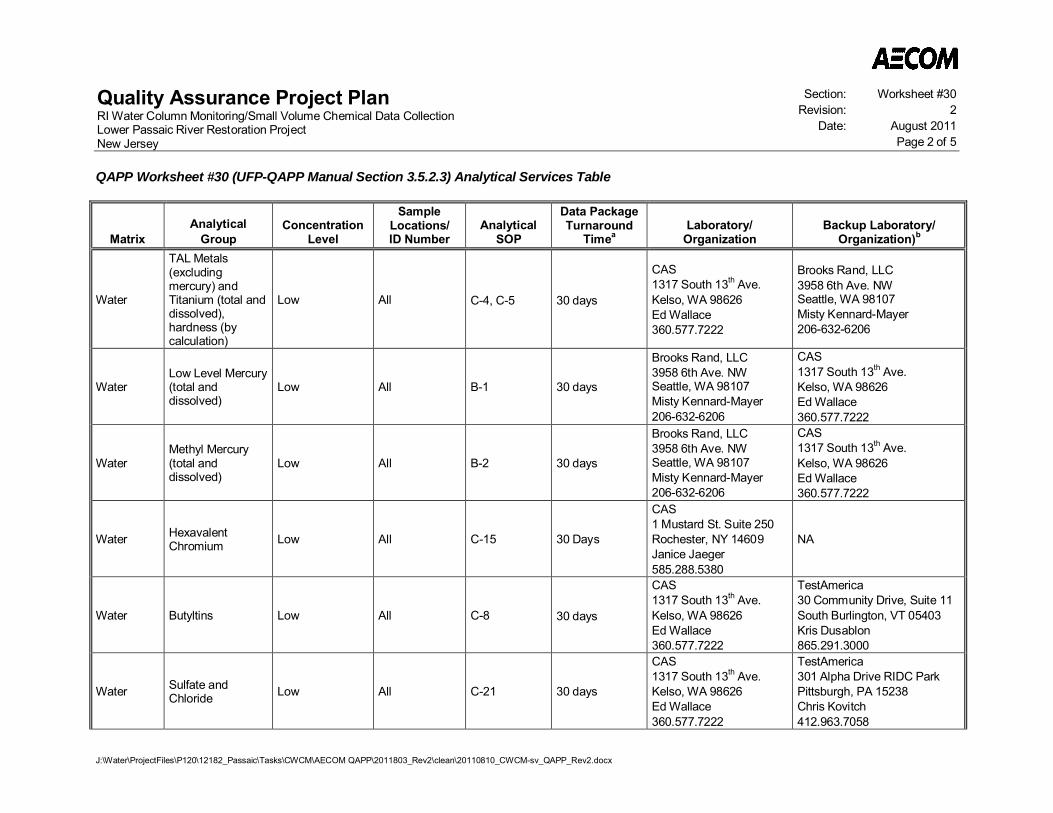
Quality Assurance Project PlanRI Water Column Monitoring/Small Volume Chemical Data CollectionLower Passaic River Restoration ProjectNew Jersey
Section: Worksheet #30Revision: 2
Date: August 2011Page 2 of 5
QAPP Worksheet #30 (UFP-QAPP Manual Section 3.5.2.3) Analytical Services Table
J:\Water\ProjectFiles\P120\12182_Passaic\Tasks\CWCM\AECOM QAPP\2011803_Rev2\clean\20110810_CWCM-sv_QAPP_Rev2.docx
MatrixAnalytical
GroupConcentration
Level
SampleLocations/ID Number
AnalyticalSOP
Data PackageTurnaround
TimeaLaboratory/
OrganizationBackup Laboratory/
Organization)b
Water
TAL Metals(excludingmercury) andTitanium (total anddissolved),hardness (bycalculation)
Low All C-4, C-5 30 days
CAS1317 South 13th Ave.Kelso, WA 98626Ed Wallace360.577.7222
Brooks Rand, LLC3958 6th Ave. NWSeattle, WA 98107Misty Kennard-Mayer206-632-6206
WaterLow Level Mercury(total anddissolved)
Low All B-1 30 days
Brooks Rand, LLC3958 6th Ave. NWSeattle, WA 98107Misty Kennard-Mayer206-632-6206
CAS1317 South 13th Ave.Kelso, WA 98626Ed Wallace360.577.7222
WaterMethyl Mercury(total anddissolved)
Low All B-2 30 days
Brooks Rand, LLC3958 6th Ave. NWSeattle, WA 98107Misty Kennard-Mayer206-632-6206
CAS1317 South 13th Ave.Kelso, WA 98626Ed Wallace360.577.7222
Water HexavalentChromium Low All C-15 30 Days
CAS1 Mustard St. Suite 250Rochester, NY 14609Janice Jaeger585.288.5380
NA
Water Butyltins Low All C-8 30 days
CAS1317 South 13th Ave.Kelso, WA 98626Ed Wallace360.577.7222
TestAmerica30 Community Drive, Suite 11South Burlington, VT 05403Kris Dusablon865.291.3000
Water Sulfate andChloride Low All C-21 30 days
CAS1317 South 13th Ave.Kelso, WA 98626Ed Wallace360.577.7222
TestAmerica301 Alpha Drive RIDC ParkPittsburgh, PA 15238Chris Kovitch412.963.7058
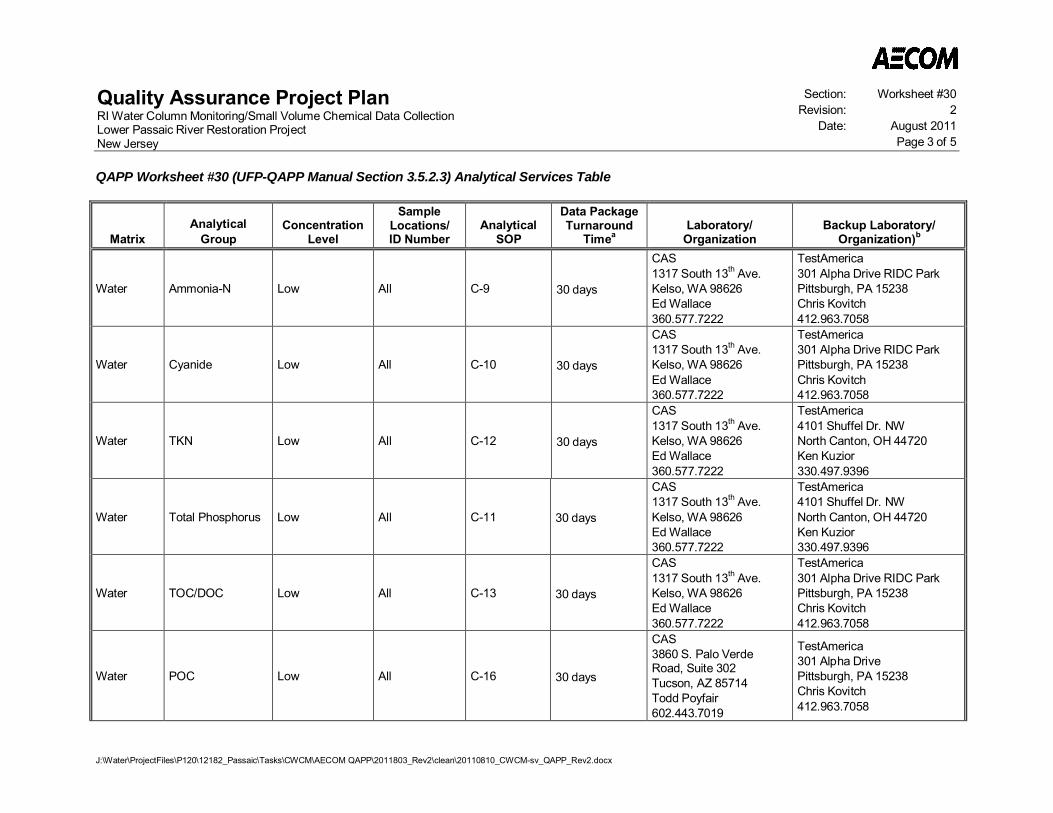
Quality Assurance Project PlanRI Water Column Monitoring/Small Volume Chemical Data CollectionLower Passaic River Restoration ProjectNew Jersey
Section: Worksheet #30Revision: 2
Date: August 2011Page 3 of 5
QAPP Worksheet #30 (UFP-QAPP Manual Section 3.5.2.3) Analytical Services Table
J:\Water\ProjectFiles\P120\12182_Passaic\Tasks\CWCM\AECOM QAPP\2011803_Rev2\clean\20110810_CWCM-sv_QAPP_Rev2.docx
MatrixAnalytical
GroupConcentration
Level
SampleLocations/ID Number
AnalyticalSOP
Data PackageTurnaround
TimeaLaboratory/
OrganizationBackup Laboratory/
Organization)b
Water Ammonia-N Low All C-9 30 days
CAS1317 South 13th Ave.Kelso, WA 98626Ed Wallace360.577.7222
TestAmerica301 Alpha Drive RIDC ParkPittsburgh, PA 15238Chris Kovitch412.963.7058
Water Cyanide Low All C-10 30 days
CAS1317 South 13th Ave.Kelso, WA 98626Ed Wallace360.577.7222
TestAmerica301 Alpha Drive RIDC ParkPittsburgh, PA 15238Chris Kovitch412.963.7058
Water TKN Low All C-12 30 days
CAS1317 South 13th Ave.Kelso, WA 98626Ed Wallace360.577.7222
TestAmerica4101 Shuffel Dr. NWNorth Canton, OH 44720Ken Kuzior330.497.9396
Water Total Phosphorus Low All C-11 30 days
CAS1317 South 13th Ave.Kelso, WA 98626Ed Wallace360.577.7222
TestAmerica4101 Shuffel Dr. NWNorth Canton, OH 44720Ken Kuzior330.497.9396
Water TOC/DOC Low All C-13 30 days
CAS1317 South 13th Ave.Kelso, WA 98626Ed Wallace360.577.7222
TestAmerica301 Alpha Drive RIDC ParkPittsburgh, PA 15238Chris Kovitch412.963.7058
Water POC Low All C-16 30 days
CAS3860 S. Palo VerdeRoad, Suite 302Tucson, AZ 85714Todd Poyfair602.443.7019
TestAmerica301 Alpha DrivePittsburgh, PA 15238Chris Kovitch412.963.7058

Quality Assurance Project PlanRI Water Column Monitoring/Small Volume Chemical Data CollectionLower Passaic River Restoration ProjectNew Jersey
Section: Worksheet #30Revision: 2
Date: August 2011Page 4 of 5
QAPP Worksheet #30 (UFP-QAPP Manual Section 3.5.2.3) Analytical Services Table
J:\Water\ProjectFiles\P120\12182_Passaic\Tasks\CWCM\AECOM QAPP\2011803_Rev2\clean\20110810_CWCM-sv_QAPP_Rev2.docx
MatrixAnalytical
GroupConcentration
Level
SampleLocations/ID Number
AnalyticalSOP
Data PackageTurnaround
TimeaLaboratory/
OrganizationBackup Laboratory/
Organization)b
Water Total Sulfide Low All C-14 30 days
CAS1317 South 13th Ave.Kelso, WA 98626Ed Wallace360.577.7222
Test America301 Alpha DrivePittsburgh, PA 15238Chris Kovitch412.963.7058
Water TDS Low All C-19 30 days
CAS1317 South 13th Ave.Kelso, WA 98626Ed Wallace360.577.7222
Test America301 Alpha DrivePittsburgh, PA 15238Chris Kovitch412.963.7058
Water Alkalinity Low All C-20 30 days
CAS1317 South 13th Ave.Kelso, WA 98626Ed Wallace360.577.7222
Test America301 Alpha DrivePittsburgh, PA 15238Chris Kovitch412.963.7058
Water SSC Low All C-17 30 days
CAS1317 South 13th Ave.Kelso, WA 98626Ed Wallace360.577.7222
Test America30 Community Drive, Suite 11South Burlington, VT 05403Kris Dusablon865.291.3000
Water Chlorophyll a Low All C-22 30 days
CAS1317 South 13th Ave.Kelso, WA 98626Ed Wallace360.577.7222
NA
Water Bacteria Low SeeWorksheet #18
E-1, E-2, E-3,E-4 30 days
EMSL, Inc.200 Route 130N. Cinnaminson, NJ08077Jason Dobranic800-220-3675
NA
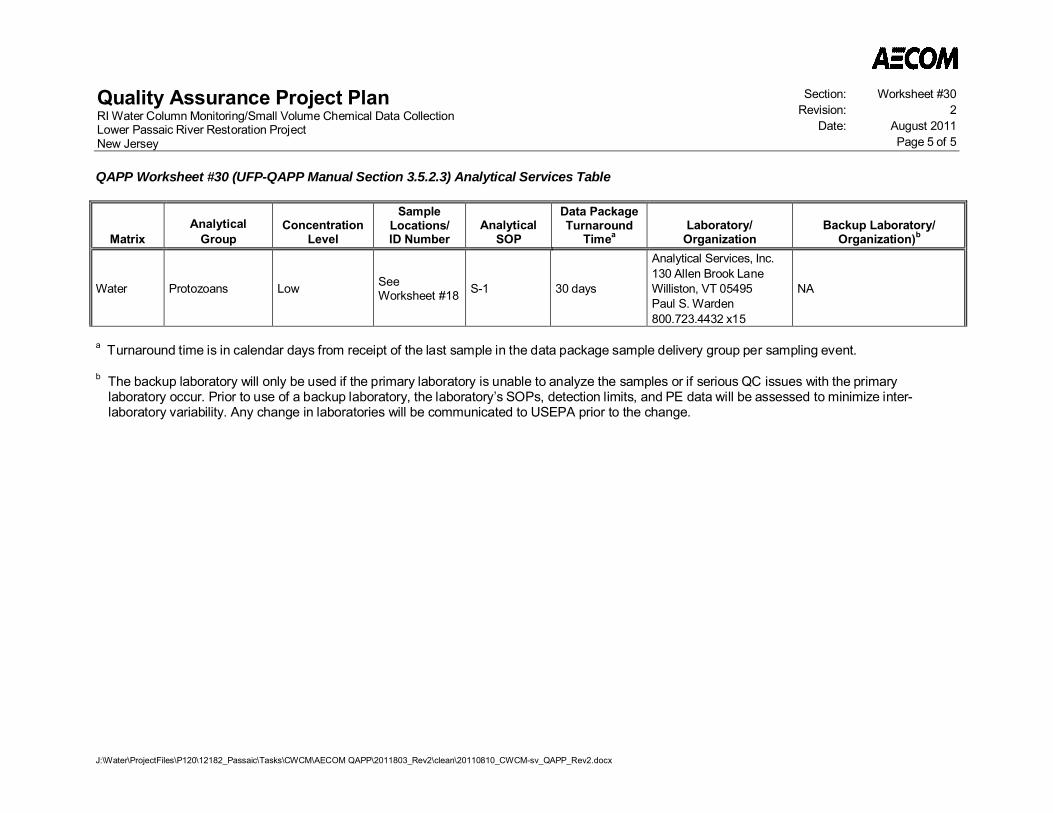
Quality Assurance Project PlanRI Water Column Monitoring/Small Volume Chemical Data CollectionLower Passaic River Restoration ProjectNew Jersey
Section: Worksheet #30Revision: 2
Date: August 2011Page 5 of 5
QAPP Worksheet #30 (UFP-QAPP Manual Section 3.5.2.3) Analytical Services Table
J:\Water\ProjectFiles\P120\12182_Passaic\Tasks\CWCM\AECOM QAPP\2011803_Rev2\clean\20110810_CWCM-sv_QAPP_Rev2.docx
MatrixAnalytical
GroupConcentration
Level
SampleLocations/ID Number
AnalyticalSOP
Data PackageTurnaround
TimeaLaboratory/
OrganizationBackup Laboratory/
Organization)b
Water Protozoans Low SeeWorksheet #18 S-1 30 days
Analytical Services, Inc.130 Allen Brook LaneWilliston, VT 05495Paul S. Warden800.723.4432 x15
NA
a Turnaround time is in calendar days from receipt of the last sample in the data package sample delivery group per sampling event.
b The backup laboratory will only be used if the primary laboratory is unable to analyze the samples or if serious QC issues with the primarylaboratory occur. Prior to use of a backup laboratory, the laboratory’s SOPs, detection limits, and PE data will be assessed to minimize inter-laboratory variability. Any change in laboratories will be communicated to USEPA prior to the change.
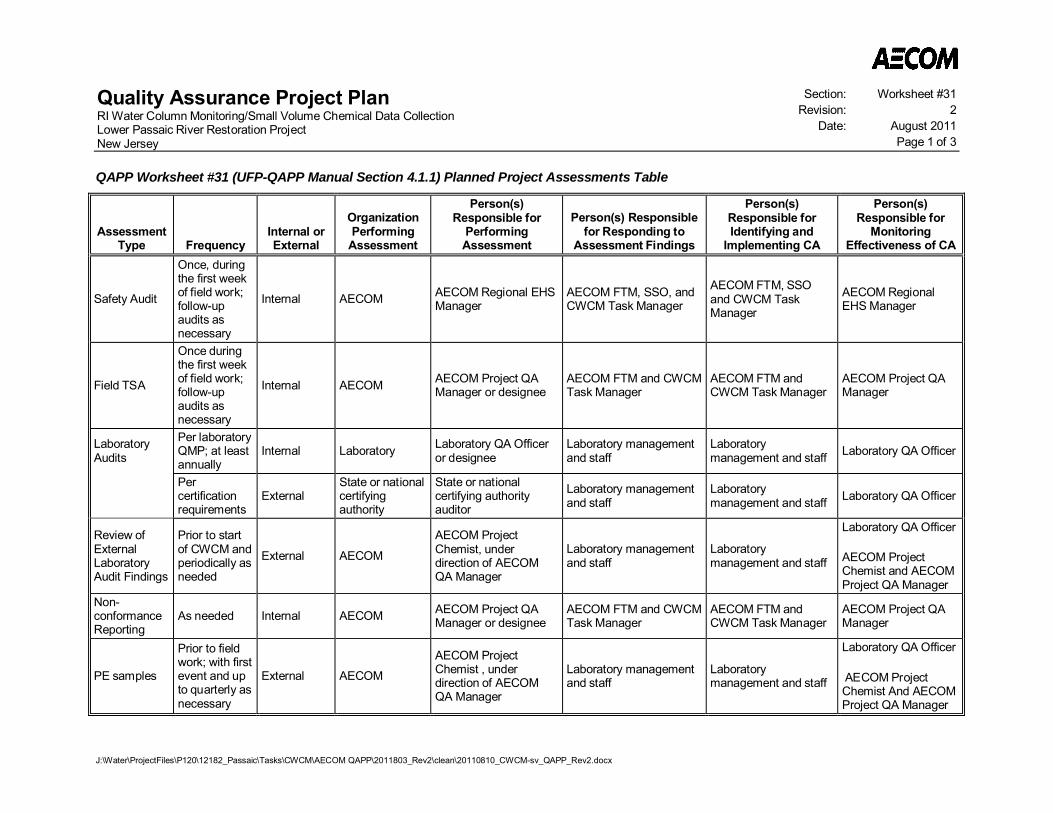
Quality Assurance Project PlanRI Water Column Monitoring/Small Volume Chemical Data CollectionLower Passaic River Restoration ProjectNew Jersey
Section: Worksheet #31Revision: 2
Date: August 2011Page 1 of 3
J:\Water\ProjectFiles\P120\12182_Passaic\Tasks\CWCM\AECOM QAPP\2011803_Rev2\clean\20110810_CWCM-sv_QAPP_Rev2.docx
QAPP Worksheet #31 (UFP-QAPP Manual Section 4.1.1) Planned Project Assessments Table
AssessmentType Frequency
Internal orExternal
OrganizationPerforming
Assessment
Person(s)Responsible for
PerformingAssessment
Person(s) Responsiblefor Responding to
Assessment Findings
Person(s)Responsible forIdentifying and
Implementing CA
Person(s)Responsible for
MonitoringEffectiveness of CA
Safety Audit
Once, duringthe first weekof field work;follow-upaudits asnecessary
Internal AECOM AECOM Regional EHSManager
AECOM FTM, SSO, andCWCM Task Manager
AECOM FTM, SSOand CWCM TaskManager
AECOM RegionalEHS Manager
Field TSA
Once duringthe first weekof field work;follow-upaudits asnecessary
Internal AECOM AECOM Project QAManager or designee
AECOM FTM and CWCMTask Manager
AECOM FTM andCWCM Task Manager
AECOM Project QAManager
LaboratoryAudits
Per laboratoryQMP; at leastannually
Internal Laboratory Laboratory QA Officeror designee
Laboratory managementand staff
Laboratorymanagement and staff Laboratory QA Officer
Percertificationrequirements
ExternalState or nationalcertifyingauthority
State or nationalcertifying authorityauditor
Laboratory managementand staff
Laboratorymanagement and staff Laboratory QA Officer
Review ofExternalLaboratoryAudit Findings
Prior to startof CWCM andperiodically asneeded
External AECOM
AECOM ProjectChemist, underdirection of AECOMQA Manager
Laboratory managementand staff
Laboratorymanagement and staff
Laboratory QA Officer
AECOM ProjectChemist and AECOMProject QA Manager
Non-conformanceReporting
As needed Internal AECOM AECOM Project QAManager or designee
AECOM FTM and CWCMTask Manager
AECOM FTM andCWCM Task Manager
AECOM Project QAManager
PE samples
Prior to fieldwork; with firstevent and upto quarterly asnecessary
External AECOM
AECOM ProjectChemist , underdirection of AECOMQA Manager
Laboratory managementand staff
Laboratorymanagement and staff
Laboratory QA Officer
AECOM ProjectChemist And AECOMProject QA Manager

Quality Assurance Project PlanRI Water Column Monitoring/Small Volume Chemical Data CollectionLower Passaic River Restoration ProjectNew Jersey
Section: Worksheet #31Revision: 2
Date: August 2011Page 2 of 3
QAPP Worksheet #31 (UFP-QAPP Manual Section 4.1.1) Planned Project Assessments Table
J:\Water\ProjectFiles\P120\12182_Passaic\Tasks\CWCM\AECOM QAPP\2011803_Rev2\clean\20110810_CWCM-sv_QAPP_Rev2.docx
Assessments
Assessment activities will measure the effectiveness of the project implementation and associated QA/QC activities. Audits are used as a means ofmonitoring the performance of field and laboratory activities and are conducted by the Regional EHS Manager (safety audits), Project QA Manager(TSAs), or a qualified alternate. Audits will include systems audits that are more qualitative in nature and will be made at appropriate intervals toensure that all aspects of the QA program are operative. Performance audits are quantitative audits that are conducted to assess the accuracy ofmeasurement systems; this would include the use of PE samples.
Safety audits and TSAs will be conducted for field operations to assess implementation of project requirements and determine if the systems underreview are capable of meeting project PQOs. These audits will include observations of procedures, discussions with project personnel, and review ofrecords. Any minor deficiencies noted during an audit will be corrected immediately. If a major deficiency is noted during an audit, a stop work orderwill be issued until the deficiency can be corrected and the effectiveness of the CA measured and documented. A stop work order may be issued bythe Regional EHS Manager or Project QA Manager, as appropriate, who will notify the CWCM Task Manager and the AECOM PM. The conditionsthat lead to a stop work order must be documented in sufficient detail to clearly define the problem and identify possible corrective measures. Allcommunications among project staff that address evaluation of the problem and appropriate solutions must be attached to the stop work order. TheProject QA Manager or Regional EHS Manager, the CWCM Task Manager, and AECOM PM must agree in writing to resume work after review of thedata supporting correction of the deficiency. The Project QA Manager and Regional EHS Manager will maintain documentation of the deficiencies thatwere noted, the individual(s) responsible for follow-up, documentation of the effectiveness of the CAs taken, and implementation of procedures toprevent recurrence of the problem.
No project-specific on-site system audits of laboratories are planned for the CWCM. However, participating laboratories are required to take part inregularly scheduled audits required by state and federal agencies as part of ongoing certification or participation in specific contracts. For those auditsconducted within 6 months of the start of, or during the course of, the CWCM program, the laboratories must provide copies of the results of thesethird-party audits to the Project Chemist. Any change in laboratory ownership, management, or certification status must also be immediately reportedto the Project Chemist. The Project Chemist, under the direction of the Project QA Manager, will review the third-party audit reports. Any significantdeficiencies will require follow up and resolution with the laboratory. The Project Chemist will prepare a written summary of findings and CAs.
The PE program for the CWCM will involve two parts: (1) an evaluation of recent PE data provided by the laboratories and performed as part of theirroutine participation in USEPA Water Supply (WS) and Water Pollution (WP) certification programs, and (2) analysis of new PE samples purchasedby AECOM from a commercial vendor (for example, Resource Technology Corporation). A complete set of blind PE samples for all analyte groups(except for General Chemistry) will be analyzed by both the primary and back-up laboratories before the field sampling begins. An evaluation will beperformed by the Project Chemist, who will prepare a written report summarizing the results, actions taken, and resolution of any issues based on thepre-program PE result datasets. In addition to the pre-program PEs, the participating laboratories will analyze known PE samples or certifiedreference materials (CRMs), which are not blind, at the start of each field sampling event, not to exceed once per calendar quarter. Given the
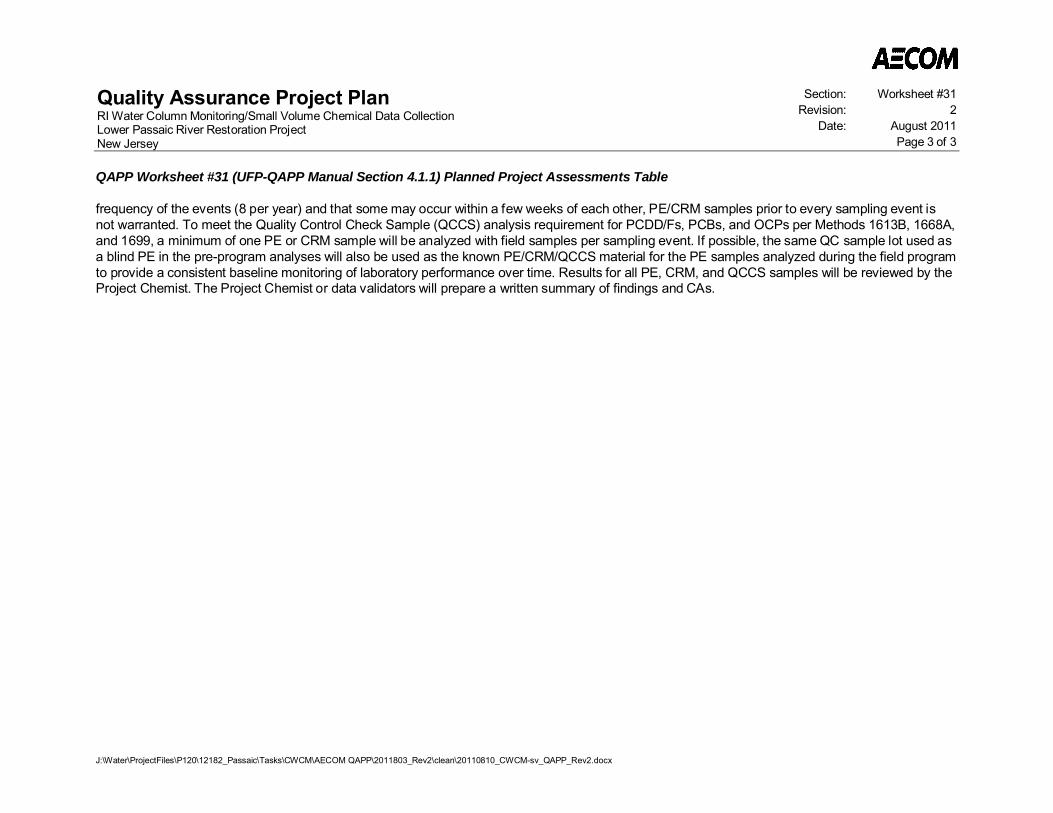
Quality Assurance Project PlanRI Water Column Monitoring/Small Volume Chemical Data CollectionLower Passaic River Restoration ProjectNew Jersey
Section: Worksheet #31Revision: 2
Date: August 2011Page 3 of 3
QAPP Worksheet #31 (UFP-QAPP Manual Section 4.1.1) Planned Project Assessments Table
J:\Water\ProjectFiles\P120\12182_Passaic\Tasks\CWCM\AECOM QAPP\2011803_Rev2\clean\20110810_CWCM-sv_QAPP_Rev2.docx
frequency of the events (8 per year) and that some may occur within a few weeks of each other, PE/CRM samples prior to every sampling event isnot warranted. To meet the Quality Control Check Sample (QCCS) analysis requirement for PCDD/Fs, PCBs, and OCPs per Methods 1613B, 1668A,and 1699, a minimum of one PE or CRM sample will be analyzed with field samples per sampling event. If possible, the same QC sample lot used asa blind PE in the pre-program analyses will also be used as the known PE/CRM/QCCS material for the PE samples analyzed during the field programto provide a consistent baseline monitoring of laboratory performance over time. Results for all PE, CRM, and QCCS samples will be reviewed by theProject Chemist. The Project Chemist or data validators will prepare a written summary of findings and CAs.
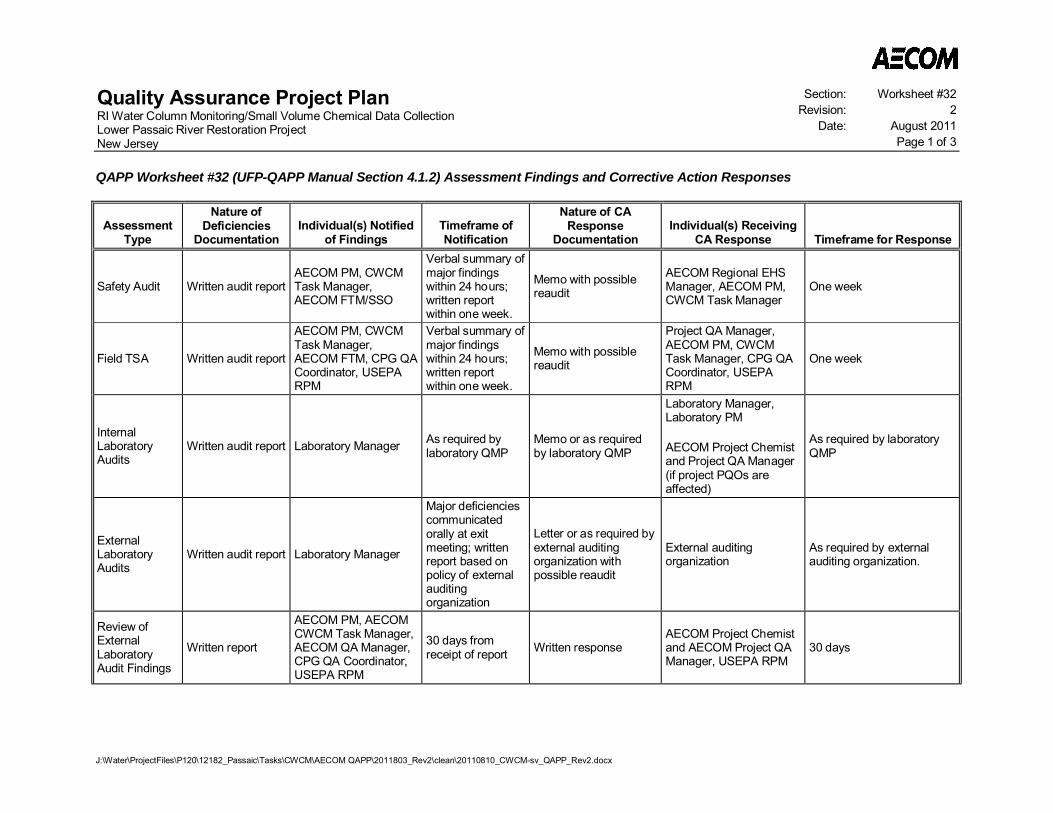
Quality Assurance Project PlanRI Water Column Monitoring/Small Volume Chemical Data CollectionLower Passaic River Restoration ProjectNew Jersey
Section: Worksheet #32Revision: 2
Date: August 2011Page 1 of 3
J:\Water\ProjectFiles\P120\12182_Passaic\Tasks\CWCM\AECOM QAPP\2011803_Rev2\clean\20110810_CWCM-sv_QAPP_Rev2.docx
QAPP Worksheet #32 (UFP-QAPP Manual Section 4.1.2) Assessment Findings and Corrective Action Responses
AssessmentType
Nature ofDeficiencies
DocumentationIndividual(s) Notified
of FindingsTimeframe ofNotification
Nature of CAResponse
DocumentationIndividual(s) Receiving
CA Response Timeframe for Response
Safety Audit Written audit reportAECOM PM, CWCMTask Manager,AECOM FTM/SSO
Verbal summary ofmajor findingswithin 24 hours;written reportwithin one week.
Memo with possiblereaudit
AECOM Regional EHSManager, AECOM PM,CWCM Task Manager
One week
Field TSA Written audit report
AECOM PM, CWCMTask Manager,AECOM FTM, CPG QACoordinator, USEPARPM
Verbal summary ofmajor findingswithin 24 hours;written reportwithin one week.
Memo with possiblereaudit
Project QA Manager,AECOM PM, CWCMTask Manager, CPG QACoordinator, USEPARPM
One week
InternalLaboratoryAudits
Written audit report Laboratory Manager As required bylaboratory QMP
Memo or as requiredby laboratory QMP
Laboratory Manager,Laboratory PM
AECOM Project Chemistand Project QA Manager(if project PQOs areaffected)
As required by laboratoryQMP
ExternalLaboratoryAudits
Written audit report Laboratory Manager
Major deficienciescommunicatedorally at exitmeeting; writtenreport based onpolicy of externalauditingorganization
Letter or as required byexternal auditingorganization withpossible reaudit
External auditingorganization
As required by externalauditing organization.
Review ofExternalLaboratoryAudit Findings
Written report
AECOM PM, AECOMCWCM Task Manager,AECOM QA Manager,CPG QA Coordinator,USEPA RPM
30 days fromreceipt of report Written response
AECOM Project Chemistand AECOM Project QAManager, USEPA RPM
30 days

Quality Assurance Project PlanRI Water Column Monitoring/Small Volume Chemical Data CollectionLower Passaic River Restoration ProjectNew Jersey
Section: Worksheet #32Revision: 2
Date: August 2011Page 2 of 3
QAPP Worksheet #32 (UFP-QAPP Manual Section 4.1.2) Assessment Findings and Corrective Action Responses
J:\Water\ProjectFiles\P120\12182_Passaic\Tasks\CWCM\AECOM QAPP\2011803_Rev2\clean\20110810_CWCM-sv_QAPP_Rev2.docx
AssessmentType
Nature ofDeficiencies
DocumentationIndividual(s) Notified
of FindingsTimeframe ofNotification
Nature of CAResponse
DocumentationIndividual(s) Receiving
CA Response Timeframe for Response
Non-conformanceReporting
Written report
AECOM PM, AECOMCWCM Task Manager,AECOM QA Manager,CPG QA Coordinator
Verbal summary ofmajor findingswithin 24 hours;written reportwithin one week.
Memo with possiblecorrective action
Project QA Manager,AECOM PM, CWCMTask Manager, CPG QACoordinator
One week
PE samples Written PE resultsevaluation report Laboratory Manager
Deficiencies(results outsideacceptance range)identified withinone week ofreceivinglaboratory results
Letter with request forlaboratory investigationinto deficiencies andCA, if necessary,before project fieldsamples are analyzed.CA may includeinvestigation andpreparation by thelaboratory of a CAreport, analysis of anew PE sample, or ifAECOM deemsappropriate, theanalyses may bemoved to another lab.
AECOM Project Chemist,Project QA Manager, andCPG QA Coordinator
One week
Quality Assurance Project PlanRI Water Column Monitoring/Small Volume Chemical Data CollectionLower Passaic River Restoration ProjectNew Jersey
Section: Worksheet #32Revision: 2
Date: August 2011Page 3 of 3
QAPP Worksheet #32 (UFP-QAPP Manual Section 4.1.2) Assessment Findings and Corrective Action Responses
J:\Water\ProjectFiles\P120\12182_Passaic\Tasks\CWCM\AECOM QAPP\2011803_Rev2\clean\20110810_CWCM-sv_QAPP_Rev2.docx
Non-Conformance/QC Reporting
A non-conformance is defined as an identified or suspected deficiency in, or deviation from, procedures described in an approved document (e.g.,improper sampling procedures, improper instrument calibration, errors in calculations or errors in computer algorithms); an item where the quality ofthe end product itself or subsequent activities conducted using the document or item would be affected by the deficiency; or an activity that is notconducted in accordance with established plans or procedures. Any project staff member that discovers or suspects a non-conformance isresponsible for initiating a non-conformance report to the Project QA Manager. The Project QA Manager will evaluate each non-conformance reportand provide a response describing the actions to be taken and assigning responsibility for the CA. The appropriate Task Manager will verify that thenonconforming item or procedure is not used until the CA has been performed and found to produce acceptable results. If the non-conformanceinvolves instrumentation or equipment, the device must be tagged to indicate it is defective and not to be used.
A copy of each non-conformance report will be added to the project file. Original non-conformance reports will be maintained by the Project QAManager or designate.
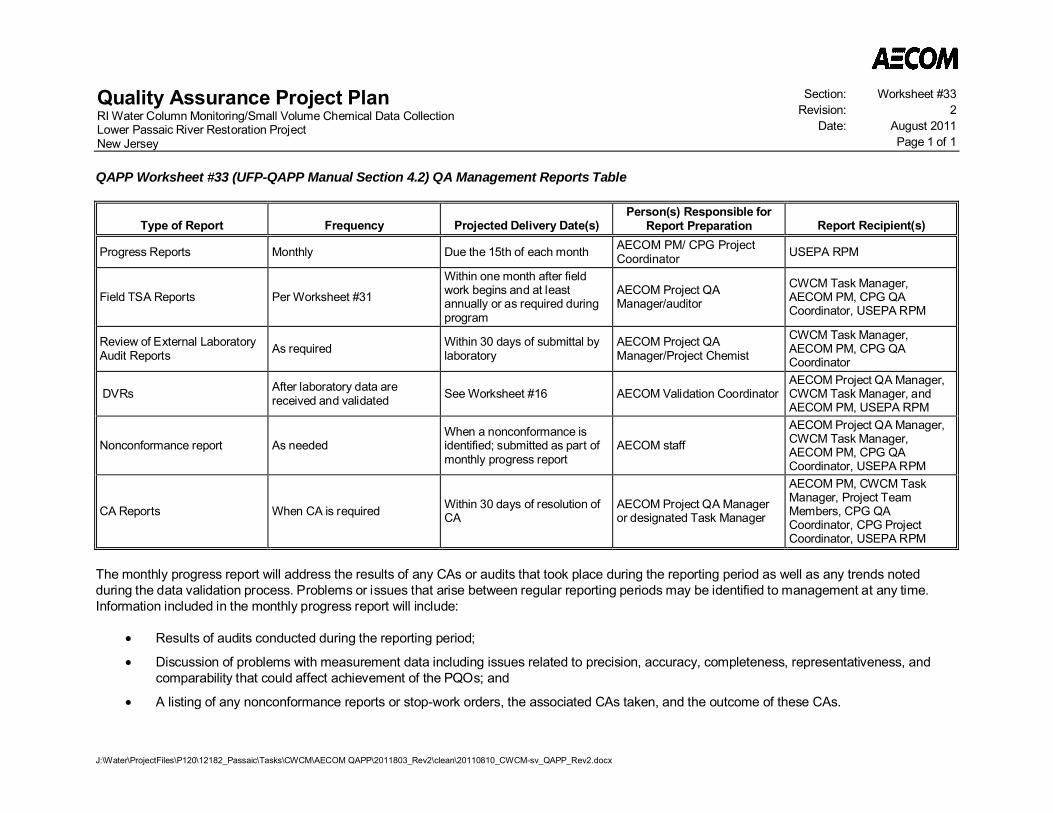
Quality Assurance Project PlanRI Water Column Monitoring/Small Volume Chemical Data CollectionLower Passaic River Restoration ProjectNew Jersey
Section: Worksheet #33Revision: 2
Date: August 2011Page 1 of 1
J:\Water\ProjectFiles\P120\12182_Passaic\Tasks\CWCM\AECOM QAPP\2011803_Rev2\clean\20110810_CWCM-sv_QAPP_Rev2.docx
QAPP Worksheet #33 (UFP-QAPP Manual Section 4.2) QA Management Reports Table
Type of Report Frequency Projected Delivery Date(s)Person(s) Responsible for
Report Preparation Report Recipient(s)
Progress Reports Monthly Due the 15th of each month AECOM PM/ CPG ProjectCoordinator USEPA RPM
Field TSA Reports Per Worksheet #31
Within one month after fieldwork begins and at leastannually or as required duringprogram
AECOM Project QAManager/auditor
CWCM Task Manager,AECOM PM, CPG QACoordinator, USEPA RPM
Review of External LaboratoryAudit Reports As required Within 30 days of submittal by
laboratoryAECOM Project QAManager/Project Chemist
CWCM Task Manager,AECOM PM, CPG QACoordinator
DVRs After laboratory data arereceived and validated See Worksheet #16 AECOM Validation Coordinator
AECOM Project QA Manager,CWCM Task Manager, andAECOM PM, USEPA RPM
Nonconformance report As neededWhen a nonconformance isidentified; submitted as part ofmonthly progress report
AECOM staff
AECOM Project QA Manager,CWCM Task Manager,AECOM PM, CPG QACoordinator, USEPA RPM
CA Reports When CA is required Within 30 days of resolution ofCA
AECOM Project QA Manageror designated Task Manager
AECOM PM, CWCM TaskManager, Project TeamMembers, CPG QACoordinator, CPG ProjectCoordinator, USEPA RPM
The monthly progress report will address the results of any CAs or audits that took place during the reporting period as well as any trends notedduring the data validation process. Problems or issues that arise between regular reporting periods may be identified to management at any time.Information included in the monthly progress report will include:
Results of audits conducted during the reporting period;
Discussion of problems with measurement data including issues related to precision, accuracy, completeness, representativeness, andcomparability that could affect achievement of the PQOs; and
A listing of any nonconformance reports or stop-work orders, the associated CAs taken, and the outcome of these CAs.

Quality Assurance Project PlanRI Water Column Monitoring/Small Volume Chemical Data CollectionLower Passaic River Restoration ProjectNew Jersey
Section: Worksheet #34Revision: 2
Date: August 2011Page 1 of 1
J:\Water\ProjectFiles\P120\12182_Passaic\Tasks\CWCM\AECOM QAPP\2011803_Rev2\clean\20110810_CWCM-sv_QAPP_Rev2.docx
QAPP Worksheet #34 (UFP-QAPP Manual Section 5.2.1) Verification (Step I) Process Table
Verification Input DescriptionInternal/External Responsible for Verification
Field data
Field data, including equipment decontamination records, sampleequipment calibration logs, and field measurements, will be reviewed forcompleteness, accuracy and agreement with SOP LPR-G-01 (FieldRecords).
Internal CWCM Task Manager or designee
Chain-of-Custody
The COC will be reviewed initially in the field for complete and correctinformation. Internal AECOM FTM, CWCM Task Manager,
or designeeUpon receipt at the lab, the COC will be compared to sample containersand any discrepancies will be resolved. External Laboratory Sample Custodian
During validation the COC will be verified against laboratory receipt andreporting information. External Data Validator
Sample Condition Holding temperature, holding time and preservation will be reviewed whenaccepting custody of samples and coolers. External Laboratory Sample Custodian
Laboratory Data Packagesand EDDs
Laboratory data (hard copy and EDDs) will be verified by the laboratoryperforming the work for completeness and technical accuracy prior torelease.
External Laboratory
Laboratory data will be assessed using the validation procedures describedin Worksheets #35 and #36. Internal Data Validator
Audit Reports
Field system audit reports will be reviewed to confirm that specified CAshave been taken, the CA has been effective and all documentation of CA isattached to the audit report.
Internal laboratory audits will be reviewed to confirm that specified CAshave been taken, the CA has been effective and all documentation of CA iscomplete.
Internal
External
AECOM Project QA Manager ordesignee
Laboratory QA Manager
Assessment actions andreports
QA/QC process will be reviewed for agreement with QAPP/FSPAddendum. External ddms, inc., CPG Project QA
Coordinator, or designee
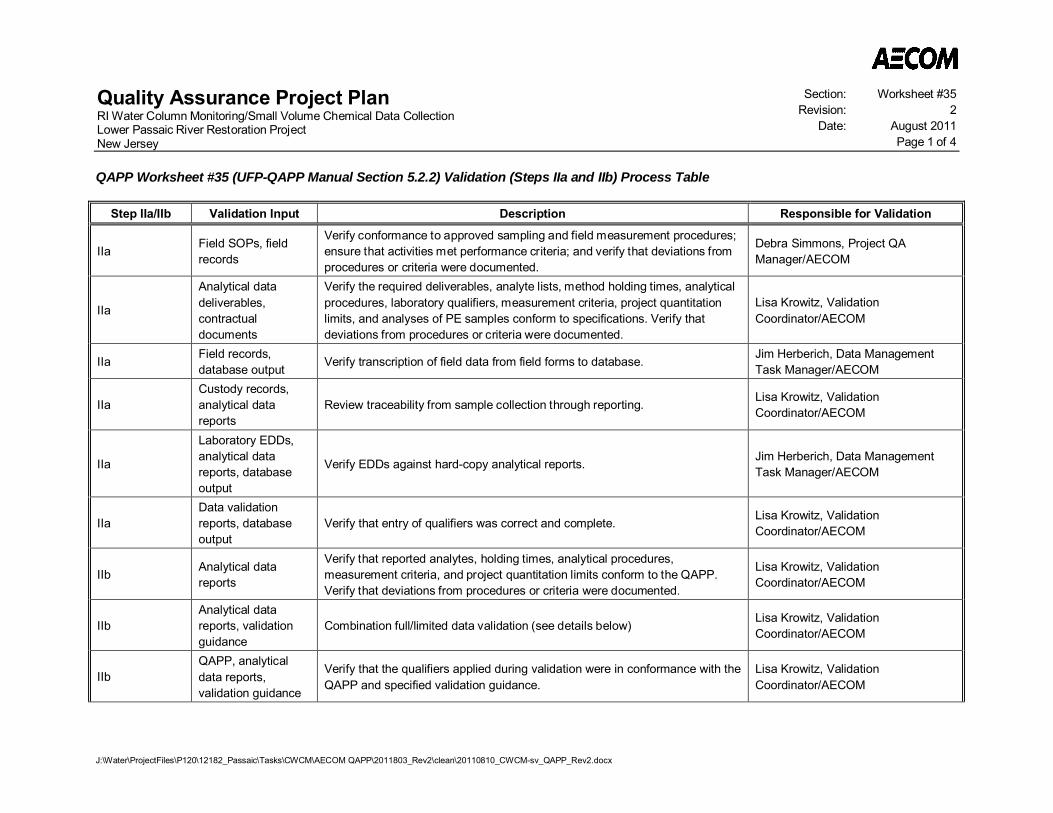
Quality Assurance Project PlanRI Water Column Monitoring/Small Volume Chemical Data CollectionLower Passaic River Restoration ProjectNew Jersey
Section: Worksheet #35Revision: 2
Date: August 2011Page 1 of 4
J:\Water\ProjectFiles\P120\12182_Passaic\Tasks\CWCM\AECOM QAPP\2011803_Rev2\clean\20110810_CWCM-sv_QAPP_Rev2.docx
QAPP Worksheet #35 (UFP-QAPP Manual Section 5.2.2) Validation (Steps IIa and IIb) Process Table
Step IIa/IIb Validation Input Description Responsible for Validation
IIa Field SOPs, fieldrecords
Verify conformance to approved sampling and field measurement procedures;ensure that activities met performance criteria; and verify that deviations fromprocedures or criteria were documented.
Debra Simmons, Project QAManager/AECOM
IIa
Analytical datadeliverables,contractualdocuments
Verify the required deliverables, analyte lists, method holding times, analyticalprocedures, laboratory qualifiers, measurement criteria, project quantitationlimits, and analyses of PE samples conform to specifications. Verify thatdeviations from procedures or criteria were documented.
Lisa Krowitz, ValidationCoordinator/AECOM
IIa Field records,database output Verify transcription of field data from field forms to database. Jim Herberich, Data Management
Task Manager/AECOM
IIaCustody records,analytical datareports
Review traceability from sample collection through reporting. Lisa Krowitz, ValidationCoordinator/AECOM
IIa
Laboratory EDDs,analytical datareports, databaseoutput
Verify EDDs against hard-copy analytical reports. Jim Herberich, Data ManagementTask Manager/AECOM
IIaData validationreports, databaseoutput
Verify that entry of qualifiers was correct and complete. Lisa Krowitz, ValidationCoordinator/AECOM
IIb Analytical datareports
Verify that reported analytes, holding times, analytical procedures,measurement criteria, and project quantitation limits conform to the QAPP.Verify that deviations from procedures or criteria were documented.
Lisa Krowitz, ValidationCoordinator/AECOM
IIbAnalytical datareports, validationguidance
Combination full/limited data validation (see details below) Lisa Krowitz, ValidationCoordinator/AECOM
IIbQAPP, analyticaldata reports,validation guidance
Verify that the qualifiers applied during validation were in conformance with theQAPP and specified validation guidance.
Lisa Krowitz, ValidationCoordinator/AECOM
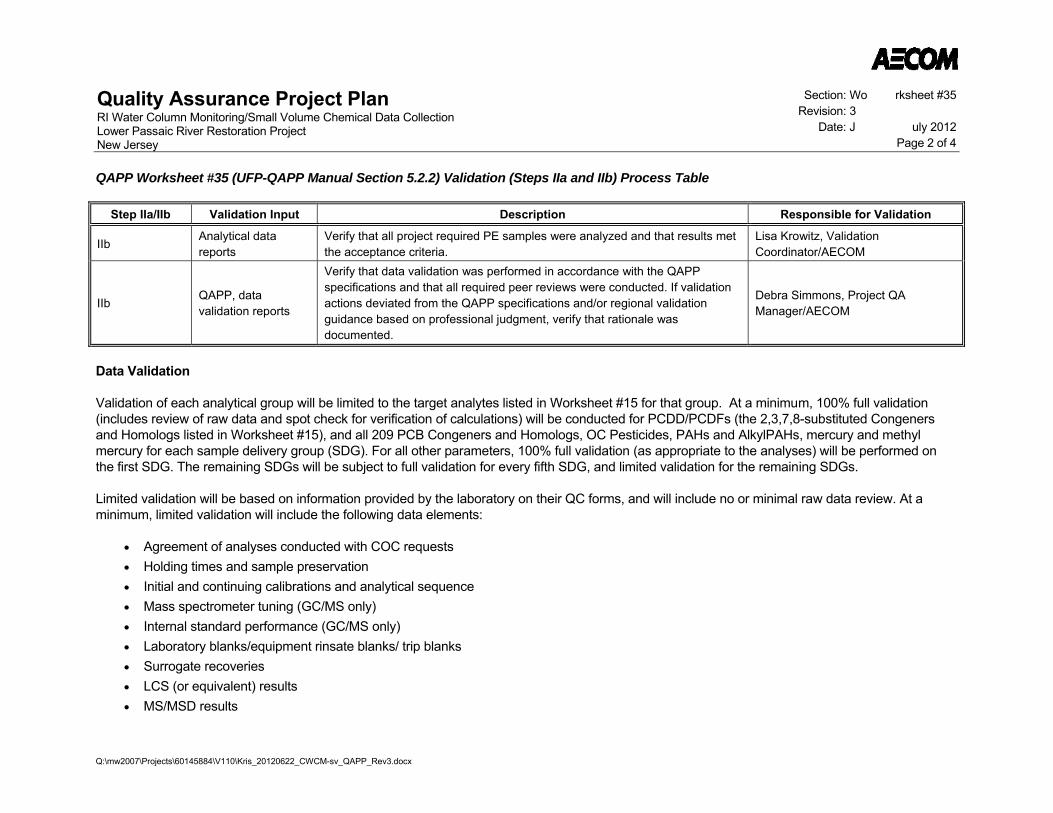
Quality Assurance Project Plan RI Water Column Monitoring/Small Volume Chemical Data Collection Lower Passaic River Restoration Project New Jersey
Section: Wo rksheet #35 Revision: 3
Date: J uly 2012 Page 2 of 4
QAPP Worksheet #35 (UFP-QAPP Manual Section 5.2.2) Validation (Steps IIa and IIb) Process Table
Q:\mw2007\Projects\60145884\V110\Kris_20120622_CWCM-sv_QAPP_Rev3.docx
Step IIa/IIb Validation Input Description Responsible for Validation
IIb Analytical data reports
Verify that all project required PE samples were analyzed and that results met the acceptance criteria.
Lisa Krowitz, Validation Coordinator/AECOM
IIb QAPP, data validation reports
Verify that data validation was performed in accordance with the QAPP specifications and that all required peer reviews were conducted. If validation actions deviated from the QAPP specifications and/or regional validation guidance based on professional judgment, verify that rationale was documented.
Debra Simmons, Project QA Manager/AECOM
Data Validation
Validation of each analytical group will be limited to the target analytes listed in Worksheet #15 for that group. At a minimum, 100% full validation (includes review of raw data and spot check for verification of calculations) will be conducted for PCDD/PCDFs (the 2,3,7,8-substituted Congeners and Homologs listed in Worksheet #15), and all 209 PCB Congeners and Homologs, OC Pesticides, PAHs and AlkylPAHs, mercury and methyl mercury for each sample delivery group (SDG). For all other parameters, 100% full validation (as appropriate to the analyses) will be performed on the first SDG. The remaining SDGs will be subject to full validation for every fifth SDG, and limited validation for the remaining SDGs.
Limited validation will be based on information provided by the laboratory on their QC forms, and will include no or minimal raw data review. At a minimum, limited validation will include the following data elements:
Agreement of analyses conducted with COC requests Holding times and sample preservation Initial and continuing calibrations and analytical sequence Mass spectrometer tuning (GC/MS only) Internal standard performance (GC/MS only) Laboratory blanks/equipment rinsate blanks/ trip blanks Surrogate recoveries LCS (or equivalent) results MS/MSD results
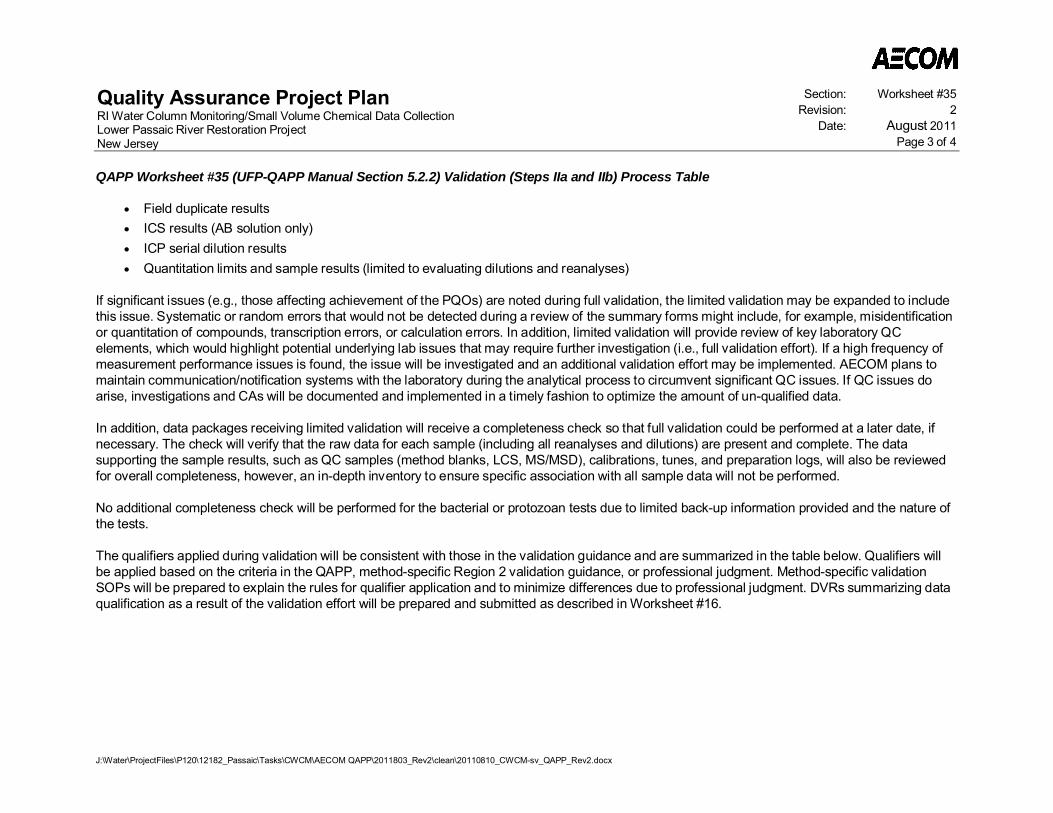
Quality Assurance Project PlanRI Water Column Monitoring/Small Volume Chemical Data CollectionLower Passaic River Restoration ProjectNew Jersey
Section: Worksheet #35Revision: 2
Date: August 2011Page 3 of 4
QAPP Worksheet #35 (UFP-QAPP Manual Section 5.2.2) Validation (Steps IIa and IIb) Process Table
J:\Water\ProjectFiles\P120\12182_Passaic\Tasks\CWCM\AECOM QAPP\2011803_Rev2\clean\20110810_CWCM-sv_QAPP_Rev2.docx
Field duplicate resultsICS results (AB solution only)ICP serial dilution resultsQuantitation limits and sample results (limited to evaluating dilutions and reanalyses)
If significant issues (e.g., those affecting achievement of the PQOs) are noted during full validation, the limited validation may be expanded to includethis issue. Systematic or random errors that would not be detected during a review of the summary forms might include, for example, misidentificationor quantitation of compounds, transcription errors, or calculation errors. In addition, limited validation will provide review of key laboratory QCelements, which would highlight potential underlying lab issues that may require further investigation (i.e., full validation effort). If a high frequency ofmeasurement performance issues is found, the issue will be investigated and an additional validation effort may be implemented. AECOM plans tomaintain communication/notification systems with the laboratory during the analytical process to circumvent significant QC issues. If QC issues doarise, investigations and CAs will be documented and implemented in a timely fashion to optimize the amount of un-qualified data.
In addition, data packages receiving limited validation will receive a completeness check so that full validation could be performed at a later date, ifnecessary. The check will verify that the raw data for each sample (including all reanalyses and dilutions) are present and complete. The datasupporting the sample results, such as QC samples (method blanks, LCS, MS/MSD), calibrations, tunes, and preparation logs, will also be reviewedfor overall completeness, however, an in-depth inventory to ensure specific association with all sample data will not be performed.
No additional completeness check will be performed for the bacterial or protozoan tests due to limited back-up information provided and the nature ofthe tests.
The qualifiers applied during validation will be consistent with those in the validation guidance and are summarized in the table below. Qualifiers willbe applied based on the criteria in the QAPP, method-specific Region 2 validation guidance, or professional judgment. Method-specific validationSOPs will be prepared to explain the rules for qualifier application and to minimize differences due to professional judgment. DVRs summarizing dataqualification as a result of the validation effort will be prepared and submitted as described in Worksheet #16.
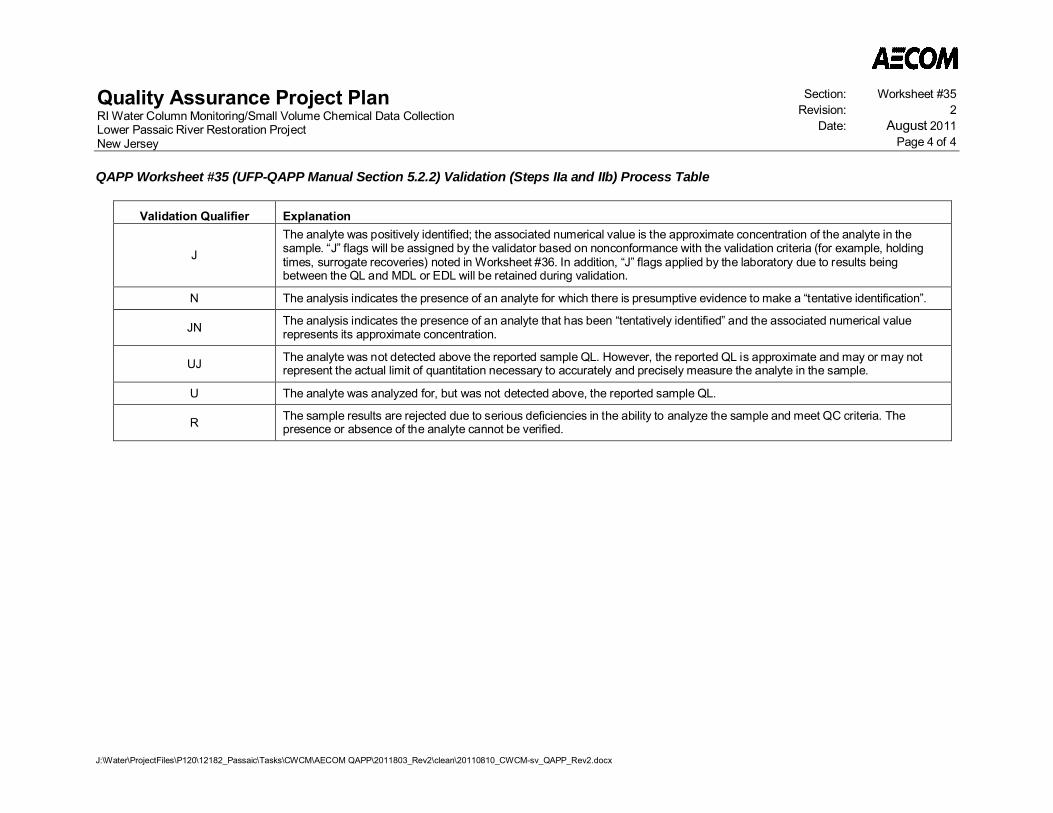
Quality Assurance Project PlanRI Water Column Monitoring/Small Volume Chemical Data CollectionLower Passaic River Restoration ProjectNew Jersey
Section: Worksheet #35Revision: 2
Date: August 2011Page 4 of 4
QAPP Worksheet #35 (UFP-QAPP Manual Section 5.2.2) Validation (Steps IIa and IIb) Process Table
J:\Water\ProjectFiles\P120\12182_Passaic\Tasks\CWCM\AECOM QAPP\2011803_Rev2\clean\20110810_CWCM-sv_QAPP_Rev2.docx
Validation Qualifier Explanation
J
The analyte was positively identified; the associated numerical value is the approximate concentration of the analyte in thesample. “J” flags will be assigned by the validator based on nonconformance with the validation criteria (for example, holdingtimes, surrogate recoveries) noted in Worksheet #36. In addition, “J” flags applied by the laboratory due to results beingbetween the QL and MDL or EDL will be retained during validation.
N The analysis indicates the presence of an analyte for which there is presumptive evidence to make a “tentative identification”.
JN The analysis indicates the presence of an analyte that has been “tentatively identified” and the associated numerical valuerepresents its approximate concentration.
UJ The analyte was not detected above the reported sample QL. However, the reported QL is approximate and may or may notrepresent the actual limit of quantitation necessary to accurately and precisely measure the analyte in the sample.
U The analyte was analyzed for, but was not detected above, the reported sample QL.
R The sample results are rejected due to serious deficiencies in the ability to analyze the sample and meet QC criteria. Thepresence or absence of the analyte cannot be verified.
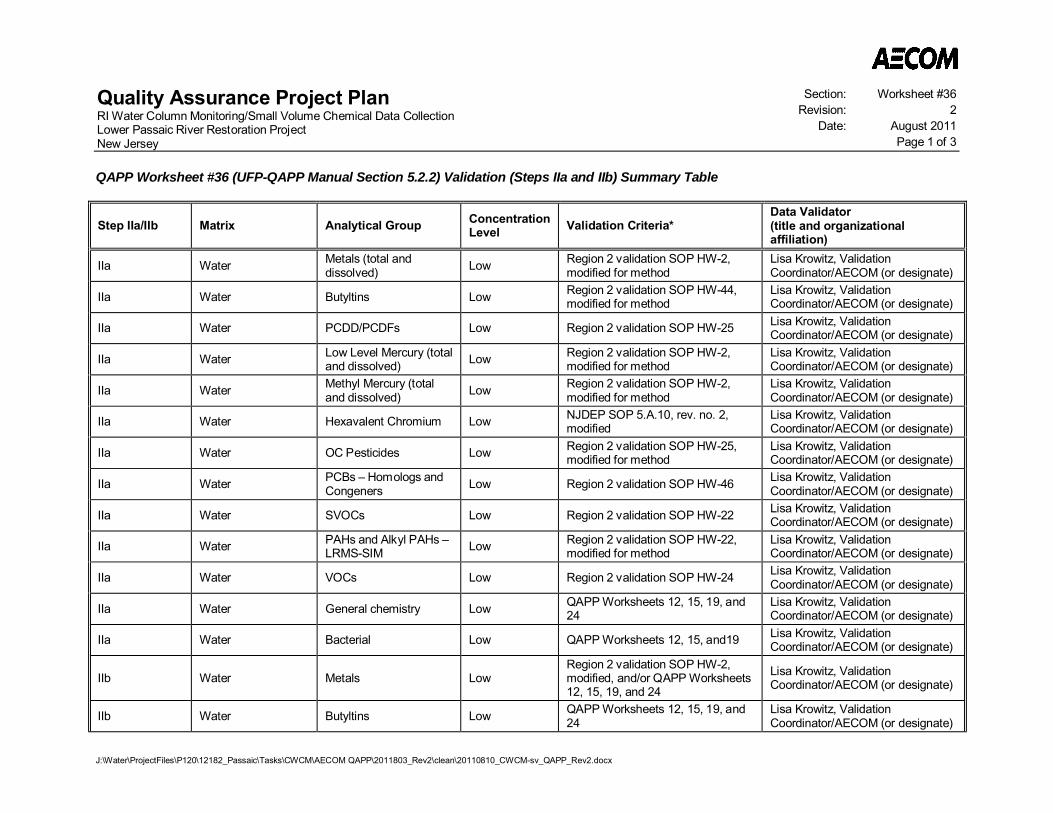
Quality Assurance Project PlanRI Water Column Monitoring/Small Volume Chemical Data CollectionLower Passaic River Restoration ProjectNew Jersey
Section: Worksheet #36Revision: 2
Date: August 2011Page 1 of 3
J:\Water\ProjectFiles\P120\12182_Passaic\Tasks\CWCM\AECOM QAPP\2011803_Rev2\clean\20110810_CWCM-sv_QAPP_Rev2.docx
QAPP Worksheet #36 (UFP-QAPP Manual Section 5.2.2) Validation (Steps IIa and IIb) Summary Table
Step IIa/IIb Matrix Analytical Group ConcentrationLevel Validation Criteria*
Data Validator(title and organizationalaffiliation)
IIa Water Metals (total anddissolved) Low Region 2 validation SOP HW-2,
modified for methodLisa Krowitz, ValidationCoordinator/AECOM (or designate)
IIa Water Butyltins Low Region 2 validation SOP HW-44,modified for method
Lisa Krowitz, ValidationCoordinator/AECOM (or designate)
IIa Water PCDD/PCDFs Low Region 2 validation SOP HW-25 Lisa Krowitz, ValidationCoordinator/AECOM (or designate)
IIa Water Low Level Mercury (totaland dissolved) Low Region 2 validation SOP HW-2,
modified for methodLisa Krowitz, ValidationCoordinator/AECOM (or designate)
IIa Water Methyl Mercury (totaland dissolved) Low Region 2 validation SOP HW-2,
modified for methodLisa Krowitz, ValidationCoordinator/AECOM (or designate)
IIa Water Hexavalent Chromium Low NJDEP SOP 5.A.10, rev. no. 2,modified
Lisa Krowitz, ValidationCoordinator/AECOM (or designate)
IIa Water OC Pesticides Low Region 2 validation SOP HW-25,modified for method
Lisa Krowitz, ValidationCoordinator/AECOM (or designate)
IIa Water PCBs – Homologs andCongeners Low Region 2 validation SOP HW-46 Lisa Krowitz, Validation
Coordinator/AECOM (or designate)
IIa Water SVOCs Low Region 2 validation SOP HW-22 Lisa Krowitz, ValidationCoordinator/AECOM (or designate)
IIa Water PAHs and Alkyl PAHs –LRMS-SIM Low Region 2 validation SOP HW-22,
modified for methodLisa Krowitz, ValidationCoordinator/AECOM (or designate)
IIa Water VOCs Low Region 2 validation SOP HW-24 Lisa Krowitz, ValidationCoordinator/AECOM (or designate)
IIa Water General chemistry Low QAPP Worksheets 12, 15, 19, and24
Lisa Krowitz, ValidationCoordinator/AECOM (or designate)
IIa Water Bacterial Low QAPP Worksheets 12, 15, and19 Lisa Krowitz, ValidationCoordinator/AECOM (or designate)
IIb Water Metals LowRegion 2 validation SOP HW-2,modified, and/or QAPP Worksheets12, 15, 19, and 24
Lisa Krowitz, ValidationCoordinator/AECOM (or designate)
IIb Water Butyltins Low QAPP Worksheets 12, 15, 19, and24
Lisa Krowitz, ValidationCoordinator/AECOM (or designate)
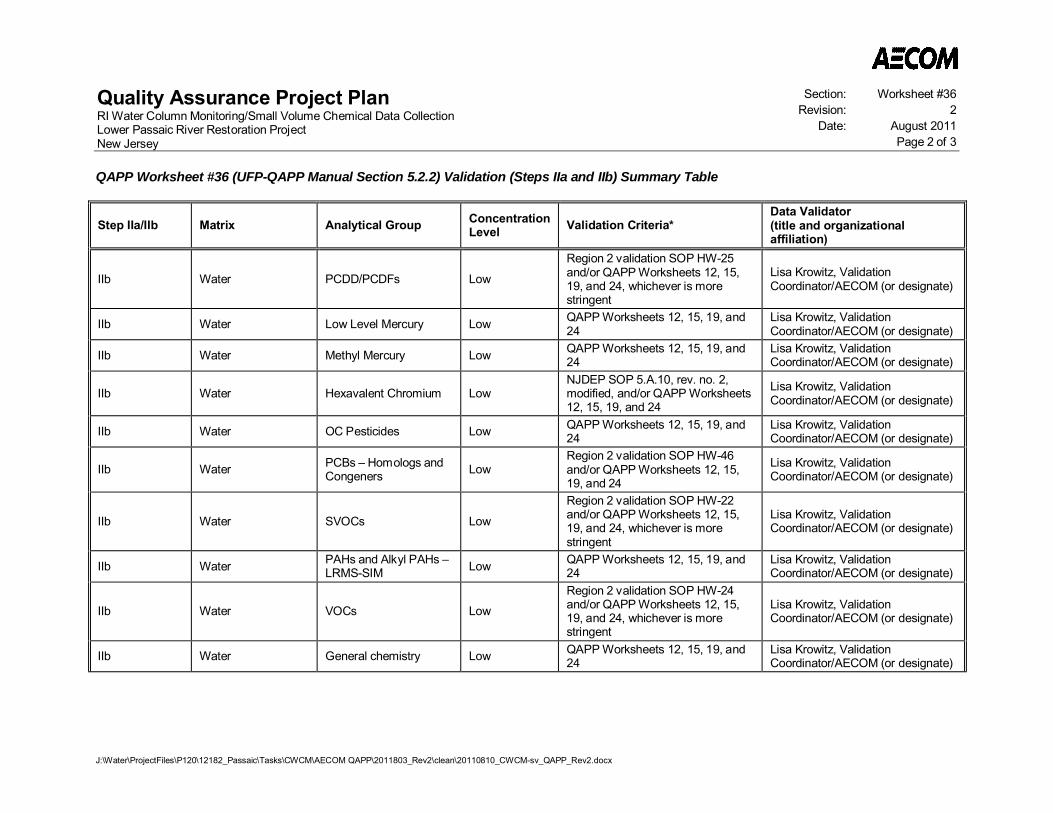
Quality Assurance Project PlanRI Water Column Monitoring/Small Volume Chemical Data CollectionLower Passaic River Restoration ProjectNew Jersey
Section: Worksheet #36Revision: 2
Date: August 2011Page 2 of 3
QAPP Worksheet #36 (UFP-QAPP Manual Section 5.2.2) Validation (Steps IIa and IIb) Summary Table
J:\Water\ProjectFiles\P120\12182_Passaic\Tasks\CWCM\AECOM QAPP\2011803_Rev2\clean\20110810_CWCM-sv_QAPP_Rev2.docx
Step IIa/IIb Matrix Analytical Group ConcentrationLevel Validation Criteria*
Data Validator(title and organizationalaffiliation)
IIb Water PCDD/PCDFs Low
Region 2 validation SOP HW-25and/or QAPP Worksheets 12, 15,19, and 24, whichever is morestringent
Lisa Krowitz, ValidationCoordinator/AECOM (or designate)
IIb Water Low Level Mercury Low QAPP Worksheets 12, 15, 19, and24
Lisa Krowitz, ValidationCoordinator/AECOM (or designate)
IIb Water Methyl Mercury Low QAPP Worksheets 12, 15, 19, and24
Lisa Krowitz, ValidationCoordinator/AECOM (or designate)
IIb Water Hexavalent Chromium LowNJDEP SOP 5.A.10, rev. no. 2,modified, and/or QAPP Worksheets12, 15, 19, and 24
Lisa Krowitz, ValidationCoordinator/AECOM (or designate)
IIb Water OC Pesticides Low QAPP Worksheets 12, 15, 19, and24
Lisa Krowitz, ValidationCoordinator/AECOM (or designate)
IIb Water PCBs – Homologs andCongeners Low
Region 2 validation SOP HW-46and/or QAPP Worksheets 12, 15,19, and 24
Lisa Krowitz, ValidationCoordinator/AECOM (or designate)
IIb Water SVOCs Low
Region 2 validation SOP HW-22and/or QAPP Worksheets 12, 15,19, and 24, whichever is morestringent
Lisa Krowitz, ValidationCoordinator/AECOM (or designate)
IIb Water PAHs and Alkyl PAHs –LRMS-SIM Low QAPP Worksheets 12, 15, 19, and
24Lisa Krowitz, ValidationCoordinator/AECOM (or designate)
IIb Water VOCs Low
Region 2 validation SOP HW-24and/or QAPP Worksheets 12, 15,19, and 24, whichever is morestringent
Lisa Krowitz, ValidationCoordinator/AECOM (or designate)
IIb Water General chemistry Low QAPP Worksheets 12, 15, 19, and24
Lisa Krowitz, ValidationCoordinator/AECOM (or designate)
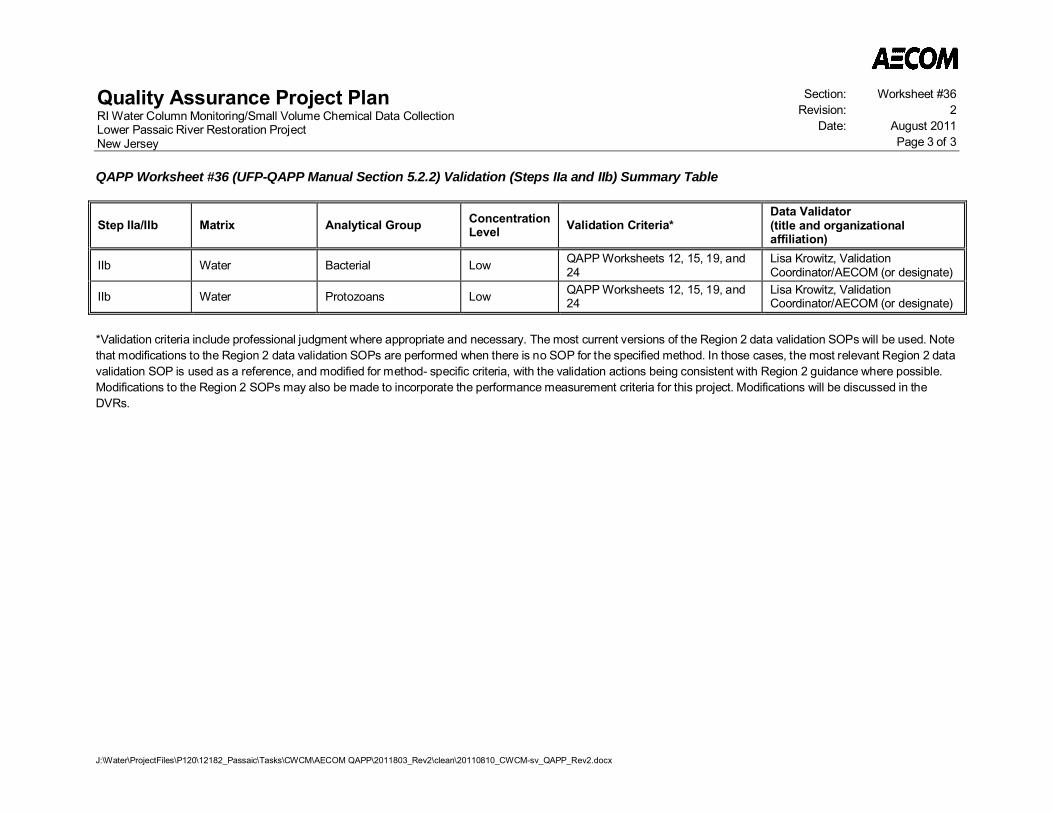
Quality Assurance Project PlanRI Water Column Monitoring/Small Volume Chemical Data CollectionLower Passaic River Restoration ProjectNew Jersey
Section: Worksheet #36Revision: 2
Date: August 2011Page 3 of 3
QAPP Worksheet #36 (UFP-QAPP Manual Section 5.2.2) Validation (Steps IIa and IIb) Summary Table
J:\Water\ProjectFiles\P120\12182_Passaic\Tasks\CWCM\AECOM QAPP\2011803_Rev2\clean\20110810_CWCM-sv_QAPP_Rev2.docx
Step IIa/IIb Matrix Analytical Group ConcentrationLevel Validation Criteria*
Data Validator(title and organizationalaffiliation)
IIb Water Bacterial Low QAPP Worksheets 12, 15, 19, and24
Lisa Krowitz, ValidationCoordinator/AECOM (or designate)
IIb Water Protozoans Low QAPP Worksheets 12, 15, 19, and24
Lisa Krowitz, ValidationCoordinator/AECOM (or designate)
*Validation criteria include professional judgment where appropriate and necessary. The most current versions of the Region 2 data validation SOPs will be used. Notethat modifications to the Region 2 data validation SOPs are performed when there is no SOP for the specified method. In those cases, the most relevant Region 2 datavalidation SOP is used as a reference, and modified for method- specific criteria, with the validation actions being consistent with Region 2 guidance where possible.Modifications to the Region 2 SOPs may also be made to incorporate the performance measurement criteria for this project. Modifications will be discussed in theDVRs.
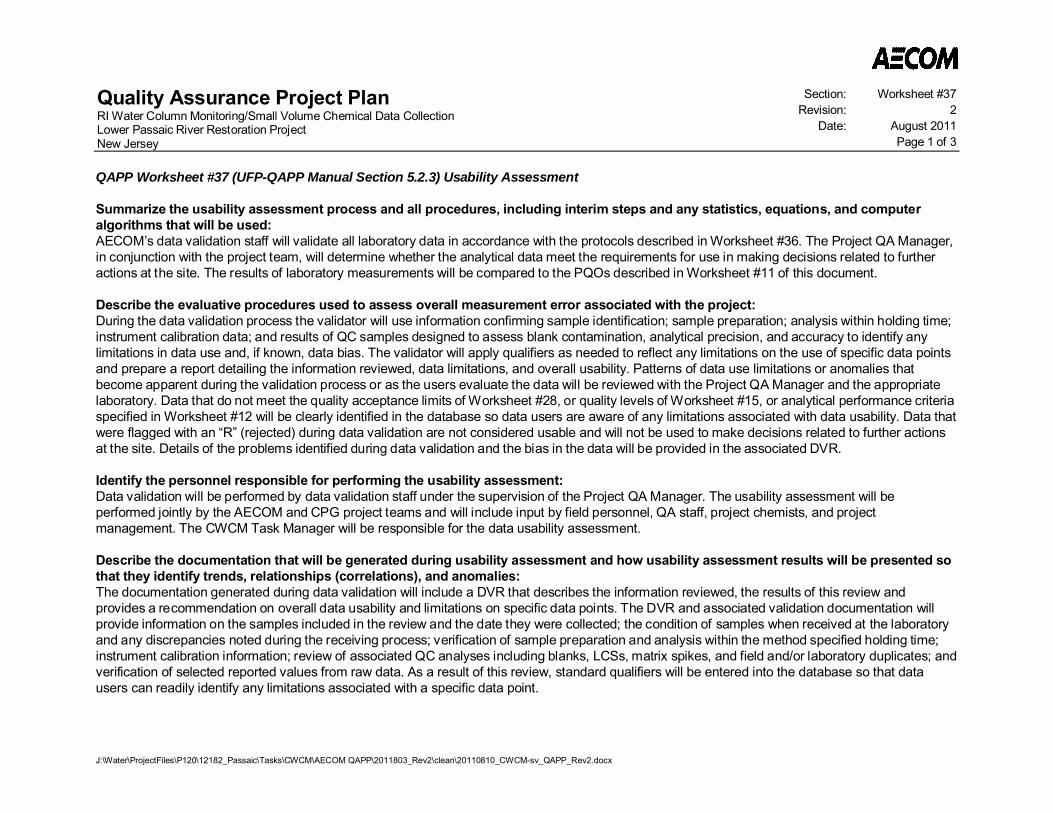
Quality Assurance Project PlanRI Water Column Monitoring/Small Volume Chemical Data CollectionLower Passaic River Restoration ProjectNew Jersey
Section: Worksheet #37Revision: 2
Date: August 2011Page 1 of 3
J:\Water\ProjectFiles\P120\12182_Passaic\Tasks\CWCM\AECOM QAPP\2011803_Rev2\clean\20110810_CWCM-sv_QAPP_Rev2.docx
QAPP Worksheet #37 (UFP-QAPP Manual Section 5.2.3) Usability Assessment
Summarize the usability assessment process and all procedures, including interim steps and any statistics, equations, and computeralgorithms that will be used:AECOM’s data validation staff will validate all laboratory data in accordance with the protocols described in Worksheet #36. The Project QA Manager,in conjunction with the project team, will determine whether the analytical data meet the requirements for use in making decisions related to furtheractions at the site. The results of laboratory measurements will be compared to the PQOs described in Worksheet #11 of this document.
Describe the evaluative procedures used to assess overall measurement error associated with the project:During the data validation process the validator will use information confirming sample identification; sample preparation; analysis within holding time;instrument calibration data; and results of QC samples designed to assess blank contamination, analytical precision, and accuracy to identify anylimitations in data use and, if known, data bias. The validator will apply qualifiers as needed to reflect any limitations on the use of specific data pointsand prepare a report detailing the information reviewed, data limitations, and overall usability. Patterns of data use limitations or anomalies thatbecome apparent during the validation process or as the users evaluate the data will be reviewed with the Project QA Manager and the appropriatelaboratory. Data that do not meet the quality acceptance limits of Worksheet #28, or quality levels of Worksheet #15, or analytical performance criteriaspecified in Worksheet #12 will be clearly identified in the database so data users are aware of any limitations associated with data usability. Data thatwere flagged with an “R” (rejected) during data validation are not considered usable and will not be used to make decisions related to further actionsat the site. Details of the problems identified during data validation and the bias in the data will be provided in the associated DVR.
Identify the personnel responsible for performing the usability assessment:Data validation will be performed by data validation staff under the supervision of the Project QA Manager. The usability assessment will beperformed jointly by the AECOM and CPG project teams and will include input by field personnel, QA staff, project chemists, and projectmanagement. The CWCM Task Manager will be responsible for the data usability assessment.
Describe the documentation that will be generated during usability assessment and how usability assessment results will be presented sothat they identify trends, relationships (correlations), and anomalies:The documentation generated during data validation will include a DVR that describes the information reviewed, the results of this review andprovides a recommendation on overall data usability and limitations on specific data points. The DVR and associated validation documentation willprovide information on the samples included in the review and the date they were collected; the condition of samples when received at the laboratoryand any discrepancies noted during the receiving process; verification of sample preparation and analysis within the method specified holding time;instrument calibration information; review of associated QC analyses including blanks, LCSs, matrix spikes, and field and/or laboratory duplicates; andverification of selected reported values from raw data. As a result of this review, standard qualifiers will be entered into the database so that datausers can readily identify any limitations associated with a specific data point.
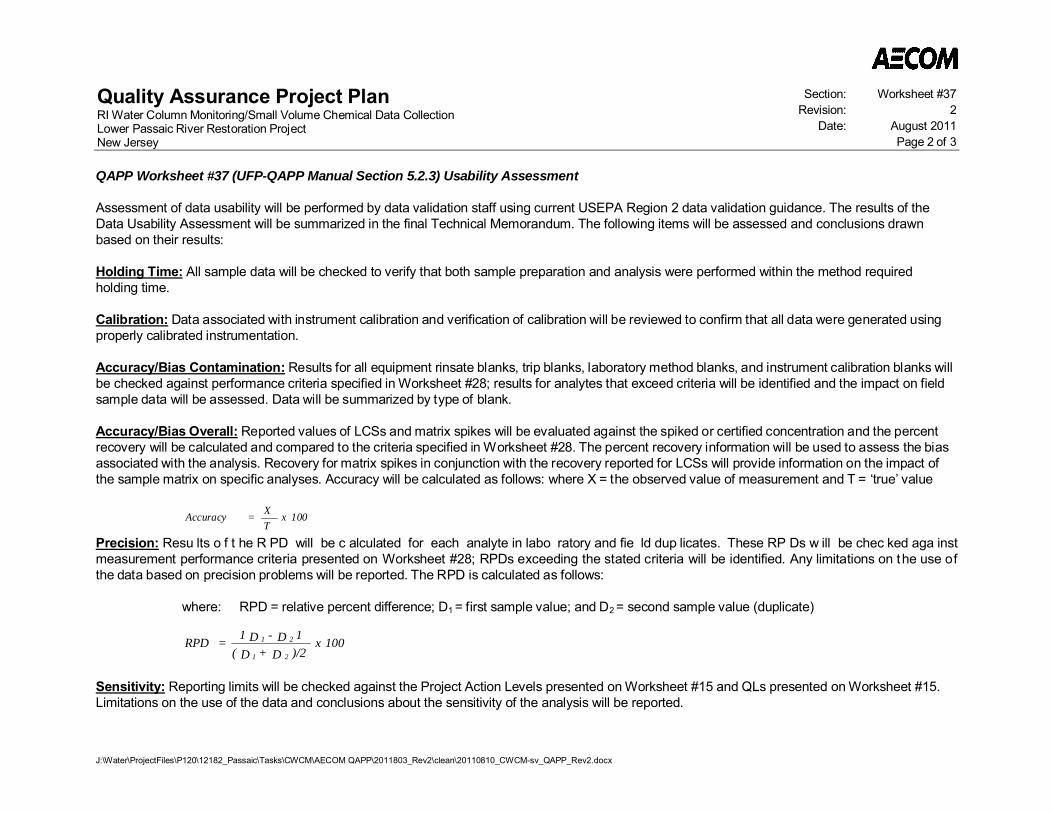
Quality Assurance Project PlanRI Water Column Monitoring/Small Volume Chemical Data CollectionLower Passaic River Restoration ProjectNew Jersey
Section: Worksheet #37Revision: 2
Date: August 2011Page 2 of 3
QAPP Worksheet #37 (UFP-QAPP Manual Section 5.2.3) Usability Assessment
J:\Water\ProjectFiles\P120\12182_Passaic\Tasks\CWCM\AECOM QAPP\2011803_Rev2\clean\20110810_CWCM-sv_QAPP_Rev2.docx
Assessment of data usability will be performed by data validation staff using current USEPA Region 2 data validation guidance. The results of theData Usability Assessment will be summarized in the final Technical Memorandum. The following items will be assessed and conclusions drawnbased on their results:
Holding Time: All sample data will be checked to verify that both sample preparation and analysis were performed within the method requiredholding time.
Calibration: Data associated with instrument calibration and verification of calibration will be reviewed to confirm that all data were generated usingproperly calibrated instrumentation.
Accuracy/Bias Contamination: Results for all equipment rinsate blanks, trip blanks, laboratory method blanks, and instrument calibration blanks willbe checked against performance criteria specified in Worksheet #28; results for analytes that exceed criteria will be identified and the impact on fieldsample data will be assessed. Data will be summarized by type of blank.
Accuracy/Bias Overall: Reported values of LCSs and matrix spikes will be evaluated against the spiked or certified concentration and the percentrecovery will be calculated and compared to the criteria specified in Worksheet #28. The percent recovery information will be used to assess the biasassociated with the analysis. Recovery for matrix spikes in conjunction with the recovery reported for LCSs will provide information on the impact ofthe sample matrix on specific analyses. Accuracy will be calculated as follows: where X = the observed value of measurement and T = ‘true’ value
100xTX=Accuracy
Precision: Resu lts o f t he R PD will be c alculated for each analyte in labo ratory and fie ld dup licates. These RP Ds w ill be chec ked aga instmeasurement performance criteria presented on Worksheet #28; RPDs exceeding the stated criteria will be identified. Any limitations on the use ofthe data based on precision problems will be reported. The RPD is calculated as follows:
where: RPD = relative percent difference; D1 = first sample value; and D2 = second sample value (duplicate)
100x)/2D+D(1D-D1=RPD
21
21
Sensitivity: Reporting limits will be checked against the Project Action Levels presented on Worksheet #15 and QLs presented on Worksheet #15.Limitations on the use of the data and conclusions about the sensitivity of the analysis will be reported.
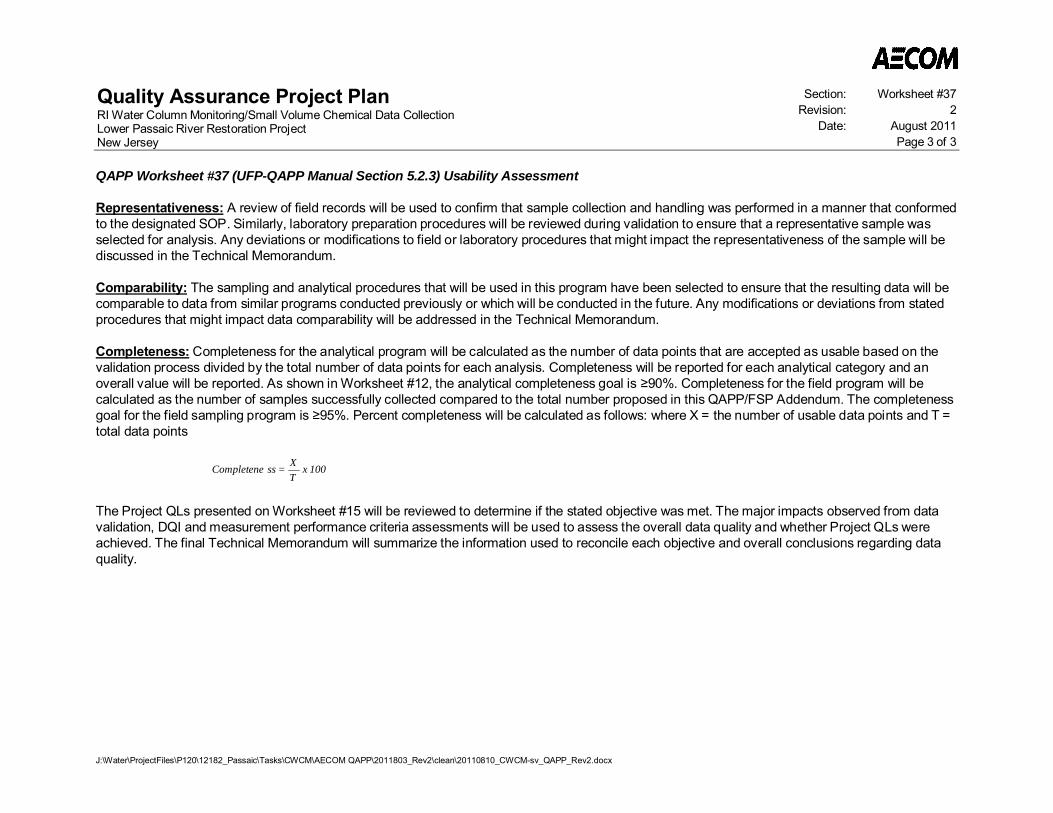
Quality Assurance Project PlanRI Water Column Monitoring/Small Volume Chemical Data CollectionLower Passaic River Restoration ProjectNew Jersey
Section: Worksheet #37Revision: 2
Date: August 2011Page 3 of 3
QAPP Worksheet #37 (UFP-QAPP Manual Section 5.2.3) Usability Assessment
J:\Water\ProjectFiles\P120\12182_Passaic\Tasks\CWCM\AECOM QAPP\2011803_Rev2\clean\20110810_CWCM-sv_QAPP_Rev2.docx
Representativeness: A review of field records will be used to confirm that sample collection and handling was performed in a manner that conformedto the designated SOP. Similarly, laboratory preparation procedures will be reviewed during validation to ensure that a representative sample wasselected for analysis. Any deviations or modifications to field or laboratory procedures that might impact the representativeness of the sample will bediscussed in the Technical Memorandum.
Comparability: The sampling and analytical procedures that will be used in this program have been selected to ensure that the resulting data will becomparable to data from similar programs conducted previously or which will be conducted in the future. Any modifications or deviations from statedprocedures that might impact data comparability will be addressed in the Technical Memorandum.
Completeness: Completeness for the analytical program will be calculated as the number of data points that are accepted as usable based on thevalidation process divided by the total number of data points for each analysis. Completeness will be reported for each analytical category and anoverall value will be reported. As shown in Worksheet #12, the analytical completeness goal is 90%. Completeness for the field program will becalculated as the number of samples successfully collected compared to the total number proposed in this QAPP/FSP Addendum. The completenessgoal for the field sampling program is 95%. Percent completeness will be calculated as follows: where X = the number of usable data points and T =total data points
100xTX=ssCompletene
The Project QLs presented on Worksheet #15 will be reviewed to determine if the stated objective was met. The major impacts observed from datavalidation, DQI and measurement performance criteria assessments will be used to assess the overall data quality and whether Project QLs wereachieved. The final Technical Memorandum will summarize the information used to reconcile each objective and overall conclusions regarding dataquality.
Quality Assurance Project PlanRI Water Column Monitoring/Small Volume Chemical Data CollectionLower Passaic River Restoration ProjectNew Jersey
Section: Attachment 1Revision: 2
Date: August 2011
J:\Water\ProjectFiles\P120\12182_Passaic\Tasks\CWCM\AECOM QAPP\2011803_Rev2\clean\20110810_CWCM-sv_QAPP_Rev2.docx
Attachment 1
References
Quality Assurance Project PlanRI Water Column Monitoring/Small Volume Chemical Data CollectionLower Passaic River Restoration ProjectNew Jersey
Section: Attachment 1Revision: 2
Date: August 2011Page 1 of 4
J:\Water\ProjectFiles\P120\12182_Passaic\Tasks\CWCM\AECOM QAPP\2011803_Rev2\clean\20110810_CWCM-sv_QAPP_Rev2.docx
AECOM in prep. Low Resolution Coring Characterization Summary. Lower Passaic River Study Area RI/FS.Draft submitted February 2010.
AECOM 2010a. Quality Assurance Project Plan/Field Sampling Plan Addendum. Remedial InvestigationWater Column Monitoring/Physical Data Collection for the Lower Passaic River, Newark Bay and WetWeather Monitoring. Lower Passaic River Restoration Project. Revision 4. March 2010.
AECOM 2010b. Lower Passaic River Restoration Project Data Management Plan. AECOM, Westford, MA.July 2010, including all revisions.
AECOM 2009. Quality Management Plan, Lower Passaic River Restoration Project, CERCLA Docket No.02-2007-2009. AECOM, Westford, MA, September 2009 or current version.
AECOM 2008. Lower Passaic River Restoration Project. Periodic Bathymetric Surveys. Quality AssuranceProject Plan. AECOM, Westford, MA. October 2008.
APHA 1998. Standard Methods for the examination of Water and Wastewater, 20th Edition, American PublicHealth Association, 1998
ASTM 2010 Annual Book of ASTM Standards, Water, and Environmental Technology, Section 11, Volumes11.01 and 11.02,
Battelle 2005. Lower Passaic River Restoration Project. Pathways Analysis Report. Prepared for U.S.Environmental Protection Agency Region 2 and U.S. Army Corps of Engineers. Battelle, Duxbury,Massachusetts.
CARB 1997 Method 429: Determination of Polycyclic Aromatic Hydrocarbon Emissions from StationarySources, Air Resources Board, California Environmental Protection Agency
CLH 1995. Work Plan, Vol. 1 of Passaic River Study Area Remedial Investigation Work Plans. ChemicalLand Holdings (now Tierra Solutions, Inc.), Newark, NJ. January 1995.
ENSR 2008. Lower Passaic River Restoration Project RI/FS. Quality Assurance Project Plan. RI LowResolution Coring/Sediment Sampling. Revision 4. ENSR, Westford, MA. October 2008.
Iannuzzi, T.J. and D.F. Ludwig. 2004. Historical and current ecology of the Lower Passaic River. Urb Habit2(1):3–30.
Iannuzzi, T.J., D.F. Ludwig, J.C. Kinnell, J.M. Wallin, W.H. Desvousges, and R.W. Dunford. 2002. Acommon tragedy: history of an urban river. Amherst Scientific Publishers, Amherst, MA.
Krone, C.A.; Brown, D.W.; Burrows, D.G.; Bogar, R.G.; Chan, S.; Varanasi, U.A. 1988 Method forAnalysis of Butyltin Species and Measurement of Butyltins in Sediment and English Sole Livers fromPuget Sound, Environmental Conservation Division, Northwest and Alaska Fisheries Center,National Marine Fisheries Service, NOAA, November, 1988.
Malcolm Pirnie, Inc. (MPI) 2004-2005. LPRSA RI/FS Sampling Program. www.ourpassaic.org (Lastaccessed January 20, 2008).
Quality Assurance Project PlanRI Water Column Monitoring/Small Volume Chemical Data CollectionLower Passaic River Restoration ProjectNew Jersey
Section: Attachment 1Revision: 2
Date: August 2011Page 2 of 4
J:\Water\ProjectFiles\P120\12182_Passaic\Tasks\CWCM\AECOM QAPP\2011803_Rev2\clean\20110810_CWCM-sv_QAPP_Rev2.docx
Malcolm Pirnie, Inc. (MPI) 2005. Lower Passaic River Restoration Project. Quality Assurance Project Plan.Prepared for US Environmental Protection Agency and US Army Corps of Engineers. Malcolm Pirnie,Inc., White Plains, NY. August 2005.
Malcolm Pirnie, Inc. (MPI) 2006. Lower Passaic River Restoration Project. Draft Field Sampling Plan.Volume 1. Prepared for US Environmental Protection Agency, US Army Corps of Engineers, and NewJersey Department of Transportation/Office of Maritime Resources. Malcolm Pirnie, Inc., White Plains,NY; Earth Tech, Inc., Bloomfield, NJ; Battelle, Stony Brook, NY. January 2006.
Malcolm Pirnie, Inc. (MPI) 2007a. Draft Source Control Early Action Focussed Feasilibity Study. for LowerPassaic River Restoration Project. Malcolm Pirnie, Inc., White Plains, NY. June 2007.
Malcolm Pirnie, Inc. (MPI) 2007b. Lower Passaic River Restoration Project. Conceptual Site Model.Prepared for US Environmental Protection Agency, US Army Corps of Engineers, and New JerseyDepartment of Transportation/Office of Maritime Resources. Malcolm Pirnie, Inc., White Plains, NY.February 2007.
Malcolm Pirnie, Inc. (MPI) 2007c. QAPP/FSP Addendum for Lower Passaic River Restoration ProjectEmpirical Mass Balance Evaluation. Malcolm Pirnie, Inc., White Plains, NY. December 2007.
Malcolm Pirnie, Inc. (MPI), Earth Tech, Battelle. 2006. Lower Passaic River Restoration Project. Draft FieldSampling Plan. Volume 2. Prepared for US Environmental Protection Agency and US Army Corps ofEngineers. Malcolm Pirnie, Inc., White Plains, NY; June 2006.
National Oceanic and Atmospheric Administration (NOAA). 1984. A geochemical assessment ofsedimentation and contaminant distributions in the Hudson-Raritan Estuary. National Oceanic andAtmospheric Administration, National Ocean Service, Rockville, MD.
NJDEP 2008. Surface Water Quality Standards. N.J.A.C. 7:9B. Available online:http://www.nj.gov/dep/rules/rules/njac7_9b.pdf
NY/NJ HEP 2004. Contamination assessment and reduction project. Data download and GIS mappinginformation. NY/NJ Harbor Estuary Program. Available online: http://www.carpweb.org/main.html.
Rutgers University. 2004 to 2005. www.marine.rutgers.edu/cool/passaic/ (accessed January 20, 2008).
Sommerfield, C.K. and R. J. Chant. 2010. Mechanisms of Sediment Trapping and Accumulation in NewarkBay, New Jersey: An Engineered Estuarine Basin (HRF 008/07A). Prepared for the Hudson RiverFoundation, July 2010. Suter, G.W. II, and C.L. Tsao. 1996. Toxicological Benchmarks for Screening ofPotential Contaminants of Concern for Effects on Aquatic Biota on Oak Ridge Reservation: 1996Revision. Oak Ridge National Laboratory, Oak Ridge, TN. 104pp. ES/ER/TM-96/R2.
Suszkowski, D.J. 1978. Sedimentology of Newark Bay, New Jersey: an urban estuarine bay. DoctoralDissertation, University of Delaware.
Tierra Solutions, Inc. 1999. Passaic River Study Area Ecological Sampling Plan. Quality Assurance ProjectPlan. March 1999.
Quality Assurance Project PlanRI Water Column Monitoring/Small Volume Chemical Data CollectionLower Passaic River Restoration ProjectNew Jersey
Section: Attachment 1Revision: 2
Date: August 2011Page 3 of 4
J:\Water\ProjectFiles\P120\12182_Passaic\Tasks\CWCM\AECOM QAPP\2011803_Rev2\clean\20110810_CWCM-sv_QAPP_Rev2.docx
Tierra Solutions, Inc. 2004. Newark Bay Study Area Remedial Investigation Work Plan. Sediment Samplingand Source Identification Program. Newark Bay, New Jersey. Volume 1a of 3. Inventory and OverviewReport of Historical Data. Text and Appendices. Revision 0. June 2004.
Tierra Solutions, Inc. 2011. Combined Sewer Overflow/Stormwater Outfall Investigation Quality AssuranceProject Plan. Lower Passaic River Study Area.
USEPA 1983. Methods for Chemical Analysis of Water and Wastes. EPA-600/4-79-020, Office of Water.March 1979 and Revised March 1983
USEPA 1997. Methods for the Determination of Chemical Substances in Marine and EstuarineEnvironmental Matrices - 2nd Edition, EPA/600/R-97/072, Office of Research and Development,1997
USACE 1997. Final environmental impact statement on the Newark Bay Confined Disposal Facility.U.S.Army Corps of Engineers, New York District, New York, NY. April 1997.
USACE 2001. Requirements of Sampling and Analysis Plans. EM-200-1-3. February 2001.
USACE 2007. Lower Passaic River Restoration Project source control early action (Draft). Appendix F,Navigation Studies, CENAN - Lower Passaic River navigation analysis. US Army Corps of EngineersNew York District.
USEPA 2005. Intergovernmental Data Quality Task Force Uniform Federal Policy for Quality AssuranceProject Plans Evaluating, Assessing, and Documenting Environmental Data Collection and UsePrograms Part 1: UFP-QAPP Manual Publication Numbers: EPA: EPA-505-B-04-900A DOD: DTICADA 427785 Final Version 1 March 2005.
USEPA 2007a. Administrative Settlement Agreement and Order on Consent for Remedial Investigation/Feasibility Study. CERCL Docket No. 02-2007-2009. May 2007.
USEPA 2007b. Contract Laboratory Program Guidance for Field Samplers. OSWER 9240.0-44. EPA 540-R-07-06. FINAL July 2007.
USEPA 2008a ``Final Update IV'' to the Third Edition of the manual, ``Test Methods for Evaluating SolidWaste,Physical/Chemical Methods,'' EPA publication SW-846, Office of Solid Waste, January 3,2008 Available online : http://www.epa.gov/epawaste/hazard/testmethods/sw846/online/index.htm
USEPA 2009a. National Recommended Water Quality Criteria. Last updated December 2, 2009. Availableonline : http://www.epa.gov/waterscience/criteria/wqctable/
USEPA 2009b. Drinking Water Contaminants, Maximum Contaminant Levels. Last updated September 11,2009. Available online: http://www.epa.gov/safewater/contaminants/index.html/
USEPA 2009c. Regional Screening Levels (Formerly PRGs). Screening Levels for Chemical Contaminants.Updated December 2009. Available online: http://www.epa.gov/region9/superfund/prg/index.html/
USEPA 2010a Approved General-Purpose Methods, Office of Water, Office of Science and Technology.Available online: http://water.epa.gov/scitech/swguidance/methods/methods_index.cfm

Quality Assurance Project PlanRI Water Column Monitoring/Small Volume Chemical Data CollectionLower Passaic River Restoration ProjectNew Jersey
Section: Attachment 1Revision: 2
Date: August 2011Page 4 of 4
J:\Water\ProjectFiles\P120\12182_Passaic\Tasks\CWCM\AECOM QAPP\2011803_Rev2\clean\20110810_CWCM-sv_QAPP_Rev2.docx
USEPA 2010b General Methods, Office of Water, Office of Science and Technology. Available online:http://water.epa.gov/scitech/swguidance/methods/other.cfm
USGS. Gage 01389500 – Passaic River at Little Falls, New Jersey.http://waterdata.usgs.gov/nj/nwis/nwisman/?site_no=01389500&agency_cd=USGS
Windward 2009a. Lower Passaic River Restoration Project. Lower Passaic River Study Area RI/FS. QualityAssurance Project Plan: Fish and decapod crustacean tissue collection for chemical analysis and fishcommunity survey. Final. Prepared for Cooperating Parties Group, Newark, New Jersey. WindwardEnvironmental LLC, Seattle, WA
Windward 2009b. Lower Passaic River Restoration Project. Lower Passaic River Study Area RI/FS. QualityAssurance Project Plan: Surface sediment chemical analyses and benthic invertebrate toxicity andbioaccumulation testing. Final. Prepared for Cooperating Parties Group, Newark, New Jersey. October8, 2009. Windward Environmental LLC, Seattle, WA.
Windward and AECOM 2009. Lower Passaic River Study Area Human Health and Ecological RiskAssessment Streamlined 2009 Problem Formulation Document. Prepared for Cooperating PartiesGroup, Newark, New Jersey. October 8, 2009. Windward Environmental LLC, Seattle, WA andAECOM, Westford, MA.
Quality Assurance Project Plan RI Water Column Monitoring/Small Volume Chemical Data Collection Lower Passaic River Restoration Project New Jersey
Section: Appe ndix A Revision: 3
Date: July 2012
Q:\mw2007\Projects\60145884\V110\Kris_20120622_CWCM-sv_QAPP_Rev3.docx
Appendix A WCM/Chemical Data Collection Field Sampling Plan Addendum Lower Passaic River Restoration Project
Quality Assurance Project Plan RI Water Column Monitoring /Small Volume Chemical Data Collection Lower Passaic River Restoration Project New Jersey
Section: Appe ndix A Revision: 2
Date: Augu st 2011 Page 1 of 21
J:\Water\ProjectFiles\P120\12182_Passaic\Tasks\CWCM\AECOM QAPP\2011803_Rev2\clean\20110810_CWCM-sv_QAPP_Appendix-A_rev2.docx
1.0 Introduction
This Field Sampling Plan (FSP) has been prepared by the Cooperating Parties Group (CPG) as an addendum to the Lower Passaic River Restoration Project (LPRRP) FSP, Volume 1 (MPI 2006). The survey and sampling activities described in this FSP Addendum were designed as part of a Water Column Monitoring (WCM) Program in support of the Remedial Investigation and Feasibility Study (RI/FS) that the CPG is required to carry out under the Settlement Agreement (USEPA 2007). The WCM Program has been divided into two subtasks. The first subtask (addressed in the FSP 2009-01 Addendum and termed the WCM/Physical Data Collection or Physical WCM (PWCM)) (AECOM 2010a) includes collection of physical measurements in the water column (currents, temperature, conductivity, turbidity and solids). The second subtask (addressed in this FSP Addendum and termed the WCM/Chemical Data Collection or Chemical WCM (CWCM) Program) includes sampling and analysis of chemicals in the water column as well as certain physical measurements (such as additional solids and particle size distributions). The design and plan for this second subtask was developed following initiation of the physical data collection, building on the data initially collected.
The proposed investigation described in this FSP Addendum for the CWCM Program includes the collection of small volume surface water samples from multiple stations on the Lower Passaic River (LPR), Newark Bay and its associated waterways. The sampling will be conducted throughout a one year period at up to 17 stations including the lower 17.4 miles of the LPR, the LPR’s major tributaries (Second River, Third River and Saddle River), the LPR above Dundee Dam, five locations in Newark Bay, and Newark Bay’s major tributaries (Hackensack River, Arthur Kill and Kill van Kull). The program includes different sampling strategies based on the specific flow and/or tidal conditions for each event type. The plan for this investigation includes the following components:
A Quality Assurance Project Plan (QAPP) has been prepared for this portion of the investigation detailing the proposed monitoring and associated field, laboratory, and data validation and management methodologies. The QAPP has been prepared following the “Uniform Federal Policy for Implementing Quality Systems” (USEPA 2005) and includes the following documents as appendices:
– This FSP Addendum is provided as an overview of the proposed field investigation and is included as Appendix A to the QAPP.
– Standard operating procedures (SOPs) covering the field elements of the proposed investigation are included as Appendix B to the QAPP.
– Related laboratory SOPs are included as Appendix C to the QAPP.
A Health and Safety Plan (HASP) Addendum (based on the overall LPRRP HASP [MPI 2005a]) addressing the work elements specific to this investigation will be submitted under a separate cover.
1.1 Site background The Lower Passaic River Study Area (LPRSA) encompasses the 17.4-mile tidal reach of the Passaic River below the Dundee Dam, its major tributaries, and the surrounding watershed that hydrologically drain below the Dundee Dam. Overall goals of the RI/FS and a description of the associated investigations have been presented in the Work Plan (MPI 2005b), three FSPs (FSP1 [MPI 2006], FSP2 [MPI et al. 2006], and FSP3 [MPI 2005c]), and a QAPP (MPI 2005d). The CWCM program includes sampling in the Newark Bay Study Area (NBSA), which includes Newark Bay, and the confluences of the Hackensack River, Arthur Kill and Kill
Quality Assurance Project Plan RI Water Column Monitoring /Small Volume Chemical Data Collection Lower Passaic River Restoration Project New Jersey
Section: Appe ndix A Revision: 2
Date: Augu st 2011 Page 2 of 21
J:\Water\ProjectFiles\P120\12182_Passaic\Tasks\CWCM\AECOM QAPP\2011803_Rev2\clean\20110810_CWCM-sv_QAPP_Appendix-A_rev2.docx
van Kull to Newark Bay. Sampling in the NBSA will support the chemical fate and transport (CFT) model and may be used to support the NBSA risk assessment.
1.2 Conceptual site model A conceptual site model (CSM) and methods to update the CSM were developed to examine the assumed sources of contaminants, routes of environmental transport, contaminated media, routes of exposure, and receptors (MPI 2007). The data generated by the investigation described in this FSP Addendum will be used to update the CSM, support numerical modeling of the LPRSA and the NBSA, support the risk assessments (RAs) and guide potential future data collection efforts.
1.3 Sampling objectives While the detailed design of the CWCM program was not fully developed in FSP1, the program outline suggested a complex and multiple-phase sampling program. AECOM has worked with the end users of the data (i.e., human health risk assessment (HHRA) and ecological risk assessment (ERA) teams, the food web model (FWM) team and CFT model team) to develop data use objectives (DUOs) and data quality objectives (DQOs) for the CWCM program. Using the DQO/DUOs, a strategy for the CWCM program has been developed. This FSP Addendum presents the CWCM strategy, with justification for the sampling design and confirmation of the ability to achieve the DQO/DUOs developed by the end users (QAPP Worksheet #11).
A critical issue in the development of a CWCM program is the need to measure the concentrations of constituents present in the water column at low levels, particularly hydrophobic organic constituents (HOCs) such as polychlorinated dibenzo-p-dioxins/polychlorinated dibenzofurans (PCDD/PCDFs), some polychlorinated biphenyl (PCB) congeners, and some semi-volatile organic compounds (SVOCs). For this reason, FSP1 incorporated high volume sample collection methods. These methods have practical implementation constraints. For instance, the time required to collect a single sample limits the ability to capture representative point and quasi-synoptic data (e.g., slack tide). These constraints also make the methods costly to implement. The proposed CWCM program, therefore, relies primarily on small volume water sampling detailed in the QAPP and FSP, supplemented by a subset of high volume sampling (approximately 10% of small volume samples). This phase of the CWCM program includes only small volume water sampling. A program for high volume sampling is being developed as an addendum to the CWCM QAPP.
Broadly defined, the goals of the CWCM Data Collection Program are to:
1. Collect data to support the calibration, validation, and sensitivity analysis of the CFT model. The data will provide information to develop the inflows to the model and to characterize the transport of contaminants in the LPRSA, above Dundee Dam, and the NBSA, including the flux of contaminants from the sediments to the water column through routine monitoring events. Water column contaminant concentration data collected in the LPRSA, above Dundee Dam and the NBSA with sufficient spatial coverage and frequency and over a range of flow conditions will be used to characterize potential gradients, mixing and general inputs to the system.
2. Collect data to characterize the impacts of storm-induced high flow (i.e., not sustained high flow) conditions on contaminant sources and transport in which resuspension of contaminants from the sediment bed and subsequent deposition from the water column are expected to dominate other transport processes. Water column contaminant concentration data collected during high flow
Quality Assurance Project Plan RI Water Column Monitoring /Small Volume Chemical Data Collection Lower Passaic River Restoration Project New Jersey
Section: Appe ndix A Revision: 2
Date: Augu st 2011 Page 3 of 21
J:\Water\ProjectFiles\P120\12182_Passaic\Tasks\CWCM\AECOM QAPP\2011803_Rev2\clean\20110810_CWCM-sv_QAPP_Appendix-A_rev2.docx
conditions will be used to assess the potential for increased contaminant loading to the water column from upstream sources and/or through resuspension of existing sediments.
3. Collect data to characterize the transport of contaminants under conditions of high upstream tidal flow, which occurs during low flow conditions at spring tides. Water column contaminant concentration data collected during a combination of low flow and spring tide conditions will be used to better assess the up-river transport potential and support the understanding of the fate and transport for the LPRSA CSM and LPR/Newark Bay Model.
4. Estimate average water column concentrations of contaminants in the LPRSA for use in exposure point concentration estimation for the HHRA, ERA and FWM.
These monitoring goals have been designed to support the ongoing RI site characterization and modeling efforts. The high volume sampling program will be used to address RI site characterization efforts for the HOCs that may not be detected at levels that meet the project action levels (PALs) of the small volume program. Further details of the high volume sampling program will be provided in the high volume QAPP and FSP Addendum.
2.0 Field activities
2.1 Overview The flow thresholds for the low flow and high flow events were selected from an analysis of the discharge record at Dundee Dam (April 2007 to August 2010). The low flow event threshold was identified by conducting an analysis of the number of events satisfying both the discharge criterion and the spring-tide criterion. The analysis showed that a discharge criterion of <400 cfs was satisfied multiple times (i.e., 8-12 times per calendar years 2007-2009) in each of the years over the period of record at Dundee Dam.
The high flow threshold was identified by conducting a return frequency analysis using the available discharge data at Dundee Dam. A flow event with a return period of 3 months (or 4 occurrences per year) was chosen as the flow threshold that can reasonably be expected to be exceeded during the CWCM period. Accordingly, the discharge associated with the 1 in 3 months event at Dundee Dam was calculated to be 3,000 cfs and is proposed as the minimum flow for a high flow event. High flow sampling will be triggered following seven days of normal (i.e., < 3,000 cfs) flows.
In summary, the proposed CWCM small volume program includes the following three elements:
Routine Events - Water samples will be collected at 17 locations in the LPRSA (including the LPRSA tributaries), above Dundee Dam, Newark Bay, Hackensack River, Arthur Kill, and Kill van Kull for laboratory analysis. A total of five hundred forty (540) samples will be collected through five Routine Events spread over winter (one event), spring (two events), and summer (two events). At least one Routine Event will occur during a spring tide, and one during a neap tide. The sampling events will be conducted over a variety of flow conditions, from 400 to 3,000 cubic feet per second (cfs) at Dundee Dam. The locations of samples collected during flows of < 1,000 cfs will be determined based on flow and tide stage (see Exhibit 1). Where commercial boat traffic does not prohibit anchoring, samples will be collected from the deepest part of the river (thalweg). The thalweg will be determined in the field by measuring and recording the depths across the river at each location, and identifying the deepest point. Samples will be collected at two depths (3 feet (ft) below surface and 3 ft from the bottom) for the stations in the LPR (River Mile [RM] 0 - 17.4) and the NBSA, and at mid-depth for the LPRSA
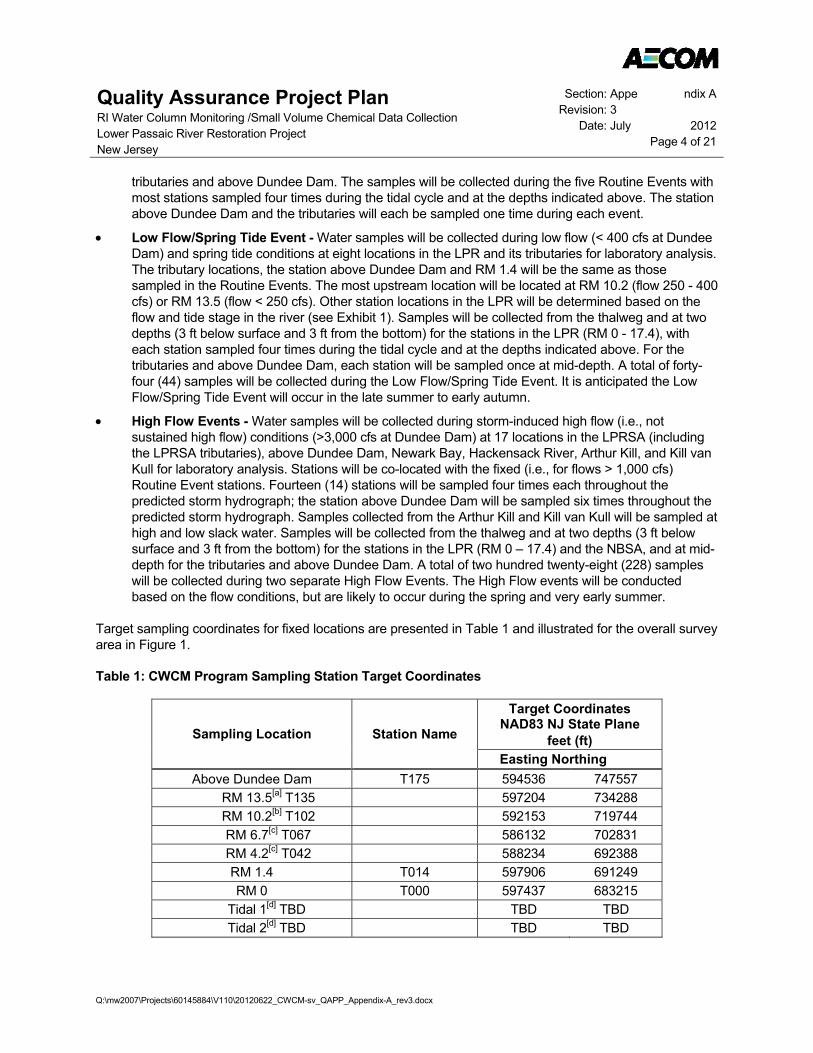
Quality Assurance Project Plan RI Water Column Monitoring /Small Volume Chemical Data Collection Lower Passaic River Restoration Project New Jersey
Section: Appe ndix A Revision: 3
Date: July 2012 Page 4 of 21
Q:\mw2007\Projects\60145884\V110\20120622_CWCM-sv_QAPP_Appendix-A_rev3.docx
tributaries and above Dundee Dam. The samples will be collected during the five Routine Events with most stations sampled four times during the tidal cycle and at the depths indicated above. The station above Dundee Dam and the tributaries will each be sampled one time during each event.
Low Flow/Spring Tide Event - Water samples will be collected during low flow (< 400 cfs at Dundee Dam) and spring tide conditions at eight locations in the LPR and its tributaries for laboratory analysis. The tributary locations, the station above Dundee Dam and RM 1.4 will be the same as those sampled in the Routine Events. The most upstream location will be located at RM 10.2 (flow 250 - 400 cfs) or RM 13.5 (flow < 250 cfs). Other station locations in the LPR will be determined based on the flow and tide stage in the river (see Exhibit 1). Samples will be collected from the thalweg and at two depths (3 ft below surface and 3 ft from the bottom) for the stations in the LPR (RM 0 - 17.4), with each station sampled four times during the tidal cycle and at the depths indicated above. For the tributaries and above Dundee Dam, each station will be sampled once at mid-depth. A total of forty-four (44) samples will be collected during the Low Flow/Spring Tide Event. It is anticipated the Low Flow/Spring Tide Event will occur in the late summer to early autumn.
High Flow Events - Water samples will be collected during storm-induced high flow (i.e., not sustained high flow) conditions (>3,000 cfs at Dundee Dam) at 17 locations in the LPRSA (including the LPRSA tributaries), above Dundee Dam, Newark Bay, Hackensack River, Arthur Kill, and Kill van Kull for laboratory analysis. Stations will be co-located with the fixed (i.e., for flows > 1,000 cfs) Routine Event stations. Fourteen (14) stations will be sampled four times each throughout the predicted storm hydrograph; the station above Dundee Dam will be sampled six times throughout the predicted storm hydrograph. Samples collected from the Arthur Kill and Kill van Kull will be sampled at high and low slack water. Samples will be collected from the thalweg and at two depths (3 ft below surface and 3 ft from the bottom) for the stations in the LPR (RM 0 – 17.4) and the NBSA, and at mid-depth for the tributaries and above Dundee Dam. A total of two hundred twenty-eight (228) samples will be collected during two separate High Flow Events. The High Flow events will be conducted based on the flow conditions, but are likely to occur during the spring and very early summer.
Target sampling coordinates for fixed locations are presented in Table 1 and illustrated for the overall survey area in Figure 1.
Table 1: CWCM Program Sampling Station Target Coordinates
Sampling Location Station Name
Target Coordinates NAD83 NJ State Plane
feet (ft)
Easting Northing Above Dundee Dam T175 594536 747557
RM 13.5[a] T135 597204 734288 RM 10.2[b] T102 592153 719744 RM 6.7[c] T067 586132 702831 RM 4.2[c] T042 588234 692388 RM 1.4 T014 597906 691249 RM 0 T000 597437 683215
Tidal 1[d] TBD TBD TBD Tidal 2[d] TBD TBD TBD
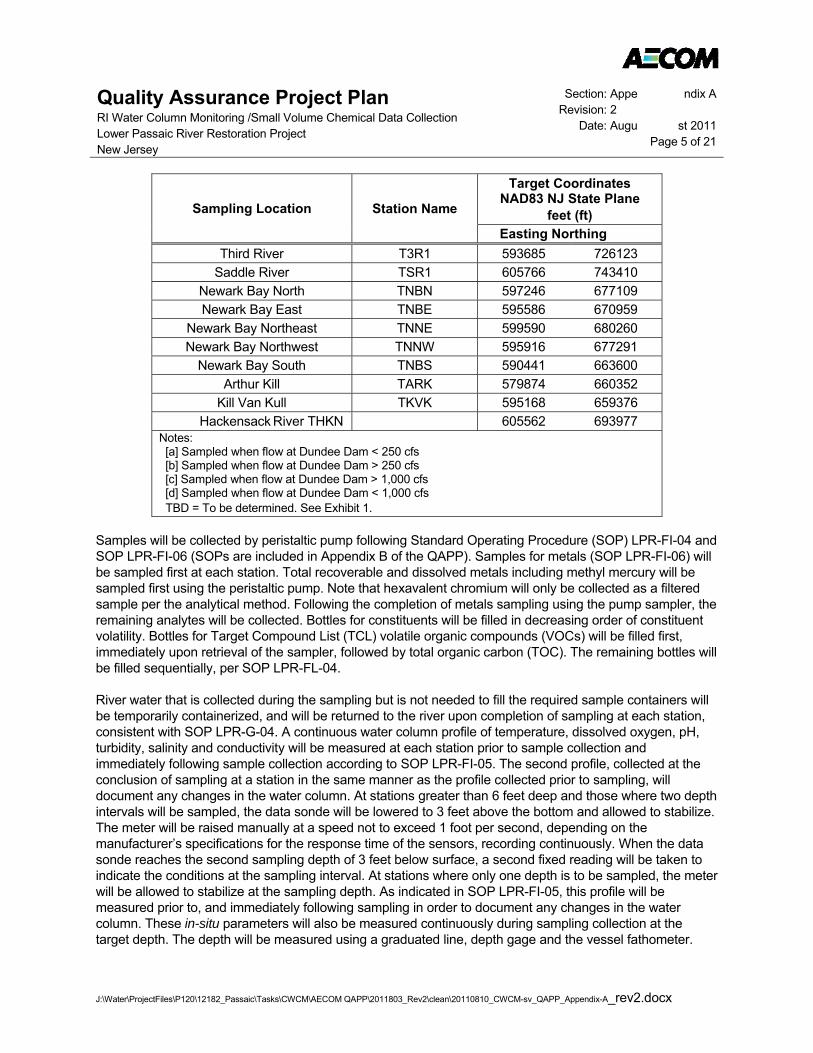
Quality Assurance Project Plan RI Water Column Monitoring /Small Volume Chemical Data Collection Lower Passaic River Restoration Project New Jersey
Section: Appe ndix A Revision: 2
Date: Augu st 2011 Page 5 of 21
J:\Water\ProjectFiles\P120\12182_Passaic\Tasks\CWCM\AECOM QAPP\2011803_Rev2\clean\20110810_CWCM-sv_QAPP_Appendix-A_rev2.docx
Sampling Location Station Name
Target Coordinates NAD83 NJ State Plane
feet (ft)
Easting Northing Third River T3R1 593685 726123
Saddle River TSR1 605766 743410 Newark Bay North TNBN 597246 677109 Newark Bay East TNBE 595586 670959
Newark Bay Northeast TNNE 599590 680260 Newark Bay Northwest TNNW 595916 677291
Newark Bay South TNBS 590441 663600 Arthur Kill TARK 579874 660352
Kill Van Kull TKVK 595168 659376 Hackensack River THKN 605562 693977
Notes: [a] Sampled when flow at Dundee Dam < 250 cfs [b] Sampled when flow at Dundee Dam > 250 cfs [c] Sampled when flow at Dundee Dam > 1,000 cfs [d] Sampled when flow at Dundee Dam < 1,000 cfs TBD = To be determined. See Exhibit 1.
Samples will be collected by peristaltic pump following Standard Operating Procedure (SOP) LPR-FI-04 and SOP LPR-FI-06 (SOPs are included in Appendix B of the QAPP). Samples for metals (SOP LPR-FI-06) will be sampled first at each station. Total recoverable and dissolved metals including methyl mercury will be sampled first using the peristaltic pump. Note that hexavalent chromium will only be collected as a filtered sample per the analytical method. Following the completion of metals sampling using the pump sampler, the remaining analytes will be collected. Bottles for constituents will be filled in decreasing order of constituent volatility. Bottles for Target Compound List (TCL) volatile organic compounds (VOCs) will be filled first, immediately upon retrieval of the sampler, followed by total organic carbon (TOC). The remaining bottles will be filled sequentially, per SOP LPR-FL-04.
River water that is collected during the sampling but is not needed to fill the required sample containers will be temporarily containerized, and will be returned to the river upon completion of sampling at each station, consistent with SOP LPR-G-04. A continuous water column profile of temperature, dissolved oxygen, pH, turbidity, salinity and conductivity will be measured at each station prior to sample collection and immediately following sample collection according to SOP LPR-FI-05. The second profile, collected at the conclusion of sampling at a station in the same manner as the profile collected prior to sampling, will document any changes in the water column. At stations greater than 6 feet deep and those where two depth intervals will be sampled, the data sonde will be lowered to 3 feet above the bottom and allowed to stabilize. The meter will be raised manually at a speed not to exceed 1 foot per second, depending on the manufacturer’s specifications for the response time of the sensors, recording continuously. When the data sonde reaches the second sampling depth of 3 feet below surface, a second fixed reading will be taken to indicate the conditions at the sampling interval. At stations where only one depth is to be sampled, the meter will be allowed to stabilize at the sampling depth. As indicated in SOP LPR-FI-05, this profile will be measured prior to, and immediately following sampling in order to document any changes in the water column. These in-situ parameters will also be measured continuously during sampling collection at the target depth. The depth will be measured using a graduated line, depth gage and the vessel fathometer.
Quality Assurance Project Plan RI Water Column Monitoring /Small Volume Chemical Data Collection Lower Passaic River Restoration Project New Jersey
Section: Appe ndix A Revision: 2
Date: Augu st 2011 Page 6 of 21
J:\Water\ProjectFiles\P120\12182_Passaic\Tasks\CWCM\AECOM QAPP\2011803_Rev2\clean\20110810_CWCM-sv_QAPP_Appendix-A_rev2.docx
Samples will be analyzed for a suite of chemicals similar to that analyzed in the fish/decapod tissue collection (Windward 2009a) and benthic sediment sampling programs (Windward 2009b), including PCDD/PCDFs, PCB congeners and homologs, polycyclic aromatic hydrocarbons (PAHs), alkyl PAHs, TCL SVOCs and associated tentatively identified compounds (TICs), TCL VOCs and associated TICs, butyltins, organochlorine (OC) pesticides, mercury (Hg), methyl mercury, Target Analyte List (TAL) metals, titanium (Ti), and cyanide. In addition to these parameters, samples from this program will also be analyzed for selected physical parameters, including suspended solids concentration (SSC), total dissolved solids (TDS), organic carbon fractions (total, dissolved and particulate), chlorophyll a, nutrients and anions (i.e., phosphorous, sulfide, sulfate, chloride, ammonia [NH3-N], total Kjeldahl nitrogen [TKN]), hardness (calculated), and alkalinity. Approximately 10% of the LPR samples will also be analyzed for pathogens to support the HHRA. The full list of constituents is presented in Worksheet #15 of the QAPP.
Not all analytes will be analyzed during every sampling event. A list of priority analytes (Group A) will be analyzed in samples from every event; the priority analytes and additional analytes (Group B) will be analyzed in samples collected during a subset of events. In addition, pathogens (Groups C and D) will be analyzed in a subset of LPRSA stations. The Group A priority analyte suite was developed based on the Modeling Work Plan (HydroQual, 2006) and in consultation with the CFT modeling team and United States Environmental Protection Agency (USEPA), and will be used to calibrate the CFT model.
Group A (the priority analyte suite) includes PCDD/PCDFs, PCB congeners and homologs, mercury, cadmium, copper, lead, the organic carbon fractions, the solids fractions, chlorophyll a, alkalinity, and the major anions (sulfide, sulfate, and chloride). Group A analytes will be used to calibrate the CFT model, and provide water column data to support the RAs and FWM.
Group B includes methyl mercury (total and dissolved), the remaining TAL metals (total and dissolved, where applicable), dissolved hexavalent chromium, Ti, cyanide, SVOCs, VOCs, butyltins, PAHs, alkyl PAHs, OC pesticides, hardness, and nutrients (i.e., phosphorus, TKN, and NH3-N). Group B analytes will be measured in all samples collected during the Low Flow/Spring Tide Event, one spring and two summer Routine Events, and one High Flow Event. Group B analytes will be used to support the RAs and FWM, and validate the CFT model.
Group C includes coliform bacteria: total coliform, Escherichia coli (E. coli), fecal coliform, fecal Streptococci and fecal Enterococci. Group C analytes will be measured in the samples collected 3 ft below the surface, once during both spring Routine Events, both summer Routine Events, both High Flow Events, and the fall Low Flow/Spring Tide Event, at the five stations located in RM 0 – 17.4 of the LPRSA only (the NBSA, above Dundee Dam, and the LPRSA tributaries will not be sampled for Group C analytes). Group C analytes will be used in the HHRA.
Group D analytes include the protozoan pathogens Giardia and cryptosporidium. Group D analytes will be measured in the samples collected 3 ft below surface, once during each summer Routine Event and during both High Flow Events at the five stations located in RM 0 – 17.4 of the LPRSA only (the NBSA, above Dundee Dam and LPRSA tributaries will not be sampled for Group D analytes). Group D analytes will be used in the HHRA.
Quality Assurance Project Plan RI Water Column Monitoring /Small Volume Chemical Data Collection Lower Passaic River Restoration Project New Jersey
Section: Appe ndix A Revision: 2
Date: Augu st 2011 Page 7 of 21
J:\Water\ProjectFiles\P120\12182_Passaic\Tasks\CWCM\AECOM QAPP\2011803_Rev2\clean\20110810_CWCM-sv_QAPP_Appendix-A_rev2.docx
2.2 Details of field activities Routine Events. The objectives of the Routine Event program are to capture data representative of the influxes and mixing processes in the river and Newark Bay, the deposition of particulates from the water column to the sediment, and of the preliminary flux of contaminants from the sediment to the water column. The conditions under which such processes would be apparent are likely to be low to medium flows at the Dundee Dam boundary. These data will be used to calibrate the CFT model to these conditions, and to provide exposure concentration data for the RAs and FWM.
Five Routine Events will be conducted over the course of one year under normal flow conditions (400 - 3,000 cfs at the gage at Dundee Dam). The five events are planned to occur in winter (one event), spring (two events) and summer (two events). This provides data throughout most of the year (sampling in the fall will be conducted under Low Flow/Spring Tide conditions, see below) while focusing the sampling during the seasons of highest human use and biological activity. At least one Routine Event will be sampled during a spring tide, and one Routine Event will be sampled during a neap tide. The sample locations will include the LPRSA, above Dundee Dam, and the NBSA (QAPP Worksheet #18). The data collected during the Routine Events will provide data to support the exposure point calculations for the RAs and FWM. A variety of flows ranging from 400 - 3,000 cfs at Dundee Dam are planned for the Routine Events, designed to provide information regarding the variability of chemical concentrations in the study area to support the calibration of the CFT model. Up to one hundred eight (108) samples will be collected during each of the Routine Events to be analyzed for target analytes as defined in QAPP Worksheet #15. Group A analytes will be sampled in each event. Group B analytes will be measured in one spring and two summer events. Shallow (3 ft below surface) water stations in the five locations in the lower 17.4 miles of the LPR will be analyzed for pathogens (QAPP Worksheets #15 and #18). Group C analytes (coliform bacteria) will be analyzed in the two spring and two summer events; and Group D analytes (Giardia and cryptosporidium) will be sampled during the summer events. Frequency and type of quality control (QC) samples are provided in QAPP Worksheet #20.
It is anticipated that the events will bracket “normal” flow conditions and ideally occur during two different flow regimes measured at the Dundee Dam United States Geologic Survey (USGS) gage (low to medium flow: 400 - 1,000 cfs and medium to high flow 1,000 – 3,000 cfs). Seventeen stations, generally located at the same stations as those sampled in the PWCM program, will be sampled at the thalweg, when feasible, during the Routine Events (Table 2 and Figure 1). The locations for flows > 1,000 cfs are fixed locations. When flows are 400 - 1,000 cfs, the location of two of the river stations (Tidal 1 and Tidal 2) will be determined within 48 hours of the time of the survey based on the extent of the salt wedge (Exhibit 1). One of these stations, Tidal 1, will be located approximately one mile downstream of the toe of the salt wedge. Tidal 2 will be located halfway between Tidal 1 and the station at RM 1.4 (but not upstream of RM 4.2). The discharge used to determine Tidal 1 will be based on an average of the prior 7 days discharge at the USGS gage at Dundee Dam and using National Oceanic and Atmospheric Administration (NOAA) predictions from the gage at Dundee Dam on the Passaic River. A total of up to five hundred forty (540) samples will be collected over five surveys in the Routine Events (Table 3). Each Routine Event will be conducted within approximately a four-day period. General weather conditions, such as precipitation and wind speed and direction will be recorded during the sampling period.
The Routine Event sampled in winter will consist of Group A analytes only. One spring event will consist of Group A and Group C analytes. The remaining spring Routine Event will include Group A, Group B and Group C analytes. The two summer Routine Events will include Group A, Group B, Group C and Group D analytes. Groups C and D analytes will be collected only at the five locations in lower 17.4 RM of the LPR.
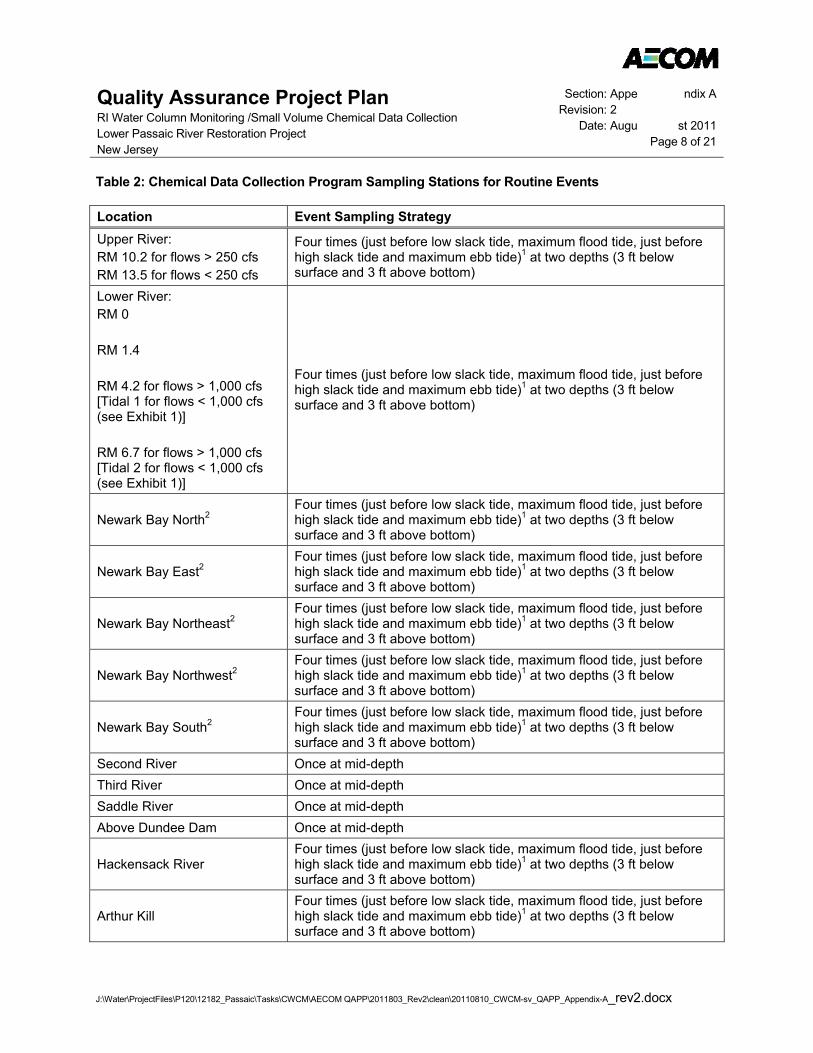
Quality Assurance Project Plan RI Water Column Monitoring /Small Volume Chemical Data Collection Lower Passaic River Restoration Project New Jersey
Section: Appe ndix A Revision: 2
Date: Augu st 2011 Page 8 of 21
J:\Water\ProjectFiles\P120\12182_Passaic\Tasks\CWCM\AECOM QAPP\2011803_Rev2\clean\20110810_CWCM-sv_QAPP_Appendix-A_rev2.docx
Table 2: Chemical Data Collection Program Sampling Stations for Routine Events
Location Event Sampling Strategy Upper River: RM 10.2 for flows > 250 cfs RM 13.5 for flows < 250 cfs
Four times (just before low slack tide, maximum flood tide, just before high slack tide and maximum ebb tide)1 at two depths (3 ft below surface and 3 ft above bottom)
Lower River: RM 0 RM 1.4 RM 4.2 for flows > 1,000 cfs [Tidal 1 for flows < 1,000 cfs (see Exhibit 1)] RM 6.7 for flows > 1,000 cfs [Tidal 2 for flows < 1,000 cfs (see Exhibit 1)]
Four times (just before low slack tide, maximum flood tide, just before high slack tide and maximum ebb tide)1 at two depths (3 ft below surface and 3 ft above bottom)
Newark Bay North2 Four times (just before low slack tide, maximum flood tide, just before high slack tide and maximum ebb tide)1 at two depths (3 ft below surface and 3 ft above bottom)
Newark Bay East2 Four times (just before low slack tide, maximum flood tide, just before high slack tide and maximum ebb tide)1 at two depths (3 ft below surface and 3 ft above bottom)
Newark Bay Northeast2 Four times (just before low slack tide, maximum flood tide, just before high slack tide and maximum ebb tide)1 at two depths (3 ft below surface and 3 ft above bottom)
Newark Bay Northwest2 Four times (just before low slack tide, maximum flood tide, just before high slack tide and maximum ebb tide)1 at two depths (3 ft below surface and 3 ft above bottom)
Newark Bay South2 Four times (just before low slack tide, maximum flood tide, just before high slack tide and maximum ebb tide)1 at two depths (3 ft below surface and 3 ft above bottom)
Second River Once at mid-depth Third River Once at mid-depth Saddle River Once at mid-depth Above Dundee Dam Once at mid-depth
Hackensack River Four times (just before low slack tide, maximum flood tide, just before high slack tide and maximum ebb tide)1 at two depths (3 ft below surface and 3 ft above bottom)
Arthur Kill Four times (just before low slack tide, maximum flood tide, just before high slack tide and maximum ebb tide)1 at two depths (3 ft below surface and 3 ft above bottom)

Quality Assurance Project Plan RI Water Column Monitoring /Small Volume Chemical Data Collection Lower Passaic River Restoration Project New Jersey
Section: Appe ndix A Revision: 2
Date: Augu st 2011 Page 9 of 21
J:\Water\ProjectFiles\P120\12182_Passaic\Tasks\CWCM\AECOM QAPP\2011803_Rev2\clean\20110810_CWCM-sv_QAPP_Appendix-A_rev2.docx
Location Event Sampling Strategy
Kill van Kull Four times (just before low slack tide, maximum flood tide, just before high slack tide and maximum ebb tide)1 at two depths (3 ft below surface and 3 ft above bottom)
1 Four samples will be collected over the tidal cycle for the first two events. After two events are completed, the data will be evaluated for variability. Should the variability in concentrations among the four tide stages be low (i.e., 50%; to be determined in consultation with USEPA), the frequency of sampling may be reduced to high slack tide and low slack tide only. 2 Data collected from the NB stations will be evaluated for variability. Should the variability in concentration among the stations be low, to be determined in consultation with USEPA, the number of stations may be reduced.
Table 3: Chemical Data Collection Program Sample Summary Table for Routine Events
Timing of Sampling
Routine Events Stations Depth
Intervals HW
Slack LW
Slack Max Ebb
Max Flood Non-Ti dal
Sample Subtotals
Upper River 1 2 1 1 1 1 0 8 Lower River 4 2 1 1 1 1 0 32 Newark Bay 5 2 1 1 1 1 0 40 Tributaries 3 1 0 0 0 0 1 3 Above Dundee Dam 1 1 0 0 0 0 1 1 Hackensack River 1 2 1 1 1 1 0 8 Kills 2 2 1 1 1 1 0 16
Total Samples per Survey 108 Total Routine Event Samples (Five Surveys) 540
Note: HW Slack = High water slack tide LW Slack = Low water slack tide Max Ebb = Maximum flow during ebb tide Max Flood = Maximum flow during flood tide
High Flow Events. The objective of the High Flow Event program is to capture data under conditions in which resuspension of contaminants from the sediment bed and subsequent deposition from the water column back to the sediment bed are expected to dominate other transport processes. A threshold for mobilization of the High Flow Event has been established as > 3,000 cfs of flow at the Dundee Dam gage, a flow with a return rate of approximately 3 months.
Subject to weather conditions, two High Flow Events are planned under storm-induced high flow (i.e., not sustained high flow) conditions (> 3,000 cfs at Dundee Dam). The high flows (exceeding 3,000 cfs) that trigger the High Flow Events are not sustained high flows, but weather-induced flows. The predicted peak discharge of a weather event should exceed the 3,000 cfs criterion to trigger an event. There is no limitation with respect to the duration of the event, but events of such magnitude may occur over the span of several days. The planned sample locations include the LPRSA (including the LPRSA tributaries), above Dundee Dam and the NBSA (QAPP Worksheet #18). The data collected during the High Flow Events will provide data to support the exposure point calculations for the RAs and FWM. The data will also be used to provide the CFT model information to preliminarily calibrate the erosion fluxes from the sediments to the water column, and the subsequent deposition of particle-bound contaminants from the water column to the sediment. It is also anticipated that during these events there will be a higher loading of suspended
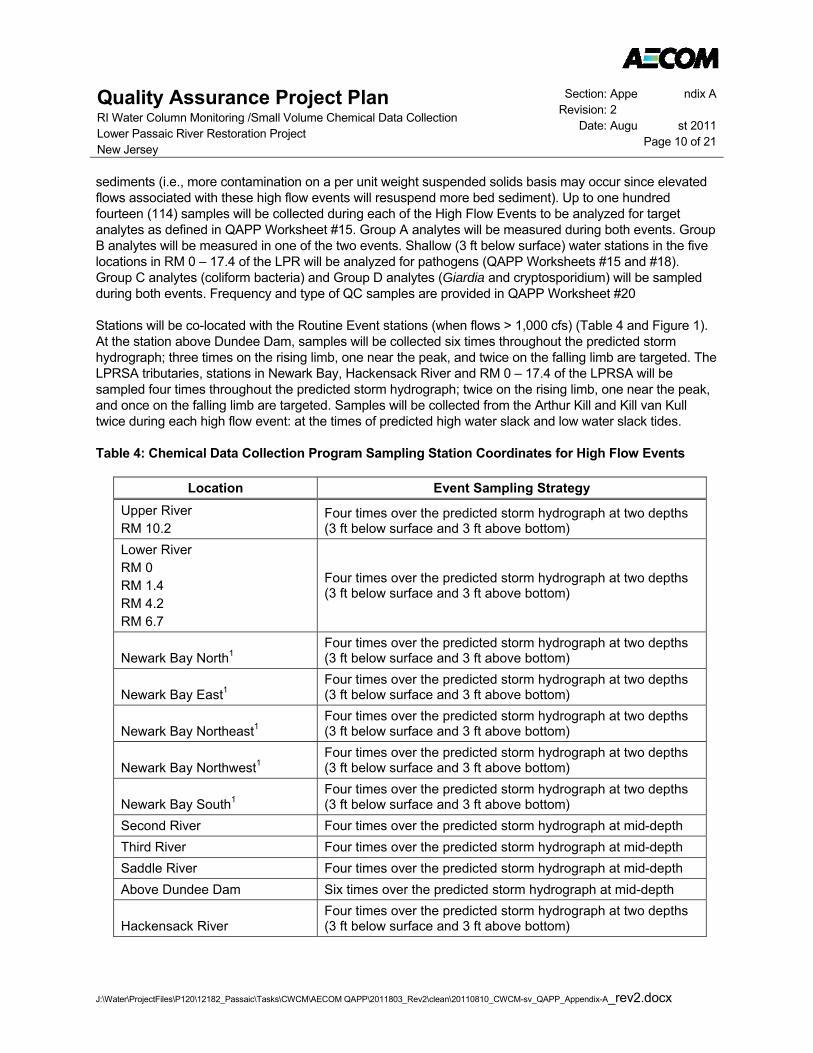
Quality Assurance Project Plan RI Water Column Monitoring /Small Volume Chemical Data Collection Lower Passaic River Restoration Project New Jersey
Section: Appe ndix A Revision: 2
Date: Augu st 2011 Page 10 of 21
J:\Water\ProjectFiles\P120\12182_Passaic\Tasks\CWCM\AECOM QAPP\2011803_Rev2\clean\20110810_CWCM-sv_QAPP_Appendix-A_rev2.docx
sediments (i.e., more contamination on a per unit weight suspended solids basis may occur since elevated flows associated with these high flow events will resuspend more bed sediment). Up to one hundred fourteen (114) samples will be collected during each of the High Flow Events to be analyzed for target analytes as defined in QAPP Worksheet #15. Group A analytes will be measured during both events. Group B analytes will be measured in one of the two events. Shallow (3 ft below surface) water stations in the five locations in RM 0 – 17.4 of the LPR will be analyzed for pathogens (QAPP Worksheets #15 and #18). Group C analytes (coliform bacteria) and Group D analytes (Giardia and cryptosporidium) will be sampled during both events. Frequency and type of QC samples are provided in QAPP Worksheet #20
Stations will be co-located with the Routine Event stations (when flows > 1,000 cfs) (Table 4 and Figure 1). At the station above Dundee Dam, samples will be collected six times throughout the predicted storm hydrograph; three times on the rising limb, one near the peak, and twice on the falling limb are targeted. The LPRSA tributaries, stations in Newark Bay, Hackensack River and RM 0 – 17.4 of the LPRSA will be sampled four times throughout the predicted storm hydrograph; twice on the rising limb, one near the peak, and once on the falling limb are targeted. Samples will be collected from the Arthur Kill and Kill van Kull twice during each high flow event: at the times of predicted high water slack and low water slack tides.
Table 4: Chemical Data Collection Program Sampling Station Coordinates for High Flow Events
Location Event Sampling Strategy Upper River RM 10.2
Four times over the predicted storm hydrograph at two depths (3 ft below surface and 3 ft above bottom)
Lower River RM 0 RM 1.4 RM 4.2 RM 6.7
Four times over the predicted storm hydrograph at two depths (3 ft below surface and 3 ft above bottom)
Newark Bay North1 Four times over the predicted storm hydrograph at two depths (3 ft below surface and 3 ft above bottom)
Newark Bay East1 Four times over the predicted storm hydrograph at two depths (3 ft below surface and 3 ft above bottom)
Newark Bay Northeast1 Four times over the predicted storm hydrograph at two depths (3 ft below surface and 3 ft above bottom)
Newark Bay Northwest1 Four times over the predicted storm hydrograph at two depths (3 ft below surface and 3 ft above bottom)
Newark Bay South1 Four times over the predicted storm hydrograph at two depths (3 ft below surface and 3 ft above bottom)
Second River Four times over the predicted storm hydrograph at mid-depth Third River Four times over the predicted storm hydrograph at mid-depth Saddle River Four times over the predicted storm hydrograph at mid-depth Above Dundee Dam Six times over the predicted storm hydrograph at mid-depth
Hackensack River Four times over the predicted storm hydrograph at two depths (3 ft below surface and 3 ft above bottom)
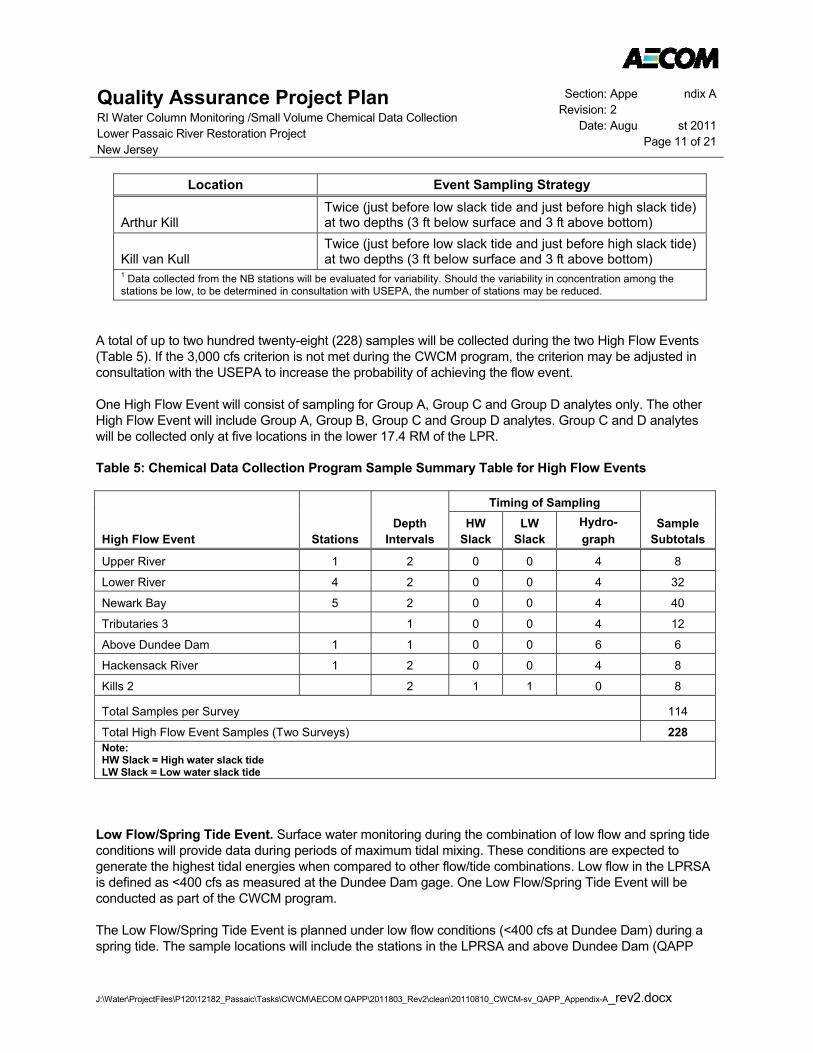
Quality Assurance Project Plan RI Water Column Monitoring /Small Volume Chemical Data Collection Lower Passaic River Restoration Project New Jersey
Section: Appe ndix A Revision: 2
Date: Augu st 2011 Page 11 of 21
J:\Water\ProjectFiles\P120\12182_Passaic\Tasks\CWCM\AECOM QAPP\2011803_Rev2\clean\20110810_CWCM-sv_QAPP_Appendix-A_rev2.docx
Location Event Sampling Strategy
Arthur Kill Twice (just before low slack tide and just before high slack tide) at two depths (3 ft below surface and 3 ft above bottom)
Kill van Kull Twice (just before low slack tide and just before high slack tide) at two depths (3 ft below surface and 3 ft above bottom)
1 Data collected from the NB stations will be evaluated for variability. Should the variability in concentration among the stations be low, to be determined in consultation with USEPA, the number of stations may be reduced.
A total of up to two hundred twenty-eight (228) samples will be collected during the two High Flow Events (Table 5). If the 3,000 cfs criterion is not met during the CWCM program, the criterion may be adjusted in consultation with the USEPA to increase the probability of achieving the flow event.
One High Flow Event will consist of sampling for Group A, Group C and Group D analytes only. The other High Flow Event will include Group A, Group B, Group C and Group D analytes. Group C and D analytes will be collected only at five locations in the lower 17.4 RM of the LPR.
Table 5: Chemical Data Collection Program Sample Summary Table for High Flow Events
Timing of Sampling
High Flow Event Stations Depth
Intervals HW
Slack LW
Slack Hydro- graph
Sample Subtotals
Upper River 1 2 0 0 4 8
Lower River 4 2 0 0 4 32
Newark Bay 5 2 0 0 4 40
Tributaries 3 1 0 0 4 12
Above Dundee Dam 1 1 0 0 6 6
Hackensack River 1 2 0 0 4 8
Kills 2 2 1 1 0 8
Total Samples per Survey 114
Total High Flow Event Samples (Two Surveys) 228 Note: HW Slack = High water slack tide LW Slack = Low water slack tide
Low Flow/Spring Tide Event. Surface water monitoring during the combination of low flow and spring tide conditions will provide data during periods of maximum tidal mixing. These conditions are expected to generate the highest tidal energies when compared to other flow/tide combinations. Low flow in the LPRSA is defined as <400 cfs as measured at the Dundee Dam gage. One Low Flow/Spring Tide Event will be conducted as part of the CWCM program.
The Low Flow/Spring Tide Event is planned under low flow conditions (<400 cfs at Dundee Dam) during a spring tide. The sample locations will include the stations in the LPRSA and above Dundee Dam (QAPP
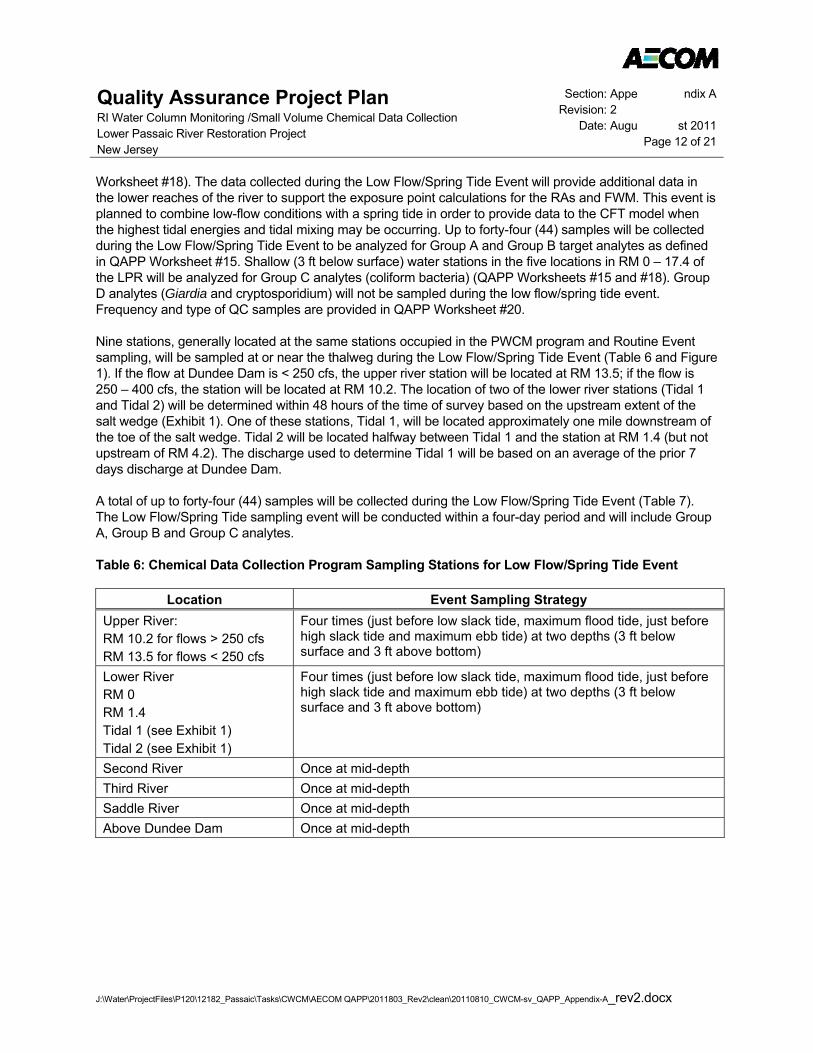
Quality Assurance Project Plan RI Water Column Monitoring /Small Volume Chemical Data Collection Lower Passaic River Restoration Project New Jersey
Section: Appe ndix A Revision: 2
Date: Augu st 2011 Page 12 of 21
J:\Water\ProjectFiles\P120\12182_Passaic\Tasks\CWCM\AECOM QAPP\2011803_Rev2\clean\20110810_CWCM-sv_QAPP_Appendix-A_rev2.docx
Worksheet #18). The data collected during the Low Flow/Spring Tide Event will provide additional data in the lower reaches of the river to support the exposure point calculations for the RAs and FWM. This event is planned to combine low-flow conditions with a spring tide in order to provide data to the CFT model when the highest tidal energies and tidal mixing may be occurring. Up to forty-four (44) samples will be collected during the Low Flow/Spring Tide Event to be analyzed for Group A and Group B target analytes as defined in QAPP Worksheet #15. Shallow (3 ft below surface) water stations in the five locations in RM 0 – 17.4 of the LPR will be analyzed for Group C analytes (coliform bacteria) (QAPP Worksheets #15 and #18). Group D analytes (Giardia and cryptosporidium) will not be sampled during the low flow/spring tide event. Frequency and type of QC samples are provided in QAPP Worksheet #20.
Nine stations, generally located at the same stations occupied in the PWCM program and Routine Event sampling, will be sampled at or near the thalweg during the Low Flow/Spring Tide Event (Table 6 and Figure 1). If the flow at Dundee Dam is < 250 cfs, the upper river station will be located at RM 13.5; if the flow is 250 – 400 cfs, the station will be located at RM 10.2. The location of two of the lower river stations (Tidal 1 and Tidal 2) will be determined within 48 hours of the time of survey based on the upstream extent of the salt wedge (Exhibit 1). One of these stations, Tidal 1, will be located approximately one mile downstream of the toe of the salt wedge. Tidal 2 will be located halfway between Tidal 1 and the station at RM 1.4 (but not upstream of RM 4.2). The discharge used to determine Tidal 1 will be based on an average of the prior 7 days discharge at Dundee Dam.
A total of up to forty-four (44) samples will be collected during the Low Flow/Spring Tide Event (Table 7). The Low Flow/Spring Tide sampling event will be conducted within a four-day period and will include Group A, Group B and Group C analytes.
Table 6: Chemical Data Collection Program Sampling Stations for Low Flow/Spring Tide Event
Location Event Sampling Strategy Upper River: RM 10.2 for flows > 250 cfs RM 13.5 for flows < 250 cfs
Four times (just before low slack tide, maximum flood tide, just before high slack tide and maximum ebb tide) at two depths (3 ft below surface and 3 ft above bottom)
Lower River RM 0 RM 1.4 Tidal 1 (see Exhibit 1) Tidal 2 (see Exhibit 1)
Four times (just before low slack tide, maximum flood tide, just before high slack tide and maximum ebb tide) at two depths (3 ft below surface and 3 ft above bottom)
Second River Once at mid-depth Third River Once at mid-depth Saddle River Once at mid-depth Above Dundee Dam Once at mid-depth
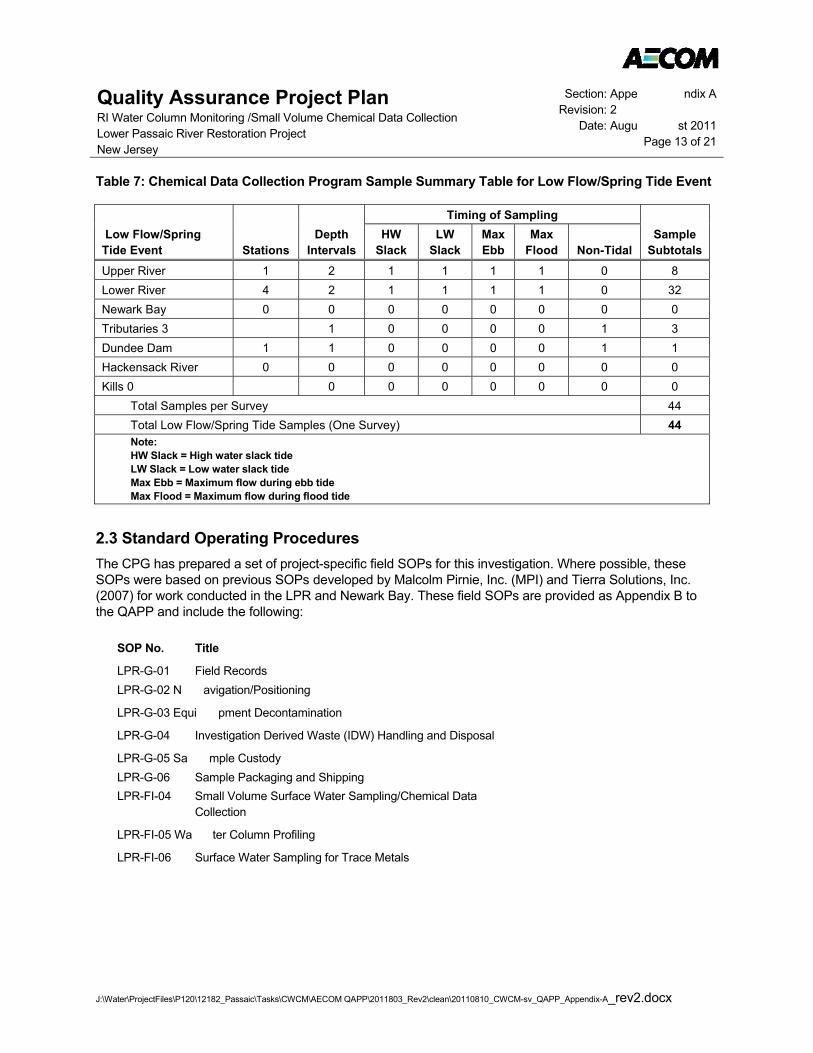
Quality Assurance Project Plan RI Water Column Monitoring /Small Volume Chemical Data Collection Lower Passaic River Restoration Project New Jersey
Section: Appe ndix A Revision: 2
Date: Augu st 2011 Page 13 of 21
J:\Water\ProjectFiles\P120\12182_Passaic\Tasks\CWCM\AECOM QAPP\2011803_Rev2\clean\20110810_CWCM-sv_QAPP_Appendix-A_rev2.docx
Table 7: Chemical Data Collection Program Sample Summary Table for Low Flow/Spring Tide Event
Timing of Sampling Low Flow/Spring Tide Event Stations
Depth Intervals
HW Slack
LW Slack
Max Ebb
Max Flood Non-Tidal
Sample Subtotals
Upper River 1 2 1 1 1 1 0 8 Lower River 4 2 1 1 1 1 0 32 Newark Bay 0 0 0 0 0 0 0 0 Tributaries 3 1 0 0 0 0 1 3 Dundee Dam 1 1 0 0 0 0 1 1 Hackensack River 0 0 0 0 0 0 0 0 Kills 0 0 0 0 0 0 0 0
Total Samples per Survey 44 Total Low Flow/Spring Tide Samples (One Survey) 44 Note: HW Slack = High water slack tide LW Slack = Low water slack tide Max Ebb = Maximum flow during ebb tide Max Flood = Maximum flow during flood tide
2.3 Standard Operating Procedures The CPG has prepared a set of project-specific field SOPs for this investigation. Where possible, these SOPs were based on previous SOPs developed by Malcolm Pirnie, Inc. (MPI) and Tierra Solutions, Inc. (2007) for work conducted in the LPR and Newark Bay. These field SOPs are provided as Appendix B to the QAPP and include the following:
SOP No. Title
LPR-G-01 Field Records LPR-G-02 N avigation/Positioning
LPR-G-03 Equi pment Decontamination
LPR-G-04 Investigation Derived Waste (IDW) Handling and Disposal
LPR-G-05 Sa mple Custody LPR-G-06 Sample Packaging and Shipping LPR-FI-04 Small Volume Surface Water Sampling/Chemical Data
Collection
LPR-FI-05 Wa ter Column Profiling
LPR-FI-06 Surface Water Sampling for Trace Metals

Quality Assurance Project Plan RI Water Column Monitoring /Small Volume Chemical Data Collection Lower Passaic River Restoration Project New Jersey
Section: Appe ndix A Revision: 2
Date: Augu st 2011 Page 14 of 21
J:\Water\ProjectFiles\P120\12182_Passaic\Tasks\CWCM\AECOM QAPP\2011803_Rev2\clean\20110810_CWCM-sv_QAPP_Appendix-A_rev2.docx
2.4 Site facilities The field facility located at the Kelways Industrial Park in East Rutherford, NJ (at approximately RM 13.5) will serve as the base of operations for this effort. Indoor space at the facility will be used for storage, staging surveys, and packaging samples for shipment to the laboratory for analysis. The floating dock located at the field facility will be used for vessel mobilization for survey operations in the middle and upper sections of the study area. The lower portion of the LPRSA and the NBSA study area will be accessed from the Passaic Yacht Club. The station above Dundee Dam will be accessed from the public boat ramp in Elmwood Park.
2.5 Health and safety The tasks described within this FSP Addendum will be conducted in accordance with the companion program-specific HASP Addendum prepared for this effort, in conjunction with the overall Project HASP (MPI 2005a). This program-specific HASP Addendum will be submitted as a separate document.
2.6 Data management The data collected during the tasks described within this FSP Addendum will be handled and managed in accordance with the Lower Passaic River Restoration Project Data Management Plan (DMP) (AECOM 2010b). The DMP specifies data formats, data deliverables, and data archiving procedures.
3.0 Field activity schedule
The following schedule is proposed for the monitoring events:
Date Task 1
August 2011 First Routine Event (summer event)
August – September 2011 Review data from First Routine Event
September 2011 – November 2011 Low Flow/Spring Tide Event (autumn event)
December 2011 – February 2012 Winter Routine Event
March 2012 – June 2012 Two spring Routine Events Potential for High Flow Events
June 2012 – August 2012 Summer Routine Event
1Timing and duration of surveys dependent on weather, water temperature, and flow conditions. The USEPA will be notified of proposed timing during the planning of each of the sampling events.
4.0 Reporting
Regular reporting on the progress of the CWCM program will be performed as part of the overall monthly progress reporting for the LPR RI/FS and NBSA RI/FS and will include the following:

Quality Assurance Project Plan RI Water Column Monitoring /Small Volume Chemical Data Collection Lower Passaic River Restoration Project New Jersey
Section: Appe ndix A Revision: 2
Date: Augu st 2011 Page 15 of 21
J:\Water\ProjectFiles\P120\12182_Passaic\Tasks\CWCM\AECOM QAPP\2011803_Rev2\clean\20110810_CWCM-sv_QAPP_Appendix-A_rev2.docx
Brief summary of any field surveys performed during the previous month (type of survey, dates, number of samples collected, issues of note, and deviations from the program QAPP/FSP Addendum).
Delivery of validated data, processed data, and raw data (as applicable). Requirements for validated data submittals are prescribed by the Region 2 guidance on multimedia electronic data deliverables (EDDs) at http://www.epa.gov/region02/superfund/medd.htm.
Following completion of the entire CWCM program, a data characterization summary report will be prepared that will include the following:
Summary of the overall monitoring effort including a full description of any deviations from this FSP Addendum or the associated QAPP;
Presentation of a data quality review and summary of data usability;
Summary graphics of monitoring data with a written summary on the updated interpretation of the LPR estuarine dynamics; and
Discussion on achievement of the DQOs and any recommended follow-up investigations.
Quality Assurance Project Plan RI Water Column Monitoring /Small Volume Chemical Data Collection Lower Passaic River Restoration Project New Jersey
Section: Appe ndix A Revision: 2
Date: Augu st 2011 Page 16 of 21
J:\Water\ProjectFiles\P120\12182_Passaic\Tasks\CWCM\AECOM QAPP\2011803_Rev2\clean\20110810_CWCM-sv_QAPP_Appendix-A_rev2.docx
5.0 References
AECOM 2010a. Quality Assurance Project Plan/Field Sampling Plan Addendum. Remedial Investigation Water Column Monitoring/Physical Data Collection for the Lower Passaic River, Newark Bay and Wet Weather Monitoring. Lower Passaic River Restoration Project. Revision 4. March 2010.
AECOM 2010b. Lower Passaic River Restoration Project Data Management Plan. July 2010, including all revisions.
HydroQual, 2006. Final Modeling Work Plan. Lower Passaic River Restoration Project. Mahwah, NJ.
Malcolm Pirnie, Inc. (MPI) 2005a. Lower Passaic River Restoration Project. Health and Safety Plan. Prepared for US Environmental Protection Agency and US Army Corps of Engineers. Malcolm Pirnie, Inc., White Plains, NY. August 2005.
MPI 2005b. Lower Passaic River Restoration Project. Work Plan. Prepared for US Environmental Protection Agency and US Army Corps of Engineers. Malcolm Pirnie, Inc., White Plains, NY. August 2005.
MPI 2005c. Lower Passaic River Restoration Project. Revised Preliminary Draft Field Sampling Plan. Volume 3. Prepared for US Environmental Protection Agency and US Army Corps of Engineers. Malcolm Pirnie, Inc., White Plains, NY. July 2005.
MPI 2005d. Lower Passaic River Restoration Project. Quality Assurance Project Plan. Prepared for US Environmental Protection Agency and US Army Corps of Engineers. Malcolm Pirnie, Inc., White Plains, NY. August 2005.
MPI 2006. Lower Passaic River Restoration Project. Draft Field Sampling Plan. Volume 1. Prepared for US Environmental Protection Agency, US Army Corps of Engineers, and New Jersey Department of Transportation/Office of Maritime Resources. Malcolm Pirnie, Inc., White Plains, NY; Earth Tech, Inc., Bloomfield, NJ; Battelle, Stony Brook, NY. January 2006.
MPI, Earth Tech, and Battelle 2006. Lower Passaic River Restoration Project. Draft Field Sampling Plan. Volume 2. Prepared for US Environmental Protection Agency and US Army Corps of Engineers. Malcolm Pirnie, Inc., White Plains, NY. June 2006.
MPI 2007. Lower Passaic River Restoration Project. Conceptual Site Model. Prepared for US Environmental Protection Agency, US Army Corps of Engineers, and New Jersey Department of Transportation/Office of Maritime Resources. Malcolm Pirnie, Inc., White Plains, NY. February 2007.
Tierra 2007. Standard Operating Procedures and Revisions. Newark Bay Study Area Phase II RIWP, Appendix F. October, 2007.
USEPA 2005. Intergovernmental Data Quality Task Force Uniform Federal Policy for Implementing Environmental Quality Systems Evaluating, Assessing, and Documenting Environmental Data Collection/Use and Technology Programs Manual Publication Numbers: EPA: EPA-505-F-03-001 DoD: DTIC ADA 395303 Final Version 2. March 2005.
Quality Assurance Project Plan RI Water Column Monitoring /Small Volume Chemical Data Collection Lower Passaic River Restoration Project New Jersey
Section: Appe ndix A Revision: 2
Date: Augu st 2011 Page 17 of 21
J:\Water\ProjectFiles\P120\12182_Passaic\Tasks\CWCM\AECOM QAPP\2011803_Rev2\clean\20110810_CWCM-sv_QAPP_Appendix-A_rev2.docx
USEPA 2007. Administrative Settlement Agreement and Order on Consent for Remedial Investigation/ Feasibility Study. CERCLA Docket No. 02-2007-2009. May 2007.
Windward 2009a. Lower Passaic River Restoration Project. Lower Passaic River Study Area RI/FS. Quality Assurance Project Plan: Fish and decapod crustacean tissue collection for chemical analysis and fish community survey. Final. Prepared for Cooperating Parties Group, Newark, New Jersey. Windward Environmental LLC, Seattle, WA. August 2009.
Windward 2009b. Lower Passaic River Restoration Project. Lower Passaic River Study Area RI/FS. Quality Assurance Project Plan: Surface sediment chemical analyses and benthic invertebrate toxicity and bioaccumulation testing. Final. Prepared for Cooperating Parties Group, Newark, New Jersey. October 8, 2009. Windward Environmental LLC, Seattle, WA.
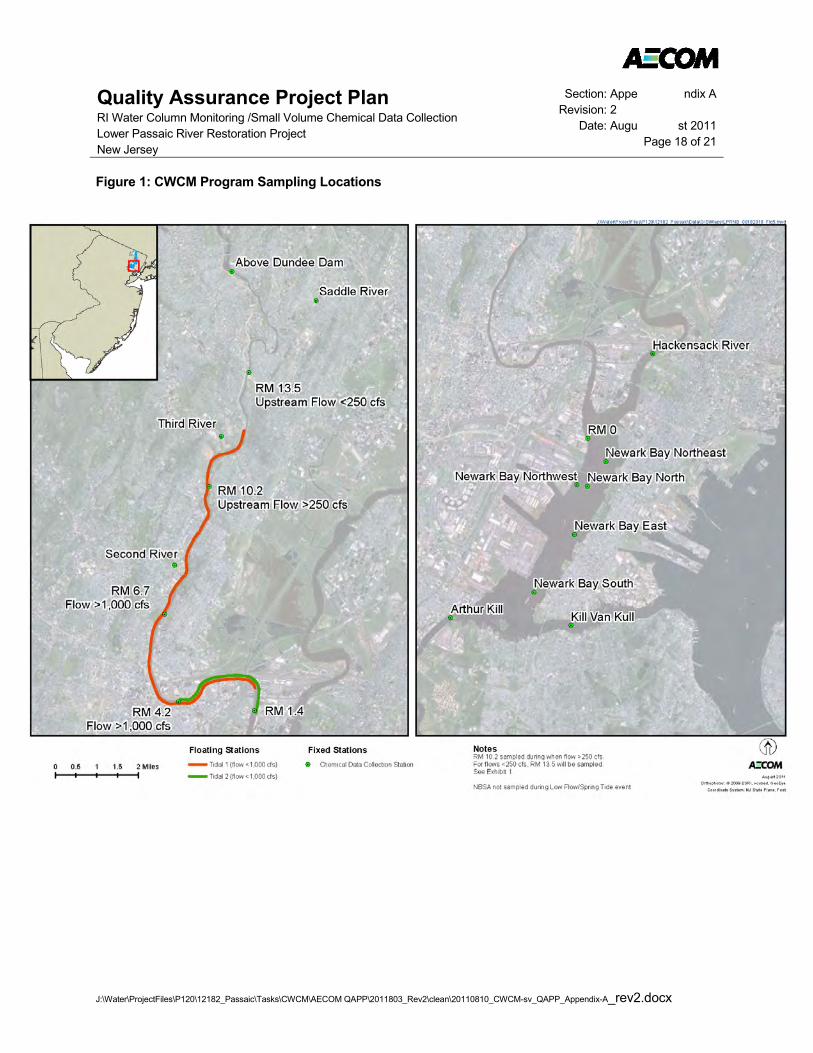
Quality Assurance Project Plan RI Water Column Monitoring /Small Volume Chemical Data Collection Lower Passaic River Restoration Project New Jersey
Section: Appe ndix A Revision: 2
Date: Augu st 2011 Page 18 of 21
J:\Water\ProjectFiles\P120\12182_Passaic\Tasks\CWCM\AECOM QAPP\2011803_Rev2\clean\20110810_CWCM-sv_QAPP_Appendix-A_rev2.docx
Figure 1: CWCM Program Sampling Locations

Quality Assurance Project Plan RI Water Column Monitoring /Small Volume Chemical Data Collection Lower Passaic River Restoration Project New Jersey
Section: Appe ndix A Revision: 2
Date: Augu st 2011 Page 19 of 21
J:\Water\ProjectFiles\P120\12182_Passaic\Tasks\CWCM\AECOM QAPP\2011803_Rev2\clean\20110810_CWCM-sv_QAPP_Appendix-A_rev2.docx
Exhibit 1. Locations of Tidal 1 and Tidal 2 The location of Tidal 1 and Tidal 2 will be determined prior to the execution of the Routine Events (when flow is <1,000 cfs at Dundee Dam) and Low Flow/Spring Tide Events. The location of Tidal 1 is intended to be approximately one mile downstream of the salt wedge, and Tidal 2 will be sampled based on the location of Tidal 1 (see below).
Within two days prior to a sampling event, the AECOM CWCM Task Manager, or designee, will coordinate with Moffat & Nichol’s CFT Modeling Liaison, or designee, to estimate the discharge from Dundee Dam for the seven previous days from the USGS website and flow predictions for Dundee Dam from the NOAA website. Using these data, the tidal stage (i.e., low tide, high tide, maximum ebb tide or maximum flood tide) and the moon stage (i.e., neap to spring tide), the location for Tidal 1 will be determined. The model output for the 2 part per thousand (ppth) isohaline as a function of these properties is presented in Table E-1 and Figure E-1. Example sampling locations during neap and spring tides based on hydrodynamic model results are presented in Tables E-2 and E-3, respectively.
From the determined Tidal 1 location, Tidal 2 will be determined as follows:
If the point halfway between Tidal 1 and RM 1.4 is located upstream of RM 4.2, Tidal 2 will be located at RM 4.2.
If Tidal 1 is located downstream of RM 4.2, Tidal 2 will be located halfway between Tidal 1 and RM 1.4.
This information will be relayed to and confirmed with the AECOM Field Task Manager (FTM) and Ocean Surveys, Inc. (OSI), the vessel subcontractor.
Table E-1: Approximate Locations of the 2 ppth Isohaline Line
2 ppth Isohaline Location (river miles) Discharge at Dundee Dam
Gage (cfs)
Neap Spring
High Tide Low Tide High Tide Low Tide
100 12.75 11 12.5 9.25 200 11.25 9 10.75 6.75 300 10.25 7.5 9.75 5 600 8 5.75 8 3.75 900 6.5 4 6.5 2 1200 5.25 3.25 5.75 1 2000 3.5 1.5 4.5 0.25 3000 2 0.75 3.25 0 6000 0.75 -0.5 1.25 -1.5 12000 -1 -1.25 -0.75 -2

Quality Assurance Project Plan RI Water Column Monitoring /Small Volume Chemical Data Collection Lower Passaic River Restoration Project New Jersey
Section: Appe ndix A Revision: 2
Date: Augu st 2011 Page 20 of 21
J:\Water\ProjectFiles\P120\12182_Passaic\Tasks\CWCM\AECOM QAPP\2011803_Rev2\clean\20110810_CWCM-sv_QAPP_Appendix-A_rev2.docx
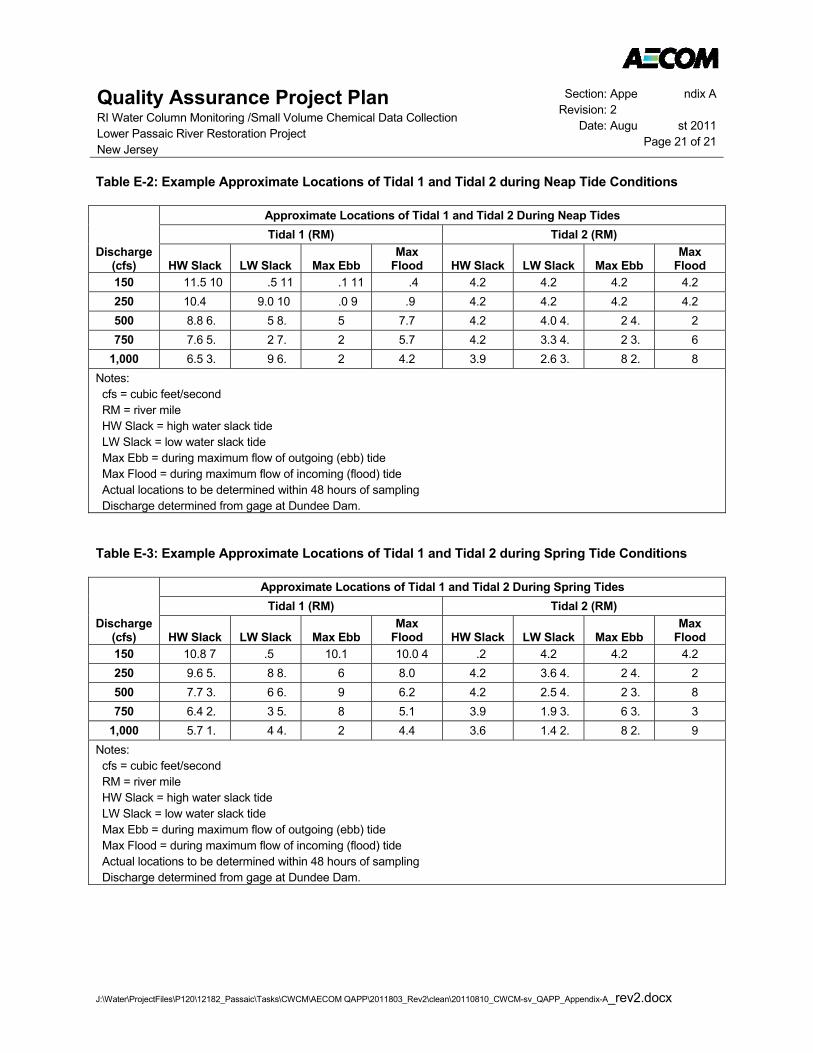
Quality Assurance Project Plan RI Water Column Monitoring /Small Volume Chemical Data Collection Lower Passaic River Restoration Project New Jersey
Section: Appe ndix A Revision: 2
Date: Augu st 2011 Page 21 of 21
J:\Water\ProjectFiles\P120\12182_Passaic\Tasks\CWCM\AECOM QAPP\2011803_Rev2\clean\20110810_CWCM-sv_QAPP_Appendix-A_rev2.docx
Table E-2: Example Approximate Locations of Tidal 1 and Tidal 2 during Neap Tide Conditions
Discharge (cfs)
Approximate Locations of Tidal 1 and Tidal 2 During Neap Tides Tidal 1 (RM) Tidal 2 (RM)
HW Slack LW Slack Max Ebb Max
Flood HW Slack LW Slack Max Ebb Max
Flood 150 11.5 10 .5 11 .1 11 .4 4.2 4.2 4.2 4.2 250 10.4 9.0 10 .0 9 .9 4.2 4.2 4.2 4.2 500 8.8 6. 5 8. 5 7.7 4.2 4.0 4. 2 4. 2 750 7.6 5. 2 7. 2 5.7 4.2 3.3 4. 2 3. 6
1,000 6.5 3. 9 6. 2 4.2 3.9 2.6 3. 8 2. 8 Notes: cfs = cubic feet/second RM = river mile HW Slack = high water slack tide LW Slack = low water slack tide Max Ebb = during maximum flow of outgoing (ebb) tide Max Flood = during maximum flow of incoming (flood) tide Actual locations to be determined within 48 hours of sampling Discharge determined from gage at Dundee Dam.
Table E-3: Example Approximate Locations of Tidal 1 and Tidal 2 during Spring Tide Conditions
Discharge (cfs)
Approximate Locations of Tidal 1 and Tidal 2 During Spring Tides Tidal 1 (RM) Tidal 2 (RM)
HW Slack LW Slack Max Ebb Max
Flood HW Slack LW Slack Max Ebb Max
Flood 150 10.8 7 .5 10.1 10.0 4 .2 4.2 4.2 4.2 250 9.6 5. 8 8. 6 8.0 4.2 3.6 4. 2 4. 2 500 7.7 3. 6 6. 9 6.2 4.2 2.5 4. 2 3. 8 750 6.4 2. 3 5. 8 5.1 3.9 1.9 3. 6 3. 3
1,000 5.7 1. 4 4. 2 4.4 3.6 1.4 2. 8 2. 9 Notes: cfs = cubic feet/second RM = river mile HW Slack = high water slack tide LW Slack = low water slack tide Max Ebb = during maximum flow of outgoing (ebb) tide Max Flood = during maximum flow of incoming (flood) tide Actual locations to be determined within 48 hours of sampling Discharge determined from gage at Dundee Dam.

Quality Assurance Project Plan Phase I RI Chemical Water Column Sampling and Analysis Lower Passaic River Restoration Project Newark, New Jersey
Section: Appendix B Revision: 2
Date: August 2011
J:\Water\ProjectFiles\P120\12182_Passaic\Tasks\CWCM\AECOM QAPP\2011803_Rev2\clean\20110810_CWCM-sv_QAPP_Rev2.docx
Appendix B Field Standard Operating Procedures

Standard Operating ProcedureLower Passaic River Restoration Project
J:\Water\ProjectFiles\P120\12182_Passaic\Tasks\CWCM\AECOM QAPP\2011803_Rev2\clean\LPR-FI-04_Small Volume Surface WaterSampling-Chemical Data Collection_rev3.docx
Small Volume Surface Water Sampling/Chemical Data Collection
Procedure Number: LPR-FI-04
Revision No.: 3
Revision Date: August 2011
Prepared by
Steve WolfAaron Hopkins
Date: August 10, 2011Laura Kelmar, Project Manager
Date: August 10, 2011Debra L. Simmons, Project QA Manager
Annual review of this SOP has been performedand the SOP still reflects current practice.
Initials: D ate:Initials: D ate:

Standard Operating Procedure Lower Passaic River Restoration Project Small Volume Surface Water Sampling/Chemical Data Collection
SOP No.: LPR-FI-04 Revision: 3
Date: August 2011 Page i of i
J:\Water\ProjectFiles\P120\12182_Passaic\Tasks\CWCM\AECOM QAPP\2011803_Rev2\clean\LPR-FI-04_Small Volume Surface Water Sampling-Chemical Data Collection_rev3.docx
Contents
1.0 SCOPE AND APPLICABILITY .......................................................................................................... 1
2.0 HEALTH AND SAFETY CONSIDERATIONS ................................................................................... 1
3.0 INTERFERENCES .............................................................................................................................. 2
4.0 EQUIPMENT AND MATERIALS ....................................................................................................... 2
5.0 PROCEDURES ................................................................................................................................... 3
6.0 QUALITY ASSURANCE / QUALITY CONTROL .............................................................................. 6
7.0 DATA AND RECORDS MANAGEMENT .......................................................................................... 7
8.0 PERSONNEL QUALIFICATIONS AND TRAINING ......................................................................... 7
9.0 REFERENCES .................................................................................................................................... 7
10.0 REVISION HISTORY .......................................................................................................................... 8
Standard Operating ProcedureLower Passaic River Restoration ProjectSmall Volume Surface Water Sampling/ChemicalData Collection
SOP No.: LPR-FI-04Revision: 3
Date: August 2011Page 1 of 10
J:\Water\ProjectFiles\P120\12182_Passaic\Tasks\CWCM\AECOM QAPP\2011803_Rev2\clean\LPR-FI-04_SmallVolume Surface Water Sampling-Chemical Data Collection_rev3.docx
1.0 Scope and applicability
1.1 This project Standard Operating Procedure (SOP) defines the procedures for the collection of surfacewater samples in the Lower Passaic River Study Area and Newark Bay Study Area as part of theLower Passaic River Restoration Project (LPRRP). This SOP addresses both vessel and shore-based sampling efforts and is restricted to standard or “small volume” sample collection. High-volumesampling techniques are beyond the scope of this SOP.
1.2 Samples will be collected for chemical, microbiological, and physical analyses. Analytes for aparticular program are specified in the Quality Assurance Project Plan (QAPP).
1.3 It is assumed that the sampling activities described in this SOP will be conducted in conjunction withwater column profiling (SOP LPR-FI-05) and/or surface water sampling specific to metals analyses(SOP LPR-FI-06).
1.4 The preferred method of sampling is via a pumping system using a peristaltic pump. A trigger-activated bottle sampler may be used as a contingency.
1.5 It is fully expected that the procedures outlined in this SOP will be followed. Procedural modificationsmay be warranted depending upon field conditions or limitations imposed by the procedure.Substantive modification to this SOP will be approved in advance by the Project Quality Assurance(QA) Manager and the Task Manager and communicated to the Cooperating Parties Group (CPG)Project Coordinator and the United States Environmental Protection Agency (USEPA) RemedialProject Manager (RPM). Deviations from this SOP will be documented in the field records. Theultimate procedure employed will be documented in the report summarizing the results of thesampling event or field activity.
2.0 Health and safety considerations
2.1 The health and safety (H&S) considerations for the work associated with this SOP, including physical,chemical, and biological hazards are addressed in the site-specific Health and Safety Plan (HASP)and associated addendums (MPI 2005a; MPI 2005b; AECOM 2011). The major H&S considerationsfor the work associated with water sample collections are the marine safety aspects of the program.
2.2 Daily safety briefs will be conducted at the start of each working day before any work commences.These daily briefs will be facilitated by the Site Safety Officer (SSO) or his/her designee to discuss theday’s events and any potential health risk areas covering every aspect of the work to be completed.Weather conditions should be part of these discussions. As detailed in the HASP, everyone on thefield team has the authority to stop work if an unsafe condition is perceived until the condition(s) is fullyremedied to the satisfaction of the SSO.
Standard Operating ProcedureLower Passaic River Restoration ProjectSmall Volume Surface Water Sampling/ChemicalData Collection
SOP No.: LPR-FI-04Revision: 3
Date: August 2011Page 2 of 10
J:\Water\ProjectFiles\P120\12182_Passaic\Tasks\CWCM\AECOM QAPP\2011803_Rev2\clean\LPR-FI-04_SmallVolume Surface Water Sampling-Chemical Data Collection_rev3.docx
3.0 I nterferences
3.1 Cross-contaminations of sample may result if sample handling equipment is inadequately orimproperly decontaminated. Refer to SOP LPR-G-03 for decontamination procedures.
3.2 Contamination of samples may result if samples are exposed to certain environmental conditions.Exposure to potential sources of contamination (e.g., exhaust fumes) will be minimized.
3.3 Care must be taken to avoid disturbing the bed sediment during sampling. Re-suspended bedsediments may contaminate the surface water samples.
3.4 Inappropriate sampling equipment, such as that manufactured from non-inert plastics, maycontaminate samples. Using Teflon, polymer, or stainless steel sampling equipment will minimizecontamination during sample collection activities.
3.5 Purging of the pump system with a minimum of three volumes of site water prior to sample collectionwill ensure a representative sample.
4.0 Equipment and materials
The following equipment list contains materials which may be needed in carrying out the procedurescontained in this SOP. Not all equipment listed below may be necessary for a specific activity.Additional equipment may be required, pending field conditions.
Water pump (peristaltic pump capable of 10 liters/minute (L/min)or better)
12-volt battery (as needed)
Electrical connectors
CFLEX™ or equivalent polymer tubing (typical configuration requires 3/8 inch ID), a 50-foot orlonger length will be required for the deepest portion of the Lower Passaic River (LPR) andNewark Bay. If tubing must be connected to create longer lengths, inert and decontaminatedconnectors will be used.
Trigger-activated Teflon coated or stainless steel bottle sampler with messenger and 20 metersof graduated line
Teflon y-connector
Stainless steel tubing clamps
Voss Technologies 0.45 micron inline metals filter (or equivalent)
Pre-labeled sample containers per QAPP Worksheet #19
Laboratory-supplied de-ionized water
Weight bearing line/cable and anchor weight
Standard Operating ProcedureLower Passaic River Restoration ProjectSmall Volume Surface Water Sampling/ChemicalData Collection
SOP No.: LPR-FI-04Revision: 3
Date: August 2011Page 3 of 10
J:\Water\ProjectFiles\P120\12182_Passaic\Tasks\CWCM\AECOM QAPP\2011803_Rev2\clean\LPR-FI-04_SmallVolume Surface Water Sampling-Chemical Data Collection_rev3.docx
Field laptop computer
Hand-held electronic recording device (optional) with Intelligent Data Entry Form® (IDEF)software from Earthsoft or equivalent
Approved plans, including target sampling locations
Insulated coolers with wet ice
Field notebook, pen, standardized forms (as needed)
Chain-of-custody forms and seals
Chemical-free wipes
Plastic tape
Survey vessel fitted with differential global positioning system (DGPS) navigational equipment(SOP LPR-G-02) and fathometer
Multi-parameter datasonde (refer to SOP LPR-FI-05)
Safety gear (first aid kit, work vests, HASP specified personal protective equipment [PPE])
Decontamination supplies (refer to SOP LPR-G-03 – Equipment Decontamination)
5.0 Procedu res
5.1 Equipment decontamination
The trigger-activated sampler (if used) and any non-dedicated sampling equipment will be cleanedprior to initial use and between samples at different depths and times following the Level IIIprocedures in SOP LPR-G-03. A sufficient supply of pre-decontaminated small equipment will bemobilized to the sampling locations to minimize the need for performing field decontamination.Larger equipment, such as the trigger-activated sampler, will however require field decontaminationon the vessel between samples.
5.2 Equipment Rinsate Blanks
Equipment rinsate blanks will be collected at the frequency specified in the QAPP, and from eachset of sampling gear (tubing, tubing outfitted with a filter, and bottle sampler with tubing), after thesampling gear is decontaminated. Rinsate blanks of the bottle sampler will be collected by filling thedecontaminated bottle sampler with laboratory-supplied de-ionized water, then filling the appropriatesample containers. Tubing rinsate blanks will be collected by pumping laboratory-supplied de-ionized water through a new length of tubing (and filter for dissolved samples) to fill the appropriatesample containers. Laboratory-specific de-ionized water will be used to prepare the rinsate blanksfor each laboratory performing rinsate blank analysis. An example table is provided in Attachment 2.
Standard Operating ProcedureLower Passaic River Restoration ProjectSmall Volume Surface Water Sampling/ChemicalData Collection
SOP No.: LPR-FI-04Revision: 3
Date: August 2011Page 4 of 10
J:\Water\ProjectFiles\P120\12182_Passaic\Tasks\CWCM\AECOM QAPP\2011803_Rev2\clean\LPR-FI-04_SmallVolume Surface Water Sampling-Chemical Data Collection_rev3.docx
5.3 Instrument Set-Up
Fasten the CFLEX™ tubing to the datasonde (YSI or equivalent) that will be used to conduct watercolumn profiling (SOP LPR-FI-05) with plastic tape. Avoid causing any obstruction to the turbiditysensor. Attach the datasonde and the tubing inlet to the weighted deployment line at approximately3 feet above the anchor weight. The tubing and the sensor cable should then be fastened (withplastic tape or similar) to the weighted deployment line at regular intervals over the entire length.
5.4 Water Pump
Connect the pump to a 12-volt battery or directly to the vessel’s 12-volt electrical system usingappropriate electrical connections. The water pumps, associated tubing, and filters should be newand dedicated to the project. The tubing using in the project will be new, dedicated tubing for eachsample collected, and will be pre-cleaned and shipped bagged individually to the facility from thelaboratory. The internal volume of water carried in the system (pump inlet to pump outlet) should bepurged with a least three volumes of river water prior to sample collection to ensure that arepresentative sample is collected. The number of minutes required to purge the pump and tubingwill be calculated as follows:
((( r2 x l)/10)/f) x 3 = minutes to purge the pump
Where: = pi
r = half the inner diameter of the tubing (cm)l = length of tubing used on station (meters)f = flow rate of the pump (liters/min)
5.5 Deployment/Field Data Collection
5.5.1 Navigate to the station of interest using the navigational procedures outlined in SOP LPR-G-02 – Navigational Positioning.
5.5.2 Deploy the datasonde and attached sampling tube and begin water column profiling asoutlined in the QAPP and SOP LPR-FI-05.
Sample collection from a boat: Ideally, boat engines and/or generators should be shut offduring sampling. If this is not possible, then the sampling platform should be positionedupwind from any running combustion engines.
At the station of interest, the datasonde (and sampling tubing) should be lowered throughthe water column until it is 3 feet off the bottom as determined by the shipboard fathometer.Turbidity will be monitored real time during the descent and caution taken to avoid contactwith the bottom. In the event of bottom contact during sampling, as determined by operator“feel” or sporadically high real-time turbidity readings, sampling should be delayed until theturbidity plume has dissipated. Dissipation of the turbidity plume will be indicated by a returnof the turbidity reading to pre-bottom contact levels.
Based on the water depth provided by the fathometer, the field team will determine thewater column structure and define the desired depths for data and sample collection. After
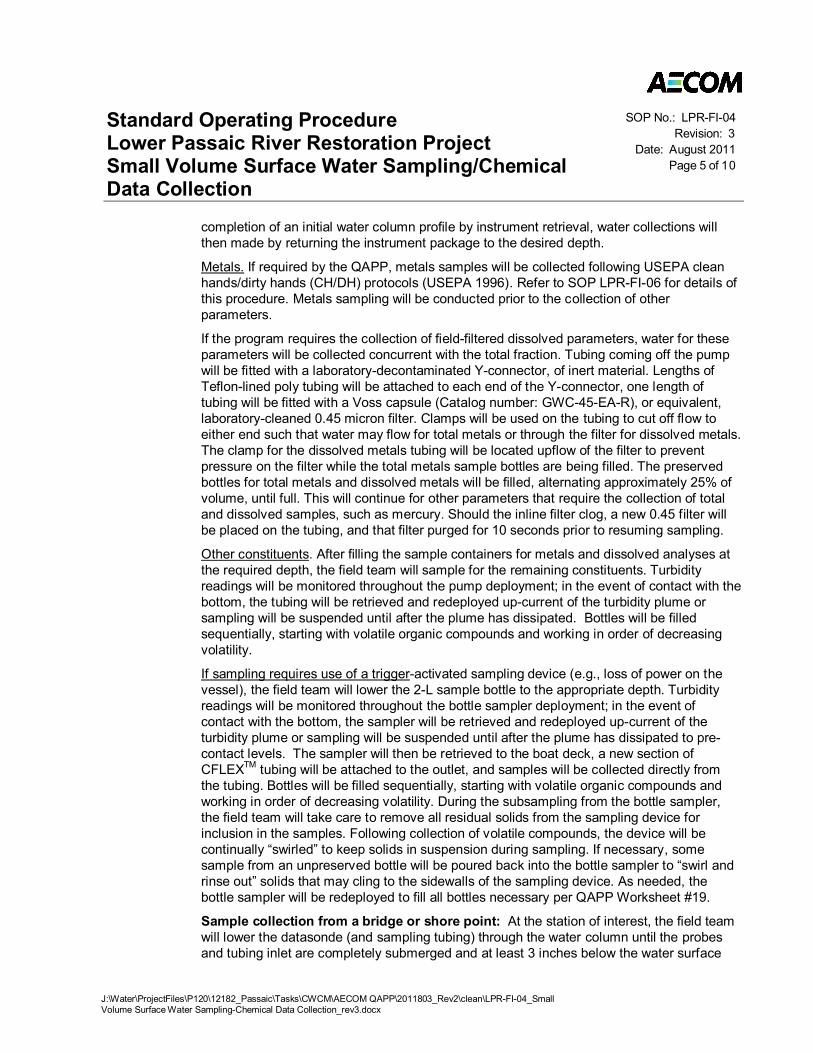
Standard Operating ProcedureLower Passaic River Restoration ProjectSmall Volume Surface Water Sampling/ChemicalData Collection
SOP No.: LPR-FI-04Revision: 3
Date: August 2011Page 5 of 10
J:\Water\ProjectFiles\P120\12182_Passaic\Tasks\CWCM\AECOM QAPP\2011803_Rev2\clean\LPR-FI-04_SmallVolume Surface Water Sampling-Chemical Data Collection_rev3.docx
completion of an initial water column profile by instrument retrieval, water collections willthen made by returning the instrument package to the desired depth.
Metals. If required by the QAPP, metals samples will be collected following USEPA cleanhands/dirty hands (CH/DH) protocols (USEPA 1996). Refer to SOP LPR-FI-06 for details ofthis procedure. Metals sampling will be conducted prior to the collection of otherparameters.
If the program requires the collection of field-filtered dissolved parameters, water for theseparameters will be collected concurrent with the total fraction. Tubing coming off the pumpwill be fitted with a laboratory-decontaminated Y-connector, of inert material. Lengths ofTeflon-lined poly tubing will be attached to each end of the Y-connector, one length oftubing will be fitted with a Voss capsule (Catalog number: GWC-45-EA-R), or equivalent,laboratory-cleaned 0.45 micron filter. Clamps will be used on the tubing to cut off flow toeither end such that water may flow for total metals or through the filter for dissolved metals.The clamp for the dissolved metals tubing will be located upflow of the filter to preventpressure on the filter while the total metals sample bottles are being filled. The preservedbottles for total metals and dissolved metals will be filled, alternating approximately 25% ofvolume, until full. This will continue for other parameters that require the collection of totaland dissolved samples, such as mercury. Should the inline filter clog, a new 0.45 filter willbe placed on the tubing, and that filter purged for 10 seconds prior to resuming sampling.
Other constituents. After filling the sample containers for metals and dissolved analyses atthe required depth, the field team will sample for the remaining constituents. Turbidityreadings will be monitored throughout the pump deployment; in the event of contact with thebottom, the tubing will be retrieved and redeployed up-current of the turbidity plume orsampling will be suspended until after the plume has dissipated. Bottles will be filledsequentially, starting with volatile organic compounds and working in order of decreasingvolatility.
If sampling requires use of a trigger-activated sampling device (e.g., loss of power on thevessel), the field team will lower the 2-L sample bottle to the appropriate depth. Turbidityreadings will be monitored throughout the bottle sampler deployment; in the event ofcontact with the bottom, the sampler will be retrieved and redeployed up-current of theturbidity plume or sampling will be suspended until after the plume has dissipated to pre-contact levels. The sampler will then be retrieved to the boat deck, a new section ofCFLEXTM tubing will be attached to the outlet, and samples will be collected directly fromthe tubing. Bottles will be filled sequentially, starting with volatile organic compounds andworking in order of decreasing volatility. During the subsampling from the bottle sampler,the field team will take care to remove all residual solids from the sampling device forinclusion in the samples. Following collection of volatile compounds, the device will becontinually “swirled” to keep solids in suspension during sampling. If necessary, somesample from an unpreserved bottle will be poured back into the bottle sampler to “swirl andrinse out” solids that may cling to the sidewalls of the sampling device. As needed, thebottle sampler will be redeployed to fill all bottles necessary per QAPP Worksheet #19.
Sample collection from a bridge or shore point: At the station of interest, the field teamwill lower the datasonde (and sampling tubing) through the water column until the probesand tubing inlet are completely submerged and at least 3 inches below the water surface
Standard Operating ProcedureLower Passaic River Restoration ProjectSmall Volume Surface Water Sampling/ChemicalData Collection
SOP No.: LPR-FI-04Revision: 3
Date: August 2011Page 6 of 10
J:\Water\ProjectFiles\P120\12182_Passaic\Tasks\CWCM\AECOM QAPP\2011803_Rev2\clean\LPR-FI-04_SmallVolume Surface Water Sampling-Chemical Data Collection_rev3.docx
and record in-situ parameters according to SOP LPR-FI-05. If the instrument packagemakes contact with the bottom sampling should be delayed for 5 minutes to allow for anysuspended sediments to dissipate to pre-contact levels as determined by monitoring real-time turbidity readings. Sample collection can then proceed as outlined for boat-basedsample collection using pumps or sampler deployment if necessary. If sample collectionthrough direct immersion is possible and appropriate, samples will be collected by loweringa capped, inverted sample bottle beneath the water surface, uncapping while submerged,and then slowly rotating the bottle upright until full. The bottle will then be capped whilesubmerged and removed from the water column. Samples that require collection into pre-preserved bottles will be collected using an interim container (for example, a non-preservedlaboratory-supplied bottle of a material appropriate for the analysis) and then transferredinto the pre-preserved bottle.
All samples will be collected into bottles that were received pre-preserved (QAPP Worksheet#19) or will be preserved upon receipt at the laboratory.
5.5.3 Sample collection information will be recorded at the time of collection using either IDEFs,standardized forms, the field logbook, or a combination. This information will include, but notbe limited to, the station ID, sample ID, time and date of sample collection, sample collectiondepth, the sampler’s name, vessel, description of any sample processing, and any pertinentobservations. An example of the IDEF is provided as Attachment 1. Refer to QAPPWorksheet #27 for sample identification details.
5.5.4 Samples will be placed in coolers and stored on ice (refer to the QAPP for containerizationand storage specifications) until shipment to the laboratory. Chlorophyll a samples (if requiredfor the program) will immediately be placed in the dark and on ice.
5.5.5 Sample custody, packaging and shipment will be conducted according to the proceduresdescribed in SOPs LPR-G-05 – Sample Custody, and LPR-G-06 – Packaging and Shipping.
6.0 Quality Assurance / Quality Control
6.1 Entries on the forms and in the field logbook will be checked by the samplers to verify that theinformation is correct.
6.2 It is the responsibility of the Field Task Manager (FTM) or designee to spot check adherence to theprocedural requirements of this SOP and to review the associated documentation for accuracy andcompleteness.
6.3 Data quality evaluations will be based on quality control (QC) sample results. QC samples mayinclude field duplicates, matrix spike/matrix spike duplicate (MS/MSD) samples and equipment rinsateblanks; frequency of collection requirements is tabulated in QAPP Worksheet #28. Additional volumefor field duplicates and MS/MSD samples will be collected according to the methods outlined in thisSOP; however, with the exception of volatile compounds, bottles will be filled concurrently (rather thansequentially) if possible to minimize variability between sample containers.
Standard Operating ProcedureLower Passaic River Restoration ProjectSmall Volume Surface Water Sampling/ChemicalData Collection
SOP No.: LPR-FI-04Revision: 3
Date: August 2011Page 7 of 10
J:\Water\ProjectFiles\P120\12182_Passaic\Tasks\CWCM\AECOM QAPP\2011803_Rev2\clean\LPR-FI-04_SmallVolume Surface Water Sampling-Chemical Data Collection_rev3.docx
7.0 Data and records management
7.1 Field records will be generated and maintained as outlined in SOP LPR-G-01 – Field Records and inthe LPR Data Management Plan (DMP) [AECOM 2010, or current version]. These documents coverall aspects of collection including chronology of events, station locations, time/date, sampler name,and data collected.
7.2 Field data will be maintained and distributed to the appropriate personnel as described in the LPRDMP (AECOM 2010, or current revision).
7.3 Deviations to the procedures detailed in the SOP must be recorded in the field logbook at the time ofoccurrence and summarized on the Daily Activity Log (refer to SOP LRP-G-01 – Field Records). Aformal nonconformance report (NCR) will be completed (refer to SOP LRP-G-01 – Field Records) anddistributed as specified in the QAPP.
7.4 All records associated with the activities described in this SOP will be ultimately maintained inaccordance with the Lower Passaic River Quality Management Plan (AECOM 2009).
8.0 Personnel qualifications and training
The individuals executing these procedures must have read, and be familiar with, the requirements ofthis SOP and the corresponding LPRRP plans (e.g., HASP, QAPP, DMP, and FSP). Water qualitydata collection is a relatively simple procedure requiring minimal training. However, inexperiencedpersonnel performing these activities will be initially be supervised by the FTM or designee.
9.0 Ref erences
AECOM 2009. Quality Management Plan, Lower Passaic River Restoration Project, CERCLA DocketNo. 02-207-2009. September 2009 or current version.
AECOM 2010. Lower Passaic River Data Management Plan. July 2010 or current version.
AECOM 2011. Lower Passaic River Restoration Project, Remedial Investigation, Health and SafetyPlan Addendum. June 2011 or current version.
MPI 2005b. Lower Passaic River Restoration Project Health and Safety Plan Final Addendum –Sediment Coring. July 2005.
USEPA 1996. Method 1669 Sampling Ambient Water for Trace Metals at EPA Water Quality CriteriaLevels. July 1996.

Standard Operating ProcedureLower Passaic River Restoration ProjectSmall Volume Surface Water Sampling/ChemicalData Collection
SOP No.: LPR-FI-04Revision: 3
Date: August 2011Page 8 of 10
J:\Water\ProjectFiles\P120\12182_Passaic\Tasks\CWCM\AECOM QAPP\2011803_Rev2\clean\LPR-FI-04_SmallVolume Surface Water Sampling-Chemical Data Collection_rev3.docx
10.0 Revision history
Revision Date Changes
0 June 2010 NA
1 September 2010 Minor revisions throughoutdocument
2 July 2011 Minor revisions throughoutdocument
3 August 2011 Minor revisions; update todissolved parameter collection;equipment blank table added as
Attachment 2
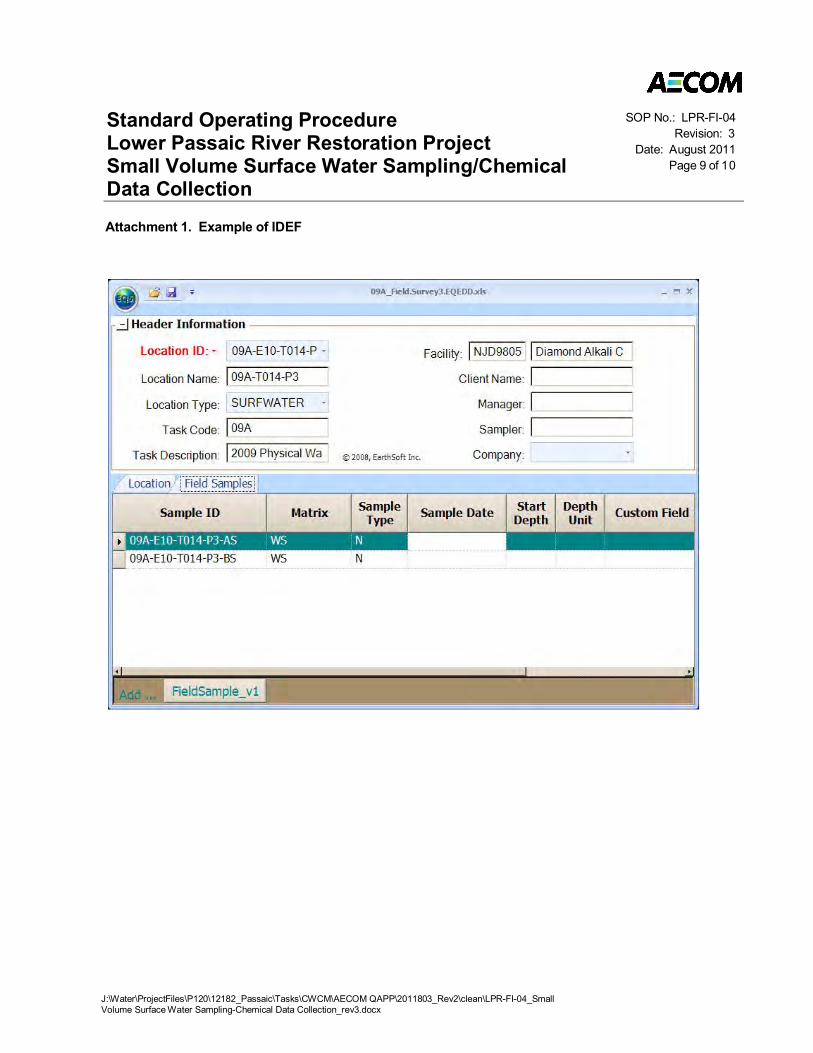
Standard Operating ProcedureLower Passaic River Restoration ProjectSmall Volume Surface Water Sampling/ChemicalData Collection
SOP No.: LPR-FI-04Revision: 3
Date: August 2011Page 9 of 10
J:\Water\ProjectFiles\P120\12182_Passaic\Tasks\CWCM\AECOM QAPP\2011803_Rev2\clean\LPR-FI-04_SmallVolume Surface Water Sampling-Chemical Data Collection_rev3.docx
Attachment 1. Example of IDEF
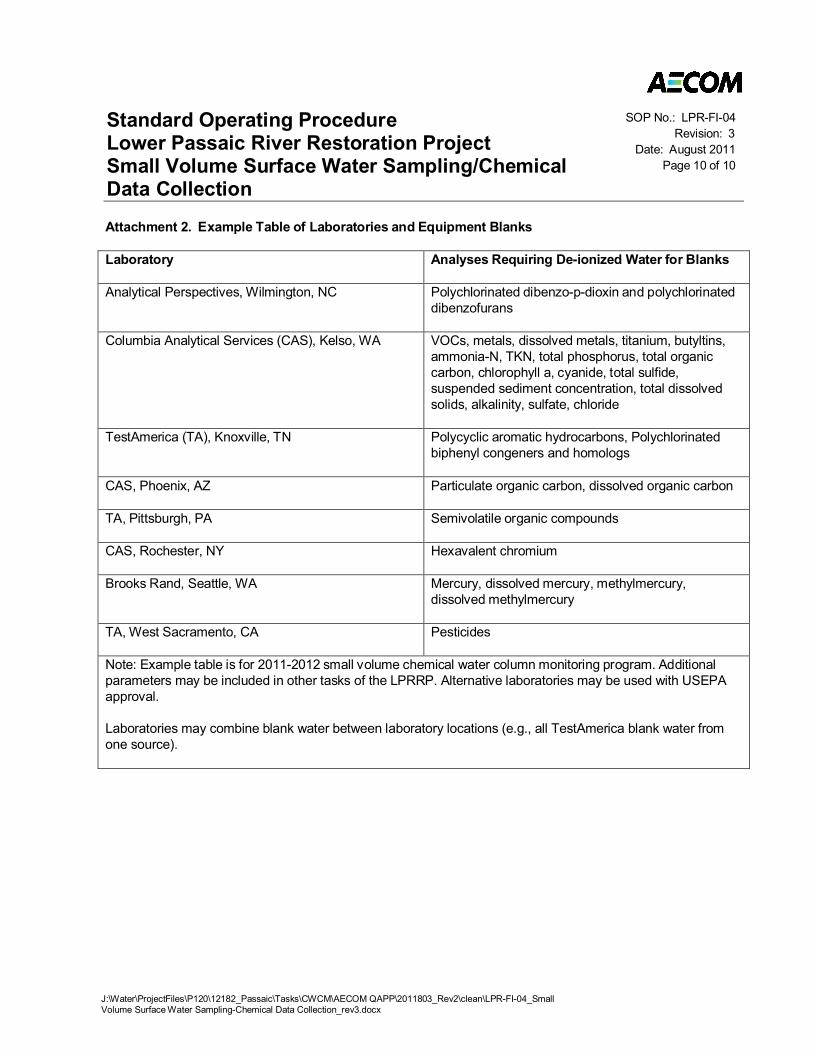
Standard Operating ProcedureLower Passaic River Restoration ProjectSmall Volume Surface Water Sampling/ChemicalData Collection
SOP No.: LPR-FI-04Revision: 3
Date: August 2011Page 10 of 10
J:\Water\ProjectFiles\P120\12182_Passaic\Tasks\CWCM\AECOM QAPP\2011803_Rev2\clean\LPR-FI-04_SmallVolume Surface Water Sampling-Chemical Data Collection_rev3.docx
Attachment 2. Example Table of Laboratories and Equipment Blanks
Laboratory Analyses Requiring De-ionized Water for Blanks
Analytical Perspectives, Wilmington, NC Polychlorinated dibenzo-p-dioxin and polychlorinateddibenzofurans
Columbia Analytical Services (CAS), Kelso, WA VOCs, metals, dissolved metals, titanium, butyltins,ammonia-N, TKN, total phosphorus, total organiccarbon, chlorophyll a, cyanide, total sulfide,suspended sediment concentration, total dissolvedsolids, alkalinity, sulfate, chloride
TestAmerica (TA), Knoxville, TN Polycyclic aromatic hydrocarbons, Polychlorinatedbiphenyl congeners and homologs
CAS, Phoenix, AZ Particulate organic carbon, dissolved organic carbon
TA, Pittsburgh, PA Semivolatile organic compounds
CAS, Rochester, NY Hexavalent chromium
Brooks Rand, Seattle, WA Mercury, dissolved mercury, methylmercury,dissolved methylmercury
TA, West Sacramento, CA Pesticides
Note: Example table is for 2011-2012 small volume chemical water column monitoring program. Additionalparameters may be included in other tasks of the LPRRP. Alternative laboratories may be used with USEPAapproval.
Laboratories may combine blank water between laboratory locations (e.g., all TestAmerica blank water fromone source).
Standard Operating Procedure Lower Passaic River Restoration Project
J:\Water\ProjectFiles\P120\12182_Passaic\Tasks\CWCM\AECOM QAPP\20110712_Rev1_toEPA\Word_clean\20110708_CWCM-sv_QAPP_Appendix-B_rev1\LPR-FI-05_Water Column Profiling_rev2.docx
Water Column Profiling
Procedure Number: LPR-FI-05
Revision No.: 2
Revision Date: July 2011
Prepared by
Steve Wolf Aaron Hopkins
Date: July 7, 2011 Laura Kelmar, Project Manager Date: July 7, 2011 Debra L. Simmons, Project QA Manager
Annual review of this SOP has been performed and the SOP still reflects current practice.
Initials: Date: Initials: Date:
Standard Operating Procedure Lower Passaic River Restoration Project Water Column Profiling
SOP No.: LPR-FI-05 Revision: 2
Date: July 2011 Page i of i
LPR-FI-05_Water Column Profiling_rev2.docx
Contents
1.0 SCOPE AND APPLICABILITY ............................................................................................................... 1
2.0 HEALTH AND SAFETY CONSIDERATIONS ....................................................................................... 1
3.0 INTERFERENCES ................................................................................................................................... 2
4.0 EQUIPMENT AND MATERIALS ............................................................................................................ 2
5.0 PROCEDURES ........................................................................................................................................ 3
6.0 QUALITY ASSURANCE / QUALITY CONTROL .................................................................................. 4
7.0 DATA AND RECORDS MANAGEMENT ............................................................................................... 4
8.0 PERSONNEL QUALIFICATIONS AND TRAINING .............................................................................. 5
9.0 REFERENCES......................................................................................................................................... 5
10.0 REVISION HISTORY ............................................................................................................................... 6
Standard Operating Procedure Lower Passaic River Restoration Project Water Column Profiling
SOP No.: LPR-FI-05 Revision: 2
Date: July 2011 Page 1 of 7
LPR-FI-05_Water Column Profiling_rev2.docx
1.0 Scope and applicability
1.1 This project Standard Operating Procedure (SOP) defines the procedures for the collection of water column profile data in the Lower Passaic River Study Area and the Newark Bay Study Area as part of the Lower Passaic River Restoration Project (LPRRP) using a multi-parameter datasonde from a boat or other sampling platform.
1.2 This SOP assumes that water column profiling is associated with surface water sample/data collection activities; refer to SOPs LPR-FI-04 and LPR-FI-06, or as specified in the Quality Assurance Project Plan (QAPP).
1.3 This SOP has been prepared based on the use of a YSI™ 6820 V2, but an equivalent instrument can be used and the principles of this SOP applied to its use.
1.4 It is fully expected that the procedures outlined in this SOP will be followed. Procedural modifications may be warranted depending upon field conditions or limitations imposed by the procedure. Substantive modification to this SOP will be approved in advance by the Project Quality Assurance (QA) Manager and the Task Manager and communicated to the Cooperating Parties Group (CPG) Project Coordinator and the United States Environmental Protection Agency (USEPA) Remedial Project Manager (RPM). Deviations from this SOP will be documented in the field records. The ultimate procedure employed will be documented in the report summarizing the results of the sampling event or field activity.
2.0 Health and safety considerations
2.1 The health and safety (H&S) considerations for the work associated with this SOP, including physical, chemical, and biological hazards are addressed in the site-specific Health and Safety Plan (HASP) and associated addendums (MPI 2005a; MPI 2005b; AECOM 2011). The major H&S considerations for the work associated with water column data collections are the marine safety aspects of the program.
2.2 Daily safety briefs will be conducted at the start of each working day before any work commences. These daily briefs will be facilitated by the Site Safety Officer (SSO) or his/her designee to discuss the day’s events and any potential health risk areas covering every aspect of the work to be completed. Weather conditions are often part of these discussions. As detailed in the HASP, everyone on the field team has the authority to stop work if an unsafe condition is perceived until the conditions are fully remedied to the satisfaction of the SSO.
Standard Operating Procedure Lower Passaic River Restoration Project Water Column Profiling
SOP No.: LPR-FI-05 Revision: 2
Date: July 2011 Page 2 of 7
LPR-FI-05_Water Column Profiling_rev2.docx
3.0 Interferences
3.1 Ensuring that the in-situ sensors are and clean will reduce interference risks. Floating debris may foul the instrumentation and regular checking during measurements is needed to ensure that sensors are not blocked.
3.2 Ensuring that the in-situ sensors are maintained properly will help reduce interference risks related to these data collection efforts and also prevent sensors from becoming corroded.
3.3 Proper calibration of the instrument is necessary to ensure accurate data. Refer to Section 5.2 of this SOP for calibration procedures.
4.0 Equipment and materials
The following equipment list contains materials which may be needed in carrying out the procedures contained in this SOP. Not all equipment listed below may be necessary for a specific activity. Additional equipment may be required, pending field conditions.
Multiparameter datasonde with turbidity sensor (YSI™ 6820 V2 or equivalent)
EcoWatch™ data logging software or equivalent
Connective (serial) cabling
Sufficient memory capacity for the survey
Weight bearing line/cable and anchor weight. Greater than 50 feet of line may be required for the deepest areas of Newark Bay.
Field laptop computer
Calibration solutions
Chemical-free wipes
Tap water supply
Plastic tape
Approved plans, including target locations
Manufacturer’s operating manual
Replacement batteries
Survey vessel fitted with differential global positioning system (DGPS) navigational equipment (SOP LPR-G-02) and a fathometer
Safety gear (work vests, HASP specified personal protective equipment [PPE])
Standard Operating Procedure Lower Passaic River Restoration Project Water Column Profiling
SOP No.: LPR-FI-05 Revision: 2
Date: July 2011 Page 3 of 7
LPR-FI-05_Water Column Profiling_rev2.docx
5.0 Procedures
5.1 Datasonde Instrument Set-Up
Fasten the pump tubing for water sample collection (SOP LPR-FI-04) to the multiparameter datasonde, avoiding any obstruction to the turbidity sensor. Attach the datasonde and the tubing inlet to the weighted deployment line at approximately 3 feet (ft) above the anchor weight. The tubing and the sensor cable should then be fastened (with cable ties) to the weighted deployment line at regular intervals over the entire length. Sensors should be inspected for cleanliness and to ensure they are free of corrosion.
Install the instrument batteries and data logging software according to the instrument-specific operating manual. A new logging file should be created for each profile to aid in data tracking. Refer to QAPP Worksheet #27 for the profile naming conventions. The data logging system should then be set up to log data every second unless otherwise specified in the QAPP.
5.2 Calibration
The datasonde should be calibrated daily before initiating water column profile data collection according to Section 2.6 of the manufacturer’s operation manual (YSI 2009).
5.3 Deployment/Field Data Collection
5.3.1 Navigate to the station of interest using the navigational procedures outlined in SOP LPR-G-02 – Navigational Positioning.
5.3.2 Deploy the datasonde and attached sampling tube and begin water column data profiling as outlined in the QAPP.
Profile collection from a boat: At the station of interest, the datasonde (and sampling tubing) should be lowered through the water column until it is 3 ft off the bottom as determined by the shipboard fathometer. If the operator “feels” the bottom with the weight, the instrument should be raised and data collection delayed to allow any resuspended sediment to dissipate as determined by monitoring real-time turbidity readings. The anchor weight should be kept suspended above the bottom sediment. Based on the water depth provided by the datasonde, field technicians will determine the water column structure and define the desired depths for data and sample collection. The datasonde should be allowed to equilibrate at bottom depth for at least one minute (or until readings for all parameters stabilized) before beginning profiling.
Field technicians will then create a new logging file for that station/profile according to QAPP naming conventions (QAPP Worksheet #27) and initiate data logging. The datasonde will then be slowly retrieved by hand at a rate of approximately one foot per second, per the manufacturer’s specifications for the response time of the sensors, as indicated by the real-time display in EcoWatch™. Fixed point measurements will be collected at each sampling depth. Once the initial profile is complete field technicians will return the instrument package to the sampling point and conduct water sampling according to SOP LPR-FI-04. The datasonde will continue to log data throughout the sampling activity.
Standard Operating Procedure Lower Passaic River Restoration Project Water Column Profiling
SOP No.: LPR-FI-05 Revision: 2
Date: July 2011 Page 4 of 7
LPR-FI-05_Water Column Profiling_rev2.docx
After the conclusion of all sampling at a station a second profile will be collected in the same manner as the first in order to document any changes in the water column.
Profile collection from a bridge or shore point: At the station of interest, the field team should lower the datasonde (and sampling tubing) through the water column until the probes and tubing inlet are completely submerged and at least 3 inches below the water surface. If the instrument package makes contact with the bottom profiling should be delayed for 5 minutes to allow for any suspended sediments to dissipate as confirmed by monitoring real-time turbidity readings. The datasonde should be allowed to equilibrate at sample depth for at least one minute (or until readings for all parameters stabilized) before beginning profiling.
Field technicians will then create a new logging file for that station/profile according to QAPP naming conventions (Worksheet #27) and initiate data logging. Due to the shallow water depth at bridge sampling stations (1-2 ft), data will only be collected at a single depth for in-situ parameters as defined in QAPP Worksheet #18. Once the initial in-situ measurements are complete field technicians will conduct water sampling according to SOP LPR-FI-04. Data logging will continue for the duration of sampling activities in order to document any changes in the water column.
6.0 Quality assurance / quality control
6.1 It is the responsibility of the Field Task Manager (FTM) or designee to check the instrument calibration/test information, to spot check adherence to the procedural requirements of this SOP, and to review the associated documentation for accuracy and completeness.
6.2 Newly acquired profile data should be reviewed for reasonableness by the FTM or designee before moving off station.
7.0 Data and records management
7.1 Field records will be generated and maintained as outlined in SOP LPR-G-01 – Field Records and in the Lower Passaic River (LPR) Data Management Plan (DMP) [AECOM 2010, or current version]. These documents cover all aspects of collection including chronology of events, station locations, time/date, sampler name, and data collected.
Instrument check/test records including sensor calibration records will be maintained in the field logbook.
7.2 During water column profiling in-situ data will be captured on a laptop PC using EcoWatch™ data acquisition software. In addition, field technicians will record profile information on the In-situ Data Log, Attachment 1 to this SOP. Acquired data will be downloaded on a daily basis as an EcoWatch™ file and then exported as an excel spreadsheet to the AECOM Data Management Task Manager at the conclusion of the survey for permanent storage as specified in the DMP (AECOM 2010, or current version).
Standard Operating Procedure Lower Passaic River Restoration Project Water Column Profiling
SOP No.: LPR-FI-05 Revision: 2
Date: July 2011 Page 5 of 7
LPR-FI-05_Water Column Profiling_rev2.docx
Data files recorded by the instrument will be tracked by date/time stamp and profile naming convention (refer to QAPP Worksheet #27). The field laptop time/clock should be checked at the start of the survey against an accurate source (e.g., cell phone or DGPS time stamp) to ensure accurate time synchronization for these tidally sensitive data.
7.3 Field data will be maintained and distributed to the appropriate personnel as described in the LPR DMP (AECOM 2010, or current revision).
7.4 Deviations to the procedures detailed in the SOP must be recorded in the field logbook at the time of occurrence and summarized on the Daily Activity Log (refer to SOP LRP-G-01 – Field Records). A formal nonconformance report (NCR) will be completed (refer to SOP LRP-G-01 – Field Records) and distributed as specified in the QAPP.
7.5 All records associated with the activities described in this SOP will be ultimately maintained in accordance with the Lower Passaic River Quality Management Plan (AECOM 2009).
8.0 Personnel qualifications and training
The individuals executing these procedures must have read, and be familiar with, the requirements of this SOP and the corresponding LPRRP plans (e.g., HASP, QAPP, DMP, and FSP). Water quality data collection is a relatively simple procedure requiring minimal training. However, initial instrument calibration and sample/data collections should be supervised by the FTM or designee.
9.0 References
AECOM 2009. Quality Management Plan, Lower Passaic River Restoration Project, CERCLA Docket No. 02-207-2009. September 2009 or current version.
AECOM 2010. Lower Passaic River Data Management Plan. July 2010 or current version.
AECOM 2011. Lower Passaic River Restoration Project, Remedial Investigation, Health and Safety Plan Addendum. June 2011 or current version.MPI 2005b. Lower Passaic River Restoration Project Health and Safety Plan Final Addendum – Sediment Coring. July 2005.
YSI 2009. 6-Series Multiparameter Water Quality Sondes. September 2009 or current version. http://www.ysi.com/resource-library.php
Standard Operating Procedure Lower Passaic River Restoration Project Water Column Profiling
SOP No.: LPR-FI-05 Revision: 2
Date: July 2011 Page 6 of 7
LPR-FI-05_Water Column Profiling_rev2.docx
10.0 Revision history
Revision Date Changes
0 June 2010 NA
1 September 2010 Minor revisions throughout document
2 July 2011 Minor revisions throughout document
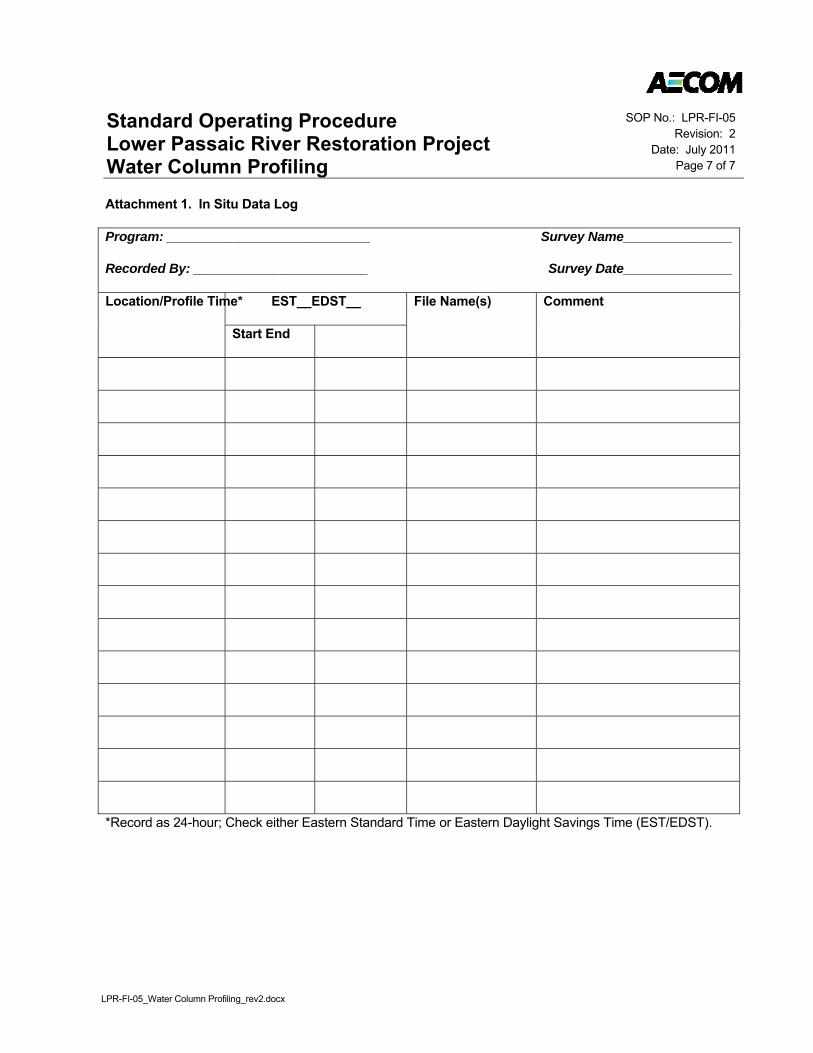
Standard Operating Procedure Lower Passaic River Restoration Project Water Column Profiling
SOP No.: LPR-FI-05 Revision: 2
Date: July 2011 Page 7 of 7
LPR-FI-05_Water Column Profiling_rev2.docx
Attachment 1. In Situ Data Log
Program: ____________________________
Recorded By: ________________________
Survey Name_______________
Survey Date_______________
Location/Profile Time* EST__EDST__ File Name(s) Comment
Start End
*Record as 24-hour; Check either Eastern Standard Time or Eastern Daylight Savings Time (EST/EDST).
Standard Operating ProcedureLower Passaic River Restoration Project
J:\Water\ProjectFiles\P120\12182_Passaic\Tasks\CWCM\AECOM QAPP\2011803_Rev2\clean\LPR-FI-06_Surface Water Sampling forTrace Metals_rev3.docx
Surface Water Sampling for Trace Metals
Procedure Number: LPR-FI-06
Revision No.: 3
Revision Date: August 2011
Prepared by
Kristen DurocherAaron Hopkins
Date: August 10, 2011Laura Kelmar, Project Manager
Date: August 10, 2011Debra L. Simmons, Project QA Manager
Annual review of this SOP has been performedand the SOP still reflects current practice.
Initials: D ate:Initials: D ate:
Standard Operating Procedure Lower Passaic River Restoration Project Surface Water Sampling for Trace Metals
SOP No.: LPR-FI-06 Revision: 3
Date: August 2011 Page i of i
J:\Water\ProjectFiles\P120\12182_Passaic\Tasks\CWCM\AECOM QAPP\2011803_Rev2\clean\LPR-FI-06_Surface Water Sampling for Trace Metals_rev3.docx
Contents
1.0 SCOPE AND APPLICABILITY ............................................................................................................... 1
2.0 HEALTH AND SAFETY CONSIDERATIONS ....................................................................................... 1
3.0 INTERFERENCES ................................................................................................................................... 2
4.0 EQUIPMENT AND MATERIALS ............................................................................................................ 2
5.0 PROCEDURES ........................................................................................................................................ 3
6.0 QUALITY ASSURANCE / QUALITY CONTROL .................................................................................. 5
7.0 DATA AND RECORDS MANAGEMENT ............................................................................................... 6
8.0 PERSONNEL QUALIFICATIONS AND TRAINING .............................................................................. 6
9.0 REFERENCES......................................................................................................................................... 6
10.0 REVISION HISTORY ............................................................................................................................... 7
Standard Operating ProcedureLower Passaic River Restoration ProjectSurface Water Sampling for Trace Metals
SOP No.: LPR-FI-06Revision: 3
Date: August 2011Page 1 of 9
J:\Water\ProjectFiles\P120\12182_Passaic\Tasks\CWCM\AECOM QAPP\2011803_Rev2\clean\LPR-FI-06_Surface Water Sampling forTrace Metals_rev3.docx
1.0 Scope and applicability
1.1 This project Standard Operating Procedure (SOP) defines the procedures for the collection ofsurface water samples in the Lower Passaic River Study Area and the Newark Bay Study Area aspart of the Lower Passaic River Restoration Project (LPRRP) using clean hands/dirty hands(CH/DH) protocols (USEPA, 1996). Sampling will be conducted from a boat or other samplingplatform.
1.2 Samples will be collected for chemical analyses. Use of this SOP is restricted to metals, includingbut not limited to low-level mercury, methylmercury and hexavalent chromium. Analytes for aparticular program are specified in the Quality Assurance Project Plan (QAPP).
1.3 It is assumed that the sampling activities described in this SOP will be conducted in conjunction withwater column profiling (SOP LPR-FI-05) and/or surface water sampling for other parameters (SOPLPR-FI-04).
1.4 It is fully expected that the procedures outlined in this SOP will be followed. Proceduralmodifications may be warranted depending upon field conditions or limitations imposed by theprocedure. Substantive modification to this SOP will be approved in advance by the Project QualityAssurance (QA) Manager and the Task Manager and communicated to the Cooperating PartiesGroup (CPG) Project Coordinator and the United States Environmental Protection Agency (USEPA)Remedial Project Manager (RPM). Deviations from this SOP will be documented in the fieldrecords. The ultimate procedure employed will be documented in the report summarizing theresults of the sampling event or field activity.
2.0 Health and safety considerations
2.1 The health and safety (H&S) considerations for the work associated with this SOP, includingphysical, chemical, and biological hazards are addressed in the site-specific Health and Safety Plan(HASP) and associated addendums (MPI 2005a; MPI 2005b; AECOM 2011). The major H&Sconsiderations for the work associated with water sample collection are the marine safety aspectsof the program.
2.2 Daily safety briefs will be conducted at the start of each working day before any work commences.These daily briefs will be facilitated by the Site Safety Officer (SSO) or his/her designee to discussthe day’s events and any potential health risk areas covering every aspect of the work to becompleted. Weather conditions are often part of these discussions. As detailed in the HASP,everyone on the field team has the authority to stop work if an unsafe condition is perceived untilthe conditions are fully remedied to the satisfaction of the SSO.
Standard Operating ProcedureLower Passaic River Restoration ProjectSurface Water Sampling for Trace Metals
SOP No.: LPR-FI-06Revision: 3
Date: August 2011Page 2 of 9
J:\Water\ProjectFiles\P120\12182_Passaic\Tasks\CWCM\AECOM QAPP\2011803_Rev2\clean\LPR-FI-06_Surface Water Sampling forTrace Metals_rev3.docx
3.0 I nterferences
3.1 Contamination during sampling activities can affect the accurate determination of total anddissolved metals at trace levels. Potential sources of contamination include metallic samplingequipment, deionized water, and dust from automobile/boat exhaust, cigarette smoke, nearbyroads, and bridges (USEPA 1996). Adherence to the CH/DH procedures as described in Section5.0 will minimize these interferences.
3.2 Cross-contamination of samples may result if sample handling equipment is inadequately orimproperly decontaminated. Refer to SOP LPR-G-03 for decontamination procedures.
3.3 Care must be taken to avoid disturbing the bed sediment during sampling. Re-suspended bedsediments may contaminate the surface water samples.
3.4 High sample turbidity may cause clogging of the filter membrane and cause a decrease in filterefficiency/rate. Monitoring of flow rate is recommended; if a significant decrease is noted,replacement of the filter may be needed.
3.5 Purging the pump system with a minimum of three volumes of site water will ensure that the samplecollected is representative of the sample location and desired depth.
4.0 Equipment and materials
The following equipment list contains materials which may be needed in carrying out theprocedures contained in this SOP. Not all equipment listed below may be necessary for a specificactivity. Additional equipment may be required, pending field conditions.
Water pump (peristaltic pump capable of 10 liters/minute (L/min) or better)
12-volt battery (as needed)
Electrical connectors
Laboratory-supplied pre-cleaned and double-bagged CFLEX™ or equivalent polymer tubing(typical configuration requires 3/8 inch ID), a 50-foot length will be required for the deepestportion of the Lower Passaic River (LPR). Greater than 50 feet of tubing may be required fordeep samples. If tubing must be connected to create longer lengths, inert and decontaminatedconnectors will be used.
Pre-cleaned and double-bagged Voss Technologies 0.45 micron inline metals filter (orequivalent)
Teflon Y-connectors
Stainless steel tubing clamps
Laboratory-supplied double-bagged water sample containers per QAPP Worksheet #19
Weight bearing line/cable and anchor weight
Standard Operating ProcedureLower Passaic River Restoration ProjectSurface Water Sampling for Trace Metals
SOP No.: LPR-FI-06Revision: 3
Date: August 2011Page 3 of 9
J:\Water\ProjectFiles\P120\12182_Passaic\Tasks\CWCM\AECOM QAPP\2011803_Rev2\clean\LPR-FI-06_Surface Water Sampling forTrace Metals_rev3.docx
Field laptop computer, equipped with Intelligent Data Entry Form® (IDEF) software orequivalent (optional)
Approved plans, including target sampling locations
Insulated coolers with wet ice
Field notebook, pen, standardized forms (as needed)
Chain-of-custody forms and seals
Chemical-free wipes
Plastic tape
Zipper-lock bags
Laboratory supplied reagent water
Tap water supply
Pre-cleaned pipets
Survey vessel fitted with differential global positioning system (DGPS) navigational equipment(SOP LPR-G-02) and a fathometer
Safety gear (first aid kit, work vests, HASP specified personal protective equipment [PPE])
5.0 Procedu res
5.1 Instrument Set-Up
Fasten the CFLEX™ tubing to the datasonde that will be used to conduct water column profiling(SOP No.: LPR-FI-05) with small cable ties. Avoid causing any obstruction to the turbidity sensor.Attach the datasonde and the tubing inlet to the weighted deployment line at approximately 3 feet(ft) above the anchor weight. The tubing and the sensor cable should then be fastened (withcable ties or similar) to the weighted deployment line at regular intervals over the entire length.
5.2 Water Pump
Connect the pump to a 12-volt battery or directly to the vessel’s 12-volt electrical system usingappropriate electrical connections. The water pumps, associated tubing, and filters should benew and dedicated to the project. Tubing and filters are received pre-cleaned from the laboratoryand will be kept in sealed zip-top plastic bags prior to use. New tubing and filters will be used foreach sample. Water pumps should be rinsed with tap water before and after each sampling dayin accordance with SOP LPR-G-03. Rinsing is not generally required for the sampling apparatus(pump, datasonde etc.) between stations (or between sampling depths). However, the internalvolume of water carried in the system (pump inlet to pump outlet) should be purged with a leastthree volumes of river water to ensure that a representative sample is collected. Prior tosampling, the tubing shall be rinsed with site water.
5.3 Equipment Rinsate Blanks

Standard Operating ProcedureLower Passaic River Restoration ProjectSurface Water Sampling for Trace Metals
SOP No.: LPR-FI-06Revision: 3
Date: August 2011Page 4 of 9
J:\Water\ProjectFiles\P120\12182_Passaic\Tasks\CWCM\AECOM QAPP\2011803_Rev2\clean\LPR-FI-06_Surface Water Sampling forTrace Metals_rev3.docx
Equipment rinsate blanks will be collected at the frequency specified in the QAPP, and from eachset of sampling gear (tubing and tubing outfitted with a filter) after the sampling gear isdecontaminated. Rinsate blanks will be collected by pumping laboratory-supplied reagent waterthrough a pre-cleaned (by the laboratory) length of tubing (and filter for dissolved samples) to fillthe appropriate sample containers. Laboratory-specific reagent water will be used to prepare therinsate blank for each laboratory performing rinsate blank analysis.
5.4 Sample Bottles
The laboratory will supply pre-cleaned Fluorinated Ethylene Propylene (FEP),Polytetrafluoroethylene (PTFE), conventional or linear polyethylene, polycarbonate, orpolypropylene sample containers with lids in double zip top plastic bags. Bottles for low-levelmercury (Hg) analysis should be fluoropolymer or glass. The containers will be rinsed with a0.1% Hydrogen Chloride (HCl) (v/v) solution and then filled with reagent water by the laboratoryprior to shipment to the field facility.
5.5 Deployment/Field Data Collection
5.5.1 Navigate to the station of interest using the navigational procedures outlined in SOP LPR-G-02 – Navigational Positioning.
5.5.2 Deploy the datasonde and attached sampling tube and begin water column profiling andsampling as outlined in the QAPP and SOPs LPR-FI-04 and LPR-FI-05. Ideally, boatengines and/or generators should be shut off during sampling. If this is not possible, thenthe sampling platform should be positioned upwind from any running combustion engines.
Prior to filling any bottles for metals analysis one member of the field team will bedesignated as the DH sampler and one member of the team will be designated as the CHsampler. The DH sampler will handle the outer sample bags and operate the pump andall other equipment during the sampling process. The CH sampler will don new nitrilegloves and only contact the inner sample bags, sample containers, filters, and sampletubing until sampling is complete.
Once the pump has been purged according to SOP LPR-FI-04 and the sample is ready tobe collected, the DH sampler will open the outer bag of the appropriate sample containerand allow the CH sampler to remove the inner bag and bottle. The CH sampler should takecare not to contact the outer surface of the outer bag. The CH will then open the inner bag,remove the bottle, and uncap the bottle for sample collection directly from the sampletubing (the CH sampler should take care to minimize the amount of time the bottle is opento reduce the potential for atmospheric contamination). Once the required volume iscollected the process is reversed to return the bottle to the inner and outer bags.
Bottles may be received pre-preserved from the laboratory using the preservativesappropriate for each analysis, as presented in Worksheet #19 of the QAPP. If bottles arenot pre-preserved, preservative will be added to the sample bottles once filled with sitewater, and the bottle will be inverted to ensure mixing. The preservatives for each metal areas follows:
Methylmercury: sulfuric acid
Hexavalent chromium: laboratory-provided buffer solution
Mercury: bromine chloride
Standard Operating ProcedureLower Passaic River Restoration ProjectSurface Water Sampling for Trace Metals
SOP No.: LPR-FI-06Revision: 3
Date: August 2011Page 5 of 9
J:\Water\ProjectFiles\P120\12182_Passaic\Tasks\CWCM\AECOM QAPP\2011803_Rev2\clean\LPR-FI-06_Surface Water Sampling forTrace Metals_rev3.docx
Other TAL metals and titanium: nitric acid
If the program requires the collection of field-filtered dissolved metals, water for theseparameters will be collected concurrent with the total metals. Tubing coming off the pumpwill be fitted with a laboratory-decontaminated Y-connector, of inert material. Lengths ofTeflon-lined poly tubing will be attached to each end of the Y-connector, one length oftubing will be fitted with a Voss capsule (Catalog number: GWC-45-EA-R), or equivalent,laboratory-cleaned 0.45 micron filter by the CH sampler. Clamps will be used on the tubingto cut off flow to either end such that water may flow for total metals or through the filter fordissolved metals. The clamp for the dissolved metals tubing will be located upflow of thefilter to prevent pressure on the filter while the total metals sample bottles are being filled.The preserved bottles for total mercury and dissolved mercury will be filled, alternatingapproximately 25% of volume, until full. The DH sampler will operate the pump and clamps.This will continue for other parameters that require the collection of total and dissolvedsamples, such as methylmercury and TAL metals. Should the inline filter clog, a new 0.45filter will be placed on the tubing, and that filter purged for 10 seconds prior to resumingsampling.
High sample turbidity may cause clogging of the filter membrane and a decrease in filterefficiency/rate. If the rate of flow is observed to decrease substantially, then it isrecommended that the filter be replaced by the CH sampler by first removing the tubingoutlet from the sample container. The DH sampler should then turn off the pump, reversethe pump direction, turn the pump back on to release pressure in the filter, turn the pumpoff again, and finally remove the used filer. A new filter can then be installed and purged asdescribed above.
All samples will be collected into bottles that were received pre- preserved (QAPPWorksheet #19) or will be preserved upon receipt at the laboratory.
5.5.3 Sample collection information will be recorded at the time of collection using either IDEFs,standardized forms, the field logbook, or a combination. This information will include, butnot be limited to, the station ID, sample ID, time and date of sample collection, samplecollection depth, the sampler’s name, vessel, description of any sample processing, andany pertinent observations. An example of the IDEF is provided as Attachment 1. Refer toQAPP Worksheet #27 for sample identification details.
5.5.4 Samples will be placed in coolers and stored on ice (refer to QAPP Worksheet #19 forcontainerization and storage specifications) until shipment to the laboratory.
5.5.5 Sample custody, packaging and shipment will be conducted according to the proceduresdescribed in SOPs LPR-G-05 – Sample Custody, and LPR-G-06 – Packaging andShipping.
6.0 Quality assurance / quality control
6.1 Entries on the forms and in the field logbook will be checked by the samplers to verify that theinformation is correct.
Standard Operating ProcedureLower Passaic River Restoration ProjectSurface Water Sampling for Trace Metals
SOP No.: LPR-FI-06Revision: 3
Date: August 2011Page 6 of 9
J:\Water\ProjectFiles\P120\12182_Passaic\Tasks\CWCM\AECOM QAPP\2011803_Rev2\clean\LPR-FI-06_Surface Water Sampling forTrace Metals_rev3.docx
6.2 It is the responsibility of the Field Task Manager (FTM) or designee to spot check adherence to theprocedural requirements of this SOP, and to review the associated documentation for accuracy andcompleteness.
6.3 Data quality evaluations will be based on quality control (QC) sample results. QC samples mayinclude field duplicates, matrix spike/matrix spike duplicate (MS/MSD) samples, and equipmentrinsate blanks; frequency of collection requirements is tabulated in QAPP Worksheet #28.Additional volume for field duplicates and MS/MSD samples will be collected according to themethods outlined in this SOP; however, bottles will be filled concurrently (rather than sequentially) ifpossible to minimize variability between sample containers.
7.0 Data and records management
7.1 Field records will be generated and maintained as outlined in SOP LPR-G-01 – Field Records andin the LPR Data Management Plan (DMP) [AECOM 2010]. These documents cover all aspects ofcollection including chronology of events, station locations, time/date, sampler name, and datacollected.
7.2 Field data will be maintained and distributed to the appropriate personnel as described in the LPRDMP (AECOM 2010).
7.3 Deviations to the procedures detailed in the SOP must be recorded in the field logbook at the timeof occurrence and summarized on the Daily Activity Log (refer to SOP LRP-G-01 – Field Records).A formal nonconformance report (NCR) will be completed (refer to SOP LRP-G-01 – Field Records)and distributed as specified in the QAPP.
7.4 All records associated with the activities described in this SOP will be ultimately maintained inaccordance with the Lower Passaic River Quality Management Plan (AECOM 2009).
8.0 Personnel qualifications and training
The individuals executing these procedures must have read, and be familiar with, the requirementsof this SOP and the corresponding LPRRP plans (e.g., HASP, QAPP, DMP, and FSP).Inexperienced personnel performing these activities will be initially be supervised by the FTM ordesignee.
9.0 Ref erences
AECOM 2009. Quality Management Plan, Lower Passaic River Restoration Project, CERCLADocket No. 02-207-2009. September 2009 or current version.
AECOM 2010. Lower Passaic River Data Management Plan. July 2010 or current version.
Standard Operating ProcedureLower Passaic River Restoration ProjectSurface Water Sampling for Trace Metals
SOP No.: LPR-FI-06Revision: 3
Date: August 2011Page 7 of 9
J:\Water\ProjectFiles\P120\12182_Passaic\Tasks\CWCM\AECOM QAPP\2011803_Rev2\clean\LPR-FI-06_Surface Water Sampling forTrace Metals_rev3.docx
AECOM 2011. Lower Passaic River Restoration Project, Remedial Investigation, Health and SafetyPlan Addendum. June 2011 or current version.MPI 2005b. Lower Passaic River RestorationProject Health and Safety Plan Final Addendum – Sediment Coring. July 2005.
USEPA 1996. Method 1669 Sampling Ambient Water for Trace Metals at EPA Water QualityCriteria Levels. July 1996.
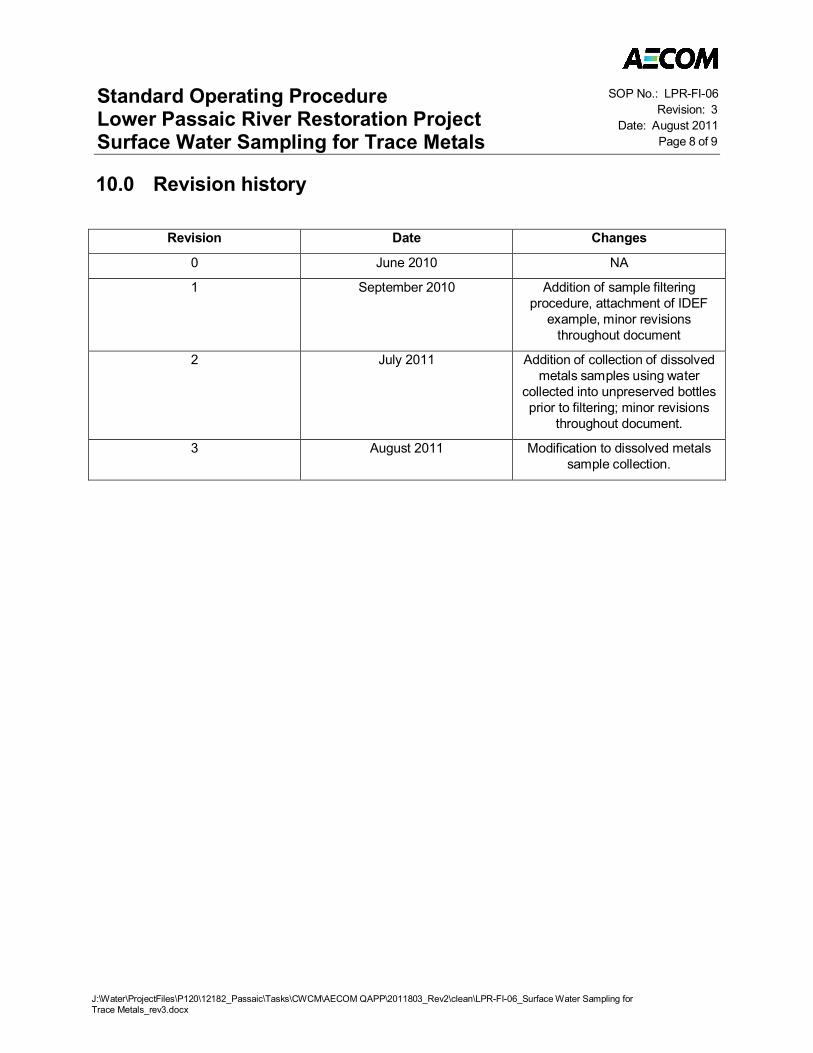
Standard Operating ProcedureLower Passaic River Restoration ProjectSurface Water Sampling for Trace Metals
SOP No.: LPR-FI-06Revision: 3
Date: August 2011Page 8 of 9
J:\Water\ProjectFiles\P120\12182_Passaic\Tasks\CWCM\AECOM QAPP\2011803_Rev2\clean\LPR-FI-06_Surface Water Sampling forTrace Metals_rev3.docx
10.0 Revision history
Revision Date Changes
0 June 2010 NA
1 September 2010 Addition of sample filteringprocedure, attachment of IDEF
example, minor revisionsthroughout document
2 July 2011 Addition of collection of dissolvedmetals samples using water
collected into unpreserved bottlesprior to filtering; minor revisions
throughout document.
3 August 2011 Modification to dissolved metalssample collection.
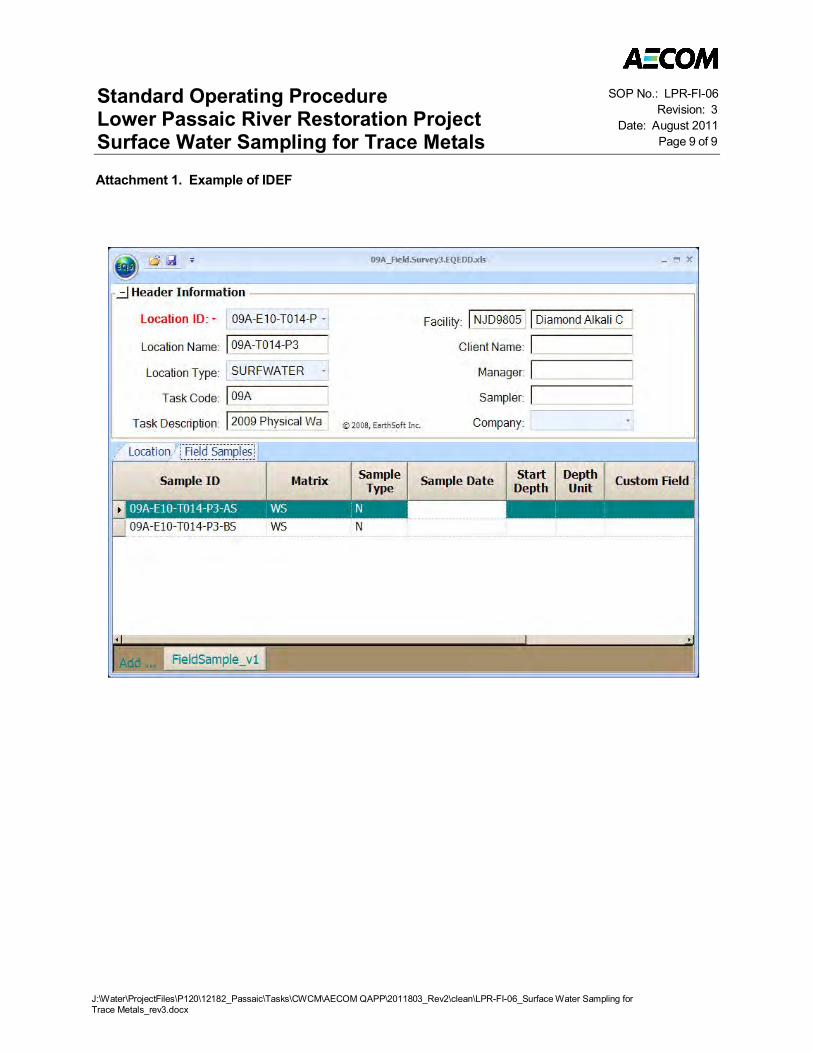
Standard Operating ProcedureLower Passaic River Restoration ProjectSurface Water Sampling for Trace Metals
SOP No.: LPR-FI-06Revision: 3
Date: August 2011Page 9 of 9
J:\Water\ProjectFiles\P120\12182_Passaic\Tasks\CWCM\AECOM QAPP\2011803_Rev2\clean\LPR-FI-06_Surface Water Sampling forTrace Metals_rev3.docx
Attachment 1. Example of IDEF

Standard Operating Procedure Lower Passaic River Restoration Project
J:\Water\ProjectFiles\P120\12182_Passaic\Tasks\CWCM\AECOM QAPP\20110712_Rev1_toEPA\Word_clean\20110708_CWCM-sv_QAPP_Appendix-B_rev1\LPR-G-01_Field_Records_Rev7.docx
Field Records
Procedure Number: LPR-G-01
Revision No.: 7
Revision Date: July 2011
Prepared by
Kristen Durocher Dion Lewis
Date: July 7, 2011 Laura Kelmar, AECOM Project Manager Date: July 7, 2011 Debra L. Simmons, Project QA Manager
Annual review of this SOP has been performed and the SOP still reflects current practice.
Initials: Date: Initials: Date:

Standard Operating Procedure Lower Passaic River Restoration Project Field Records
SOP No.: LPR-G-01 Revision: 7
Date: July 2011 Page i of i
J:\Water\ProjectFiles\P120\12182_Passaic\Tasks\CWCM\AECOM QAPP\20110712_Rev1_toEPA\Word_clean\20110708_CWCM-sv_QAPP_Appendix-B_rev1\LPR-G-01_Field_Records_Rev7.docx
Contents
1.0 SCOPE AND APPLICABILITY .......................................................................................................... 1
2.0 HEALTH AND SAFETY CONSIDERATIONS ................................................................................... 1
3.0 INTERFERENCES .............................................................................................................................. 1
4.0 EQUIPMENT AND MATERIALS ....................................................................................................... 2
5.0 PROCEDURES ................................................................................................................................... 2
6.0 QUALITY ASSURANCE / QUALITY CONTROL .............................................................................. 5
7.0 DATA AND RECORDS MANAGEMENT .......................................................................................... 5
8.0 PERSONNEL QUALIFICATIONS AND TRAINING ......................................................................... 6
9.0 REFERENCES .................................................................................................................................... 6
10.0 REVISION HISTORY .......................................................................................................................... 7
Attachment 1 Example of Daily Activity Log
Attachment 2 Example of Field Modification Form
Attachment 3 Example of Nonconformance Form
Standard Operating Procedure Lower Passaic River Restoration Project Field Records
SOP No.: LPR-G-01 Revision: 7
Date: July 2011 Page 1 of 11
J:\Water\ProjectFiles\P120\12182_Passaic\Tasks\CWCM\AECOM QAPP\20110712_Rev1_toEPA\Word_clean\20110708_CWCM-sv_QAPP_Appendix-B_rev1\LPR-G-01_Field_Records_Rev7.docx
1.0 Scope and Applicability
1.1 The purpose of this document is to define the standard operating procedure (SOP) for documentation of field activities conducted in the Lower Passaic River Study Area and the Newark Bay Study Area as part of the Lower Passaic River Restoration Project (LPRRP), including sample collection events, field measurements, and site visits. Appropriate documentation of field activities provides an accurate and comprehensive record of the work performed, sufficient for a technical peer to reconstruct the day's activities and determine that necessary requirements were met. Field records also provide evidence and support technical interpretations and judgments. The procedures and systems defined in this SOP help ensure that the records are identifiable (reference the project task/activity), legible, retrievable, and protected from loss or damage.
1.2 LPRRP field data may be recorded electronically or in field logbooks, standardized forms, annotated maps, or photos. This SOP provides general guidance on field recordkeeping; additional details for specific procedures (for example, chain of custody, sample collection) are provided in the SOPs for the individual task.
1.3 It is fully expected that the procedures outlined in this SOP will be followed. Procedural modifications may be warranted depending upon field conditions or limitations imposed by the procedure. Substantive modification to this SOP will be approved in advance by the Project Quality Assurance (QA) Manager and the Task Manager and communicated to the Cooperating Parties Group (CPG) Project Coordinator and the United States Environmental Protection Agency (USEPA) Remedial Project Manager. Deviations from this SOP will be documented in the field records. The ultimate procedure employed will be documented in the report summarizing the results of the sampling event or field activity.
2.0 Health and Safety Considerations
2.1 Although record keeping itself does not generally pose significant health and safety risks, the tasks being implemented in the vicinity of individuals keeping records may require attention to safety practices. Project related physical, chemical and biological hazards are addressed in the site specific Health and Safety Plan (HASP) and associated addendums (MPI, 2005a; MPI 2005b; AECOM 2011).
2.2 Daily safety briefs will be conducted at the start of each working day before any work commences. These daily briefs will be facilitated by the Site Safety Officer (SSO) or his/her designee to discuss the day’s events and any potential health risk areas covering every aspect of the work to be completed. Weather conditions are often part of these discussions. As detailed in the HASP, everyone on the field team has the authority to stop work if an unsafe condition is perceived until the conditions are fully remedied to the satisfaction of the SSO.
3.0 Interferences
Not Applicable
Standard Operating Procedure Lower Passaic River Restoration Project Field Records
SOP No.: LPR-G-01 Revision: 7
Date: July 2011 Page 2 of 11
J:\Water\ProjectFiles\P120\12182_Passaic\Tasks\CWCM\AECOM QAPP\20110712_Rev1_toEPA\Word_clean\20110708_CWCM-sv_QAPP_Appendix-B_rev1\LPR-G-01_Field_Records_Rev7.docx
4.0 Equipment and Materials
The following equipment list contains materials that may be needed in carrying out the procedures contained in this SOP. Not all equipment listed below may be necessary for a specific activity. Additional equipment may be required, pending field conditions.
Bound field logbook
Standardized field data sheets (refer to Section 5.3)
Black ballpoint pen, Rite-in-Rain® pen, or black Sharpie® (or equivalent)
Site maps
Clipboard
Three-ring binder or equivalent
Camera (optional)
Time piece
Hand-held electronic recording device (optional) with EQuIS Data Gathering Engine (EDGE)™ software from Earthsoft, Intelligent Data Entry Form® (IDEF) software or equivalent
5.0 Procedures
5.1 General Requirements
5.1.1 The field records will contain sufficient detail so that the collection effort can be reconstructed without reliance on the collector’s memory.
5.1.2 Pertinent field information will be recorded legibly in a logbook and/or an appropriate standardized form (as described herein), or directly onto a portable electronic device, such as a laptop computer or Yuma. It is recommended that entries made by hand be made in black ballpoint pen.
5.1.3 Entries will be signed and dated. No erasures or obliterations will be made. A single line will be drawn through incorrect entries and the corrected entry written next to the original strikeout. Strikeouts are to be initialed and dated by the originator.
5.1.4 If a ballpoint pen cannot be used because of adverse weather conditions (rain or freezing temperatures), a fine-point Sharpie® or Rite-in-Rain® pens are acceptable substitutes. If conditions are such that only pencil can be used, an explanation will be included in the logbook and the affected data will be photocopied, signed as verified copy, and maintained in the project files as documentation that the information has not been changed.
5.1.5 Entries will be factual and observational (i.e., no speculation or opinion), and will not contain any personal information or non-project-related entries. Abbreviations and acronyms will be defined.
Standard Operating Procedure Lower Passaic River Restoration Project Field Records
SOP No.: LPR-G-01 Revision: 7
Date: July 2011 Page 3 of 11
J:\Water\ProjectFiles\P120\12182_Passaic\Tasks\CWCM\AECOM QAPP\20110712_Rev1_toEPA\Word_clean\20110708_CWCM-sv_QAPP_Appendix-B_rev1\LPR-G-01_Field_Records_Rev7.docx
5.1.6 Field information will be recorded without delay – information recorded significantly after the fact will be dated as such.
5.1.7 Field activities and other events pertinent to the field activities will be documented in chronological order. Times will be recorded using Eastern Standard Time (EST) or Eastern Daylight Savings Time (EDT) notation for each entry.
5.2 Field logbooks
5.2.1 Field logbooks will be bound waterproof field books. LPRRP logbooks will be dedicated to the project and will not be used for any other project or purpose. Separate and dedicated logbooks will be kept for different operations running concurrently (e.g., sample collection on board the vessel, core processing at the CPG field facility, surface water collection on-board a vessel, surface water collection from the shore); individual tasks making up each operation will be maintained in the same logbook, if possible.
5.2.2 The cover and binding of each logbook will be labeled to identify the operation and dates included with the logbook; each page in the logbook will be consecutively numbered. Pages will not be removed or torn out of the logbook.
5.2.3 The title page of each logbook will contain the following:
AECOM contact, AECOM office location, and phone number;
The logbook number (assigned at the time the logbook is signed out)
Project name (LPRRP/Task) and AECOM project number; and
Start and end dates of work covered by the logbook.
5.2.4 To assist in the return of a field logbook in the event it is lost, the following will also be included on the title page: “$25 Reward if found and returned to AECOM, 250 Apollo Drive, Chelmsford, Massachusetts 01824”.
5.2.5 At the front of each logbook will be a page cross-referencing each author’s printed name, signature, and initials.
5.2.6 A page header will appear on the first page of each day’s notes in the logbook, and activities for each day will be recorded on a new page. The page header will include:
name of author and other personnel on site (and affiliated organization if applicable);
date;
time of arrival (military time);
proposed activity (task); and
current weather and tidal conditions, and weather forecast for the day.
5.2.7 An abbreviated header, containing at least the date, will appear at the top of each additional page for the active date. Field forms require similar header information.
5.2.8 The field logbook will provide a chronology of events. At a minimum, documentation in a logbook will include the following (unless documented on a standard form):
Standard Operating Procedure Lower Passaic River Restoration Project Field Records
SOP No.: LPR-G-01 Revision: 7
Date: July 2011 Page 4 of 11
J:\Water\ProjectFiles\P120\12182_Passaic\Tasks\CWCM\AECOM QAPP\20110712_Rev1_toEPA\Word_clean\20110708_CWCM-sv_QAPP_Appendix-B_rev1\LPR-G-01_Field_Records_Rev7.docx
names of visitor(s), including time of arrival and departure, the visitor’s affiliation, and reason for visit;
summary of project-related communications, including names of people involved and time;
time daily work commences and ceases;
start and stop times of new tasks;
start and stop times of significant stand-by time (work interruptions);
safety or other monitoring data, including units with each measurement;
deviations from approved scope of work, including the necessary approvals;
progress updates;
problems/delays encountered;
unusual events; and
signature or initials of author on every page.
Additional detail on the contents of the field logbook is provided in Table 1.
5.2.9 The logbook will cross-reference the field forms if necessary; however, whenever possible, details recorded on the standardized forms will not be replicated in the logbook.
5.2.10 If there are additional lines on the page at the end of the day’s activities, a line will be drawn through the empty space, and initialed and dated, leaving no room for additional entries.
5.3 Standardized forms
5.3.1 Standard forms for field data are provided with each SOP. The Daily Activity Log is attached to this SOP (Attachment 1). This form will be completed each day of active work and transmitted to the Task Manager or his/her designee. Refer to the appropriate SOP (e.g., core processing) for the forms specific to that task.
5.3.2 The information collected on any field form may alternately be collected electronically by PC/handheld as appropriate.
5.3.3 The following rules apply to the standardized forms:
Each form will be signed and dated by the person completing the form.
There will be no blank spaces on the form – unused spaces will have “not applicable” or “not available” explanations.
5.4 Maps and drawings
5.4.1 Pre-existing maps and drawings that include notations made in the field (for example, relocating of sample locations) will be referenced in the logbook and, like all field records, include the project/task name and number, site identification, and be signed/dated by the person that prepared them.
5.4.2 Maps and drawings will include compass orientation and scale. Sketches will include points of reference and distances to the reference points.
Standard Operating Procedure Lower Passaic River Restoration Project Field Records
SOP No.: LPR-G-01 Revision: 7
Date: July 2011 Page 5 of 11
J:\Water\ProjectFiles\P120\12182_Passaic\Tasks\CWCM\AECOM QAPP\20110712_Rev1_toEPA\Word_clean\20110708_CWCM-sv_QAPP_Appendix-B_rev1\LPR-G-01_Field_Records_Rev7.docx
5.5 Photographs and other photo documentation
Photographs or videos may be taken by the field team to help document site conditions, sample locations, or sample characteristics. Photographs and videos will be identified in the logbook or on the standard form by a unique numbering system. If photographs are collected by a digital camera, the file number as well as the photograph number will accompany the description of the photograph in the logbook. At a minimum, the date/time the photograph was taken, the general location, a brief description, and the photographer’s name will be recorded. Additional information may include Differential Global Positioning System (DGPS) coordinates, direction the photographer was facing, and/or weather conditions. If necessary, an object will be included to indicate the scale of the object in the photograph.
5.6 Electronic files
5.6.1 Electronically recording devices may include data logging systems, PDAs, laptops, or tablet PCs.
5.6.2 Sufficient backup systems will be in place to protect against electronic data loss. Information will be saved to a disk or backed up immediately upon completion. The backup disk or other media (CD, flash drive) will then be stored in a secure location separate from the laptop, tablet, or PDA.
5.6.3 Files will be uniquely identified and will be stored in the project files on the network in accordance with the Lower Passaic River Project Quality Management Plan (AECOM 2009). Files will be labeled per Worksheet #27 of the QAPP. An unedited version of the file will be maintained and all subsequent manipulations tracked.
6.0 Quality Assurance/Quality Control
6.1 Entries in the field forms will be double-checked by the field team members to verify the information is correct.
6.2 Completed field forms will be reviewed by the Field Task Manager and/or his/her designee to verify that the requirements are being met. At a minimum, this should occur at the end of each day. When the review is complete, the reviewer will append his/her initials and date to the pages reviewed for documentation purposes.
6.3 If information recorded in the field is transcribed to another format, the original record will be retained for comparison purposes.
7.0 Data and Records Management
7.1 Deviations to the procedures detailed in the SOP or approved plans will be noted in the field logbook or other appropriate field form at the time of occurrence and summarized on the Daily Activity Log (Attachment 1). A formal nonconformance report (NCR) will be completed (Attachment 2) and distributed as specified in the QAPP.
Standard Operating Procedure Lower Passaic River Restoration Project Field Records
SOP No.: LPR-G-01 Revision: 7
Date: July 2011 Page 6 of 11
J:\Water\ProjectFiles\P120\12182_Passaic\Tasks\CWCM\AECOM QAPP\20110712_Rev1_toEPA\Word_clean\20110708_CWCM-sv_QAPP_Appendix-B_rev1\LPR-G-01_Field_Records_Rev7.docx
7.2 Proposed modifications to the SOPs or approved plans will be documented on a Field Modification form and submitted to USEPA. An example Field Modification form is presented as Attachment 3.
7.3 Logbooks, field forms, chain of custody forms, and all other records associated with the activities described in this SOP will be ultimately maintained in accordance with the Lower Passaic River Project Quality Management Plan (AECOM 2009).
7.4 Logbooks that are taken offsite from the field facility will be photocopied or scanned and filed at the end of each day to mitigate against the loss of historical entries should the logbook be lost in the field.
7.5 Field data forms and chain of custody will be filed in the field facility once they have been completed and distributed (if necessary), or at the end of each field day. These documents will be maintained in labeled three-ring binders or contained in some other organized manner that prevents loss.
7.6 Distribution of daily forms will be performed according to the needs of the project team and at the direction of the Field Task Manager or designee. Refer to the Lower Passaic River Data Management Plan (AECOM, 2010) for the frequency and distribution of field data and chain-of-custody transmittal information.
8.0 Personnel Qualifications and Training
8.1 Individuals executing these procedures will have read and be familiar with the requirements of this SOP and the corresponding LPRRP plans (e.g., HASP, QAPP, DMP, FSP). No specialized training is required. Nonetheless, these activities should be reviewed by the Field Task Manager, as described below.
8.2 The Field Task Manager is responsible for reviewing and approving the field records for accuracy, completeness, and conformance to the procedures in this SOP. The Field Task Manager is also responsible for ensuring that the field records are distributed to the appropriate personnel during field activities, ensuring that records are maintained properly on site, and for archiving the records upon completion of field activities.
9.0 References
AECOM 2009. Quality Management Plan, Lower Passaic River Restoration Project, CERCLA Docket No. 02-2007-2009. September 2009 or current version.
AECOM 2010. Lower Passaic River Data Management Plan. July 2010 or current version.
AECOM 2011. Lower Passaic River Restoration Project, Remedial Investigation, Health and Safety Plan Addendum. June 2011 or current version.
MPI 2005a. Lower Passaic River Restoration Project Health and Safety Plan. January 2005.
MPI 2005b. Lower Passaic River Restoration Project Health and Safety Plan Final Addendum – Sediment Coring. July 2005.
Tierra 2007. Standard Operating Procedure No. 8 (Revision 2), Field Documentation. Newark Bay Study Area Phase II RIWP, Appendix F, October, 2007.
Standard Operating Procedure Lower Passaic River Restoration Project Field Records
SOP No.: LPR-G-01 Revision: 7
Date: July 2011 Page 7 of 11
J:\Water\ProjectFiles\P120\12182_Passaic\Tasks\CWCM\AECOM QAPP\20110712_Rev1_toEPA\Word_clean\20110708_CWCM-sv_QAPP_Appendix-B_rev1\LPR-G-01_Field_Records_Rev7.docx
10.0 Revision History
Revision Date Changes
0 May 2008 NA
1 July 2008 Added cross-reference as Section 5.2.5; updated Table 1; added unique file ID scheme to Section 5.6.3
2 September 2009 Included Field Modification and Nonconformance forms; “ENSR” to “AECOM”; minor editorial changes
3 February 2010 Modify to include IDEF option; Table 1 footnote update; addition of Attachment 2-3 names on Contents page
4 June 2010 Updated text to reflect general sampling procedures where sediment specific wording was used.
5 September 2010 Minor revisions throughout document
6 June 2011 Minor revisions throughout document
7 July 2011 Minor revisions throughout document
Standard Operating Procedure Lower Passaic River Restoration Project Field Records
SOP No.: LPR-G-01 Revision: 7
Date: July 2011 Page 8 of 11
J:\Water\ProjectFiles\P120\12182_Passaic\Tasks\CWCM\AECOM QAPP\20110712_Rev1_toEPA\Word_clean\20110708_CWCM-sv_QAPP_Appendix-B_rev1\LPR-G-01_Field_Records_Rev7.docx
Table 1 LPR Summary of Field Information
General Information Applicable Record1 Project/task name/general location All Personnel on site (AECOM, clients, site contacts, regulators, oversight personnel, subcontractors, general public)
A, B, K
Results of phone calls, conversations (See QAPP Worksheet #3 for project contact information) B Chronology of activities, including mobilization, investigatory activities, and demobilization B Weather conditions (initial and any changes; temperature, barometric pressure, wind conditions, precipitation)
B, D
Tidal and atmospheric information (if applicable) B, G Subcontractors, description of services to be provided, and any issues (equipment problems, corrective action, stand by time)
A, B
Health and safety (H&S) tailgate meetings, H&S monitoring Refer to HASP Description of major equipment (survey vessels, sampling platforms, sampling devices) and any problems or conditions that might impact performance or data quality
A, B, J
Equipment decontamination B, D, E Any pertinent field observations such as difficulties in sampling or conducting measurements or unusual circumstances that could affect data quality (instrument problems, contamination sources)
B, D, J
Deviations from approved plan (schedule, relocation/elimination of locations, change orders), including rationale and approval
A, B, J
Sample collection and transfer summary, custody information from collection through analysis, to final disposal
C, D, E, H
Investigation-derived waste (IDW) types, volumes, storage, and disposal F Field measurements Description of Instruments (make, model, serial number) and inspection B, G Instrument calibration (date, time, personnel, standard, standards used/expiration date, and results)
B, G
Measurement date, time, location/station, results (units, any correction factors applied, calculations (if applicable)
D, E, G, L
Identity of person performing the measurements D, E, G, L Sampling information Equipment description and inspection B, D Sample selection criteria/rationale (if different from plan) A, B, D, J Sample location (GPS coordinates, depth, compass/distance from fixed points) D Sample description (recovery, moisture, color, odor, texture, general sediment profile/stratigraphy, PID screening results, artifacts)
D, I
Sample manipulations (homogenization, compositing, filtering, preservation) D, E Sample ID, segment/interval, date, time, and sampler identity D, E, H Sample parameters, containers (size/type), preservation Field and QC sample ID, storage container and conditions for each (sub)sample/parameter set D, C, E 1 Locations for this information may include but are not limited to: A: Daily Activity Log; B: Field Notebook; C: COC Form; D: Sample Collection Form; E: Sample Processing Form; F: IDW Logs; G: Water Quality Data Log; H: Sample Transfer and Custody Form; I: Core Logging Form; J: Nonconformance Form; K: Site Log-in Record; L: In-Situ Data Log
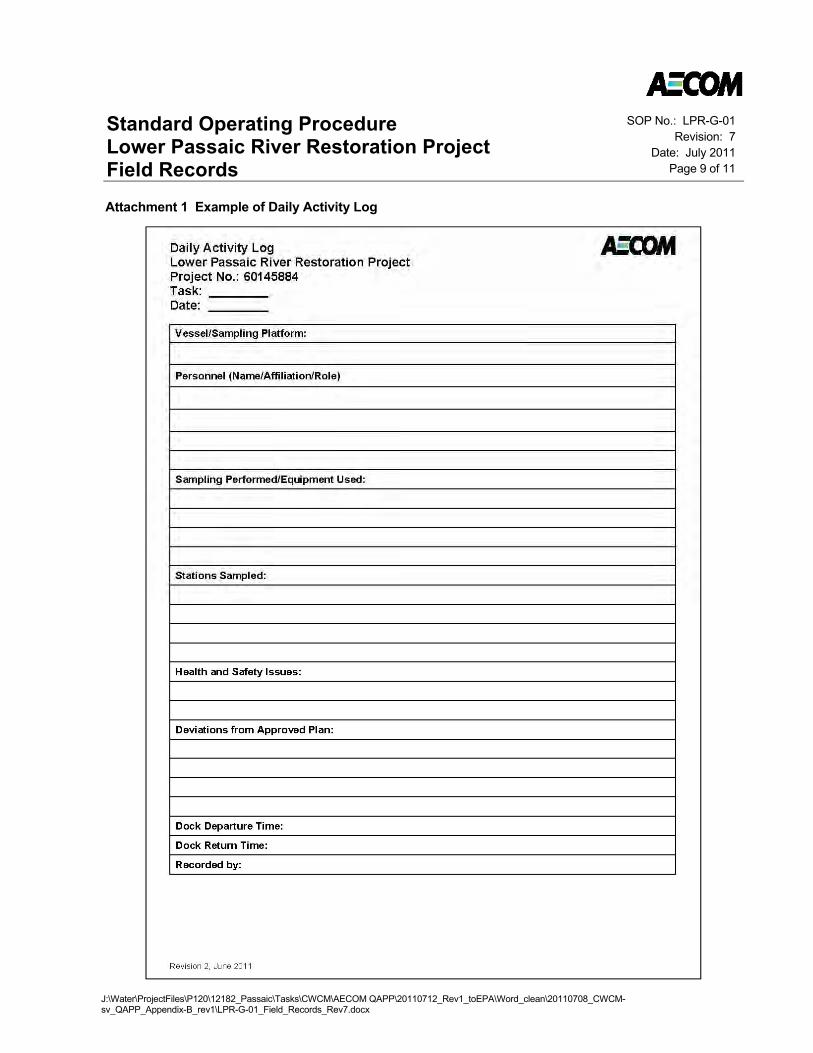
Standard Operating Procedure Lower Passaic River Restoration Project Field Records
SOP No.: LPR-G-01 Revision: 7
Date: July 2011 Page 9 of 11
J:\Water\ProjectFiles\P120\12182_Passaic\Tasks\CWCM\AECOM QAPP\20110712_Rev1_toEPA\Word_clean\20110708_CWCM-sv_QAPP_Appendix-B_rev1\LPR-G-01_Field_Records_Rev7.docx
Attachment 1 Example of Daily Activity Log
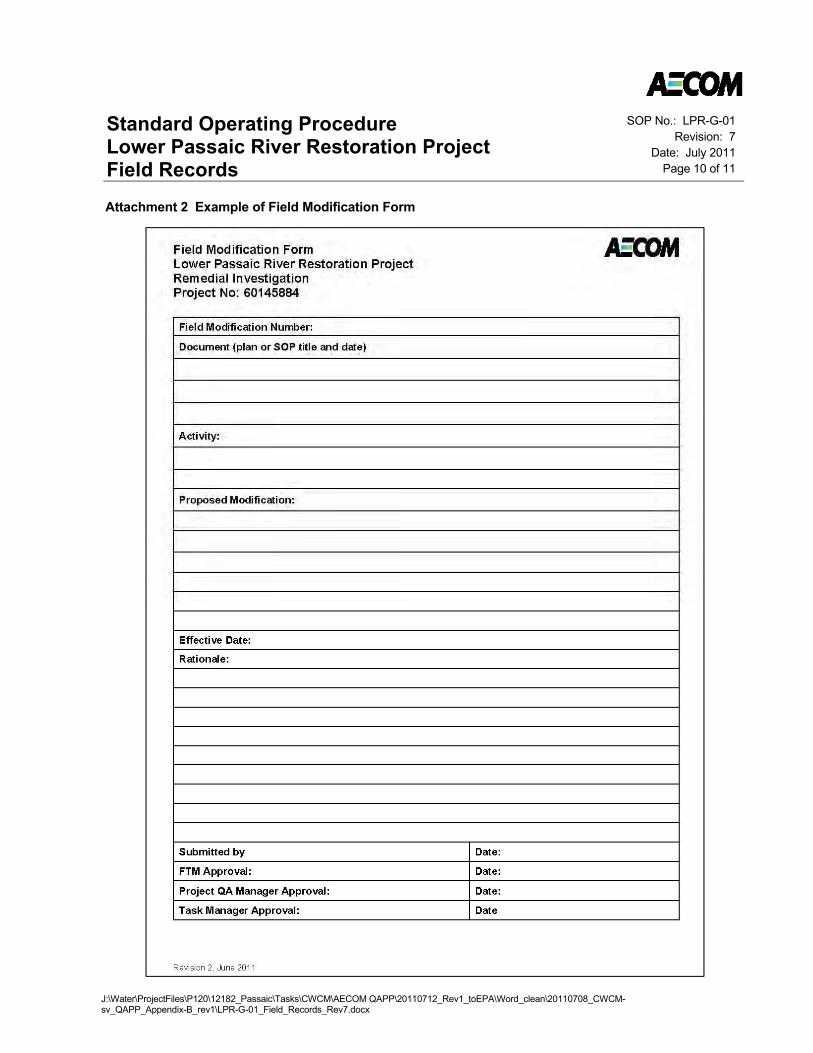
Standard Operating Procedure Lower Passaic River Restoration Project Field Records
SOP No.: LPR-G-01 Revision: 7
Date: July 2011 Page 10 of 11
J:\Water\ProjectFiles\P120\12182_Passaic\Tasks\CWCM\AECOM QAPP\20110712_Rev1_toEPA\Word_clean\20110708_CWCM-sv_QAPP_Appendix-B_rev1\LPR-G-01_Field_Records_Rev7.docx
Attachment 2 Example of Field Modification Form
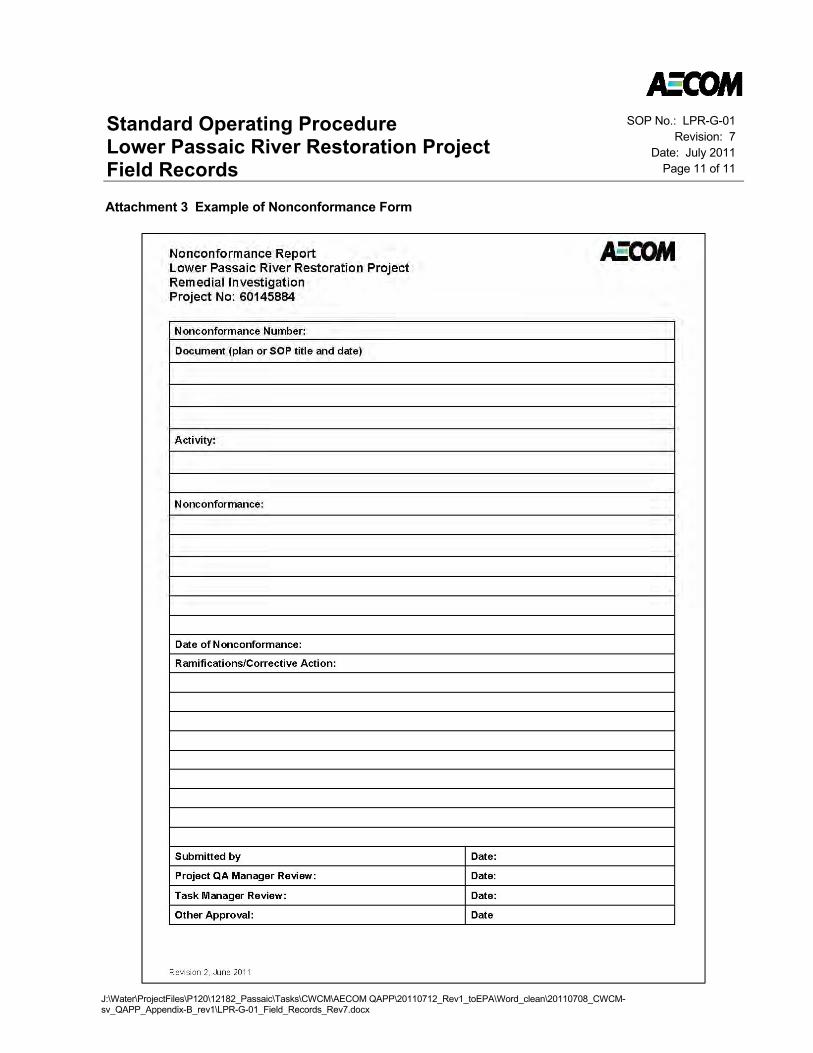
Standard Operating Procedure Lower Passaic River Restoration Project Field Records
SOP No.: LPR-G-01 Revision: 7
Date: July 2011 Page 11 of 11
J:\Water\ProjectFiles\P120\12182_Passaic\Tasks\CWCM\AECOM QAPP\20110712_Rev1_toEPA\Word_clean\20110708_CWCM-sv_QAPP_Appendix-B_rev1\LPR-G-01_Field_Records_Rev7.docx
Attachment 3 Example of Nonconformance Form
Standard Operating ProcedureLower Passaic River Restoration Project
J:\Water\ProjectFiles\P120\12182_Passaic\Tasks\CWCM\AECOMQAPP\20110712_Rev1_toEPA\Word_clean\20110708_CWCM-sv_QAPP_Appendix-B_rev1\LPR-G-02_Navigation_Positioning_Rev5.docx
Navigation/Positioning
Procedure Number: LPR-G-02
Revision No.: 5
Revision Date: July 2011
Prepared by
Kristen Durocher
Annual review of this SOP has been performedand the SOP still reflects current practice.
Initials: D ate:Initials: D ate:
Laura Kelmar, Project Manager Date: July 7, 2011
Debra L. Simmons, Project QA Manager Date: July 7, 2011
Standard Operating Procedure Lower Passaic River Restoration Project Navigation/Positioning
SOP No.: LPR-G-02 Revision: 5
Date: July 2011 Page i of i
J:\Water\ProjectFiles\P120\12182_Passaic\Tasks\CWCM\AECOM QAPP\20110712_Rev1_toEPA\Word_clean\20110708_CWCM-sv_QAPP_Appendix-B_rev1\LPR-G-02_Navigation_Positioning_Rev5.docx
Contents
1.0 SCOPE AND APPLICABILITY ............................................................................................................... 1
2.0 HEALTH AND SAFETY CONSIDERATIONS ....................................................................................... 1
3.0 INTERFERENCES ................................................................................................................................... 1
4.0 EQUIPMENT AND MATERIALS ............................................................................................................ 2
5.0 PROCEDURES ........................................................................................................................................ 2
6.0 QUALITY ASSURANCE / QUALITY CONTROL .................................................................................. 5
7.0 DATA AND RECORDS MANAGEMENT ............................................................................................... 6
8.0 PERSONNEL QUALIFICATIONS AND TRAINING .............................................................................. 6
9.0 REFERENCES......................................................................................................................................... 7
10.0 REVISION HISTORY ............................................................................................................................... 7
Standard Operating Procedure Lower Passaic River Restoration Project Navigation/Positioning
SOP No.: LPR-G-02 Revision: 5
Date: July 2011 Page 1 of 7
J:\Water\ProjectFiles\P120\12182_Passaic\Tasks\CWCM\AECOM QAPP\20110712_Rev1_toEPA\Word_clean\20110708_CWCM-sv_QAPP_Appendix-B_rev1\LPR-G-02_Navigation_Positioning_Rev5.docx
1.0 Scope and Applicability
1.1 The purpose of this document is to define the standard operating procedure (SOP) for positioning vessels in the Lower Passaic River Study Area and the Newark Bay Study Area as part of the Lower Passaic River Restoration Project (LPRRP). Positioning will be conducted to locate the vessel(s) with sufficient accuracy and precision to meet project objectives during sampling or measurement activities.
1.2 This SOP describes the equipment, field procedures, materials, and documentation procedures necessary to position vessels. Specific information regarding proposed sampling and/or measurement locations is provided in the LPRRP Quality Assurance Project Plan (QAPP).
1.3 It is fully expected that the procedures outlined in this SOP will be followed by the field team. Procedural modifications may be warranted depending upon field conditions, equipment limitations, or limitations imposed by the procedure. Substantive modification to this SOP will be approved in advance by the Project Quality Assurance (QA) Manager and the Task Manager and communicated to the Cooperating Parties Group (CPG) Coordinator and the United States Environmental Protection Agency (USEPA) Remedial Project Manager. Deviations from the SOP will be documented in the field records. The ultimate procedure employed will be documented in the report summarizing the results of the sampling event or field activity.
2.0 Health and Safety Considerations
2.1 The health and safety (H&S) considerations for the work associated with this SOP, including physical, chemical, and biological hazards are addressed in the site specific Health and Safety Plan (HASP) and associated addendums (MPI, 2005a; MPI 2005b; AECOM 2011). The major health and safety considerations for the work associated with navigating/positioning the vessel are the marine safety aspects of the program
2.2 Daily safety briefs will be conducted at the start of each working day before any work commences. These daily briefs will be facilitated by the Site Safety Officer (SSO) or his/her designee to discuss the day’s events and any potential health risk areas covering every aspect of the work to be completed. Weather conditions are often part of these discussions. As detailed in the HASP, everyone on the field team has the authority to stop work if an unsafe condition is perceived until the conditions are fully remedied to the satisfaction of the SSO.
3.0 Interferences
Differential global positioning system (DGPS) signal interferences/blockage can occur from time to time by bridges or other structures. These interferences can prevent system function until satellite signals are re-established. If insufficient satellite coverage occurs for proper function, the user will be alerted by the HYPACK system. In these cases the vessel will be repositioned to obtain better satellite coverage.
Standard Operating Procedure Lower Passaic River Restoration Project Navigation/Positioning
SOP No.: LPR-G-02 Revision: 5
Date: July 2011 Page 2 of 7
J:\Water\ProjectFiles\P120\12182_Passaic\Tasks\CWCM\AECOM QAPP\20110712_Rev1_toEPA\Word_clean\20110708_CWCM-sv_QAPP_Appendix-B_rev1\LPR-G-02_Navigation_Positioning_Rev5.docx
4.0 Equipment and Materials
The following equipment list contains materials which may be needed in carrying out the procedures contained in this SOP. Not all equipment listed below may be necessary for a specific activity. Additional equipment may be required, pending field conditions.
personal protective equipment (PPE) and other safety equipment, as required by the HASP;
sampling vessel(s) adequately sized and equipped for the task and expected conditions on the Passaic River, including high frequency (VHF) radio, ground tackle, and required U.S. Coast Guard safety gear;
navigation charts and sampling/measurement locations figure;
electronic navigation charts with pre-loaded waypoints for all sampling and measurement locations - refer to the corresponding LPRRP QAPP;
DGPS Receivers (x2) with an accuracy of +1 foot;
DGPS External Antennas (x2);
field laptop computer with HYPACK survey software;
fixed water level measurement and recording gauges (approximately one per river mile);
equipment user manuals;
table of target sampling/measurement location coordinates;
assorted nautical equipment (e.g., anchors, lines, personal flotation devices);
logbook and ballpoint pen;
sample collection forms; and
RTK DGPS positioning system (optional).
5.0 Procedures
Sampling and measurement activities will be conducted from a vessel. In accordance with procedures outlined below, these vessels must be properly positioned and their position recorded before each activity can begin. The following describes the procedures that will be performed to accurately position sampling vessels at a designated sampling location, and the pertinent observations that will be recorded in the appropriate field notebook and/or data sheet.
Positioning will be achieved by using a DGPS integrated with HYPACK survey software in order to obtain the real time position of the vessel, in relation to planned sampling stations, displayed on an electronic nautical chart. Survey personnel will follow the appropriate sections of equipment user’s manuals to ensure proper equipment operation and system performance.
Standard Operating Procedure Lower Passaic River Restoration Project Navigation/Positioning
SOP No.: LPR-G-02 Revision: 5
Date: July 2011 Page 3 of 7
J:\Water\ProjectFiles\P120\12182_Passaic\Tasks\CWCM\AECOM QAPP\20110712_Rev1_toEPA\Word_clean\20110708_CWCM-sv_QAPP_Appendix-B_rev1\LPR-G-02_Navigation_Positioning_Rev5.docx
5.1 Positioning the vessel
This section gives the step-by-step procedures for vessel positioning. Observations made during vessel positioning will be recorded on the sample collection forms, other standardized forms, and/or logbook, as appropriate.
A DGPS will be used to establish locations during implementation of activities specified in the LPRRP QAPP. Two DGPS units will be required: one on board the vessel with a receiving antenna to be aligned with the deployment of the sampling apparatus, and the other at a known fixed location (monument or temporary benchmark) to provide corrections to the standard GPS signal.
While this SOP provides general guidance and procedural steps, personnel performing positioning activities also will follow the appropriate sections of equipment user’s manuals and have the manuals available for reference while operating the equipment.
The following procedures describe the steps to establish position at a location, as well as the steps to adjust the positioning for collection of additional samples.
5.1.1 Obtain the appropriate form(s). Initiate the Daily Activity Log provided in SOP LPR-G-01 (Field Records).
5.1.2 Obtain the target sampling/measurement locations. These locations will have been selected prior to commencement of field activities, as described in the QAPP. The location of each target sampling location will be established in the New Jersey State Plane Coordinate System with respect to the North American Datum of 1983 (NAD83).
5.1.3 Enter the coordinates for each sampling location as a waypoint into the HYPACK software package. Confirm accuracy of each entry against the coordinates established in the corresponding LPRRP QAPP.
5.1.4 Configure the HYPACK system for the survey, including setting the survey grid to the New Jersey State Plane Coordinate System with respect to the North American Datum of 1983 (NAD83 - feet), and setting the “target ring” or maximum allowable offset based on task specific requirements listed in the corresponding LPRRP QAPP.
5.1.5 If less than sub-meter accuracy is required, a DGPS base station will be established over a shore-based marker prior to sampling or measurement operations. The operation and horizontal/vertical accuracy of the vessel mounted DGPS will be verified at another shore-based marker by recording observed horizontal and vertical (XYZ) data and comparing these data to the published XYZ data for a given point. After initial DGPS system verification, a temporary benchmark may be established at a location convenient to the vessel to facilitate daily DGPS system performance verification. DGPS system performance verification will be conducted twice per day and documented in the logbook and vessel data logger. The horizontal and vertical accuracy will be compared to shore-based markers to verify performance. Elevations will be recorded in North American Vertical Datum of 1988 (NAVD88) with an accuracy of +/- one foot.
Standard Operating Procedure Lower Passaic River Restoration Project Navigation/Positioning
SOP No.: LPR-G-02 Revision: 5
Date: July 2011 Page 4 of 7
J:\Water\ProjectFiles\P120\12182_Passaic\Tasks\CWCM\AECOM QAPP\20110712_Rev1_toEPA\Word_clean\20110708_CWCM-sv_QAPP_Appendix-B_rev1\LPR-G-02_Navigation_Positioning_Rev5.docx
5.1.6 Install the DGPS antennae in a safe location which accurately represents the actual sample or measurement collection point; (e.g., immediately adjacent to a coring well, or mounted to the A-frame).
5.1.7 Identify and approach actual sampling/measurement locations by using data from the DGPS/HYPACK system in the navigation mode. The navigation mode provides information on heading, distance remaining, and time remaining. This information is based on the selected waypoint location and the present location of the vessel.
5.1.8 For sediment sampling, the vessel will be secured by lowering spud poles once in position within the station “target radius”. In water depths that preclude the use of spud poles, maneuver the vessel approximately 60 feet up-current (or up-wind in slack conditions) of the target, drop the anchor, and pay out anchor line until the vessel drifts within the “target radius”. A second anchor set may be required to increase lateral stability under certain conditions.
5.1.9 For water column sampling, the vessel will be positioned over each sampling/measurement location with no contact with the bottom. The operator will utilize the onboard navigation system to maintain positioning of the vessel within 10 feet of the sampling/measurement location. The water sampling apparatus will be secured to a CTD-OBS vertical profile unit or YSI datasonde which will be viewed on the vessel in real time. As the field crew conducts the vertical profile, the unit will be stopped at various depths to collect the water samples while making no contact with the riverbed.
5.1.10 Once the vessel is on location (and secured, for sediment sampling), note the coordinates from the DGPS unit and check the coordinates to verify that the vessel is within the pre-determined range of the target location as defined in QAPP. If not acceptable, adjust the vessel’s location, and recheck the position. Repeat this process until the vessel’s position is within acceptable range of the target. Record the final coordinates on the appropriate form. Record the actual sampling coordinates electronically (using HYPACK).
5.1.11 Once the coordinates are acceptable, perform the sampling or measurement activity at the location. Record final location coordinates on the appropriate form. For sediment sampling, final location coordinates will be recorded once the sampling device has penetrated the sediment to the target depth or refusal and prior to retrieval. Plot locations onto a master chart or use computer-based, real-time software to verify location.
5.1.12 To adjust the vessel’s position to repeat an attempt at sediment sampling, the vessel will be moved by allowing it to rotate around the spud pole or by adjusting an anchor line until the new position for the sampling device has been established. Record the new position.
5.1.13 At the end of the sampling day, check the data loaded onto the DGPS units to verify the existence of locations where data were collected. Download HYPACK navigation files to a portable data storage device and transfer data to an applicable secure project directory (AECOM 2010).
5.2 Elevation measurements
5.2.1 In order to establish the elevation of the sediment surface at locations within the river, a system will be established whereby the water level of the river is continuously monitored and recorded for use as a local reference. This system will consist of a number of transducer/data loggers (tide gauges) for measuring and recording the water level at
Standard Operating Procedure Lower Passaic River Restoration Project Navigation/Positioning
SOP No.: LPR-G-02 Revision: 5
Date: July 2011 Page 5 of 7
J:\Water\ProjectFiles\P120\12182_Passaic\Tasks\CWCM\AECOM QAPP\20110712_Rev1_toEPA\Word_clean\20110708_CWCM-sv_QAPP_Appendix-B_rev1\LPR-G-02_Navigation_Positioning_Rev5.docx
approximately one-mile intervals (or more closely spaced, as necessary) along the Lower Passaic River. The benchmark elevation of each water level recorder will be surveyed to the North American Vertical Datum of 1988 (NAVD88) with an accuracy of 0.01 foot. Once the benchmark elevation for a station is established it can be re-located as necessary for coverage of the active work area. The water level at each tide station will be recorded approximately every 15 minutes, and the data downloaded weekly.
5.2.2 At each sampling point on the river where elevation data is required, the depth from the water level to the sediment surface will be determined as specified in the SOP for the activity being performed. The time of the measurement will be recorded. The water surface elevation at the time of the measurement will be determined by comparison to the closest water level recorders, with interpolation between measuring points as necessary.
5.3 Calibration, maintenance, and use of field instruments
5.3.1 Poor DGPS Reception or System Failure
If insufficient satellite coverage occurs for proper function, the user will be alerted by the HYPACK® system. In these cases the Field Task Manager will be notified that verification of the field position of the vessel at the target location cannot be performed. The Field Task Manager will review the situation with respect to available reference resources and may provide the field team with alternate locations, as required by the QAPP. The selection of alternate sampling locations will be made jointly through discussions with the Field Task Manager and the boat personnel.
When satellite reception is insufficient to meet system accuracy requirements, system error codes will appear on the output screen. Nonetheless, proper operation of the DGPS / HYPACK navigation system can be verified by checking the displayed vessel position on the electronic base map against surrounding geographic features. This activity will be undertaken at the start of each day after start-up as a quick check to verify proper system function. Note: system function errors will be obvious and rigorous checking of the system is not necessary.
5.3.2 Maintenance
Prior to use, the DGPS units will be inspected for functionality. Maintenance and use of DGPS units will follow the appropriate sections of the equipment user's manual. Field personnel will have the manual available for reference. Equipment maintenance will be recorded in the field logbook, including the reason for the maintenance (routine or because of a problem), actions taken, and final resolution (e.g., correction of the problem, replacement of the instrument).
6.0 Quality Assurance/Quality Control
6.1 Actual sampling/measurement locations will be verified as being within the QAPP-specified radius/tolerance surrounding the target coordinates specified in the corresponding LPRRP QAPP. Using a HYPACK navigation system allows the user to see the real time position of the sampling vessel in relation to the designated position of the sampling/measurement station and the user defined “target radius” surrounding each station. This visual confirmation on the electronic chart is
Standard Operating Procedure Lower Passaic River Restoration Project Navigation/Positioning
SOP No.: LPR-G-02 Revision: 5
Date: July 2011 Page 6 of 7
J:\Water\ProjectFiles\P120\12182_Passaic\Tasks\CWCM\AECOM QAPP\20110712_Rev1_toEPA\Word_clean\20110708_CWCM-sv_QAPP_Appendix-B_rev1\LPR-G-02_Navigation_Positioning_Rev5.docx
also complimented by a HYPACK data display that indicates the actual distance to target. Using these two features ensures proper vessel positioning.
6.2 DGPS system performance will be verified by confirming the accuracy of the initial HYPACK configuration (i.e., geographic reference) and by regular system checks during the course of the day.
6.3 The quality of the data provided by the DGPS unit is monitored by HYPACK as another control feature built into the system. In the event there is degradation in DGPS signal quality, either by a reduced number of available satellites or satellite geometry, the HYPACK system will alert the operator of the reduced quality of horizontal and vertical precision levels.
6.4 Data recorded manually and electronically (see Section 7.2) will be cross-checked for accuracy
7.0 Data and Records Management
7.1 Field records will be generated as outlined in SOP LPR-G-01 (Field Records). This document provides specifics on recording data for field activities. At a minimum, sample position information (x, y, and z), verification of DGPS system performance, and any positioning-related problems encountered will be recorded. Additional information may be required for sample collection or measurement activities and are outlined in the relevant SOPs.
7.2 Position data will be saved electronically at the time of sampling within HYPACK and recorded manually on the sample collection/measurement forms. Although the electronic record represents the primary record, the sample collection/measurement form information will serve as a backup to the electronic file.
7.3 Position data (actual sample locations) will be downloaded and transmitted to the AECOM Data Management Task Manager at the frequency stated in the Data Management Plan (AECOM, 2010).
7.4 Deviations to the procedures detailed in the SOP will be recorded in the field logbook at the time of occurrence and summarized on the Daily Activity Log (refer to SOP LRP-G-01 – Field Records). A formal nonconformance report (NCR) will be completed (refer to SOP LRP-G-01 – Field Records) and distributed as specified in the QAPP.
7.5 All records (electronic and hard copy) associated with the activities described in this SOP will be maintained in accordance with the LPRRP Quality Management Plan (AECOM, 2009).
8.0 Personnel Qualifications and Training
Individuals executing these procedures will have read, and be familiar with, the requirements of this SOP. Vessel navigation and positioning will only be performed by experienced DGPS / HYPACK operators.
Standard Operating Procedure Lower Passaic River Restoration Project Navigation/Positioning
SOP No.: LPR-G-02 Revision: 5
Date: July 2011 Page 7 of 7
J:\Water\ProjectFiles\P120\12182_Passaic\Tasks\CWCM\AECOM QAPP\20110712_Rev1_toEPA\Word_clean\20110708_CWCM-sv_QAPP_Appendix-B_rev1\LPR-G-02_Navigation_Positioning_Rev5.docx
9.0 References
AECOM 2009. Quality Management Plan, Lower Passaic River Restoration Project, CERCLA Docket No. 02-2007-2009. September 2009 or current version.
AECOM 2010. Lower Passaic River Data Management Plan. July 2010 or current version.
AECOM 2011. Lower Passaic River Restoration Project, Remedial Investigation, Health and Safety Plan Addendum. June 2011 or current version.
MPI 2005a. Lower Passaic River Restoration Project Health and Safety Plan. January 2005.
MPI 2005b. Lower Passaic River Restoration Project Health and Safety Plan Final Addendum – Sediment Coring. July 2005.
Tierra 2007. Standard Operating Procedure No. 2 (Revision 2), Positioning. Newark Bay Study Area Phase II RIWP, Appendix F, October, 2007.
10.0 Revision History
Revision Date Changes
0 May 2008 NA
1 July 2008 Minor revisions to all sections; added elevation measurements
as Section 5.2
2 September 2009 Minor revisions to expand procedures to include water
column sampling and measurements
3 September 2010 Minor revisions throughout document
4 June 2011 Minor revisions throughout document
5 July 2011 Included Newark Bay Study Area; other minor revisions
Standard Operating Procedure Lower Passaic River Restoration Project
J:\Water\ProjectFiles\P120\12182_Passaic\Tasks\CWCM\AECOM QAPP\20110712_Rev1_toEPA\Word_clean\20110708_CWCM-sv_QAPP_Appendix-B_rev1\LPR-G-03_Equip_decon_Rev5.docx
Equipment Decontamination Procedure Number: LPR-G-03
Revision No.: 5
Revision Date: July 2011
Prepared by
Kristen Durocher
Date: July 7, 2011 Laura Kelmar, AECOM Project Manager Date: July 7, 2011 Debra L. Simmons, Project QA Manager
Annual review of this SOP has been performed and the SOP still reflects current practice.
Initials: Date: Initials: Date:
Standard Operating Procedure Lower Passaic River Restoration Project Equipment Decontamination
SOP No.: LPR-G-03 Revision: 5
Date: July 2011 Page i of i
J:\Water\ProjectFiles\P120\12182_Passaic\Tasks\CWCM\AECOM QAPP\20110712_Rev1_toEPA\Word_clean\20110708_CWCM-sv_QAPP_Appendix-B_rev1\LPR-G-03_Equip_decon_Rev5.docx
Contents
1.0 SCOPE AND APPLICABILITY .......................................................................................................... 1
2.0 HEALTH AND SAFETY CONSIDERATIONS ................................................................................... 1
3.0 INTERFERENCES .............................................................................................................................. 1
4.0 EQUIPMENT AND MATERIALS ....................................................................................................... 2
5.0 PROCEDURES ................................................................................................................................... 3
6.0 QUALITY ASSURANCE/QUALITY CONTROL ................................................................................ 6
7.0 DATA AND RECORDS MANAGEMENT .......................................................................................... 6
8.0 PERSONNEL QUALIFICATIONS AND TRAINING ......................................................................... 6
9.0 REFERENCES .................................................................................................................................... 7
10.0 REVISION HISTORY .......................................................................................................................... 7
Standard Operating Procedure Lower Passaic River Restoration Project Equipment Decontamination
SOP No.: LPR-G-03 Revision: 5
Date: July 2011 Page 1 of 7
J:\Water\ProjectFiles\P120\12182_Passaic\Tasks\CWCM\AECOM QAPP\20110712_Rev1_toEPA\Word_clean\20110708_CWCM-sv_QAPP_Appendix-B_rev1\LPR-G-03_Equip_decon_Rev5.docx
1.0 Scope and Applicability
The purpose of this document is to define the standard operating procedure (SOP) for decontamination of equipment, instruments, and other materials used during implementation of field tasks in the Lower Passaic River Study Area and the Newark Bay Study Area as part of the Lower Passaic River Restoration Project (LPRRP). Decontamination is the process of neutralizing, washing, and rinsing exposed surfaces of equipment to minimize the potential for contaminant migration and/or cross-contamination. This procedure does not apply to personnel decontamination which is described in the site-specific Health and Safety Plan (HASP) and associated addendums (MPI 2005a; MPI 2005b; AECOM 2011).
It is fully expected that the procedures outlined in this SOP will be followed. Procedural modifications to this SOP may be warranted depending upon field conditions, equipment limitations, or limitations imposed by the procedure. Substantive modification to this SOP will be approved in advance by the Project Quality Assurance (QA) Manager and Task Manager and communicated to the Cooperating Parties Group (CPG) Project Coordinator and to the United States Environmental Protection Agency (USEPA) Remedial Project Manager. Deviations from this SOP will be documented in the field records. The ultimate procedure employed will be documented in the report summarizing the results of the sampling event or field activity.
2.0 Health and Safety Considerations
2.1 The health and safety considerations for the work associated with this SOP, including physical, chemical and biological hazards, are addressed in the HASP and associated addendums (MPI 2005a; MPI 2005b; AECOM 2011).
2.2 Daily safety briefs will be conducted at the start of each working day before any work commences. These daily briefs will be facilitated by the Site Safety Officer (SSO) or his/her designee to discuss the day’s events and any potential health risk areas covering every aspect of the work to be completed. As detailed in the HASP, everyone on the field team has the authority to stop work if an unsafe condition is perceived until the conditions are fully remedied to the satisfaction of the SSO.
3.0 Interferences
3.1 Equipment decontamination should be performed in an area that does not interfere with sampling activities, but sufficiently close to maintain an efficient working environment. Whenever possible, decontamination activities will be performed in a location that is not subject to potential sources of contamination (for example, generators and other combustion engines). Where decontamination is required on a boat, the vessel’s engines must be turned off during decontamination. Ideally, boat engines and/or generators should be shut off during collection of equipment blanks, consistent with collection of river water samples. If this is not possible, then the sampling platform should be positioned upwind from any running combustion engines.
Standard Operating Procedure Lower Passaic River Restoration Project Equipment Decontamination
SOP No.: LPR-G-03 Revision: 5
Date: July 2011 Page 2 of 7
J:\Water\ProjectFiles\P120\12182_Passaic\Tasks\CWCM\AECOM QAPP\20110712_Rev1_toEPA\Word_clean\20110708_CWCM-sv_QAPP_Appendix-B_rev1\LPR-G-03_Equip_decon_Rev5.docx
3.2 Equipment that is improperly or inadequately decontaminated may result in biased sample results. To avoid sample contamination, the procedures and equipment specified in this SOP are to be followed. Specifically:
The decontamination materials, including detergent, water, solvents, and acids, will meet the specifications of the SOP;
Buckets and other containers holding decontamination solutions will be labeled to segregate containers holding “dirty” from “clean” solutions, and brushes will be dedicated to a particular step in the decontamination process; and
Decontaminated equipment that is not immediately reused will be covered/wrapped in plastic or aluminum foil (shiny side out) and marked to indicate it is clean.
4.0 Equipment and Materials
The following equipment list contains materials which may be needed in carrying out the procedures contained in this SOP. Not all equipment listed below may be necessary for a specific activity. Additional equipment may be required, pending field conditions.
personal protective equipment (PPE) and other safety equipment, as required by the HASP;
bristle brushes;
plastic wash/rinse buckets or tubs;
phosphate-free biodegradable detergent (e.g. Liquinox®, Alconox®);
Joy® (or equivalent) detergent (for oily residues);
10% nitric acid, reagent grade;
methanol (pesticide grade or better in separate Teflon bottles);
hexane (pesticide grade or better in separate Teflon bottles);
deionized "analyte-free" water (DIW);
stainless steel bowls or pans (labeled as needed);
squeeze bottles (Teflon® for solvent)
aluminum foil;
plastic sheeting;
zipper-lock bags;
tap water (from any treated municipal water supply);
high-pressure/steam cleaner;
sample container(s) for equipment rinsate blank, if collected;
investigation-derived waste (IDW) storage containers (refer to SOP LPR-G-04); and
field logbook and standardized forms as needed.
Standard Operating Procedure Lower Passaic River Restoration Project Equipment Decontamination
SOP No.: LPR-G-03 Revision: 5
Date: July 2011 Page 3 of 7
J:\Water\ProjectFiles\P120\12182_Passaic\Tasks\CWCM\AECOM QAPP\20110712_Rev1_toEPA\Word_clean\20110708_CWCM-sv_QAPP_Appendix-B_rev1\LPR-G-03_Equip_decon_Rev5.docx
5.0 Procedures
Sampling equipment (including newly purchased equipment) that comes into contact with the media to be sampled will be decontaminated prior to use in the field to eliminate or minimize cross-contamination. The frequency of decontamination is provided in the task-specific SOPs (for example, surface water sampling, grab sampling, sediment collection via vibracore, core processing). Sufficient decontaminated equipment will be available to be dedicated to the sampling locations planned for each day, where feasible. Equipment will be decontaminated in the area designated for decontamination.
For the LPRRP, surface water and sediment samples may be submitted for chemical, radiochemical, biological, and geotechnical analyses as described in the Quality Assurance Project Plan (QAPP). Sampling equipment will be decontaminated as described in Section 5.0 below. Decontamination of the sampling equipment will be commensurate with the analyses to be performed.
Solvents used during decontamination activities will be collected and handled in accordance with residuals management procedures outlined in SOP LPR-G-04 – Investigative Derived Waste (IDW) Handling and Disposal.
Not all sampling equipment will require full decontamination procedures. Three levels of decontamination (i.e., solvent, soap and water, or ambient water decontamination) will be performed based on the usage of the sampling equipment as defined below.
5.1 General preparation
Inspect equipment needed for sample collection to ensure that it is in good working order and establish an equipment decontamination area that includes a collection basin that can be placed beneath the equipment to collect decontamination fluids, brushes, and a series of wash bottles for each of the solutions specified in the following section. An IDW container and storage system will also be established as outlined SOP LPR-G-04 – Investigative Derived Waste (IDW) Handling and Disposal.
5.2 Level I (Decontamination with Ambient Water): The following steps will be used to decontaminate sampling and support vessels, vessel anchors, lines, ropes, vibracoring head, and buoy marker weights:
5.2.1 Personnel will dress in suitable PPE to reduce exposure to contaminants (refer to the HASP).
5.2.2 Equipment will be rinsed with river water onboard the sampling vessel.
5.2.3 Rinse water will not be contained.
5.2.4 Daily decontamination of the decks of the vessels will consist of a river water washing as soon as possible after concluding work. Further wash-down with tap water at the marina is at the discretion of the boat’s captain.
5.3 Level II (Decontamination with Soap and Water): The following steps will be used to decontaminate equipment that is not intended to collect samples for chemical analysis (e.g., sample storage coolers):
5.3.1 Personnel will dress in suitable PPE to reduce exposure to contaminants (refer to the HASP).
5.3.2 Residual sediment will be scraped off and the equipment rinsed with site/river water (on the sampling vessel while on site).
Standard Operating Procedure Lower Passaic River Restoration Project Equipment Decontamination
SOP No.: LPR-G-03 Revision: 5
Date: July 2011 Page 4 of 7
J:\Water\ProjectFiles\P120\12182_Passaic\Tasks\CWCM\AECOM QAPP\20110712_Rev1_toEPA\Word_clean\20110708_CWCM-sv_QAPP_Appendix-B_rev1\LPR-G-03_Equip_decon_Rev5.docx
5.3.3 Residual sediment on equipment that is decontaminated at the field facility will be collected according to IDW procedures outlined in SOP LPR-G-04 – IDW Handling and Disposal.
5.3.4 Equipment may be rinsed with tap water if needed to further remove gross contamination.
5.3.5 Equipment will be placed in a wash tub or bucket (if size allows) containing Alconox® (or other phosphate-free detergent) along with tap water, and scrubbed with a bristle brush or similar utensil.
5.3.6 Equipment will be rinsed twice with tap water over a bucket using a squeeze bottle or pressure washer.
5.3.7 Following decontamination, equipment will be placed in a dedicated clean area or will be protected from re-contamination by covering with plastic or wrapping in foil.
5.3.8 Rinse water and detergent water will be replaced frequently. Residual decontamination water used on the boat will be held in 5-gallon buckets, labeled, and transferred to the field facility for collection and ultimate disposal in accordance with IDW procedures outlined in SOP LPR-G-04 – Investigation Derived Waste (IDW) Handling and Disposal.
5.4 Level III (Decontamination with Solvents): The following decontamination procedure is based on a modification of the Region 2 procedure (USEPA, 1989). The following steps will be used to decontaminate small sampling equipment that will come into contact with sediment or surface water designated for chemical analysis. This sampling equipment includes stainless steel trowels, spoons and bowls, core tubes, stainless steel core cutters and catchers, plastic caps for the core tubes, trigger-activated bottle samples, and CFLEX tubing. Sampling devices will be decontaminated between collection of samples at different depths and different times at the same sampling location.
5.4.1 Personnel will dress in suitable PPE to reduce exposure to chemicals and contaminants (refer to the HASP).
5.4.2 Any residual sediment will be scraped off and the equipment rinsed with site/river water (on the vessel while on site).
5.4.3 Residual sediment on equipment that is decontaminated at the field facility will be collected according to IDW procedures outlined in SOP LPR-G-04 – Investigative Derived Waste (IDW) Handling and Disposal.
5.4.4 Equipment may be brushed and rinsed with tap water if needed to further remove gross contamination.
5.4.5 Equipment will be placed in a wash tub or bucket containing Alconox (or other phosphate-free detergent) along with tap water, and scrubbed with a bristle brush or similar utensil. Equipment will be rinsed with tap water over a second wash tub or bucket, using a squeeze bottle or pressure sprayer, followed by a 10% nitric acid rinse (for metals analyses), a DIW rinse, a methanol rinse, a hexane rinse (for organic analyses), and lastly with a DIW rinse. Rinses shall utilize sufficient amounts of solvent/water to flush rather than just wet the surface. The volume of DIW used during the rinse must be at least five times the volume of solvent used.
5.4.6 Core liners will be decontaminated by pouring a small amount of detergent and tap water into each core, capping the ends, and agitating the core liner so that all surface areas are flushed with the liquid. The detergent and tap water will be containerized as IDW and the process repeated with tap water, 10% nitric acid, DIW, methanol, hexane, and DIW. All
Standard Operating Procedure Lower Passaic River Restoration Project Equipment Decontamination
SOP No.: LPR-G-03 Revision: 5
Date: July 2011 Page 5 of 7
J:\Water\ProjectFiles\P120\12182_Passaic\Tasks\CWCM\AECOM QAPP\20110712_Rev1_toEPA\Word_clean\20110708_CWCM-sv_QAPP_Appendix-B_rev1\LPR-G-03_Equip_decon_Rev5.docx
decontamination solutions will be containerized as IDW and handled as described in Section 5.4.8.
5.4.7 Following decontamination, equipment will be placed in a clean area on clean aluminum foil or plastic sheeting and allowed to air dry. Following air drying, the equipment will be wrapped in aluminum foil, shiny side out, or placed in a zipper-lock bag, if not immediately re-used for sample collection. Larger equipment may be wrapped in clean plastic sheeting. Equipment that may be used immediately (i.e., before fully air dried) may be reused providing obvious deionized water has been shaken off. Core liners will be capped with clean caps, and the caps taped in place. The core liners will then be placed back into their original packaging for storage. Clean equipment should be marked in some way to indicate that it is clean. Core liners will not be marked; instead, caps taped in place on both ends of a liner will indicate that it has been decontaminated.
5.4.8 Used decontamination solutions and associated materials will be collected for ultimate disposal in accordance with IDW procedures outlined in SOP LPR-G-04 – Investigative Derived Waste (IDW) Handling and Disposal. Equipment decontamination waste materials generated on the vessel will be collected in 5-gallon buckets, labeled, and transferred to the field facility for disposal.
5.5 Field instrumentation should be cleaned according to the manufacturer's instructions. Care will be taken to prevent damage to equipment. Field instruments such as water quality meters will be rinsed daily during field operations at the end of each workday with DIW at a minimum, or more rigorously according to the manufacturer’s instructions. When possible, instruments which are difficult to decontaminate, such as cameras and data logging instruments, may be protectively wrapped to reduce or eliminate the need for decontamination.
5.6 Pumps used for surface water sampling will be rinsed with tap water prior to and following each day of use. Decontamination of the pump between stations or between depths is not required. Tubing will be received from the laboratory pre-cleaned and in dedicated packaging and will not require decontamination in the field.
5.7 Other sampling equipment that might be used and that has had direct contact with sediments or wastes will be decontaminated at a designated area prior to leaving the Site. If the above decontamination procedures are not applicable or feasible, the decontamination procedure will be as follows:
5.7.1 Equipment will be wrapped or draped in plastic or placed in the plastic-lined cargo area of a truck for transport to the area designated for decontamination.
5.7.2 Equipment will first be washed with a hot water, high-pressure spray or steam-cleaned.
5.7.3 Equipment will then be rinsed, by hose or high pressure spray, with tap water.
5.7.4 Wash and rinse water will be collected and handled in accordance with IDW procedures outlined in SOP LPR-G-04 – Investigative Derived Waste (IDW) Handling and Disposal.
5.8 Equipment leaving the Site upon the completion of on-site investigation activities will be decontaminated according to Sections 5.2, 5.3, 5.4, 5.5, or 5.6, above.
5.9 Equipment rinsate blanks will be collected to assess the adequacy of equipment decontamination procedures. Equipment rinsate blanks will be submitted for testing at the frequency specified in the
Standard Operating Procedure Lower Passaic River Restoration Project Equipment Decontamination
SOP No.: LPR-G-03 Revision: 5
Date: July 2011 Page 6 of 7
J:\Water\ProjectFiles\P120\12182_Passaic\Tasks\CWCM\AECOM QAPP\20110712_Rev1_toEPA\Word_clean\20110708_CWCM-sv_QAPP_Appendix-B_rev1\LPR-G-03_Equip_decon_Rev5.docx
QAPP. The equipment rinsate blank collection procedures are included in the SOPs for the individual tasks (surface water sampling, sediment sampling, core processing, etc.).
6.0 Quality Assurance/Quality Control
6.1 Decontamination QA/QC procedures described in Section 5.0 will be performed to assess the adequacy of equipment decontamination procedures. Equipment rinsate blanks will be collected at the frequency specified in the QAPP (QAPP Worksheet #20).
6.2 It is the responsibility of the Field Task Manager to periodically check/ensure that the equipment decontamination procedures are in conformance with those stated in this SOP.
7.0 Data and Records Management
7.1 Documentation of decontamination procedures will be contained in the field logbook or recorded on the appropriate task-specific standardized form and should include:
a list of equipment being decontaminated along with the date and time;
a brief description of the procedure and materials used during the process (e.g., Level I/ambient water rinse; Level II/soap and water rinse; Level III/acid and solvent rinse);
the names of the project staff performing the decontamination;
documentation of equipment rinsate blanks including sample ID, date and time, the equipment rinsed, collector, and parameters; and
IDW storage and disposal.
7.2 Field data will be distributed to the appropriate personnel as described in the Lower Passaic River Data Management Plan (DMP; AECOM 2010).
7.3 Deviations to the procedures detailed in the SOP will be recorded in the field logbook at the time of occurrence and summarized on the Daily Activity Log (refer to SOP LRP-G-01 – Field Records). A formal nonconformance report (NCR) will be completed (refer to SOP LRP-G-01 – Field Records) and distributed as specified in the QAPP.
7.4 All records associated with the activities described in this SOP will be ultimately maintained in accordance with the Lower Passaic River Restoration Project Quality Management Plan (AECOM 2009).
8.0 Personnel Qualifications and Training
Individuals executing these procedures will have read, and be familiar with, the requirements of this SOP and the corresponding LPRRP plans (e.g., HASP, QAPP, DMP). Decontamination of field

Standard Operating Procedure Lower Passaic River Restoration Project Equipment Decontamination
SOP No.: LPR-G-03 Revision: 5
Date: July 2011 Page 7 of 7
J:\Water\ProjectFiles\P120\12182_Passaic\Tasks\CWCM\AECOM QAPP\20110712_Rev1_toEPA\Word_clean\20110708_CWCM-sv_QAPP_Appendix-B_rev1\LPR-G-03_Equip_decon_Rev5.docx
equipment is a relatively simple procedure; no specialized training is needed. However, execution of these activities will initially be supervised by more experienced personnel.
9.0 References
AECOM 2009. Quality Management Plan, Lower Passaic River Restoration Project, CERCLA Docket No. 02-2007-2009. September 2009 or current version.
AECOM 2010. Lower Passaic River Data Management Plan. July 2010 or current version.
AECOM 2011. Lower Passaic River Restoration Project, Remedial Investigation, Health and Safety Plan Addendum. June 2011 or current version.
MPI 2005a. Lower Passaic River Restoration Project Health and Safety Plan. January 2005.
MPI 2005b. Lower Passaic River Restoration Project Health and Safety Plan Final Addendum – Sediment Coring. July 2005.
Tierra 2007. Standard Operating Procedure No. 2 (Revision 2), Decontamination. Newark Bay Study Area Phase II RIWP, Appendix F, October, 2007.
USEPA 1989. Region II CERCL Quality Assurance Manual. Revision 1. October 1989.
10.0 Revision History
Revision Date Changes 0 April 2008 NA 1 July 2008 Added Section 5.4.6 to discuss
decontamination of core lines; reworded Section 5.3.8; corrected minor typos
2 June 2010 Added information specific to surface water sampling; logo change.
3 September 2010 Minor changes throughout the document 4 June 2011 Minor changes throughout the document 5 July 2011 Minor changes throughout the document

Standard Operating Procedure Lower Passaic River Restoration Project
J:\Water\ProjectFiles\P120\12182_Passaic\Tasks\CWCM\AECOM QAPP\20110712_Rev1_toEPA\Word_clean\20110708_CWCM-sv_QAPP_Appendix-B_rev1\LPR-G-04_IDW_handling_and_disposal_Rev5.docx
Investigative Derived Waste (IDW) Handling and Disposal Procedure Number: LPR-G-04
Revision No.: 5
Revision Date: July 2011
Prepared by
Kristen Durocher
Date: July 7, 2011 Laura Kelmar, Project Manager Date: July 7, 2011 Debra L. Simmons, Project QA Manager Annual review of this SOP has been performed and the SOP still reflects current practice.
Initials: Date: Initials: Date:
Standard Operating Procedure Lower Passaic River Restoration Project Investigative Derived Waste (IDW) Handling and Disposal
SOP No.: LPR-G-04 Revision: 5
Date: July 2011 Page i of i
J:\Water\ProjectFiles\P120\12182_Passaic\Tasks\CWCM\AECOM QAPP\20110712_Rev1_toEPA\Word_clean\20110708_CWCM-sv_QAPP_Appendix-B_rev1\LPR-G-04_IDW_handling_and_disposal_Rev5.docx
Contents
1.0 SCOPE AND APPLICABILITY .......................................................................................................... 1
2.0 HEALTH AND SAFETY CONSIDERATIONS ................................................................................... 1
3.0 INTERFERENCES .............................................................................................................................. 1
4.0 EQUIPMENT AND MATERIALS ....................................................................................................... 1
5.0 PROCEDURES ................................................................................................................................... 2
6.0 QUALITY ASSURANCE/QUALITY CONTROL ................................................................................ 6
7.0 DATA AND RECORDS MANAGEMENT .......................................................................................... 6
8.0 PERSONNEL QUALIFICATIONS AND TRAINING ......................................................................... 7
9.0 REFERENCES .................................................................................................................................... 7
10.0 REVISION HISTORY .......................................................................................................................... 7
Attachment 1 – Example of IDW Log
Standard Operating Procedure Lower Passaic River Restoration Project Investigative Derived Waste (IDW) Handling and Disposal
SOP No.: LPR-G-04 Revision: 5
Date: July 2011 Page 1 of 8
J:\Water\ProjectFiles\P120\12182_Passaic\Tasks\CWCM\AECOM QAPP\20110712_Rev1_toEPA\Word_clean\20110708_CWCM-sv_QAPP_Appendix-B_rev1\LPR-G-04_IDW_handling_and_disposal_Rev5.docx
1.0 Scope and Applicability
1.1 The purpose of this document is to define the standard operating procedure (SOP) for disposal of sediment, water, personal protective equipment (PPE), and other potentially contaminated materials generated during operations conducted in the Lower Passaic River Study Area and the Newark Bay Study Area as part of the Lower Passaic River Restoration Project (LPRRP).
1.2 It is fully expected that the procedures outlined in this SOP will be followed. Procedural modifications to this SOP may be warranted depending upon field conditions, equipment limitations, or limitations imposed by the procedure. Substantive modifications to this SOP will be approved in advance by the Project Quality Assurance (QA) Manager and the Task Manager and communicated to the Cooperating Parties Group (CPG) Project Coordinator and the United States Environmental Protection Agency (USEPA) Remedial Project Manager. Deviations from this SOP will be documented in the field records. The ultimate procedure employed will be documented in the report summarizing the results of the sampling event or field activity.
2.0 Health and Safety Considerations
2.1 The health and safety considerations for the work associated with this SOP, including physical, chemical, and biological hazards, are addressed in the site specific Health and Safety Plan (HASP) and associated addendums (MPI 2005a; MPI 2005b; AECOM 2011).
2.2 Daily safety briefs will be conducted at the start of each working day before any work commences. These daily briefs will be facilitated by the Site Safety Officer (SSO) or his/her designee to discuss the day’s events and any potential health risk areas covering every aspect of the work to be completed. Equipment decontamination and Investigative Derived Waste (IDW) handling are often part of these discussions. As detailed in the HASP, everyone on the field team has the authority to stop work if an unsafe condition is perceived until the conditions are fully remedied to the satisfaction of the SSO.
3.0 Interferences
Not applicable.
4.0 Equipment and Materials
The following equipment list contains materials which may be needed in carrying out the procedures contained in this SOP. Not all equipment listed below may be necessary for a specific activity. Additional equipment may be required, pending field conditions.
personal protective equipment (PPE) or other safety equipment, as required by the HASP;
55-gallon open-top drums (Department of Transportation [DOT] approved) with lid;
Standard Operating Procedure Lower Passaic River Restoration Project Investigative Derived Waste (IDW) Handling and Disposal
SOP No.: LPR-G-04 Revision: 5
Date: July 2011 Page 2 of 8
J:\Water\ProjectFiles\P120\12182_Passaic\Tasks\CWCM\AECOM QAPP\20110712_Rev1_toEPA\Word_clean\20110708_CWCM-sv_QAPP_Appendix-B_rev1\LPR-G-04_IDW_handling_and_disposal_Rev5.docx
55-gallon closed-top drums (DOT approved) for collection of liquids;
30-gallon (minimum) garbage bags;
5-10 gallon carboys to be used as satellite waste collection containers;
Type I or II UL approved galvanized steel can(s) to be used for solvent waste collection;
5-gallon buckets with lids;
permanent marking pens and/or paint pens;
labels and tags;
duct tape;
storage racks;
small (cooler-size) storage containers;
walk-in cooler;
chemical storage cabinet (meeting Occupational Safety and Health Administration [OSHA] and National Fire Protection Association [NFPA] Code 30 specifications/Factory Manual [FM] approved);
field logbook and IDW log form (see Attachment 1); and
Acid and solvent spill kits.
5.0 Procedures
Potentially contaminated sediment, water, PPE, and other materials will be classified into three categories: (1) solid materials consisting of sediments, sediment samples returned from the laboratory, used polybutyrate core tubes, used PPE, and other materials used in the handling, processing, and storage of sediment (addressed in Section 5.1); (2) liquid wastes such as waste water, river water and decontamination water (addressed in Section 5.2.1); and (3) spent and residual chemicals (liquids) from decontamination (addressed in Section 5.2.2). Sediment from cores that are not processed for chemical, biological, or radiochemical analysis may be either archived or disposed of, and will be segregated and handled separately according to its classification. To the extent practical, liquids generated during coring and core processing operations will be separated from the solid material. Each type of material will be handled in the manner described in this SOP.
As discussed in the HASP, solid and liquid IDW handling will be performed in a well ventilated area (in the field) or in the vacuum hood when working in the field facility. Furthermore, skin and eyes will be protected from accidental exposure. Liquid IDW transfers will also take place in a well-ventilated storage location and may require respirators as specified in the HASP.

Standard Operating Procedure Lower Passaic River Restoration Project Investigative Derived Waste (IDW) Handling and Disposal
SOP No.: LPR-G-04 Revision: 5
Date: July 2011 Page 3 of 8
J:\Water\ProjectFiles\P120\12182_Passaic\Tasks\CWCM\AECOM QAPP\20110712_Rev1_toEPA\Word_clean\20110708_CWCM-sv_QAPP_Appendix-B_rev1\LPR-G-04_IDW_handling_and_disposal_Rev5.docx
5.1 Solid waste
Solid residuals generated during field activities will be characterized for appropriate offsite disposal. Solid residuals consist of two types of materials: non-sediment solid materials generated during the collection and processing of cores, including items such as used polybutyrate core tubes, aluminum foil from clean core tubes, PPE (e.g., gloves, Tyvek® suits, boot covers), and sediment not used for analyses (e.g., waste sediment such as that collected from the core "smear zone" and residual sediment). Non-sediment and sediment wastes will be segregated and temporarily stored in separate containers pending disposal. Loose sediment will be removed from non-sediment waste items prior to disposal and stored with other sediment wastes.
If recovered sediment is determined to be unusable after a core has been cut open, the sediment will be removed from the core tube and stored in an appropriate container for disposal as waste sediment. The used core tube will be stored and disposed of with the non-sediment solid wastes. Sediment residuals will be placed in 55-gallon drums, labeled, and stored temporarily until disposal.
Non-sediment solid materials will be placed in 55-gallon drums, bulk bags and/or a roll-off container, and stored temporarily pending characterization and off site disposal. All drums and bags containing solids residuals will be labeled and handled as described in Section 5.1.1 of this SOP.
5.1.1 Handling and tracking
As they are generated during field activities, waste sediment and other solid waste materials will be placed in DOT-approved 55-gallon drums or 30-gallon bags. Solid waste materials which are initially placed in bags may be bulked into 55-gallon drums for storage. The following procedures will be followed for storing sediment and other solid waste in these drums:
A unique drum number (consisting of the program ID and the sequential number) will be assigned to each drum by the Field Task Manager or designee. The drum number will be clearly marked on multiple places on the drum;
A label indicating that the drum contains IDW pending characterization and a Class 9 Hazardous Solid Waste label will be placed on each drum;
A log will be kept for each drum, listing the materials placed in that drum. All solid materials will be segregated based on the type of material (e.g., sediment, coring tubes, PPE, waste plastic, paper, or foil) and, to the extent practicable, by where they were generated (e.g., location within the river, station number, etc.);
Drums will be kept closed at all times except when material is being added to them. Drums will be sealed (bungs or lid bands tightened) when not in active use.
Collection drums may be reused at the processing facility after emptying; and
Drums containing solid materials will be stored in a secured area within the field facility until proper offsite disposal can be coordinated. Drums containing hazardous waste will be removed from the facility within the time mandated for the governing hazardous waste generator status (large quantity generator, small quantity generator, or conditionally except generator).
Standard Operating Procedure Lower Passaic River Restoration Project Investigative Derived Waste (IDW) Handling and Disposal
SOP No.: LPR-G-04 Revision: 5
Date: July 2011 Page 4 of 8
J:\Water\ProjectFiles\P120\12182_Passaic\Tasks\CWCM\AECOM QAPP\20110712_Rev1_toEPA\Word_clean\20110708_CWCM-sv_QAPP_Appendix-B_rev1\LPR-G-04_IDW_handling_and_disposal_Rev5.docx
5.2 Liquid waste
5.2.1 Waste water
Waste water will be generated during sediment core processing and decontamination activities. Sediment recovered during this process will be handled according to Section 5.1 of this SOP. Waste water will be collected in the large on-site storage tank (which is connected to the sink outlet) until the material is characterized and transferred off site for disposal.
5.2.2 River water
River water will be generated during the collection of surface water samples including purging the pump tubing and excess water retained in the trigger-activated grab sampler. River water is not considered IDW. During sampling activities, river water that is collected during the sampling but is not needed to fill the required sample containers will be temporarily containerized in 5-gallon plastic buckets, and will be returned to the river upon completion of sampling at a station.
5.2.3 Chemical liquid wastes
Chemical liquid wastes will include the spent solvents and acids and other residual chemicals generated during the decontamination process (refer to SOP LPR-G-03 – Equipment Decontamination).
Waste acids and solvents will be collected in (dedicated) satellite containers as follows:
Waste acids (e.g., HCl, HNO3) will be collected in a plastic storage carboy (20-L) SEPARATE FROM WASTE SOLVENTS, labeled with a Class 8 Corrosive Liquid label and containing a tag that indicates acid name, concentration, and volume along with users initials, date/time.
Waste solvents (e.g., acetone, methanol and hexane) will be collected in Type I or II UL approved galvanized steel disposal can, SEPARATE FROM WASTE ACIDS, labeled with a Class 3 Flammable Liquid label and containing a tag that indicates solvent name, concentration, and volume along with users’ initials, date/time.
If chemical liquid waste volumes increase beyond limited satellite storage container capacity, they will be placed in separate DOT-approved 55-gallon drums as follows:
Acid Waste (HCl, HNO3):
Assign a unique identification number to the (plastic lined) acid drum (clearly marked on the top and sides).
Place a label indicating that the drum contains IDW pending characterization and a Class 8 Corrosive Liquid label on the drum
Prepare a log for the drum, listing the volume and concentration of each acid transferred to the drum along with date/time.
Close the drum after each transfer
Store the drum in a secure area at the field facility until pickup by an authorized waste handler at the end of the field phase. Drums containing hazardous waste will be removed from the facility within the time mandated for the applicable hazardous waste

Standard Operating Procedure Lower Passaic River Restoration Project Investigative Derived Waste (IDW) Handling and Disposal
SOP No.: LPR-G-04 Revision: 5
Date: July 2011 Page 5 of 8
J:\Water\ProjectFiles\P120\12182_Passaic\Tasks\CWCM\AECOM QAPP\20110712_Rev1_toEPA\Word_clean\20110708_CWCM-sv_QAPP_Appendix-B_rev1\LPR-G-04_IDW_handling_and_disposal_Rev5.docx
generator status (large quantity generator, small quantity generator, or conditionally except generator).
Solvent Waste (Acetone, Methanol, Hexane):
Assign a unique identification number to the Type I or II UL approved steel disposal can (clearly marked on the top and sides);
Prepare a log for the drum, listing the volume and concentration of each solvent transferred to the drum along with date/time.
Place a label indicating that the drum contains IDW pending characterization and a Class 3 Flammable Liquid label on the drum.
Close the drum after each transfer.
Store the drum in a secure area at the field facility until pickup by an authorized waste handler at the end of the field phase. Drums containing hazardous waste will be removed from the facility within the time mandated for the governing hazardous waste generator status (large quantity generator, small quantity generator, or conditionally except generator).
5.3 Samples returned from offsite laboratories
Upon completion of the required chemical, biological, and/or radiochemical analyses, remaining sample material and sample containers from the laboratory may be returned to the field facility. Returned sample material/containers will be transported under chain of custody procedures, and remain in custody until disposal. Upon receipt, the chain of custody form will be signed and the samples will be logged in by a project staff member. The approximate volume of sample material and the condition of the containers in which the samples are returned will be checked and recorded in the IDW logbook.
The labels will then be removed from the sample containers, and the containers with their contents will be placed in a DOT-approved 55-gallon drum and will be characterized and disposed of off-site.
5.4 Materials returned from sampling locations
Both solid and liquid IDW will be generated at each sediment sampling location. These materials will be containerized in closed 5-gallon buckets on the sampling vessel, labeled, and secured for transport to the CPG field facility dock. The containers will be carried by hand to a truck with a plastic-lined cargo area and then transported to the field facility for consolidation in 55-gallon drums for subsequent testing and disposal.
IDW associated with surface water sampling may include liquid wastes (equipment decontamination solutions) and solid waste such as used PPE, aluminum foil, and tubing. These materials will be containerized as described above and returned to the CPG field facility for disposal. As discussed in Section 5.2, river water is not considered IDW and will be returned to the river upon departure from a sampling location.
Standard Operating Procedure Lower Passaic River Restoration Project Investigative Derived Waste (IDW) Handling and Disposal
SOP No.: LPR-G-04 Revision: 5
Date: July 2011 Page 6 of 8
J:\Water\ProjectFiles\P120\12182_Passaic\Tasks\CWCM\AECOM QAPP\20110712_Rev1_toEPA\Word_clean\20110708_CWCM-sv_QAPP_Appendix-B_rev1\LPR-G-04_IDW_handling_and_disposal_Rev5.docx
6.0 Quality Assurance/Quality Control
6.1 Disposal procedures will be documented in a logbook to ensure that disposal activities are conducted in accordance with the procedures outlined in the SOPs. Waste manifests will be obtained for solid and aqueous waste disposal to verify that proper transportation and disposal of these materials has occurred.
6.2 It is the responsibility of the Field Task Manager to periodically check/ensure that the IDW procedures are in conformance with those stated in this SOP and that records are complete and accurate.
7.0 Data and Records Management
7.1 The Field Task Manager or designee is responsible for documenting the handling and/or disposal of containers filled with solids or liquids generated during the LPRRP investigation in accordance with SOP LPR-G-01 (Field Records). In addition, the following information will be included in the logbook (at a minimum):
Name of person performing residual management or disposal activities;
Date and time of activity;
Information coordinating container numbers for drums or bags containing solid materials with sample numbers, core boring numbers, or origin; and
Information coordinating origin of waste liquid (water or chemical[s]) with specific waste drum or tank.
7.2 The IDW logbook will be kept at the CPG field facility for the duration of the field program. The logbook will be divided into 3 sections. Section 1 will provide a summary of each drum number, the date that filling commenced, date filled, pickup date, and manifest identifier. Individual drum/container logs (Attachment 2) will be inserted into Section 2 of the logbook when complete (when each container is filled and closed for shipping). All shipping manifest documentation and Land Disposal Restriction forms (if applicable) will be inserted into Section 3 of the logbook when available.
7.3 Deviations to the procedures detailed in the SOP will be recorded in the field logbook at the time of the occurrence and summarized on the Daily Activity Log (refer to SOP LRP-G-01 – Field Records). A formal nonconformance report (NCR) will be completed (refer to SOP LRP-G-01 – Field Records) and distributed as specified in the QAPP.
7.4 All records associated with the activities described in this SOP will be ultimately maintained in accordance with the Lower Passaic River Restoration Project Quality Management Plan (AECOM 2009).

Standard Operating Procedure Lower Passaic River Restoration Project Investigative Derived Waste (IDW) Handling and Disposal
SOP No.: LPR-G-04 Revision: 5
Date: July 2011 Page 7 of 8
J:\Water\ProjectFiles\P120\12182_Passaic\Tasks\CWCM\AECOM QAPP\20110712_Rev1_toEPA\Word_clean\20110708_CWCM-sv_QAPP_Appendix-B_rev1\LPR-G-04_IDW_handling_and_disposal_Rev5.docx
8.0 Personnel Qualifications and Training
8.1 The individual executing these procedures will have read, and be familiar with, the requirements of this SOP. Execution of these activities will initially be supervised by more experienced personnel.
8.2 Personnel will also be health and safety trained and certified as specified by the HASP.
9.0 References
AECOM 2009. Quality Management Plan, Lower Passaic River Restoration Project, CERCLA Docket No. 02-2007-2009. September 2009 or current version.
AECOM 2011. Lower Passaic River Restoration Project, Remedial Investigation, Health and Safety Plan Addendum. June 2011 or current version.
MPI 2005a. Lower Passaic River Restoration Project Health and Safety Plan. January 2005.
MPI 2005b. Lower Passaic River Restoration Project Health and Safety Plan Final Addendum – Sediment Coring. July 2005.
Tierra 2007. Standard Operating Procedure No. 7 (Revision 2), Management and Disposal of Residuals. Newark Bay Study Area Phase II RIWP, Appendix F, October, 2007.
10.0 Revision History
Revision Date Changes
0 April 2008 NA
1 July 2008 Remove “acid” from solvent waste procedures in Section 5.2.2; add destruction of labels to Section 5.3
2 June 2010 Added information specific to surface water sampling; logo change.
3 September 2010 Minor revisions throughout the document.
4 June 2011 Minor revisions throughout the document.
5 July 2011 Included Newark Bay Study Area
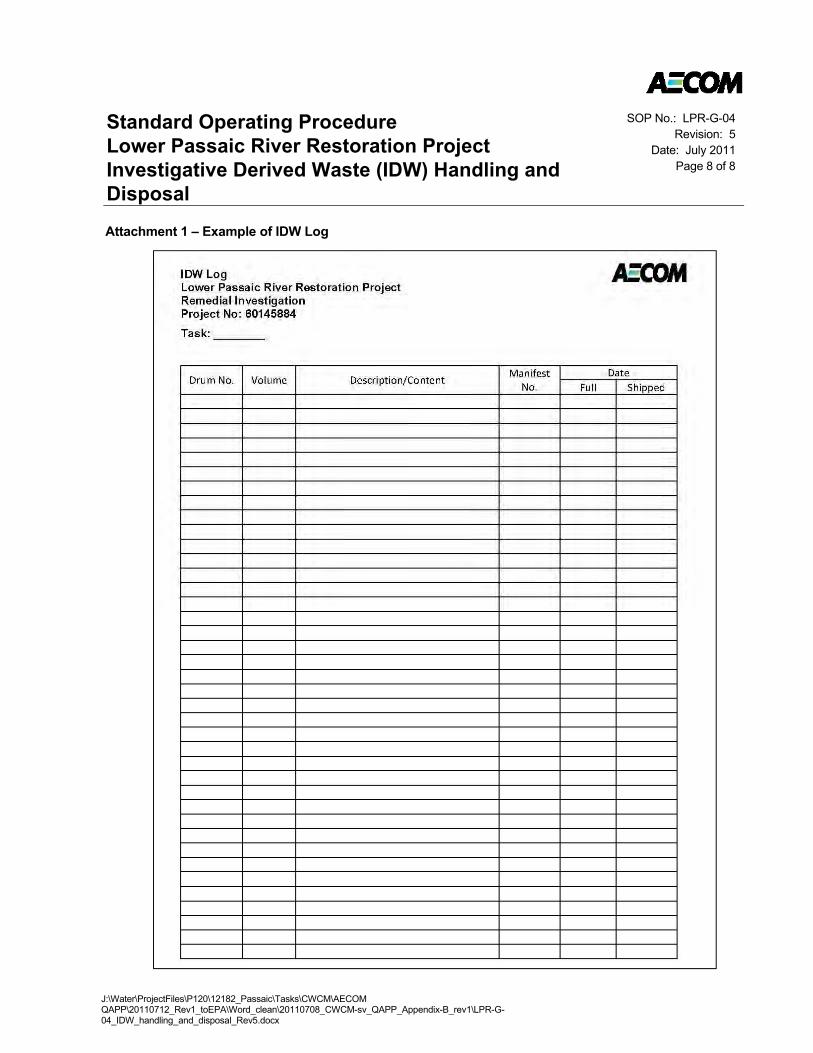
Standard Operating Procedure Lower Passaic River Restoration Project Investigative Derived Waste (IDW) Handling and Disposal
SOP No.: LPR-G-04 Revision: 5
Date: July 2011 Page 8 of 8
J:\Water\ProjectFiles\P120\12182_Passaic\Tasks\CWCM\AECOM QAPP\20110712_Rev1_toEPA\Word_clean\20110708_CWCM-sv_QAPP_Appendix-B_rev1\LPR-G-04_IDW_handling_and_disposal_Rev5.docx
Attachment 1 – Example of IDW Log

Standard Operating Procedure Lower Passaic River Restoration Project
J:\Water\ProjectFiles\P120\12182_Passaic\Tasks\CWCM\AECOM QAPP\20110712_Rev1_toEPA\Word_clean\20110708_CWCM-sv_QAPP_Appendix-B_rev1\LPR-G-05_Sample_Custody_Rev6.docx
Sample Custody Procedure Number: LPR-G-05
Revision No.: 6
Revision Date: July 2011
Prepared by
Kristen Durocher Dion Lewis
Date: July 7, 2011 Laura Kelmar, AECOM Project Manager Date: July 7, 2011 Debra L. Simmons, Project QA Manager Annual review of this SOP has been performed and the SOP still reflects current practice.
Initials: Date: Initials: Date:
Standard Operating Procedure Lower Passaic River Restoration Project Sample Custody
SOP No.: LPR-G-05 Revision: 5
Date: June 2011 Page i of i
J:\Water\ProjectFiles\P120\12182_Passaic\Tasks\CWCM\AECOM QAPP\20110712_Rev1_toEPA\Word_clean\20110708_CWCM-sv_QAPP_Appendix-B_rev1\LPR-G-05_Sample_Custody_Rev6.docx
Contents
1.0 SCOPE AND APPLICABILITY .......................................................................................................... 1
2.0 HEALTH AND SAFETY CONSIDERATIONS ................................................................................... 1
3.0 INTERFERENCES .............................................................................................................................. 1
4.0 EQUIPMENT AND MATERIALS ....................................................................................................... 2
5.0 PROCEDURES ................................................................................................................................... 2
6.0 QUALITY ASSURANCE / QUALITY CONTROL .............................................................................. 5
7.0 DATA AND RECORDS MANAGEMENT .......................................................................................... 5
8.0 PERSONNEL QUALIFICATIONS AND TRAINING ......................................................................... 6
9.0 REFERENCES .................................................................................................................................... 6
10.0 REVISION HISTORY .......................................................................................................................... 6
Attachment 1 Example Grab/Core Field Custody and Transfer Form
Attachment 2 Example Chain-of-Custody Form
Attachment 3 Example Chain-of-Custody Seal
Standard Operating Procedure Lower Passaic River Restoration Project Sample Custody
SOP No.: LPR-G-05 Revision: 6
Date: July 2011 Page 1 of 10
J:\Water\ProjectFiles\P120\12182_Passaic\Tasks\CWCM\AECOM QAPP\20110712_Rev1_toEPA\Word_clean\20110708_CWCM-sv_QAPP_Appendix-B_rev1\LPR-G-05_Sample_Custody_Rev6.docx
1.0 Scope and Applicability
1.1 The purpose of this document is to define the standard operating procedure (SOP) for the chain-of-custody (COC) procedures associated with samples collected in the Lower Passaic River Study Area and the Newark Bay Study Area as part of the Lower Passaic River Restoration Project (LPRRP). The objective of COC procedures is to provide sufficient evidence of sample integrity to satisfy data defensibility requirements. Samples may include sediment or water collected or generated for chemical, radiochemical, biological, and/or physics analyses, and associated quality assurance (QA) analysis. This SOP is intended to be complete enough so that: 1) the steps which could affect tracking, documentation, or integrity of samples are explained in sufficient detail and 2) different sampling personnel following these procedures will deliver samples to the laboratory which are equally reliable and consistent, and in compliance with regulatory agency requirements.
1.2 It is expected that the procedures outlined in this SOP will be followed. Procedural modifications may be warranted depending on field conditions, equipment limitations, or limitations imposed by the procedure. Substantive modification to this SOP will be approved in advance by the Task Manager and the Project QA Manager and will be communicated to the Cooperating Parties Group (CPG) Project Coordinator and the United States Environmental Protection Agency (USEPA) Remedial Project Manager. Deviations from the SOP will be documented in the field records. The ultimate procedure employed will be documented in the report summarizing the results of the sampling event or field activity.
2.0 Health and Safety Considerations
2.1 Although COC activities do not generally pose significant health and safety risks, sample exposure via external container residues may occur and much of the work going on in the vicinity of sample custodians requires attention to safety practices. Project-related physical, chemical and biological hazards are addressed in the site specific Health and Safety Plan (HASP) and associated addendums (MPI 2005a; MPI 2005b; AECOM 2011).
2.2 Daily safety briefs will be conducted at the start of each working day before any work commences. These daily briefs will be facilitated by the Site Safety Officer (SSO) or his/her designee to discuss the day’s events and any potential health risk areas covering every aspect of the work to be completed. As detailed in the HASP, everyone on the field team has the authority to stop work if an unsafe condition is perceived until the conditions are fully remedied to the satisfaction of the SSO.
3.0 Interferences
Not applicable.
Standard Operating Procedure Lower Passaic River Restoration Project Sample Custody
SOP No.: LPR-G-05 Revision: 6
Date: July 2011 Page 2 of 10
J:\Water\ProjectFiles\P120\12182_Passaic\Tasks\CWCM\AECOM QAPP\20110712_Rev1_toEPA\Word_clean\20110708_CWCM-sv_QAPP_Appendix-B_rev1\LPR-G-05_Sample_Custody_Rev6.docx
4.0 Equipment and Materials
The following equipment list contains materials which may be needed in carrying out the procedures contained in this SOP. Not all equipment listed below may be necessary for a specific activity. Additional equipment may be required, pending field conditions.
personal protective equipment (PPE) and other safety equipment, as required by the HASP;
sample containers as specified in the QAPP (Worksheet #19);
sample labels;
chain of custody forms;
custody tape or seals;
field logbook;
ballpoint pen or fine-tipped marked (e.g., Sharpie®); and
clear plastic sealing tape.
5.0 Procedures
5.1 General requirements
5.1.1 As few people as possible should handle the samples.
5.1.2 Sampling personnel should be able to testify that tampering of the samples could not occur without their knowledge.
5.2 Sample identification
Each sample, including field samples and quality control (QC) samples (e.g., trip blanks, equipment rinsate blanks, field duplicates) will be assigned a unique identification. Refer to the corresponding QAPP (Worksheet #27) for the sample identification protocol.
5.3 Sample labeling
5.3.1 A label will be attached to each bottle used for sampling. Waterproof, adhesive labels are preferred. Labels will be applied to the container, not the lid, whenever possible.
5.3.2 When practical, the project identification, sample matrix, laboratory designation/analyses requested, field sample identification code, and preservation will be typed or printed onto the label before sampling. The label will be protected from water and solvents with clear packing tape, except in cases where not appropriate (for example, pre-weighed VOA vials).
5.3.3 Completion of the sample labels (including the sampler’s initials and the date and time of sample collection) will occur at the time of sample collection. Labels will be completed in waterproof, indelible ink.
Standard Operating Procedure Lower Passaic River Restoration Project Sample Custody
SOP No.: LPR-G-05 Revision: 6
Date: July 2011 Page 3 of 10
J:\Water\ProjectFiles\P120\12182_Passaic\Tasks\CWCM\AECOM QAPP\20110712_Rev1_toEPA\Word_clean\20110708_CWCM-sv_QAPP_Appendix-B_rev1\LPR-G-05_Sample_Custody_Rev6.docx
5.4 Sample tracking
5.4.1 From the time of collection through transportation, the handling of samples will follow COC procedures. A representative from each sampling team (e.g., from each vessel) will be assigned as the field sample custodian. This individual will be responsible for the custody of the samples from collection until release to CPG field facility Sample Management Officer (SMO) for processing or shipment to the laboratories. The field sample custodian will provide a sample transfer/custody form and the completed and electronic versions of the sample collection forms (refer to SOPs LPR-S-01 – Grab Sampling, LPR-S-02 – Sediment Coring Using a Piston Push Core, and LPR-S-03 – Sediment Sampling Using a Vibracorer) to the CPG Field SMO when relinquishing the collected samples for sample processing or shipment. The CPG Field SMO will verify the samples against the sample transfer/custody form and then sign the form accepting custody of the samples. An example sample transfer/custody form for field to CPG facility transfer of sediment cores is provided as Attachment 1; a similar form or a standard chain of custody (COC) form (Attachment 2) may be utilized for other types of samples.
5.4.2 A sample is considered under a person’s custody if one or more of the criteria are met:
sample is in the person’s possession;
sample is in the person’s view after being in person’s possession;
sample was in the person’s possession and then was locked up to prevent tampering; or
sample is in a designated secure area.
5.4.3 Samples collected for analysis will be continuously tracked in the CPG field facility and while in transit to the laboratory by use of the following procedures below. The CPG field facility is locked, with limited access, and is therefore considered to be a secure area.
5.4.4 Individual sample bottles will be properly labeled and securely sealed before being placed in the container for shipment to the laboratory.
5.4.5 Pertinent information will be entered on the COC form (Attachment 2) and will include
project identification (project and task number, LPRRP sampling program);
signatures of samplers;
sample identification code. This code should be unique to the sampling event and to the program and must agree exactly with the field sample identification code recorded on the bottle label;
date and time of sample collection,
sample matrix (sediment, water, etc.);
analyses requested;
number of sample containers;
preservative;
grab or composite sample designation (if applicable);
Standard Operating Procedure Lower Passaic River Restoration Project Sample Custody
SOP No.: LPR-G-05 Revision: 6
Date: July 2011 Page 4 of 10
J:\Water\ProjectFiles\P120\12182_Passaic\Tasks\CWCM\AECOM QAPP\20110712_Rev1_toEPA\Word_clean\20110708_CWCM-sv_QAPP_Appendix-B_rev1\LPR-G-05_Sample_Custody_Rev6.docx
sampler’s remarks (optional). These comments may serve to alert the laboratory to highly contaminated samples or identify QC sample requirements.
signatures of individuals involved in sample transfer;
destination (e.g., laboratory name and location);
page number (for example: 1 of 2, 2 of 2);
if applicable, COC tape numbers; and
if applicable, the air bill or other shipping number.
This information is consistent with guidance in SW 846, Test Methods for Evaluating Solid Waste (USEPA, 1993).
5.4.6 The COC will be manually filled out completely and legibly in indelible ink, or reproduced from electronic sample forms produced directly from EQuIS Data Gathering Engine (EDGE)™ software from Earthsoft (refer to SOP LPR-G-01 – Field Records). COCs may be pre-printed with known information (project identification, parameters to be analyzed, etc.). Corrections will be made, if necessary, by drawing a single line through and initialing and dating the error. The correct information will then be recorded with indelible ink. There should be no unexplained blank spaces. Blank lines will be lined out and initialed and dated.
5.4.7 Each COC will be cooler-specific (i.e., list only the samples packed in the cooler). Information on the COC must agree exactly with that recorded on the sample containers. Discrepancies may result in the samples being incorrectly logged into the laboratory or delays in initiating sample analysis.
5.4.8 The completed COC form will be signed, dated, enclosed in a sealable plastic bag, and placed in the container prior to shipment. A copy of the COC will be retained by field personnel and stored in a dedicated binder or file. Additional copies will be distributed via email or fax as follows:
Project Chemist or his/her designee;
Data Management Task Manager or his/her designee;
CPG QA coordinator, and
laboratory project manager at each laboratory being used.
5.4.9 Samples will be considered in the custody of the field sample custodian or CPG Field SMO while in his/her possession or within sight, or maintained in a secure area prior to shipment. If the person packing the container and verifying the sample list (i.e., the CPG Field SMO) is different than the sampler, and the sample transfer/custody form (see Attachment 1 or equivalent) has been completed, the CPG Field SMO will sign the COC form to relinquish custody. The field sample custodian will sign each COC as the sampler.
5.4.10 If samples are to be shipped by commercial overnight carrier, COC seals must be used and the COC seal numbers recorded on the COC form. See Attachment 3 for an example COC seal. Refer to SOP LPR-G-06 – Packaging and Shipment of Environmental Samples for specific packaging procedures. Representatives of commercial carriers are not required to sign the COC form.
Standard Operating Procedure Lower Passaic River Restoration Project Sample Custody
SOP No.: LPR-G-05 Revision: 6
Date: July 2011 Page 5 of 10
J:\Water\ProjectFiles\P120\12182_Passaic\Tasks\CWCM\AECOM QAPP\20110712_Rev1_toEPA\Word_clean\20110708_CWCM-sv_QAPP_Appendix-B_rev1\LPR-G-05_Sample_Custody_Rev6.docx
5.4.11 If samples are hand carried to a laboratory, custody will be maintained and documented on the COC form through the process (e.g., from the person packing the cooler to the person transporting the samples to the laboratory).
5.4.12 If samples are transmitted to the laboratory by courier, the procedures described in either Section 5.4.10 or 5.4.11 will be followed, depending on whether the courier is a commercial courier or laboratory representative, and whether the cooler has been secured by COC seals prior to pick up by a laboratory courier.
5.4.13 Upon receipt at the laboratory, the designated laboratory sample custodian will sign the COC form indicating receipt of the incoming field samples. The samples will be checked against the COC form upon arrival at the laboratory. The receiving personnel will enter all arriving samples into the laboratory system. Any discrepancies between the samples and the COC form(s), or any evidence of tampering with the shipping container or the custody seal will be immediately reported to the Project Chemist. The laboratory sample custodian will check the temperature of the cooler upon arrival at the laboratory and record the measured temperature on the COC and/or appropriate sample/cooler receipt forms. The Project Chemist will be immediately notified of any sample preservation issues, including temperature exceedances.
5.4.14 A completed copy of the COC form will be distributed via email or fax to the Project Chemist within 24 hours of sample receipt at the laboratory. The original will be retained by the laboratory.
6.0 Quality Assurance/Quality Control
6.1 Completed COCs will be reviewed by the individuals preparing the samples for shipment for completeness, accuracy, and legibility. Specifically, the samples and COC record will be compared to ensure agreement between the sample labels and the COC, and to verify the number of sample containers.
6.2 These records are subjected to periodic review by the Field Task Manager to verify adherence to the procedures outlined in this SOP.
7.0 Data and Records Management
7.1 The records associated with the custody process (transfer forms, COC records, airbills, etc.) will be maintained at the CPG field facility in an organized and contained manner (e.g., 3-ring binder or file folder) for the duration of the sampling event.
7.2 COC records will be distributed to the appropriate personnel as described in the Lower Passaic River Data Management Plan (DMP; AECOM 2010).
7.3 Deviations to the procedures detailed in the SOP will be recorded in the field logbook at the time of occurrence and summarized on the Daily Activity Log (refer to SOP LRP-G-01 – Field Records). A formal nonconformance report (NCR) will be completed (refer to SOP LRP-G-01 – Field Records) and distributed as specified in the QAPP.
Standard Operating Procedure Lower Passaic River Restoration Project Sample Custody
SOP No.: LPR-G-05 Revision: 6
Date: July 2011 Page 6 of 10
J:\Water\ProjectFiles\P120\12182_Passaic\Tasks\CWCM\AECOM QAPP\20110712_Rev1_toEPA\Word_clean\20110708_CWCM-sv_QAPP_Appendix-B_rev1\LPR-G-05_Sample_Custody_Rev6.docx
7.4 All records associated with the activities described in this SOP will be ultimately maintained in accordance with the Lower Passaic River Restoration Project Quality Management Plan (AECOM 2009).
8.0 Personnel Qualifications and Training
Individuals executing these procedures will have read and be familiar with the requirements of this SOP and the corresponding LPRRP plans (e.g., HASP, QAPP, DMP). No specialized training is required; however, execution of these activities will initially be supervised by more experienced personnel.
9.0 References
AECOM 2009. Quality Management Plan, Lower Passaic River Restoration Project, CERCLA Docket No. 02-207-2009. September 2009 or current version.
AECOM 2010. Lower Passaic River Data Management Plan. July 2010, or current version.
AECOM 2011. Lower Passaic River Restoration Project, Remedial Investigation, Health and Safety Plan Addendum. June 2011 or current version.
MPI 2005a. Lower Passaic River Restoration Project Health and Safety Plan. January 2005.
MPI 2005b. Lower Passaic River Restoration Project Health and Safety Plan Final Addendum – Sediment Coring. July 2005.
Tierra 2007. Standard Operating Procedure No. 2 (Revision 2), Containers, preservation, handling, and tracking of samples for analysis. Newark Bay Study Area Phase II RIWP, Appendix F, October, 2007.
United States Environmental Protection Agency. 1997. SW 846, Test Methods for Evaluating Solid Waste.
10.0 Revision History
Revision Date Changes
0 May 2008 NA
1 July 2008 Changes to Sections 5.3, 5.4.1 and 5.4.8
2 September 2009 Minor changes to address non-sediment samples
3 June 2010 Minor changes to address surface water sampling; organizational changes; update logo

Standard Operating Procedure Lower Passaic River Restoration Project Sample Custody
SOP No.: LPR-G-05 Revision: 6
Date: July 2011 Page 7 of 10
J:\Water\ProjectFiles\P120\12182_Passaic\Tasks\CWCM\AECOM QAPP\20110712_Rev1_toEPA\Word_clean\20110708_CWCM-sv_QAPP_Appendix-B_rev1\LPR-G-05_Sample_Custody_Rev6.docx
Revision Date Changes
4 September 2010 Minor revisions throughout document
5 June 2011 Minor revisions throughout document
6 July 2011 Added Newark Bay Study Area
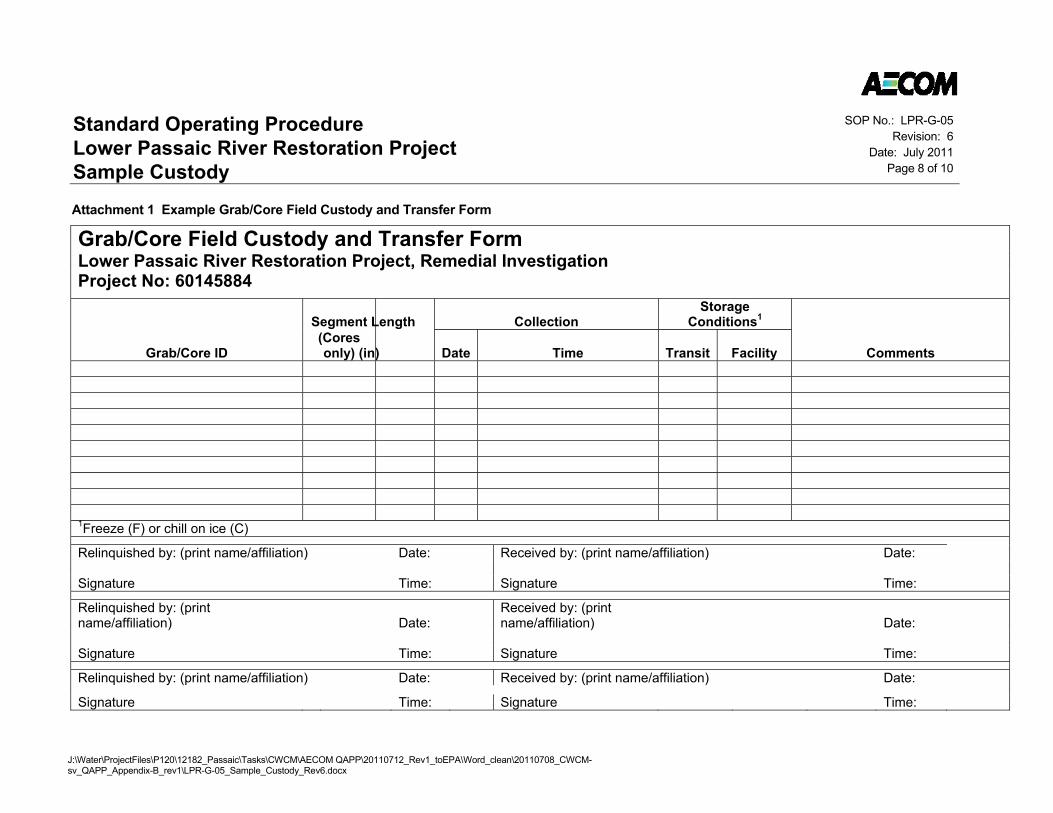
Standard Operating Procedure Lower Passaic River Restoration Project Sample Custody
SOP No.: LPR-G-05 Revision: 6
Date: July 2011 Page 8 of 10
J:\Water\ProjectFiles\P120\12182_Passaic\Tasks\CWCM\AECOM QAPP\20110712_Rev1_toEPA\Word_clean\20110708_CWCM-sv_QAPP_Appendix-B_rev1\LPR-G-05_Sample_Custody_Rev6.docx
Attachment 1 Example Grab/Core Field Custody and Transfer Form
Grab/Core Field Custody and Transfer Form Lower Passaic River Restoration Project, Remedial Investigation Project No: 60145884
Grab/Core ID
Segment Length Collection Storage
Conditions1
Comments (Cores only) (in) Date Time Transit Facility
1Freeze (F) or chill on ice (C)
Relinquished by: (print name/affiliation) Date: Received by: (print name/affiliation) Date: Signature Time: Signature Time:
Relinquished by: (print name/affiliation) Date:
Received by: (print name/affiliation) Date:
Signature Time: Signature Time:
Relinquished by: (print name/affiliation) Date: Received by: (print name/affiliation) Date:
Signature Time: Signature Time:
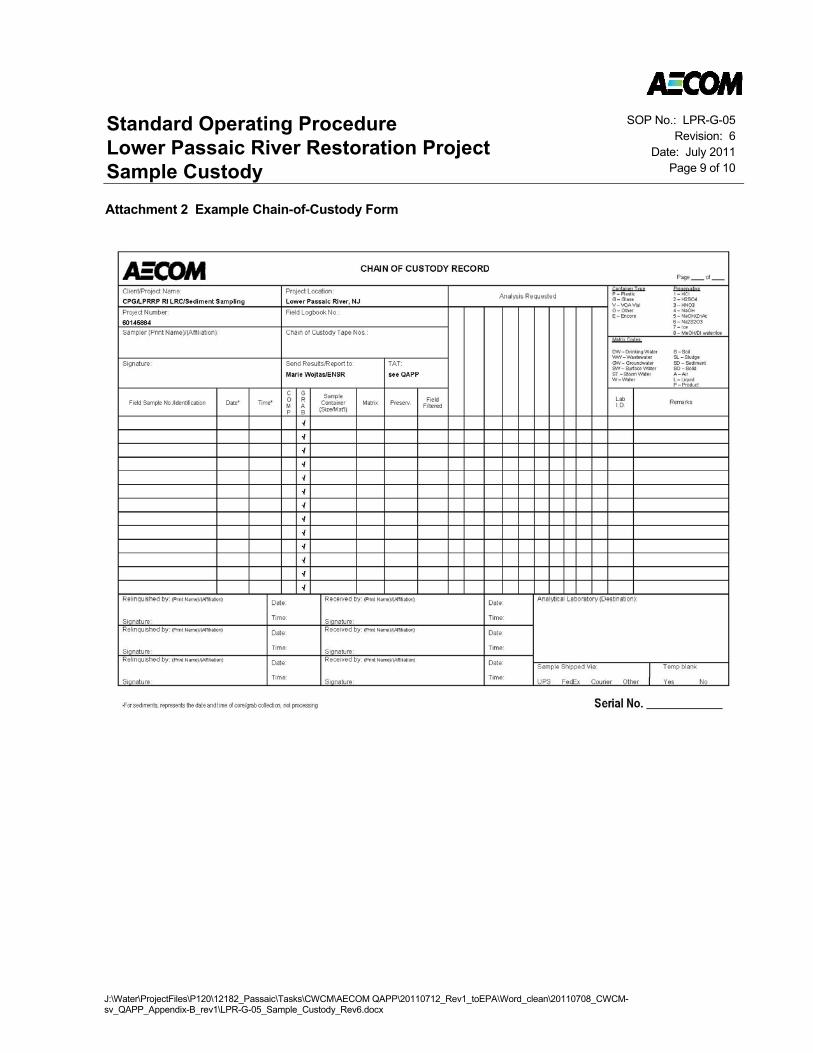
Standard Operating Procedure Lower Passaic River Restoration Project Sample Custody
SOP No.: LPR-G-05 Revision: 6
Date: July 2011 Page 9 of 10
J:\Water\ProjectFiles\P120\12182_Passaic\Tasks\CWCM\AECOM QAPP\20110712_Rev1_toEPA\Word_clean\20110708_CWCM-sv_QAPP_Appendix-B_rev1\LPR-G-05_Sample_Custody_Rev6.docx
Attachment 2 Example Chain-of-Custody Form
Standard Operating Procedure Lower Passaic River Restoration Project Sample Custody
SOP No.: LPR-G-05 Revision: 6
Date: July 2011 Page 10 of 10
J:\Water\ProjectFiles\P120\12182_Passaic\Tasks\CWCM\AECOM QAPP\20110712_Rev1_toEPA\Word_clean\20110708_CWCM-sv_QAPP_Appendix-B_rev1\LPR-G-05_Sample_Custody_Rev6.docx
Attachment 3 Example Chain-of-Custody Seal
Standard Operating ProcedureLower Passaic River Restoration Project
J:\Water\ProjectFiles\P120\12182_Passaic\Tasks\CWCM\AECOM QAPP\20110712_Rev1_toEPA\Word_clean\20110708_CWCM-sv_QAPP_Appendix-B_rev1\LPR-G-06_Sample_Packaging_and_Shipping_Rev5.docx
Sample Packaging and Shipping
Procedure Number: LPR-G-06
Revision No.: 5
Revision Date: July 2011
Prepared by
Kristen DurocherDion Lewis
Date: July 7, 2011Laura Kelmar, Project Manager
Date: July 7, 2011Debra L. Simmons, Project QA Manager
Annual review of this SOP has been performedand the SOP still reflects current practice.
Initials: D ate:Initials: D ate:

Standard Operating Procedure Lower Passaic River Restoration Project Sample Packaging and Shipping
SOP No.: LPR-G-06 Revision: 5
Date: July 2011 Page i of i
J:\Water\ProjectFiles\P120\12182_Passaic\Tasks\CWCM\AECOM QAPP\20110712_Rev1_toEPA\Word_clean\20110708_CWCM-sv_QAPP_Appendix-B_rev1\LPR-G-06_Sample_Packaging_and_Shipping_Rev5.docx
Contents
1.0 SCOPE AND APPLICABILITY .......................................................................................................... 1
2.0 HEALTH AND SAFETY CONSIDERATIONS ................................................................................... 1
3.0 INTERFERENCES .............................................................................................................................. 1
4.0 EQUIPMENT AND MATERIALS ....................................................................................................... 2
5.0 PROCEDURES ................................................................................................................................... 2
6.0 QUALITY ASSURANCE / QUALITY CONTROL .............................................................................. 4
7.0 DATA AND RECORDS MANAGEMENT .......................................................................................... 5
8.0 PERSONNEL QUALIFICATIONS AND TRAINING ......................................................................... 5
9.0 REFERENCES .................................................................................................................................... 5
10.0 REVISION HISTORY .......................................................................................................................... 6
Standard Operating Procedure Lower Passaic River Restoration Project Sample Packaging and Shipping
SOP No.: LPR-G-06 Revision: 5
Date: July 2011 Page 1 of 6
J:\Water\ProjectFiles\P120\12182_Passaic\Tasks\CWCM\AECOM QAPP\20110712_Rev1_toEPA\Word_clean\20110708_CWCM-sv_QAPP_Appendix-B_rev1\LPR-G-06_Sample_Packaging_and_Shipping_Rev5.docx
1.0 Scope and Applicability
1.1 The purpose of this document is to define the standard operating procedure (SOP) for packaging and shipping samples collected in the Lower Passaic River Study Area and the Newark Bay Study Area as part of the Lower Passaic River Restoration Project (LPPRP). Sample packaging and shipment generally involves the placement of individual sample containers into a cooler or other similar shipping container and placement of packing materials and coolant in such a manner as to isolate the samples, maintain the required temperature, and to limit the potential for damage to sample containers when the cooler is transported.
1.2 It is expected that the procedures outlined in this SOP will be followed. Procedural modifications may be warranted depending on field conditions, equipment limitations, or limitations imposed by the procedure. Substantive modification to this SOP will be approved in advance by Task Manager and the Project Quality Assurance (QA) Manager and will be communicated to the Cooperating Parties Group (CPG) Project Coordinator and the United States Environmental Protection Agency (USEPA) Remedial Project Manager. Deviations from the SOP will be documented in the field records. The ultimate procedure employed will be documented in the report summarizing the results of the sampling event or field activity.
2.0 Health and Safety Considerations
2.1 Although packaging activities do not generally pose significant health and safety risks, sample exposure via external container residues may occur and much of the work going on in the vicinity of sample custodians/shippers require attention to safety practices. Project related physical, chemical, and biological hazards are addressed in the site specific Health and Safety Plan (HASP) and associated addendums (MPI 2005a; MPI 2005b; AECOM 2011).
2.2 Sample packaging and shipping involves potential physical hazards primarily associated with handling of occasional broken sample containers and lifting of heavy objects. Adequate precautions will be taken, including minimizing the weight of individual coolers, using hand carts to transport coolers, and using the buddy system to lift coolers into and out of vehicles.
2.3 Daily safety briefs will be conducted at the start of each working day before any work commences. These daily briefs will be facilitated by the Site Safety Officer (SSO) or his/her designee to discuss the day’s events and any potential health risk areas covering every aspect of the work to be completed. As detailed in the HASP, everyone on the field team has the authority to stop work if an unsafe condition is perceived until the conditions are fully remedied to the satisfaction of the SSO.
3.0 Interferences
Improper sample storage or inadequate protection against breakage and cross-contamination could potentially affect sample results. The field team will follow the details of this SOP to minimize these effects.
Standard Operating Procedure Lower Passaic River Restoration Project Sample Packaging and Shipping
SOP No.: LPR-G-06 Revision: 5
Date: July 2011 Page 2 of 6
J:\Water\ProjectFiles\P120\12182_Passaic\Tasks\CWCM\AECOM QAPP\20110712_Rev1_toEPA\Word_clean\20110708_CWCM-sv_QAPP_Appendix-B_rev1\LPR-G-06_Sample_Packaging_and_Shipping_Rev5.docx
4.0 Equipment and Materials
The following equipment list contains materials which may be needed in carrying out the procedures contained in this SOP. Not all equipment listed below may be necessary for a specific activity. Additional equipment may be required, pending field conditions.
personal protective equipment (PPE) and other safety equipment, as required by the HASP;
inert packing material (e.g., foam peanuts, vermiculite, cardboard, bubblewrap, etc.);
pre-preserved sample containers as specified in the QAPP (Worksheet #19);
sample labels;
chain of custody (COC) forms;
insulated coolers;
custody tape or seals;
indelible marking pens;
shipping tape;
sealable plastic bags;
temperature blanks (provided by the laboratory);
field logbook;
ice or similar chilling source;
ballpoint pen or fine-tipped marked (e.g., Sharpie®); and
clear plastic sealing tape.
5.0 Procedures
5.1 General requirements
5.1.1 Vehicular sample transport will adhere to normal/applicable Department of Transportation (DOT) regulations and air transport should follow applicable International Air Transport Association (IATA) regulations. DOT and IATA regulations/guidelines related to sample shipments can be viewed on AECOM’s SH&E intranet web page.
5.1.2 An area for storing unused sample containers/coolers and a clean area for sample handling, packaging, and shipment will be designated at the CPG field facility to avoid cross contamination concerns.
5.1.3 Laboratories will often re-use coolers. The interior and exterior of each cooler received at a project location should be inspected for cleanliness before using it. Any coolers that have cracked interior or exterior linings/panels or hinges should be discarded. Any coolers missing one or both handles should also be discarded if replacement handles (i.e., knotted rope handles) cannot be fashioned in the field.
Standard Operating Procedure Lower Passaic River Restoration Project Sample Packaging and Shipping
SOP No.: LPR-G-06 Revision: 5
Date: July 2011 Page 3 of 6
J:\Water\ProjectFiles\P120\12182_Passaic\Tasks\CWCM\AECOM QAPP\20110712_Rev1_toEPA\Word_clean\20110708_CWCM-sv_QAPP_Appendix-B_rev1\LPR-G-06_Sample_Packaging_and_Shipping_Rev5.docx
5.1.4 Excess strapping tape and old shipping labels should be removed. If the cooler interior exhibits visible contamination or odors it should be decontaminated in accordance with LPR-G-03 – Equipment Decontamination (Level II) prior to use.
5.1.5 The Field Task Manager or designee will notify the laboratory(ies) of the number, type and approximate collection and shipment dates for the samples in advance of any sample transfers and communicate any delays in sample shipment. The laboratory will be alerted when shipments are scheduled for weekend delivery, so that personnel are available to receive the samples.
5.2 Sample packaging and shipping will be done in accordance with applicable regulations, as described below:
5.2.1 After filling a sample container, affix cap and securely seal with clear tape (except for samples to be analyzed for volatile organic compounds [VOCs]) and complete the sample label. Apply the label to the sample container and cover with clear tape.
5.2.2 Clean the outside of each sample container by wiping it off with a clean paper towel. Verify that residual sediment has been removed from the outside of the container, and from the area under and around the cap.
5.2.3 Place each glass sample bottle into an individual bubble bag sleeve provided by the lab or wrap each glass bottle/jar individually using bubble wrap secured with tape or rubber bands
5.2.4 Seal each sample container inside a sealable plastic bag. Samples for VOC analysis will be packaged together in a sealed plastic bag.
5.2.5 For those samples that require thermal preservation, place on ice or similar chilling source immediately after collection.
5.2.6 Place plastic bubble wrap matting in the bottom of each cooler or shipping container as needed. Insert a clean trash bag into the cooler to serve as a liner.
5.2.7 Transfer the samples to the plastic-lined cooler. Place bottles upright into the cooler. If a combination of plastic and glass sample containers are to be packed, alternate them within the cooler to further protect the glass. Use inert packaging material (e.g., cardboard, vermiculite, etc.) to cushion the samples and minimize the potential for breakage by placing additional packing material throughout the voids between sample containers and between any layers within each cooler to a level which meets the approximate top of the sample containers. Packing material may require tamping by hand to reduce the potential for settling. Seal the drains on the ice chest (if present) with shipping tape or plug the drains with silicone sealant or a similar inert substance.
5.2.8 Place a trip blank in each cooler containing field samples for VOCs and/or TPH Purgeables analyses. It is suggested that sample containers used for VOC or TPH Purgeables analyses should be grouped together into a single individual cooler to limit the number of trip blanks required for transportation and analysis. Note that trip blanks are not required for aqueous QC samples such as equipment rinsate blanks.
5.2.9 Conduct an inventory of sample numbers, fractions and containers when placing samples into the coolers, and check the inventory against the corresponding COC form before sealing the cooler.
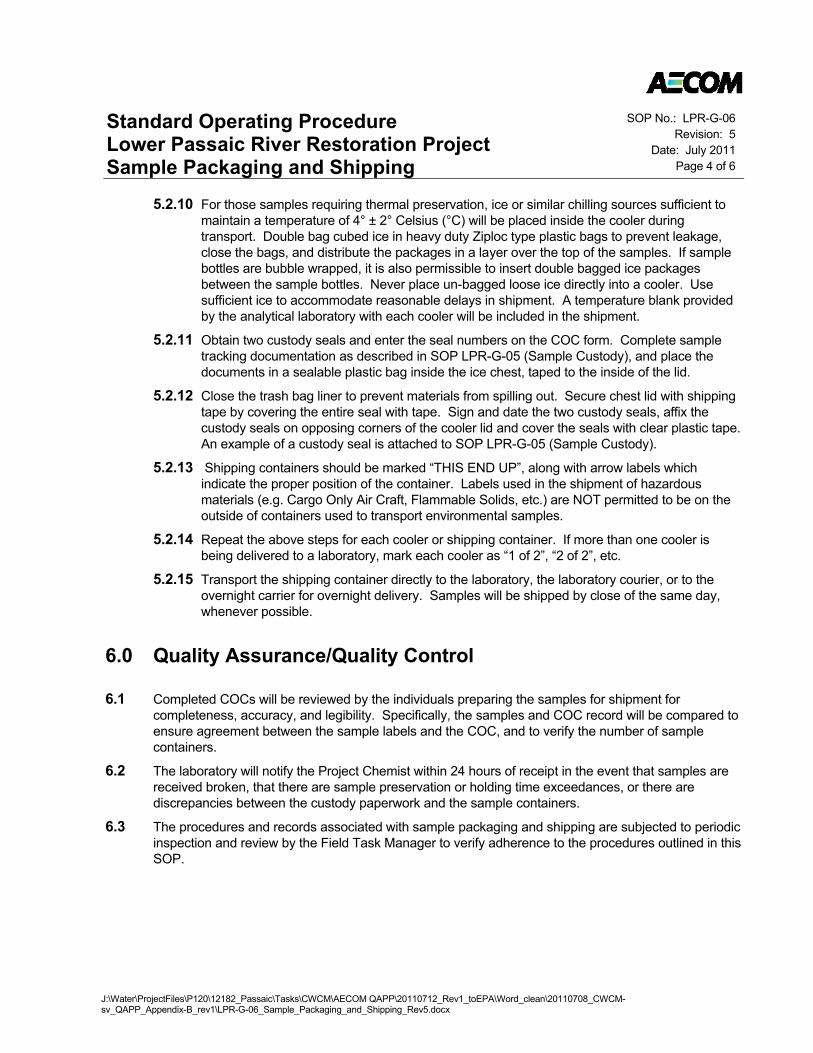
Standard Operating Procedure Lower Passaic River Restoration Project Sample Packaging and Shipping
SOP No.: LPR-G-06 Revision: 5
Date: July 2011 Page 4 of 6
J:\Water\ProjectFiles\P120\12182_Passaic\Tasks\CWCM\AECOM QAPP\20110712_Rev1_toEPA\Word_clean\20110708_CWCM-sv_QAPP_Appendix-B_rev1\LPR-G-06_Sample_Packaging_and_Shipping_Rev5.docx
5.2.10 For those samples requiring thermal preservation, ice or similar chilling sources sufficient to maintain a temperature of 4° ± 2° Celsius (°C) will be placed inside the cooler during transport. Double bag cubed ice in heavy duty Ziploc type plastic bags to prevent leakage, close the bags, and distribute the packages in a layer over the top of the samples. If sample bottles are bubble wrapped, it is also permissible to insert double bagged ice packages between the sample bottles. Never place un-bagged loose ice directly into a cooler. Use sufficient ice to accommodate reasonable delays in shipment. A temperature blank provided by the analytical laboratory with each cooler will be included in the shipment.
5.2.11 Obtain two custody seals and enter the seal numbers on the COC form. Complete sample tracking documentation as described in SOP LPR-G-05 (Sample Custody), and place the documents in a sealable plastic bag inside the ice chest, taped to the inside of the lid.
5.2.12 Close the trash bag liner to prevent materials from spilling out. Secure chest lid with shipping tape by covering the entire seal with tape. Sign and date the two custody seals, affix the custody seals on opposing corners of the cooler lid and cover the seals with clear plastic tape. An example of a custody seal is attached to SOP LPR-G-05 (Sample Custody).
5.2.13 Shipping containers should be marked “THIS END UP”, along with arrow labels which indicate the proper position of the container. Labels used in the shipment of hazardous materials (e.g. Cargo Only Air Craft, Flammable Solids, etc.) are NOT permitted to be on the outside of containers used to transport environmental samples.
5.2.14 Repeat the above steps for each cooler or shipping container. If more than one cooler is being delivered to a laboratory, mark each cooler as “1 of 2”, “2 of 2”, etc.
5.2.15 Transport the shipping container directly to the laboratory, the laboratory courier, or to the overnight carrier for overnight delivery. Samples will be shipped by close of the same day, whenever possible.
6.0 Quality Assurance/Quality Control
6.1 Completed COCs will be reviewed by the individuals preparing the samples for shipment for completeness, accuracy, and legibility. Specifically, the samples and COC record will be compared to ensure agreement between the sample labels and the COC, and to verify the number of sample containers.
6.2 The laboratory will notify the Project Chemist within 24 hours of receipt in the event that samples are received broken, that there are sample preservation or holding time exceedances, or there are discrepancies between the custody paperwork and the sample containers.
6.3 The procedures and records associated with sample packaging and shipping are subjected to periodic inspection and review by the Field Task Manager to verify adherence to the procedures outlined in this SOP.
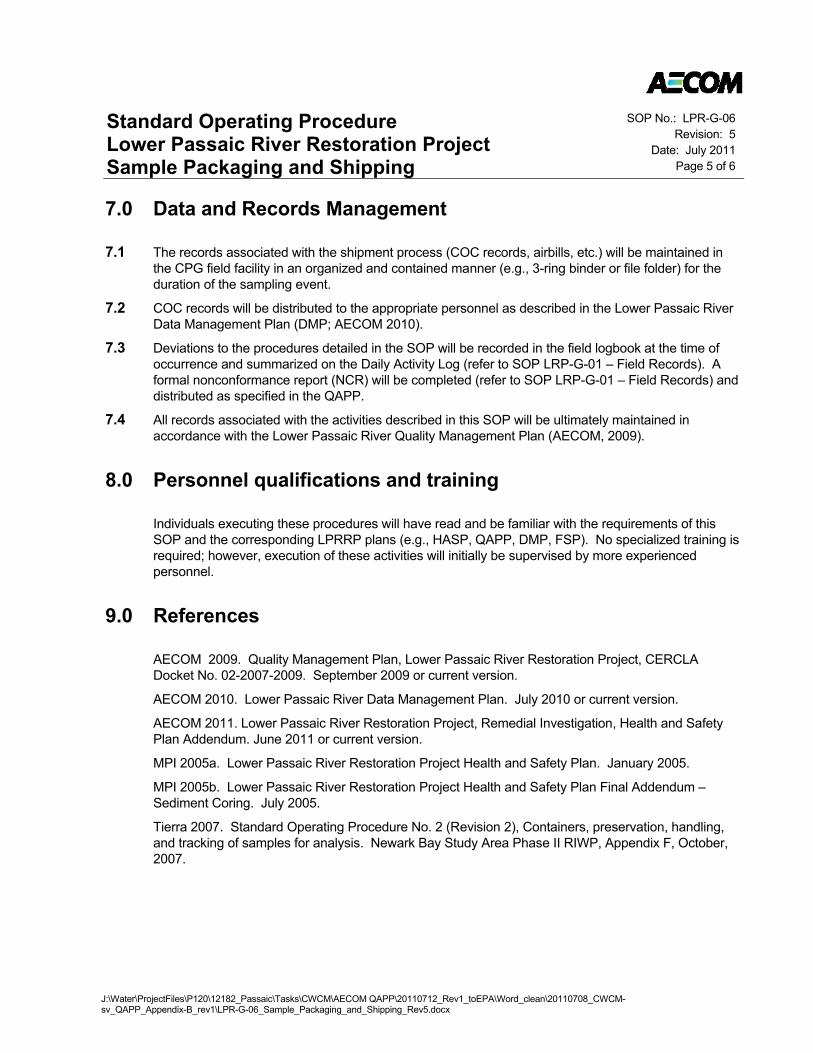
Standard Operating Procedure Lower Passaic River Restoration Project Sample Packaging and Shipping
SOP No.: LPR-G-06 Revision: 5
Date: July 2011 Page 5 of 6
J:\Water\ProjectFiles\P120\12182_Passaic\Tasks\CWCM\AECOM QAPP\20110712_Rev1_toEPA\Word_clean\20110708_CWCM-sv_QAPP_Appendix-B_rev1\LPR-G-06_Sample_Packaging_and_Shipping_Rev5.docx
7.0 Data and Records Management
7.1 The records associated with the shipment process (COC records, airbills, etc.) will be maintained in the CPG field facility in an organized and contained manner (e.g., 3-ring binder or file folder) for the duration of the sampling event.
7.2 COC records will be distributed to the appropriate personnel as described in the Lower Passaic River Data Management Plan (DMP; AECOM 2010).
7.3 Deviations to the procedures detailed in the SOP will be recorded in the field logbook at the time of occurrence and summarized on the Daily Activity Log (refer to SOP LRP-G-01 – Field Records). A formal nonconformance report (NCR) will be completed (refer to SOP LRP-G-01 – Field Records) and distributed as specified in the QAPP.
7.4 All records associated with the activities described in this SOP will be ultimately maintained in accordance with the Lower Passaic River Quality Management Plan (AECOM, 2009).
8.0 Personnel qualifications and training
Individuals executing these procedures will have read and be familiar with the requirements of this SOP and the corresponding LPRRP plans (e.g., HASP, QAPP, DMP, FSP). No specialized training is required; however, execution of these activities will initially be supervised by more experienced personnel.
9.0 References
AECOM 2009. Quality Management Plan, Lower Passaic River Restoration Project, CERCLA Docket No. 02-2007-2009. September 2009 or current version.
AECOM 2010. Lower Passaic River Data Management Plan. July 2010 or current version.
AECOM 2011. Lower Passaic River Restoration Project, Remedial Investigation, Health and Safety Plan Addendum. June 2011 or current version.
MPI 2005a. Lower Passaic River Restoration Project Health and Safety Plan. January 2005.
MPI 2005b. Lower Passaic River Restoration Project Health and Safety Plan Final Addendum – Sediment Coring. July 2005.
Tierra 2007. Standard Operating Procedure No. 2 (Revision 2), Containers, preservation, handling, and tracking of samples for analysis. Newark Bay Study Area Phase II RIWP, Appendix F, October, 2007.
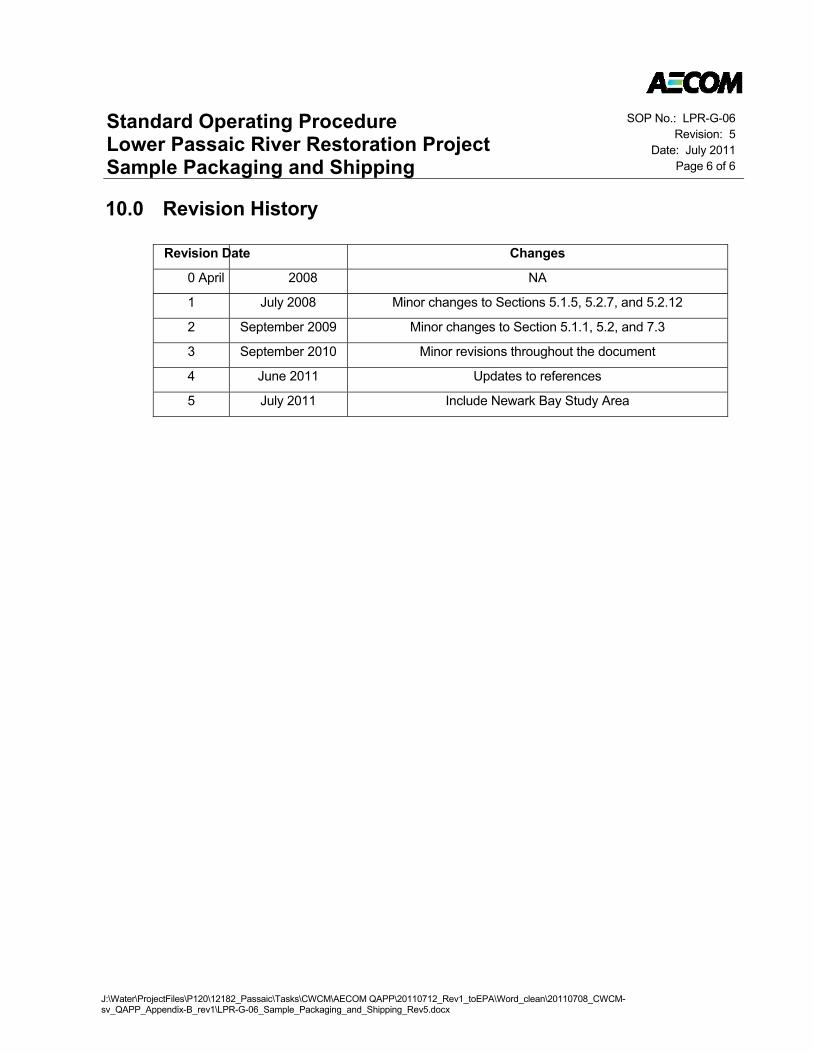
Standard Operating Procedure Lower Passaic River Restoration Project Sample Packaging and Shipping
SOP No.: LPR-G-06 Revision: 5
Date: July 2011 Page 6 of 6
J:\Water\ProjectFiles\P120\12182_Passaic\Tasks\CWCM\AECOM QAPP\20110712_Rev1_toEPA\Word_clean\20110708_CWCM-sv_QAPP_Appendix-B_rev1\LPR-G-06_Sample_Packaging_and_Shipping_Rev5.docx
10.0 Revision History
Revision Date Changes
0 April 2008 NA
1 July 2008 Minor changes to Sections 5.1.5, 5.2.7, and 5.2.12
2 September 2009 Minor changes to Section 5.1.1, 5.2, and 7.3
3 September 2010 Minor revisions throughout the document
4 June 2011 Updates to references
5 July 2011 Include Newark Bay Study Area
Quality Assurance Project Plan RI Water Column Monitoring/Small Volume Chemical Data Collection Lower Passaic River Restoration Project New Jersey
Section: Appe ndix C Revision: 2
Date: July 2012
Q:\mw2007\Projects\60145884\V110\Kris_20120622_CWCM-sv_QAPP_Rev3.docx
Appendix C Laboratory Standard Operating Procedures and Control Limits
To be provided under separate cover.
Quality Assurance Project Plan RI Water Column Monitoring/Small Volume Chemical Data Collection Lower Passaic River Restoration Project New Jersey
Section: Appe ndix C Revision: 2
Date: July 2012
Q:\mw2007\Projects\60145884\V110\Kris_20120622_CWCM-sv_QAPP_Rev3.docx
Appendix C-1 Laboratory Standard Operating Procedures
Quality Assurance Project PlanRI Water Column Monitoring/Small Volume Chemical Data CollectionLower Passaic River Restoration ProjectNew Jersey
Section: Appendix CRevision: 1
Date: August 2011
J:\Water\ProjectFiles\P120\12182_Passaic\Tasks\CWCM\AECOM QAPP\2011803_Rev2\clean\20110810_CWCM-sv_QAPP_Rev2.docx
Appendix C-2
Laboratory Control Limits