Quality Assurance in Open University - AAOU 2017
374
1
-
Upload
khangminh22 -
Category
Documents
-
view
1 -
download
0
Transcript of Quality Assurance in Open University - AAOU 2017

1
i
TABLE OF CONTENTS
QUALITY ASSURANCE IN OPEN UNIVERSITY
Page
CAPACITY BUILDING FOR DISTANCE TEACHERS THROUGH VIRTUAL
TRAINING LOUNGE: A CASE OF IGNOU
1
Moumita Das, Prabir K Biswas
QUALITY CONTROL ON FINAL EXAMS PROCESSING AT
EXAMINATION CENTRE OF UNIVERSITAS TERBUKA – INDONESIA
8
Eko Yuliastuti Endah Sulistyawati, Adhi Susilo
THE EVALUATION OF THESIS DEFENCE IMPLEMENTATION AT
GRADUATE PROGRAM OF UNIVERSITAS TERBUKA
13
Tita Rosita, Sri Lestari Pujiastuti, Fauzy Rahman Kosasih
NURTURING CREATIVITY FOR IMPROVING THE QUALITY IN OPEN
DISTANCE LEARNING SYSTEM: AN ANALYTICAL STUDY
20
Moumita Das, Prabir K Biswas
ROLE OF TEACHERS IN TECHNOLOGY-MEDIATED DISTANCE
EDUCATION
30
Deeksha Dave
QUALITY IN THE ODL SYSTEM IN INDIA: NEED FOR ADOPTING
INNOVATIVE MEASURES
39
Leena Singh, Moumita Das
INTEGRATING OER INTO AN ONLINE TUTORIAL IN ODL
SETTING: AN EXPLANATORY STUDY
50
Maximus Gorky Sembiring
UT WEBSITE USER SATISFACTION IMPROVEMENT MODEL BASED ON
PERCEIVED USEFULNESS, PERCEIVED EASE OF USE, PERCEIVED
INFORMATION QUALITY AND PERCEIVED SYSTEM QUALITY (CASE
STUDY ON PAGE WWW.MAKASSAR.UT.AC.ID)
60
Nina Utami Yanuarvah, I Made Gunawan Sanjaya, Andi Sylvana
QUALITY OF LEARNER SUPPORT SERVICE AND DISTANCE LEARNERS’
PERCEPTIONS: A CASE STUDY
67
Sutapa Bose
FACTORS AFFECTING STUDENTS’ RE-ENROLLMENT: A MULTIPLE
CASE STUDY IN THREE REGIONAL OFFICES OF UNIVERSITAS
TERBUKA
75
Sugilar
IMPLEMENTATION OF THE BENEFIT MODEL (USABILITY) IN
IMPROVING USER SATISFACTION WITH ACADEMIC INFORMATION
SYSTEM SERVICE AT UNIVERSITAS TERBUKA
82

ii
I Made Gunawan Sanjaya, Andi Sylvana, Nina Utami Y.S
STUDENT SATISFACTION ANALYSIS OF ONLINE TUTORIAL THROUGH
INFORMATION SYSTEM QUALITY AND PERSONAL SERVICES OF
ONLINE TUTORIAL AT UNIVERSITAS TERBUKA
88
Andi Sylvana, Murtiadi Awaluddin
OPTIMIZATION OF ONLINE TUTOR SATISFACTION THROUGH
IMPROVEMENT OF QUALITY SYSTEMS, INFORMATION QUALITY AND
IMPROVEMENT OF CONTACT PERSONNEL SERVICES AT
UNIVERSITAS TERBUKA
95
Andi Sylvana, Murtiadi Awaluddin
STOU STUDENTS’ LEARNING OUTCOMES AND COURSE
SATISFACTION
102
Chantana Thongprayoon
ENHANCING STUDENT INVOLVEMENT THROUGH SUPPORT
SERVICES OFFERED: CASE OF DISTANCE EDUCATION IN SRI LANKA
111
Hansani Chathurika Dassanayake, B Nishantha, Asanka
Senevirathne
AN EXPLORATION OF SELF-REGULATED LEARNING PERFORMANCE
FOR STUDENTS OF DISTANCE EDUCATION
125
Sunu Dwi Antoro, Diah Astuti, Yugara Pamekas
RESEARCH ON THE STATUS QUO OF BUILDING OF LEARNING-GUIDE
TEACHER TEAM--EMPIRICAL ANALYSIS BASED ON THE OPEN
UNIVERSITY OF CHINA
134
Xiaoqing Jiang
RESEARCH ON THE MODE OF MOBILE LEARNING IN DISTANCE
EDUCATION
144
Zhixiang Li, Chen-ning
ANTECEDENTS AND OUTCOMES OF SERVICE RECOVERY
SATISFACTION:PERSPECTIVE OF OPEN DISTANCE LEARNING (ODL) IN
MALAYSIA
149
Mohd Rushidi bin Mohd Amin, Abdul Rahim bin Mohamed
Amin, Shishi Kumar A/L Piaralal
EXPLORING THE EFFECTIVENESS OF ACCOUNTING PRACTICUM IN
UNIVERTAS TERBUKA
171
Ali Muktiyanto Rini Dwiyani Hadiwidjaja, Noorina Hartati, Irma
ONLINE ENGLISH LEARNING – THE MIXED PERCEPTIONS OF LERNERS
AND THEIR SUGGESTIONS FOR ONLINE TRAINING QUALITY
ASSURANCE AT HCMC OPEN UNIVERSITY
183
Nguyen Chau Bich Tuyen
FACTORS HINDERING STUDENTS’ CHOOSING THE DISTANCE
LEARNING BY ONLINE METHOD: CASE STUDY OF HO CHI MINH CITY
OPEN UNIVERSITY
194

iii
Phuoc Kim Nguyen, Huynh Hanh Phuc
QUALITY ASSURANCE IN COURSES WITH PRACTICUM: HOW AND
WHY UNIVERSITAS TERBUKA DOES IT
202
Rinda Noviyanti
DEVELOPING PROFESSIONAL LEARNING COMMUNITY THROUGH
BLENDED INSTITUTION BASED COLLABORATIVE PROFESSIONAL
DEVELOPMENT MODEL: AN INNOVATIVE PROJECT.
208
Saroj Pandey
ANALYZING THE CASES OF UT STUDENTS’ FINAL EXAMINATION
RESULT
216
Dem Vi Sara, Lina Asnamawati
QUALITY ASSURANCE SYSTEM IN OPEN UNIVERSITY: A CASE STUDY
OF THE SCORING GUIDELINES AT MATHEMATHICS
DEPARTMENT
225
Tutisiana Silawati, Zulmahdi Dailami, Hasoloan Siregar
EMPLOYERS’ PERCEPTION ON THE IMPORTANCE AND THE
SATISFACTION LEVEL OF IDENTIFIED SET OF SKILLS AMONG OPEN
UNIVERSITY UNDERGRADUATES
231
Sumalee Sungsri, Thirumeni T Subramaniam, Isti Rokhiyah,
Hoang Tuyet Minh
QUALITY ASSURANCE IN OPEN EDUCATION A CASE STUDY AT HANOI
OPEN UNIVERSITY, VIETNAM
240
Nguyen Thi Thuy Hong, Nguyen Viet Hung, Tran Thien Hoang
E-LEARNING MATERIALS DEVELOPMENT AND PROVISION FOR
LEARNERS AT HANOI OPEN UNIVERSITY (HOU)
245
Thi Lan Thu Tran
PARTICIPATION PATTERN AND SATISFACTION LEVEL OF ACADEMIC
SERVICES AT DEPARTMENT OF BIOLOGY UNIVERSITAS TERBUKA
251
Sri Utami, Inggit Winarni, Budi Prasetyo, Susi Sulistiana, Sri
Kurniati Handayani, Deddy Ahmad Suhardi
DATA MINING TECHNIQUES TO ANALYZE STUDENTS’ ACCESS
PATTERNS AND PERFORMANCE IN AN ONLINE LEARNING
ENVIRONMENT
260
Myra Collado Almodiel
WORKING SATISFACTION INFLUENCE ON PERFORMANCE OF THE
STAFF FROM UNIVERSITAS TERBUKA DISTANCE LEARNING
PROGRAM UNIT (UPBJJ-UT) MAKASSAR BY WORKING MOTIVATION
270
Muhammad Alwi, Risnashari
COMPULSARY FACE-TO-FACE TUTORIAL IN DISTANCE EDUCATION
SYSTEM AND ITS QUALITY ASSURANCE
277
Sri Yuniati Putri Koes Hardini, Durri Andriani

iv
GROUP REPORTING AS A TOOL TO ENHANCE THE
QUALITY OF COURSES: THE RESPONSE OF DATABASE
STUDENTS TO ONLINE COOPERATIVE LEARNING
Mari Anjeli Lubrica Crisanto
SOCIAL PRACTICES OF PLAGIARISM IN OPEN
UNIVERSITY STUDENTS IN MAKING ONLINE TUTORIAL
TASK
Pardamean Daulay, Sutini, Nur Afni Khafsoh
STUDENT PERSISTENCE IN OPEN AND DISTANCE
LEARNING: A CASE IN HONG KONG
Oliver Tat-Sheung Au, K C Li, Billy Wong
RESEARCH ON THE MODE OF MOBILE LEARNING
IN DISTANCE EDUCATION
Zhixiang Li, Chen Ning
CONSTRUCTION OF THE VIRTUAL-ACTUAL
COMBINATION PRACTICAL TEACHING SYSTEM
FOR OPEN EDUCATION
Chenghui Han
THE PRACTICE OF INTERNAL QUALITY AUDIT AT A
DISTANCE HIGHER EDUCATION: AN EXAMPLE OF
UNIVERSITAS TERBUKA, INDONESIA
Basuki Hardjojo, Deetje Sunarsih, Ojat Darojat
IMPLEMENTATION OF PROBLEM-BASED LEARNING
METHOD IN LEARNING PROCESS OF URBAN
PLANNING STUDIO IN URBAN AND REGIONAL
PLANNING STUDY PROGRAM
Tina Ratnawati, Vita Elysia
THE EFFECT OF STUDENTS' LEARNING
INDEPENDENCE AND COGNITIVE LEARNING STYLE
ONnguyen ATOMIC PHYSICS PEFI4421 LEARNING
ACHIEVEMENT
Prayekti
ANALYSIS OF SERVICE QUALITY, COSTUMER
SATISFACTION AND STUDENT LOYALTY AT MAKASSAR
REGIONAL OFFICE UNIVERSITAS TERBUKA INDONESIA
Jalil
286 296
304
314
320
323
341 348
357

1
CAPACITY BUILDING FOR DISTANCE TEACHERS THROUGH VIRTUAL TRAINING LOUNGE: A CASE OF IGNOU
Moumita Das, 1 Prabir Kr. Biswas 2
1 Assistant Director, NCIDE, IGNOU (INDIA) 2 Professor and Director, STRIDE, IGNOU (INDIA)
Abstract
The National Centre for Innovation in Distance Education (NCIDE) at the Indira Gandhi National Open University (IGNOU), India, nurtures creativity and innovation among its functionaries through various capacity-building measures. The Information and Communication Technology (ICT) tools are increasingly being used in teaching-learning. Taking this trend forward towards training, NCIDE has designed and developed a unique online platform named the Virtual Training Lounge (VTL) to impart online training to the ODL functionaries. The VTL is accessible anytime from anywhere. Its key features include the provision of collaborative tools, such as discussion board, chat; flexible content uploading; and interactive content generation. This online platform not only provides synchronous training, but also sustains the learning experience of the trainees asynchronously. The NCIDE has conducted several trainings using the VTL with satisfactory outcomes. In this paper one such training is being discussed, which employed the VTL during the workshop. The objective of the paper is to study the need and importance of using VTL as a tool in capacity building of the distance teachers. The feedback from the trainees about the VTL indicates the importance of this ICT training tool in the capacity building of the distance teachers. With further developments in the platform based on the suggestions of the trainees, many more such workshops may be conducted in the future. Keywords: Virtual Training, capacity building, creativity, innovation in ODL system, ICT, training tool
1. INTRODUCTION
Capacity building or capacity development of the functionaries of the Open and Distance Learning (ODL) System is important as it improves, strengthens, creates, adapts, maintains and retains the knowledge and skills of the functionaries, which in turn enhances the quality of the system. Training is one component of capacity building. With the increasing use of the Information and Communication Technology (ICT) tools in teaching-learning, e-learning has gained impetus. The training of the teachers have also being carried out using e-learning tools, such as customized Moodle, in some educational institutions and universities in the world [1], [2], [3]. The National Centre for Innovation in Distance Education (NCIDE) at the Indira Gandhi National Open University (IGNOU) is a facility for promoting, supporting, re-engineering and disseminating innovations in ODL system [4]. One of the activities of the National Centre for Innovation in Distance Education (NCIDE) is to nurture creativity and innovation among the various functionaries of the ODL system. The NCIDE carries this out through various capacity-building measures from time to time, organizing training workshop on creativity and innovation is one of them. NCIDE developed a web-based platform called the Virtual Training Lounge (VTL) to provide training and capacity building of the ODL functionaries. It has been used from time to time to train the teachers of IGNOU. It was recently used by the Staff Training Research Institute in Distance Education (STRIDE), IGNOU in its Workshop on Research Methodology. This paper presents the case study of this particular workshop to analyze the effectiveness and quality of the VTL as an online training tool for the distance teachers.
2. BACKGROUND
Training may be defined as the systematic application of formal processes to impart knowledge and help people to acquire skills necessary for them to perform their jobs satisfactorily (Armstrong, 1984) [5]. For a successful training outcome, several factors are important, such as the design of the training

2
programme including the pedagogy and course content, the trainers, the infrastructural support and the environment. The learning environment plays a vital role in the learning process. A training environment that supports continuous sharing of information and opinion is conducive for learning (Dhal, 2014) [6]. Indeed, researchers have found that supportive learning environment encourage the learners/trainees to be involved in interaction, which facilitate their learning experience that gets transferred to meaningful knowledge and practical skills and which ultimately improves workplace performance (Dobos, 2015) [7]. With the advent of the information and communication technology (ICT) tools, organizations are increasingly using the e-learning tools for conducting training programmes. The e-learning tools have many advantages both from the perspectives of the learners [8] and the teachers/trainers. Some of the main advantages for the learners are:
1. Learners can choose their own place of study. 2. Learners can choose their own time of study. 3. Learners can choose their own pace of study. 4. Learners can learn through their preferred medium (text, audio or visual). 5. Learners can express their own views without inhibition. 6. Learners can interact with peer groups without inhibition. 7. Learners can get the opportunity to interact with their teachers/trainers anytime.
E-learning offers the following main advantages for the teachers and trainers:
1. Teachers/trainers can select and present content appropriate for the learners/ trainees. 2. Teachers/trainers can take questions and provide instant feedback to all learners/trainees in a
short period of time. 3. Teachers/trainers can interact with individual learners/trainees both synchronously and
asynchronously. 4. Teachers/trainers can monitor the learning behavior of the learners/trainees and provide
personalized individual mentoring. 5. Teachers can evaluate the learners/trainees over a period of time, which might be required for
summative assessment.
In sum, e-learning ICT tools have the capability of providing an environment that could address many of the learning problems faced by the trainees as well as the teaching problems faced by the trainers. Keeping these factors in mind, the VTL was designed and developed by the NCIDE (IGNOU Profile, 2015) [9]. The VTL is designed to provide not only synchronous training, but also to sustain the learning experience of the trainees online (Figure 1). The VTL can also be accessed through personal mobile phones. The VTL is designed to facilitate the trainees by providing:
1. quick access, 2. quick upload at all times, where documents in Word, PDF, PPT, photos etc., can be
uploaded easily, and 3. quick response.
The ease of access to the VTL anytime from anywhere makes it an ideal platform for training and its sustainability. Some of its key features are:
1. Access anytime, anywhere through a web based platform. 2. Asynchronous and synchronous collaborative tools, such as discussion board, chat, wikis,
blogs etc. 3. Flexible content uploading. 4. WYSIWYG editor for interactive content generation

3
Figure 1. A Screenshot of the Virtual Training Lounge
3. OBJECTIVES
The objectives of this study are to: a. elucidate the need of the Virtual Training Lounge for training purposes; b. describe the facilities available in VTL; and c. explain the effectiveness of VTL as a training tool in capacity development of the distance
teachers.
4. RESEARCH METHODOLOGY
4.1 Context of the Study
This case study pertains to the seven-day workshop on “Creativity and Innovation in ODL” conducted by NCIDE, IGNOU, New Delhi, India [10]. This seven day-workshop was essentially a One-Credit workshop of 30 hours, which was conducted both in face to face and virtual mode in the Virtual Training Lounge, an online platform developed by NCIDE for online training (http://vtl.ignouonline.ac.in/vtl/). A gap of five days was kept between the first and the second day of the workshop to provide the participants enough time to think and reflect about the tasks assigned to them on the first day, thus enabling them to incubate their ideas. The face to face interaction and group activities were for two full days and two half days comprising a total of about 14 hours. The participants worked online in the Virtual Training Lounge for the remaining 16 hours.
4.2 Research Design
The qualitative method of intrinsic and exploratory case study was employed. Case studies are complex examples that provide an insight into the context of a problem as well as illustrate the main point [11]. The intrinsic case study is undertaken to gain a deeper understanding of the particular case [12]. In this study it was expected that the case would facilitate understanding the usefulness of the Virtual Training Lounge for training distance teachers.
4.3 Participants
There were 14 participants in the workshop, who are the subjects of this study. Out of the 14 participants, eleven were female and three were male. Of the 14 participants, 12 responded to the questionnaire. These participants were the teachers from 8 Schools of Studies of IGNOU. These Schools of Studies were: School of Foreign Languages, School of Management, School of Journalism and New Media Studies, School of Interdisciplinary and Trans Disciplinary Studies, School of Agriculture, School of Health Sciences, School of Sciences, and School of Social Work.

4
4.4 Instruments
The data collection was by the survey method using a questionnaire. The questionnaire had both closed and open ended questions, which facilitated the collection of qualitative and quantitative data. The personal observations by the participants during the workshop were also included in the study.
4.5 Data Analysis
The qualitative data was statistically analyzed and expressed as percentage.
4.6 Procedure of the Study
The study was carried out in NCIDE, IGNOU. The workshop studied was organised for seven days. On the first day participants were asked to talk about their creative contributions in the ODL system. Thereafter a few tasks were assigned to them and they were asked to think about those tasks and discuss with other participants and mentors in the Virtual Training Lounge. In the next six days, the participants learnt about various creative strategies and discussed, generated, analysed and evaluated many ideas on developing a creative self working material. The term Self Working Material was coined by Professor Prabir Kumar Biswas (an author of this paper) to define the study /learning material that puts emphasis on the psychomotor domain. The participants had continued using the Virtual Training Lounge from the first to the last day. They had been using it extensively to post their ideas and discuss them. On the seventh day the participants were asked to fill in the questionnaire.
5. RESULTS
Out of 14 participants who attended the workshop, only 12 responded to a questionnaire. The results are summarised below:
1. Timely information about workshop events: All the participants said that they received the relevant invitations, intimations and information related to the workshop events on time.
2. Methodology of the workshop and resource person: The participants were satisfied with the format and methodology of the workshop with about 58 % saying that the ODL format, duration and content were useful to them. More than 75 % of the participants were highly satisfied with the resource person of the workshop. About 68 % said that the workshop was thought provoking and would help them in their future activities.
3. Domains: All the participants opined that the workshop catered to the cognitive, affective and psychomotor skills.
4. Virtual Training Lounge: The relevant screenshots of the VTL are provided in Figs. 2 and 3 below. The participants gave the following feedback regarding the VTL:
i. The participants (92%) were satisfied with the VTL saying that was accessible in various devices.
ii. About 75% of the participants said that the VTL was accessible at anytime iii. A majority of the participants (92%) said that VTL was accessible from anywhere. iv. A majority (83 %) said it enabled them to post their comments. v. The design was not easy to navigate for 42 % of the participants. vi. About 42% of the participants said they were not able to access the resources posted in VTL. vii. The participants (75%) suggested that the VTL needs to be improved further. viii. They have suggested measures to improve VTL, such as
a. addition of synchronous audio interaction, b. allowing increase in file size for uploading in VTL, c. VTL should be made more navigable, so that new posts could be located.

5
Figure 2. A Screenshot of the Discussion Forum of the Virtual Training Lounge showing the initial phase of use.
5. Venue: The participants were satisfied with the venue saying the ambience (75%), sitting arrangements (83%), and support of NCIDE staff (67%) were good. However the food and beverages (42%) needed to be improved.
6. Overall rating: The workshop was rated very good by 42 % and good by 42 % of the participants.
7. Any other comments/suggestions: In addition to the above, the participants gave the following feedback:
1. A group of participants from the same discipline should come together for developing the Self working material (SWM). Workshops specifically designed for each discipline should be organized on creativity and innovations for developing SWM.
2. More such workshops needed periodically to check individual status and their updation.
3. I want to place on record my deep appreciation for the manner in which the workshop was conducted.
4. A participant summed up the workshop through an email in the following words:
“The lively discussions, integrating and collating the ideas on broad spectrum of topics ranging from effective utilization of access devices, converting self- learning material to self-working material, integrating media for better teaching learning in ODL were very stimulating. The workshop has given us a platform to foster an environment that nurtures creativity and innovation by focusing on creative solutions on distance education. We had deliberation on several advanced topics on design, implementation, and novel approaches on distance learning tools, communication mechanisms, new educational technologies, distance learning, serious game, simulation, and the arts, and so on.”

6
Figure 3. A Screenshot of the Discussion Forum of the Virtual Training Lounge showing the responses of the participants.
6. DISCUSSION
The results indicate that the Virtual Training Lounge has the potential to be an effective tool for training the distance education teachers. The familiar philosophy of distance education, namely accessibility anytime anywhere is being employed in the VTL and it was helpful to the distance learning teachers. Further, the VTL could be accessed through various devices, such as laptops, tablets and mobiles, making it extremely flexible. This openness and flexibility of the VTL was found to be satisfactory by the participants. The participants were able to upload the content they had created during the workshop satisfactorily. They could access that content. They were, additionally, able to access the workshop content uploaded by the resource persons and the posts in the discussion forum easily. The participants were also able to reply to the posts in the discussion forum easily.
The participants were able to log in to the Virtual Training Lounge asynchronously at their own convenient time and explore the platform and post their content or comments. They interacted with each other (peer to peer) in the individual discussion forums associated with each session of the workshop. The participants also posted questions for the mentors/resource persons (the authors) and received the replies to their queries asynchronously. These interactions helped them to understand the concepts better, as per the feedback received from the participants.
However, the some participants were little bit unsatisfied with the design of the Virtual Training Lounge. The navigation of the platform was found to be difficult by some of them. This calls for an improvement in the design aspect of the Virtual Training Lounge, which would facilitate easy navigation and help locate the posts, thereby enhancing user access. Among the suggestions to improve the Virtual Training Lounge, the participants recommended the inclusion of synchronous audio interaction and allowing bigger files to be uploaded. It appears that the participants are used to the social forums and expect a similar ease of use. Indeed it is possible to implement these features in the Virtual Training lounge and then used for training purposes.

7
The participants suggested that more such workshops using the Virtual Training Lounge may be conducted in the future as it facilitates providing individual attention to them that helps enhance their learning process.
7. CONCLUSION
The Virtual Training Lounge is a novel training tool in the ODL system that can be used for capacity development the distance teachers. It has been found highly useful by the participants in this case study. This tool can be used anytime, anywhere on any device. Thus, the feasibility of this tool has been demonstrated in this case study. Since the software is open-source, it is cost effective. Further, the use of Virtual Training Lounge is expected to decrease the workshop expenses by reducing face to face interaction and the associated costs. As suggested by the participants, some improvements to this innovative training tool needs to be made for its complete functionality. The Virtual Training Lounge can be scaled up to be used in many more workshops by the ODL system in the future.
REFERENCES
[1] Cavalli, E., and Lorenzi, A. (2002). Teacher training through eLearning technology.
http://citeseerx.ist.psu.edu/viewdoc/download?doi=10.1.1.583.3222&rep=rep1&type=pdf
[2] Woodcock, S., Sisco, A., and Eady M. (2015). The Learning Experience: Training Teachers Using Online Synchronous Environments. Journal of Educational Research and Practice, 5(1), pp. 21–34.
[3] European Training Foundation. (2009). E-Learning for Teacher Training: from Design to Implementation, Handbook for Practitioners. http://www.etf.europa.eu/webatt.nsf/0/C12578310056925BC12577750047E991/$file/NOTE87ZHCL.pdf
[4] IGNOU. (2017).NCIDE. http://www.ignou.ac.in/ignou/aboutignou/icc/ncide/introduction
[5] Armstrong, M. (2012). A Handbook of Human Resource Management Practice. United Kingdom: Kogan Page.
[6] Dhal, M. (2014). A Qualitative Study of Training Effectiveness. Working Paper. IIM Kozhikode. https://iimk.ac.in/websiteadmin/FacultyPublications/WorkingPapers/149abs.pdf?t=31
[7] Dobos, A. (2015). The role of learning environments in civil service professional development training. Procedia - Social and Behavioral Sciences, (197), pp. 565 – 569.
[8] O’Donoghue, J. Singh, G., Greene, C. (2004). A comparison of the advantages and disadvantages of IT based education and the implications upon students. Interactive Educational Multimedia, (9), pp. 63-76.
[9] IGNOU. (2015). IGNOU Profile, New Delhi : IGNOU.
[10] IGNOU. (2016). .IGNOU Profile, New Delhi : IGNOU , p. 64.
[11] Fry, H., Ketteridge, S., and Marshall, S. (1999). A Handbook for Teaching and Learning in Higher Education, Kogan Page, Glasgow, p. 408.
[12] Stake, R.E. (1995). The Art of Case Study Research, California: Sage.

8
QUALITY CONTROL ON FINAL EXAMS PROCESSING AT EXAMINATION CENTRE OF UNIVERSITAS TERBUKA – INDONES IA
Eko Yuliastuti E.S. 1) & Adhi Susilo 2)
1&2) Universitas Terbuka (INDONESIA)
ABSTRACT
One indicator to measure competency of learning out comes from student of Universitas Terbuka (UT) is the final exams(FE). As part of the student learning system, the FE is the only process that can be fully controlled by the UT. Therefore, UT performs quality control to maintain the credibility and validity of the results of FE. One attempt to maintain the validity of the results of FE is controlling the processing of examination results in UT Examination Centre. There are three types of exam results at UT, the exam answer sheet (EAS), exam answers book(EAB), and exam assessment sheet. This article will discuss quality control on EAS processing. Quality control on EAS processing consists on many steps: EAS admission, examination and determination of the validity of rules and sanction violations of test administration, scanning, matching examinees student data and personal data, giving sanction violations of rules and administration, scoring, and grading.During the semester exam 2016. 2, EAS which were process data UT Examination Centre were amounted to 1.505.220 pieces. With the number of permanent employees 15 people, each semester, the Examination Center recruits temporary labors to process the exam results from 739 test points. To get qualified temporary labor, then Examination Center must do the selection. For selected temporary labors, trainings were conducted in order to work according the required qualifications from UT.Providing quality control of test results processing and temporary labor recruitment process, have be enable to improve the performance of the Examination Center. It can be seen by the exam results available in earlier stage and the decreasing of problems related to the processing of exam results each semester.
Keywords: Quality control of processing exam results, exam answer sheet, Examination Center, temporary labors.
1 INTRODUCTION
Universitas (UT) is a university that uses open and distance learning systems. Teaching materials for students are delivered through various media, ranging from printed materials to digital teaching materials. The learning process for students is done freely with the help of learning through face-to-face tutorials, online tutorials, and practice / practicum whose implementation is controlled by academic staff at the UT. At the end of each semester, students' learning achievement is measured through the final exam of the semester (FE) for each course. Each UT semester holds 2 FEs, namely FE for Faculty of Economics (FEc), Faculty of Law, Social and Political Sciences (FLSPS), Faculty of Mathematics and Natural Sciences (FMNS), and Faculty of Teacher Training and Education (FOE) and FE for FOE Program Primary School Teacher Education (PSTE) and Teacher Education Early Childhood Education (TEECE).
FE are implemented throughout the Regional Offices (RO). UT has 39 ROs serving across Indonesia and one Overseas Service Unit. Materials for FE in the form of supporting materials and manuscripts sent from the Central UT to all RO and test places abroad. The test script is destroyed at the local exam/ test location / RO site. The results of FE in the form of test answer sheets (EAS) and the assessment format along with the supporting test result files are sent directly to the Test Center at the Central UT. While the test results in the form of test answers (EAB) sent to RO Sentra to be corrected by the examiner. EAB scores obtained from inspectors at RO Sentra are sent to Central Testing Center at UT Center for grading process.
The FE process is done in the Field of Exam Resulting Processing, Testing Center, UT Center. The processing time of the FE results to yield the grade in the Testing Center is determined for 7 weeks for FE results from FEc, FLSPS, FMNS, and FOE and FOE Program PSTE and TEECE.While the process

9
time of FE FOE Program PSTE and TEECE is determined for 9 weeks. The total score processed in each semester of 2015- 2016 are listed in Table 1. The FE results process must produce valid, reliable, and in accordance with the standards specified by UT. Bearing in mind that value process should be done correctly according to the standards specified in UT. Quality dick is done at every stage of the process of examination result since RO and in Processing Field of Exam Result, Test Center, UT Center. In this paper will be discussed about quality control performed on the processing of exam results in the Field of Exam Resulting Processing, Testing Center, UT Center in an attempt to generate valid and standardized value.
Table 1. Number of FE Score Value Processed in 2015-2016
Short Number FE Period
FEc, FLSPS, FMNS, FOE
FOE Program PSTE and TEEC Amount
(score) (score) (score)
1. 2015.1 466.550 1.077.467 1.544.017
2. 2015.2 472.134 1.043.171 1.515.305
3. 2016.1 497.609 976.340 1.473.949
4. 2016.2 562.914 942.306 1.505.220
Distance education is teaching and planned learning in which teaching normally occurs in a different place from learning, requiring communication through technologies as well as special institutional organization (Moore and Kearsley, 2012). The existence of distance between student and learning source hence need media and technology to assist the learning process.
According Moore and Kearsley (2012), there are 4 kinds of media that can be used to assist student learning process, that is:
A. Print media
B. The image media (silent and moving)
C. Voice media
D. Media artifacts.
Instructional design should consider all aspect of instructional environment, following a well-organized procedure that provides guidance to even the novice distance instructor. The learner (Simonson etc., 2012) is the learner of the distant learner.
1.1 Final Exam of the Semester at UT
To measure the level of achievement of student learning outcomes in the courses followed, UT conducts final exam (FE) in each semester. FE results in the form of value is symbolize the success rate of students mastering a teaching material. Simonson et al (2012), states that assessment is define as a process of measuring, documentating, and intrepreting behaviors that demonstrate learning. Assessment is the means of measuring learning gains and can be used to improve the teaching-learning process in distance education setting as well as more traditional environments.
1.2 Processing of FE Results at UT
Processing of FE results in Processing Field of Testing Result, Testing Center, UT Center begins with acceptance of FE results from RO. For test answer sheets (EAS) and test scoring formats are sent directly from RO, while for exam book (EAB) sent from RO Sentra.

10
The FE results are sent to the Field of Exam Resulting Processing through Post Office and Giro, delivered directly by RO staff or delivered by courier. Upon receipt of FE results, the number of packs (sacks) is matched with mailing letters from the Post Office and Giro / RO / courier staff. If the number of sacks is in accordance with the delivery letter then the exam results will be checked the number of boxes, the number of envelopes in the acceptance of FE results.
The next stage is bacthing numbering on FE results based on test location per exam spot per RO on a number of FE envelope results. After the batching process, the next step is to check the validity of FE results. In this process, the EAS / assessment format is matched with the student's personal data (name, student identification number, date of birth, course code, signature graduation on Student Presentation Checklist with EAS / EAB signature). If EAS is in accordance with the student's personal data, then the EAS is scann. EAS scann results will be matched with personal data on student registration data base, if there is discrepancy and after examined correctly then editing and updating personal data of students.
The execution of the punishment shall be conducted if in the Minutes of Examination Execution there is a record of violation of the disciplinary examination or on the monitoring officer's report on the execution of the examination there is a record of violation of the discipline of examination. In addition, also applied punishment pattern answers for students who have the same pattern of answers on the answer about the wrong. Scoring is done based on the key answer questions from the Field of Test Examination and Testing Technology Development at the Testing Center. After the supporting value is declared complete by the Administrative and Academic Bureau of Students, then grading the value of FE. In UT there are 5 grade values, namely A, B, C, D, and E. These sequential processes affect each other. There is a potential for significant errors during the production process consisting of sequential stages, each of which is heavily dependent on the previous stage. Such processes can be affected critically by material variations, weight, time, temperature, or other parameters, regardless of the task. Choice between alternatives can be crucial to the success of the entire process (Allalouf, 2007). Therefore the process of examination results should be controlled so that the results are vaid and standardized.
1.3 Announcement of FE Results to UT Students
The result of FE is the result of the assessment of student learning process in certain subject. The FE results are submitted to students in grade form on the exam list (EL) format per semester. Student grades are sent to RO through student records system (SRS) application to RO and UT website. Students will get EL from RO. In addition, students can access the UT website to see its grade.
1.4 Research Questions / Objectives
The purpose of this study was to know the suitability of quality control on the processing of FE results into grades in the Field of Examination of Test Results, Testing Center with UT standard. It also studies the compatibility of recording with quality controls performed.
2 METHOD The method in this research is observation study. The objective of this observational study is to determine the level of conformity of practice with the quality control standards determined by UT, especially during the final exam period 2015.1, 2015.2, 2016.1 and 2016.2.
Variables of conformity of quality control standard on FE result process, subject to quality control standard on process of FE grade, and achievement of target quality of processing result of FE seen from scope as follows.
1. This research is conducted for FE results in:
A. Faculty of Economic
C. Faculty of Law, Social and Political Sciences.
D. Faculty of Mathematics and Natural Sciences (FMNS),
E. Faculty of Teacher Training and Education and

11
F. Faculty of Education (FOE) for Program Primary School Teacher Education (PSTE) and Teacher Education Early Childhood Education (TEECE).
The exam results are combined for FEc, FLSPS, FMNS, FOE at each observed FE period. While for FE results FOE for Program Primary School Teacher Education (PSTE) and Teacher Education Early Childhood Education (TEECE)are incorporated separately in each FE period observed based on separate test times with FEc, FLSPS, FMNS, FOE.
2. Time of sampling during final exam period
A. 2015.1
B. 2015.2
C. 2016.1
D. 2016.2
3. Quality objectives achieved during the FE period
A. 2015.1
B. 2015.2
C. 2016.1
D. 2016.2
3 RESULT AND DISCUSSION
3.1. Amount of Value Processed
The number of exam results processed in the Field of Examination of Test Results, Testing Centers from the FE period 2015.1, 2015.2, 2016.1 and 2016.2 are listed in Table 2.
Table 2.Number of FE Value Processed in 2015-2016
Short number
FE period
FEc, FLSPS, FMNS, FOE
FOE Program PSTE and TEEC Amount
(score) (grade) (score) (grade) (score)
1. 2015.1 466.550 460.740 1.077.467 965 371 1.544.017
2. 2015.2 472.134 469.842 1.043.171 913.716 1.515.305
3. 2016.1 498.095 486.602 976.340 871.148 1.473.949
4. 2016.2 562.914 556.701 942.306 900.770 1.505.220
3.2 Tools Used for Quality Control
Testing Center has been certified ISO 9001: 2015. Guidelines for Quality Assurance System used are JKOP UJ04 dated June 25, 2013. In Guidelines of Quality Assurance System contains Testing Procedure of Test Result, 22 work instructions, and 19 recordings used as quality control on FE result process in Processing Field of Test Result during FE period 2015.1, 2015.2, 2016.1 and 2016.2.
3.3 The Quality of Exam Results to be Achieved unde r UT Conditions
The quality objective of processing the exam results to achieve ISO 9001: 2015 certification is 95% of the value processed correctly. This value is determined based on the number of scores that can be made grade. Not all processed scores can be made grade because of incomplete administrative

12
requirements, incomplete final score components, and unregistered course registration data. The achievement of the quality objectives in each semester is shown in Table 3.
3.4 Achievement of Processing Quality of FE Results
The processing of FE results in the semester 2015.1, 2015.2, 2016.1 and 2016.2 are listed in Table 3.
Table 3. Achievements of Quality Goals for Processing of FE Results in the Semester 2015.1, 2015.2, 2016.1 and 2016.2
Short number
FE Period
FEc, FLSPS,FMNS, FOE FOE Program PSTE and TEEC
(%) (%)
1. 2015.1 98,8 89,6
2. 2015.2 99,5 87,6
3. 2016.1 97,7 89,2
4. 2016.2 98,7 95,6
4 CONCLUSION AND RECOMMENDATION
Based on observations on the process of FE results semester 2015.1, 2015.2, 2016.1, and 2016.2 in the Field of Processing Results Exam, Testing Center concluded that:
1. The process of FE results in the semester 2015.1, 2015.2, 2016.1, and 2016.2 has followed the Guidelines of Quality Assurance System in ISO 9001: 2015
2. Quality targets achieved in accordance with the set of 2015.1, 2015.2, 2016.1 for FE FE, FHISIP, FMIPA and FKIP and FE 2016.2 for FE FKIP PGSD and PGPAUD results.
3. Less than achieved Quality Goals set for semester 2015.1, 2015.2, 2016.1 for results for FE results FKIP PGSD and PGPAUD
4. Factors outside the process of examination results affect the results of grading the value of FE results.
Based on the results of this study, it is recommended that UT to do:
1. Providing trainings for the execution committee for FE exams to be more orderly so that the exam administration case can be avoided.
2. The entry process of supporting value scores is more accurate and timely.
3. The process of validation of the registration of subjects from students on time.
REFERENCES
Allalouf, A. (2007). Quality control procedures in the scoring, equating, and Reporting of test scores. Educational Measurement: Issues and Practice Volume 26, Issue 1Spring 2007 Pages 36-46.
Moore, M.G. & Kearsley, G. (2012). Distance education: a system view of online learning, third edition. Davis Drive, Belmont: Wadsworth.
Simonson, M., Smaldino, S., Albright, M., & Zvacek, S., (2012). Teaching and learning at a distance, fifth edition.Boston: Pearson Education, Inc.

13
THE EVALUATION OF THESIS DEFENCE IMPLEMENTATION AT GRADUATE PROGRAM OF UNIVERSITAS TERBUKA
Tita Rosita 1, Sri Lestari Pujiastuti 2, Fauzy Rahman Kosasih 3
1,2,3Universitas Terbuka (INDONESIA)
Abstract
In terms of the implementation of learning process, graduate program of Universitas Terbuka (UT) has similarities with other universities. For example, each graduate program student is required to take a number of course credits per semester that have been determined by each study program. The final stage of the study completion for graduate program students is thesis defence. Thesis defence is an academic requirement for a master candidate at the end of the program. Thesis defence is a direct communication activity between the examiner committee consisting of five individuals: chair and secretary of the committee from UT’s graduate program, expert examiner (external), first examiner (first supervisor) and second examiner (second supervisor) and the master candidate to defend his/her thesis. If the master candidate succeeds in maintaining his/her thesis in front of the examiner committee and is declared to be graduated, then he/she will be eligible to use academic title. This study was aimed at evaluating the implementation of thesis defence at UT’s graduate program. Descriptive evaluative method with qualitative approach was employed to conduct this study. The results show that according to the head of UT’s distance learning program unit (UPBJJ-UT), supervisors, expert examiner, and master candidates, the implementation of thesis defence at UT’s graduate program has been run effectively. However, the results also show that there are things that have not worked effectively, including the directions given to the candidate to revise his/her thesis (introduction, literature review, methods, results, conclusions, bibliography).
Keywords: evaluation, thesis defence, UT’s graduate program
1 INTRODUCTION In terms of the implementation of learning process, graduate program of Universitas Terbuka (UT) has similarities with other universities. For example, each regular graduate program student is required to: take a number of course credits per semester that have been determined by each study program, actively participate in 8 (eight) online tutorial initiations and 4 (four) face-to-face tutorial meetings, do the tasks, and do the final examination each semester. For non-regular students, they do not have the face to face tutorial, which means that the whole learning process is conducted through online tutorial initiations.
In the end of third semester, students of regular and non-regular program are required to register for Residential Thesis Supervision I as a seminar of their thesis proposal and register for Residential Thesis Supervision II as an activity to report their research in front of their supervisors. After their thesis is signed by the first and second supervisors and after fulfilling both administration and academic requirements, it means that they are eligible to register for thesis defence.
Thesis defence is an academic requirement for a master candidate at the end of the program. Thesis defence is a direct communication activity between the examiner committee consisting of five individuals: chair and secretary of the committee from UT’s graduate program, expert examiner (external), first examiner (first supervisor) and second examiner (second supervisor) and the master candidate to defend his/her thesis. If the master candidate succeeds in maintaining his/her thesis in front of the examiner committee and is declared to be graduated then he/she will be eligible to use academic title (Rosita, Dewiki, Susanti, Sudarmo, Supartomo, 2007).
Based on data released by Graduate Program of UT in March 2016, the students of UT’s Graduate Program registered in 2016.1 are 2254 students and the students who have graduated until 2016.1 are 2169 students. While those who take the test session in the semester 2016.1 and 2016.2 are 690

14
students. In 2014 and 2015, students who can take the thesis defence are only about 59% of the total number of students. In the implementation, the thesis defence needs to have stages and requirements that must be met by students both administration and academic requirements. In relation to the issues, it is necessary to conduct evaluation on the implementation of the thesis defence examination at Graduate Program of UT in order to obtain information on the effectiveness of its implementation, which includes: pre-, during, and post-thesis defence examination.
2 LITERATURE REVIEW
2.1 Definition of Evaluation The concept of evaluation according to Ralph Tyler (in Arikunto 2009, p. 3) is a data collection process to determine the extent to which the objectives of a program are actually attained. Furthermore, Arikunto (2009) also explains that evaluation covers two steps, which are to measure and to asses. In line with Arikunto, Subali (2014) defines evaluation as a process to establish a program; to find out the effectivity of a plan.
Wirawan (2011, p. 7) defines evaluation as “a research to: collect, analyse and present useful information on evaluation object; asses and compare it with evaluation index and, furthermore, use the result to make a decision based on the evaluation.” In general, the term evaluation can be perceived as a procedure to appraise, rate, and assess, which is done based on its unit value. Therefore, one of the aims of evaluation program as stated by Stufflebeam (1971, in Arikunto and Jabar, 2008) is to present data to the decision maker.
2.2 Evaluation Models There are several models that can be used to gauge education program. However, they basically have the same interest, i.e., to collect information that is related to evaluated research problems. As proposed by Stephen Isaac (1986, cited in Tulung, 2014), the evaluation program models are labelled based on their focus, which are:
a. Good oriented (the object of the research is the purpose of the program. Evaluation is carried out continuously to find out the accomplishment of a program)
b. Decision oriented c. Transactional oriented d. Research oriented
Referring to Simbolon’s statement, (2003, in Handayani and Trisna, 2013, p. 198), evaluation should be able to measure these four indicators:
a. Input b. Process c. Output d. Outcome
Evaluation of program activities is a mean to measure the success of programs implementation.
2.3 Education Services Quality The performance of good education depends on its purpose. Therefore, a good education should envelope any kind of education into its scheme. A fine quality of education should be well preserved because one little flaw can ruin the system as a whole.
The definition of service quality revolves around the idea of answering the costumer’s needs and also its distribution efficiency. In this case, service quality is the expected excellence rate and the control on customer demand fulfilment (Tjiptono and Diana, 2003). The quality of service can be measured by comparing costumers’ ideal to the service given.
Ariani (2003) proposes that quality is the overall characteristic of product or service to meet the costumer’s needs and hope. In this case, quality is major force that can affect the success of organizations and the growth of institutions, which also can be applied to the implementation of

15
education services. Act as the cornerstone for this matter is Act number 20, 2003 about National Educational System and Government Regulation number 19, 2005 about National Educational Standard which state that quality assurance in education is an obligation for both internal and external parties.
There are few possible scenarios to the education services. If the service is beyond costumers’ expectation, then it is perceived as ideal. Meanwhile, the service is satisfying if it is in accordance with costumers’ expectation. Lower than that, however, can raise a negative perception on education. Thus, the merit of service providers holds a very important position to satisfy costumers’ demand consistently.
Essentially, humans always seek more. In this context, customer satisfaction cannot be used as an absolute standard; however, stand as it is, the method may provide useful information (derived from academic literature and interview, which are validated individually or in group). According to Giese and Cote (2000), there are three important components used to measure customer satisfaction: (1) summary of varied effective response; (2) satisfaction focus on product selection, purchase and consumption; (3) time to response adjusted to situation and limited by duration.
3 METHOD This research was conducted using evaluative method. According to Destianingtyas (2013) evaluative research is a procedure in collecting and analysing data systematically to determine the merit and worth of education services using certain criteria that are used as absolute or relative standard.
The place where the research was done is UT’s Distance Learning Program Unit (UPBJJ-UT) that have graduate program. To narrow the research population, there were only nine programs chosen out of 28 programs by considering the number of students taking the test in 2016.1 and 2016.2 in Bengkulu, Jakarta, Kupang, Mejene, Mataram, Padang, Palangkaraya, Pontianak, and Samarinda.
The source of data in the research were all 690 graduate students at UT’s Graduate Program who were registered in the thesis defence (Table 3.1). Also included in this research were the Head of UPBJJ, examiners and supervisors who were academically related to those students.
4 RESULTS AND DISCUSSION Use as many sections and subsections as you need (e.g. Introduction, Methodology, Results, Conclusions, etc.) and end the paper with the list of references.
4.1 Overview of Academic Information System at Univ ersitas Terbuka The academic information system is established by utilizing hierarchical system and is supported by distinct divisions focusing on different functions. Those divisions are:
a. Administrator as the main organizer of the system performs several functions: 1) Data Master: managing profile data of university, chairman and study program, lecturer and the
other employee’s data. 2) Academic Transaction: organizing students’ admission and students’ Study Plan Card
(KRS)/Study Result Card (KHS) manual. 3) System Management: Controlling access to each system and the administrator password, also
optimizing database. 4) Report: Printing Reports of Self Evaluation and Accreditation Support. 5) Converting database to Data Centre of Ministry of Research, Technology, and Higher Education
of the Republic of Indonesia. b. Study program which acts as the organizer of academic activities including lectures, research and
community services according to their respective study. To fulfil these purposes, they cover several roles: 1) Arranging the courses and printing the list of courses per semester. 2) Managing the class or study program displacement. 3) Directing academic supervisor assignment. 4) Managing students’ final project (thesis). 5) Changing administrative password of the study program.

16
c. Administrative affair division, which manages the teaching and learning activities so that the lecture schedules between departments do not overlap. This division is responsible for various tasks, such as: 1) Choosing a study program that will be managed. 2) Managing academic activities: Setting the active semester, lecture and exam schedule,
managing alphabetical score value including the numerical to alphabetical conversion value, managing curriculum conversion, and printing curriculum conversion data.
3) Students’ affairs: managing new students’ data capacity and students’ biographical data, printing info and students’ status.
4) Lecture: Managing Grade Point Average (IPK)/Grade Point (IP) data and cumulative Students’ University Credit Unit (SKS) per year and cross-program joint classes, setting the lecture and room schedule, reporting class activities (lecturers’ attendance, total students per class, printing exam attendance sheet, printing score list), printing subject list, management of thesis defence, generating temporary score, and printing students’ Study Result Card (KHS).
5) Changing administrative affair master password. d. Lectures, which are in charge of conducting the teaching activity and directly interacting with
students, have several functions: 1) Lecture: providing academic schedule and e-learning activity (providing subjects, tasks, Q & A
session, and designing class curriculum) for students. 2) Managing student academic final score: analysing score (competency, attendance, mid-
semester exam, and final semester exam), score input, calculating the students’ final academic score, and printing the Participant List and Final Score (DPNA).
3) Supervision: supervising Student Study Services (KKN) or Student Internship (PKN), and thesis if appointed to be.
4) Biodata: inquiring lecturers’ biographical data, adjusting biographical data, and changing password
e. Students, which function to monitor academic activities, and to perform interaction with lectures, has several roles: 1) Lectures: inquiring lectures schedule info, study plan card, attending e-learning activities (study
subjects, exercise, Q & A session/Quiz, and info on lecture unit). 2) Study Result: receiving information about study result card and temporary score transcript. 3) Financial (if the Financial Information System is activated): Payment bill info and cumulative
payment recap. 4) Supervision: Acquiring Student Study Service (KKN) or Student Internship (PKN), and thesis
supervision with appointed supervisors. 5) Biodata: Inquiring biographical data, changing personal biographical data and password.
The implementation of academic information system at UT should be improved. As evaluated in this research, the distribution of the academic information which is related to thesis defence should be improved. This matter is vital, considering the high number of the candidates who were not aware of the detail of the test. In this case, the score of this information distribution is only 25% to 50% in overall. The growth of those percentages is important since the delivery of this information from Universitas Terbuka to the supervisors, examiners, and candidates is crucial.
4.2 Overview of The Preparation of Thesis Defence I mplementation at Graduate Program of Universitas Terbuka
Based on the data processed from the research result, the overview of thesis defence implementation at Graduate Program of Universitas Terbuka are as follow:
a. The Preparation of Thesis Defence Implementation According to The Head of UT’s Distance Learning Program Unit (UPBJJ-UT)
The Head of UPBJJ states that, in overall, the preparation of thesis defence implementation at Graduate Program of UT has been run well. However, the process itself was not managed fully efficient. The information of thesis defence schedule and the test requirement submission, for example, was often delivered via the students’ and supervisors’ e-mail, short message, and WhatsApp; and unfortunately, the distribution was not yet utilizing UT’s website. Then, the students sent the documents required for thesis defence by mail, but not yet collected directly by the UT staffs. Also, the duration needed to hold the test session, started from the last date of thesis defence requirement submission, was affected by the number of candidates and UT staffs; however, the duration itself did not correspond with the

17
Standard Operating Procedures of the test. Moreover, the time and location detail of the test session were announced on website and on the second Residential Thesis Supervision; however, none of the lecturers and students receive it through e-mail, short message, or WhatsApp.
b. Preparation of Thesis Defence Implementation According to Supervisors
In general, according to the Supervisors, the thesis defence implementation has been run smoothly. Nevertheless, there were still some components which did not run as it must. One of them was the distribution of information about supervisors’ appointment which was often conducted via e-mail and short message, phone call, or WhatsApp, whereas, effectively this information could also be delivered by costumer service. Also, the supervision technical guidance was often distributed via e-mail and directly to the supervisors or students, not by costumer service or other media. Furthermore, the thesis defence schedule was delivered through e-mail and short message, phone call, or WhatsApp; hardly utilizing costumer service. Likewise, utilities needed for thesis defence were often announced via e-mail and short message, phone call, or WhatsApp, but this information was rarely delivered through customer service.
c. Preparation of Thesis Defence Implementation According to Examiners
The Examiners point out that the preparation of thesis defence at graduate program was well managed. However, there were few components that do not run effectively. One of the most noticeable one was the assignment of expert examiners via e-mail and short message, phone call, or WhatsApp, whereas such information was rarely delivered through website or other media. Then, the thesis draft submission guidance was often delivered to home/workplace near exam time (at UT). However, there was rarely any link included in this guidance or in other forms of similar information. Lastly, further instruction given to the expert examiners was hardly announced on website, as it was usually distributed in the form of short message, phone call, and WhatsApp, or explained by costumer service.
d. Preparation of Thesis Defence Implementation According to Candidates
According to the candidates, the preparation of thesis defence implementation at Graduate Program of UT was generally effective. However, they believed that some aspects can be improved. For instance, the information about supervisors was often delivered by e-mail and short message, phone call, or WhatsApp. In addition, the data about expert examiner often included his/her e-mail, phone number, and institution. No other supporting info such as home address seems to be added. Meanwhile, the supervision with first and second supervisors was usually run by direct meeting and e-mail, not by video call.
4.3 Overview of Thesis Defence Implementation at Gr aduate Program of Universitas Terbuka
a. The implementation of Thesis Defence According to The Head of UT’s Distance Learning Program Unit (UPBJJ-UT)
The implementation of Thesis Defence According to The Head of UT’s Distance Learning Program Unit was generally effective. This fact is proven by the achievement of candidates in the thesis defence, both in term of performance and ability, the service given during the test, and provision of suggestion for Final Task of Graduate Program (TAPM).
b. Implementation of Thesis Defence According to Supervisors
The supervisors agree that the thesis defence at UT was well implemented. However, there were several issues to be noticed. It was found out that most of difficulty experienced by candidates during the defence was their lack of understanding on the research methodology. They were also not adept enough to present the research result. Fortunately, there was no other problem occurred during the thesis defence.
c. Implementation of Thesis Defence According to Examiners
The UT’s thesis defence was effectively managed as seen from the readiness of facilities (information, test room, LCD projector, sound system, and others) provided by UPBJJ-UT for the test session.

18
d. Implementation of Thesis Defence According to Candidates
The implementation of thesis defence was generally effective according to the candidates. This testimony is supported availability of tools such as information, test room, LCD projector, sound system, and others provided by UPBJJ-UT for thesis defence. Moreover, the instructions given by expert examiner, first and second examiner about how to improve background, conceptual foundation, methodology, findings discussion and recommendation, and others also contributed to this positive result. In addition, the candidates were also helped by the instruction from the chair commission about presentation technique, thesis defence code of conduct, thesis draft correction time management and its deadline, and schedule and requirement of final assessment.
4.4 Overview of Thesis Defence Implementation Resul t at Graduate Program of Universitas Terbuka
a. Result of Thesis Defence Implementation at Graduate Program of UT According to the Head of UT’s Distance Learning Program Unit (UPBJJ-UT)
The Head of UPBJJ explains that the result thesis defence implementation was generally effective. However, there are several points to note, one of them is the follow-up information after the test session which was often delivered by the committee, but was rarely done by expert examiner, first and second examiner, and chairman of the commission. Subsequently, the post-test action was often taken in form of coordination of the Head of UPBJJ-UT with the chairman of the commission. However, this process rarely involved expert examiner, first and second examiners, and the students.
b. Result of Thesis Defence Implementation at Graduate Program of UT According to Supervisors
The supervisors state that the result of the UT’s thesis defence was largely effective. Nonetheless, there are some aspects needed to be evaluated, especially the follow-up action after the test session which was often in the form of draft correction including its further guidance, communication with students and committee from UPBJJ-UT. There was no additional action taken other than that.
c. Result of Thesis Defence Implementation at Graduate Program of UT According to Examiners
The examiners affirm that result of thesis defence implementation at Graduate Program of UT was effective in general. This finding can be proven from the supervision given to the candidates, which included reinforcement of research background, methodology, findings and discussion, and recommendation. In addition, the candidates were also given more direction about preliminary study, the preliminary data reinforcement, information about previous research, and the importance of research. Regarding to conceptual foundation, the candidates were provided with further direction about identification of theory relevance to the research, the relevance of present research to previous research, the mind frame, and citation technique; followed by direction about methodology (research design, operationalization of variables, research models, data collection and data analysis).
Subsequently, the direction related to the research results presentation was given in form of explanations about identification of data analysing accuracy, technique to explain the context of research result, technique to discuss research result, technique to utilize the result of interview, theories, and information about previous research to discuss the research results. Afterwards, candidates were given explanation and suggestion of how to write conclusion and recommendation which was mainly about effective way to describe conclusion, to explain the context of conclusion, to give recommendation, and how to utilize case study in explaining recommendation. Lastly, they received the information about the presentation of bibliography (bibliography writing, how to avoid plagiarism, citation compatibility with bibliography, and increasing the accuracy of bibliography).
d. Result of Thesis Defence Implementation at Graduate Program of UT According to Candidates
According to the candidates, the result of thesis defence implementation at Graduate Program was generally effective. Nonetheless, there are several points to be noticed, one of them is the notification of post-test information from the thesis defence implementation which was dominantly in form of note from expert examiner, and head of commission.

19
5 CONCLUSION The results of this research show that the implementation of thesis defence at UT’s graduate program is considered effective in general according to the Head of UT’s Distance Learning Program Unit (UPBJJ-UT), supervisors, examiners, and candidates. However, there are several elements that have not worked effectively, which are post-test information, follow-up action conducted after the test, given direction to the master candidates, guidance on conceptual foundation and methodology, method of research results presentation, direction on suggestion and conclusion presentation, bibliography, and difficulties during the test session.
REFERENCES
[1] Ariani, D. W. (2003). Manajemen kualitas pendekatan sisi kualitatif. Jakarta: Ghalia Indonesia
[2] Arikunto, S. and Jabar C. S. A. (2008). Evaluasi program pendidikan. Jakarta: Bumi Aksara.
[3] Arikunto, S. (2009). Dasar-dasar evaluasi pendidikan. Jakarta: Bumi Aksara
[4] Destianingtyas. (2013). Evaluasi pelaksanaan pembelajaran keterampilan komputer dan pengelolaan informasi (KKPI) pada siswa kelas xi di SMK Texmaco Pemalang. Retrived from dari: http://lib.unnes.ac.id/17137/1/1102408032.pdf on December 16, 2016.
[5] Giese, J. L. and Cote, J. A. (2000). Defining consumer satisfaction. Academy of Marketing Science Review 2000(01), 1-34. Retrieved from http://www.amsreview.org/articles/giese01-2000.pdf on April 26, 2016.
[6] Handayani, M. and Trisna. (2015). Evaluasi kinerja akuntabilitas Politeknik Negeri Banjarmasin. INTEKNA, 13(2), 195-200. Retrieved from http://ejurnal.poliban.ac.id/index.php/intekna/article/view/135 on December 16, 2016.
[7] Rosita, T., Dewiki, S., Susanti, Sudarmo, A. P., Supartomo, C. B. (2007). Pedoman ujian sidang program pascasarjana. Jakarta: Universitas Terbuka.
[8] Subali, B. (2014). Evaluasi pembelajaran (proses dan produk). Workshop evaluasi program pembelajaran (proses & produk) bagi dosen Universitas Muhammadiyah Purwokerto. Retrieved from http://staff.uny.ac.id/sites/default/files/pengabdian/prof-dr-bambang-subali-ms/unmuh-evaluasi-pembelajaran-r.pdf on December 16, 2016.
[9] Tjiptono, F. and Diana, A. (2003). Total quality management. Yogyakarta: Penerbit Andi.
[10] Tulung, J. M. (2014). Evaluasi program pendidikan pelatihan kepemimpinan tingkat iv di Balai Diklat Keagamaan Manado. Journal Acta Diurna, 3(3), 1-16.
[11] Wirawan. (2011). Evaluasi: teori, model, standar, aplikasi dan profesi. Jakarta: Rajagrafindo Persada.

20
NURTURING CREATIVITY IN OPEN DISTANCE LEARNING SYST EM: AN ANALYTICAL STUDY
Moumita Das 1, Prabir K. Biswas 2
1 Assistant Director, National Centre for Innovation in Distance Education, Indira Gandhi National Open University, New Delhi, (INDIA)
2 Professor and Director Staff Training and Research institute of Distance Education, Indira Gandhi National Open University, New Delhi, (INDIA)
Abstract
The Open Distance Learning (ODL) system provides an immense opportunity for creativity and innovation, which could play a pivotal role in further improving the quality of the system. There is scarcity of literature on how creativity has been nurtured by the teachers and managers of the ODL system. Therefore, the present study was carried out with the objectives of (i) assessing the awareness of the teachers and academic counsellors of IGNOU on creativity in general, (ii) examining how they use creativity in designing and developing course materials in different disciplines, (iii) analysing how they use creativity in providing support to the distance learners, and (iv) investigating how they like to nurture creativity in distance learners. One hundred and fifty teachers and academics, and academic counsellors in study centres of IGNOU across India were selected randomly. A questionnaire was developed, validated by the experts, and administered to the participants online. Data obtained was analyzed statistically for the perception of creativity of the respondents, and how they fostered creativity in the areas of i) designing and developing course materials, ii) delivery of instruction, iii) providing learner support, iv) evaluating the learner, and v) encouraging colleagues to be more creative. Analysis was also done for the steps taken by the respondents towards developing creativity in distance learners. The findings reveal the knowledge, understanding and implementation of the creative ideas of the teachers, academics and academic counsellors of IGNOU to nurture creativity in the distance learners, which would be helpful for the further development of the ODL system. Keywords: Open Distance Learning, Creativity, Course Design and Development, Learner Support
1 INTRODUCTION
Creativity and innovation are the driving forces of economies today. Creativity, which is at the core of innovation reaches out to the unreached, and bridge the gap between the haves and the have nots. R. Harris [1] defines creativity as:
1. An ability to imagine or invent something new, 2. An attitude or the ability to accept change and newness, a willingness to play with ideas and
possibilities, a flexibility of outlook, the habit of enjoying the good, while looking for ways to improve it.
3. A process of hard work, and continuous work to improve ideas and solutions, by making gradual alterations and refinements to their works.
Creativity is an inherent behaviour in an individual and s/he could be trained to develop her/his inherent potential creativity [2], [3]. The individual’s creativity needs to be nurtured, so that the person continues to contribute to the development of the society. Every educational institution needs to develop a conducive environment to teach creative behaviour. The education system could help its learners in preparing themselves for the future by enabling them to understand and develop their creativity [4]. This paper focuses on the University system, specifically the Open Distance Learning (ODL) system, and the Indira Gandhi National Open University (IGNOU) in particular. The paper is an exploratory study that aims to investigate the perception of creativity in the teachers, academics, and academic counsellors of IGNOU.

21
2 REVIEW OF LITERATURE The concept of creativity in education was introduced in the United States of America in the 1960s. J. P. Guilford, a psychologist had attributed creativity to “divergent thinking” in addition to the common “convergent thinking” in individuals. This concept was adopted to develop approaches for “training to be more creative” by the US National Defense Education Act. This development was followed by waves of research in creativity all over the world [5], [6], [7]. Creativity has more than a hundred different types of definition [8], [9], [10]. Creativity includes the willingness to take risks, maintain a high level of self-initiation and to be task-oriented in striving for excellence. However, in spite of a diverse definitions of creativity, there is a common core to all the definitions [5]. At the core of the definition, there are three elements:
1. Novelty: (a creative product, course of idea that departs from the familiar) 2. Effectiveness: (It achieves some end, such as aesthetic, spiritual, or material) 3. Ethicality (the word “creative” is not used to describe destructive or selfish behavior)
2.1 Fostering creativity through education
Students want to learn in creative ways, such as exploring, manipulating, questioning, experimenting, risking, testing, and modifying ideas. Learning creatively takes place during the process of sensing problems or gaps in information, making guesses or hypotheses about these deficiencies, testing these guesses, revising, and retesting them, and communicating the results. However, in reality, today students learn from authoritative sources, such as the teacher, parents, textbooks, etc. This type of learning fosters recognition, memory and logical reasoning, traits that may not bring out the inherent creativity of the student [3]. It is possible to foster creativity through education and training in schools and universities and with practice, less talented people can surpass the achievements of the talented [11], [12], [13], [14]. Torrance emphasized that the most successful strategies to teach creativity involved the following [11]:
• Addressing the cognitive and emotional functioning of the child, • Providing adequate structure or environment, • Providing motivation, • Provide opportunities of involvement, and practice, and • Providing opportunities for interaction with other teachers and children.
Teachers should design the educational content in such a way that it encourages divergent thinking. The content may contain questions or problems that make the students think about consequences and alternatives, with the facilitation of eliciting responses for influence (number of responses), flexibility (variety in responses), and originality (uniqueness of response). Teachers are expected to try to provide an environment conducive to creative thinking. In this regard, Daniel Fasko Jr. listed the recommendations given by Feldhusen and Treffinger in 1980 as follows [15]:
1. Support and reinforce unusual ideas and responses of students. 2. Use failure as a positive to help students realize errors and meet acceptable standards in a
supportive atmosphere. 3. Adapt to student interests and ideas, whenever possible. 4. Allow time for students to think about and develop their creative ideas. Not all creativity occurs
immediately and spontaneously. 5. Allow students to have choices and be a part of the decision – making process. Let them have
a part in the control of their education and learning experiences. The mere development of creative thinking or cognitive ability is not enough, a creative attitude or behavior too needs to be developed for the full development of a creative personality. The student should be able to appreciate other’s creative productions as well.

22
2.2 About Indira Gandhi National Open University The Indira Gandhi National Open University (IGNOU) is engaged in teaching-learning through the distance mode. It has a three tier structure consisting of the headquarter at New Delhi and, Regional Centres (67 in number) all over India, Study Centres (2981 in number) all over India, and Overseas centres (29 in number) abroad [16]. The academic and administrative educational support to the students are provided in the Regional Centres.. In IGNOU there are two kinds of academic professionals; one is the teacher and the other is called academic counsellor. The teacher is present in the headquarters and in concerned with designing and developing the programmes and course content and activities of evaluation. The academic counselor is present in the Study Centres and is concerned with counseling the learners at the Study Centres of IGNOU, and also provide student support at various levels. The academic counsellor is sometimes engaged in writing content for the courses as well as in evaluation. The academic counsellors at the Study Centre are in close contact with the students, and often are involved in counseling the needs of the students, including psychological aspects. In the ODL system, fostering creativity in the students separated in space and time poses a challenge for the distance learning educators. Considering the millions of students enrolled in IGNOU, this aspect cannot be overlooked at all. Suitable interventions are needed to ensure that the students’ creativity is adequately nurtured by the University through innovative and creative interventions. A literature search has revealed that there is no reported research study on how to foster creativity in the students of IGNOU. The authors had conducted one study in this regard [17]. This study is an extension of the earlier study. There is a need to understand if the teachers and the academic counselors of IGNOU recognise the aspect of creativity in the students, how do they propose to develop creativity, and what facilities are expected from the University towards this endeavour. 2.3 Operational definition of creativity For the purposes of this study, creativity in the context of the Open and Distance Learning System has been defined by the author as follows [17]: Creativity in ODL system may be defined as “The attitude to design and develop something new and useful product or process using a flexible and open outlook, and though continuous hard work, in the ODL domains of teaching –learning and student support, with an aim to improve the ODL system.” 3 RESEARCH QUESTIONS
The above literature survey led to the following research questions:
• How do the teachers and academic counsellors of IGNOU perceive creativity? • How have the teachers and academic counsellors of IGNOU used creativity in designing and
developing course materials for the learners? • How have the teachers and academic counsellors of IGNOU used creativity in providing support
to the learners? • In what ways the teachers and academic counsellors of IGNOU like to nurture creativity in
distance learners?
4 OBJECTIVES OF THE STUDY
The main objectives of the present study were (i) to assess the awareness of the teachers and academic counsellors of IGNOU on creativity in
general, (ii) to examine how they use creativity in designing and developing course materials in different
disciplines, (iii) to analyse how they use creativity in providing support to the distance learners, and (iv) to investigate how they like to nurture creativity in distance learners.

23
5 METHODOLOGY
5.1 Method
The method used for the study was the survey method. An online questionnaire using Google forms was developed for the survey. For the questionnaire, an ordinal (Likert scale) was used with the following ranking order: Strongly agree, Agree, Neutral, Disagree, and Strongly disagree. Open ended questions we also framed. The questionnaire was sent to the participants through email.
5.2 Sample
A total of 150 teachers at the headquarters and academic counsellors at different Regional Centres and Study Centres of IGNOU across India were sent the questionnaire through email. After one and a half months, a total of 31 responses were received. (n=31).
5.3 Data Analysis
The data was analysed and expressed as percentages.
6 LIMITATIONS OF THE STUDY
The data reflects the opinion of only a section of the teaching faculty and academic counsellors of IGNOU. The opinion of the students on creativity and its fostering among learners requires a separate study. 7 RESULTS
7.1 Demographic details
The questionnaire was sent to 150 respondents, out of which only 31 responses were obtained (n=31). Out of these 30 respondents, 23 were males and 8 were females.
7.2 Teaching experience
The teaching experience of the respondents ranged from 0 years to 40 years in the conventional system and in the Open and Distance Learning System. The teachers had shifted from the conventional system to the ODL system whereas the academic counselors were from the conventional system who were also counseling and teaching the distance learners of IGNOU. 7.3 Subjects or disciplines
The respondents for this study were drawn from across fifteen disciplines, including science, social studies, computers, humanities, and management. These disciplines were: Management, Education, English Language and Literature, Managerial Economics, Learning Disability, Social Work, Computer Science, Women’s Studies, Veterinary Extension, Pharmacy, Microbiology, Environmental Science, Library Science, Physics, and Mathematics. 7.4 Perception of creativity
This section deals with the perception of creativity by the respondents.
7.4.1 Personality aspect
About 84 % of the respondents said that creativity is a habit of individuals, while 16 % disagreed with it.

24
About 97 % of the respondents said that redefining problems is one of the keys of creativity, while none disagreed. About 3 % of the respondents’ response was neutral. Sixteen per cent of the respondents said that analytical thinking was not part of thinking creatively, while a huge 74 % said analytical thinking was necessary for creativity. About 88 % of the respondents said that creative people like to generate new ideas, while 9.4 % did not agree. About 34 % of the respondents said that creative people do not accept knowledge as a double edged sword and act accordingly. About 27.5 % respondents disagreed and about 37.9 % of the respondents were neutral in their response. About 97 % of the respondents said that learners should be encouraged to identify and surmount obstacles as it is important for developing creativity. None of the respondents disagreed while 3 % were neutral in their response. Twenty three per cent of the respondents said that risk taking and rewarding were important for developing creativity. Sixty one per cent of the respondents said that there were not important for developing creativity, and 16 % respondents were neutral in their response. About 20% of the respondents said that encouraging tolerance of ambiguity is important for developing creativity. About 47 % of the respondents said it is not important and 33 % were neutral in their response.
7.4.2 Place or environment
About 86.6 % of the respondents said that creativity is an outcome between a person and the environment. About 3% disagreed while 10 % has no opinion (neutral) on this. All the respondents (100%) agreed that respondents should always try to provide an environment that fosters creativity in learners. Almost all (94 %) of the respondents said that the teachers and academic counsellors need to allow learners time to think creatively. About 87 % of the respondents said that teachers and academic counsellors should allow learners to make mistakes while 13 % disagreed. About 78 % of the respondents said that teachers and academic counsellors should teach learners responsibility for both success and failure. About 20% of the respondents said that teachers and academic counsellors should not encourage learners imagine things from other’s view points. About 67% of the respondents disagreed. About 94 % of the respondents said that learners develop creativity when they are shown how to do something (demonstration), and not by saying only. About 7 % were neutral in their response. None of the respondents disagreed. 7.4.3 Teaching to foster creativity About 97 % of the respondents said that distance teachers should always use a creative mind while designing a course for distance learners. About 3 % of the respondents members were neutral in their response. About 97 % of the respondents said that distance teachers and academic counsellors should always use a creative mind while providing academic support to the distance learners. About 3% of the respondents were neutral in their response. About 94 % of the respondents said that the teachers and academic counsellors should concentrate on the practical aspect of creative thinking i.e., how to sell creative ideas. About 6 % of the respondents had neutral response.

25
7.5 Fostering creativity in teaching, student suppo rt services and in colleagues
This section deals with the responses regarding the inclination of the respondents towards fostering creativity in various activities of teaching-learning in the Open and Distance Learning system.
7.5.1 Is creativity encouraged while designing and developing your course for distance learners?
A total of 25 respondents (80.6 %) said that creativity is encouraged while designing the course for distance learners in their own disciplines. Five respondents said it is not encouraged, while one respondents could not say anything. When asked about how creativity was encouraged in their subjects the respondents provided the following inputs:
• By infusing in the curriculum new pedagogic ideas relevant to the present day education world. • By introducing practical and daily life problems. • Learners are encouraged to design their own content as per their ideas. • By giving them (the learners) opportunities to develop case studies, role plays and other
participatory methods of learning 7.5.2 If creativity is not currently encouraged, then in what way creativity should be encouraged in designing a course for distance learners? Five respondents responded that creativity was not currently encouraged in their discipline and so the following measures need to be taken:
• Course development process developed a long time back is still in operation without allowing innovation. A free hand to course developers should be given to develop new courses.
• Design and develop courses based on need survey and styles of learning of distance learners. • Content need to be set to test the analysis, application and skills related faculties of learners.
7.5.3 Is creativity encouraged while delivering your course through distance mode? Twenty six respondents (83.8 %) said that creativity is encouraged while delivering the course in their discipline. Five respondents said that creativity is not encouraged. One respondent said that it is not encouraged to the extent as in the conventional universities, while another said that their ideas do not get accepted by their seniors. The 26 respondents who said creativity is encouraged, provided the following inputs:
• Different modes of communication, such as email, telephone and Skype are used to interact with the learners.
• By encouraging the learners to think genuinely original and trying to develop the learners’ faculty of exploring possibilities.
7.5.4 If creativity is not currently encouraged, then in what way it should be encouraged in delivering course through distance mode? Twenty seven responders answered this query, while four respondents had no response to this question. The 10 respondents provide the following suggestions:
• The language, tenor, presentation etc. of the content should be user-friendly. • More ICT based delivery; online modules and lectures, holding distance classrooms on Mobile
and workshops on Mobile • More interactive sessions. • Online forums and discussions on a particular problem. • One to one correspondence should be encouraged
7.5.5 Is creativity encouraged while providing student support through distance mode? Six respondents either said creativity is not encouraged in student support or could not say anything in response to the question, while twenty five (80.6 %) said yes creativity is encouraged. Eleven respondents said that creativity in student support is provided in the following way by their disciplines:
• By enabling easy accessibility and retention in the programme.

26
• Use of technology • Special encouraging comments when assignments are evaluated
7.5.6 If creativity is not currently encouraged, then in what way it should be encouraged while providing student support? It is interesting to note here that about 26 respondents had no suggestions to make. The suggestions of the remaining five respondents are as follows:
• We should incorporate workshops and learning journey for learners related to their field of study for all courses.
• Use of a platform like Moodle where the learners can post their ideas and ask for different support.
• More home assignments.
7.5.7 Is creativity encouraged while evaluating learners in distance education? Most of the respondents said that respondents said that was not encouraged in evaluation. One respondent described the ways in which creativity was encouraged, which is presented below:
• We discuss case studies. The way each learner deals with the cases and problems is enough to assess and promote creative thinking skills.
7.5.8 If creativity is not currently encouraged, then in what way it should be encouraged while evaluating learners in distance education? Six respondents provided their suggestions on how creativity in evaluation should be encouraged as below:
• Self evaluation by the learners should also be allowed, which could then be vetted by the faculty or counselor.
• more emphasis on formative evaluation • More interactive based learning such as webinars and interaction with mentors through Skype
and other bases can be put on compulsion basis.
7.5.9 How would you like to contribute to encourage creativity among your colleagues? Twenty seven respondents (87 %) replied that they would like to contribute towards encouraging creativity among their colleagues. The suggested the following methods:
• Over-the- desk discussions often seeks creative problem solving skills and a creative outlook to the process of learning.
• By sharing and learning from each other. • By providing the environment to work together. • By including more IT based library services.
There are many areas which require a little creative thinking and intervention that can act as panacea to the ailing system of DE. For example, for maximizing management efficiency at the Regional Centres, creative interventions may involve the formation of discipline –wise batches of students and allot them specific study centres; distribute SIM by hand to learners of city based RCs, like the metropolis for instance, by calling them through SMS, e-mails, etc. This would ensure quick distribution, particularly happening before the counselling sessions begin. This would also ensure much less expenditure than if sent by post. 7.5.10 Steps to develop creativity in distance learners through course materials Twenty five respondents provided the following suggestions on how creativity could be developed through course materials:
• Include some games, actual situation, real life problems, live consultancy cell, industry interaction committees, business problem awareness sessions and problem solving suggestions.
• Provide the soft copy of SLM in memory cards to facilitate learning through mobile

27
• Encourage different house style for self learning material depending upon programme level, target group and education background.
• Set up of interactive e-learning portals, video lectures, mobile apps for learning on the go can make student engagement better.
• Encourage open ended questions or questions with more than one answer. • Make the Counselling on Sundays and Saturdays compulsory for students.
7.5.11 Steps to develop creativity in distance learners through academic support (written form): Twenty two respondents provided the following suggestions on how creativity could be developed through academic support:
• E-content workshops for the topics and subjects the learners are studying should be held. On the spot e-content sessions, recording and utilising the full possibilities of e-learning, online teaching etc can be thought of.
• At every completion stage of examination, the learners may be asked to submit their feedback. • Maximum use of technology by PIC and Academic counsellors should be done to increase
connectivity with the learner • DE Universities can develop a capsule course, a non-credit one or credit based, for orientation
of Academic Counsellors into different facets of student support services. This programme can be offered as an academic one for larger benefit of others clienteles too.
• More lab sessions, field visits, internship/training for few days in each semester, guest lectures from industry/government experts.
• Assignments could focus on originality, weightings for creative answers. 7.5.12 Steps to develop creativity in distance learners through technology Twenty three respondents suggested the following steps to develop creativity in the learners using technology:
• Innovative ideas from learners can be gathered through online feedback forms. • Academic cousellors should create their Learner groups through mobile applications such as
WhatsApp, and also create connectivity through emails. Students must be encouraged to speak to the Academic Counsellors, and the latter must be willing to answer to the students’ queries, in the waking hours.
• Use of multimedia for programmes. • Use of e-learning, m-learning, mobile apps, call center for academic query resolution, virtual
class rooms • Use of social media
7.5.13 Steps to develop creativity in distance learners through project/practical Twenty four respondents provided their suggestions on how to develop creativity in distance learners through project work or practicals. These are presented below:
• Measures to defeat plagiarism. • Titles of projects computerised and new ones matched to avoid copying. • Field works for practicals for vicarious experience. • Limiting seats per Learner Study Centre practical based programmes • Encourage new areas and methodologies of projects • Link the projects to the practical aspect of life
7.5.14 Any other suggestion
• The respondents provided the following suggestions and observations: • Encourage research with grants provision both in Schools and RCs to achieve greater efficiency
of the system. • Creativity should be encouraged and promoted as out of box suggestions are often the best
and most workable ones. • Empower the study centres as they are the backbone of the University.

28
• Increase incentives to Counsellors.
8 DISCUSSION
Our study examined the three research questions related to the teachers’ and academic counsellors’ perception of creativity in IGNOU, how they have used creativity in teaching and providing learner support, and in what ways would they like to nurture creativity in the learners and colleagues of the ODL system. The teachers and academic counsellors of IGNOU perceived that creativity is a matter of habit and creativity entails redefining problems and generating new ideas. Interestingly a majority of them said that analytical thinking was necessary for creativity. This finding is in consonance with the findings of Harris who said that much of the thinking in education lays emphasis on critical thinking skills, which are the major characteristics of less creative people [1]. This is indeed a major a gap area in the mindset of the people involved and the matter needs to be investigated further in the context of IGNOU. It also points to the need of sensitizing the teachers and academic counsellors towards identification of the problem areas, the creativity process, and the attitude, characteristics and needs of each individual learner. This study found that the teachers and the academic counsellors employed various creative methods in teaching to nurture creativity, such as infusing in the curriculum new pedagogic ideas relevant to the present day world, introducing real life problems, encouraging the learners to design their own content as per their ideas, case studies, role plays and other participatory methods of learning, and by encouraging the learners to develop their faculty of exploring possibilities, and using methods of evaluation that encourage creativity in the learners. They also supported creativity encouraging techniques, such as: learners should be allowed time to think creatively, they should be allowed to surmount obstacles, they should be allowed to make mistakes, and creative learners should be rewarded. A large number of teachers and academic counsellors agreed that they should also concentrate on the aspect of selling creative ideas. It is interesting to note that the teachers and academic counsellors who have been working for more than 20 years have strongly supported nurturing of creativity in the ODL system. Indeed it has been observed that creativity in a person peaks when the person acquires sufficient knowledge, expertise and experience through many years of service in the profession. Apparently the experienced teachers represent those who possess a strong passion to bring out the creative potential in their students [18]. The findings of the study indicate that the teachers and academic counsellors of IGNOU have been using creativity in providing student support as and when it had become possible for them to so. They have been using ICT tools to provide one to one support as much as possible. Different modes of communication, such as email, mobile phones, telephone and Skype are used to interact with the learners. However, they have also mentioned the fact that they should be provided the appropriate environment by the University to nurture their own creativity as well as the creativity of their learners. For this they listed the course of action such as: inclusion of games, actual situation, real life problems, live consultancy cell, industry interaction committees, business problem awareness sessions and problem solving suggestions in the study material, setting up of interactive e-learning portals, video lectures, mobile apps for learning on the go to make student engagement better; development of a capsule course, a non-credit one or credit based, for orientation of academic counsellors into different facets of student support services, conducting E-content workshops for the topics and subjects the learners are studying; and incentivizing the academic counselors. Empowering the Study Centres of IGNOU was also suggested. Indeed, the need of the hour is to think afresh and remove any impediment, bureaucratic or otherwise, to foster creativity in the university [19]. 9 CONCLUSION
This study, based on the feedback from the teachers and academic counsellors of IGNOU, has brought out several important observations on fostering creativity in IGNOU that need to be taken note of and acted upon. Also it has highlighted several needs of the academic counselors that should be addressed by the policymakers. The analysis of the perception of creativity among the teachers and the academic

29
counsellors indicates that they require more clarity on the matter of creativity. Some of them have indicated that creativity is encouraged to some extent, but it is negligible. They have shown the motivation to foster creativity among the students and colleagues. All of them, however, have a clear opinion on the fact that the University should provide avenues to them to nurture their creativity so that in turn they are able to nurture the creativity of the students. In conclusion, the University needs to take adequate measures for sensitization and capacity building of the teachers and the academic counselors so that they could appreciate creativity and build an environment of creativity and innovation in the university. The National Centre for Innovation in Distance Education at IGNOU could play a very important role towards achieving these goals. ACKNOWLEDGEMENTS The authors wish to thank all the participants of this study from all over India. REFERENCES [1] Harris, R. (1998). Introduction to creative thinking. Retrieved 17 August, 2016, from
http://www.virtualsalt.com/crebook1.htm. [2] Kuppuswamy, B. (Ed).(1991). Advanced Educational Psychology. New Delhi: Sterling Publishers
(Pvt) Ltd. [3] Torrance, E.P. (1987). Teaching for creativity. In: Isaksen, S. G. (Ed.) Frontiers of Creativity
Research. Beyond the Basics. Buffalo, NY: Bearly Limited. [4] Jackson, N. (2014). Developing students’ creativity through a higher education. In A. Xie & N. L.
Lei (Eds.), Proceedings from the Ðnternational Symposium on “The Cultivation of Creativity in University Students” (pp.8-28). Macao: Macao Polytechnic Institute.
[5] Cropley, A. J. (2001). Creativity in Education and Learning: A guide for teachers and Educators. London: Kogan Page.
[6] McCarthy, M. (1997). A Sociocultural Approach to Creativity. General Music Today, 10,10-15. [7] Sawyer, R. K. (2012). Explaining Creativity: The Science of Human Innovation. New York: OUP. [8] Meusburger, P. (2009). Milieus of Creativity: The Role of Places, Environments and Spatial
Contexts. In: P. Meusburger, J. Funke, E. Wunder (Eds.) Milieus of Creativity: An Interdisciplinary Approach to Spatiality of Creativity. Netherlands: Springer.
[9] UK National Advisory Committee on Creative and Cultural Education (1999). All our futures: Creativity, culture and education. Suffolk: DfEE.
[10] Amabile, T. M. (1996). Creativity in context. Boulder: Westview Press. [11] Torrance, E. P. (1977). Creativity in the Classroom. National Education of the United States.
Retrieved on 10 August 2016 from http://files.eric.ed.gov/fulltext/ED132593.pdf. [12] Guilford, J . P. (1967). The nature of human intelligence. New York: McGraw Hill. [13] Karkockiene, D. (2005). Creativity: Can it be Trained? A Scientific Educology of Creativity. cd-
International Journal of Educology, 2005 Lithuanian Special Issue. Retrieved on 17 August 2016 from http://files.eric.ed.gov/fulltext/ED494897.pdf.
[14] Muirhead, B. (2007). Integrating creativity into online University classes. Educational Technology & Society, 10 (1),1-13.
[15] Fasko Jr. D. (2000-2001). Education and Creativity. Creativity Research Journal, 13 (3&4),317-327.
[16IGNOU. 2017. International Division. Retrieved on 21 June 2017 from http://www.ignou.ac.in/ignou/aboutignou/division/id/introduction
[17] Das, M. (2016). Creativity in Open Distance Learning: A Study of the Perception of the Teachers and the Academics of IGNOU. Indian Journal of Open Learning, 25(3), 205-223.
[18] Tan, A. G., and Majid D. (2011).Teachers’ perceptions of creativity and happiness: a perspective from Singapore. Procedia Social and Behavioral Sciences, 15, 173–180.
[19] Das, M., and Ghosh, C.K. (2012). Innovation in Open and Distance Learning System: The IGNOU experience, Turkish Online Journal of Distance Education-TOJDE July 2013 ISSN 1302-6488 Vol 14, No 3 Article 12. Retrieved on 07 September 2016 from http://dergipark.ulakbim.gov.tr/tojde/article/view/5000102243/5000095342.
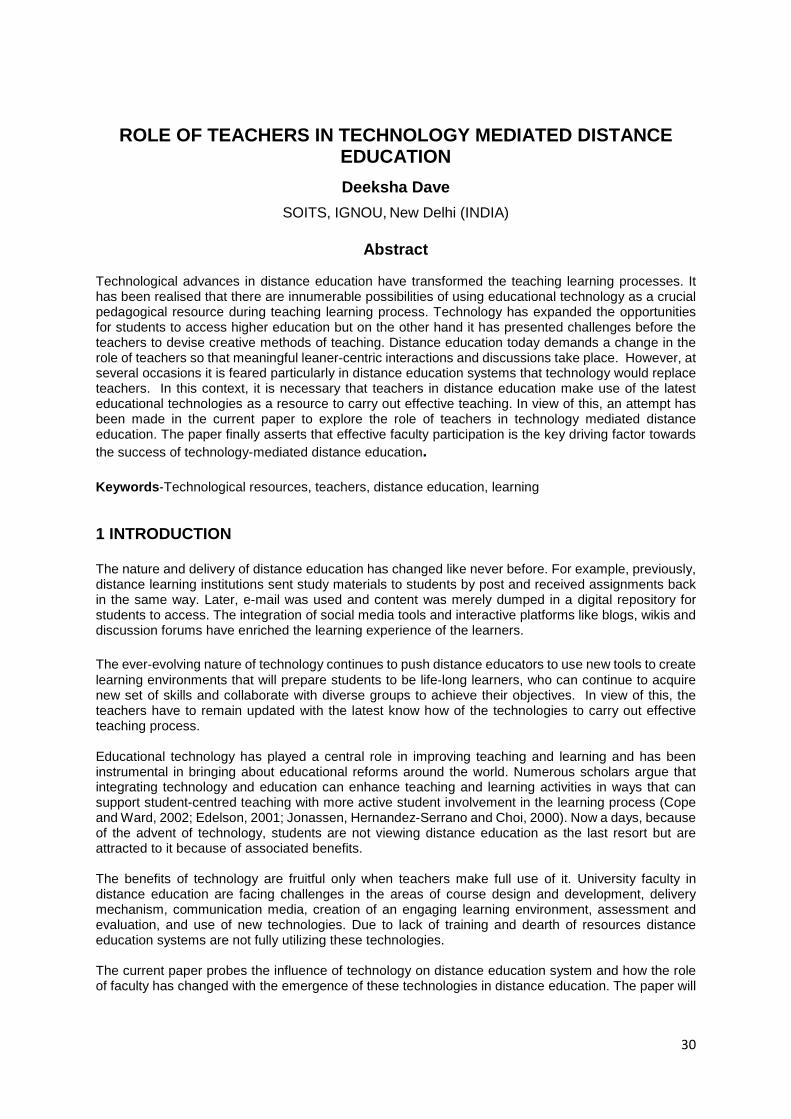
30
ROLE OF TEACHERS IN TECHNOLOGY MEDIATED DISTANCE EDUCATION
Deeksha Dave
SOITS, IGNOU, New Delhi (INDIA)
Abstract
Technological advances in distance education have transformed the teaching learning processes. It has been realised that there are innumerable possibilities of using educational technology as a crucial pedagogical resource during teaching learning process. Technology has expanded the opportunities for students to access higher education but on the other hand it has presented challenges before the teachers to devise creative methods of teaching. Distance education today demands a change in the role of teachers so that meaningful leaner-centric interactions and discussions take place. However, at several occasions it is feared particularly in distance education systems that technology would replace teachers. In this context, it is necessary that teachers in distance education make use of the latest educational technologies as a resource to carry out effective teaching. In view of this, an attempt has been made in the current paper to explore the role of teachers in technology mediated distance education. The paper finally asserts that effective faculty participation is the key driving factor towards the success of technology-mediated distance education.
Keywords -Technological resources, teachers, distance education, learning
1 INTRODUCTION
The nature and delivery of distance education has changed like never before. For example, previously, distance learning institutions sent study materials to students by post and received assignments back in the same way. Later, e-mail was used and content was merely dumped in a digital repository for students to access. The integration of social media tools and interactive platforms like blogs, wikis and discussion forums have enriched the learning experience of the learners.
The ever‐evolving nature of technology continues to push distance educators to use new tools to create learning environments that will prepare students to be life‐long learners, who can continue to acquire new set of skills and collaborate with diverse groups to achieve their objectives. In view of this, the teachers have to remain updated with the latest know how of the technologies to carry out effective teaching process. Educational technology has played a central role in improving teaching and learning and has been instrumental in bringing about educational reforms around the world. Numerous scholars argue that integrating technology and education can enhance teaching and learning activities in ways that can support student-centred teaching with more active student involvement in the learning process (Cope and Ward, 2002; Edelson, 2001; Jonassen, Hernandez-Serrano and Choi, 2000). Now a days, because of the advent of technology, students are not viewing distance education as the last resort but are attracted to it because of associated benefits. The benefits of technology are fruitful only when teachers make full use of it. University faculty in distance education are facing challenges in the areas of course design and development, delivery mechanism, communication media, creation of an engaging learning environment, assessment and evaluation, and use of new technologies. Due to lack of training and dearth of resources distance education systems are not fully utilizing these technologies. The current paper probes the influence of technology on distance education system and how the role of faculty has changed with the emergence of these technologies in distance education. The paper will

31
also emphasize the role of professional development needed to update teachers regarding the use of technology in education.
2 REVIEW OF LITERATURE
The journey of the advent of technology in education has been well researched by the scholars. The traditional correspondence or TV based style of distance teaching was enriched with (interactive) educational media, Web-based courses, Internet-enabled synchronous and asynchronous communication and collaboration (Qu & Nejdl, 2001). A number of studies have been conducted on the impact of technology on the quality of distance education. The usefulness, ease of use and effective delivery has attracted large numbers of fresh students and working professionals towards this mode of learning. Researchers have studied the various types of technological tools and their applications. Internet and other wireless communication facilities support the seamless continuation of interaction when the learner is away from his computer.
A lot of studies have also been conducted on the attitude of teachers towards the use of technology in teaching learning process. Chai and Khine (2006) argue that teachers' technology use is influenced by factors which can be classified in two broad categories, external environmental factors and the personal teacher characteristics. Sadik (2006) in his study in Egypt reported that the more positive teachers' attitudes were towards technology the more likely they were to integrate it in classroom. Various studies conducted in different countries on teacher attitudes, including Turkey, revealed positive attitudes toward technology and computers (Hong & Koh, 2002). The study concluded that attitudes were more strongly influenced by prior computer experiences than by gender. Sadik (2006) also established a gender relationship with positive attitudes towards computers in favour of males. It is also found that distance education teachers are hesitant to the use of newer educational technology and are resistant to change their style of teaching. Ball and Levy (2008) investigated the impact of self-efficacy, computer anxiety, and technology experience on instructor intention to use emerging learning experience in a small private university in US and found that self-efficacy was the only major determinant of instructor intention. Teo (2009) found that computer self-efficacy directly impacts pre-service teacher’s perceived usefulness, perceived ease of use, and behavioural intention in Singapore. Liaw et al. (2007) found that perceived self-efficacy determines instructor behavioural intention to use e-learning in Taiwan. Albirini (2006) investigated the perception of school teachers regarding the use of ICT in education in Syria, and the results highlighted the importance of teachers’ vision of technology, their experiences and the cultural conditions on their attitudes towards technology. Mahdizadeh et al. (2008) found that a teacher’s previous experience with e-learning environments and ease of use explain teachers’ perception of the usefulness of e-learning environments and their actual use of these environments. Instructor innovativeness is important to the satisfaction of e-learning (Raaij and Schepers 2008). The notable work has been carried out by O Niel (2006) where he has stated that the teacher is no longer the “dispenser of information”, with the increase access to resources on the Web. Similarly Sellers (2001) writes that the traditional classroom teacher is often viewed as the initiator of all classroom activities, and as such is held responsible for students' learning opportunities. It has also been mentioned in his study that the role of teachers and learners is changing with the advent of technology. In her research on role of teacher and learner in technology mediated learning Vaghela (2015) mentions that Teacher is not actually teacher but an instructor so Technology Mediated Learning is not based on teaching method but it is based on method of giving instruction. On one hand, in recent years, technology and computers require lesser financial resources, thus spreading at faster rates (Cepni, Tas and Kose, 2006; Newhouse and Rennie, 2001). On the other hand, teachers have always been the central agents in the utilization of any reform based innovation. Even if the school has sound technological infrastructure, and the teachers have no willingness or attitude to learn new technology, there is no use of technological support. If the goal is to promote technology enhanced education, it is of primary importance to investigate what teachers perceive of technology and its use in education, what their knowledge and skills are or what skills they need to further develop (Kahveci, Sahin & Genc, 2011).

32
3 METHODOLOGY A review based research has been conducted for the present study. 50 research papers were studied and an attempt has been made to know the impact of technology on changing the role of distance education teachers. The inferences have been drawn taking the conclusions of these research papers. An attempt has also been made to figure out as what prevents the faculty from giving away their traditional roles and what are the chief motivating factors for them. The information was collected from various secondary sources like reports, articles, journal papers, books, etc. The source of primary data was through informal interaction with the distance education teachers in various state and national open universities.
4 DISTANCE LEARNING AND USE OF TECHNOLOGY
Openness and flexibility has made distance learning to be viewed as a viable, quality alternative to full-time, contact study. A number of programmes are designed and are on offer in distance mode because the learners find it more convenient to study in distance mode than in conventional classrooms. Earlier, distance education was considered as an option only for those who could not get admission elsewhere. However, the interference of technology has transformed the distance learning process. Moreover, the need for skill based courses requires more technological support to provide real time experience to the learners. There are certain advantages of the use of technology in distance learning. The comfort and user-friendliness of digital media has reduced the load of faculty in several ways. For instance, faculty can upload the content of their lecture on a server or send though group mail and thus relieve students from the burden of taking notes during the lecture. The student who has missed any class also remains informed through this. Further, the distance learners come from different backgrounds and therefore learn in different ways and at different pace. Technology creates an environment in which potential of individual learner is utilized in best possible manner. The self-organized learners take an active role and personal responsibility in the development of their skills and competencies with the help of available technology. In the past, there was only interpersonal contact between the teacher and learner in distance learning. There was no peer group interaction. But today with the use of technology, the learners are able to interact with each other in spite of being geographically separated. Moreover, the 21st‐century learner wants to stay connected to peers and receive prompt feedback from the instructor. With the emergence of technology, participation and contribution from diverse students has become more equitable and widespread. The learner may access the information in real time while actively collaborating, or delayed time at the learner’s convenience. 4 CHANGING ROLE OF TEACHERS There is no question that the role of the teacher is changing (T.H.E. Journal, 2000). It is expected that distance learning enrolments within the next decade will increase and therefore it will have profound impact on faculty members’ instructional roles. Beaudoin (1990) recognized that faculty would have to adjust monitoring and evaluating the work of geographically distant learners rather than transmit information in person. Electronic technologies have increasingly changed the interaction between instructor and student. For most of the 20th century, distance education involved pen and paper, the typewriter, and the postal service, which provided the sole link between the individual instructor and the individual student. With the development of the radio and then television, it became possible to transmit educational courses, programs and content widely using these mass media distribution channels. (Moore & Anderson, 2003). Likewise some organisations are doing away with traditional buildings, providing flexible hours, making available large amounts of multimedia, etc. to accommodate the changing the role of the distance teacher in today’s times. The teacher no longer has to be in charge, but can give some of the control over to the students and the technology. The task for the teacher is to arrange the learning environment in such a way as to provide situations in which students use their own knowledge to construct meaning of a particular problem. Teachers should themselves be well-trained in order to guide the students on the right path of Technology Mediated Learning. It doesn’t mean that there is no place of teacher in the classroom but

33
it means that teacher has to play multiple roles. Most of the times teachers continue with their traditional roles of lecturer, information giver, discussion leader, etc. The new teacher roles identified in the present study are instructional designer, trainer, collaborator, partner in learning and team coordinator. “Each role is associated with specific activities and is made possible by the use of technology a project-based learning in inquiry-based instructional methods.” (Daithí Ó Murchú, 2015).
Technology Mediated Learning is not based on teaching method but it is based on how the teachers are giving instructions in the classroom. As the teaching becomes more learner-centred, the faculty fear that their role would be replaced by technology and ultimately they will lose the authority of the classrooms. To come out of this anxiety, it is essential that the teachers have a keen understanding and appreciation of their changing role. They must stay motivated and enthusiastic. Lee, 2001 and Schifter, 2000 have mentioned about the intrinsic and extrinsic motivating factors. Personal motivation to use the technology is an intrinsic motivator and chances of promotion and increment are the extrinsic motivators for the faculty to use technology in preparing their lessons and taking classes. Likewise there are intrinsic and extrinsic barriers too. Intrinsic barriers are that the faculty feel threatened by the technology and are concerned that online courses and programs will replace the on-campus learning experience. They worry about their career and the changes within the field and what those changes may do to their job security (Dooley & Murphrey, 2000). According to Lori (2003), faculty members are faced with a number of new situations when teaching an online learning class as opposed to a traditional class.
The most important role of the instructor these days is to model effective teaching and accept "the responsibility of keeping discussions track, contributing special knowledge and insights, weaving together various discussion threads and course components, and maintaining group harmony" (Berge, 1995). The desired role of distance education teachers are discussed below:
4.1 Team Member Sellers (2001) wrote that the traditional classroom teacher served as the initiator of all classroom activities, and as such, he/she was responsible for students' learning opportunities. Technology mediated learning is ultimately student-centred and student-driven. It encourages student-centred learning in which intellectual attainment replaces the didactic force of the teacher as the main impetus of learning. As evidenced by various studies mentioned, the most critical issue in this educational revolution is the role of the instructor. The distance instructor loses a certain autonomy common in the traditional classroom. In technology driven learning, the instructor becomes a member of a team; subsequently, the instructor no longer has total control of the learning environment. For a number of years, teachers have managed classes by virtue of their control on information. Now, with instant access to vast resources online, students are no longer dependent on the teacher alone for knowledge. The Office of Technology Assessment states that, “...teachers have to be allowed to choose, willing to make choices, and qualified to implement their choices effectively. OTA finds that, just as there is no one best use of technology, there is no one best way of teaching with technology. Flexibility should be encouraged, allowing teachers to develop their personal teaching approach utilizing the variety of options offered by technology” (US. Congress, 1988, p. 17). One of the important areas that affect the change of the role of the instructor in distance education is the Transactional Distance Gap. Moore’s Theory of Transactional Distance defines the role of faculty in distance education. This concept of “transactional distance” defined the relationship of instructor and learner. (Moore & Anderson, 2003) According to Moore, transactional distance is the gap of understanding and communication between the teachers and learners caused by geographic distance. It is filling this ‘gap’ of understanding and communication between the teacher and learner that defines the role of the instructor. The instructor must be the one to bridge that gap through special teaching techniques, distinctive procedures in instructional design and the facilitation of interaction. (Moore & Kearsley, 2005). 4.2 Team coordinator “Team coordinator” was another teacher role that is identified in the present study. The focus of this role was on the active assignment of individual students to project or portfolio teams. In addition to opening up opportunities for collaborative and social learning activities, teachers who assumed the

34
“team coordinator” role created opportunities for peer tutoring, apprenticeship modelling, and support between students with mixed ability levels.” (Daithí Ó Murchú, 2015). Muirhead (2001) wrote that distance education would demand changing the traditional role of teachers from information transmitters to guides who arrange meaningful learner-centred experiences. A good classroom teacher is not necessarily a good online teacher (Davis and Roblyer, 2005). Distance educators have more options than just wikis, blogs, or podcasts to enhance interaction. The teacher is no longer the “dispenser of information”, with the increase access to resources on the Web. Seller (2001) writes that the traditional classroom teacher as such is held responsible for students' learning opportunities. Online learning is ultimately student-centred and student-driven. As evidenced by various studies mentioned, the most critical issue in this educational revolution is the role of the instructor. The distance instructor loses a certain autonomy common in the traditional classroom. In technology mediated learning the instructor becomes a member of a team; subsequently, the instructor no longer has total control of the learning environment. A learning environment is created in which students are active participants in the learning process. (Sellers, 2001). New models of teaching can accommodate the needs of the 21st‐century learner by including activities that allow students to contribute to the learning process at any time, from anywhere. Students may take on the role of the instructor by sharing expertise, presenting sections of the course content, and using the file‐sharing capabilities to share documents with the instructor or peers. Learning “on the go” is more commonplace than ever before. The ability to conveniently add one’s contribution to a collaborative project or connect with peers at any time facilitates access to education.
The 21st‐century learner requires educational opportunities not bound by time or place, yet allow interaction with the instructor and peers. Voice and videoconferencing, whiteboards, live presentation tools, application sharing, chats, and emails are just a few of the many tools available for interaction and collaboration. Blogs, wikis, and podcasts, as well as social software are emerging technologies that foster the sense of connectedness between the members of a group.
4.3 Partner in Learning
Emerging technologies that foster different forms of interaction may also affect the role of the instructor. Evolving theoretical frameworks and paradigm shifts may no longer support the role of facilitator. Formerly a deliverer of knowledge, the instructor’s role changed over the years as technology advancements presented different kinds of responsibilities and new theoretical perspectives emerged. By the use of collaborative technologies such as wikis, blogs, and podcasts, the role of facilitator has now converted into an active partner. The instructor must view the students as contributors of knowledge, and thus allow them to participate in the creation of content. This radical change in view is supported by the contribution‐oriented pedagogy used by Collis and Moonen (2005).
Emerging technologies afford new opportunities as well as responsibilities. It is the responsibility of the instructor to maximize student interaction. As emerging technologies are implemented to support interaction, the instructor’s role will include not just monitoring and facilitating the interactions, but also actively participating in the exchange of knowledge and reflection. As a partner in learning, both learner and instructor will benefit from the mutual learning process.
4.4 Trainer
“The role of “trainer” is also emerging as the technology widens its scope. “Trainers” give individual instruction to enable skill development. This training or mentoring was accomplished through modelling the use of multimedia and technology, and helping the students to see how they might use software tools to accomplish unique language learning tasks.” (Daithí Ó Murchú, 2015)
4.5 Technology Savvy
As distance educators seek to incorporate technology in their classrooms they face the challenge of meeting the needs of a varied learner segment that is more mobile and technology‐savvy than any previous generation. The teachers must understand that Gen Z kids will grow up with a highly

35
sophisticated media and computer environment and will be more Internet savvy. Students usually adapt more quickly than their teachers to new technology. On the other hand, teachers who have begun to feel comfortable with the equipment don’t mind having their students teach those new tips and tricks (Apple Classrooms of Tomorrow, 1992). Research on the educational uses of these emerging technologies is limited, yet the information available demonstrates their versatility. Wikis are flexible enough to serve different purposes and can be adapted in different courses. Researchers and practitioners are recognizing emerging technologies as powerful tools for building social interaction among teachers and learners. Higher levels of technology will make significant inroads in academics and customized instruction can be provided to the learners.
4.6 Content developers
Content development is a critical area that is too often overlooked when it comes to the application of technology. Latest technologies can be used to develop the content in such a way that it becomes more informative and interesting for the learners. There is voluminous educational material which is mostly in English. With the help of technology, the print based content can be converted into digital media. Interactive learning materials on CDs-, DVDs can be used to develop educational content. In this way the teacher in distance education has to play the multiple roles of scriptwriters, audio and video production specialists, programmers, multimedia course authors, and web-developers also. However, to provide the technical support many universities with distance education programs have dedicated technical support and content development units.
4.7 Instructional Designer
“Instructional designer” is one of the more common new roles taken on by distance education teachers. Just as the students in distance education are termed as self learners, the teachers are also free to design and plan their lectures as per their choice by effectively utilizing the technology. Depending upon the topic, they can use A/V tools and design the instructions in their own unique ways. In the words of Palloff and Pratt (2000) remind us that “technology does not teach students; effective teachers do”. It has been found that many times, the instructors do not design their lessons to take advantage of the technology presented. This affects the quality of the instruction.
5 CHALLENGES FACED BY TEACHERS Proactive implementation of emerging technologies is dependent on comfort level, monetary resources, and visionary leadership of faculty. Revising course design and delivery structures is a time‐consuming and a costly endeavour. However, time and money may not be the only factors that would inhibit the integration of emerging technologies. Visionary educators seeking to improve current practices face the conflict between the freedom afforded by emerging technologies and the administrative control enforced for legal reasons. Others are confined by lack of funds or support from government agencies. Many educational institutions are looking for ways to improve their current practices in regard to technology integration and how it enhances student interaction.
Many institutions are restricted by legal concerns and administrative control, other institutions around the globe face monetary or political constraints that may prevent them from integrating new technologies. Integration of emerging technologies is also difficult for countries that lack the connectivity. Lack of support from government is responsible for delaying the advancement of distance education in Brazil, forcing institutions to adopt a hybrid method of delivery only (Litto, 2002) Litto acknowledges that this is a frustrating problem for educators who recognize the need to revise the outdated educational system and see asynchronous delivery as part of the answer. In the meantime, it may be necessary to choose emerging technologies that extend face‐to‐face collaboration for those students participating in mixed‐mode delivery.
Proactive leadership can minimize the limitations imposed by administrative control, lack of infrastructure, or lack government support. Some other limitations of the use of technology in distance education are lack of staff training, lack of expertise in course designing, development and delivery, lack of knowledge of technology, lack of support for distance learning , inadequate faculty selection for distance learning courses, inappropriate courseware, programme implementation and evaluation strategy.

36
Undoubtedly, the use of technological resources is rapidly expanding, but this takes place in contexts where the expectation is often highly ahead when possible technological solutions are directly experienced. Too often the opportunities and advantages of the use of technology in the learning process are poorly exploited. To effectively use the technology, the professional development of the teachers towards teaching tools is of prime importance. The teachers must be trained with particular skills to provide suitable applications.
Ideally, these should be addressed in pre-service teacher training and built on and enhanced in-service. In some countries, like Singapore, Malaysia, and the United Kingdom, teaching accreditation requirements include training in ICT use. ICTs are swiftly evolving technologies, however, and so even the most ICT fluent teachers need to continuously upgrade their skills and keep abreast of the latest developments and best practices.
Unfortunately, most teacher professional development in ICTs talks more about “teaching the tools” and less on “using the tools to teach.” The integration of emerging technologies into new models of teaching must also take into consideration cultural differences and learning tendencies, respecting the individual.
6 CONCLUSION For distance education to be successful, faculty needs to be trained in the technology as well as the pedagogy of distance learning. Teaching through technology is a new experience, different from teaching in the classroom. It requires a different set of skills and a different pedagogy. Training for teaching via distance education is essential (Wolf, 2005) Faculty development workshops to introduce faculty to distance education technology and to the changes in pedagogical approach needed to effectively conduct distance education classes are a must. Through these types of workshops, faculty can learn, among other things, strategies to improve the interpersonal dimension of distance learning, a concern of many educators. Designers and administrators must understand how the technology tool selected will aid interaction and which types of interaction it will promote.
Emerging teaching models will undoubtedly integrate new technology tools, yet those tools that foster interaction must be deliberately integrated into the design process to ensure appropriate application. The possibilities are as varied as the tools themselves, the impact and implications of technology on new ways of learning and new models of teaching are far-reaching. Although administrators have identified student–student interaction as a weak area, they consider many of the emerging technologies explored in this article to be “unsafe” practices and therefore do not authorize their use.
7 REFERENCES
Albirini, A. (2006). Teachers’ attitudes toward information and communication technologies: The case of Syrian EFL teachers. Computers & Education, 47(4), pp 373-398.
Ball, D. M., & Levy, Y. (2008). Emerging educational technology: Assessing the factors that influence instructors' acceptance in information systems and other classrooms. Journal of Information Systems Education, 19(4), pp 431.
Beaudoin, M. (1990). The instructor's changing role in distance education. American Journal of Distance Education, 4(2), pp. 21-29.
Berge, Zane L. (1995) The role of the online instructor/facilitator. Educational technology 35, (1), pp. 22-30
Brooks, Lori. (2003) How the attitudes of instructors, students, course administrators, and course designers affects the quality of an online learning environment." Online Journal of Distance Learning Administration 6, (4)
Çepni, S., Taş, E., & Köse, S. (2006). The effects of computer-assisted material on students’ cognitive levels, misconceptions and attitudes towards science. Computers & Education, 46(2), pp.192-205.

37
Chai, C. S., Khine, M. S., & Teo, T. (2006). Epistemological beliefs on teaching and learning: A survey among pre-service teachers in Singapore. Educational Media International, 43(4), pp. 285-298.
Collis, B. & Moonen, J. (2005). Collaborative learning in contribution‐oriented pedagogy”. In Encyclopaedia of distance learning, Hershey, PA: Idea Group. Vol. 1, pp. 277–283.
Cope, C., & Ward, P. (2002). Integrating learning technology into classrooms: The importance of teachers’ perceptions. Educational Technology & Society, 5(1), pp. 67-74.
Daithí Ó Murchú (2015) New Teacher and Student Roles in the Technology- Supported, Language Classroom retrieved from http://www.itdl.org/Journal/feb_05/article01.htm
Davis, N. E., & Roblyer, M. D. (2005). Preparing teachers for the “Schools that technology built” Evaluation of a program to Train teachers for virtual schooling. Journal of Research on Technology in Education, 37(4), pp. 399-409
Dooley, K. E., & Murphrey, T. P. (2000). How the perspectives of administrators, faculty, and support units impact the rate of distance education adoption. Online Journal of Distance Learning Administration, 3(4)
Edelson, D. C. (2001). Learning-for-use: A framework for the design of technology-supported inquiry activities. Journal of Research in Science Teaching, 38(3), pp. 355-385.
Hernandez-Serrano, J., Choi, I., & Jonassen, D. H. (2000). Integrating constructivism and learning technologies. In Integrated and holistic perspectives on learning, instruction and technology Springer Netherlands pp. 103-128.
Hong, K. S., & Koh, C. K. (2002). Computer anxiety and attitudes toward computers among rural secondary school teachers: A Malaysian perspective. Journal of Research on Technology in Education, 35(1), 27-48. Kahveci, A., Sahin, N., & Sebnem, G. E. N. Ç. (2011). Computer perceptions of secondary school teachers and impacting demographics: A Turkish perspective. TOJET: The Turkish Online Journal of Educational Technology, 10(1). Lee, J. (2001). Instructional support for distance education and faculty motivation, commitment, satisfaction. British Journal of Educational Technology, 32 (2), pp. 153-160. Liaw, S. S. (2008). Investigating students’ perceived satisfaction, behavioural intention, and effectiveness of e-learning: A case study of the Blackboard system. Computers & Education, 51(2), pp.864-873.
Litto, F. M. January (2002). The hybridization of distance learning in Brazil: An approach imposed by culture. In International Review of Research in Open and Distance Learning
Mahdizadeh, H., Biemans, H., & Mulder, M. (2008). Determining factors of the use of e-learning environments by university teachers. Computers & Education, 51(1), pp.142-154.
Moore, M. G. & Anderson, W. G., (Eds) (2003). Handbook of Distance Education.Mahwah, NJ. Moore, M., & Kearsley, G., (2005). Distance Education A Systems View, Thomson Wadsworth
Muirhead, B., & Min, D. (2001). Practical strategies for teaching computer-mediated classes. Educational Technology & Society, 4(2), pp. 1-12.
Newhouse, P., & Rennie, L. (2001). A longitudinal study of the use of student-owned portable computers in a secondary school. Computers & education, 36(3), pp. 223-243.
O’Neil, T. (2006). How distance education has changed teaching and the role of the instructor. In E-Leader Conference.

38
Qu, C., & Nejdl, W. (2001). Constructing a web-based asynchronous and synchronous collaboration environment using WebDAV and Lotus Sametime. In Proceedings of the 29th annual ACM SIGUCCS conference on User services, pp. 142-149
Sadik, A. (2006). Factors influencing teachers’ attitudes toward personal use and school use of computers: New evidence from a developing nation. Evaluation Review, 30(1), pp. 86-113 Schifter, C.C. (2000). Faculty motivators and inhibitors for participation in distance education. Education Technology, 40 (2), pp. 43-46 Sellers, R. G. (2001). Learning to teach in a virtual environment: A case study of the Louisiana virtual classroom teachers Louisiana State University and Agricultural & Mechanical College, pp. 1-190 THE Journal, (2000), The Changing Role of the Teacher (28)4 Teo, T. (2009). Modelling technology acceptance in education: A study of pre-service teachers. Computers & Education, 52(2), pp. 302-312.
Vaghela, M. B. (2015). Develop Academic Vocabulary with the Use of Internet in an Indian Context. The Global Journal of English Studies May, 1(1).
Van Raaij, E. M., & Schepers, J. J. (2008). The acceptance and use of a virtual learning environment in China. Computers & Education, 50(3), pp. 838-852.
Wolf, M. K., Crosson, A. C., & Resnick, L. B. (2005). Classroom talk for rigorous reading comprehension instruction. Reading Psychology, 26(1), pp. 27-53.
https://pdfs.semanticscholar.org/d5a8/ec74fe562bbd132d13792249b6d2d38868ca.pdf
http://www.tandfonline.com/doi/abs/10.1080/08923649409526853
https://link.springer.com/article/10.1007/s11162-008-9094-7
https://www.all4women.co.za/981594/money/careers/technology-changed-face-distance-learning
http://en.cnki.com.cn/Article_en/CJFDTOTAL-DDJY200203006.htm
http://www.tandfonline.com/doi/abs/10.1080/08923649209526796
http://www.tandfonline.com/doi/abs/10.1080/1358165010260102
https://www.tonybates.ca/tag/journal-of-distance-education/page/2/

39
QUALITY IN THE ODL SYSTEM IN INDIA: NEED FOR ADOPTI NG INNOVATIVE MEASURES
Leena Singh 1 and Moumita Das 2
1 Assistant Professor, Indira Gandhi National Open University (INDIA) 2Assistant Director, Indira Gandhi National Open University (INDIA)
Abstract
Quality has been defined as that attribute in product, process and system, which meets customer satisfaction. Value based definition describes quality as providing good value for cost. Quality becomes necessary to meet competition, fulfill customer satisfaction and providing good value for cost. In Open and Distance Learning (ODL) system, quality may be defined as the ODL system having attributes of learner-centeredness, product-centeredness, cost-effectiveness, and meeting the expectations of all stakeholders. The ODL system in India is nearly thirty-five years old and has been catering to millions of students in India and abroad. With the new and emerging technological, pedagogical and managerial practices in the recent times, the system needs to further develop the quality aspect of its products and services. The increasing demand for quality services and products by its multiple stakeholders, namely learners, professionals, teachers, society, government, employer and researchers, calls for undertaking innovative measures that would enhance the overall quality of the system. The objective of this paper is to explore new methods of generating quality products and services in the ODL system. The paper analyses the various aspects of quality in the different areas of the ODL systems in existence in India and abroad, and presents a framework that proposes new measures to improve the quality of the ODL system. The findings of this paper are expected to facilitate the policymakers of the ODL system to take an informed decision to enhance the quality of the system.
Keywords: Quality, Innovation, Benchmarking, Open and Distance Learning System
1 INTRODUCTION
The ODL system has shown a tremendous growth during the past few decades due to its unique feature of user-friendliness. In this system, the students are free to learn from their own place, in accordance with own pace and convenience while being located far away from the institution. This uniqueness and the ease of obtaining knowledge have a pivotal role to play in facilitating today’s emerging knowledge society. Today in India almost half of the students enrolled in higher education are having teaching- learning transaction through the distance mode, i.e. through the open universities or though the correspondence courses of traditional universities or the directorates of distance education [1].
However, the problems of efficiency, equity, quality and benchmarking still persist in all areas of the ODL system. Quality is found wanting mainly in the areas of learner support, delivery mechanisms, and counselling. All this is reflected in the low acceptability of students from the ODL system in reputed traditional universities for higher degrees. Further, the students of the ODL system find gainful employment with more difficulty in comparison with their conventional counterparts.
In the wake of the UN Millennium Development Goals, which emphasize on education for sustainable development, there is a need and demand for innovative methodologies and programmes in the ODL system that would meet the quality requirements of the large and diverse communities of the country, for their overall development. Therefore, in today’s competitive world, the success of the ODL system depends upon innovations, which would increase the efficiency and quality of the system.
Quality in higher education has been studied extensively. Several guidelines and frameworks are in place to implement and manage quality in higher education. [2] The aspect of quality in the ODL system has also been explored extensively. Researchers studying quality in the ODL system have often opined that it is not an easy task to explore quality as it has multiple aspects [3], [4].

40
Indeed, the ODL system has multiple dimensions. To be able to manage its quality aspects, the various dimensions of the ODL system need to be explored and understood. A systems approach has been used to study quality in the education system. A system is an organized assembly of components which are related in such a way that the behavior of a component will influence the overall status of the system. [5] Educational systems exhibit the behavior of such a system with the components of input, transformation and output. The inputs to the system are in the form of the human (teachers and students), physical and financial resources. The transformation sub-system comprises the processes and activities related to curriculum, management and support mechanisms. The outputs of the system are the employable graduates, growth in knowledge through research publications, and socio-economic development. [2]The ODL system may be viewed and evaluated as a system [6] for studying the dimensions of quality. The dimensions of quality in ODL system has been divided into three main groups (i) core dimensions, (ii) systemic dimensions, and (iii) resource dimensions. These dimensions are further categorized into ten factors. [7]
The distance education theories help to identify the scope of quality intervention. For example, Otto Peters’ theory of Industrialization compares distance education to an industry with the features of rationalization, division of labor, mechanization, assembly line, mass production, preparatory work, planning, organization, scientific control methods, formalization, standardization, change of function, objectification and concentration and centralization. Borje Holmberg, in his new comprehensive theory of distance education incorporated concepts such as the centralized learners, student freedom, free access to learning, mediated communication, deep learning, personal relationship, study pleasure, empathy between teachers and learners, conceptual learning, and problem learning. [3]
Quality in the ODL system across the world is directed through several guidelines, such as the ISO 9000-2000 [2], UK [8], USA [9], COL Guidelines [10], AAOU [11] and UGC ODL guidelines [12].
Experts opine that quality can be brought into the ODL system by laying emphasis on improving the learning process and systems using the problem-solving methods. All stakeholders, such as students, teachers, administrators, support staff and parents should participate in continuous improvement of learning process. Training and development of teachers is a must. Parameters to determine the progress of learners, such as intentionality, impulsivity, planning, communication, memory, competence, and reciprocity should be developed [13].
This exploratory paper investigates and analyses the various aspects of quality in the different areas of the ODL systems in existence in India and abroad. It further explores ways to improve quality in these areas through innovative measures.
2. STUDY OBJECTIVES
The objectives of this study are to:
1. identify the gap areas of ODL system, based on the analysis of the available guidelines. 2. identify the parameters of quality to be implemented in the gap areas. 3. identify the available benchmarks and innovative measures for quality development in the ODL
system, and 4. design a feasible framework for innovative measures for quality management in the ODL
system.
3. METHODS
To achieve the objectives of this exploratory study, the qualitative method of analysis of documents was used followed by quantitative assessment of ODL institution.
• Analysis of documents: in this study the method of document analysis was employed. Document analysis is a systematic procedure for reviewing or evaluating documents both printed and electronic. As an analytical method in qualitative research, document analysis requires that data be examined and interpreted in order to elicit meaning, gain understanding, and develop empirical knowledge. Documents can provide data on the context of research, help tracking change and development, and provide a way to verify findings or corroborate the evidence from other sources. [14] For this study, documents pertaining to quality in education

41
and the ODL system available on websites were analysed. Pertinent research papers, thesis, reports, guidelines and innovation databases were also studied and analysed. The analysis involved comparison of different prevalent guidelines on quality of ODL systems. The various ODL universities were analysed in terms of their existing quality for the selection of gap areas or benchmark. The quality of IGNOU, in particular, was used in detail for exploring the areas of quality intervention.
1. Assessment using predefined criteria: The instrument of assessment employed was the Commonwealth of Learning (COL) toolkit [10]. The toolkit was developed by experts from twelve commonwealth countries and UNESCO. It includes international performance indicators for institutions to gauge their own performance. A detailed assessment of IGNOU using the performance indicators in the COL toolkit was carried out using the participant observation method. Since this is a yet unexplored area, there was no precedence of this kind of evaluation of IGNOU. For this ten (10) criteria were selected against which 130 performance indicators were assessed. As suggested in the toolkit, the performance indicators were applied to the particular context and the performance against each of the performance indicators were recorded after carefully and objectively analyzing evidence from the IGNOU sources, such as Annual Reports, IGNOU Profile, Vice Chancellor’s Report, Minutes of the Board of Management, research papers, IGNOU Ordinance, Distance Education Council (DEC) 2009 guidelines etc. The results of evaluation of the institution brought into light three criteria standards (with zero score) that were considered gap areas at IGNOU. The three criteria standards had ten performance indicators. Out of these ten performance indicators, three important performance indicators were selected for further study (Table 1) and the subsequent development of a framework.
Table 1. The three most important gap areas in qual ity at IGNOU selected for the study.
3 LIMITATIONS OF THE STUDY
It is likely that during the analysis of the documents, many of the relevant documents have not been available and therefore not consulted, which might leave gaps in the data. Further, there might be author bias in the document, and may also have researcher bias on the final analysis. The observation method cannot explore the actual causes of behaviors, and by this method it is also not possible to determine if a given observation truly represents that which occurs in reality. 4 QUALITY IN THE ODL SYSTEM
4.1 Definition
Quality may be defined, in management terms, simply as “customer satisfaction”. A quality of a product or process may be determined by the satisfaction expressed by the customer after using it. The International Standard for Organisation (ISO) 8402-1986 standard defines quality as "the totality of features and characteristics of a product or service that bears its ability to satisfy stated or implied needs." In India, “fitness of purpose” has been adopted as the definition of quality in higher education
S. No Criteria Performance Indicator 1. The learners Research into the needs and expectations of learners provides
inputs to policy making in the institution.
2. Infrastructure and learning resources
The institution has mechanisms to regularly evaluate the adequacy and accessibility of resources and services for learners and takes appropriate remedial measures to address inadequacies.
3. Research consultancy and extension services
Findings of research underpin the development of the programmes and the courses of the institution.

42
[2]. For the ODL system, we may define quality as “the totality of the features of the products and services of the ODL system that satisfies the learner’s needs.”
4.2 Parameters of Quality in the ODL System
The parameters of quality depend upon the various features or criteria or areas of the ODL system. Quality in ODL system, therefore, means quality in these areas of the ODL system. Once the areas are known, it is possible to identify, measure and evaluate the quality attributes of the areas and the processes of quality improvement followed in each area. Another parameter of quality is the indicators or attributes of quality of the products and the services used in each area. These indicators need to be present in the different aspects of the ODL system to impart quality to the system. To develop quality in the various areas, processes, products and services, there are several measures and tools, such as benchmarking. The following sections review the various parameters of quality and tools to bring about quality.
3.2.1 Areas of the ODL system
The areas of quality in the ODL system as prevalent in different parts of the world are analysed and presented briefly in this section.
The ODL Quality Council (ODLQC) of the UK lists six areas of quality assurance [8], which are: (i) Outcome [of the course/program], (ii) Resources [study material], (iii) Support [to the learner], (iv) Selling [advertisement and promoting the provider], (v) Provider [Staff, tutor, infrastructure], and, (vi) Collaboration between principal provider and the provider.
In the USA, the Institute for Higher Education Policy (IHEP) considers five main areas of quality assurance in the ODL system [3]: (i) curriculum and instruction, (ii) programme planning, evaluation and assessment, (iii) learning support systems and services (including libraries), (iv) faculty and faculty support, and (v) student services and information. The Council for Higher Education Accreditation (CHEA) Distance Education Accrediting Commission (DEAC)[9] provides seven key areas that are evaluated when quality of the ODL institutions are reviewed. These are: (i) Institutional mission, (ii) Institutional organizational structure, (iii) Institutional resources, (iv) Curriculum and instruction, (v) Faculty support, (vi) Student support, and (vii) Student learning outcome.
In the Asian context, the various guidelines on quality of the ODL system, such as the COL quality toolkit, the AAOU guidelines, etc., have identified the areas for quality assurance. There are some overlapping or common areas in all the guidelines, which are [15] (i) Vision, mission and values, (ii) Assessment and evaluation, (iii) Educational resources, (iv) Leadership, governance and administration, (v) Financial resources, (vi) IT infrastructure, (vii) Teaching and learning, (viii) Curriculum and course development, (ix) Student support, (x) Faculty and staff, (xi) Internal quality assurance system, and (xii) Research.
In India, there is one national University, IGNOU, and fourteen State Open Universities. In all these Universities, the Distance Education Council (DEC) 2009 guidelines have been used till now to evaluate ODL institutions for quality. Based on the DEC guidelines, recently the new University Grants Commission (UGC) guidelines for ODL institutions have been formulated for implementation across India. The DEC guidelines stipulate nine areas as follows: (i) Programmes to be offered, (ii) Staff, (iii) Teaching learning strategies, (iv) Evaluation system, (v) Delivery system, (vi) Infrastructural facilities, (vii) Library and resource centre, (viii) Audio-visual production facility, and (ix) ICT facilities. The UGC guidelines for ODL system lists nine areas of quality: (i) Systems Management, (ii) Self-regulation, (iii) Quality [in learning material and pedagogy], (iv) Teachers and academics, (v) Use of technology, (vi) Programme launch, (vii) Admissions, examination and learner support, (viii) Evaluation and Certification, and (ix) Assessment and Accreditation.
A recent report has described the status of the ODL institutions in India with respect to ten areas of quality. [16] The findings are summarised in Table 2 below.

43
Table 2. The areas of quality of the fifteen ODL Universities in India
S
No
Criteria (Area)
Open and Distance Learning Universities in India
A B C D E F G H I J K L M N O
1. Mission and Mandate √ √ √ √ √ √ √ √ √ √ √ √ √ √ √
2. Learner enrolment √ √ √ √ √ √ √ √ √ √ √ √ √ √ √
3. Programme types √ √ √ √ √ √ √ √ √ √ √ √ √ √ √
4. Enrollment pattern √ √ √ √ √ √ √ √ √ √ √ √ √ √ √
5. Learner profile √ √ √ √ √ √ √ √ √ √ √ √ √ √ √
6. Learner success √ √ √ √ √ √ √ √ √ √ √ √ √ √ √
7. Pedagogy and application of technology in pedagogy
√ √ √ √ √ √ √ √ √ √ √ √ √ √ √
8. Learner support √ √ √ √ √ √ √ √ √ √ √ √ √ √ √
9. Staffing √ √ √ √ √ √ √ √ √ √ √ √ √ √ √
10. Income and expenditure √ √ √ √ √ √ √ √ √ √ √ √ √ √ √
A = Indira Gandhi National Open University, B = Bhim Rao Ambedkar Open Oniversity, C = Vardhman Mahaveer Open University, D = Nalanda Open University, E = Yashwantrao Chavan Maharashtra Open University, F = Madhya Pradesh Bhoj Open University, G = Babasaheb Ambedkar Open University, H =Karnataka State Open University, I = Netaji Subhash Open University, J = Uttar Pradesh Rajarshi Tandon Open University, K = Tamil Nadu Open University, L = Pandit Sunderlal Sharma Open University, M = Uttarakhand Open University, N = Krishna Kant Handique Open University, O = Sambalpur Open University
From the above analysis, it is evident that there are variations in the criteria or areas that define quality in the ODL system. However, there are commonalities too, which may be taken into account for future ODL quality improvement efforts. This finding has also been reported by Cheney in a detailed analysis of the guidelines used in the USA, and Jung et al in a comparative analysis of the areas in Asian ODL systems [3], [15]
3.2.2 Quality attributes of the ODL system Parameters of quality are essentially the attributes or indicators of quality of a system, especially the products and processes developed and used in the system. It is believed that the characteristics of software as an intangible product are more consistent with higher education.3 A model of quality in higher education was proposed in 1996 by Owelia and Aspinwall, wherein they adapted the characteristics of the quality parameters of software quality assurance. [3] Subsequently a similar model was proposed for the ODL system by Kefalas et al (2003) [17] by using attributes of software quality assurance. These attributes are availability, usability, learning effectiveness, performance, security and potential for change. In addition to the above-mentioned attributes, many other attributes of quality in software systems have been proposed by Chen et al in 2013, [18] such as adaptability, configurability, flexibility, interoperability, performance, responsiveness, recoverability, scalability, stability, security, extensibility, modularity, portability, reusability, testability, auditability, maintainability, manageability, sustainability, and supportability. Accessibility has been identified as a quality attribute of web technologies. [19] A study of the The ISO/IEC250241:2012 [20] guidelines for software quality assurance revealed six attributes, namely functionality, reliability, usability, efficiency, maintainability, and portability. All these software attributes are in the domain of human-technology interventions. Since the ODL system also employs human-technology interventions, these quality attributes may be conveniently used in the ODL system. Drawing upon the above review, this study proposes the following fourteen attributes for measuring the quality in the products and services of the ODL system.

44
1. Availability: The products and services of the ODL system is available on time and at any place the learner needs it. Similarly, the availability of resources is there for all other stakeholders on time and as and when they need these.
2. Accessibility: The product and services are accessible to all including the differently-abled or those with special needs or those residing in the remote areas, to their satisfaction.
3. Affordability: The products and services are cost-effective or affordable for the learners.
4. Usability: The learners, teachers and staff are able to use the products, processes and services for teaching-learning in an efficient manner and with satisfaction.
5. Learnability: The product and processes enhance the ability of the learner to quickly grow and adapt her knowledge and skills.
6. Reliability: The mechanism of assurance is in place where the continuity and accuracy of service is guaranteed. Also, the system intimates the learners in case of any failure to deliver its products or services. The other stakeholders are similarly intimated.
7. Durability: The products and services are relevant for a long time.
8. Security: The system can protect confidential data, such as learners’ details. The Intellectual Property Rights are protected. Other forms of security measures in technology use are maintained.
9. Flexibility: The system can adapt in case there is a change in the external environment. New policies, products, processes or services are included if needed.
10. Manageability: The system is easily manageable. It may include operations and deployment of products and services.
11. Serviceability: The system can be supported through changing configurations in the products, processes, or services.
12. Performance efficiency: The system is able to provide the desired output, e.g., produce learners with knowledge and skills.
13. Sustainability: The quality improvements in the system are sustained for a long time.
14. Scalability: The quality improvements in the system can be scaled up to be implemented in other related areas of the system.
5 BENCHMARKING
Benchmarking is the process of evaluating something with a standard. To maintain the standards and compete nationally and internationally an ODL institution needs to benchmark with best practices prevailing in other institutions. Benchmarking in the ODL system is the process of identifying best practices from within the ODL institution or other institutions in order to improve overall performance. Benchmarking employs the following steps [3]:
1. Comparing one thing with another thing. 2. Creating criteria and using these to assess the difference between the two things. 3. Use the differences to identify suitable direction of change. 4. Implement the required change.
5.1 Categories of Benchmarking
Benchmarking are of four categories: Product, Performance, Process and Strategic Benchmarking. [21]
1. Product Benchmarking: this makes qualitative comparisons with best practices related to product or services. This facilitates in redesigning product and services. Product benchmarking in terms of ODL includes cost valuation and learner-perceived quality.
2. Process Benchmarking: It provides with the most effective and efficient process to be implemented. A process is a set of sequential activities performed on a service to add value for cresting learner satisfaction, e.g. online admission initiated in IGNOU. Here the process

45
requires to be re-designed or re-engineered. The business process along with management process and the supportive processes is required to be improved to attain optimum performance level.
3. Performance Benchmarking: relates to entire business-related performance of ODL system or a group of critical activities. It serves as an important tool to identify the functional areas where there is greater scope for improvement. It includes system performance variables like efficiency, effectiveness, productivity, quality, quality of work life, flexibility, innovativeness and profitability.
4. Strategic Benchmarking: Strategy is the ability to see the destination hence it is both proactive and reactive. Learning from others best practices are important enablers for strategic planning. Strategic planning would also include the best practices which lead to profit enhancements and reduction in cost.
5.2 Benchmarks in the ODL system
Benchmarks in the ODL system have been found as scattered examples. There appears to be an unavailability of a comprehensive database of best practices in ODL system in the European countries, the UK and the USA. Only one comprehensive compilation of best practices in the ODL system in the Asia Pacific region by Insung Jung in 2005 [22] has been found in the review of literature. The innovative best practices have been identified in areas like quality assurance, curriculum, policy and management, student services and tutoring, ICT innovations, cost savings, collaboration and for-profit involvement.
In India, the National Centre for Innovation in Distance Education (NCIDE) at IGNOU has developed a database of innovations comprising of innovations carried out in ODL institutions across India. [23] The areas of innovation include programmes, application of ICT, admission, learner support, evaluation, quality and benchmarking, and convergence of systems. The database contains more than a hundred innovations and ideas that may serve as benchmarks to improve the quality of the ODL system.
Incidentally, several quality practices at IGNOU, especially in the field of programme and course development, have been used as benchmarks by the state open universities in India. [16]
Benchmarks need not always be from the ODL institutions. The best practices used in other institutes of higher education across the world may be selected as benchmarks and suitably adapted.

46
Table 3. Benchmarks and creativity tools identified for the three important gap areas of quality in IGNOU.
6 CREATIVITY TOOLS
Creativity tools are inherently methods to enhance creative thinking in individuals. There are two kinds of creativity tools that foster either convergent on divergent thinking. Creativity tools help to devise creative and innovative solutions to problems. The most popular creativity tool is the brainstorming method. There are other tools, such as brainwriting 6-3-5, attribute listing, SCAMPER, wishing, new useful feasible (NUF), force field analysis, six thinking hats etc [24].
These creativity tools can be used to generate new ideas, refine those ideas and implement them for quality improvement in a gap area in the ODL system.
7 A FRAMEWORK FOR QUALITY IMPROVEMENT IN THE ODL SY STEM
In this study, after the identification of three most important gap areas, and following a review of the available literature and databases of benchmarking and creativity tools, an attempt was made to select appropriate benchmarks or creativity tools to be used for quality development of the gap areas by the authors. The findings are presented in Table 3.
No Criteria Performance Indicator Innovative Measure
Method
1. The learners
Research into the needs and expectations of learners provides inputs to policy making in the institution.
Benchmarking A study of UK higher education was commissioned by the Quality Assurance Agency, UK and was published as a report in 2013. [25] This report may be used for suitably designing research tools to conduct research studies on the needs and expectations of IGNOU Learners.
2. Infrastructure and learning resources
The institution has mechanisms to regularly evaluate the adequacy and accessibility of resources and services for learners and takes appropriate remedial measures to address inadequacies.
Benchmarking and creativity tools
The Guide to Evaluating Distance Education and Correspondence Education by the Western Association of Schools and Colleges, USA [26] may be used as a benchmark for identifying areas of quality intervention. Thereafter, creativity tools such as brainstorming, attribute listing, six thinking hats etc can be appropriately used.
3. Research consultancy and extension services
Findings of research underpin the development of the programmes and the courses of the institution.
Creativity tools
Tools, such as brainstorming, or brainwriting, NUF and force field analysis may be used to devise ways to: 1.Develop solutions for:
a. effective feedback collection b. report generation from research done by IGNOU and other ODL institutions c. identification of appropriate methods based on data collected at a and b above to be presented to the policymakers for implementation.

47
It needs to be emphasized that the products and processes developed during the implementation of innovative measures should incorporate suitable quality indicators.
The review and analysis of all the different facets of quality as described above led to the design of the following framework for quality improvement of the ODL system (Figure 1).
1. Evaluation of the Institution: The institutional practices and products are compared with standard guidelines to determine the gap areas that need quality improvement.
2. Identifying the gap areas: A list of the shortcomings in the gap areas need to be made, e.g, performance indicators.
3. Employing the appropriate tools: Benchmarking or creativity tools, separately or combined, may be used to generate new ideas and devise innovative solutions.
4. Implementation: The improved process or product is implemented after testing and incorporating feedback on its usefulness. Periodic monitoring is recommended.
Figure 1. A framework for quality improvement in th e ODL system.
The NCIDE at IGNOU is mandated to bring in total quality management at IGNOU. This framework may be applied by NCIDE for quality interventions in IGNOU.
8 CONCLUSION Quality assurance measures in the ODL system in India need innovative ways to devise solutions. This study has reviewed the existing quality guidelines meant for the various areas of the ODL system, and shortlisted a suitable guideline tool for analyzing an ODL institution. It may be noted that the guidelines may not contain all the necessary indicators and might need to be upgraded with the context and also with the developments happening with time. This paper also reviewed the various parameters of quality in ODL products and processes drawn from software quality assurance and systems engineering disciplines and proposed fourteen quality attributes to be included appropriately in the new products or processes. The study identified three important areas of quality intervention at IGNOU and proposed a framework for innovative measures using benchmarking and creativity tools. This framework, when adopted, is expected to bring in the necessary change towards quality improvement in the ODL system. ACKNOWLEDGEMENTS The authors wish to acknowledge their family and friends for their moral support and providing valuable inputs during the writing of this paper.
Evaluation of the Institution by comparing with standard
guidelines
Identifying the gap areas
Employing the appropriate
benchmarking or creativity
tools
Implementation of the
innovative solution

48
REFERENCES
[1] Ghosh, C.K. and Das, M. (2014). Selected Innovations for Open and Distance Learning System COMOSA Journal, NIOS:Delhi pp 1-29.
[2] Mishra, S. (2006). Quality Assurance in Higher Education: An Introduction. NAAC: India. p. 27-28. Retrieved from http://www.naac.gov.in/docs/Quality%20Assurance%20in%20Higher%20Education%20An%20Introduction.pdf on 27 July 2017.
[3] Chaney, B. H. (2007). History, Theory and Quality Indicators of Distance Education: A Literature Review. Texas: Texas A&M University. https://www.eurashe.eu/library/modernising-phe/mobility/virtual/WG4%20R%20distanceed.pdf
[4] Darojat, O., Nilson, M., and Kaufman, D. (2015). Quality Assurance in Asian Open and Distance Learning: Policies and Implementation. Journal of Learning for Development. 2(2), 19 pages. http://jl4d.com/index.php/ejl4d/article/view/105
[5] Paton, R.A., and McCalman, J. (2000). Change Management: A Guide to Effective Implementation. (Second Edition). London:Sage,
[6] Moore, M. G., & Kearsley, G. (1996). Distance education: A systems view ofonline learning. Boston, MA: Wadsworth Publishing.
[7] Koul, B. N. (2006). Towards a culture of quality in open distance learning: Present possibilities, in Koul, B.N. and Kanwar, A. (eds), Towards a Culture of Quality, Vancouver: COL.
[8] ODLQC (2006). Open & Distance Learning Quality Standards. Retrieved from https://www.odlqc.org.uk/odlqc-standards
[9] DEAC. (2017). Accreditation Handbook. Retrieved from http://www.deac.org/UploadedDocuments/2017-Handbook/2017-Accreditation-Handbook-Part-Three.pdf
[10] Rama, K., Hope, A and Coomaraswamy, U.(2009) (Eds.) Quality Assurance Toolkit for Distance Higher Education Institutions and Programmes. Vancover:COL. http://oasis.col.org/bitstream/handle/11599/105/pub_HE_QA_Toolkit_web.pdf?sequence=1&isAllowed=y
[11] AAOU. (2010). Quality Assurance Framework. Retrieved from http://aaou.upou.edu.ph/quality-assurance-framework/
[12] Controller of Publications. (2017) University Grants Commission (Open and Distance Learning) Regulations, 2017. The Gazette of India (Extraordinary). Delhi: Controller of Publications, India. Retrieved from http://www.ugc.ac.in/oldpdf/regulations/distance%20education%20regulations.pdf
[13] Tribus, M. (1996). Quality in Education According to the Teachings of Deming and Feuerstein. School Psychology International. 14-19. Retrieved from www.growthmindseteaz.org/files/Feuerstein and deming.pdf
[14] Bowen, G. A.(2009). Document Analysis as a Qualitative Research Method, Qualitative Research Journal, 9 (2), pp. 27-40.
[15] Jung, I., Wong, T. M., Li, C., Baigaltugs, L., and Belawati, T. (2011). Quality assurance in Asian distance education: Diverse approaches and common culture. International Review of Research in ODL, 12(6), Retrieved from http://files.eric.ed.gov/fulltext/EJ963932.pdf
[16] Srivastav, M. (2016). Report of the current status of ODL institutions in India. CEMCA: Vancouver.
[17] Kelafas, P. Retalis,S., Stamatis, D. and Theodoros, K.(2003) Quality assurance procedures and e-ODL. Paper presented at the International Conference of Networking and e-learning, 8-9 May (2003), Valencia, Spain. Retrieved from: http://pps.teithe.gr/QAeODL.pdf
[18]. Chen, L., Ali Babar, M., and Nuseibeh, B. (2012). Characterizing Architecturally Significant Requirements. I E E E Software, 30(2), 38 - 45.

49
[19] Federal Communications Commission". (1999). FCC on Telecommunications Accessibility for the Disabled. Retrieved from http://transition.fcc.gov/Bureaus/Common_Carrier/Orders/1999/fcc99181.txt
[20] Esaki, K. (2013). System Quality Requirement and Evaluation: Importance of application of the ISO/IEC25000 series, Global Perspectives on Engineering Management, 2 (2), pp. 52-59
[21] SOMS. (2005). Unit 8, Other Concepts, Tools and Techniques, Total Quality Management (MS-96), IGNOU:School of Management Studies, pp. 256-261.
[22] Jung, I. (2005). Innovative and Good Practices of Open and Distance Learning in Asia and the Pacific, APEID, UNESCO Bangkok Occasional Paper Series, Paper No. 3.
[23] IGNOU Profile 2016. Navdharana. New Delhi:IGNOU, p 66.
[24] Creating minds. (2015). All creative tools. Retrieved from http://creatingminds.org/tools/tools_all.htm
[25] Kandiko, C. B, and Mawer, M. (2013). Student Expectations and Perceptions of Higher Education. London: King’s Learning Institute. Retrieved from https://www.kcl.ac.uk/study/learningteaching/kli/People/Research/student-expectations-perceptions-HE.aspx
[26] Western Association of Schools and Colleges. (2013). The Guide to Evaluating Distance Education and Correspondence Education, USA: California. Retrieved from http://accjc.org/wp-content/uploads/Guide-to-Evaluating-DE-and-CE.pdf

50
INTEGRATING OER INTO AN ONLINE TUTORIAL IN ODL SETT ING: AN EXPLANATORY STUDY
Maximus Gorky Sembiring 1 1Universitas Terbuka (INDONESIA)
Abstract
Projecting qualities relatable to the success of incorporating open educational resources (OER) into online tutorial supports in open distance learning (ODL) configuration were explored. It was aimed at elucidating factors combined, how and in what routines they were interrelated. Explanatory-design was adopted. Five variables quantitatively involved: success of integrating OER (dependent); institutional (moderating); social, pedagogical and attitudinal (independent). Questionnaires and queries for quantitative-qualitative purposes were developed. Respondents were randomly chosen by distributing 550 questionnaires to 750 Universitas Terbuka tutors; 306 were completed. Seven hypotheses were scrutinized utilizing structural equation model (SEM); six were statistically validated. Main variable influencing success factor was attitudinal followed by institutional and social. Institutional was influenced by pedagogical, social and attitudinal. Quantitative procedure was generally substantiated by qualitative. Nevertheless, pedagogical was statistically excluded and moderating was qualitatively pedagogical instead of institutional. Further inquiry is essential to reconsider how and why this slight distinctive effect was occurred.
Keywords: ODL, OER, online tutorial, explanatory-design, SEM
1 INTRODUCTION This report is an expansion of comparable study as reported by Zubir, Sembiring and Rustam (2015) with slight modified approach, attribute and respondent. In general, they are still in the corresponding measures. The discussion is in the field of open educational resources (OER) with respect to online tutorial supports for student in open distance learning (ODL) milieu. OER are now understood as a sustainable way forward for reaching education for all in each level of formal and non-formal education. Developing countries can specifically benefit owing to the movement of OER from developed countries (Kawachi, 2013); including for Indonesia through Universitas Terbuka experiences. OER are defined as a small self-contained entity of a self-assessable teaching and learning package with quantifiable learning objective. They are mostly in a digital electronic configuration, frequently are open and free to use as well.
Given adjustment to higher education milieu and the rising hazards and prospects posed by socially disruptive powers of information and communication technology (ICT), universities can no longer prolong running academic services as usual. They have recognized this transformed reality by adopting business style involves active transformation of process, operation, and system. Institutions experimenting with OER and massive open online courses (MOOCs) for example are now making numerous courses available easily (de Hart, 2014). For the proliferation of open content online is accelerating globally, content delivery by itself is no longer sufficiently compelling value proposition in higher education environment.
Correspondingly, the large-scale stream of an online learning and their advantages due to how Internet technologies incorporated well with ODL are extensively explored in the last several years. Exponential advancement in ICT, online tutorial has become progressively well-liked model for most students (Zang, Perris & Yeung, 2005). This signifies various prospects for continued progression of OER by providing current and prospective students with a greater flexibility to acquire high quality education (Devine & Lokuge, 2012). Internet technologies amalgamation enhance student connectivity and potentially strengthen learning atmosphere with emerging accepted technologies and tutor’s involvement (Susilo, 2014; Price, Richardson & Jelfs, 2007).
Up to the mid of 1990’s, including in Universitas Terbuka traditions, student segregation has been publicized as a normal problem and customarily perceived as a force of attrition; issues related to persistence and/or retention (Bean, 1985; Tinto, 1993; Sawitri & Sembiring, 2013). By careful notion,

51
entering the end of 1990s, Universitas Terbuka acclimatized online tutorial supports to purposely bridge student gap in accessing and acquiring academic supplies. Universitas Terbuka has ratified exceptional functions in the country by offering more than 170 courses through online tutoring services, with a non-OER at that time; as the beginning of actual online learning. Since then, more than 850 courses by 2017, which account of all feasible courses proffered, have been altered into totally or partially blended to online courses (Universitas Terbuka, 2017). Institutionally, these numbers are harmoniously accomplished related to what was quantified in the University strategic and operational plans (Universitas Terbuka, 2015).
In an effort of widening OER in Universitas Terbuka, at least in the last ten years, “Sumber Pembelajaran Terbuka” or SUAKA UT, dedicated portal for students acquiring OER content without restraints, was officially established through http://www/ut.ac.id/OER (Universitas Terbuka, 2013). The portal has features to access various OER-content: (i) internet television or ITV, (ii) web supplement, (iii) “guru pintar online” (GPO, dedicated portal for students of Faculty of Education and Teacher Training), (iv) digital library (Diglib), and (v) Universitas Terbuka radio broadcast (UT Radio). At this stage, they are offered in a separate entity.
This implies that they are not merged in the sense of integrating those online tutorial supports contained integrated OER. All the same, the University plans to have 50% of courses were offered in the form of integrated multimedia learning materials (IMLM, containing blended OER) by 2015 and 75% by 2016 (they were both accomplished); and 100% by 2017; these are still in the progress (Universitas Terbuka, 2015 & 2017).
To illustrate (2016 for example), student body was totalled to 333.501. The records showed entrees to the ITV=52,822; web supplement=778,398; GPO=436,023; and Diglib=4,636,545. In addition, the number of IMLM was still less than 75% in 2015/2016 (Universitas Terbuka, 2017). Given those facts, there are critical issues classified twofold, namely: (i) number of IMLM produced is still lower than that it was initially planned and (ii) the participation rate of entrees to http://www/ut.ac.id/OER is considered to be relatively low. All the same, it was strongly believed the role of this portal was substantial to improve student performance.
It is therefore critical to foresee how OER can be incorporated into an online tutorial support and do encourage an amenable learning atmosphere for quality education and cost-effectiveness through Universitas Terbuka traditions. Additionally, what are factors involved and in what routines they are interrelated. The inquest was therefore mainly aimed at elucidating crucial issues on amalgamating OER into online tutorial service productively for students benefit. In addition, it was of importance to classify how those factors were interconnected one another and in what routines.
2 RELATED LITERATURE
Online learning is now the fastest growing trends in education with the help of technology. Students in online learning setting performed modestly better than that of those receiving solely traditional classical instructions. The advantage over the classes was significant contrasting blended learning with traditional instruction but not contrasting purely in online with face to face conditions. Studies using blended learning tended to involve additional learning time, instructional resources, and course elements that encourage interactions among students themselves (Means, Toyama, Murphy & Baki, 2013). Online learning has become popular because of its potential delivering in a more flexible way and access to content where the instruction can be happened at any time, from any place, and by any one.
The motivation for online learning programs often entails: (i) increasing availability of learning experiences for learners who cannot or prefer not to attend traditional class, (ii) assembling and disseminating instructional content in more efficient costing, and (iii) providing access to qualified resources to students in places where such experts are not available. Online learning advocates additional reasons for embracing instruction mode including current technological support of an interactivity degree, social networking, collaboration, and reflection can enhance learning atmosphere relative to normal classroom context (Rudestam & Schoenholtz-Read, 2010).
Dual concepts of sharing and reutilizing underpinning OER are not new. Masterman, Wild, White and Manton (2011) summarized them by describing OER can be viewed as latest in a number of initiatives to encourage good pedagogic practice, including reuse of resources. Additionally, OER can be compared with learning objects, noting similarities in challenges to widescale use (accessibility,

52
discoverability, granularity, reusability) and the differences. This implies the presence of online learning (primarily in online tutoring scheme) and OER are remarkably phenomenal in the last decade.
Stimulated by Atkins, Brown and Hammond (2007), the amalgamation of OER with online tutoring configuration can be largely described as teaching and/or learning resources or properties that reside in the public domain or have been published under an intellectual property license allows free of use or re-purposing by any group. They might comprise full courses, course materials, modules, textbooks, audio/video streaming, evaluation, software, and other tools or techniques used to keep entry and access to knowledge.
Universitas Terbuka is also guided to amalgamate OER by incorporating them into online tutorial services. It is believed that by integrating OER into such service will bridge students get through the subjects they undertake positively. Starting from the last five to six years back, OER in Universitas Terbuka becomes gradually an integral part of academic services and mainly through ICT-based mode of delivery. Factors on integrating OER into online tutorial is positively getting more urgent.
Various factors can be universally recognized in conjunction with issues on integrating OER into online tutorial support. To certain extent, those factors, identified by Nagashima (2014), can be justified from institutional, pedagogical, and social outlooks. Besides, teaching conceptualization, confidence, recognition to combining material, and readiness (as part of attitudinal factor) can also be utilized to validate those factors (Masterman et al., 2011). This implies success pattern can be comprehensively defined as measurement of institutional, pedagogical, social, and attitudinal factors. Those success factors can be perceived analytically from utility, availability, accessibility, affordability, and applicability dimensions (Zang, Perris & Yeung, 2005; Varnhagen & Digdon, 2002; MacKinnon & Williams, 2006).
Table 1. Variables and Dimensions Involved
No Variables Dimensions Remarks
1 Social Factor
X1
X11: Social view X12: Localization X13: Diffusion X14: Awareness X15: Preference X1-3, X4 and Y were
independent, moderating and dependent variables successively Every variable has five dimensions. Each dimension has two questions
Y was influenced by X1-4
X4 was influenced by X1-3
2 Pedagogical Factor
X2
X21: Focus of subject X22: Interactivity X23: Provenance X24: Relevance X25: Granularity
3 Attitudinal Factor
X3
X31: Conceptualization X32: Recognition X33: Confidence X34: Readiness X35: Responsibility
4 Institutional Factor
X4
X41: Reputation X42: Funding X43: Resources X44: Discoverability X45: Regulation
5
The Success of Integrating OER into an Online
Tutorial Support Y
Y1: Utility Y2: Availability Y3: Accessibility Y4: Affordability Y5: Applicability
In the operational level, elaborated and summarized notion of Nagashima (2014), Masterman et al. (2011) and Rosell-Aguilar (2007) on institutional factor can be defined as extent dimensions of reputation, funding, resources, discoverability, and regulation. Pedagogical factor can be defined as a weight of subject focus, interactivity, provenance, relevance, and granularity. Social factor is defined as quantity of social understanding, localization, diffusion, awareness, and preference. Attitudinal factor is defined as magnitude of conceptualization, recognition, confidence, readiness, and responsibility.

53
Before establishing the operational framework, it is worth to notice the success scheme of integrating OER into online tutorial service is determined by four main variables. To ease the design from quantitative view, they are systematically displayed in Table 1.
Now, it is the stage of establishing the initial operational framework harmoniously with the structure exhibited in Table 1 and then followed by dimensions as illustrated in Figure 1. This framework is then used as a basis to determine design, methodology, instruments and ways of ensuing analysis accomplished under quantitative and then followed by qualitative procedure.
3 DESIGN, METHODOLOGY AND HYPOTHESES
This study utilizes mixed methods, i.e., explanatory design (Creswell & Clark, 2011). The research is prearranged and executed under quantitative approach first and then followed by qualitative series. Two main instruments are developed with respect to the variables and dimensions involved. They are: (i) instrument in the form of questionnaires for quantitative purpose and (ii) the list of inclusive queries for the sake of review, interview and focus-group discussion sessions for qualitative purpose.
After reflecting on Table 1, we may establish the initial operational framework of the study (Figure 1). Both Table 1 and Figure 1 specified main points have effects on the success factors of integrating OER (Y) into online tutorial support. They are relatable to institutional, pedagogical, social, and attitudinal factors. In other words, the success factor (Y, dependent variable) was assessed by perceiving variables (and their dimensions) of institutional (moderating variable, X4), social (X1), pedagogical (X2) and attitudinal (X3); the last three factors (X1-3) are the independent variables.
Figure 1. The Initial Opeartional Framework
Y was measured by utility (Y1), availability (Y2), accessibility (Y3), affordability (Y4), and applicability (Y5). X1 was quantified by subject focus (X11), interactivity (X12), provenance (X13), relevance (X14), and granularity (X15). X2 was enumerated by social view (X21), localization (X22), diffusion (X23), awareness (X24), and preference (X25). X3 was weighed by conceptualization (X31), recognition (X32), confidence (X33), readiness (X34), and responsibility (X35). In addition, X4 was signified by reputation (X41), funding (X42), resources (X43), discoverability (X44), and regulation (X45). These are the structure of the framework; from and for quantitative purposes.
Instrument in the form of questionnaire was developed consisting of 50 questions in total (Likert Scale, 1-5) related to the five variables engaged (Tjiptono & Chandra, 2011). This implies each variable has five dimensions and each dimension is measured by two statements. Five hundred and fifty questionnaires were provided and distributed to around 700 tutors of Universitas Terbuka in March-April 2017 from all over Indonesia as authorized respondents; and 306 of them were finally completed. Besides, set of queries were systematically arranged for qualitative purposes accomplished afterwards related to the five variables involved for deeper inquiry through interview and focus-group discussion.

54
The variables are quantitatively explored through questionnaire. A survey is then started to assemble data from respondents (Fowler, 2014). A simple random sampling technique was selected to determine eligible respondents for quantitative purpose. Purposive sampling technique for qualitative procedure was chosen to select eligible experts as resources persons of the study (Cochran, 1977; Sugijono, 2012). SEM is finally utilized to detect the level of relations power on the variables and dimensions engaged (Wijayanto, 2008; Hair, Black, Babin & Anderson, 2009).
This approach finally scrutinizes seven hypotheses, H1-7 (Figure 1). They are: the success of integrating OER into an online tutorial support is influenced by social (H1), institutional (H2), pedagogical (H3), and attitudinal (H4) factors. Likewise, institutional is influenced by: social (H5), pedagogical (H6), and attitudinal (H7) factors.
4 RESULTS AND DISCUSSIONS
Before conferring the results, it is constructive to represent respondent characteristics (Table 2) to augment better perception on the discussions prior to deducing the final remarks.
Table 2. Characteristics of the Respondents
Faculty [Tutor]
Education 35%
Social Science 24%
Economics 22%
Maths/Science 19%
Admin 0.00%
Experience 1–5 year
3% 6–10 year
16% 11–15 year
22% 16–20 year
42% 21++ year
17% Age year < 29=5% 30-39=17% 40-49=27% 50-59=40% 60+ =11%
Involvement in OER year
< 1=9% 1–2=21% 3–4=44% 5–6=18% 7+ = 8%
Credential Professor
0% Sen. Lecturer
15% Lecturer
80% Ass. Lecturer
4% Non-Lecturer
1% Degree Doctoral=6% Master=92% Bachelor=2% Diploma=% Office Central 33% Regional 67%
The next results of analyses are detailed in the following interpretation and related figure and table (Figure 2 and Table 3).
Figure 2. Hypotheses and the Loading Factors Results
Figure 2 clearly displays one out of seven hypotheses was not validated by the analysis. That is H3=1.70, as the tvalues ≤ 1.96 (for α=5%). This means that pedagogical (X2) factor does not significantly influence the success factor of integrating OER into online tutorial (Y). The other six

55
hypotheses are positively and directly confirmed by the analysis. They are: (1) H1=1.97 (social influenced the success factor of integrating OER), (2) H2=3.88 (institutional influenced the success factor), (3) H4=6.97 (attitudinal influenced the success factor), (4) H5=39.48 (social influenced institutional factor), (5) H6=42.67 (pedagogical influenced institutional factor), and (6) H6=31.96 (attitudinal influenced institutional factor), as the tvalues ≥ 1.96 (for α=5%).
Having positioned all dimensions involved in accordance with related variables under quantitative measurement, it is the time to relate their loading factors. This is to observe the power of relations among variables and/or dimensions engaged and their behaviour (one and another) under SEM approach. It was aimed at working out the end results originated from and illustrated in Figure 2.
Figure 2 observably displays five prime quantitative upshots, as follows:
1. The first effect is related to the most influencing factor on the success of integrating OER into online tutorial. That is attitudinal factor (X3=0.79) and then successively followed by institutional (X4=0.51) and social (X1=0.40) factors.
2. The second finding is concerning the order of dimensions of the three main influential variables. They are successively clarified as follows:
• Attitudinal factor (X3) – respondents categorized confidence (X33=0.81) in the first level and then followed respectively by recognition (X32=0.72), responsibility (X35=0.70), readiness (X34=0.66), and conceptualization (X31=0.62). This implied the integration of OER should cautiously consider the attitudinal characteristics in a more comprehensive connotation. Tutor confidence is critically important. This means that no quality online tutorial contained OER if the tutors are not fully self-reliant.
• Institutional factor (X4) – respondents placed reputation (X41=0.80) in the first rank and then consecutively followed by funding (X42=0.76), discoverability (X44=0.71), resources (X43=0.70), and regulation (X45=0.58). This implied the integration of OER should carefully consider these dimensions from quite broader perspectives. It is important to find and adopt OER from reputable producers. This is to maintain the quality of provided services.
• Social factor (X1) – respondents put two dimensions simultaneously in the first position, namely localization and preference (X12=X15=0.78) and then respectively followed by awareness (X14=0.77), social view (X11=0.74) and diffusion (X13=0.71). This entailed the integration of OER should thoughtfully consider social attributes with high intent. The management should be responsive considering both localization and preference aspects in amalgamating OER into online tutoring as contextualizing OER is effective if and only if we put our self on students side.
3. The third outcome is linked to the order of dimensions in the dependent variable (Y). Respondents obviously considered availability (Y2=0.78) as the most crucial dimension in integrating OER into online tutorial element. The others are subsequently arranged as: accessibility (Y3=0.76), applicability (Y5=0.71), affordability (Y4=0.70), and utility (Y1=0.68). This implied the first thing should come to mind on the success factor of integrating OER into online tutorial support is the availability of all necessary resources including man, money, and material. This must be seriously taken into account to assure the integration is abounding.
4. The fourth end is connected to invalidated hypothesis, that is the pedagogical factor (X2). Despite it does not significantly influence the dependent variable (Y), but through moderating variable (X4), respondents put relevance (X24=0.79) as the most determined dimension and then followed successively by interactivity (X22=0.78), provenance (X23=0.77), granularity (X25=0.75), and focus of subject (X21=0.74). The integration of OER should guarantee that the plan is especially dispersal in the aspect of relevance.
5. The fifth result is interrelated to the power of relation on independent to the moderating variables. The result confirms that pedagogical (X1=0.91) is the foremost influential factor to institutional (X4) and then followed sequentially by social (X2=0.89) and attitudinal (X3=0.82) factors. Correspondingly, despite the instruction is delivered on ICT-based, pedagogic aspect in assuring multi-way communication and/or feedback mechanism should be naturally in place. It does not make any difference whether it is an online delivery or classical face to face interaction thoughtful attention to pedagogical aspect should cautiously be considered from institutional perspective.

56
Prior to validating conclusive line of argument on the unified qualitative and quantitative results, it is sensible to reflect whether or not the results under SEM is in a ‘good fit’ category as illustrated in Table 3.
Table 3. Goodness of Fit of the Tested Operational Framework
Goodness of Fit Cut-off Value Results Notes RMR (Root-Mean Square Residual) < 0.05 or < 0.1 0.046 Good Fit
RMSEA (Root-Mean Square Error of Approximation) ≤ 0.08 0.087 Marginal Fit GFI (Goodness of Fit Index) ≥ 0.90 0.990 Good Fit
AGFI (Adjusted Goodness of Fit Index) ≥ 0.90 0.990 Good Fit NFI (Normed Fit Index) ≥ 0.90 0.990 Good Fit
CFI (Comparative Fit Index) ≥ 0.90 1.000 Good Fit NNFI (Non Normed Fit Index) ≥ 0.90 1.000 Good Fit
IFI (Incremental Fit Index) ≥ 0.90 1.000 Good Fit RFI (Relative Fit Index) ≥ 0.90 0.999 Good Fit
This is to assure the reliability of the results in comprehending the final outcomes based on hypotheses and loading factors analysis acquired. The analysis, based on the results as exhibited in Table 3, was almost all concluded in the ‘good fit’ category. One result (RMSEA) is nevertheless categorized in a marginal fit category. This implied the initial operational framework is in fact highly dependable. The conceptual and operational frames are parallel one another. Despite one marginal fit category is there, it is still positively valuable to use quantitative upshot as a point of reference to extrapolate and pursue and/or compare the results to qualitative approach afterwards. It is related to reconfirmation of the power and level of their interrelations.
Correspondingly, three underlying evaluations have to be explored in-depth to inventively make used of attained consequences. The first consequence is on the distinctive results found under exploratory-design, i.e., qualitative versus qualitative effect. The second is justification adjacent to approach used (refer to respondents’ characteristics). The third effect is on the implication of findings for future consideration if comparable topic will be conducting later.
First, under quantitative procedure, pedagogical factor (X2) has uniquely no effect to the dependent variable, whereas it qualitatively has. Despite it differs, it does not imply that it absolutely contradicts one another. Besides, pedagogical factor essentially has an effect to the success of integrating OER even though it is through the moderating variable (institutional factor, X4). Conceptually, this is tolerable as the relations can be direct or even indirect. To certain extent the result accomplished is still supporting each other. In short, the initial operational framework is quantitatively acceptable with institutional factor as the moderating and pedagogical as one of independent variables respectively. To certain extent, it was found from qualitative inquiry that the selected respondent (expert) firmly agreed upon that the initial operational framework along with its dimension and the initial ranks. Above all, qualitative inquiry came to an end that the pedagogical factor (X2) also influenced the success of integrating OER into online tutoring scheme as one of independent variables.
Theoretically, explanatory sequential design was conducted by first collecting and analyzing data quantitatively and then followed by qualitative procedure prior to interpretation (Creswell & Clark, 2011). It aims at explaining quantitative results further details. Therefore, connecting the two strands (quantitative data analysis to qualitative collection coupled with using quantitative result to make decision on qualitative research questions, sampling, and data collection in the second phase) become a crucial detail. The end results show one out of seven hypotheses established (as series of quantitative effects) are not accomplished in chorus. As one hypothesis is not validated by the analysis (pedagogical factor, X2), it then implies that the qualitative inquiry is much more suitable to be explained than that of quantitative explanatory findings.
Second, referring to respondents’ features (Table 2), it can be enlightened most respondents categorized at a high qualified level staff viewed from educational degree and background, working experience and age, and qualification in Universitas Terbuka context. Nonetheless, most of them have a limited experience in OER, as only 26% of them get involved in OER movement for five years or more. It is then plausible that most of them may not been able to foresee pedagogical factor along with its dimension as a pivotal entity favourably have an effect to the dependent variable directly. Besides, most respondents are holding master degree qualification, they may not be sensitive enough yet to foresee pedagogical is reciprocally able to succeed the integration of OER into online tutorial support.
Third, anticipating comparable research for further inquiry so it is more corresponding to improve academic performance, it is then prominent to explore the magnitude of respondents. The respondents

57
are not limited to the tutors from Universitas Terbuka only but also by welcoming faculty and/or experts from other universities and institutions. By involving them, it will enlarge the effects obtained accordingly with the operational framework (quantitative inquiry) in amalgamating OER into online tutorial support at large. Sensible insight is necessary to be wisely perceived to avoid probable limitation and failure in retrieving the harmony between quantitative and qualitative outcomes. Searching and espousing other relevant methodology is pertinent to guarantee the inquiry under quantitative and qualitative procedures or vice versa will be more functional and appropriate.
Surprisingly, however, another expert (as one of selected resource person in this study) strongly believed the other way around on the position of pedagogical and institutional factor as the moderating variable. Here, pedagogical is then the moderating variable instead of the institutional. This view makes the quantitative upshot is distinctively different from the qualitative end. Despite the institutional factor from quantitative approach is not the main influential factor to the dependent variable (Y), and in fact the second, but it was firmly placed as the moderating variable; while an expert put them in the different attitude (again, pedagogical is the moderating variable instead of institutional).
These are the three main motives behind why different views (pedagogical is the moderating instead of institutional variable) did conversely occur. First, the effectiveness of integrating OER into an online tutorial support cannot be separated from academic perspectives; it is abundantly surrounded by both academic strategy and academic atmosphere. Pedagogical factor included subject focus, interactivity, provenance, relevance and granularity. These five attributes are altogether tightly related to academic ambiance itself; while the institutional factor is not totally within an academic perspective.
Second, social and attitudinal factors are essentially in the same range as institutional variable. They are less-connected one another viewed from methodological perspective to academical outlooks. In other words, from methodological approach, it is more appropriate to categorize institutional to social and attitudinal factors rather than that of pedagogical.
Third, the resource person on this study had experiences not only in tutoring schemes within ODL setting but also had been involved and practicing OER for more than 30 and 10 years respectively. Therefore, pedagogical factor is finally positioned as the moderating variable by the expert. This standpoint is clearly different from what was previously obtained from the initial quantitative operational framework. There is a limitation of 10 pages. All pages’ size should be A4 (21 x 29,7cm). The top, bottom, right, and left margins should be 2,5 cm. All the text must be in one column and Arial font, including figures and tables, with single-spaced 10-point interline spacing. [Arial, 10-point, normal, justified alignment]
5 CONCLUSIONS
Inquiry on factors affecting success of integrating OER into online tutorial encountered trivial difference between what was completed under quantitative versus qualitative approach. This implies that the established quantitative framework is imperfectly explained yet. Conversely, the qualitative analysis did so. It is unfortunate, they differ both in one of hypothesis testing and in the position of the moderating variable.
It is noticeable that deeper inquiry is critical to be implemented to find the reasons behind the difference. The end result nevertheless is still useful for the University to be reflected in prioritising critical factors should be cautiously taken into account on how to integrate OER along with its dimensions into online tutorial support for students’ necessities.
By means of explanatory sequential design, as part of mixed methods, the inquiry is able to show up four main variables leading to the success of integrating online tutoring plans. They are orderly displayed along with their dimensions and ranks, plus six validated hypotheses out of seven. The adoption of OER movement can be regarded as a hint that the University is on the right path despite around 26% of tutors got experienced in OER for five years or more.
It is very constructive to record that most tutors classified attitudinal as the most influential variable to integrate OER into online tutorial lucratively. This implies the University should conquer this outcome by concentrating on the five dimensions within this variable. The confidence of tutors is the most vital factor to integrate OER successfully into online tutorial support. The University is well-adviced to anticipate other four dimensions to secure the adoption, integration and implementation of OER into academic practice, so they will not obstruct the faculty getting involved successfully in the future.

58
Conjecturing this know-how is universally typical in ODL, the management and academic would then be well-advised to consider on variables studied along with their associated dimensions previously discussed. It aims at dedicating them indisputable thoughts that attitudinal becomes central component to sustain completion of OER as integral part of focus in ODL to meet student expectation.
ACKNOWLEDGEMENT
I would like to express my great gratitude to all the 39 Directors of Universitas Terbuka Regional Offices throughout Indonesia for their sincere supports to make this paper is finally accomplished.
REFERENCES Aitkens, D. E., Brown, J. S., & Hammond, A. L. (2007). A review of OER movement: Achievements,
challenges and new opportunity. Report to the William & Flora Hewlett Foundation. Bean, J. P. (1985). Interaction effects based on class level in an exploratory model of college student
dropout syndrome. American Educational Research Journal, 22(1), 35-64. Cochran, W. G. (1977). Sampling techniques. 3rd Ed. New York: John Wiley & Sons. Creswell, J. W., & Clark, V. L. P. (2011). Designing and conducting mixed methods research. 2nd Ed.
Los Angles: Sage Publication. De Hart, K. (2014). Open education resources strategy 2014-2016 of University of South Africa. Office
of Pro-Vice Chancellor, the University of South Africa.
Devine, J., & Lokuge, W. (2012). Engaging distance students through online tutorials. Proceedings of the 2012 AAEE Conference, Melbourne, Victoria.
Fowler, F. J. Jr. (2014). Survey research methods. 5th Ed. Los Angeles: SAGE. Hair, Jr., J. F., Black, W. C., Babin, B. J., & Anderson, R. E. (2009). Multivariate data analysis with
readings. 7th Ed. New Jersey: Prentice Hall. Kawachi, P. (2013). Quality assurance guidelines for open educational resources: TIPS framework.
Version 1.0. New Delhi: CEMCA. MacKinnon, G., & Williams, P. (2006). Models for integrating technology in higher education: The
physics of sound. Journal of College Science Teaching, 35(8), 22-25. Masterman, L., Wild, J., White, D., & Manton, M. (2011). The impact of OER on teaching and learning
in UK universities: Implications for learning design. In Cameron, L. & Dalziel, J. (Eds). Proceedings the 6th International LAMS and Learning Design Conference: Learning design for a changing world, 135-144. Available at http://lamsfoundation.org/lams2011sydney/papers.htm.
Means, B., Toyama, B., Murphy, R., & Baki, M. (2013). The effectiveness of online and blended learning: A meta-analysis of the empirical literature. Teachers College Record, 115(3), 1-47.
Nagashima, T. (2014). What makes open education thrive? Examination of factors contributing to the
success of open education initiatives. The International Journal for Innovation & Quality in Learning, 3(03), September 2014, 10-21. Available at: http://innoqual.efquel.org/.
Price, L., Richardson, J. T. E., & Jelfs, A. (2007). Face-to-face versus online tutoring support in distance
education. Studies in Higher Education, 31(1), February 2007, 1-20. Rosell-Aguilar, F. (2007). Changing the roles in online tutorial support for ODL through audio-graphic
SCMC. The JALT CALL Journal, 3(1-2), 81-94.

59
Rudestam, K. E., & Schoenholtz-Read, J. (2010). The flourishing of adult online education: An overview. In Rudestam, K. E., & Schoenholtz-Read, J. (Eds.). Handbook of online learning, 1–18. Los Angeles: Sage.
Sawitri, H. H., & Sembiring, M. G. (2013). Visualizing impending features shaping persistence viewed
by Universitas Terbuka students at Denpasar Regional Office. Paper presented at the 27th Asian Association of Open Universities Annual Conference, hosted by Allama Iqbal Open University, Islamabad, Pakistan,1-3 October 2013.
Sugiyono. (2012). Metode penelitian kombinasi. Bandung: Penerbit Alfa Beta. Susilo, A. (2014). Emerging technologies accepatnce in online tutorials: Tutors’ and students’ behavior
intenstions in higher education. Open Praxis, 6(3), 257-274. Tinto, V. (1993). Leaving college: Rethinking causes and cures of student attrition. 2nd Ed. Chicago:
University of Chicago. Tjiptono, F., & Chandra, G. (2011). Service, quality and satisfaction. Yogyakarta: Andi. Universitas Terbuka. (2013). Universitas Terbuka online services. 1st Ed. November 2013. Tangerang
Selatan: Universitas Terbuka. Universitas Terbuka. (2015). Strategic and operational planning of Universitas Terbuka 2014–2021.
Tangerang Selatan: Universitas Terbuka. Universitas Terbuka. (2017). Rector’s office yearly report for 2016. Tangerang Selatan: Universitas
Terbuka. Varnhagen, C. K., & Digdon, N. (2002). Helping student read reports of empirical research. Teaching
of Psychology, 29(2), 160. Wijayanto, S. H. (2008). Structural equation modelling - Lisrel 8.80. Yogyakarta: Penerbit Graha Ilmu. Zhang, W. Y., Perris, K., & Yeung, L. (2005). Online tutorial support in ODL: Students’ perceptions.
British Journal of Educational Technology, 36(5), 789-804. Zubir, E., Sembiring, M. G., & Rustam. (2015). Major attributes underwriting the integration of OER into
online tutorial service. Paper presented at the 29th Asian Association of Open Universities Annual Conference, hosted by Open University Malaysia, Kuala Lumpur, 30 November-2 December 2015.

60
UT WEBSITE USER SATISFACTION IMPROVEMENT MODEL BASED ON PERCEIVED USEFULNESS, PERCEIVED EASE OF US E,
PERCEIVED INFORMATION QUALITY AND PERCEIVED SYSTEM QUALITY (CASE STUDY ON PAGE WWW.MAKASSAR.UT.AC.ID )
Nina Utami Y Sanusi 1, I Made Gunawan Sanjaya 2, Andi Sylvana 3
1Universitas Terbuka (INDONESIA) 2Universitas Terbuka (INDONESIA) 3Universitas Terbuka (INDONESIA)
Abstract
In every opportunity, the Open University always strives to provide the best service for all parties primarily to the UT academic community. Various efforts have been made including providing information services about the UT through the website, thus facilitating the flow of information flowing to the remote areas and can be accessed by all groups. In order for web services provided to be effective and generate satisfaction for UT web service users it is necessary a model to increasing user satisfaction based information system services in terms of Perceived Usefulness, Perceived Ease of Use, Perceived Information Quality Dan Perceived System Quality. This study aims to determine the level of satisfaction of UT web service users in terms of Perceived Usefulness, Perceived Ease of Use, Perceived Information Quality Dan Perceived System Quality case study on web pages www. Makassar.ut.ac.id. Using the sample of 60 web page user respondents, the result that Perceived Usefulness, Perceived Ease of Use, Perceived Information Quality Dan Perceived System Quality are able to significantly influence UT website user satisfaction and the dominant influence was Perceived Ease of Use, Perceived System Quality, Perceived Usefulness and last Perceived Information Quality. On this basis finally formed a model that can be made recommendations in improving user satisfaction UT website services. Keyword: website, satisfaction, improvement, perceived, quality. 1. INTRODUCTION
The on-going advances of technology information have significantly affected how society behaves. Such advances have changed the concept of what it means to be social. One of the upsides is that the information access is able to overcome time and space barriers. The advances are seamless and ubiquitous, permeating in every aspect of life including education. Universitas Terbuka (UT), as a long-distance education institution, heavily depends on the information technology for its academic productivity. The most essential part of learning at UT is the space-time separation between students and UT also students and tutors mediated by the information technology.Improving the service quality, most particularly access to information about registration and learning experience for its students, prompts UT to develop a website at each Unit of Distance Learning (UPBJJ). UPBJJ-UT Makassar for South Sulawesi has developed and operated www.makassar.ut.ac.id since 2012. The website anticipates the needs of both prospective and existing students for information about UT and addresses them, which, in turn, encourages user satisfaction. However, website-related problems are common among users. Among them are access difficulty, loading speed, outdated information and download speed. To resolve such problems, a model for improvement to user satisfaction with respect to the perceived usefulness, perceived ease of use, perceived information quality and perceived system quality is necessary. This is the focus of this study that aims to measure the rate of web-user satisfaction at www.makassar.ut.ac.id based on those aforementioned dimensions.
2. LITERATURE REVIEW AND HYPHOTESIS DEVELOPMENT
2.1 Perceived Usefulness Davis (1989) in Kartika (2006) defines perceived usefulness as a condition in which an individual believes that using a particular system will enhance his/ her work performance. The notion of usefulness roots from the definition of “useful” which is “capable of being used advantageously.” Perceived

61
usefulness is the benefit from which an individual obtain during the technology use. Within the context of user service, this benefit is closely related to the adjustment of available information to users’ needs. Similarly, Jogiyanto (2003) defines perceived usefulness as the extent to which the use of technology affects user work performance. This affects the individual’s belief in the process of decision making. This decision making leads to a successful adoption of a given information system.
2.2 Perceived Ease of Use Perceived ease of use refers to the degree to which an individual believes that a particular technology is easily used (Davis, 1989 in Kartika, 2006). Perceived ease of use is critical as to how an individual operates a particular technology in achieving maximum work performance and time management. Easy-to-use technology does not require a great deal of effort and time in operating a certain system. Use frequency and user interaction may define the perceived ease of use. A more frequently-used system indicates a more commonly-known and easily-used system (Goodwin and Silver in Adam et al., 1992 in Irmadhani, 2005).
2.3 Perceived Information Quality Information quality holds three information components, which are data clarity, data accuracy and comprehensive information format. In addition, information quality generates an economic value in the process of decision making on resource allocation that makes the information an important economic resource. Similarly, DeLone and McLean (1992) describe that information quality measures the quality of an output generated from a certain information system. Furthermore, Romney and Steinbart (2006) classify a number of dimensions that measure information quality, which are relevance, reliability, completeness, timeliness, understandability and verifiability. Such dimensions serve as prerequisites to gaining high-level information quality, which, in turn, generate high-level user satisfaction. This is consistent with prior work by Leclercqs (2007), Wixom and Todd (2007), Livari (2005), Palmer (2002) and Rai et. al (2002) that found a positive effect of information quality on user satisfaction. 2.4 Perceived System Quality In a study by DeLone and McLean (1992), system quality refers to a characteristic of information inherent in the system itself, which impacts the extent to which the system is able to generate benefits to users. Guimares et al. (1992) state that system quality reflects user satisfaction of a computer system, while Davis et al. (1989) and Chin and Todd (1995) associate system quality with perceived ease of use that impacts the benefits generated by a system. Kulkarni et al. (2006), Wu and Wang (2006) and Halawi et al. (2007) describe that system quality is posited to drive use intention, which, in turn, is posited to induce user satisfaction. This is in line with prior findings by Chiu et al. (2007), Hsieh and Wang (2007), Almutairi and Subramanian (2005), Livari (2005) and McGill et al. (2003) that identified a strong influence of system quality on user satisfaction. 2.5 Website-User Acceptance and Satisfaction Satisfaction of a certain information system relates to how users perceive the information system on a practical basis, rather than on a technical basis (Guimares, Staples and McKeen, 2003). In theory and in practice, often user satisfaction applies to the measurement of the effectiveness of information system (Melone, 1990). This is consistent with prior findings by DeLone and Mclean (1992), McKiney et al. (2005), Rai et al. (2002), McGill et al. (2003), Almutairi and Subramanian (2005) and Livari (2005) that concluded the quality of information system was strongly associated with user satisfaction.
2.6 Hypotheses Development The model in this study proposed a number of hypothesized relationships as follows: H1: Perceived usefulness will be positively and significantly related to user satisfaction of UT website. H2: Perceived ease of use will be positively and significantly related to user satisfaction of UT website. H3: Perceived information quality will be positively and significantly related to user satisfaction of UT
website. H4: Perceived system quality will be positively and significantly related to user satisfaction of UT
website.

62
3. METHOD
3.1 Research Design
This study was designed as an explanatory analysis that sought to verify the hypothesized relationships by elaborating phenomena based on a scientific examination. The independent variables included in this study are perceived usefulness, perceived ease of use, perceived information quality and perceived system quality, while the dependent variable is user satisfaction of ut website.
3.2 Participants
Method for data collection in this study is cross-sectional survey. The population comprises the entire students at UPBJJ-UT Makassar who use web service at www.makassar.ut.ac.id. The samples were acquired from random sampling and the questionnaires were delivered online. The collected data were gathered from 60 respondents.
3.3 Instrument Data collection was completed using questionnaires with a 5-point likert scale ranging from 1 (strongly disagree or highly dissatisfied) to 5 (strongly agree or highly satisfied).
Variable Indicators Code
Perceived use-
fulness (X1)
I obtain fast and up-to-date information. A1
UT website enables me to gain information without leaving home or workplace, which maximizes time efficiency.
A2
All of the provided information is sufficient enough. A3
Perceived ease of
use (X2)
Learning how to access UT website is not complicated. B1
Universitas Terbuka always provides the latest information about tuton implementation.
B2
The facilities at UT website are easily accessed and comprehensible. B3
Perceived information
quality (X3)
Important information about UT activities is provided well in advance before the implementation.
B21
UT website always provides the latest information about UT activities.
B22
UT website always announces the closing date of each academic activity.
B23
Each information at UT website is presented in detail. B24
Perceived system quality (X4)
UT website always provides contact-person service that enables users to obtain more detailed information.
B31
The facilities at UT website meet my expectation and need. B32
The facilities at UT website always support my academic activities. B33

63
3.4 Data Analysis
To gain adequate results, the instrument in this study was measured using validity and reliability test to avoid errors that might affect the accuracy of data collected. Then, multiple linear regression was run to acquire the results of model testing, the effects between the variables and the dominant variables. In terms of validity test, an item was a valid measure only to the extent that it scored above 0.40 at a significance level of 95% within a group of items representative of the variables to be measured. In terms of reliability test, Cronbach’s Alpha, coefficient and item-total correlation were applied to examine whether each variable was reliable. Each variable scored above 0.60, which generated reliable variables and indicated internal consistency. To assure the effects between variables, p-value must score ≤ 0,05 to ensure the significant effects of the independent variables on the dependent variable, at a confidence level of 95% and a maximum deviation standard of 5%.
4 RESULTS
4.1 Validity And Reliability
The results of validity and reliability test are presented in Table 2:
Table 2 The Results of Validity and Reliability
Variable Indicator
Validity Cronbach’s
Alpha Reliability
Min. Max.
X1 0.701 0.908 Valid 0.760 Reliable
X2 0.540 0.754 Valid 0.787 Reliable
X3 0.539 0.832 Valid 0.786 Reliable
X4 0.445 0.788 Valid 0.888 Reliable
Y 0.417 0.988 Valid 0.792 Reliable Source: SPSS Output, processed in 2017 Table 2 shows that the minimum value of validity is above 0.2 and the alpha is above 0.6, which indicates that the questionnaires are applicable for the respondents.
4.2 Frequency Distribution
The recapitulation of frequency distribution of respondents on web-user satisfaction based on the perceived usefulness, perceived ease of use, perceived information quality and perceived system quality is provided in Table 3:
Table 3. Recapitulation of Web-User Satisfaction Based on Perceived Usefulness, Perceived Ease of Use, Perceived Information Quality and Perceived System Quality
Variable * Cross Tabulation of Respondent Answers
Count
Respondent Answers
Total Low Moderate High
Variable X1 1 4 55 60
X2 0 10 50 60
X3 0 8 52 60
X4 0 5 55 60
Y 0 8 52 60
Total 1 35 264 300
Source: SPSS output, processed in 2017

64
The table shows that overall the perceived usefulness, perceived ease of use, perceived information quality and perceived system quality are classified in high category, which leads to high-category user satisfaction of UT website.
4.3 Multiple Regression Analysis
Multiple regression was performed to model the relationships between the independent variables and dependent variable. The results are seen below:
Table 4. The Results of Multiple Regression
Independent Variable Dependent Variable
T Sig t
Perceived Usefulness (X1)
Web-User Satisfaction
(Y)
9.674 .0.00
Perceived Ease of Use (X2)
8.897 .000
Perceived Information Quality (X3)
19.931 .000
Perceived System Quality (X4)
2.082 0.42
R2 .961 Adjusted R2 .959 F 341.966 Sig F .000
Source: SPSS Output, processed in 2017 The results are interpreted as follows:
1. R2 of 0.961 (96.1%) is the rate of the simultaneous effects of perceived usefulness, perceived ease of use, perceived information quality and perceived system quality on user satisfaction of UT website. The remaining 3.9% accounts for other factors not included in the model.
2. FCal of 341.96 with alpha of 0.00 (less than 0.05) indicates that perceived usefulness, perceived ease of use, perceived information quality and perceived system quality simultaneously have positive and significant effects on user satisfaction of UT website.
3. TCal of 9.674 with alpha of 0.000 (less than 0.05) indicates that perceived usefulness has a positive and significant effect on user satisfaction of UT website, given that the other factors which may affect the level of user satisfaction remain constant. Seddon (1997) defines perceived usefulness as the extent to which stakeholders belief that applying a certain system will enhance empoyee performance, and, in turn, organization productivity. Similar definition is also proposed by Raid (2009) who states that perceived usefulness refers to the degree to which a system encourages a great deal of effectiveness from which users benefit. This is aligned with prior work by Rai et. al (1992) who found a strong relationship between perceived usefulness and user satisfaction using three Information System Success Models developed by DeLone and McLean (1992) and Seddon (1997). The third model was also from Seddon (1997) which was modified by exploring the relationship between perceived usefulness and system use. Similar to prior finding by Zviran (2005) and Adams (1992), this study concludes that perceived usefulness positively affects user satisfaction. Hypothesis 1, that perceived usefulness will be positively and significantly related to user satisfaction of UT website, is accepted.
4. TCal of 8.897 with alpha of 0.000 (less than 0.05) indicates that perceived perceived ease of use has a positive and significant effect on user satisfaction of UT website, given that the other factors which may affect the level of user satisfaction remain constant. According to Davis (1989), perceived ease of use is defined as the extent to which an individual beliefs that a certain technology will relieve users of unnecessary tasks. Perceived ease of use is based on the degree to which a new technology enables a great deal of convenience for prospective users. Teo et al. (1999) state that perceived ease of use has both direct and indirect influence on the use of Internet service. Similarly, Nysveen et al. (2005a, b) describe the underlying factors of mobile-service consumption are perceived usefulness and perceived ease of use. Therefore, hypothesis 2, that perceived ease of use will be positively and significantly related to user satisfaction of UT website, is accepted.

65
5. TCal of 19.931 with alpha of 0.00 (less than 0.05) indicates that perceived information quality has a positive and significant effect on user satisfaction of UT website, given that the other factors which may affect the level of user satisfaction remain constant. Information is generally deemed of high quality when it adequately represents its data clarity, data accuracy and comprehensiveness. This notion is aligned with Romney and Steinbart’s (2006) who categorize the dimensions of information quality into relevance, reliability, completeness, timeliness, understandability and verifiability. Information quality also has a set of economic values that fit in decision making on resource allocations which make the information content a valuable economic resource. Similarly, DeLone and Mclean (1992) claim that information quality measures the quality of an output generated from an information system. Prior work by Leclercqs (2007), Wixom and Todd (2007), Livari (2005), Palmer (2002) and Rai et al. (2002) concluded that improved information quality would increase the likelihood of improved user satisfaction. Therefore, hypothesis 3, that perceived information quality will be positively and significantly related to user satisfaction of UT website, is accepted.
6. TCal of 2.082 with alpha of 0.42 (less than 0.05) indicates that perceived system quality has a positive and significant effect on user satisfaction of UT website, given that the other factors which may affect the user satisfaction remain constant. Guimares et al. (2003) point out that the concept of user satisfaction of a certain information system lies in how users perceive the given information system on a practical basis, rather than on a technical basis. Melone (1990) describes that the concept, both in theory and in practice, is often used to measure the effectiveness of information system; greater information system will result in greater user satisfaction. Prior work by DeLone and McLean (1992), McKiney et al. (2002), Rai et al. (2002), McGill et al. (2003), Almutairi and Subramanian (2005) and Livari (2005) indicated that the quality of information system positively affected user satisfaction. Hypothesis 4, that perceived system quality will be positively and significantly related to user satisfaction of UT website, is accepted.
5 CONCLUSION Based on the calculation results and analysis, the study settles on a number of conclusions as follows:
1. User intention to use UT web service is determined by user perception on its usefulness. The rate of user satisfaction goes up as the perceived usefulness of UT web improves.
2. Perceived ease of use is important in the development of UT web service in terms of how easy users access the facilities and contents of the web.
3. Information quality affects user satisfaction in a way that it is able to generate and deliver benefits for users within UT web service.
4. System quality of UT web service is built on the aim of meeting user requirements. As the system quality improves, the rate of UT web-user satisfaction becomes significant.
REFERENCES
[1] Adams, D.A., R.R. Nelson & P. A. Todd. 1992. Perceives Usefulness, Ease of Use, and Usage of Information Technology: A Replication. MIS Quarterly. Vol. 16 No. 2: Hal. 227- 247
[2] Almutairi, H. & Subramanian, Girish, H., 2005, “An Empirical of the DeLOne and McLean Model in the Kuwaiti Private Sector”, The Journal of Computer Information System, Spring, 45,3, pg.113
[1] Chin, W.C. dan Todd, P.A. 1995. On the Use, Usefulness and Ease of Use of Structural Equation Modelling in MIS Research: A Note of Caution. MIS Quarterly, Vol. 19 No. 2, pp. 237-46
[2] Chiu, C. M., Chiu, C. S. & Chang, H. C. 2007. Examining the integrated influence of fairness and quality on learners’ satisfaction and Webbased learning continuance intention. Information Systems Journal 17(3), 271–287
[3] Davis, F.D., 1989, “Perceived Usefulness, Perceived Ease of Use, and Acceptance of Information System Technology,” MIS Quarterly, Vol.13, No.3, pp.319-339.
[4] DeLone, WH., dan McLean, ER. 1992. Information Systems Success: The Quest for the Dependent Variable. Information System Research, 3(1), 60-95

66
[5] Guimaraes, T., D. S. Staples, dan J. D. McKeen. 2003. Empirically Testing Some Main User-Related Factor for Systems Development Quality. Quality Management Journal 10, No. 4: 39- 54.
[6] Guimaraes, T., M. Igbaria, and M. Lu. 1992. The determinants of DSS success: An integrated model. Decision Sciences 23, no. 2: 409-430
[7] Halawi, L. A., Mccarthy, R. V. & Aronson, J. E. 2007. An empirical investigation of knowledge-management systems’ success. The Journal of Computer Information Systems 48(2), 121–135.
[8] Hsieh, J. J. P. A. & Wang, W. 2007. Explaining employees’ extended use of complex information systems. European Journal of Information Systems 16(3), 216–227.
[9] Irmadhani. 2005. Pengaruh Persepsi Kebermanfaatan, Persepsi Kemudahan Penggunaan Dan Computer Self Efficacy, Terhadap Penggunaan Online Banking Pada Mahasiswa S1 Fakultas Ekonomi Universitas Negeri Yogyakarta. Program Studi Akuntansi Fakultas Ekonomi Universitas Negeri Yogyakarta
[10] Jogiyanto, HM. 2003. Sistem Teknologi Informasi. Edisi 1. Andi, Yogyakarta [11] Kartika, Shinta Eka. 2009. Analisis Proses Penerimaan Sistem Informasi Icons Dengan
Menggunakan Technology Acceptance Model Pada Karyawan PT. Bank Negara Indonesia (Persero) Tbk. Di Kota Semarang. Program Studi Magister Akuntansi Program Pasca Sarjana Universitas Diponegoro
[12] Kulkarni, U. R., Ravindran, S. & Freeze, R. 2006. A knowledge management success model: theoretical development and empirical validation. Journal of Management Information Systems 23(3), 309–347
[13] Leclercq, A. 2007. The perceptual evaluation of information systems using the construct of user satisfaction: case study of a large French group. The Database for Advances in Information Systems 38(2), 27–60
[14] Livari, Juhani, 2005, “An Empirical Test of the DeLone and McLean Model of Information System Success”, Database for Advances in Information Systems, Spring, 36,2. pg.8
[15] McGill, Tanya, Hobbs, Valerie, & Klobas, Jane, 2003, “User-Developed Applications and Information Systems Success: A Test of DeLone and McLean’s Model”, Information resource Management Journal; Jan-Mar; 16.1. pg.24
[16] McKiney, V., Yoon, K., and Zahedi, Fatemeh, 2002, “The Measurement of Web- Customer Satisfaction: An Expectation and Disconfirmation Approach”, Information System Research, 13,3.
[17] Melone N.P. 1990, ”A Theoretical Assessment of The User Satisfaction Construct in Information System Research”, Management Science. January.
[18] Nysveen, H., Pedersen, P.E., Thorbjornsen, H. and Berthon, P. (2005), “Mobilizing the brand: the effects of mobile services on brand relationships and main channel usage”, Journal of Service Research, Vol. 7 No. 3, pp. 257-76
[19] Palmer, A., 2002. Website Usability, Design and Performance Metrics. Information System Research, 13 (1), 151-167
[20] Rai, A., Lang, S.S. and Welker, R.B., 2002. ”Assessing the Validity of IS Success Models: An Empirical Test and Theoretical Analysis”, Information System Research, Vol.13, No.1. pp. 29-34.
[21] Raid, Moh’d Al-adaileh, 2009. An Evaluation of Information Systems Success: A User Perspective - The Case of Jordan Telecom Group. European Journal of Scientific Research, 37 (2), 226-239
[22] Romney, Marshall B., dan Paul John Steinbart. 2006. Sistem Informasi Akuntansi, Edisi 9, Salemba Empat, Jakarta
[23] Seddon.P.B. 1997. A Respecification and Extension of The DeLone and McLean’s Model of IS Success. Information System Research.8 September. 240-250
[24] Teo, T. S. H.; Lim, V. K. G.: and Lai, R. Y. C. 1999. Intrinsic and extrinsic motivation in internet usage. The Internet Journal of Management Science, 27, 25-37
[25] Wixom, B. H., & Todd, P. A. 2007. A theoritical Integration of User Satisfaction and technology Acceptance. Information system research, 85-102
[26] Wu, J-H & Wang, Y-M. 2006. Measuring KMS Success: A Respecification of the DoLone and McLean’s Model. Information and Management. pp: 728-739
[27] Zviran, M., Plskin, N., dan Levin, R., 2005. Measuring User Satisfaction and Perceived Usefulness in The ERP Context. The Journal of Computer Information Systems, Spring 2005, 45 (3)

67
QUALITY OF LEARNER SUPPORT SERVICE AND DISTANCE LEARNERS’ PERCEPTIONS: A CASE STUDY
Sutapa Bose
School of Education, Indira Gandhi National Open University, New Delhi (INDIA)
Abstract
Quality of learner support service (LSS) being one of the determinants of the quality of distance education, this case study examines the quality of the LSS of a distance teacher education programme, offered by the Indira Gandhi National Open University. An in-depth and systematic exploration of the variables has been carried out within a real-life context, and as the data obtained is described and judgments are added to the findings, the case study is of descriptive and evaluative type. This article describes the LSS of this programme, and thereafter it examines learners’ problems and perceptions during three phases of the programme. For the first phase that began with the enrolment of the first batch, and was marked by numerous complaints from learners, it analyses the content of the complaints, and codes them to identify learners’ problems, perceptions, and the factors causing the problems. It re-examines these aspects in the next phase, when multi-pronged interventions were provided for supporting interactions. In the third phase too, it examines these aspects when the interventions were coupled with attempts to repair the support system. The study suggests that (i) as the LSS had not been shaped by the theoretical propositions on distance learners’ needs, it affected interactions and consequently learners’ perceptions; (ii) retaining theoretically sound distance education practices in future collaborative ventures will be essential as even meritorious teachers on becoming distance learners, need support.
Key words: teacher education programme; distance mode; learner support; impact; learners’ perceptions
1 INTRODUCTION
The quasi permanent separation of teachers and distance learners ([6]) in open and distance learning (ODL) is bridged through dialogues and two way communication (([2]; [5]). This necessitates learner support service (LSS). The quality of LSS is hence, one of the determinants of the quality of ODL ([11]).This study therefore draws out a theoretical perspective from the literature describing the role of LSS in ODL ([8];[10];[12][15];[16]) and uses it to evaluate the quality of the LSS of the Certificate Programme for Professional Development of Primary Teachers (CPPDPT). This programme is offered by the Indira Gandhi National Open University (IGNOU), an ODL university of India to a target group comprising about 13,000 teachers.
This article describes the main features of the CPPDPT, especially it’s LSS for presenting the context of the study. Next it examines learners’ problems and perceptions about the programme during three phases. It examines the content of learners’ complaints of the first phase that began with the enrolment of the first batch of learners in July 2014, and codes them for identifying learners’ problems and perceptions about the programme, and also traces the factors causing the problems. It re-examines these aspects in the second phase that began from July 2015 when multi-pronged interventions were provided to support learners. In the third phase that began from July 2016, too, it examines these aspects, when the interventions were coupled with attempts to repair the support system. 2 REASEARCH QUESTIONS The research questions of the study are:
• What were the problems faced by learners? • What was the impact of the problems on learners’ perceptions? • What caused the problems?

68
3 CONTEXT OF THE STUDY
In India many teachers with training for teaching at the secondary level, teach at the elementary level. India’s Right to Education (RTE) Act framed in 2009 however mandates that such teachers must pass a six months bridge course that makes them qualified for teaching at the elementary level. Therefore, the Kendriya Vidyalaya Sangathan (KVS), a government school system of India, with many such teachers in its 1068 schools, signed a memorandum of collaboration (MoC) with IGNOU for the bridge course. IGNOU’s School of Education (SOE) subsequently developed the CPPDPT. The CPPDPT comprises a theoretical component, which is taught mainly through Self Learning Material (SLM) in the print medium, and a 15 day face to face Personal Contact programme (PCP). Term End Examination (TEE) and assignments are the means for summative assessment while learning is assessed continuously during the PCP of this programme. The programme is offered twice a year through programme study centres (PSCs), and its minimum duration is six months, but learners can complete it within its maximum duration of 18 months. 3.1 LSS of the programme
Traditional face to face academic counseling integrates tutoring and counseling ([12];[14]) but is isolated from instructional processes. The view that it should be replaced with learner support, which is integrated into technology mediated instruction ([9];[17]) is gaining ground but several distance education institutions maintain the traditional approach ([15]). IGNOU being one such institution, it activates conventional teacher education institutions as PSCs for its teacher education programmes and makes them the sites for academic counseling and the PCP. However, for the CPPDPT programme it has activated PSCs at KVS schools for supporting learners from the school hosting the PSC as well as those from nearby schools. Further, it appointed KVS teachers of secondary and senior secondary levels instead of teacher educators as academic counselors, and the school principal, instead of an experienced teacher educator as the Programme in Charge (PIC) of the PSC. The KVS therefore provides learners as well as LSS providers for the programme. The LSS design was thus changed radically with the assumptions that KVS teachers being meritorious are not likely to require LSS, and senior teachers can provide it to those requiring it. In keeping with IGNOU’s policy, the SOE organised a 2 day face to face orientation programme for these academic counselors.
4 RESEARCH METHOD
Case study method has been used for studying the LSS of the CPPDPT programme and learners’ problems and their perceptions have been examined during six academic sessions. A contemporary phenomenon (LSS) was therefore investigated within its real-life context through an in-depth and systematic exploration of the same variables (learners’ problems and perceptions) repeatedly ([23]) during successive phases. The study is also descriptive and evaluative as the data obtained is described and judgment is added to the findings ([24]). However, the cohort considered for the study was not constant as a new cohort of learners comprising new entrants, and those who had enrolled earlier but had not passed was generated during every admission session. Nevertheless, the cohorts were homogeneous as they comprised a mix of old and young KVS primary teachers, having similar academic qualification and workplace experience. 4.1 Data collection
Numerous complaints made through emails and phone calls marked the first phase, and revealed learners’ problems and perceptions. In the second phase there was a sharp decline in the number of such emails and phone calls, and in the third phase there were no complaints. Therefore, data was collected mainly through a semi structured group interview of learners attending the PCP at PSCs in the second phase, and only through it in the third phase. As each PSC had about 50 learners I interviewed 450 learners at 9 PSCs. The sample of learners for the interview was thus purposive. The interview covered topics pertaining to the SLM (timely delivery, relevance and comprehensibility); PCP activities (duration, relevance, and systemic problems); assessment (norms and procedures); academic counselling, and general perception about the

69
programme. Reports of the SOE faculty members who visited other PSCs corroborate my findings, and along with the emails and phone calls they underline the similarity in learners’ problems and perceptions across India.
4.2 Data analysis
General inductive approach has been used for content analysis of the data. The data was therefore reduced to a summarised form that links the research questions and the findings, and helps to establish a theory ([19]) about learners’ problems, perceptions and their causes. As one segment of text can be coded into more than one category ([19]) some categories have overlapping codes. In vivo coding method has been used for drawing in the learners’ voice, and hence, the actual language used by the participants has been used for coding ([13]).
5 DATA AND ITS DISCUSSIONS
The data and its discussion for the three phases are as follows:
5.1 First phase
The data, summarized as codes, sorted into categories and abstracted as general themes, is presented as a framework (Table1) that places learners’ problems in the perspective of distance learners’ needs. Table 1- learners’ problems and needs
Theme Categories Codes Independent learning habit and autonomy
Time management
Can’t find time for this programme.
No time to write assignments.
Didn’t have time to study for TEE.
Self-regulated learning How can we learn using SLM?
Didn’t know that the programme guide mentions the date for submitting TEE form. Didn’t know the programme guide has information about assignment submission.
Familiarity with IGNOU’s systemic aspects
Structure of IGNOU
Which office should I contact?
Whom should I contact?
IGNOU’s policies What is credit transfer?
Can’t we have TEE in months other than June & December? I want to change my PSC
Terms used (jargons) at IGNOU
I got IGNOU’s ‘books’. What is ‘credit’? Is CPPDPT a ‘course’ or a ‘programme’? What is ‘TEE’? What is ‘PSC’? What is ‘academic counselling’?
Awareness about the programme
Programme’s genesis
Why is IGNOU offering this programme?
Why have assessments? Programme objectives How will the programme benefit me?
Using SLM SLM receipt Don’t know from where to get the SLM. SLM use The content is difficult.
Content load is too heavy.

70
Want SLM in Hindi medium. Awareness about assessment
Assignment No time to write assignments. Why is it compulsory?
PCP Why do we need to write activity reports? TEE Memorizing the SLM is difficult.
2 hours aren’t enough. Awareness about PCP
Duration and timing The PCP duration is too long. I shall miss my vacation.
Information about the rules guiding the PCP
I missed the PCP. I want to attend the PCP but at my hometown.
Consent for enrolment and undisrupted learning tenure
Consent for enrolment
No one asked me whether I wished to enroll. Is there any incentive? I have already passed a similar course. But I teach music. I shall retire before the programme is over. How can I attend two programmes?
Transfer of teachers Now that I have been transferred, where is my PSC?
For reporting the findings emerging from the inductive analysis of the data, the themes (top-level categories) are used as main headings, and the categories comprising them are made meaningful through descriptions that include evidence from raw data indicating how the findings address the research question(s) and how the categories are related ([19]). The findings are therefore reported as follows: Independent learning habit: There were many complaints about the lack of time for the programme, and using SLM for TEE. A complaint summing up this says - ‘we didn’t have the time to unpack the big packet of books (SLM) that IGNOU has sent and there is no time for writing assignments and studying for exams, and using these books seems difficult’. Many learners also complained that they had missed the TEE as they were unaware of the last date for submitting assignments and TEE forms. Such complaints pointed to learners’ inability and/unwillingness to manage time, study independently, use the programme guide that has been developed as a tool to provide academic and systemic support, and thus indicated that learners had not evolved into autonomous and independent learners, required for distance education ([5]; [21]). Familiarity with IGNOU’s systemic aspects: Learners confusion between IGNOU’s Regional Centres (RCs) and the KVS’s Regional Offices (ROs), and lack of awareness about IGNOU’s policies and its administrative structure, led to complaints like- ‘our RO, which administers our school, instructed us to enroll in this course. We are therefore not sure whether to approach the RO or IGNOU’s main office (Head Quarters) or its office here (RC) for changing PSC.’ Learners were also not sure whether the CPPDPT was a programme or a course, and terms like TEE, credits, PSC, academic counselors, SLM, blocks and units seemed to be jargons for them. This reaffirmed that learners had neither been introduced to these terms nor to the programme guide that explains these terms; lists common problems, and the contact details of respective functionary(s); describes IGNOU’s structure, policies, and the rules for assignment submission, changing PSC, credit transfer, TEE timings, and the like. Awareness about the programme: Complaints like ‘all of a sudden IGNOU enrolled us in a six month in-service programme and that too with assessments, for reasons best known to it’, indicated that learners had enrolled in a programme about which they had neither awareness nor interest. Using SLM : Some learners had not received the SLM and were not aware of the office to be contacted for this problem. Many learners also complained that the SLM content was heavy as well as difficult, while some said that memorizing the SLM for the TEE would have been easier if it had been developed in Hindi medium. Learners’ lack of study skills, the ability to use SLM for meaningful learning, and awareness of the MoC stipulations regarding the medium of instructions were evident from these complaints.

71
Awareness about assessment: Learners complained against the assessment mechanisms, and essay type questions, and did not appreciate their utility for assessing conceptual clarity. They also detested the need for writing the activity reports for the PCP and the compulsion to pass tests. Older learners complained that they had passed university examinations long back and it was difficult for them to write assignments, and answer the TEE questions within 2 hours. These complaints revealed learners’ lack of awareness about the RTE mandate and the MoC requirements. Issues related to PCP: Learners felt that the PCP duration was too long and complained that it consumed a considerable part of their vacation. Some wished to attend it at a PSC at their home town, while many were anxious that they had missed the PCP. These complaints pointed to the lack of awareness about the MoC that stipulates the PCP duration; the flexible programme structure that allows completion of a component that has been missed in the subsequent session; and also about the grounds for changing PSC. Consent for enrolment and undisrupted learning tenure: A learner summed up a common complaint by saying ‘we enrolled as we were instructed to enroll, sacrificed our vacation, and went through the ordeal of changing the PSC but without understanding why.’ Many who were supposed to take leave had also enrolled, and a learner said, ‘I enrolled as per KVS orders, but my maternity leave is due.’ A learner on the verge of retirement said, ‘some of us shall retire soon, before the course is over, when we will apply the learning?’ Similarly, a music teacher said, ‘I teach music and cannot understand these courses.’ Learners who were already trained for elementary level teaching complained that the course content lacked novelty. Further, some learners had been nominated by the KVS for another in-service programme of 2 weeks duration that coincided with the PCP. One such learner summed up the problem by saying that ‘we have been nominated for two programmes simultaneously. Which one should we attend?’ The KVS policy of transferring teachers across KVS schools too led to many complaints. A learner said in this regard ‘following my enrolment I had a PSC but after my transfer, it is thousands of kilometers away. Where do I submit my assignment and where do I attend the PCP? IGNOU officials say that they need time to transfer me to a PSC here but the programme will be over soon.’ Another learner said ‘as transfers after enrollment result in assessment of various components of the programme at different PSCs, grades reach IGNOU from various PSCs. No wonder some of our colleagues’ grade cards are incomplete.’ The complaints exposed the hurried attempts to fulfill the RTE mandate without factoring in learners’ consent, convenience and eligibility for the programme. They also exposed that the LSS could not convey learners’ problems regarding nomination to the KVS, nor connect learners to IGNOU, nor generate awareness about the programme and the systemic aspects, autonomy, study skills, and motivation. The LSS therefore could not perform its central function of providing cognitive, affective, and systemic support ([15];[16]) and supporting interactions between learners, learners and tutors, and learners and the content ([8]). As interactions have a direct bearing on learners’ perceptions of learning experiences and perceived value of a course satisfaction ([7]; [20]; [22]), the inability of the LSS to perform its key role of supporting interactions ([1]; [3] [4]) affected learners’ perception about the programme, and also their satisfaction, and this resulted in poor retention ([18]) in this phase. Further the negative perception spread to prospective learners and antagonized them, and the KVS stalled nomination for the third session. As the academic counsellors taught school subjects to children, it is likely that they lacked the understanding of adult learners, content knowledge and the abilities to teach it, systemic knowledge with an understanding of distance learning and the administrative systems of the organizations, and the ability to serve as a link between learners and the institution, required for supporting learners ([10]) and this weakened the LSS. 5.2 The second phase There were no admissions in the July 2015 session but the programmes’ maximum duration being 18 months, there were a large number of learners of the preceding sessions who had not passed out. The programme therefore continued and SOE provided the following interventions:
• Proactive and reactive group mails about systemic issues to the ROs and PICs on a regular basis.
• Regular communication with IGNOU’s administrative divisions and the KVS for preventing and addressing learners’ problems.

72
• Visit to PSCs during the PCP by the SOE faculty members for supporting learners for academic and systemic issues and motivating them.
Although a few problems of the first phase continued in the second phase but there was a significant decline in the number of complaints. Further the data did not yield new codes, indicating that new problems had not emerged, and learners’ perception seemed to change from hostility to acceptance of the programme.
5.3 The third phase In this phase the interventions initiated in the second phase continued. It was however found that many academic counselors who had been oriented had been transferred from the schools activated as PSCs and those replacing them had not been oriented; and those oriented required more support. Therefore, a second orientation programme was organised to repair the LSS but the focus of the orientation was shifted from themes like genesis and history of ODL; ODL in India; SOE, and its activities and programmes; counseling skills, and the like, to need and structure of the programme; systemic problems commonly faced by learners; study skills; and feedback on assignments. In this phase the KVS too declared incentives for the pass outs. Learners ceased complaining in this phase. Further at the PCPs their keenness to complete the programme was obvious. One of them said ‘we would not have got 6 months leave for a conventional bridge course and without this programme we could not have retained our job.’ Learners’ however confirmed the absence of academic counseling and feedback on assignments. Therefore, it is likely that the support learners received was informal but continuous. Apart from change in learners’ perceptions about the SLM, the assessment system and the programme in general, another achievement of this phase was the drop outs seeking readmission to the programme. 6 CONCLUSIONS IGNOU has been offering teacher education programmes since the last few decades without instances of wide spread learners’ problems. Learners’ awareness of the benefits of a programme and willingness for enrolment undeniably sustain motivation and contribute towards self-regulated learning. Still IGNOU owes its student-teachers’ satisfaction to a large extent to the LSS, provided by teacher educators of conventional institutions. As these teacher educators teach teacher education programmes to adult learners and organize academic counselling sessions for distance learners, it is likely that their conceptual understanding of the policies governing teacher education vis à vis the programme objectives could have generated awareness about the programme’s significance in the first phase, and they would have also addressed learners’ problems with greater efficiency. KVS teachers’ lack of such experience and understanding was however too deep to be filled by an orientation programme having an ambitious scope but limited duration, and the LSS remained weak. The weakness of the LSS can be traced to its design, which lacked a sound theoretical framework, and to its design considerations that undermined the theoretical propositions on distance learners’ needs. However, when KVS teachers, who are reputed for being among the best teachers of India, became distance learners, non-fulfilment of these needs led to wide spread resentment that culminated in the discontinuation of admission to the programme. Subsequent interventions resumed admission to the programme, and with the attempts to strengthen the LSS, the complaints tapered off. Learners’ perception about the programme also changed, and the declaration of incentives for the pass outs by the KVS accelerated the change. Nevertheless, as the LSS could not be capacitated for academic counselling, the obligation towards learners remained partly unfulfilled. Therefore, for future collaborative ventures the need for retaining practices that have sound theoretical underpinnings will be important and partner institutions will have to be convinced about distance learners’ needs, the established practices for fulfilling them, and the risks involved in deviations based on assumptions.

73
REFERENCES
[1] Anderson, T. (2003). Getting the Mix Right: An updated and Theoretical Rational for Interaction. International Review of Research in Open and Distance learning, 4(2). http://www.irrodl.org/index.php/irrodl/article/view/149/230
[2] Baath, J.A.(1980). Postal Two Way Communication in Correspondence Education. Lund: Gleerup. [3] Billings, D. M., Connors, H. R., & Skiba, D. J.(2001). Benchmarking Best Practices in Web-based Nursing Courses. Advances in Nursing Science, 23, 41-52.
[4] Boyle, D. K., & Wambach, K.A.(2001). Interaction in Graduate Nursing Web-based Instruction. Journal of Professional Nursing, 17,128-134.
[5] Holmberg, B. (1989). Theory and Practice of Distance Education. London: Routledge, 161.
[6] Keegan, D. (1990). Foundations of Distance Education. London and New York: Routledge.
[7] Kuo,Y., Walker, A.E. , Belland, B. R.& Schroder, K.E.E.(2013 ). A Predictive Study of Student Satisfaction in Online Education Programs. The International Review of Research in Open and Distributed Learning.14(1). http://www.irrodl.org/index.php/irrodl/article/view/1338/2416
[8] Moore, M.G. (1989).Three Types of Interaction. American Journal of Distance Education. https://www.researchgate.net/publication/237404371_Three_Types_of_Interaction
[9] Moore, M.G. (2016). Flipped Classrooms, Study Centers Andragogy and Independent Learning, American Journal of Distance Education, 30(2), 65-67.
[10] O’ Rourke,J. (2003).Tutoring in Open and Distance Learning: A Handbook for Tutors.COL. http://www.col.org/SiteCollectionDocuments/odltutoringHB.pdf
[11] National Assessment and Accreditation Council (NAAC) & Commonwealth of Learning (COL) (2007). Quality Indicators for Teacher Education (2007).Bangalore: NAAC.
[12] Rekkedal, T. (1991). The Personal Tutor/Counsellor in Distance Education. An Experiment at NKI. Paper presented at the ZIFF-Ringkolloquium, FernUniversität, Germany, 1991. http://www.nettskolen.com/forskning/25/ziffpers.htm
[13] Saldana,J. (2009). The Coding Manual for Qualitative Researchers. Sage Publications: New Delhi, 74-75.
[14] Sewart, D. (1978). Continuity of Concern for Students in a System of Learning at a Distance, ZIFF Paper No. 22 (Hagen, ZIFF). In T.Rekkedal, & S.Qvist-Eriksen (Eds.). Internet-based e-learning, Pedagogy and Support Systems. NKI Distance Education.
[15] Simpson,O.(2016). Student Support Service for Success in Open And Distance Learning. CEMCA EdTech Notes 3-5.
[16] Tait, A. (2000). Planning Student Support in Open and Distance Learning. Journal of Open, Distance and e-Learning, 15(3), 287-299.
[17] Tait, A. (2014). From Place to Virtual Space: Reconfiguring Student Support for Distance and e-learning in the Digital Age, Open Praxis, 6(1). https://openpraxis.org/index.php/OpenPraxis/article/view/102/74
[18] Tinto, V. (2004). Student Retention and Graduation facing the Truth living with the Consequences. The Pell Institute for the Study of Opportunity in Higher Education. Occasional Paper1. http://www.pellinstitute.org/tinto/TintoOccasionalPaperRetention.pdf
[19] Thomas, D.R. (2006).A General Inductive Approach for analyzing Qualitative Evaluation Data. American Journal of Evaluation, 27, 237-246.

74
[20] Thorpe, M. (2002). Rethinking Learner Support: The Challenge of Collaborative Online Learning. Open Learning, 7 (2), 105-119.
[21] Wedemeyer,C.A.(1977). Independent Study. In A.S. Knowles (Ed.). The International Encyclopedia of Higher Education. Boston: Northeastern University.
[22] Yukselturk, E., & Yildirim, Z. (2008). Investigation of interaction, Online Support, Course Structure and Flexibility as the contributing Factors to Students’ Satisfaction in an Online Certificate Program. Educational Technology & Society, 11(4), 51-65.
[23] Yin, R.K. (2003). Case Study Research: Design and Methods (3rd edn.). Thousand Oaks, CA: Sage. 13.
[24] Zainal, Z. (2007). Case Study as a Research Method. Jurnal Kemanusiaan, 9. http://eprints.utm.my/8221/1/ZZainal2007-Case_study_as_a_Research.pdf

75
FACTORS AFFECTING STUDENTS’ RE-ENROLMENT: A MULTIPL E CASE STUDY IN THREE REGIONAL OFFICES OF UNIVERSITAS
TERBUKA
Sugilar
Universitas Terbuka, INDONESIA
Abstract
Students' re-enrollment in open and distance learning environment might be considered as an indication of learning quality and always attractive to study because of the uncertainty whether a student who enrolled in one semester will re-enroll in the next semester. This study used the multiple case study approach to identify factors influencing of students’ re-enrollment and employed the multiple logistic regression. Three regional office of Universitas Terbuka were selected for those cases, i.e. Jambi, Bengkulu, and Jakarta which involved 3539 students. This study focused on the new students enrolled in the 1st semester of 2016/2017 and re-enrolled in the 2nd semester of 2016/2017. The results showed that the percentage of new students enrolled in the 1st semester of 2016/2017 and re-enrolled in the 2nd semester of 2016/2017 in Jambi, Bengkulu, and Jakarta were respectively 82.6%, 85.1%, and 71.1%. The multiple logistic regression analysis revealed that (1) the students’ GPA and credits attained were the factors affecting students’ re-enrollment, the students with GPA above 2.0 were 3.5, 3.4, and 4.7 times more likely to re-enroll in Jambi, Bengkulu, and Jakarta respectively, and the students with credits attained above 84% were 3.1, 3.5, and 5.8 times more likely to re-enroll in Jambi, Bengkulu, and Jakarta; (2) the students who participated in an online examination were 12.0 and 4.0 times more likely to re-enroll in Bengkulu and Jakarta respectively, but the factor was not significant in Jambi; (3) the students who participated in a face-to-face tutorial were 2.3 and 1.7 times more likely to re-enroll in Bengkulu and Jakarta respectively, but the factor was not significant in Jambi. Some theoretical perspectives were discussed to explain the results and some recommendation for practice and future research were proposed.
Keywords: Re-enrollment, multiple case study, multiple logistic regression
1 INTRODUCTION
Background
Re-enrolment is an event that a student enrolled in one semester re-enrol in the immediate next semester. Students’ re-enrolment is a serious problem in Universitas Terbuka and probably also in any open and distance learning universities since the non re-enrollment phenomena could be an early warning for students’ withdrawal. Moreover, Universitas Terbuka does not apply drop-out regulation; students are permitted to decline to re-enroll in one term and start to re-enroll in the succeeding term or to decide to stop re-enrolling permanently without officially withdrawing. Simpson [1] noted that distance institutions are more prone to higher drop-out rates than the UK full-time average. In this case, identifying some factors affecting the student re-enrollment might thus be an attempt to diagnose students’ condition for academic success and to identify particularly appropriate measures to sustain the students’ commitment to remain re-enrolled until graduation.
Literature Review
Some literatures try to explain students’ condition for academic success and provide a theoretical framework to describe them. Using an expanded person-environment fit (P-E fit) model for college students of science, technology, engineering, and mathematics (STEM), Le, Robbins & Westrick [2] found that persistent learning behavior was affected by individual difference factors, including ability and interest. Similarly, describing why interaction in ODL is extremely important, Smart, Feldman & Ethington [3], relying on Holland’s theory, provided a theoretical linkage between variations in patterns of students’ success and students’ learning experiences as well as their interactions with different academic environments. First, students’ success embodies a function of the fit or congruence between

76
their personality types and their chosen academic environments. Second, students’ success is determined by the extent to which students learn the distinctive patterns of attitudes, interests, and abilities that are required, reinforced, and rewarded by their chosen academic environments, irrespective of the fit or congruence between their personality types and their chosen academic environments. This study principally could be applied to refer to open and distance learning as an academic environment, students’ academic attainment (GPA and credits attained) and participating in face-to-face or online learning support services as students’ learning experiences, and students’ re-enrollment as students’ success.
Dzakiria, Kasim, Mohamed, & Christopher [4] asserted that the structure of ODL provides learners with the greatest flexibility and provides control over time, place and pace of learning and that “one important element, in accordance with the flexibility, that tends to define success factors for students attending an ODL program is the level of interactivity within the student-tutor-content dyads.” (p. 1). It has thus become highly essential that to improve the ODL experience, decrease attrition rates and maintain long-term good standing, equitable provision of such interaction and interactivity should be a non-negotiable priority for ODL institutions. Similarly, research regarding the importance of interaction in ODL conducted by Choi, Lee, Jung, & Latchem [5] specified that “a lack of feedback from the instructors, heavy workload, and difficulties in studying at a distance were directive subjects to non-re-enrollment” (p. 1). The learners’ perceptions about the value of the degrees and their ages, gender, and educational backgrounds were also found to have generally stirred up decisions not to re-enroll. Although the factors of non-re-enrollment vary, Choi, Lee, Jung & Latchem [5] offered some suggestions that decreasing number of required credit hours per semester; a provision of upstanding social support; an introduction of a more flexible enrollment option; and better use of available technology and infrastructure to help both students and instructors build stronger learning communities.
Godfrey & Matos-Elefonte [6], on the identification of students’ success in college based on various student-level backgrounds and academic variables as well as school-level social and academic characteristics, demonstrated that characteristics at both levels play a role in the likelihood of reaching these goals. Similarly, Stephan, Davis, Lindsay, & Miller [7] described the early college success of students, identifying measures in the state longitudinal data system that predicts early college success, and examining the usefulness of those predictors. The study found that half the students achieved early college success by the composite of all three indicators, i.e.: enrolling in only non-remedial courses in the first semester, completing all attempted credits in the first semester, and persisting to the second year of college. The study also identified variables for student demographic characteristics, high school academic achievement, and behavior that might be related to whether a student achieved success in the early college years. Researchers at the University of Maryland University College [8] showcased an analysis of predictive models of students’ success in college that identified factors associated with the students’ success based on students’ GPAs and retention rates. The results showed that students’ performance in their first semester at UMUC remained crucial in relating to re-enrollment, retention, and graduation and the first term GPA might be an indicator of factors contributing to students’ success, beyond academic abilities. Sugilar [9] tried to predict the students’ re-enrollment and concluded that age, GPA, credits earned, and face-to-face tutorial participation were significant predictors for re-enrolment in ODL environment.
The aforesaid study results highlighted the role of interaction between students’ personal characteristics, utilizing learning resources within a learning environment, and feedback received by the students from the environment, to the students’ success in a learning environment. This study assumed that students’ personal characteristics (gender, age, marital status, and working status), academic achievement (GPA, credits attained), and utilizing learning resources (participating in online tutorial, online examination, and face-to-face tutorial) were the factors affecting the students success as indicating by re-enrollment.
Research Problem The main focus of this research was to identify factors affecting new students enrolled in one semester will re-enrol in the immediate next semester. UT has 40 regional offices which are spread out within huge areas in Indonesia. The factor affecting re-enrolment in one area is not certain will be affecting the students’ re-enrolment in other areas. Therefore, this study tries to test the factors affecting students’ re-enrolment within three regional offices as a multiple case study.

77
2 RESEARCH METHODS
This quantitative study aims to identify factors influencing of students’ re-enrollment. This study used the multiple case study approach. Three regional office of Universitas Terbuka were selected for those cases, i.e. Jambi, Bengkulu, and Jakarta. The Jambi regional office of UT has recently achieved the best regional office for accomplishing the target of numbered student in the 2nd semester of 2016/2017 and also the best regional office for the highest percentage of the students re-enrolled in the 2nd Semester of 2016/2017. The Bengkulu regional office is the winner of the rector award in 2016 for the best regional office in Indonesia and also recognized as the regional offices with the highest number of students participating in face-to-face tutorial. Meanwhile, the Jakarta regional office of UT is a regional office with the most numbered students with 15.596 students.
The new students of the 1st semester of 2016/2017 in the three regional offices (Jambi, Bengkulu, and Jakarta) consisted of 3539 students. The statistical technique used for analyzing the data was the logistic regression for analyzing the data of the new students enrolled in the 1st semester of 2016/2017 and re-enrolled in the 2nd semester of 2016/2017.
The dependent variable was the re-enrolment variable which was denoted by 1 for re-enrol and 0 for non-re-enrol student. The independent variables were the hypothetical variables that affecting students’ re-enrolment. The independent variables consisted of personal characteristics (age, gender, and marital status, academic achievement (GPA, credits attained), and student participation in learning support services (face-to-face-tutorial, online tutorial, and online examination),
The data analysis was conducted using multiple logistic regression, which was designed as a statistical technique in the late 1960s and early 1970s, and became routinely available in statistical packages in the early 1980s ([10]). Such logistic regression requires only the dependent variable to be binary, while the independent variables could be interval, ordinal, or categorical. However, to avoid too many blank cells and to generate convenient interpretable output, the variables GPA, credits attained, and ages were treated as categorical. The logistic regression represents relationship between the dependent variables and independent variables in a mathematical equation model:
log � ��1 − �� = + ���� + ���� + ���� + ⋯ + ����
where:
p = the probability of student’s re-enrolment
a = a constant
bi = coefficient of logistic regression for the ith independent variables.
The statistical significance of the individual regression coefficients (βs) should be tested with the Wald Chi-square statistic and Hosmer & Lemeshow test of the goodness of fit for testing that the model was a good fit to the data. Another parameter is Nagelkerke’s R2. It is for describing how much variation in the outcome that the model can explain.
3 RESEARCH RESULTS
3.1 Descriptive of Results
The 3539 new students in 1st Semester of 2016/2017 in the three regional offices of UT were categorized as re-enrolled and non-re-enrolled students in each regional office in 2nd Semester of 2016/2017 as shown in Table 1.

78
Table 1. Re-enrolment of the Three Regional Offices in 2016/2017
Regional Offices The Number of New Students enrolled in 1st Semester of 2016/2017
The Percentage of Students re-enrolled in 2nd Semester of 2016/2017
Jambi 518 428 (82.6%)
Bengkulu 1173 998 (85.1%)
Jakarta 1848 1314 (71.1%)
Total = 3539 Average = 79.6%
Table 1 showed that the average of students’ re-enrolment percentage of the three regional offices was 79.6%. The Bengkulu regional office of UT has the highest percentage of students’ re-enrolment by 85.1%. As describing earlier, Bengkulu regional office of UT has a reputation for being the best regional offices as it was the winner of the rector award in 2016. Bengkulu is also recognized as the regional offices with the most students participating in face-to-face tutorial. Meanwhile, Jakarta regional offices of UT, attaining re-enrolment level of 75.2%, is a regional office with the second highest number of students in 2017.
For the group of student personal characteristics, Table 2 showed that only in Jakarta that the gender variable differentiated the re-enrolment, there was 68.7% female re-enrolled and 73.7% male. For the students’ age variable, only in Bengkulu that the variable differentiated the re-enrolment, i.e. 87.3% for the students with age lower or equal to 24 years and 80.9% for age over 24. In Jambi, the 86.3% of married students were re-enrol more than percentage of unmarried students which was 78.5%. In Jakarta, the working status variable slightly differentiated the re-enrolment, the percentage of the unemployed students and the employed students who re-enrol were 69.6% and 71.3% respectively.
For the group of academic attainment variable (credit attained and GPA), in all three regional office, students’ credits attained differentiated the percentage of re-enrolment between the students with credits attained below or equal to 84% and the students with credit attainment more than 84%. In Jambi, the percentage was 78.1% for lower group of credits attainment and 95.0% for the higher. In Bengkulu, the percentage was 65.0% and 92.6%. In Jakarta, the percentage was 58.8% and 93.4%. When it comes to GPA, the re-enrolment percentage of students with higher GPA was much greater than the re-enrolment percentage of students with lower GPA, i.e. 78.1% and 95.0% in Jambi, 65.0% and 92.6% in Bengkulu, and 58.8% and 93.4% in Jakarta.
In group of utilizing support services variables, students’ using learning support services differed re-enrolment level in Jakarta and Bengkulu, but not in Jambi. Participation in online tutorial had greater effect in Jakarta, 51.7% for non-participating and 74.4% for participating. Participation in the online examination had greater effect in Jakarta, 70.3% for non-participating and 92.4% for participating. Participating in F2F tutorial had greater effect in Bengkulu, 62.8% for non-participating and 89.6% for participating. Unfortunately, there was no data for participation in F2F tutorial in Jambi.
Table 2. Percentage of Students’ Re-enroll among Regional Offices and Categories of Indicators
Predictors / (Variable Value) Jambi Bengkulu Jakarta 1. Gender
Female (0) 82.5% 83.6% 68.7% Male (1) 82.8% 87.0% 73.7%
2. Age ≤ 24 (0) 82.2% 87.3% 71.1% > 24 (1) 82.8% 80.9% 71.1%
3. Marital Status
Unmarried (0) 78.5% 85.7% 70.6% Married (1) 86.3% 83.0% 72.3%

79
4. Working Status
Unemployed (0) 80.7% 86.2% 69.6% Employed (1) 83.0% 84.3% 71.3%
5. Credits Attained
≤ 84% (0) 73.5% 75.9% 48.9% > 84% (1) 91.9% 94.1% 89.6% 6. GPA
≤ 2.0 (0) 78.1% 65.0% 58.8% > 2.0 (1) 95.0% 92.6% 93.4%
7. Participation in Online Tutorial
No (0) 83,6% 81.4% 51.7% Yes (1) 83.6% 88.9% 74.4%
8. Participation in Online Examination
No (0) 82.5% 84.6% 70.3% Yes (1) 85.0% 97.6% 92.4%
9. Participation in F2F Tutorial
Yes (0) 82.6% 62.8% 69.6% No (1) 0% 89.6% 85.5%
3.2 Statistical Significance of the Model
Table 3 presents the statistical significance of the individual regression coefficients (βs) tested with the Wald Chi-square statistic. The Hosmer & Lemeshow test of the goodness of fit suggested that the model was a good fit to the data as p=0.168 (> 0.05), p=0.525 (> 0.05), and p=0.757 (>0.05). Nagelkerke’s �� suggested that the model explained roughly 15%, 27%, and 35% of the variation in the outcome for Jambi, Bengkulu, and Jakarta respectively.
Table 3. The Coefficient of Regression
Variables Regional Offices B S.E Wald df Sig. Exp(B)
1. Gender Jambi -.053 .271 .038 1 .845 .948 Bengkulu -.017 .193 .008 1 .930 .983 Jakarta .051 .124 .173 1 .678 1.053
2. Age Jambi -.379 .346 1.200 1 .273 .685 Bengkulu -.757 .268 7.987 1 .005* .469 Jakarta -.026 .148 .031 1 .861 .974
3. Marital Status Jambi .636 .298 4.565 1 .033* 1.889 Bengkulu .120 .294 .166 1 .684 1.127 Jakarta .182 .163 1.248 1 .264 1.200
4. Working Status
Jambi .003 .343 .000 1 .993 1.003 Bengkulu .490 .223 4.824 1 .028* 1.632 Jakarta .048 .180 .072 1 .789 1.049
5. Credits Attained
Jambi 1.125 .280 16.158 1 .000* 3.081 Bengkulu 1.264 .216 34.278 1 .000* 3.539 Jakarta 1.755 .132 177.248 1 .000* 5.785
6. GPA Jambi 1.248 .427 8.527 1 .003* 3.482 Bengkulu 1.220 .231 27.829 1 .000* 3.386 Jakarta 1.546 .183 71.384 1 .000* 4.694
7. Online Tutorial
Jambi -.066 .259 .064 1 .800 .937 Bengkulu .299 .196 2.321 1 .128 1.348 Jakarta .546 .158 11.966 1 .001* 1.726

80
*) Significant at � < 0.05 According to Table 3, age and working status made significant effect to re-enrolment in Bengkulu, as well as marital status in Jambi. Meanwhile, credit attained and grade point average made significant effect to the re-enrolment in the three regional offices. The online tutorial made effect in Jakarta only, not in Jambi and Bengkulu. The online examination and F2F tutorial made effect in Bengkulu and Jakarta, but not in Jambi.
The last column,"�#�$ presents the odds ratio for each of the predictors. Such odds represent the likelihood that one outcome will occur to the likelihood that the outcome will not occur ([11]), which in this case, referred to the likelihood of the event of re-enrolment or non-re-enrolment. The odds ratio (OR) is a comparative measure of two odds relative to different events ([11]), which is calculated by dividing the odds by other odds, which in this case, referred to the odds of the outcome in students who were re-enrolled by the odds of the same outcome in students who were not re-enrolled.
For group of student personal characteristics variable, as seen in Table 3, the odds ratio of the age variables was .469 (less than 1) in Bengkulu, implying that the odds of the students aged below or equal to 24 years (with variable value equal to 0 in Table 2) were less likely to re-enrol than the students aged over 24 (with variable value equal to 1 in Table 2) to re-enrol in the subsequent semester by 0.469 times, thereby denoting lower likelihood of re-enrolment in the younger students. The odds ratio of the marital status variable was 1.889 (more than 1) in Jambi, indicated that the married students (with variable value equal to 1 in Table 2) were more likely to re-enrol than the unmarried students (with variable value equal to 0 in Table 2). It meant that the odds of the married students were higher than unmarried students to re-enrol by 1.889 times. The odds ratio of the working status variable was 1.632 (more than 1) in Bengkulu, indicated that the employed students (with variable value equal to 1 in Table 2) were more likely to re-enrol than the unemployed students (with variable value equal to 0 in Table 2). It meant that the odds of the employed students were higher than unemployed students to re-enrol by 1.632 times.
For group of academic achievement variable, Table 3 showed that the odds ratio of the credits attained was 3.081, 3.539, and 5.785 (all more than 1) for Jambi, Bengkulu, and Jakarta respectively. It indicated that the students with credits attained more than 84% (with variable value equal to 1 in Table 2) were more likely to re-enrol than the students with credits attained less than or equal to 84% by 3.081, 3.539, and 5.785 times in Jambi, Bengkulu, and Jakarta respectively. Meanwhile, for GPA variable, Table 3 revealed that the odds ratio of the GPA was 3.483, 3.386, 4.694 (all more than 1) for Jambi, Bengkulu, and Jakarta respectively, showed that the students with GPA more than 2.0 (with variable value equal to 1 in Table 2) were more likely to re-enrol than the students with GPA less than or equal to 2.0 by 3.483, 3.386, and 4.694 times in Jambi, Bengkulu, and Jakarta respectively.
For group of learning support service variable, the odds ratio of the participation in online tutorial variable was 1.726 in Jakarta. This indicated that, in Jakarta, the students who participated in online tutorial were more likely to re-enrol than the unmarried students by 1.889 times. The odds of the participation in online examination was 12.026 and 4.054 in Bengkulu and Jakarta respectively, but it was not significant in Jambi. It indicated that, in Bengkulu and Jakarta, the students who participated in online examination were more likely to re-enrol than the students who did not participate in online examination by 12.026 and 4.054 times respectively. In Bengkulu and Jakarta, the odds of the participation in face-to-face tutorial was 2.351 and 1.729 respectively. This offered a point that the students who participated in face-to-face tutorial were more likely to re-enrol than the students who did not participate by 12.026 and 4.054 times respectively.
8. Online Examination
Jambi .537 .657 .668 1 .414 1.711 Bengkulu 2.487 1.039 5.732 1 .017* 12.026 Jakarta 1.400 .499 7.885 1 .005* 4.054
9. F2F Tutorial Jambi - - - - - - Bengkulu .855 .248 11.902 1 .001* 2.351 Jakarta .548 .259 4.463 1 .035* 1.729

81
4 CONCLUSIONS
This research considers that the new students’ re-enrolment is indication of a service quality to maintain student’s success or a step forward to the student’s success. The students’ success in an ODL environment, as indicated by their re-enrolment in each semester, is due to various factors. This research specifically identified that the students’ success related to the three factors. Firstly, the individual characteristics related to maturity, as specified by age, marital status, and working status, i.e. the more mature the students are, the more chance the students for being success. Secondly, the level of success in previous semesters, as showed by GPA and credits attained, i.e. the more GPA and credits earned in the previous semester the more chance for the students to re-enrol in this semester. Thirdly, the availability learning support services that are perceived by the students to enable them to interact with content, instructors, and peers, i.e. when the students joining a learning support that give them a feeling of interaction with content, instructors, and peers in previous semester, then the chance for the students to re-enrol in this semester is increased.
REFERENCES
Simpson, O. (2016). Student Support Services for Success in Open and Distance Learning. Available from http://www.cemca.org.in.
Le, H., Robbins, S. B., & Westrick, P. (2014). Predicting student enrollment and persistence in college STEM fields using an expanded P-E fit framework: A large-scale multilevel study. Journal of Applied Psychology, 99(5), 915-947.10.1037/a0035998
Smart, J.C., Feldman, K.A., & Ethington, C.A. (2006). Holland’s theory and patterns of college student success. Available from http://nces.ed.gov/npec/pdf/smart_team_report.pdf.
Dzakiria, H., Kasim, A., Mohamed. A.H., & Christopher, A.A. (2013). Effective learning interaction as a prerequisite to successful open distance learning (ODL): A Case study of Learners in the Northern State of Kedah and Perlis, Malaysia. Turkish Online Journal of Distance Education, 14(1). Retrieved from http://files.eric.ed.gov/fulltext/EJ1006252.pdf.
Choi, H., Lee, Y., Jung, I., & Latchem, C. (2013). The extent of and reasons for non re-enrollment: A case of Korea National Open University. The International Review of Research in Open and Distance Learning, 14(4). Retrieved from http://www.irrodl.org/index.php/irrodl/article/view/1314.
Godfrey, K. E. & Matos-Elefonte, H. (2010). Key indicators of college success: Predicting college enrollment, persistence, and graduation. New York, NY: College Board.
Stephan, J. L., Davis, E., Lindsay, J., & Miller, S. (2015). Who will succeed and who will struggle? Predicting early college success with Indiana’s Student Information System. Washington, DC: U.S. Department of Education, Institute of Education Sciences, National Center for Education Evaluation and Regional Assistance, Regional Educational Laboratory Midwest. Retrieved from http://ies.ed.gov/ncee/edlabs.
University of Maryland University College. (2015). Predictive analytics for student success: Developing data-driven predictive models of student success. Retrieved from https://www.umuc.edu/visitors/about/ipra/upload/developing-data-driven-predictive-models-of-student-success-final.pdf.
Sugilar. (2017). Predicting students’ re-enrollment in an open and distance learning environment. Manuscript submitted for publication.
Peng, C-Y., J., Lee, K.L., & Ingersoll, G.M. (2002). An introduction to logistic regression analysis and reporting. The Journal of Educational Research, 96(1). Retrieved from http://www-psychology.concordia.ca/fac/kline/734/peng.pdf.
Park, Hyeoun-Ae. (2103). An introduction to logistic regression: From basic concepts to interpretation with particular attention to nursing domain. Journal of Korean Academic Nursing, 43(2), 154-164. Retrieved from http://dx.doi.org/10.4040/jkan.2013.43.2.154.

82
IMPLEMENTATION OF THE BENEFIT MODEL (USABILITY) IN IMPROVING USER SATISFACTION OF UT ACADEMIC
INFORMATION SYSTEM SERVICES
I Made Gunawan Sanjaya 2, Andi Sylvana 1, Nina Utami 3
1Universitas Terbuka (INDONESIA) 2Universitas Terbuka (INDONESIA) 3Universitas Terbuka (INDONESIA)
Abstract
The management of technology-based information at the Open University (UT) today has become an important and urgent need in order to support the successful vision and mission of the institution. This is because information technology has proven to be very effective as a key facilitator in improving and leveling education services through distance learning capabilities that are inseparable by space, distance and time so that everything that is needed will be available online and can be accessed anytime and anywhere. In connection with that and in an effort to improve the quality of service to students, UT provides online registrars facility for students in the form of UT Academic Information System (SIA) application which has been officially utilized starting January 2017. In order for this application can be effective to give satisfaction for its user hence required research about student satisfaction in terms of satisfaction of service user to a website (USABILITY) as the purpose of this research. Using the sample of 50 respondents of active students in UPBJJ - UT Makassar randomly, the results obtained are usability dimensions measured based on Ease of Use, Customization, Download delay and web content (information) significant effect on service user satisfaction either simultaneously or partially. The dominant variable that influences successively is Ease of Use then followed by web content (information), Customization and the last is the Download delay. Based on these results, it can be concluded that to increase student satisfaction of SIA service users continuously can be done by giving full attention to the Ease of Use variables in USABILITY dimension, by maintaining the structure of web presentation, easy access and clarity of information presentation. Keywords: usability, satisfaction, academic, infomation, system,
1. INTRODUCTION
The pace of change led by information technology has challenged the traditional method of teaching and learning, and the way education is executed. Today, Internet does not only serve as a learning resource but also facilitates online-learning experience which does not require on-campus attendance. UT (Universitas Terbuka) embraces this recent shift in education paradigm. The development of technology-based information fosters innovation that increases value, enhances quality and boosts productivity at UT. Information technology (IT) aids plenty of resources that enable long-distance students to have online-learning experience without space-time obstacles. As a response to IT development in terms of student satisfaction, UT has developed an application called SIA that allows for online registration since its inception in January 2017. Web-based information such as E-Registration within academic setting is intended to eliminate the constraint of distance and time and facilitates information integration in a teaching-learning setting as a central matter in ensuring the education experience. The ease of designing and implementing E-Registration is highly necessary for higher-education administrators to improve their work performance in monitoring each educational activity. E-Registration enables both students and registration staff to access registration procedures online without the restriction of a traditional queuing line. In addition to course registration, E-Registration allows for online teaching consultation. While there are a number of purposes SIA UT can serve, web-related issues are common among users. These issues are log-in failures, outdated information, and, ultimately, slow-loading page, given that too many users are logged in during particular period of time, particularly the approaching closing date. This study settles on a usability model for the

83
improvement of SIA in the context of student satisfaction to eliminate such issues and, at the same time, to utilize the application to its full extent.
2. LITERATURE REVIEW AND HYPOTHESIS DEVELOPMENT
2.1. Usability Usability refers to the process of interaction optimization between users and an interactive system in a way that users gain appropriate information or accomplish a task on an application in a better manner (Jetter and Gerken, 2006 in Prayoga and Senuse, 2010). The principal benefit to users is that the application allows users to perform tasks easily and efficiently, which, in turn, leads to user satisfaction. According to Laundauer (1995) in Prayoga and Sensuse (2010), maintenance makes the bulk of software development costs in terms of usability problems, rather than technical problems. The importance of usability analysis and testing prior to, during and subsequent to the software development is thus widely emphasized (Gonzalez, Lozano, and Montero, 2004 in Prayoga and Sensuse, 2010). Nielsen (1994) in Prayoga and Sensuse (2010) refers to usability as practical and meaningful experience of human-computer interaction that deals with easy and fast operation. Nielsen (1994) in Prayoga and Sensuse (2010) further formulates the factors that underlie the importance of website usability, among which is user behavior pattern in terms of web access. Most users do not stay long on a web page that requires instructions, particularly when they come across a poor web design. They need instant process as they rush through a web page. When they encounter access problems, some will linger for several minutes; some will leave immediately. In addition to general conceptions of usability, it is necessary to view the measurement of usability on website development. The general criterion that defines a usable website is a user-centric website that aligns with users’ needs and expectations (U.S. Department of Health & Human Services, 2009 in Prayoga and Sensuse, 2010). Nielsen (1994) in Prayoga and Sensuse (2010) classifies five key principles of ideal website usability, which include learnability, efficiency, memorability, error handling and satisfaction. Learnability measures the degree to which users understand website access on the first attempt, reasons for access and the ability to identify what they are looking for. Efficiency deals with the ability of a website to generate information with a minimum expenditure of time and effort. Memorability measures how easy a website is to remember after a number of visits. A website that constantly changes leads to users’ confusion, frustration and hardly impressionable. Error handling avoids broken links or under-construction web pages. Satisfaction is the extent to which users are satisfied when they use a website to accomplish a task. Users generally prefer fast and easy-to-use web designs. Accordingly, they know what to find, where to find it and how to find it. In another study, Dix, J. Finlay, G. Abowd, R. & Beale (1993) in Prayoga and Sensuse (2010) classify four criteria of usability analysis: effectiveness, efficiency, satisfaction and learnability. International Standar Organization (ISO) conducts consolidation of usability measurements based on usability measurement by Nielsen (1994), Dix, J. Finlay, G. Abowd, R. & Beale (1993), ISO standard 9126 & ISO standard 14598 (product-oriented usability) and ISO standard 9241 & ISO standard 13407 (process-oriented usability) in Prayoga and Sensuse (2010). The result generates a consolidation model of 5-parameter usability: effectiveness, efficiency, satisfaction, learnability and security (Abran, A. Khelifi, W. Suryn, & A. Seffah, 2003 in Prayoga and Sensuse 2010). Among the usability models, ISO, Nielsen (1994) and Dix et al. (1993) propose and highlight the importance of usability measurement on user satisfaction as part of the usability parameters. These user-oriented models are the primary focus of this study. The notion of user satisfacion within the context of usability model is further emphasized by further studies on website-visitor satisfaction. Palmer (2002) in Prayoga and Sensuse (2010), later known as an expert in human-computer interaction, develops a construct of website usability into download delay, webpage navigation or organization, interactivity, responsiveness, website content or information and user satisfaction. The parameters for download delay are early-access speed and access speed between pages. The parameters for page navigation or organization are web page arrangement, links, layout and web navigation order. The parameters for interactivity are custom web pages and interactivity. The parameters for responsiveness are feedback and FAQ facilities. The parameters for website content or information are the amount of information, variety of information, number of words and quality of website content. The parameters for user satisfaction are user visit and web-access frequency. Agarwal and Venkatesh (2002) in Prayoga and Sensuse (2010) describe usability measurement model based on the approach by Microsoft Usability Guideline. The model arranges categories and breaks them into sub-categories based on weights and ratings. The model has been commonly used as a reference to other measurements of usability. Green and Pearson (2002) in Prayoga and Sensuse (2010) compare the model with Palmer’s model through Confirmatory Factor Analysis (CFA). The result shows that Palmer’s model meets the required standards over Agarwal and Venkatesh’s. In a further study, Green and Pearson (2004) in

84
Prayoga and Sensuse (2010) conduct a study on the similar comparison. The study that applies Palmer’s and Agarwal & Venkatesh’s models to a website (Green and Pearson, 2004) in Prayoga and Sensuse (2010) conceives the best four dimensions in user-satisfaction measurement on a website by constructing a robust and parsimonious model to identify variables which have the strongest impacts on outcomes. These dimensions include ease of use, personalization, download delay and web content. Those are the four constructs on which this study focuses with respect to a measurement on an application presented later in Methodology. In addition to the four constructs, the usability model settles on the concept of user satisfaction as an endogenous variable that is likely to boost website traffic or visits, which, in turn, potentially provides significant value to the measurement validity.
2.2. Hypotheses Development The study proposes a number of hypothesized relationships as follows: H1: Ease of use will positively and significantly affect user satisfaction. H2: Personalization will positively and significantly affect user satisfaction. H3: Download delay will positively and significantly affect user satisfaction. H4: Web content will positively and significantly affect user satisfaction.
3. METHOD
3.1. Research Design This study was designed as an explanatory analysis that sought to verify the hypothesized relationships by elaborating phenomena based on a scientific examination. The independent variables included in this study are ease of use, personalization, download delay and content, while the dependent variable is user satisfaction of SIA service.
3.2. Participants Method for data collection in this study is cross-sectional survey. The population comprises the entire registered students at UPBJJ-UT Makassar. The samples were acquired from random sampling and the questionnaires were delivered online. The collected data were gathered from 50 respondents.
3.3. Instrument Data collection was completed using questionnaires with a 5-point likert scale ranging from 1 (strongly disagree or highly dissatisfied) to 5 (strongly agree or highly satisfied).
Table 1. Variables and Indicators
Variable Indicators Code
Ease of Use
(X1)
The menu at SIA UT is simple and easy to use. X11
Access to SIA UT is connected to the Internet with no
restrictions of locations. X12
The language used at SIA UT is comprehensible. X13
Personalization
(X2)
The contents of SIA UT are attractive and useful.
X21
The webpages at SIA UT are familiar and well-known. X22

85
Access Speed
(X3)
SIA UT provides easy access to the information I need.
X31
Navigating to each menu at SIA UT is relatively fast. X32
Content
(X4)
The information provided at SIA UT perfectly suits my
needs.
X41
SIA UT offers various information that supports my
educational activities. X42
3.4. Data Analysis To gain adequate results, the instrument in this study was measured using validity and reliability test to avoid errors that might affect the accuracy of data collected. Then, multiple linear regression was run to acquire the results of model testing, the effects between the variables and the dominant variables. In terms of validity test, an item was a valid measure only to the extent that it scored above 0.40 at a significance level of 95% within a group of items representative of the variables to be measured. In terms of reliability test, Cronbach’s Alpha, coefficient and item-total correlation were applied to examine whether each variable was reliable. Each variable scored above 0.60, which generated reliable variables and indicated internal consistency. To assure the effects between variables, p-value must score ≤ 0,05 to ensure the significant effects of the independent variables on the dependent variable, at a confidence level of 95% and a maximum deviation standard of 5%.
4. RESULTS
4.1. Validity and Reliability The results of validity and reliability test are presented in table 2:
Tabel 2 The Results of Validity and Reliability
Variable Indicator
Validity Cronbach’s
Alpha Reliability
Min. Max.
X1 0.911 0.981 Valid 0.771 Reliable
X2 0.324 0.821 Valid 0.825 Reliable
X3 0.439 0.943 Valid 0.834 Reliable
X4 0.569 0.925 Valid 0.856 Reliable
Y 0.781 0.765 Valid 0.755 Reliable Source: SPSS Output, processed in 2017 Table 2 shows that the minimum value of validity is above 0.2 and the alpha is above 0.6, which indicates that the questionnaires are applicable for the respondents.
4.2. Frequency Distribution
The recapitulation of frequency distribution of respondents on ease of use, personalization, download delay, content and user satisfaction is provided in Table 3:

86
Table 3. Recapitulation of Ease of Use, Personaliza tion, Download Delay, Content and User Satisfaction
The table shows that overall the variables – ease of use, personalization, download delay and content – are classified in high category, which leads to high-category user satisfaction of SIA UT.
4.3. Multiple Regression Analysis Multiple regression was performed to model the relationships between the independent variables and dependent variable. The results are seen below:
Table 4. The Results of Multiple Regression
Independent Variable Dependent Variable t Sig t Ease of use (X1)
User Satisfaction (Y)
69.483 .000 Personalization (X2) 10.056 .000 Download delay (X3) 14.613 .000 Content (X4) 12.643 .000
R2 . 971 Adjusted R2 . 968 F 371.713 Sig F .000
Source: SPSS Output, processed in 2017 The results are interpreted as follows: 7. R2 of 0.971 (97.1%) is the rate of the simultaneous effects of ease of use, personalization, download
delay and content on user satisfaction. The remaining 2.9% accounts for other factors not included in the model.
8. FCal of 371.713 with alpha of 0.00 (less than 0.05) indicates that ease of use, personalization, download delay and content simultaneously have positive and significant effects on user satisfaction.
9. TCal of 69.483 with alpha of 0.000 (less than 0.05) indicates that ease of use has a positive and significant effect on user satisfaction, given that the other factors which may affect the level of user satisfaction remain constant. Hypothesis 1, that ease of use will positively and significantly affect user satisfaction, is accepted.
10. TCal of 10.056 with alpha of 0.000 (less than 0.05) indicates that personalization has a positive and significant effect on user satisfaction, given that the other factors which may affect the level of user satisfaction remain constant.
Variabl e * Crosstabulation of Respondent Answers Count
Respondent Answers
Total Low Moderate High
Variable x1 0 37 13 50
x2 6 16 28 50
x3 0 21 29 50
x4 0 17 33 50
Y 0 0 60 50 Total 6 91 153 250

87
Hypothesis 2, that personalization will positively and significantly affect user satisfaction, is accepted.
11. TCal of 14.613 with alpha of 0.000 (less than 0.05) indicates that download delay has a positive and significant effect on user satisfaction, given that the other factors which may affect the level of user satisfaction remain constant. Hypothesis 3, that download delay will positively and significantly affect user satisfaction, is accepted.
12. TCal of 12.643 with alpha of 0.000 (less than 0.05) indicates that web content has a positive and significant effect on user satisfaction, given that the other factors which may affect the level of user satisfaction remain constant. Hypothesis 4, that web content will positively and significantly affect user satisfaction, is accepted.
5. CONCLUSION The following are conclusions based on the results: a. The level of ease of use, personalization, download delay and web content measures the user
experience upon the interaction with SIA UT. In other words, these four dimensions are essential factors that underlie the success rate of SIA UT in terms of meeting the needs of academic information and service for UT students.
b. Easy-to-use application enables users to experience simple access to the facilities, the navigations, and, most importantly, the information provided at SIA UT. The simple procedures increase the likelihood of improved user satisfaction.
c. Personalization delivers contents and functionality that fit users’ specific needs or interests. When a specific need has been met, user satisfaction grows significantly.
d. High-speed download is a significant predictor for user satisfaction as most users demand instant results and have no patience policy for waiting.
e. Clear, relevant and accurate web content is the key to user satisfaction as the content targets the users, engage them and persuade them to take action.
REFERENCES
[1] Abran, A. Khelifi, W. Suryn, & A. Seffah, 2003. “Consolidating the ISO Usability Models”8th Annual INSPIRE Conference
[2] garwal dan Venkatesh, 2002. “Assessing a Firm's WebPresence: A Heuristic Evaluation Procedure for the Measurement of Usability,” Information Systems Research, vol. 13, pp. 168-186, 2002.
[3] Dix, J. Finlay, G. Abowd, R. & Beale, 1993. Human-Computer Interaction, Prentice-Hall, New Jersey.Gonzalez, M.D. Lozano, dan F. Montero, 2004. “A Usabilityand Accessibility Oriented Development Process” University of Castilla-La Mancha, Spain
[4] Green dan Pearson, 2004. “Confirmatory Factor Analysis of Two Web SiteUsability Instruments” In Proceeding of the Third Annual Workshop on HCI Research, pp. 10-11, 2004.
[5] Jetter, HC dan J. Gerken, 2006. A Simplified Model of User Experience for Practical Application, Universität Konstanz, http://www.inf.uni-konstanz.de/cgip/bib/files/JeGe06.pdf, 2006.
[6] Landauer, TK. 1995. The Trouble with Computers: Usefullness, Usability, and Productivity, MIT Press, Cambridge, 1995.
[7] Nielsen, J. 1994. Guerrilla HCI: Using Discount Usability Engineering to Penetrate the Intimidation Barrier, Usable Information Technology, http://www.useit.com/papers/ guerrilla_hci.html, 1994.
[8] Palmer, JW. 2002. “WebSite Usability, Design and Performance Metrics,”Information Systems Research, vol. 13, pp. 151-167, 2002.
[9] Prayoga, Sigit Hadi dan Sensuse, Dana Indra. 2010. Analisis Usability pada Aplikasi Berbasis Web Dengan Mengadopsi Model Kepuasan Pengguna (User Satisfaction). Journal of Information Systems, Volume 6, Issues 1, April 2010.
[10] U.S. Department of Health & Human Services, 2009. Usability Basics, U.S. Government, http://www.usability.gov, retrieved November 13, 2009.

88
STUDENT SATISFACTION ANALYSIS OF ONLINE TUTORIAL THROUGH INFORMATION SYSTEM QUALITY AND PERSONAL SERVICES OF ONLINE TUTORIAL AT UNIVERSITAS TERBUKA
Andi Sylvana 1, Murtiadi Awaluddin 2
1Universitas Terbuka (INDONESIA) 2Universitas Islam Negeri Makassar (INDONESIA)
Abstract
Providing the users of learning supports with superior service has enabled UT to build and grow service commitment that can contribute to the needs of society, employees, and, most notably, students in online tutorials (tuton). Designed in a web-based environment, online tutorials is one of UT learning supports that offers versality of tutorial experience. One of the indicators whether optimal service applies to the business operations is measuring the satisfaction level of students as service users. This study aimed to figure out the satisfaction level of tuton students in terms of the quality of information system and personal service of online tutors at Universitas Terbuka. Data were acquired from 50 tuton-student respondents at UT 2017.1. The study found that the level of student satisfaction positively and significantly affected the variable of system quality, information quality and personal service of online tutors. The most dominant variables, in descending order, were system quality, personal service of online tutors and information quality. On that basis, this study settled on a framework of tuton-student satisfaction with respect to the improvement of system quality of tuton application, information quality and personal service of online tutors. Keywords: satisfaction, analysis, information, quality, services. 1. INTRODUCTION
Establishing distance higher education has allowed UT to provide all citizens with access to higher education without time and space barriers. It is the era of Information and Communication Technology (ICT), and teachers and students are widely opting it for its benefits. Advances of technology offer new options in how to run learning activities replete with digital devices. The confluence of technology and education has prompted human capital to prioritize skills for national growth. To that end, UT has set up gradual improvement in every aspect of its education products and services. As one of academic support services at UT, tuton serves as an alternative to on-campus tutorial, which primarily works with students who opt to take up tutorial experience in an online environment with broader flexibility of time and space.Tutorials serve as learning support services that aim to overcome the challenge of achieving a range of academic skills. Tutorials at UT fall into several categories, which are written tutorials, online tutorials, radio tutorials and face-to-face tutorials. As such tutorials are multimedia-designed, tutors are prompted to integrate their material presentations into a proper platform. In online tutorials, tutors assist and facilitate students academically. They respond to students’ questions or opinions in discussions and evaluate their assignments. By the end of tutorials, tutors provide assessment on their academic achievement on a particular course and incorporate feedback into subsequent tasks for improvement. Students may be admitted to online tutorials with 8 initiation courses and 3 assignments. In addition, they may take on tutor-student discussion or student-student interaction. To make sure that the learning activities and environment are properly set up to support effective learning, tutors heavily depend on the quality of system, information and services provided by tuton supervisors. Internal-service quality reflects and encourages how tutors perform their tasks. Numerous issues arise during the implementation of online tutorials; students’ failure to make online submission of initiation assignments due to upload problems; limited access to the web pages due to loading problems; and initiation scores are occasionally released by the end of meeting. When such issues arise, they are likely to affect the outcome of online tutorials and, ultimately, lower student convenience during tutorial experience. To resolve such issues, a study on satisfaction of tuton students through the quality of information system and personal service of online tutors at Universitas Terbuka is mandatory. These are the focuses of this study that aimed to measure the effect of system quality, information quality and personal service of tutors on tuton-student satisfaction.

89
2. LITERATURE REVIEW AND HYPHOTESIS DEVELOPMENT Sys tem Quality
2.1. System Quality The notion of information system quality lies in how the system is perceived and used. Davis et al. (1989) perceive it as “ease of use” when it comes to experiencing new technologies. It represents the degree to which users feel that the new-technology experience does not require considerable effort and lets them spend time on other tasks, which in turn improves their time management and overall work performance. Studies by Delone and McLean (1992), McKinley et al. (2002), Rai et al. (2002), McGill et al. (2003), Almutairi and Subramanian (2005) and Livari (2005) demonstrate similar findings that information system quality positively affected user satisfaction.
2.2. Information Quality
Identifying information quality means determining whether the content of particular information has the charateristics or attributes that make it meaningful and purposeful. Information quality, as posited by Kadir (2010), is heavily related to conveying certain knowledge based on relevance and timeliness. Likewise, O’Brien (2005) classifies a number of dimensions that define information quality, which are timeliness, currency, frequency and time period. Information quality has long been associated with system use, user satisfaction and net profit (DeLone and McLean, 1992). In addition, Kotler et al. (2004) in Tjiptono (2006) state that attractive web pages that serve as information platforms are likely to represent and define how business operations are running for potential visitors and customers. Turban and Gehrke (2000) shed light on online business where the quality of web contents either attracts potential customers or drives them away to competitors. Furthermore, O’Brien in his book “System Analysis and Design Method” classifies 3 dimensions of information quality – time dimension, content dimension and form dimension. Time dimension deals with the time in which the information is presented. Content dimension focuses on the content of the presented information, while form dimension focuses on how the information is presented.
2.3. Contact Personnel Service
Contact personnel constitutes an individual or a group of individuals through which service delivery runs and with which customers do direct interactions in a service setting. According to Nguyen and Leblanc (2002), contact personnel is an individual at the front line of organizations who interacts with public in service-purchase encounters. As high-contact service, contact personnel for tuton is of crucial importance, as put by Lovelock and Wright (2002) that state, “In high-contact service, service personnel is central to service delivery.” Lovelock and Wright (2002) further state, “In the eyes of the customers, service personnel may also be seen as an integral part of the service experience.” Nguyen and Leblanc (2002) classify what influences contact personnel: a. Appearance b. Competence c. Professionalism. While appearance refers to the combination of attire, hairstyle, make-up and personal hygiene, competence is defined by the personnel’s expertise and experience. Customer perception on real-time service is defined by a number of factors in addition to the company value and achievement. The manner, courtesy and appearance of the personnels make indelible impression on customers. Shamdasani and Balakrishnan (2000) put additional traits into the categories: a. Expertise b. Similarity c. Knowledge d. Hospitality e. Mutual Disclosure. Good customer service means having quick access to service delivery. In a service setting, contact personnels are in a position to respond a number of inquiries and complaints quickly and accurately. High-performance human resources score good business. They serve as service providers within service companies who set the tone for whatever customer interaction proceeds to. Contact personnels are closely related to marketing; marketing brings customers in, and contact personnels keep them coming back.
2.4 Student Satisfaction Satisfaction is the nature of an individual. Each individual holds different levels of satisfaction with respect to a prevailing value system (Rivai, 2004). Higher valuation on a particular activity that fulfills what an individual desires will result in higher satisfaction of the given activity. Highly-satisfied individual reflects positive attitudes, and vice versa.

90
2.5 Hypothesis Development This study proposed a number of hypotheses: H1: System quality had a positive and significant effect on tuton-student satisfaction. H2: Information quality had a positive and significant effect on tuton-student satisfaction. H3: Tutor’s personal service had a positive and significant effect on tuton-student satisfaction.
3 METHOD
3.1 Research Design This study was designed as an explanatory research that sought to verify hypotheses by explaining a phenomenon based on a scientific approach. This study provided three independent variables – system quality, information quality and tutor’s personal service – and one dependent variable – tuton-student satisfaction.
3.2 Participants
The method of data collection used cross-sectional analysis. The population comprised the entire online tutors, and the target population included online tutors in Faculty of Economy, Universitas Terbuka, 2017.1. Samples were obtained from convenience sampling, and questionnaires were taken online. 60 respondents were selected as samples from which data were used to make inferences.
3.3 Instrument
Data collection used questionnaires with a 5-point likert scale, ranging from “1= Strongly Disagree” to “5= Strongly Agree.”
Table 1. Variable and Indicator
Variable Indicator Code
System Quality (X1)
X1.1 Tuton application enables tutors to interact with students.
A1
X1.2 Tuton application enhances tutorial experience. A2
X1.3 The features of tuton application meet tutors’ needs in conducting online tutorials.
A3
Information Quality (X2)
Time Dimension
1. Timeliness I am notified well in advance regarding the implementation of online tutorials.
B11
2. Currency (Up-to-date Information) B12
Universitas Terbuka keeps me updated regarding the implementation of tuton.
3. Time-Period B13
Universitas Terbuka keeps notifying me of when the end of tuton approaches.
Content Dimension
1. Accuracy The tutorial courses are the assigned courses.
B21
2. Relevance The tutorial courses meet the curriculum requirement.
B22

91
3. Scope Information about how to attend tuton is comprehensible.
B23
4. Performance Information about how to attend tuton is useful.
B24
Form Dimension
1. Clarity Information about how to attend tuton is clear and concise.
B31
2. Detail Each information from tuton supervisors is thoroughly presented.
B32
3. Order B33
Steps in tuton implementation are well ordered and elaborated.
4. Presentation Information about tuton implementation is presented in additional platforms such as video.
B34
5. Media B35
Each information is meaningful and purposeful with respect to the succesful implementation of tuton.
3.4 Data Analysis
The analysis began with the process of developing the instrument which was measured using validity and reliability test to avoid errors that might affect the accuracy of data collected. Then, multiple linear regression was completed to acquire the result of model testing, the effect between the variables and the dominant variables. In terms of validity test, an item was a valid measure only to the extent that it scored above 0.40 at a significance level of 95% within a group of items representative of the content of the trait to be measured. In terms of reliability test, Cronbach’s Alpha, coefficient and item-total correlation were applied to measure whether each variable was reliable. Each variable scored above 0.60, which generated reliable variables and indicates internal consistency. To figure out the effect between variables, p-value must score ≤ 0,05 to ensure significant effect of the independent variables on the dependent variable, at a confidence level of 95% and a maximum deviation level of 5%.
4 RESULTS
4.1 Validity and Reliability The results of validity and reliability test are presented in the following table:
Table 2
Results of Validity and Reliability Test
Variable Indicator
Validity Cronbach’s
Alpha Reliability
Min. Max.
X1 0.801 0.908 Valid 0.860 Reliable
X2 0.440 0.94 Valid 0.857 Reliable
X3 0.739 0.823 Valid 0.776 Reliable
Y 0.517 0.952 Valid 0.852 Reliable
Source: SPSS Output, processed in 2017

92
The result shows that the minimum values stand above 0.2, and the alpha values
4.2. Frequency Distribution
The recapitulation of frequency distribution of respondents regarding the assessment of system quality, information quality and tutor service and tuton-student satisfaction is presented in Table 3.
Table 3. Recapitulation of Student Assessment on Sy stem Quality, Information Quality and Tutor Service at UT
Source: SPSS Output, processed in 2017
The majority of respondents perceive information quality, system quality and tutor’s personal service as high, which indicates that UT consistently meets its customer requirements and expectations in the three areas. Likewise, tuton-student satisfaction is perceived as high. Student satisfaction sets off a profit chain of links between quality, productivity and customer satisfaction.
4.3. Multiple Regression Analysis
Multiple linear regression was used to measure the effect of the independent variables on the dependent variable presented in Table 4.
Table 4. Results of Multiple Regression
Independent Variable Dependent Variable
t Sig t
System Quality (X1) Tuton-Student
Satisfaction (Y)
3.285 .002 Information Quality (X2)
8.630 .000
Tutor Personal Service (X3)
4.042 .000
R2 .929 Adjusted R2 .925 F 376.5 Sig F .000
Source: SPSS Output, processed in 2017
The output is interpreted as follows:
1. R2 of 0.92 (92%) is the simultaneous effect value of system quality, information quality and tutor service on tuton-student satisfaction. The remaining 8% constitutes other factors not included in the model.
2. FCal. of 242.4 with alpha probability level of 0.00 (less than 0.05) indicates that system quality, information quality and tutor service simultaneously had positive and significant effects on tuton-student satisfaction.
3. TCal. of 3.285 with alpha probability level of 0.002 (less than 0.05) indicates that system quality had a positive and significant effect on tuton-student satisfaction, given that the other factors that might affect the system quality remained constant. Hypothesis 1, that system quality positively and significantly affected tuton-student satisfaction, is accepted.
4. TCal. of 8.630 with alpha probability level of 0.000 (less than 0.05) indicates that information quality had a positive and significant effect on tuton-student satisfaction, given that the other factors that
Cross tabulation of Respondents’ Answers
Count Respondents’ Answers
Total Low Moderate High Variable
X1 0 8 52 60 X2 0 19 41 60 X3 0 20 40 60 Y 2 20 38 60
Total 2 67 171 240

93
might affect the information quality remained constant. Hypothesis 2, that information quality positively and significantly affected tuton-student satisfaction, is accepted.
5. TCal. of 4.042 with alpha probability level of 0.00 (less than 0.05) indicates that tutor service had a positive and significant effect on tuton-student satisfaction, given that the other factors that might affect the tutor service remained constant. Hypothesis 3, that tutor service positively and significantly affected tuton-student satisfaction, is accepted.
A good information system should be user-oriented, which means that the system is essentially designed for user convenience. User satisfaction of information system refers to the degree to which the outcome of the use of an information system meets the user expectation. It is perceived as a positive condition the user experiences after using the system due to its ease of use (Santoso, 2009).
Information quality generates output from information system that relates to the value, benefit and relevance of the information addressed to the system users. A good information quality addresses its users’ needs, which in turn leads to satisfaction of using the information system (Radityo and Zulaikha, 2007).
Contact personnels are equally important, given that oftentimes they are the only direct links customers have with a company when it comes to product or service inquiries and/or complaints. In addition to customer links, contact personnels help distinguish a company from its competitors. When two or more companies sell products or services with similar qualities and at similar prices, pulling off extra effort into customer services may give one company a competitive advantage over another.
5 CONCLUSION
The results are concluded as follows:
f. The variable of system quality, information quality and tutor service simultaneously had positif and significant effects on tuton-student satisfaction. The ability to retain and to improve the quality in the three areas is imperative to tuton experience and, ultimately, the level of service UT is able to provide to students.
g. The variable of system quality closely relates to the availability, usability and performance of an overall system. Quality means that a system fits for the implementation of tuton and therefore meets the requirements set for tuton-student satisfaction.
h. The variable of information quality affects tuton-student satisfaction so long as it addresses students’ needs. Accurate, timely and well-presented information is likely to improve how students perceive the quality of information, and, in turn, how they perform their tasks.
i. The variable of tutor service that reflects user orientation supports students and focuses on their major needs and priorities. Students, hence, are able to connect with approriate resource for consistent and reliable service.
REFERENCES
[1] Lupiyoadi, Rambat. 2001. Manajemen Pemasaran Jasa. Jakarta: PT. Salemba Empat. [2] Davis, F. (1989): Perceived Usefulness, perceived ease of use, and user acceptance of information
technology. MIS Quarterly, Vol. 13, pp. 318-341. [3] O’Brien, James A. 2005. Pengantar Sistem Informasi, Penerbit Salemba Empat [4] DeLone, W.H., and Ephraim R. Mclean. 1992. Information System Success: The Quest for the
Dependent Variable. Information System Research, March. 60-95 [5] McKiney, V., Yoon, K., and Zahedi, Fatemeh. 2002. The Measurement of Web- Customer
Satisfaction: An Expectation and Disconfirmation Approach. Information System Research. 133: 296-315
[6] Rai, A., Lang, S.S. and Welker, R.B. 2002. Assessing the Validity of IS Success Models: An Empirical Test and Theoretical Analysis, Information System Research. Vol.13, No.1. pp. 29-34.
[7] McGill, Tanya, Hobbs, Valerie, and Klobas, Jane. 2003. User-Developed Applications and Information Systems Success: A Test of DeLone and McLean’s Model. Information resource Management Journal; Jan-Mar; 16.1.pg. 24.
[8] Almutairi, H. and Subramanian, Girish, H. 2005. An Empirical of the Delone and McLean Model in the Kuwaiti Private Sector.The Journal of Computer Information System. Spring, 45,3, p.113.

94
[9] Livari, Juhani. 2005. An Empirical Test of the DeLone and McLean Model of Information System Success. Database for Advances in Information Systems. Spring. 36,2.p.

95
OPTIMIZATION OF ONLINE TUTOR SATISFACTION THROUGH IMPROVEMENT OF QUALITY SYSTEMS, INFORMATION QUALITY AND IMPROVEMENT OF CONTACT PERSONNEL SERVICES AT
UNIVERSITAS TERBUKA
Andi Sylvana 1, Murtiadi Awaluddin 2
1Universitas Terbuka (INDONESIA) 2Universitas Islam Negeri Makassar (INDONESIA)
Abstract
Internal service quality has been trusted to be an important key for organizations and institutions to be able to optimize internal customer satisfaction and ultimately will provide satisfaction for external customers. Internal service quality in question is a prepared facility such as e-learning web pages and services from the responsible tuton to online tutors during online tutorial activities on progress. This study aims to determine the effect of system quality, information quality and contact personnel service to online tutor satisfaction at the Universitas Terbuka. Data obtained from 100 respondents online tutors in UT academic year 2017.1. The final result obtained. Information systems, quality information and services. And the dominant contribution to tuton satisfaction in succession is the quality of information, following the quality of contact person service and the last is the quality of the application system. This foundation thus formed a model of optimization of tutor satisfaction through improving the quality of the system from the tuton application, the quality of information and services.
Keywords: system, information, quality, services, satisfaction
1. INTRODUCTION
Universitas Terbuka provides broad access to world-class higher education to all citizens through Open and Distance Learning (ODL) to produce globally-competitive graduates. To that end, UT has set up gradual improvement in every aspect of its education products and services. As one of academic support services at UT, online tutorial serves as an alternative to on-campus tutorial, which primarily works with students who opt to take up tutorial experience in an online environment with broader flexibility of time and space. In online tutorials, tutors assist and facilitate students academically. They respond to students’ questions or opinions in discussions and evaluate their assignments. By the end of tutorials, tutors provide assessment on their academic achievement on a particular course and incorporate feedback into subsequent tasks for improvement. Students may be admitted to online tutorials with 8 initiation courses and 3 assignments. In addition, they may take on tutor-student discussion or student-student interaction. To make sure that the learning activities and environment are properly set up to support effective learning, tutors heavily depend on the quality of system, information and services provided by Tuton supervisors. Internal-service quality reflects and encourages how tutors perform their tasks.This study identified several critical issues throughout the implementation of Tuton. Among them were unplanned scheduling that led to a lack of information about tutorial meetings and website issues such as slow-loading speed and under-maintenance issue. This study refers to these as “critical” given that planning how to cope with them is likely the key to achieving success in terms of the internal-service quality. Internal Marketing (IM) is a relatively new notion adopted by companies with the aim of enhancing the quality of products and services for better job performance. Most service companies like higher education institutions apply Internal Marketing for marketing feat in a way that integrates every aspect of a company’s internal qualities in on-going marketing processes (Lupyoadi, 2001). In addition, Service Profit Chain asserts that internal-service quality fosters service delivery and empowers customer satisfaction. These are the focuses of this study that aimed to measure the effect of system quality, information quality and contact personnel service on online-tutor satisfaction.

96
2. LITERATURE REVIEW AND HYPHOTESIS DEVELOPMENT
2.1. System Quality The notion of information system quality lies in how the system is perceived and used. Davis et al. (1989) perceive it as “ease of use” when it comes to experiencing new technologies. It represents the degree to which users feel that the new-technology experience does not require considerable effort and lets them spend time on other tasks, which in turn improves their time management and overall work performance. Studies by Delone and McLean (1992), McKinley et al. (2002), Rai et al. (2002), McGill et al. (2003), Almutairi and Subramanian (2005) and Livari (2005) demonstrate similar findings that information system quality positively affected user satisfaction
2.2. Information Quality Identifying information quality means determining whether the content of particular information has the charateristics or attributes that make it meaningful and purposeful. Information quality, as posited by Kadir (2010), is heavily related to conveying certain knowledge based on relevance and timeliness. Likewise, O’Brien (2005) classifies a number of dimensions that define information quality, which are timeliness, currency, frequency and time period. Information quality has long been associated with system use, user satisfaction and net profit (DeLone and McLean, 1992). In addition, Kotler et al. (2004) in Tjiptono (2006) state that attractive web pages that serve as information platforms are likely to represent and define how business operations are running for potential visitors and customers. Turban and Gehrke (2000) shed light on online business where the quality of web contents either attracts potential customers or drives them away to competitors. Furthermore, O’Brien in his book “System Analysis and Design Method” classifies 3 dimensions of information quality – time dimension, content dimension and form dimension. Time dimension deals with the time in which the information is presented. Content dimension focuses on the content of the presented information, while form dimension focuses on how the information is presented.
2.3. Contact Personnel Service Contact personnel constitutes an individual or a group of individuals through which service delivery runs and with which customers do direct interactions in a service setting. According to Nguyen and Leblanc (2002), contact personnel is an individual at the front line of organizations who interacts with public in service-purchase encounters. As high-contact service, contact personnel for Tuton is of crucial importance, as put by Lovelock and Wright (2002) that state, “In high-contact service, service personnel is central to service delivery.” Lovelock and Wright (2002) further state, “In the eyes of the customers, service personnel may also be seen as an integral part of the service experience.” Nguyen and Leblanc (2002) classify what influences contact personnel: a. Appearance b. Competence c. Professionalism. While appearance refers to the combination of attire, hairstyle, make-up and personal hygiene, competence is defined by the personnel’s expertise and experience. Customer perception on real-time service is defined by a number of factors in addition to the company value and achievement. The manner, courtesy and appearance of the personnels make indelible impression on customers. Shamdasani and Balakrishnan (2000) put additional traits into the categories: a. Expertise b. Similarity c. Knowledge d. Hospitality e. Mutual Disclosure. Good customer service means having quick access to service delivery. In a service setting, contact personnels are in a position to respond a number of inquiries and complaints quickly and accurately. High-performance human resources score good business. They serve as service providers within service companies who set the tone for whatever customer interaction proceeds to. Contact personnels are closely related to marketing; marketing brings customers in, and contact personnels keep them coming back.
2.4. Hypothesis Development This study proposed a number of hypotheses: H1: System quality had a positive and significant effect on online-tutor satisfaction. H2: Information quality had a positive and significant effect on online-tutor satisfaction. H3: Contact personnel service had a positive and significant effect on online-tutor satisfaction.

97
3. METHOD
3.1. Research Design This study was designed as an explanatory research that sought to verify hypotheses by explaining a phenomenon based on a scientific approach. This study provided three independent variables – system quality, information quality and contact personnel service – and one dependent variable – online-tutor satisfaction.
3.2. Participants
The method of data collection used cross-sectional analysis. The population comprised the entire online tutors, and the target population included online tutors in Faculty of Economy, Universitas Terbuka, 2017.1. Samples were obtained from convenience sampling, and questionnaires were taken online. 100 respondents were selected as samples from which data were used to make inferences.
3.3. Instrument
Data collection used questionnaires with a 5-point likert scale, ranging from “1= Strongly Disagree” to “5= Strongly Agree.”
Table 1. Variables and Indicators
Variables Indicators Codes
System Quality (X1)
X1.1 Tuton application enables tutors to interact with students.
A1
X1.2 Tuton application enhances tutorial experience. A2
X1.3 The features of Tuton application meet tutors’ needs in conducting online tutorials.
A3
Information Quality (X2)
Time Dimension
1. Timeliness B11
I am notified well in advance regarding the implementation of online tutorials.
2. Currency (Up-to-date Information) B12
Tuton supervisors keep me updated regarding the implementation of Tuton.
3. Time Period B13
Tuton supervisors keep notifying me of the duration of online tutorials per meeting.
Content Dimension
1. Accuracy B21
The tutorial-assigned courses have met my educational background.
2. Relevance The tutorial-assigned courses have met the curriculum requirements.
B22
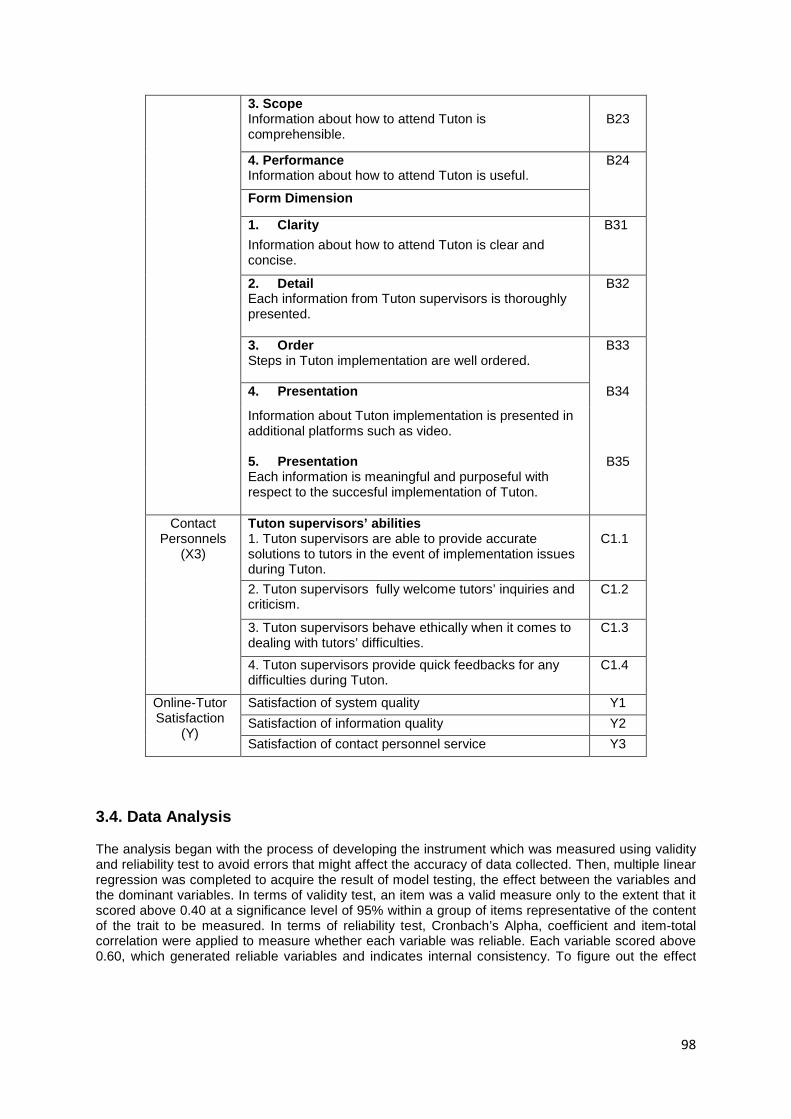
98
3. Scope Information about how to attend Tuton is comprehensible.
B23
4. Performance Information about how to attend Tuton is useful.
B24
Form Dimension
1. Clarity B31
Information about how to attend Tuton is clear and concise.
2. Detail Each information from Tuton supervisors is thoroughly presented.
B32
3. Order Steps in Tuton implementation are well ordered.
B33
4. Presentation B34
Information about Tuton implementation is presented in additional platforms such as video. 5. Presentation
B35 Each information is meaningful and purposeful with respect to the succesful implementation of Tuton.
Contact Personnels
(X3)
Tuton supervisors’ abilities 1. Tuton supervisors are able to provide accurate solutions to tutors in the event of implementation issues during Tuton.
C1.1
2. Tuton supervisors fully welcome tutors’ inquiries and criticism.
C1.2
3. Tuton supervisors behave ethically when it comes to dealing with tutors’ difficulties.
C1.3
4. Tuton supervisors provide quick feedbacks for any difficulties during Tuton.
C1.4
Online-Tutor Satisfaction
(Y)
Satisfaction of system quality Y1
Satisfaction of information quality Y2
Satisfaction of contact personnel service Y3
3.4. Data Analysis
The analysis began with the process of developing the instrument which was measured using validity and reliability test to avoid errors that might affect the accuracy of data collected. Then, multiple linear regression was completed to acquire the result of model testing, the effect between the variables and the dominant variables. In terms of validity test, an item was a valid measure only to the extent that it scored above 0.40 at a significance level of 95% within a group of items representative of the content of the trait to be measured. In terms of reliability test, Cronbach’s Alpha, coefficient and item-total correlation were applied to measure whether each variable was reliable. Each variable scored above 0.60, which generated reliable variables and indicates internal consistency. To figure out the effect

99
between variables, p-value must score ≤ 0,05 to ensure significant effect of the independent variables on the dependent variable, at a confidence level of 95% and a maximum deviation level of 5%.
4. RESULTS
4.1. Validity and Reliability
The results of validity and reliability test are presented in the following table:
Table 2
Results of Validity and Reliability Test
Variable Indicator
Validity Cronbach’s
Alpha Reliability
Min. Max.
X1 0.901 0.938 Valid 0.870 Reliable
X2 0.354 0.84 Valid 0.765 Reliable
X3 0.839 0.923 Valid 0.837 Reliable
Y 0.317 0.895 Valid 0.765 Reliable Source: SPSS Output, processed in 2017 The result shows that the minimum values stand above 0.2, and the alpha values stand above 0.6. This indicates that the instrument could be properly distributed.
4.2. Frequency Distribution
The recapitulation of frequency distribution of respondents regarding the assessment of system quality, information quality and contact personnel service and online-tutor satisfaction is presented in Table 3.
Table 3. Recapitulation of Tutors’ Assessment on Sy stem Quality, Information Quality and Contact Personnel Services
Source: SPSS Output, processed in 2017
The majority of respondents perceive information quality, system quality and contact personnel service as high, which indicates that UT consistently meets its customer requirements and expectations in the three areas. Likewise, online-tutor satisfaction is perceived as high. Tutor satisfaction sets off a profit chain of performance links between quality, productivity and student satisfaction.
4.3. Multiple Regression Analysis
Multiple linear regression was used to measure the effect of the independent variables on the dependent variable presented in Table 4.
Table 4. Results of Multiple Regression Independent Variable Dependent
Variable t Sig t
System Quality (X1) Tutor Satisfaction
(Y)
4.096 .014 Information Quality (X2)
12.137 .000
Cross tabulation of Respondents’ Answers
Count Respondents’ Answers
Total Low Moderate High Variable X1 3 6 91 100
X2 0 14 86 100 X3 0 18 82 100 Y 0 18 82 100
Total 3 56 341 400

100
Contact Personnel Service (X3)
5.201 .000
R2 .922 Adjusted R2 .919 F 376.5 Sig F .000
Sources : SPSS Output, processed in 2017
The output is interpreted as follows:
13. R2 of 0.92 (92%) is the simultaneous effect value of system quality, information quality and contact personnel service on tutor satisfaction. The remaining 8% constitutes other factors not included in the model.
14. FCal. of 376.5 with alpha probability level of 0.00 (less than 0.05) indicates that system quality, information quality and contact personnel service simultaneously had positive and significant effects on tutor satisfaction.
15. TCal. of system quality is 4.096 with the alpha of 0.014 (less than 0.05), which indicates that the system quality had a positive and significant effect on tutor satisfaction, given that the other factors that might affect the system quality remained constant. Hypothesis 1, that system quality positively and significantly affected online-tutor satisfaction, is accepted.
16. TCal. of information quality is 12.137 with the alpha of 0.000 (less than 0.05), which indicates that the information quality had a positive and significant effect on tutor satisfaction, given that the other factors that might affect the information quality remained constant. Hypothesis 2, that information quality positively and significantly affected online-tutor satisfaction, is accepted.
17. TCal. of contact personnel service is 5.201 with the alpha of 0.000 (less than 0.05), which indicates that the contact personnel service had a positive and significant effect on tutor satisfactions, given that the other factors that might affect the information quality remained constant. Hypothesis 3, that contact personnel service positively and significantly affected online-tutor satisfaction, is accepted.
A good information system should be user-oriented, which means that the system is essentially designed for user convenience. Despite the fact that the system is properly developed, without user support, system failure is likely to occur, and the implementation goes poorly. User satisfaction of information system refers to the degree to which the outcome of the use of an information system meets the user expectation. It is perceived as a positive condition the user experiences after using the system due to its ease of use (Santoso, 2009). Information quality generates output from information system that relates to the value, benefit and relevance of the information addressed to the system users. A good information quality addresses its users’ needs, which in turn leads to satisfaction of using the information system (Radityo and Zulaikha, 2007). Contact personnels are equally important, given that oftentimes they are the only direct links customers have with a company when it comes to product or service inquiries and/or complaints. In addition to customer links, contact personnels help distinguish a company from its competitors. When two or more companies sell products or services with similar qualities and at similar prices, pulling off extra effort into customer services may give one company a competitive advantage over another.
5. CONCLUSION
The results are concluded as follows:
j. The variable of system quality, information quality and contact personnel service simultaneously had positif and significant effects on online-tutor satisfaction. The ability to retain and to improve the quality in the three areas is imperative to tutor experience and, ultimately, the level of service tutors are able to provide to students.
k. The variable of system quality closely relates to the availability, usability and performance of an overall system. Quality means that a system fits for the implementation of Tuton and therefore meets the requirements set for online-tutor satisfaction.
l. The variable of information quality affects online-tutor satisfaction so long as it addresses tutors’ needs. Accurate, timely and well-presented information is likely to improve how tutors perceive the quality of information, and, in turn, how they perform their tasks.

101
m. The variable of contact personnel service that reflects user orientation supports tutors and focuses on their major needs and priorities. Tutors are hence able to connect with approriate resource for consistent and reliable service.
REFERENCES
[1] Lupiyoadi, Rambat. 2001. Manajemen Pemasaran Jasa. Jakarta: PT. Salemba Empat. [2] Davis, F. (1989): Perceived Usefulness, perceived ease of use, and user acceptance of
information technology. MIS Quarterly, Vol. 13, pp. 318-341. [3] O’Brien, James A. 2005. Pengantar Sistem Informasi, Penerbit Salemba Empat. [4] DeLone, W.H., and Ephraim R. Mclean. 1992. Information System Success: The Quest for
the Dependent Variable. Information System Research, March. 60-95. [5] McKiney, V., Yoon, K., and Zahedi, Fatemeh. 2002. The Measurement of Web- Customer
Satisfaction: An Expectation and Disconfirmation Approach. Information System Research. 133: 296-315.
[6] Rai, A., Lang, S.S. and Welker, R.B. 2002. Assessing the Validity of IS Success Models: An Empirical Test and Theoretical Analysis, Information System Research. Vol.13, No.1. pp. 29-34.
[7] McGill, Tanya, Hobbs, Valerie, and Klobas, Jane. 2003. User-Developed Applications and Information Systems Success: A Test of DeLone and McLean’s Model.Information resource Management Journal; Jan-Mar; 16.1. p.24.
[8] Almutairi, H. and Subramanian, Girish, H. 2005. An Empirical of the Delone and McLean Model in the Kuwaiti Private Sector.The Journal of Computer Information System. Spring, 45,3, p.113.
[9] Livari, Juhani. 2005. An Empirical Test of the DeLone and McLean Model of Information System Success. Database for Advances in Information Systems. Spring. 36,2. p.8.

102
STOU GRADUATES’ LEARNING OUTCOMES AND COURSE SATISFACTION
Chantana Thongprayoon
Sukhothai Thammathirat Open University (THAILAND)
Abstract
This research had two objectives: 1) to investigate learning outcomes for STOU graduates; and 2) to measure the satisfaction of STOU graduates based on the Thailand Qualification Framework of Higher Education (TQF: HEd). The samples were 612 STOU graduates in the year 2014 and attended the graduation ceremony at STOU in September 2016. The samples were randomly selected. The research instruments were two questionnaires with five-point rating scales and open-ended questions. For the learning outcomes questionnaire, there were seventeen question items and one open-ended question. For the course satisfaction questionnaire, there were five main items based on the TQF (HEd) and divided into 18 sub-items, as well as one open-ended question. The instruments were validated and checked for reliability by three experts in the field. Data were analyzed with descriptive statistics: Frequency, mean scores and descriptive analysis for the open-ended answers. The results were divided into four parts: 1) Demographic data; 2) Learning outcomes; 3) Course satisfaction according to TQF: HEd; and 4) Suggestions for teaching and learning approaches. For demographic data, samples were 372 females and 240 males. Most of them were 31-40 years old, and they were private company employees with incomes of 10,000-15,000 baht. Most of them had studied Management Science. For learning outcomes of courses, the sample students achieved the learning outcomes in every item with average mean score = 4.09. For course satisfaction, the sample students were satisfied with average mean score = 4.20. Some suggestions were text books be delivered on time and more assignments and exercises given. Also, they wanted to have more interactivity with their instructors and classmates. They suggested STOU should solve problems occurring in the teaching and learning process and follow the philosophy of distance education as well as revise pedagogy to be up to date. They also requested summaries of subject content and guidelines for examinations. Keywords : Learning outcomes, Course satisfaction, STOU graduates
1 INTRODUCTION Sukhothai Thammathirat Open University (STOU) has provided distance learning under a distance education system for almost 40 years. Distance learning is an education system or teaching system in which students receive instruction over the media such as written materials, the Internet, CDs, audio, online education, etc. Students use those media in studying any subject at home instead of going to school with no need for residency or to be physically present at the institution. The institutions ensure that the distance learning programs and qualifications are the same level of quality as campus-based programs. Distance learning institutions have been serving people who lack opportunities in education. The system enables people to fulfill their lives with equal opportunities to those who are more fortunate in the society. [1] Assessment in distance learning is as crucial as in other modes of education. Quality learning environments should be “Learner-centered.” A key ingredient in learner-centered teaching is allowing students to make mistakes and learn from them. [2] Learning Outcomes identify what the learner will know and be able to do by the end of a course or program. These are not the same as objectives. Objectives are intended results or consequences of instruction; while outcomes are achieved results or consequences of what was learned. The learning outcomes approach reflects a conceptual shift towards making learning more meaningful and effective. [3]

103
University of Virginia [4] stated Student Learning Outcomes as: 1. Knowledge outcomes that address content and methods of the discipline; 2. Skills outcomes that describe the techniques and approaches required for work in the discipline; and 3. Attitude outcomes that address commitment, appreciation, or openness. These emphasize the importance of confidentiality, truthfulness, and integrity. Besides learning outcomes, course satisfaction is also crucial for students’ success in their studies. Paechter, Maier, and Macher (2009) [5] studied “Students’ expectations of, and experiences in e-learning: Their relation to learning achievements and course satisfaction.” They reported that students’ achievement goals were the best predictors for success and ranked higher than other course characteristics. Students’ assessments of the instructor’s expertise in e-learning, and her counseling and support were the best predictors for learning achievement and course satisfaction. In addition, self-regulated and collaborative learning were related to learning achievements. The results of the study suggest that it is important to influence students’ motivation and goals by adapting instruction accordingly and to emphasize the importance of continuing education and training for the instructors. Although students’ learning outcomes and course satisfaction are important as predictors for students’ success in their study, the acquisition and honing of 21st century skills are also significant to fulfill students’ life. An emphasis on what students can do with knowledge, rather than what units of knowledge they have, is the essence of 21st century skills. The new assessments benchmarks for policy makers that reflect the need for 21st-century skills are competence as independent thinkers, problem solvers, and decision makers. There are hundreds of descriptors of the skill set, including life skills, workforce skills, interpersonal skills, applied skills, and non-cognitive skills. Educators should use in-school time to teach students how to find, interpret, and use information, rather than using most or all of the time to present information. [6] The importance of learning outcomes and course satisfaction should be related to students’ persistence and sense of fulfillment in their study as well. From the Sukhothai Thammathirat Open University (STOU) context, Sungsri (2015) [7] developed a model of educational services affecting the success of studying in the distance education system from the cases of STOU and Open University of Malaysia (OUM). The results showed that the students from both universities had the same opinions on the most important factor that affected the success of their study--the quality of the subject content. However, the second most important factor for STOU students was the convenience of contacting the regional centers in rural areas, while OUM students were secondarily most concerned about the knowledge ability of instructors. The portion of the samples surveyed who were lecturers and staff suggested some guidelines for developing the educational services, such as that the university should have answering phone services related to registration. In addition, there should also be summarized content of course book. Ouyyanont et al, (2011) [8] reported that in the past decades advanced technology arose that pushed STOU to develop new methods of learning and delivery, such as e-learning. Obstacles that have continually occurred are the rigid course content production procedure that has to rely on a course team and external content specialists, besides the long publication lines. By the time the course materials are distributed, the content is almost outdated.
2 THAI QUALIFICATION FRAMEWORK FOR HIGHER EDUCATION (TQF: HEd) Qualifications frameworks describe the qualifications of an education and training system and how they interlink. National qualifications frameworks (NFQ) describe what learners should know, understand and be able to do on the basis of a given qualification. [9] TQF: HEd is a requirement for every educational institution to compete globally with other educational institutions. The framework is useful to provide appropriate points of comparison in academic standards for institutions in their planning and internal quality assurance processes. The evaluators involved the external reviews and employers in understanding the skills and capabilities of graduates they may employ. [10] The TQF: HEd groups the kinds of learning expected from students into five domains and describes learning outcomes at each level. The five domains of learning outcomes are:
1) Ethical and Moral Development; 2) Knowledge;

104
3) Cognitive Skills; 4) Interpersonal Skills and Responsibility; 5) Analytical and Communication Skills.
These domains of learning and the outcomes associated with them apply to all fields of study. The present research intends to find out the learning outcomes of STOU graduates and the satisfaction with courses based on the TQF: HEd. The findings will benefit the enhancement of the students’ learning outcomes as per their expectations and help provide effective teaching and learning approaches that will meet the qualification framework and fulfill the graduates’ satisfaction. It will also benefit the efficiency and effectiveness of the program at STOU as well as producing graduates that fulfill the qualification framework as required for higher education.
RESEARCH OBJECTIVES This research has two objectives: 1) to find out the learning outcomes of STOU graduates; and 2) to find out the course satisfaction of STOU graduates based on the TQF: HEd.
METHODOLOGY The samples were 612 STOU graduates in the year 2014 who attended the graduation ceremony at STOU in September 2016, out of a total number of graduates of 12,964. Samples were proportionately and randomly selected according to the number of graduates in each school. Research instruments were questionnaires divided into three sections: The demographic data; the learning outcomes of courses in the program of study; and the course satisfaction based on the TQF (HEd). For learning outcomes of courses, there were 17 items of questions with five-point rating scales and one open-ended question. These were from the agreement among the Open Universities that have Minutes of Understanding (MOUs) with STOU. For the course satisfaction, there were 5 main items of questions which were divided into and 18 sub-items with five-point rating scales and one open-ended question. Learning outcomes in this paper means what graduates expect to know, understand, and be able to apply to their work successfully after program completion. Course satisfaction here means the kinds of learning expected from graduates in five domains and describes learning outcomes at each level. The five domains of learning outcomes are: 1. Ethical and Moral Development; 2. Knowledge; 3. Cognitive Skills; 4. Interpersonal Skills and Responsibility; and 5. Analytical and Communication Skills. The instruments were approved for validity and reliability by three experts in the field. Data were analyzed with descriptive statistics which were frequency, and mean scores, and for analysis of the open-ended answers, descriptive analysis was used. Based on those of the Likert, the five rating scale questionnaires asking for the achievement of the Learning Outcomes had the following meaning: 5 = most much achieved; 4 = much achieved; 3 = neutral; 2 = slightly much achieved; and 1 = least much achieved. Similarly, the five rating scale questionnaires asking for the course satisfaction based on the TQF (HEd) had the following meaning: 5 = most much satisfied; 4 = much satisfied; 3 = neutral; 2 = slightly much satisfied; and 1 = least much satisfied.
The interpretation of the mean scores ) ) of the Learning Outcomes and Course Satisfaction questions were:
Mean scores of
Learning Outcomes Interpretation Mean scores of
Course Satisfaction Interpretation
4.21-5.00 most achieved 4.21-5.00 most satisfied 3.41-4.20 much achieved 3.41-4.20 much satisfied

105
2.61-3.40 neutral 2.61-3.40 neutral 1.81-2.60 slightly achieved 1.81-2.60 slightly satisfied 1.00-1.80 least achieved 1.00-1.80 least satisfied
3 RESULTS
The result is divided into 4 parts. Part one is the demographic data; Part two is the Learning Outcomes of program study; Part three is the course satisfaction according to Thailand Qualification Framework (TQF: HEd); and Part Four covers two open-ended questions about suggestions to enhance learning experiences and for improving teaching and learning approaches.
Part One: Demographic Data
The number of sample graduates was 612 (N = 612). These were composed of 240 males (39.2 percent) and 372 females (60.8 percent).
Most of the sample graduates were 31-40 years old (n=274, 44.8 percent). The second highest number were in the age range of 20-30 years old (n=191, 31.2 percent). The fewest number in any age range group was 8 (1.4 percent). They were more than 60 years old.
Majority of the sample graduates were private company employees (n=206, 33.7 percent), and government officers (n=145, 23.7 percent), respectively.
The income of most graduates was in the range 10,000-15,000 Baht a month (n=183, 29.9 percent), or 15,001-20,000 Baht a month (n=133, 21.7 percent). Majority of the graduates studied in Management Science (n=209, 34.1 percent), and Law (n=64, 10.5 percent), respectively. Fewest number of the sample graduates studied Economics (n=5, 0.8 percent). Part Two: Learning Outcomes of Courses
According to the analyzed results of the overall mean scores, graduates identified that they much achieved the Learning Outcomes (average mean score = 4.09). For each of the 17 items of the Learning Outcomes questions, most of the average mean scores also showed the much achieved rating of the Learning Outcomes as shown in Table 1.
The two highest mean scores are item 17 and 15, respectively. Item 17 stated that the satisfaction of course learning in the program was most achieved. (mean
score = 4.24). Item 15 stated that the students plan to use experience gained from learning to facilitate working
at its best (mean score = 4.23). This meant that the graduates achieved to a high degree the outcomes of the study plan and were prepared to fully receive the experience gained from teaching and learning.
Table 1 Graduates’ Learning Outcomes and mean scores
Learning Outcomes Mean scores
Interpretation
1. The teaching and learning methods show learning outcomes clearly (This meant that the Learning Outcomes were much achieved. They highly achieved what they expected to know, understand, and be able to apply to their work successfully.)
4.17 Much achieved
2. The number of assignments and activities assigned in each subject is appropriate. (This meant that the graduates achieved to a high degree what they received from the assignments and activities that were composed of reading, attending the tutorial classes to promote learning, group activities, and searching.)
4.10 Much achieved
3. The transmission of subject content via learning and teaching media facilitate the success of the learning outcomes.
4.10 Much achieved
4. There were suggestions in the learning and teaching process that facilitate the success of learning (This meant that the graduates much achieved what they received from the suggestion in the
4.08 Much achieved

106
teaching and learning methods, and the instructional design facilitated questioning and inquiry.)
5. Learning resources in the subject facilitate the success of learning. (This meant that the graduates achieved well the outcomes of learning resources, which consisted of a variety of media, online learning, instruments in laboratory, studio, and digital library.)
3.97 Much achieved
6. The technology used in the teaching and learning process facilitates the success of learning outcomes.
4.02 Much achieved
7. The experience gained from learning subjects in the program facilitates the success of learning. (This meant that the graduates much achieved the outcomes of the learning experience which were the usage of online media, online database, online meeting, face-to-face tutorial, field work practice, professional training, project, and learner activities.)
4.03 Much achieved
8. The supplementary materials of the subject content via the online teaching and learning facilitate the success of learning. (This meant that the graduates much achieved the outcomes of the supplementary additions to the subject content which were short notes and facilitating supports from instructors and peers.)
3.96 Much achieved
9. The quality and the facilitation of the instructors facilitate the success of learning. (This meant that the graduates highly achieved the outcomes of the quality of the instructions when there was positive interaction among the instructors who have experience, knowledge, and enthusiasm in teaching.)
4.15 Much achieved
10. The interaction with the classmates facilitates the success of learning.
3.98 Much achieved
11. The interim evaluation of learning is appropriate. (This meant that the graduates achieved a great deal from the outcomes of the evaluation which is from scoring, grading, and feedback from the instructors.)
4.00 Much achieved
12. The instructors’ feedback and suggestions for the assignments facilitate the success of learning.
4.01 Much achieved
13. The summative evaluation at the end of the semester is appropriate. (This meant that the graduates much achieved the outcomes of the summative evaluation, which were final exams, scores, and grades graduates received.)
4.05 Much achieved
14. The motivation received from learning encourages the desire to learn and reach the goal in professional work.
4.18 Much achieved
15. The plan to use experience gained from learning to facilitate working at its best. (This meant that the graduates much achieved the outcomes of the plan, feeling prepared to fully receive the experience gained from teaching and learning.)
4.23 Most achieved
16. The thought of being more successful and achieve more of the learning outcomes. (This meant that the graduates much achieved the outcomes of having more time to think of the ways to achieve more learning outcomes.)
4.20 Much achieved
17. The satisfaction of course learning in the program. 4.24 Most achieved
Average 4.09 Much achieved
Part Three: Course satisfaction based on the Thaila nd Qualification Framework of Higher Education (TQF: HEd) According to the analyzed results of the overall mean scores, graduates showed much satisfaction with the courses in their program of study (average mean score = 4.20). For each of the 18 items under course satisfaction, the mean score showed that the graduates were most or much satisfied with their courses in all items, as shown in Table 2.
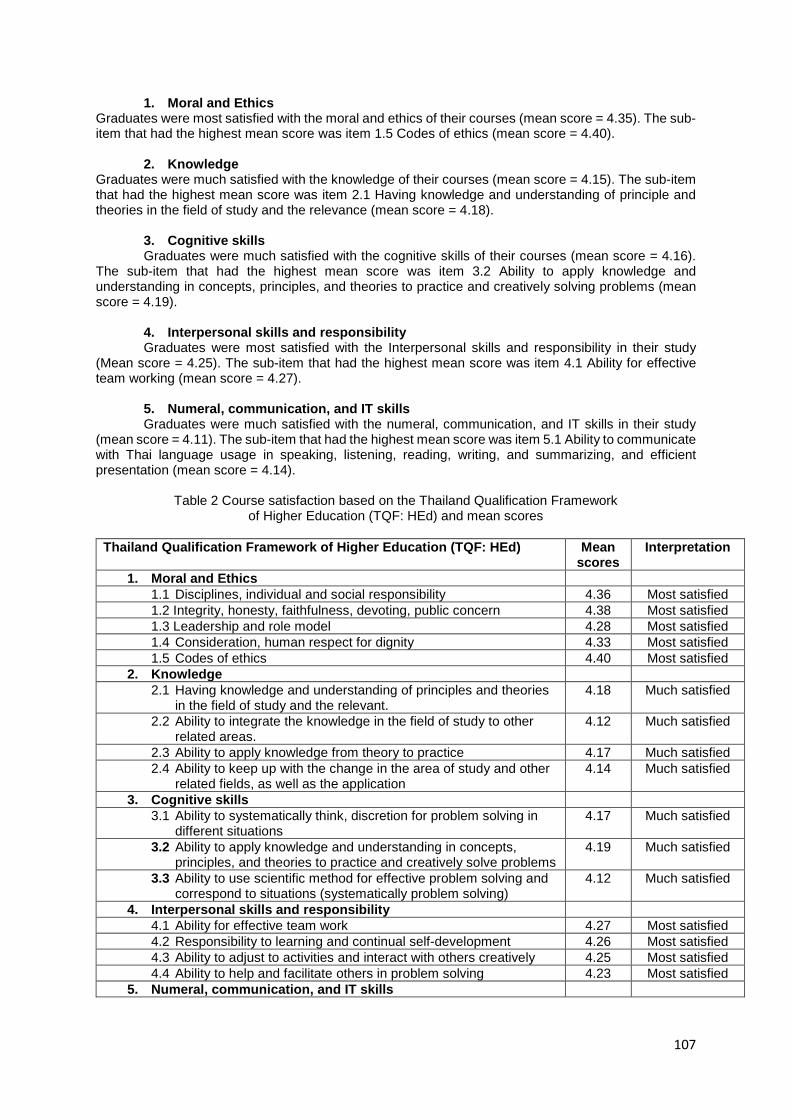
107
1. Moral and Ethics Graduates were most satisfied with the moral and ethics of their courses (mean score = 4.35). The sub-item that had the highest mean score was item 1.5 Codes of ethics (mean score = 4.40).
2. Knowledge Graduates were much satisfied with the knowledge of their courses (mean score = 4.15). The sub-item that had the highest mean score was item 2.1 Having knowledge and understanding of principle and theories in the field of study and the relevance (mean score = 4.18).
3. Cognitive skills Graduates were much satisfied with the cognitive skills of their courses (mean score = 4.16).
The sub-item that had the highest mean score was item 3.2 Ability to apply knowledge and understanding in concepts, principles, and theories to practice and creatively solving problems (mean score = 4.19).
4. Interpersonal skills and responsibility Graduates were most satisfied with the Interpersonal skills and responsibility in their study
(Mean score = 4.25). The sub-item that had the highest mean score was item 4.1 Ability for effective team working (mean score = 4.27).
5. Numeral, communication, and IT skills Graduates were much satisfied with the numeral, communication, and IT skills in their study
(mean score = 4.11). The sub-item that had the highest mean score was item 5.1 Ability to communicate with Thai language usage in speaking, listening, reading, writing, and summarizing, and efficient presentation (mean score = 4.14).
Table 2 Course satisfaction based on the Thailand Qualification Framework
of Higher Education (TQF: HEd) and mean scores
Thailand Qualification Framework of Higher Educatio n (TQF: HEd) Mean scores
Interpretation
1. Moral and Ethics 1.1 Disciplines, individual and social responsibility 4.36 Most satisfied 1.2 Integrity, honesty, faithfulness, devoting, public concern 4.38 Most satisfied 1.3 Leadership and role model 4.28 Most satisfied 1.4 Consideration, human respect for dignity 4.33 Most satisfied 1.5 Codes of ethics 4.40 Most satisfied
2. Knowledge 2.1 Having knowledge and understanding of principles and theories
in the field of study and the relevant. 4.18 Much satisfied
2.2 Ability to integrate the knowledge in the field of study to other related areas.
4.12 Much satisfied
2.3 Ability to apply knowledge from theory to practice 4.17 Much satisfied 2.4 Ability to keep up with the change in the area of study and other
related fields, as well as the application 4.14 Much satisfied
3. Cognitive skills 3.1 Ability to systematically think, discretion for problem solving in
different situations 4.17 Much satisfied
3.2 Ability to apply knowledge and understanding in concepts, principles, and theories to practice and creatively solve problems
4.19 Much satisfied
3.3 Ability to use scientific method for effective problem solving and correspond to situations (systematically problem solving)
4.12 Much satisfied
4. Interpersonal skills and responsibilit y 4.1 Ability for effective team work 4.27 Most satisfied 4.2 Responsibility to learning and continual self-development 4.26 Most satisfied 4.3 Ability to adjust to activities and interact with others creatively 4.25 Most satisfied 4.4 Ability to help and facilitate others in problem solving 4.23 Most satisfied
5. Numeral, communication, and IT skills

108
5.1 Ability to communicate with Thai language usage in speaking, listening, reading, writing, and summarizing, and efficient presentation
4.14 Much satisfied
5.2 Ability to effectively select ICT presentation methods appropriate to the situation
4.13 Much satisfied
5.3 Ability to select and apply the statistical techniques or related mathematics in solving problems appropriately
4.04 Much satisfied
Average 4.20 Much satisfied Part Four: Two open-ended questions about suggestio ns to enhance learning experiences and for improving teaching and learning approaches Some graduates gave additional answers for the two open ended questions about suggestions to enhance learning experiences and for improving teaching and learning approaches. The answers were as follows:
1. Suggestions to enhance learning experiences. (F = 23) The total number of answers for the suggestions to enhance learning experiences are 23
answers as shown in Table 3. The suggestions were: - To use knowledge for onsite problem solution and in daily life (f = 9) - To continually learn more relevant knowledge from online channels such as YouTube (f =
8) - To focus mainly on core topics while studying and do a lot of exercises. (f = 4) - To know more friends and help one another in learning. (f = 2)
Table 3 Suggestions to enhance learning experiences and their frequencies
Suggestions to enhance learning experiences Frequency
To use knowledge for onsite problem solution and in daily life 9 To continually learn more relevant knowledge from online channels such as YouTube.
8
To focus mainly on core topics while studying and do a lot of exercises. 4 To know more friends and help one another in learning. 2
Total 23
2. Suggestions for the program study to improve tea ching and learning approaches (F = 100)
The total number of answers for the suggestions to improve teaching and learning approaches in the program study was 100 answers (f = 100) as shown in Table 4. Graduates were satisfied with the approaches they experienced (f = 16). However, some suggested the ideas to improve the teaching and learning approaches. The highest frequency of answers were as follows:
- The program should provide more assignments and exercises that have score accumulation for the students, and provide more training activities with more training time. (f = 16)
- Text books should be delivered on time. (f = 11)
Table 4 Suggestions for program teaching and learning approaches
Suggestions for program teaching and learning approaches Frequency Rank The program already provided the appropriate teaching and learning approaches.
16 1
The program should provide more assignments and exercises that have score accumulation for the students, and to provide more training activities with more training time.
16 1
Text books should be delivered on time. 11 2 There should be more learning channel access via Internet for alumni and those who are interested to learn more and keep contact with the program.
8 3
To provide more interactivity with their instructors and class mates. 7 4

109
To revise pedagogy to be up to date and follow the philosophy of distance education.
7 4
To provide summaries of subject contents. 6 5 To provide more tuition classes in more provincial areas. 6 5 To provide more supplementary media contents (via VCD, online, E-book). 6 5 To provide more site visits and exchange students with other institutions in ASEAN.
6 5
To provide more assignments to enhance cognitive skills, world views and mathematical skills.
5 6
To provide guidelines for calculated assignments and those of examinations at the end of the text books.
4 7
To provide more contact channels with the university and receive more correct information in time.
3 8
4 CONCLUSIONS AND RECOMMENDATIONS Learning outcomes may be considered in several aspects. It may be considered into 3 components (Knowledge, skills, and attitudes) or more than three. Some of these correspond with the TQF: HEd and the skills that employers in the 21st century consider foremost: ability as independent thinkers, problem solvers, and decision makers. Educators should therefore provide a curriculum that coaches students how to find, interpret, and use information to meet the skills required. As for STOU, there have been several research projects that tried to find out how to solve the current problems that hindered students learning outcomes so that more students could be retained in the system. However, problems still occur up to now. Although the present study showed from the graduates’ perceptions of their learning outcomes that the majority of them felt they were much achieved according to the program they studied, especially to facilitate working at its best which is the item that reached the highest mean achievement score. However, the institution should continue to survey and assess the whole process offered to maintain the quality and to develop the pedagogy and instruction approaches continually. For the course satisfaction based on the 5 domains of TQF: HEd, graduates stated that they were at least much satisfied with all the stated qualifications. The ones that achieved the most satisfaction rating were the Moral and Ethics and Interpersonal skills and responsibility domains. Those that reached the much satisfaction rating were the domains of Knowledge, Cognitive skills, and the Numerical, communication, and IT skills. STOU should still keep up with increasing greater satisfaction in those domains. Suggestions that graduates recommended to enhance their learning experiences were that they used their knowledge while working in daily life. They also suggested the continual learning from online channels. This implied the desire for continual life-long learning among the graduates. Graduates also gave suggestions for the program that they studied to improve teaching and learning approaches, although they were much satisfied with what the program had offered. Some suggestions were the provision of more assignments and exercises that allowed score accumulation and more training activities. They also asked for on time text delivery. Therefore, STOU should consider those requirements as a primary concern. In regard to the above results, the program study of STOU should also consider the learning outcomes of the graduates they produce to serve the market place and society as well as considering the teaching approach to satisfy all stakeholders, primarily the students who study in the program. All five domains of the TQF: HEd are also crucial for the 21st century work place and environment. Morals and ethics is the first domain that the program should primarily be concerned with since it brings out the attitudes which are crucial for students to develop sustainable relationships with themselves and with others. The other domains are also important that STOU should keep in mind to provide qualified graduates to serve society.

110
Although a good level of satisfaction was achieved for most of the indicators for learning outcomes and qualification frameworks, the programs at STOU should compete with themselves while looking at the surroundings to develop up-to-date pedagogy, text contents and other related approaches that can fulfill the needs of the stakeholders both specifically and widely. As an institution for inclusive and equitable education, STOU should still continually assure the quality of the graduates they produce to be able to compete with the ones from other institutions in the global context. There should be promotion for awareness and commitment amongst all involved staff and integrate quality assurance programs into the university’ s annual action plans to improve the quality of institution’s methods, educational products and outcomes to ensure that all process conform to the requirements for the purpose of increasing student success. Finally, this study may bring out the more efficiency and effectiveness of the program at STOU as well as producing graduates that fulfill the qualification framework as required for the higher education in open and distance learning context. The results from this study may give some benefits to the open and distance learning institutions as inclusive and equitable education providers for all. REFERENCES
[1] Simon Midgley. (2017). University of Birmingham. Retrieved August 2, 2017, from https://www.thecompleteuniversityguide.co.uk/distance-learning/what-is-distance-learning/
[2] Office of Institutional Research and Effectiveness (OIRE). Why assessment? Retrieved November 24, 2016, from http://www.oire.uconn.edu/WhyAssessment.html
[3] Office of Institutional Research and Effectiveness (OIRE). Why assessment? Retrieved November 24, 2016, from http://www.oire.uconn.edu/WhyAssessment.html
[4] Institutional Assessment & Studies, University of Virginia. Outcomes assessment. ? Retrieved November 24, 2016, from http://avillage.web.virginia.edu/iaas/assess/resources/learningoutcomes.shtm
[5] PAECHTER, MANUELA; MAIER, BRIGITTE; MACHER, DANIEL. (2009). STUDENTS’ EXPECTATIONS OF, AND EXPERIENCES IN E-LEARNING: THEIR RELATION TO LEARNING ACHIEVEMENTS AND COURSE SATISFACTION. Retrieved August 2, 2017, from http://www.sciencedirect.com/science/article/pii/S0360131509002000
[6] Silva, Elena. Measuring skills for 21st century learning. Retrieved May 1, 2009, from PHI DELTA KAPPAN, http://journals.sagepub.com/doi/abs/10.1177/003172170909000905?journalCode=pdka
[7] Sungsri, Sumalee (2015). Developing a Model of Educational Services Affecting the Success of Studying in the Distance Education System: Case Studies of Sukhothai Thammathirat Open University and Open University Malaysia. A research report.
[8] Ouyyanont, Porphant and others (2011). Benchmarking Sukhothai Thammathirat Open University Distance Learning System Towards Outstanding International Open Universities. A research report.
[9] School of Business and Engineering, Halmstad University. European Lifelong Learning Policy – Short track studies on good practices. (2010). Retrieved June 12, 2017, from https://www.diva-portal.org/smash/get/diva2:373881/FULLTEXT01.pdf
[10] National Qualifications Framework for Higher Education in Thailand. Implementation Handbook. (2006), Retrieved October 1, 2014 from http://www.mua.go.th/users/tqf-hed/news/FilesNews/FilesNews8/NQF-HEd.pdf

111
ENHANCING STUDENT INVOLVEMENT THROUGH SUPPORT SERVICES OFFERED:
CASE OF DISTANCE EDUCATION IN SRI LANKA
H.C. Dassanayake 1, B. Nishantha 2, W.A.R. Senevirathne 3 1Department of Decision Sciences, University of Sri Jayewardenepura (SRI LANKA)
2Department of Management and Organizational Studies, University of Colombo (SRI LANKA)
3Department of Management Studies, The Open University of Sri Lanka (SRI LANKA)
Abstract
Distance education encourages lifelong learning especially for those who have inner quest for higher education yet have missed the opportunity due to one or more reasons. Despite the popularity and demand, the system has been suffering from inherent and critical issues as higher student dropout rate, longer completion time of study programmes by students and comparatively low academic performance. Even though suggestions to overcome these issues by previous studies focus on services offered by distant education institutes, they alone cannot overcome them as It requires students to involve in academic matters since in distance education system, self-responsibility towards academic activities is crucial. Therefore, this paper investigates the impact of support services on student involvement in distance education in Sri Lanka and, examines whether this impact is mediated by student experience quality. For this purpose, quantitative research approach based on cross-sectional survey design was used. Data were collected using a structured questionnaire. Sample consisted of 400 undergraduates of the Open University of Sri Lanka, drawn using simple random sampling technique. Data which were analyzed using Structural Equation Modeling revealed that there is a direct impact of support services on student involvement. Mediating effect was substantiated where it partially mediates the impact of support services on student involvement. The validated model after data analysis is a novel model unique to the distance education. Further, findings facilitate in service designing process and thereby enable to address the prevailing issues in the distance education context. Thus, the study is enriched with number of implications in terms of theoretical, managerial and societal.
Keywords: Distance Education, Support Services, Experience Quality, Student Involvement
1 INTRODUCTION
Since the ancient time, teacher-teaching and student-listening was the primary mode of education. They used to gather at a specific location at a specific time which was pre-determined [1][2]. This arrangement immensely altered with the invention of educational delivery mechanisms powered by telecommunication and technological developments [3][4]. Prevailed temporal and geographical constraints for education were removed consequently by allowing students to make their learning decisions as what to learn, where to learn and how to learn [1]. Physical face of academic establishments was also altered and, online classes, study material and libraries became more popular among community [1]. This resulted in proliferation of study programmes based on Distance Education (DE) platform [2][4]. As the name stipulates, DE is a system of education or process of providing education or any instructional arrangement where teacher and student are geographically dispersed hence teaching behaviours are executed apart from learning behaviours [5][6][7][8]. Importantly, there is a gap between teacher and student where student is isolated and bear self-responsibility towards academic activities [7]. Students are provided with relevant study material and information to enable them to work by themselves. Therefore, they can study at their own time, at the place of their choice and without face to face contact with teachers and peers [9][10]. On the other hand, from the earliest days the rationale of DE has been to open opportunity for learners to pursue higher studies regardless of geographic, socio-economic or other constraints. Thus, a significant diversity in terms of age, family responsibilities, employment, aims and intentions among students is visible in DE system comparing to conventional education system [8][11]. These characteristics are unique to the DE system hence they

112
demand for special course designing techniques, organizational as well as administrative arrangements [1][5][7][8]. Removing barriers to education has made DE as one of the most effective methods of pursuing education particularly for those who missed educational opportunities [12]. However, reviewing scholarly work indicate that dropping out from study programmes without completing them and lacking excellent academic performance by students are comparatively higher in DE system comparing to conventional universities [12][13][14][15]. This is backed by student specific reasons as lacking responsibility towards own learning, inadequate understanding on DE system and difficulty of managing numerous responsibilities at once while learning as well as system specific features as depersonalized learning environment, poor interaction with peers and teachers and technological barriers[12][13][14][16][17][18]. Considering the Sri Lankan context, the Open University of Sri Lanka (OUSL) is the pioneer in DE which has an ever increasing demand and popularity for its study programmes since the inception [19][20][21]. Other than the OUSL, there are multiple institutes attached to state and private universities offering distance based study programmes in different disciplines. Despite the demand, popularity and importance as an effective method of education, above identified problems are visible in the Sri Lankan context at present. Recent statistics, particularly related to one of the most demanded study programmes offered by the OUSL, Bachelor of Management Studies (BMS) degree, it is apparent that graduation rate comparing to registration rate is significantly at a lower level, which is less than 10%. Further, since students are provided with the opportunity of extending their degree, majority of them do not complete the degree during the stipulated four years period. Specifically, among the graduates, small proportion has been able to secure a first class or second class upper division degree as many of undergraduates are looking for mere paper qualification [19]. Even though these problems have been observing over time, purpose of any DE provider would be enabling students to complete their study programmes within the permitted time with superior performance and, encouraging and facilitating them to climb up in the academic ladder to become professionals with strong academic background in their respective fields. Allowing dropout from any study progarmme restrains another students’ potential of entering into the study progarmme since all the institutions are competing for scarce resources. Particularly, DE is for those who missed their Higher Education (HE) opportunities due to some reason or the other hence restraining student opportunities to enroll into study programmes can adversely affect their academic as well as professional development and finally wellbeing of the entire nation. Therefore, finding root causes and appropriate solutions are paramount important. As emphasized by previous studies, suggestions to overcome prevailing problems in the DE context address aspects as teaching, teaching styles, teacher characteristics, assessment, facilities [12][13][16][22] as well as administrative, financial and advisory services and also opportunity for extra-curricular activities [12][13][23][24]. These are primarily the services offered by DE institutes which include both main services, i.e. core services and support services. However, in the DE context, majority are part time students who are employed and bear family and professional responsibilities. They expect hassle free learning processes and environments such that support services provided by institutes to augment the core services are comparatively more important as emphasized by previous studies in order to overcome the identified issues[8][11]. Nevertheless, self-learning is one of the main concerns in DE context where students have to play a significant role as they need to invest time and effort and get themselves involved in academic activities [7]. Thus, services offered by institutes alone cannot overcome above problems. As highlighted by theory of student involvement [25] and theory of student effort [26], academic involvement results in improved student learning and development whereas theory of student attrition says higher the academic engagement with the institute reduces the likelihood of student dropout [27]. Further, empirical studies have proved a significant relationship between student involvement and their performance as well as lower dropout rates [25][[28][29][30]. Therefore, in order to overcome the prevailing identified problem in the DE context, making the student involved in academic matters is essential. Accordingly, student involvement can be identified as the mediator that links the input and output of the learning process where input is the services offered by DE institutes whereas output is the student success and retention [25]. Thus, this papers attempts to find out the impact of support services offered by DE institutes on student involvement in DE in Sri Lanka. On the other hand, DE is a service

113
and every service encounter is accompanied by experiences where perception of the experience, i.e. experience quality, determines the behavior [31]. Therefore, this paper further investigates whether student experience quality mediates the above impact of support services on student involvement in DE in Sri Lanka. Accordingly, the two main research questions of this paper are as follows. • Do the support services offered by DE institutes affect student involvement in DE in Sri Lanka? • Does student experience quality mediate the impact of support services offered by DE institutes on
student involvement in DE in Sri Lanka?
2 LITERATURE REVIEW
2.1 Support Services Human needs and wants are satisfied through products offered by organizations. Even though products are traditionally categorized as goods or services, boundaries between them are blurring nowadays [32]. Products are offered as a bundle and, depending on the relative proportion they are categorized as either goods or services [32][33]. Accordingly, HE is categorized as a service; specifically, it is a professional service which caters the need of learning and acquiring knowledge, expertise and skills. It offers opportunities as the product to its customers, i.e. students, with the help of tangible and intangible elements as infrastructure and faculty expertise respectively [34][35][36]. HE service is provided by people for people, directed at student mind via intangible actions hence, it is a mental stimulus processing service which does not result in ownership of any physical item and benefits are therefore purely intangible. These benefits are unique to each student thus education service is heterogeneous even though all the students are offered with the same service [37][38]. Even though HE service is offered as a single package to students, who are the primary customers, it consists of number of tangible and intangible elements together which create a value for students. A service package is a combination of core and support services [37][39]. Core service are the basic problem solving benefits students seek or needs trying to fulfill and thereby the reason for service transaction [37][38][40]. Support services are supplementary to core services which provide additional benefits, enhance service value and contribute to differentiate the service from substitutes [37][38][40]. As presented in the service flower model [37], support services, i.e. peripheral services can further classified into facilitating services and enhancing services. Facilitating services facilitate the use of core services whereas enhancing services enhance the value and appeal of core services [37]. Accordingly, in the DE context enquiry; admission and pre-study advisory services; career guidance and counseling services; record keeping; provision of timely and relevant information; information management and; other administrative support can be identified as facilitating services. Similarly, enhancing services include multiple payment methods and related applications; financial aids; online registration and related online support; differentiated services for students with special needs of one sort or another and; extra-curricular and recreational facilities [41][42][43][44]. 2.2 Student Involvement Theory of student involvement defines student involvement as the amount of physical and psychological energy that the student devotes to college experience [25]. It is the ability of an individual to take charge of own learning by setting goals, identifying gaps in knowledge and addressing them through a self-monitoring process [10]. An academically involved student may participate in classroom discussions or study by him or herself hence student involvement can happen in both inside or outside the classroom [45]. Thus involvement can be observed and measured qualitatively or quantitatively with respect to each student [41]. Accordingly, student involvement is a behavioral phenomenon [25][46] and connected with the individual student. When a student is academically involved, he or she utilizes considerable amount of available time on reading course material; other relevant books; use library; logging to learning management system frequently; make separate notes; utilize their learning into day to day activities specifically in their work settings; attend lectures and; actively participate in classroom discussions. Also they interact with lecturers to discuss subject matters, academic plans and tend to look for feedback on their performance as well as other academic and career related progression. They also take part in collaborative learning with peers, spend time in studying and tutoring as well as sharing experience on study programmes and future plans with peers [25][45][47][48].

114
2.3 Student Experience Quality Services are always accompanied by experience since they result in experiential effects [49]. Experience is the intangible takeaways from service encounters which originate from a set of interaction between the customer and a product, a company or part of its organization over several touch points in the service journey [50]. In HE, students bring certain characteristics with them and interact with services provided by institute resulting a learning experience. As per student life cycle, student experience starts when a student decides to study at university and evolves through the phases as application, registration, teaching, learning and assessment, graduation and post qualification experience. It is not limited to class room learning or academic matters but covers whole experience they are going through including out of class non-academic aspects as student support and administrative activities as well as social aspects as forming new friendships, advising and mentoring [51][52]. The most developed aspects of customer experience measurements concern customer perceptions of parts of the service journey or of the overall customer experience based on their affective analysis of service which is known as customer experience quality [49][53]. On student point of view, student experience quality is the students' perceptions of direct and indirect inputs they receive from their college which indicate student’s own view towards the variety of aspects as curricula, program delivery, quality of instruction, and learning support. If their expectations on these elements are met, they tend to rate it as a quality experience and if not other way around [54][55]. 2.4 Impact of Support Services on Student Involveme nt There are empirical studies that have identified consequences of student involvement rather than its antecedents particularly in the DE context [25][26]. Specifically, how student involvement is affected by services offered by institutes has not empirically investigated earlier hence this paper attempts to bridge the prevailing knowledge gap [25][56]. Theory of student involvement provides the theoretical foundation for this relationship. As one of the postulates of the theory emphasizes, if educational policies and practices of a HE institute are effective, it will result in increased involvement in academic activities by its students [25]. These policies and practices provide the ground rules for functionality of the institute such that what it offers to students and how it is offered are part of these policies and practices [57]. Therefore, it can identify that core and supportive services offered are included in and also influenced by these educational policies and practices of the institute. Even though previous studies have not explicitly identified impact of these support services on student involvement, by analyzing scattered findings it can identify that support services results in effective student involvement. For instance, facilitating services as administrative support and provision of timely information address alienation feature unique to DE whereas enhancing services as multiple and flexible payment methods aligning with modern technological innovations make it convenient for students to execute their studies without constraints. Since majority of learners in the DE system are working adults with family responsibilities, financial support in terms of scholarships or payment in installments can assist students in continuation of their studies. These support services provide a hassle free supportive learning environments and conditions for students where they feel committed and comfortable with the institution resulting higher integration with the academic activities [58][59][60][41][44]. Accordingly, based on theoretical and empirical grounds, following hypothesis is proposed in this paper. H1: Support services offered by DE institutes positively influence on student involvement in DE in Sri Lanka. 2.5 Mediating Role of Student Experience Quality Mehrabian and Russel model which is based on Stimuli-Organism-Response framework highlights that individual’s feelings and emotions evoked by environmental stimuli ultimately determine their behavior [61]. Environmental stimuli are what people receive with their senses and after interpreting them on their own view, an emotional state expands into either one of pleasure or of arousal. Next the person responds to the emotional state through a behavior which can be either approach or avoidance related. An approach or positive related behavior indicates that the person possess a better feeling and vice versa. Hence it is apparent that emotions indicate a person’s perception on stimuli and it will result in his or her behavior [61][62]. Accordingly, in the HE context, support services can be treated as stimuli received by students, more specifically contextual stimuli, and their involvement is the behavioral response to those stimuli which is mediated by their perception on learning experience, i.e. experience quality, gained from those services.

115
Students in the DE platform carry a diverse profile and their expectations on services offered are not merely limited to curriculum, pedagogy or assessment rather essentially related with how the DE institute responds to their needs and commitments [63]. Student perception on experience can be therefore influenced by additional and value added service provided [51]. Comprehensive orientation programmes, provision of information, guidelines and instructions facilitate smooth functioning of student activities. Financial, social or psychological support and guidance to students removes external barriers to academic performance. Use of latest information and communication technology is seen as essential in creating stimulating learning environments characterized by features as blended learning, remote access to live lectures, access to digital libraries and networking of students, academic staff, research assistants and learning resources. Opportunities for extra-curricular activities also make student academic life more interesting and entertaining. Therefore, well designed these support services create emotional feelings outside the main functional solution which subsequently result in better perception regarding their student experience [51][56][42]. On the other hand, Entwistle and Tait have specifically identified a direct relationship between student perception and actions [64]. Positive perception on their learning experience influences desirable study behaviors which results increased student involvement. When meaningful learning experiences are missing, students often become disengaged and dissatisfied because they see no relevance in what they are learning. Accordingly, students with few chances to participate in meaningful learning experiences are denied the opportunity to integrate and apply the knowledge they have obtained in their classes. Therefore, contemporary research in student learning has also suggested a relationship between learning experience and study behavior. Better the student experience, i.e. when student perceive their learning experience as of high quality, it will therefore eventually increase their involvement in academic activities [45][64][65][66]. Therefore, based on these theoretical and empirical foundation following hypotheses are proposed to test the mediating effect of student experience quality on the relationship between support services and student involvement H2: Support services offered by DE institutes positively influence on student experience quality in DE in Sri Lanka. H3: Student experience quality positively influence on student involvement in DE in Sri Lanka. H4: Student experience quality mediate the relationship between support services offered by DE institutes and student involvement in DE in Sri Lanka. Based on the above identified relationships therefore, the following conceptual framework is proposed by this paper which is subject to empirical validation through a rigorous data collection and analysis.
Figure 1: Conceptual framework.
3 METHODOLOGY
This study establishes relationships between study variables rather than in depth exploration hence can be categorized as an explanatory study. Since it looks into gathering data on student opinion regarding, data were collected at a specific time from the sample such that this is a cross sectional study considering the time horizon and followed the deductive approach as hypotheses were developed based on established theories. Study sample consisted of 400 undergraduates of the BMS degree programme drawn using the simple random sampling technique [67][68]. Based on the survey strategy, primary data were collected by using a structured questionnaire as the data collection tool. Study variables were measured at 5 point likert scale ranging 1=strongly disagree to 5=strongly agree by modifying and adapting to existing measures. Table 1 presents the operationalization of variables. In order to overcome Common Method Variance (CMV), at the questionnaire designing stage procedural remedies were taken as ensuring respondent’s anonymity in the attached cover letter and
Student
Involvement
Student
Experience
Quality
Support Services
(+) (+)

116
providing proper instructions to psychologically separate the measures [69]. Pilot study was undertaken and based on the feedback, required modifications were done. Using the online method, 700 questionnaires were distributed and reminder notes were sent to encourage the response. After removing incomplete questionnaires, codded questionnaires were fed to SPSS 20.0 to treat outliers and missing values. For the preliminary analysis 386 questionnaires were used. Multivariate assumptions of normality, linearity, multicolinearity and homoscedasticity were ensured as they are essential to conduct the Structural Equation Model. Since available measures were modified to suit to the study context, Exploratory Factor Analysis was performed with respect to each construct to test the factor structure and confirmed the unidimensionality of measures. Further, Reliability of measures
Table 1. Operationalization of study variables
Variable Definition Dimension Literature
Source
Support
services
Supplementary to core services offered by DE
institutes which provide additional benefits and
enhance service value to students
Facilitating services
Enhancing services
Jung (2012)
Student
experience
quality
Perceived superiority of holistic service encounter
or the experience of the student
Bujisic (2014)
Student
Involvement
Amount of physical and psychological effort
devoted by a student for academic activities
Active participation
Self-learning
Student faculty
interaction
Learning with peers
National
Survey on
Student
Engagement
[NSSE], 2016
were tested by Cronbach’s alpha value calculated for each dimension and construct. Since all the calculated values were greater than 0.6, high internal consistency was validated. Using AMOS 21.0 measurement and structural models were developed. Measurement model was tested with Confirmatory Factor Analysis. Model fit was improved using modification indices and removing factor loadings less than 0.45. Resulted Goodness-of-Fit (GOF) indices were above the cut-off values indicating that model provides a reasonably good fit. Convergent validity of measures was tested using Composite Reliability (CR) and Average Variance Extracted (AVE). Accordingly, CR and AVE values of all dimensions and constructs were greater than 0.60 and 0.50 respectively. Therefore, based on CR and AVE convergent validity of measures were established. Similarly, discriminant validity could also establish as AVE values for all the dimensions and constructs were greater than the corresponding squared correlation coefficients. Finally, Harman’s single factor was calculated to test whether data are free of CMV. Result revealed the presence of six distinct factors with eigenvalue greater than 1.00 together accounted for 61.51% of the total variance; the first factor did not account for a majority of the variance (22.29%). Thus, no general factor was apparent. Accordingly, these results did suggest that CMV is not of great concern and thus is unlikely to confound the interpretations of results. Finally structural model was developed to test the study hypotheses [67][68][69][70].
4 DATA ANALYSIS
4.1 Sample Profile
The study sample consists of undergraduates of the BMS degree at the OUSL. They are attached to Colombo, Kandy and Matara regional centers where students attached to colombo regional center represents the highest participation in survey. Respondents are studying at all the levels in the degree programme and 45% of them are from level 6, such that expect that they are possessed with considerable knowledge on services offered by the university. Aligning to typical characteristics of DE, 67% of students are employed and most importantly 67% of the sample bear family commitments in terms of financial contribution to their families. However, contrary to previous findings, sample consists of only 33% of maaried students and majority of respondents are females accounting 60% of the sample.

117
4.2 Structural Model
Upon theoretical and empirical basis this paper proposed four hypotheses of which one is related to the direct impact of support services on student involvement whereas others test the indirect impact proposing student experience quality as the mediator. In order test these hypotheses structural model (Figure 2) was developed upon the validated measurement model and bootstarapping method was used to test the mediator effect. The corresponding GOF indices of the model is presented in Table 2.
Figure 2: Structural model.
Table 2. GOF Indices of the Structural Model
Absolute Incremental Parsimony CIMIN/DF GFI AGFI RMSEA IFI TLI CFI PRATIO
2.14 0.87 0.84 0.06 0.92 0.90 0.91 0.90
Accordingly, CIMIN/DF is less than 3, RMSEA is well below 0.08, PRATIO is 0.9. GFI, AGFI values are closer to 0.9 and IFI, TLI and CFI have reached 0.9. Thus, it could conclude that GOF of the structural model was at an acceptable level and thereby can use to test the four hypotheses of the study [70]. Following Table 3 summarizes the results of the hypotheses testing.
Table 3. Results of the Hypotheses Testing
Hypotheses β P Result on Hypotheses
H1: Support services offered by DE institutes positively influence on student involvement in DE in Sri Lanka
0.38 0.00* Supported
H2: Support services offered by DE institutes positively influence on student experience quality in DE in Sri Lanka
0.68 0.00* Supported
H3: Student experience quality positively influence on student involvement in DE in Sri Lanka
0.33 0.00* Supported
H4: Student experience quality mediates the relationship between support services offered by DE institutes and student involvement in DE in Sri Lanka
0.22 0.00* Supported
Note: *p<0.05.

118
Results indicate that all the four hypotheses are significant at 95% confidence level. Both the direct and indirect paths are therefore significant in the model. Thus, support services has a direct positive impact on student involvement as well as indirect positive impact on student involvement via student experience quality. Therefore student experience quality can be identified as a mediator on the impact of support services offered by DE institutes on student involvement. On the other hand, the path coefficient, β is lower in the indirect path than the direct path. This indicates that student experience quality partially mediates the impact of support services on student involvement. Accordingly, it can conclude based on the results of the hypotheses testing, if DE institutes offer better support services to their students it will improve student involvement in academic activities. Similarly, due to partial mediating effect, better support services will let students to perceive their learning experience as high of quality such that it will affect their behavior in terms of enhanced utilization of time and effort on academic matters resulting improved student involvement.
5 DISCUSSION, IMPLICATIONS AND FURTHER STUDIES
5.1 Discussion The proposed direct impact of support services on student involvement on the basis of theory of student involvement as well as empirical findings, was substantiated in the Sri Lankan context. This aligns to previous findings as they highlight that effective supportive services encourage students to pay more attention on their academic activities [25][58][59][60][. Properly designed orientation programmes which enable students to have an overall understanding on the DE system and means of succeeding; adminstrative support as dissemination of timely information, well organized documentation processes, quick response and helpful non academic staff members; financial support specially payment in installments, scholarships and multiple payment methods; counseling services and psychological support as well as career guidence since majority are working students who need to balance their family life and work life while learning will create a hazzle free learning opportunities and environments to students. Further, opportunities for extra curricular activities as participation in student associations and sports make the student life more interesting. When these supportive services are effecetively designed and organized, it eliminates the need of students to pay extra attention on non academic matters, make the learning process convinient and intersting without extra burden which bridge the detached student closer to the institute. Due to hazzle free convinient and interesting learning environment students tend to pay more attention on their studeis and perform well. The proposed mediating effect of student experience quality on the impact of support services on student involvement which is based on the Mehrabian and Russell Model was validated in the Sri Lankan context. Even though this impact has not been previously explicitly tested in the DE context, considering the scattered findings on elements of support services provided by DE institutes it can identify that better services result in better evaluation by students regarding their experience. Thus, aligning with previous findings, it can conclude that in order to create an actual value of student experience requires proper construction not only main services but also supportive services offered by the education institute [52]. Similarly, these findings are consistent to previous findings conducted in other service contexts as in restaurants, hotels and transportation [71][72][73]. In the broadest sense they have identified that service quality, product quality, pricing and price fairness, service environment, processes, service convenience and employees are the key drivers of customer experience quality. Accordingly, provision of information, feedback procedures, responsiveness and quick service provision, use of multiple channels of customer interaction, use of latest technologies, convenient payment processes and value added services as playing music in service location are identified as drivers of customer experience quality which can categorized as support services [71][72][73]. Such that, based on findings of the previous studies it can also affirm that support services are linked to customer experience quality. On the other hand, due to unique characteristics of students in the DE platform as employment status and family commitments, they prefer to have a hassle free learning environment such that provision of these supportive services makes the service they receive more appealing. This can be mainly since people are more attractive nowadays towards the additional benefits they receive other than the basic service. Even though they are not essential to fulfill the basic requirement, people expect service provider to make the service they receive more unique, memorable and convenient by accompany them with these additional services. If they are provided with such service they tend to evaluate their

119
experience as superior. Reasons for these changes can be attributable to shift in socio-demographic factors particularly improvements in life style which is influenced mainly by the technological developments. When considering the impact of student experience quality on student involvement, study findings are consistent with previous studies. Specifically, Klaus and Maklan [74] as well as Entwistle and Tait [64] have concluded a direct relationship between student perception and actions while Ning and Downing [75] have concluded that student perception of learning experience directly affect their study behaviors. Since student involvement is a behavioral phenomenon, therefore, study findings convey a consistence with existing knowledge. Similarly, in other service industries also it has proven that customer perception drives their behavior and behavioral intentions as repeat purchase, word of mouth communication as well as loyalty and satisfaction [49][76]. Even though mediating impact of student experience quality has not explicitly tested in previous studies, based on available knowledge in DE as well as in other service sectors therefore, it is apparent that study findings represent a consistent with existing knowledge. Accordingly, findings of this study along with previous findings fulfill the requirements to consider a variable as a mediator. Since the proposed novel mediating impact was substantiated by the study findings; this study contributes new knowledge and extends the existing knowledge base specific to DE in the Sri Lankan context. 5.2 Implications Findings of this study are enriched with theoretical as well as managerial implications. The validated theoretical framework of the study was developed by combining two theoreies in order to adress the prevailing issues in the DE context. Particularly, much of the previous studies have focused on consequences of student involvement rather than its drivers. Also the established mediating effect of student expereince quality has not been previously tested in the study context. Therefore, while addressing these prevailed gaps in the existing knowledge base, the validated theoretical model of the study can be identified as a novel contribution which is unique to the DE constext. On the other than even though previous studies have emphasized on drop out and lower academic performance as problems in the DE context, they have not addressed how contextual elements as services offered by institutes along with student contribution can overcome the identified problems. Therefore, the findings bridge this empirical gap in the knowledge base. Most importantly, the fingings are significant in terms of managerial or practical means. They provide valuable input to the institutes specifically in service designing and redesigning. Since support services can make positive impact upon utilization of time and effort on academic activities by students, institutes need to ensure that they provide all the relevant, comprehensive and up-to-date services in addition to their core services as teaching, learning and evaluation. Particularly, due to existence of partial mediating effect, it is essential to ensure that services provided are perceived by stuednts as of high quality. Even though quality is a subjective phenonemon, designing services considering industrial requirements, student demand and their proirities, as well as principles of service desigining along with educational theories and philosophies will enable institutes to deliver a quality service that encourage students towards academic involvement. Thus, the study findings provide significant inputs for educational policy developments and thereby making the service offered by these institutes more appealing. Such managerial decisions will enable to overcome identified critical and inherent issues in the system. However as a whole, findings of the study have societal impact as educated citizens are a real asset to any nation. Educating citizens therefore influence on their well-being and thereby the development of the entire nation. It is a known fact that DE is an effective mean of offering academic programmes for those who missed higher studies or those who have inner quest for higher studies. Therefore, it is essential to identify and provide solutions to the problems of the DE system to make sure that intended benefits of it are reaped. Findings of this study therefore provide important input to decision makers in designing study programmes in a way that enhances student involvement in academic activities. On one aspect this enables students to attain academic qualifications while enhancing their knowledge and enabling them to make better contribution to professional as well as personal life. On the other hand DE institutes would be able to make better decisions by allocating their scare resources in a productive manner for the betterment of the nation. In addition, higher student performance and reported lower dropout rates resulting from better services offered by DE institutes will positively affect the goodwill of

120
the institute and create market recognition as well as confidence among potential students. Thus, findings emphasize on need of reconsidering about DE system as a whole in order to make it more beneficial to the wider society and thereby making the nation literate. 5.3 Further Studies Despite the study implications there are number of limitations that can be addressed in future studies. The sample of the study consisted of undergraduates of the BMS degree offered by the OUSL. Since there are plenty of other institutes that offer distance based study programmes in different disciplines, future studies can select a sample to incorporate a wider diversity in the sample which can gain more insight into the study phenomenon. On the other hand, there is high diversity among students in the DE system due to removal of barriers to education. Even though all are offered with the same services, their perception may be influenced by individual characteristics as their employment status, age or own study intentions and desires. Therefore, the impact of support services offered by institutes on student experience quality can be affect by these student characteristics such that in future studies they can be incorporated as moderating variables to the validated theoretical framework. Similarly, this study gathered data from students which present their opinion on study variables. Future studies can gather service provider opinion, particularly on services they offer and thereby can perform a gap analysis in order to identify the unmet desires of student which will be helpful in service designing process.
REFERENCES
Sachar, M. & Neumann, Y. (2003). Difference between traditional and distance education academic performances: A meta analytic approach. International Review of Research in Open and Distance Learning, 4(2).
O’Malley, J., & McCraw, H. (1999). Students perceptions of distance learning, online learning and the traditional classroom. Online Journal of Distance Learning Administration, 2(4).
Wang, C., & Liu, Z. (2003). Distance education: Basic resources guide. Collection Building, 22(3), 120-130.
Gunewardene, G. I. C., & Lekamge, G. D. (2010). Open and distance learning transformed: Possible adaptations to suit special contexts. OUSL Journal, 6, 22-4.
Moore, J. L., Dickson-Deane, C., & Galyen, K. (2011). E-learning, online learning and distance learning environments: Are they the same? Internet and Higher Education, 14(2), 129-135.
Simonson, M., Smaldino, S., Albright, M., & Zvacek, S. (2008). Teaching and Learning at a Distance: Foundations of distance education (4th ed.). Upper Saddle River, N.J: Pearson/Merrill Prentice Hall.
Woolls, B., Dowlin, K., & Loertscher, D. (2002). Distance education: changing formats. The Electronic Library, 20(5), 420-424.
Rumble, G. (1989). Open learning, distance learning and the misuse of language. Open Learning: The Journal of Open, Distance and e-learning, 4(2), 28-36.
UNESCO. (2002). Open and distance learning: Trends, policy and strategy considerations. France: Author.
Bates, A. (1995). Technology, open learning and distance education. London: Routledge.
Maxwell, L. (1995). Integrating open learning and distance education. Education Technology, 35(6), 43-48.
Attri, A.J. (2012). Distance education: Problems and Solutions. International Journal of Behavioral Social and Movement Sciences, 1(4), (42-58).
Dadigamuwa, P. R., & Senanayake, S. (2012). Motivating factors that affect enrolment and student performance in an ODL engineering programme. The International Review of Research in Open and Distance Learning, 13(1).
Willging, P. A., & Johnson, S. D. (2004). Factors that influence students’ decision to drop out of online courses. Journal of Asynchronous Learning Networks, 8(4), 105-118.

121
Li, G., & Killian, T. (1999). Students who left college: An examination of their characteristics and reasons for leaving. Paper presented at the 39th Annual Forum of the Association for Institutional Research, Seattle. Retrieved from http://files.eric.ed.gov/fulltext/ED433779.pdf
Farajollahi, M., & Moenikia, M. (2010). The study of relation between students support services and distance students’ academic achievement. Procedia - Social and Behavioral Sciences, 2(2), 4451-4456.
Cui, G. A. (2013). Effects of students’ characteristics and locus of control on their satisfaction with online distance education experience (Doctoral dissertation, Virginia Polytechnic Institute and State University). Retrieved from https://vtechworks.lib.vt.edu/handle/10919/23860
Battalio, J. (2009). Success in distance education: Do learning styles and multiple formats matter? The American Journal of Distance Education, 23, 71-87.
The Open University of Sri Lanka (2016). Bachelor of management studies degree 2016. Nawala: Author.
Wasala, R. A. (August 28, 2010a). Open and distance learning initiatives in Sri Lanka - I: The Island (Sri Lanka), p. 10.
Wasala, R. A. (September 3, 2010b). Open and distance learning initiatives in Sri Lanka - II: The Island (Sri Lanka), p. 11.
Edge, W. D., & Loegering, J. P. (2000). Distance education: Expanding learning opportunities. Wildlife Society Bulletin, 28(3), 522-533.
Lowes, S., Lin, P., & Wang, Y. (2007). Studying the effectiveness of the discussion forum in online professional development courses. Journal of Interactive Online Learning, 6(3), 181–210.
Peters, O. (1999). Teaching and learning in distance education: Analysis and interpretations from an international perspective. London: Kogan Page.
Astin, A. W. (1984). Student involvement: A developmental theory for higher education. Journal of College Student Personnel, 25, 297-308.
Pace, C. R. (1984). Measuring the quality of college student experiences: An account of the development and use of the college student experiences questionnaire. Los Angeles: University of California, Center for the Study of Evaluation. Retrieved from https://eric.ed.gov/?id=ED255099
Bean, J. P. (1980). Dropouts and turnover: The synthesis and test of a causal model of student attrition. Research in Higher Education, 12(2), 155-187.
Fischer, M. J. (2007). Settling into campus life: Differences by race/ethnicity in college involvement and outcomes. Journal of Higher Education, 78(2), 125-161.
Hoffman, J. L. (2002). The impact of student co-curricular involvement on student success: Racial and religious differences. Journal of College Student Development, 43(5), 712-739.
House, J. (2000). The effects of student involvement on the development of academic self-concept. Journal of Social Psychology, 140, 261-263.
Robbins, S. P., & Judge, T. A. (2013). Organizational behavior (15th ed.). New Jersey: Prentice Hall.
Perera, C. (2009). Operations management: Concepts and application. Sri Lanka: Godage International Publishers.
Wise, R., & Baumgartner, P. (1999). Go Downstream, the new profit imperative in manufacturing. Harvard Business Review, 28(1), 89-96.
Raj, D. M. A., Raguraman, M., & Veerappan, R. (2013). Marketing of educational services: A new strategy for customer satisfaction. International Journal of Scientific Research and Management, 1(8), 435-440.
Nyangau, J. Z., & Bado, N. (2012). Social media and marketing of higher education: A review of the literature. Journal of the Research Center for Educational Technology, 8(1), 38-51.

122
DeShields, O. W., Kara, A., & Kaynak, E. (2005). Determinants of business student satisfaction and retention in higher education: Applying Herzberg’s two-factor theory. International Journal of Educational Management, 19(2), 128-139.
Lovelock, C. & Wirtz, J. (2013). Services Marketing: People, Technology & Strategy. Upper Saddle River, New Jersy: Prentice-Hall.
Canterbury, R. M. (1999), Higher education marketing: A challenge. The Journal of College Admission, 16(5), 22-30.
Roth, A. V., & Menor, L. J. (2003). Insights into service operations management: A research agenda. Production and Operations Management, 12(2), 145-164.
Gronroos, C. (2008). Service logic revisited: Who creates value? And who co-creates? European Business Review, 20(4), 298-314.
Foreman, E. A. (2013). Using involvement theory to examine the relationship between undergraduate participation in extra-curricular activities and leadership development. Journal of Leadership Education, 12(2), 56-73.
Jung, I. (2012). Asian learners perception of quality in distance education and gender differences. The International Review of Research in Open and Distance Learning, 13(2), 1-25.
Douglas, J., Douglas, A., & Barnes, B. (2006). Measuring student satisfaction at a UK university. Quality Assurance in Education, 14(3), 251-267.
Kretovics, M. (2003). The role of student affairs in distance education: Cyber-services or virtual communities. Online Journal of Distance Learning Administration, 6(3). Retrieved from http://www. Westga.edu/~distance/ ojdla/fall63/kretovics63.html
Sidelinger, R. J., & Booth-Butterfiled, M. (2010). Co-constructing student involvement: An examination of teacher confirmation and student to student connectedness in the college classroom. Communication Education, 59(2), 165-184.
Butzow, J. W., & Williams, C. M. (1977). Towards a definition of involvement: Translating a humanistic concept into a behavioral model. Science Education, 61(4), 479-490.
Pass, M. W. (2013). Quality of student effort: Improving through achievement mastery and psychological needs. Atlantic Marketing Journal, 2(3), 43-59
Campbell, L. M. (2012). A study of student involvement variables in higher education: Their influence on success on the uniform CPA examination (Doctoral dissertation, University of Toledo). Retrieved from http://utdr.utoledo.edu/cgi/viewcontent.cgi?article=1299&context=theses-dissertations
Lemon, K. N., & Verhoef, P. C. (2016). Understanding customer experience throughout customer journey 1. Journal of Marketing, 80(6). Retrieved from https://www.researchgate.net/publication/304029900
Walter, U., Edvardsson, B., & Ostrom, A. (2010). Drivers of customers’ service experience: A study in the restaurant industry. Managing Service Quality, 20(3), 236-258. doi:10.1108/09604521011041961
Arambewela, R., & Maringe, F. (2012). Mind the gap: Staff and postgraduate perceptions of student experience in higher education. Higher Education Review, 44(2), 63-84.
Ng, I., & Forbes, J. (2008). Education as service: The understanding of university experience through the service logic. Journal of Marketing for Higher Education, 19(1), 38– 64.
Jutter, U., Schaffner, D., Windler, K., & Maklan, S. (2013). Customer service experience: Developing and applying a sequential incident laddering technique. European Journal of Marketing, 47(5), 738-768.
Neumann, Y., & Neumann, E. F. (1993). Quality of learning experience and students’ college outcome. International Journal of Educational Management, 7(1), 4-10.
Rautopuro, J., & Vaisanen, P. (2001). Non-Traditional students at university: A follow up study of young and adult students’ orientations, satisfaction and learning outcomes. Paper presented at

123
the European Conference on Educational Research, Lille. Retrieved from http://www.leeds.ac.uk/educol/documents/00001880.htm
Fraser, B.J., Walberge, H. J., Welch, W. W., & Hatties, J. A. (1987). Synthesis of educational productivity research. International Journal of Educational Research, 11(2), 147-252.
Bell, L., & Stevenson, H. (2006) Education policy: Process, themes and impact. London: Routledge,
Foubert, J. D., & Grainger, L. (2006). Effects of membership in clubs and organizations on the psychosocial development of first year and senior college students. Journal of Student Affairs Research and Practice, 43, 166-182.
Huang, Y., & Chang, S. (2004). Academic and co-curricular involvement: Their relationship and the best combinations for student growth. Journal of College Student Development, 45(4), 391-406.
Pascarella, E. T. & Terenzini, P. T. (2005). How college affects students: A third decade of research. San Francisco: Jossey-Bass
Billings, W. L. (1990). Effects of store atmosphere on shopping behavior (Master’s thesis, Illinois Wesleyan University). Retrieved from http://digitalcommons.iwu.edu/busadmin_honproj/16
Robbins, S. P., & Judge, T. A. (2013). Organizational behavior (15th ed.). New Jersey: Prentice Hall.
Tan, A., Muskat, B., & Zehrer, A. (2016). A systematic review of quality of student experience in higher education. International Journal of Quality and Service Sciences, 8(2), 209-228.
Entwistle, N., & Tait, H. (1990). Approaches to learning, evaluations of teaching, and preferences for contrasting academic environments. Higher Education, 19, 169-194.
Sadlo, G., & Richardson, J. T. E. (2003). Approaches to studying and perceptions of the academic environment in students following problem based and subject based curricula. Higher Education Research and Development, 22, 253–274.
Lizzio, A., Wilson, K., & Simons, R. (2002). University students’ perception of the learning environment and academic outcomes: Implications for theory and practice. Studies in Higher Education, 27(1), 27-52.
Saunders, M., Lewis, P., & Thornhill, A. (2011). Research methods for business students. (5thed.). India: Dorling Kindersley India Pvt. Ltd.
Sekaran, U., & Bougie, R. (2014). Research methods for business: A skill building approach (5th ed.). India: Wiley India Pvt. Ltd.
Podsakoff, P. M., MacKenzie, S. B., Lee, J., & Podsakoff, N. P. (2003). Common method biases in behavioral research: A critical review of the literature and recommended remedies. Journal of Applied Psychology, 88(5), 879-903.
Hair, J., Black, W. C., Babin, B. J., & Anderson, R. E. (2009). Multivariate data analysis (7th ed.). Chollerstrasse: Prentice Hall.
Fatma, S. (2014). Antecedents and consequences of customer experience management: A literature review and research agenda. International Journal of Business and Commerce, 3(6), 32-49.
Yuksel, A., & Yuksel, F. (2016). Measurement of tourist satisfaction with restaurant services: A segment based approach. Journal of Vacation Marketing, 9(1), 52-68. doi:
Tombs, A., & McColl-Kennedy, J. R. (2003). Social-Servicescapes conceptual model. Marketing Theory, 3(4).
Klaus, P., & Maklan, S. (2012). EXQ: a multiple-item scale for assessing service experience. Journal of Service Management, 23(1), 5-33.
Ning, H. K, & Downing, K. (2011). The interrelationship between student learning experience and study behavior. Higher Education Research and Development, 30(6), 765-778.
Kim, H. S., & Choi, B. (2016). The effects of three customer-to-customer interaction quality types on customer experience quality and citizenship behavior in mass service settings. Journal of Services Marketing, 30(4), 384-397.

124
Bujisic, M. (2014). Antecedents and consequences of customer experience in beverage establishments (Doctoral dissertation, University of Central Florida). Retrieved from http://etd.fcla.edu/CF/CFE0005309/Dissertation_Milos_Bujisic_June_30.pdf
NSSE – National Survey on Student Engagement. (2016). Retrieved from http://nsse.indiana.edu/pdf/EIs_and_HIPs_2015.pdf

125
AN EXPLORATION OF SELF-REGULATED LEARNING PERFORMANCE FOR STUDENTS OF DISTANCE EDUCATION
Sunu Dwi Antoro 1, Diah Astuti 2, Yugara Pamekas 3
1Universitas Terbuka (INDONESIA) 2Universitas Terbuka (INDONESIA ) 3Universitas Terbuka (INDONESIA)
Abstract
This research aimed to explore self-regulated learning and autonomous learning performance of distance students at Universitas Terbuka from Yogyakarta region office. Questionnaires for gathering students in understanding and implementing self-regulated learning, autonomous learning style as well as written distance learning experiences were given to the students. The grade point average (GPA) was also collected and was correlated with the students’ self-regulated learning performance. Descriptive survey design was adopted and purposive sampling was implemented to select appropriate respondents. Data were analyzed by adopting basic descriptive statistics. The results show that the students’ performance in self-regulated learning was first indicated by time management through planning learning activities 38.8%, and target completion of study 30.5%.The second was proved by planning the target learning 38.8% and 36.1% making learning schedule. The implementation of self-regulated learning in learning modules was the third indication demonstrated by 47.2 % through signing the essential materials and 38.8% through learning course review and doing assignments. The competence for getting deeper understanding of modules was done by taking part in face-to-face and online learning support 55.5%, and answering formative test and online self-evaluation 47.2%. The the way to read modules was through scanning (41.6%). Students whose self-regulated performance was good got 2.26 – 3.57 GPA. Key words: distance education, self-regulated learning, autonomous learning 1. INTRODUCTION
Distance education manages the learning process without face-to-face interaction. It is an education where learners are separated and use “interactive telecommunications system to connect learners, resources and instructors [7]. It means that learning process is conducted using interactive media to facilitate learning interaction. The separated learners means that learners are scattered anywhere. They learn in various places, such as at home, at the office, and at anywhere they stay. Learning process is also done at anytime; it can be in the morning, in the afternoon, at night, etc. The interactions between teachers and distance learners are conducted through various media. Media connects between teachers and students. Utilization of media in is the minimum requirement of delivery learning process. Learning interaction is seen as a process of changing student behavior, in that the role of self-learning process becomes very important [4].
The components of the learning process in distance education include learning materials, methods of learning and assessment. The three components can not be separated. Learning materials are materials to be learned by learners with techniques and learning strategies facilitated by the learner so as to become a learning process. Learning method is a technique and strategy of self-regulated learning to master the concept, certain principles or skills. Assessment serves as a tool to monitor student learning progress, weakness and lack of learning process that is being implemented. The learning process that should be done and facilitated by lecturers needs to be replaced by the existence of teaching materials covering component of learning materials, study guide, and teacher or tutor manual [8]. These three components are combined into a set of learning media called a module.

126
Distance learners mainly use strategy of self-regulated is learning content material in a certain course. Self-regulated in their learning process can act both autonomously and causally to influence their outcomes and experiences [9].
Research on the self-learning performance of distance learning students in UT Yogyakarta want to know the self-regulated performance. Data collection was conducted using questionnaires to gather students in understanding and implementing self-regulated learning and autonomous learning style as well as written distance learning experiences. In this study, researcher examined student perceptions of distance learning and self-regulated learning including how they implement. The grade point average is also gathered and compare with the self-regulated learning performance. 2. METHOD This descriptive study aimed to explore self-regulated performance of distance students enrolled in Universitas Terbuka, Yogyakarta. To measure self-regulated learning performance eight indicators were used. Two indicators explore the perception of distance education system and self-regulated learning, five indicators explore the implementation learning process in relation with the self-regulated learning, and finaaly explore the relation of self-regulated performance with GPA. Research questions in this study are a. How do distance learners perceive the characteristics of distance learning? b. How do distance learners perceive self-regulated learning? c. How do distance learners manage time for learning in distance learning? d. How do distance learners make learning plan? e. How do distance learners manage learning modules? f. What learning support provided do distance learners prefer? g. How do distance learners read modules? h. How is self-regulated performance in relation with Grade Point average (GPA)? 2.1. Participants Participants in this study were students who enrolled in distance learning at Universitas Terbuka located in Yopgyakarta region office at least two semester participation. There were 36 participants enrolled in this study. Table 1. Sample study
Participants (semester ) Number of participants Study Program First 2 Elementary Education Program
second 12 Communication Science Program 3 Tax Program 3 Elementary Education Program
Third 6 Communication Science Program 1 Literature
Sixth 2 Elementary Education Program Eighth 3 Elementary Education Program Nineth 4 Elementary Education Program
Table 1 represent participant represent participants 6 different semesters and 4 different study program. The participants from the elementary education program were mostly chosen for distance learners in Yogyakarta 80% of them are taking this program. 2.2. Data Collection This study employed purposive sampling to choose the participants for the questionnaire. Purposive sampling is a type of sampling technique based on some considerations to get the representative data. (Jakni, 2016). In the present study, this involved choosing distance students has been enrolled in Universitas Terbuka Yogyakarta region ranging from the first semester students to ninth semester students to explore distance students’ performance of self-regulated learning. A questionnaire was designed to circulate among 36 students who are active distance learners at Universitas Terbuka.

127
2.3. Data Analysis The quantitative data from the questionnaire was analyzed using simple statistic by counting the chosen alternatives indicators of self-regulated learning in order to perform descriptive statistical analysis. Qualitative data from open-ended questions were also analyzed to complete the information gathered from questionnaires. 2. THEORETICAL AND CONCEPTUAL FRAMEWORK 2.1. Self-regulated learning
Distance education in higher education is an educational system that organizes the learning process for students remotely by applying students' self-regulated learning capability in studying the subjects they take. Self-regulated learning is a key requirement of learning process. Autonomous learning is defined as a learning that is conducted though learning active, learning by doing, interacting with the environment, and having purposes. It must have its own way to interact with the environment, learn from its experience (especially from its mistakes), decide what to do by itself, be able to adapt to different environment and tasks, and be able to assimilate advice [3].
Doing self-regulated learning has consequences that students are required to have their own initiative in learning materials, do all the independent tasks, establish self-learning skills and apply their learning experiences. Self-regulated learning in many ways is determined by the ability of distance learners to manage and learn effectively. Effective independent learning can only be done if students have strong self-discipline, initiative, and motivation to learn. Learners’ learning motivation, goal setting, action control and learning strategies played a significant role in their learning performance” [6]..
Distance learners are generally required to be able to learn independently. They do not depends on the teachers anymore like when they studied at senior high school. They have their own initiation for learning. They can learn individually or make study group for learning together.
2.2. Self-regulated learning Strategy
Self-regulated learning strategies include a variety of learning strategies that distance learners can choose to engage in self-learning. They do not have to master all of these strategies, but they need to know and then choose the most appropriate strategy to apply. The ability to choose a learning strategy will help greatly not just in learning, but also on doing other activities. To be a reliable planner and manager for various activities is needed.
Self-regulated learning in UT is determined by learning effectively. The ability to conduct self-regulated learning is determined by the students’ competence to learn efficiently and effectively. To be able to learn independently efficiently and effectively, distance learners are required to have self-discipline, initiative, and strong motivation to learn. They must be able to arrange time efficiently, so they can learn regularly based on a self-determined schedule for learning. The process of self-regulated learning, learners need to set their learning goals, make their learning plans, choose their learning strategies, monitor their learning processes, evaluate their learning outcomes and suppress interference [6]..The ability of speed of reading, scanning, and skimming also helps them understand the contents of the materials [2]. Environment structuring, Goal setting, Time management , Help seeking, Task strategies, and Self-evaluation [9].
2.3. Learning Materials for Distance Learners
Universitas Terbuka, as a higher distance education, organizes learning delivery system using text based media in the form of modules and non print learning material such as web based supplement, digital library, and open educational resources. UT also offers some others learning material which is based on digital material video, audio, and animation. There are also online tutorial and face-to-face tutorial for learning support.

128
Learning materials are the only major learning medium in the open and long distance learning system. It consists of modules which are designed for self-learning system so that students are able to master the competencies of the courses. It also contains some exercises and formative assessments completed with the feedback in each module to help students check their understanding. Universitas Terbuka uses printed materials which are also called modules as the main teaching and learning materials. The modules do not only contain learning materials but also instructions and guidance for students to study the material so that students can learn independently [1].
Module serves as a substitute for lecturers in the classroom [1]. Components of teaching materials include modules and each module consists of learning activities. Each learning activity contains an introduction, material description, concrete examples, tasks, cases or graphs. In addition it also comes with exercise and guidance answers to the exercises that provide tasks that must be done students after learning the description and examples. The purpose of the training is to strengthen student mastery of the concepts or principles learned. The summary is a summary of the concepts described in the descriptions and examples.
Formative test in every learning activity of the objective test is intended to measure the level of student mastery of the material that has been studied. The key to the formative test is placed at the end of the module. Feedback and follow-up is a description of how to calculate the percentage of correct formative test answers done and feedback on the level of mastery achieved. The bibliography contains a list of references that the module writer uses to describe descriptions and examples at once readable to enrich the student's knowledge of the material discussed in the module.
2.4. Characteristics of Learning Material for Self- Regulated Learning The teaching materials are then divided into modules.Therefore, in each teaching material there is a section that gives a general overview of the material coverage of each subject in each module. Distance instructional material arae categorized into nine characteristics such as self-instructional, self-explanatory power, self-paced learning, self-contained, individualized learning materials, flexible and mobile learning materials, communicative interactive learning materials, multimedia, computer-based materials, and supported by tutorials, and study group [8]. . Sself-instructional in distance learning system means instructional materials that is designed to make distance learners learn by themselves [8]. Self-instructional creates learning condition as if learners interact with the lecture. Self-explanatory power means that distance instructional materials provides explanation of the material by using easy language that is easy to understand, a logical sequence, communicative language, and interactive language [8].. Self-paced learning materials allow learners learn on their own capability, they do not depend on other learners. Self-contained materials mean that contents are complete [8]. Individualized learning materials let learners learn based on their own learning style, ability, and characteristics [8]. Flexible and mobile learning materials enable learners to learn at any time, place and at any condition [8]. Communicative interactive learning materials facilitate interaction process when it is learned [8]. Multimedia, computer-based materials permit learners to access in web-based facilitation. Supported by tutorials, and study group means that learning process may needs learning support through tutorial [8]. 2.5. Self-regulated learning in print media
The main teaching material in UT is a printed material as the instructional materials. In addition to printed materials, instructional materials can be in the form supplements of instructional materials, non-printed teaching materials such as audio cassettes, audio CDs, video CDs, interactive video CDs, computer-assisted teaching materials and web-based supplement of instructional materials. UT names the printed materials as modules.
As the main media for learning process, distance learners in UT are encouraged to obtain modules by ordering through e-book store [4]. Learning materials in modules represents the lecturer presentation so it is designed as the material Lectures. Learning interactions are designed integrated in presenting contents.

129
To understand content distance learners must learn the course overview and all tasks and exercises that should be done during taking the course, and then read through the introductory contents of the module well to know the outline of the contents of the module, the learning objectives, as well as how to learn the contents of this module.
The next learning process is to read contents in the modules more carefully and record / make summaries / mark the concepts Important with the explanation using learners’ own words. To add the understanding of contents, watch non print teaching materials that complete the material. Do all the the exercises and formative tests to deepen understanding learning material in each modules and it facilitates practice for taking examination. Re-read the summary whenever the final examination of the semester is near, and take part in tutorial [4].
3. RESULT 3.1. Perception of Characteristics of Distance Lear ning The perception of the students about the characteristic of distance learning system is to know how many of them understand that distance learning require self-regulated. Their understanding were calculated and the results were shown into percentage and were sen in table 2.
Table 2. Distance learners’ perception about the characteristic of distance learning No Characteristics of distance education Percentage 1. Distance learning system 25.0 2. Change of learning culture paradigm 8.3 3. Self-regulated ability 72.2 4. High commitment 47.2
As seen at table 1. There are four indicators that 72,2 % students stated that learning in a distance should have the ability for self-directed learning. This means that students realize that self-regulated learning is requirement for learning process need in distance learning system. However, their perception about the importance of self-regulated learning is not synergistic with the understanding of the importance of changing the paradigm of learning culture. There were 8,3 % students know that learning in distance must change their learning culture paradigm. 3.2. Perception of Self - regulated Learning As it is discussed above that self-regulated learning is the way distance learners handle learning process. Distance learning institutions such as UT manage the delivery learning system mainly through self-learning or self-regulated learning. From data collection, the results show that the students’ performance in self-regulated learning was first indicated by time management through planning learning activities 38.8%, and target completion of study 30.5%.The second was proved by planning the target learning 38.8% and 36.1% making learning schedule.This information reveals that the participants are relatively realize the importance of self-regulated learning in distance education. The maximum percentage is not achieved do to the pass habitual learning which tends the spoon feeding learning activities. They seem to face the problem of changing learning culture paradigm. 3.3. Management of Time Allocation for Self-regulat ed Learning Time management is an important part of self-regulated learning management. In this case, the allocation of time is related with all activities undertaken is self-regulated learning. Based on information gathered through questionnaires there are tame allocations for learning, learning objective decision, assigning graduation target, assigning course grade target, learning activities decision, and planning of learning process. Table 2 represents the percentage of these indicators of time allocation.
Table 3. The way distance learners manage the time allocation No Time management Percentage 1. Allocate learning time 83.3 2. Decide learning objectives 16.6

130
3. Assign graduation target 30.5 4. Assign the course grade target 27.7 5. Decide learning activities 19.4 6. Plan learning process 38.8 7. Learn catalog 27.7
As seen in table 3 most of participants manage learning time. It indicates that most distance learners realize the importance to determine when to learn and when to do other things. In managing time for learning, participants relative assign the graduation target and plan leaning activities to achieve the target. Activities such as assigning learning objectives, finishing study target, course grade target, and learning activities are rarely implemented by participants, and this case indicated by the lower percentage of participants’ preference. 3.4. Learning Plan in Distance Education Learning plan in a distance learning is deeded to plan, implement and evaluate learning process so that students decide when to learn, when to do other things. Table 4. How distance students plan learning.
No Learning plan Percentage 1. Decide the time for learning 25.0 2. Decide learning target 38.8 3. Conduct self-evaluation 13.8 4. Evaluate learning plan implementation 25.0 5. Create learning schedule 36.1
In table 4 there is no dominant ways of learning plan among the five indicators. However the lowest percentage is self-evaluation. There is only 13.8 % of students conduct self-evaluation. It indicated that is rarely conducted by the students and hasn’t been a learning culture in distance learning. Whereas self-evaluation is very important in distance learning system. Through self-evaluation learners are able to know the progress of learning process. Self evaluation is an important step in the process of distance learning system for each individual learner in order to know the effectiveness of achievement of learning goals [2]. 3.5. Way of Learning Modules The main teaching material of UT is a printed material called modules. In addition printed materials, UT also provides additional teaching materials in the form of non-printed teaching materials.
Table 5. How distance learners learn modules No Implementation self-learning in learning modules Percentage 1. ordering modules or borrow from friends 38.8 2. learning the course review and all the tasks 38.8 3. learning the introduction at glance 13.8 4. marking essential concepts 47.2 5. learning the summary 19.4 6. writing own summary for each module 25.0 7. learning modules the near set time with examination 22.2 8. creating concept maps 11.1
In table 5 shows the implementation of self-regulated learning in learning modules. There are eight indicators alternatives provided by the participants. The results reveal that the third indicator of self-regulated learning performance demonstrated by 47.2 % through signing the essential materials and 38.8% through learning course review and doing assignments. The competence for getting deeper understanding of modules was done by taking part in face-to-face and online learning support 55.5%, and answering formative test and online self-evaluation 47.2%.

131
3.6. Learning supports UT in providing learning assistance provides learning services as it can deepen the understanding of learning materials in the module.
Figure 1. How distance learners perceive available learning support The diagram shows students’ effort to deepen understanding learning material facilitated by UT. It means that not all distance learning supports are demanded by students. Only the face-to-face tutorial interests the students, there are 55.5 % students like to join the face-to-face tutorial. The second demanded by the students is the formative assessment. 3.7. Way to Read Modules Reading modules is a major way of following the distance learning system. Ability to master the technique of fast reading, skimming, scanning is needed in order to understand the distance learning distance learning. Table 6. The percentage of reading style
Reading method Percentage Speed reading 41,6 Scanning 50.0 skimming 25.0
From table 6, we can understand that distance students can read module relatively effectively through speed reading and scanning. These items were chosen by the participants with fairly high percentages. However, skimming method of reading module is rarely conducted for only 25% participants chose this reading method. 3.8. Self-regulated performance in relation with G PA Self-regulated performance in distance learning will influence learning outcome. Table 7. Show the self-regulated performance viewed from GPA achievement
Self-Regulated Performance Grade Point Average (GPA) 1.0 - 1.9
(%) 2.0 - 2.9
(%) 3.0 - 4.0
(%) Manage self-regulates learning 50.0 51.6 83.3 Manage learning time 50.3 54.4 58.3 Assign Learning target 45.4 50.3 58.3 Learn Course review 27.2 27.2 33.3
Learn
learning
material
from
digital
library
11.1%
Take part
face to
face or
online
tutorial
55.5%
Learn non
printed learning
material
11.1%
Learn
Open
educational
resouirces
5.5%
Take part in
radio brodcast
and TV feature)
5.5%
Do the
formative tests
47.2%
Ask difficult
concept to tutor
16.6%
Re-read the
summary
27.7%
Do the online
summative test
27.7%
Effort to deepen module understanding

132
Learn essential concept 33.3 54.5 66.6 Join the Face-to-face and online tutorial 58.3 45.5 66.6 Have Speed reading ability 41.6 45.4 50.0 Do the formative 41.6 45.4 50.0
Students whose self-regulated performances are good that are indicated by all of the self-regulated performance got 2.26 – 3.57 GPA. 4. DISCUSSION In this study, the exploration of self-regulated learning performance of the distance learners at Universitas Terbuka Indonesia Yogyakarta region office represented their profiles in their experiences of self-regulated learning or autonomous learning. The main idea of the findings is on distance learners’ perception of ODL characteristics and on the exploration of about the self-regulated performance of the distance learners. In the first part of exploration, distance learners perception about the characteristics of distance education reflect that 72.2% of the sample chose self-regulated as the characteristics of ODL. High commitment indicator was also chosen by 47.2%. In relation this perception of the sample about characteristics of ODL, the perception of the self-regulated learning was chosen by 38.8% learning time allotment and learning plan. In this result reflect that sample’s perception of characteristics of ODL is indicated by self-regulated learning through determination of learning time allocation and learning plan. In the second part of the exploration, sample of this study were examined their profile of self-regulated learning. The first profile of self-regulated was examined through management of time allocation for self-regulated learning. The results show that 83.3% of the sample did the time allocation for learning which mostly for learning process 38.8%. To manage the time, it is also indicated by the assigning target graduation (30.5%) and course grade target (27.7%), in this case represent that sample have the target for deciding time allocation. However, it contradicts with the time allocation for learning objective (16.6%) and learning activities (19.4). Time allocation for self-regulated learning is conducted in the allocation design. It needs deeper confirming whether the time allocation design was really implemented or not. The second profile of distance learners in self-regulated learning shown by the way sample plan learning. Sample was examined through five indicators. Learning target decision and learning schedule creation were somewhat conducted represented with 38.8% and 36.1%. Time for learning decision and learning process evaluation had the same proportion around 25%. Planning to conduct self-evaluation was the lowest sample preference means it is hardly realized that self-evaluation in self-regulated learning is an important component. The third profile of self-regulated learning was examined through the way sample learn instructional materials. The starting point of learning showing by getting modules and reading the course review was chosen 38.8% sample. The most widely done was learning by marking the essential concepts which were chosen by 47.2 % sample. While the least desirable learning activities was 11.1% chose creating concept maps. The fourth profile of self-regulated was explored by how sample interest to learn through the learning supports available. The most popular learning support to follow is the help of learning in the form of either the face-to-face tutorial or online indicated with 55.5 % sample did it. In this case, learning support was still needed by sample and it means that learning support for distance learners is still in demand and it indicates that the ability of self-directed learning is still low. This condition is supported by the least sample that choose to learn through non-printed learning materials. The fifth profile is seen from the way sample read modules. Scanning reading method was most reading strategy conducted by 50% sample. However, most samples relatively did speed reading, scanning and skimming. The last profile of self-regulated learning performance was examined through the relation between the GPA of semester that has been taken. 5. CONCLUSION This descriptive study tried to document the self regulated learning performance of distance learners from UT located in Yogyakarta region office. Self-regulated learning is an importance component of distance learning system since this learning style needs self-motivation, self-plan, self-implementation, and self-evaluation. All of the learning activities are on their own management for their own self-regulated learning process. Therefore, they are supposed to have the necessary skills to direct their own learning process.This study explored self-regulated learning performance of distance learners

133
examined based on their perception of distance learning system and self-regulated learning and on another part were the profile self-regulated implementation which is expected to describe self-regulated learning profile based on six components of self-regulation. These are time allocation, learning plan, target decision, learning schedule. In learning modules are learning essential concepts, doing formative test, reading through scanning, taking part in tutorial. The study found that distance learners understand the need of self-regulated learning in distance learning process. In the second exploration, distance learners perform well enough in allocating learning time, learning plan, target decision, and learning schedule. In learning modules, distance learners learn the essential concepts, doing formative tests, learn through scanning, and take part in tutorial. More specific findings of the study can be summarized as follows: The first part of this study
• Distance learners perceive that distance learning need self-regulated ability. • Distance learners relatively perceive self-regulated learning in time allocation, learning plan,
target learning, The second part of the study
• Distance learners manage time for learning through time allocation for planning learning, target learning, and learning activities.
• Distance learners make learning plan start from target learning decision, create learning schedule, and length of time for learning.
• Distance learners manage learning modules through marking the essential concepts and taking part in a tutorial for the help from tutor explanation.
• Distance learners were mostly intending to take part in face-to-face and online tutorial. Another learning support that they follow is doing the formative test.
• In term of reading type, distance students were relatively read modules through speed reading and scanning
The last part of the study self-regulated learning competence compared in relation to the grade point average. The more component of self-regulated learning is implemented the higher the GPA. REFERENCES Setijadi, dkk. (2005). Buku Pedoman Pendidikan jarak jauh. Jakarta: Universitas Terbuka. KIRMIZI, O. (2013). Investigating self-regulated learning habits of distance education students. Journal
of History Culture and Art Research Vol. 2, No. 2, June 2013. Copyright © Karabuk University WEI-MIN SHEN. (1994). Autonomous learning from the environment. Computer Science Press
W.H.Freeman and Company Katalog Penyelenggraan. http://www.ut.ac.id/sites/all/files/images/2017/Mei/Katalog-Sistem-
Penyelenggaraan-Diploma-Sarjana-FE-FHISIP-FMIPA-FKIP-UT-2017-2018.pdf Jakni. (2016). Metodologi penelitian eksperimen bidang pendidikan. Bandung: Penerbit Alfabeta. Eric C. K. Cheng. (2011). The role of self-regulated learning in enhancing learning performance.The
International Journal of Research and Review. Volume 6 Issue 1, March 2011 Simonson, M., Smaldino, S., Albright, M., & Zvacek, S. (2012). Teaching and Learning at a Distance:
Foundations of Distance Education. 5th ed. Boston: Pearson. Adwi Suparman (2012) Desain instruksional modern. Jakarta: Penerbit Erlangga Brak, L.B., Lan, W.Y, & Paton, V.O. (2010). Profiles in self-regulated learning in the online learning
environment. International Review of Research in Open and Distance Learning Volume 11, Number 1

134
RESEARCH ON THE STATUS QUO OF BUILDING OF LEARNING-GUIDE TEACHER TEAM – EMPIRICAL ANALYSIS BASED ON
THE OPEN UNIVERSITY OF CHINA
Xiaoqing Jiang
The Open University of China (CHINA)
Abstract
Since non-academic support services in distance education are provided by learning-guide teachers, the building of learning-guide teacher team is an important factor affecting the learning support service and is a key factor for guaranteeing the quality of distance education. Based on the definition of learning-guide teacher, this paper analyzes the current status and main problems in the building of learning-guide teacher team on the basis of a special research on learning-guide teachers of the Open University of China from 2015 to 2016, and puts forward ideas for the building of the distance education learning-guide teacher team from the perspective of the Open University of China. Keywords non-academic support services, learning-guide teacher, team building 1. INTRODUCTION The importance of learning support services (LSS) for guaranteeing the quality of distance education has been recognized in the distance education sector. Oftentimes, LSS is divided into academic support and non-academic support. Academic support services are generally provided by a team of teachers with academic backgrounds while non-academic support services are provided by learning-guide teachers (or class teacher). [1]
Alongside the expanding number of students participating in distance education, increasingly diversified student structure, and increasing differences in individuals, the students will meet with difficulties of all descriptions in the course of learning, and the non-academic support services for students assume greater importance. More and more distance education institutions step up efforts to build the non-academic support services. In non-academic learning support services, the human factor – the staff engaged in non-academic support services – are of critical importance. In China, the main entity for distance education is the Open University of China (formerly China Central Radio & TV University). Based on its system of school management and hierarchical management model, the running and teaching services of the Open University of China are jointly undertaken by the headquarters, provincial branches, municipal institutes, and county-level learning centers. The faculty consists of instructors, presiding teachers, course-responsible teachers, course tutors, and learning-guide teachers. Among them, the role of learning-guide teacher is responsible for guiding students to learn, and providing students with non-academic learning support services. A study shows that in a class led by an excellent learning-guide teacher, students generally have “three highs and one low”, namely high registration rate, high rate of students upgrading from junior college to university grade, high pass rate of application for degrees, and low dropout rate. Students highly recognize the open education provided by China Central Radio & TV University (Wang Shufen, 2010). [2] Thus, learning-guide teachers in distance education play an important and unique role in ensuring the quality of the Open University of China. At present, the Open University of China, based on China Central Radio & TV University, is thriving. Running an open university is inseparable from a team of high-quality teachers with stable scale, rational structure, and broad development prospects. The new historical stage of development is bound to raise new challenges and new requirements for the building of learning-guide teacher team. Knowing the status of learning-guide teachers and the development status of learning-guide teachers is a prerequisite for accelerating the learning-guide teacher team building and boosting their ability. This is also the main problem for study in this paper.

135
2. DEFINITION OF CORE CONCEPT 2.1. Distance education learning-guide teacher “Learning-guide teacher” was originally derived from part-time counselor of the UK’s Open University. Part-time counselor is responsible for the teaching management for students and maintaining the contact between students and the school until the student’s graduation. The counselor is the student’s consultant in study and life, and focuses on providing students with non-academic support services. Learning-guide teachers at the Open University of China are most typical and prominent in China's distance education sector. But there are some differences in the definition and function of learning-guide teachers. Some researchers consider that learning-guide teacher is the liaison teacher or the class teacher responsible for students in a specialty or grade [3]; some researchers believe that it is hard to summarize the role of learning-guide teacher using the “class teacher” in traditional education. Learning-guide teacher is a “learning guidance staff” for guiding students in self-study, a “planner” for assisting students to choose courses independently, a “consultant” for helping students in learning, the psychological “counsel” for students, an “administrator” for their daily affairs, and a “cheerleader” for encouraging their efforts. In view of the “learning guidance” nature of teaching activities in distance education, the learning-guide teacher in distance education under this article refers to the full-time staff who guide, support and help students to complete their studies and achieve their academic goals in China’s distance education environment. Their job responsibilities include providing non-academic support services for students, such as students’ enrollment guidance, counseling, emotional care and management services.
2.2. Non-academic support services Bernadette Robinson, who first raised the idea of “providing support for students in learning”, pointed out that because the student’s problem is not always of an academic nature, the distance education system needs to provide support services outside the academic material, such as: daytime class teaching, weekend school, individual counseling at district center, collective discussion with mentor, and meeting with counselors” [4]. Ormond Simpson, who divides the learning support services into teaching support services and non-academic support services for the first time, considers that the most important content of teaching support activities is teaching counseling”. Regarding non-academic support, support is provided for students in terms of emotion and organized learning, and its content mainly includes the provision of information, provision of advice, problem exploration, activities arrangement and the implementation of management and other aspects [5]. In China, Chen Wei proposed “academic assistance activities” and “non-academic assistance activities” [6]. Xiong Wen divides learning support services into remedial learning support and developmental learning support [7]. Zou Fanlin proposed that non-learning support services is not directly related to the subjects (courses), but still closely linked with the students’ learning. Also, it helps students to complete their academic studies, though with a focus on emotional care, creation of a learning environment, cultivation of learning skills and skills management [8]. In summary, the concept of “non-academic support services” advanced by Zou Fanlin is more in line with the practice of non-academic support services in distance education in China. Therefore, the explanation by Zou Fanlin is adopted for the concept of non-academic support services in this paper.
3. RESEARCH PROCESS AND METHODS In 2015-2016, the Open University of China’s Learning Support Service Center conducted field research on over 10 provincial branches and their affiliated learning centers in Tianjin, Qingdao, Zhejiang, Anhui and Hunan and so on, in order to fully understand the status of the development of learning-guide teacher team at Open University of China. Taking the learning-guide teachers as the research object, it uses questionnaires and the interview research method to explore the practice of the development of learning-guide teacher team and the existing problems. The questionnaires of learning-guide teachers include the teachers’ basic information, working condition, management mechanism, and career development. A total of 200 questionnaires were

136
distributed, with 190 valid questionnaires recovered. The rate of valid questionnaires is 95%. Fifteen learning-guide teachers were interviewed and five seminars were held in multiple forms, angles and dimensions for the survey. The study of this paper is based on the data of the above survey.
4. RESEARCH RESULTS AND ANALYSIS
4.1. Overview of learning-guide teacher team
4.1.1. Age distribution As shown in Fig. 1, the age of learning-guide teachers varies widely, with old and young learning-guide teachers coexisting. Learning-guide teachers aged 40-49 account for 48.90% of the total; followed by learning-guide teachers aged 50 and above, accounting for 34.40%; learning-guide teachers aged 20-29 and 30-39 account for 10% and 6.7%, respectively. Judging from the age distribution, a majority of learning-guide teachers are in the age bracket of 40-49 or above 50.
Fig. 1 Age distribution of learning-guide teachers
4.1.2 Educational level and titles The survey found that learning-guide teachers generally hold a junior college degree or above; learning-guide teachers with bachelor’s degree or above account for 55.3% of the total (Fig. 2). In terms of title, the proportion of learning-guide teachers who are lectures is the highest, at 75%, followed by teaching assistants who account for 15%.
10,00%6,70%
48,90%
34,40%
导学教师年龄分布导学教师年龄分布导学教师年龄分布导学教师年龄分布
20-29
30-39
40-49
50以上
Distribution of age of learning-guide teachers
Above 50

137
Fig. 2 Academic composition of learning-guide Fig. 3 Title of learning-guide teachers teachers
4.1.3 Professional background The data show that the learning-guide teachers surveyed mostly have professional backgrounds related to the specialty of students under their management. Their professional knowledge is chiefly in such specialties as administrative management, law, computer, business management, and Chinese language and literature. It is noteworthy that specialties including administrative management, business administration, Chinese language and literature, and law have a large enrolment under the open distance education mode provided by China Central Radio & TV University. This shows that the Open University of China schools take into consideration the professional learning of students in selecting learning-guide teachers, but learning-guide teachers who have professional expertise in education and psychology required for the management and service of students are relatively few.
Fig. 4 Professional background of learning-guide teachers
Title of learning-guide teachers
Associate
professor
Lecturer
Accounting Mathematics Others
Administrative
management
Law Computer
Business
administration
Chinese
language and
literature

138
4.1.4 Years of work Learning-guide teachers have a relatively short working life in this post. Survey shows (Table 1) that learning-guide teachers who work for 1-5 years account for 43.4% of the total, those who work for 6-10 years account for 51.6%, and those who work for 11-15 years account for only 5%.
Table 1 Years of work of learning-guide teachers
Years of working as learning-guide teachers (years)
Number of teachers Percentage
1 - 5 years 87 46% 6 - 10 years 95 50% 11 - 15 years 8 4%
4.1.5 Teacher-to-student ratio The Ministry of Education prescribes that colleges and universities in general should set up the posts for full-time counselors at the junior college and undergraduate level at a teacher-to-student ratio of not less than 1:200. The survey shows that the branches and their respective learning centers generally set up the corresponding posts for learning-guide teachers based on this ratio, taking into consideration the specialties offered by the school and the number of students. For example, Tianjin Branch schools provide that one learning-guide teacher guides about 200 students of the same specialty in the same grade. Open Education College Anhui branch provides that: the ratio of full-time learning-guide teacher to students is about 1:200.
4.2. Working condition
4.2.1 Job responsibilities The survey found that the job responsibilities of grassroots learning-guide teachers mainly include teaching affair administration, learning process support services, student affairs management, student organization construction, and personalized consulting services (see Fig. 4). Its work responsibilities are related to school teaching, teaching affairs and students, covering all aspects in student learning and life. It shows “complex, mixed, scattered” features.
Fig. 5 Job responsibilities of learning-guide teachers
Job responsibilities of learning-guide teachers
Teaching affair management
Student enrollment education
Tuition fee collection
Issue of teaching materials
Course registration
Examination & approval of exemption from course-taking/exam
Student information rearrangement and submission
Learning process support services
Notify teachers of teaching information
Guide students to select courses
Guide students about learning methods
Remind and urge students in learning
Collect student’s assignment
Provide technical support
Student discipline education
Student examination rule development
Selection of excellent student and reward
Treatment of students violating discipline
Extracurricular activity organization
Student archives management
Prevent and deal with student emergencies
Class building and management
Learning group management
Student group building and management
Reply to student’s inquiries
Processing of complaints and report by students
Service for special students (students for re-learning, handicapped students, rural students, elderly students, etc.)
Psychological health education
Career planning and guidance
Student affair management
Student organization construction
Personalized consulting service

139
Job responsibilities of learning-guide teachers 4.2.2 Weekly working hours of learning-guide teachers The survey found that a majority of learning-guide teachers work longer than 40 hours per week, and a considerable number of learning-guide teachers work for up to 50 hours per week. See Table 2 for details. Excessively long working hours have left many learning-guide teachers tired and exhausted.
Table 2 Weekly working hours of learning-guide teachers
Weekly working hours Number of teachers
Percentage
30-40 hours 9 4% 41-50 hours 82 43.40%
Over 50 hours 99 52.60%
4.2.3 Recognition of the positions The teacher’s cognition of the posts affects their work efficiency and attitude toward work. The learning-guide teachers at the grassroots level involved in the survey do not have a keen cognition of the posts. Learning-guide teachers are responsible for “management”, “services” and “education” and so on. They provide advisory services, ideological and political education, psychological counseling, and emotional support for students and also are responsible for the daily management of students. Owing to the trivial work, complex business, irregular working hours, and “invisible” results, some learning-guide teachers do not have awareness of their “teacher identity”. They describe their job as “student financial administrator”, “student councilor”, and “manager of student courses” and so on. They often think themselves marginalized in school affairs”. They need to “keep their mobile phones on 24 hours a day for convenient contact with students”, and “have a large number of tasks and work from dawn to dusk” and so on. Nevertheless, the grassroots learning-guide teachers in the survey have a strong sense of responsibility. They consider that: “work has to be done properly once it is undertaken.” At the same time, the objects of non-academic support services provided by learning-guide teachers are students. “Students hold respect for us”, “they (students) are willing to communicate with us if they encounter problems in learning or life”, “and some students contact me after graduation”; the students’ recognition and respect of and trust in learning-guide teachers enhance their self-worth and strengthen their professional identity to a certain extent.
4.3. Management status After years of development of open distance education, learning-guide teachers have become the backbone in student management and service. The Open University of China schools becomes increasingly aware of the importance of learning-guide teacher team, and, based on the actual situation of their own school running and the characteristics of learning-guide teachers, is actively exploring a management mechanism for open university learning-guide teachers.
4.3.1 Training of learning-guide teachers Learning-guide teachers, who are at the coalface in teaching, undertake a number of tasks that require knowledge and skills in many fields. The Open University of China’s provincial branches and affiliated learning centers under the survey have begun to attach importance to the training of learning-guide teacher team. They enhance the ability of learning-guide teachers by adopting diverse training forms such as expert lectures, exchange of experiences, seminars, and visits and inspection. Tianjin branch offers pre-job training for newly employed learning-guide teachers, issues the learning-guide teacher qualification certificate after the successful training evaluation, and regularly holds work seminar for on-the-job learning-guide teachers. Shanghai Open University Nanhui branch and Songjiang branch carry

140
out skills training programs for learning-guide teachers in each semester, and arrange them to visit other organizations or sister schools, with a view to promoting mutual learning and exchange among learning-guide teachers.
4.3.2 Assessment of learning-guide teachers Examination and evaluation is an important part of the building of learning-guide teacher team. The provincial branches and the affiliated learning centers under the survey strengthen the assessment of learning-guide teachers and gradually specify evaluation indexes according to the job responsibilities. Through the analysis of the relevant assessment indicators in the learning-guide teacher appraisal system at Tianjin Branch, Qingdao Branch and Zhejiang Branch, we summarize some key elements in the learning-guide teacher’s evaluation index, which mainly includes the work plan, work record, work summary, registration and fees, class construction, extracurricular activities, student evaluation and reward, student archive management, examination attendance rate, student class attendance, student loss rate, and student satisfaction and so on.
4.3.3 Incentives In order to promote the enthusiasm of learning-guide teachers, as the survey shows, provincial branches and the affiliated learning centers adopt a variety of ways to commend, reward and publicize the learning-guide teachers to enhance their sense of honor and accomplishment. Beijing branch has developed the “Measures for Appraisal and Selection of Excellent Learning-guide teachers of Beijing Open University (provisional)”, which provide that the appraisal and selection of excellent learning-guide teachers are carried out every two years. Henan branch hold an annual event to select “excellent learning-guide teacher”, as well as the commendation conference for excellent learning-guide teachers. Open Education Institute Shanghai branch compiles the excellent deeds of learning-guide teachers into stories about learning-guide teachers, so as to actively promote their dedication, devotion, and the work cases of excellent learning-guide teachers.
4.4. Career development Of the learning-guide teachers covered by the survey, 27% have clear career development goals, 58% have vague career development goals, 12% have no clear career development goals, and 3% have not given consideration to career goals. 19.3% of them are satisfied or highly satisfied about current career development status, while 61.6% of them express themselves unsatisfied or highly unsatisfied about current career development status. Their confusion about career development is mainly due to the lack of career planning, and vague career positioning (Table 3). The biggest obstacle to career development is a feeling of being marginalized by them on the faculty; moreover, the school does not provide the environment and space for development; the school leaders do not attach importance to the development of learning-guide teachers; the teachers are unclear about how to make development; also at play are inadequate personal ability; heavy tasks; and unclear job responsibilities; as a result, the learning-guide teachers are at a loss about direction of development (Table 4). Through the interviews, it is found that the construction of Open University is also a process of transformation of China Central Radio & TV University system. The corresponding management mechanism and institutional environment in the transformation process have yet to be established, which is also reflected in the learning-guide teacher’s career development. They have vague role positioning, and unclear career development direction, without a good career development environment; the leaders focus only on enrollment and examinations; confronted with the expansion of student number and students’ diverse service needs, the personal ability of learning-guide teachers are often unable to meet these new situations, making it hard to provide personalized support services for students. These issues pose problems in the career development of learning-guide teachers.

141
Table 3 Confusion of learning-guide teachers about career development (multiple choices) Option Subtotal Percentage A. Ambiguous career positioning
80 42.06%
B. Lack of career planning 89 47.32% C. Individual expertise, competencies or interests do not match the existing job responsibilities
50 26.56%
D. Dissatisfied with the current state of work, but at a loss what to do
54 28.75%
E. Others 18 9.7% Table 4 Obstacles to career development of learning-guide teachers (multiple choices) Options Subtotal Percentage A. Learning-guide teachers feel being marginalized at school
115 60.75%
B. Schools do not attach importance to the development of learning-guide teachers, and provide little training opportunities
78 41.09%
C. Inadequate individual ability
71 37.69%
D. Heavy work tasks, unclear job responsibilities, and at a loss about direction of development
46 24.04%
E. Narrow career development path, and at a loss what to do
41 21.78%
F. Others 13 6.9%
5. CONCLUSIONS
The analysis of survey results on learning-guide teachers at the Open University of China shows that learning-guide teachers play an irreplaceable role in the non-academic support services for distance open education. But there are also some problems to be solved urgently, mainly in the following aspects.
1. Multiple tasks and roles are the norm for learning-guide teachers. Their role and job duties need to be adjusted On the one hand, due to the utilitarian character in the development of distance education, coupled with the practical considerations of costs in running grassroots learning centers, multi-task responsibilities and multiple roles prevails in grass-roots learning-guide teachers; on the other hand, there are less learning-guide teachers at the more basic grass-roots level. This requires learning-guide teachers to undertake multiple tasks including teaching management, student management and student services. Through interviews, it has been found that although some learning-guide teachers do not have a strong professional identity, most learning-guide teachers are able to be engaged in this profession stably.

142
Nearly 1/3 of teachers believe that in order to meet the needs of career development, the Open University of China headquarters should make top-level design concerning the job responsibilities, assessment and evaluation mechanism and management model of learning-guide teachers, and specify their roles and responsibilities according to the principles and teaching model of the open university.
2. Learning-guide teacher team needs to improve their professional ability The survey shows that judging from the composition of grassroots learning-guide teachers of the Open University of China, a considerable part of them are retired staff, who have low education level and do not have a deep understanding of distance open education and who adopt traditional closed approaches to managing students support services. Interviews found that most of grassroots learning-guide teachers have a single professional knowledge structure and a lack of scientific management knowledge and skills. In the context of emphasis laid by Open University on the deep integration of information and education, some learning-guide teachers lack the skills to use information technology, and are not skilled in network technology. It is difficult for them to guide students in online learning, transfer learning resources and help them solve the problems in their study. The Open University of China shall offer comprehensive, systematic business knowledge and skills training for learning-guide teachers, in a bid to improve the learning-guide teachers’ professional expertise and work capability, and facilitate the professional and specialized development of the learning-guide teacher team.
3. Improve the institutional system and create new ways of management mechanism The institutional mechanism is the key to the healthy growth of teacher team. At present, the Open University of China has gradually improved its institutional system for learning-guide teacher team, and unveiled a host of measures for the learning-guide teacher team, including employment qualification, access requirement and work specifications and so on. Some achievements have been made and some experience has been gained. But how to carry out effective management and execution in work remains a big problem. As a new-type university, the Open University of China needs to provide a safeguard mechanism for the development of learning-guide teachers through system innovation at the top-level of school development. It needs to specify the role of learning-guide teachers in the learning support service system, establish a sound qualification access mechanism for learning-guide teachers, and develop scientific job responsibilities standards; optimize the evaluation indicators by exploring the learning-guide teacher management and operation mechanism; explore a fair, rational and effective incentive mechanism, enhances learning-guide teacher’s sense of responsibility and sense of belonging, stimulate their initiative and enthusiasm in work, and maximize their work efficiency.
4. Career development status is not optimistic and services for career development shall be strengthened. Because of the marginalized status of learning-guide teachers at schools, unclear role positioning, the school’s inadequate attention to learning-guide teachers, and narrow development space for teachers and so on, the learning-guide teacher’s personal career development path does not fully dovetail with the school’s cause development. Take title promotion as an example. The interview finds that the title promotion of most learning-guide teachers is usually tied to the publication of academic papers regarding their specialty. In practice, however, these criteria are mostly not directly related to the work of learning-guide teachers. This is the main reason that most learning-guide teachers lack the direction of career development, and lack identity with the profession. The Open University should provide more space, better environment, and more effective services for learning-guide teachers in their career development. They can establish a complete internal mechanism for the title promotion of learning-guide teachers, including: expanding and making clear career development channels, establishing a training mechanism, organizing training activities, building a communication platform, launching sharing, evaluation, and competition activities, relying on the teacher team to carry out collaborative work or research projects, and setting up competency standards for learning-guide teachers. The survey also found that learning-guide teachers have a strong demand for training, systematic training based on job responsibilities is urgently needed, and mixed training programs combining different subjects are well-received.

143
6. CONCLUDING REMARKS
Strengthening the building of the learning-guide teacher team is an important part of the construction of the teaching staff at the Open University of China. As a new university entity, the Open University of China has its own characteristics and laws in building the learning-guide teacher team. Over the more than 30 years of its development, China Central Radio & TV University has explored and developed a mature learning-guide teacher management mechanism. However, it still has yet to meet the requirements of a new-type university. With the development of the Open University of China and the reform of its school running and teaching mode, the management of learning-guide teacher team needs to be adjusted and optimized. It is necessary to specify their growth system and career development path, establish long-term development goals toward specialization and professionalism, create a good career development space for learning-guide teachers and promote the healthy development of learning-guide teacher team for the Open University of China.
REFERENCES
[1] Gu Jingxiang, Fang Muzhen. Exploration of learning support service system construction for distance education [J]. China Educational Technology, 2007, (6): 39-43. [2] Wang Shufen, Exploration and analysis of management of learning-guide teachers under modern distance open education [J]. China Adult Education, 2011 (11): 30-32. [3] Luo Honglan, Yang Tingting. Research on the Competency of Full-time Teachers for Distance Education [J]. China Educational Technology, 2008 (9): 32-35. [4] Du Qiongying. Introduction to and inspiration from the study of learning support service theory [J]. Journal of Yunnan RTV University, 2001, (1): 15-18. [5] Translated by Li Yawan. Exploration of the ways of supporting the learners to achieve success [J]. Distance Education In China, 2005, (9): 13-14. [6] Chen Wei. Exploration of Learning Support Service for Adult Higher Education [J]. Science and Technology of West China, 2008, (23): 82-83. [7] Xiong Wen. Soft influence factor and evaluation model of learning support service quality for distance education [J]. China Adult Education, 2009, (20): 107-108. [8] Zou Fanlin. On non-academic support services for distance education and its strategy [J]. China Educational Technology, 2010 (7): 59-63. About the Author: Jiang Xiaoqing: Associate researcher. Student Affairs and Teacher Development Center of the Open University of China (100039)
144
RESEARCH ON THE MODE OF MOBILE LEARNING IN DISTANCE EDUCATION
Zhixiang-li 1, Chen-ning 2
1School of Engineering, the Open University of China (CHINA) 2School of Engineering, the Open University of China (CHINA)
Abstract
This paper analyzes the necessity of carrying out mobile learning in distance education and constructs a "1 + N" mobile learning model. Taking the application of computer graphics course mobile learning resources as an example, the problems of how to develop and apply mobile learning resources and how to learn by mobile learning resources are discussed. The results show that mobile learning is an effective complement to the modern distance learning, as it can be accessible from virtually anywhere and anytime. It also provides a useful exploration for the combination model of mobile learning and face-to-face classroom teaching.
Key words: distance education; mobile learning; learning model; learning resources
1. INTRODUCTION
As a new field of distance education development, mobile learning has made full use of the new achievements of contemporary mobile communication, network technology, mobile equipment and educational development, and constructed a "seamless learning" space which can be studied at any time and any place. Mobile learning has the characteristics of mobility, high efficiency, broadness and individuality. It greatly broadens the scope of education and learning, and has made great impetus to lifelong education, democratization of education and individualized learning. Especially in recent years, with the rapid development of wireless communication network and the emergence of new mobile devices, mobile learning has become a hot spot in the field of distance education research and application. Based on the characteristics of distance education, this paper studies the development and application of mobile learning resources, and explores the mobile learning model in distance education in order to solve the teaching problems existing in the Open University of China (referred to the OUC), so as to improve the quality of teaching.
2. THE NECESSITY OF MOBILE LEARNING IN DISTANCE EDU CATION
The distance education learners in the OUC are mainly working adults, they have clearly learning purpose. On the one hand, they are aware of the importance of knowledge in practical work, hoping to improve their working ability through the study; the other hand, they also hope that through further study and development, develop their own interests, enrich themselves. In addition, because the learners are studying in the occupation, engineering and learning contradictions, in this case, students must rely on self-study. At the same time, adult students have a strong sense of independence, and they are willing to arrange their own learning without restriction. Based on the analysis of learners' learning characteristics, it is necessary to carry out mobile learning in distance education. The combination of mobile learning and distance education can provide students with a "seamless" learning space, provide students with more learning convenience and possible, and students can choose to learn and improve their interest and effect. Mobile learning "embedded" to the remote teaching links can provide new means for distance learning information dissemination, teacher-student communication, learning effect detection. In the distance education to carry out mobile learning, distance education will save a lot of human resources, improve teaching effectiveness. New learning ideas and learning styles require mobile learning to enter distance education as early as possible. Mobile learning can help classroom teaching, and allows learners to walk in the classroom or even outside the school at any learning time, provides good support for experiential, situational learning.

145
It can build a bridge for classroom teaching and life, provide new ways for remote teaching, but also provide support for the concept of lifelong learning.
3. THE CONSTRUCTION AND IMPLEMENTATION OF "1 + N" M OBILE LEARNING MODEL
According to the theoretical basis of mobile learning, we can see that mobile learning is learner-centered and has a mobile device for learning activities. This paper putts forward a “1+N” mobile learning model. "1" refers to the learner as the center, and they have "1" part of the mobile learning terminal; "N" refers to the learners can learn and practice at any time, any place, and using any learning mode. It can be seen that throughout the learning process, students are the subject of learning, teachers only help to guide and promote. The realization of mobile learning is divided into SMS-based mobile learning, MMS-based mobile learning, browsing-based mobile learning, Video-based mobile learning and offline class mobile learning mode.
3.1 SMS - based mobile learning mode
SMS-based mobile learning model is mainly used in learning activities of communication data less and simple text description. It is a popular mobile learning path. As a means of communication, short message service has now been widely used, and won the favor of the majority of users. Because of its extensive use, some researchers began to try to apply it to teaching and learning.
3.2 MMS-based mobile learning mode
Multimedia services (MMS) can be divided into three cases: MMS terminals receive and send multimedia messages to each other; MMS terminals and Internet E-MAIL server send and receive multimedia messages; MMS terminal and Internet value-added service platform send and receive multimedia messages to each other. Ordinary short text messages can only include 170 bytes in length, MMS short messages can be up to 30-100 kilobytes in length. In addition to text, MMS messages can contain a combination of one or more media formats in the sound, picture, and video clips. Through the multimedia short message service provided by 3G, the learner can send the short message to the teaching server through the terminal. The teaching server can analyze and process the received data, the reply information can be automatically returned to the learner in the form of short message. Of course, learners can also discuss the problem through short message.
3.3 Browsing-based mobile learning mode
Browse, links include WAP and mobile Internet services and mobile broadband services. The construction of WAP education site is another important aspect in the field of mobile learning. There is not much difference between WAP education site and ordinary WAP site. The difference lies in the purpose of the application and the object oriented.
3.4 Video-based mobile learning mode
With the help of 3G technology to provide the network bandwidth, learners can get a higher network transmission bandwidth both indoors, outdoors or in the process of moving. you can easily achieve demand across from the text, picture to audio and video. Based on this business, we can develop some courses suitable for learners to watch, simulate learning through the mobile phone software, and provide services for mobile learning by taking full advantage of 3G bandwidth advantages. Compared with the previous TV education and online education program based on the wired network, it has greater flexibility, can free learning at anytime and anywhere. It is more suitable for modern fast-paced learning crowd.
3.5 Offline class mobile learning mode
This learning mode allows learners to get rid of restrictions of the time, place. As long as the need for information, you can carry portable mobile devices to find, browse and download. The information download can be stored in the mobile terminal for a long time, the learner can learn offline, reduce the dependence on the network, but also reduce the financial burden of the Internet.

146
4. THE DEVELOPMENT AND APPLICATION OF MOBILE LEARNI NG RESOURCES
The development of mobile learning resources should follow the following principles: 1) The validity of media form selection.2) Content catch big and put small down, strengthen the core. 3) Learn in use. 4) Focusing on the performance of the same core content in different media forms. 5) Attention to strengthen the user experience. The development process of mobile learning resources includes many development links from the beginning of the demand analysis to put into use [1-2]. For example, the main development aspects of computer graphics courses mobile learning resources are as shown in Figure 1. 1. Demand analysis. Firstly, we should carry out the analysis of the learner. Based on the characteristics of the learners 'groups and the level of self-control, we should concern how to stimulate the learners' interest in learning. Secondly, we should carry out the analysis of the learning content. According to the characteristics and difficulty of the learning contents, the learning content is presented in a form that is most easily accepted and understood by the learner. 2. To determine the guiding ideology of teaching. The quality of teaching resources depends largely on the suitability of the teaching ideology. The appropriate teaching ideology can start from the learner's own characteristics and the nature of the learning content, so that the learners can grasp the knowledge more easily and reach the teaching purpose [3]. 3. Resource development. In the development of mobile learning resources, we must carry out the content structure design and interface navigation design firstly according to the demand analysis, and then select the appropriate development tools to complete the development of mobile learning resources according to the identified resource presentation form and resource length [4-5].
Learner characteristics
Learning Content
demand analysis
Teaching guiding ideology
Resource development
PAD Mobile phone
WAP Browser WWW Browser
Put into use
Rich learning
resources
Timely interaction
AnyLearning
place
Any learning
time
Feedback modification
Resource presentation form
Fig 1. Development and Design Framework of Mobile Learning Resources

147
4. Put into use. After the completion of resource development, the mobile learning resource can be provided directly to the learners to use. For the more far-reaching impact and the application of a wide range, you should go through professional testing and a variety of trial firstly, quality is proved qualified and then put into use. 5. Feedback and modification. In the course of the using process, the learners 'feedback on the used learning resources is collected, and the learning resources are appropriately modified to achieve better learning results under the premise of satisfying most learners' satisfaction.
5. MOBILE LEARNING RESOURCES APPLICATION EVALUATION We have developed a computer graphics course of mobile learning resources for student learning. Computer graphics courses enrolled students 76 people, 62 students have chosen to use mobile learning resources for learning, and the remaining 14 people are not using mobile learning resources. In these 62 students, summative test scores 90-100 points to 48, 78% of the total number of points for the 80-89 0,70-79 points to 12, 19% of the total number of, 60-69 points is zero, do not pass the 2, 3% of the total, as shown in FIG 2. Visible, students learn to use mobile learning resources, high interest, have achieved good results, the pass rate was 97%, and the effect is satisfactory. In addition, we focused on computer graphics program mobile learning resource designed a questionnaire for students to use mobile learning resource evaluation, as shown in Table 1.
Fig2. Summative exams map
Tab 1 mobile learning resources satisfaction questionnaire
The survey very much
agree agree general disagree
Teaching content and methods(10
items) 3 56 3 0
Interface design(2 items) 0 55 7 0
Learning Support Service(3 items
) 0 50 12 0
Course Overall satisfaction(1 item
) 0 58 4 0 Through the questionnaire can be found in the course of the experiment, the use of new technologies learners showed great curiosity and excitement, they are very willing and eager to use the new technologies in learning; more importantly, experimentally found that the new technology with the aid of learning outcomes learners has been significantly improved, mobile learning resources are more able to cater to the tastes of younger students, so they can maintain a lasting interest in learning.
6. SUMMARY
The development of mobile Internet, it made the content and form of learning undergo a revolutionary change. Learners hope that the learning content is personalized, learning means is information technology, learning process is lifelong. Mobile terminals become learning tools at any time. Mobile learning resources is from the "whole" to "narrow" relative to the traditional learning resources, the relevance of resources is more and more stronger, the resources form of the same knowledge is diverse. Mobile learning allows students to choose their own personalized learning resources and methods. It has advantages of rich media, diverse communication channels, easy to use and so on. Mobile learning resources can be made for a variety of forms of terminal learning resources products, communicate through different channels. It can achieve dynamic integration, multi-channel, multi-form digital
48; 78%
12; 19%2; 3%
Grading
100-90
89-80
79-70
69-60
59-0

148
publishing, real-time sharing and interaction. Learners have curiosity about the way of mobile learning, the friendly interface and the flexible interaction can effectively stimulate learners' interest in learning. Compared with the previous learning resources, mobile learning resources have added a lot of new features, such as marking, taking notes, sharing, search function, add bookmarks and other auxiliary learning means. You can communicate with teachers and students. As a new learning mode in distance education, mobile learning is a kind of auxiliary teaching method. There are still many problems in the design of mobile learning mode and learning resources, which need further study and exploration.
REFERENCES
[1] Liu Yuping, Learning resources design research based on the Tablet PC Mobile [J]. Master's degree thesis of Liaoning Normal University, 2014,6: 34-42 [2] Hu Jianfang, Learning resources design research based on the smart phone mobile [J]. Master's degree thesis of Inner Mongolia Normal University, 2014,5: 27-35 [3] Duan Luqian, An Xueguo. Technology and Reform of "Foreign Training Machinery CAD" Teaching Based on Human Suit [J] Acta Scientiarum, 2014,35 (4): 619-622 [4] Song Xuemei. Application of task-driven teaching method in computer graphics teaching [J]. Journal of Yantai Vocational College, 2014,20 (4): 72-74 [5] Cui Ting. Application of Project Teaching Method in "Computer Drawing" Course [J]. Heilongjiang Science, 2014.5: 217

149
ANTECEDENTS AND OUTCOMES OF SERVICE RECOVERY SATISFACTION: PERSPECTIVE OF OPEN DISTANCE LEARNING
(ODL) IN MALAYSIA
Mohd Rushidi bin Mohd Amin 1, Abdul Rahim bin Mohamed Amin 2, Shishi Kumar A/L Piaralal 3
1Open University Malaysia (MALAYSIA) 2Open University Malaysia (MALAYSIA) 3Open University Malaysia (MALAYSIA)
Abstract
Researcher and practitioner often paid less attention to service recovery research comparing to service quality or customer satisfaction in online setting particularly in online distance learning (ODL) in Malaysia. More importantly, the outcomes of service recovery satisfaction are often being less emphasized by the ODL institutions in order to gained advantages in the current higher education business environment. Service organizations often focus on delivering service in the perspective of doing right at the first time particularly in-service industry including ODL institutions. Service failure is inevitable and if the service delivery failed at some point, the whole processes will be disrupted, and the students will be dissatisfied and disappointed. This is where service recovery through justice dimensions takes place and the importance of service recovery satisfaction and behavioural outcomes is often ignored in the whole service delivery process. The relationship of justice dimensions (Procedural, Distribution, Interpersonal and Informational justice), service recovery satisfaction and behavioural outcomes is being explore and the moderating effect of corporate image in Malaysian ODL context is being explore and examine in this study. Keywords: Justice Dimensions, Service Recovery Satisfaction, Corporate Image, Behavioural Outcomes, Online Distance Learning (ODL).
1 INTRODUCTION In meeting the challenge and provide opportunities for Malaysian to pursuing tertiary education, online and distance learning (ODL) is one of the feasible alternative to Malaysian due to the flexible lecture hours, weekend classes, low tuition fees and wide choice of learning centres (Santhi, 2009). This learning approach has its own issues and among them are workload, family obligations, inadequate time arrangement and failure to adapt to lessons and assignments, lack of feedback and interaction and low support service. ODL institutions offers the opportunities to the students to study in their own pace and it is characterized as a multi-dimensional concept to bridging the time, location, cost, education, communication gap between the students, colleagues and their tutors (Antwerpen, 2015). ODL concentrates removing the barrier of access and flexibility of conventional learning and supporting the students with the expectation that the students can succeed in this new way of learning. At this moment there are three dedicated online distance institutions that actively operated and they are Open University of Malaysia (OUM), Asia e University (AeU) and Wawasan Open University (WOU). However, no service is perfect and not affected by controllable or uncontrollable failures. Every service provided is vulnerable to failure and the essence of service rectification or recovery is often missing or inadequate to be implemented (Valarie, Bitner & Gremler, 2009). Business entity including higher education institutions are required to be more streamlined than before in finding the balance between taking care of customer demand of the service and the stakeholders' desire of profitability (Ahmad, 2014).

150
1.1 Problem Statement Many empirical researches has been conducted in the field of service failure, recovery customer satisfaction, justice dimensions, corporate image and customer behavioural outcomes in the setting of retailing, healthcare, restaurant, hotel, airlines, telecommunication and banking (Abbas, Abdullateef, & Mokhtar, 2015; Barakat, Ramsey, Lorenz, & Gosling, 2015; Lopes & da Silva, 2015; Ro, 2014; Cambra Fierro, Melero Polo, & Sesé Oliván, 2014; Cheng & Loi, 2014; Ha & Jang, 2009; Kassim & Souiden, 2007) but not in Malaysian private higher education institutions especially in ODL context. Service recovery in ODL is not being paid so much intention and needed to be examine closely (Gruber, Reppel, 2010; Voss, 2009; Swanson & Davis, 2000). Voss et al., (2010) highlight this issue particularly upheld the need to study service failure and service recovery in the education area for building and adding to the existing body of knowledge in the field including ODL. However, research to date fails to reach a concrete understanding the relationship of customer recovery satisfaction and customer behavioural outcomes from the perspective of Justice dimensions in ODL Point to be highlighted here is that this research shall address the theoretical gap by further investigates the four dimension of justice by including Interpersonal and Informational Justice dimension as suggested by Krishna, Dangayach and Jain (2011). So far, the investigation of four factor dimensions of justice is not being emphasis in the research of service recovery although there are many research that stated that each justice dimensions has a distinguish advantages and have a combination effect when being tested together (Nikbin, Ismail, & Marimuthu, 2013; Nikbin, Marimuthu, Hyun, & Ismail, 2015). In addition, empirical studies that investigate the relationship between informational justice and service recovery satisfaction are often paid less attention (Krishna et al., 2011). Furthermore, the outcomes of service recovery satisfaction such as trust, word of mouth, loyalty and repurchase intentions is also included following the potential that suggested by Bhandari (2010). The effect of corporate image as the moderator enriched the literature in corporate image in service recovery (Ding, Ho, & Lii, 2015; Nikbin et al., 2015). The proposed research model in this study is among the first approach to measure service recovery satisfaction and their behavioural outcomes with the effect of corporate image as the moderator in online setting specifically in ODL. Corporate image is an important resource that the service provider need to properly manage in order to shape the general assessment by the customer of the service provider and has been broadly recognized in the service literature (Bitner, 1990; Gronroos, 1984; Nguyen & Leblanc, 1998). However, this construct has been generally overlooked in the service recovery literature (de Matos, Henrique, & Rossi, 2007; Mostafa, Lages, Shabbir, & Thwaites, 2015) and there is still more opportunities to carry out empirical research in assessing corporate image especially in service recovery context. However, to the best of the author knowledge, not many empirical researches has examined the moderating effect of the different type of perceived justice on corporate image in service recovery and ODL setting. This study provides a comprehensive understanding especially in online environment because users are influenced by various factors when using different services in post-adoption stage.
1.2 Research Objectives The main objectives of this study are to understand the antecedent and outcomes of service recovery satisfaction with service recovery for ODL learners who had highlighted their experience of service failure. The specific objectives of the study are as follows:
RO 1. To examine the relationship of Perception of Justice dimensions toward Service Recovery Satisfaction where the details research objectives are: RO 1a: To examine the relationship of Distributive Justice towards Service Recovery Satisfaction. RO 1b: To examine the relationship of Procedural Justice towards Service Recovery Satisfaction. RO 1c: To examine the relationship of Interpersonal Justice towards Service Recovery Satisfaction.

151
RO 1d: To examine the relationship of Informational Justice towards Service Recovery Satisfaction. RO 2. To examine the relationship of Service Recovery Satisfaction toward Behavioural outcomes where the details research objectives are: RO 2a: To examine the relationship of Service Recovery Satisfaction towards Repurchase Intention. RO 2b: To examine the relationship of Service Recovery Satisfaction towards Word of Mouth. RO 2c: To examine the relationship of Service Recovery Satisfaction towards Trust. RO 2d: To examine the relationship of Service Recovery Satisfaction towards Loyalty.
RO 3. To assess the moderating effect of Corporate Image on the relationship of Perception Justice dimensions and Service Recovery Satisfaction where the details research objectives are: RO 3a: To assess the moderating effect of Corporate Image between the relationship of Distributive Justice and Service Recovery Satisfaction. RO 3b: To assess the moderating effect of Corporate Image between the relationship of Procedural Justice and Service Recovery Satisfaction. RO 3c: To assess the moderating effect of Corporate Image between the relationship of Interpersonal Justice and Service Recovery Satisfaction. RO 3d: To assess the moderating effect of Corporate Image between the relationship of Informational Justice and Service Recovery Satisfaction.
1.3 Research Questions Based on the research objectives mentioned in the earlier section, this study aims to answer the following research questions:
RQ 1. Is there a positive relationship of each Perception of Justice dimensions and Service Recovery Satisfaction? RQ 1a: Is there a positive relationship between Distributive Justice and Service Recovery Satisfaction? RQ 1b: Is there a positive relationship between Procedural Justice and Service Recovery Satisfaction? RQ 1c: Is there a positive relationship between Interpersonal Justice and Service Recovery Satisfaction? RQ 1d: Is there a positive relationship between Informational Justice and Service Recovery Satisfaction?
RQ 2. Is there a positive relationship between Service Recovery Satisfaction and Behavioural outcomes? RQ 2a: Is there a positive relationship between Service Recovery Satisfaction and Repurchase Intention? RQ 2b: Is there a positive relationship between Service Recovery Satisfaction and Word of Mouth?

152
RQ 2c: Is there a positive relationship between Service Recovery Satisfaction and Trust? RQ 2d: Is there a positive relationship between Service Recovery Satisfaction and Loyalty?
RQ 3. Is there a moderating effect of Corporate Image on the relationship of Justice dimensions and Service Recovery Satisfaction? RQ 3a: Is there a moderating effect of Corporate Image on the relationship between Distributive Justice and Service Recovery Satisfaction? RQ 3b: Is there a moderating effect of Corporate Image on the relationship between Procedural Justice and Service Recovery Satisfaction? RQ 3c: Is there a moderating effect of Corporate Image on the relationship between Interpersonal Justice and Service Recovery Satisfaction? RQ 3d: Is there a moderating effect of Corporate Image on the relationship between Informational Justice and Service Recovery Satisfaction?
2 LITERATURE REVIEW 2.1 Online Distance Learning (ODL) in Malaysia With the significance of delivering a quality service in the service sector, many ODL institutions focused on service quality, satisfaction and loyalty of their students. Regardless of positive efforts and research in this area, ODL institutions still face the difficulties in retaining their existing students. Anagnostopoulou, Mavroidis, Giossos, and Koutsouba (2015) stress out that the dropout rates of ODL institutions are much higher than conventional institutions. Saif (2014) stated that among the reason for the students’ disappointment are level of service quality, quality of the academics and quality of learning facilities, which did not live up to the students’ expectations. Due to this situations, researchers and practitioners are still investigating and examined the best practice to leverage the significant of quality service to enhance students satisfaction and retention in Malaysian Private Higher Education Institutions (Santhi & Ganesh, 2015). In ensuring sustainability of higher education institutions, the institutions oblige them to consistently attempt towards to meet or surpassing the students expectations (Anderson & Fornell, 1994; Hanaysha, Abdullah, & Warokka, 2011).
Previous studies in online distance learning (ODL) focused more on service quality, teaching and learning, reducing attrition rate, defection rate, students retention (Noor, Khalil, & Latif, 2016; Santhi & Ganesh, 2015). As in any service industry, quality service is vital particularly in ODL institutions. Prior literatures have recommended that satisfaction is one of the key advantages for any higher education institutions as it will lead towards organizations profitability and financial stability (Noor et al., 2016). More empirical research is required on ODL and especially on the students’ perspective that viewed as being the most critical aspect and one significant issue that this study proposed is the issue of service. However, empirical research on the topic of service recovery satisfaction and behavioural outcomes has been ignored and this focal issue need more noteworthy consideration. Much understanding is required on the part of role and functionality of service recovery in ODL and how that might possibly influence the ODL students future behavioural outcomes.

153
2.2 Proposed Research Framework and Hypotheses Deve lopment Antecedent Variables Outcome Variables Moderator Figure 1 Propose Research Framework 2.3 Service Failure A service failure is a broken promise. It occurs whenever any product or service fails to meet the customer’s expectations including in the online services. According to Berry and Parasuraman (1991), failure open the window of opportunity in a different and positive perspective. Kim and Smith (2005) stated that service failure results into customer dissatisfaction with the service provider and the consequence of service failure is that customers may exit, spread a harmful word-of-mouth and voice their grievance to the service provider prior to their dissatisfaction. There are various factors which cause services failure in higher educational institutions (Abdullah, 2006; Hill, 1995). Either individually or in combination with other factors, the major causes of service failure in educational institutions are staff’s lack of punctuality, bad behaviour, unprepared lectures and lack of empathy.
Discrepancy between service performance and customer expectation also considered as a failure. According to Lewis and Spyrakopoulos (2001), service failure happens when consumers are disappointed with service or when performance of product or service falls below their expectation. In higher education institutions, the accomplishment of service delivery relies upon the efforts of academic or non-academic staff (Cooper, 2007). Low interaction between students, academic and non-academic staff may bring gap between service performance and consumer expectation. Past researches by Swanson and Davis (2000), Voss et al., (2010) and Chahal and Devi (2013) indicated that in general, service failures in education sector are categorised under three groups: Group I (related to professor’s/faculty’s reaction to service delivery system failure), Group II (faculty’s reaction to students’ needs and requests) and Group III (unprompted and unsolicited actions behaviour of the teaching or non-teaching staff with the students in the institutions). In subsequent of customer feedback following service failure situation, service provider frequently attempt service recovery, which stand for the next stage of the customer overall experience with the service (Singh & Crisafulli, 2015). 2.4 Service Recovery Service recovery process is meant to provide solution to the problem causes by the service failures and improve the relationship between customer and service provider (Cambra-Fierro, Melero-Polo, & Sese, 2015). Past research has determine that service recovery lead to various reactions from customer (Joireman, Gregoire, Devezer, & Tripp, 2013). Customers will recapture and regain satisfaction in the
Service Recovery
Satisfaction
Corporate Image
Perceived of Justice
• Distributive • Procedural • Interpersonal • Informational
Behavioral Outcomes
• WOM • Loyalty • Trust • Repurchase
Intention

154
service provider if they put adequate recovery efforts to provide solution to the problem (Cambra-Fierro et al., 2015). Service recovery is an actions initiated by a service provider in rectifying the problem which cause by service failure that can affect the level of customer satisfaction (Karatepe, 2006; Sheth, Sisodia, & Sharma, 2000). Gronroos (1990) define service recovery as systematic actions which are taken by a service provider to rectify the error following a service failure in order to regain customers’ support. More attention has been given and highlighting the importance of service recovery research as this field is often neglected (Tax, Brown, & Chandrashekaran, 1998; Wirtz & McColl-Kennedy, 2010).
Rashid, Ahmad and Othman (2014) examined the relationship between service recovery and customer satisfaction in co-created retail industry. According to them, co-created retail industry reveals the engagement of customer in business value creation as a win-win approach for both in the setting of service recovery. In addition, Rashid et al., (2014) proposed a conceptual framework and they recommended three prepositions which stated that customer satisfaction is influenced by three factor justice dimensions of service recovery which is distributive, procedural and interactional justice. Komunda and Osarenkhoe (2012) stated that effective service recovery can recover customers’ perceived quality of the services and point to positive word of mouth, good customer relationship and customer loyalty. Unsuccessful service recovery would reduce the level of confidence among the customer and also the reason for spreading of the negative word of mouth. The challenge for the service provider is to deal with non-complainer customers (Kumar Piaralal, Kumar Piaralal, & Awais Bhatti, 2014). If the service provider does not identify the customer’s problem and take immediate steps to recover or make amends, they could lose a valuable customer who may tell others.
2.5 Justice Theories Colquitt (2001) stated that over the last decades the concept of justice or fairness has become an increasingly noticeable construct. At first, researchers only emphasis distributive justice by focused on the justice of decision outcomes (Adams, 1965). Justice Theory (Adams, 1963) has been broadly employed to describe customers’ reactions either satisfaction or dissatisfaction toward a service failure. The basis that form justice theories is social psychology. Justice theories explains the behaviours successfully and broadly when individuals face a complex conflict situation (Abbas et al., 2015). Previous research suggests that when customers evaluate their consumption experiences, they also include justice since their consumption can be considered as an exchange between the service provider and the consumer (Sindhav, Holland, Rodie, Adidam, & Pol, 2006). Past service marketing studies have examined the justice concept (Hutchinsona, Lai, & Wang, 2009; Sindhav et al., 2006) and found that being treated fairly is an important consideration to customers when they were evaluating their satisfaction with the services provided (Martinez-Tur, Peiro, Ramos, & Moliner, 2006). In this study Justice Theories is being used. Justice theories is more specific and consist of three major different components such as distributive, procedural and interactional justice. Later on, interactional is divided into two component i.e. Interpersonal and Informational justice.
Mansori, Tyng and Ismail (2014) studied the impact of perceived justice on customer satisfaction and summarized past literature related to perceived justice towards customer satisfaction in the context of online shopping, online retailing, banking, restaurant, hotel and summarize that perceived justice consist of three dimensions i.e. perceived distributive justice, perceived procedural justice and perceived interactional justice. However, the forth type of justice dimension (Informational Justice) is not being explored. Krishna et al., (2011) stated that Informational Justice should be included in future service recovery research and this study fill in the gap by incorporated Informational Justice into the research framework. Colquitt, Conlon, Wesson, Porter and Ng (2001) provided a valuable perspective about organizational justice, justice dimension, size of relationships among justice dimensions, the relative importance of different justice criteria and the unique effects of justice dimensions on the key outcomes. A meta-analysis on all articles published since 1975 were conducted. It started with Thibaut and Walker (1975) introduced the procedural justice construct, which allowed for the comparative study of the influence of multiple dimensions of justice.

155
2.5.1 Distributive Justice The first type of justice is distributive justice, which look at individuals' impression of the fairness of results that they received. Adams (1963, 1965) highlight that one of the early theories of justice, set that the fairest allocations are those that compensate individuals in their extent to their contribution. Before 1975, the research of justice was fundamentally based on distributive justice. In the research, he suggested that to determine whether an outcome was fair is to calculate the ratio of one's contributions or inputs to one's outcome and then compare that ratio with another comparison. Allocation of benefits and costs is the main element in distributive justice. In the situation of service failure, distributive justice can be defined as perceived fairness of service recovery outcome (Nikbin, Ismail, Marimuthu, & Abu-Jarad, 2011). In addition, customers expect to be compensated for the inconvenience related to the failure and having through the recovery process. The typical forms of compensation are one or some combination of refunds, credits, correction of charges, repairs and replacement and apologies. Distributive justice has found to influenced satisfaction, repurchase intention and word of mouth decisions in a variety of service recovery setting (Mansori et al., 2014). However, Baker and Meyer (2014) argued that compensation might not the best service recovery efforts provided by the organization when service failure occurred. Giving compensation directly to customer could reduce the organization profitability. In similar account, Bambauer-Sachse and Rabeson (2015) investigates the aspect of tangible compensation for a service failure that directly related to high degree of customer satisfaction for high-involvement services encounter. They investigated the suitability of different kinds of tangible compensation including different circumstances of responsibility for the failure and failure severity. Hence, the first hypotheses relate Distributive Justice and Service Recovery Satisfaction. Based on the literature above, it is expected that Distributive justice dimensions has positive relationship with service recovery satisfaction. Therefore, the following hypotheses is as follows:
H1: Perception of Justice has positive relationship with Service Recovery Satisfaction, where the details hypotheses are: H1a: Distributive Justice has positive relationship with Service Recovery Satisfaction.
2.5.2 Procedural Justice The second type of justice is procedural justice. Mattila (2001) stated that procedural justice is the perception of justice in terms of processes or procedure to recover from service failure. A timely response is required in case of service failure. Procedural justice refer to the individuals' view of the fairness of the procedure and processes, used to determine the results that they received (Greenberg, 2009). Thibaut and Walker (1975, 1978) found out that individuals were more tolerating of unfavourable results as long as the procedure used to allocate those results was reasonable. In 1975, Thibaut and Walker introduced the study of process to the literature on justice and a third-party dispute resolution of procedure is being discussed particularly emphasis on the process stage and decision stage. Respectively, the amount of influence disputants had in each stage act as an evidence of process control and decision control. They recommended that disputants are willing to capitulate control in the decision stage as long as they retained control in the process stage. In a separate view, disputants viewed the procedure as fair and reasonable if they perceived that they had process control. This process control effect is often referred to as the fair process effect. Procedural fairness concerns with the policies and rules that form the complaint process. The second hypothesis indicate the relationship between Procedural Justice and Service Recovery Satisfaction. Therefore, the following hypothesis is as follows:
H1b: Procedural Justice has positive relationship with Service Recovery Satisfaction.
2.5.3 Interpersonal and Informational Justice Colquitt et al., (2001) stated that the term of justice is used to stand for fairness or righteousness. Interactional justice can divided into two different element: interpersonal justice and informational justice (Colquitt, 2001b). In organization context, Greenberg (1993) recommend a four-factor structure that

156
include interpersonal justice and informational justice. Interpersonal justice acts fundamentally to change responses to decision outcomes, since sensitivity can improve individuals feel better on unfavourable result (Greenberg, 1994). On the other hand, informational justice acts fundamentally to adjust responses to procedures, in that explanations give the information needed to assess the parts of the process. Informational injustice which mirrors a perceived insufficient of fairness in the condition of sufficient information about change (Colquitt et al., 2001; Timming, 2012).They added that respect and sensitivity feature of interactional justice is best seen as interpersonal aspects of distributive justice due to the alteration of reaction to decision outcomes. Furthermore, the explanation aspect of interactional justice may be best seen as the interpersonal aspect of procedural justice as the explanation always deliver the information needed to assess the structural aspect of the procedure itself. The interpersonal treatment can be described as when the individual received the treatment with dignity and respect when the procedure is carry out. The main foundation of reasonable interpersonal conduct is by showing politeness, concern, honesty and give an explanation of why the service failure occur at the first place and putting efforts to solving the problem. Greenberg (1993) describe in detail about the informational justice and stress out on the explanation that given to the people which put across the information about why procedures were used in a certain manner or why outcomes were distributed in a certain way. Offering clarification and explanation that is sufficient and detailed can be associated to improve satisfaction with service recovery. The effect of informational justice may not be the same for the customer at all the time. This relationship can change, depending upon the attributions of service failure. This is one of the issues that have not been adequately examined and Nikbin et al., (2013) examines the linkages between instructive equity and recovery satisfaction, under both high and low levels of failure attributions in order to fulfil this gap. The component in interpersonal and informational justice such as politeness, concern, honesty and fairness in the provision of sufficient information could contribute towards recovery satisfaction. When service provider gave inadequate information, the customer may realize that this insufficient of information could act as an indication that the service provider does not respect them (Greenberg, 2004) and may spark the emergence of negative outcomes. The third and fourth indicate the relationship between Interpersonal and Informational Justice towards Service Recovery Satisfaction Therefore, based on the literature above, the following hypotheses are as follows:
H1c: Interpersonal Justice has positive relationship with Service Recovery Satisfaction. H1d: Informational Justice has positive relationship with Service Recovery Satisfaction.
2.6 Service Recovery Satisfaction A definition of satisfaction by Maxham III & Netemeyer (2002) which stated as “customer satisfaction with particular transaction involving a failure and recovery”. This definition is broadly recognized that satisfaction is among the utmost influence of complainants’ future behavioural intentions in offline and online setting (Du, Fan, & Feng, 2010; Hocutt, Bowers, & Donavan, 2006; Kuo & Wu, 2012). Customer satisfaction has been studied extensively and often been treated as the single most important construct that determines consumers’ subsequent behaviour (Oliver, 2015). Service recovery satisfaction is different from common satisfaction because recovery satisfaction focuses on customer feelings after a service failure (Wang, Hsu, & Chih, 2014). It is a transitory and encounter-specific assessment of a service failure recovery (Boshoff, 1999; McCollough, Berry, & Yadav, 2000). Therefore, this study used Maxham III and Netemeyer (2002b) recovery satisfaction definition that stated that ‘the customer overall affective feeling about the firm as a result of the firms complaint handling’. When a service failure occurs, the service provider has to address the issue in order to maintain a good relationship with the customer (Lovelock, Patterson, & Wirtz, 2011). Previous researchers implied that recovery efforts could strengthen relationships between the customer and service provider (Smith, Bolton, & Janet, 1999). Recovery satisfaction has a positive effect on satisfaction and can alleviated back the level of dissatisfied customer (Ok, Back, & Shanklin, 2005). The level of service recovery satisfaction results from many reason despite the fact that these are altogether grounded in the customer experience of the service and also with the interaction with the service provider. The perceptions of justice are imperative antecedents of recovery satisfaction (Kohsuwan & Lawkobkit, 2013). Smith, Bolton and Janet (1999) argued that customer satisfaction with service failure/recovery encounters will be influenced by a customer’s perception of the justice dimensions. Fair service is

157
closely related to consumer satisfaction as it reflects the customers’ evaluation of the performance of service providers (Carr, 2007; Juhari, Awais Bhatti, & Kumar Piaralal, 2016). 2.7 Customer Behavioural Outcomes Customers who are treated fairly are also likely to develop future higher behavioral outcomes (Humphrey, Ellis, Conlon, & Tinsley, 2004). Justice is a set of perceptions of fairness within an examined social system (Colquitt et al., 2001). Many situations require individuals to form perceptions of justice as one compares the processes and outcomes to acceptable norms. Justice is an important concept to investigate in managerial settings because it positively affects many desirable perceptions and future behaviour outcomes and findings from past research had showed that satisfaction with recovery will lead to positive behavioural outcomes (Cengiz, ER, & Kurtaran, 2007). Service recovery is anticipated to improve consumer satisfaction and developed customer loyalty and also to limit the potential for negative WOM (Hart, Heskett, & Sasser, 1990).
Service recovery satisfaction is highly potential to bring a few advantages such as spreading positive WOM and re-purchase intention (Tax & Brown, 1998) and behavioral outcomes (repatronage intentions) (Harrison‐Walker, 2012). Turel, Yuan and Connelly (2008) mentioned that quality service has been recognized in the academic and practitioner literatures as a fundamental component of service provider performance. Effective customer service delivery and operations can enhance customer loyalty, facilitate customer trust and increase repurchase likelihood (Fornell, Johnson, Anderson, Cha, & Bryant, 1996; Reibstein, 2002; Saini & Johnson, 2005). Ho and Foon (2012) stated that quality service offered by the tertiary institutions has significant outcome on the students behavioural intentions. The intention of future visit, repurchase and referral are the outcome of service satisfaction (Bhandari, 2010). Theory of Reasoned Action (TRA) is a model to anticipate behavioral intentions (Ajzen & Fishbein, 1980; Fishbein & Ajzen, 1975). Therefore, customer behaviour outcomes such as trust, loyalty, WOM and repurchase intention are chosen as the dependent variables in this study.
2.7.1 Repurchase Intention One of the key element of outcome of service recovery satisfaction is repurchase intent (Thomas, Blattberg, & Fox, 2004). Griffin and Lowenstein (2001) indicate that a business organization has a 60 - 70 per cent of chances to make repeat selling to an active customer and only 5 - 20 per cent chances to sell to a new customer. Profitability can be increased by reducing the cost of getting new customers by patronage (Mittal & Lassar, 1998). The outcomes of service recovery satisfaction ought to increase future repurchase intention (Andreassen, 2001). In higher education, the service transpires from the service provider in terms of academic service (students records, examination, lecturers delivering lecture), students financial service and students support related activities. Although the academic program is considered as a product of the higher education institution, but the repurchase intent in the higher education context can regard of selling the academic program when the undergraduate students continue their tertiary education into higher level such as the master degree, doctorate level or professional certified program over extended period of time.
Return or repurchase intentions might differ by service type because according to the nature of the industry, high competition and fierce rivalry. At the point when customer have a plenty of choices within the product or service, switching intentions for the product or service turns out to be easier and less complicated than voicing dissatisfaction. Tax et al., (1998) contended that repurchase intentions could be affected by fundamental element such as switching costs, other alternative availability or contractual agreements. Repurchase intention is important because, it is evident that acquiring new customers may cost as much as five times than retaining existing ones which justifies that satisfying customer needs is the key to generate customer loyalty and ultimately to retain the customers (Gallo, 2014). Therefore, based on the literature above, this study proposes the following hypotheses:
H2: Service Recovery Satisfaction has positive relationship with Behavioural outcomes, where the details hypotheses are:
158
H2a: Service Recovery Satisfaction has positive relationship with Repurchase Intentions. 2.7.2 Word of Mouth Referral in the form of word of mouth has been identified as important method of spreading the words about a product or services either positive or negative. However, direct encounter such as face to face is still trustworthy information (Liu, Sudharshan, & Hamer, 2000). Lacey and Morgan (2008) defined word of mouth (WOM) refers to pass or deliver on individual suggestions to others regarding a service provider including its product or service. WOM is a casual and informal mode of communications between customers about the elements of organization's product or service (Westbrook, 1987). WOM gives information to customer about the organization or service provider which helps them to choose whether to repatronize or not (Zeithaml, Berry, & Parasuraman, 1993). WOM is seen as credible information and the customer negative WOM is the most impeding reaction to a business (Singh, 1990). Blodgett, Wakefield, and Barnes (1995) found that customer who get reasonable and fair treatment and see that justice has been done to them will probably repatronize the provider and may play a part in spreading positive WOM. WOM has been distinguished as one of the key outcomes of service recovery efforts (Choi & Choi, 2014; Maxham III, 2001; Orsingher, Valentini, & Angelis, 2010). Harrison-Walker (2001) characterized WOM as an informal, individual to individual correspondence between a non-commercial communicator and a receiver with respect to a brand, product, an organization or a service. In spite of supporting the hypotheses of this study, this research ought to add additional knowledge to enhance the understanding of perception of justice in service with the particular relation towards and WOM. WOM is the probability that an individual would positively suggest a service provider product or service after experiencing service failure and service recovery (Maxham III & Netemeyer, 2002; Sabharwal, Soch, & Kaur, 2010). Hence, it is posit that there is a positive relationship between customer service recovery satisfaction and WOM. Therefore, based on the literature above, this study proposes the following hypothesis:
H2b: Service Recovery Satisfaction has positive relationship with Word of Mouth.
2.7.3 Trust There has been a risen of consensus in social psychological field with respect to the centrality of trust to exchange, signifying the most vital variable in relationship (Ball, Coelho, & Machás, 2004). Crosby, Evans, and Cowles (1990) characterized trust as a conviction created by customer in light of a belief that the provider are dependable and would act to the great interest of the customer. In this manner, trust exist when one has certainty that their needs will be met by actions undertake by the exchange partner (Alrubaiee & Al-Nazer, 2010; Wang & Chang, 2013). Investigation in organizations studies has shown that policies and procedures are firmly related with trust (Forret & Love, 2008). Past research has asserted the significance of perceived distributive justice in produce trust (Chiu, Huang, & Yen, 2010). When the service provider shows positive interpersonal treatment, the customer may encounter positive emotions. The positive emotions may signal that all is right (Törnblom & Vermunt, 2007), giving certainty that the issue will be comprehended and a feeling of trust that the service providers will take care of them. In this study, trust is characterizes as the expectations of the customer that the service provider is dependable and will satisfy with the given promise (Sirdeshmukh, Singh, & Sabol, 2002). Currently, the development of trust in a relationship relies on upon direct physical or human interaction experiences with a service provider. These experience interaction are often missing in online context (Gao, 2005). At the point when service is effective, customer satisfaction and loyalty are gained through trust that can limit uncertainties and risks (Gao, 2005). When an online service unsuccessful, the customer trust is broken. To win back the customer, trust must be redeveloped after service recovery satisfaction. Past research has found that customers who are happy with the service recovery will probably display a more high level of trust than are the individuals who are dissatisfied (Coulter & Coulter, 2002; del Río-Lanza, Vázquez-Casielles, & Díaz-Martín, 2009; Kau & Loh, 2006; Ruyter & Wetzels, 2000; Tax et al., 1998). Trust is one of the main construct in the study of marketing and customer relationship since its

159
significance was stress out by Dwyer, Schurr, and Oh (1987). An effective service recovery can enhance customer trust, which contributed to customer intent to repurchase similar service from the service provider in the future WOM (de Matos et al., 2009; DeWitt et al., 2008; Kim, Kim, & Kim, 2009; Ranaweera & Prabhu, 2003a). Therefore, based on the literature above, this study proposes the following hypothesis:
H2c: Service Recovery Satisfaction has positive relationship with Trust. 2.7.4 Loyalty Customer loyalty is based on a commitment to a service provider and is regularly reflected as the continued patronage with the same provider. Customer loyalty is essential in long term relationship and the survival of the provider lies in its capacity to retain and attract potential customer. Loyal customers required less marketing efforts and are considered to be more profitable than the new customer (Dawkins & Reichheld, 1990). Reichheld and Sasser (1990) stated that a service provider could increase profit 100 percent just by increasing retention rate by 5 percent. Retention is believed to be a function existing customer level of satisfaction. Customer loyalty can be defined as a profoundly held responsibility to re-purchase or repatronise a favored product or service in the future, causing repetitive same-brand purchasing, despite of situational effect and advertising efforts that may cause switching behaviour (Oliver, 1999; Richard & Zhang, 2012). Past study also have recommended that customer loyalty may even be improved by an effective service recovery efforts (Haverila & Naumann, 2011). Past research in loyalty concentrated on share of market, distinguishing the customer sequence purchase, purchasing to specific brand and the likelihood of purchasing. The attraction of acquiring new customer ought to be viewed as an intermediate step, but by strengthening the relationship and turning the existing customer into loyal customer should be more emphasize. By including customers in recovery approach, it would trigger them to perceive higher recovery satisfaction and enhance their behavioural outcomes such as loyalty (Gohary, Hamzelu, & Alizadeh, 2016). Service recovery possess different element in online context. For example, disappointed customer may complaint about the service failure to the online channel (Ward & Ostrom, 2006) which can have effect on future customer behavioral outcomes (Hackman, Gundergan, Wang, & Daniel, 2006). Past literature has demonstrated that satisfaction is among the variable that contributes to customer and employee commitment (Kelley & Davis, 1994; Kelley, Hoffman, & Davis, 1993). At the point when a provider developed a good procedure of handling customer complaint, it leads towards more prominent customer loyalty (Tax & Brown, 2000). Additionally, Andreassen (1999) affirmed that satisfaction with service recovery strongly affected customer loyalty.
Therefore, based on the literature above this study proposes the following hypothesis: H2d: Service Recovery Satisfaction has a relationship with Loyalty.
2.8 Corporate Image Corporate image portray customer perception of the service provider, which comes from the customer prior involvement and ultimately contributes toward a whole image of the company (Andreassen, 2001). Managing corporate image has turned out to be important task in order to building up a successful competitive positioning strategy (Barich & Kotler, 1991; Cornelissen, 2000; Dowling, 1986). Corporate image is a perception of a company or service provider held in the customer mind and works as a channel which effects the perception of the company or service provider operation (Grönroos, 1988; Keller, 1993). As indicated by Nguyen and Leblanc (2001) corporate image is identified with the different physical and behavioral attributes of the firm, various of product/service and the impression of quality conveyed by service provider that communicating with the customer. Andreassen (2001) identified corporate image as "how the customer see a company based on past experience or impressions and how these perception create an arrangement of associations that add to a whole image of the company''. Corporate image viewed as corporate association held by the customer, might be affected by the contact actions of the service staff (Nguyen & Leblanc, 2002) and frequently these activities incorporate fair treatment to the customer as service provider attempt to positioning itself and treating

160
every one and equally and fairly (Bies & Greenberg, 2002). Consequently, a good corporate image is vital for service providers. Past research indicated that corporate image effects customer satisfaction (Andreassen & Lindestad, 1998). Service recovery is important in customer assessments of the service and the service provider (de Matos et al., 2007) and it is expected to affect corporate image. Only few study have examined corporate image within service recovery setting (Ding et al., 2015; Mostafa et al., 2015; Nefat, Benazic, & Aleric, 2012; Nikbin et al., 2010), the dynamic part of corporate image has been give emphasis to, particularly in service recovery field (Sajtos, Brodie, & Whittome, 2010). The effect of perceived justice on a few outcomes is imperative and understanding these effects alongside with the potential effect of corporate image is deem necessary (Liao, 2007; Tax et al., 1998; Vazquez-Casielles, Alvarez, & Dıaz, 2010). Empirical research that linked the relationship between satisfaction with service recovery to corporate image is inadequate and past research in service recovery is only limit in one particular setting (Nikbin et al., 2015). This research further enhance knowledge in the service recovery literature in ODL not just by recommending a relationship between both of these construct but also additionally construing a moderating role. Given the curiosity of these relationship and the prospective value in the service recovery literature, this study will further comprehend the effect of perceived justice on corporate image and constitutes one of the research contributions.Past research suggested to consider corporate image as the moderating variable in the relationship between perceived justice and recovery satisfaction (del Río-Lanza et al., 2009; Nikbin et al., 2015). This study will further enrich the literature service recovery literature and adds new knowledge to the service provider-customer relationship by considering the effect of corporate image on ODL students and their future behavioural outcomes.
Therefore, it is posited that:
H3: Corporate Image moderates the relationship between Perceived of Justice and Service Recovery Satisfaction, where the details hypotheses are: H3a: Corporate Image moderates the relationship between Distributive Justice and Service Recovery Satisfaction. H3b: Corporate Image moderates the relationship between Procedural Justice and Service Recovery Satisfaction. H3c: Corporate Image moderates the relationship between Interpersonal Justice and Service Recovery Satisfaction. H3d: Corporate Image moderates the relationship between Informational Justice and Service Recovery Satisfaction.
3 CONCLUSION Service recovery has significant effects on the sustainable of business industry including the online context (Singh & Crisafulli, 2016). However, the literature on justice dimensions and service recovery satisfaction and their influence on customer behavioural outcomes in online environment is still lacking and need further examination (Ding & Lii, 2016; Liu, 2016). This study further enhances the literature in the field of justice dimensions especially in the ODL context. This research also will also analyze the relationship of justice dimensions and service recovery satisfaction including testing the relationship of the propose model between justice dimensions, corporate image and service recovery satisfaction and finally customer behavioural outcomes (trust, word of mouth, loyalty and repurchase intentions) as the outcomes. Moreover, this study covers relevant literatures and further enrich the current literature in exploring relationship between justice dimensions, corporate image, service recovery satisfaction and behavioural outcomes in the online context and closing the gap as identified in previous research (Chang, Lai, & Hsu, 2012; Ding & Lii, 2016; Lin et al., 2011b; Singh & Crisafulli, 2016; Tate & Evermann, 2010; Tate, Furtmueller, Gao, & Gable, 2014). An insight is also into the idea of service recovery satisfaction and the behavioural outcomes through justice dimensions in Malaysian ODL environment explained.

161
REFERENCES Abbas, M. R., Abdullateef, A. O., & Mokhtar, S. S. M. (2015). Does Service Recovery Lead to
Customer Satisfaction and Loyalty in Airline Industry ? A Perceived Justice Theory Approach. World Applied Sciences Journal, 33(2), 256–262. https://doi.org/10.5829/idosi.wasj.2015.33.02.960
Abdullah, F. (2006). The development of HEdPERF: a new measuring instrument of service quality for
the higher education sector. International Journal of Consumer Studies, 30(November), 569–581. https://doi.org/10.1111/j.1470-6431.2005.00480.x
Adams, J. S. (1963). Toward an Understanding of Inequity. Journal of Abnormal and Social
Psychology, 67(5), 422–436. https://doi.org/10.1037/h0040968 Adams, J. S. (1965). Inequity in Social Exchange. In L. Berkowitz (Ed.), Advances in experimental
social psychology (pp. 267–299). New York: Academic Press. Ahmad, H. (2014). An Overview of the Malaysian Higher Education Issues and Challenges. Malaysian
Online Journal of Education Management, 2(1), 10–19. Ajzen, I., & Fishbein, M. A. (1980). Understanding attitudes and predicting social behaviour. (E. Cliffs,
Ed.). NJ: Prentice-Hall. Alrubaiee, L., & Al-Nazer, N. (2010). Investigate the impact of relationship marketing orientation on
customer loyalty: The customer’s perspective. International Journal of Marketing Studies, 2(1), 155–174.
Anagnostopoulou, E., Mavroidis, I., Giossos, Y., & Koutsouba, M. (2015). Student satisfaction in the
context of a postgraduate programme of the Hellenic Open University. Turkish Online Journal of Distance Education, 16(2), 40–55.
Anderson, E. W., & Fornell, C. (1994). Customer satisfaction research prospectus. In Ronald T. Rust
& Richard L. Oliver (Eds.). In Service quality: New directions in theory and practice (pp. 241–268). California: Sage Publications.
Andreassen, T. W. (1999). What drives customer loyalty with complaint resolution? Journal of Service
Research, 1(4), 324–32. Andreassen, T. W. (2001). From Disgust to Delight: Do Customers Hold a Grudge? Journal of Service
Research, 4(1), 39–49. https://doi.org/10.1177/109467050141004 Andreassen, T. W. (2001). From disgust to delight. Do customers hold a grudge? Journal of Service
Research, 4(1), 2001. Andreassen, T. W., & Lindestad, B. (1998). Customer Loyalty and Complex Services—The Impact of
Corporate Image on Quality, Customer Satisfaction and Loyalty for Customers with Varying Degrees of Service Expertise. International Journal of Service Industry Management, 9(1), 7–23.
Antwerpen, S. van. (2015). The quality of teaching and learning of BCom honours degree students at
an open distance learning university in South Africa. Africa Education Review, 12(4), 680–695. https://doi.org/10.1080/18146627.2015.1112159
Baker, T., & Meyer, T. (2014). Explanation information and source in service recovery initiatives.
Journal of Services Marketing, 28(4), 311–318. https://doi.org/10.1108/JSM-12-2012-0249 Ball, D., Coelho, P. S., & Machás, A. (2004). The role of communication and trust in explaining
customer loyalty: An extension to the ECSI model. European Journal of Marketing, 38(9/10), 1272–1293.
Bambauer-Sachse, S., & Rabeson, L. E. (2015). Service recovery for moderate and high involvement

162
services. Journal of Services Marketing, 29(5), 331–343. https://doi.org/10.1108/JSM-05-2014-0155
Barakat, L. L., Ramsey, J. R., Lorenz, M. P., & Gosling, M. (2015). Severe service failure recovery
revisited: Evidence of its determinants in an emerging market context. International Journal of Research in Marketing, 32(1), 113–116. https://doi.org/10.1016/j.ijresmar.2014.10.001
Barich, H., & Kotler, P. (1991). A Framework for Marketing Image Management. Sloan Management
Review, 32(2), 94–104. Berry, C. R. ., & Parasuraman, A. . (1991). Marketing Services: Competing Through Quality. New
York, NY: New York Press. Bhandari, M. S. (2010). Impact of Varying Service Recovery Attributes on Outcomes in Process-
Based and Outcome-Based Service Failure: An Empirical Examination. Victoria University. Bies, R., & Greenberg, J. (2002). Justice, Culture, Corporate Image: The Swoosh, the Sweatshops,
and the Sway of Public Opinion. In M. J. Grannon & K. L. Newman (Eds.), The Blackwell Handbook of Cross-Cultural Management (pp. 320–333). Oxford: Blackwell.
Bitner, M. J. (1990). Evaluating Service Encounters: The Effects of Physical Surroundings and
Employee Responses. Journal of Marketing, 54(2), 69–82. Blodgett, J. G., Wakefield, K. L., & Barnes, J. H. (1995). The effects of customer service on consumer
complaining behavior. Journal of Services Marketing, 9(4), 31–42. https://doi.org/10.1108/08876049510094487
Boshoff, C. (1999). Recovsat: An Instrument to Measure Satisfaction with Transaction-Specific Service Recovery. Journal of Service Research, 1(3), 236–249. https://doi.org/10.1177/109467059913005
Cambra-Fierro, J., Melero-Polo, I., & Sese, J. (2015). Does the nature of the relationship really
matter? An analysis of the roles of loyalty and involvement in service recovery processes. Service Business, 9, 297–320. https://doi.org/10.1007/s11628-013-0228-4
Cambra Fierro, J., Melero Polo, I., & Sesé Oliván, F. J. (2014). From dissatisfied customers to
evangelists of the firm: A study of the Spanish mobile service sector. BRQ Business Research Quarterly, 17(3), 191–204. https://doi.org/10.1016/j.cede.2013.10.001
Carr, C. L. (2007). The FAIRSERV Model : Consumer Reactions to Services Based on a
Multidimensional Evaluation of Service Fairness. Decision Sciences, 38(1), 107–130. https://doi.org/10.1111/j.1540-5915.2007.00150.x
Cengiz, E., ER, B., & Kurtaran, A. (2007). THE EFFECTS OF FAILURE RECOVERY STRATEGIES
ON CUSTOMER BEHAVIOURS VIA COMPLAINANTS ’ PERCEPTIONS OF JUSTICE DIMENSIONS IN BANKS Department of Finance , Turkey. Banks and Bank System, 2(3), 174–188.
Chahal, H., & Devi, P. (2013). Identifying Satisfied/Dissatisfied Service Encounters in Higher
Education. Quality Assurance in Education: An International Perspective, 21(2), 211–222. https://doi.org/10.1108/09684881311310728
Chang, H. H., Lai, M. K., & Hsu, C. H. (2012). Recovery of online service: Perceived justice and
transaction frequency. Computers in Human Behavior, 28(6), 2199–2208. https://doi.org/10.1016/j.chb.2012.06.027
Cheng, V. T. P., & Loi, M. K. (2014). Handling Negative Online Customer Reviews: The Effects of
Elaboration Likelihood Model and Distributive Justice. Journal of Travel & Tourism Marketing, 31(1), 1–15. https://doi.org/10.1080/10548408.2014.861694
Chiu, C.-M., Huang, H.-Y., & Yen, C.-H. (2010). Antecedents of trust in online auctions. Electronic

163
Commerce Research and Applications, 9(2), 148–159. Choi, B., & Choi, B.-J. (2014). The effects of perceived service recovery justice on customer affection,
loyalty, and word-of-mouth. European Journal of Marketing, 48(1), 108–131. https://doi.org/10.1108/EJM-06-2011-0299
Colquitt, J. A. (2001a). On the dimensionality of organizational justice: a construct validation of a
measure. Journal of Applied Psychology, 86(3), 386–400. https://doi.org/10.1037/0021-9010.86.3.386
Colquitt, J. A., Conlon, D. E., Wesson, M. J., Porter, C. O. L. H., & Ng, K. Y. (2001). Justice at the
millenium: A meta-analytic review of 25 years of organizational justice research. Journal of Applied Psychology, 86(3), 425–445. https://doi.org/10.1037//0021-9010.86.3.425
Cooper, P. (2007). Knowing your “Lemons”: Quality Uncertainty in UK Higher Education. Quality in
Higher Education, 13(1), 19–29. https://doi.org/10.1080/13538320701272698 Cornelissen, J. (2000). Corporate Communications: A Guide to Theory and Practice. London: Sage. Coulter, K. S., & Coulter, R. A. (2002). Determinants of trust in a service provider: The moderating
role of length of relationship. Journal of Service Marketing, 16(1), 35–50. Crosby, L. A., Evans, K. R., & Cowles, D. (1990). Relationship quality in services selling: An
interpersonal influence perspective. Journal of Marketing, 54(3), 68–81. Dawkins, P., & Reichheld, F. (1990). Customer retention as a competitive weapon. Directors and
Boards, 14, 41–47. de Matos, C. A., Rossi, C. A. V., Veiga, R. T., & Vieira, V. A. (2009). Consumer reaction to service
failure and recovery: the moderating role of attitude toward complaining. Journal of Services Marketing, 23(7), 462–475.
de Matos, C. A. de, Henrique, J. L., & Rossi, C. A. V. (2007). Service Recovery Paradox: A Meta-
Analysis. Journal of Service Research, 10(1), 60–77. del Río-Lanza, A. B., Vázquez-Casielles, R., & Díaz-Martín, A. M. (2009). Satisfaction with service
recovery: Perceived justice and emotional responses. Journal of Business Research, 62(8), 775–781. https://doi.org/10.1016/j.jbusres.2008.09.015
DeWitt, T., Nguyen, D., & Marshall, R. (2008). Exploring customer loyalty following service recovery.
Journal of Service Research, 10, 269–281. Ding, M.-C., Ho, C.-W., & Lii, Y.-S. (2015). Is corporate reputation a double-edged sword? Relative
effects of perceived justice in airline service recovery. International Journal of Economics and Business Research, 10(1), 1–17. https://doi.org/10.1504/IJEBR.2015.070266
Ding, M. C., & Lii, Y. S. (2016). Handling online service recovery: Effects of perceived justice on
online games. Telematics and Informatics, 33(4), 881–895. https://doi.org/10.1016/j.tele.2016.02.001
Dowling, R. G. (1986). Managing Your Corporate Images. Industrial Marketing Management, 15(2),
109–115. Du, J., Fan, X., & Feng, T. (2010). An experimental investigation of the role of face in service failure
and recovery encounters. Journal of Consumer Marketing, 27(7), 584–593. Dwyer, F. R., Schurr, P. H., & Oh, S. (1987). Developing buyer-seller relationships. Journal of
Marketing, 51(2), 11–27.

164
Fishbein, M. A., & Ajzen, I. (1975). Belief, attitude, intention, and behavior: an introduction to theory
and research. MA: Addison-Wesley. Fornell, C., Johnson, M. D., Anderson, E. W., Cha, J., & Bryant, B. E. (1996). The American customer
satisfaction index: Nature, purpose, and findings. Journal of Marketing, 60(7), 7–18. Forret, M., & Love, M. S. (2008). Employee justice perceptions and coworker relationships.
Leadership & Organization Development Journal, 29(3), 248–260. Gallo, A. (2014). The Value of Keeping the Right Customers. Harvard Business Review, October. Gao, Y. (2005). Factors influencing user trust in online games. The Electronic Library, 23(5), 533–538. Gohary, A., Hamzelu, B., & Alizadeh, H. (2016). Please explain why it happened! How perceived
justice and customer involvement affect post co-recovery evaluations: A study of Iranian online shoppers. Journal of Retailing and Consumer Services, 31, 127–142. https://doi.org/10.1016/j.jretconser.2016.03.013
Greenberg, J. (1993). The Social Side of Fairness: Interpersonal and Informational Classes of
Organisational Justice. Justice in the Workplace: Approaching Fairness in Human Resource Management, (4), 79–103.
Greenberg, J. (1994). Using socially fair treatment to promote acceptance of a work site smoking ban.
Journal of Applied Psychology, 79(2), 288–297. Greenberg, J. (2004). Stress Fairness to Fare No Stress: Organizational Dynamics, 33(4), 352–365.
https://doi.org/10.1016/j.orgdyn.2004.09.003 Greenberg, J. (2009). Promote procedural and interactional justice to enhance individual and
organizational outcomes. (L. E. A., Ed.) (2nd ed.). Hoboken, NJ: Wiley. Griffin, J., & Lowenstein, M. W. (2001). Customer Winback: How to Recapture Lost Customers--And
Keep Them Loyal. Wiley. Gronroos, C. (1984). A Service Quality Model and Its Marketing Implications. European Journal of
Marketing, 18(4), 36–44. Gronroos, C. (1990). Relationship approach to marketing in service contexts: The marketing and
organizational behavior interface. Journal of Business Research, 20(1), 3–11. https://doi.org/10.1016/0148-2963(90)90037-E
Grönroos, C. (1988). Service quality: The six criteria of good perceived service quality. Review of
Business, 9((Winter)), 10–13. Ha, J., & Jang, S. (S ). (2009). Perceived justice in service recovery and behavioral intentions: The
role of relationship quality. International Journal of Hospitality Management, 28(3), 319–327. https://doi.org/10.1016/j.ijhm.2008.12.001
Hackman, D., Gundergan, S. P., Wang, P., & Daniel, K. (2006). A service perspective on modelling
intentions of online purchasing. Journal of Services Marketing, 20(7), 459–470. Hanaysha, J., Abdullah, H. H., & Warokka, A. (2011). Service quality and students satisfaction at
higher learning institutions: the competing dimensions of Malaysian universities competitiveness. Journal of Southeast Asian Research, 2011, 1–10.
Harrison‐Walker, L. J. (2012). The role of cause and affect in service failure. Journal of Services
Marketing, 26(2), 115–123. Hart, C., Heskett, J. L., & Sasser, W. E. J. (1990). The Profitable Art of Service Recovery. Harvard
Business Review, July/Augus, 148–56.

165
Haverila, M., & Naumann, E. (2011). Customer complaint behavior and satisfaction in a B2b context:
A longitudinal analysis. Journal of Services Research, 10(2), 45–62. Hill, F. M. (1995). Managing service quality in higher education: the role of thestudent as primary
consumer. Quality Assurance in Education, 3(3), 10–21. https://doi.org/10.1108/09684889510093497
Ho, J. S. Y., & Foon, Y. S. (2012). Internationalizing Higher Education: The Effect of Country-of-Origin
on the Evaluation of Service Quality. Communications of the IBIMA, 2012, 1–11. https://doi.org/10.5171/2012.123629
Hocutt, M. A., Bowers, M. R., & Donavan, D. T. (2006). The art of service recovery: fact or fiction?
Journal of Services Marketing, 20(3), 199–207. https://doi.org/10.1108/08876040610665652 Humphrey, S. E., Ellis, A. P. J., Conlon, D. E., & Tinsley, C. H. (2004). Understanding customer
reactions to brokered ultimatums: Applying negotiation and justice theory. Journal of Applied Psychology, 89(3), 466–482.
Hutchinsona, J., Lai, F., & Wang, Y. (2009). Understanding the relationships of quality, value, equity, satisfaction, and behavioral intentions among golf travelers. Tourism Management, 30(2), 298–308.
Joireman, J., Gregoire, Y., Devezer, B., & Tripp, T. (2013). When do customers offer a second chance
following a double deviation? The impact of inferred firm motives on customer revenge and reconciliation. Journal of Retailing, 89(3), 315–337.
Juhari, A. S., Awais Bhatti, M., & Kumar Piaralal, S. (2016). Service Quality and Customer Loyalty in
Malaysian Islamic Insurance Sector Exploring the mediating effects of Customer Satisfaction. International Journal of Academic Research in Business and Social Sciences, 6(3), 17–36. https://doi.org/10.6007/IJARBSS/v6-i3/2030
Karatepe, O. M. (2006). Customer complaints and organizational responses: The effects of
complainants’ perceptions of justice on satisfaction and loyalty. International Journal of Hospitality Management, 25(1), 69–90. https://doi.org/10.1016/j.ijhm.2004.12.008
Kassim, N. M., & Souiden, N. (2007). Customer retention measurement in the UAE banking sector.
Journal of Financial Services Marketing, 11(3), 217–228. Kau, A., & Loh, W. Y. E. (2006). The effects of service recovery on consumer satisfaction: a
comparison between complainants and non‐complainants. Journal of Services Marketing, 20(2), 101–111. https://doi.org/10.1108/08876040610657039
Keller, K. L. (1993). Conceptualizing, measuring, and managing customer based brand equity.
Journal of Marketing, 57(1), 1–22. Kelley, S. W., & Davis, M. A. (1994). Antecedents to customer expectations for service recovery.
Journal of the Academy of Marketing Science, 22(1), 52–61. Kelley, S. W., Hoffman, K. D., & Davis, M. A. (1993). A typology of retail failures and recovery. Journal
of Retailing, 69(4), 429–452. Kim, T., Kim, W. G., & Kim, H.-B. (2009). The effects of perceived justice on recovery satisfaction,
trust, word-of-mouth, and revisit intention in upscale hotels. Tourism Management, 30(1), 51–62. Kim, Y. ., & Smith, A. K. (2005). Crime and punishment: examining customers’ responses to service
organisations’ penalties. Journal of Service Research, 8(2), 162–180. Kohsuwan, P., & Lawkobkit, M. (2013). Focal determinants of service fairness and service recovery
satisfaction in cloud computing. AU-GSB E-Journal, 6(1), 12–20. Komunda, M., & Osarenkhoe, A. (2012). Remedy or cure for service failure?: Effects of service

166
recovery on customer satisfaction and loyalty. Business Process Management Journal, 18(1), 82–103. https://doi.org/10.1108/14637151211215028
Krishna, A., Dangayach, G. S., & Jain, R. (2011). Service Recovery: Literature Review and Research
Issues. Journal of Service Science Research, 3(1), 71–121. https://doi.org/10.1007/s12927-011-0004-8
Kumar Piaralal, N., Kumar Piaralal, S., & Awais Bhatti, M. (2014). Antecedent and Outcomes of
Satisfaction with Service Recovery: A Study among Mobile Phone Users in Central Region of Malaysia. Asian Social Science, 10(12), 210–221. https://doi.org/10.5539/ass.v10n12p210
Kuo, Y.-F., & Wu, C.-M. (2012). Satisfaction and post-purchase intentions with service recovery of
online shopping websites: perspectives on perceived justice and emotions. International Journal of Information Management, 32(2), 127–138.
Lacey, R., & Morgan, R. M. (2008). Customer advocacy and the impact of B2B loyalty programs.
Journal of Business & Industrial Marketing, 24(1), 3–13. Lewis, B. R., & Spyrakopoulos, S. (2001). Service Failures and Recovery in Retail Banking: The
Customers Perspective. The International Journal of Bank Marketing, 19(1), 37–47. Liao, H. (2007). Do It Right This Time: The Role of Employee Service Recovery Performance in
Customer-Perceived Justice and Customer Loyalty After Service Failures. Journal of Applied Psychology, 92(2), 475–489.
Lin, H.-H., Wang, Y.-S., & Chang, L.-K. (2011). Consumer responses to online retailer’s service
recovery after a service failure: A perspective of justice theory. Managing Service Quality, 21(5), 511–534. https://doi.org/10.1108/09604521111159807
Liu, B. S.-C., Sudharshan, D., & Hamer, L. O. (2000). After-service response in service quality
assessment: a real-time updating model approach. Journal of Services Marketing, 14(2), 160–177. https://doi.org/10.1108/08876040010321000
Liu, C.-C. (2016). Understanding player behavior in online games: The role of gender. Technological
Forecasting and Social Change, 111, 265–274. https://doi.org/10.1016/j.techfore.2016.07.018 Lopes, E. L., & da Silva, M. A. (2015). The effect of justice in the history of loyalty: A study in failure
recovery in the retail context. Journal of Retailing and Consumer Services, 24, 110–120. https://doi.org/10.1016/j.jretconser.2015.03.003
Lovelock, C. H., Patterson, P. G., & Wirtz, J. (2011). Services marketing : an Asia-Pacific and
Australian perspective (5th ed.). Sydney: Prentice-Hall/Pearson Education. Mansori, S., Tyng, G. G., & Ismail, Z. M. (2014). Service Recovery , Satisfaction and Customers ’ Post
Service Behavior in the Malaysian Banking Sector. Management Dynamics in the Knowledge Economy, 2(1), 5–20.
Martinez-Tur, V., Peiro, J. M., Ramos, J., & Moliner, C. (2006). Justice perceptions as predictors of
customer satisfaction: The impact of distributive, procedural, and interactional justice. Journal of Applied Social Psychology, 36(1), 100–119. https://doi.org/10.1111/j.0021-9029.2006.00005.x
Mattila, A. S. (2001). The effectiveness of service recovery in a multi-industry setting. Journal of
Services Marketing, 15(7), 583–596. https://doi.org/10.1108/08876040110407509 Maxham III, J. G. (2001). Service recovery’s influence on consumer satisfaction, positive word-of-
mouth, and purchase intentions. Journal of Business Research, 54(1), 11–24. https://doi.org/10.1016/S0148-2963(00)00114-4
Maxham III, J. G., & Netemeyer, R. G. (2002). Modeling customer perceptions of complaint handling
over time: The effects of perceived justice on satisfaction and intent. Journal of Retailing, 78(4),

167
239–252. McCollough, M. a., Berry, L. L., & Yadav, M. S. (2000). An Empirical Investigation of Customer
Satisfaction after Service Failure and Recovery. Journal of Service Research, 3(2), 121–137. https://doi.org/10.1177/109467050032002
Mittal, B., & Lassar, W. M. (1998). Why do customers switch? The dynamics of satisfaction versus
loyalty. Journal of Services Marketing, 12(3), 177–194. https://doi.org/10.1108/08876049810219502
Mostafa, R. B., Lages, C. R., Shabbir, H. A., & Thwaites, D. (2015). Corporate Image: A Service
Recovery Perspective. Journal of Service Research, 18(4), 468–483. https://doi.org/10.1177/1094670515584146
Nefat, A., Benazic, D., & Aleric, D. (2012). Antecedents and Outcomes of Service Recovery
Satisfaction in Telecommunications in Croatia along with the Role of Image and Perceived Switching Costs. Economic Research, 25(4), 1051–1066. https://doi.org/10.1080/1331677X.2012.11517547
Nguyen, N., & Leblanc, G. (1998). Indicators of the Corporate Image in the Service Sector: A Survey
of New Clients of a Life Insurance Company. Canadian Journal of Administrative Sciences—Revue Canadienne Des Sciences De L Administration, 15(2), 128–141.
Nguyen, N., & Leblanc, G. (2001). Corporate image and corporate reputation in customers’ retention
decisions in services. Journal of Retailing and Consumer Services, 8(4), 227–236. Nguyen, N., & Leblanc, G. (2002). Contact Personnel, Physical Environment and the Perceived
Corporate Image of Intangible Services by New Clients. International Journal of Service Industry Management, 13(3/4), 242–262.
Nikbin, D., Ismail, I., & Marimuthu, M. (2013). The relationship between informational justice, recovery
satisfaction, and loyalty: The moderating role of failure attributions. Service Business, 7(3), 419–435. https://doi.org/10.1007/s11628-012-0169-3
Nikbin, D., Ismail, I., Marimuthu, M., & Abu-Jarad, I. Y. (2011). The impact of firm reputation on
customers’ responses to service failure: the role of failure attributions. Business Strategy Series, 12(1), 19–29. https://doi.org/10.1108/17515631111106849
Nikbin, D., Ismail, I., Marimuthu, M., & Jalalkamali, M. (2010). Perceived Justice in Service Recovery
and Recovery Satisfaction: The Moderating Role of Corporate Image. International Journal of Marketing Studies, 2(2), 47–52. https://doi.org/10.5539/ijms.v2n2p47
Nikbin, D., Marimuthu, M., Hyun, S. S., & Ismail, I. (2015). Relationships of Perceived Justice to
Service Recovery, Service Failure Attributions, Recovery Satisfaction, and Loyalty in the Context of Airline Travelers. Asia Pacific Journal of Tourism Research, 20(3), 239–262. https://doi.org/10.1080/10941665.2014.889028
Noor, K. M., Khalil, M. A. K. M., & Latif, L. A. (2016). Harnessing The Power of Service Quality to
Attracy and Retain Students: An OUM Experience. In Presented in 8th Pan-Commonwealth Forum on Open Learning ( PCF8 ) 27 - 30 November 2016 (pp. 1–15).
Ok, C., Back, K. J., & Shanklin, C. W. (2005). Modeling Roles of Service Recovery Strategy: A
Relationship-Focused View. Journal of Hospitality & Tourism Research, 29(4), 484–507. https://doi.org/10.1177/1096348005276935
Oliver, R. L. (1999). Whence consumer loyalty? Journal of Marketing, 63(Special issue), 33–44. Oliver, R. L. (2015). Satisfaction: A Behavioral Perspective on Consumer (Second Edi). New York,
NY: Routledge.

168
Orsingher, C., Valentini, S., & Angelis, M. de. (2010). A meta-analysis of satisfaction with complaint
handling in services. Journal of Academy of Marketing Science, 38(2), 169–186. Ranaweera, C., & Prabhu, J. (2003). The influence of satisfaction, trust and switching barriers on
customer retention in a continuous purchasing setting. International Journal of Service Industry Management, 14(4), 374–395.
Rashid, M. H. A., Ahmad, F. S., & Othman, A. K. (2014). Does Service Recovery Affect Customer
Satisfaction? A Study on Co-Created Retail Industry. Procedia - Social and Behavioral Sciences, 130, 455–460. https://doi.org/10.1016/j.sbspro.2014.04.053
Reibstein, D. J. (2002). What attracts customers to online stores, and what keeps them coming back?
Journal of the Academy of Marketing Science, 30(4), 465–473. Reichheld, F. F., & Sasser, J. W. E. (1990). Zero defects: Quality comes to services. Harvard
Business Review, 68, 105–111. Richard, J. E., & Zhang, A. (2012). Corporate image, loyalty, and commitment in the consumer travel
industry. Journal of Marketing Management, 28(5–6), 568–593. https://doi.org/10.1080/0267257X.2010.549195
Ro, H. (2014). Complaint, patience, and neglect: Responses to a dissatisfying service experience.
Service Business, 8(2), 197–216. https://doi.org/10.1007/s11628-013-0193-y Ruyter, K. de, & Wetzels, M. (2000). Customer equity considerations in service recovery: a cross-
industry perspective. International Journal of Service Industry Management, 11(1), 91–108. https://doi.org/10.1108/09564239810199923
Sabharwal, N., Soch, H., & Kaur, H. (2010). A Scale Development Approach for Service. Journal of
Services Management, 10(1), 125–142. Saif, N. I. (2014). The Effect of Service Quality on Student Satisfaction: A Field Study for Health
Services Administration Students. International Journal of Humanities and Social Sciences, 4(8), 172–181.
Saini, A., & Johnson, J. L. (2005). Organizational capabilities in e-commerce: An empirical
investigation of e-brokerage service providers. Journal of the Academy of Marketing Science, 33(3), 360–375.
Sajtos, L., Brodie, R. J., & Whittome, J. (2010). Impact of Service Failure: The Protective Layer of
Customer Relationships. Journal of Service Research, 13(2), 216–229. Santhi, R. (2009). Malaysian Workforce And Open & Distance Education: Deterrents Affecting Needs
To Participate. In The Asian Conference on Education 2009, Osaka, Japan. Osaka, Japan. Santhi, R., & Ganesh, R. (2015). Addressing service quality to increase students satisfaction and
retention in Malaysian private Higher Education Institutions. American Journal of Economics, 5(2), 243–250. https://doi.org/10.5923/c.economics.201501.31
Sheth, J. N., Sisodia, R. S., & Sharma, A. (2000). The Antecdents and Consequences of Customer
Centric Marketing. Journal of the Academy of Marketing Science, 28(1), 55–66. Sindhav, B., Holland, J., Rodie, A. R., Adidam, P. T., & Pol, L. G. (2006). The Impact of Perceived
Fairness on Satisfaction: Are Airport Security Measures Fair? Does It Matter? Journal of Marketing Theory and Practice, 14(4), 323–335.
Singh, J. (1990). Voice, exit, and negative word-of-mouth behaviors: An investigation across three
service categories. Journal of the Academy of Marketing Science, 18(1), 1–15.

169
Singh, J., & Crisafulli, B. (2015). Customer Response to Service failure and Recovery Experiences. In
Boundary Spanning Elements and the Marketing Function in Organizations: Concepts and Empirical Studies (pp. 117–35). Springer International Pubishing Switzerland. https://doi.org/10.1007/978-3-319-13440-6
Singh, J., & Crisafulli, B. (2016). Managing online service recovery: procedures, justice and customer
satisfaction. Journal of Service Theory and Practice, 26(6), 1–37. https://doi.org/10.1108/09574090910954864
Sirdeshmukh, D., Singh, J., & Sabol, B. (2002). Consumer trust, value, and loyalty in relational
exchanges. Journal of Marketing, 66(1), 15–37. Smith, A. K., Bolton, R. N., & Janet, W. (1999). A model of customer satisfaction with service
encounters involving failure and recovery. Journal of Marketing Research, 36(3), 356–372. Swanson, S. R., & Davis, J. C. (2000). A VIEW FROM THE AISLE : CLASSROOM SUCCESSES ,
FAILURES AND RECOVERY STRATEGIES. Marketing Education Review, 10(2), 17–25. Tate, M., & Evermann, J. (2010). The End of ServQual in Online Services Research: Where to from
here? E-Service Journal, 7(1), 60–85. https://doi.org/10.2979/ESJ.2010.7.1.60 Tate, M., Furtmueller, E., Gao, H., & Gable, G. (2014). Reconceptualizing Digital Service Quality: A
Call-To-Action and Research Approach. Pacific-Asia Conference on Information Systems (PACIS).
Tax, S. S., & Brown, S. W. (1998). Recovering and learning from service failure. Sloan Management
Review, 78–88. Tax, S. S., & Brown, S. W. (2000). Service recovery: research insights and practices. In T. A. Swartz
& D. Iacobucci (Eds.), Handbook of Services Marketing and Management (pp. 271–285). Thousand Oaks, CA,: Sage Publications.
Tax, S. S., Brown, S. W., & Chandrashekaran, M. (1998). Customer evaluations of service complaint
experiences: implications for relationship marketing. The Journal of Marketing, 62(2), 60–76. https://doi.org/10.2307/1252161
Thibaut, J. W., & Walker, L. (1975). Procedural Justice: A Psychological analysis (Wiley). Hoboken,
NJ. Thibaut, J. W., & Walker, L. (1978). A Theory of Procedure. California Law Review, 66(3), 541.
https://doi.org/10.2307/3480099 Thomas, J. S., Blattberg, R. C., & Fox, E. J. (2004). Recapturing Lost Customers. Journal of
Marketing Research, 41(1), 31–45. https://doi.org/10.1509/jmkr.41.1.31.25086 Timming, A. R. (2012). Tracing the effects of employee involvement and participation on trust in
managers: an analysis of covariance structures. The International Journal of Human Resource Management, 23(15), 3243–3257. https://doi.org/10.1080/09585192.2011.637058
Törnblom, K., & Vermunt, R. (2007). Distributive and Procedural justice: Research and Social
Applications. Aldershot, England: Routledge. Turel, O., Yuan, Y., & Connelly, C. E. (2008). In Justice We Trust: Predicting User Acceptance of E-
Customer Services. Journal of Management Information Systems, 24(4), 123–151. https://doi.org/10.2753/MIS0742-1222240405
Valarie, A. Z., Bitner, M. J., & Grembler, D. D. (2009). Services Marketing: Integrating Customer
Focus Across the Firm (Fifth Edit). McGraw Hill. Vazquez-Casielles, R., Alvarez, L. S., & Dıaz, A. M. M. (2010). Perceived Justice of Service Recovery

170
Strategies: Impact on Customer Satisfaction and Quality Relationship. Psychology & Marketing, 27(5), 487–509.
Voss. R., Gruber, T. Reppel, A. E. (2010). Which classroom service encounters make students happy
or unhappy ? Insights from an online CIT study. International Journal of Educational Management, 24(7), 615–636.
Voss, R. (2009). Studying critical classroom encounter: The experiences of students in German
college education. Quality Assurance in Education, 17(2), 156–173. Wang, E. S.-T., & Chang, S.-Y. (2013). Creating Positive Word-of-Mouth Promotion Through Service
Recovery Strategies. Services Marketing Quarterly, 34(2), 103–114. https://doi.org/10.1080/15332969.2013.770661
Wang, K.-Y., Hsu, L.-C., & Chih, W.-H. (2014). Retaining customers after service failure recoveries: a
contingency model. Managing Service Quality, 24(4), 318–338. https://doi.org/10.1108/MSQ-11-2013-0251
Ward, J. C., & Ostrom, A. L. (2006). Complaining to the Masses: The Role of Protest Framing in
Customer-Created Complaint Web Sites. Journal of Consumer Research, 33(2), 220–230. Westbrook, R. A. (1987). Product/Consumption-based Affective Responses and Post-purchase
Processes. Journal of Marketing, 24(3), 258–270. Wirtz, J., & McColl-Kennedy, J. R. (2010). Opportunistic customer claiming during service recovery.
Journal of the Academy of Marketing Science, 38(5), 654–675. https://doi.org/10.1007/s11747-009-0177-6
Zeithaml, V. A., Berry, L. L., & Parasuraman, A. (1993). The Nature and Determinants of Customer
Expectations of Service. Journal of the Academy of Marketing Science, 21(1), 1–12.

171
EXPLORING THE EFFECTIVENESS OF ACCOUNTING PRACTICUM IN UNIVERTAS TERBUKA
Ali Muktiyanto 1), Rini Dwiyani Hadiwidjaja 2), Noorina Hartati 3), Irma 4)
Accounting Department, Universitas Terbuka (INDONESIA)
Abstract
Accounting Study Program at Faculty of Economics Universitas Terbuka has several practical courses. Practical courses are mandatory and must be taken by every accounting student. There are two Accounting Practicum Services applied in Accounting Study Program there are Face-to-face Practice (FFP) and Online Practice (OP). The problems that often arise in the management of accounting practicum especially in FFP such as socialization of guidelines and guidance of practice that has not been optimal, facilities and infrastructure is not adequate yet, the instructor has not complied with the guidelines and has not met the qualification standard. This indicates that FFP has not run effectively in accordance with the management function. Therefore, this research tries to analyze the effectiveness of FFP management by the regional office (UPBJJ UT) through management functions which include Planning, Organizing, Actuating and Controlling aspects. The research proves that the effectiveness of the implementation of the management functions which are Planning, Organizing, Actuating and Controlling of FFP has been going well. Planning functions of FFP that should be improved is planning before the implementation of the FFP, the effectiveness of information and communication between the organizers of FFP and instructors, students and group unit and availability of FFP. Organizing functions of FFP that must be improved is the form of FFP organization with the main duty and function, the availability of the person responsible for FFP and the special staff of the FFP. Actuating functions of FFP that must be considered is the availability of break room for instructors, a place of prayer and a toilet. More important is the availability of FFP materials consisting of case manuscripts and workbooks. Controlling functions of FFP that to be improved are in terms of acceptance of complaints and handling, career development of instructors and awards for outstanding instructors. Keywords: practicum, accounting, planning, organization, actuating, controlling
1. BACKGROUND The university is an organization requires leadership or leadership and good management. Universities that do not have the leadership and management would be fatal, because it will experience powerlessness in producing quality human resources (Abbas, 2008). Curriculum of S1 Accounting Study Program contains the practicum course that support the achievement of the competencies of graduates and provide flexibility to students to deepen expertise in the field of Accounting. The practicum course has a practicum activity called Face to Face Practicum (FFP). FFP is designed in case study, problem solving, and group discussion. FFP is held for 8 (eight) meetings in 1 (one) semester in each city of regional office. Implementation of FFP refers to the Guidance and Guidelines of Practicum Accounting Study Program. The implementation scenario of FFP in Regional Office is 8 (eight) meetings, the students are given a comprehensive case to be completed and done on the prepared work paper by the instructor with time 120 minutes (2 hours). Based on observations of researchers, concerns or complaints that often arise in the management of FFP include lack of information on guidelines and guidance FFP, facilities and infrastructure FFP still inadequate, the lab that conducted the instructor is not in accordance with the guidelines FFP and human resources (HR) or instructor FFP has not met the qualification standards. In addition to complaints above, during the time in Accounting Study Program has never been reviewing the effectiveness of management Laboratory Course Introduction to Accounting (EKSI4101) and Laboratory Auditing (EKSI4414) as improving the quality of academic and administrative services. Based on the results of these observations, UT and Accounting Department in particular strive to always

172
improve the management of FFP by exploring the elements of what needs to be upgraded or repaired. Management is often synonymous with management. Management is the process of function - management functions that include aspects of planning, organizing, implementing, and monitoring. This study aims to analyze the extent of the effectiveness of the management of FFP by Regional Offices with through management functions that include aspects of planning, organizing, implementing, and monitoring. 2. LITERATURE REVIEW
2.1. Management of Higher Education University as an institution or organization that requires the application of management in carrying out its activities. Management is the utilization process of all resources in order to achieve the goals setting. General management functions in the management of the university consists of planning, organization, mobilization (actuating) and supervision (controlling) (Abbas, 2008). Nurhadi (1983: 5) to formulate the definition of management or administration of education as follows: "The administration of education is an activity or series of activities such as joint business management process group of people who are members of the educational organization to achieve a predetermined level, in order to effectively and efficiently ". According Sudjud (1987: 4) put forward the notion of management or administration of education as follows: "Administration of education or educational management is the process of planning, organizing, and assessing the utilization of the human component, information, technology, infrastructure, finance, organizational structure, and the environment the education system in order to achieve the educational goals effectively and efficiently, based on the values and principles of education. The scope of management education by function or sequence of events: (1) planning, (2) organizing, (3) directing (actuating), coordinating, communicating, and supervising or evaluating. , (4) coordinating, (5) communicating, and (6) to supervising or evaluating. Here is an overview scope of management education. It can be concluded that the management of FFP in Regional Offices included in the management of educational facilities with the sequence of activities of planning, organizing, directing (actuating), coordinating, communicating, and supervising or evaluating. 2.2. Practicum Laboratory activity (practicum), by its terms, the lab is defined as a series of activities that allow someone (students) to apply the skills or practicing something. In conducting the laboratory is not only the ability associated with manipulating tools skills are trained, but attitudes toward scientific inquiry just need to get pressure. In the book Teaching and Learning Strategies, Woolnough suggested that practical forms can be:
1. Exercise, used to support basic skills development aspect. For example, using the eye, a magnifying glass, etc.
2. Investigation (inquiry), is used for the purpose aspects of problem-solving skills. Examples of such investigations practicum shaped how to get sprouts from the seeds of the soursop.
3. Experiential, used for the purpose of increasing understanding of the aspects of the subject matter. For example, studying and wrenching parts of plants (flowers / fruit).
Practicum is one form of teaching and learning activities that are intended to strengthen the mastery of the material that is applicable. Practicum is a learning process that is intended to help students understand the concepts and theories in the book's subject matter, so that students can achieve the competencies expected after a certain course.
3. METHODS This study used mixed methods research approaches. The study is a mixed methods research approach that combines the form of qualitative and quantitative form. According to the book fuse Bryman Quantitative and Qualitative Research Methods (2014) that one reason for the incorporation of

173
qualitative and quantitative research including triangulation logic which qualitative research results can be checked on quantitative studies to strengthen the validity of research data. When viewed from the presentation of the data, the nature of this research is descriptive and verification. Descriptive method means trying to describe and interpret the object in accordance with what is (Sukardi, 2010). The purpose of descriptive research is to create a picture or painting in a systematic, factual, and accurate about the facts, nature and combined inter phenomenal investigated (Umar, 2011). While the verification method used to test the validity of a hypothesis which is carried out through data collection in the field. The research focus is the management of Face to Face Practicum (FFP) all over Regional Offices in supporting the implementation of learning practicum courses in Accounting Study Program which include:
1. Planning; 2. Organizing; 3. Actuating; and 4. Controlling.
Data used in the preparation of this study are primary and secondary data. The population of this research is all Regional Offices that organizing of FFP. The sample was taken by purposive on Regional Offices conducting the FFP. Data analysis techniques used in this research is descriptive analysis. This means that from the data obtained from the study were presented what was then analyzed descriptively to obtain a description of the facts on the ground. 4. RESULTS AND DISCUSSION 4.1. Results There were 39 Regional Offices of UT as population. Population taken with purposive and obtained 16 Regional Offices. Acting as a respondent is Coordinator of Learning Materials and Academic Support Services (LMASS) of Regional Office. Information about the organization of FFP in Regional Office explored through a questionnaire containing 36 statements in Likert scale. Respondents elaborated through direct interviews or via telephone. 36 The statement is divided into four sections based on 4 (four) management functions, namely: (1) planning, 10 statements; (2) organizing, 10 statements; (3) actuating, 8 statements; and (4) controlling, 8 statements. Having tested the validity and reliability, from 36 statements remaining 33 statements were valid and reliable. Three statements are the statement number 3 of actuating (t-value: 1:31 <1.96; standard loading factor: 0:33 <0.50) and a statement of the number 2 (t-value: 1:47 <1.96; standard loading factor: 0:37 <0.50) and number 3 of controlling (t-value: 1.65 <1.96; standard loading factor: 0:41 <0.50).
4.2. Discussion 4.2.1. Face to Face Practicum (FFP) and Coordinator of Learning Materials and Academic Support Services (LMASS) Effectiveness of LMASS Coordinator who have carried out FFP can be seen from the implementation of the management functions: Planning, Organizing, Actuating, and Controlling. Most of Coordinator LMASS have not yet understand the mechanism of FFP. One of the Coordinators interviewed by the researcher mentioned the reason why the Regional Office has never conducted FFP so there is no need to know and do FFP process from planning to implementation. The other reason they assume that FFP with Face to Face Tutorial (FFT) is the same process and implementation. Most of LMASS coordinator who organizes FFP states that FFP has not been fully organized because of the unclear implementation guidance and guidelines for FFP. Instructors of FFP still act as tutors of FFT deliver material not through practical tasks. Some of Regional Office UT organizing of FFP very well as cooperation with the Public Universities conducting practicum course of auditing and accounting laboratory. Instructor of Public Universities has been understood and used to guide the students in practicum courses.

174
4.2.2. Effectiveness of FFP Planning Figure P1 shows that although there is 82% of the respondents stated FFP effective planning, but there are 13% who said it was not effective. This can be referred to the results of interviews mainly on respondents who do not maintain FFP. They saw no need to plan of FFP, because it does not need organizing FFP. Figure P2 shows that 94% of respondents said that planning has a role. The interesting is that there are 6 % who say somewhat of a role, it is possible that this view emerges from respondents who have not conducted the FFP and felt that the planning is ineffective so that it is questionable.
In Figure P3 shows that there are 12% of respondents who see the implementation guidelines and guidance on the implementation of the FFP is not effective. It is aligned with the respondent when responding to question the effectiveness of planning FFP. Most of the respondents who answered effective because it has been using it as a guide to the implementation of its FFP in Regional Offices. The interesting thing is Figure P4 there are 38% of respondents doubt the effectiveness of the implementation of the FFP. When traced because the response has not been read and implement these guidelines.
Figure P5 shows that although the perception of perception has been done but there are still 18% of respondents still doubt its effectiveness. Meanwhile the Figure P6 communications Coordinator of LMASS with the instructors good and smoothly (88%) and only 13% are dubious.
13%6%
63%
19%
P1. The Effectiveness of FFP
Planning before implementation
Uneffective less effective
Effective very effective
6%
44%
50%
P2. The role of FFP Planning for
Coordinator of LMASS
less important important
Veri Important
6%
6%6%
56%
25%
P3. The Effectiveness of FFP Guidlines
and Guidance for FFP
Very uneffective uneffective
less effective effective
very effective
38%
38%
25%
P4. The Effectiveness of FFP
less effective effective

175
Figure P7 showed that 31% of respondents doubt the effectiveness of the delivery of information to students and study group of FFP. While Figure P8 indicates that there are 19% of respondents doubt the effectiveness of the delivery of information about rights and obligations of the instructor at the time of perception.
Apparently, there are 6% of respondents stated that the delivery schedule of the FFP to the instructor is not timely (Figure P9). Figure P10 shows there are 6% of respondents said modules, workbooks and texts about FFP is not available and 19% doubted there. FFP overall planning function that should be improved is in the planning before the FFP, the effectiveness of information and communication between the organizers of FFP by instructors, students and study group as well as the availability of FFP.
6%13%
56%
25%
P5. The Effectiveness of Equation of
Perception
uneffective less effective
effective very effective
13%
38%
50%
P6. The communication between
Coordinator of LMASS and
Instructors of FFP
less good good very good
31%
50%
19%
P7. The Effectiveness of
information about FFP to students
and study Club management
less effective effective very effective
19%
44%
38%
P8. The effectiveness of
information about Instructor
Rights and Obligations in
Equation of Perception
less effective effective very effective

176
Organizing Figure O1 presents information FFP organizational structure. It appears that 38% of respondents doubted the effectiveness. Similarly, information from Figure O2 showed that 32% of respondents doubted the implementation of the duties and functions of FFP.
Standard Operating Procedures (SOP) in the implementation of FFP 25% of respondents considered ineffective and 6% doubted (Figure O3). Only 6% of respondents who view Regional Office staff who helped organize the FFP incompetent while 76% of respondents believe the competence of his staff (Figure O4).
6%
56%
38%
P9. The effectiveness of on time
information about FFP Schedule to
Instructor
uneffective effective very effective
6%19%
31%
44%
P10. The availability of Printed
Material: Modul, Workbooks,
and Test Paper
not available less available
available very available
6%
38%
38%
19%
O1. The Effectiveness of FFP
organizational structure
Uneffective less effective
Effective very effective
19%
13%
50%
19%
O2. The Effectiveness of
implementation of duties and
functions FFP
Uneffective less effective
Effective very effective

177
19% of respondents stated that the Kit Tutorial of FFP consist of RAT, SAT, outline tasks, etc. are not validated in Regional Office-UT (Figure O5). 31% of respondents felt the guidelines and guidance FFP in Regional Office not available and 13% doubted his existence (Figure O6).
26% of respondents did submit guidelines to the instructor FFP (Figure 07). Apparently there are 12% of respondents stated that it is not personal to be responsible for the implementation of FFP (Figure O8).
19%
19%
6%50%
6%
O3. The effectiveness of Standard
Operating procedures (SOP) in the
implementation of FFP
Very Uneffective Uneffective
less effective Effective
very effective
6%
19%
38%
38%
O4. The competence of
Regional Office's staff in
assisting of FFP
Very incompetent less competent
competent very competent
19%
6%
31%
44%
O5. Kit Tutorial (RAT, SAT, Outline
Task, etc.) is validated at Regional
Office
not validated less validated
validated very validated
6%
25%
13%25%
31%
O6. Availability of guides and
guidelines of FFP at Regional
Office
Very unavailable Unavailable
less available available
Very available

178
Even 19% of respondents said there is no special field personnel who take care of the implementation of FFP (Figure 9). Similarly, 12% of respondents said the person in charge in organizing FFP did not commit.
Overall organizing functions that must be improved is the organization FFP as well as the main tasks and the availability of personnel in charge of FFP and the staff who directly manage the implementation of FFP. Actuating On actuating function, 25% of respondents said the environment is not conducive place of FFP (Figure A1). Meanwhile, there were 13% respondents doubted their dugout for instructors (Figure A2).
13%
13%
6%44%
25%
O7. Submission of FFP
Guidelines to instructors
very not delivered
not delivered
less delivered
6%25%
19%
44%
6%
O8. There is someone who is
responsible for organizing FFP
very no oneNo oneless oneavailable someone
6%
25%
19%
44%
6%
O9. Available of field personnel to
manage FFP
very no one
6% 6%
69%
19%
O10. Commitment of
responsible of accounting FFP
Very not committedNot committedLess committedCommitted

179
6% of respondents said FFP does not provide a place of worship space (Figure A4) and 19% of respondents doubted the availability of toilets were clean (Figure A5).
12% of respondents stated lab materials are not available, and 6% more doubt (Figure A6). 13% of respondents doubted their support facilities in the FFP (Figure A7). Only 6% of respondents who doubt affordability venues of FFP (Figure A8).
6%
19%
38%
38%
A1. Environment of FFP is
condusive
very not condusive not condusive
condusive very condusive
13%
56%
31%
A2. Availability of break room for
instructors at FFP locations
less available available Very available
6%
6%
25%
63%
A4. Availability of pray room
Unavailable less available
available Very available
19%
31%
50%
A5. Availability of clean toilets
less available available Very available

180
Overall actuating management functions that must be considered are the availability of instructor break room, places of worship and toilets. More important is the availability of FFP materials (manuscripts and workbooks). Controlling In the controlling function, 6% of respondents considered that monitoring and evaluation implementation had not been effective and 13% had doubts about its effectiveness (Figure C1). The timely assignment is considered ineffective by 19% of respondents and 6% doubt it (Figure C4).
6%
6%
6%
31%
50%
A6. Availability of practicum
materials (case paper and
workbook)
Very unavailable Unavailable
less available available
Very available
13%
31%56%
A7. Availability of support
facilities
less available available Very available
6%25%
69%
A8. Locations of FFP easy to reach
and secure
Less easy to reach and secure
easy to reach and secure
Very easy to reach and secure
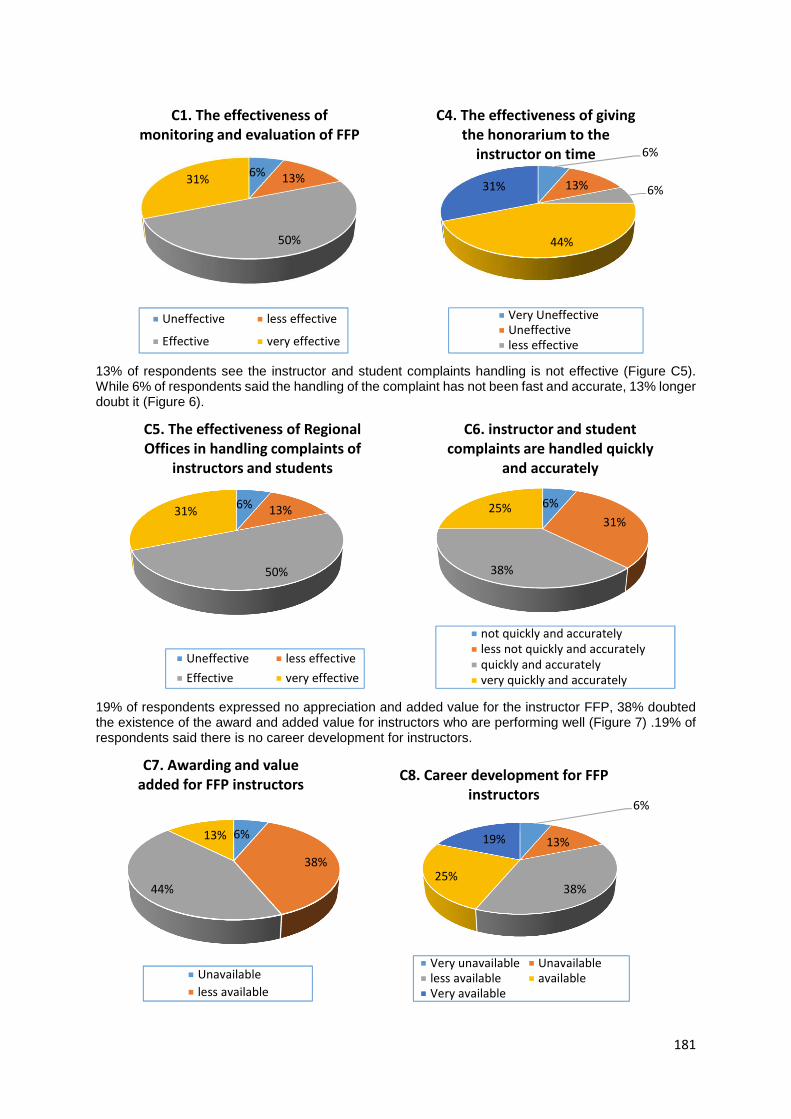
181
13% of respondents see the instructor and student complaints handling is not effective (Figure C5). While 6% of respondents said the handling of the complaint has not been fast and accurate, 13% longer doubt it (Figure 6).
19% of respondents expressed no appreciation and added value for the instructor FFP, 38% doubted the existence of the award and added value for instructors who are performing well (Figure 7) .19% of respondents said there is no career development for instructors.
6%13%
50%
31%
C1. The effectiveness of
monitoring and evaluation of FFP
Uneffective less effective
Effective very effective
6%
13% 6%
44%
31%
C4. The effectiveness of giving
the honorarium to the
instructor on time
Very Uneffective
Uneffective
less effective
6%13%
50%
31%
C5. The effectiveness of Regional
Offices in handling complaints of
instructors and students
Uneffective less effective
Effective very effective
6%
31%
38%
25%
C6. instructor and student
complaints are handled quickly
and accurately
not quickly and accurately
less not quickly and accurately
quickly and accurately
very quickly and accurately
6%
38%
44%
13%
C7. Awarding and value
added for FFP instructors
Unavailable
less available
6%
13%
38%25%
19%
C8. Career development for FFP
instructors
Very unavailable Unavailable
less available available
Very available

182
Overall a controlling function that should be improved is the receiving and handling complaints and career development as well as awards for outstanding instructor. 5. CONCLUSION The effectiveness of the implementation of the planning function has been good. FFP of planning functions that should be improved is planning before implementation of FFP, the effectiveness of information and communication between the organizers of FFP by instructors, students and study group as well as the availability of FFP. Effectiveness of the performance has been good organizing. Organizing functions that should be improved is the organization and it’s the FFP responsible of main tasks and availability of FFP and the staff that takes care specifically the implementation of FFP. Actuating the effectiveness of the performance has been good. Actuating in management functions that must be considered is the availability of instructors break room, a place of worship and a toilet. The more excellent is the availability of FFP (case paper and workbook). Controlling effectiveness of the performance has been good. Controlling function that should be improved is in receipt of the complaint and its handling and career development as well as awards for outstanding instructor.
REFERENCES
Abbas, Syahrizal. (2008). Higher Education Management. Kencana Prenadamedia Group: Jakarta Brannen, Julia. (2005). Mixing Qualitative and Quantitative Research Methods (Mixing Methods:
Qualitative and Quantitative Research). Molds 5, Yogyakarta: Student Library. Burhan Bungin. (2008). Qualitative Research Data Analysis.Jakarta: Rajawali Pujiati, M.Pd. (2007), Development of Instructional Materials for Students Practical Introduction to
Accounting Department of Accounting, Economics and Education Journal, Vol. 4 No. 2. Malta. (2013), Factors Associated with Effectiveness of Strengthening Capabilities Course
Professionals on Student FKIP UPBJJ UT Banda Aceh, Journal of Open and Distance Education, Volume 14, Number 1, March 2013, 57-68
Sujatmiko, Heri. (2013), Computer Laboratory Management SMA Negeri In Sleman, thesis
Unpublished: UNY. Sugiyono. (2008). Educational Research Methods Quantitative Approach, Qualitative and R & D.
Bandung: Alfabeta. Suharsimi Arikunto. (2010). Procedure Research: A Practical Approach 14. Mold Jakarta: PT. Rineka
Copyright Sukardi. (2009). Educational Research Methodology: Competence and Practice. Jakarta: PT. Earth
Literacy. Sukmadinata, Nana Syaodih. (2010). Educational Research Methods, Bandung: PT Young
Rosdakarya. Omar, Hussein. (2011). Research Methods for Thesis and Thesis Business. Jakarta: Raja Grafindo
Persada. Warsono. (2005). Physics Laboratory Management SMA Negeri 1 Sewon. Thesis. Yogyakarta: PPs
UNY.

183
ONLINE ENGLISH LEARNING – THE MIXED PERCEPTIONS OF LERNERS AND THE SUGGESTIONS FOR ONLINE TRAINING
QUALITY ASSURANCE AT HCM OPEN UNIVERSITY
Nguyen Chau Bich Tuyen
Ho Chi Minh Open University (VIETNAM)
Abstract
To integrate into the pace of worldwide developing education and to conduct the commitment of providing society with active learning through offering learners the most flexible and obtainable methods, various online models are applied in Ho Chi Minh Open University (HOU) training system. To English language learners, series of online exercises are required to complete in order to promote their language skills. However, after several years of teaching and observing this online learning process, hundreds of questions related to how learners perceived it and how to ensure the quality of this online learning model are still in doubt. Hence, to clarify the perceptions of learners towards online English learning process, as well as to get some essential suggestions to make sure this online learning quality, a survey was carried out and sent to 200 students with both English majors and non- English majors at HOU. This study is aimed not only to understand more students’ feelings in English online learning system, but also to listen to some innovative proposals of students in making assurance of this online training quality. This may lead to widening online training of various foreign languages at HOU Faculty of Foreign Languages and affirming HOU identity in Southeast Asia in future. The finding shows that learners expressed their mixed perceptions in three aspects of positive, negative, and neutral feelings due to their various learning motivations. It also exposes three innovative suggestions ensuring online training quality including content enrichment, tutor – student interaction, and technological awareness.
Keywords: positive feelings, negative feelings, neutral feelings, content enrichment, technological awareness
1. INTRODUCTION
To make the teaching activity more innovative in higher education environments and to integrate in the worldwide online training system, numerous kinds of modern technologies are applied in teaching and learning process like technological advances, video clips, web-based learning training Moodle, or some sorts of program designs, instructional designs related to internet based learning and so on. These training methods are called with the familiar name of e – learning or online training which has been widely developing in various learning communities (Allen & Seaman, 2008) for many decades and gradually setting up and growing in Vietnamese universities for few years, attracted great numbers of learners.
Obviously, different from traditional teaching activity – a form of face to face attendance in class on campus, the online training has more requirements of instructional design which has to be set up in system of planning, implementation, management and evaluation, clearly identifies the close relationships of instructional problems, learner characteristics, task analysis, instructional objectives, content sequencing, instructional strategies, designing message, development of instruction and the evaluation of instruments (Morrison, Ross, Kemp, & Kalman, 2010). These stages are required to conduct in a considerate way to assure the instructional design more systematic and effective due to different online training input process produces different output of online products. In the eyes of educational experts, it seems not to be able to deny the importance of learning object in the instructional design process as Morrison, Ross, Kemp, & Kalman (2010) exposed that when giving an online lecture and making sure the online learning success, the instructor needs to recognize how to make learners impressive and it is more essential to have little consideration to the nature of learner group, learners’ preparation level and their motivation of degree recognition and the like.

184
In fact, the online training system has not been strongly developed within years in Vietnam although it has been discussed and popularly developed in regions across the world many decades. In HOU learning environment, this online training is not an exception. It has been also mentioned a lot but has not completely carried out due to some problems of accessibility (wi-fi connection), technology (computer, laptop smartphones…) and content (online teaching materials, instructional design) Recently, with the strategies of development, meeting the social requirements and providing people lifelong learning, HOU has put great investment in three vital needs of online training such as providing strong wi-fi connection, facilitating more computers and displaying spaces in HOU library, even the books with available accounts to help the weak financial background learners have good condition to integrate into the new online learning model. This indicates that HOU is willing to support all necessity for variety of learning models as present web- based learning course and future Moodle -based online training in various subjects.
Apparently, learners in both English major and non- English major at HOU are provide a course of face to face on campus within 7 to 10 weeks combining with web- based learning. It means that learners are required not only to directly attend in class but also to complete all exercises in the website including some English skills of grammar, vocabulary, reading and writing. These requirements are aimed to expect the learners be able to improve their English language skills, develop their knowledge, as well as increase learners’ autonomy learning method. To encourage learners in doing online exercises on website, 20 percent of total marks are scored
However, after a long run of web-based English learning at HOU, numerous questions relating to training quality assurance are still in doubt Thus, in this paper, the author especially focuses on studying learners’ backgrounds, ability, passion, determination in order to explore the learners’ perceptions of this web-based English learning. This study is believed that some innovations are suggested and these greatly contribute to future online design and training at HOU.
The process of study was conducted by making a survey sent to 198 sophomores of English major and non- major to understand learners’ independent variables (Richardson & Swan, 2003) as age, gender, location, major, learning styles, learning attitude, learning experiences and learning interest. In addition, some external factors of learners such as the benefits of online environment (flexibility, convenience, accessibility) (Keegan, 1996); family and organizational supports (Park & Choi, 2009); social presence and teacher presence influenced student engagement and satisfaction with the online delivery (Garrison, Anderson, & Archer, 2001). The author also focuses on some internal factors that encourage learners’ activeness, strong determination, and autonomy in online English learning. Then, from these explorations, some implied expectations of learners in online training system are revealed.
The findings show that learners seem to have mixed perceptions of online Engish learning. Some expressed their feeling in a positive way. Some thought in a netrual way - nothing was awful or awesome and the others exposed their negative feeling on this kind of online exercise. These mixed perspectives were come from some different internal and external factors of learners as learning background, family situation, and individual determination and cabability, learners’ expectations of instructor’s interaction, content enrichment and technologcai involment.
The research questions chiefly focus on:
1. What are some external motivations directly affect the perceptions of students in online English learning?
2. What are the influences of internal motivations on the perceptions of students in online English learning?
3. What the expectations do learners imply to have more improvements of English Online learning quality?
2. OBJECTIVES
This research aimed to collect learners’ independent information as age, gender, location, major, learning styles, learning attitude, and learning experiences. It is also expected to gather some external factors of learners’ online learning conditions like flexibility, convenience, accessibility, family and university supports, and teacher presence and interaction with the learners as well. Additionally, the research was set to understand some internal factors that help to motivate learners to be more dynamic and strongly determined in online autonomy. Finally, some implied expectations of learners in online
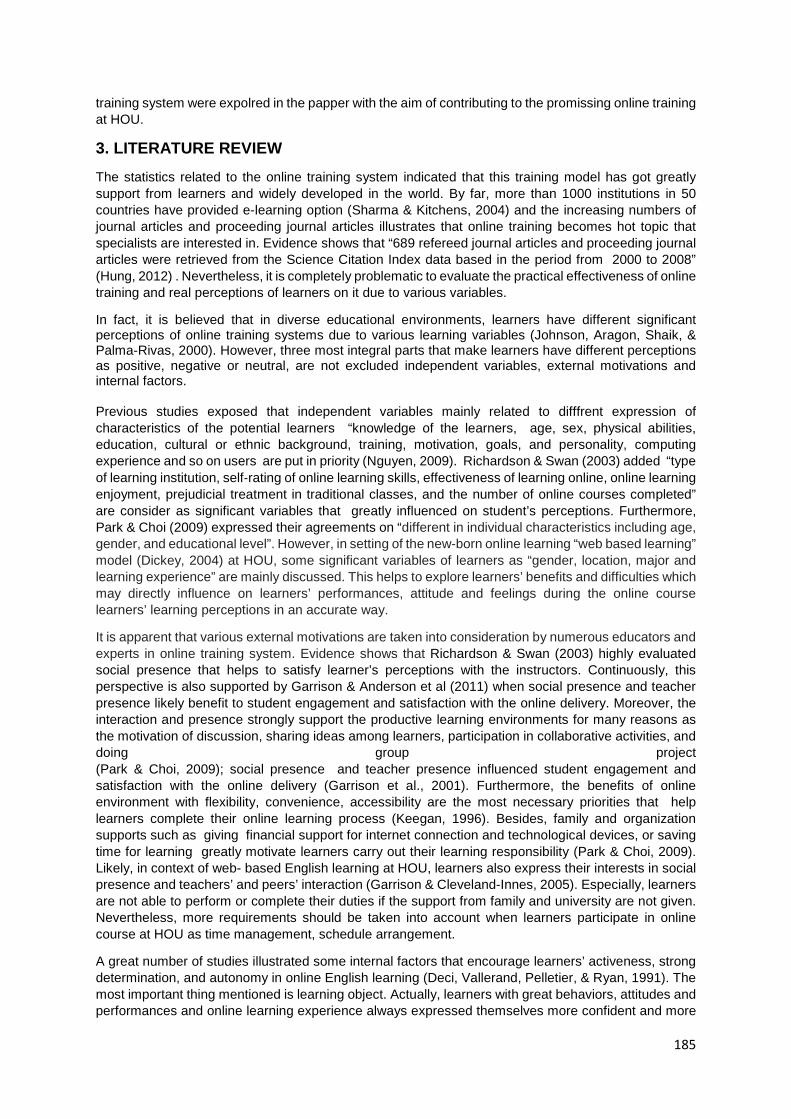
185
training system were expolred in the papper with the aim of contributing to the promissing online training at HOU.
3. LITERATURE REVIEW
The statistics related to the online training system indicated that this training model has got greatly support from learners and widely developed in the world. By far, more than 1000 institutions in 50 countries have provided e-learning option (Sharma & Kitchens, 2004) and the increasing numbers of journal articles and proceeding journal articles illustrates that online training becomes hot topic that specialists are interested in. Evidence shows that “689 refereed journal articles and proceeding journal articles were retrieved from the Science Citation Index data based in the period from 2000 to 2008” (Hung, 2012) . Nevertheless, it is completely problematic to evaluate the practical effectiveness of online training and real perceptions of learners on it due to various variables.
In fact, it is believed that in diverse educational environments, learners have different significant perceptions of online training systems due to various learning variables (Johnson, Aragon, Shaik, & Palma-Rivas, 2000). However, three most integral parts that make learners have different perceptions as positive, negative or neutral, are not excluded independent variables, external motivations and internal factors. Previous studies exposed that independent variables mainly related to difffrent expression of characteristics of the potential learners “knowledge of the learners, age, sex, physical abilities, education, cultural or ethnic background, training, motivation, goals, and personality, computing experience and so on users are put in priority (Nguyen, 2009). Richardson & Swan (2003) added “type of learning institution, self‐rating of online learning skills, effectiveness of learning online, online learning enjoyment, prejudicial treatment in traditional classes, and the number of online courses completed” are consider as significant variables that greatly influenced on student’s perceptions. Furthermore, Park & Choi (2009) expressed their agreements on “different in individual characteristics including age, gender, and educational level”. However, in setting of the new-born online learning “web based learning” model (Dickey, 2004) at HOU, some significant variables of learners as “gender, location, major and learning experience” are mainly discussed. This helps to explore learners’ benefits and difficulties which may directly influence on learners’ performances, attitude and feelings during the online course learners’ learning perceptions in an accurate way.
It is apparent that various external motivations are taken into consideration by numerous educators and experts in online training system. Evidence shows that Richardson & Swan (2003) highly evaluated social presence that helps to satisfy learner’s perceptions with the instructors. Continuously, this perspective is also supported by Garrison & Anderson et al (2011) when social presence and teacher presence likely benefit to student engagement and satisfaction with the online delivery. Moreover, the interaction and presence strongly support the productive learning environments for many reasons as the motivation of discussion, sharing ideas among learners, participation in collaborative activities, and doing group project (Park & Choi, 2009); social presence and teacher presence influenced student engagement and satisfaction with the online delivery (Garrison et al., 2001). Furthermore, the benefits of online environment with flexibility, convenience, accessibility are the most necessary priorities that help learners complete their online learning process (Keegan, 1996). Besides, family and organization supports such as giving financial support for internet connection and technological devices, or saving time for learning greatly motivate learners carry out their learning responsibility (Park & Choi, 2009). Likely, in context of web- based English learning at HOU, learners also express their interests in social presence and teachers’ and peers’ interaction (Garrison & Cleveland-Innes, 2005). Especially, learners are not able to perform or complete their duties if the support from family and university are not given. Nevertheless, more requirements should be taken into account when learners participate in online course at HOU as time management, schedule arrangement.
A great number of studies illustrated some internal factors that encourage learners’ activeness, strong determination, and autonomy in online English learning (Deci, Vallerand, Pelletier, & Ryan, 1991). The most important thing mentioned is learning object. Actually, learners with great behaviors, attitudes and performances and online learning experience always expressed themselves more confident and more

186
responsible for participating in the online learning course (OLC). To perform an online learning course effectively, learners are required to pay much attention to their academic skills, technical skills, learning motivation (Richardson & Swan, 2003). Evidence shows that the more opportunities that learners engaged with OLC, the more benefits learners obtain as the skill of using technology associated with online delivery. Furthermore, learners are required to develop proficiency of e-learning platform navigation, join in online discourse, submitting electronic assignments and partaking in discussion board discourse” (Carter, 2013). Similarly, learners need to actively construct knowledge and deeply understand through social, cognitive and teacher negotiating processes with others in OLC (So & Brush, 2008). In general, these acquiring skills and qualification of learners indicated that active participation in OLC contributes to good performance on the test or other measurements (Richardson & Swan, 2003). But in online English learning at HOU, the internal factors of learners are mostly emphasized on learners’ English passion, learning rationales and learning methods. Once learners are keen on English, variety of necessary reasons that make learners be more patient in maintaining strong learning determination and from that learners can adjust their learning methods in an appropriate manner.
Previous research explored numerous perceptions of learners in OLC in many aspects as learner general perceptions of social presence, satisfied perception with the instructors, perceptions of scored high in terms, perception of contributed significant to the predictor equation, learners ’perceived learning (Richardson & Swan, 2003). It also displayed “perceptions of the online delivery of the course satisfaction, benefits and barriers” (Carter, 2013). In the situation of applying web-based learning for English majors and non English majors at HOU, the perceptions of learners are quite different in three groups as positive perception (belongs to group of learners getting strong motivations., learning experience and conditions); neutral perceptions offer learners with inactive activitiy, discourage learning styles and negative perception in group of learners having passion shortage, inconvenient condition and limited technology and knowledge.
4. METHODOLOGY
This research is performed as a descriptive and quantitative one. The research variables are varied into some categories of independent variables (age, gender, location, major, learning styles, and experiences), external motivations (flexibility, convenience, accessibility, family and university supports, instructor’s interaction) and internal motivations (attitude, passion, learning methods). The collection of these learners’ variables helps to recognize learner’s perceptions and expectations toward online English learning. The process of doing research started up with making a survey questionnaire which presented learners’ personal details, learning encouragements and conditions. This helps to explore learners’ perceptions and performances in online English learning. The research continuously collected 198 respondents out of 200 sophomores in both English major and non – English major at HOU. The decision of making random selection of numbers of English majors and non-English majors because the author enjoys checking quality of applying web- based learning at HOU and learners’ perceptions on this. The learners who take part in English major do not mean that they enjoy learning English and have positive perceptions on online English learning and vice-verse. Various previous studies exposed that learners have different perceptions of online English learning for numerous external and internal reasons. Thus, it is reliable to carry out the research and perform the process of data analysis in a descriptive simple manner.

187
5. RESULTS AND DISCUSSION
INDEPENDENT VARIABLES OF LEARNERS
Figure1. Independent Variables (Gender, Major, Loc ation, Semesters, Learning styles)
Observing the Figure1, it is easy to recognize the numbers of female participants (65,2%) is nearly as twice as males (34.8%). All of them are both English majors (41 %) and non – English majors (58, 41%).The selection of participants was based on the condition of English learning face to face in class with text book combining with doing online exercises at home with the website provided. Most of participants are from provinces (71.7 %). This number clearly expresses some disadvantages in applying technology in learning process. According to statistics, most of learners who come from different provinces may not have better living and learning conditions as learners living in big city- HCMC. Learners in provinces often share renting rooms, they often have to face with problem of internet connection (wifi) and technological devices (laptop, computers, cellphones) when making comparison with learners in a big city. Moreover, these learners may be less able in English background and poor technological awareness for inadequate sufficient conditions of state of the art technology applying,
34.8%
65.2%
41%
58.1 %
28.3 %
71.7 %
0
20
40
60
80
100
120
140
160
male female Major in
English
Non-major
in English
Live in HCM
city
Live in
Provinces
20.2%4.5 %
75.3%
Learn in class
Online Learning
Online & In class
learning 69.7%14.6 %
15.7% Online -
Compusory
Online - optional
Online - not
influenced
30.8%
65.70%
3.5%
1 -2 Semeters
3-4 Semeters
5 -6 Semeters

188
less qualified English teaching and learning. These cause many barriers that may make learners under pressure and lose inspiration in online English learning.
The figure1 also presented the population of research are second year students who have studied 4 semesters (65. 7%) The rest of students – some are in case of sophomores but achieved good marks English placement tests, so they need not to attend the first and second semesters (for non- English majors), or the learners belong to the group of students who have attended 4 semesters but have not accessed website to do online exercise (30.3 %) because online exercises are required to complete in order to encourage learners’ improvement and occupy 20% total marks of the English course. Others are in group of learners have great ability, so they made the decision to have 2 or more English classes at the same time due to the rules of studying by getting enough credits for graduation or in an opposite way that learners could not express their English ability through the course, so they need to take part some courses again to pass the exam and collect enough credits. Numbers of learners attending 5- 6 semesters is limited (3.5 %). In general, the participants approved are sophomores but have different learning experience in various numbers of semesters. Besides, one variable related to learners’ perspectives of online course, the responses are also varied. More than a half of participants believed that “it is a compulsory online course (69.7 %) means that learners have to complete to meet the requirement of learning program. However, it still has one group of participants thought that “just an optional online course” (14.6%) – means that they have their own choice if they complete they can get 2 marks out of 10 marks of the course. This is more surprised when most of learners in this group normally have good English language skills. They are afraid of spending a lot of time to complete all exercises to get 2 marks (they prefer spending more time for other subject in heavy learning curriculum). They also strongly believed that with their great ability they are easy to get good marks in learning process in class and final written test. While the less able learners always making effort to complete online to earn more marks. Another group gave feedback that it is not influenced if they do online exercises or not (15.7%) means that learners didn’t show their interests in this online learning, or they don’t pay much attention to regulation and even the marks. In general, just based on the statistic of independent variables, a series of feelings and expression are exposed in a mixed fashion. More details of learners’ perceptions and their desirable expectations of online English learning will be displayed in the following table:
EXTERNAL FACTORS INFLUENCED ON THE PERCEPTIONS OF LEARNERS
Table1. External factors
Questions No Percent
1. How does the time influence on your online exercise doing?
Influenced a lot 22 11.11 % Quite Influenced 14 7. 1 % Influenced 68 34.3 % Less Influenced 54 27.3% Not Influenced 40 20.2%
2. What specific factor influences on your online exercise doing process?
Short deadline 32 16.2% Many exercises 26 13.1% Full learning schedule 118 60% Family house work 24 12.1%
Part time job 26 13.1 %
3. How does the cost of the internet and technology cause the difficulty of online exercise
doing process?
Much difficult Quite difficult Difficult Less difficult Not difficult
6 12 34 66 80
3.0% 6.0 % 17.1% 33.3% 40%
4. What necessary supports can you get from your university?
Internet Connection Computers
27 32
13.7% 16.2%
Space in Library 56 28.3% Learning Website 64 32.3% All necessary things 64 32.3%
5. How are the university supports helpful in your Very helpful 24 12.1%

189
online exercise doing process? Quite helpful 44 22.2% Helpful 88 44.4% Less helpful 34 17.2% Not helpful 8 4%
6. Is it complex with the steps of website accessing to do online exercise?
Very complex 8 4% Quite complex 20 10.1% Complex 14 7.1% Less complex 58 29.3%
Not complex 98 50%
7. Are you under pressure when doing online exercise?
Under pressure much Quite under pressure Under pressure Less Under pressure Not under pressure
14 0
16 56 112
7% 0%
8.0% 29% 57%
8. Does the instructor regularly contact or give you consultancy during the online learning course?
Very regular 52 26.2% Quite regular 36 18.2% Regular 58 29.3% Less regular 48 24.3% Never contact 4 2%
9. How can you keep contact with the instructor?
Directly in class 154 77.8% Email 50 25.3% Facebook 22 11.1% Phone 6 3.0% Forum 10 5.1%
10. What activities are performed when the instructor and learner meet each other?
Instructor gives explanation of something difficult
78 39.4%
Learners just listen to the instructor’s sharing
66 33.3%
Learners ask for some techniques of doing online exercise
50 25.3%
Learners do nothing
46
23.2 %
11. Is it necessary to have instructor’s presence in your online learning or doing online exercise?
Very necessary 46 23.2% Quite necessary 40 20.2% Necessary 82 41.4% Less necessary 18 9.1% Not necessary 12 6.1%
12. How does your family support your online English learning process?
Very supportive 24 12.1% Quite supportive 14 7.1% Supportive Less supportive Not supportive
98 28 34
49.5% 14.1% 17.2%
Twelve questions were raised to 198 learners with the aim to explore some external factors that influenced the perceptions of learners like the time (Questions 1& 2), the cost (Question 3), family supports (Question 12), university supports (Questions 4 &5), technological complex (Question 6), instructors’ presence and interaction (Questions 8, 9, 10 & 11), pressure of online doing (Question 7)
Questions 1& 2
Although the participants in research have different perspectives of influenced degrees of time, more than a half of them (52.51%) generally believed that the time is one of the most important factors that influenced on their online learning process. Particularly, while some groups of learners revealed that time had great influence (11. 11%), quite influence (7.1%) medium influence (34. 3%), and less

190
influence (27. 3 %) there are still more than 20 % of learners express that time did not have any influence at all. But when the second question related to the time was raised to 198 learners, 60% of them gave the responses that “full learning schedule” greatly influenced on their process of doing online exercises. Others also have time problems in situation of container load of exercise (13.1 %) short deadline of homework (16.2 %), family chore (12.1 %) and part time job (13.1%). These percentages implied that various learners have learning and family backgrounds. This makes learners perceive online in a different way.
Question 3, 4, 5 &12
It is more challenging for learners in financial aspect when putting more investment in internet connection (wifi, 3G) and electronic devices as laptops, computer, smart phones and the like when taking part in doing online exercises. With the learners who live in big city and have strong financial background, the device and internet cost seem not to be problematic, but for most learners come from provinces, these expenses are prior concerns. Nevertheless, it is really amazing when 40% of learners responded that they have no difficulty and 33.3 % of learners felt less difficult in paying internet and technology expenses. It completely makes sense when HOU provides learners all necessity as internet connection, computers, library spaces, web-based learning and others (exposed in question 4). This well- equipped learning environment helps to low down the financial stress of learners in process of online learning and give learners all advantages to complete their responsibilities in online learning. In addition, learners are also beneficial when getting supports from family as cost of materials, technology, internet and available time to finish their online learning course. Despite the family supports and organizational helpfulness are perceived in different levels, learners generally are convenient in their learning conditions (more than 82% perception of family support in various levels from “very supportive to less supportive” and more than 90% perception of university helpfulness in various levels from supportive to less supportive)
Questions 8, 9, 10 &11
The role of instructor is one of vital external factors that deeply influences on learners’ perceptions. Actually, nearly 85% of learners believed that the presence of the instructor inspired them a lot in 3 levels (from “very necessary to necessary”) (Question11). It is more supportive for the instructor’s importance when learners expressed their preference of keeping contact with the instructor directly in class (77.8%) (Question9). Whenever meeting in class, the variety of activities often happened including giving explanation for difficulties in exercises (39.4%), listening from the instructor’s sharing (33.3), asking for some technical techniques of doing online exercises (25.3%) (Questions10). In spite of fewer learners’ neglect attitudes in the instructor’s contact through the survey such as less regular contact (24.3 %) or never contact (2%), but the total percentage of the instructor’s regular contact or giving consultancy (73.7) clarified the vital role of the instructor (Question 8). However, there is no big difference in percentage of learners’ perspectives in most questions in table 1, so it firmly illustrated that learners have difference perceptions in numerous aspects.
Question 6 & 7
Technology information is not a barrier in online English learning because learners just follow some steps of accessing learning website and performed the exercise in an easy way. However, just a half of learners strongly affirmed that the steps of website accessing to do online exercise were not complex. Half of learners expressed their opinions in level less complex (29.3%), complex (7.1%), quite complex (10.1%) and very complex (4%). Besides, participants were also asked for feelings of doing online exercise, 57% of them firmly expressed “not under pressure”. The rest of participants revealed their feelings of under pressure although 29% learners in this group felt “less under pressure”.
In overall, these figures in table1 “external factors” more or less have exposed learners’ perceptions in different ways due to different backgrounds of family condition, educational history, individual setting and location.
To have accurate conclusion in learners’ perceptions, more requirements of internal factors or learners inside motivations should be taken into account

191
INTERNAL FACTORS INFLUENCED ON THE PERCEPTIONS OF LEARNERS
Table 2 – Internal factors
1. What motivation makes you feel interested in doing online English exercises?
Awareness of English necessity 170 85.60% Obey the regulation 36 18.20% Satisfy parents 46 23.20% Strong passion 74 37.40% Competitive spirit 6 3%
2. What learning methods help you to improve your English skills?
Reading books & check dictionary 114 57.60% Participating in class room activities 40 20.20% Study from teacher 84 42.40% Online Autonomy 116 58.60% Contact with native speakers 0 0%
3. What is your perception in online English learning?
Interested in Online Exercises 67 33.80% Neutral 107 54% Not interested 24 12.12%
4. What kinds of exercises do you prefer? (online exercises or printed exercises)
Enjoy Online Exercises 133 67.20%
Enjoy printed Exercises 65 32.80%
The learners can take advantages of family and organizational supports, and instructor’s interaction to develop their English skills. However, numerous previous studies proposed that the internal motivations of individuals are more decisive. Especially in process of online English learning – a new learning model at HOU – learners are required to have more learning inspirations, strong passion or determination and good awareness of technology when performing online English learning
Table 2 displays with four key questions related to the learning motivations, learning methods, learning perspectives and types of exercise interest. It is simpler to conclude that part of learners’ perceptions in online English learning or learners’ implications for this learning model development. According to the survey, learners had their own different motivations in doing online English exercises. This leads to different perceptions. In question 1, most of learners had good awareness of English necessity (85.6%) (job supporting, high earning, interaction tool). Other learners (more than one third of learners) exposed their strong passion in English learning (37.40%). Some of learners did not express their own learning motivation but for satisfying parent (23.20%) or meeting requirement of university (obeying the regulation 18.20%). The results show that learners almost have good awareness of their responsibilities for learning but their own interest in online English learning is still limited. This may lead to different perceptions that may be positive, negative or neutral.
Additionally, observing English learning methods, it is simpler to have conclusion that what kind of learners belong to “passive learners or active learners”(Lee & Lehman, 1993). These help to recognize their perceptions based on their performances. Actually, the passive learners prefer learning method of reading books and checking dictionary (57.60%), and study from teacher (42.40%) but active learners enjoy taking part in classroom activities (20.20%), and have skill of online autonomy (58.60%). Due to learning methods are varied from learners to learners, so their perspectives and perceptions are not the same.
After carrying out the process of exploring learners’ independent variables, internal factors, and external motivations, it is possible to give the conclusion of learners’ perceptions when looking at the statistic numbers. However, to firmly confirm the perceptions of learners on web-based English learning at HOU, a question (question 3) related to learner’s feeling on online English learning was raised to 198 learners and their perceptions were put in three scales as interested (33.8 %), neutral (54%), not interested (12.2%). Besides learners were also checked whether they enjoy doing English exercise online or in printed paper, and the responses prefer online exercise (66.7%). This means that learners enjoy new learning model “website –based learning” with the convenience of accessibilities, technology and content.

192
6. DISCUSSION
New learning model- “web- based learning” has been widely applied in English training for both English majors and non- English majors. To perform this training model, HOU has given strong supports in internet connection, technological devices, learning website all the necessary items. Learners also had more choices of using organizational services or getting family supports in three main difficulties of online training system as accessibilities, content and technology. It means that learners did not have any barrier in online English learning Nevertheless, when looking back the statistics analyzed from the responses of learners for three sections of independent variables, external factors and internal factors, there were mixed percentages of positive, neutral and negative feelings and perspectives in each mentioned variable. It is easy to recognize the mixed perceptions of learners, especially in table 1 – external factors, the numbers of responses seem to be equally divided. This means that various group of learners showed various preferences, feelings and perspectives despite they are in the same condition of learning environment. These are the best descriptions or explanations for their different gender locations, family background, previous learning experiences and conditions. Indeed, some independent information illustrated that numbers of learners in provinces are higher than learners in HCM city. But the difference of locations did not imply that learners in big city have skilled technological awareness, more motivations, or better abilities in online English learning and vice-verse. Similarly, it did not mean that only English majors have great interest or methods in online English learning. In fact, many learners made decision to study in English major due to various internal factors. For examples, learners themselves enjoyed making their parents pleased or they have passed the university entrance examination and got into English major at HOU and so on. Hence, the research is performed to explore how learners’ perceptions are in the same online English learning condition at HOU.
The results are obviously illustrated that “Web-based Online English learning” was neutral (54.7%) – means that nothing was special or interested Some believed “interested” and other expressions were “not interest”. The factors that make learners have various feelings because learners are familiar with some traditional or inactive activities in learning process “reading book and looking up dictionary” (57.6 %) more than two time of “participating in classroom activities (20.2 %)” enjoying the instructors’ presence and interaction, listening to the instructors’ explanation. Furthermore, nearly 50% of learners did not enjoy online autonomy. And if they decided to participate in online English learner course because they were wisely aware of English importance (85,6 %). Additionally, their learning motivations were not derived from their strong passion in online English learning (37.4%). These leads to mixed perception of online English learning and based on these learners’ expressions, it is firmly believed that learners have desirable expectations of the content enrichment (this helps learners have more sources to study more and make learner more interested); teacher interaction (helping in problem explanation and instruction)
7. CONCLUSION
Online English learning widely develop across the countries, in HOU higher education environment web based English learning has been applied for years. To explore the perceptions of learners as well as to have more improvements in this new learning model, a study was conducted. It seemed to be interesting when the perceptions of learners are mixed in three categories as positive, neutral and negative. Obviously, these perceptions are based on data analyzed that collected from 198 respondents of HOU sophomores in both English major and non- English major. This research may be reliable and helpful in some similar online English training environments due to it clearly presented some necessary independent variables related to learners’ family and learning background. These personal criteria influence on external and internal factors that help motivate or demotivate learners in process of online English learning system. This is leading to some expected suggestions of learners that are strongly supportive for present online English learning and for the potential online foreign language training in future as well.

193
REFERENCES
Allen, I. E., & Seaman, J. (2008). Staying the course: Online education in the United States, 2008: ERIC.
Carter, M. A. (2013). A study of students’ perceptions of the online component of a hybrid postgraduate course. Procedia-Social and Behavioral Sciences, 84, 558-568.
Deci, E. L., Vallerand, R. J., Pelletier, L. G., & Ryan, R. M. (1991). Motivation and education: The self-determination perspective. Educational psychologist, 26(3-4), 325-346.
Dickey, M. (2004). The impact of web-logs (blogs) on student perceptions of isolation and alienation in a web-based distance-learning environment. Open learning, 19(3), 279-291.
Garrison, D. R., Anderson, T., & Archer, W. (2001). Critical thinking, cognitive presence, and computer conferencing in distance education. American Journal of distance education, 15(1), 7-23.
Garrison, D. R., & Cleveland-Innes, M. (2005). Facilitating cognitive presence in online learning: Interaction is not enough. The American journal of distance education, 19(3), 133-148.
Hung, J. l. (2012). Trends of e‐learning research from 2000 to 2008: Use of text mining and bibliometrics. British Journal of Educational Technology, 43(1), 5-16.
Johnson, S. D., Aragon, S. R., Shaik, N., & Palma-Rivas, N. (2000). Comparative analysis of learner satisfaction and learning outcomes in online and face-to-face learning environments. Journal of interactive learning research, 11(1), 29.
Keegan, D. (1996). Foundations of distance education: Psychology Press. Lee, Y. B., & Lehman, J. D. (1993). Instructional Cuing in Hypermedia: A Study with Active and
Passive Learners. Journal of Educational Multimedia and Hypermedia, 2(1), 25-37. Morrison, G. R., Ross, S. M., Kemp, J. E., & Kalman, H. (2010). Designing effective instruction: John
Wiley & Sons. Nguyen, L. V. (2009). The triangular issues in multimedia language courseware design in the
Vietnamese EFL environment. Asian Social Science, 4(6), 65. Park, J.-H., & Choi, H. J. (2009). Factors influencing adult learners' decision to drop out or persist in
online learning. Journal of Educational Technology & Society, 12(4). Richardson, J., & Swan, K. (2003). Examing social presence in online courses in relation to students'
perceived learning and satisfaction. Sharma, S. K., & Kitchens, F. L. (2004). Web services architecture for m-learning. Electronic Journal
of e-Learning, 2(1), 203-216. So, H.-J., & Brush, T. A. (2008). Student perceptions of collaborative learning, social presence and
satisfaction in a blended learning environment: Relationships and critical factors. Computers & Education, 51(1), 318-336.

194
FACTORS HINDERING STUDENTS CHOOSING THE DISTANCE LEARNING BY ONLINE METHOD: CASE STUDY OF
HO CHI MINH CITY OPEN UNIVERSITY
Nguyen Kim Phuoc 1), Huynh Hanh Phuc 2)
1Distance Education Department, Ho Chi Minh City Open University (Vietnam) 2Faculty of Business Administration, Ho Chi Minh City Open University (Vietnam)
Abstract
E-leaning has been becoming one of the most convenient method for distance education. According to the report of Dodebo in 2014, The worldwide market shares of E-learning education got $35.6 billion in 2011. The five-year multipart annual development rate is estimated at about 7.6%, so revenues should achieve $51.5 billion by 2016 (Docebo 2014). However, this education method is moderately new and modern in Vietnam. As a result, it causes some difficulties in the implementation process in Vietnam market, especially reaching the undeveloped provinces such as: Western Vietnam or Middle of Vietnam. The students are facing many problems and troubles when they know about this method and they have to consider as much before they decide to enroll this course. The paper aims to examine the factors that hinder students choosing distance learning by online method. A case study of Ho Chi Minh City Open University is researched in order to find out the obstacles that hinder students selecting distance learning by online method. Thence, this study also helps Ho Chi Minh City Open University to discover the way to encourage students to decide on distance learning and to enhance student support services to create better learning environment. Quantitative analysis is used to test the hypotheses contained in the proposed conceptual model. The study utilized the Likert approach with score of 5 points and interviewed 300 students who are being counseled through the admission system at Ho Chi Minh City Open University via questionnaire survey. The number of valid questionnaires was used 227. SPSS were used to analyze the collected data. The results of the study show that, "Choose to study by E - Learning" is influenced by four factors: (F1) subjective norm, (F2) Functional selfish motives (self – interest), (F) Infrastructure (Facilities) and (F4) No-Functional selfish motives (not self–interest). The adjusted coefficient R2 is 0.832, or 83.2% the variation of the intention to use distance learning by online method can be explained by independent variables in the model. Based on the research results, a number of policy implications have been proposed to help Open University to develop E – Learning strongly in the future. Keywords: E-learning, online learning, distance learning, hindering factors of E-learning. 1. INTRODUCTION
Online learning (E-learning) is quite popular with the world education system. In the famous universities, the e-learning system is considered a standard training system and is required in asserting the quality and standards of the university. Understanding the needs and educational trends in the world, Open University of Ho Chi Minh City established the E-learning center three years ago. At the present, Open university has introduced the training of distance education by online methods with many courses such as business administration, international business, auditing, accounting, Finance Management, etc. with the number of students nearly 1,000 people per year. This is a very positive result in the beginning. It shows that the school has caught up with the tendency of learners to choose the trend of development of open education system in the world. However, learners choose to study online is still limited. The question is "What factors hindering students choosing the distance learning by online method?" This research aims to find out the factors that hinder learners of distance learning via the online method, thus helping Open Ho Chi Minh City and other University in Vietnam to understand, to apply this education method in reality and also to promote this method to develop strongly in the future. The benefits of learning e-learning are: the source of information is plentiful, students can adjustably and proactively learn in appropriate time, standardized learning methods make graduation diploma have same value as traditional education method due to the same system learning and reducing costs

195
also. However, despite these advantages, in Vietnam, this education mode is still not popular. Therefore, in order to motivate learners to choose online learning, it is necessary to identify the factors that obstruct the choice of learners.
2. LITERATURE REVIEW AND RESEARCH MODEL
2.1. Literature review Researching the factors that influence online buying or learning intentions has been studied by several authors, based on a variety of theories, among these theories – online consumer behavior model (FFF – factors, filtering elements and filtered buying behaviors), theory of Planned Behavior - TPB and the theory of reasoned action (TRA). Intention is a factor used to evaluate the ability to perform behavior in the future [5]. According to Ajzen (1991), intention is a motivational element that motivates an individual to be ready for action [6, p.181]. Therefore, Delafrooz et al. (2011) argued that "the intention of online shopping is the certainty of consumers used to make purchases over the Internet "[20, p.70]. The online consumer behavior model FFF was proposed by Professor Ujwala Dange and Professor Vinay Kimar of Priyadarshini Engineering University and the SB Patil Institute of Management in 2012. This model has close relationships with people’ consumption in the term of current shopping. The FFF model considers both internal and external factors influencing consumers' buying behavior. Then consider the impact of these factors on business choice and consumers’ purchasing decisions are presented in Figure 1.
According to Kimar and Dange (2012), the barrier to choose online shopping is the trust, safety and belief of learners. According to Ajzen (1991), intentions are directly influenced by "attitudes", "subjective standards" and "behavioral awareness”. Among these factors, attitudes are “an individual's assessment of the outcome from performing a behavior" [6, p. 188]. In the context of online shopping or learning, attitudes refer to the good or bad ratings of consumers about using the Internet to purchase goods / services from retail websites [21]. The attitude of consumers influences their intention. In the context of online shopping, consumer attitudes towards online shopping have been shown to have a positive effectiveness on their buying intention. This relationship has been stated by empirical studies [21, 23].
Figure 2: Theory of Planned Behavior TPB Source: Chutter (2009)
ATTITUDE TOWARD
BEHAVIOR
SUBJECTIVE NORM
TRUST AND EVALUATIONS
NORMALTIVE AND
MOTIVATION TO COMPLY
BEHAVIORAL INTENTION
ACTUAL BAHAVIOR
EXTERNAL FACTORS Socio - Economics Technology and public policy Culture/Sub-culture
INTERNAL FACTORS Attitude Learning Perception Motivation Self-image Semeotics
BUYING MOTIVES
FILTERING ELEMENTS
Security concern
Security concern concern
Trust and
trustworthiness
FILTER BUYING
MOTIVES BUYING
Figure 1: FFF Model Source: Kimar và Dange

196
Theory of Planned Behavior TPB has been widely used in research and successfully applied as a theoretical framework for predicting online purchasing behavior and intentions. Ajzen (1991) developed TPB theory based on Fishbein's and Ajzen's Theory of Reasoned Action (TRA) theory by adding the "behavioral awareness" factor to TRA [6, 7]. Controlling cognitive behavior reflects the ease or difficulty of performing behavior, which is dependent on the availability of resources and opportunities for performing behavior [6]. According to TPB model, the "behavioral intentions" of "objectivity" and "controlling behavioral awareness." TPB has been widely accepted and used in studies for the purpose of predicting the specific intentions and behaviors of individuals. Moreover, empirical studies have shown the suitability of this model in the study of consumer behavior in the context of online shopping [8-11]. Hansen et al. (2004) tested both the TRA and TPB models, which showed that the TPB model explained the customer behavior better than the TRA model [10]. Moreover, in term of research in Vietnam, several studies have demonstrated that TPB is more suitable for predicting consumers' online shopping intentions [11]. In addition to these three factors, the trust is one of the most influential factors in consumers' buying intentions online. The lack of the trust has been recognized as one of the main reasons for preventing consumers from shopping online [12, 13]. If the trust is not built, online transactions will not happen [14]. Consequently, the trust of customers in online sales is the foundation for online shopping behavior. In the context of online shopping, the trust has a particularly important role. In the online environment, consumer perceptions about transaction risks is higher because buyers do not interact directly with people as well as the product they intend to buy [12, 16]. The risks that consumers may encounter when shopping online include financial and product risks [17]. Perceived risk is a factor that causes negatively affects to the online buying intention [18]. However, Gefen et al. (2003) argued that this factor has no direct relationship with intention to buy online [19]. Starting from these issues, this paper will combine the FFF model, the TRA model and the TPB model to study the factors that impede learners’ intentions for online learning in Vietnam. 2.2. Research Model
(F1) SUBJECTIVE NORM
(F2) FUNCTIONAL SELFISH MOTIVES (SELF – INTEREST)
(F3) INFRASTRUCTURE
(F4) NO- FUNCTIONAL SELFISH MOTIVES (NOT SELF – INTEREST)
Y - CHOOSE E–LEARNING METHOD
Figure 4: Research model Source: Author, 2017
ATTITUDE TOWARDS THE
BEHAVIOR
SUBJECTIVE NORM
PERCEIVED BEHAVIORAL
CONTROL
INTENTION BEHAVIOR
Figure 3: Theory of Planned Behavior - TPB Source: Ajzen (1991)

197
The study bases on the theory FFF (factors – filtering elements - filtered buying behaviors), theory of Planned Behavior TPB, the theory reasonable action and Vietnam’s social foundation. The research model includes four factors: Independent variable group are (F1) Subjective norms, (F2) Functional selfish motives (self – interest), (F3) Infrastructure (Facilities) and (F4) No-Functional selfish motives. The dependent factor is “Choose to study by E – Learning method”, the specific research model is showed in Figure 4
Table 1: Hypothesis and choice of variables
Factors Group Factor Variable chosen foundation
Hypothesis
- Not enough capacity or skills to study - The difficulty of using the learning system
(technical barriers) - Ineffectiveness of the curriculum - Not enough persistence or motivation in
learning - Failure to develop personal skills
(F1) Subjective norm
Ajzen (1991) H1 (+)
- Tuition fee is higher than traditional mode - The current income of an individual does
not afford the payment of tuition fees - Curriculum is not attractive - Academic support services are not
adequate or poor - Less learning materials, not enough
response to student’s demands - Degree is not enough - There is no time to focus on learning as
regulation
(F2) Functional selfish motives (self – interest)
Kimar and Dange (2012)
H2 (+)
- The quality of current internet connection - Internet network system at the current
place of work or living - Personal equipment with internet
connection
(F3) Infrastructure (Facilities)
Chutter (2009) H3 (+)
- Studying environment (less friends) - Law about E - Learning is not clearing yet - Less interact to lecturers (interactivity) - Learning model is not popular
(F4) No- Functional selfish motives (not self – interest)
Kimar and Dange (2012)
H4 (+)
- Subjective norm is importance factors - Functional selfish motives (self – interest) is
importance factors - Infrastructure (Facilities) is importance
factor - No- Functional selfish motives (not self –
interest) is importance factors
Y - Choose E -– Learning method
Kimar and Dange (2012)
Source: Author, 2017
3. RESEARCH METHODOLOGY
Preliminary research is conducted through qualitative research. Qualitative research was conducted by discussing with senior experts in distance learning and E-Learning education. Furthermore, the study also refers from research, journals mentioning about E - Learning as well as obstacles when teaching and enrolling in order to build the scale. The formal study was conducted using a quantitative approach that was proceeded as well as the questionnaire was modified from the preliminary results.

198
Analysis of research data is implemented from simple to complex: exploratory factor analysis => scale reliability evaluation => correlation analysis => multivariate regression analysis => verify model research. The research used the Enter method for regression analysis. This is a common method of linear regression analysis. Using the adjusted coefficient R Square to evaluate the suitability of the model, the closer the factor to the value of 1.00, the greater the fit of the model. Sig. value of the regression coefficients is used to verify the hypothesis of the significance of regression coefficients, if Sig. <0.05, rejecting the hypothesis and concluding that regression coefficients in the model are statistically significant. Conversely, if sig. > 0.05, removing the corresponding variable into the model. Moreover, the research also uses the VIF tool to diagnose multi-collinearity, if the coefficient VIF <10, concluding that there is no hyperbolic multiplication in the model. 4. RESEARCH RESULTS
4.1. Data collection and sample characterization
The research sample is collect from experienced people who are using the Internet every day or have been using the internet in Vietnam. Questionnaires were sent directly via email of the subjects or interviewed individuals directly through enrollment consultancies in the E-learning center of the Open University of Ho Chi Minh City. Then, data collected 300 questionnaires in June 2017. However, during the data entry and filtering process, the author eliminated 73 invalid votes due to missing or losing data. Therefore, the number of questionnaires put into use for analysis was 227. The sample is as follows (table 2):
Table 2: Characteristic of Sample
Characteristic Amount Ratio (%)
Gender Female 131 57.7 Male 96 42.3 Age ≤ 24 39 17.18 ≥ 25 - ≤ 30 83 36.56 ≥ 31 - ≤ 35 71 31.28 ≥ 36 - ≤ 40 22 9.69 ≥ 40 12 5.29 Place birth (living area) South 156 68.7 Middle 39 17.2 Morth 32 14.1 Current working area Specila - grade urban centers 140 61.7 Urban type I & II 40 17.6 Urban type III 21 9.3 Urban type IV & V 20 8.8 Others 6 2.6
Source: Authors surveyed and analyzed, 2017.
Data collection is homogeneous in terms of gender, age, place of birth, and place of work. This helps to ensure the representation of the data is guaranteed. Data analysis methods were performed, including descriptive statistics, exploratory factor analysis, Cronbach's Alpha, correlation analysis and regression analysis - hypothesis testing.
4.2. Analyzing the discovery factor
The exploratory factor analysis for the four independent variable groups has results as the following: The first KMO and Bartlett test scores are 0.849, with the factor "There is no time to focus on learning as regulation" Factor below 0.5, so this factor is eliminated. The remaining factors included in the second KMO and Bartlett Test were 0.879, factor load factors were greater than 0.5, Eigen value greater than 1, and 66.538% variance were explained. The factor convergence value of the observed variables is greater than 0.5 (table 3). The results of factor analysis for the dependent variable group shows the results are: The KMO and Bartlett tests have a value of 0.850 and the loading factor is satisfactory.

199
Table 3: Rotated Component Matrixa
Group Factor Factors Component
1 2 3 4
F1
- S
ubje
ctiv
e no
rm (
KM
O =
.8
79)
Not enough capacity / skills to study .775 The difficulty of using the learning system (technical barriers)
.759
Ineffectiveness of the curriculum .656 Not enough persistence / motivation in learning .652 Failure to develop personal skills .652
F2
- F
unct
iona
l se
lfish
mot
ives
(K
MO
= .8
79)
Tuition fee is higher than traditional mode .818 The current income of an individual does not afford the payment of tuition fees
.670
Curriculum is not attractive .638 Academic support services are not adequate / poor .578 Less learning materials, not enough response to student’s demands
.519
Degree is not enough .516
F3
- F
acili
ties
(KM
O
= .8
79) The quality of current internet connection .888
Internet network system at the current place of work / living
.859
Personal equipment with internet connection .859
F4
– N
o F
unct
ion
al (
KM
O
= .8
79)
Studying environment (less friends) .750 Law about E - Learing is not clearing yet .671 Less interact to lecturers (interactivity) .650 Learning model is not popular .498
Y -
C
hoos
e E
(K
MO
=
.850
) Subjective norm .680 .652 .534 .516
Functional selfish motives (self – interest) Infrastructure (Facilities) No- Functional selfish motives (not self – interest)
Source: Authors surveyed and analyzed, 2017. 4.3. Verify scale reliability
Table 4: Verifying results of the scale reliability
Factors Observed variable Cronbach’s Alpha
coefficient Corrected Item-Total
Correlation F1 - Subjective norm 5 .855 .636 F2 - Functional selfish 6 .855 .539 F3 - Facilities 3 .895 .777 F4 – No Functional 4 .668 .451 Y - Choose E 4 .856 .394
Source: Authors surveyed and analyzed, 2017. The scale reliability is determined by the Cronbach's Alpha coefficient. The results obtained for all factor groups having Cronbach's Alpha coefficient greater than 0.6 and a Corrected Item-Total Correlation coefficient greater than 0.3. The result shows that the scale satisfies the reliability requirements.
4.4. Correlation analysis and validation
The Pearson coefficient is used to analyze the correlation between quantitative variables. Correlation coefficients show that the relationship between the dependent variable and the independent variables is statistically significant. On the other hand, the magnitudes of the correlation coefficients ensure that

200
there are no hyperbolic multipliers. As a result, other statistics can be used to test the relationship between variables. The adjusted coefficient R2 is 0.832, or 83.2%. The variation in the intention to study by online learning method can be explained by independent variables in the model. Thus, the model is consistent with the sample data set. The coefficient of the Durbin-Watson test of the regression model is 1,547 (Table 5) is in the range from 1 to 3, it means the residuals are independent of each other. The standard deviation (Std.Dev) of the regression model is 0.991 approximately 1 and the average Mean is close to zero, so it can be concluded that the standard hypothesis is not violated. Conducting a linear multiple regression analysis between the dependent factor “Choose to study by E - Learning” and fours independent factor: (F1) Subjective norm, (F2) Functional selfish motives (self – interest), (F) Infrastructure (Facilities) and (F4) No- Functional selfish motives (not self – interest).
The results of regression analysis show that independent factors have normalized regression coefficients of .186; .692; .502 and .263 with Sig smaller than .05. Thus, the hypotheses are accepted.
Table 5: Coefficients a
Model
Unstandardized Coefficients
Standardized Coefficients
t Sig.
Collinearity Statistics
B Std. Error
Beta Tolerance VIF
(Constant) 8.576E-
017 .027
.000 1.000
Subjective norm .186 .024 .186 6.821 .000 1.012 1.025 Functional selfish motives (self – interest)
.692 .027 .692 25.392 .000 1.000 1.000
Infrastructure (Facilities) .502 .027 .502 18.431 .000 1.000 1.090 No- Functional selfish motives (not self – interest)
.263 .072 .263 9.669 .000 1.079 1.005
Dependent Variable: Choose E Learning R .914 R Square .835 Adjusted R Square .832 Durbin-Watson 1.547
Nguồn: Tác giả điều tra và phân tích, 2017. As a result of the regression analysis (Table 4), the independent factors F2 and F3 have the strongest impact on the dependent factor. The factor F4 - No-Functional selfish motives (not self-interest) have the smallest impact to dependent factor.
5. DISCUSSION AND POLICY IMPLICATION The main contribution of this study was to develop FFF theory (factors – filtering elements - filtered buying behaviors) by combining the theory of planned behavior (Theory of Planned Behavior (TPB), the reasonable action (TRA) based on the social foundation of Vietnam. The results of the study show that: “Choose to study by E - Learning” is affected by four factors: (F1) Subjective norm, (F2) Functional selfish motives (self – interest), (F) Infrastructure (Facilities) and (F4) No- Functional selfish motives (not self – interest). The results of this study are similar to previous studies (Section 3). Therefore, in order to raise the learners’ intention for distance education by online learning approach at the Open University of Ho Chi Minh City, the university should: (i) provide support services to equip the learners with necessary skills in order to facilitate their ability to develop their own skills, to foster personal learning motivation, and to provide technical support for more E-Learning systems; (ii) recalculate tuition fees to suit the income of Vietnamese people. In addition, many other support services need to be increased so that learners feel that the fees are high due to the high quality of services. (iii) Recommend that the government needs to call for investment to develop and improve internet infrastructure and networking nationwide; (iv) The Ministry of Education and Training in Vietnam

201
needs to improve the legal framework and standardize the degree (just only one graduate degree, not too many type of degrees). REFERENCES [1]http://ecommerceinsiders.com/key-factors-influencing-online-consumer-behaviour-backed-research-1981 [2] Kumar, V & Dange, U., A Study of Factors Affecting Online Buying Behavior: A Conceptual Model, 2012.. Retrieved from http://ssrn.com/abstract=2285350 [3] Goyal, M.M., Online Shopping: A Survey on Consumer’s Perception, The International Journal of Business & Management (ISSN 2321 – 8916), 2017, http://www.theijbm.com/ [4] Chutter M. I., Overiew of the technology Acceptance model: Origins, Developments and Future Directions, Indiana University, USA, 2009, [5] Blackwell, R. D., Miniard, P. W. & Engel, J. F., Consumer Behavior, 9th edition, Dryden, New York, 2001. [6] Ajzen, I., “The theory of planned behavior”, Organizational Behavior and Human Decision Processes, 50 (1991) 2, 79-211. [7] Fishbein, M., & Ajzen, I., Belief, attitude, intention and behavior: An introduction to theory and research, Addison-Wesley, 1975. [8] Al-Jabari, M. A., Othman, S. N., & Mat, N. K. N., “Actual Online Shopping Behavior among Jordanian Customers“, American Journal of Economics, Special Issue (2012), 125-129. [9] George, J. F., “The theory of planned behavior and Internet purchasing”, Internet Research, 14 (2004) 3, 198-212. [10] Hansen, T., Møller Jensen, J., & Stubbe Solgaard, H., “Predicting online grocery buying intention: A comparison of the theory of reasoned action and the theory of planned behavior”, International Journal of Information Management, 24 (2004) 6, 539-550. [11] Thang Ha Ngoc, "Comparison of Acceptable Technology Models and Behavioral Theories Predicted in Consumer Purchase Intentions Study," Journal of Economics & Development, 227 (2016) II, 57-65. [12] Jarvenpaa, S.L., Tractinsky, N., & Vitale, M., “Consumer Trust in An Internet Store”, Information Technology & Management, 1 (2000), 45-71. [13] Lee, M. K., & Turban, E., “A trust model for consumer internet shopping”, International Journal of Electronic Commerce, 6 (2001) 1, 75-91. [14] Winch, G., & Joyce, P., “Exploring the dynamics of building, and losing, consumer trust in B2C eBusiness”, International Journal of Retail & Distribution Management, 34 (2006) 7, 541-555. [15] Chen, Y. T., & Chou, T. Y., “Exploring the continuance intentions of consumers for B2C online shopping: Perspectives of fairness and trust”, Online Information Review, 36 (2012) 1, 104-125. [16] Pavlou, P. A., “Consumer acceptance of electronic commerce: Integrating trust and risk with the technology acceptance model”, International Journal of Electronic Commerce, 7 (2003) 3, 101-134. [17] Bhatnagar, A., Misra, S., & Rao, H. R., “On risk, convenience, and Internet shopping behavior”, Communications of the ACM, 43 (2000) 11, 98-105. [18] Hsin Chang, H., & Wen Chen, S., “The impact of online store environment cues on purchase intention: Trust and perceived risk as a mediator”, Online Information Review, 32 (2008) 6, 818-841. [19] Gefen, D., Karahanna, E., & Straub, D. W., “Inexperience and experience with online stores: The importance of TAM and trust”, IEEE Transactions on Engineering Management, 50 (2003) 3, 307-321. [20] Delafrooz, N., Paim, L. H., & Khatibi, A., “A Research Modeling to Understand Online Shopping Intention”, Australian Journal of Basic & Applied Sciences, 5 (2011) 5, 70-77 [21] Lin, H. F., “Predicting consumer intentions to shop online: An empirical test of competing theories”, Electronic Commerce Research and Applications, 6 (2007) 4, 433-442. [22] Yoh, E., Damhorst, M. L., Sapp, S., & Laczniak, R., “Consumer adoption of the internet: The case of apparel

202
QUALITY ASSURANCE IN COURSES WITH PRACTICUM: HOW AND WHY UNIVERSITAS TERBUKA DOES IT
Rinda Noviyanti 1
1Department of Math & Natural Sciences, Universitas Terbuka (INDONESIA)
Abstract
This paper presents an analysis of the implementation of practicum for students at the Faculty of Mathematics and Natural Sciences (FMIPA) Universitas Terbuka (UT) as part of a comprehensive effort to deliver an educational process that ensures the quality of the courses offered. As a faculty offering science courses, FMIPA is required to conduct practicum for courses where in the learning process students need to follow the process, observe the object, as well as analyze, prove, and draw conclusions to an object, state, and process of the material learned so that the students can answer questions obtained through inductive observation. To provide a complete learning experience in accordance with the targeted competencies to students in 16 practicum-courses offered, FMIPA has prepared two types of practicum, field and self-directed. Field practicum is carried out by conducting a survey to a practicum site using a questionnaire as an instrument, and/or an interview guide to interview the resource persons in the form of experiment, or observe the practicum object. Meanwhile self-directed practicum can be done anywhere (no laboratory required). To evaluate the effectiveness of practicum implementation, a study was conducted involving 77 students taking the practicum-courses. The study was carried-out through online questionnaires where respondents were asked to answer questions in four categories, namely congruency of the targetted and perceived-needed competences, comprehensiveness of the practicum guide, availibility of practicum equipment, and availibility and quality of supervisors. The findings indicate that overall FMIPA has organized practicum that could guarantee the quality of learning outcomes.
Keywords: practicum, field-practicum, quality assurance, self-directed practicum
1 INTRODUCTION
Faculty of Mathematics and Natural Sciences (FMIPA) Universitas Terbuka (UT) as an academic unit in UT that accommodates courses that require practices provides learning assistance in the form of practicum. Practicum is conducted for learning materials that require students to have practical skills. The practicum in Agribusiness Study Program is aimed at improving the competence of Agribusiness students through application, analysis, synthesis, and evaluation of theories contained in the modules (FMIPA-UT, 2011). Practicum is an integral part of learning process and can be utilized to build the full competencies of cognitive, affective, and psychomotor aspects of the student, despite the emphasis on psychomotor domain (FMIPA-UT, 2011).
Sagala (2007) defines practicum as a learning process in which students are given the opportunity to experience, follow the process, observe an object, analyze, demonstrate, and draw their own conclusions about an object, situation, or process. In line with that, Subiantoro (2009) said that in practicum, it is possible to apply various science process skills as well as the development of scientific attitude that support the process of acquiring knowledge (scientific products) in students because through practicum students have opportunities to develop and apply the skills of science process and a scientific attitude to gain knowledge. On the other hand Suparno (2007) divides the practice into two activities, namely guided or planned practicum and free practicum. Students' activities in guided practicum are limited to experimenting and finding results only because the whole experiment has been designed by the facilitator. The experimental steps, the equipment to be used, and the objects to be observed or researched are pre-determined by the facilitator. While the activities of students in free practicum more demanding students to think independently, such as how to assemble experiments, experiment and solve problems, facilitators only provide problems and objects that must be observed or researched.

203
There are 16 practicum courses offered by the Agribusiness study program, 4 courses used in 3 majors, 5 courses used in Agricultural major, 4 courses uesd in Animal Husbandry major, and 3 courses used in Fisheries major (detailed courses depicted in Table 1). Practicum is developed for subjects that require students to perform certain skills.
Practicum is divided into two, field and independent practicum. Field practicum is practicum activities conducted in the field by conducting surveys at a practicum site using questionnaires as instruments, and or interview-guidelines for interviewing resource persons. In addition, filed practicum can also take form of practice/experiment/observation of objects of the practicum. Meanwhile, independent practicum is a self-employed practicum carried out by students and can be done anywhere (not necessarily in laboratory), for example at student's house, in office where student work, or other places worthy of being used as a practicum. Independent practicum can be done in groups but the report should be made individually (FMIPA-UT, 2011).
Tabl 1. List of Practicum-Courses in Agribusniess Study Program
No. Courses Major Type of Practicum
A B C X Y 1. Programa dan Evaluasi Penyuluhan Pertanian √ √ √ √ 2. Manajemen Agribisnis √ √ √ √ 3. Studi Kelayakan Agribisnis √ √ √ √ 4. Metode dan Teknik Penyuluhan Pertanian √ √ √ √ 5. Dasar-Dasar Perlindungan Tanaman √ √ 6. Keteknikan Budidaya Ikan √ √ 7. Budidaya Ternak Unggas √ √ 8. Budidaya Ternak Perah √ √ 9. Budidaya Tanaman Pangan Utama √ √ 10. Budidaya Tanaman Perkebunan Utama √ √ 11. Bangunan dan Peralatan Kandang √ √ 12. Teknik Pembenihan Ikan √ √ 13. Pengolahan Hasil Pertanian √ √ 14. Teknologi Pengolahan Hasil Perikanan √ √ 15. Pemanfaatan Limbah Pertanian √ √ 16. Pengolahan Hasil Ternak √ √
Note: A=Agriculture B=Animal Husbandary C=Fishery X= Field Practicum Y= Independent Practicum
Independent Practicum is one of the breakthroughs of Agribusiness study program to facilitate students in conducting practicum required in the course. Through independent practicum, students can practice in their respective residence location according to their needs. Study program prepares a practicum guide for each practicum-course. This guide is structured in such a way that it can lead students to practice without direct guidance from any party (Susilo et al, 2015). To ensure the quality of this endependnet practicum, it is necessary to evaluate the implementation of practicum in the field.
The population of this research is all active student of Agribusiness study program at FMIPA-UT registrated in the first semester of in 35 UT Regional Offices (ROs). In-depth interviews were also conducted for practicum managers at UPBJJ-UT and lecturers at Agribusiness PS at central UT as the practicum manual. Questionnaires are given to all students online through an online tutorial website located at http://student.ut.ac.id on each subject practicing. Questionnaires sent back by the students there are 77 pieces.
Respondents were asked questions to capture their level of agreement on four aspects of practicum implementation (practicum preparation, practicum guidance, competence, and practice). For each of these aspects, the respondent is asked to provide an assessment in the numbers 1 through 5 (1 = strongly disagree, 2 = disagree, 3 = do not know, 4 = agree, and 5 = strongly agree).

204
2 RESULTS and DISCUSSIONS
2.1 Respondents’ Characteristics
From total 77 respondents, there were 26 (34%) female and 51 male (66%) which actually represents agricultural extensian worker, the day-today work of the respondents, populaton which mostly men. Meanwhile, in term of age, :most of the respondents (70%) were under 34 years or younger
Table 2. Age Distribution of The Respondents
Age (years) ‹ 25 25 - 29 30 - 34 35 - 39 40 - 44 › 45 Number (n) 28 12 14 15 6 2 Percerntage (%) 36 16 18 19 8 3
Currently, the tendency for the majority of agribusiness students ages 25 years and below. This is different from the situation 10 years ago where the average age of Agribusiness study program students over 40 years (Argadatta et al, 2008). The shift toward younger students is encouraging because it is expected to more easily absorb technological advances. Meanwhile, the majority of Agribusiness study program students are high school graduates (60%), followed by graduates of D3 extension (31%). It is interesting that the number of respondents who work as agricultural extension workers is less than that which is not. Of the total 77 respondents, only 21% were extension workers, 16% were not employed, and the remainder (63%) were administrative staff at schools in notary offices, and cleaning personnel. These diverse types of jobs show that their present type of work is not a barrier for them to become a bachelor's degree in Agricultural Extension and Communication. In term of domicile, majority (60%) of respondents live outside the city UT ROs. This is in line with the UT mission of providing access to world-class higher education for all levels of society through the implementation of various distance education programs to produce highly competitive graduates.
2.2 Practicum Preparation Aspect
Respondents’ preparation for the practicum was good. This is evident from the ownership of basic material books and practice manuals (Table 3). Respondents have also made good use of the UT online network facility, seen by the way they obtained guidance from the UT website by downloading from elearning.ut.ac.id/lm page. The smoothness of respondents accessing the guides through the UT website could be supported by the respondents’ relatively young age, which could be more technologically literate.
Table 3. Respondents’ Preparation for the Practicum (N=77)
Statements Percentange Yes No
Have a the module to be practiced 76,6 23.4 Have an independent practicum/practice manual 74.0 26.0 Obtain independent practice manual/practice through:
a. UT Website 63.6 36.4 b. Catalog 16.9 83.1 c. UT RO 18.2 81.8 d. Other students 13.0 87.0 e. Others 9.1 90.9
Get information about the implementation of independent practicum /practice from UT RO or Agribusiness Study Program
74.0 26.0
1.3 Practicum Guidance Aspects
The majority of respondents agreed (72.7%) and strongly agreed (16.9%) that the practicum guide was easily accessible. There are still 10.4% of respondents who say they do not know, disagree, and strongly disagree that the practice guide is easy to obtain. This will be an obstacle for them to practice. The ease of accessing this guide is due in part to the diversity of means used in distributing guidelines.

205
It was approved by 72.7% of respondents and strongly agreed by 16.9% of respondents.
A number of 57.1% and 13% respondents respectively agreed and strongly agreed that presentation of the material in the Practicum Guide was systematic. There were still quite a lot (29.9%) of respondents who stated that the presentation of material in the guidance is not systematic which in turn forcing Agribusiness study program to conduct research to find out which courses need to be improved. For clarity of practicum material, 83.1% of respondents agreed and strongly agreed that the material was clear enough. For the Language used, the majority of respondents stated that the languauge used were simple and easy to understand. Nevertheless, there were still 14.2% of respondents who felt that the language used in the guides was not simple and elusive. The guides were complete according to 80.6% of respondents. This results indicate that the Agribusiness study program needs to perfect the the incomplete guidelines.
Table 4. Respondents’ Perceptions of The Practicum Guide
The Practicum Guide is Percentage (N=77)
Strongly Disagree
Disagree Don’t Know
Agree Strongly Agree
easy to access 2.6 2.6 5.2 72.7 16.9 distributed using variety of media 2.6 3.9 13.0 72.7 7.8 presentated systematically 3.9 10.4 15.6 57.1 13.0 clear in explaining the materials 3.9 5.2 7.8 63.6 19.5 used easy and simple language 3.9 6.5 3.9 67.5 18.2 complete 3.9 10.4 5.2 66.3 14.3 clear in explaining how to write the report 3.9 9.1 6.5 68.8 11.7 clearly stated all aspects required in the report 2.6 6.5 11.7 74.0 5.2 explaining scoring system 3.9 6.5 23.4 62.3 3.9
The report writing guidelines, reporting aspects, and report scoring guidelines are aspects newly incorporated in the guidelines. This is related to the research of Susilo et al in 2015 stated that students still have difficulties in writing independent practicum reports. For clarity of report writing guidance, reporting aspects, and reporting guidelines the results are almost identical to the practicum manual. The majority of respondents agreed to all three. Only on scoring guidelines, respondents who did not know its existence were 23.4%. This situation is a warning to the study program to further clarify the scoring guide, and socialize it to the students.
2.4 Competencies Aspects
When asked about the suitability of competence that students will achieve in practicum/practice in accordancewith the curriculum, 67.5% of respondents agreed and 13% strongly agreed. Respondents who did not know accounted for 14.3% and the rest disagreed and strongly disagreed (Table 5). For questions about course materials, the majority of respondents also agree that the course material taken is quite helpful in carrying out the practicum/practice. There were 7.8% and 2.6% of respondents who disagree and strongly disagreed, although the percentage was very small but the study program will keep improving.
Table 5. Respondents’ Perceptions on Competencies in the Practicum
Statements Percentage (N=77)
Strongly Disagree
Disagree Don’t Know
Agree Strongly Agree
Comptencies to be achived in practicum is in line with comptenecies targtted in the curriculum
3.9 1.3 14.3 67.5 13.0
Learning material is sufficient to support the practicum implementation
2.6 7.8 9.1 62.3 18.2
2.5 Practicum Implementation Aspects
Students of Agribusiness study program must condut practicum to be able to pass the relevant course.
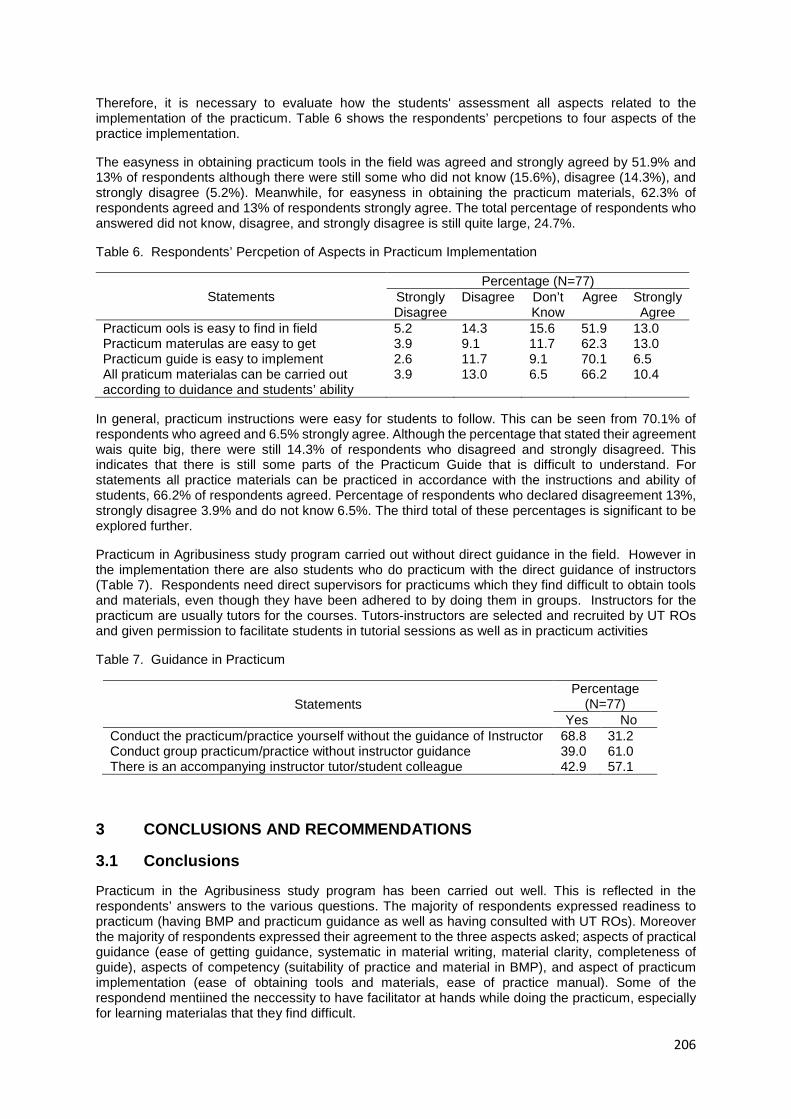
206
Therefore, it is necessary to evaluate how the students' assessment all aspects related to the implementation of the practicum. Table 6 shows the respondents’ percpetions to four aspects of the practice implementation.
The easyness in obtaining practicum tools in the field was agreed and strongly agreed by 51.9% and 13% of respondents although there were still some who did not know (15.6%), disagree (14.3%), and strongly disagree (5.2%). Meanwhile, for easyness in obtaining the practicum materials, 62.3% of respondents agreed and 13% of respondents strongly agree. The total percentage of respondents who answered did not know, disagree, and strongly disagree is still quite large, 24.7%.
Table 6. Respondents’ Percpetion of Aspects in Practicum Implementation
Statements Percentage (N=77)
Strongly Disagree
Disagree Don’t Know
Agree Strongly Agree
Practicum ools is easy to find in field 5.2 14.3 15.6 51.9 13.0 Practicum materulas are easy to get 3.9 9.1 11.7 62.3 13.0 Practicum guide is easy to implement 2.6 11.7 9.1 70.1 6.5 All praticum materialas can be carried out according to duidance and students’ ability
3.9 13.0 6.5 66.2 10.4
In general, practicum instructions were easy for students to follow. This can be seen from 70.1% of respondents who agreed and 6.5% strongly agree. Although the percentage that stated their agreement wais quite big, there were still 14.3% of respondents who disagreed and strongly disagreed. This indicates that there is still some parts of the Practicum Guide that is difficult to understand. For statements all practice materials can be practiced in accordance with the instructions and ability of students, 66.2% of respondents agreed. Percentage of respondents who declared disagreement 13%, strongly disagree 3.9% and do not know 6.5%. The third total of these percentages is significant to be explored further.
Practicum in Agribusiness study program carried out without direct guidance in the field. However in the implementation there are also students who do practicum with the direct guidance of instructors (Table 7). Respondents need direct supervisors for practicums which they find difficult to obtain tools and materials, even though they have been adhered to by doing them in groups. Instructors for the practicum are usually tutors for the courses. Tutors-instructors are selected and recruited by UT ROs and given permission to facilitate students in tutorial sessions as well as in practicum activities
Table 7. Guidance in Practicum
Statements Percentage
(N=77) Yes No
Conduct the practicum/practice yourself without the guidance of Instructor 68.8 31.2 Conduct group practicum/practice without instructor guidance 39.0 61.0 There is an accompanying instructor tutor/student colleague 42.9 57.1
3 CONCLUSIONS AND RECOMMENDATIONS
3.1 Conclusions
Practicum in the Agribusiness study program has been carried out well. This is reflected in the respondents’ answers to the various questions. The majority of respondents expressed readiness to practicum (having BMP and practicum guidance as well as having consulted with UT ROs). Moreover the majority of respondents expressed their agreement to the three aspects asked; aspects of practical guidance (ease of getting guidance, systematic in material writing, material clarity, completeness of guide), aspects of competency (suitability of practice and material in BMP), and aspect of practicum implementation (ease of obtaining tools and materials, ease of practice manual). Some of the respondend mentiined the neccessity to have facilitator at hands while doing the practicum, especially for learning materialas that they find difficult.

207
3.2 Recommendations
Agribusiness study program should keep mapping the various aspects of practicum which respondents stated as not good enough. The results of this mapping need to be followed up by improving the practicum guidelines so that the quality of the lab can be perfected.
REFERENCES
[1] Argadatta, E. Indrawati, P.R., Pertiwi, R., Noviyanti, & Yuliana, E. 2008. Tracer study alumni Program Studi S1 PKP FMIPA-UT: Sebaran, karakteristik, dan keberterimaan di masyarakat Indonesia (Tracer study of alumni of PKP Study Program-UT: Distribution, characteristics, and acceprance in Indonesia society). Jurnal Pendidikan Terbuka dan Jarak Jauh, 9(2). Jakarta: Universitas Terbuka
[2] FMIPA UT. 2011. Petunjuk Teknis Pelaksanaan Praktikum Program Studi S1 Agribisnis FMIPA-UT (Technical Guidance ffor Practicum Implementation at Agribussines Study Program FMIPA-UT). Jakarta: FMIPA Universitas Terbuka.
[3] Sagala, S. 2007. Belajar dan Pembelajaran (Learn and Learning). Alfabeta: Bandung
[4] Susilo, A dkk. March 2015. Evaluasi Penyelenggaraan Praktikum Mandiri Program Studi Agribisnis Universitas Terbuka (Evaluation of Independent Practicum Implementation at Agribussines Study Program Universitas Terbuka). Jurnal Pendidikan Terbuka dan Jarak Jauh, 16(1), 58-67.
[5] Subiantoro, A W. 2009. Pentingnya Praktikum Dalam Pembelajaran IPA. [Online]. Tersedia: http://vahonov.files.wordpress.com/2009/07/ pentingnya-praktikum-dalam-pembelajaran-IPA.pdf
[6] Suparno, 2007. Metode Praktikum dalam Pembelajaran. Downloaded from http://repository.upi.edu/operator/upload/s_d025_030315_ chapter2.pdf on April 15, 2016.

208
DEVELOPING PROFESSIONAL LEARNING COMMUNITY THROUGH BLENDED INSTITUTION BASED COLLABORATIVE PROFESSIONA L
DEVELOPMENT MODEL: AN INNOVATIVE PROJECT
Saroj Pandey
Director, SOE IGNOU, New Delhi, (INDIA)
Abstract
This Paper deals with an innovative project ‘Certificate Progarmme for Professional Development of Primary Teachers (CPPDPT)’ launched by Indira Gandhi National Open University in collaboration with of Kendriya Vidyalaya Sangthan (KVS) of the country, which has successfully addressed the limitations of traditional ‘one size fits all’ deficit model of professional development of teachers by developing a professional learning community of teachers using teacher empowerment approach to facilitate them to become lifelong learners, and construct their own knowledge based on their personal experiences of their own context. Drawing its theoretical frameworks from the professional learning models like that of Mitchell and Sackney(2001), Menon, 2004, Hord( 2004) Schmoker, (2006) and Kuijpers,Houtveen and Wubbels( 2010) ,etc as well as learning from the experiences of school based teacher training models of countries like US and UK, this project has tried to decentralize and democratize teachers’ professional development where teachers have been actively engaged right from identifying their own training needs to implementing the progamme successfully. The project, which aims at continuous professional learning of teachers has three major rubrics: developing awareness of primary teachers on emerging issues of primary education, improving their pedagogical content knowledge in subject areas, and providing them face to face opportunities in workshop mode to practice, challenge, reflect on their own understanding and practices to develop an insight on various issues and classroom problems which they face. Adopting a constructivist approach this six months certificate programme has removed the barriers of cascade approach being followed in the distance mode where the information flows from headquarter, to regional centres and programme study centres, this project directly deals with the programme study centres, academic counselors and trainee teachers, while keeping the regional centres in the loop and utilizes the expertise available in the KVS schools itself to facilitate and ensure authentic and context specific learning. This has helped to address the initial hesitation, apprehensions, and roadblocks of the KV teachers functioning as academic counselors for this programmes and developed their capacities as well, in addition to training the target teachers thus building the capacity of the institution as a whole. The paper also highlights the difficulties and road blocks faced during the implementation of this programme and further scope for improving its effectiveness. 1. THE CONTEXT
The education scenario of India has witnessed some major and significant epistemological shift in the field of education from traditional behviourist to constructivist perspective after the implementation of National Curriculum Framework for School Education (2005) and enactment of Right of children to Free and Compulsory elementarily education Act 2009 which call upon teachers to acquire new knowledge and competencies to play their role meaningfully. In the emerging context, teaching is conceived as a process to initiate, facilitate and promote students’ motivation, self- learning and self-actualization. Teachers are expected to facilitate conditions, which may help students to develop the ability to learn persistently, systematically, critically and creatively. Therefore, they are expected to acquire new knowledge, competencies and skills; and develop them continuously. In the present context they are also expected to de learn their existing practices and relearn the practices which may help them to become the facilitator of learning. Professional development of teacher on a continuous basis, utilizing both conventional and distance mode is, therefore, the only way to provide necessary orientation and exposure to teachers to the range of skills and activities which impact upon quality classroom transactions.

209
Though the role of teachers has changed from the imparter of knowledge to facilitator of conditions which ensure learning, the in-service training programmes in the country continue to be predominantly traditional one ‘size fits all’ deficit model that often fail to address the variability of the context in which teachers teach as well as diversity of students’ learning. These training programmes focus on why and what to change instead of how to implement these changes. It is presumed that the teacher will automatically be able to practice in classroom what s/he has learned in the training programme. Thus, while knowledge and awareness are generated through the external professional development model, it often fails to provide learning experiences required by teachers to enable them to implement this knowledge, once they return to the school, as majority of discourses were theoretical only. The cascade approach being followed for professional development programmes in India suffers from considerable transmission loss by the time it reaches to the end users. In addition, these programmes are ‘expert driven’ who often have no exposure to teaching at the stage for which they provide training. The information is provided in bits and pieces in adhoc manner resulting in little change in classroom practice of teachers. As suggested by Boyle et al (2003) such training programmes depend on exhortation rather than modelling, process, structured practice in which teachers play an active role. Such model of continuous professional development of teachers fails to address the changing perspective of learning recommended by NCF 2005 which focuses on personal experiences and knowledge construction process of learners and emphasises active learning, reflective thinking, critical pedagogy and problem solving etc. and expects teachers to be the lifelong learners accountable for their own learning. The emphasis now is on teacher empowerment that encourages them to take initiative in identifying and acting on their own individual needs. There is growing realisation that teacher learning needs to be situated in authentic contexts which are meaningful to teacher’s practice that is social in nature (Putnam & Borko,2000). Teacher’s professional development from this perspective acknowledges that learning is not limited to formal professional development, but takes place in all arena in which the teachers participate: the classroom, the community and the school environment (Borko, 2004). Teachers in the contemporary context are viewed as professionals who need to maintain the currency of their knowledge and to continue to expand and enhance their professional practice. There is a growing consensus in the literature regarding the elements of effective professional development for teachers. It incorporates principles of adult learning which is self-directed and self-motivated, and which gives opportunity to teachers for immediate application of new skills and knowledge. Effective professional development is embedded in the reality of schools and teachers’ work. It promotes critical reflection and meaningful collaboration. It is internally coherent and rigorous, and it is sustained over the long term. Therefore, a shift in CPD is being witnessed across various countries from one size fits all cascade model to school based in service programmes and collaborative professional learning communities which are more context specific, need based and highly participatory and carried by teachers themselves with little or no outside support. Hiebert, Gillmore, and Stigler,2002 have identified two basic paradigm shifts i.e 1) what it means to teach and learn; and 2) decentralization of authority. This perspective, which reflects the constructivist epistemology, calls for teachers to be reflective practitioners in addition to having content knowledge, and equipped with a range of pedagogical approaches to make informed professional decisions. Such change cannot be achieved through traditional passive model but needs a model where teachers are active partners right from identifying their own training needs to the execution of training programme as professional development yields best results when it is school based, and collaborative actively involving all teachers, focused on students’ learning, and linked to the curriculum (Hiebert, et.al,2002, p3). This approach is not only informed by constructivism but also gels well with the experiential learning models based on Knowles,1978 andragogical principles, as well as Kolb’s experiential learning model having the cycle of experiencing, processing, generalizing and applying. Focus of professional development of teachers is now shifting from one size fits all to institution based models of teacher training and ‘turn to the practical’ approach (McNamara and Murray, 2013; Beauchamp, Clarke, Hulme, and Murray, 2015; Brown and McNamara, 2005, 2011). The experiences in professional learning communities enhance the knowledge base of teachers and have significant impact on their classroom transactions (Campbell et al.,2004; Seo,2009; Opfer & Pedder,2010). In fact, collaboration, particularly within a community of practice is considered as a key factor for both creating and sustaining conditions for teachers’ learning (Cochran-Smith & Lytle,2009; Erickson et.al,2005). It provides opportunity to teachers to learn through lived experiences of their own and others in social participation. Critical reflection, analysis, synthesis and synthesis of these

210
experiences facilitate their knowledge construction process as the participants engage in dialogue and discussion, reflect on their own and other’s experiences and pedagogical practices, interpreting it jointly and then practicing it. This professional development model also subscribes to the shift in the epistemology of teaching learning towards constructivism in India post NCF 2005. 2. THE CERTIFICATE PROGRMME FOR PROFESSIONAL DEVELO PMENT OF
PRIMARY TEACHERS (CPPDPT) Guided by the experiences of international community on teachers’ continuous professional development models and grounded in the grass root realities of Indian education system the Certificate Programme for Professional Development of Primary teachers (CPPDPT) has been conceived with the objective to orient teachers working at the primary level, but having pre service training for the secondary level (B.Ed), towards the content and pedagogical requirements at the primary level and develop pedagogical skills to teach at the primary level. The programme has been conceived, developed and executed collaboratively by two organizations the Indira Gandhi National Open University(IGNOU), the largest open university of the world and Kendriya Vidyalaya Sangthan (KVS), the largest central government organization of government schools in India based on an Memorandum of Collaboration for organizing professional development programmes for teachers of KVS. This six months certificate programme considers teachers as continuous learners and provides opportunity to them to reflect on their own practices, continuously, evaluate themselves and adapt their classroom practices to implement the knowledge gained from this programme in their classroom once they graduate from the programme. Hiebert, Gillmore,and Stigler’s,(2002) visualization of two paradigm shifts ,i.e the conceptualization of teaching learning and decentralization of authority provided insight for planning and development of the CPPDPT programme as it gels well with the basic principles conceived by the National Curriculum Framework 2005 and subsequent changes in teacher preparation visualized in the National Curriculum Framework for Teacher Education (NCFTE,2009) brought out by the National Council for Teacher Education (NCTE). 3. SITUATING LEARNING IN THE CONTEXT OF LEARNERS:
DECENTRALISED & DEMOCRATIC PROGRAMME PLANNING
Some of the common issues for success of any professional development programme include the issues of the context of the target group, equity and diversity, professional culture, capacity building for sustainability, time for professional development and evaluation and assessment (Loucks- Hosley, et al.1998). The conventional models of professional development programmes are generally designed by external experts and have serious limitation as they often fail to address the real needs and pressing challenges which the classroom teachers face. Two prong strategy was adopted to address the issue of unrelated ness of training to the actual needs and context of teachers -,i) the content areas have been identified after having a need assessment survey of primary teachers working in KV schools across the country, and focused group discussion with 100 primary teachers of KVS on the difficulties and challenges they encountered during their day to day teaching, as well as interaction with the senior authorities of KVS on specific requirements of kvs teachers; and ii) situating the whole programme in the school context where these teachers have to function, by identifying the Programme Study Centres (PSCs), Programme Study Centre In charges (PICs), and Academic Counselors (ACs) from the same organization (i.e the KVS) itself. This ensured opportunity to impart training not only to the target primary teachers but also developed the capacity of their fellow teachers working at secondary and senior secondary stages, as well as the principal of the school (who functioned as PICs) on mentoring, scaffolding, organizing collaborative group work and engaging in assessment for learning, in addition to being oriented on the basic issues and concerns of education in the country. Therefore, the capacity building for the entire institution as suggested by Loucks- Hosley, et al.1998 could be achieved to a certain extent while executing this programme for the primary teachers. The basic principles which governed the conceptualization and execution of this programme has been:
• Situating the entire programme in the specific context of learners i.e the KVS schools; • Providing opportunity to teachers for active learning, critical thinking and reflection; • Facilitating knowledge construction process through collaborative learning opportunities; and

211
• Ensuring assessment for learning. The programme adopted a blended mode including both distance and face to face interaction facilitated by ICT support wherever possible. To sum up in one sentence the CPPDPT programme is for the teachers of KVS, of the teachers of KVS and by the teachers of KVS intended to built the capacity of the institutions as a whole while keeping the target group at the centre of all activities. 4. THE PROGRAMME STRUCTURE: CONTENT AND ACTIVITY AL IGNMENT
The programme has been developed on the premise that teachers already have a wide range of professional knowledge and skills. The content therefore needs to deepen professional knowledge and extend those skills in ways that improve their teaching-learning process. Therefore, content areas were interwoven in three broad rubrics in ways that improve their teaching-learning process. These are: a) Orientation of teachers on major issues, concerns and challenges of primary education in the country and their role as professionals in this context. Three courses have been designed under this component. b) Development of pedagogical content knowledge of teachers in basic subject areas i.e. language, mathematics and environmental studies taught at the primary level. c) Workshop Based Activities (WBA): The programe includes personal contact programme in the form of Workshop Based Activities of fifteen days duration adopting an eclectic approach integrating both behaviouristic and constructive pedagogical principles wherever apply and deemed necessary. Workshop activities have been planned in keeping with many research conclusions that opportuninties for teachers to engage in professional learning can have substantial impact on student learning (Phillips, McNaughton & Mac Donald (2001), Timperly (2006), English & Bareta (2006). Deliberate attempts have been made to include activities to ignite the cognitive faculties of learners and motivate them to reflect on their classroom situation and determine their own teaching learning strategy as visualized by Carr, Fung & Chan (2002). Therefore, while the self learning materials (SLM) constitute a primary learning medium subscribing to the traditional behviourist perspectives (Bates, 2016), inbuilt ‘questions for reflection’ and ‘activities for practice’ provide opportunities for reflection, critical thinking, experimentation and construction of knowledge to the teachers. This is consistence with the Klob’s experiential learning model discussed above. The salient feature of the SLM is that efforts have been made to include examples from KV schools with which the teachers can easily relate themselves. The workshop based activities is an important and specific component provides opportunity to teachers to apply and generalize whatever they have learnt through the theoretical discourses in the SLM. The SLM in the print medium is supplemented with power point presentations on certain identified themes, audio and video programmes recorded in the form of interview, panel discussions and lectures, etc. and supplied to the Programme Study Centres in advance. 5. TRANSACTIONAL MODEL: A DEPARTURE FROM OTHER ODL PROGRAMMES The programme visualized a school based collaborative design integrating both behaviourist and constructivist models wherever deemed necessary. The focus has been on providing opportunities for active engagement to learners to reflect on, share knowledge, and challenge their own practices and beliefs and construct new knowledge within their own school context. During this knowledge construction process they are supported and provided scaffolding by their own senior colleagues. The CPPDPT programme is, therefore, being offered twice a year, through programme study centers (PSCs) located in Kendriya Vidyalayas identified as Programme Study Centres and are sites for academic counselling, and the Workshop Based activities (WBA), unlike other teacher education programmes of IGNOU for which PSCs are activated at teacher education institutions. The principal of the concerned school is the programme–In-Charge (PIC), and the senior teachers of the KVS, instead of teacher educators, are appointed as academic counselors. However, it was not easy to ensure such departure from the routine face to face training mode as neither the teachers nor the academic counselors were ready and prepared to accept this role. While the participating teachers were more comfortable with their passive role at the receiving end as it was more convenient for them; the academic counselors and Programme in charges were not confident to play the role of mentors/ facilitators as they had to deal with their own colleagues and therefore were apprehensive, which was expressed by the reactions such as ‘ how can I evaluate/assess teachers of my own school’, ‘issues will arise if I give low grades to teacher of my own school’ and ‘I will not be able to deal with certain themes’, etc. This can be understood as teachers traditionally function in

212
isolation with little or no scope for collaboration. They appear uncomfortable in exposing their own knowledge of content and discussing or sharing the strategies they used to teach in the class. The comments of teachers reported above reflect their lack of confidence, fear of being exposed before their junior colleagues and resistance to change. These apprehensions were addressed by providing orientation to teachers and principals associated with the project as Academic Counselors and Prograamme in charges of the study centers on their roles and functions. The orientation of teachers and principals functioning as ACs and PICs were organiesd in five Zonal Institutes of Educational Training (ZIETs) of KVS across the country in two cycles of two days duration each, covering approximately 1000 ACs and PICs of 110 Programme Study Centres. This programme, utilizing both face to face and web-conferencing transactional approach oriented the participants on their roles and functions. The programme is unique in that a direct link has been established through the headquarter to the programme study centres instead of information being rooted through the Regional Centres (RCs) of IGNOU, which is the usual practice. Two ways communication has been ensured through constant e-mails and phone calls and any quarry is immediately attended. The model for programe delivery followed for this programme as compared to other programmes of IGNOU is given below.
.
IGNOU/ School of
Education
Regional Centres
Programme
Study Centre
Programme
Study Centre
Programme
Study Centre
IGNOU/ School
of Education
Traditional IGNOU
model
CPPDPT model
Regional Centres
KVS
Headquarters

213
6 OPPORTUNITY FOR ACTIVE LEARNING THROUGH WORKSHOP ACTIVITIES
The fifteen days workshop gives teachers a central role in their own learning. The workshop is visualized in a way where teachers have to be engaged in discussion, brainstorming, peer tutoring, and developing innovative activities for their classrooms. Workshop expects that teachers have gone through the SLM provided to them, have noted down their difficulties and come prepared in the workshop to clarify their doubts through discussion, debate and reflection on the theme being discussed as the workshop activities are closely aligned with the content of various courses. Resource persons in WBA play the role of mentor and facilitators helping teachers to clarify their own doubts and learn by active engagement in their own learning process. But it does not mean that one activity serves one purpose only, instead multiple objectives can be achieved through a single activity. For instance, in ‘where teachers ‘role play’ where teachers are positioned as learners, serves the multiple purpose of developing teachers own content knowledge, and insights into their own learning practices, greater empathy for students and provides opportunity for conversation about practices with other participants. Working in small groups provides opportunity to participants to discuss their doubts, apprehensions, overcome their hesitation and thus facilitates in developing collegial feeling among them. By the end of WBA participants reported less hesitant, and realized that their peers also experience similar instructional challenges.WBA also ensured that each teacher takes the leadership role in group works by way of rotating the group leader for each activity. The assessment system during the WBA is continuous and criteria based with ample scope for peer assessment as well as self assessment. 7. ROADBLOCKS EXPERIENCED IN IMPLEMENTATION OF CPPD PT
PROGRAMME Any deviation from the traditional practice and path is riddled with many issues and challenges. This programme also has to encounter and overcome a few. These include;
• The dependence of teachers on conventional face to face professional development programmes where information is spoon fed by the expert to the participants and teachers do not have to play an active role was found to be the greatest challenge to overcome. The success of ODL models is dependent upon the self motivation of learners, which was observed to be quite low in the initial cycle of this programme as the teachers felt that the programme has been thrust on them by their authorities whereas they have already been attending so many in–service programmes organized by KVS itself regularly. The issue was addressed by exempting the teachers attending this programme from their regular and mandatory in-service training programme, and giving due weightge to this certificate in the departmental promotions of teachers. It was observed that teachers’ motivation increased significantly so much so that those who had taken admission in the first batch in 2014 and did not complete the programme during its regular 18 months duration suddenly showed their strong willingness to complete the certificate programme even by paying the re admission fee from their own pocket, and special provision had to be made to re register them to complete their certificate programme.
• The requirement self study, completing assignments, attending workshop and appearing in the term end examination further aggravated their misery and resistance. Teachers especially expressed their resistance to Term End Examination (TEE) and felt it should have been ignored and some alternative means of assessment might have been followed.
• Lack of exposure of teachers, academic counselors and programme in-charge of PSCs to the distance learning system, and their own roles and responsibilities affected the smooth functioning of the programme. Though orientation programmes were organized to train these functionaries, yet, it was not sufficient to make them effective. This issue was addressed by the faculty members of the School of Education by engaging few sessions of WBA during their visits for monitoring the WBA. This provided hands on experiences to PSCs on ‘how to do’ and increased their motivation.
• Frequent transfers of trained PICs and ACs posed serious challenges for quality of this programme as many PSCs were found to be managed by untrained PISCs/ACs.
• Delay in official notification of the dates of WBA, which was the responsibility of KVS created hardships for participants as last minutes arrangements had to be made by them to ensure their presence in the venue of WBA.

214
• Communication gap between the PIC and enrolled teachers has also been observed at some centres and information/instructions given by coordinators of the programme to the PICs were not shared with the enrolled teachers in some cases.
• Availability of SLM only English medium has been observed by teachers coming from Hindi belt a barrier in their learning. SLM itself has been viewed as difficult by a few.
• In collaborative effort success depends on the sustained motivation of the collaborating parties to carry out the programme till its logical end which itself is a difficult task. With the change in authority in collaborating organization change in attitude towards the CPPDPT programme has also been observed which often interfered in decision making, especially in situations where very quick decision had to be taken.
8 CONCLUSION Change is a difficult process as it has to confront with lots of resistance and overcome many challenges, the KVS project and the CPPDPT programme launched under this project is by no means an exception. Efforts through this programme has been made to break away from the traditional face to face, as well as ODL model and facilitate an institution to develop a professional community in their own organization through collaborative efforts. While implementing this programme many barriers had to be passed and pathways had to be searched to sail smoothly. However, the programme has successfully covered more than eleven thousand primary teachers in five cycles of admission which indicates its success and achievement of the project objective. REFERENCES Bates, T. (2016). Teaching in a Digital Age. Retrieved on 13/1/17 from https://opentextbc.ca/teachinginadigitalage/ (Borko, 2004). Boyle, B., While, D ., & Boyle,T.(2003). A longitudinal study of teacher chnge: what makes professional development effective? University of Manchester, Institute of Political and economic governance, working paper no 1. Manchester, Beauchamp, G. Clarke, L. Hulme, M. and Murray, J. (2015) Teacher education in the United Kingdom post devolution: convergences and divergences, Oxford Review of Education, 41:2, 154-170. Brown, T. and McNamara, O. (2011) Becoming a Mathematics Teacher. Identity and Identifications. Dordrecht: Springer. Brown, T. and McNamara, O. (2005) New Teacher Identity and Regulative Government: The Discursive Formation of Primary Mathematics Teacher Education. Carr, R., Fung, Y. & Chan, S.K. (2002). Distance education for teacher education: HongKong experience. Journal of In-Service Education, 28 (1), 163-178. Campbell, A., McNamara, O., & Gilroy, P. (2004). Practitioner research and professional development in education. London: Paul Chapman Publications. Cochran Smith, M., & Lytle, S. (2009). Inquiry as stance: Practitioner research in the next generation. New York: Teachers College Press. Erickson, G., Brandes, G., Mitchell, I., & Mitchell, J. (2005). Collaborative teacher learning: Findings from two professional development projects. Teaching and Teacher Education 21(7) 787-798/ http://dx.doi.org/10.1016/j.tate.2005.05.018 Hord, S.M. (Ed). (2004) Learning together, leading together: Changing schools through Professional learning communities. New York: Teachers College Press.
215
Hiebert, J., Gallimore, R., & Stigler, J.W. (2002). A knowledge base for the teaching profession: What would it look like and how can we get one? Educational Researcher,31(5), 3-15. Knowles, M (1978). The adult learner: A neglected species. London: Gulf Publishing. Kuijpers, J.M., Houtveen, A.A.M. &Wubbels Th. (2010). An integrated professional development model for effective teaching. Teaching and Teacher Education 26. 1687-1694. Loucks-Horsley, S., Hewson, P., Love, N., & Stiles, K. E. (1998). Designing professional development for teachers of science and mathematics. Thousand Oaks, CA: Corwin Press. Menon, M.(2004). Networking for quality assurance in alternative modes of teacher education. India. In R.K. Rama& M. Menon (Eds) Innovations in teacher education- International practices for quality assurance (pp65-76). Banglore: NAAC. McNamara, O., and Murray, J. (2013) The School Direct programme and its implications for research informed tefile:///C:/Users/DirectorSOE/Desktop/coll%20model/working-p2imp.pdfacher education and teacher educators. York: Higher Education Academy Opfer, V. D., & Pedder, D. (2010). Benefits, status and effectiveness of continuous professional development for teachers in England. The Curriculum Journal,21(4),413-431. http://dx.doi.org/10.1080/09585176.2010.529651 Putnam, R &. Borko, H., (2000). What do new views of knowledge and thinking have to say about research on teacher learning. Educational Researcher,29(1),4-15. Seo, K. (2009). Teacher learning communities and professional development. The Journal of Korean Teacher Education, 26(2), 243-276. Smylie, M. (1988). The enhancement function of staff development: Organizational and psychological antecedents to individual teacher change. American Educational Research Journal, 25(1), 1-30. http://dx.doi.org/10.3102/00028312025001001 Schmoker, M. (2006). Results now: How can we attend unprecedented improvements in teaching and learning. Alexandria, VA: ASCD

216
ANALYZING THE CASES OF UT STUDENTS’ FINAL EXAMINATI ON RESULT
Dem Vi Sara 1, Lina Asnamawati 2
1UT’S Bogor Regional Office (INDONESIA) 2UT’S Bengkulu Regional Office (INDONESIA)
Abstract
The outcome of students’ learning process can be measured in many ways. One of them is through final examination at the end of each semester (UAS). Universitas Terbuka (UT) conducts UAS concurrently at every UT Regional Offices and UT branch offices overseas. This execution of UAS has been approved both nationally and internationally, as UT already has quality assurance system. UAS is categorized into two big programs: primary teacher program, and non-primary teacher program. Since the exam schedules for both programs are different, UT eventually needs to execute UAS four times in a year, twice for primary teacher program, and twice for non-primary teacher program. However, in 2016.2, UT’s Examination Center reported that there were cases (557,455 administrative cases, and 558,536 exam-rule violation cases) during UAS exam which caused the UAS score result to be withheld. This study provides qualitative descriptive analysis on the UAS cases at the UT Regional Offices in Bogor and in Bengkulu during the 2016.2 period. The investigation was carried out through document study, and by interviewing the sampling students, relevant UT staff, and UAS committee. The analysis begins with data review of the number of students’ registration, which is then followed by mapping out the number of occurrences and type of UAS cases. Next, we analyse the root cause of these UAS cases. Lastly, we discuss the solution and improvement activities as UT best practices. Keywords: Distance Learning, Examination, Quality Assurance 1. BACKGROUND
Universitas Terbuka (UT) is a state institution of higher education in Indonesia which implements a distance and open learning system. UT has thousands of students who are spread all over Indonesia as well as abroad. In every semester, UT evaluates its students learning process and results through different format, such as final examination (Ujian Akhir Semester/UAS), tutorials, practic or practicum, final assignment and academic papers. The evaluation is carried out to measure students’ understanding and mastery on the subjects (Tim Penulis UT, 2016). This evaluation is in line with government regulations (Peraturan Pemerintah 19/2005, article 22 paragraph 1) which stated that learning evaluation should include cognitive, psychomotor and affective aspect based on charcteristics of each of the learning subject. Furthermore, Purwanto (1984) stated that after completing a series of learning processes in one semester, the most important feedback expected by the students is the result of final examination. Students need the feedback not only to determine whether they have successfully passed the subjects but also to know their level of achievement throughout the course. Therefore, in UT, final examination becomes main focus of students’ academic activities. Belawati (2000) emphasizes that UAS is the primary control that defines the credibility of UT as education institutions. As consequences, ÚAS should be held and organized well. There are number of cases where UAS results that could not be issued by UT. In the second semester of 2016 (2016.2), for example, UT Examination Center released that there were many cases (including 557,455 administrative cases and 558,536 exam-rule violation cases) during the exam that caused the exam score result to be withheld. Students, in this case, are unable to get their exam results immediately. They are indeed upset and raised their complaints to UT requesting clarifications on why they are unable to get their exam results. As consequences, UT should face and overcome students’

217
complaints which are obviously time-consuming. These complaints have become a quite prominent issue faced by UT and the students since 2016.2. UT staffs get frustrated over these recurring problems. The students, on the other hand, are disappointed and not satisfied with support services provided by UT. The students felt upset knowing that they have already paid or registered for the exams but receive no feedback at all. In addition, it is feared that students’ learning motivation may decline in the future. These issues indicate that there are still gaps between UT as an institution and its students’ expectations. UT procedures and policies still do not meet students’ expectations and even worse, the credibility of UT in the future may be at risk. This report comprises the descriptive analysis study on UAS 2016.2 cases in UT regional offices Bogor and Bengkulu. This study aims at formulating best practices to anticipate and handle if the similar cases occur in the future. The report starts with the overview of UT and its regional office and followed by a brief decription of UAS as well as quality assurance. Description of number and type of examination result in 2016.2 are mapped and elaborated in Section 4 ”Findings”. In section 5 “Discussion”, the root causes of UAS cases are analysed and discussed. Lastly, suggested solutions and recommendations to anticipate and avoid the occurance of UAS cases are described in section 6 “Improvement Activities” and 7 “Conclusion”.
2. OVERVIEW 2.1. UniversitasTerbuka and Its Regional Offices
Universitas Terbuka (UT) is established as 45th higher education institution in Indonesia based on government regulations (Surat Keputusan Presiden RI) No.41/1984. Its vision is to be one of a center of
excellence in the world by 2020. UT has four faculties and one graduate program that offer around 46 study programs at various levels, including master, bachelor, diploma and certification program. In order to manage the courses offered by faculties and graduate program, UT classifies the courses into primary teacher program and non-primary teacher program. Primary teacher program is specially designed for elementary school teachers’ education and childhood teacher education, while non-primary teacher program includes any other courses beside primary teacher program. Since the exam schedules for both programs are different, UT eventually needs to execute final examinations (UAS) four times in a year, twice for primary teacher program and twice for non-primary teacher program. The activity of UAS of both programs are carried out in UT regional offices. UT regional offices are the service unit providing UT services domestically and internationally. UT regional office is UT technical unit in the location where it provides various administrative and academic services. Overall, UT now has 40 regional offices which are spread over in different provinces in Indonesia. Two of them are located in Bogor and Bengkulu. Operationally, UT regional office is responsible for organizing student examination in addition to its role as UT’s information center, registration counters, modules distributor, study group or tutorial coordinator and other technical fields. Therefore, regional office acts as UT’s extension at a very strategic position as it deals directly with the students. To execute these duties and responsibilities, regional office doesn’t work alone. It established several partnerships with public and private institutions. However, in this case, students registration, learning process and examination, are organized and executed by UT regional office, while the instruments and policies are determined by UT head office. Any student who has registered for courses is automatically registered as candidate for final examination participants. Each of UT regional office manages its students separately. The students are located either in cities or remote areas and have diverse background of cultures, conditions, ages, life styles or habits. In primary teacher program, the students learn in group based on their city or district, while in non-primary teacher program, they normally learn individually. UT Headquarter developed standardised policies and procedure for all activities and processes conducted by UT regional office. These policies and procedures are established to ensure the quality of services are consistent and controlled thus satisfy the customers and ensure continuous improvement. UT needs to maintain the quality by managing current available resources as well as internal processes.

218
2.2. Final Examination and Quality Assurance
Final examination (Ujian Akhir Semester, UAS) serves as the main quality control tool to maintain UT’s credibility as academic institution, since its result is the main instrument to evaluate the students’ learning progress and achivement. UT has put a high attention to final examination management service level, starting from preparing UAS activity to issuing UAS result. This commitment is not easily executed as Belawati (2000) stated that organising UAS is a very challenging activity at UT in terms of managing the students, examination schedule, as well as the examination location. In terms of quality assurance (QA), UT has obtained both national and international accreditations. Nationally, UT has earned the accreditation from Badan Akreditasi Perguruan Tinggi (BAN-PT), and internationally, UT has been awarded the Internasional Council for Open and Distance Education (ICDE), Standard Agency (ISA) and ISO 9001:2008 in Distant Learning Management from SGS and SAI Global. However, Suparman dan Zuhairi (2004) explained that the QA is not an effort to create a quality, but instead, an effort to improve the quality comprehensively, sistematically, and sustainably. The existence of the UT QA system guidelines called “simintas” indicates that UT already has an internal QA mechanism, whereby the implementation of QA system becomes shared responsibility of management and staffs, both at UT central and all its regional offices. The focus of this QA is to adequately provide superior services to the customers, in this case, to fulfill students’ needs for products, learning processes, and other services to support the graduates to possess the expected competencies. Superior service is the best service provided to the customers, either internal or external customers, based on service procedures and standards. This service aims to achieve customers’ satisfaction. (Pusmintas, 2011). The success of conducting UAS in UT relies heavily on the discipline to respect and comply with standard procedure contained in the UT QA system guidelines. In “Proctor Working Guidelines at examination room”, for example, there are a number of points consisting the duties and responsibilities, including: circulating the attendance list to be signed by participants who are attending final exam; and signing the result form of examination participants (examination-sheet/Lembar-Jawaban-Ujian/LJU or examination-book/Buku-Jawaban-Ujian/BJU). The person in charge of these duties and responsibilities has to strictly adhere to the regulations. 3. THE FRAMEWORK OF THE STUDY
The study is a qualitative descriptive analysis on the UAS cases at the UT regional offices in Bogor and Bengkulu during the period of 2016.2. The investigation was carried out by analyzing the documents and by interviewing the students, relevant UT staff, and UAS committee. The analysis begins with data review of the number of students’ registration. Registration process is done so that the students names can be officially listed as UAS participants. During the registration, a student has to submit a complete set of requested documents in order to obtain a billing and then to pay the bill through UT-appointed banks. The students are then expected to study hard by making full use of UT study materials and/or other resources in order to prepare well for the UAS. The determination in studying will help to relieve anxiety level and boost confidence in facing the UAS. Atfer UAS, the students will receive their UAS results. Some UAS results may encounter certain issues/problems. These problematic UAS cases are then mapped according to their frequency and types. Next, due to time constraint, these cases will be elaborated further but only with the data of UT Bogor alone. Then, the root cause will be investigated through a deeper study on the documents from UT Bogor and Bengkulu, and through some restricted interviews with UT staff, UAS officers and students. Lastly, it discusses on the solution and improvement activities to find UT best practices. In short, the framework of the study is as follows in ‘Fig. 1”:

219
Fig. 1. The Framework of the Study
4. FINDINGS
4.1. The Number of Students and Examination Partici pants Table 1 shows the total number of UT students and UT students registered in UT regional office Bogor and Bengkulu in the period 2016.2:
Table 1. The Number of Students 2016.2
Primary Teacher
Program Non-Primary Teacher Program Total
UT at all 216,041 111,121 327,162
UT Bogor 5,269 3,854 9,123
UT Bengkulu 3,965 4,762 8,727
Source: Sync Monitor of UT
In contrast, Table 2 shows the number of students registered as UAS participants in 2016.2 in UT Bogor and Bengkulu:
UAS Result
Mapping of UAS Cases (Frequencies & Types)
Solution and Improvement
Activities
UAS preparation
Registration Learning Process UAS Activity
The Cases of UAS Result
Analyzing UAS Cases
Reviewing Document
Interviewing UT Staff, Students, UAS Commitee
The Root Cause of UAS Cases

220
Table 2. The Number of UAS Participations 2016.2
Primary Teacher Program Non-Primary Teacher Program Total
UT Bogor 4,645 3,527 8,172
UT Bengkulu 3.448 4.223 7.671
Source: Sync Monitor of UT
Table 1 data is based on the number of bills generated by UT, while Table 2 data is based on the number of students who have fully-paid their bills and therefore automatically registered as UAS participants. 4.2. The Cases of Final Examination Result
UT Examination Center released data shows that there were many cases during exam in the period of 2016.2 which caused the exam score result to be withheld: 557,455 administrative cases, and 558,536 exam-rule violation cases. The cases reported by UT Bogor and UT Bengkulu in 2016.2 are categorized in the Table 3 below:
Table 3. The Number and the Types of UAS Cases 2016.2
Type of Case
UT Bogor UT Bengkulu
Primary Teacher Program
Non-Primary Teacher Program
Total
Primary Teacher Program
Non-Primary Teacher Program
Total
Registration Fee 24 - 24 10 - 10
Joki Punishment 41 19 60 102 182 284
Incomplete Personal Data 510 - 510 626 - 626
Administration 51 - 51 53 - 53
Semester Package Left Behind
6,764 - 6,764 403 - 403
Practicum - 13 13 34 8 42
Signature Differences - 10 10 19 51 70
Unregistration - 13 13 - 37 37
Total 7,390 55 7,445 1,247 278 1,525
Source: Processed internal document of UT Bogor and Bengkulu 2016.2
Table 3 shows that the cases occurred in those two UT regional offices are of similar type, both in primary teacher program and in non-primary teacher program. However, as a whole, there are more cases occurred in primary teacher program as compared to non-primary teacher program; 99,26 % in UT Bogor and 81,77 % in UT Bengkulu. To elaborate further, below is a more detailed breakdown of the cases of primary teacher program in UT Bogor, which can be considered as a representation of UT Bengkulu as well:

221
4.2.1. Registration Fee: 24 cases
This refers to those cases where students who have fully-paid the Registration fee and obtained the receipt, but their names were not found in UAS participants list. One possible reason for this is glitch/error in the Banking system during bill payment. Another reason is that when students are late for bill payment, but due to their valid excuses, UT still considered them for UAS eventhough the system was unable to accept late payment. The 24 cases recorded in UT Bogor did not actually come from 24 different students, but rather only from 7 students: 5 students with 15 cases in Bogor District, 1 student with 5 cases in Bogor Town, 1 student with 4 cases in Cianjur. Each of these students were registering up to 6 subjects. 4.2.2. Joki: 41 cases
This kind of case occurs when a student is found to have someone else to sit in the exam on behalf of him/her or when a student is found to be using any sort of communication device (e.g. mobile phone) during the UAS. In 2016.2, there were a total of 41 cases recorded in UT Bogor: 4 students committing 23 cases in Bogor District and 3 students committing 18 cases in Bogor Town. Each of these students were taking 5-6 subjects. In other words, these 41 cases were actually only due to 7 students. As per UT regulation (SK Rektor No.58 Year 2016), if a student is caught with this case in just 1 subject, then all the other subjects that the student is taking in the same semester will be automatically graded as E. 4.2.3. Incomplete Personal Data: 510 cases
This case happens when a student does not submit all the required documents during the initial registration process. These 510 cases indeed were due to 510 different individuals: 199 students from Bogor District, 107 students from Bogor Town, 144 students from Cianjur District, 16 students from Sukabumi district and 44 students from Sukabumi Town.
4.2.4. Administration: 51 cases
These consists of a few issues: (a) Practice score is not yet published upon deadline (38 cases); (b) different signatures are observed between the examination sheet/workbook vs. attendance list (12 cases); and (c) examination sheet was not signed by the student (1 case) or by the UAS examiner. In the case of Practice score, the subject grade will not appear on the exam result eventhough there is no problem during the exam (UAS). This is because the subject final grade is a combination of Practice score and Exam score. But, in the case of different signature or no signature at all, it is simply because the student does not follow the rule. The rule states that a student must put the same signature on his/her examination sheet/workbook and on the attendance list. 4.2.5. Semester Package Left Behind: 6,764 cases
This issue occurs when a student does not pay tuition fee for 1 or more semester-packages. Based on the regulation of the primary teacher program, every semester-package should be taken by the student in a certain period in a consecutive way. The semester package which is not paid by the students is known as semester-package left behind. The student, in this case, will still be liable to pay the semester-package in the next semester. But, in addition, the student will still need to pay extra for the tutorial sessions which were initially provided for free. Hence, due to this increase in cost/fee, there will normaly be delay in the payment. When the payment is often delayed, the student forgets to keep his/her bill properly and then asks for the bill to be re-printed. This re-printing of billing will eventually increase the number of unfinished cases. For UT Bogor, this case has the highest occurrence out of all the cases: 6385 cases coming from Self-paying students and 379 cases from students with scholarship.

222
5. DISCUSSIONS
Issues during UAS may arise because of several reasons: students’ physical condition, how responsible and caring are the UT staff, how discipline are the examiner/proctors during the UAS, and how reliable is computer system. This starts from the UAS preparation stage (registration and studying process) until the execution of the UAS itself. UAS result really depends on the above factors. According to UT staff, students in the Primary Teacher Program are divided into study groups. All the admininstrative stuff including subject registration is managed collectively by the leader of the study group. Hence the students have high dependency on their study group leader. This eventually causes some data inaccuracies during registration. A very contrast situation happens for the students in the non-primary teacher program. They normally come in person to register, hence, the data input is very accurate. This is further supported by Sadjati, I.M., Pertiwi,P.R., and Yuliana, R. (2011) who stated that if the students encounter difficulty in filling in the forms, there would be UT staff who would help them to rectify any potential mistakes. The accuracy of data during registration will certainly affect the accuracy of data of UAS participants. During the study period (tutorial), there are students who still think that a good tutorial grade would guarantee a passing grade in UAS. This means that the tutors have yet to generate enough confidence in the minds of the students in facing the UAS. The students still care less of their UAS preparation, physically and mentally. In actual fact, UT regulation states that tutorial grade will contribute to the final grade only when the UAS score is more than 30%. During the investigation of UAS cases, it was found that both students and proctor in the examination room have contributed greatly to the examination sheet error. The students may have committed the violation, and the examiner/proctor tends to ignore and let it happen. This is definitely in contrast to the idea that the exam regulations and proctor’s working guide must be strictly followed. The students expect clarity from the examiner/proctor when providing guidelines and giving instructions on how to fill in the LJU, proctors’ punctuality, proctor’s thoroughness in checking and signing the students LJU (Sadjati, I.M., Pertiwi, P.R., and Yuliana, E., 2011). Moreover, for the many complaints issued by students and UT staffs indicated that the information or commitment to the rules and regulations of examination are still poorly understood by the examination committee and especially by the students. In such case, (Sara, D.V., Kurniawati, Y., and Tampubolon, J.K., 2009) reinforces that proctor does not understand the condition of UT students which is diverse in ages, habits, experiences, and so forth. He/she assumed that filling up one’s particular on the examination sheet is a simple task that can easily be done by the students without any assistance. (Sara, D.V., Yunus, M., and Rusyana, E., 2011). Based on the data on the administrative mishaps before and during UAS, Sembiring, G.(2009) has even explained that UAS administrative case has become a major issue in 2008.2, when there were 100,602 out of 1,993,569 (5 %) UAS sheets in UT that could not be issued within the time window. In terms of emotion, there are students who feel anxious and panic when facing UAS. They are low in confidence level and worry that they would fail miserably. They would then start to be pragmatic and would not hesitate to commit exam-rule violations such as cheating, asking for answer from other students, even browsing for the answer on the internet via mobile phone. Niels, G.J., 2002 mentioned that students cheat because they do not have enough time to complete the assignment, they are lazy but wanting to get a good grade (IPK) without having to study hard before the exam. Rindfleisch dan Heide (in Stillerud, 2002) added that a person commits academic dishonesty because he/she believes that he/she should be able to win the competition and to control uncertainties around him/her. This bad habit (cheating) should ideally never happen, if his/her has enough preparation physically and mentally. To maintain the quality of UAS execution in UT, through SK Rektor No.58 Year 2016, UT rector has decided to enforce an academic penalty of grade E on that particular subject (for the case of cheating) and on all of the registered subjects in the same semester (for the case of Joki). An imperfect computerized system of the UT-appointed banks has also contributed to the UAS problematic cases. Students who have paid the tuition fee may not be listed as UAS participants. This is mainly because there is an error/glitch on the computer system. In addition, if the glitch/error happens on the last day of payment period, the payment date will be delayed as it can only be processed on the next day. For this case, however, UAS grading process would still be done despite some delay.

223
6. SOLUTIONS AND IMPROVEMENT ACTIVITIES In fact, UT has made various efforts to solve such error on issuing examination sheet. Indriasih (2001) suggested the improvement of proctors’ performance. Setiawati, I. (2002) suggested the improvement of certain points on the guideline. While Sudirah, et al (2005) suggested that the description, duties and responsibilities of proctors needs to be more socialized. However, even though the suggestions have been implemented, the execution is not easy and still requires a lot of attention and comprehension. Therefore, Tampubolon, J.K., and Kurniawati, Y. (2005) suggested that UT regional office intensively gives clear direction to proctors and socialize the procedure of filling up examination sheet and administration to UT students in every learning activity. For example, in new student orientation or in tutorials activities. The campaign about the importance of accuracy and precision of the registration, tutorials, and examinations administration can be conducted in these activities, i.e. to check the accuracy and validity of proof of registration and examination participant ID card immediately upon receipt. This is to anticipate the discrepancy between real facts with the data keyed in UT database. In addition, the original form of examination sheet should be introduced and the technical steps to fill it out should be clearly explained. This explanation should not only be conveyed orally or by pictures, but also be given as on-hand experience to students. New students need to be trained to fill out the examination sheet so that they are familiar with UT system. Students can also be asked to simulate filling out their particulars on examination sheet sample provided by the tutor/course coordinator before every tutorial test. This opportunity can be deemed as a strategy for the success on the final examination. In fact, the success of UT students’ is not only determined by the ability to absorb the theoretical concepts and answer the questions, but also by performing administrative discipline and technical accuracy in taking examination (including the process of filling up the particulars on examination sheet). This advice is raised as UT regional office has very strategic position to avoid/eliminate the activities/processes during examination implementation that does not comply with the regulation. By being ISO 9001:2000 certified, it is indicated that deviation from regulation should not occur and should be anticipated as UT regional office is considered capable of performing work procedures in accordance with standard guidelines. In other words, UT regional office is considered capable to maintain the commitment to service at UT based on the regulation, standard and ethics. In addition, the existing system needs to be improved so as not to negatively-affect the students. From the execution point of view, there needs to be a new breakthrough solution to tackle problems coming from external factors. To ensure that the one attending the exam is the real student (and not someone who sits in for other), it was proposed that the students who is taking the exam no longer need to sign both the LJU and BJU, but to scan their fingerprints instead. Meanwhile, to avoid the use of mobile phones during the exam, each exam location may be provided with a small metal detector (although still considered too idealistic) to facilitate the examiners in ensuring the examination rooms are clear from any mobile phones. Other supporting facilities also need improvement, such as making posters or banners or circulars about things students should not do during UAS (e.g. cooperating between one another and using communication tools).
7. CONCLUSIONS
Based on the discussion above, it can be concluded that as an institution that provides distance higher education with a vision to be a center of excellence in the world by 2020, UT should continue to improve itself and work hard to find best practices. UT needs to put a higher priority in providing excellent services in order to build and maintain its good image. UT has to be aware and understand the student’s needs and wisely responds to their complaints/issues. As the expected outcome of this effort, both UT and students will be equally satisfied: UT will be satisfied for its success in assisting the students starting from registration process until they obtain their learning results, and students will be satisfied because they receive excellent service from UT. In other words, having a better system to satisfy both UT and its students is expected in the future. This would mean that the credibility of UT is well preserved and the vision to be one of centers of excellence amongst distant higher education institutions in the world by 2020 can hopefully be realized.

224
REFERENCES [1] Internal Documents of UT’s Examination Center, and UT regional office of Bogor and Bengkulu.
2006.2. [2] Tim Penulis UT. (2016.2/2017). Katalog Universitas Terbuka. UniversitasTerbuka Jakarta. [3] Purwanto, M.N. (1984). Prinsip-prinsip dan Teknik Evaluasi Pengajaran .Rosdakarya, Bandung. [4] Belawati, T. (2000). Prinsip-prinsip Pengelolaan Pendidikan Terbuka dan Jarak Jauh. Jakarta.
Pusat Antar Universitas, Universitas Terbuka. [5] Suparman, A. & Zuhairi,A. (2004). Pendidikan Jarak Jauh. Teori dan Praktek. Pusat Penerbitan
Universitas Terbuka. Jakarta. [6] Pusmintas. (2011). Prosedur Pelaksanaan Ujian. (http://staff.ut.ac.id/pusmintas/
webpusmintas/iso.html) [7] UT Database: http://172.16.29.110/syncmonitor/raga_masa_mhs_reg_upbjj_p.php. [8] Sadjati, I.M., Pertiwi, P.R., & Yuliana, E. (2011). Faktor yang Berhubungan dengan Akurasi Data
Mahasiswa Peserta Ujian di UPBJJ-UT Jakarta dan Mataram. Jurnal Pendidikan Terbuka dan JarakJauh. Vol. 12, No. 1, Maret 2011, pp.66-76. LPPM-Universitas Terbuka.
[9] Sara, D.V., Kurniawati, Y., & Tampubolon, J.K. (2009). Implementasi Prosedur Pengawasan Ruang UAS Pendas UT di UPBJJ-UT Bogor. LPPM UniversitasTerbuka. Jakarta.
[10] Sara, D.V., Yunus, M., and Rusyana, E. (2011). An Effort to Minimize Student Mistakes in Filling up Their Identities on Examination Sheet at Universitas Terbuka. Paper presented in at the 25th AAOU Annual Conference in Penang, Malaysia.
[11] Sembiring, G. (2009). Temu Mitra UPBJJ-UT Bogor. Bahan Rapat Koordinasi Pengelola Pokjar. UPBJJ-UT Bogor.
[12] Niels, G.J. (2002). Academic IQ Practices, School Culture and Cheating Behavior. Winchester Thurston School.
[13] Stillerud, B. (2002). Behavioral Assumptions in Marketing Organizations: An Explorations of Dimensions of Governance, Role Stress and Organizational Outcomes. University of Kentucky. Gatton College of Business and Economics., unpublished manuscript.
[14] Indriasih, A. (2001). Evaluasi Penyelenggaraan UAS D-II PGSD di Kabupaten Pati. Lembaga Penelitian Universitas Terbuka. Jakarta.
[15] Setiawati, I. (2002). Evaluasi Pelaksanaan UAS Rumpun Mata Kuliah Keterampilan Berbahasa. Lembaga Penelitian Universitas Terbuka. Jakarta.
[16] Sudirah, dkk. (2005). Pengisian Format Status Kegiatan pada Pelaksanaan Registrasi dan Ujian di UPBJJ-UT. Jurnal Pendidikan Volume 6 Nomor 2 September 2005. Lembaga Penelitian dan Pengabdian kepada Masyarakat Universitas Terbuka. Jakarta.
[17] Tampubolon, J.K., and Kurniawati, Y. (2005). Persepsi Mahasiswa UT terhadap Pelayanan Akademik Universitas Terbuka. Universitas Terbuka UPBJJ Bogor. Jakarta.

225
QUALITY ASSURANCE SYSTEM IN OPEN UNIVERSITY: A CASE STUDY OF THE SCORING GUIDELINES AT MATHEMATHICS
DEPARTMENT
Tutisiana Silawati 1, Zulmahdi Dailami 2, Hasoloan Siregar 3
1Universitas Terbuka (INDONESIA) 2 Universitas Terbuka (INDONESIA) 3 Universitas Terbuka (INDONESIA)
Abstract
Research on assessment of 293 students’ essay test answer book of Mathematics Department has been conducted in Universitas Terbuka in its five Regional Centres i.e: Jakarta, Yogyakarta, Surabaya, Medan, and Palembang. Students’ tes answer books consisted of three subjects, namely 1) the comprehensive test of MATA4500/TAP, 2) the main course of MATA4111/Calculus II, and 3) a course taken by the studens in five regional centres of MATA4213/Numerical Methods. The sample consist of students who registered at the first semester of 2014, second semester of 2014, and first semester of 2015. The Students’ tes answer books for each course is evaluated by two lecturers from a local college, the qualification of the lecturers is magister of Math.The lecturer assesed students’ essay tes anwer books by using a scoring guide/marking schemes that created by the test developer from the Mathematics Departement. The results showed that, the differences scores of 13 out of 292 (95,55%) given by the two lecturers shows that does not exeed than 5%, it is in accordance with the Sistem Jaminan Kualitas (Quality Assurance System) Universitas Terbuka 2013, No. Document JKOP_UJ03-PK04 PK Examination of Test Results Description. Therefore, the Scoring Guidelines are good and clear. Keywords: Students’ test answer book, regional centre, scoring guidelines, quality assurance system
1 INTRODUCTION
Universitas Terbuka (UT), is a State University that implements a distance learning system, which means students learn using media, both print and non-print media. Therefore, UT students are expected to learn independently, by utilizing teaching materials that have been prepared for self-study by UT. Quality Assurance in general, refers to a process of defining and fulfilling a set of quality standards consistently and continuously with the goal of satisfying all consumers, producers, and the other stakeholders. UT formulated the university’s Quality Assurance System or Sistem Jaminan Kualitas (Simintas) in October 2001 (Tian B.and Amin Z., 2007). Evaluation of learning outcomes implemented in the form of final exams, comprehensive tests with scientific work, and Online Tutorial. Comprehensive test is intended to verify the mastery of students in a comprehensive field of science in the program Strata one (S1). The Comprehensive test material covers some of the support courses available in Mathematics Department. Since the first semester of 2015 the Comprehensive test score combined with scientific works that can be uploaded on UT web application via http://karil.ut.ac.id (UT 2017/2018 Catalog). A final exam may be an objective test (multiple choice) or a description test. The final exams answer is written for the objective test done on the Test Answer Sheet, where the student fills out the Test Answer Sheet using a 2B pencil. The final exams answers to the test description including comprehensive test are done on the students’ test anwer book. Assessment of students’ essay test anwer book conducted at five Regional Centres namely: 1. Medan (consist of Medan, Banda Aceh, Padang, and Pekanbaru), 2. Palembang (consist of Palembang, Jambi, and Bengkulu), 3. Jakarta (consist of Jakarta, Bandar Lampung, Serang, Bogor, Bandung, Pangkal Pinang, Pontianak, Palangkaraya, Batam, and overseas), 4. Yogyakarta (consist of Yogyakarta, Surakarta, Semarang, and Purwokerto), and 5. Surabaya (consist of Surabaya, Malang, Jember,

226
Denpasar, Mataram, Kupang, Banjarmasin, Samarinda, Makasar, Kendari, Palu, Manado, Gorontalo, Ambon, Ternate, Majene, and Jayapura). Examination of assesment of students’ test answer book involves lecturers from local universities at regional centres. The final exams and comprehensive tests equipped with Scoring Guidelines developed by lecturer in Mathematics Department as an assessment guide for examiners from local universities at regional centres.The Scoring Guidelines along with final exams and comprehensive tests are sent by the UT-Testing Center to five regional centres one day after the final exams implementation is completed. The results of the research are used to find out information about final exams and comprehensive tests Scoring Guidelines according to the examiners at five regional centres Perfection improvements can be made which in the end the research objective in order to obtain a good Scoring Guideline can be done.
2 ESSAY TES
The Essay Tes in general the number of test item less than the objective test, the student in answering the essay tes requires a long sentence and paragraph to answer the test questions. There are two types of essay tes, first explanatory test that are open answer test that is students are not given limitation in writing and organizing their answers and second limited answer test ie students are given specific limits and context in terms of form and reach of answers (Suwarto, 2010). Students in the essay test can demonstrate their ability to interpret facts and concepts and compose answers in sequence and integrated, and the process can be measured (Writing Essay Test Items). Students' distance learning performance can be measured by evaluating learning outcomes using the essay test (Nakayama, et al., 2010).
2.1 Essay Test Characteristics Characteristics of the essay test are, (1) in general one item contains some questions; (2) answers are given in written form; (3) answers are given in long descriptions. The positive aspects of the essay test are, (1) the essay test can assess students' understanding at a high level; (2) students can present their own ideas and thoughts; (3) the essay test can be prepared in relatively short time. The lack of a description test is, (1) the value may be different when judged by the same corrector at different times and / or by different corrector at the same time; (2) the length and complexity of the answers can cause problems in the assessment; (3) the time needed to correct the problem. (Suwarto, 2010).
2.2 Essay Test Assessment Assessment in the essay test have two types: Analysis Method and Global Method The Analysis Method uses an ideal answer whose value is arranged in detail step by step and each stage is assigned an answer value. The value given by the lecturer to the student in accordance with the number of stages of the answer. While the Global Method is the ideal answer is not shared in the specific stages, lecturers examine globally by assigning an overall grade of student answers (Suwarto, 2010). UT conducts examination of the results of the examination test at Regional Centres office, the examiner is not allowed to bring home students’ essay test anwer book along with other examination files. Examination of tests results is done by two independent examiners using the Scoring Guidelines. The maximum limit of value difference between the two examiners. for non-exact courses is 10%. As for the exact course is 5%. If the difference in value between two examiners exceeds the maximum limit, then the two examiners re-examine the students’ test anwer book. (Guideline Simintas 2013, No. JKOP_UJ03-PK04 Document). 3 SCORING GUIDELINES
Essay Tests and Comprehensive Tests equipped with The Scoring Guidelines developed by Mathematics departement lecturer (Tutisiana S, 2015). UT that implement learning using distance learning system. As consequences, assessment of students’ essay anwer book conducted at five

227
Regional Centres, so that scoring guidelines are the necessary guidance for examiners. The scoring guide is the lecturer’s reference in scoring the student's answers that contains the possible answers and scores appropriate for each possible answer (Simintas Guidelines 2013, No. Document JKOP_UJ03).
The Scoring Guidelines come with a score for each answer process or stages of answered made by the student. Guidelines were developed as a guideline Assessment scoring for lecturers who checked students’ essay test answer book. Therefore, lecturers at five Regional Centres examining students’ essay test answer book with the same standard. Everyone student essay test answer book examined by 2 correctors, the grade came from avarage between first corrector and secong corrector. Regional Centres selected based on the compliance with the examiner lecturer competency courses, examination capacity (the number of lecturer examiners vs. number of students), and ease of access of Regional Centres (Simintas Guidelines, 2013, No. Document JKOP_UJ03) 4 METHODOLOGY The study was conducted at UT’s Examination Centres at March-April 2016, intended for study how much differences grade of students between the corrector/examiner 1 with 2. Regarding the students’ essay test answer book which have been examined. The three courses examined namely: 1) MATA4500 / TAP, is the comprehensive test, 2) MATA4111 / Calculus II, is of competence subject, and 3) MATA4213 / Numerical Method, this course is registered by students representing 5 Regional Centers. Students’ essay test answer book examined for 3 exams periods: first semester of 2014.1, second semester of 2014.2, and first semester of 2015.1. The survey data for this study were collected from students’essay test anwer books for three courses at 3 exams periods, as shown in Table 1. Data for this study were analized using SPSS, t-test.
Table 1. Cources and Students’ Essay Test Answer Books
No Code/Course Students’ Essay Test Answer Books
1 MATA4500/Comprehensive 20
2 MATA4111/Calculus II 160
3 MATA4213/Numerical Method 113
Total 293
5 RESULTS
Assessment by examiners at Regional Centers for Three Courses
Table 2. Students’ Essay Test Answer Books for Three Cources
Examiners N Mean Std. Deviation Std. Error Mean
1st 293 33.57 21.260 1.242
2nd 293 33.16 21.327 1.246

228
Independent Samples Test
Levene's Test for Equality of
Variances t-test for Equality of Means
F Sig. t df Sig. (2-tailed)
Mean Difference
Std. Error Difference
95% Confidence Interval of the
Difference Lower Upper
Examiners
Equal variances assumed
.012 .914 .235 584 .814 .413 1.759 -3.042 3.868
Equal variances
not assumed
.235 583.994 .814 .413 1.759 -3.042 3.868
The t-Test results for all cources shown that no difference between the 1st examiner and the 2nd examiner. All this can be seen from sig (2-tailed) in independent sample test in t-test column. All values are significant at p> 0.05, which means there is no difference between the assessments given by the twoo examiners.
Assessment by examiners at Regional Centers for MATA4111/Calculus II
Table 3. Students’ Essay Test Answer Books for MATA4111/Calculus II
Examiners N Mean Std. Deviation Std. Error Mean
1st 160 34.08 22.415 1.772
2nd 160 32.33 22.413 1.772
Independent Samples Test
Levene's Test for Equality of Variances t-test for Equality of Means
F Sig. t df Sig. (2-tailed)
Mean Difference
Std. Error Difference
95% Confidence Interval of the
Difference Lower Upper
Examiners Equal variances assumed
.018 .892 .701 318 .484 1.756 2.506 -3.174 6.687
Equal variances not assumed
.701 318.000 .484 1.756 2.506 -3.174 6.687
The t-Test results for MATA411/ Calculus II cources. All this can be seen from sig (2-tailed) in independent sample test in t-test column. All values are significant at p> 0.05, which means there is no difference between the assessments given by the twoo examiners, shown that no difference between the 1st examiner and the 2nd examiner

229
Assessment by examiners at Regional Centers for MATA4213/Numerical Methods
Table 4. Students’ Essay Test Answer Books for MATA4213/Numerical Methods
Examiners N Mean Std. Deviation Std. Error Mean
1st 113 29.11 16.852 1.585
2nd 113 30.11 16.689 1.570
Independent Samples Test
Levene's Test for Equality of
Variances t-test for Equality of Means
F Sig. t df Sig. (2-tailed)
Mean Difference
Std. Error Difference
95% Confidence Interval of the
Difference Lower Upper
Examuners Equal variances assumed
.000 .997 -.448 224 .654 -1.000 2.231 -5.397 3.397
Equal variances not assumed
-.448 223.979 .654 -1.000 2.231 -5.397 3.397
The t-Test results for MATA4213/Numerical Methods cources shown that no difference between the 1st examiner and the 2nd examiner. All this can be seen from sig (2-tailed) in independent sample test in t-test column. All values are significant at p> 0.05.
Assessment by examiners at Regional Centers for MATA4500/Comprehensive Test
Table 4. Students’ Essay Test Answer Books for MATA4500/Comprehensive Test
Examiners N Mean Std. Deviation Std. Error Mean
1st 20 54.75 21.791 4.873
2nd 20 57.10 21.918 4.901
Independent Samples Test
Levene's Test for Equality of
Variances t-test for Equality of Means
F Sig. t df Sig. (2-tailed)
Mean Difference
Std. Error
Difference
95% Confidence Interval of the
Difference Lower Upper
Examiners Equal variances assumed
.017 .896 -.340 38 .736 -2.350 6.911 -16.341 11.641
Equal variances not assumed
-.340 37.999 .736 -2.350 6.911 -16.341 11.641

230
The t-Test results for MATA4500/Comprehensive Test cources shown that no difference between the twoo examiners. All this can be seen from sig (2-tailed) in independent sample test in t-test column. All values are significant at p> 0.05, which means there is no difference between the assessments given by the 1st examiner and the 2nd examiner
6 DISCUSSIONS
The t-Test results for either the course or for each course indicate no difference between the 1st examiner and the 2nd examiner. All this can be seen from sig (2-tailed) in independent sample test in t-test column. All values are significant at p> 0.05, which means there is no difference between the assessments given by the examiner 1 and 2.
In 2015, Tutisiana S, Zulmahdi D, and Hasoloan, have been doing research at 3 Regional Centres: Jakarta, Yogyakarta, and Surabaya for different subjects namely: MATA4436/Algebra II, MATA4323/Ordinary Differential Equation, MATA4321/Algebra I, MATA4317/ Analysis I, and MATA4320/ Analysis II. The results of the study stated that the Scoring Guidelines of subjects are good and equipped with clear steps so that the difference of perception between examiner 1 and 2 can be minimized. The statement is also found by observing that the difference between examiner 1 and 2 for the five subjects does not exceed 5%, in accordance with the Simintas Guidelines (Simintas 2013, No. JKOP_UJ03-PK04 Document). As recommendation this research should also be done for other courses in other Departments. REFERENCES
Katalog Universitas Terbuka 2017/2018. Departemen pendidikan Nasional UniversitasTerbuka
Nakayama, M., Yamamoto, H, & Santiago, R, “The Role of Essay Test Assessment in e-Learning: A Japanese Case Study” The Electronic Journal of e-Learning, Vol 8, Issue2, pp 173-178 (2010). Retrieved July 27, 2017 from https://books.google.co.id/books?id=8-JxfSWUkvoC.
Pedoman Simintas 2013, JKOP UJ03 Pemeriksaan Ujian Uraian RII.0. Retrieved September 13, 2015 from: http://pusmintas.ut.ac.id/index.php/pedoman-simintas/pedoman-simintas- 2015/manajemen-pembelajaran-jarak-jauh/category/391-27-jkop-uj03-pemeriksaan-ujian-uraian-rii-0 .
Pedoman Simintas 2013, JKOP UJ04 Petunjuk Kerja Pemeriksaan Hasil Ujian Uraian. Retrieved September 13, 2015 from: http://pusmintas.ut.ac.id/index.php/pedoman-simintas/pedoman-simintas-2015/manajemen-pembelajaran-jarak-jauh/category/391-27-jkop-uj03-pemeriksaan-ujian-uraian-rii-0.
Suwarto, ”Mengungkap Karakteristik Tes Uraian” Jurnal Widyatama, Vol 19 No 2, pp 91-106 (2010). Retrieved July 27, 2017 from: portalgaruda.org/article.php?article=268342&val=7107&title=Mengungkap Karakteristik Tes Uraian.
Tutisiana S, Zulmahdi D, Hasoloan S, “Penilaian Korektor Terhadap Pedoman Penskoran Ujian Uraian Matakuliah-matakuliah yang diasuh oleh PS Matematika” FMIPA-UT, Paper presented at SENARI III 2015
Writing Essay Test Items, Center for Innovation in Teaching & Learning. University of Illinois at Urbana-Champaign. Retrieved September 13,2015 from: http://citl.illinois.edu/teaching-resources/evaluating-student-performance/writing-good-test-questions/writing-essay-test-items
Tian, B, & Amin, Z, , “The Practice of a Quality Assurance System in Open and Distance Learning: A case sudy at Universitas Terbuka (The Indonesia Open University) International Review of Research in Open and Distance Learning, Vol 8, Number 1, pp 173-178 (2010). Retrieved July 27,2017 from: http://www.irrodl.org/index.php/irrodl/article/view/340/774

231
EMPLOYERS’ PERCEPTION ON THE IMPORTANCE AND THE SATISFACTION LEVEL OF IDENTIFIED SET OF SKILLS AMON G
OPEN UNIVERSITY UNDERGRADUATES
Sumalee Sungsri 1, Thirumeni T Subramaniam 2, Isti Rokhiyah 3, Hoang Tuyet Minh 4
1Sukhothai Thammathirat Open University (THAILAND) 2Open University Malaysia (MALAYSIA)
3Universitas Terbuka (INDONESIA) 4Hanoi Open University (VIETNAM)
Abstract
The desired outcome of any education programme can be evaluated using several aspects from multiple stakeholder perspective. A group of researchers from four open universities seek to obtain such perspective from the employers of their graduates. All higher education institutions place considerable importance on employers’ expectations of the quality of graduates that they produce. This is especially true among open universities where the targeted employers are often the actual employers of their graduates. Thus, their role as a key stakeholder is more prominent. The perception of the employers on the sets of skills that they consider important and satisfactory can be used to evaluate educational programmes and as a quality assurance measure. A survey instrument based on five sets of skills (Foundation, Professional Competencies, Personal Attributes, Organisational Skills and Technical Knowledge) was designed based on several studies to measure importance and satisfaction using two sets of 5-point Likert scales respectively. The targeted population in this study are the employers of the 2016 graduates from the Bachelor Degree programmes from all four universities. The findings help to rank the set of skills in terms of both importance and satisfaction for each university. These were then compared to identify common trends as well as the differences. The importance of the skills is crucial in assisting the institutions in learning about the needs of the employment market. The satisfactory level serves as one of the means to measure the quality of the education programmes offered. Thus, this study forms a part of the quality assurance mechanism in delivering education programmes that meets the employment market in a satisfactory manner.
Keywords: Employer, Importance-satisfaction Survey, Programme Evaluation, Quality Assurance
1 INTRODUCTION
The identification of employer as one of key stakeholders in the education industry is well justified in that the graduates produced by the education industry must have the employability skills that meets the needs of the employers. Other key stakeholders include students, academician, public, government and the organisation itself. In addition, specific interest group such as the national qualification agency which provides the national qualification framework that sets programme outcomes in a number of domains must be considered. Employability refers to the capability of obtaining and sustaining an employment. However, a consensus about what is subsumed under ‘employability’ is not evident from empirical research (Knight and Yorke, 2003). The search among the instruments used in employer satisfaction surveys shows there is even disagreement in how the set of skills are clustered. An example, the ability to adapt to change which is clustered under Professional Competencies and not under Personal Attributes (University of Texas-Pan American, 2001) as indicated in the instrument used by the University of Sydney Business School (2014). What is evident is the fact that subject-specific or technical knowledge and skills are not the only measure for ‘employability’. There is a multi-dimensional set of skills that could impact ‘employability’. Nevertheless, the effort to identify a set of skillsto meet the demand of the job market (employability)is highly useful in designing programmes and learning environments that could support suchan initiative.
The concept of employability refers to current needs of the labour market. Thus, it is time specific. The labour market itself exists within a specific socio-economic environment. Thus, any study about how a programme can be designed as an initiative towards employability must be timely and specific to socio-economic profiles that are have similarities. This is the fundamental understanding that had supported
232
the initiative to study the skills that are considered important along with the level of satisfaction among four open universities from Malaysia, Thailand, Indonesia and Vietnam.
2 IMPORTANCE-SATISFACTION SURVEY In understanding the need of the employers, it is important to understand how important the identified sets of skills are. The level of importance measured in this study refers to the emphasis placed by the employers on a number of skills. This is entirely different from the level importance emphasised for the purpose of learning within a field of study. This study is an effort to integrate the academic structure with practical implications. Therefore, it is not the only stakeholder feedback to be considered in the design of a programme. This purpose is integrated with the institutional effort to measure the level of satisfaction on a number of predetermined set of skills among the learners/employees as perceived by the employers as one of the key stakeholders.
The determination of the set of skills studied was carried out by clustering the required skills under five categories: (i) Foundation, (ii) Professional Competencies, (iii) Personal Attributes, (iv) Organisational Skills and (v) Technical Knowledge. These categories were based on existing employer satisfaction surveys carried out by a number of institutions. These categories are discussed below.
2.1 Foundation Skills In general foundation skills refersto skills that form the building block to any educational programme that enable learners to proceed to programme specific courses. Such skills also refer to essential skills required for a person to manage work and life in general. While selection of foundation skills may defer, it often includes communication skills and numeracy. The University of Sydney Business School (2014) lists five sets of skills under Foundation Skills: (i) Oral communication skills, (ii) Written communication skills, (iii) Numeracy, (iv) Capacity to develop knowledge and skills, (v) Capacity to analyse and solve problem. The identification of skills under the foundation skills may differ from one society/organisation to another. The communication skills could be narrowed to communication skills in a specific language (often English). As the world changes through different ages, from industrial revolution, the age of computer and internet, and now social media, new forms of literacyemerges. ICT Skills and information literacy are examples of skills that are no longer specialised skills but rather skills expected at most higher education institutions and workplaces.
2.2 Professional Competencies
Professional competencies refer the skills to the capacity of person to do something (to think, to collaborate, and more) that is required in a working profession. Nevertheless, there are competencies that are generic to a large number of professions. Examples include thinking skills such as critical thinking and creative thinking, conceptual skills, problem solving skills, scientific skills, research skills, collaborative skills, social skills, team skills, and lifelong learning skills. The Employer Satisfaction Survey carried out by The University of Texas-Pan American (2001) measures both Importance and Satisfaction includes three key dimensions: Professional Competencies (which includes Foundation Skills), Personal Attributes and Enterprises/Business Skills. In addition to the Foundation Skills, Professional Competencies proposed include Logical Thinking, Knowledge in Specialised Area, Critical Analysis, Research Skills and Ability to Adapt to Change. There are differences in the manner the items are clustered between the various studies carried out.
2.3 Personal Attributes Personal Attributesrefers to a wide category that depends on the personality of an individual. In this paper, the personal attributes considered refers to those that perceived to be relevant in employability studies. The Personal Attributes dimension categorised by the University of Texas-Pan American (2001) includes Self Reliance, Responsibilities and Interpersonal Skills. The ability to adapt to change is clustered under Professional Competencies, whereas The University of Sydney Business School (2014) groups Adaptive Skills and Cross-Cultural Skills with Attributes. Some of these skills are grouped under ‘Qualities generally expected of employees’ by the Hanover Research Council (2009). This grouping also includes Integrity as an item.

233
2.4 Enterprise/Business/Organisational Skills
This cluster listsgeneric business skillsthat most enterprise/organisations would consider as important skills that they would expect from their employees. Among the skills considered by the University of Texas-Pan American (2001) are ability to organize, time management and leadership. Such listing is also introduced by the University of Sydney Business School (2014) and the Hanover Research Council (2009). Decision making skills is a thinking skill (see professional competencies which is also linked with leadership. As such it is possible to find it listed under two different sets of skills. Another skill that can be included is the entrepreneurial skill. The acquisition of this skill integrates a set of various skills in a complex real-life business model environment. The rational for introducing entrepreneurship in higher education was highlighted by Moreland (2006).
2.5 Technical/Domain-specific Knowledge and Skills
Technical skills and domain specific knowledge (also termed as Knowledge and Understanding) were observed by several studies (University of Sydney Business School, 2014; Hanover Research Council, 2009; and University of North Dakota, 2011). This cluster includes capacity to use knowledge at workplace, specific knowledge (related to regulations/policies/standards). Hanover Research Council (2009) includes understanding of systems and organisations involving political system, market, culture, and people; which is also captured under general knowledgeof the surrounding environment. Lifelong Learning skill refers to capacity to acquire/develop new knowledge and skills is seen as a process that ‘empowers’ that could lead to gainful employment (Pologeorgis, 2012).
3 RESEARCH METHOD
The instrument used in this study consists of the five sets of skills: (i) Foundation; (ii) Professional Competencies; (iii) Personal Attributes; (iv) Organisational Skills; and (v) Technical Knowledge. There are five to six items clustered under each set of skills. The instrument was redesigned and adapted based several employer satisfaction survey instrument from several studies (University of Texas-Pan American, 2001; University of Sydney Business School, 2014; Hanover Research Council, 2009; and University of North Dakota, 2011). This study follows a preliminary study that was carried out to test its reliability. The instrument design includes two sets of 5-point Likert scales to measure importance and satisfaction respectively.
The targeted population in this study are the employers of the 2016 graduates from the Bachelor Degree programmes from four universities: OUM, STOU, UTI and HOU. Copies of the questionnaire indicating the names of their employee/graduate were sent to all employees. OUM received a total of 205 useable responses, while STOU received 363 useable responses. HOU has a smaller number of useable respondents of 85. UT has also received a number of useable respondents.
Data obtained from the submitted completed questionnaires were cleaned before it was analysed using descriptive statistics. The Statistical Package for Social Sciences (SPSS) software was used for this purpose.
4 FINDINGS AND DISCUSSION
The importance mean value was obtained for each set of skillsfor each institution. These values were used to rank the set of skills in terms of importance across all four universities. Comparison between the four institutions was made. The importance of the sets of skills is crucial in assisting the institutions in learning about the needs of the employment market.
In a similar manner, satisfaction mean value was obtained for each set of skills for each institution. These values were used to identify the sets of skills that were found to satisfactory across all four universities to identify the strengths of each institution. The satisfactory level serves as one of the means to measure the quality of the education programmes offered.
In the second part of this section, the data were analysed to identify the most important skill within a dimension. The satisfactory mean values were analysed to see if the most important skill were also indentified as the skill with high level of satisfaction. Any variation is identified as an opportunity to improve the curriculum. This was carried out with respect to each institution.

234
This study forms a part of the quality assurance mechanism in delivering education programmes that meets the employment market in a satisfactory manner.
4.1 Set of Skills
The ratings obtained by each university are of different levels. The overall importance mean for STOU is the highest at 4.12 followed by UT at 3.91 and HOU at 3.24 (a much lower value). The overall mean for OUM is much lower at 1.91, which raise some concerns. The overall satisfaction mean for STOU is also the highest at 4.21, followed by UT at 3.93, HOU at 3.20 and OUM at 2.37. While the range, the difference between the minimum and the maximum importance means also shows a difference. The range for HOU, STOU, UT and OUM are 0.70, 0.65, 0.51 and 0.37 respectively. Similarly, the range for the measure of satisfaction STOU, HOU, UT and OUM are 0.70, 0.45, 0.50 and 0.30 respectively.Such differences in terms of the rating between different institutions are not unexpected. The issue in any comparison of the subjective Likert scale response between groups that posses different referents has been reviewed in the study by Heine, Lehman, Peng and Greenholtz (2002). Further analysis on how the effect can be mitigated must be explored further in the interest of similar comparative studies.
In terms of the ranking order for Importance, both the employers of graduates from STOU and HOU have identified Personal Attributes as the most important set of skills. The importance mean for the Personal Attributes are relatively higher than the other sets of skills. The four other remaining sets of skills do not show a marked difference between them, at both STOU and HOU. The respondents for STOU, from both government and non-government organizations see that personal attributes, especially “responsible” and “integrity” as the most important skills. The findings are rather different at OUM and UT, where the Foundation and Technical Knowledge were ranked highest as equally important sets of skills. The third set of skills that was ranked as equally important differs: Professional Competencies was ranked equally important at OUM, while Personal Attributes was ranked equally important at UT. A key factor that may have caused the difference in ranking at OUM and UT compared to STOU and HOU as observed in Table 1 lies in the fact that the populations of graduates at OUM and UT consist largely of teachers.
Table 1: Level of Importanceacross the Sets of Skills
OUM STOU UT HOU
Foundation 2.13 3.75 4.10 3.03
Professional Competencies 1.96 4.19 3.76 3.06
Personal Attributes 1.76 4.40 3.92 3.73
Organisational Skills 1.79 4.12 3.62 3.20
Technical Knowledge 1.96 4.16 4.13 3.18
Overall Mean 1.91 4.12 3.91 3.24
Table 2 shows that generally the employers of all four university graduates gave highest score of satisfaction for the set of skills they considered most important. Studying the lowest satisfaction mean for each university can be a strategic decision is improving the performance of the universities. The lowest satisfaction mean for both STOU and HOU were obtained for the Foundation set of skills, while at UT and OUM, the lowest satisfaction mean were obtained for the Organisational Skills and the Personal Attributes respectively. However, it is necessary to note that the range of means for UT and OUM were only 0.5 and 0.3 respectively. Thus, the level of satisfaction among the set of skills are significantly different.

235
Table 2: Level of Satisfaction across the Sets of Skills
OUM STOU UT HOU
Foundation 2.37 3.51 3.93 2.75
Professional Competencies 2.36 3.95 3.51 2.90
Personal Attributes 2.07 4.21 3.65 3.20
Organisational Skills 2.17 3.89 3.43 2.92
Technical Knowledge 2.24 3.81 3.92 2.98
Overall Mean 2.24 3.87 3.69 2.95
4.2 Specific Skills
Table 3 shows the items with highest importance mean for OUM and the associated satisfaction mean values which incidentally are also the items with highest satisfaction mean. In other words, the employers are satisfied in the all items that they have rated as highly important. Nevertheless, there is a concern concerning the level of rating as there are generally very low (less than 3). Low importance means may suggest there are skills that are important but were not covered in this study. However, 80% of the respondents did not identify any additional skill for the open-ended question seeking for additional suggestions. The low importance level lies on the nature of the respondents who answered the questions for OUM who are largely government school management (usually the headmasters or headmistresses). This study however could serve as a guide for OUM in designing curriculum for its changing learner population where there is a migration from school teachers to employees in the industrial sector. In this perspective, OUM should view the findings obtained for STOU and HOU with interest.
Table 3: Level of Importance and Satisfaction at OUM
Importance Satisfaction
English Language Comprehension 2.28*, 0.83 2.54*, 0.78
Research Skills 2.17*, 0.77 2.50*, 0.77
Cross-Cultural Skills 1.88*, 0.65 2.17*, 0.74
Entrepreneurial Skills 2.12*, 0.86 2.38*, 0.75
General Knowledge 2.20*, 0.76 2.43*, 0.69
Table 4 shows the items with highest importance mean for STOU and the associated satisfaction mean valueswhich incidentally are also the items with highest satisfaction mean. For foundation skills, the employers rated ICT literacy skill and information literacy as the highest mean because they saw that these skills were regards as instruments for the employees to search for knowledge and information for their work. For professional competencies, the employers rated collaboration skill as the most importance because they saw that work cannot be successful by individual worker,team work or collaboration was needed for all kind of work. For personal attributes, the employers saw that responsibility and integrity are the importance characteristics of the employees that every organization looked for. They rated them the most important than the rest skills. For Organizational skills, the employers agreed rated that Time Managementwas the most important because the saw that every

236
process of work and to be success in work, employees needed to be able to manage time properly. Moreover, the employees needed to have organization and planning skill. For technical knowledge, the employers expected that the qualified employees should be able to apply knowledge and skills obtained from their study to their work. Next importance skill was lifelong learning skill because the employers thought that in today world, everyone have to learn continuously as lifelong learning in order to upgrade their knowledge and skills to go along with the rapidly change of social and environment.
The employers also rated all items with highest satisfaction mean. That mean they were satisfied with the skills that the university provided for STOU graduates. They would like the university keep on this process of teaching and learning given to students and adjust it to go along with the change of the society.
Table 4: Level of Importance and Satisfaction at STOU
Importance Satisfaction
ICT Literacy Skills 3.99*, 0.58 3.83, 0.64
Information Literacy 3.97, 0.62 3.86*, 0.59
Collaboration Skills 4.37*, 0.54 4.24*, 0.58
Integrity 4.67*, 0.51 4.40*, 0.53
Responsible 4.63, 0.51 4.30, 0.56
Time Management 4.30*, 0.53 4.05*, 0.56
Organization and Planning 4.23, 0.51 3.81, 0.62
Capacity to use Knowledge and Skills at Workplace 4.27*, 0.57 4.07*, 0.58
Lifelong Learning 4.26, 0.57 3.51, 0.82
Knowledge of Industrial Regulations 4.25, 0.58 4.05, 0.61
Table 5 shows the items with highest importance mean for UT and the associated satisfaction mean values. The employers of UT learners identified numeracy skills as the most important foundation skills and the type of skill they were most satisfied with. Similarly, they recognised collaboration skills among the most important and most satisfying professional competencies. Being responsible is identified as the most important personal attributes, but the level of satisfaction among all personal attributes is the same. Time management is recognised as the most important organisational skill which the employers were also satisfied with. All the technical skills were observed as equally important with almost equal level of satisfaction. The findings do not give much room in finding areas that could improve, except the technical skill concerning Knowledge of Industrial Regulations. The university could review relevant courses in their programmes to close the gap.

237
Table 5: Level of Importance and Satisfaction at UT
Importance Satisfaction
Numeracy Skills 4.27*, 0.72 4.05*, 0.69
Collaboration Skills 4.46*, 0.65 4.11*, 0.67
Responsible 4.49*, 0.60 3.97, 0.71
Interpersonal Skills 4.41, 0.63 3.97, 0.70
Integrity 4.38, 0.62 3.95, 0.64
Self-Reliance 4.38, 0.59 3.95, 0.66
Adaptability 4.34, 0.59 3.97, 0.64
Cross-Cultural Skills 3.92, 0.77 3.65, 0.70
Time Management 4.32*, 0.63 3.80, 0.66
Productivity 4.25, 0.65 3.81*, 0.63
Knowledge of Industrial Regulations 4.27*, 0.65 3.94, 0.67
Capacity to use Knowledge and Skills at Workplace 4.24, 0.67 4.01, 0.67
Lifelong Learning 4.21, 0.66 4.03*, 0.68
General Knowledge of Surrounding Environment 4.13, 0.74 3.92, 0.69
Table 6 shows the items with highest importance mean for HOU and the associated satisfaction mean values. For foundation skills, the employers rated English Language Oral Communication as the most important. This reflects Vietnam’s greater involvement with the global world and English is becoming more important. However, the satisfaction level for English Language Oral Communication is quite low. This finding reflects the late introduction of the English language to Vietnam. Before the domoi (Renovation), started in 1986, foreign languages that were taught at most Vietnamese schools were Russian and Chinese. The employers also rated ICT Literacy Skills as important. This reflects the fact that ICT has become an indispensible instrument at work (and also at home) in Vietnam, a country which enjoys high rate of ICT development. The employers are quite satisfied with the ICT Literacy Skills; and again this may imply the success of Vietnam in her ICT promotion strategies. For professional competencies, the employers rated Critical Thinking and Problem Solving as the most important skills; however, their satisfaction for this skill is quite low (in fact the lowest), at 2.84. This reflects the teaching and learning practice at Vietnamese schools, where the teachers talk and students listen. This way of learning and teaching is known to hinder the development of critical thinking and problem solving skills. For personal attributes, the employers recognise responsibility as most important. The level of satisfaction is also among the lowest. The gap between the employer’s expectation and the level of employee’s sense of responsibility must be explored further to understand the underlying reasons. Among the Organizational skills, the employers rated Productivity as the most important and their level of satisfaction is also the highest. This may reflect the hardworking nature of the Vietnam people. The employers rated Capacity to use Knowledge and Skills at Workplace as the most important technical knowledge, and they were highly satisfied with these set of skills. This is a good sign as it indicates the university has successfully imparted knowledge and skills that are applicable to the industry.

238
Table 6: Level of Importance and Satisfaction at HOU
Importance Satisfaction
English Language Oral Communication 3.68*, 0.38 2.31, 0.38
ICT Literacy Skills 3.13, 0.34 3.24, 0.35
Information Literacy 2.54, 0.36 3.29*, 0.35
Critical Thinking and Problem Solving 3.62*, 0.37 2.84, 0.35
Collaboration Skills 2.67, 0.35 3.16*, 0.35
Responsible 4.51*, 0.50 3.13, 0.34
Interpersonal Skills 3.71, 0.38 3.67*, 0.38
Adaptability 3.76, 0.39 3.61, 0.37
Productivity 3.75*, 0.39 3.14*, 0.34
Capacity to use Knowledge and Skills at Workplace 3.86*, 0.40 3.05, 0.34
General Knowledge of Surrounding Environment 2.68, 0.35 3.13*, 0.34
There are many factors that may influence on what the employers rate as most important. The findings in this paper seem to suggest that the factors must be viewed according to the type of the programme and therefore the industry they cater to. The teaching profession place a great emphasis on Foundation Skills, while the industry place greater importance to Personal Attributes regardless of the location of the respondents. The level of satisfaction cannot be compared in the similar manner. While the set of skills identified as most important were found to be satisfactory, it is not generally true. The level of satisfaction cannot be compared, and each university can only hope to identify possible areas of importance. Further effort to share best practices may be useful.
5 SUMMARY
The perception of the employers of four open universities’ graduates on important set of skills and the associated level of satisfaction are reported in this paper. The targeted employers are often the actual employers of their graduates, thus they are recognised as a key stakeholder. The perception of the employers on the sets of skills that they consider important and satisfactory can be used to evaluate educational programmes and as a quality assurance measure. The 2016 survey on five sets of skills: Foundation, Professional Competencies, Personal Attributes, Organisational Skills and Technical Knowledge identified Foundation Skills as most important for Teachers and Personal Attribute for the graduate in other industries. The findings helped to rank the importance of the identified set of skills for each university in the region. While, the satisfactory level serves as one of the means to measure the quality of the education programmes offered and in delivering education programmes that meets the employment market in a satisfactory manner. Opportunity for improvements were identified for each university in this study. These however are not comparable.
Acknowledgement
The authors would like to acknowledge the contributions of Alvie Simonette Alip (from the University of The Philippines Open University), Latifah Abdol Latif, Mohd Ghazali Mohayidin and Nur Amalina Diyana Suhaimi (from Open University Malaysia) in various aspects that led to the publication of this conference paper.

239
REFERENCES
Hanover Research Council. (2009). An Overview Employer of Employer Surveys.
Heine, S.J., Lehman, D. R., Peng, K., and Greenholtz, J. (2002). What’s Wrong With Cross-Cultural Comparisons of Subjective Likert Scales?: The Reference-Group Effect. J. of Personality and Social Psychology. 82(6), pp. 903-918.
Moreland, N. (2006). Entrepreneurship and Higher Education: An Employability Perspectives. Learning and Employability Series. The Higher Education Academy.
Pologeorgis, N. (2012). Employability, The Labor Force and The Economy. Investopedia
The University of Texas-Pan American. (2001). Employer Satisfaction Survey. Office of Institutional Effectiveness.
The University of Sydney Business School. (2014). ‘Employer Satisfaction Survey: Report for The Department of Education. The Workplace Research Centre.
University of North Dakota. (2011). 2010 UND Employer Satisfaction Survey. Office of Institutional Research.

240
QUALITY ASSURANCE IN OPEN EDUCATION A CASE STUDY AT HANOI OPEN UNIVERSITY, VIETNAM
Nguyen Thi Thuy Hong, Nguyen Viet Hung, Tran Thien Hoang
Evaluation & Quality Assurance Department, HOU, Hanoi, (VIETNAM)
Abstract Quality Assurance in higher education has increasingly been paid much attention to in open universities to confirm the quality of open teaching and learning process is equivalent to the one of conventional training. Over recent years, Hanoi Open University (HOU) has implemented the national system of Quality Assurance (QS) issued by the Ministry of Education and Training (MoET) to ensure that the training process satisfies the requirements of open education. However, the globalization tendency has required HOU to seek for new QS that is internationally applied to maintain, improve and enhance the quality of training, doing research and gradually to confirm its internal and external assessment and benchmarking. This paper firstly aims at clarifying the importance of QS in open universities. Next, the real situation of QS at HOU is generalized and analyzed in details. Basing on the analyses of the strengths and weaknesses of the current QS at HOU, the group of authors will propose some recommendations for an effective implementation of the standard Quality Assurance system at HOU known as ASEAN University Network - Quality Assurance (AUN-QA) to build culture quality in university. Key Words: Quality Assurance, Hanoi Open University, innovation, open learning quality, enhance, AUN-QA, open university 1 INTRODUCTION
Quality assurance was born with a mission to guide, control and make sure all the activities within universities to follow strictly the policies regulated. In fact, quality assurance has always accompanied with training operations, education quality improvement and universities’ stability and reputation. For today’s learning society, the role of quality assurance in conventional higher education and in distance one has been ever-increasing than before. With the rapid rise of information and communication technology, quality assurance in traditional universities and especially in open ones has not lost its educational values but changed its roles to adapt. 2 ROLES OF QUALITY ASSURANCE IN OPEN UNIVERSITIES Assisted technologies enable learners to access a distance course regardless geographical location, working conditions, age and time. Distance learning is considered to be an effective tool for promoting lifelong learning and development of the country. Distance learners take advantages of many information channels to absorb knowledge while reducing the cost of classroom building. However, traditional stereotypes have left implications for distance education through the society’s attitude towards the quality of the distance education - fail to meet the society’s requirements for the high-qualified workforce in the integrated era. It is an indispensable consequence of unsynchronized development in open and distance training. Therefore, distance education with typical features namely entrance admission, virtual learning environment and online evaluation and assessment require a strict supervision of quality control and quality assurance to demonstrate the quality of distance training is equivalent to the quality of conventional one. In fact, most open universities have paid adequate attention to building the sufficient criteria to make sure the quality of distance course meet the course’s objectives. However, the integrated era requires well-qualified labor force with competencies to work in the highly-competitive working environment. Therefore, it is essential for open universities to develop a standard framework of quality assurance, taking universities’ specific conditions into account to enhance the quality of distance courses.

241
From the experiences of many countries with progressive education, quality assurance has never been isolated from teaching and learning processes. The improvement of education quality should be parallel with the development of quality assurance to ensure the training quality meet the courses’ objectives and satisfy the community’s demands. Being aware of the importance of quality assurance, many universities associate the criteria of quality assurance with their development strategies. HOU has been continuously developing and achieving great results both in scale expansion, development of training branches and training moods especially growing distance education to meet the demand for higher education among the masses people in the society. 3 RESEARCH METHODOLOGY The information and data used in the preparation of this paper were collected from existing HOU’s self-assessment report in the 2011-2016 period. The data on quality assurance in education distance at HOU retrieved from the database of the Evaluation and Quality Assurance department. 4 RESULTS AND DISCUSSION
From the survey results of the HOU’s self-assessment report in the 2011-2016 period, the group of researchers have identified the real situation of distance training and of quality assurance at HOU, focusing on the strengths and weaknesses of the current of the QA system at HOU. The strengths and weaknesses of HOU’s current QA system are summarized the following: 4.1 Real Situation of Distance Training and Quality Assurance at Hanoi Open University The globalization tendency has brought HOU new challenges in producing more skilled and productive workforce to meet the increasing requirements of integration era. Along with other open universities, HOU has made great attempts to raise the national education level by providing learning opportunities to people throughout the country. With the total population of 29,845 students, HOU is one of Vietnam’s leading universities in open and distance training. HOU’s mission to build a learning society is shown in its training scope with the bigger proportion of distance training with nearly 61% (18,335 students) compared to regular and secondary one with over 31% (11,510 students). The following figure 1 illustrates the proportion of distance training and other training modes at HOU. It can be seen from the following pie chart (figure 1) that HOU’s training operations are mainly in the field of open and distance education. This requires QA system at HOU to take the quality of open and distance education provision into account to assure quality of distance training equal to the one of other training modes.
Figure 1: Proportion of Distance and Other Training Modes at HOU in School Year 2015 -2016
(Source: HOU Self - assessment 2011-2016 Report)
61%
39%
Open and
distance
students
Regular and
secondary
students

242
From its establishment, HOU has tried its best to increase the enrollment rate, paying much attention to growing the number of open and distance learners. The enrollment of distance learners into HOU went up unsteadily through the four-year research period. HOU has experienced an increasing demand for access to distance education. It is clearly illustrated from the following figure 2 that the number of the students enrolling into distance education in the first research year was the smallest with 2,503 students. This number reached its highest point (with 4,714 students) in the second research year but went down sharply in the third research year (with 2,863 students). The enrollment of distance provision in the last research year increased nearly one thirds in the preceding research year (with 3,926 students). This shows that the society’s recognition of distance education at HOU is not very high and so is its quality evaluation.
Figure 2: Demand for Distance Education in 2013 - 2016 Period
(Source: HOU Self - assessment 2011-2016 Report)
Over recent years, HOU has always associated its training’s operations with the criteria of quality assurance for its development basing on international Network of Quality Assurance in Higher Education (INQAHE, 2006). According to this Network of Quality Assurance, university’s quality accreditation need to base on a standard set of criteria for higher education’ quality in all fields. If there isn’t a set of criteria for higher education’s quality, verification of education quality will base on universities’ objectives which are identified basing on the development level of national socio-economy and universities’ typical conditions. In order to control the quality of distance education and assure it satisfies the courses’ objectives, HOU has implemented the national system of Quality Assurance (QA) issued by the MoET. This system of QA comprises with 10 criteria namely missions and educational objectives; organization and management; training curriculum; training activities; stakeholders; learners; science research and technology development; international cooperation; library, learning facilities and support; finance and its management. The quality assurance system enables HOU to control and assure the quality of all its training activities. The standard criteria of quality assurance manage the training modes at HOU, showing the following strengths. 4.2 Strengths of the Quality Assurance System at HO U
First, the QA system at HOU has managed the training quality by adjusting the teaching and learing processes basing on the learners’ feedbacks. Besides, this system of quality assurance aims at evaluating the levels of each training program to satisfy university’s missions. Second, the QA system with regulated criteria enables HOU to control and assure the training quality to meet the courses’ requirements and objectives. Basing on the strengths and weaknesses of the
0
500
1000
1500
2000
2500
3000
3500
4000
4500
5000
2012-2013 2013-2014 2014-2015 2016-2017
Demand for Distance Education in 2013 - 2016 Period

243
training program determined by the QA system, HOU will proposes recommendations to overcome the weaknesses of the training program to enhance the training quality. Third, the quality assurance system at HOU periodically provides training quality evaluation, training program’s effectiveness, stakeholders, university structure implemented by the training unit itself relying on the standard criteria issued by external organization specialized in quality assurance and by the accreditation organizations relying on the standards recognized at national or specialized levels. Beside the achievements brought about in the implementation of QA, HOU’s system of QA has shown the following weaknesses. 4.3 Weaknesses of Quality Assurance System at HOU Firstly, the QA of HOU emphasizes mainly on quality assurance of regular and secondary provision rather than assuring the quality of distance one. In other words, there is a lack of a framework to assess HOU’s readiness for education of distance provision. Face-to-face conventional and distance training are different training modes in terms of measuring criteria, methodologies, evaluation and assessment methods etc. However, both these training modes aim at providing learners with the same level of knowledge and competences. As mentioned above, distance education accounts for the main provision in university’s training scope (61% compared to 39%). However, HOU’s self-assessment report in the 2011-2016 period does not provide adequate information on quality assurance of distance training. It can be inferred from the report that HOU has not paid an adequate attention to assess the quality of distant education. Secondly, the evidence system concerning the training activities in HOU’s self-assessment 2011-2016 report is not sufficient enough to draw a general picture of HOU’s training operations. Therefore, it is difficult to assess the training quality at HOU in order to assure whether the training quality satisfies the courses’ requirements or not. Thirdly, HOU’s QA focuses on access, equity and capacity building in distance education rather than assuring the quality in the processes and products of distance education. There is inadequacy of evidence system on the quality of education training to develop a framework of QA to enhance the quality of open and distance courses. 4.4 Recommendations for Quality Assurance in Distan ce Education at HOU To assure the quality of distance education equivalent to the quality of conventional one, HOU needs to fulfill the following points: First, HOU should apply AUN-QA Network to improve quality assurance. HOU should follow the model of AUN-QA Network which comprises three components namely strategic (QA at institutional level), systemic (Internal QA system) and tactical dimensions (QA at programme level). These components are subjected to both internal and external QA assessments. The eleven criteria of AUN-QA Network in terms of expected learning outcomes, programme specification, programme structure and content, teaching and learning approach, student assessment, academic staff quality, support staff quality, student quality and support, facilities and infrastructure, quality enhancement, output need to be implemented. Second, HOU should fulfill the three fundamental principles of the ISO 19011 standard which are relevant to self-assessment and AUN-QA namely ethical conduct (foundation of professionalism), fair presentation (obligation to report truthfully and accurately) and due professional care (application of diligence and judgment to assessment). In addition, HOU should take two other principles concerning the assessment process in terms of independence (basis for the impartiality and objectivity of the assessment conclusions) and evidence (rational basis for reaching reliable and reproducible assessment conclusions in a systematic assessment process). Third, HOU should provide evidence of the quality assurance in distance education equivalent to conventional face-to-face education in terms of students’ completion rates and grades; effective provision of support, materials, teaching and learning; efficient supply of distance evaluation, assessment and feedback; sufficient engagement with distance students; satisfaction of distance learners and stakeholders with the quality and acceptability of the courses and qualifications; and

244
internal and external reviews to achieve quality improvement and to build a quality culture. To do this, HOU should carry out the procedure of AUN-QA Network which comprises of preparation of self-assessment report, writing self-assessment report, preparation of quality assessment, quality assessment process. Fourth, it is advisable for HOU should develop a legislative and regulatory framework of QA to guide training units in assessing their readiness to embark on distance training and to maintain this training mode effectively. The virtual learning environment requires a specified criterion of QA for distance training provision in order to control and to confirm the quality of distance training equivalent to the quality of conventional one. It is very useful for HOU to consult the QA framework for distance education (suggested by Ozkul and Aydin, 2011) which consists of four components namely institutional policies (vision, mission, goals and leadership), structural arrangements (technical infrastructures, organizational structures, human resources, student support systems, measuring and evaluation), program and content development processes (curriculum, course design, course production) and course delivery process (course delivery). Fifth, HOU should record typologies and extent of online, blended and distance education at the institutional and national levels to demonstrate its quality of outcomes. This enables HOU to compare its training quality with the one of other universities and to monitor its own progress. HOU should measure QA of e-learning instrument through reference tool for design and assessment of e-learning program to make sure the students have actually developed the pre-specified competences. The QA system in distance education at HOU must ensure that its graduates are well prepared and qualified for the job market. The qualifications in terms of data analysis, numeracy, problem solving, computing skills, capacity to communicate and work effectively in teams are highly valued. 5 CONCLUSION Developing QA for distance education at HOU is essential to show that HOU has sufficient conditions to offer distance education to the society. A well-defined QA policy framework for distance education assures that the quality training is delivered to both students and the public. HOU needs to perfect the current system of QA to make sure all training operations follow regulated principles and meet the courses’ objectives. Initiating a new regulatory process and aligning the specific criteria of QA for distance education provision is necessary to satisfy international requirements for accountability and recognition of distance learning. REFERENCES ASEAN University Network. (2015) Guide to AUN-QA Assessment at Programme Level. ASEAN
University Network, Chulalongkorn University Phayathai Road, Bangkok. Darab B. and Montazer. Gh.A. (2011), An Eclectic Model for Assessing E-learning Readiness in the
Iranian Universities. Computers & Education. ENQA (2005). Standards and Guidelines for Quality Assurance in European Higher Education Area.
Helsinki: European Association for Quality Assurance in Higher education. http.//www.enqa.eu. HOU Self - assessment Report 2011-2016. (2017). HOU Internal Documents. Ozkul, A.E. and Aydin, C.H. (2011). Open and Distance Learning in Turkey: Current Status, Future
Directions, Paper Presented in IETC 2011 (International Educational Technology Conference, May 25-27 2011), Istanbul, Turkey.
Stella A. and Granam A. (2004). Challenge Quality Assurance in Distance education: the Challenges
to be Addressed. Higher Education.

245
E-LEARNING MATERIALS DEVELOPMENT AND PROVISION FOR LEARNERS AT HANOI OPEN UNIVERSITY (HOU)
Tran Thi Lan Thu
E-learning Center, Hanoi Open University (VIETNAM)
Abstract
E-learning materials take an important role in E-learning. This is also the most important condition for maintaining, developing and assuring the quality of training, especially for tertiary education. E-learning resources are plentiful, practical in terms of content, diverse in type and form of design to help self-study/distance learners learning anytime, anywhere, maintain or increase the learning motivation of the learners, and especially it makes quality assurance in e-learning. This article mentions to the development of HOU's e-learning materials and the provision of e-learning resources for undergraduate degree courses at HOU. The article also outlines some of the findings from statistics and student surveys on e-learning access and the level of meet the demand of learners between types and learning forms of e-learning materials have been provided by HOU. Keywords: E-learning materials, e-learning resource, provision of e-learning materials. 1 E-LEARNING MATERIALS AND ITS ROLE IN ONLINE EDUCA TION
E-learning materials are "learning materials digitized to a specific structure, format and script, stored on a computer for computer-aided instruction and learning. Digital formats can be text, slides, data tables, audio, images, videos, interactive applications, and even composite documents of the aforementioned formats". Digitization here means the use of digital technology to convert printed forms of text, traditional text into digital form so that information can be processed, stored and transmitted. Via digital devices and online. E-learning materials users in education and training institutions consist of 02 main: students and lecturers. At universities, institutes, e-learning material resources is one of the conditions to maintain, develop and ensure the quality of training. This is reflected in the Vietnam Higher Education Law issued in 2012, chapter VII, article 50, section 4 on "maintaining and developing conditions for quality assurance of training". E-learning materials which are rich in content and diversity of forms will help universities and institutes satisfy the demand of teaching and learning, especially distance learning, online and help learners easy to study anywhere and anytime. It can be concluded that e-learning materials are an indispensable part in for the demand of teaching and learning online at universities and institutes. The use of e-learning materials makes learners easy to master subject knowledge through images, audio, video, virtual demonstration models, … supplemented for the subjects, motivate learners, take initiative and avoid the phenomenon of boring with their own learning. Therefore, finding the sources of learning materials that meet the demand of learners themselves becomes important. In distance learning and online learning requires from the teacher the ability to self-study, innovate teaching methods, improve self-knowledge, and create new ones that are communicated to learners. Especially for teachers, the method of transferring knowledge to learners is very important. Today, conveying knowledge through the "lively visual" method has become popular with all learners. E-learning materials such as sound, images, video... support the lecture of the instructor becomes richer, more lively, easy to make the attention of the learner.

246
With the rapid development of information and communication technology, e-learning materials: - havecreated an environment and equal opportunity for all to have the opportunity to use
materials for their learning and research. That because learningmaterial resources, especially e-learning material resources, are not limited to space and time;
- give learners a new, fast, convenient, multi-access form of documentation - and helps learners have more choices in accessing reliable and quality resources for their
study plan and self improvement. Some requirements for e-learning materials:
- E-learning materials must be accurated: E-learning materials provide knowledge to learners and are the foundation for the learning process so that the knowledge provided must be accurated and accorded with the provisions of law and regulations.
- E-learning materials must ensure consistency: E-learning materials in online education include many interrelated components: multimedia lecture, text lecture, question bank, case study, each of which, in different formats and ways to convey knowledge to learners. The components must be consistent in terms of content, information, avoiding the same problem but each component of the data provides conflicting information.
- E-learning materials must meet the demand and characteristics of learners: For each object learners have different needs and characteristics, the scope of knowledge and the way they absorb is different. E-learning materials in online education must be built in accordance with the demand and characteristics of online learners to determine the extent of knowledge as well as how to transmit content sensibly and effectively.
2 E-LEARNING OPERATION OF HANOI UNIVERSITY UNIVERSI TY
2.1. E-learning system The E-learning system for e-learning courses in the Hanoi Open University is built in accordance with the method of organizing classes and adaptation of the learner's self-study and self-study method. This system has met the basic learning activities of learners, is periodically upgraded and offers new features. IT systems rely on multiple systems integration and support. The systems used include: LMS (learning management system); LCMS (Content Management System); Helpdesk supports learners; Classroom Forum; Website portal provides information for trainees; Online classes provide real-time classroom; Management system. 2.2. Classroom e-learning activities E-learning classes are implemented with the following basic activities:
(1) Studying: Students learn with the learning materials provided on the system; (2) Interaction: The interactions between trainees, trainees and instructor are mainly through the following: classroom forum, real-time online classroom, e-mail, and other online information sharing, … (3) Practice: Students do quiz exercises and case studies. (4) Examination: conduct regular assessment including attendance assessment, midterm examination, and the completion of the course. The final exam offline on the campus.
2.3. Support learners With the characteristics of distance learning and e-learning, learning support plays an important role in organizing a successful, effective training course. Learning support for learners aims to:
- Create a link between the students and the school - Ensure continuous learning, effectively - Reduce dropout rate.
2.4. Instructor and tutor Instructor and tutor who participate in online and e-learning program, in addition to their professional qualifications, also have the skills to teach on e-learning system environment. Prior to teaching, faculty

247
members need to complete a training course to understand e-learning, the e-learning process, and the content preparation requirements, the facilities, the tasks and schedule weekly. In addition, during the teaching process, instructors need to ensure that they adapt the deadline for answering questions and comments from students, giving marks. 2.5. Technical staff Technical staff who develop user manual for each module in the system; User training instruction for students, lecturers, administrators; Monitor the operation status of the system, admin the system data generated during the operation; Receive feedback from users to propose system upgrades. 2.6. Advisor and administor staff Advisor staff have responsibility of training program management, training plan, course arrangement; manage student profile information, student learning process and assessment; Consult and assist students with learning methods in e-learning system, the administrative requirements, ensuring the continuous learning of students. 2.7. Course supervisor team Course supervisor have responsibility to assistinginstructors in online classroom; monitor the preparation all the content for the course before starting; support instructors to manage the forum and motivate students and instructors’ interaction; manage the deadline of feedback from the instrutors to students; receive feedback from students, lecturers on learning materials, training programs, e-learning technology requirement, ... for transfering to the relevant department for settlement; 3 THE DEVELOPMENT OF E-LEARNING MATERIALS IN HOU 3.1. Materials component Hanoi Open University has 179 e-learning materials. The learning materials system is built in a variety of formats, implement IT and lecturing techniques. Currently, the standard learning materials for E-learning courses offered to students include: E-textbooks, Self study guide, Syllabus and learning plan, Multimedia lectures (audio, video, slide), Topic lectures (audio, video, interactive, slide), real-time classroom lectures recorded, Test and practice questions bank, Subject-related case studyfor discussion, Exercise skills, group exercises. 3.2. E-learning material team The e-learning material developer team consists of 3 main subjects: Lecturer (SME), Instructional design (ID), Media Developmental (MD).
3.3. The process of e-learning materials developmen t The e-learning material development process consists of four phases: - Phase 1: Content Design
This phase involves the participation of ID and SME, in which SME focus to the professional content and proposed teaching methods and the appropriate form of teaching organization.
- Phase 2: Teaching design This is the formal design phase of e-learning lecture. Depending on the content developed in Phase 1, ID and MD will determine the form and presentation method of the lecture in order to transforming the content of knowledge accurately and effectively.
- Stage 3: Content Development This is the process of setting up, configuring all components of each lecture on the display screen in accordance with the principles of content design, linking those components, editing audio, images and synchronize. By the end of this period a complete e-learning material was obtained.

248
- Stage 4: Evaluation and approve
E-learning materials was completed must be tested, evaluated and approved by all developer team.
These four phases can be generalized through the following table: Phase Steps Person
Content design
1 Analyze needs and characteristics of learners SME
2 Outline the contents of the lesson 3 Proposed content of each lessons
ID, SME 4 Develop the principles and objectives of teaching 5 Design scenario 6 Compose questionnaires SME 7 Evaluate teaching process ID, SME
Instruction-al design
1 Learning Flow design ID 2 Interface design
3 Storyboard design 4 Technology implement decision
ID, MD 5 Process evaluation
Content develop-ment
1 Development planning MD 2 Decide on development tool
MD, ID 3 Layout design 4 Design text data
MD 5 Graphic data design 6 Audio data design
MD, ID, SME 7 Video, animation design 8 Review and edit step 4 MD, ID 9 Synchronize and publish MD 10 Step 6 verification MD, ID 11 Handover & check ID 12 Assessment process MD, ID
Evaluation and approve
1 Assessment planning LM 2 Decide form of evaluation
LM, SME, ID 3 Evaluation and conclusion 4 Technical approve 5 Content approve 6 Acceptance and implementation
3.4. Facilities for the development of learning mat erials
- Studio: Hanoi Open University is invested by Korea KOICA project with 3 modern studios (1 large room and 2 small rooms).
- The content development department is equipped with high-speed computers, installed software. The software used is mainly Articulate studio 2013, articulate storyline 2, SCORM standard.
3.5. Provision of learning materials for learners
- After learning materials are approved and accepted, each component of learning materials was uploaded and organized into the learning management system (LMS) according to the course syllabus of the course.
- The class time will be updated when new class starts. The administrators will check all the requirement of related content and information in the new class on the learning management system (LMS).

249
4 SURVEY AND EVALUATION FROM THE LEARNERS ON E-LEARNING MATERIALS
To collect data to survey from learners on e-learning materials, the author collects data on accessing the learning materials and issues questionnaires to the respondents. 4.1. Some data on access to learning materials The total number of students surveyed studying at the E-learning Center of the Open University of Hanoi is 3031 students enrolled in 6 sectors: Business Administration: 589 students, Accounting: 476 students, Banking and Finance: 127 students, Economics Law: 876 students, English language: 613 students, IT: 350 students. Data collection on access to learning materials was conducted on 330 subject-matter courses during the six-month period from January to June 2017. The number of students accessing learning materials by component is as follows:
Major
The number of students accessing learning materials (Number of access/ number of students)
Multi-media lecture
E-textbook Self-study guide
Question bank
Case study
Vclass lecture
recorded
Other materials
Accountant 94% 31% 72% 100% 68% 54% 58% Business administration
99% 37% 63% 100% 66% 57% 57%
Finance and banking
93% 29% 61% 100% 59% 48% 65%
Information technology
95% - 53% 100% 56% 49% 64%
Economics Law 98% 35% 66% 100% 75% 59% 68% English language
100% - 79% 100% 70% 62% 87%
- Mutilmedia lectures and question bank have highest access, which are the main learning
materials. - Case study and Vclass lecture recorded have the access ration 48% – 75%. - E-textbook have lowest access 29% – 35%.
4.2. Survey results on learning materials from learners To assess how are learning materials adapt the learners demand, the author has conducted survey of learners and use the Linkert scale 5 levels. Number of questionaires is 500, collected 310. The questionnaire survey carried out 04 contents as follows:
- Necessity, effectiveness of learning materials - Evaluate the transission method of the lectures and the accessibility of the learner - Evaluate the role of technical implementation in multimedia lectures related to the
accessibilityand convenient for learners.
Findings of survey as follows: 1) More than 86% of learners strong agree and agree on the necessity and effectiveness of
learning materials (E-textbooks, Self Study Materials, Multimedia Lecture Notes, Bank Multiple Choice Questions, Case Studies Discussion, Practical Lecture, Semester, Vclass Lecture).In connection to the almost statistics number of learners access to multimedia lectures and quiz exercise which are the main learning materials, 93-95% answer agree and strong agree that multimedia lectures and quiz exercise are necessary and effetive. For e-textbooks, self-study learning guide and case study, 69% to 72% users, in which e-textbookshave 15% opinions disagree and totally disagree. For the case study, there was almost no disagree opinions, and mostly at the normal level, in connection to the 66% of accessing, this indicates this type of learning material was not attractive to students.

250
2) Evaluate the transmission methodof multimedia lectures, related to the accessibility of the lectures, there are 68% opinions of the learners agree, 26% normal and 6% disagreed. However, when questioning the transmission method by case study and interactive methods in lectures, 92% feedback that more effective.
3) Evaluate the role of technical implementationin multimedia lectures related to the accessibilityand convenient for learners, 38.7% of answers are very important, 46.7% important and 14.7% said it was normal and not important. When comparing video and multimedia lectures formats, 60% of respondents said that the multimedia format was convenient to use, while only 39% rated it to the video lecture format. At the same, 94% respondents with the demand of accessing by mobile device.
Feedback indicated a high level of student satisfaction with the multimedia lecture and the pratical quiz bank, although also provided us with some clear guidance on what kind of improvements were needed:
- almost all learners are motivated by interactivity - learners learn synchronously less than asynchronously - the technical implementation in multimedia lectures effectively needs to be ensured.
5 CONCLUSION
E-learning materials play a very important role in online education and e-learning, because it is the core and the basis for the quality of the training. The development of e-learning materials based on a process that ensures coordination between instructors, designers and technical staff to create learning materials that are both attractive in terms of content and techniques. It helps self-learners achieve good results. With the survey results obtained from learners studying at HOU, it is possible to see the demand for student materials is varied of types, the main materials such as multimedia lectures need to be develop more interaction and practical, as well as ensuring the learners demand ofaccessing by mobile devices. Beside that, for the quality of e-learning materials resourse for e-leaners, the university need to update the content, improve the teaching method and also update the technical implementation in accordance under the development of information technology. REFERENCES 1. Ministry of Education and Training, 4-2017, Report on Distance education in Vietnam 2. Ministry of Education and Training, Regulation on IT implementation in management and
deployment in online education, 12-2016 3. Vietnam Higher Education Law, 2012 4. http://www.ier.edu.vn/upload/product/da-tao-truc-tuyen-trong-nha-truong-viet-nam-thuc-trang-va-
giai-phap-612939932903.pdf

251
PARTICIPATION PATTERNS AND STUDENT SATISFACTION LEVELS OF ACADEMIC SERVICES AT DEPARTMENT OF
BIOLOGY UNIVERSITAS TERBUKA
Inggit Winarni 1, Sri Utami 1, Budi Prasetyo 1, Susi Sulistiana 1, Sri Kurniati Handayani 1, Deddy Ahmad Suhardi 2
1Department of Biology, Faculty of Mathematics and Natural Science, Universitas Terbuka (INDONESIA)
2Department of Statistics, Faculty of Mathematics and Natural Science, Universitas Terbuka (INDONESIA)
Abstract
The academic service aspect is one of the main benchmarks of successful learning process for the Universitas Terbuka (UT). This study measured the participation pattern and satisfaction level of ten academic services at Department of Biology UT by its alumni during study. This was an exit survey study using questionnaires and interviews of alumni of Department of Biology on 2016 in the five UT Regional Office. Data of participation analyzed by Principal Component Analysis. The result revealed that there were two components of alumni participation for academic services, they were learning resources and tutorial services (cumulative variance data 61%). We also do an analysis using scoreplot of the two component. The result was that there were three pattern: a) those who participate in both learning resources and tutorial services, b) those who participate more often in the tutorial services than in learning resources services, and c) those who do not participate in eather learning resources or tutorial services. The analysis of satisfaction level was simple by doing some frequencies distributions. The result was that five academic services have high level which are online community forum, online journals, online tutorials, printed materials, and online self-exercise. Meanwhile five other academic services have low level which are face to face tutorial, virtual reading room, digital library, dry laboratory, and UT television. These findings indicate that need to propose a new strategic plan regarding administrative requirements so that all academic services can be utilized by students. Keywords: Participation, satisfaction, academic services
1. INTRODUCTION
Universitas Terbuka (UT) is a state university offering open and online distance learning services in Indonesia. The implementation of education in UT emphasizes the openness system. This system indicates that UT has some specific characteristics such as the absence of entrance examination, no age restriction, no geographical location limitation, no specific educational background, no graduation year of high school restriction, and multi entry-multi exit. On the other hand, distance learning systems that held in UT tend to encourage learning independence for students that complement other UT-specific characteristics. Academic services are becoming an important component in achieving quality education at UT. This service is a systematic effort of UT to facilitate students to master the curriculum contents through the learning process. The existence of academic services is expected to increase the learning independence, is to prioritize the initiative and activeness partcipation in the academic services offered. The participation of academic services has an important role in the achievement of effective learning process. The study of Azan, Meirawan, & Sutarsih (2015) found that the service particiation had a significant effect on the service quality. In addition to participation, student satisfaction of academic services also become one of the service quality indicators. This is supported by several research that there were a positive influence between the education quality and the graduates satisfaction (Rahmidini, Wirakusumah, & Puspa Dewi, 2015;

252
Adams, 2016). Graduates is the right object in satisfaction survey because they are the parties who undergo the learning process, so they can reveal the good or bad impression of each service received. According to Kotler (2008), satisfaction from the consumer/service users is considered good if they meet what they expect, otherwise services will be perceived poorly if they don’t meet what they expect. In addition to being an indicator of the service quality, satisfaction also affects the number of students. Related to this, the Faculty of Mathematics and Natural Sciences (MNS) of UT is one of the faculties that need to be reviewed the satisfaction level of its graduates. This is because faculty of MNS have relatively low of student percentage (1.05%) compare with other faculties (Universitas Terbuka, 2016b). Prior research on the satisfaction level has been done in Department of Biology which found that the program implementation and the service quality of this department were generally satisfactory for the graduates (Sulistiana, et al., 2015). In this study, the satisfaction level is seen based on several aspects, including academic services. Completing previous study, this study aims to measure the participation pattern and graduate satisfaction level of academic services at the department of Biology UT. This information is required as an indicator of the quality of academic services at UT. The study findings are expected to be useful for the evaluation and development of academic services in both faculty and biology department. 2. METHODOLOGY
The study was conducted for graduates of biology department-faculty of MSN, during the period 2015.1 until 2016.2. As much as 23 graduates spread at UT regional office of Jakarta, Serang, Bogor, Bandung, and Yogyakarta included in this study. The data collection was through questionnaires and interview. Questionnaires were made based on research objectives. Prior to disseminating to graduate, questionnaires and interview guides were tested in advance to maintain their validity. Sociodemographic characteristics of graduates were collected in this study, include age, gender, employment, origin of UT regional office, and predicate graduation. Primary analyzes were conducted on ten academic services offered at biology department UT, they were online tutorials, face to face tutorials, online community forums, printed materials, virtual reading room, online self-exercise, digital library, online journals, dry laboratory, and UT television. The analysis of the academic services is based on the participation pattern and satisfaction level. All data inputted into Microsoft Excel 2010 for further analysis. Data analysis using Stata SE 12.0 (College Station, TX), involves sociodemographic characteristics analysis and academic services analysis. Analysis of sociodemographic characteristics was done by frequency distribution. The academic services analysis was done in two ways, were participation patterns analysis and the satisfaction level analysis. The participation patterns analysis using Principal Component Analysis (PCA) method. This analysis was used to summarize a number of variables (ten of academic services) into new variables/components that were not correlated to each other. These new components were used to facilitate data interpretation. Variables supporting a component seen by the correlation of these variables to the component, that was equal to 0.4 or more. In order to be plotted in two dimensions, only the first two components represent the largest variance being analyzed. The analysis is continued by determining the pattern derived from the new component by Score Variable Plot (scoreplot) method. This plot was the plot between the first component as the X axis with the second component as the Y axis. Meanwhile, the analysis of the satisfaction level was done by making the frequency distribution at ten academic services, each of which consists of four response categories: very satisfied, satisfied, and not satisfied. 3. RESULTS
3.1 Sociodemographic Characteristics of Graduates
The collected data was obtained from 22 graduates from 23 total graduates (response rate
95,7%). Some important characters related to the graduates in this study are summarized in Table 1. Based on the results of the study showed that the average age of alumni of Biology Program is 31.9 years. According to Hurlock (2002), the average age of the alumni is included in the early adult category

253
(ages 18-40 years). Based on Government Regulation No. 11 of 2002 on the procurement of civil servants mentioned that the acceptance for civil servants both men and women aged as low as 18 years and as high as 35 years (State Personnel Agency, 2002). Thus, the graduates of Biology study program whose average age is 31.9 years still in accordance with the needs of the labor market. The status of the alumni profession mostly (86.36%) are workers with the same proportion between men and women. The data show that UT biology study programs are in demand by employees. For graduates with work status, being a student has at least two things related to self potential, namely: 1) having a fixed income so as to have the ability to finance the SPP and other tuition fees, and 2) self-improvement through the achievement of higher competencies of competence Previous high school level. While related domicile, alumni spread in six UT regional Office were Jakarta, Serang, Bogor, Bandung, Surakarta, and Yogyakarta.
Most of the alumni (70%) graduated with "satisfactory" predicate with GPA of 2,00-2,75. This condition needs attention given the market demand of the work world is often required with a minimum GPA of 2.75 (Suyanto & Pratono, 2000). Increasing GPA for students is closely related to the seriousness of students in learning, learning strategies, and optimal utilization of time, and actively follow all the services learned from UT. In addition, the effort to increase student's GPA is also the responsibility of UT including biology program by improving the quality of various academic services.
Table 1. Sociodemographic Characteristics of Graduates at Department of Biology UT
Characteristics (n=22) Total (%) Age*
Mean (± SD) 31.9 (± 4.27) Gender
Male 11 (50.00) Female 11 (50.00)
Employment Employed 19 (86.36) Unemployed 3 (13.64)
UT Regional Office Jakarta 7 (31.82) Serang 4 (18.18) Bogor 2 (9.09) Bandung 7 (31.82) Surakarta 1 (4.55) Yogyakarta 1 (4.55)
Predicate Graduation (n=20) Satisfactory 14 (70.00) Very Satisfactory 6 (30.00)
*Normality test of age p= 0.396 (p>0.05): normally distributed 3.2 Participation Patterns of Academic Services
Open University has provided various academic services to support the learning process so that
students achieve optimal learning satisfaction. In the process of distance learning, the ability of students to learn independently become the key to successful learning success. To that end, the various academic services offered by the institution are expected to be utilized by the students maximally. The correlation structure among the 10 academic service variables studied, resulted in two main components of academic services (Table 2). The first component is correlated with digital libraries, online journals, dry labs, and UT TV. This component is identified as a learning resource aspect, with a variance of 36.8% representing the data variance. While the second component is correlated with online tutorials, TTM, printed materials, and self-service online. This component as a tutorial aspect, represents 23.8% data variance. Cumulatively, both components represent 60.6% of the data variance. The cumulative variance of these two components is less representative (less than 70%) so that analysis based on the two components is only a preliminary description to see the trend pattern.

254
Table 2. Variable Correlation and Variances of Participation’s Component
No Variable 1st Component 2nd Component
1 Online Tutorials 0.169 0.500
2 Face to Face Tutorials 0.013 0.425
3 Online Community Forum 0.344 0.078
4 Printed Materials -0.008 0.498
5 Virtual reading Room 0.275 -0.242
6 Online Self-Exercise 0.171 0.477
7 Digital Library 0.412 -0.126
8 Online journals 0.427 -0.113
9 Dry Laboratory 0.442 -0.031
10 UT Television 0.448 -0.032
Variance 3.676 2.384
% of variance 36.8 23.8
Cumulative 36.8 60.6
The scoreplot plot of both components is shown in Figure 1. Considering the mean values of both components, the pattern of academic service utilization can be analyzed based on 4 quadrant of component utilization rate. The first quadrant shows the high utilization area in both the learning source component and the tutorial component. The second quadrant shows the high utilization area of the tutorial component, while the utilization level of the learning resource component is low. The third quadrant shows a low utilization area in both components. The fourth quadrant shows the area of utilization level of the tutorial component low, while the utilization level of the learning source component is high.
The group of respondents in quadrant 1 gives an idea that almost all academic services (tutorial aspect and learning resources) offered to students have been fully utilized. In contrast, the groups of respondents in the third quadrant are less likely to take advantage of the academic services offered. Respondents group in the second quadrant gives an illustration of students who are more utilizing academic services that support tutorial aspects rather than aspects of learning resources. This implies that the utilization of high aspects of the tutorial is not matched by the use of aspects of learning resources. While the group of respondents in the fourth quadrant gives an illustration that students more often use academic services in the form of aspects of learning resources rather than tutorials. This fourth quadrant is an area of higher learning resource utilization than tutorial utilization, but in this quadrant there is no meaningful student distribution (there is only 1 student). Overall from Fig. 1 can be summarized that 41% of academic services are maximally utilized by students, 27% of academic services are not optimally utilized, and 32% use academic services on tutorial aspects but ignore aspects of learning resources.
Fig 1. Participation Pattern of Academic Services for two first Component
I II
III IV

255
The achievement of 41% utilization value (Quadrant 1) is an ideal pattern that is expected by the institution that all academic services offered can be utilized optimally by the students. The importance of providing academic services to students in assisting the learning process with the remote system is one of the reasons that support the high value of the utilization of academic services. In addition, the maximum utilization of academic services may also contribute to high UAS scores. This is as stated by some researchers that the utilization of e-learning media has a strong contribution to learning outcomes (Wahyudin, Sutikno, & Isa, 2010; Sjukur, 2012). This is in accordance with Suharmini's report (2015) that the tuton influences the value of UAS. On the basis of it UT implements the policy that the utilization of online tutorials has contributed to the final exam score of 30% (Open University, 2016a). Based on this study pattern, students are expected to continue to maximize the utilization of existing academic services, and on the other hand UT continues to strive to provide the best service and always try to improve the quality of its services. In addition, the use of this high academic service by graduates is expected to be a role model for students who are still active to be motivated to utilize the existing academic services to the fullest.
The distribution of 27% of graduates in quadrant 2 provides an illustration that during the lecture they tend to use more tutorial aspects than learning resources. One of the trigger factors is possible because of the tendency of two-way communication on the utilization of tutorial aspects, namely the existence of tutors that can help provide explanation of the material that is considered difficult. So the students tend to be more concerned about the use of aspects of this tutorial. The reluctance of students to utilize aspects of learning resources is also possible because the lecture tasks that do not require students to read more from the existing learning resources (Farida, 2012). One example is the preparation of scientific papers in UT that contribute to the value of the final assignment of students. It is known that the rules regarding the scientific work for UT students are considered to be less binding, which is though compulsory but this scientific work does not have a sks load (Sks 0 load) (Open University, 2013). In addition, although scientific work contributes to the final value of the task but only 20%, so that without the scientific work of students it is still possible to get good grades. This condition allows students free from the task of preparing scientific papers. Whereas the majority of the use of libraries and journals is used to search information in making the final task (Royan, 2014). In addition, the low reading culture, library collections or other inadequate learning resources, and the lack of knowledge of the existence of several aspects of learning resources are also factors that trigger low utilization of aspects of learning resources (Farida, 2012; Saleh, 2013). Based on these findings, students' usefulness regarding the availability of these aspects needs to be improved, either through quality improvement, review of learning regulations, or improvements in socialization to better recognize students
Meanwhile, graduates in quadrant III indicate a lack of utilization of all aspects of services offered during the lecture. Self motivation factor plays an important role in the activeness of students in utilizing various learning services. It is known that high levels of motivation and mental ability are closely related to student academic behavior (Logan, et al., 2017). However, student self-motivation study was not conducted in this study. The busyness or absence of graduate time to take advantage of academic services during the study has also contributed to the low utilization of existing services (Farida, 2012). This condition can occur considering most of the graduates (86.36%) who are respondents in this research are those who have been working. Regarding the low utilization of the various services in this pattern, face-to-face tutorials (TTM) need attention due to low utilization by most (50%) of graduates. Based on the interview results, graduates revealed that TTM service is a service that is considered very important to help the learning process but can not be utilized because of constrained administrative requirements that do not allow them to be able to use it. The existing provisions, TTM is a costly activity so that in its implementation requires the fulfillment of the minimum quota amount that register and not a combination of some UPBJJ-UT nearby. On the other hand, Rahayu's research, Prayitno, and Sunarjo (2014) found that the tutorial process had a significant effect on the quality of UT graduate students. Thus the importance of TTM in the success of this study becomes one of the important indicators for further study in order to obtain the most appropriate solution in the settlement to the students.
3.3 Satisfaction Level of Academic Services
Data on graduates' satisfaction on the 10 academic services reviewed in this study are presented
in Table 3 below. There is a lot of missing data on the assessment of this aspect because for graduates who never use academic services they are less likely to fill out a questionnaire about measuring the level of satisfaction of the service.

256
Table 3. Distribution of Satisfaction Level of Academic Services
N
o
Variable Satisfaction Level (Frequency) Satisfaction Level (Percentage)
Ver
y
Sati
sfie
d
S
a
ti
sf
i
e
d
So
me
wh
at
Dis
sati
sfie
d
D
is
s
a
ti
sf
i
e
d
Ver
y
Sati
sfie
d
S
a
ti
sf
i
e
d
So
me
wh
at
Dis
sati
sfie
d
D
is
s
a
ti
sf
i
e
d
1 Online Tutorials** 6
1
5 1 0
27,
3
6
8
,
2 4,5 0
2
Face to Face
Tutorials** 1 6 5 1 7,7
4
6
,
1
38,
5
7
,
7
3
Online Community
Forum
3 1
4
5 0 13,
6
6
3
,
7
22,
7
0
4
Printed
Materials** 8
1
1 3 0
36,
4
5
0
13,
6 0
5
Virtual Reading
Room 4
1
1 3 0
22,
2
6
1
,
1
16,
7 0
6 Online Sef-
Exercise**
9 1
1
2 0 40,
9
5
0
9,1 0
7 Digital Library* 2 8 7 0
11,
8
4
7
41,
2 0
8 Online Journals* 3 8 3 0
21,
4
5
7
,
1
21,
5 0
9 Dry Laboratory* 4 5 6 2
23,
5
2
9
,
4
35,
3
1
1
,
8
1
0 UT Television* 0 4 6 3 0
3
0
,
8
46,
1
2
3
,
1
*1st Component; **2nd Component
Based on the respondents who fill the measurement of satisfaction level, almost all academic services (90%) are stated satisfactory (satisfied and very satisfied category) by most students. Online tutorial services become the highest percentage service (95.5%) in satisfied and very satisfied categories, while UT TV becomes the lowest percentage service (30.8%) for satisfied and highly satisfied categories. Satisfaction with a great service is related to the quality of the service itself (Kuo, 2010; Maria, Hadiwidjaja, & Mulyana, 2015). Related to the high percentage of satisfaction in the tuton, it is possible because the learning process is more communicative and interactive on this service becomes the trigger factor. This is supported by the research of Maria, Hadiwidjaja, & Mulyana (2015) which states

257
that the effectiveness and ease of communication access and the speed of response to student inquiries are the most influential indicators on the quality of service by the students. In addition, the use of tuton that contributes a maximum of 30% to the final score also gives other positive points (Open University, 2016a). Meanwhile, based on interview results, it is known that the low percentage of satisfaction on UT TV because most students do not know the existence of this UT TV service. This shows that there is still a need for an increase in the socialization of academic services to students so that the existing services can be maximally utilized by the students.
Findings on this aspect of satisfaction are important points that can be used as indicators to improve the quality of academic services provided. Even some research proves that student satisfaction is one of the key students decide dropout or not from distance education (Fredericksen, et al., 2000; Levy, 2007; Lee & Choi 2013; Sembiring, 2014; Sembiring, 2015). Information about unsatisfactory assessment of the existing services will be a special note for the Biology Program to evaluate and follow up as remedial measures to improve student service and students will get their rights optimally. 4. CONCLUSION
Graduate academic service review can be used to find out the utilization pattern and graduate
level of satisfaction during the study. Based on the findings of this study, it can be concluded that there are three patterns of utilization of academic services offered by UT biology professors: 1) high utilization students, both in the tutorial component and learning resources, 2) more dominant students utilize tutorial services but low On the utilization of learning resources, and 3) students with low utilization rates, both on tutorial services and learning resources. Based on the satisfaction aspects of academic services, almost all academic services are considered satisfactory by most graduates. Finding information from this alumni becomes an important indicator to see the quality of academic services provided so that can be used as a reference to further improve the quality of these services, especially on services that have a pattern of utilization and low satisfaction levels. REFERENCES Adams, D. S.(2016). Teaching Distance Education In Library Science: A Comparative Study Of Faculty
Satisfaction, Teaching Effectiveness, And Support Services. (Doctoral dissertation). Retrieved from http://scholarcommons.sc.edu/etd/3501.
Azan, K., Meirawan, D., & Sitarsih, C. (2015). Mutu layanan akademik. Jurnal Administrasi pendidikan,
XXII (1): 190-203. Farida, S. (2012). Faktor-faktor penyebab keengganan membaca di lingkungan mahasisiwa: studi
kasus. Seminar Nasional Bahasa 2012, Fakultas Bahasa Universitas Widyatama. Diakses dari http://repository.widyatama.ac.id/xmlui/bitstream/handle/123456789/1939/D13%20-%20Prosiding%20-%20Tema%20D%20Linguistik%20Terapan%20-%20Sasmi%20Farida.pdf?sequence=1
Fredericksen, E., Pickett, A., Shea, P., Pelz, W., & Swan, K. (2000). Student satisfaction and perceived
learning with on-line courses: principles and examples from the SUNY learning network. Journal of Asynchronous Learning Networks, 4(2), 7–41.
Hurlock, E.B. (2002). Psikologi perkembangan. 5th edition. Jakarta: Erlangga. Badan Kepegawaian Negara (2002). Keputusan Kepala Badan Kepegawaian Negara nomor 11 tahun
2002 tentang ketentuan pelaksanaan peraturan pemerintah nomor 98 tahun 2000 tentang pengadaan Pegawai Negeri Sipil sebagaimana telah diubah dengan peraturan pemerintah nomor 11 tahun 2002. Jakarta: badan Kepegawaian Negara.
Kotler, P. (2008). Marketing Management. New Jersey: Prentice Hall Inc. Kuo, YC. (2010). Interaction, internet self-efficacy, and self-regulated learning as predictors of student
satisfaction in distance education courses. All Graduated Theses and Dissertation. Paper 741.

258
Lee, Y. & Choi, J. (2013). A structural equation model of predictors of online learning retention. The Internet and Higher Education, 16:pp.36–42.
Levy, Y. (2007). Comparing dropouts and persistence in e-learning courses. Computers & Education,
48 (2), 185–204. Logan, J.W., Lundberg, O.H., Roth, L., & Walsh, K.R. (2017). The effect of individual motivation and
cognitive ability on student performance outcomes in a distance education environment. Journal of Learning in Higher Education, 13 (1): p83-92.
Maria, M., Hadiwidjaja, R.D., & Mulyana, A. (2015). Pengaruh faktor kualitas jasa perguruan tinggi jarak
jauh (PTJJ) terhadap kepuasan mahasiiswa dan niat menyelesaikan kuliah (studi kasus mahasiswa fakultas ekonomi Universitas Terbuka). Jurnal Manajemen Organisasi, VI (2): 117-133.
Rahayu, T., Prayitno, & Sunarjo, J. (2014). Efektivitas pelaksanaan tutorial tatap muka dan
hubungannya dengan mutu lulusan mahasiswa program studi s1 pgsd unit program belajar jarak jauh universitas terbuka purwokerto. Laporan Hasil Penelitian. UPBJJ-UT Purwokerto: Lembaga Penelitian dan Pengabdian kepada Masyarakat Unit Program Belajar Jarak Jauh Purwokerto Universitas Terbuka. Diunduh dari http://repository.ut.ac.id/5812/1/2014_61.pdf
Rahmidini, A., Wirakusumah, F.F., & Puspa Dewi, S. (2015). Pengaruh kualitas pendidikan terhadap
kepuasan mahasiiwa lulusan Prodi D.III Kebidanan di Stikes Respati Tasikmalaya. CR Journal (1),1: 31-46.
Royan, N.E. (2014). Pola perilaku penemuan informasi di kalangan mahasiswa skripsi. Laporan
Penelitian. Diakses dari http://journal.unair.ac.id/download-fullpapers-ln8c2297f805full.pdf. Saleh, A.R. (2013). Pengembangan perpustakaan digital: teori dan praktik tahap demi tahap. Bogor:
Rumah Q-ta Production. Sembiring, M.G. (2014). Modeling the determinants of student retention in distance education
institutions. International Journal of Continuing Education and Lifelong Learning, 6 (2).
Sembiring, M.G. (2015). Validating Validating student satisfaction related to persistence, academic performance, retention and career advancement within ODL perspectives. Open Praxis, 7 (4), 325–337.
Sjukur, S.B. (2012). Pengaruh blended learning terhadap motivasi belajar dan hasil belajar siswa tingkat
SMK. Jurnal Pendidikan Vokasi, 2 (3): 368-378. Suharmini, S.W. (2015). Aksesibilitas mahasiswa pada tutorial online program studi perpustakaan.
Jurnal Pendidikan Terbuka dan Jarak Jauh, 16 (1) Maret: 29-38. Sulistiana, S., Winarni, I., Kurniati, S., & Prasetyo, B. (2015). Tingkat kepuasan lulusan terhadap
penyelenggaraan dan mutu layanan, serta persepsi pemangku kepentingan terhadap kinerja lulusan program studi biologi FMIPA UT. Jurnal Pendidikan Biologi indonesia, 1 (3): 274-282).
Suyanto & Pratono, A.H. (2000). Permintaan tenaga kerja: studi kasus lowongan kerja media cetak
Mei-Juli 2000. Unitas, 8 (2): 36-55. Universitas Terbuka (2013). Panduan pembimbingan karya ilmiah untuk pembimbing dan mahasisiwa
FEKON, FISIP, FMIPA, dan PPs. Tangerang Selatan: Universitas Terbuka. Universitas Terbuka (2016a). Tutorial Online. Diakses dari http://www.ut.ac.id/tutorial-online. Universitas Terbuka (2016b). Laporan Kerja Tahunan Rektor Universitas Terbuka 2015. Tangerang
Selatan: Universitas Terbuka Indonesia.

259
Wahyudin, Sutikno, & Isa (2010). Keefektifan pembelajaran berbantuan multimedia menggunakan metode Inkuiri terbimbing untuk Meningkatkan Minat dan Pemahaman Siswa. Jurnal Pendidikan Fisika Indonesia, 6 (20): 58-62.
260
DATA MINING TECHNIQUES TO ANALYZE STUDENTS’ ACCESS PATTERNS AND PERFORMANCE IN AN ONLINE LEARNING
ENVIRONMENT
Myra C. Almodiel
University of the Philippines Open University (PHILIPPINES)
Abstract
In an online learning environment where students do not have direct face-to-face interactions with instructors, observing their learning behaviors is quite a challenge. Recent studies on data mining suggest that the use of data mining techniques on educational data can be a useful tool to study the performance of the students. This study applied the data mining process to analyze the access patterns and performance of undergraduate students in an online course at the UP Open University (UPOU). The data used in this study was generated from an open-source LMS called Moodle, using selected standard report plugins. Descriptive and inferential statistics, clustering and visualization techniques were employed to identify and analyze the students’ behavioral patterns and preferences based on the login frequency, frequency of accessing course materials, number of views and posts in the collaborative learning logs and discussion, announcements, and self-introduction forums, and frequency of submission and completion of assignments, exams and project. Descriptive statistics were used to determine the demographic characteristics and online participation behaviors of the students. Inferential statistics were used to investigate relationship among the variables. This study used the SPSS to analyze and classify the data using the K-means algorithm. Keywords: Data Mining, Learning Management System (LMS), online learning, student performance, clustering 1. INTRODUCTION In an online learning environment where students do not have direct face-to-face interactions with teachers, observing students' learning behavior is quite a challenge. Considering the huge amount of data on students' activities that an online learning management system collects and stores everyday, analyzing the students’ performance can be a time-consuming and a challenging task for a teacher. Assessment of the students’ performance in complex computer-supported collaborative learning or inquire based learning scripts is a tiresome and a time-consuming process for the teachers, who should take into consideration a huge number of parameters (Dimopoulos etal, 2013). Recently, there is a growing number of research studies on the use of data mining techniques on educational data to analyze the performance of the students. Studies suggests that data mining is very useful in examining students’ learning behavior in online learning environment due to its potentials in "analyzing and uncovering the hidden information of the data itself which is hard and very time consuming if to be done manually" (Mohamad & Tasir, 2013). The increasing interest in the field of data mining in educational systems is making educational data mining as “a new growing research community” (Romero & Ventura, 2007). 1.1. Data Mining Tools and Techniques Generally speaking, data mining techniques are powerful tools for discovering hidden knowledge, and have great potential to reveal online learning behavioral patterns, preferences, progress, and more (Hung, 2008). Data mining techniques can be used to determine the learning behavioral patterns such as students’ participation behavior, learning style and preferences on course resources. For instance, Hung & Zhang (2008), were able to identify students’ behavioral patterns and preferences in the online learning processes, differentiated active and passive learners, and found important parameters for performance prediction, using clustering and decision tree analysis. Alfiani & Wulandari (2015) focused

261
on mapping students using K-mean Cluster algorithm to reveal the hidden pattern and classifying students based on their demographic (sex, origin, GPA, grade of certain courses), and average of course attending. On the other hand, Park etal (2016), used the class analysis and clustering approach to analyze blended learning courses by online behavior data. In a survey on educational data mining from 1995-2005, Romero & Ventura (2007) identified several EDM techniques :
• Statistics and Visualizations; • Web mining (Clustering, classification and outlier detection; association rule mining and pattern
mining); and • Text Mining.
In the study on "Tools for Educational Data Mining" (Slater,etal, 2017) several EDM tools which are frequently used by researchers to conduct EDM analyses were reported. These were summarized in Table 1.
Table 2: General Purpose Tools for Educational Data Mining
EDM Tools Functions Sample Tools Data manipulation For manipulation, cleaning, and
formatting of data, as well as for feature engineering and data creation
Microsoft Excel, Google Sheets, EDM Workbench, Pyton and Jupiter notebook, SQL
Algorithmic analysis
To model and predict processes and relationships in educational data
RapidMiner, WEKA, SPSS, KNIME, Orange, KEEL,Spark MLLib
Visualization
To build interactive visual interfaces for gaining knowledge and insight from data, as well as communicating important implications for learning to students and teachers
Tableau, D3js
1.2. Access patterns and student performance The relationship between online access patterns and student performance is a subject that captures the interest of many researchers (Butrous, 2011). By identifying patterns of learning behavior, teachers may be able to “identify those students who require additional assistance and intervention” (Haig & Falkner, 2013). Previous studies on the relationship between online access patterns and student performance has shown that there is a strong positive relationship between access patterns and students’ performance. (Butrous, 2011). A research study by Haig & Falkner (2013) showed that “student’s pattern of study, as measured by LMS usage, correlates with their final grade in a course”. In the same research, it was reported that “students who are more engaged with the course perform better in terms of their final grade” (Haig & Falkner, 2013). Bagarinao (2011), in his study on "Learners’ Access Patterns and Performance in an Online Course in Science, Technology and Society" revealed that “learners who have visited the site and read messages more frequently got higher scores in the examinations administered for the course”. 1.3. Data Mining Process According to Romero, etal (2007), data mining process in elearning consists of four steps:
1. Collect data from an LMS system on students' usage and interaction. 2. Preprocess the data, meaning the data is cleaned and transformed into an appropriate format
to be mined. 3. Apply data mining data algorithms to build and execute the model that discovers and
summarizes the knowledge of interest for the user (teacher, student, administrator, etc.)., where 4. Interpret, evaluate and deploy the results.
This particular study used the data generated from an open-source LMS called Moodle, using selected standard report plugins. A combination of statistic analysis, visualization, and clustering approach were used to analyze the students' access patterns and performance.

262
2. RESEARCH OBJECTIVES In general, this research aims to analyze the undergraduate students' access patterns and performance in an online learning environment using data mining techniques. Specifically, this study aims to:
1. Identify the demographic characteristics and access patterns of undergraduate students at UP Open University (UPOU); and
2. Describe and classify the characteristics of students using clustering techniques. 3. METHODOLOGY 3.1. The virtual learning classroom MyPortal (www.myportal.upou.edu.ph) is the UP Open University 's learning management system (LMS). It is powered by Moodle (Modular Object-Oriented Dynamic Learning Environment) v.3.2+, which is an open source course management system. This study involved a three-unit introductory course on information technology for the undergraduate students taking up Bachelor in Multimedia Studies (BAMS) at UP Open University. This study included 45 students who took up MMS 101 (Introduction to Information Technology) course during the Third Trimester 2016-2017. Those who dropped the course were excluded in the study. The MMS 101 course is divided into seven (7) modules and runs for 10 weeks (see Fig.1).
Fig 1. Screenshot of the MMS 101 (Introduction to IT) Course Site
3.1.1. Student Performance Assessment Student performance was based on the final grade of the student. Student performance is categorized into four categories based on their final grades: High Performing Group (Final Grade: 86%-100%), Average Performing Group (Final Grade: 72%-85%), Low Performing Group (Final Grade:71%-60%), and Failed (Final Grade: less than 60%). 3.2. Data Mining Process This study adapts the process in data mining by Romero, etal (2007) (see Fig.2).

263
Fig.2. Process of Data Mining in Moodle Course Site Using
Standard Report Plugins in Moodle (Adapted from Romero, etal, 2007) 3.2.1. Collect data. This particular study uses the students' demographic information (Name, Sex, Location), and the data generated using selected standard report plugin for Moodle which are available from the course site (see Table 3).
Table 3. Selected standard report plugin for Moodle (Source: www.moodle.org)
Plugin Useful for Description
Logs Teachers, Admins, Decision-makers Filterable log of events
Activity Teachers View count of activities in course Course Participation Teachers Single student's participation in course
Statistics Teachers, Admins
The statistics graphs and tables show how many hits there have been on various parts of site during various time frames.
3.2.2. Preprocess the data. The following data were generated using selected standard report plugin for Moodle and were cleaned and preprocess using Microsoft Excel (see Fig. 3). For this study, data for the following activities within the course site were generated:
1. Number of students who accessed (Views and Posts) to Self-Introduction Forum 2. Number of students who accessed (Views and Posts) to Announcement Forum 3. Number of students who accessed (Views and Posts) Discussion/Collaborative Forums 4. Number of students who accessed Course materials (Course Guide, Study Guide, Course
Modules) 5. Number of students who submitted/completed requirements (assignments/exam/quiz/project)
Fig. 3. Screenshot of the standard report plugin of the MMS 101 course site

264
3.2.3. Apply data mining. Preprocessed data gathered for this study were analyzed using SPSS. Descriptive statistics were used to determine the demographic characteristics and online participation behaviors of the students. Inferential statistics were used to investigate relationship among the variables. Clustering is an unsupervised method for grouping and it group the data into sets of related observations or clusters (Myatt, 2007). This study used the SPSS to analyze and categorize the data using the K-means algorithm with a value of 4 to the number of clusters. K-means clustering approach was used to determine the usage patterns and clusters of online learning behaviors that emerge upon mining students' online participation data related to online learning activities. K-means clustering is an example of non-hierarchical method of grouping a data set (Myratt, 2007). Computed values were visualized by using graphical and tabular representations. 3.2.4. Interpret, evaluate and deploy the results. Data were interpreted and analyzed, and conclusions were made based from the results. 4. RESULTS AND DISCUSSION 4.1. Demographic characteristics of students and st udents' access patterns to the course site 4.1.1. Demographic characteristics of students To determine the online learners’ demographic characteristics and access to the course, data gathered were measured and analyzed using SPSS. Results revealed that out of 23 male students, more than half (60.87%) belongs to the high and average performing groups while out of 22 female students, 77.27 percent belongs to the high and average performing groups (see Table 4). In addition, results also showed that all of the overseas students are all passers while 12.82% Philippine-based students failed the course. A visual representation of the comparison of demographic variables by performance status (Figure 4) revealed that overall, most (78.43%) of the students passed the course while the rest (21.57%) did not.
Table 4. Descriptive statistics and test of significance of demographic variables by performance
Performance
Sex Location
Male Female Overseas Philippine-Based
Frequency 23 22 6 39 High 14 26.09% 36.36% 33.33% 30.77% Average 17 34.78% 40.91% 50.00% 35.90% Low 9 26.09% 13.64% 16.67% 20.51% Failed 5 13.04% 9.09% 0.00% 12.82% p-value 0.677 0.688

265
Figure 4. Comparison of demographic variables by performance status 4.1.2. Overall pattern of students' access to the course site Descriptive statistics of student's access to the course site are shown in Table 5. Results revealed that (see Table 5) out of the seven variables on students' access to the course site, the variable "Number of views to discussion and collaborative forums", got the highest mean value of 127.46, while the variable "Number of posts to self-introduction forum" got the lowest mean value of 2.28. This suggests that students are more engaged if given more opportunities for collaboration. The variables "Access (views and posts) to self-introduction forum" got a total number of 1357 access (views and posts). This suggests that students have a high interest in knowing information about their co-learners. The variable "no. of course submitted" has the smallest standard deviation value of 1.04. Figure 5 shows a visual presentation of the total number of students' access to the course site. results showed that the variable "Number of views to discussion and collaborative forums", got the highest total number of access/views of 5,736 (63%), while the variable "Number of posts to self-introduction forum " got the lowest total number of views of 103 (1%).
Table 5. Descriptive statistics of student's access to the course site
Variables Total Min Max Mean SD No. of views to announcements 237 0 27 5.26 6.35
No. of views to self-introduction forum 1254 0 159 27.86 40.38
No. of access to course materials 433 1 39 9.60 7.86
No. of views to discussion and collaborative forums
5736 10 768 127.46 135.84
No. of posts to discussion and collaborative forums 1064 0 78 23.64 17.59
No. of posts to self-introduction forum 103 0 11 2.28 2.63
No. of course requirements submitted 241 1 6 5.35 1.04

266
Fig.5. Students' access to the course
4.1.3. Comparison of students' course participation by week To determine the course participation behavior of the students on a 10-week course, data logs was generated from the LMS. A visual representation of the course participation behavior per week is illustrated in Figure 4. Based on the results, there is a significant increase in the number of views and posts on Week 2 (14.56%), Week 4 (11.71%), Week 7-9 (33.4%), and Week 10 (17.71%). Week 2 is the week where the Assignment#1 has been posted. results also showed that this is the week with the second highest number of access/views (15.42%), with Week 10 being the highest (20.02). Week 4 is the week where taking Quiz#1 is required. Week 7-9 are the period of submission of their Final Project. These periods are also the highest number of posts (49.10%). Week 10 is their Final Exam Week. Results showed that this period has the highest number of views (20.02) which suggests that students are more active in accessing/viewing the course site during this period probably to review course materials, discussion forums and activities in preparation for their Final Exam. This suggests that students are more active when there are major activities/requirements in the course.
Fig. 6. Comparison of Course Participation by Week
4.2. Clustering Clustering techniques were applied students based on their online participation characteristics. Clustering is an unsupervised method for grouping and it group the data into sets of related observations or clusters (Myatt, 2007). This study utilized the following variables to describe and classify the characteristics of the students:
1,46%
15,42%
9,65%11,32%6,66% 5,94%
11,91%10,27%7,35%
20,02%
0,49%
11,11%
10,80%13,28%
3,05% 3,84%
18,58%
14,56%15,97%
8,34%
1,27%
14,56%
9,88%
11,71%
5,95% 5,53%
13,23%
11,12%9,06%
17,71%
0,00%
10,00%
20,00%
30,00%
40,00%
50,00%
W1 W2 W3 W4 W5 W6 W7 W8 W9 W10
No. of Views (Percent) No. of Posts (Percent) Total

267
1. Number of students who accessed (Views and Posts) to Self-Introduction Forum 2. Number of students who accessed (Views and Posts) to Announcement Forum 3. Number of students who accessed (Views and Posts) Discussion/Collaborative Forums 4. Number of students who accessed Course materials (Course Guide, Study Guide, Course
Modules) 5. Number of students who submitted/completed requirements (assignments/exam/quiz/project) 6. Final Grades
Table 6, shows the demographic characteristics of students in four clusters. As shown in Table 7, the students were classified into 4 clusters with 2, 20, 15 and 8 students, respectively. Cluster 1 is characterized by students with the highest level of access to course site, and has an average final grade of 87.16. Cluster 2 is characterized by students with a low mean value in accessing the course materials (7.2) and number of views to discussion and collaborative forums (11.5), with an average final grade of 82.99. Cluster 3 is characterized by students with the with the lowest level of access to course site, and has the lowest average final grade of 60.1. Cluster 4 is characterized by students with an average level of access to the course site and an average final grade of 83.11.
Table 6. Demographic characteristics of students in four clusters
Variables Cluster
1 2 3 4 N=2 N=20 N=15 N=8
Performance
High 7.14% 64.29% 0.00% 28.57% Average 5.88% 58.82% 17.65% 17.65% Low 0.00% 11.11% 77.78% 11.11% Failed 0.00% 0.00% 100.00% 0.00%
Sex
Male 4.35% 47.83% 34.78% 13.04% Female 4.55% 40.91% 31.82% 22.73%
Location
Overseas 33.33% 16.67% 16.67% 33.33% PH-Based 0.00% 48.72% 35.90% 15.38%
Table 7. Means for clustering results
Variables Cluster
1 2 3 4 No. of views to announcements 21 5.1 3.4 5.25 No. of views to self-introduction forum
147 16.45 9.33 61.25
No. of access to course materials 22.5 7.2 7.6 16.25 No. of views to discussion and collaborative forums
610.5 11.5 55.8 172.13
No. of posts to discussion and collaborative forums
44.5 23.25 12.27 40.75
No. of posts to self-introduction forum
6.5 1.25 1 6.25
No. of course requirements submitted 6 5.9 4.27 5.88
Final Grade 87.16 82.99 60.1 83.11

268
Fig. 7. Visualization of means for clustering results
5. CONCLUSION AND RECOMMENDATIONS Considering the huge amount of data that an LMS is able to capture and store, it is but practical for teachers to look for tools that can help them do the job. Data mining is a useful tool in analyzing the students' online access patterns and performance. Through the use of data mining techniques, access patterns of students based on demographic variables such as gender and location were identified in relation to the students' performance. It is interesting to know that female students performed better than male students in terms of their final grades. All overseas students passed the course. The researcher is recommending that further studies be done in other courses to check the consistency of the result. It is also recommended to conduct a survey to the students to determine they study habits, and their perception on the effect of their location on their performance in class. The overall access pattern of the students suggests that students are more engaged if given more activities and opportunities for collaboration such as in discussion forums. Results show that a big part of students access to the course site is to access (view and post) in the discussion forums, and to view the introduction forum where they learn something from their classmates. Results also show that there is a high level of access to self-introduction forum, suggesting that students are interested to know information about their co-learners. This suggests that the teacher in charge can add more activities that facilitate more interesting discussions about themselves among students. Results also showed that students are most active in accessing the course site on the second week of classes, on the week of Final Exam, and those week that requires them to submit or complete assignments. Clustering approach, as applied in this study, helped in classifying different groups of students according to their characteristics which can be the basis for course improvement of the teacher in charge. In conclusion, this study suggests that the data mining techniques, particularly the statistics, clustering approach, and visualization can be applied to analyze the data generated using selected standard report plugin for Moodle which are available from the course site. Further study in the subject matter relating to other learning behavior of students in an online class is highly recommended. The use of other learning analytics such as reports, blocks and plugins to assess the performance and learning behavior of students is recommended as well.

269
REFERENCES [1] Dimopoulos, Ioannis and Petropoulou, Ourania and Boloudakis, Michail and Retalis, Symeon (2013) Using Learning Analytics in Moodle for assessing students’ performance. In: 2nd Moodle Research Conference (MRC2013), 4th and 5th October, 2013, Sousse, Tunisia. [2] Mohamad, S. K., & Tasir, Z. (2013). Educational data mining: A review. Procedia-Social and Behavioral Sciences, 97, 320-324. [3] Romero, C., Ventura, S., & García, E. (2007). Data mining in course management systems: Moodle case study and tutorial. Computers & Education, 51(1), 368-384. [4] Hung, J. L., & Zhang, K. (2008). Revealing online learning behaviors and activity patterns and making predictions with data mining techniques in online teaching. MERLOT Journal of Online Learning and Teaching. [5] Alfiani, A. P., & Wulandari, F. A. (2015). Mapping Student's Performance Based on Data Mining Approach (A Case Study). Agriculture and Agricultural Science Procedia, 3, 173-177. [6] Park, Y., Yu, J. H., & Jo, I. H. (2016). Clustering blended learning courses by online behavior data: A case study in a Korean higher education institute. The Internet and Higher Education, 29, 1-11. [7] Slater, S., Joksimović, S., Kovanovic, V., Baker, R. S., & Gasevic, D. (2017). Tools for educational data mining: A review. Journal of Educational and Behavioral Statistics, 42(1), 85-106. [8] Butrous, N. (2011). Online access patterns and students’ performance. Journal of Systemics, Cybernetics, and Informatics, 9(2), 74-78. Retrieved 20 July, 2017 from http://www.iiisci.org/journal/CV$/sci/pdfs/OL268TF.pdf [9] Haig, T., Falkner, K., & Falkner, N. (2013, January). Visualisation of learning management system usage for detecting student behaviour patterns. In Proceedings of the Fifteenth Australasian Computing Education Conference-Volume 136 (pp. 107-115). Australian Computer Society, Inc.. [10] Bagarinao, Ricardo T. (2011). Learners’ Access Patterns and Performance in an Online Course in Science, Technology and Society. ASEAN Journal of Open Distance Learning. Retrieved from http://ajodl.oum.edu.my/sites/default/files/document/vol3-no1/Vol3-01.pdf. [11] Myatt, G. J. (2007). Making sense of data: a practical guide to exploratory data analysis and data mining. John Wiley & Sons.

270
WORKING SATISFACTION INFLUENCE ON PERFORMANCE OF THE STAFF FROM UNIVERSITAS TERBUKA DISTANCE LEARNIN G
PROGRAM UNIT (UPBJJ-UT) MAKASSAR BY WORKING MOTIVATION
Muh. Alwi 1, Risnashari 2
1Universitas Terbuka (INDONESIA) 2Universitas Terbuka (INDONESIA)
Abstract
Employee performance in an organization is heavily defined by the degree to which the employees are motivated, which, in turn, leads to a certain degree of job satisfaction. In other words, greater job satisfaction and motivation will increase the likelihood of greater employee performance within an organization. UPBJJ-UT Makassar is currently facing challenges as to how its employees improve their performance in a way that business stays competitive. This study aimed to address such issue by measuring the effect of job satisfaction on employee performance through work motivation at UPBJJ-UT Makassar. Descriptive statistics and multiple linear regression were used to present the measurement using the samples of the employees at UBPJJ-UT Makassar. Data analysis shows that job satisfaction positively affected employee performance with a standardized positive-direct effect of 0.187 and 0.184. Work motivation also positively affected employee performance with a standardized positive-direct effect of 0.248. However, statistics indicates that job satisfaction, albeit positive, had an indirect effect on employee performance through work motivation with a standardized positive-indirect effect of 0.118. Keywords: 1. INTRODUCTION
One of the prerequisites to globally-competitive business is competent human resources that are able to meet organizational goals. Professional human resources strengthen work quality to ensure business results have been achieved. It therefore becomes essential that human resources be constantly developed as they are organization’s most valuable assets. As intangible assets, human resources cannot be measured on a physical manifestation. Instead, human resources are perceived on a degree to which work achievement meets work standard. When employees generate good work achievement, the organization needs to show them sufficient appreciation and recognition. In exchange for the work achievement, the organization may provide them with compensation. Employees will demonstrate pleasurable attitudes when they are valued as compensation plays a pivotal role in determining the level of employee satisfaction. Satisfied employees are typically content with their job roles and the compensation they earn for their effort and are thus encouraged to attain the expected organizational goals. Job satisfaction refers to a personal trait and hence may vary from one employee to another in accordance with the value system that applies in the environment where he/ she works. Greater perception on an activity that meets an employee’s desire will result in greater satisfaction on the activity. This means that job satisfaction constitutes an evaluation of an employee on pleasantness or unpleasantness and contentment or dicontentment that derive from work experience. In addition to job satisfaction, work motivation is an underlying factor that shapes and affects employee performance. Deassler (in Suwardi, 2011) defines motivation as an inner state in which an individual’s desire is stimulated to perform a particular goal-directed activity. Motivation drives an individual to act a certain way that results from a desire within the individual. When he/ she exhibits an inclination for a specific action, motivation prompts him/ her in the course of goal pursuit. In relation to job satisfaction,

271
work motivation forces employees to pull off effort to accomplish the required tasks and responsibilities. Improved job satisfaction increases performance outcomes as satisfaction makes employees invest more in their work. Satisfaction of work, superiors, subordinates, compensations and opportunities develops into motivation upon working toward a goal. Based on the observation at UPBJJ-UT Makassar, a number of performance-related issues are common among employees. The employees leave work during working hours without permission, are not engaged in work-related activities such as gossiping, and several other issues where staff and educators do not perform their basic tasks well. These indications are consistently aligned with ISO audit’s major and minor findings in terms of the poor performance management. An organization performance is represented by the acccumulation of employee performance. To some extent, UPBJJ-UT suffers from poor employee performance in a sense that it does not fulfill its operational needs and meet the defined set of goals. This study aimed to find out the underlying factors that affected employee performance at UPBJJ-UT. The research formulation of this study is “How does job satisfaction affect employee performance at UPBJJ-UT Makassar through work motivation?” 2. LITERATURE REVIEW
2.1 Job Satisfaction
Lock in Luthans (2006) points out, “Job satisfaction is a pleasurable or positive emotional state resulting from the appraisal of one’s job or job experience.” Porter in Luthans (2006) asserts, “Job satisfaction is the difference between how much of something there should be and how much there is now.” Robbins (2008) defines job satisfaction as a set of an one’s general behaviors toward one’s job. An employee achieves a certain degree of job satisfaction when the reward system provided by an organization meets his/ her expectation. Job satisfaction becomes critical as employees get engaged within their work environment in a way that they contribute their vitality and energy to meet and surpass organizational goals. As previously mentioned, job satisfaction varies among employees in accordance with the prevalent value system. When employees encounter greater work-related aspects that potentially meet their desires, the likelihood of job satisfaction becomes higher. Job satisfaction, furthermore, induces positive attitudes within a work environment. Positive attitudes create positive rapports at workplace and, in turn, help employees to accomplish tasks faster and better. Employee attitudes relating to job satisfaction stimulate work motivation and employee loyalty. When an organization overlooks this, job-related stress, lack of productivity and employee turnover become higher (Robbins, 2008).
2.2 Work Motivation Deassler (in Suwardi, 2011) describes motivation as a one’s internal factor driven by a desire of performing a particular goal-directed activity. Similarly, Suryabrata (2010) refers to motivation as an intrinsic condition that stimulates one’s desire to commit a certain activity. According to Sukmadinata (2003), motivation is an internal state encouraged by multiple stimuli that give reason for one’s actions, desires and needs. McDonald (in Hadis, 2008) explains that motivation takes its origin from a change in energy level that comes from within as a result of a response to achieving a goal. McDonald observes the nature of motivation according to these three elements:
1. Motivation induces a change of energy within an individual. 2. Motivation comes as a response to a stimulus. 3. Motivation is a desire of a goal-reaching commitment.
McDonald seems to observe motivation in accordance with the notion that it results from a response to an action that generates a sense of purpose. Such notion is similar to Uno’s (2009) that states, “Motivation is a set of forces that drive an individual to perform a certain purpose-oriented activity.” Such forces are influenced by a number of factors: 1) basic-need fulfillment, 2) behaviors, 3) goal achievement, 4) feedback.

272
2.3 Employee Performance Both small-scale and big-scale organizations heavily depend on outstanding employee performance. This performance determines the degree to which an organization achieves its defined strategic objectives. Poorly-trained employees slow down productivity and hinder the organization from achieving those objectives. Measuring performance is thus essential to the employee management system. Fattah (1999) defines performance as an individual’s abililty based on a set of skills, knowledge, attitudes and motivation with respect to productivity. Sedarmayanti (2001) refers to performance as work implementation, work fulfillment and work accomplishent. Samsuddin (2005) observes performance in the context of the rate of job execution achieved by an individual at work by demonstrating skills on an assigned task within a period of time to gain business efficiency and productivity. Similar to Samsuddin, Gomes (2003) defines performance as specific work accomplishment within the required time period. Veithzal (2005) proposes similar definition that performance is the level of overall achievement in a certain period of time in completing a task based on the achievable criteria and targets.
Based on the prior definitions, performance can be concluded as work fulfillment and achievement generated from a task that meets a certain deadline and goal.
The conceptual framework of this study is seen below:
3. RESEARCH METHOD
This study was conducted at UPBJJ-UT Makasar using descriptive analysis and multiple linear regression with the following formula:
%= �0+�1�1+�2�2+ & Where: Y = Score of employee performance X1 = Score of job satisfaction X2 = Score of work motivation b0 = Constant/ intercept b1 b2 = Regression coefficient e = error term
This study sought to measure the effect of job satisfaction on employee performance at UPBJJ-UT Makassar through work motivation. To that end, this study adopted quantitative-descriptive approach to illustrate the variables of job satisfaction, work motivation and employee performance at UPBJJ-UT Makassar. To avoid random directions and measurement errors, this study provides limitations of research described in the following operational variables: 1. Job satisfaction is the conformity of employee expectation to a reward provided by an organization.
Job satisfaction is indicated by employee contentment of work opportunity within a certain period of time, employee opportunity for performance review, adequate work environment, employee rapport and contentment of supervisor role in work control.
2. Work motivation is an internal force that drives an individual to perform a certain goal-oriented activity. Work motivation is indicated by work achievement, rewards and promotions for well-performing employees, employee accountabilities, competence-based job descriptions, recognitions from superiors and target-oriented tasks.
Job Satisfaction (X1)
Work Motivation (X2)
Employee Performance (Y)

273
3. Employee performance is work achievement as a result of efforts such as completing tasks ahead of deadlines, excellent work quality, exceptional knowledge and skills, competence-based tasks and employee engagement initiatives.
The population of the study comprises 49 employees of UPBJJ-UT Makassar, among whom are 32 academic staffs and 17 administrative staffs. Research population, as put by Engkos (2012), constitutes the total of a characteristic that becomes an object or subject in a given place or area that meets certain requirements of the measured problem. This study took on a census on account of small groups within the population, thus drawing conclusions about the whole members of the population. To gain a valid and reliable measurement, a test of validity and reliability was run on each item based on the operational variables.
4. RESULT AND DISCUSSION
4.1 Test of Research Instrument 4.1.1 Validity Test Validity coefficient reported the rate of instrument ability to generate data or information of the variables measured. The validity was tested using Pearson product-moment correlation at a significance level of 5% to measure the effects between the independent variables and dependent variables by correlating the scores of question items and the total scale scores. When Pearson correlation scored > 0,3, the item was considered valid. The results of the validity test is shown in table 1:
Table 1
No. Variable Questionnaire item Corrected item-total correlaton
Description
1 Job Satisfaction X1 ()
I am satisfied with the work opportunity within a certain period of time.
0,785 Valid
I am given an opportunity to review my work performance.
0,799 Valid
The working environment and conditions are sufficient.
0,486 Valid
Rapport between employees is well developed.
0,795 Valid
I am satisfied with the work supervision.
0,797 Valid
2 Motivasi Kerja (X2)
Well-achieving employees are provided with promotions.
0,771 Valid
Rewards to well-achieving employees motivate employee performance.
0,846 Valid
I complete tasks with optimal accountability based on my job descriptions.
0,851 Valid
Generally, my co-workers and superiors acknowledge my work.
0,834 Valid
I always need to know how to achieve maximum progress and results during tasks.
0,865 Valid
3 Kinerja Karyawan (Y)
I always seek to complete a task ahead of schedule and move on to another task.
0,725 Valid
My work performance heavily determines the organization outcome and success. Therefore
0,873 Valid

274
I constantly sustain and improve my work quality.
My knowledge and skills are relevant to my current job description.
0,867 Valid
I optimize assigned tasks according to the required capabilities.
0,848 Valid
I work well on my own initiative. 0,640 Valid Table 1 shows that the product-moment correlation scored 0.3 at a significance level less than 5%, which indicates a valid item in the instrument. 4.1.2 Reliability Test
Reliability test measured the consistency of the instrument using Cronbach’s alpha of ≥ 0,6, which indicates a reliable instrument. The results are seen below:
Table 2
Variable Cronbach’s Alpha Description Job satisfaction 0, 773 Reliable Employee Performance 0,844 Reliable Work motivation 0, 884 Reliable
Table 2 shows that the alpha of each variable scored greater than 0.6, which indicates a consistent result after a repeat measure on the same subjects.
4.2 Description of Research Variables After each of the items was tested in terms of the validity and reliability, descriptive analysis provided the quality description by categorizing the variables and the indicators based on the mean values where the range of value is formulated as follows:
Highest value – lowest value Range of value =
Number of classification
The categories based on the mean values of respondent answers are seen in table 3:
Table 3
No Mean value Category 1 1,00 ≤ x < 1,85 Strongly disagree/ very bad 2 1,85 ≤ x < 2,65 Disagree/ bad 3 2,65 ≤ x < 3,45 Slightly agree/ slightly good 4 3,45 ≤ x < 4,25 Agree/ good 5 4,25 ≤ x ≤ 5,00 Strongly agree/ very good
4.3 Analysis on the Description of Employee Perform ance at UPBJJ-UT Makassar
UPBJJ-UT Makassar has provided proper organizational infrastructures, and engaged potential staff in training and development at UPBJJ-UT Makassar or sent them to national training and development at Head-Office UT. Those measures are intended to improve job satisfaction at UPBJJ-UT Makassar.

275
Respondent answers to job satisfaction can be measured with the following indicators: contentment of work opportunities within a period of time, opportunities for performance review, work environment, rapport between employees and supervision role in work control. Based on the collected questionnaires, respondent assessment lies in 3,80 – 4.32 with a mean value of 4.18, which indicates that job satisfaction at UPBJJ-UT is perceived as good. In other words, the respondents are satisfied with the job opportunities, the job progress, the work environment, the rapport between employees and the job supervision. Among those five items, the rapport between employees (XI.4) turns out to be the most dominant factor of job satisfaction with a value of 4.32. This indicates that the other underlying factors need further improvement. In a study by Suwardi (2011) who observed job satisfaction at Regional Secretariat to Pati Regency, job satisfaction among the employees would increase the likelihood of greater employee performance.
4.5 Analysis of the Description of Work Motivation at UPBJJ-UT Makassar UPBJJ-UT Makassar understands and emphasizes that what indicates work motivation among its employees is of crucial importance in terms of achieving its business goals. The indicators include promotions and rewards for well-performing employees, accountable task-completion, competence-based job descriptions, recognition of subordinates by superiors and target-oriented tasks. Based on the collected questionnaires, work motivation is perceived as good, ranging from 4.08 to 4.29 with a mean value of 4.19. Among the five items, rewards to well-performing employees (X2.2) end up as the most dominant factor with a value of 4.29. This is consistent with a prior finding by Suwardi (2011) who concluded that high work motivation would result in high employee performance at Regional Secretariat to Pati Regency.
4.6 Analysis of the Description on Employee Perform ance at UPBJJ-UT Makassar As for employee performance, the questionnaires generated a range value from 4.03 to 4.27 with a mean of 4.19. The most dominant factor out of the five indicators is capability-based job description (Y4) with a value of 4.27. This indicates UPBJJ-UT Makassar deals with a good rate of employee performance, which allows for continuously-improving work quality among its employees. The indicators of good employee performance include task completion ahead of schedules, work quality, skill and knowledge-based assignment, capability-based job description and employee initiative ability. In other words, the employees of UPBJJ-UT Makassar are able to perform tasks with efficient time management, are engaged in an ideal quality of work, demonstrate the required skills and knowledge upon assignments, represent the right capabilities to the required job standard, and work well on their own initiatives.
4.7 The Level of the Effect of Job Satisfaction on Employee Performance Through Work Motivation 4.7.1 The effect of job satisfaction (X1) on employee performance (Y) The descriptive statistics presented previously indicates that job satisfaction positively and significantly affects the employee performance at UPBJJ-UT Makassar with a standardized direct effect of 0.187 and 0.184. This indication leads to the positive effect of job satisfaction on employee performance. The standardized direct effect of 0.187 specifically leads to the empirical facts that the employees at UPBJJ-UT are satisfied with the work opportunities and work environment. The satisfaction will enhance their roles and responsibilities and, ultimately, the overall work performance.
4.7.2 The effect of work motivation (X2) on employee performance (X2) The descriptive statistics indicates that work motivation positively affects employee performance as shown by the standardized indirect effect of 0.248. This indication leads to the fact that high-level work motivation increases the likelihood of high-level employee performance. Reward giving to well-performing employees proves to elevate work motivation during tasks that require optimal accountability in a way that the employees complete the tasks based on their job descriptions.

276
The variable of employee performance describes the empirical data that the employees of UPBJJ-UT constantly seek to complete a task ahead of time to move on to another task and fully realize that their work quality heavily defines the business progress at UPBJJ-UT.
4.7.3 The effect of job satisfaction on employee performance through work motivation The descriptive statistics indicates that there was an indirect-significant effect of job satisfaction on employee performance through work motivation with a standardized indirect effect of 0.118. This indication leads to the empirical facts that, despite indirect effect, the employees of UPJJ-UT are satisfied with the work opportunities, work progress, work environment, rapport between the employees and work supervision.
5 CONCLUSION AND SUGGESTION
5.1 Conclusion There are a number of different purposes that job satisfaction and work motivation can serve in the context of employee performance at UPBJJ-UT Makassar. All of which ensure that employee decisions and behaviors conform to the importance of accomplishing desired policies and program objectives UPBJJ-UT has set and pursued. 5.2 Suggestion This study brings into academic discussion the current situation of human resources at UPBJJ-UT where increased attention needs to be addressed on sufficient work environment in terms of job satisfaction and on appropriate reward and recognition to highly-performing employees in terms of work motivation in order to attain strategic objectives and optimal institutional results.
REFERENCES Fattah, Nanang. 1999. Landasan Manajemen. Bandung: Rosda Karya. Gomes, F.C. (2003). Manajemen Sumberdaya Manusia. Yogyakarta: Andi Offset. Hadis, Abdul. (2008). Psikologi dalam Pendidikan. Bandung: Alfabeta. Luthans, F. (2006). Perilaku Organisasi (Terjemahan Vivin Andika Yuwono). Yogyakarta: Andi. Sukmadinata, Nana Syaodih. (2003). Landasan Proses Pendidikan. Bandung: Remaja Rosdakarya. Robbins, Stephen P. (2008). Perilaku Organisasi, Konsep-Kontroversi-Aplikasi, Edisi Bahasa
Indonesia, Jakarta: PT. Prenhalindo. Rivai, Veithzal. (2005). Performance Appraisal. Jakarta: PT Raja Grafindo Persada. Riduwan & Engkos A.K. (2012). Cara Menggunakan dan Memaknai Path Analysis. Bandung: Alfabeta. Sadili Samsudin. (2005). Manajemen Sumber Daya Manusia. Bandung Pustaka Setia. Sedarmayanti. (2001). Sumber Daya Manusia dan Produktivitas Kerja. Bandung: Mandar Maju. Suwardi & Utomo Joko. (2011). Pengaruh Motivasi Kerja, Kepuasan Kerja, dan Komitmen
Organisasional Terhadap Kinerja Pegawai (Studi pada pegawai Setda Kabupaten Pati), Analisis Manajemen 5 (1)
Suryabrata, Sumadi. (2010). Psikologi Pendidikan. Jakarta: Grafindo Persada Uno, Hamzah B. (2009). Teori Motivasi dan Pengukurannya. Jakarta: Bumi Aksara.

277
COMPULSORY FACE-TO-FACE TUTORIAL IN DISTANCE EDUCATION SYSTEM: STUDENTS’ PERCEPTIONS
Sri Yuniati Putri Koes Hardini 1, Durri Andriani 2 1Faculty of Math & Natural Sciences, Universitas Terbuka (INDONESIA)
2Faculty of Education, Universitas Terbuka (INDONESIA)
Abstract
Since 2013, Universitas Terbuka (UT) has been participated in ‘Bidik Misi’, a government of Indonesia program which provides scholarship for students in higher education institution. To be eligible, student must fresh graduate from senior high school, have good academic record in his/her senior high school, and faces financial limitations. Bear in mind the students’ limitation in self-directed learning, requirement to success in distance education environment, UT requires all ‘Bidik Misi’ students to attend an 8 week-sessions of face to face (F2F) tutorial sessions for all courses taken. This rather different approach is like a two-edged knife: positive if students accept this as beneficial to their learning process and negative if students consider this as reducing chances of doing other activities. To analyse students’ perception on this matter, questionnaires were developed and distributed to all ‘Bidik Misi’ students registered in the second semester of 2016. The questionnaires are focussed on studnets’ perception in three aspects, namely students’ discipline to attend and to hand-in assignments in F2F tutorial sessions, tutors’ quality, and role of F2F tutorial for mastering learning materials. During August-October 2016, the questionnaires were send to eight purposively chosen UT Regional Offices (ROs) and further distibuted to all Bidikmisi students in the UT ROs. A number of 366 students filled-out and returned the questionnaires. The results showed that almost all of the respondents attended the tutorial sessions, handed-in all assignment, perceived tutors as dsicipline and providing enough feedback, and the sessions helped the respondents doing their final exams.
Keywords: face-to-face tutorial, learning support, student perception, tutor
1 INTRODUCTION
Universitas Terbuka (UT) as a higher education institution fully implements distance education (DE) system in Indonesia encourages students to employ self-directed learning (UT Katalog 2017/2018, 2017). However, not all students are accustomed to self-directed learning due to primary and secondary school system in Indonesia which mostly conducted using teacher-centered approach. Notwithstanding, aware of the situation, UT provides learning support for its students with could facilitate the students to master learning process but at the same time prepare the students to eventually get used to self-directed learning. This learning support are provided in many forms, one of them is face-to-face tutorial (F2F tutorial).
The F2F tutorial is especially important to support the Indonesia government program, called Bidikmisi, in which bright but economically-handicapped fresh high-school graduate students are given scholarship to enroll in higher education insitution. UT is included in the Bidikmisi Program and have first Bidikmisi students in 2013. UT beliefs that those Bidikmisi grantees, accustomed to teacher-centered approach, would find F2F tutorial beneficial to their learning process.
Nevertheless, it is necessary to evaluate the F2F tutorial from the Bidikmisi grantees perceptions. The evaluation is focussed on three aspects in relatuon to F2F tutorial namely roles of tutors, functions of assingments, and advantage of F2F tutorial in final examinations.
2 BIDIKMISI PROGRAM & UNIVERSITAS TERBUKA
Bidikmisi Program is an educational scholarship from the government of the Republic of Indonesia through the Directorate General of Higher Education (DGHE), Ministry of Education and Culture (MoEC) for prospective students who are economically disadvantaged but have academic potential, to study at universities in recognized study programs to graduate on time. (http://bidikmisi.belmawa.ristekdikti.go.id/). Grantess will receive assistance of tuition fee given since

278
they accepted in university. The grants are for 8 semesters for Diploma IV and S1 program, and for 6 semesters for Diploma III program. This scholarship is in the form of exemption from all tuition fees during college. In addition, scholarship recipients also receive an allowance for tuition fees that will be received every 6 months
There are four purposes of the Bidikmisi Program, namely: • to improve access and learning opportunities in higher education for students who have economis
constraints but doing well academically • to provide educational assistance to candidates who are eligible to complete a Diploma or Bachelor
Degree program • to improve student achievement, both in curricular, co-curricular and extra curricular, • to produces graduates who are independent, productive, and have social awareness so that they
can play a role in the effort to eradicate pPoverty chain cutting and have positive contribution to community empowerment. (https://id.wikipedia.org/wiki/Beasiswa_Bidikmisi).
Bidikmisi Program is a form of state commitment to continuously strive to increase the number of people who can take education to the higher education level. Even further aimed at breaking the poverty chain that still struck in our country (about 11.5%) (http://dikti.go.id/menggapai-impian-dengan-bidikmisi/). The Bidikmisi Program began in 2010 in response to the high tuition fees at higher education institutions that resulted in more than half of the high school graduates in 2010 not continuing to higher levels. In addition, the number of students coming from poor families is very small, but not a few high school graduates who have good academic ability, but economically need to be assisted. Furthermore, if prospective students who have good academic ability, but economically disadvantaged are assisted, they can be a potential superior human resources.
In 2016, the government provided Bidikmisi assistance to 74,128 new students, bringing the total recipients of education funding from 2010 to present to reach 352,409 students. Every month Bidikmisi-winning students receive Rp.600.000/month life support. In 2017, Kemenristekdikti will increase it to Rp.650.000/month.
Bidikmisi Program is inline with what The Commonwealth Education Hub (2016) beliefs as a need for a variety of funding options to be available to ensure increased and equitable access and at UT, all administraive affairs of the Bidikmisi Program is coordinated by the Office of Vice-Rector for Networking. Once adminitrative issues are settle, related study programs take charge of the students learning process, including implementation of F2F tutorial.
Beginning in 2012 UT is given the opportunity by the DGHE) to recruit students from senior high school graduates in the last two years, in order to obtain Bidikmisi scholarship (http://www.ut.ac.id/2015/78-tentang-ut/691-beasiswa).. The requirement to register for Bidikmisi Program at UT is as follows.
1. Participants are high school graduates who graduated in the last two years 2. The highest age at the time of registering is 21 years 3. Economically handicapped is indicated as follows.
• Maximum gross income of parent/guardian combined = Rp 3,000,000/month • Maximum gross income of parent/guardian combined divided by the number of family members
= Rp750.000/month. 4. Maximum education of parent /guardian = Strata 1 or Diploma 4. 5. Have sufficient academic potential, which is reflected in the best 30% of the school 6. Special consideration is given to applicants who meet the requirements of 1 s.d. 4, if having co-
curricular or extra-curricular achievements at the district/city level or other non-competitive achievements with no ranking (eg head of student school organization).
7. The academic potential and achievements referred to in items 5 and 6 shall be declared by recommendation letter from the Principal/Madrasah or Head of District / City Education Office in accordance with Appendix II of Bidikmisi Guideline.
8. Have adequate health so as not to disrupt the process of learning in higher education institution. 9. Not color blind for certain courses. 10. Committed to complete studies at UT, expressed in agreement or contract between UT and Bidikmisi
student, which includes the rights and obligations of each party including the student's observance of university regulations related to the Bidikmisi Program and the sanctions for its violation.
The UT Bidikmisi Program is distributed to all 38 UPBJJ-UT (see Chart 1 for UT Regional Offices –ROs- location throughout Indonesia and Table 1 for study programs offered in every UT RO)

279
Chart 1. Location of Universitas Terbuka Regional Offices
Table 1. UT Regional Offices & Study Program Offered in Bidikmisi Program
No. UT ROs
∑ of Students (per 2017.2)
Faculty of Economics
Faculty of Law, Social &
Political Sciences
Faculty of Math & Natural
Sciences 1* 2* 3* 4* 5* 6* 7* 8* 9* 10*
1 Banda Aceh 139 √ 2 Medan 80 √ 3 Batam 38 √ 4 Padang 94 √ 5 Pangkal Pinang 90 √ 6 Pekanbaru 98 √ 7 Jambi 45 √ 8 Palembang 220 √ 9 Bengkulu 135 √ 10 Bandar Lampung 143 √ 11 Jakarta 45 √ 12 Serang 37 √ 13 Bogor 200 √ 14 Bandung 189 √ 15 Purwokerto 91 √ 16 Semarang 191 √ 17 Surakarta 93 √ 18 Yogyakarta 83 √ 19 Pontianak 83 √ 20 Palangkaraya 29 √ 21 Banjarmasin 180 √ 22 Samarinda √ 23 Surabaya 215 √ 24 Malang 197 √ 25 Jember 335 √ √ 26 Denpasar 193 √
No. UT ROs
Faculty of Economics
Faculty of Law, Social &
Political Sciences
Faculty of Math & Natural
Sciences

280
1 = Economics Developmentnt 4 = State Administration 7 = English Literature 10 = Statistics 2 = Accountant 5 = Communication 8 = Biologi 3 = Management 6 = Administration Sciences 9 = Agribussiness The requirement to register for Bidikmisi Program at UT is as follows. 1. Participants are high school graduates who graduated in the last two years 2. The highest age at the time of registering is 21 years 3. Economically handicapped is indicated as follows.
• Maximum gross income of parent/guardian combined = Rp 3,000,000/month • Maximum gross income of parent/guardian combined divided by the number of family members
= Rp750.000/month. 4. Maximum education of parent /guardian = Strata 1 or Diploma 4. 5. Have sufficient academic potential, which is reflected in the best 30% of the school 6. Special consideration is given to applicants who meet the requirements of 1 s.d. 4, if having co-
curricular or extra-curricular achievements at the district/city level or other non-competitive achievements with no ranking (eg head of student school organization).
7. The academic potential and achievements referred to in items 5 and 6 shall be declared by recommendation letter from the Principal/Madrasah or Head of District / City Education Office in accordance with Appendix II of Bidikmisi Guideline.
8. Have adequate health so as not to disrupt the process of learning in higher education institution. 9. Not color blind for certain courses. 10. Committed to complete studies at UT, expressed in agreement or contract between UT and Bidikmisi
student, which includes the rights and obligations of each party including the student's observance of university regulations related to the Bidikmisi Program and the sanctions for its violation
3 F2F TUTORIAL
Fung and Carr (2000) did a reserach on F2F tutorial which focussed on students' expectations of the benefits they will gain; their reasons for attending; the approaches they prefer; and their overall satisfaction with what tutors actually provide. Reddy V. Points out that attendance at tutorial sessions should be made compulsory. Tutors who are not familiar with the techniques of counseling and treating adults should get some orientation beforehand. (Reddy, 1996)
Katalog 2017/2018 (2018) explains that F2F tutorial is a tutorial activity conducted face-to-face in a classroom. F2F tutorial is conducted by UT ROs in eight consecutive weeks for each course. During the tutorial, students are given three assignments at weeks 3, 5, and 7. The assignments can be done inside or outside of the tutorial class, depends on the characteristics of the course and the provisions set. In the F2F tutorial, students are required to actively participate by coming at least five out of eight meetings, engaging in the discussions, and finishing all three assignments timely.
A study by Putra (NA) reveals that there is a substantial difference between the average of students’ tutorial scores and that of the final examination results. In addition, the correlation between score in tutorial and those in final exam is very small but positive and significant. Furthermore, partial correlation analysis between tutors’ specific characteristics shows that the association of students’ tutorial scores and final exam results is significant in the group of students guided by tutors holding a master’s degree and in those instructed by university affiliated tutors. The mean difference analysis between groups
1* 2* 3* 4* 5* 6* 7* 8* 9* 10* 27 Kupang 15 √ 28 Mataram 76 √ 29 Makassar 139 √ √ 30 Majene 96 √ 31 Palu 17 √ 32 Kendari 24 √ 33 Manado 49 √ 34 Gorontalo 139 √ 35 Ambon 84 √ 36 Jayapura 115 √ 37 Ternate 59 √ 38 Sorong 108

281
defined by tutor characteristics showed that the students guided by tutors with a master’s degree did substantially and significantly better than those instructed by tutors with only a bachelor’s degree, but there is no significant difference between the groups defined by tutors’ professional affiliations.
Picture 1. F2F Tutorial Sessions
Others researchers, Rahman and Sadat (2010), mentions factors like conditions and infrastructure of the tutorial centres, tutor’s qualification, experience and training in distanc learning, teachin styl and strategie as importance in the process of acquiring education through DE.
At UT, F2F tutorial tutors are experts from state or private higher education institutions as well as other institutions who fulfilled the requirements set by UT. The requirement is related to their educatioanal background and teaching competencies. To ensure that tutors possess enough comptencies to act as tutors, UT provides training for prospective tutors. This is also in line with Reddy (1996) who mention the necessity for tutors who are not familiar with the techniques treating adults to get some orientation beforehand. Prospective tutors who qualify for training are invited and take part in the training where they learn about effective learning methods in tutorials, development of tutorials, and development and assessment assignments. Tutors who are not familiar with the techniques of counseling and treating adults should get some orientation beforehand. (Reddy, 1996). Tutors who have attended the training are included in the exam to obtain a tutor certificate. Only participants who have passed the examination and have a certificate of tutor are entitled to be tutors.
As part of ISO 9001:2008 (now up-dated with ISO 9001:2015) implementation, UT has developed procedure to ensure that F2F tutorial is conducted effectively. The procedure deals with planning, doing, monitoring and controlling, as well as providing feed back to the F2F tutorial process.
4 METHODS, RESULTS, & DISCUSSIONS
4.1 Methods
Bidikmisi students enroll at study programs in all 38 UT ROs. For this research, only eight UT ROs are included for manageability reasons. UT ROs were chosen purposively to represent three parts of Indonesia, eastern, western, and central parts. Eastern Indonesia was represented by Ambon, western part by Bandung, Surakarta, Jember, Surabaya, Bandar Lampung, and Medan, while central part by Gorontalo
Participants in this reserah are all students first register in 2013–2015 semester. In other words, students have to be at least in their third semester to serve as respsondent in this study. Therefore they can provide their perceptions on at least three semesters of their experiences of taking part in F2F tutorials.
Data were collected during August-October 2016 with questionnaires especially developed for this research. Questionnaires were send to UT ROs and distributed to Bidikmisi students on F2F tutorial sessions. There is no compulsary to fill out the questionnaires and no consequence of any kind to students’ participation in the reserach with the students’ final grades.

282
4.2 Results & Discussions
A number of 1000 questionnaires were distributed to Bidikmisi Students in eight UT Ros and 366 (37%) questionnaires returned and all used in analysis. Distribution of questionnaires returned based on UT ROs (Graph 1) and gender of the samples (Table 2) reveals that more than half of the respondents are from UT RO Jember and 68% are females.
Meanwhile, distribution of respondents based on Faculties and study programs are listed in Table 3. Around one fifth of the respondents enroll in Communication (21,9%) and Administration Scineces (23,8%) study programs at Faculty of Law, Social, and Political Sciences. Agribussiness study program is represented the least (1,1%). Nonetheless, all study programs are represented in this research.
Table 2. Distribution od Respondents Based on UT ROs and Gender
UT Regional Office Female Male Total
n % n % n %
Jember 143 39,07 56 15,30 199 54,37
Surabaya 40 10,93 14 3,83 54 14,75
Gorontalo 15 4,10 30 8,20 45 12,30
Ambon 12 3,28 7 1,91 19 5,19
Surakarta 13 3,55 2 0,55 15 4,10
Bandar Lampung 10 2,73 4 1,09 14 3,83
Bandung 6 1,64 3 0,82 9 2,46
Medan 8 2,19 1 0,27 9 2,46
NA 2 0,55 0 0,00 2 0,55
TOTAL 249 68,03 117 31,97 366 100,00
Table 3. Distribution of Respondents by Faculties and Study Programs
Faculty Study Program UT Regional Office*
TOTAL1 2 3 4 5 6 7 8 NA
Economics
Ec. Development - - - - 9,0 - - - - 9,0
Accountant 1,4 - - 3,6 1,4 1,4 5,2 1,4 - 14,2
Management 1,4 2,2 - 2,7 - - 4,9 - - 11,2
Law, Social & Political Sciences
State Administration 1,1 1,6 - - 7,7 - - - - 10,4
Communication - - - 1,9 16,1 1,1 0,0 2,7 - 21,9
Administration Sciences - - - 4,1 19,1 - - - 0,5 23,8
Math & Natural Sciences
Biology 1,4 0,0 2,5 - - - - - - 3,8
Agribusiness - - - - 1,1 - - - - 1,1
Statistics - - - - - - 4,6 - - 4,6
TOTAL 5,2 3,8 2,5 12,3 54,4 2,5 14,8 4,1 0,5 100,0
1 = Ambon 3 = Bandung 5 = jember 7 = Surabaya 2 = Bandar Lampung 4 = Gorontalo 6 = Medan 8 = Surakarta
Almost all of respondents (98%) attended all the F2F tutorial sessions and almost all (96,2%) did the assignment on time. The almost fully-attendance could be rooted in the regulation that only those who attend at least five out of eight sessions is entitled to tutorial session to be counted in final score (Katalog UT 2017/2018, 2017). Meanwhile, high number of respondents strongly agree and agree to hand in all their assignments timely could be caused by the respondents awareness that in doing the assignments

283
they could get tutors assistance which could result in high scores. A privilege do not apply in final examinations.
Graph 2. Respondents Attandance and Assingments on the F2F Tutorial Sessions
Graph 3. The Location of F2F Tutorial Sessions
One important thing in choosing the location for F2F tutorial is location (Ragman and Sadat, 2010). Almost 75% respondents strongly agree and agree that F2F location is close to their domicile as well as easy to reach (Graph 3). This could be also responsible for almost respondents participated in all the F2F tutorial sessions. Easiness to come to the location means respondents did not have to spend a lot of time and a lot of money. Two things that they usually lack of, especially for money. The Government does provide Bidikmisi students with staple of about Rp.600.0o0/month but it could only provide for the very basic necessities.
In term of tutors, Graph 4 depicts that respondents in general agree that tutors met their schedules (85,3%), facilitating the respondents to understand learning materials (93,3%), and last but not least providing feed back for all the assignments (93,9%). On-time tutors, with the implementation of ISO 9001:2008 at UT, is inevitable. Every process in F2F tutorial is closely guided by procedure and periodically monitored, controlled, and evaluated. The respondents evaluation on the tutors’ timelines in giving tutorial demonstrate UT success in implementing its quality assurance system. However, solely resting evaluation on the tutor’s timeliness will not beneficial for students if they do not benefit
75,1
23,0
1,6 0,3
52,1
44,1
3,30,5
Strongly Agree Agree Disagree Strongly Disagree
Attend All Tutorial Sessions Do All the Assignments
36,9 37,8
16,9
8,3
49,044,6
4,2 2,2
Strongly Agree Agree Disagree Strongly Disagree
The Location is close The location is very easy to reach

284
form the tutors’ presence. Hence, it is exhilarating that almost all of the respondents (95,3%) mentions that tutors help them understanding all subject matters.
Graph 4. Respondents’ Perceptions on Tutors in F2F Tutorial
Graph 5. Joining F2F Tutorial Helps Students in Final Exams
In line with Agung (NA) research which resulted in small but positive and significant correlation between score in tutorial and those in final exam, 98% of respondents perceived their activities in F2F tutorial helping them in their final exams (Graph 5). This also align with one of the reasons UT providing F2F tutorial, facilitating students in their learning process so they would master their learning materials and as a consequence be able to take the exams successfully.
5 CONCLUSION Almost all respondents perceived the necessity to attend F2F tutorial sessios and they handed in the assignments timely. The respondents also experinced benefits from joining teh tutorial in terms of getting feed back for the asignments as well as mastering learningmaterials which in turn helping the respondents in doing their final exams. In short, F2F tutorial which UT provided for Bidikmisi students have been positively agreed to be beneficial for students.
23,0
62,3
12,6
2,2
41,9
53,4
4,10,5
30,0
63,9
5,50,6
Strongly Agree Agree Disagree Strongly Disagree
Always arrive on time as scheduled Help understanding all subject matter
Feed back are provided for all courses
Strongly Agree
60%
Agree
38%
Disagree
2%
Strongly
Disagree
0%

285
It is therefore suggested to continue providing F2F tutorial for young-bright-fresh graduate Bidikmisi students to facilitate them in mastering all learning materias required to graduate.
REFERENCES
[1] Beasiswa Bidikmisi (Bidikmis Scholarship). Downloaded from https://id.wikipedia.org/wiki/ Beasiswa_Bidikmisi on 10 April 2017.
[2] Beasiswa. Downloaded from http://www.ut.ac.id/2015/78-tentang-ut/691-beasiswa on 10 April 2017
[3] Fung, Y & Carr, R. 2000. Face-to-Face Tutorials in a Distance Learning System: Meeting student needs. Journal Open Learning: The Journal of Open, Distance and e-Learning, 15(1), pp 35-46 downloaded from http://www.tandfonline.com/doi/abs/10.1080/026805100115452? journalCode=copl20 on 20 April 2017
[4] Menggapai impian dengan Bidikmisi. 28 March 2017. Ministry of Reserach, Technology, and Higher Education, republic of Indonesia. Downloaded from http://dikti.go.id/menggapai-impian-dengan-bidikmisi/ on 1 April
[5] Putra, A.A.M.S. (2014). Face-to-face Tutorial Program in Distance Education:How Effective to Improve Students’ Performance. Doctoral d issertation at College of Education, Florida State University.
[6] Rahman, K.M.R. & Sadat, A. (2010) Analysis of Tutorial Services for Distance Learners: A Case of Bangladesh Open University
[7] Reddy, M. (1999). Distance Education in India. A model for Developing Countries. New Delhi: Vikas Publishing
[8] The Commonwealth Education Hub. 2016. Funding education: the role of scholarships, bursaries and other mechanism. Discussion summary
[9] Universitas Terbuka. 2017. Katalog UT 2017/2018 (UT Catalog 2017/2018). Banten: Universitas Terbuka

286
GROUP REPORTING AS A TOOL TO ENHANCE THE QUALITY OF COURSES: THE RESPONSE OF DATABASE STUDENTS TO
ONLINE COOPERATIVE LEARNING
Mari Anjeli L. Crisanto 1University of the Philippines Open University (PHILIPPINES)
Abstract
Group reporting, a form of cooperative learning, is a learning tool often employed in residential teaching to facilitate quality learning. Like other cooperative learning methods, it enhances learning in classrooms by allowing students work on activities in small groups to receive rewards based on their group’s performance. However, though group reporting is often done in face-to-face settings, few literature has shown its application in online learning. Moreover, the question as to whether online cooperative learning through group reports yields positive or negative response from students has to be studied further. This study focuses on the students’ response to the group reporting activity carried out throughout one semester. A course offered by the University of the Philippines Open University (UPOU) on computer databases made use of group reporting to add to the students’ learning experience. Group meetings along with regular online lectures were carried out during the first half of the semester. The output group reports were then presented during the second half and served as the main resource for those weeks’ study modules. An online survey with Likert Scales drawing out the student reactions on the learning activity impact was administered to volunteer respondents at the end of classes. 71.9% of 32 respondents observed changes in their behaviour after using peer and cooperative learning technologies. 28 respondents also indicated that they enjoyed the group reporting activity (14 agreeing strongly, 14 agreeing moderately). 22 indicated that they were motivated to learn the course through the group reports (8 agreeing strongly, 14 agreeing moderately). However, when asked if they preferred to have all the modules in group report format 9 agreed moderately, 8 disagreed moderately, 7 disagreed strongly, 4 agreed strongly, and 4 neither agreed nor disagreed. Still, overall, online cooperative learning facilitated quality learning based on this study’s results. Keywords: Cooperative Learning, Group Reports, Quality Assurance of Learning Activities
1 INTRODUCTION
Cooperative learning i has had a substantial revival in educational research and practice in recent years. It is a technique wherein students work on learning activities in small groups and receive rewards based on their group’s performance. [1] Cooperative learning is beneficial because it combines and promotes both academic and social skills and it is useful in culturally diverse classrooms. Cooperative learning gives students the chance to learn in an environment that is dynamic and creative growing out of the interaction of diverse backgrounds, interests, experiences, and ideas [2]. Encouraging students to learn cooperatively will not only support their academic success but will equip them for lifelong learning as well [3]. However, despite the potential benefits of cooperative learning at universities, implementing it is challenging [4]. This holds not only in residential teaching but also for online teaching where literature for this are few.

287
1.1 Background Group reporting is a form of cooperative learning. Here, are responsible for their own learning and for helping others learn. As a form of cooperative learning technique, it maximizes on the diversity of the people who are part of the group to foster dynamic and creative learning. In the University of the Philippines Open University (UPOU), a course on Database Management Systems (CMSC 206) includes a mix of students who are either taking up Diploma in Computer Science or Masters in Information Systems. The mix includes students who are learning about databases for the first time, those who are experts in databases and are using them daily in their occupations, and those who are in between. Because of this diversity, group reporting was included in the course’s learning activities to enhance the students’ learning experience. CMSC 206 classes, however, are conducted purely online. Students are often based in different parts of the Philippines as well as abroad and there are no face-to-face classes for this course.
1.2 Statement of the problem
Few literature have shown how cooperative learning is done online. Moreover, the question on what the responses of students are to online cooperative learning need to be studied further. This paper focuses on answering this question.
1.3 Objectives
This study has the following objectives:
1. To identify the response of CMSC 206 students to online cooperative learning; 2. To determine if there were changes in behaviour after the cooperative learning activities; and 3. To draw out from the students their observations about their behaviour change.
2 RESEARCH DESIGN AND METHODS
Group reporting as a form of cooperative learning was executed during Week 7 of the First Semester 2016-2017. Students were instructed to conduct group meetings using technologies of their choice by Week 2 of the said semester. They were given the freedom to meet virtually or face-to-face in order to create their group reports which were to be presented in a form of a video or playlist uploaded online. The 64 students were divided into 7 groups with 9-10 group members each. They were grouped according to the location they indicated in their profiles. As much as possible, the groups contained students who specified the same location. However, there were a lot of offshore students and students who resided in other regions in the Philippines. Thus, most groups still had members who were spatially distant from each other. Each group was assigned to report on one of the modules for CMSC 206. Their output videos were shown as the main reference in the course site during the week assigned to them. These output videos for Modules 6-12 in CMSC 206 were shown from Weeks 7-13. These group reports comprised 20% of the students’ total grade as stated in their course guides. Group reports were graded based on content, clarity, and creativity. Clarity and creativity were assessed by their peers. Online questionnaires were then distributed to the students at the end of the semester. This was voluntary and answering the survey did not affect their grades in any way. Of the 64 students, 57 remained active meaning these 57 did not drop the course formally or informally. 32 of 57 active students took part in the online survey. The survey was divided into six parts: 1) Student Demographics; 2) Technologies Used; 3) Peer Learning Assessment; 4) Cooperative and Collaborative Learning Assessment; 5) Overall Evaluation; 6) Comments and Suggestions for CMSC 206. This paper focuses on parts 3, 4, and 5 of the survey administered. These were the questions asked for parts 3, 4, and 5 of the online questionnaire:
A. Peer Learning Assessment

288
1. Please evaluate each sentence as how you agree/relate with them personally. Please avoid answering (3) as much as possible. Only answer it if you truly do not have a stance in the statement.
a. The technologies I identified helped me learn from my peers b. The technologies I identified enabled me to share what I know with my peers c. Learning from my peers (through these technologies) contributed positively to
my learning experience d. I would have performed the same way or better if I worked in this course alone* e. Interacting with my peers and sharing my work with them was difficult*
B. Cooperative and Collaborative Learning Assessment 1. Please evaluate each sentence as how you agree/relate with them personally. Please
avoid answering (3) as much as possible. Only answer it if you truly do not have a stance in the statement.
a. Learning as a team enabled us to learn more about this course than learning alone.
b. The technologies we have used made it easier for us to collaborate c. The technologies we have used allowed us to accomplish our tasks quickly d. The technologies for collaboration made it more difficult for us to accomplish
our tasks* e. We were able to accomplish more via face to face meetings than using the
technologies* f. In accomplishing tasks, we were able to communicate with each other more
conveniently through SMS, phone calls, and face to face conversations* g. Having youtube video presentations together allowed us to learn the course
concepts more effectively h. After taking this course I can see a positive impact in my behaviour in terms of
collaboration and cooperation in the work place C. Overall Evaluation
1. Please evaluate each sentence as how you agree/relate with them personally. Please avoid answering (3) as much as possible. Only answer it if you truly do not have a stance in the statement.
a. I liked and enjoyed the group reporting activity in this course. b. I preferred to have all modules in group report format. c. I was motivated to learn the course through the group reports.
2. Were there changes in your behavior after using peer and cooperative learning technologies? (Yes/No)
3. If your answer was yes, please state your observations. If your answer was no, please state why.
The questions were based on an earlier survey conducted by Figueroa [5] for peer and cooperative learning among distance learners in academic and private-public partnership initiatives. Questions with an asterisk were negatively worded and had to be normalized during the analysis and interpretation stage. The consolidated responses were analyzed by taking the Cronbach alpha to test for reliability and using the percent agree methodology to determine the students’ overall response to the online cooperative activity. The frequency of those who stated “strongly agree” and “moderately agree” were summed then divided by the total to determine the percent who agreed to the Likert questions. This was also done for the frequency of those who stated “strongly disagree” or “moderately disagree” to get the percent who disagreed. Neutral responses were simply divided by the total. The next section discusses the results of these computations.
3 RESULTS
Thirty-two of the 57 active students who took up CMSC 206 in the 1st Semester of the Academic Year 2016-2017 participated in the online survey administered at the end of the course. The demographics of the participants are shown in the Fig. 1, 2, and 3.

289
Fig. 1. Gender of participants
Fig. 2. Degree being pursued by participants
Fig. 3. Country where participants are residing in
41%
59%
GENDER OF PARTICIPANTS
Male Female
41%
59%
DEGREE PURSUED
DCS MIS
0
5
10
15
20
25
30
Philippines Australia Singapore Oman USA Bahrain Nigeria
COUNTRY RESIDING IN

290
There were 19 female respondents (59.4%) and 13 male respondents (40.6%). 19 (59.4%) were taking up Master of Information Systems and 13 (40.6%) were taking up Diploma in Computer Science. CMSC 206 is a core subject of DCS and an elective of MIS. As for the participants’ location, the survey only gathered the country where the participants resided in. 24 were staying the Philippines, 3 in Singapore, and 1 each in Australia, Oman, USA, Bahrain, and Nigeria.
Table 1 shows the agreement table of the consolidated responses to the Likert Questions of parts 3, 4, and 5 of the administered online survey.
Table 1. Agreement Table for survey questions on peer, cooperative, and collaborative learning
No. Statements Evaluated (Likert Questions) 1 2 3 4 5
1 The technologies I identified helped me learn from my peers 0 1 1 16 14
2 The technologies I identified enabled me to share what I know with my peers
0 0 0 22 10
3 Learning from my peers (through these technologies) contributed positively to my learning experience
0 0 0 13 19
4 I would have performed the same way or better if I worked in this course alone*
10 13 5 4 0
5 Interacting with my peers and sharing my work with them was difficult*
17 12 1 2 0
6 Learning as a team enabled us to learn more about this course than learning alone.
0 0 1 16 15
7 The technologies we have used made it easier for us to collaborate 0 0 1 14 17
8 The technologies we have used allowed us to accomplish our tasks quickly
0 0 1 16 15
9 The technologies for collaboration made it more difficult for us to accomplish our tasks*
17 10 2 3 0
10 We were able to accomplish more via face to face meetings than using the technologies*
9 11 10 1 1
11 In accomplishing tasks, we were able to communicate with each other more conveniently through SMS, phone calls, and face to face conversations*
8 7 7 7 3
12 Having youtube video presentations together allowed us to learn the course concepts more effectively
1 0 1 19 11
13 After taking this course I can see a positive impact in my behaviour in terms of collaboration and cooperation in the work place
0 0 4 12 16
14 I liked and enjoyed the group reporting activity in this course 0 0 4 14 14
15 I preferred to have all modules in group report format 7 8 4 9 4
16 I was motivated to learn the course through the group reports 0 7 3 14 8

291
More participants answered “moderately agree” and “strongly agree” compared to the other choices. To interpret these ratings further, the percent agree scores were computed. The statements with an asterisk were those in negative wording and the frequency of “strongly disagree” and “moderately disagree” were computed for the percent agree scores and “strongly agree” and “moderately agree” for percent disagree. Fig. 4 shows the percent agree-disagree chart of participants’ response to survey questions.
Fig. 4. Percent agree-disagree chart of participants’ response to survey questions
Only 2 statements had percent agree scores lower than 50%. In the statement “In accomplishing tasks, we were able to communicate with each other more conveniently through SMS, phone calls, and face to face conversations*”, the 47% score meant only 47% able to connect more conveniently using online technologies as compared to the offline ones mentioned. 41% disagreed with the statement on preferring to have all the modules in group report format. This could mean that they are ok with having 7 out of 12 modules in group reporting format as was done in the course or that some or none at all should be presented as a group report. The rest of the statements (14 of 16) had the majority agreeing as the percent agree scores were higher than 50%. 7 of those statements had percent agree scores above 90%. These are shown in Table 3.
Table 3. Likert questions with more than 90% participants agreeing
No. Statements Evaluated (Likert Questions) Percent Agr ee
1 The technologies I identified helped me learn from my peers 93.75%
2 The technologies I identified enabled me to share what I know with my peers
100%
3 Learning from my peers (through these technologies) contributed positively to my learning experience
100%
5 Interacting with my peers and sharing my work with them was difficult* 90.63% disagreed
6 Learning as a team enabled us to learn more about this course than learning alone.
96.875%
0
10
20
30
40
50
60
70
80
90
100
1 2 3 4 5 6 7 8 9 10 11 12 13 14 15 16
PERCENT AGREE-DISAGREE CHART
Percent Agree Neutral Percent Disagree

292
7 The technologies we have used made it easier for us to collaborate 96.875%
8 The technologies we have used allowed us to accomplish our tasks quickly 96.875%
12 Having youtube video presentations together allowed us to learn the course concepts more effectively
93.75%
The technologies being referred to in the statements were those which the participants identified as those used in their meetings and group reports (parts 1 and 2 of the online survey). For statement 5, it means that 90.63% found that interacting and sharing with their peers was not difficult. The scores indicate that the participants found online cooperative learning to be agreeable. As for the survey’s reliability, the responses for those 16 Likert questions had a Cronbach alpha coefficient of 0.88 (good) indicating that the questions were reliable. When asked if there were changes in their behaviour after using peer and cooperative learning technologies, 72% (23 participants) responded yes while 28% (9 participants) responded no as seen in Fig. 5. Table 2 shows the participants’ observations on their changes in behaviour copied in verbatim.
Fig. 5. Response of participants to changes in behaviour survey item
Table 2. Participants’ observations on their changes in behaviour
ANSWER REASONS FOR ANSWER
YES Using peer and cooperative learning technologies helped me become more of a "people-oriented" person, as I have to broaden my understanding about others and work with them harmoniously so we can accomplish our tasks.
It made me somewhat more interactive and added a sense of more involvement for me rather than solo reading and studying does.
I learned to take more initiative and learned to ask my peers about things I do not know about.
72%
28%
WERE THERE CHANGES IN YOUR
BEHAVIOR AFTER USING PEER AND
COOPERATIVE LEARNING
TECHNOLOGIES?
YES NO

293
It made me more responsive to my group mates given that we can't meet face to face and do my best to explain my report via audio visuals.
Not a change in behavior, per se, but I gained some additional skills since I don't normally do video-editing outside this course.
I become more responsible because we were working in a group.
My mindset changed that collaboration for school activity is feasible given the opportunity and was able to know my classmates besides their names.
Given that this is an online education and there is tremendous gap among the students, truly those technologies are great tool for collaboration. I am glad that I experienced to use Skype calls in a collaborative manner. Also I was very challenged that my group mates are so active (giving so much ideas and sharing a lot) in doing our group projects.
I observe that by using peer and cooperative learning technologies, distance learning is no distance at all.
I learned to finish things way ahead of schedule in order for the group leader to compile all our works into one presentation
I felt relieved that I was not alone having difficulties with new technologies. My respect for my other classmates was increased, especially to those who took extra effort to make the group project a success.
Group reporting in online education is very difficult to achieved with a one hundred percent result since not everyone will be present on the scheduled meetings plus you cannot see the "real" reactions and emotions of your groupmates especially when there are conflicts in the agenda or intended output. Nevertheless, we were still able to achieved a positive result even though there were limited time for most of us.
I appreciated peer and cooperative learning technique. I liked how the course was structured which was a mix of teacher-student learning and the next half as group reporting. It was well structured and I learned a lot using this teaching method.
there is an exchnage of ideas, and I have learned new technologies from my groupmates when we dicussed about how to come up with the presentation.
I was able to manage my time because of the deadline. Patience in manipulating the technology used in our group report (videoscribe) as I am new to it, and patience with my group members, as there are members who were not able to meet the deadline set by the group.
I feel more challenged and more responsible in terms of accomplishing the assigned task to me. I also become much inspired and able to work and study easily through the cooperative learning.
I learned a lot from my from group more specifically the technology we used in accomplishing our group report because it is new to me and I can use it in the future.
I felt more comfortable and confident in socializing with other people.
It made me realize that participation is needed and reading through their replies on the discussion forum opened my eyes on a lot of things that I don't know before.
The method forced me to do time management and avoided procrastination.

294
Yes, that each and everyone has each own way of presenting his report through use of different tools like PowToon.
I learn new things like powtoon
My group mates are all contributed in the group report project. I would say their perseverance is contagious. The main reason why I work positively with them is because they are very encouraging and inspiring.
NO These are the same technologies I am leveraging in the office.
In a group where everyone has to contribute, there will always be some members who won't be able to do their part, whether the task is to be done face-to-face or offline. We'll only be fortunate if someone else from the group steps up for that non-contributing member aside from the group leader. Lucky us.
I like my classmates. They were cooperative and easy to work with. I find it refreshing to meet (virtually) them knowing that it is rare to happen because of the distance learning format we have in UPOU
No change really.
None
I don't think it did a lot to change my behavior since the groupings was not that long enough to be able to change someone's behavior.
I'm used to meetings or collaborative work from my work
N/A
These technologies have been a norm even before I was in undergrad.
The answers consolidated in the table shows that a lot of the behaviour changes were positive though there were some who did not experience any behaviour change. However, those who experienced positive behaviour changes outnumbered those who had none.
4 CONCLUSIONS AND RECOMMENDATIONS
The results of this study show that the CMSC 206 participants found online cooperative learning to be agreeable and that their response towards this activity was positive. 88% of the respondents had indicated that they enjoyed the group reporting activity. 69% indicated that they were motivated to learn the course through the group reports. However, when asked if they preferred to have all the modules in group report format only 41% agreed. 9 agreed moderately, 8 disagreed moderately, 7 disagreed strongly, 4 agreed strongly, and 4 neither agreed nor disagreed. It is unclear whether the students preferred just to have the 7 modules in group report format as was done throughout the semester or if they preferred to have some or none at all. Still, overall, online cooperative learning facilitated quality learning based on this study’s results. 71.9% of 32 respondents observed changes in their behaviour after using peer and cooperative learning technologies and the majority of their behaviour changes were positive. Further studies can be done to determine how much or how less of the course should be done in group reporting format.
295
REFERENCES
Slavin, R.E. (1980). Cooperative Learning. Review of Educational Research, 50(2), 315-342.
Sharan, Y. (2010). Cooperative Learning for Academic and Social Gains: valued pedagogy, problematic practice. European Journal of Education, 45(2), 300-313.
Skalicky, J & Brown, N. (2009). Peer Learning Framework: A Community of Practice Model. (Discussion Paper). Australia: University of Tasmania.
Buchs et al.. (2015). Why students need to be prepared to cooperate: a cooperative nudge in statistics learning at university, Educational Psychology: An International Journal of Experimental Educational Psychology: DOI: 10.1080/01443410.2015.1075963.
Figueroa, R.B. Jr. et al. (2015). An Evaluation of Tools for Fostering Collaborative and Peer Learning Among Distance Learners in Academic and Private-Public Partnership Initiatives. Paper presented at The Asian Conference on Education & International Development, Osaka, Japan, March 29-April 1, 2015.

296
SOCIAL PRACTICES OF PLAGIARISM IN OPEN UNIVERSITY STUDENTS IN MAKING ONLINE TUTORIAL TASK
Pardamean Daulay 1 Sutini 2 Nur Afni Khafsoh 3
1Lecturer of Faculty of Social and Political Science, Universitas Terbuka (INDONESIA) 2Lecturer of Faculty of Teacher Training and Education, Universitas Terbuka (INDONESIA) 3Online Tutor of Faculty of Social and Political Sciences, Universitas Terbuka (INDONESIA)
Abstract
This research aims to describe Open University students' perceptions of plagiarism, The factors behind the plagiarism and forms of plagiarism in Open University students in creating online tutorial tasks. This research uses a qualitative method by distributing questionnaires to 23 respondents. The result of the research finds that the general perception of Open University students about plagiarism is still limited to the technical level, that is doing the cheating in the exam. So that in doing the task of the online tutorial, they never quote information or task material from the internet without mentioning the source. There are two factors that cause Open University students to practice plagiarism, namely; (1) the development of information technology such as internet which gives ease to the students to get the materials of online tutorial task from those sources, (2) the high burden of student task, while the available time is very limited. However, the form of plagiarism by Open University students can still be categorized as a form of inadvertent plagiarism, among others; (1) take the writings of others who are acknowledged as own works, such as download papers or articles from the internet, then collected as a result of his own work, (2) take idea then change into his own language, and (3) The whole (copy paste) without changing the text or adding with any analysis or comment.
Keyword: Plagiarism, online tutorial, perception, distance education
1 PRELIMINARY
Open University is a distance education institution remotely using the internet network as one mode of learning. One of them is an online tutorial service (online tutorial) aimed at helping students solve various lecture problems that are considered difficult. Therefore, this online tutorial activity is not much different from the face-to-face lectures in the classroom. Students learn to be facilitated by a lecturer (read-tutor) to discuss certain lectures. But the difference, if the lectures are face to face for 18 weeks per semester, but online tutorial only done eight weeks. The task of the tutor was slightly different, such as preparing the initiation as a substitute for teaching materials, making eight discussion topic topics that will be discussed in discussion forums, and provide 3 tutorial tasks. Meanwhile, students must study the initiation materials, participate actively in discussion forums and do three tutorial tasks. Tasks are given in weeks 3, 5, and 7. Active participation of students in discussions and online tutorial assignments contributes 30% towards the final grade of the course. However, the initial observations made by the authors during this show that many students participant online tutorial who did not play an active role in the discussion and in the execution of tasks. Even from the recording of online tutorial participants' activity, it was found that some of the students had actually opened discussion forums and job pages, but they did not post anything on the forum. Many Open University students who work on tasks are just careless, sending answers over time, and there is a tendency for students to do their work by plagiarism, for example by sending answers that are entirely taken from the internet without specifying the source.

297
This phenomenon is certainly not very good because the Open University's effort to provide learning assistance services to students based on honesty values has not been welcomed by students. Whereas from the registration period 2013.1 all courses are completed with online tutorial activities, so if the task is not done well or practice plagiarism, it will reduce their chance to get value contribution for each subject they register. This is thought to be the result of several reasons, namely (1) the possibility of Open University students has not understood the essence or meaning of the tutorial task; (2) Tutor of online tutorial has not explained the essence of a tutorial task, (3) other possible tutors giving less feedback on student assignments, and (4) limited access to UT students to obtain library services. According to Fasli Jalal (2010), the act of plagiarism other people's scientific papers which are later acknowledged as their own works have long been held in various institutions of higher education. The case of plagiarism is not only done by students but also professors and professors. As reported in Kompas.Com entitled "Penjipakan Makin Merebak/ More Plagiarism" (18/02/2010). There were two prospective professors at a private university in Yogyakarta who was suspected of submitting scholarly work on the submission of their master degree, so that the submission of their professorship title was temporarily suspended until the clarification process was completed. Another striking case of plagiarism occurred in a sociology doctorate of alumni at Gajah Mada University (UGM). In one of the news on www.surabayaspost.co.id under the title "Membenahi Moral Pendidikan Tinggi/ Maintaining a Moral Higher Education" (02/03/2010), it is mentioned that the case is only known after the declared graduated as a doctor in the field of sociology and that after The dissertation of the dissertation work concerned in one of its parts is considered trumpeting thesis masterpiece of Faculty of Social and Political Science of University of Airlangga. With the incident, the title held by the concerned member had to be canceled by the UGM Senate. Plagiarism is defined in the Great Dictionary of Indonesian as a collection of other people's opinions and makes it as if its own, such as publishing another's written work on its own behalf. Historically the term plagiarism comes from the word plagium which means kidnapping of a child or slave. Then Belinda (in Soelistyo, 2011) defines plagiarism as an act of plagiarizing other people's ideas, ideas or works without mentioning the source, giving rise to false or misleading assumptions about the origin of an idea, idea or work. Meanwhile, Goldstein (in Soelistyo, 2011) declared the plagiarism act as a form of plagiarism, thus deemed to have a connection with copyright. According to Minister of National Education Regulation no. 17 of 2010, there are five forms of plagiarism that often occur and done intentionally in the academic or college environment, as follows:
• Citing terms, words, sentences, data, information and combine from a source without specifying the source or without adequately and adequately declaring its source.
• Referring to or citing random terms, words, sentences, data or information from a source without specifying the source or without stating the source adequately and completely.
• Use the source of ideas, opinions, views, or theories without adequately and completely stating or including the source.
• Formulate with words or with your own sentences from sources of words, sentences, ideas, opinions, views, or theories without adequately and adequately outlining the source.
• Submit a scientific paper produced or published by the other party as a scientific work without including the source adequately and completely.
According to Fasli Jalal (2010), the factors causing Indonesian society began to be infected by instant culture, a habit that wants everything to be obtained quickly, although to obtain it must violate ethics, norms and applicable law. This instant culture has infected almost all walks of life ranging from ordinary people to high officials. Coverage of this instant culture ranging from food to the Publishing of fake diploma, cheating homework to trace the final task as a student thesis. This not only affects people's lifestyles but also has a negative impact on the progress of the Indonesian nation. According to Suganda (2005), there are several factors that cause plagiarism still occur among students are (1) Lack of knowledge about the rules of writing scientific papers, (2) The misuse of technological advances has introduced the internet to students. Ease-amenity in accessing this internet is not infrequently abused by students. Students do copy - paste without mentioning the source copy of the reference, (3) Lazy. Lazy nature is a human nature, not least for students. Students become saturated and lazy because it is always faced with the tasks that accumulate. Tasks from various courses often have deadlines that are almost simultaneous. This, of course, makes the student less than optimal to

298
do his job. Not infrequently, students also do the task with a shortcut. Distract from time constraints, students do copy paste from friend's work or internet browsing result, (4) Wants good value. Most students would want a good grade so that various ways are done to get that goal. Sometimes students do plagiarism because it only prioritizes good value without thinking of its impact. (5) Sanctions have not been enforced explicitly. Protection of patent from a scientific work is still small. Law enforcement of the plagiarism of a scientific work is still weak. Even if there are often exposed to punishment is a student who is caught doing plagiarism. While the person who offers the preparation of thesis and thesis is still often separated from the legal snares. Another factor that affects the action of plagiarism is perception. The word perception is derived from the English word perception. The word perception is translated into Indonesian as a view, a feeling, a power of sight/knowledge, knowledge, awareness, and observation. Rachmat (2005) says that perception is the experience of objects, events, or relationships obtained by inferring information and interpreting messages. Giving meaning to sensory stimuli. Meanwhile, Kinichi and Kreitner in Kustiwi (2014) define perception as the cognitive process experienced by everyone in understanding information about their environment, either through sight, hearing, appreciation, feeling and smell (Simbolon, 2008). Robbins in (Siauman, 2005) quoted by Kustiwi (2014) states that perception is a process by which individuals organize and interpret their sense impressions to give meaning to their environment. Meanwhile, according to Morgan perception is defined as an individual way of looking at the outside world and refers to individual experience (Siauman, 2005). Research on plagiarism among students has been done, such as the study of Puspita Mahesti Ririh (2010) entitled "The Behavior of Internet Plagiarism (Study of Typology of Internet Plagiarism Behavior among Students of Faculty of Social and Political Science of University of Airlangga)" to 100 respondents stated that 94% Do a copy and paste from the internet without including the name of the author and the source of his writing. Yohana Inga Wfy (2010) conducted a research entitled "Plagiarism Behavior in Executives and Non-Exact Students (Descriptive Study of Student Perceptions and Attitudes of FST and staff Faculty of Social and Political Science to plagiarism behavior in University of Airlangga)", mention that the exact student is higher FST doing plagiarism Than the non-exact student of Faculty of Social and Political Science. The pattern of plagiarism action performed by both groups is the same at the time of setting individual tasks. The student's stimulus to do plagiarism is a classmate because some students are not caught while doing plagiarism, then the action of plagiarism was imitated by other students. The attitudes of the teaching staff both among the exact and non-diverse students are cognitively or tend to prohibit or behave normally or simply because they assume that the student's plagiarism is a natural thing. The result of Hadi's research (2008) found that the cause of Faculty of Social and Political Science of Malang Muhammadiyah University students completed the academic task by plagiarism, that is the lack of knowledge in making the correct writing, the students become lazy to think, the influence of the campus or living environment, and want to get good grades. The result of Hadi's research was supported by Zahur (2012) who stated that the plagiarism among students in blindly lecturing the faculty of Tarbiyah of State Islamic Religion Institute of Imam Bonjol Padang, triggered by the development of information technology and the intensity of lecture tasks while the available time allocation is very limited. Meanwhile, Pickering (2006), revealed that the reason students do plagiarism, among others, the pressure to get higher grades, lack of time to learn, lazy, error instruction, and often make delays in doing academic tasks. Based on some of the results of this research, it is clear that the research practice of plagiarism among students is still focused on the students face to face, while the students of PTJJ as far as the researcher knowledge is still rare or even never done especially in Indonesia. Therefore, this research is considered urgent to be used to find solutions and prevention of plagiarism practices. This article was written based on research results aimed at describing Open University students' perceptions of plagiarism, the factors behind the student's plagiarism and the forms of plagiarism among Open University students in creating online tutorial tasks. This study used a qualitative approach by asking students to fill out a questionnaire that was uploaded on online tutorial application of Indonesian

299
Language. Data analysis was done by using qualitative and quantitative data analysis. Qualitative data analysis is used to describe the data obtained from the interview results limited to some students, while quantitative analysis used to describe the data obtained from the questionnaire distributed to students. 2 RESULTS AND DISCUSSION
2.1 Student Perception about Plagiarism The results show that the majority of UT students have known the term plagiarism. The main sources of information about plagiarism were obtained from the Open University website of 10 respondents (43.48%), The Last Semester Examination 5 (21.74%), internet 3 (13.04%), UT catalog and News Paper of 2 people each (8.70%), and 1 person (4.34%) earned from friends. More can be seen in Figure 1.
Figure 1. Source of Information About Plagiarism
This suggests that information about plagiarism is well known, but unfortunately, it is still a prohibition to avoid cheating on a friend during the exam, without further explanation of why it is not allowed to do so and how to avoid plagiarism. Thus, the plagiarism they understand is only a prohibition for not cheating a friend during the exam. The results of this study indicate that the majority of respondents define the plagiarism act is to trump the work of friends during the exam as much as 15 people (65.22%), and collect the work of friends by changing the name and Student ID Number as personal duties, as many as 8 people (34.78%). It seems that Open University students understand plagiarism to the extent of technical level, that is in the form of cheating the duties of friends. If a student only knows the definition of plagiarism in such a form, the student is indicated to have an opportunity to perform plagiarism. This is in accordance with the argumentation of Belinda (in Soelistyo, 2011) which states that one of the causal factors that are suspected to be the trigger for the increasing number of pluralism cases in Indonesian students is the wrong perception of the students. 2.2 The Social Practice of Plagiarism In Working on the Online Tutorial
The results of this study indicate that students have participated in doing online tutorial tasks, but in practice they experience various difficulties, such as study time clashing with hours of work, not understanding the intent of the question and the lack of time given to do the task. Therefore, students
0
5
10
15
20
25
30
35
40
45
50
Open University
Website
Final Exam Internet Catalog of Open
University
News Paper
value
value

300
argue plagiarism because of forced, pressed time and not possible to do online tutorial task , and the demands of online tutorial tasks are too heavy and burdening students, therefore students take shortcuts by copying paste online tutorial tasks from the internet. Students are reasoned to do the instant way because it is more efficient time, quick to finish and easy, and copy or imitate the duties of friends because it is easier to do, practical, and quic9kly completed. Behind the decision to do plagiarism in doing online tutorial work, there must be a reason for encouraging them to do so. The results of this study indicate there are some things that cause Open University students to practice plagiarism: Limited time (43.48%), confident that the tasks collected are not read by the tutor (30.43%), want to complete the task on time (17.39%), and want to get good score (8.70%).
Figure 2. Factors Cause of student Doing Plagiarism
From several factors, it can be concluded two factors causing the behavior of plagiarism among Open University students, namely; (1) the development of information technology such as the internet that makes it easier for the students to get the materials to do the online tutorial task from those sources. Backed up with ease and speed of access, as well as search and copying facilities, (2) the high burden of tasks assigned, while the time available is not enough to do online tutorial tasks. There is also a habit of delaying the collection of tasks so that they are trapped in the habit of learning SKS system (Sistem Kebut Semalam/system racing overnight) in doing online tutorial tasks so that when time is pressed, then encourage students to find a shortcut by finding information or material of tasks from the internet, without specifying The source. The findings of this data support the results of Haris's (2009) study which found that students who have poor time and planning management and are accustomed to delaying the delivery of duties so that they are tempted to copy and paste when the time is insufficient. In addition, factors that also affect students do plagiarism is the tutor rarely check the task online tutorial. Students are of the view that an act of copying paste tasks from the internet or taking the duties of friends as a legitimate act, and it has become natural. Based on their experience there is no strict sanction from the tutor when collecting the tasks quoted from the internet, just a warning not to do such a thing again. Soelistyo (2011) in his book explains, one of the factors causing students to do plagiarism that is because the weak academic ethics that occurs in the campus environment, implementation or application of student ethics guidance within the academic environment is softer than the law. In addition, the ethical norms of students also do not put forward sanctions as hard as the rule of law. Sanctions against violations of ethics are nothing more than blemish and criticism only. Therefore sanctions given to students who have done plagiarism has not been able to cause a deterrent effect so that students only consider plagiarism as an act that is commonly done and it becomes a custom or culture that is reasonably done by students.
0
5
10
15
20
25
30
35
40
45
50
Want To Get Good
Value
Want To Complete
the task on time
confident that the
tasks collected are
not read by the tutor
Limited Time
Value
Value

301
2.3 Forms of Plagiarism in Working on Online Tutori al Tasks
The forms of plagiarism done by Open University students can be known from the way the student completes the online tutorial task when the task collection deadline is imminent. Based on the results of the research using questionnaires it can be seen that the forms of plagiarism done by Open University students is by copy paste from the internet and by copying their college duties. This is in accordance with the results of research (Ririh, 2010) which suggests the forms of plagiarism that occurs among students that are by the way students imitate the task of friends and find some posts on the internet in accordance with the topic of the task and then the writings are directly in copy paste into the task.
The results showed that there are 3 forms of plagiarism that might have been done by Open University students when doing the online tutorial task, that is; First, download papers or articles from the internet, then collected as the work itself. From the table, it can be seen that as many as 20 respondents (86.96%) stated never download free papers or articles from the internet then collected as his own to complete online tutorial tasks. Only as many as 3 respondents (13.04%) said rarely do so. Second, copy and paste material from the internet without mentioning the source and then assembled as an online tutorial task. A total of 13 respondents (56.52%) stated that they rarely did it, and they stated that they had never done only 2 (8.70%). However, as many as 3 respondents (13.04%) stated very often do that, and that states often do as many as 5 people (21.74%).
Third, rename, student ID Number and a few words from an original source, then sent as an online tutorial task. This form of plagiarism with Thief, as many as 20 people (86.96%) never did, and there are 3 respondents (13.04%) who claimed to have done it. This indicates that the forms of plagiarism conducted by respondents are mostly unintentional forms of plagiarism, that is, the practice of plagiarism which is done because of the ignorance of the respondents that the practice is included in the form of plagiarism.
3 CONCLUSION
Based on the results of research analysis and discussion, the author can draw some conclusions, among others: 1. In general, Open University students' perceptions of plagiarism are still limited to the technical level, is in the form of cheating on the exam. Students claimed to have done the task online tutorial by quoting the task material from the internet without mentioning the source, which are as many as 15 people (78.36%) of 23 respondents. Such action is classified as unintentional plagiarism because of ignorance in how to use documentation or information available on the internet. 2. The results of this study also conclude that there are some things that cause Open University students to practice plagiarism, in the meantime; Limited time (43.48%), confident that the tasks collected are not read by the tutor (30.43%), want to complete the task on time (17.39%), and want to get good score (8.70%). From several factors, it can be concluded two factors causing the behavior of plagiarism among Open University students, namely; (1) the development of information technology such as the internet that makes it easier for the students to get the materials to do the onlin tutorial task from those sources. Backed up with ease and speed of access, as well as search and copying facilities, (2) the high burden of tasks assigned, while the time available is not enough to do online tutorial tasks. There was also a habit of delaying the collection of tasks so that they were trapped in the habit of learning SKS system (Sistem Kebut Semalam/System Rice Overnight). This encourages students to search for shortcuts by searching for information or task metrics from the internet, without listing the source. 3. Plagiarism forms performed by respondents in completing online tutorial tasks can be divided into three. The three forms of plagiarism are (1) taking the writings of others who are acknowledged as works of their own, (2) taking ideas or torso of the minds of others to be subsequently transformed into their own language, and (3) retrieving the text as a whole without altering the text or adding With any analysis or comment. This shows that the forms of plagiarism by the respondents are mostly

302
unintentional forms of plagiarism, that is, the practice of plagiarism which is done because of the ignorance of the respondents that the practice is included in the form of plagiarism. Suggestion Based on the results of research and conclusions, the authors provide suggestions, among others: 1. The provision of a course of writing scientific papers is offered at the very first time a student enters in Open University and as part of the learning process. The course offerings at the beginning of the course are expected to shape students' understanding right from the start, so there will be no case of Open University students unaware of plagiarism and they know how to avoid plagiarism practices. 2. It is hoped that the results of this study can give an idea of plagiarism practices conducted by Open University students, so that tutors or teachers together can provide a deterrent effect for students who do plagiarism, and jointly also take preventive measures to minimize plagiarism in Open University, For example, the tutors provide concrete sanctions in the form of not giving value to students who are proven to do plagiarism in doing online tutorial tasks. 3. The results of this study are expected to be useful and additional information for subsequent researchers related to the practice of plagiarism in doing online tutorial tasks through experimental methodology in order to know exactly the forms of plagiarism practices conducted by Open University students associated with the practice of plagiarism in doing online tutorial tasks Through an experimental methodology to know exactly the forms of plagiarism practices undertaken to serve as a basic ingredient in prevention of plagiarism among Open University students.
REFERENCES
Budiyawati. Y, Susanti., & Frans, Y.A. ( 2006). Pengaruh pengelolaan tuton dan faktor internal mahasiswa terhadap partisipasi mahasiswa dalam tuton. Jakarta: Pusat penelitian kelembagaan, Lembaga Penelitian, Universitas Terbuka.
Hadi, Hudi, Hutomo. (2009). Budaya Plagiarisme diKalangan Mahasiswa (Studi Kasus Pada BudayaPlagiarisme Penyelesaian Tugas Akademik di Kalangan Mahasiswa FISIP UMM). Skripsi. Malang.Jurusan Ilmu Kesejahteraan Sosial. FISIP. UniversitasMuhammadiyah Malang.Iskandar. 2009.
Harris, Robert. 2009. Anti-Plagiarism Strategies for Research Papers. Diakses dari http://www.virtualsalt.com/antiplag.htm, tanggal 15 November 2015.
Kementerian Pendidikan Nasional. (2010), Peraturan Pemerintah Pendidikan Nasional no. 17 tahun 2010 tentang Pencegahan dan Penanggulangan Plagiat di Perguruan Tinggi, diakses pada tanggal 12 Pebruari 2015, dari: http://luk.tsipil.ugm.ac.id/atur/Permen17-2010.pdf
Miles, Matthew B. dan A. Michael Huberman, (1992). Analisis Data Kualitatif, Buku Sumber Tentang Metode-Metode Baru. Terjemahan dari Analyzing Qualitative Data : A Source Book for New Methods. UI Press, Jakarta.
Noviyanti, M. (2006). Kesiapan Tutor UT dalam Mengelola Tutorial Online, Jakarta: Pusat penelitian kelembagaan, Lembaga Penelitian, Universitas Terbuka.
Ririh, Puspita Mahesti. (2010). Perilaku Plagiarisme Internet – Studi tentang Tipologi Perilaku Plagiarisme Internet di Kalangan Mahasiswa S1 FISIP UNAIR. Skripsi Universitas Airlangga, Surabaya.
Suganda, Tarkus, (2005). Memahami Hakikat Dari Pemberian Tugas Terstruktur Perkuliahan,http://blogs.unpad.ac.id/tarkussuganda/files/2012/08/MEMAHAMI-HAKIKAT-DARI-PEMBERIAN-TUGAS-TERSTRUKTUR-PERKULIAHAN.pdf, diakses 13 Pebruari 2015.
Universitas Terbuka (2008) Panduan Tutorial Online, Diambil tanggal 27 Januari 2015 dari http://student.ut.ac.id/.

303
Wardani, IGAK (2000). Program tutorial dalam sistem pendidikan tinggi terbuka dan jarak jauh. Jurnal Pendidikan Tinggi Jarak Jauh, 1 (2), 41 – 52.
Wfy, Yohana Inga. (2010). Perilaku Plagiat di Kalangan Mahasiswa Eksak dan Non Eksak – Studi Deskriptif Persepsi Mahasiswa dan Sikap Staf Pengajar FST Dan FISIP Terhadap Perilaku Plagiat Di UNAIR. Skripsi Universitas Airlangga, Surabaya.
Zalnur, Muhammad. (2012). Plagiarisme di Kalangan Mahasiswa dalam Membuat Tugas-Tugas Perkuliahan Pada Fakultas Tarbiyah IAIN Imam Bonjol, Jurnal Al-Ta’lim, Jilid 1, Nomor 1 Februari 2012, hlm. 55-65.

304
STUDENT PERSISTENCE IN OPEN AND DISTANCE LEARNING: A CASE IN HONG KONG
Oliver Au, K C Li, Billy Wong
The Open University of Hong Kong
Abstract
There has been an abundant amount of work done on student persistence for open and distance learning (ODL). Technology updates, such as the proliferation of powerful smart phones, introduce new factors for us to consider. We interview strong, mid-pack and weak students in separate focus groups. They were asked about their motivation, success factors and challenges. Though our findings are in line with the literature, we have surprises too. Mid-pack students believed that word-by-word rote memorization was their best strategy to prepare for examinations. Weak students believed that they needed to master multi-tasking to learn well in tight schedules. All weak student participants thought of quitting at some point while no strong students had considered quitting. To improve student persistence, we focus on meeting the needs of weak students. After deliberation, we recommend the followings. Add time management and study skills component to existing courses for students to practice. Appoint advisors to DL students to help them create an appropriate study plan and acquire a sense of belonging. Make learning videos short and engaging. Consider adopting student leaders or peer tutors in DL that have been used successfully in full-time study. Conduct focus group with students just like what we did for the preparation of this paper.
Keywords: Student persistence, retention, attrition, open learning, distance learning.
1 INTRODUCTION
The landscape of distance learning (DL) is increasingly competitive. When the Open Learning Institute (OLI) of Hong Kong opened its door in 1989, there were fewer tertiary institutions in Hong Kong. They focused on full-time study programmes. It is fair to say that OLI was the only established education provider focusing on DL. OLI gained the university status in 1997 to become the Open University of Hong Kong (OUHK). Over the years, conventional tertiary institutions have been entering the part-time study market to compete with OUHK. OUHK started to offer full-time study programmes shortly after the turn of the century. At the time of writing, we have roughly the same number of full-time and part-time students. As the city’s population continues to age, the number of prospective students is reducing in the midst of more education providers today than say ten years ago. We have practical reasons and moral obligation to make sure that our DL students are successful.
Every student that drops out implies a reduction in the institution’s income. Failed students would have spent time and money to no avail. We don’t want to see it happening. In this study, we aim at exploring ways to improve student persistence in our DL courses.
Section 2 has a literature review covering student persistence models, dropout factors, persistence strategies used by students and retention strategies used by institutions. Section 3 describes our focus group methodology. Section 4 discusses the result. Section 5 explains actions that we think are worth considering.
2 LITERATURE REVIEW
2.1 Models of Student Persistence
2.1.1 Student Integration Model by Tinto
Tinto found that students' personal characteristics (age, gender, attributes and etc) and prior experiences (secondary school) influence their academic integration and social integration. Academic integration refers to students' academic performance and intellectual development while social integration refers to students' interactions with faculty members and peers [1]. With both integrations

305
successful, students will be more likely to persist and achieve their graduation goal [2] [3]. But Tinto’s work was completed with full-time students and may not be adequate to explain the attrition of DL students. Tinto’s model spawned the development of additional models by other researchers.
2.1.2 Student Attrition Model by Bean and Metzner
Bean and Metzner build a model for mature students, commuter students and part-time students on top of Tinto's and other psychological models [4]. They argue that older students have less interactions with each other. They usually seek support from family and friends. The model is built with four groups of variables:
• academic variables like learning habits, advising and programme fit, • background variables such as age, goals and prior academic performance, • environmental variables including financial situation, employment and family responsibilities
and • academic outcomes GPA and psychological outcomes (stress, satisfaction, goal and
institutional commitments).
2.1.3 Composite Persistence Model by Rovai
Rovai creates a composite persistence model [2] using the models of Tinto, Metzner and Bean's and research results on student skills [5] [6], distance learners’ needs [7], and matching teaching and learning styles [8]. The composite model focuses on student persistence in distance education. Factors are categorized as: student characteristics, student skills, external and internal factors affecting students after admission. The student skills category includes computing skills, information literacy and time management. The internal factors category contains consistency and clarity of online programmes, policies, procedures, e-learning systems, students' self-esteem in the mastery of e-learning tools, measurable learning objectives, sense of identification with the institution, interpersonal relationships (with peers, faculty and staff), accessibility of support services (libraries and advisors) and matching of learning and teaching styles (directive teaching style with self-directed students).
2.2 Factors of student retention and dropout
Recent studies on student persistence and attrition in ODL found that facilitating factors and challenges experienced by students can be personal, motivational and institutional.
2.2.1 Individual student factors
Personal factors : Having realistic expectations at the beginning of a study programme on the amount of work required is a student success factor [9]. Those students tend to take responsibility of their own learning and are committed to their study. They consciously choose suitable learning strategies and work hard with effective time management.
Students with unrealistic expectation lose interests on their study in face of higher-than-expected workload. In Grebennikov and Shah's 5-year survey, "course was not what students had expected" had been ranked very high as a dropout factor in the first year of study [10]. Lacking adequate preparation and dedication makes students regard their study as challenging [9].
The amount of time and effort expended in a study programme is influential in a student’s persistence [11, pp. 33]. Studying is an investment. The more time students have invested, the less likely they will withdraw [12].
In Sweet's study, most distance learners drop a course due to a lack of time to adequately study the course materials [3]. In a study of attrition factors for ODL, 62.8% of respondents were unprepared for the examination, among which "not enough time to study" was the major reason [13, pp. 79]. Work responsibilities were cited as a hindrance. According to Tladi, students being employed and having family responsibilities have worse attrition and less commitment to study independently. They made little use of available support even when they need it.
In online nurse practitioner study programmes, Knestrick et al. identified the age of students being over 40 as a predictor of attrition [14]. They explained that students who were older than 40 had more family responsibilities and been away from formal education for longer.

306
Motivational/psychological factors : Motivation is important for persistence. Over two-thirds of participants from an online programme cited "sense of accomplishment", "mastery of specific skills", "perceived utility of learning" and "meeting career goals" as important reasons for them to complete the study [11, pp. 33]. Other factors of personal goals, a sense of community, and family support were also influential psychological motivators which boosted students' persistence.
Lacking motivators may lead to dropout. In a study of engagement, Kahu et al. found that mature distance students who had considered leaving were unsatisfied with their university experience [15]. In a study of student nurses, ten Hoeve et al. found that problems in achieving learning goals and working in a team, and uncertainty about one’s knowledge and abilities [16] caused attrition. Perseverance and the drive to become a nurse are keys to persistence for some.
2.2.2 Institutional factors
Quality of programme : It was found that a well-organized study programme and the competence of teaching staff improve student persistence [11] [16, pp. 31]. Dissatisfaction with a training programme is often associated with low quality of the programme and its teaching staff [16].
Content of programme : The relevancy of the programme in meeting personal and professional needs and perceived amount of learning influence student persistence in online programmes [11].
Why did some students with enough time to study choose not to do so? Tladi found that the main reason was demotivation by high workload and difficulties in understanding the study materials [13]. Students who considered quitting expressed negative experiences about the course regarding difficult contents or poor class organization [16].
Institutional support : Raciti suggests that efforts to build strong relationships between students and lecturers/tutors encourage student persistence [17]. Institutional support was found to be helpful to students [11]. One participant expressed gratitude toward faculty and staff, "The first person I talked to was [Mr. J]. [Mr. J] was so enthusiastic. He answered my questions and was very encouraging that it was a great programme. Throughout my two years he has been my advisor ... any time I had a question or wasn't sure which class to focus on during my electives I would call [Mr. J]" [11, pp. 32].
All student participants who considered quitting were negative about the support from the teaching staff [16]. Authors concur on the importance of quality support from teaching staff and counselling services especially for online study.
2.3 Persistence strategies by students
2.3.1 Expect hard work
Students having a smooth transition from high school to university started with the expectations that universities would be hard work and very different from schools. They focused on their goals and were fully aware of their own responsibility in learning. When asked about how to overcome challenges, a student responded that he/she stayed focused and worked hard all the time [9, pp. 416].
2.3.2 Manage time
Yang et al. identified time management skills as an important factor for student persistence in online programmes [11]. Effective time management is more important for part-time students who have coursework, job and family responsibilities to balance.
Successful students are well-organized and adopt effective time management strategies [9]. One participant reflected, "With all the assignments, tutorials and tests that had to be done, effective time management was going to be of utmost importance. I would then record all test dates and due dates as soon as they were made available to me and then try and allocate time that I estimated to be efficient for each task at hand. I also tried my best to study before the time for a test and not leave things for the last minute as I found that it only creates more anxiety and stress" [9, pp. 417].
2.3.3 Build constructive social support
Distance learners do not meet their tutors, lecturers and classmates regularly. Faculty and support staff will have trouble identifying students who are at risk of feeling isolated [12]. The sense of isolation increases the risk of dropout. Kahu et al. believe that friendship is particularly important for mature distance learners who struggled to fit in the university culture [15].

307
Make right friends : In McGhie's study, all the successful students emphasized the importance of making "right friends", i.e. those who support, encourage or assist them academically. They chose friends who are determined to succeed [9]. They worked together and supported each other. A student shared, "Surround yourself with positive peers or better yet help encourage and motivate others to join you in reaching a goal. Knowing you can help & support each other, makes learning less stressful and fun" [9, pp. 417].
Seek help from lecturers : Successful students in McGhie's study sought help from teaching staff as well as from peers. They reported that they were not afraid to ask questions. A participant explained, "not be afraid to ask for help, nobody expects you to always be good at everything". Another student remarked, "I asked questions when something was not clear and I went for consultation and I received clarification on work covered" [9, pp. 418].
Gaining encouragement from family : Encouragement and support of family members are important motivation. They help students to stay focused and work hard [9] [16].
2.4 Retention strategies by institutions
2.4.1 Course design
Link study to student work : Yang et al. recommend linking coursework to students’ professional work so that students can apply what they have learned [11].
Design course flexibly : Park et al. suggest course designers to offer choices in learning activities and assignments to accommodate students with different learning styles [12]. This calls for an assessment of students' learning style preferences at the beginning of the course. To improve student retention, an Australian university introduced flexible timetabling as well as course design and delivery to suit the schedule of working students [10].
Encourage collaborative work by students : Park et al. suggest institutions to cultivate social interaction among online classmates to reduce attrition [12]. Kahu et al. also see a need for distance learners to work with peers on collaborative tasks [15]. Connections with peers neutralize the sense of isolation often experienced by distance learners.
2.4.2 Institutional support
Make support services accessible : If a mentor has been assigned to each student to provide support in times of crisis, attrition would be reduced [12]. Under its retention project, an Australian university extended the operation of facilities, services and consultation outside normal hours. Colleges of this university supply part-time students with information on available financial aids, scholarships, emergency funds, costs of books and internet access [10].
Build relationships with students : A learning community connects students to each other, to the institution and to the resources that they need [2, pp. 13]. A strong relationship with teaching staff helps students to make the decision to stay [17]. Yang et al. recommend the creation of support networks to help solve students' personal or professional problems [11]. Rapport between students and staff should be established at the very beginning [12].
Contact students proactively : Park et al. suggest that faculty and support staff should take initiative to contact students [12]. They can send messages to students regularly and ask if they are encountering problems. Support staff taking the initiative to contact students is important because students in trouble may not seek help.
2.4.3 Looking after returning students
Counselling and guidance should be provided to returning students to improve retention [12]. The services should help students to assess available resources, set realistic expectations for their performance, maintain study-life balance and reflect more on initial intention to withdraw.
3 METHODOLOGY – FOCUS GROUP
We have chosen to use focus group interview over questionnaire survey because it allows us to elicit in-depth information with open-ended questions. Interaction among participants and with the course coordinator (CC) gives us insights that are difficult to obtain from questionnaires.

308
The study was conducted after the final examination has been marked so that we know the performance of each student. The student grades had not been announced so students expressed their views without knowledge of their final grades.
We invited all students from two high-level computing courses in software engineering and distributed systems for which the first author was the CC. The CC’s role is not to give lectures but to set assignment and examination questions. He or she prepares marking schemes and monitors the quality of the marking performed by tutors. The CC also makes small updates annually to the distance learning materials as needed.
Students were invited to one of three focus groups according to their final course scores. Grouping students of similar performance together should facilitate their interaction. The passing score is 40. For our study, we respectively classified student scores in ranges of 71 and higher, 57 to 70 inclusive and 56 and below as strong, mid-pack and weak. After discounting 4 students enrolled in both courses, we have invited 135 students. We have 10 strong students, 10 mid-pack students and 8 weak students accepted the invitation. One student in each group did not show up apparently due to the need to work overtime which is very common in Hong Kong especially for IT professionals. The focus group interview went from 7:30 to 9:00 pm on a weekday evening.
Each student received HK$400 for travelling expenses. This amount is neither too high to attract students not really interested in contributing nor too low to deter them fitting the group interview into their schedules. Students were asked about their overall education experience at OUHK not limited to the course they were finishing with the first author.
4 RESULTS We report below the parts of group discussion concerning motivation, success factors and challenges. We skim the comments made by students that have weak correlation with student persistence, for example the usability of our registration systems. The rationale is that students are unlikely to quit their study for a poorly designed user interface of the registration system.
4.1 Motivation
Getting a degree in computing was the most common motivation for students. Three out of nine strong students were also motivated by practical use of what he has learned. None of the strong students had considered quitting.
Three out of nine mid-pack students needed a push from their bosses or colleagues to start their degree study. Mid-pack students seemed to have a rougher career path or study path than strong students. Some mid-pack students had considered quitting.
Weak students complained that the study materials and assignments were boring. They were not motivated by fun in their study anyway. Perhaps it is due to weak students being in survival mode all the time. Having fun in study became a luxury. Most weak students thought of quitting at some point in time.
4.2 Success Factors
Success factors are different according to student performance. Strong students named success factors that are in their full control. But mid-pack and weak students named numerous success factors that are beyond their control. Strong students are clearly more effective problem solvers by focusing on the things they can change.
4.2.1 Success Factors of Strong Students
Time management : Strong students identified time management as the most important success factor. They start early and allocate more time to study the challenging topics. They made efficient use of their time and would study while riding on a train. This spread their study effort relatively even throughout the study term.
Study skills : Strong students may jot notes when reading or attending classes. One participant even drew mind maps to relate concepts. They were good at using search engines and could learn independently.

309
Observing advices : In DL, prerequisites are often advisory rather than enforced. Strong students observed the advisory prerequisites by taking courses in a progressive order. They also considered the course contents before enrolling.
Assigning purposes to activities : Strong students assigned purposes to learning activities. They expected to learn by completing assignments. They will try to complete all 4 assignments in the course even only the best 3 scores will be used to calculate the final score. (Weak students only regarded assignments as a means to pass the course. Some weak students would identify the most challenging assignment to skip. They are happy because their final score will not be affected.)
4.2.2 Success Factors of Mid-Pack Students
Memorization : Mid-pack students considered memorization to be the most important success factor.
Class attendance : Once every two weeks, there is an optional tutorial class to attend. Even classes are recorded, mid-pack students worried about technical or organizational mishaps resulting in undiscernible voice or class not recorded.
Examination tips : Mid-pack students found it important to have examination study guide and/or specimen examination paper from the CC. Mid-pack students were delighted to see a student sharing a past examination question on the WhatsApp chat group. Mid-pack students are exam-oriented.
Examination schedule : Mid-pack students wanted the examination dates to spread out more so that they have adequate time to study between two examinations.
4.2.3 Success Factors of Weak Students
Adequate time : Weak students thought that having adequate time was important. Their solution to heavy workload is hoping to do less. This is different from strong students’ approach to manage time efficiently to accomplish more.
Good health : Weak students acknowledged the importance of good health without saying whether good health is a result of certain life style or good genetics.
Good luck : Weak students wanted to have good luck in choosing topics to study for examination.
Memorization : Weak students named rote memorization as useful. But they also said that they would forget everything after the examination.
Choosing easy assignments : There are 4 assignments in a course but only best 3 scores are used to calculate the final score. Weak students preferred to take shortcut by skipping the most difficult assignment.
Ability to multitask : Weak students thought that multitasking allowed them to learn more in a short time. (Research proves that multitasking is bad for learning [19].)
4.3 Challenges
4.3.1 Common challenges
Some challenges were only identified by a certain focus group. We still show them as common challenges if they affect other focus groups. The weak students tend to name less challenges than the other two groups of students.
Too much to learn : An OUHK DL course typically covers more contents than an equivalent face-to-face (F2F) course at OUHK or other institutions. This is the result of how we develop DL courses at OUHK. There will be the course author and field experts on the course development team. Each member identifies topics that they considered important. Members rarely object to the inclusion of another person’s favourite topics. The resulting course materials will hold all members’ favourite topics thus are heavier than a normal F2F course.
Limited sharing by tutors : A course may have multiple tutorial groups led by different tutors. The tutor of one tutorial group may not share the power point slides with students in another tutorial group. Students found it beneficial to have access to all the slides used by all tutors for the same course. The CC should convince tutors to share their slides freely.

310
Unfriendly registration systems : The registration system does not prevent students to enrol courses not fitting the students’ intended major, courses with time conflict or courses that cannot be counted together due to overlapped contents. Students need to tediously watch out on their own. The checking should have been done easily by a computer system.
Late release of model answers : Not all CCs post model answers to assignments for students to learn. Some CCs posted too late.
Expensive tuition : Few employers subsidize tuition of their employees. When they do, they only pay a small portion. DL students considered the tuition fee an important factor. They chose OUHK because we are the price leader in DL. A student cited that an OUHK course costed $10,000 when a competitor charged $17,000.
4.3.2 Challenges to Strong Students
Not enough comments on marked assignments : Strong students would like to see more comments by the tutor who marked their assignments.
Examination not long enough : The examination lasts for 3 hours for the 10-credit year course. While 3 hours may appear long, this is for a full year course. Strong students wanted to have more time in the exam so they had more time to think deeply and to write more. Mid-pack and weak students did not complain perhaps because they didn’t have as much to write in the answer.
Overlapped contents among courses : The overlapped contents may be necessary because students could take courses in different orders. The repeating contents may be needed by multiple courses. Strong students were interested in learning new things so they complained a little about seeing overlapping in two different courses.
Contents not up-to-date : Strong students complained some course materials are old technologies. They were motivated to learn the latest technology while mid-pack and weak students focused more on passing the course.
Assignment questions not posted at the beginning : Not posting all assignment questions at the course beginning prevents strong students from planning their time or starting ahead. In worst scenarios, CCs posted assignment questions with less than one month from the due date.
Learning outcomes unclear at the chapter level : Learning outcomes are generally clear at the course level but not at the chapter level. Strong students want the learning outcomes to be clear even at the chapter level for them to better focus their effort.
Video not organized in small chunks : The 2-hour tutorial is recorded as one big chunk. Suppose a student had listened for half an hour and stopped. To resume the next day, he or she needs to download from the beginning again and painstakingly advance to where he stopped last. The video feature of our online learning environment is not user friendly.
4.3.3 Challenges to Mid-Pack Students
Bad tutors and course coordinators : Roughly 90% of our tutors are nice according to our mid-pack students. The other 10% are bad and bother our mid-pack students. Some CCs were irresponsive and would not answer email or questions on the forum.
Bad study tips : Mid-pack students were told by some tutors that in the marking of assignments or exam papers, markers looked for specific keywords otherwise no marks would be given. We were surprised by this kind of study tips and that some students actually believed them. Those tutors conveyed the wrong message to students that it is possible or common for questions to have a single correct answer. No wonder students memorize by rote.
Demanding examination schedule : Some mid-pack students complained about having the last class just one day before an examination. The class and the examination next day might not belong to the same course. This complaint reveals that our classroom usage is very tight and students rely heavily on cram-study right before the examination.
4.3.4 Challenges to Weak Students
Uninformed course selection : Some weak students acknowledged that they were unaware of course prerequisites. Other weak students would ignore them. They had little idea in the amount of work required to complete a course.

311
Lack of interests in course contents : Weak students were motivated by the improved job prospect of having a relevant degree. None of them took courses for interests. On the other hand, they still complained that theories and assignments were boring.
Weak aptitude : Weak students were poor in mathematics and programming.
Not having time to study : Weak students only attended one-fifth of the classes in person and viewed two-fifths of the recorded videos.
Lack of motivation : The final score is calculated from 30% of assignment scores and 70% of examination scores. Weak students lost interests in completing the assignments due to the low weight of 30%. They found course contents uninteresting and unrelated to their jobs.
Challenging course contents : Weak students found the course contents to be too tough. Over half of the weak students had considered quitting.
5 RECOMMENDATIONS
5.1 Train Students on Time Management and Study Ski lls
Strong students manage their time well. All students should be equipped with effective time management to improve retention. Time management is more than knowledge. A routine behaviour is formed after it has been repeatedly preceded by a cue and followed by a reward [20]. Attending a lecture or writing an examination alone cannot change a habit. We can incorporate time management practices in multiple courses throughout the study programme for students to reinforce effective time management.
Weak students have poor study skills. They rely too much on cram study and rote memorization just before the examination [21]. They forget most everything after the examination. Weak students even have the misconception that multi-tasking helps them learn more under time constraints. They need to learn and practice good study skills alongside with time management.
5.2 Appoint an Advisor to Each DL Student
Strong students consider advisory prerequisites carefully before taking a course. They make sure that they take courses in an appropriate order. Weak students tend to ignore this step even the information is available to them.
Students entering our study programme with advanced standing only need to have two-thirds of content match to be exempted from a course. This will increase the challenge if the content match is on the low side.
Students may not know that a 10-credit course at our institution is supposed to require around 300 study hours. If they come with a weak background or want to aim for a high final grade, they need to study more.
Two alternatives come to mind. First, we can provide students with an online self-diagnostic test before they enrol a course. The test score can predict roughly how challenging the course will be to a student. The diagnostic test can have multiple-choice questions graded automatically online.
Second, we can appoint a faculty member to serve as an advisor to the student. The advisor will meet the student face-to-face or talk over the phone. The advisor and his student will go through the student’s background and interests together to make sure that the student is making a right choice. This has the added benefit of putting a human face on the institution. Our recommendation to advise ODL students is consistent with Simpson’s [18]. He thinks that institutions have the moral obligation to inform and counsel ODL students which can improve retention and reduce students’ sense of isolation. Students should be encouraged to explore and think through the advises to come to a decision for themselves. A supportive and empathetic advisor can help to motivate weak students. To save commuting time, an advising session can take place on Skype.
5.3 Improve Learning Videos and OLE Guo et al. listed some suggestions about making learning videos [23]. Short videos under 6 minutes are more engaging. Videos should intersperse the instructor’s talking head with slides. Kahn-style tablet

312
drawing are better than static slides. The videos that our students see are one or two hour long unedited recording of the computer screen and voice during tutorials. The worst part is that if a student did not finish the video, he or she will have to repeat downloading the video from the beginning and advance to the right place. Our OLE currently does not support pre-download for a smooth play regardless of the network speed. Preloading is a standard feature in MOOC apps. We as a DL provider have some catching up to do.
5.4 Facilitate Peer Learning
Sense of community is an important part of online students’ learning experience [22]. But best practices are hard to come by. Our online learning environment (OLE) provides a discussion forum for students to ask questions. But Students prefer to use the WhatsApp chat group that they set up on their own. Perhaps students feel more comfortable communicating with fellow students than with teaching staff.
In our full-time face-to-face programmes, students are recruited and trained as leaders and peer tutors to help others in sports programmes and computer laboratories. Peer learning is a cost-effective means to achieve desired learning outcomes. We would want to find out how to do that in ODL.
Though prior research suggest that group projects may be beneficial to DL students [15], our DL students explicitly asked us not to give them group projects to do. DL students vary greatly in their time commitment. Having a non-committed teammate is very frustrating. DL students already practice teamwork in their full-time job. The benefit of having group work in ODL is less than that in full-time study.
5.5 Conduct Focus Group to Get Student Feedback
Questionnaires are commonly used to get feedback from students. Surveys by mail or email get dismal response rate typically of less than 10%. For our full-time students, we would distribute the questionnaire on paper in the last class to increase the response rate to around 75%. Our participants told us that they had never been invited to a focus group before. They enjoyed the opportunity to communicate their needs to university staff. The presence of CC increases their confidence that some of their feedback will be used to improve the course. Some universities have published guidelines for teaching staff to conduct focus group [24]. We may explore the benefit of conducting focus group throughout the course instead of at the end or combine the peer learning effort with focus group. In this study, we invited students to come after the final examination. We set aside a budget to pay travel expenses to each student. If the focus group was conducted the end of a regular class, we may reduce or eliminate the travel expenses.
5.6 Conclusions
Actions involve costs. But if we don’t take appropriate actions, we may pay the price in the form of attrition. In distance education, it is desirable to achieve economy of scale. Resources invested to reduce attrition should be financially appealing. In addition, education providers have the moral obligation to help students succeed. We hope that DL institutions would invest wisely in the future of their students. The recommendations reflect the view of the authors not the view of OUHK. The decision to take a recommended action still depends on the calculated return of investment (ROI). Not all recommendations suit all DL courses uniformly.
REFERENCES Tinto, V. (1975). Dropout from higher education: a theoretical synthesis of recent research. Review of
Educational Research, 45(1), pp. 89-125.
Rovai, A. P. (2003). In search of higher persistence rates in distance education online programs. Internet and Higher Education, 6, pp. 1-16.
Sweet, R. (1986). Student dropout in distance education: an application of Tinto's model. Distance Education, 7(2), pp. 201-213.
Bean, J., & Metzner, B. (1985). A conceptual model of nontraditional undergraduate student attrition. Review of Educational Research, 55, pp. 485-650.

313
Rowntree, D. (1995). Teaching and learning online. A correspondence education for the 21st century? British Journal of Educational Technology, 26(3), pp. 205-215.
Cole, R. A. (Ed.) (2000). Issues in web-based pedagogy: a critical primer. London: Greenwood Press.
Workman, J. J., & Stenard, R. A. (1996). Student support services for distance learners. DEOSNEWS, 6(3) (Retrieved July 24, 2017, Website: http://learningdesign.psu.edu/assets/uploads/deos/deosnews6_3.pdf).
Grow, G. O. (1991). Teaching learners to be self-directed. Adult Education Quarterly, 41(3), pp. 125-149.
McGhie, V. (2017). Entering university studies: identifying enabling factors for a successful transition from school to university. Higher Education Journal, 73, pp. 407-422.
Grebennikov, L., & Shah, M. (2012). Investigating attrition trends in order to improve student retention. Quality Assurance in Education, 20(3), pp. 223-236.
Yang, D., Baldwin, S., & Snelson, C. (2017). Persistence factors revealed: students' reflections on completing a fully online program. Distance Education, 38(1), pp. 23-36.
Park, C. L., Perry, B., & Edwards, M. (2011). Minimising attrition: strategies for assisting students who are at risk of withdrawal. Innovations in Education and Teaching International, 48(1), pp. 37-47.
Tladi, L. S. (2013). Factors affecting examination attrition: does academic support help? A survey of ACN203S (Cost Accounting and Control) students at Unisa. Open Learning: The Journal of Open, Distance and e-Learning, 28(1), pp. 67-82.
Knestrick, J. M., Wilkinson, M. R., Pellathy, T. P., Lange-Kessler, J., Katz, R., & Compton, P. (2016). Predictors of retention of students in an online nurse practitioner program. The Journal for Nurse Practitioners, 12(9), pp. 635-640.
Kahu, E. R., Stephens, C., Leach, L., & Zepke, N. (2013). The engagement of mature distance students. Higher Education Research & Development, 32(5), pp. 791-804.
ten Hoeve, Y., Castelein, S., Jansen, G., & Roodbol, P. (2017). Dreams and disappointments regarding nursing: student nurses' reasons for attrition and retention. A qualitative study design. Nurse Education Today, 54, pp. 28-36.
Raciti, M. M. (2012). Predicting first year student transfer intentions: do relationships matter? Australasian Marketing Journal, 20, pp. 65-72.
Simpson, O. (2013). Supporting students in online open and distance learning. Routledge.
Dzubak, C. M. (2008). Multitasking: The good, the bad, and the unknown. The Journal of the Association for the Tutoring Profession, 1(2), pp. 1-12.
Duhigg, C. (2012). The power of habit: Why we do what we do in life and business, Random House.
Au, O., So, R., & Lee, L. K. (2017, June). Prior Knowledge Dwarfs Hard Work in Achieving Academic Performance. In International Conference on Blended Learning, Springer, Cham, pp. 139-147.
Sadera, W. A., Robertson, J., Song, L., & Midon, M. N. (2009). The role of community in online learning success. Journal of Online Learning and Teaching, 5(2), 277.
Guo, P. J., Kim, J., & Rubin, R. (2014, March). How video production affects student engagement: An empirical study of mooc videos. In Proceedings of the first ACM conference on Learning@ scale conference, ACM, pp. 41-50.
Miller, B. (2010). Student Focus Group Guidelines. The University of Sydney. (Retrieved August 23, 2017, https://sydney.edu.au/arts/teaching_learning/academic_support/Student_focus_group_guidelines.pdf).

314
RESEARCH ON THE MODE OF MOBILE LEARNING IN DISTANCE EDUCATION
Zhixiang-li 1
,,,,Chen-ning 2
1School of Engineering, the Open University of China, Beijing, (CHINA) 2School of Engineering, the Open University of China, Beijing, (CHINA)
Abstract
This paper analyzes the necessity of carrying out mobile learning in distance education and constructs a "1 + N" mobile learning model. Taking the application of computer graphics course mobile learning resources as an example, the problems of how to develop and apply mobile learning resources and how to learn by mobile learning resources are discussed. The results show that mobile learning is an effective complement to the modern distance learning, as it can be accessible from virtually anywhere and anytime. It also provides a useful exploration for the combination model of mobile learning and face-to-face classroom teaching. Key words: distance education; mobile learning; learning model; learning resources
1. INTRODUCTION
As a new field of distance education development, mobile learning has made full use of the new achievements of contemporary mobile communication, network technology, mobile equipment and educational development, and constructed a "seamless learning" space which can be studied at any time and any place. Mobile learning has the characteristics of mobility, high efficiency, broadness and individuality. It greatly broadens the scope of education and learning, and has made great impetus to lifelong education, democratization of education and individualized learning. Especially in recent years, with the rapid development of wireless communication network and the emergence of new mobile devices, mobile learning has become a hot spot in the field of distance education research and application. Based on the characteristics of distance education, this paper studies the development and application of mobile learning resources, and explores the mobile learning model in distance education in order to solve the teaching problems existing in the Open University of China (referred to the OUC), so as to improve the quality of teaching.
2. THE NECESSITY OF MOBILE LEARNING IN DISTANCE EDU CATION
The distance education learners in the OUC are mainly working adults, they have clearly learning purpose. On the one hand, they are aware of the importance of knowledge in practical work, hoping to improve their working ability through the study; the other hand, they also hope that through further study and development, develop their own interests, enrich themselves. In addition, because the learners are studying in the occupation, engineering and learning contradictions, in this case, students must rely on self-study. At the same time, adult students have a strong sense of independence, and they are willing to arrange their own learning without restriction. Based on the analysis of learners' learning characteristics, it is necessary to carry out mobile learning in distance education. The combination of mobile learning and distance education can provide students with a "seamless" learning space, provide students with more learning convenience and possible, and students can choose to learn and improve their interest and effect.Mobile learning "embedded" to the remote teaching links can provide new means for distance learning information dissemination, teacher-student communication, learning effect detection. In the distance education to carry out mobile learning, distance education will save a lot of human resources, improve teaching effectiveness.

315
New learning ideas and learning styles require mobile learning to enter distance education as early as possible. Mobile learning can help classroom teaching, and allows learners to walk in the classroom or even outside the school at any learning time, provides good support for experiential, situational learning. It can build a bridge for classroom teaching and life, provide new ways for remote teaching, but also provide support for the concept of lifelong learning.
3. THE CONSTRUCTION AND IMPLEMENTATION OF "1 + N" M OBILE LEARNING MODEL
According to the theoretical basis of mobile learning, we can see that mobile learning is learner-centered and has a mobile device for learning activities. This paper putts forward a “1+N” mobile learning model. "1" refers to the learner as the center, and they have "1" part of the mobile learning terminal; "N" refers to the learners can learn and practice at any time, any place, and using any learning mode. It can be seen that throughout the learning process, students are the subject of learning, teachers only help to guide and promote. The realization of mobile learning is divided into SMS-based mobile learning, MMS-based mobile learning, browsing-based mobile learning, Video-based mobile learning and offline class mobile learning mode.
3.1 SMS - based mobile learning mode
SMS-based mobile learning model is mainly used in learning activities of communication data less and simple text description. It is a popular mobile learning path. As a means of communication, short message service has now been widely used, and won the favor of the majority of users. Because of its extensive use, some researchers began to try to apply it to teaching and learning.
3.2 MMS-based mobile learning mode
Multimedia services (MMS) can be divided into three cases: MMS terminals receive and send multimedia messages to each other; MMS terminals and Internet E-MAIL server send and receive multimedia messages; MMS terminal and Internet value-added service platform send and receive multimedia messages to each other. Ordinary short text messages can only include 170 bytes in length, MMS short messages can be up to 30-100 kilobytes in length. In addition to text, MMS messages can contain a combination of one or more media formats in the sound, picture, and video clips. Through the multimedia short message service provided by 3G, the learner can send the short message to the teaching server through the terminal. The teaching server can analyze and process the received data, the reply information can be automatically returned to the learner in the form of short message. Of course, learners can also discuss the problem through short message. 3.3 Browsing-based mobile learning mode Browse, links include WAP and mobile Internet services and mobile broadband services. The construction of WAP education site is another important aspect in the field of mobile learning. There is not much difference between WAP education site and ordinary WAP site. The difference lies in the purpose of the application and the object oriented. 3.4 Video-based mobile learning mode With the help of 3G technology to provide the network bandwidth, learners can get a higher network transmission bandwidth both indoors, outdoors or in the process of moving. you can easily achieve demand across from the text, picture to audio and video. Based on this business, we can develop some courses suitable for learners to watch, simulate learning through the mobile phone software, and provide services for mobile learning by taking full advantage of 3G bandwidth advantages. Compared with the previous TV education and online education program based on the wired network, it has greater flexibility, can free learning at anytime and anywhere. It is more suitable for modern fast-paced learning crowd.

316
3.5 Offline class mobile learning mode This learning mode allows learners to get rid of restrictions of the time, place. As long as the need for information, you can carry portable mobile devices to find, browse and download. The information download can be stored in the mobile terminal for a long time, the learner can learn offline, reduce the dependence on the network, but also reduce the financial burden of the Internet. 4. THE DEVELOPMENT AND APPLICATION OF MOBILE LEARNI NG RESOURCES The development of mobile learning resources should follow the following principles: 1) The validity of media form selection.2) Content catch big and put small down, strengthen the core. 3) Learn in use. 4) Focusing on the performance of the same core content in different media forms. 5) Attention to strengthen the user experience. The development process of mobile learning resources includes many development links from the beginning of the demand analysis to put into use [1-2]. For example, the main development aspects of computer graphics courses mobile learning resources are as shown in Figure 1. 1. Demand analysis. Firstly, we should carry out the analysis of the learner. Based on the
characteristics of the learners 'groups and the level of self-control, we should concern how to stimulate the learners' interest in learning. Secondly, we should carry out the analysis of the learning content. According to the characteristics and difficulty of the learning contents, the learning content is presented in a form that is most easily accepted and understood by the learner.
2. To determine the guiding ideology of teaching. The quality of teaching resources depends largely on the suitability of the teaching ideology. The appropriate teaching ideology can start from the learner's own characteristics and the nature of the learning content, so that the learners can grasp the knowledge more easily and reach the teaching purpose[3].
3. Resource development. In the development of mobile learning resources, we must carry out the content structure design and interface navigation design firstly according to the demand analysis, and then select the appropriate development tools to complete the development of mobile learning resources according to the identified resource presentation form and resource length[4-5].

317
Learner characteristics
Learning Content
demand analysis
Teaching guiding ideology
Resource development
PAD Mobile phone
WAP Browser WWW Browser
Put into use
Rich learning
resources
Timely interaction
AnyLearning
place
Any learning
time
Feedback modification
Resource presentation form
Fig 1. Development and Design Framework of Mobile Learning Resources
4. Put into use. After the completion of resource development, the mobile learning resource can be provided directly to the learners to use. For the more far-reaching impact and the application of a wide range, you should go through professional testing and a variety of trial firstly, quality is proved qualified and then put into use.
5. Feedback and modification. In the course of the using process, the learners 'feedback on the used learning resources is collected, and the learning resources are appropriately modified to achieve better learning results under the premise of satisfying most learners' satisfaction.
5. MOBILE LEARNING RESOURCES APPLICATION EVALUATION EVALUATION
We have developed a computer graphics course of mobile learning resources for student learning. Computer graphics courses enrolled students 76 people, 62 students have chosen to use mobile learning resources for learning, and the remaining 14 people are not using mobile learning resources. In these 62 students, summative test scores 90-100 points to 48, 78% of the total number of points for the 80-89 0,70-79 points to 12, 19% of the total number of , 60-69 points is zero, do not pass the 2, 3% of the total, as shown in FIG 2. Visible, students learn to use mobile learning resources, high interest, have achieved good results, the pass rate was 97%, and the effect is satisfactory. In addition, we

318
focused on computer graphics program mobile learning resource designed a questionnaire for students to use mobile learning resource evaluation, as shown in Table 1.
Fig2. Summative exams map
Tab 1 mobile learning resources satisfaction questionnaire
The survey very much
agree agree general disagree
Teaching content and methods(10
items) 3 56 3 0
Interface design(2 items) 0 55 7 0
Learning Support Service(3 items
) 0 50 12 0
Course Overall satisfaction(1 item
) 0 58 4 0
Through the questionnaire can be found in the course of the experiment, the use of new technologies learners showed great curiosity and excitement, they are very willing and eager to use the new technologies in learning; more importantly, experimentally found that the new technology with the aid of learning outcomes learners has been significantly improved, mobile learning resources are more able to cater to the tastes of younger students, so they can maintain a lasting interest in learning. 6. SUMMARY The development of mobile Internet, it made the content and form of learning undergo a revolutionary change. Learners hope that the learning content is personalized, learning means is information technology, learning process is lifelong. Mobile terminals become learning tools at any time. Mobile learning resources is from the "whole" to "narrow" relative to the traditional learning resources, the relevance of resources is more and more stronger, the resources form of the same knowledge is diverse. Mobile learning allows students to choose their own personalized learning resources and methods. It has advantages of rich media, diverse communication channels, easy to use and so on. Mobile learning resources can be made for a variety of forms of terminal learning resources products, communicate through different channels. It can achieve dynamic integration, multi-channel, multi-form digital publishing, real-time sharing and interaction. Learners have curiosity about the way of mobile learning, the friendly interface and the flexible interaction can effectively stimulate learners' interest in learning. Compared with the previous learning resources, mobile learning resources have add a lot of new features, such as marking, taking notes, sharing, search function, add bookmarks and other auxiliary learning means. You can communicate with teachers and students. As a new learning mode in distance education, mobile learning is a kind of auxiliary teaching method. There are still many problems in the design of mobile learning mode and learning resources, which need further study and exploration.
48; 78%
12; 19%2; 3%
Grading
100-90
89-80
79-70
69-60
59-0

319
REFERENCES
[1] Liu Yuping, Learning resources design research based on the Tablet PC Mobile [J]. Master's degree thesis of Liaoning Normal University, 2014,6: 34-42 [2] Hu Jianfang, Learning resources design research based on the smart phone mobile [J]. Master's degree thesis of Inner Mongolia Normal University, 2014,5: 27-35 [3] Duan Luqian, An Xueguo. Technology and Reform of "Foreign Training Machinery CAD" Teaching Based on Human Suit [J] . Acta Scientiarum, 2014,35 (4): 619-622 [4] Song Xuemei. Application of task-driven teaching method in computer graphics teaching [J]. Journal of Yantai Vocational College, 2014,20 (4): 72-74 [5] Cui Ting. Application of Project Teaching Method in "Computer Drawing" Course [J]. Heilongjiang Science, 2014.5: 217

320
CONSTRUCTION OF THE VIRTUAL-ACTUAL COMBINATION PRACTICAL TEACHING SYSTEM FOR OPEN EDUCATION
Chenghui Han
Jiangsu Open University (CHINA)
Abstract
Practical teaching is not only a teaching link to train the professional skills and application ability of the learners in the process of opening education teaching, but also the weak point of the process of opening education teaching. This article aims at the characteristics that the learners start to show the separation of space and time and the contradiction of engineering during part-time learning, cooperate with government and corporation and explore and construct the virtual-actual combination practical teaching system for the combination of opening education which can guarantee the smooth implementation and quality of opening education practice teaching. This system includes: online examination, scoring and virtual simulation training system; cooperate with government and cooperation to build a wide coverage of distributed solid laboratory; develop rich resources of digital practice teaching courses that are suitable for long-distance education according to the requirements of practical teaching; a teaching team that consists of course person that is in charge, course director, academic professor and technological backbone of the industry of company. Key words : Opening education; Practical teaching system; Simulation training system; Distributed entity laboratory 1 INTRODUCTION Open education is not only the mainstream education of learning society, but also an important educational model in lifelong education system. The goal of personnel training in open education is to train applied talents with innovative ability and good comprehensive quality for the forefront of production. Being an important way to realize the goal of personnel training, practical teaching is the teaching process of students' leaning technology and training skills; therefore, practice teaching is an indispensable component of open education. However, due to limited practical conditions, the relative scattered pattern in space and also the in-service spare time study of learners, requirements of the current practice teaching cannot be effectively implemented. Thus practical teaching has become a relatively weak link in the teaching process of open education. This article aims at the characteristics that the learners start to show the separation of space and time and the contradiction of engineering during part-time learning, cooperate with government and corporation and explore and construct the virtual-actual combination practical teaching system for the combination of opening education which can guarantee the smooth implementation and quality of opening education practice teaching. 2 PROBLEMS IN THE TEACHING PROCESS OF OPEN EDUCATIO N PRACTICE I. Entity experiment(training) laboratory constructions cannot meet the needs of students learning The entity experiment(training) is an indispensable link in all the teaching of agriculture and engineering specialties. However, due to the quasi-separation of teachers and students in different places, the students' requirements to practice cannot be fulfilled even if a full range of practical teaching resources are built in the campus. In-service students are not able to overcome the space distance and come to the campus to complete the training assignments in working hours frequently. II. Poor quality of virtual experiment simulation Currently the simulation performance of virtual experiment is relatively poor that it is incompetent to the role of training students skills. Moreover, the interactivity of some virtual simulation experiments is disappointing that online assessment could not be achieved.

321
III. Online learning resources of practical teaching are relatively scarce Effective online learning resources of practice teaching are relatively scarce that without the teacher's prompt operational guidance, the students may have some difficulty in completing the practice of teaching tasks independently. IV. Lack of teachers in practice teaching The student are large in number and scattered in space. Moreover, the workload of guiding practice teaching is much more great compared with pure theory teaching, which result in the shortage of teachers in practice teaching. V. Lack of monitoring and assessment in practice teaching At present, many running institutions are able to complete the task of social investigation in accordance with the requirements of centralized practice teaching. However, due to the lack of effective monitoring, the practical teaching of curriculum cannot be completed according to the quality requirements, which leads to the practice teaching being carefully planned while lightly implemented. 3 SOLUTIONS TO THE PROBLEMS In view of the problems existing in the practice teaching of open education, a practical teaching system combining virtual and reality is constructed, and its effective operation mode is also explored and practiced. I. Co-construction of off-campus training base by government, school and enterprise Adhere to the guiding ideology of government-school-enterprise cooperation, led by the government, we can cooperate with the industry and enterprises to build distributed off-campus entity experimental training facilities covering the whole province, where any experimental(training) project can be carried out. Hence, the students can perform experimental course, practice and graduation design in any county so as to get necessary training to obtain vocational qualifications. Therefore, the problem of students' inability to carry out practical training caused by their relative dispersion in time and space is solved and the participation of the government ensures the effective operation of the distributed entity experimental training laboratories. II. Developing virtual simulation training platform by school-enterprise cooperation School can cooperate with enterprise to develop virtual simulation training platform, which have the function of online examination, scoring and training. On the platform, the teachers can send examination tasks to the students through teacher station, generate papers, automatically collect the results and also carry out software project training for the students in accordance with the curriculum. The platform has online and cloud learning capabilities that the students can perform online simulation training through the network at all times and places. The operation mode of virtual simulation system is of high fidelity, flexibility and reality. Such as the analysis of residual pesticides in vegetables by GC-MS, the simulation system utilize GCMS-QP2010 GC-MS spectrometry as template, through which the students can master the instrument operation by simulation training. In this way, not only the problem of lack of large-scale analytical instrument is solved, but also the students can lay the foundation for practical operation. III. Building rich practical teaching resources In the construction of practical teaching resources, we should lay emphasis on the integration of resources, pay attention to interactivity and fun, avoid tedium and combine theory with practice while designing learning tasks and practice subjects. Practice teaching resources include text resources, experimental video, animation and micro-class, in which the experimental video not only contains the experimental principle, operating points and precautions, but also the entire experimental operation as a demonstration video which can reproduce the real experimental scene. These resources can guide students to utilize virtual simulation training platform and distributed entity experimental training

322
laboratories so as to realize "online simulation, offline practical operation", and complete the experiment task independently. IV. Establishment a practice teaching team by employing both full-time and part-time hands The team consists of course leader, course instructor, academic tutor and technical backbone of industry enterprises. Generally the course director is composed of well-known university scholars and industry experts, and is responsible for the design of practical teaching content;the course instructor is responsible for guiding the students to complete the practical teaching tasks and carry out the assessment of the students;Academic tutor is composed of teachers of the learning center, who are responsible for the routine management of the students and should assist the course instructors to complete the practical teaching tasks; the backbone of industry and enterprise are mainly responsible for guiding students' practical operation. V. Strengthen the process management and ensure the quality of practical teaching We should develop a set of more comprehensive assessment standards for practice teaching. Practice teaching mainly rely on students' online length, the use of learning resources, experimental development, the quality of experimental reports,simulation experiments and BBS participation as a basis of investigation. Especially in the process of experimental development, each student is required to submit photos or videos of offline practical operation aside from the experimental report in order to ensure the effective implementation of practice. 4 PRACTICAL APPLICATION OF PRACTICAL TEACHING SYSTE M WITH
COMBINATION OF VIRTUAL AND REALITY
The combination of virtual and reality practical teaching system has been applied to the specialty of agricultural resources and environment and environment engineering; of which the specialty of agricultural resources and environment led by the Jiangsu Provincial Agricultural Commission, in cooperation with the city and county agricultural products testing centers, has built 62 off-campus training bases covering the whole province. These off-campus training bases provide a guarantee for students to achieve "online simulation, offline practice" and play a crucial role in ensuring the quality of personnel training, resulting in better teaching effect. With the help of Jiangsu Provincial academy of Environmental Science, the specialty of environmental engineering has built distributed entity practical training laboratories covering the whole province. Moreover, in cooperation with East Simulation, we have developed simulation software for urban sewage treatment, large-scale analytical instruments, waste gas treatment of waste incineration plant and air pollution control equipment unit. At present, there are 9 courses docked with virtual simulation training, through which, the efficiency of training is greatly improved, the practical skills of students are also enhanced. REFERENCES [1] Qin X.-Z.; Ye X.-Z. and Wang J.-G.; Conducting experiments in science and engineering in open and distance education. [J]. Distance Education in China, 2008, (11):43-45. [2] Liu Q.; Tu Z.-Y. and Li W.-B.; Research on function module design of chemistry remote laboratory.[J].Journal of Tianjin Radio and Television University, 2016, 20(1): 37-40. [3] Qi Y.-J.; Lu F. and Li Y.; Research on practice teaching system in open education: a case of exploration on the practice teaching with remote experiment as the main body.[J]. Journal of Distance Education,2014, (6): 56-64.

323
THE PRACTICE OF INTERNAL QUALITY AUDIT AT A DISTANC E HIGHER EDUCATION: AN EXAMPLE OF UNIVERSITAS TERBUKA ,
INDONESIA
Basuki Hardjojo 1, Deetje Sunarsih 2 Ojat Darojat 3 1Universitas Terbuka (INDONESIA) 2Universitas Terbuka (INDONESIA) 3Universitas Terbuka (INDONESIA)
Abstract This article examines the implementation of internal quality audits as an important part of quality assurance (QA) programs at Universitas Terbuka Indonesia. Despite the wide area of quality, this paper will only focus on the implementation of internal quality audit in some strategic areas including registration services, learning materials, learner support specifically learning support, and final examination services. The diverse non-conformities in 2014 and 2015 which were explored in 37 Regional Offices were also discussed to show how the implementation of QA programs has been employed in different ways. The series of evidence indicate that non-conformities have been identified in all regional offices with different classification (major, minor, and opportunity for improvement) and with different areas of quality. Based on the results of internal QA audit, learner support especially learning support services might be regarded as crucial areas to be improved for better outlook. This paper concludes that internal quality audit is strategically important for management to continuously scrutinize and ensure that quality assurance programs are implemented in accordance with the procedure, work guidelines, and record of quality criteria. Keywords: quality, quality assurance, distance higher education
1 INTRODUCTION Quality Assurance System of Universitas Terbuka (or Simintas UT) that has been implemented since the era of Gelora Simintas in 2004 is one of the ways taken by UT to move forward as an institution implementing quality distance education. Simintas is an internal quality assurance (QA) system developed as a tool to support a number of institutional policies, both academic and operational. In 2015, Simintas UT 2012 is the main reference which contains areas of quality and statements of good practices as a realization of quality policies from each area of quality. In addition, in order to implement the quality policies, UT has developed a number of quality assurance manuals which provide information in detail about the procedure and work guidelines and records needed in the field which in general can be classified into two areas, namely Academic Management and Distance Education Management. This paper will focus on the implementation and results of internal quality audit in distance education management in the second semester of 2014 and the first semester of 2015 (2015.1) which was implemented in 37 Regional Offices with support from a number of related units in the Head Office. Internal quality audit is to ensure that quality assurance in distance education is implemented in accordance with the procedures, work guidelines and records of quality criteria. 1.1 Objectives In general, this paper is made with the purpose to examine the implementation of UT’s QA system and to provide general information to the top management for better future dealing with two major concerns:

324
1. The map and general conclusion about weaknesses and non-conformity faced in the implementation of Simintas-UT for each area of quality in distance education management, and
2. Inputs or recommendations to the top management in order to improve the quality of UT services by considering the review of quality policy.
2 LITERATURE REVIEW ON QUALITY AUDIT Studies on QA methodologies (or techniques) to assure quality in DHE have been conducted by Jung and Latchem (2012). Jung (2004) disclosed that QA methodologies intended to improve quality have focused on different dimensions such as inviting external experts, conducting evaluation research, and introducing internal review processes. Various methodologies, such as self-assessment and quality audit, for assuring quality have also been used in various areas of QA framework—such as, policy and planning, management and administration, and program design and development. According to Chapman and Carrier (1990), these methodologies often fail because they may not recognize or address the interactive/interconnected nature of these components. Specific areas of a QA framework are treated as if they were disconnected from the larger context of interwoven pressures that characterize a complex social system. Thus, the critical challenges for universities is to identify the interrelated contexts in which QA programs must be operated and respond to their strategic stakeholders’ demands to balance the different interests in order to achieve a common understanding of educational quality. The approaches to QA in DHE point to a great variety in methodologies. Some frequent approaches to QA methodologies in education include: accreditation, quality audits, student surveys (Chalmers & Johnston, 2012). Others focus on self-study or self-evaluation, the use of industry-based framework such as total quality management, ISO 9000 standards, and the Baldrige Award (Bogue, 1998). In this paper, however, researchers will focus on providing an overview of self-assessment involving internal quality audit. The self-assessment or self-study is an excellent first diagnostic step on path to quality (Sallis, 2002). It refers to the study of institutional processes and practices by members of the respective institution (Maniku, 2008). According to the European Foundation for Quality Management (EFQM), as cited by Sallis (2002), self-assessment is:
A comprehensive, systematic and regular review of an organization’s activities and results…The self-assessment process allows the organisation to discern clearly its strengths and areas in which improvements can be made and culminates, in planned improvement which are the monitored for progress. (p. 148)
Martin and Stella (2007) made further clarification by explaining that in the self-assessment process, faculty together with administrators should discuss the strengths and weaknesses in their respective units, and identify the causes of possible shortcomings. The underlying assumption behind the use of self-assessment is that an educational institution that really understands itself in terms of its strengths, weaknesses, potential opportunities and threats (SWOT) is likely to be more successful in employing its educational mandate than the one without self-awareness (Martin & Stella, 2007). The implementation of self-assessment, in different distance higher education for example at Open University of Malaysia (OUM) and Universitas Terbuka (UT), has been supported by their internal quality audit programs (Darojat, Nilson, & Kaufman, 2013). These universities have been equipped by their certified internal quality auditors to run their quality programs. According to Chalmers and Johnston (2012), quality audits in DHE tend to predominantly use performance indicators developed and collected at the institutional level, although some countries have standardized national performance indicators against which institutions are audited. Performance indicators and quality assessment, according to Shale (2003), are terms that are closely associated in QA. The performance indicators are generic statements that can be adapted for use by distance education providers to maintain and enhance quality (COL, 2009). They can be used as tools to evaluate performance trends in the institution to initiate continuous improvement (COL, 2009) and to monitor efficiency with regard to staff-student ratios, indexes of revenue and capital resources, market share and examination (Harvey & Green, 1993). One of the dilemmas related to QA at DTU lies in identifying suitable benchmarks (Stella & Gnanam, 2004), statements of best practices (AAOU version) or performance indicators (COL version) which will make the quality assessment clear especially to the QA agencies and the DTUs. To use the benchmarks, indicators and sources of evidence are necessary and important for judging the level of
325
quality performance (COL, 2009; Stella & Gnanam, 2004). For example, without specific indicators, the statement of best practice: “The institution has well run student support services” (p. 154) does not tell us clearly what characterizes effective student support. For Stella and Gnanam (2004), “it is essential to spell out what characterizes the different levels of performance” (p. 154) to avoid the ambiguity and affect the objectivity of quality assessment. 3 METHODOLOGY This study employed field visit to 37 UT’s Regional Offices scattered all over Indonesia involving UT’s internal auditors. In the present study, semi-structured interviewing technique was used equipped with Simintas quality guidelines including standard operating procedures (SOP), works instruction. Identified participants were interviewed using prepared interview guides to obtain information, but the internal auditors had flexibility to pursue further questions relevant to the purpose of the quality audit. In addition, to support this study, documentary analysis had also been employed. Documents provided rich, factual, and natural information to describe the context and contribute to an analysis of issues. The auditors collected and analysed the QA documents at research site, such as minutes of meetings, institutional documents, review reports, evaluation reports, standards and operational procedures. These documents had been used to describe specific conditions and practices, spot trends, as well as document the historical and current implementation of QA programs. Further, data analysis based on quality areas and UT’s regional office cluster was employed to present and discuss the findings drawn from content analysis of interview transcripts and documents. In this analytical work, the list of codes represented the UT’s regional offices and QA areas were used and served as symbolically linking from the data to the relevant UT’ quality guidelines and areas. 4 FINDINGS Internal audit is a sustainable effort to improve the quality of implementation of all QA programs especially the ones related to operational activities done in the Regional Offices and some related units at the Head Office. Internal audit is implemented as a self-assessment in order to achieve the targets of quality of units and to ensure that all activities are implemented in accordance with the regulation and minimum requirements that have been agreed in UT’s quality manuals and the standard operating procedure (SOP), work guideline, and work record. As has been discussed in the previous part, this report will focus on the results of audit in semesters 2014.2 and 2015.1 carried out in 37 Regional Offices that have obtained the quality certificate of ISO 9001:2008. 4.1 The Trend of Result of Findings of Internal Aud it in 2014 and 2015 by Regional Centers in the Group of 14 Regional Centers The results of findings of internal audit in distance education management in 37 Regional Centers are presented in two separate parts, namely the results of findings in 14 Regional Offices that were recertified in 2013 and 23 Regional Offices which at the time were preparing to be recertified by the certification board. Based on the recapitulation of result of audit findings from 14 Regional Offices, in general it can be said that Simintas UT is still implemented with full support and commitment from all leaders and staff at the Regional Offices. Seriousness and commitment of the leaders and staff to apply the quality assurance manuals in seven areas of quality in distance education management are reflected in the report submitted to the team of internal auditors. However, the implementation of Simintas UT in some Regional Offices is still marked with some drawbacks as can be seen in a number of internal audit findings. The findings vary in terms of type and weight (major and minor non-conformity). Considering the recapitulation results of Simintas audit findings in 2014, the number of findings in 14 and 23 Regional Offices can be mapped in the graphic 1 and graphic 2 below.

326
Graphic 1: Map of Findings of Quality Audit by Regional Offices in 2014 in the Group of 14 Regional Offices
Source: Recapitulation of internal audit findings, Pusmintas, 2014 Note: major non-conformity minor non-conformity
From the graphic above, it can be explained that in 2014 there were some major findings in several Regional Offices such as Regional Offices in Palembang, Semarang, and Surakarta. In addition, the most prominent minor findings were found in 14 Regional Offices in Bogor, Padang, and Purwokerto. All major and minor findings in 14 Regional Offices have been verified, followed-up and closed. Follow-up activities in the form of improvement and prevention have been done by each Regional Office before the implementation of external audit at the end of 2014.
Graphic 2: Map of Quality Audit Findings by Regional Office in 2015 in the Group of 14 Regional Offices
Source: Recapitulation of internal audit findings, 2015 Note: major non-conformity minor non-conformity
From the graphic 2 above it can be explained that major non-conformity was still found in five Regional Offices, namely in Regional Offices in Padang, Bandung, Malang, Gorontalo, and Jember. Meanwhile, some minor non-conformities were found in the group of 14 Regional Offices which range from 2 to 15 findings. The graphic above also explains that seven major non-conformities can be found in Padang Regional Offices, and should get more serious attention especially in the area of learner support service. It will be discussed later in the next session. Considering a number of findings found in 2014 and in the first semester of 2015, it is necessary for this report to do analysis about the trend of Simintas audit findings. Through this analysis it is expected that the management will get a more comprehensive description about the on-going implementation of Simintas especially in distance education management. The trend of Simintas audit findings in 2014 and 2015 can be illustrated in the following graphic.
05
101520
7 8 7 9 415
8 102
13 11 9 82 0 1 0
1
27 0
0
0 0 0 0

327
Graphic 3: Trend of Internal Audit Finding in 2014 and 2015
In the group of 14 Regional Offices
Source: Recapitulation of internal audit findings, Pusmintas, 2014 and 2015
Note: 2014 Major non-conformity 2015 Major non-conformity
2014 Minor non-conformity 2015 Minor non-conformity
The graphic above clearly shows that the trend of findings in 2014 and 2015 varies for each Regional Office. Major findings tend to decrease in the Regional Offices of Palembang, Surakarta, Semarang, and Purwokerto. On the contrary, major findings tend to increase in the Regional Offices of Padang, Malang, Bandung, Gorontalo, and Jember. Meanwhile, the Regional Offices of Bengkulu, Jakarta, and Pekanbaru show a very good condition; there were no major findings in 2015 and the year before. From the graphic 3 it can be explained that the trend of minor findings tended to increase in the Regional Offices of Bengkulu, Gorontalo, Jakarta, Jember, Malang, Palembang, Pontianak, and Surakarta. On the contrary, the trend of minor findings tended to decrease in the Regional Offices of Bandung, Padang, Pekanbaru, dan Semarang. From the data above, it can be summed up that the implementation of Simintas was good in the group of 14 Regional Offices, namely in the Regional Office of Pekanbaru. The achievement of Simintas implementation was marked by the decrease of minor findings from 9 findings to 2 findings and there were no major non-conformities in 2014 and 2015. 4.2 Trend of Internal Audit Findings in 2014 and 20 15 by Regional Offices in the group of 23 Regional Offices Then, the implementation of Simintas is still in progress in the group of 23 Regional Offices, namely those Regional Offices that obtained ISO certificate in distance education management in 2014. The findings of Simintas audit in 2014 in the group are presented in the following graphic.

328
Graphic 4: Map of Quality Audit Findings by Regional Offices in 2014 in 23 Regional Offices
Source: Recapitulation of internal audit findings, 2014 Note: major non-conformity minor non-conformity
Unlike the group of 14 Regional Offices which are relatively established in implementing Simintas in distance education management, the findings of internal audit in the group of 23 Regional Offices in general are relatively bigger in number than both in the categories of major and minor. Major non-conformities were found in 19 Regional Offices such as Regional Offices of Jayapura, Kendari, and Pangkal Pinang. Meanwhile, the most prominent minor findings were found in the Regional Offices of Makassar and Pangkal Pinang. All findings were followed-up, improved and prevented based on the root of each problem and 23 Regional Offices were recertified by the certification board at the end of 2014. Then in the first semester of 2015, Pusmintas carried out internal audit activities in this group for 10 Regional Offices. The remaining 13 Regional Offices will be audited in the second semester of 2015. The result of 10 Regional Offices that have been audited can be seen in the following graphic.
Graphic 5: Map of Quality Audit Findings by Regional Offices in 2015 in 23 Regional Offices
Source: Recapitulation of internal audit findings, Pusmintas, 2015 Ket: major non-conformity minor non-conformity
Of 10 Regional Offices that had been audited, it can be explained that major non-conformities were found in eight Regional Offices. Major non-conformities were found in the Regional Offices of Batam, Ambon, Kupang and Aceh. Meanwhile, some minor conformities were found in all Regional Offices. The most prominent minor conformities were found the the Regional Offices in Serang. From the graphic in can be known that the Simintas was relatively done better in the Regional Offices of Denpasar in 2015.
0
10
20
7 11 10 10 12 817
8 8 134 1 0 1 1 72
0 64
0
5
10
15
20
25
30
35
Am
bo
n
B.
Ace
h
B.
Lam
pu
ng
B'
ma
sin
Ba
tam
De
np
asa
r
Jay
ap
ura
Jam
bi
Ke
nd
ari
Ku
pa
ng
Ma
jen
e
Ma
ka
ssa
r
Ma
na
do
Ma
tara
m
Me
da
n
P'r
ay
a
Pa
lu
P.
Pin
an
g
Sa
ma
rin
da
Se
ran
g
Su
rab
ay
a
Te
rna
te
Yo
gy
ak
art
a
1711 11 11
6 713 16
10
25
5
31
18
4
27
117
29
1721
15 12 14
4
3 31
1 1
15
2
0
6
5
3
0
2
1
44
5
00
20
1

329
Graphic 6: The Trend of Internal Audit Findings in 2014 and 2015 by Regional Offices in the Group of 23 Regional Offices
Sources: Recapitulation of internal audit, Pusmintas, 2014 and 2015
Note: 2014 Major non-conformity 2015 Major non-conformity
2014 Minor non-conformity 2015 Minor non-conformity
Of 10 Regional Offices that have been audited, it can be explained that the trend of non-conformity tends to increase in the category of major non-conformity in the Regional Offices of Ambon, Banda Aceh, Batam, and Serang. On the contrary, the trend of decreasing major non-conformity was found in the Regional Offices of Bandar Lampung, Denpasar, Kupang, Palu, and Surabaya. Up to the mid of 2015, major non-conformities that need serious attention were found in the Regional Office of Batam. In the same occasion, appreciation is extended to the Regional Offices that have shown good performance in the implementation of Simintas at the Regional Offices of Lampung and Denpasar, that have shown very good commitment in the implementation of internal quality management system. Even though this part cannot be fully analyzed as not all Regional Offices were audited, but in general the trend of findings in 2014 and 2015 in 37 Regional Offices can be explained that the trend of non-conformity tends to decrease quantitatively. However, there is a special note that there was an increasing number of non-conformity in the Regional Offices that underwent management change, such as replacement of Head of Regional Offices, and replacement of coordinator or Head of Administration Unit. This is found in the Regional Offices of Padang and Malang. The Regional Office of Malang, the number of minor non-conformity is doubled in 2015. The same thing occurred in the Regional Office of Padang in 2014 where there was no major non-conformity but then it was increasing significantly in 2015. It indicates that there is a need for adequate debriefing about UT’s internal quality system for UT staff who will be assigned to be the Head of Regional Office. Based on the past experience, it is necessary to do an internship for the candidates of the Head of Regional Office in certain units, including internship in Pusmintas for some time. 4.3 Findings of Audit in Distance Education Managem ent in 37 Regional Offices by Areas of Quality For the purpose of analysis and quality improvement, the results of internal audit in 2014 are mapped and discussed based on the areas of quality. In this report, the mapping of findings is limited to the areas of quality directly related to distance education management. Meanwhile, findings related to internal management such as management review meeting held at Regional Offices are not discussed and findings related to the achievement of quality targets are made separately. Therefore, the mapping of internal audit findings will be limited to nine main areas, including promotion and cooperation, registration, learning materials and learner support services, document control, examination, student services, administration, especially the one related to resources (human resources and facilities), and certification. The findings of internal audit in the nine areas can be seen in Graphic 7 below.

330
Graphic 7: Map of Findings of Quality Audit by Areas of Quality in 2014
Source: Recapitulation of internal audit findings, Pusmintas, 2014
Before going into more comprehensive discussion in the next part, from the map of findings above it can be explained that in 2014 there were serious problems in the area of quality for learner support service. Of 37 Regional Offices that were audited internally, in general they show that the distribution of non-conformity in each area of quality is centered in the area of learner support services. As has been discussed in the report in 2014 that the most crucial problem in the Regional Offices with regard to the implementation of Simintas is weaknesses in learner support services, especially the ones related to implementation of face-to-face tutorials. Weaknesses and non-conformities occurred from the tutorial preparation such as tutor screening, tutorial locations, tutor recruitment, training and debriefing for tutors, and tutorial scheduling. In addition, understanding, commitment, and obedience of most tutors or instructors to regulations (procedure, work guideline, and record utility) that have been stipulated in the JKOP BB03 and quality manuals are still low. Then, there are weaknesses in the management of learner support services in terms of coordination in management of face-to-face tutorials and tutor evaluation, validation of tutorial assignment scoring, and post-tutorial activities including follow-up of report on monitoring results. All non-conformities, both major and minor, have been followed-up by each unit either in the form of improvement or a more important act of prevention so that it will not happen again in 2015. In the first semester of 2015, the findings of audit will be reported for 23 Regional Offices out of 37 Regional Offices. However, it should be stated in this report that quality internal audit has been done in 31 Regional Offices. The results of audit in 7 Regional Offices are not discussed in this report because they are still in the processing phase in the second semester in 2015 except the Regional Office of Surakarta. While other 7 remaining Regional Offices will be audited in the second semester of 2015. Of 23 Regional Offices that have been audited (see Graphic 8), the results are as follow. The quality area of learner support services is still the most critical area of quality. Both major and minor non-conformities occurred in this area. Of 108 findings in 23 Regional Offices, 24 findings belong to the category of major finding and the remaining 84 findings are minor non-conformity. This number will continue to increase after integration with 7 Regional Offices that have not been reported and six Regional Offices that have not been audited.
0
50
100
150
30 34 25
118
20 36 2559
20
2 8 10
29
1116
913
514 UPBJJ
23 UPBJJ

331
Graphic 8: Map of Quality Audit Findings by Areas of Quality in 2015
Source: Recapitulation of internal audit findings, Pusmintas, 2015.1
Note: 2015 Major non-conformity 2015 Minor non-conformity
Considering the main weakness above and the strategic role of learner support services in the context of distance education, it is deemed necessary to make some efforts of improvement and prevention so that the same problem will not occur again in the future. Suggestions and recommendations with regard to the effort to improve learner support services will be discussed in the next part of this report
5 DISCUSSION OF QUALITY AUDIT FINDINGS
Based on the map of Simintas audit findings that has been discussed in the previous part, the analysis of quality audit findings will be divided into two parts. First, the analysis will be based on the trend of quality audit by Regional Offices. Second, analysis and discussion will focus on the areas of quality or especially the aspects considered to be the most important pillars for UT. The important areas of quality include registration services, learner support services, exam administration, learning materials, and student services that will be discussed in sequence. 5.1 Analysis and discussion of quality audit based on Regional Offices From the data of findings presented in the first part, there are some interesting findings to discuss more in-depth in terms of major and minor non-conformities. 1. In the group of 14 Regional Offices that have implemented internal and external quality audit in
distance education management, they are in general are more reputable in implementing Simintas UT. In 2015, the number of findings in each Regional Offices was relatively low and there was a decreasing trend for both major and minor categories. It indicates several meanings in Simintas implementation. First, the level of understanding of all leaders and staff to implement Simintas is getting better. Second, the decreasing trend of non-conformity also indicates improved awareness of all staff and leaders of Regional Offices in implementing the procedure, work guideline, and utility of recording in distance education management. The trend of improved understanding and awareness and efforts to implement Simintas in this group can be seen in the Regional Offices of Pekanbaru, Semarang, Palembang, and Purwokerto. Especially in the Regional Office of Pekanbaru, the results of this audit show more solid and better performance of internal management, apart from non-existence of major non-conformity. Minor non-conformity also decreased significantly from 9 findings in 2014 to only 2 findings in 2015.
2. However, in the group of 14 Regional Offices there are phenomena that the management should pay attention to where there is an increasing trend of number of non-conformity, such as at the Regional Offices of Gorontalo, Jakarta, Jember, and Malang. In addition, major non-conformity was increasing significantly at the Regional Office of Padang. Management change at the Regional Offices of Malang, Padang, and Gorontalo also influenced the implementation of Simintas in those Regional Offices. Meanwhile, for the Regional Office of Jember, even though the results of findings show increasing non-conformity but quantitatively the finding of non-conformity was relatively
0
50
100
150
8 7 1484
12 36 6 14 41 1 0
24
32
05
1

332
smaller compared to other Regional Offices in the same class or group. During the period of 2014 and 2015, the Regional Office of Jember was noted as the most reputable Regional Office in implementing Simintas if seen from this side of non-conformity.
3. Unlike the first group, the findings of non-conformity in 2015 in the group of 23 Regional Offices in general still show relatively high number. From 10 Regional Offices analyzed in this report, the major non-conformity was found in almost all Regional Offices, except in the Regional Offices of Bandar Lampung and Denpasar. The most prominent findings of major non-conformity were found in the Regional Offices of Batam and Ambon. Meanwhile, the most prominent minor non-conformity was found in the Regional Offices of Serang and Banda Aceh.
4. In this group of 23 Regional Offices, especially the 10 Regional Offices that have been audited, there was also a good phenomenon, where on the whole the number of findings of non-conformity was decreasing. For example, in the Regional Office of Ambon, the number of non-conformity was decreasing significantly from 21 non-conformities in 2014 to 14 non-conformities in 2015. In the Regional Office of Kupang, there was a decreasing trend from 31 non-conformities in 2014 to 11 non-conformities in 2015. Even though there has been no study of the implementation of this Simintas, the trend of decreasing number of non-conformity could also be caused by some factors. First, there has been an outreach activity of Simintas implementation. Based on the analysis and the results of quality audit findings in 2014, Pusmintas in early 2015 carried out guidance activities for the Regional Offices that need the activities. The guidance activities were done by lead auditor or internal auditor regarded to have competency to help the Regional Offices to implement Simintas UT. Guidance activities were done by looking at the aspect of priorities due to limited budget. Only the Regional Offices that were really in need that were guided.
5.2 Analysis and Discussion of Quality Audit based on Quality Areas As has been discussed in the previous section, the analysis and discussion by the areas of quality will focus on a number of the most crucial aspects for UT, namely registration services, learner support services, exam administration, learning materials, and student services related to measurement of satisfaction and complaint management. 1. Registration Services
As has been previously reported, there were 42 non-conformities occurring in the area of registration in 2014. The non-conformities include the following three main things: a. The planning of Pendas registration which is not in line with the standard. b. Inspection of First Registration Documents does not refer to the procedure, guideline, and work
record. c. Data non-conformity of registered student number contained in the Sync Monitor with the
application at the Regional Offices. In addition, there is data non-conformity in the application at the Regional Offices with the query data for students receiving scholarships.
More detailed explanation related to the findings in 2014 has been discussed in the previous report. In this occasion, more comprehensive discussed will be done on the result of findings in 2015. In 2015, from 23 Regional Offices that have been audited and reported, there are eight non-conformities in the following matters. a. Data entry. Inaccuracy and no verification. Data entry of students as a frontline in the whole
process will be very influential on the quality of further services. If data entry of students is done properly, the subsequent processes like learner support services, examination, certification can be guaranteed to be problem-free; on the contrary, if there are mistakes in data entry during the registration process, it can be guaranteed that UT will not be able to provide optimal services to students. Inaccuracy in data entry has occurred in several Regional Offices due to non-implementation of quality manual (SOP and work instruction) by the staff in the field. One of the stages in Simintas that was not done related to this matter was verification of entry result by the staff in the quality area of registration.
b. Incomplete registration documents. Incomplete student registration documents, which should not be sent by the Regional Office to the Head Office, are sent by some Regional Offices without immediately completing the documents. One of the reasons why this thing occurred was increasing participation rate. As this quality was not implemented, some students did not get their score after taking the end-semester examinations.

333
c. No evaluation for effectiveness of registration process and management of problematic registration. There are still Regional Offices that do not carry out evaluation for effectiveness of registration as specified in the Simintas UT (JKOP AM01). At the end of the registration process, it is the responsibility of Registration Coordinator and Head of Regional Office to carry out the final phase of registration procedure, evaluation for effectiveness of registration process. In accordance with the quality criteria of Simintas UT, evaluation includes a number of cases and analyses, solution of problematic registration, schedule realization, and utility of resources.
d. The use of expired checklist form of registration of Pendas dan Non Pendas. Even though it is not a serious non-conformity, but the use of expired checklist form at the Regional Office should be avoided because it will result in incomplete registration requirements that was not required by the old form. This kind of non-conformity was found only in one Regional Office.
e. Non-existence of registration plan. A common problem occurs in the Regional Office is non-existence of registration plan. As a matter of fact, planning activity is a preliminary activity in quality requirement for registration procedure. Registration planning is an important activity under the coordination and responsibility of Registration and Exam Coordinator and Head of Regional Office. It is very important for a coordinator to make a plan based on the result of evaluation of registration in the previous semester. The planning includes prediction of student number, prediction of registration number, the need for human resources, updating the list of study group (Pokjar) and ensuring the batch code for each individual Pokjar.
f. Non-existence of report on first registration process activity and OSMB activity for semester the first semester of 2015. Registration report is the result of evaluation for effectiveness of registration process and management of problematic registration that should be done in accordance with the quality requirement. The report should be available in each semester even though it is in the form of minutes of meetings.
From several non-conformities described above, it can be concluded that the registration procedure at Regional Offices that have been specified in JKOP AM01 Simintas UT has not been done comprehensively and consistently in several Regional Offices. However, on the whole all Regional Offices are still committed to implement the registration activities by referring to the main reference.
2. Learner support services Non-conformity in the area of learner support services is the most prominent finding in 2015 compared to other areas of quality. Non-conformity was found, among others, in the preparation of tutorial plan, starting from the tutor screening, decision of tutorial location, tutor recruitment, tutor debriefing, and tutorial scheduling. In addition, understanding, commitment, and obedience of some tutors and/or instructors to regulations (procedure, work guideline, and record) that have been specified in the JKOP BB03 are still low. Then, weakness in managing learner support services either in terms of coordination of face-to-face tutorial activities or implementation of tutor evaluation, validation of assignment score, and follow-up of face-to-face tutorial implementation is the main issue found in the same year. On the whole, there are 147 findings of non-conformity occurring in the area of learner support services. Some 118 findings of non-conformity are found in 23 Regional Offices that at the time were preparing for recertification of ISO 9001:2008. Even though in the first semester of 2015 quality audit to all Regional Offices has not been done, from the data obtained in the first semester of 2015 it can be concluded that in general the quality area of learner support services is still the most critical area compared to other areas of quality. The 108 findings of non-conformity in 23 Regional Office is a fact that should get more serious attention. The number of non-conformity may still increase along with the audit process to be done in the Regional Offices in the second semester of 2015. The findings of non-conformity in the first semester 2015 in the area of learner support services are found in several aspects of services. a. Tutor selection, practical work, and examination of practical report were not in line with the
requirements (education background, for example, a tutor with education background in history was tutoring the subject of Computer and Learning Media, or a tutor with education background of social sciences was tutoring the subject of Art Development Methods). It was also found that the letter of assignment was different from the proposal to be a tutor. Personal data of the tutor in the application were not valid compared to the available supporting documents.

334
b. The schedule of tutorial was not distributed to the students and tutors so they did not know when the tutorial begins. The schedule was not disseminated to related parties such as students, tutors, group of students at the learning centers (Pokjar) management in some Regional Offices. It affected the quality of tutorial services for students and the tutors could not do their job properly.
c. Tutorial plan was not done properly. According to the requirements for Simintas UT, planning is one of the most important phases in each related unit, especially the Regional Office. The tutorial planning includes schedule, the need of tutors and tutorial rooms, estimated tutorial cost, number of learning materials to be distributed, and assignment of regional management. In some Regional Offices, planning was not properly done so it could not be predicted how many tutors and supervisors were needed. Consequently, tutorial services were not well-planned and tutor replacement occurred without any control.
d. Tutorial location. There were not written permissions for some tutorial locations. The quality requirements for tutorial location have been specified in Simintas UT JKOP BB02 (Procedure for Selection and Evaluation of Tutorial Location). In the quality requirements, a letter to borrow a location is a recorded requirement that should be available at the Regional Office. However, in some Regional Offices, this quality requirement is not met according to standard. However, learner support services in the locations are in progress as usual. It was made possible because the tutorial activities in the locations had been done for some time and they are done in collaboration between the Regional Office and learning centers.
e. The RAT and SAT developed by tutors were not validated, so the RAT and SAT did not meet the UT’s quality criteria (for example, the tutorial sessions vary from 60 minutes, 100 minutes, and 150 minutes, and assignments are given for 120 minutes, SAT 3, 5, and 7 were not made). RAT and SAT used various format and were not validated.
f. Tutorial was implemented not in accordance with the SAT, especially with regard to media (it was stated in the SAT that LCD would be used) but in reality, the tutor only used laptop and gave a lecture. This non-conformity was found in the Regional Office of Purwokerto. One of the problems found in all Regional Offices was related to the availability of media to support learning in the tutorial locations (learning center). Up to now, 2015.1, UT has not provided learning media (LCD) in tutorial locations. However, following the policy and budget allocation for LCD procurement in 2015, in the second semester of 2015, the same problem will not be found anymore.
g. The process of face-to-face tutorial was not under control (children might come and go in the tutorial room, students used cellular phone (HP) to communicate, students signed the attendance in one go, and tutors did not sign the attendance list). The constraints and challenges occurring the tutorial classes require the formulation of regulation for the activity. The regulation will be a reference in all locations to support successful learning.
h. Tutor evaluation was not done as it should be (no tutor evaluation by students, no tutor evaluation by the RO, evaluation by students was not analyzed nor followed-up). The result of tutor evaluation was not used for deciding (tutors with poor evaluation result were still assigned for the next tutorial). Tutor evaluation was not done comprehensively (some evaluation forms were left blank but was recapitulated) so the result was not optimal.
i. Validation of tutorial assignment score was not done (students did not attend tutorial sessions but they got tutorial score), mistakes in score entry, disobedience to minimum attendance to get tutorial score. Tutorial score was validated before entry but the result was not used as the basis for score entry. Tutorial assignment score was not found while students attended the tutorial session fully. Validation of score entry was not done.
j. Tutor attendance varied (did not come once, did not come three times, or did not come from the first meeting to the seventh meeting, and late attendance). Substitute tutor never attended training or debriefing. Tutor replacement was not accompanied by a report as specified.
k. Student attendance. The students had signed the attendance list while the tutorial had not started (for example tutorial was done on 12 April while the list was signed on 11 April). In addition, the same incident also occurred in another place where the attendance list for the eighth meeting was signed in the seventh meeting. This non-conformity was clearly contrary to Simintas UT. These findings indicate that UT cannot control tutorial services at Pokjar because the supporting documents needed for evaluation and decision making are not the same as the reality.
l. The use of tutorial record such as list of attendance which was not used as specified in Simintas BB03 RK05. Record of attendance is the physical proof to be used as a source of information about tutor attendance. In some Regional Offices, some tutors did not signed the list of

335
attendance. The list of attendance should be signed by tutors as the basis for payment of fee at the Regional Office.
m. Tutorial monitoring was done properly but the results of monitoring in 2014.2 and 2015.1 have not been analyzed nor followed-up. With regard to monitoring of tutorial implementation, it was found that in some Regional Offices the results of monitoring were not analyzed nor followed-up for sustainable improvement of services. Therefore, monitoring activities did not give positive impact on the quality of tutorial implementation in the next semester because the planning was not done on the basis of tutorial monitoring/evaluation in the previous semester.
In the quality area of learner support services, it was also found some non-conformities in the implementation of Simintas for practical work, which in general can be explained as follow. Non-conformity in practical work management. a. Practical work plans for 2014.2 and 2015.1 were not made. Along with the policy adopted by
UT to implement Single School Fee (UKT) and with reference to quality guidelines, the management of practical work both for Pendas and Non Pendas programs should be controlled well under the coordination of Regional Offices. The controlling activity should start from planning up to evaluation. However, there were findings where the Regional Office did not make practical work plan. They prepared the data of students taking the subjects with practical work but did not prepare supervisors/instructors needed for the work, and did not train them beforehand.
b. Practical work activities were not in control especially for non-Pendas program. There was no schedule for the implementation of all practical work for non-Pendas program. This non-conformity was due to non-existence of practical work plan for the on-going semester.
c. Selection of supervisors or instructors for practical work was not done according to regulation (the selection form was not filled up). In accordance with the requirements for quality, the selected instructors should fill up the selection form (BB01-RK01-RII.0) so that UT will have clear supporting documents about the process of quality assurance of all instructors working in the field. With these documents, both the Head Office and Regional Offices may monitor the implementation of Simintas UT. In addition, up to now there are still findings where the instructors do not have relevant education background.
d. Problematic examination and scoring of PKP (inaccuracy in scoring). In the Regional Office of Padang, there was a finding in the examination of PKP 2014.2 report where scoring was not done accurately. For example, 1) there was a discrepancy of more than 10% in the examination of PKP report, 2) the total score in the examination sheet was 81 while it should be 84.
e. The implementation PKP was not done according to standard of criteria, from the debriefing of supervisors, scoring of PKP improvement did not involve two scorers. Monitoring was done at a distance but there was not proof. PKP score was not validated, and there was no report on the implementation of PKP.
Based on the main weakness above and considering the strategic role of learner support services in the context of distance education, it is deemed necessary to make some improvement efforts in order to solve the problems. In addition, it is more important for UT to make special efforts in the form of preventive measures to prevent the same problem to occur the next semester. Suggestions and recommendations related to the effort to improve the quality of learner support services will be discussed in the next section of this report.
3. Learning Materials The number of findings in the quality area of learning materials in 2014 was 35. Off all audit findings in 37 Regional Offices in general it can be classified and concluded that the main weakness in the implementation of Simintas started from the packaging and storing of learning materials, monitoring of stock of learning materials including non-conformity of data of learning materials in storage, and no proof of receipt of learning materials by students. All non-conformities have been analyzed and followed-up in the form of correction and corrective action. Follow-up was done before the external audit was done. Then, from the result of quality audit in the first semester of 2015 in 10 Regional Offices, it is known that in the quality area of learning materials non-conformities were still to be found even though they were not so prominent in quantity and were only limited to minor non-conformities. But this may change following the completion of finding results processing and the subsequent audit in the
336
second semester. From 14 findings of minor non-conformities in the first semester, learning materials service can be classified into the following: a. Storage of learning materials. The learning materials were classified but they were not given
identity and status. Storage outside the building was mixed with 25 sacks of old catalogues. Storage in the inadequate storeroom was mixed with piles of boxes.
b. Learning materials logbook was not made consistently and accurately. The record of learning material stock was not accurate.
c. Receipt of learning materials by students. Students did not receive learning materials until the seventh meeting. The same finding was also found in different Regional Offices where the students received the learning materials after the third meeting. In addition, there was non-conformity between the number of modules received by the students and the number of modules in the package.
d. Record control. The receipt of learning materials by student was non-existence. It did not used the record as specified in the regulation (JKOP DS06).
e. Application of learning materials was not used. In Purwokerto, the application of learning materials was not used in accordance with the quality requirements. However, during the audit it was found out that one of the constraints in utilizing the application of learning materials was non-existence of data edit facilities.
4. Exam administration
Graphic 7 above illustrates that the crucial problem faced by UT in implementing Simintas is related to the administration of examinations. Poor exam administration is reflected in the big number of audit findings, 52 non-conformities in 37 Regional Offices. Judging from the types of the problem, the audit findings in the quality area of exam administration in 2014 can be classified as follow. a. Weakness in the preparation for examination especially the one related to ineffective debriefing
for the Person-in-Charge of Exam Location (PJLU) and Person-in-Charge of Exam Site (PLTU). In addition, the debriefing for invigilators did not fully refer to the materials of debriefing that had been prepared by the Regional Office.
b. Weaknesses during the implementation of examination varied as reflected in disobedience of exam committee and ignorance of violation committed by students. An example of common violation made by students was the use of HP during the exam and cheating (open the module and looking at other participant’s work). Meanwhile, disobedience to Simintas regulations by the exam committee was reflected in the finding where the invigilators were falling asleep or smoking while on duty, and they did check the identity of test participants.
c. Weakness after the implementation of examination can be seen from the mistakes made by some Regional Offices that did not send the evaluation of end-semester exam implementation to the Vice Rector III and evaluation of performance of invigilators in the previous semester that was not followed-up by quality improvement of exam implementation in the on-going semester.
All findings of non-conformity in 2014 have been followed-up by each Regional Office. Just like other areas of quality, the non-conformity in this area was follow-up in the form of improvement and prevention activities.
5. Student Service The quality area of student service and a strategic area to be improved from time to time. Improvement of quality of student service is expected to help successful student’s studies which in turn will improve UT’s image as an education institution prioritizing on student’s interests. Of all findings of internal audit in 2014 (34 findings) about student service, it is known that the main problem faced in the implementation of Simintas UT is related to commitment and seriousness of the Regional Offices to process and follow up the result of survey of student’s satisfaction. In addition, the findings also show that student’s complaints have been recapitulated was were not analyzed for the purpose of quality improvement. In the first semester of 2015, there were still 6 findings of minor non-conformity in 23 Regional Offices that have been audited. However, this is very important because it is directly related to the interest of students as the main clients of UT. Six findings of non-conformity can be classified as follow. a. Measurement of client’s satisfaction in 2014.2 has been done and processed as specified, but
there is no proof that the data have been analyzed and a report is made to improve the quality

337
of service. The period of 2014.2 was the period of transition where the instrument of student’s satisfaction measurement is being revised by the Head Office and PAU-LPPM UT. However, some Regional Offices still carry out measurement using old instrument. Therefore, during that period the measurement of student satisfaction did not run consistently in all Regional Offices because the Offices are not required to do the activity.
b. Student Complaints. The proof of client’s compliant cannot be produced. The management of student’s complaints is one of the aspects specified in Simintas UT. Each complaint made by students is recorded and followed-up by relevant parties. In addition, there is a finding that management of student’s complaints has been done properly, but there are complaints that the Regional Office failed to deal with and they had been sent to the Head Office, but there is no solution yet.
c. Analysis of client’s complaints. In the requirements of Simintas UT, all student’s complaints must be recapitulated, processed, analyzed and followed-up. From the result of audit, it was found that student’s complaints in the period of 2014.2 had not been analyzed up to the end of first semester of 2015. However, in other Regional Offices, there were student’s complaints that had been recapitulated but had not been analyzed. Meanwhile, student’s complaints in the first semester of 2015 had not been recapitulated. The complaints should have been recapitulated at the end of June 2015.
Since 2015, UT has changed it policy related to the management of student’s satisfaction measurement. The measurement of student’s satisfaction was previously decentralized in each Regional Office. In 2015, the measurement of student’s satisfaction was centralized but its implementation still involved the Regional Office. At the moment, the measurement of student’s satisfaction is under the responsibility of the Center for Research and Community Service (LPPM). Therefore, activities related to collection, processing and analysis of data and reporting related to the result of measurement of student’s satisfaction is under the coordination of this center. The result is reported during the RTM and distributed to relevant units especially the relevant Regional Offices as a reference for improvement of service quality.
6 CONCLUSIONS Analysis and exposure of findings of quality audit, and recommendations that have been discussed above may provide a general description about the advantages in implementing internal audit programs for continuous improvement. Internal audit programs may help the university in identifying problems and difficulties in implementing quality programs. The findings of major and minor non-conformities in different regional offices should be regarded as feedback for management about how policies, procedures, and work guidelines of Simintas UT did not work well in several regional offices with different social and cultural settings. Responding to a number of findings, as well as the result of analysis and discussion presented at the outset, it seems necessary for the university to examine the implementation of quality program in different quality areas. Learning Materials and Learner Support Services 1. Optimalization of Role and Functions of Learner Sup port Center. The results of analysis of
findings of quality audits clearly show that the quality area of learner support service was the most problematic area from year to year. The problems found in the field varied in terms of number, type, and weight. Considering the root of the problem as presented by the auditee and in order to prevent the problem from happening again in the future, the operational related to learner support services should be coordinated more comprehensively under one roof, namely Learning Support Center (PBB). The policies of learner support services from the Rectorate contained in Simintas UT 2012 whose operational so far is done in other units like PAU or Faculties in the future should be shifted to PBB. PBB is the right place to deal with the problems related to learner support services. The role and functions of this center should be expanded to coordinate each aspect of learner support services, such as screening and recruitment of facilitators (tutors, instructors, supervisors, counselors, and other academic staff). Activities of training and debriefing which was so far under the control of PAU

338
in the future should be coordinated under PBB. The capacity of PAU and Faculties and other relevant units is the source of information. PBB should also formulate and make efforts and new ways to improve the quality of services to students, starting from their first entrance, during study, and before the exam. The database of tutors should be coordinated by the PBB, not Faculties, including maintenance of tutor database. In order to improve the quality of tutors, PBB in the future should be a unit to coordinate the development of handbook of tutor which is now being developed under the coordination of Vice Rector III. In doing its function as a learning center, PBB-UT should clearly define the tasks, rights and responsibilities of tutors. To be an effective tutor, this center should ensure that each tutor understands the vision and missions of UT as well as 5 main values that support all aspects of UT existence that has been mentioned in UT quality policy. This center has an important role in training tutors to improve student’s independent learning, to train them to have the capacity to access digital library, develop professional network, and improve their repertoire of tutorial basic capacity. This center may arrange and provide an opportunity for tutors to attend professional development workshops managed by UT. In addition, PBB can also have an important role to make sure that tutors have clear understanding about all forms of unethical issues such as being late, non-attendance, dishonesty, confidentiality and intellectual property right, taking money for donation and the like that can be taken as a serious violation with sanction to be imposed by UT management or other relevant solutions.
2. Training or internship for new Heads of Regional Of fice . As has been mentioned in the previous recommendations, weaknesses in management of learner support services were due to inconsistency of the parties involved in the implementation of Simintas UT. The inconsistency was the result of negligence and ignorance of staff about the procedure and Simintas UT on the whole. Following the dynamics occurring in each Regional Office, such as change of officials and/or rotation of staff without adequate transfer of knowledge, it has become a serious problem affected the implementation of Simintas UT. Responding to the condition, efforts to guide, outreach and disseminate information should continue to make from one unit to another and from one Regional Office to another by taking into account the priority. It is expected that through the efforts awareness and understanding of staff about the procedure, work guideline and work record as well as Simintas UT on the whole will be better.
3. Optimalization of training and debriefing of tutors . Considering the non-conformity related to tutorial, especially the commitment of tutors to quality requirements of Simintas UT, such as non-attendance, no record of meetings, unobjective participation scoring, no RAT nor SAT and RAT and SAT are not validated, no understanding about time allocation of tutorial meetings and tutorial assignment, have affected significantly tutorial services at the Regional Office. Therefore, the policy related to the implementation of tutor debriefing has become very important in each semester to continue to implement for all tutors who will be assigned in the on-going semester. In the debriefing activity, the instructors should really have adequate capacity and understand the most recent regulation about quality requirement of Simintas UT.
4. Provision of various modes of learner support servi ces . Student’s index of achievement at the
RTM in the Regional Office of Surabaya has become a strategic issue widely discussed following UT’s effort to improve student’s learning ability. The index of achievement is also very important because it is related to national issue that becomes a serious problem for some UT students who are looking for a job. Even though the minimum IPK of 2.75 is not student’s need but it cannot be denied that some graduates have interest in this issue.
As has been discussed in the recommendations in 2014, UT should initiate new policies related to both academic and non-academic student service. Learner support services that try to set up independence and distance learning ability have become very strategic to reduce student’s dependence on tutors and to improve effectiveness of student learning. Therefore, OSMB activity should continue with the next learner support activities. • Organizing similar activities like workshop of learning skills for new students. Research in a
number of distance education institutions in other countries proves that the first semesters are the most critical period with high attrition rate. Therefore, various learner support services and other support services should be provided to new students. Workshop of learning skills is the best forum to be implemented after the OSMB. The activity can be designed for 1 or 2 days

339
which contain provision of various skills such as computer literacy, navigation in the cyber world, improving speed reading skills, and access to various learner support services provided by UT.
• Workshop on doing subject assignments. Doing tutorial assignments either through face-to-face tutorial or online tutorial or paper writing in the Master’s program requires serious guidance. Students should be taught and trained so that they will have the capacity to complete their tutorial assignments properly and correctly. With knowledge and skills to do assignments, it is expected that the quality of learning during their course of study at UT will be more meaningful and supports their studies and their future.
• Implementing examination clinic or other efforts for new students or old students who failed several times in the end-semester exams. The policy related to the type of learner support services is very important for students following the application of 30% cutting point (cut off) of end-semester exam score in 2014. The application of 30% cut off should go with renewal of learner support policy that give an opportunity to students so they may improve their independent learning ability especially their preparation to take examinations. This kind of activity is very important especially for those who have failed twice or more. Students who will do final assignment are possible to train in the workshop to answer final assignments under guidance and service of UT so they will be successful in the exam.
5. Development of Distance Learning Subjects . The next effort to improve student learning ability that may improve student’s index of achievement is through development of “Distance Learning” subject or “Distance Learning Skills” or other names that constitute the characteristics of UT curriculum. These subjects are presented in the curriculum in the first semester with certain credit weight or non-credit. These subjects are important for students and UT in order to face student unreadiness to follow distance education system. These subjects should be complemented with feedback from users especially students and also other facilitators such as tutors. Revision is done regularly adjusting to inputs and new development.
REFERENCES Bogue, E. G. (1998). Quality assurance in higher education: The evolution of systems and design ideals.
In G. H. Gaither (Ed.), Quality assurance in higher education: An international perspective, (pp. 7-18). San Francisco: Jossey-Bass Publishers.
Chalmers, D. & Johnston, S. (2012). Quality assurance and accreditation in higher education. In I. S. Jung & C. Latchem (Eds.), Quality assurance and accreditation in distance education and e-learning: Models, policies, and research, (pp. 1-12). New York: Routledge.
Chapman, D.W. & Carrier, C.A. (1990). Improving educational quality: A global perspective. Westport, Connecticut: Greenwood Press.
COL (2009). Quality assurance toolkit for distance higher education institutions and programmes. Vancouver, BC: The Commonwealth of Learning.
Darojat, O., Nilson, M., & Kaufman, D. (2015), Perspectives on quality and quality assurance in leaner support areas at three Southeast Asian open universities. Distance Education. 36(3), 383-399. DOI: 10.1080/01587919.2015.1081734 Retrieved from http://www.tandfonline.com/eprint/cU6ucI8sreHKhZpcBhjB/full
Harvey, L. & Green, D. (1993). Defining quality. Assessment and Evaluation in Higher Education, 18(1), 9-34.
Jung, I. S. (2004). Quality assurance systems in mega-universities and selected distance teaching institutions. A paper presented at the Second Global Forum on International Quality Assurance, Accreditation and the Recognition of Qualifications for Widening Access to Quality Higher Education, UNESCO, Paris, France, June 28-29, 2004. Retrieved July 26, 2011 from http://portal.unesco.org/education/en/ev.php-URLID=31915&URL_ DO=DOTOPIC &URLSECTION=201.html.

340
Jung, I. S. & Latchem, C. (2012). Preface. In I. S. Jung & C. Latchem (Eds.), Quality assurance and accreditation in distance education and e-learning: Models, policies, and research, (pp. xvii-xxi). New York: Routledge.
Maniku, A. A. (2008). Higher education quality assurance policy and practice in the Maldives: A case study from a small developing nation. Unpublished doctoral dissertation. New Zealand: Massey University.
Martin, M. & Stella, A. (2007). External quality assurance in higher education: Making choices. 7 place de Fontenoy, Paris: UNESCO.
Sallis, E. (2002). Total quality management in education. London: Kogan Page.
Shale, D. (2003). Performance indicators and quality assessment. In S. Panda (Ed.), Planning and management in distance education, (pp. 229-240). London: Kogan Page.
Stella, A. & Gnanam, A. (2004). Quality assurance in distance education: The challenges to be addressed. Higher education, 47, 143–160.

341
IMPLEMENTATION OF PROBLEM-BASED LEARNING METHOD IN LEARNING PROCESS OF URBAN PLANNING STUDIO IN URBAN
AND REGIONAL PLANNING STUDY PROGRAM
Tina Ratnawati 1, Vita Elysia 2 1Universitas Terbuka (INDONESIA) 2Universitas Terbuka (INDONESIA)
Abstract
The undergraduate program in Urban and Regional Planning of the Universitas Terbuka (UT) is the only planning school in open and distance learning education in Indonesia. This program is aimed at preparing students to be professional planners with emphasizes technical, strategic, and generic skills demanded of planners. To develop the atmosphere and academic interaction, learning activities in the course of Urban Planning Studio in this study program is not only the delivery of material from the tutor, but also developed the discussion and presentation activities in tutorial class, proposal presentation and final report through video conference, workshops in studios, research, or field research. Students are instilled with knowledge on principles of planning, problem-based learning, analytical and strategic thinking, as well as competency in urban and regional planning practices. The design of study based learning on the problem (problem based learning: PBL). PBL is an effective method to improve learning activities. The PBL model presents certain advantages with respect to improving student abilities in inactive learning, two-way communication, clinical thinking, and teamworking. The design of the lesson has been designed in the beginning when the studio course is offered. Practical work of studio contributes 60% and 40% of theoretical exams to the final score. Competencies of the studios are to formulate objectives, policies, and strategy planning area, to propose a spatial plan based on the results of data analysis in the planning area, to formulate spatial patterns of space, strategic areas, and the formulation of an indicative scale spatial planning program for regional scale, and to present the results of the spatial plan that has been prepared. The purpose of this paper is to illustrate the implementation of problem based learning method in supporting urban and regional planning studios viewed from those studio competencies and also quality of open and distance learning.
Keywords : studio, implementation, problem based learning method
1. INTRODUCTION 1.1. Background
The undergraduate program in Urban and Regional Planning of the Universitas Terbuka (UT) is the only planning school in open and distance learning education in Indonesia. This program is aimed at preparing students to be professional planners with emphasizes technical, strategic, and generic skills demanded of planners. Students are instilled with knowledge on principles of planning, problem-based learning, analytical and strategic thinking, as well as competency in urban and regional planning practices. It has been implemented through program offerings that include familiarity with the range of methods and techniques used by planners, studio projects, and courses in planning history and theory. Urban and Regional Planning Studio is the core teaching model of a planning school. There are three studios in total spread over three semesters which consist of Planning Process Studio, Urban Planning Studio, and Regional Planning studio.
The implementation of these studios in the Department Urban and Regional Planning of UT is facilitated with video conference-based blended learning in which participants and resource persons gather at one of the connected sites for most of the sessions. Through this several times of video conference, students present their report including their studio project plans, progress, and findings to be reviewed with some reviewers. The design of study based learning on the problem (problem based learning: PBL). PBL is an effective method to improve learning activities. The PBL model presents certain advantages with respect to improving student abilities in inactive learning, two-way communication, clinical thinking, and teamworking. The design of the lesson has been designed in the

342
beginning when the studio course is offered. Practical work of studio contributes 60% and 40% of theoretical exams to the final score.
Research on the application of PBL is mostly aimed at high school students. Most of the research is aimed at improving student learning outcomes. The purpose of this paper is to illustrate the implementation of problem based learning method in supporting urban and regional planning studios viewed from those studio competencies and also quality of open and distance learning. This paper is the result of surveys and observations conducted to the students of urban and regional planning study program who take the courses at UT regional offices in Jakarta, Bandung, Serang, Manado, Padang, Pangkalpinang, and Purwokerto. 1.2. Issue Formulation
From the above ideas, it can be said that problem based learning strategy can be a bridge to the achievement of some of the competencies or capabilities associated with studio courses on the Urban and Regional Planning Study Program in Open and Distance Education. 1.3. Objectives and Benefits 1.3.1. Purpose of the paper
The purpose of this paper is to illustrate the implementation of problem based learning method in supporting urban and regional planning studios viewed from those studio competencies and also quality of open and distance learning.
1.3.2. Benefits
This paper is expected to bring benefits, especially for faculty and study program manager for the undergraduate program in Urban and Regional Planning 2. THEORETICAL BASIS 2.1 Problem Based Learning (PBL) and Implementation of Problem-Based
Learning Method in Learning Process of Urban Planni ng Studio
PBL is one learning model that can help students to improve the skills needed in the era of globalization such as current conditions. PBL was first developed by Howard Barrows, in 19701n. This model is a model that can present a problem for students as the beginning of learning which is then resolved through investigation and applied using a problem-solving approach. The PBL model is characterized by the use of real-life problems as something students have to learn. With the PBL model it is expected that students get more skills than knowledge memorized. Starting from problem-solving skills, critical thinking skills, team work skills, interpersonal and communication skills, and information .search and information processing
The implementation of problrm based learning method give many advantagescompared to other learning models, among them as follows. • Troubleshooting is a pretty good technique for understanding the subject matter. • Problem solving can challenge students' abilities and provide satisfaction to discover new
knowledge for students. • Problem solving can improve student learning activities • Problem solving can help students how to stimulate their knowledge to understand real-life
problems. • Problem solving can help students to develop new knowledge and be responsible in their learning. • Through problem solving can show students that every subject (mathematics, science, history,
etc.), is basically a way of thinking, and something that must be understood by students, not just learning from teachers or from books alone .
• Problem solving is considered more enjoyable and liked by students • Problem solving can develop students' ability to think critically and develop their ability to adapt to
new knowledge

343
• Problem solving can give students an opportunity to apply the knowledge they have in the real world.
• Problem solving can develop students' interest to continually learn even when learning on formal education is over. .
2.2 Urban and Regional Planning Studios
At the undergraduate program in Urban and Regional Planning of the Universitas Terbuka (UT), there are three studio courses given in semester IV to VI namely Planning Process Studio, Urban Planning Studio, and Regional Planning Studio. Similar courses are arranged studios with professional practice so that the students are familiar with the systems used in the world of work. By providing this problem in any design task, students are expected to have sensitivity to see, assess, and provide solutions to these problems. To sharpen the students' ability to respond to the real conditions on the ground, then a case study in a given contextual design studio (footprint, regulatory, social and cultural conditions). The standard depiction and presentations on subject studio also follow the standards that apply to the professional world. • Studio is a subject that is based on problem - based learning which demands the ability of
participants to be able to work in teams, play an active role in expressing opinions and arguments to consider feedback from supervisors and assistants.
• Studio is the primary means to provide practical experience in the process of forming a plan through the cultivation of the cases in the field of real planning.
• In the studio students practice to conduct interdisciplinary cooperation that is essential in any planning process
• Studio is an initial understanding of urban and regional planning process both views in total or in detail in each stage as well as data collection and management training / information so that students are able to do well as one of the important stages in the planning process.
2.3 Competencies of Studios
Basically, main competencies of the studios are to formulate objectives, policies, and strategy planning area, to propose a spatial plan based on the results of data analysis in the planning area, to formulate spatial patterns of space, strategic areas, and the formulation of an indicative scale spatial planning program for regional scale, and to present the results of the spatial plan that has been prepared. The discussion covers the basic understanding relating to the planning and arrangement of space; the nature and characteristics of the planning process in total; defining the problem; formulation of goals and objectives; collection and management of data / information; basic data analysis and forecast tendencies; alternative development plans; implementation of the plan; monitoring plan; and evaluation of the implementation of the plan. That difference is the level of depth discussions and outputs issued.
Based on the above view, Studio Planning Process developed into a practical activities for learning in the educational process of urban and regional planning, to one of the crucial competencies in planning activities. Main competence of the Planning Process Studio is the preparation of planning activities (plan for planning), which is focused mainly to the introduction of the learning process to the planning area; the process of discovery, recognition and understanding of the potential and the problems that exist in the planning area; structuring potential and problems that have been formulated in order to be understood in a more comprehensive and contextual; and initial introduction to the ideas or notions of planning that may be performed in response to the problems and potentials that have been identified earlier. All activities are becoming an integral part in practical activities on this course, which was done as a preparation to the course Urban Planning Studio and Regional Planning Studio will be in use in subsequent semesters.
Urban Planning Studio aims at introducing to students urban planning as a complex system of techniques, practices, and knowledge to study and plan the city, as a result of one of the most intense human activities. Urban planning studio will focus on the different traditions of making cities and creating urban environments. The “designing of the city” is the core of the studies, analysis, and practices that the urban planning studio will propose to students, at least on five different aspects. Competencies expected after the student attends studio Urban Planning are able to carry out the process of urban planning; able to delineate urban areas; able to formulate objectives, policies and strategies of the planning area; able to develop spatial plan is based on the results of data analysis in the planning area; and able to present the results of spatial plan that has been prepared.
At the end of the course activities of Regional Planning Studio, students are able to design spatial planning district, provincial, or national levels, including the direction wisdom of region, structural zoning,

344
planning the utilization of protected areas and cultivation of environmentally friendly, plans hierarchical system of cities, planned system of regional transportation plan utility systems area, the development program, development priorities, institutional plans, and spatial control system.
2.4 The Implementation of Studios
Studio implemented for eight (8) weeks in accordance with the implementation of schemes to face-to-face tutorials at Universitas Terbuka, as in the following figure. Students have the opportunity to form a group, define the supervisor and assistant supervisor, define the topics 1-2 weeks prior to the tutorial to coordinate all. At week 2 or 3, the students presented a proposal via video conference facilitated by the Department or Study Program and UT Regional Office. This video conference activity aims to obtain feedback in order to refine the proposals of the student, supervisor and assistant supervisor, and assessor / reviewer from the study program. Then, the students are doing data collection. The data was collected at week 4, 5th, and 6th. Recording of field activities are important, the image regions after the field activities, structuring the priority issues, recommendations for further action, and the proposed solutions to problems is done at weeks 7 and 8. One day in week 8, the students present the results of the interim report from the field, with a view to obtain input in the preparation of the report, again via video conference facilitated by the Department or Study Program and UT Regional Office. The report was prepared after the completion of the tutorial (2 weeks prior to semester exam), and submitted two weeks after the semester exam. For the implementation of this studio students carry ± 14 weeks (2 weeks before the tutorial for the preparation, 8 weeks of implementation of the tutorial, and 2 weeks after the tutorial for completing the final report). Counseling is done all the time scheduled by the supervisor and assistant supervisor
Figure 1 . Scheme of studio
Lecture held in the form of delivery of material by tutors, preparation of tutorial assignments, assistance and consultancy reports, group presentations, class discussions, and video conference preparations in a format of class tutorials, round table discussion, and team working groups.
WE
EK
00
WE
EK
0
STUDENTS
- REGISTRATION - FORM A GROUP REGIONAL OFFICE
- RECRUITMENT STUDIO SUPERVISOR
- DEBRIEFING SUPERVISOR
DEPARTMENT
- PREPARATION FOR VICON PROPOSAL PRESENTATION AND REVIEW
WE
EK
1
STUDENTS
- Explanation of the
roadmap and the
formation of groups
- Understanding of
the framework
studio
- Determination of
the region Studies
REGIONAL OFFICE
- PROVIDE STUDIO
WE
EK
3
STUDENTS
- Vicon FOR PROPOSAL PRESENTATION
- IMPROVEMENT DISCUSSION FOR PROPOSAL
REGIONAL OFFICE
- PROVIDE STUDIO - PROVIDE VICON
FACILITATION DEPARTMENT
- PROVIDE REVIEWER
STUDENTS
- Discussion of
preliminary data
the study area
- Plan fieldwork
- Technical surveys
and field
observations
- Framework for field
activities
REGIONAL OFFICE
- PROVIDE STUDIO
WE
EK
4
STUDENTS
- DATA COLLECTION
REGIONAL OFFICE
- DEALING WITH
FIELD PERMISSION
WE
EK
8
STUDENTS
FINAL REPORT SUBMISSION REGIONAL OFFICE
WE
EK
7
STUDENTS
- Note the important field activities
- Overviews regions after the field activities
- Structuring the priority issues
- Follow-up Recommendations
- Proposed Solutions Problems
REGIONAL OFFICE
- PROVIDE STUDIO
WE
EK
6
STUDENTS
- Field Data
Processing
- Preparation of the
database as a first
step of data
processing
REGIONAL OFFICE
- PROVIDE STUDIO
STUDENTS
- VICON for
Presentation of
Draft Final report
- Discussion of
improvements draft
final report
REGIONAL OFFICE
- Remind tutor to collect students' scores
-
WE
EK
2
STUDENTS
- DATA COLLECTION
REGIONAL OFFICE
- DEALING WITH
FIELD PERMISSION
WE
EK
0

345
3. DISCUSSION
Problems that occur related to learning at this time especially Studio course leads us to a conclusion that it needs a renewal of learning strategies applied to students in order to meet the learning objectives that have been declared. PBL is considered appropriate to be applied in learning including in Studio courses. The implementation of the PBL in the studio course shows that PBL can empower the ability to think critically and students' attitudes toward the issues discussed in the course. This refers to the syntax developed by Mahanal (2009) strongly supports the empowerment of critical thinking. The PBL syntax is as follows.
3.1 Planning
In the implementation, the Studio covered courses cover project preparation and project planning, in the form of proposals. At this stage it exposes the students to real problems in the field, and encourages them to identify the problem which students then are asked to find alternative problem-solving and design problem solving models. 3.2 Creating
Namely the implementation of projects that provide the widest opportunity for students to design and conduct investigations and present reports (products) both orally and in writing; 3.3 Processing
Activities at this stage include project presentation and project evaluation. Project presentation is to communicate actual creations or findings from group investigations including reflection and follow-up of projects; Evaluation, done at this stage which includes peer evaluation, self-evaluation and portfolio. Referring to the PBL syntax, it can generally be communicated in problem based learning that students can actively learn to formulate problems, conduct investigations, analyze and interpret data, and make decisions to solve the problems it faces. In accordance with Thomas (2000), the PBL emphasizes complex tasks, based on challenging questions or problems, involving students in design, problem solving, decision-making or investigative activities.
The process in these studio courses is not just happening on the substance of the subject, but also proceeding in the cooperation between the teams. In planning such development plans and allocation of network support and infrastructure cannot be done individually, need suggestions and input from multiple parties so that in the preparation of differences of opinion. This course teaches how students should take into account the opinions of various parties to conform and fit then implemented on the territory of each study. Until the end goals, objectives and targets as well as the indicative program created to support programs in urban and regional planning in the study area.
Presentation proposals and reports through a video conference is a moment where students can show the group's work through a presentation in which they prepared a presentation through teamwork, discussion, representation election materials and presentation time available. Students’ presentations are moments of sharing personal ideas and achievements in learning urban planning techniques and notions. In presenting their proposal nor the report, students could argue about the plan and the results of its work on the course the studio, as well as to disseminate their ideas. It can be concluded that by doing video conferencing, students can arrange presentations, argueing, discussion, question and answer, and disseminate the results of its work plan and related subjects studio.
In other words, in addition to core competencies, by implementing problem based learning method, students are also expected to achieve the following supporting competence such as being able to take the initiative, being able to communicate ideas clearly and structured, able to display and present their ideas in an interesting, ability to design creative and innovative, and ability to work in a team capable of responsible choices.
Activities in the studio course have been described in the "Course Studio Manual" issued by the Urban and Regional Planning Study Program. This guide is a reference for students and tutors in the implementation of Studio courses.
Studio Courses in the Urban and Regional Planning Study Program is a course that aims to train students to be able to develop the concept and plan of development and management of a region and environment using real data. Studio course is a problem-based learning that demands the ability of participants to work in teams, play an active role in expressing opinions and arguments by considering

346
feedback from supervisors and assistant counselors. In the studio, students are trained to conduct interdisciplinary cooperation, which is essential in every environmental planning and management process. Each the Urban and Regional Planning Study Program student is required to attend studio activities. Activity of using problem based learning model in studio courses are as follows.
Figure 2 . Indicators of PBL implementation for Studio courses
Phase Indicator Tutor activities
1 Student orientation on problem
Describes learning objectives. Explain the sequence of learning, provide a frame of reference for work, and motivate students to engage in problem-solving activities
2 Organizing students to learn
Helping students define and organize learning tasks related to the frame of reference in the studio
3 Guiding experience individual / group
Encourage students to collect information / data in accordance with the content terms of reference that have been agreed upon, carry out data retrieval of both primary data and secondary data in the field to get explanation and problem solving
4 Compile, analyze, and presents the results of data retrieval in the field
Assist students in Plan and arrange, analyze, and Present the results of data retrieval in the appropriate field such as reports, and help them to share tasks with their groups
5 Analyze and evaluate the problem-solving process
Help students to do Reflection or evaluation of their activities and the processes they use.
6 Guiding experience individual / group Encourage students to collect appropriate information, carry out experiments to get explanations and troubleshooting. Guiding students to present the results of their activities by reporting, presenting in video conferencing using powerpoinbt presentation
Studio is a form of learning activity which aims to understand data and information gathering
techniques for regional and city planning, able to arrange survey program and implement it, and able to prepare ready-made survey report for the interest of the next stage of planning process, so as to obtain the ability to arrange Strategies and plans in an integrated manner. To achieve these objectives, steps must be taken to collect data, analyze, develop development plans, conduct dialogue and discussions, and solve problems with stakeholders in the field that pay attention to environmental carrying capacity. Thus, the studio is the primary means to provide practical experience in the process of forming the plan through the realization of cases of environmental planning and management in the field.
The role of tutors in the implementation of PBL model is as follows. 3.2.1 Setting up student thinking tools
Setting up student thinking tools aims to make students truly ready to follow the learning model of PBL. Like, help students change their thinking, prepare students for updates and difficulties that will confront, help students feel they have problems, and communicate goals, results, and expectations.

347
3.2.2 Emphasizes cooperative learning
In the process, the PBL model takes the form of collaborative inquiry and learning. As Bray explains, et al (in Rusman, 2010: 235) collaborative inquiry as a process in which people reflect and repeat activities, they work in teams to answer important questions. So students can understand that working in teams is important to develop cognitive processes.
3.2.3 Facilitating small group learning in PBL models
Learning in the form of groups is easier to do, because with a smaller number of group members will be easier control it. So the tutor can use various cooperative learning techniques to combine these groups to unite ideas. 3.2.4 Implementing PBL
In practice tutors should be able to organize a learning environment that encourages and engages students in problems. In addition, the tutor also acts as a facilitator in the process of collaborative inquiry and student learning.
Studio subjects are characterized by the use of real problems as something students should learn
in the area and city planning. With the PBL model students are expected to gain more skills than the knowledge read from textbooks alone. From problem-solving skills, critical thinking skills, team work skills, interpersonal and communication skills, information search and information processing skills, and the ability to present both information in the form of reports and presentation materials.
4 CONCLUSION
From the above ideas it can be said that implementing problem based learning method can be a bridge to the achievement of some of the competencies or capabilities associated with studio courses on the Urban and Regional Planning Study Program in Open and Distance Education, by implementing problem based learning method students are also expected to achieve the following supporting competence such as being able to take the initiative, able to communicate ideas clearly and structured, able to display and present their ideas in an interesting, ability to design creative and innovative, and ability to work in a team capable of responsible choices.
REFERENCES
M. Taufiq Amir (2009). Inovasi Pendidikan Melalui Problem Based Learning. Jakarta: Media Group Program Studi S1 Perencanaan Wilayah Dan Kota (2014). Pedoman Penyelenggaraan Studio.
Universitas Terbuka Rusman. (2010). Model-model Pembelajaran. Bandung: PT. Rajagrafindo Persada. Trianto. (2007). Model-model Pembelajaran Inovatif Berorientasi Konstrutivistik. Jakarta: Prestasi
Pustaka Wina Sanjaya. (2008). Strategi Pembelajaran Berorientasi Standar Proses Pendidikan. Jakarta:
Prenada Media Group

348
The Effect of Students' Learning Independence and C ognitive Learning Style on Atomic Physics PEFI4421 Learning Achievement
Prayekti
Universitas Terbuka (INDONESIA)
Abstract
In this study, the researcher explored the contributions of independence in learning and cognitive learning style towards students' learning achievement on Atomic Physics course PEFI4421 in semester 1, 2017 academic year. This study employed a double linear regression analysis. The analysis measured influences of a free variable on a bound variable. The measurement of this influence included one free variable (X) and one bound variable (Y), called the simple linear regression analysis with the following formula Y = a+bX. In this study, this formula was used for measuring the contribution of two free variables on one bound variable. Sample of this study were the students that already passed the Atomic Physics course in Open University Indonesia under 2016 (2 semesters) and 2017 (1 semester) academic year with an underlying assumption that the students were homogenous since they all had completed the course in a considerably recent time period. The results of this study showed that (1) not all of the students of Physics Education had the learning materials of Atomic Physics; (2) the students who dominantly had a field independent cognitive learning style and learning independence achieved maximum learning achievements of Atomic Physics; and (3) the students' graduation year did not determine the influence of the cognitive learning style and learning independence since their graduation years were still considered to be recent. Keywords: cognitive learning style, independence, learning achievement, Atomic Physics 1 INTRODUCTION
The learning independence of Open University students in Indonesia is highly influenced by their surroundings, both internally and externally. Learning achievement is characterized by three main points, namely purpose determination, strategic selection, and cognitive as well as affective observation during an academic task completion. As the students of Atomic Physics with distance learning education system, they are required to learn independently all learning materials provided by the university. Open University, in its capacity of serving the students, has provided supporting facilities and accessible materials. One of these is an access to student learning support in order that the students can prepare their study well and graduate with satisfying results. The learning support that is provided by the university covers online learning support and tutorial. Online tutorial can be accessed by the students once they completed the registration process. However, not all of the students are able to do this because of several reasons. One of the many reasons is the unequal connection to the internet access throughout the country and the students have unequal skills and capabilities to access the programs which are internet-based. Therefore, there are still many students who use hard-copy learning materials such as textbooks as the only resource of learning. Every student of Open University has different motivation and characters; this also applies to their willingness and ability to study. Each student also has different levels of cognitive learning styles and independence in learning. There are students who can learn independently and do not need to have any peer discussion with their classmates and there are those who rely heavily on group discussions and interactions with their classmates to solve the difficulties in their learning. This taps into the area of cognition. Cognition is considered to be a gift that is given since the individual was born. It is naturally gifted by GOD and cannot be altered but can be influenced by the surrounding. The existing cognition is classified into two, namely independent and dependent cognition, of which one student can only have one of them and not both of them. Besides, different students also mean different levels of learning independence, which affects the time when the students continue learning and when they decide to stop their learning. This factor relies

349
heavily on the students themselves and the underlying motivation that they have and cannot be determined by other people. Others can only provide suggestions and motivating statements in such a way that the students can learn independently. Therefore, in this study, the researcher wants to explore and identify further the effect of the students' learning independence and the influence of cognitive learning style of the students towards their achievements especially on Atomic Physics course. With this regards, the purpose of this research is to identify the effect of the Open University students' learning independence and cognitive learning style on their learning achievements in Atomic Physics PEFI4421. 2 LITERATURE REVIEW
2.1 Cognitive Learning Style Students of Open University Indonesia are considered to have a high spirit to learn, they are required to be ready to learn independently by themselves or with peers using the learning materials provided on the student portal website related to their subject of study. Students as individuals have different characters and unique individual features one another. One of the things that determine their characters is cognition. In this regard, cognitive learning is a unique way that the students have to study either receiving or processing new information that they get as well as acting in accordance with the information and behaving in accordance with the learning environment that they encounter (James W. Keefe, 1987: 3-4) Cognitive learning style is categorized into two majors, namely independent cognition (FI) and dependent cognition (FD), and these two types are performed and able to be identified during the teaching and learning process of Physics in a classroom. In general, the students' levels of acceptance in learning Physics sometimes they can directly understand the materials after the lecturer explains to them while some of them have to work together with their peers and discuss the subject materials to understand the topics. Thus, the lecturer needs to understand his students and, especially in the face-to-face classroom setting, is required to provide options for learning strategies to develop by the students and various kinds of methods that suit the topics of the course. Cognitive learning style is one variable of learning that becomes one important consideration in constructing a lesson plan. Knowledge about cognitive learning style is needed to plan or modify learning materials, learning outcomes, and learning methods. It is expected that the presence of interactions resulting from a high level of cognitive learning factor all the purposes, materials, and methods may boost the students' learning achievements to its maximum. This complies with some experts' belief that implies that certain learning strategies require certain learning styles. In particular, cognitive learning style reflects one's behavior in dealing with information processing. Keefe (1987) further describes that cognitive learning style is one type of learning style that represents someone's behavior to act on things which is relatively constant in receiving, thinking, and solving issues as well as saving information. Cognitive style refers to individual's characteristic in thinking, feeling, memorizing, solving problems, and making decisions. Information that is neatly and systematically arranged is easily received by certain individuals. Meanwhile, other individuals may perceive that the information which is easy to receive is that which is not quite neatly and systematically arranged. As one type of behavioral characteristic, cognitive style is put under the track of ability and personality and manifested to supporting activities and media. Cognitive style reflects the existence of variations between individuals in their approach to a certain task, yet this variation does not necessarily represent the individuals' intelligence rate or ability. In this stance, two individuals that have a similar cognitive learning style characteristic do not mean that they also share a similar ability. Moreover, individuals that have different styles of cognitive learning tend to have much different levels of ability. Every individual has a different style in processing information, and cognitive style is an individual step in processing information through responsive strategies towards the task assigned to them. Furthermore, Woolfolk (1993) shows that in a cognitive learning style there is an indication of differences in perceiving, addressing, and organizing information. Every individual will choose one way that they like in processing and organizing in response to the stimulation provided by the society. There are individuals that are fast-respond and those that are slow-respond. These ways of responding are also related to the personal behavior and quality, and this cognitive style is an indicator of individual variations in terms of attention, information acceptance, memory, and thought that occur and different in terms of cognition and personality (Woolfolk, 1993: 128). Then, cognitive style is a pattern shaped

350
through individual information processing which is likely to be stable with a possibility to change. In general, cognitive learning style is achieved and shaped over a long period of time and considered to be in a continuum. Woolfolk (1993) further explains that there are various types of cognitive learning styles that attract the interest of educators and they are understood in dimensions; psychologically they are divided into field independence (FI) and field dependence (FD). Meanwhile, Keefe (1987: 3-4) has quite a different perspective regarding the dimensions of cognition. It is stated that cognition is divided into two styles, one of them is a style in receiving information (reception style) and the other is a style in forming concept and retention (concept forming and retention style). The style in receiving information is more related to the reception and data analysis, while the style in forming concept and retention is more related to hypothesis construction, problem solving, and memory process. Keefe also adds that cognitive style is a part of learning style, and learning style is related to (but different from) intellectual ability. There is a difference between ability and style for ability refers to the content of cognition that differentiates the kinds of information to be processed, how to process, and in what form. On the other hand, style refers to the cognitive process which states that the content of information is to be processed. The position of cognitive style in a learning process cannot be neglected. This is in line with the perspective of Reigeluth (1993) that in teaching variables, cognitive style is one of the student characteristics which are included in the learning condition variable besides other student characteristics such as motivation, attitude, talent, interest, thinking skill, and others. As one student characteristic, the position of cognitive style in the learning process is very important to be noticed by the teacher or education manager, since a lesson plan which is designed by considering the cognitive style factor means that the lesson employs learning materials that are suitable with the student characteristics and potentials. With this well-designed planning, a suitable learning situation will be well-created since the lesson will not be perceived to be intervening student's rights. Besides, learning is adjusted with the cognition process or student cognitive development. The activation of cognitive process is closely related with the characteristics of student cognitive process. Through this, in attempt to improving the student cognitive process, there is a need of attention on the characteristics of each individual student. In a lesson plan organization using elaboration model and text book organization, before the planning process the teacher needs to have characteristics mapping analysis on all of the students, which is mainly directed towards the identification of their cognitive style. With this cognitive style analysis, the teacher or education manager can identify the cognitive style of the students. The role of cognitive style in the learning process by referring to the experts' opinions and perspectives on the dimensions of cognitive style according to Woolfolk (1993) in regard to its implementation in the learning process highly contributes to the learning success. A student who has a field dependence (FD) cognitive style leads to a global perception and perceives a burdening effort in processing information, and this can be overcome through putting the information into its related contexts. Another student who has a psychological difference field independence (FI) leads to a fact that articulation will analytically perceive information through separating the stimuli from its context, but his perception will be weaker when there is an alteration in the contexts. However, a psychological difference can be fixed through various situation exposures. Individuals of FI usually employ internal factors as a direction to process information. They complete tasks not in a sequential procedure and work more efficiently by themselves than in groups. Based on the above explanations about cognitive style, it can be concluded that cognitive style can be viewed as one variable in learning. In this case, its position represents the variables of student characteristics and its existence is internal. This means that cognitive style is one capability of someone who is developing along with its intellectual development. For students, cognitive style is considered to be given and influential to their learning achievements. In this respect, students who have a certain type of cognitive style need a certain type of learning strategy as well in order to obtain maximum learning results. 2.2 Learning Independence In the Dictionary of Indonesian (KBBI), the word "independent (Adj.)" (mandiri) refers to a state of being able to stand alone; not relying on others, while the word "independence (N)" is a thing that represents someone's condition of being able to stand alone and not relying on others. The definition of "independent" can also mean the attitude of not relying oneself to other's decision, and the definition of

351
"independence" can also mean the attitude (behavior) and mental condition that allows someone to act freely, righteously and beneficially; an attempt to do all things honestly and correctly according to the inner calls and ability to manage himself, in accordance to his rights and obligations, in such a way that can solve all the issues; as well as being responsible for all the decisions he has made through careful considerations. The definition of "independent (Adj)" can also mean being able to act according to the situations without asking or depending on others. Being independent refers to the state when someone is able to and willing to realize what he desires which is reflected from his actions and real efforts to obtain something (things or services) to fulfill his own needs and other people's (Antonius, 2002: 145). The definition of "independence" according to Eddy Wibowo (1992: 69) is a level of someone's development where he can stand alone and puts forward his own efforts in completing various activities and encountering all kinds of problems. Meanwhile, according to Masrun (1986: 8), independence can be defined as one behavior that enables someone to act freely, do anything based on self-willingness and fulfill his own needs without any help from others, as well as to think and take original/creative actions, full of initiatives, be able to influence his society, have a high level of self-confidence, and be satisfied with all his efforts. An understanding of psychological and mental independence is the condition of an individual who in his own life is able to determine and do something without any help from others as this certain type of ability can only be possessed if the individual has an ability to think carefully about things that he works on or decides, either through the viewpoint of usages and benefits, negative points and losses that he may encounter (Hasan Basri, 2000: 53). Every activity that is completed by an individual to be successful as he wishes needs a high degree of independence. Meanwhile, the definition of learning in this respect is an effort that is taken by an individual to achieve a whole new change of behavior, as a result of that individual experience in his interactions with other individuals and societies. Student learning independence according to Stephen Brookfield (2000, 130-133) covers self-awareness and self-driven learning activities to achieve the learning purposes. Merriam & Caffarella (1999) also remarks that it is a process where an individual takes initiatives in planning, executing, and evaluating his own learning system. Meanwhile, according to Grieve (2003) learning independence refers to personal attribute and psychological readiness of an individual in taking control or being responsible for his own learning process. Then, Knowles (1989) states that learning independence is a learning process where every student or individual can take initiatives, with or without the help from other people, in diagnosing learning needs, formulating learning purposes, identifying learning resources (either in the form of people or materials), selecting and applying learning strategies that are suitable for him, as well as evaluating his own learning achievements. In a similar vein, Kozna, Belle and Williams (1978) remark that independent learning is a type of learning that provides opportunities to the students to determine: learning purposes, learning resources and learning activities according to their own needs. In addition, Desi Susilawati (2009: 7-8) posits that learning independence is marked with: (1) the student try to increase their responsibility in making various decisions; (2) independence is seen as one pre-existing feature in every person and learning situation; (3) independence does not mean separating oneself from another person; (4) independent learning can transfer his learning outcomes in the forms of knowledge and skills in different situations; (5) students who learn independently can include various resources and activities such as reading, group learning, practices, and correspondences; (6) effective teacher's role in independent learning is still possible through dialogues with the students, adding learning resources, evaluating results and developing critical thinking; (7) Several education institutions find a way to develop independent learning through open learning programs. The term independent learning, according to Gibbons (2002) is an improvement of an individual in knowledge, ability, or development with every individual selects and determines the learning purposes themselves, and tries to use different methods to support these activities. Meanwhile, according to Cyril Kesten (1992), independent learning is one form of learning in which the learners (in relation with others) can make important decisions that are suitable with their own learning needs. Baumgartner (2003) also states that independent learning is an independent learning system in which every individual take steps to determine what, when, and how to learn. Then, Pannen et al. (2000) postulates that the main feature of independent learning is not the absence of a teacher or student peers, or face-to-face class meetings in a classroom. It is posited that the main feature of independent learning is the presence of student's ability development to conduct a learning process which does not rely on the presence of a teacher, student peer, classroom, or else. Gibbons (2002) further remarks that independent learning strongly relates to metacognition. Metacognition is the thought of an individual about his own mind, thinking what is known, what is done, and what is thought. In independent learning, an individual learns about his own

352
mind, makes a plan, and takes an action. The individual produces ideas for a good decision-making and thinks about the decisions in order to get the expected outcomes. The individual also thinks about the processes that they undergo as well as solutions of the problems, and strategies to develop their abilities. Independent learning can develop their individual's competencies based on their metacognition. The definition of independent learning according to Deming (1994) is a process which is marked by the activities being planned, done, studied, and acted. The independent learning process is one method that involves the students in all activities which cover several steps, and results in the observable and non-observable outcomes; this process is called independent learning. According to Johnson (2009), independent learning provides freedom to the students to determine how the academic life suits their daily life. The students make their own decisions and accept the responsibilities that follow. They also manage and adjust their actions to achieve the desired outcomes. This process of independent learning provides the students with great opportunities to sharpen their awareness about their surroundings. Independent learning enables them to make positive choices on how they will overcome their weariness and chaos in their daily life. This pattern enables them to act based on their own initiatives to shape the environment (Johnson, 2009). Independent learning is a condition of learning activities that is independent and does not rely on others, yet it is featured by willingness, initiatives and self-responsibilities in solving their learning difficulties. Independent learning will be realized is the students actively control themselves in doing, evaluating and planning things more meaningfully than before through the learning process and the students are also active in the learning process. 2.3 Characteristics of Independent Learning Student s University students who have a high level of independence in learning can be viewed from their learning activities, it is unnecessary for the lecturer to ask them to study since they show a high degree of initiatives to learn. In order to identify whether the students are independent in learning there is a need to determine the features of independent learning students. Spancer and Koss have formulated them as follows: (1) being able to take initiatives, (2) being able to solve problems, (3) being diligent and perseverant, (4) Obtaining satisfaction from his own efforts, and (5) willing to complete tasks without any help from others. Anton Sukarno (1989: 64) states that university students who are independent in learning possess the following features (1) the students plan and select their own learning activities, (2) they have initiatives and discipline themselves to keep learning, (3) they are required to be responsible for their own study, (4) they learn critically, logically, and open-mindedly, (5) they learn with full confidence. Meanwhile, Hiemstra (1991) states that university students who are independent in learning have the following features: a) they have a responsibility in making decisions related to their own attempts of learning, b) independent learning is a characteristic which can be employed by the students in every situation, c) independent learning does not mean isolating the individuals from other people, d) individuals who are independent in learning are able to transfer their learning, either in the form of knowledge or skills, from one situation to another such as participating in groups, practices, dialogues (electronically), and writing, e) an effective role of the teacher in independent learning occurs such as conducting dialogues with the students, reviewing and selecting reliable learning resources, evaluating their learning results and critical thinking, f) some educational institutions find a way to support independent learning such as open education programs, education selection for individuals, and other innovative programs. Features of independent learning according to Sadirman as cited by Ida Farida Achmad (2008: 45) include the students who: 1) are likely to give opinions, behave, and act based on the students' own will, 2) have a strong willingness to achieve purposes, 3) make plans and diligently attempt to realize their expectations with high perseverance, 4) are able to think and act creatively, are full of initiatives, and do not imitate others, 5) are likely to achieve positive progress in order to improve learning achievements, 6) are able to independently find things to do without expecting any guidance or direction from other people. Then, Thoha (1996) states that the students who are already independent in learning: a) are able to think critically, creatively, and innovatively, b) are not easily influenced by other people's opinions, c) do not run away from or avoid problems, d) solve their own problems through meaningful thinking, e) when encountering difficulties, they will solve the issues by themselves without asking for any help from others, f) do not have any low self-esteem when they have to be different from others, g) attempt to work with full perseverance and discipline, h) are responsible for their own actions.

353
Next, Babari (2002) remarks that the features of students with learning independence must be a) confident, b) able to work by themselves, c) skillful and knowledgeable that are suitable with the task requirements, d) able to appreciate time, and e) responsible. Furthermore, Muhammad Nur Syam (1999: 10) remarks that factors that may influence independent learning are divided into two majors. First, internal factors which are indicated by the development of independent learning reflected in the following phenomena: a) responsibility attitudes to complete all the assigned tasks, b) awareness of the students' rights and obligations about moral discipline in the form of a noble character reflected on their behaviors, c) personal maturity from the concept of oneself, motivation to the development of mind, desire, intention, and passion (gradually), d) awareness of health development and physical strength, e) self-discipline by following rules, awareness of right and obligations, safety driving, interpersonal respect, and completion of all required obligations. Second, there are also external factors. These factors are derived from other people such as family, school, and society. The external factors function as the strong support for maturity and independent learning, which involve: physical and spiritual potential represented by a strong and healthy body, environment, and natural resource, social economy, independent security and orderliness, condition and situation full of harmony in both positive and negative dynamics as opportunities and challenges that cumulatively involve cultural structure and else. Meanwhile, according to Meichenbaum Biemiller (1998), the factors are divided into two sources: a) social sources, involving all adult people around the students such as parents, coach, family members and teachers. These people can communicate the value of independent learning through modeling, directing and managing the desired behaviors; b) the second source involves all opportunities to practice independent learning. Students who are constantly directed by their parents and teachers cannot build their skills to learn to be independent because of the rare opportunities that they have. In this study, the researcher concludes that the factors which influence independent learning consist of two, internal and external factors. Internal factors that influence the students' independent learning are discipline, confidence, motivation, initiative, and responsibility. Therefore, students who are said to be independent in learning are those who are confident, motivated, self-initiative, discipline and responsible. Thus, the definition of independent learning for the students refers to the students' independence in learning, not relying on others, and they are required to have a high level of self-activation and initiative to learn, behave and take actions for their nation and country (Abu Ahmadi and Nur Uhbiyati, 1990: 13). The definition of independent learning according to Haris Mujiman (2005: 1) is an active learning activity, supported by strong willingness to master a certain competence to solve a problem, and is built upon their existing knowledge and competences. The determination of competences as learning objectives and methods to achieve them - covering the set time for studying, place of study, learning rhythm, learning time, learning procedures, as well as learning evaluation - completed by the students themselves. Here, independent learning is understood as the students' attempt to complete a learning activity which is based upon their strong willingness to master certain competences. 2.4 Learning Achievement The definition of learning according to Slavin in Catharina Tri Anni (2004) is a process of obtaining an ability from an experience. Gagne in Catharina Tri Anni (2004) explains that learning is a system in which there are intertwining elements that support behavioral changes. Then, the definition of learning according to Bell-Gredler in Udin S. Winataputra (2008) is a process completed by humans to obtain various competencies, skills, and attitude. Competencies, skills and attitude are obtained gradually and continuously from infant to elderly through a lifelong set of learning processes. Meanwhile, the definition of learning according to Moeslichatoen is a process that enables learning and the changes it makes are from the efforts paid in the process (in Abdul Hadis, 2008: 60). The learning achievements in learning Physics that have been obtained by the students are currently still far from expectations although there are already many efforts completed to increase the students' learning achievements in Physics in every level of education, such as: Physics curriculum revisions, Physics teacher workshops, learning media and infrastructure provisions, and else, the fact that the learning achievements in Physics is still present. Based on the observation results and experiences of the researcher as a Physics lecturer in the research venue, the students' learning achievements are still very low as can be seen from the students' final semester grades out of which only 65% of them passed the course and graduated with good scores, while the others had to undergo a remedial process and retake the course in the following semester. This is mainly because the students do not understand the learning materials given during the course well. Besides, during the teaching and learning processes in a classroom tutorial setting, the lecturer uses the blackboard as the only media and sometimes when the desired graphs are not available on the textbooks there is no supporting media to help the students understand the concepts.

354
Therefore, the learning materials are difficult to be understood and the motivation and interest of the students are low. 2.5 Atomic Physics Atomic Physics is a branch of Physics that studies atom as an isolated system from electron and atom core. Atomic Physics is related to electron configurations and processes that influence the configurations to change. This includes the relation between ion and neutral atom. The term "atomic physics" is often related to nuclear power and nuclear bomb, due to the synonym of the words "atom" and "nuclear". However, experts of Physics differentiate it by separating the branch of Physics that studies atom core and electron from the branch of Physics that studies nuclear (nuclear Physics) which only studies atom core. Physics is science or study about nature that focuses on matter, movement, and behavior in the scope of time and place, along with other related concepts such as energy and law. As one of the most basic branches of science, the main purpose of Physics is to understand how the universe works. Physics is one of the oldest academic disciplines that have been part of science along with Chemistry, Biology and certain concepts of Mathematics, but when the Science revolution broke in the 17th century, natural science has developed to a separate research program. Physics overlaps with many other branches of scientific research such as biophysics, quantum chemistry, since no strict line to be set. New knowledge in Physics is sometimes used to explain basic scientific mechanisms of others as well as open a new breakthrough for other research fields such as Mathematics and Philosophy. Physics also contributes a lot to technological development through theoretical thinking. For example, further understanding about electromagnetism or nuclear Physics are directly guided into developments of new products which dramatically shape modern societies, such as television, computer, domestic equipment, and nuclear weapons; developments of thermodynamics lead to industrial developments, mechanical advancement which in turn inspires calculus development. Based on the research findings of Dini Silmi (2013) who descriptively analyzed the FD-FI cognitive styles of secondary students in Physics learning using levels of inquiry model, generally the samples had an equal share between the students with FD and FI cognitive styles. Further, the group of students who were classified to have FD cognitive styles was 38.46%, while the other group with students classified to have FI cognitive styles was 42.31%. Meanwhile, the score achievement of the former in the inquiry level was 47.37, while the latter was 67.12. 3 METHODOLOGY
Sample of this research consisted of the students who already passed the Atomic Physics course PEFI 4421 in Open University Indonesia within 2016 (2 semesters) and 2017 (1 semester) academic years. It was assumed that the sample is homogenous regarding the fact that they had already passed the course in a relatively short while ago. The total number of students was 127, but there were only 80 students who had filled in and returned the questionnaires. Ways of collecting the data were through (1) post mail, (2) coming personally to their home address, (3) assigning UPBJJ research assistants to distribute the questionnaires. This research was considered to be correlational descriptive which was aimed at exploring and identifying a certain condition or situation of the subjects being researched and testing any significant correlation between the dependent and independent variables. This descriptive explorative research was more specific in its technique of focusing on certain aspects and trying to identify the correlations that could exist between the variables. It also used double linear regression analysis. A regression analysis is an analysis that measures the influence of a free variable on a bound variable. This measurement of influence includes one free variable (X) and bound variable (Y), which is later called simple linear regression analysis, with the following formula: Y= a+bX to determine the contribution of the two free variables on one bound variable. Winarno Surakhmad (1989:31) stated that the method was the main way to be employed to achieve purposes, such as testing a set of hypotheses using certain techniques and tools; it was used after the investigator considers the investigation purposes and situations. In this research, the method used was (1) the questionnaire filled in by the students which aimed to identify the performance of the lecturer

355
using the lecturer evaluation questionnaire, and (2) identify the student interactions of Bidikmisi program during the tutorials, (3) the test result score sheets (DNU) of the first semester of 2017 academic year to identify the learning achievements of the students on Atomic Physics PEFI4421, and lastly (4) the Embedded Figures Test (EFT) made by Witkin (1977) to measure the cognitive style of the students. Further, the EFT is a perceptual test which uses pictures. The outside frame references to be distributed were the in the form of complicated pictures, which hid a very simple picture on every frame. The data collected was then analyzed using regression statistics model by combining the data of cognitive styles and independent learning and conducting correlational analysis with the students' learning achievements in Atomic Physics. 4 FINDINGS AND DISCUSSIONS
There were 80 questionnaires to be analyzed and it was found that the level of the students' independent learning was 4.8 (high) from scale 1 to 5. This proved that the students were considered to be ready to learn independently regardless the obstacles that they faced. Most of the students had already identified what they were about to learn when they stated to take this course and tried to avoid things that might be too difficult to understand and prepare themselves to be optimally ready to study Atomic Physics. On average, the students had a belief that education is important to every individual and they already knew where to look for and obtain information needed to realize their ideal study purposes. In the learning process, the students preferred to decide themselves what and how to learn the Atomic Physics learning materials and did not feel desperate when they encountered any difficulties. The difficulties in learning were not considered to be obstacles that hinder those who were independent in learning and they were ready to take the responsibilities for this commitment. The students had already identified good learning techniques and when they had to provide more time to learn and when they had to provide less time for that, this was because the learners had already found ways to learn new things. In general, the students felt happy when they had to find the answers for the issues they had. The students had a huge curiosity in many things and had already had basic skills to understand the Atomic Physics reading materials, and were happy to try new things to enrich their knowledge. The students had considered learning issues as challenges rather than obstacles, and did things to answer them based on their own thoughts. The students had also completed group discussions well, and had a strong desire to learn new things. According to their opinion, the more they encountered new things the more they felt about the excitement of the world; hence they determined themselves to develop their potentials. The notion was that the more new things they knew the more opportunities they had to develop their potentials, since they considered themselves to be effective students either in discussion groups or independent learning individuals. In regard to the cognitive learning style of the Physics students in general, most of them had a field independent cognitive style (78%), since they preferred to learn by themselves and did not rely on other people. The students preferred to work on the assigned tasks by themselves, since they often perceived that their tight schedule let them forget their learning environment (especially in a discussion group). While also working as teachers of Physics, the students preferred to directly go back home rather than staying at their school to chat with their peer teachers. On the other hand, there were some students who had field dependent cognitive learning style (22%). It can then be concluded that most of the students of Physics mostly did not usually hang out with the other subject teachers at their school. They were mostly introvert and busy with their own businesses. As the students of Physics, they preferred to be understood and expected others to help analyze their problems and suggest solutions for them when they encountered learning issues. Only few of the students who were in favor to share their problems with others, especially in regard to the Atomic Physics tasks assigned which were considered to be difficult to understand alone even after they browsed for resources on the internet and they needed other students' opinions to strengthen their opinions or answers. For the students who already had been independent in learning and had a field independent cognitive style, they also had suitable supporting resources for Atomic Physics which in turn helped them get optimal learning achievements (72.6%). Meanwhile, for the students who had a medium rate of independent learning and a field dependent cognitive learning style, they mostly did not have suitable supporting learning resources for Atomic Physics PEFI4421 and got a low rate of learning achievements (27.4%). This showed that the students who were already independent in learning and had a field independent cognitive learning style positively resulted in the maximum learning achievements.

356
5 CONCLUSIONS
From the research conducted, it can be concluded that: 1. Not all of the students of Physics Education had suitable learning resources for Atomic Physics. 2. Cognitive learning style and dominant independent learning readiness positively correlated to the maximum learning achievements. 3. Different graduation years of the students did not influence their cognitive learning style and independent learning readiness since the years were not significantly different (2016 and 2017). REFERENCES

357
ANALYSIS OF SERVICE QUALITY, COSTUMER SATISFACTION AND STUDENT LOYALTY AT MAKASSAR REGIONAL OFFICE
UNIVERSITAS TERBUKA INDONESIA
Jalil1)
1 Makassar Regional Office Universitas Terbuka Indonesia
Abstract
This research was designed to measure the relationship between service quality, student satisfaction and student loyalty at UPBJJ-UT Makassar. Conducted in 2015 at UPBJJ-UT Makassar, the study selected 100 students who were present during the research period using accidental sampling. This study identified five dimensions to construct and measure the service quality – tangibility, realibility, responsiveness, assurance and empathy – using a 5-point likert scale. Descriptive statistics with CSI (Customer Service Index) measurement was used to evaluate the weighting factor, weighting score, weighting total and satisfaction index. Inferential analysis was used to make inferences from the population. Correlation analysis at 0.01 measured the relation between service quality, customer satisfaction and customer loyalty. The results showed that service quality provided by UPBJJ-UT Makassar had a positive and significant effect on both student satisfaction and student loyalty. However, despite its positive effect, student satisfaction did not score a significant effect on student loyalty. This research, though it has reached its aim, had a limitation; as the samples were selected using accidental sampling, the results of the research were not as generalized and representative as those using random sampling.
Keywords: service, satisfaction, loyalty, costumer.
1. INTRODUCTION
Based on the data from Forlap Dikti 2014, Indonesia comprises 3.095 higher education institutions that consist of 1.005 academies, 171 polytechnics, 1.366 colleges, 6 institutes and 492 universities. South Sulawesi has 189 higher education institutions – among which are 53 academies, 6 polytechnics, 110 colleges, 1 institute and 20 universities. This indicates the high-school graduates have a broad range of options to further their education to a higher institution. Such vast number, furthermore, indicates growing competition between higher education institutions in retaining existing students and attracting prospective students. One of the vital factors as to retaining and improving the number of students is service quality for students as customers. Student service includes both academic and administrative service provided to students throughout their academic experience until they graduate. As a higher-education institution that sustains Open and Distance Learning (ODL), Universitas Terbuka (UT) puts great emphasis on customer satisfaction. UT frequently conducts surveys on customer satisfaction throughout the semesters. The surveys, which aim to measure the level of student satisfaction of service provided by UT, include the entire aspects of UT service which are registration, learning support, examination, credit transfer, learning material, and legalization of degree certificate. By its very nature, service refers to an economic action or an activity offered by one party to another, is typically intangible and does not lead to ownership. Service is producer behavior in ways that fulfill consumer needs and desires in order to gain consumer satisfaction. Kotler (2002) states that such behavior applies during, before and after purchase transaction. Generally, greater service results in greater customer satisfaction, which encourages repurchase intention. Satisfaction represents either an individual’s pleasure or discontentment as a result of the comparison between product or service performance and his/ her expectation. Satisfaction, hence, is generated from perception and impression on performance and expectation. Measuring customer satisfaction means figuring out whether the performance has failed or met or even exceeded the expectation (Kotler, 2003). Quality plays a crucial role in service with respect to business survival and profitability. Quality does not only focus on the result but also deals with the process, environment and human resource. Tjiptono and Chandra (2011) states that quality is closely associated with a dynamic condition that yields product,

358
service, human resource, process and environment that meet or exceed expectation. Furthermore, exceptional customer service must hold 4 tenets – timeliness, accuracy, hospitality and convenience. On that basis, This research settled on an analysis of the effect of service quality on customer service and student loyalty at Universitas Terbuka of Makassar Regional Office
1.1. Problem Statement
This research outlined the problem statements as follows: 1. What is the rate of relation between service quality and student satisfaction at UPBJJ-UT Makassar? 2. What is the rate of relation between service quality and student loyalty at UPBJJ-UT Makassar? 3. What is the rate of relation between customer satisfaction and student loyalty at UPBJJ-UT 4. What is the rate of relation between service quality, student satisfaction and student loyalty at UPBJJ-
UT Makassar?
1.2. Objective of Research This research aimed to:
1. measure the relation between service quality and student satisfaction at UPBJJ-UT Makassar; 2. measure the relation between service quality and student loyalty at UPBJJ-UT Makassar; 3. measure the relation between student satisfaction and student loyalty at UPBJJ-UT Makassar; 4. measure the relation between service quality, student satisfaction and student loyalty at UPBJJ-UT
Makassar.
1.3. Significance of Research The significance of this research is as follows:
1. this research illustrated the importance of customer satisfaction in ODL service setting and provided perspective on the recent status of student satisfaction at UPBJJ-UT Makassar.
2. This research was intended to generate a great deal of interest in the research area, not only among future researchers, but also among general public.
2. METHODOLOGY
Within the context of covariation between variables, this study was designed as correlational-quantitative analysis in ways that measured the relation between service quality, student satisfation and student loyalty at UPBJJ-UT Makassar.
This study proposed a number of hypotheses as follows:
H1: There was a relation between service quality and student satisfaction at UPBJJ-UT Makassar. H2: There was a relation between service quality and student loyalty at UPBJJ-UT Makassar. H3: There was a relation between student satisfaction and student loyalty at UPBJJ-UT Makassar.
The variables included independent variable (exogenous variable), which was service quality, dependent variable (endogenous), which was student loyalty, and moderator variable, which was service quality.
Population in this study included the entire active students at Makassar Regional Office UT in 2015.1. that made up to 10.028 students. In addition to the active students, samples were also obtained from the alumni of Makassar Regional who were present during research at the office of UPBJJ-UT Makassar. 100 samples were selected with 10% margin of error and at 90% confidence level. To gain representative samples, sampling was executed using Slovin’s formula (in Umar, 2004:108). With 10% margin of error, the sample size was calculated as follows:
≈ 100

359
Where: n = sample size N = total population (total number of registered students in 2015)
0,1 = maximum margin error 1 = Slovin constant
2.1. Method of Data Collection
The data was collected using non-probability accidental sampling. 100 samples were selected with 10% margin error. The sampling criteria were then-registered students and alumni who were present during the research period at UPBJJ-UT Makassar.
2.2. Research Instrument
To develop a research instrument that fit the research problems, this research identified a number of dimensions to develop the construct of service quality:
1. Tangibility (X1), which includes the availability of registration information (X.1.1), availability of registration forms (X.1.2), physical quality of learning materials (X.1.3), proper tutorial sites (X.1.4), proper practicum sites (X.1.5), availability of examination information (X.1.6), proper examination sites, adequate number of examination scripts (X.1.8) and appearance of UT staff when it comes to student service.
2. Reliability (X2), which includes prompt registration service (X.2.1), timely tutorial schedules (X.2.2), timely distribution of learning materials (X.2.3), timely practicum schedules (X.2.4), professionalism of examination supervisors (X.2.5), orderliness at examination (X.2.6), timely final-score announcement (X.2.7), timely legalization and release of temporary graduate certificates or degree certificates (X.2.8)
3. Responsiveness, (X3) which includes ease of obtaining billing information form (Lembar Informasi Pembayaran–LIP) (X.3.1), responsive registration staff (X.3.2), ease of paying tuition (X.3.3), ease of obtaining Catalog in the beginning of the year (X.3.4), ease of obtaining learning materials (X.3.5), ease of obtaining tutorial service (X.3.6), ease of obtaining practicum service (X.3.7) and attentive staff (X.3.8)
4. Assurance, which includes data accuracy in Student’s Exam Identification Card (Kartu Tanda Peserta Ujian–KTPU) (X.4.1), data accuracy in Exam Results (Daftar Nilai Ujian–DNU) (X.4.2), data accuracy in LIP (X.4.3), fair distribution of learning materials (X.4.4), adjustment between DNU and the courses (X.4.5), ease of obtaining practicum instruments and materials (X.4.6), accessibility of examination sites (X.4.7), and available and easy-to-approach service staff (X.4.8)
5. Empathy, which includes; UT staff keeps students and coordinators informed about registration closing date (X.5.1); UT staff keeps students and PokJar coordinators informed in the event of problems in course registration (X.5.2); students are enabled to access online service for those who wish to repeat a course (X.5.3); PokJar keeps students informed about the distribution of KTPU (X.5.4); exam and PokJar coordinators keeps students informed about the required items upon an examination (X.5.5); students are not allowed to sit in an examination without KTPU unless they show another identification card (X.5.6); and UT ends certificate-legalization fees (X.5.7)
Student satisfaction was measured using a 5-point likert scale, ranging from 1 (Strongly Disagree–SD) to 5 (Strongly Agree–SA). The items included: (a) I am satisfied with the service provided by UPBJJ-UT Makassar, (b) The service at UPBJJ-UT Makassar meets student expectation, (c) Studying at UPBJJ-UT Makassar is the right choice to pursue higher education.
Student loyalty was also measured using a 5-point likert scale. The items included: (a) I would finish my education at UT, (b) I would pursue higher education level at UT, (c) I would recommend UT to friends and family.
2.3. Data Analysis

360
Data analysis in this study went through a number of phases. First, data editing was done to review the adjustment of the collected questionnaires and ensure that each item was answered. Then, the questionnaires were coded to make data tabulation easier. The data was computed using descriptive statistics analysis on respondents’ characteristics, expectation and reality levels based on Importance-Performance Analysis (IPA), while student satisfaction was manually measured using Customer Satisfaction Index (CSI).
Descriptive statistics, or univariate statistics, was applied to identify the characteristics of students who obtained service provided by UT staff. Descriptive statistics illustrated the data based on each indicator of the variables collected. The acquired data was grouped based on similar answers which would be presented in percentage and frequency distribution. To obtain in-depth measurement of student satisfaction, Customer Satisfaction Index (CSI) was performed with the following requirement (Hill, 2006): The mean scores of both levels of expectation and reality generated from CSI define the levels of student satisfaction (strongly satisfied, satisfied, dissatisfied and strongly dissatisfied). Scores 0,00-0,25, 0,26-0,50, 0,51-0,75 and 0,76-1,00 signify “strongly dissatisfied,” “dissatisfied,” “satisfied” and “strongly satisfied,” respectively. Prior to inferential analysis, validity test was run to measure the research instrument (Arikunto, 2010) using a minimum standard r ≥ 0,3 (Sugiyono, 2012). Then, reliability test was run (Arkunto, 2010) using Cronbach’s Alpha where the data was computed using SPSS 20. A reliable instrument typically scores 0,70-1,00 (Polit & Hungler, 1999).
After the acquired data provided accurate descriptions, further data processing was performed. Method for analyzing the data in this study was product-moment correlation.
To find out the significance of a correlation coefficient, rCal was compared to rtable in product-moment. rCal >
rtable at a significance level of 5% indicates the hypothesis was accepted. On the contrary, rCal < rtable at a significance level of 5% indicates the hypothesis was rejected.
3. RESULTS AND DISCUSSION
3.1. Respondent Profile
Respondent characteristics included sex, age, and education level. Out of 100 respondents, 20 (20%) were male students and 80 (80%) were female students. In terms of PokJar locations throughout South Sulawesi from 2003 to 2013, the majority of respondents came from Makassar 2008-2012. Barru Regency implemented PokJar after 2013. Consequently, respondents’ ages ranged from 17-26 to 27-36 years old. In terms of occupations, 48% of the respondents were unemployed, 16% teachers, 12% employees, 11% civil servants, 7% librarians.
3.2. Characteristics of Research Variables
3.2.1 Variable of Service Quality
The following is the recapitulation of respondent perception on service quality: Table 1. Scores of the Level of Service Quality at UPBJJ-UT Makassar 2015
No Variables Scores Criteria
1 Tangibility 3,95 – 4,44 Very good
2. Reliability 4,02 – 4,29 Very good
3 Responsiveness 4,02 – 4,25 Very good
4. Assurance 4,01 – 4,29 Very good
5. Empathy 4,17 – 4,40 Very good
The table shows that overall the service quality was perceived as very good.

361
3.2.2. Variable of Satisfaction
The mean scores of expectation and reality levels generated from Customer Satisfaction Index (CSI) defined the levels of student satisfaction of service quality. As previously mentioned, scores 0,00-0,25 denotes “highly dissatisfied,” 0,26-0,50 “dissatisfied,” 0,51-0,75 “satisfied,” and 0,76-1,00 “highly satisfied.”
Table 2 presents the calculation of respondent perception on service quality based on expectation and reality scores. The table above shows that CSI of 0.92 (92%) indicates that the overall service quality was perceived as highly satisfying by the students
Table 2 The Satisfaction Levels Based on the Mean Scores of Both Expectation Levels and Reality Levels of the Dimensions of Service Quality at UT
Dimensions of Service Quality
Mean Scores of
Expectation Levels
Weighted Factor (WF)
Mean Scores of
Reality Levels
Weighted Score (WS)
Tangibility 4.62 22.16 4.16 0.92
Reliability 4.57 21.92 4.13 0.91
Responsiveness 4.59 22.01 4.17 0.92
Assurance 4.64 22.25 4.14 0.92
Emphaty 4.66 22.35 4.25 0.95
Total 20.85 110.70
Weighted Total (WT) 4.62
Customer Satisfaction Index (CSI) 0.92
Source: Primary data, processed in 2015
.
3.2.2.1. Student Satisfaction of Tangibility
CSI measurement of student satisfaction of the indicator of tangibility is shown in Table 3.
Table 3. The Levels of Student Satisfaction of Tangibility
Indicators of Tangibility Mean Scores of Expectation Levels
Weighted Factor
(WF)
Mean Scores
of Reality Levels
Weighted Score
(WS)
1. Availability of registration information 4.68 11.26 4.09 0.46 2. Availability of registration forms 4.56 10.97 4.21 0.46 3. Physical quality of learning materials 4.6 11.07 3.94 0.44 4. Proper tutorial sites 4.56 10.97 3.95 0.43 5. Proper practicum sites
4.62 11.12 3.95 0.44 6. Availability of examination information 4.72 11.36 4.44 0.50 7. Proper examination sites 4.61 11.09 4.15 0.46 8. Adequate number of examination scripts 4.71 11.33 4.39 0.50

362
9. Appearance of UT staff 4.5 10.83 4.29 0.46
Total 41.56 100.00
Weighted Total (WT) 4.16
Customer Satisfaction Index (CSI) 0.83
Source: Primary data, processed in 2015
The table shows that CSI of 0.83 (83%) indicates the students were highly satisfied of service quality in terms of its tangibility.
3.2.2.2 Student Satisfaction of Reliability CSI measurement of student satisfaction of the indicator of reliability is shown in Table 4.
Tabel 4. Student Satisfaction of Reliability
Source: Primary data, processed in 2015
Table 4 shows that CSI of 0.72 (72%) indicates that the students were satisfied of the service quality in terms of its reliability.
3.2.2.3. Student Satisfaction of Responsiveness
CSI measurement of student satisfaction of the indicator of responsiveness is shown in Table 5. Table 5. The Levels of Student Satisfaction of Responsiveness
Indicator of Reliability
Mean Scores of
Expectation Levels
Weighted Factor (WF)
Mean Scores of
Reality Levels
Weighted Score (WS)
1. Prompt registration service 3.63 12.70 3.63 0.46
2. Punctual tutorial schedules 3.56 12.46 3.56 0.44
3. Timely distribution of learning materials 3.58 12.53 3.58 0.45
4. Timely practicum schedules 3.49 12.21 3.49 0.43
5. Professionalism of examination supervisors 3.49 12.21 3.49 0.43
6. Orderliness at examination 3.68 12.88 3.68 0.47 7. Timely announcement of examination results
8. Ease of obtaining certificates or references
3.73
3.42
13.05
11.97
3.73
3.42
0.49
0.41
Total 28.58 100.00
Weighted Total (WT) 3.58
Customer Satisfaction Index (CSI) 0.72
Indicator of Responsiveness
Mean Scores of
Expectation Levels
Weighted Factor (WF)
Mean Scores of
Reality Levels
Weighted Score (WS)
1. Prompt registration service 3.59 12.49 3.2 0.40
2. Punctual tutorial schedules 3.61 12.56 3.17 0.40
3. Timely distribution of learning materials 3.66 12.73 3.21 0.41
4. Punctual practicum schedules 3.5 12.17 3.02 0.37
5. Professionalism of examination supervisors 3.63 12.63 3.17 0.40
6. Orderliness at examination 3.63 12.63 3.25 0.41

363
Source: Primary data, processed in 2015
The table shows that CSI of 0.63% (63%) indicates that the students were satisfied of the service quality in terms of its responsiveness.
3.2.3.4 Student Satisfaction of Assurance
CSI measurement of student satisfaction of the indicator of assurance is shown in Table 6.
Table 6 The Levels of Student Satisfaction of Assurance
Indicator of Assurance Mean Scores of Expectation Levels
Weighted Factor
(WF)
Mean Scores of
Reality Levels
Weighted Score (WS)
1. Prompt registration service 3.59 12.49 3.2 0.40
2. Punctual tutorial schedules 3.61 12.56 3.17 0.40
3. Timely distribution of learning materials 3.66 12.73 3.21 0.41
4. Punctual practicum schedules 3.5 12.17 3.02 0.37
5. Professionalism of examination supervisors 3.63 12.63 3.17 0.40
6. Orderliness at examination 3.63 12.63 3.25 0.41
7. Timely announcement of examination results 3.55 12.35 3.11 0.38
8. Ease of obtaining certificates or references 3.58 12.45 3.21 0.40
Total 28.75 100
Weighted Total (WT) 3.17
Customer Satisfaction Index (CSI) 0.63
Source: Primary data, processed in 2015
The table shows that CSI of 0.63% (63%) indicates that the students were satisfied of the service quality in terms of its assurance.
3.2.3.5. Student Satisfaction of Empathy
CSI measurement of student satisfaction of the indicator of empathy is shown in Table 7.
Table 7. The Levels of Student Satisfaction of Empathy
Indicator of Assurance Mean
Scores of Expectation Levels
Weighted Factor
(WF)
Mean Scores
of Reality Levels
Weighted Score
(WS)
1. UT staff keeps students and coordinators informed about registration closing date. 3.64 12.45 3.22 0.40
7. Timely announcement of examination results
8. Ease of obtaining certificates or references
3.55
3.58
12.35
12.45
3.11
3.21
0.38
0.40
Total 28.75 100
Weighted Total (WT) 3.17
Customer Satisfaction Index (CSI) 0.63

364
2. UT staff keeps students and PokJar coordinators informed in the event of problems of course registration.
3. UT staff provides service to students in terms of registration-related problems.
3.68
3.58
12.59
12.24
3.23
3.17
0.41
0.39 4. Students are enabled to access online service for those who wish to repeat a course. 3.71 12.69 3.4 0.43 5. PokJar keeps students informed about the distribution of KTPU. 3.64 12.45 3.33 0.41 6. Exam and PokJar coordinators keeps students informed about the required items upon examination. 3.61 12.35 3.15 0.39 7. Students are not allowed to sit in an examination without KTPU unless they show another identification card. 3.68 12.59 3.24 0.41 8. UT ends legalization fees. 3.7 12.65 3.24 0.41
Total 29.24 100
Weighted Total (WT) 3.25
Customer Satisfaction Index (CSI) 0.65
Source: Primary data Primer, processed in 2015
The table shows that CSI of 0.65% (65%) indicates that the students were satisfied of the service quality in terms of empathy.
i. Variable of Loyalty (Y)
The recapitulation of respondent perception on loyalty is presented below:
Table 8 Frequency Distributon of Respondent Answer to Loyalty
Answer
TOTAL SCORE 1 2 3 4 5
SD D N A SA
Loyalty
1. I would finish my education at UT. 1 0 1 24 74 100 4.70
2. I would recommend UT to friends and family. 1 0 8 42 49 100 4.38
3. I would not move to other university despite numerous suggestions from others.
1 0 11 36 52 100 4.38
4. I am proud to be UT student. 1 1 0 28 70 100 4.65
4 1 20 130
245 400
Source: Primary data, processed in 2015 Description: SD: Strongly Disagree, D: Disagree, N: Neutral, A: Agree, SA: Strongly Agree

365
The table shows that, among the eight indicators of loyalty, variable X.6.1 with a score of 4.70 was perceived as very good.
ii. Inferential Analysis
The results of the reliability of each variable is shown below:
Table 9. The Results of the Reliability of the Variables of Student Satisfaction at UT of Makassr Regionl Office 2015
No Variable Cronbach’s Alpha Criteria
1 Tangibility 0,785 Very good
2. Reliability 0,861 Very good
3 Responsivenes 0,884 Very good
4. Assurance 0.903 Very good
5. Empathy 0.776 Very good
6. Loyalty 0.738 Very good
The reliability measurement in Table 9 shows that each of the variables was perceived as very good as it scored >0,6.
iii. Correlation Analysis
The calculation of correlation between variables is seen below:
Table 10. The Output of the Correlation Between Variables
Source: Primary data, processed in 2015
Table 10 shows that the correlation between the service quality and student satisfaction was positive with a correlation coefficient of 0.617, which was considered as a high category, at a significance value of 1% (less than 5%), which indicates a significant correlation. Likewise, the correlation between service quality and student satisfaction was positive and significant at 1% (less than 5%) with a correlation coefficient of 0.2999, which was considered as a low category. The correlation between student satisfaction and student loyalty was positive yet insignificant, which indicates that satisfaction increase did not necessarily result in loyalty increase. The correlation between variables is illustrated in the framework below:
Figure 1 Framework of the Correlation Between Variables

366
X1 = Service quality, X2 = Student satisfaction, Y = Student loyalty **) significant at 0.01 (1%)
3.3. Discussion
3.3.1. Relation between Service Quality and Satisfaction Based on the previously-taken correlation test, the quality of UT service and student satisfaction was related positively and significantly with a high category of correlation coefficient. This suggests significant improvement in service operations leads to strong customer satisfaction. This result was also found in the mean scores of service quality and index of student satisfaction, both generating high-category scores. This result is consistent with the finding of Icnasius (2014) that found the dimensions of academic service – tangibility, reliability, responsiveness, assurance and empathy – simultaneously had significant positive effects on student satisfaction. Aryani and Rosinta (2010) also concluded that service quality and customer satisfaction indicated a strong and positive effect. Satisfaction refers to an individual’s pleasure or discontentment from comparing perception or impression on product or service performance with his/ her expectation. In other words, high satisfaction is largely driven by high performance (Kotler, 2003). Service quality is key in shaping customer satisfaction. The quality of a given service that meets or surpasses customer expectation results in pleasurable customer experience and, in turn, profit benefit. When the quality suffers, customers turn to competitors who may have better offer. On-going satisfaction leads to loyalty; once customers have placed trust, they are likely to make repurchase. This is vital for profitability as long-term customers are the most profitable customers. Satisfaction of service makes the difference in a competitive market. Kotler (2003) describes satisfaction level serves as a function of comparison between the perceived performance and the actual expectation, which indicates that customer expectation drives the perception on how two or more organizations within similar line of business differ from one another. Customers hold expectations of the perceived value or benefit before purchasing goods or availing a service. This pre-purchase belief is a standard when it comes to evaluating post-purchase performance. Such belief is influenced by various forms of advertisement, service provider’s premises, word-of-mouth recommendations and buyer’s past experience with the service. Tjiptono (2001) defines satisfaction or dissatisfaction of customers as a customer’s response to the evolution of disconfimation between the prior expectation and actual performance. When customers compare those two aspects, they either confirm or disconfirm the service provider’s premises. Each of customer expectations vary to some extent according to the level of purchase involvement and previous experience. The notion of expectation-disconfirmation lies in whether the expectation has been met (confirmed) or surpassed (positively disconfirmed) or not met (negatively ;disconfirmed). A company may measure customer satisfaction through feedback which is a valuable insight for improving customer service experience and identifying emerging customer preferences that competitors cannot or do not even see. This also provides the company with a chance for measuring the degree to which how the product or service performs. Through this customer-employee interaction, customers are likely to feel important as they feel they are involved in product-shaping. As a consequence, sales and customer retention are growing.
X1
X2
Y
0.153
0.299**
0.617 **

367
Based on the results, the hypothesis, that there was a relation between service quality and student satisfaction at UPBJJ-UT Makassar (H1), is accepted. Theoretical implication of the study is that in order to boost student satisfaction, UT should set and monitor service standards and encourage gradual performance enhancement, notably within customer-employee interactions. 3.3.2. Relation Between Service Quality and Loyalty
As previously shown, the correlation between the service quality and student loyalty was positive and significant as it scored in a high category. This indicates that improvement in service quality is likely to increase student loyalty. Such indication is also reflected in the mean scores of service quality and the index of student loyalty, which fell into the category “very satisfying.” The result is in line with prior work by Rinala, Yudana and Natajaya (2013), who found that the quality of academic service showed a significant effect on student loyalty through student satisfaction. Aryani and Rosinta (2010) had a similar finding that service quality and customer loyalty had a strong and positive relation.
Tangibility affects how students perceive and evaluate service, which in turn leads to student loyalty. As put by Parasuraman (in Tjiptono, 2007), tangibility refers to appearance, service facilities, equipment, human resources and communication materials in an institution. Those directly affect whether students decide on loyalty.
Parasuraman in Tjiptono (2007) also describes that the indicators of reliability include job performance and dependability. These attributes lead customers to the decision on choosing a particular brand, making consistent purchase over an extended period of time and generating word-of-mouth recommendation. Tjiptono (2007) further states one of the underlying factors of customer loyalty is trust, due simply to the fact that customers do not buy from a brand or a company they do not trust.
Responsiveness closely relates to meeting customers’ needs. With responsiveness, service employees are able to develop an ability to understand, and in fact, anticipate what customers desire. Parasuraman (in Tjiptono, 2007) defines responsiveness as the availability and agility of service employees assisting customers. At the point, customer-employee rapport in purchase setting occurs, where responsiveness to customers is fostered.
Assurance focuses on the belief that optimizing customer satisfaction leads to long-term customer loyalty. As put by Pasuraman (in Tjiptono, 2007), assurance is closely associated with employees’ knowledge, personality and ability to foster customer trust and confidence, which, in turn, results in customer loyalty. When customers feel appreciated and understood, they are likely to stay loyal and also generate word-of-mouth referral. With sufficient knowledge and personality, employees can achieve customer loyalty in the best possible manners.
Despite its lowest percentage in the effect of service quality on customer loyalty, empathy helps develop customer loyalty. Parasuraman (in Tjiptono, 2007) characterizes empathy as a defined set of employee abilities to develop a meaningful and personal connection with customers in terms of their purchase inclinations, demands, inquiries and complaints. Similar to assurance, empathy makes customers feel valued. Customer-oriented business should have employees equipped with appropriate skills of catering to each of customer needs by understanding what is important to them to earn their loyalty.
Finally, the hypothesis, that there was a relation between service quality and student loyalty at UPBJJ-UT Makassar (H2), is accepted.
The theoretical implication of this result is that UT as a customer-centric institution needs to seek to understand who the customers are, as each of whom is unique, what they need from a particular product or service and how UT accomodates these unique preferences. 3.3.4. Relation Between Satisfaction and Loyalty

368
The relation between student satisfaction and student loyalty was also positive and significant owing to its high-category correlation coefficient, mean scores and index of customer satisfaction. The result indicates that improved student satisfaction raised the likelihood of improved student loyalty. The result replicates prior finding by Hariawan (2015) that positive and significant relation was evidently found between student satisfaction and student loyalty. Tjiptono and Chandra (2011) specifically describe that the positive relation between customer satisfaction and customer loyalty potentially drive maximum profitability, notably in terms of repurchase, cross-selling and up-selling and suppress transaction cost, particularly communication cost, selling cost and customer-service cost. A great level of satisfaction keeps customers from defecting to competitors, reduces price sensitivity, minimizes market failure expense and lowers operational cost due to the growing number of customers, advertising effectiveness and business reputation (Fornell, 1992). A company decision for systematic service improvement is making a commitment to overcome customer problems, which, in turn, shapes customer loyalty (Elu, 2005). Customer loyalty is built on a great deal of effort, and most likely budget. Loyalty is hard to earn and easy to lose. As put by Kaset International, keeping an existing customer is much harder than acquiring a new customer. A company, therefore, is prompted to change how it executes its work to the benefit of those it serves. Customer evaluation on service quality shapes a certain pattern of customer buying (Consumer Loyalty Pattern) that defines whether a customer is loyal or disloyal (Kotler, 2003). A loyal customer is defined as a person who uses a particular service from one brand, rather than other brand(s), on an on-going basis. To the contrary, a disloyal customer does not use service from one type of brand or company, exhibiting switching consumption behaviors from one brand or company to another. However, customer satisfaction is not enough. Kotler (2003) reveals that, to earn customer loyalty that stands the test of time, a company needs to achieve customer delight. Customer delight deals with a higher degree of customer pleasure than customer satisfaction. While customer satisfaction denotes an endeavour to meet customer expectation, customer delight attempts to exceed it. This implies that customer satisfaction does not necessarily lead to customer loyalty, while customer delight does. Thus, customer satisfaction has the likelihood, albeit slight, of switching consumption behavior. Based on the aforementioned result, the hypothesis, that there was a relation between student satisfaction and student loyalty at UPBJJ-UT Makassar (H3), is accepted. The theoretical implication of this result is that UT needs to deliver exceptional customer experience in ways that give customers as much value as possible beyond their expectation.
4. CONCLUSION & SUGGESTION
4.1. Conclusion
The following are the conclusions based on the data analysis and hypothesis testing previously presented:
1. The quality of service provided by UPBJJ-UT Makassar demonstrated a positive and significant effect on student satisfaction. The dimensions of quality service included tangibility, reliability, responsiveness, assurance and empathy.
2. The quality of service provided by UPBJJ-UT Makassar demonstrated a positive and significant effect on student loyalty.
3. However, student satisfaction demonstrated positive yet insignificant effect on student loyalty at UPBJJ-UT Makassar, which means student satisfaction did not necessarily result in student loyalty.
4.2. Suggestion
A number of suggestions are developed based on the results:
1. Customer satisfaction is clearly important, but customer loyalty is absolutely essential. To that end, UT needs to retain the dimensions of quality service (tangibility, reliability, responsiveness, assurance and empathy) and gradually improve them.
2. As the samples were obtained from accidental sampling, the samples were not as representative and general as those obtained from probability sampling. Approaching studies should deal with more representative participants to generalize the results for larger group.

369
3. Approaching studies need to allow for more independent variables that potentially affect the variable of service quality, such as the quality of internal service.
BIBLIOGRAPHY
Dwi Aryani dan Febrina Rosinta. (2010). Pengaruh Kualitas Layanan terhadap Kepuasan Pelanggan dalam Membentuk Loyalitas Pelanggan. Bisnis & Birokrasi, Jurnal Ilmu Administrasi dan Organisasi, Mei—Agus 2010, hlm. 114-126. Volume 17, Nomor 2
Elu, Balthasar. (2005). Manajemen Penanganan Komplain Konsumen di Industri Jasa. Jurnal Ilmu Administrasi dan Organisasi, Bisnis&Birokrasi, Vol. 13, No. 3 (September)
Ferdinand, Augusty. (2000). Tesis. Structural Equation Modelling dalam Penelitian Manajemen. Program Magister Manajemen Universitas Diponegoro Semarang
Fornell, C. (1992). A National Customer Satisfaction Barometer: The Swedish Experience. Journal of Marketing, 56.
Hariawan, Akto. (2015). Pengaruh Kualitas Pelayanan, Kepuasan Mahasiswa Dan Reputasi Terhadap Loyalitas Mahasiswa Di Stmik Amikom Purwokerto. ejournal.amikompurwokerto.ac.id/index.php/probisnis/article/view/353
Icnasius, Loyola A.P,. (2014). Pengaruh Kualitas Layanan Akademik Terhadap Kepuasan Mahasiswa Fakultas Ekonomi dan Bisnis Universitas Hasanuddin Makassar. repository.unhas.ac.id
Kotler, Philip. (2002). Manajemen Pemasaran di Indonesia: Analisis, Perencanaan, Implementasi dan Pengendalian. Jakarta. Salemba Empat.
Kotler, Philip. (2003). Marketing Management, 11th Edition. Prentice Hall Int’l, New Jersey Rinala, I Nyoman dkk. (2013). Pengaruh Kualitas Pelayanan Akademik Terhadap Kepuasan Dan Loyalitas
Mahasiswa Pada Sekolah Tinggi Pariwisata Nusa Dua Bali. Program Studi Administrasi Pendidikan, Program Pascasarjana Universitas Pendidikan Ganesha Singaraja, Indonesia.
Sari. D, Bachtiar Asikin. B, danRahmawati, M. (2007). Kualitas pelayanan Pendidikan Dalam Upaya Meningkatkan Loyalitas Mahasiswa Program Studi Akuntansi Diploma III. Laporan Penelitian. Bandung Fakultas Ekonomi Universitas Widyatama
Tjiptono, Fandy. (2001). Strategi Pemasaran. Edisi Pertama. Yogyakarta. Andi Ofset. Tjiptono, Fandy dan Anastasia Diana. (2003). Total Quality Manajemen. Edisi Revisi. Andy: Yogyakarta
______. 2007. Strategi Pemasaran. Edisi Pertama. Yogyakarta. Andi Ofset.