
2017 EdD Grace.pdf - LSBU Open Research
213
Investigation of the efficacy of an online diagnostic tool for improving the diagnosis of ocular fundus lesions imaged by Optical Coherence Tomography (OCT) Paul Grace A thesis submitted in partial fulfilment of the requirements of London South Bank University for the degree of Doctor of Optometry This research programme was carried out in collaboration with the Institute of Optometry (London) July 2017
-
Upload
khangminh22 -
Category
Documents
-
view
2 -
download
0
Transcript of 2017 EdD Grace.pdf - LSBU Open Research
Investigation of the efficacy of an online diagnostic tool for improving the diagnosis of ocular fundus lesions imaged by Optical Coherence
Tomography (OCT)
Paul Grace
A thesis submitted in partial fulfilment of the requirements of London South Bank University for the degree of Doctor of Optometry
This research programme was carried out in collaboration with the Institute of Optometry (London)
July 2017
2
Contents
Abstract .............................................................................................................................. 6
Chapter 1: Introduction .............................................................................................................. 7
Motivation for the present research ........................................................................................ 7
Hypothesis .......................................................................................................................... 9
Aims of the research ............................................................................................................... 9
Structure of the eye .............................................................................................................. 10
Gross Anatomy ................................................................................................................. 10
The retina .......................................................................................................................... 11
Cellular anatomy of the retina .......................................................................................... 12
Anatomic layers of the retina ........................................................................................... 13
Macular disease .................................................................................................................... 16
Age-related macular degeneration ................................................................................... 17
Eye examination ................................................................................................................... 21
Components of eye examination ...................................................................................... 21
Clinical methods of fundus examination .......................................................................... 23
Optical coherence tomography (OCT) ................................................................................. 25
Technology ....................................................................................................................... 25
Optical coherence tomography of the retina .................................................................... 30
Developments ................................................................................................................... 31
The value of OCT in optometric practice ............................................................................. 32
Impact on clinical eyecare and the case for OCT in optometric practice ........................ 32
Clinical applications of OCT in optometric practice ........................................................... 34
Retinal vascular occlusion ................................................................................................ 36
Teleophthalmology ........................................................................................................... 40
Patient education .............................................................................................................. 41
The use of OCT images in research and data protection issues ....................................... 42
Limitations of OCT .......................................................................................................... 42
Chapter 2: Literature review. ................................................................................................... 47
Overview .............................................................................................................................. 47
Search mode and resources .............................................................................................. 47
Optometric diagnosis and management of macular disease ............................................. 50
Philosophies of educational practice .................................................................................... 59
Diagnostic reasoning and clinical decision making ......................................................... 59
Dual processing theory ..................................................................................................... 61
Clinical reasoning in optometric practice ......................................................................... 66
Medical algorithms ........................................................................................................... 68
Non-clinical influences on clinical decision-making ....................................................... 70
VOMIT – “An acronym for our times” ............................................................................ 72
3
E-learning versus traditional teaching .............................................................................. 73
Assessing the efficacy of clinical skills training .................................................................. 74
Assessing practitioners diagnostic skills .......................................................................... 74
Current approaches to OCT training for optometrists .......................................................... 76
Accredited courses ........................................................................................................... 77
Chapter summary ................................................................................................................. 78
Chapter 3: Methods .................................................................................................................. 79
Study design ......................................................................................................................... 79
Ontology and epistemology – the position of the researcher ........................................... 82
Main outcome measures ....................................................................................................... 83
Overview of statistical methods ........................................................................................... 83
Secondary outcome measures .......................................................................................... 84
Participants ........................................................................................................................... 85
Recruitment ...................................................................................................................... 85
Process of randomisation ................................................................................................. 88
Sample size considerations ............................................................................................... 89
Procedure .............................................................................................................................. 91
Ethics approval ................................................................................................................. 91
Incentivising study participants ........................................................................................ 91
Strategies to maximise recruitment and minimise attrition .............................................. 92
The method of vignette presentation - the exam host ...................................................... 95
Masking of participants .................................................................................................. 102
The control intervention ................................................................................................. 102
The “open book exam” ................................................................................................... 103
Setting a pass mark ......................................................................................................... 105
A question of timing ....................................................................................................... 105
Exam sequencing ............................................................................................................ 106
Avoiding bias in the design of OCTAID, clinical vignettes and exam questions .......... 106
Pilot study ........................................................................................................................... 107
Pilot study methods ........................................................................................................ 108
Results of the pilot study ................................................................................................ 110
Feedback from the pilot study participants .................................................................... 111
Monitoring the use of the OCTAID site using Google Analytics (main study) ............ 112
Chapter 4: Development of OCTAID .................................................................................... 113
Back-up of OCTAID ...................................................................................................... 116
Expert panel ........................................................................................................................ 117
Chapter 5: Development of vignettes to assess efficacy of OCTAID .................................... 122
Expert panel ........................................................................................................................ 124
Pilot study ........................................................................................................................... 125
Chapter 7: Results .................................................................................................................. 126
4
Participants and sample size ........................................................................................... 126
General descriptive data ..................................................................................................... 127
Comparative statistics: OCTAID v control ........................................................................ 132
Co-varying for participants prior level of experience .................................................... 135
Novice subgroup ............................................................................................................ 135
Expert subgroup ............................................................................................................. 141
Secondary outcome measures ........................................................................................ 145
Study evaluation from the participants’ viewpoint ........................................................ 150
The OCTAID site – user engagement measured by Google Analytics .......................... 152
Comparative statistics controlling for confounding variables ............................................ 154
Chapter 7: Discussion ............................................................................................................. 156
Summary of results ............................................................................................................. 156
Appraisal of results ............................................................................................................. 161
Comparison with literature ................................................................................................. 163
Strengths and limitations .................................................................................................... 165
Factors affecting recruitment to the study ...................................................................... 165
The position of the researcher ........................................................................................ 166
The position of the participants ...................................................................................... 167
The Control Intervention ................................................................................................ 169
The Exam Modules ........................................................................................................ 170
The OCTAID site ........................................................................................................... 171
Confounding variables ................................................................................................... 172
Conclusions ........................................................................................................................ 173
Recommendations for further work ................................................................................... 175
Diagnostic reasoning ...................................................................................................... 175
Further development of OCTAID – Collaboration as a process of shared creation ...... 175
Appendices ......................................................................................................................... 178
Appendix 1 – Email to potential recruits who subscribe to online optometry forums . 178
Appendix 2 – summary of research (email attachment) ................................................ 179
Appendix 3 – study promotional leaflet (email attachment) .......................................... 180
Appendix 4 – Participant information sheet ................................................................... 183
Appendix 5 – Participant consent form .......................................................................... 186
Appendix 6 – participant OCT prior experience questionnaire ..................................... 187
Appendix 7 – participant post-study information .......................................................... 188
Appendix 8 - Literature search (sources and search engines). ....................................... 189
Appendix 9 – Study participants’ feedback (testimonials) ............................................ 190
Appendix 10 – distribution of data and normality tests for main study outcome .......... 192
Appendix 11 – Sample size calculation .......................................................................... 194
References .......................................................................................................................... 196
Publications presentations .................................................................................................. 211

5
Post Graduate Research Summer School 2014. Conference poster competition. .............. 211
European Academy of Optometry and Optics 2016 (Berlin) ............................................. 212
Research ethics committee documentation ........................................................................ 213
6
Abstract
Background: Novel ocular imaging technology has proliferated within UK community optometry. Optical Coherence Tomography (OCT) is a pillar of ocular imaging, playing a central role in retinal disease management. As a non-invasive method for diagnosis and follow-up of patients with common retinal conditions such as age-related macular degeneration (AMD) and diabetic macular oedema, OCT is well suited to the primary care setting of community optometry.
The novel nature of OCT images presents considerable challenges for community optometrists. AMD prevalence will rise as a consequence of population growth and unprecedented life expectancy and, despite the emergence of novel treatment options, limited clinical capacity threatens access to potentially sight-saving treatment. Limited guidance exists for optometrists using OCT for diagnostic and referral decisions.
Objective: To measure the efficacy of a novel internet resource which, if proven to be efficacious, could not only aid in the use of OCT for diagnosis of retinal disease and subsequent patient management but could also play a role in ongoing training of optometrists.
Method: An online diagnostic tool (OCTAID) was designed for diagnosis of central retinal lesions using OCT. The effectiveness of OCTAID was evaluated by a randomised controlled trial comparing two groups of practitioners who underwent an online assessment (using clinical vignettes) of their diagnostic and management skills based on OCT images before and after an educational intervention. Participants' answers were validated against experts' classifications (the reference standard). OCTAID was randomly allocated as the educational intervention for one group with the control group receiving an intervention of standard OCT material.
Participants: Participants were community optometrists recruited through online optometry forums
Setting: Internet based application
Results: 53 optometrists (study group) and 65 optometrists (control group) completed the study (n = 118), forming the analysis population. Both groups performed similarly at baseline with no significant difference in mean exam 1 scores (p = 0.212). The primary outcome measure was mean improvement in exam score between the two exam modules. Participants who received OCTAID improved their exam score significantly more than those who received conventional educational materials (p = 0.005).
Conclusion: Use of OCTAID is associated with an improvement in the combined skill of OCT scan recognition and subsequent patient management. There is potential for this mode of educational delivery in optometric training.
Future work recommendations: With further development, OCTAID could become a collaborative learner-centred model of OCT education allowing optometrists to take responsibility for their own learning within a unique professional community.
Funding: Self-funded
7
Chapter 1: Introduction In this chapter the author will provide background information on:
The motivation for the research
The study hypothesis
The aims of the research
The anatomy of the eye with particular reference to the anatomic layers of the retina which are imaged by OCT
Macular disease with particular reference to age-related macular degeneration
The optometric eye examination, clinical methods of fundus examination and their limitations
The new imaging technique of optical coherence tomography, its impact on clinical eyecare, the case for its use in optometric practice and its limitations
Motivation for the present research
Motivation refers to the reason or reasons that underlie behaviour and is characterised by
willingness and volition. Broussard and Garrison (2004) provided a broader definition of
motivation as “the attribute that moves us to do or not do something”. Traditionally educators
consider intrinsic motivation to be more desirable and to result in better learning outcomes
than extrinsic motivation (Guay et al, 2010). The intrinsic motivation for this study evolved
after the author introduced the imaging technology of OCT into his optometric practice in
2011. Limited guidance exists for optometrists using OCT for diagnostic and referral
decisions.
Although OCT offers accurate and repeatable information in a qualitative and quantitative
format, a full and accurate diagnosis and management decision by optometrists is not
guaranteed. Limited guidance exists for optometrists using OCT for diagnostic and referral
decisions and because high definition OCT scans reveal retinal detail previously unknown, it
8
is important to establish a general consensus to avoid confusion in daily practice (Gallego-
Pinazo et al. 2013). For the author, the idea of a research question rising from the need to
answer recurring clinical questions was particularly appealing.
Most patients seen in the British hospital eye service are referred by community optometrists
and after such referrals most optometrists typically will continue to see the patient. Feedback
from the ophthalmologist is therefore crucial for both educational purposes and for quality of
care (Whitaker et al. 1999) but reply rates from ophthalmologists to referring optometrists can
sometimes be very poor. In a study carried out at the Institute of Optometry (London)
referrals from 2004 were audited and it was found that even when a reply was specifically
requested (95% of cases) only 13% of these referrals received a reply and no relationship
existed between the reason for referral and the likelihood of reply (Evans et al. 2005).
Feedback has the effect of contributing to the professional development of optometrists and
helping to ensure that inappropriate referrals from primary care optometry to secondary care
ophthalmology are minimised over time (Ingram and Culham, 2001).
An optometrist may not reach a full and accurate diagnosis on every patient encounter but
should maintain the ability to consistently recognise or monitor abnormalities. They should
also be able to establish the urgency of referral and provide the ophthalmologist with good
quality information. Providing accurate, high quality referrals will enhance the respect other
professionals have for optometrists and increase goodwill within the primary and secondary
care relationship. The successful introduction of OCT into optometric practice will require not
only good training and regular use but also a healthy referral relationship between
optometrists and ophthalmologists. Feedback from retinal experts to optometrists’ OCT
related referrals is an essential part of the steep learning curve facing community optometrists
as they struggle to reach consensus.
9
There are capacity issues within specialist macular clinics and these clinics will be subject to
further pressures. If optometric referrals into these clinics are to be timely and appropriate and
if optometrists are to expand their role into co-management of AMD patients, they will
require non-invasive imaging technology such as OCT and the skills to use it effectively.
Hypothesis
In the present era of rapidly evolving imaging technology, expanding treatment options for
retinal disease and resulting changes in patient management plans (and referral protocols),
today’s optometric educators face the challenge of delivering knowledge and training to
optometrists in an efficient and timely manner. We hypothesise that the internet delivery (e-
learning) of such knowledge and training is the mode best suited to the delivery of OCT
education and information can be revised and updated quickly in response to new research
findings or expert opinion.
We further hypothesise that a diagnostic guide illustrating OCT images of retinal diseases (at
various stages) commonly presenting to community optometrists along with patient
management decisions should take the form of a website which takes account of current
models of clinical reasoning. Such an internet resource has the potential to aid in OCT image
interpretation and subsequent patient management. If proven efficacious, this resource could
also play a role in ongoing training of optometrists in retinal disease.
Aims of the research The aims of the research were to:
1. Develop and test an online diagnostic guide with the aim of improving the diagnosis
and optometric management of central retinal lesions using OCT and monitor its use
(as a secondary outcome measure) by the use of participant questionnaires and Google
Analytics software.
10
2. Design an online assessment in the form of 'Visual Recognition and Investigation of
Clinical Signs' (VRICS) and based on OCT images. The assessment adopted a
stepwise approach for a diagnosis and management plan, similar to a clinical vignette,
and questions were presented in multiple choice format. Participant questionnaire
feedback on the overall value of the study to optometric practice (and on its value as
an educational event) was also collected.
3. Conduct a randomised controlled trial comparing two groups of practitioners who took
part in an online assessment of their diagnostic and management skills based on OCT
images before and after educational intervention. The diagnostic guide was randomly
allocated to one group with the control group receiving a control intervention.
Structure of the eye
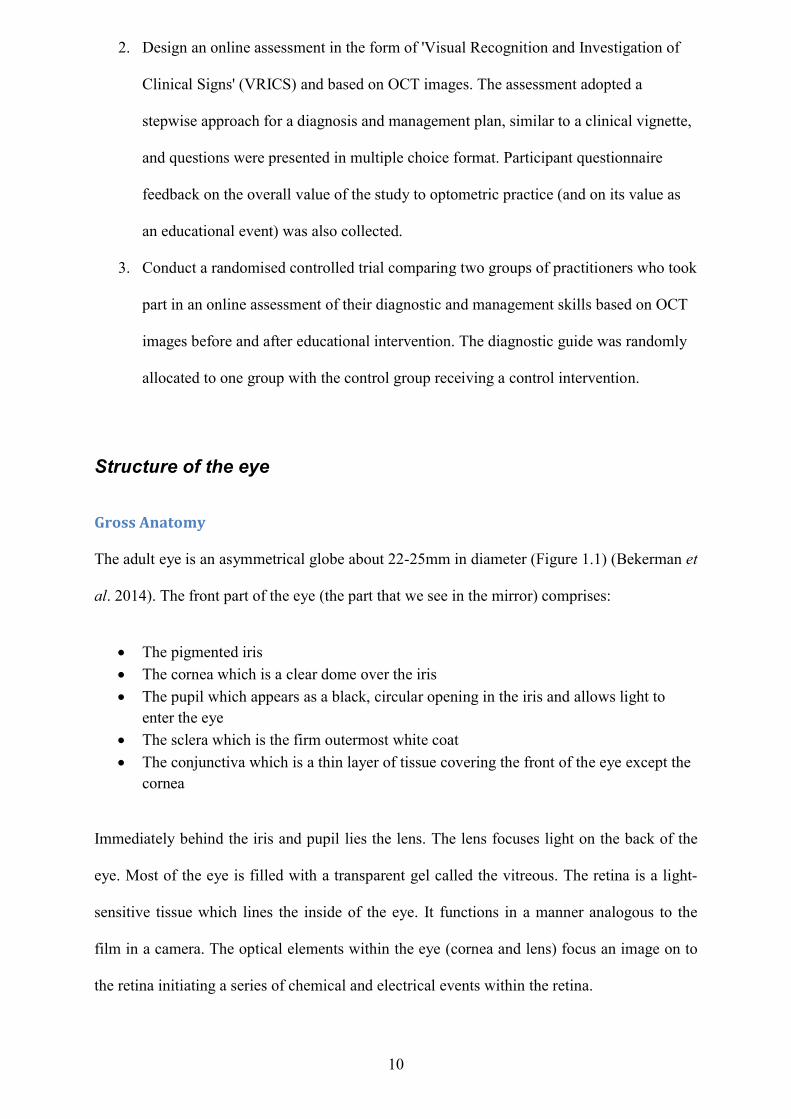
Gross Anatomy The adult eye is an asymmetrical globe about 22-25mm in diameter (Figure 1.1) (Bekerman et
al. 2014). The front part of the eye (the part that we see in the mirror) comprises:
The pigmented iris
The cornea which is a clear dome over the iris
The pupil which appears as a black, circular opening in the iris and allows light to enter the eye
The sclera which is the firm outermost white coat
The conjunctiva which is a thin layer of tissue covering the front of the eye except the cornea
Immediately behind the iris and pupil lies the lens. The lens focuses light on the back of the
eye. Most of the eye is filled with a transparent gel called the vitreous. The retina is a light-
sensitive tissue which lines the inside of the eye. It functions in a manner analogous to the
film in a camera. The optical elements within the eye (cornea and lens) focus an image on to
the retina initiating a series of chemical and electrical events within the retina.
11
Figure 1.1 – Gross anatomy of the eye
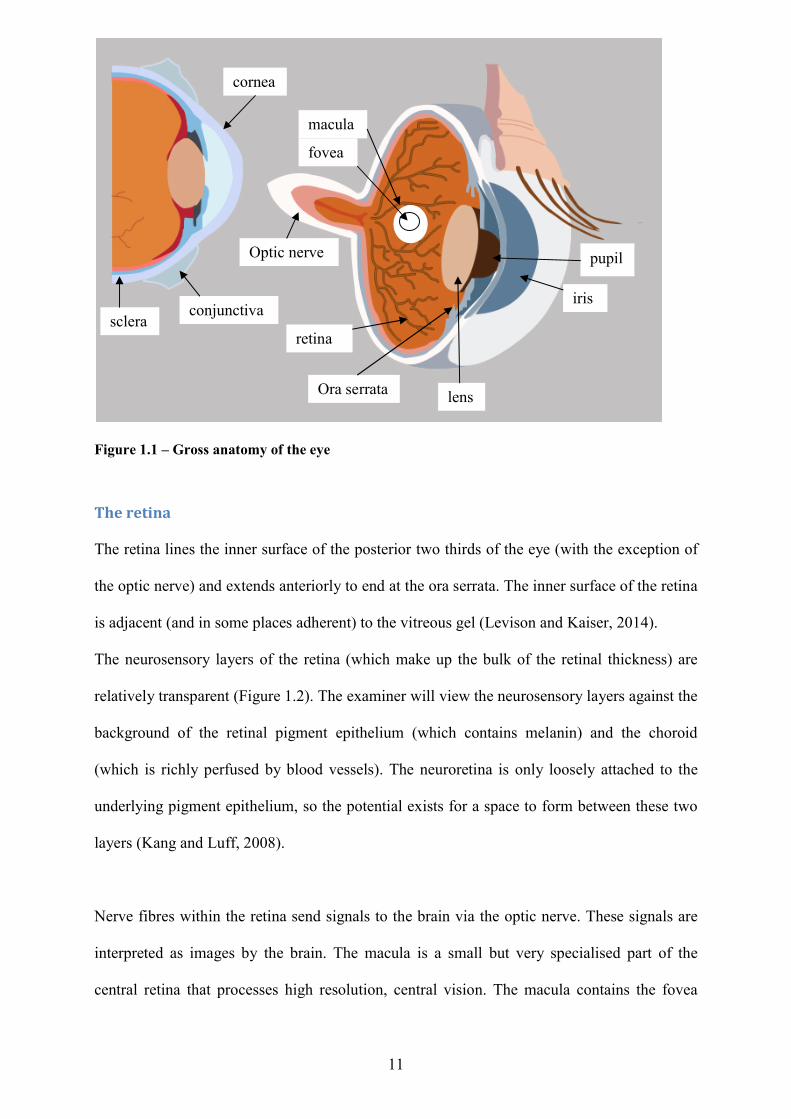
The retina The retina lines the inner surface of the posterior two thirds of the eye (with the exception of
the optic nerve) and extends anteriorly to end at the ora serrata. The inner surface of the retina
is adjacent (and in some places adherent) to the vitreous gel (Levison and Kaiser, 2014).
The neurosensory layers of the retina (which make up the bulk of the retinal thickness) are
relatively transparent (Figure 1.2). The examiner will view the neurosensory layers against the
background of the retinal pigment epithelium (which contains melanin) and the choroid
(which is richly perfused by blood vessels). The neuroretina is only loosely attached to the
underlying pigment epithelium, so the potential exists for a space to form between these two
layers (Kang and Luff, 2008).
Nerve fibres within the retina send signals to the brain via the optic nerve. These signals are
interpreted as images by the brain. The macula is a small but very specialised part of the
central retina that processes high resolution, central vision. The macula contains the fovea
pupil
iris
macula
fovea
retina
Optic nerve
cornea
conjunctiva sclera
lens Ora serrata

12
which is a small depression at the centre of the macula that has the greatest concentration of
photoreceptors and thus provides maximum acuity (Provis et al. 2013).
The average healthy retina will vary in thickness depending on retinal location. The thickness
immediately temporal to the optic disc is approximately 250 microns. The thickest part of the
retinal is surrounding the fovea (400 microns approximately) and the thinnest part of the
central retina is within the centre of the fovea itself (170 microns approximately) (Gella et al.
2015). The retina does however become thinner towards the periphery (80 microns at the ora
serrata).
Cellular anatomy of the retina The cells of the retina may be divided into three basic cell types: photoreceptor cells, neural
cells and glial cells. Photoreceptor cells consist principally of rods and cones. Cones function
best under bright (daytime; photopic) conditions and generate colour vision. Rods function
mainly in dim light (scotopic) and deliver non-colour (black and white) vision. The human
retina consists of approximately 120 million rods and 6 million cones (Hood and Birch,
1995). Each cone and rod cell contains photoreceptor elements and an axon. Each
photoreceptor portion is divided into an inner and outer segment with the photoreceptor inner
segment containing the cell nucleus. The central retina is cone-dominated, whereas the
peripheral retina is rod-dominated. The centre of the macula contains the fovea. The fovea is a
‘pit’ where the cones are most densely packed and are arranged to provide the highest and
most efficient optical density.
The retinal ganglion cells, which represent a third class of photoreceptors, are photosensitive
cells involved in responses to light that do not relate to image formation such as contributing
to the regulation of pupil size and synchronisation of circadian rhythms to the light-dark cycle
(Fu et al. 2005).

13
The neural cells of the retina include:
Bipolar cells, which are located entirely within the retina, connect the photoreceptors
to the ganglion cells. They are perpendicular to the retinal surface and are therefore
vertically orientated. Bipolar cells are post-synaptic to the rods and cones. There are at
least 13 distinct types of bipolar cells, each of which transforms photoreceptor input in
a different way (Euler et al. 2014).
Ganglion cells terminate in dendrites which synapse with bipolar cells. Ganglion cell
axons become the nerve fibre layer within the retina and become optic nerve fibres
which terminate in the brain.
Horizontal cells, which are oriented parallel to the retinal surface, connect bipolar cells
with each other and are located in the outer plexiform layer of the retina.
Amacrine cells, which function within the inner plexiform layer, connect bipolar and
ganglion cells. Therefore, the inner plexiform layer represents the second synaptic
layer of the retina. Most amacrine cells lack axons and are horizontally orientated.
Both amacrine cells and horizontal cells serve to integrate and modulate the visual
message presented to the ganglion cells (Kolb,1997).
The retina also contains cells such as Muller cells, astrocytes and microglial cells which
perform a supporting matrix throughout the retina (Vecino et al. 2016). Muller cells are the
principal glial cells of the retina. Muller cell bodies are located in the inner nuclear layer but
their processes project in either direction to form the inner and outer limiting membranes.
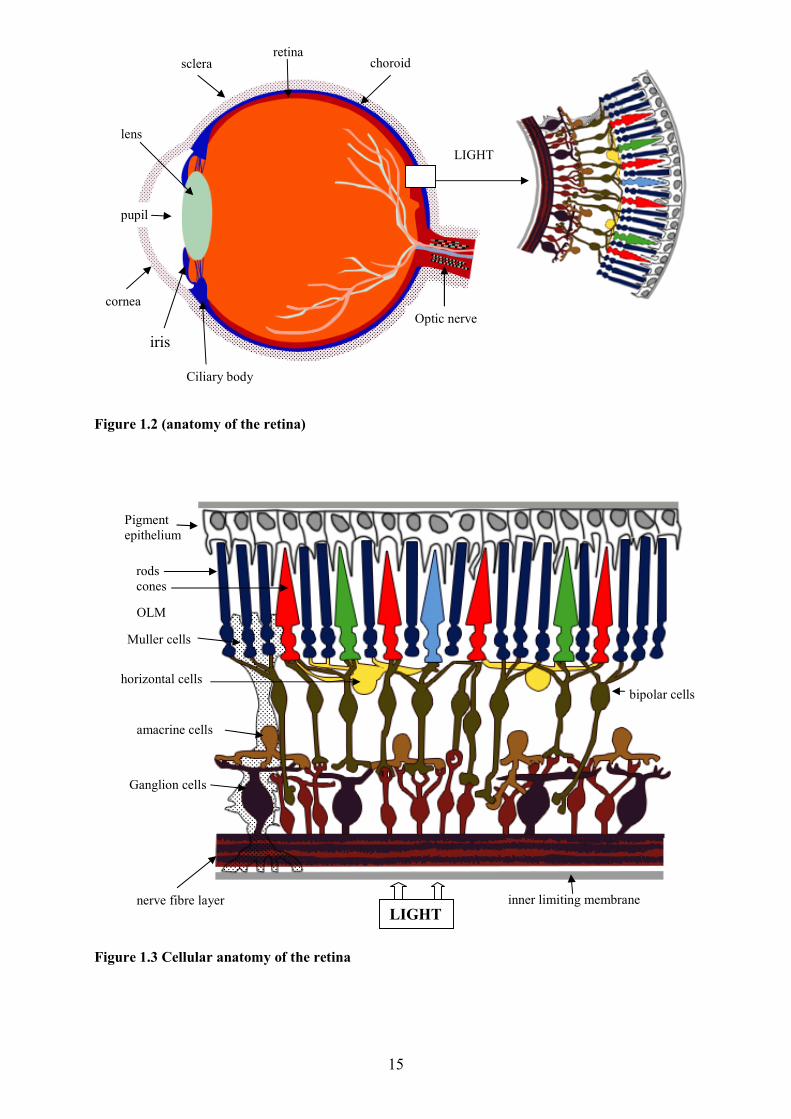
Anatomic layers of the retina There are ten named microscopic layers of the human retina (Figure 1.3) containing various
structures. Starting with the innermost layer (adjacent to the vitreous), these layers are:
1. The inner limiting membrane – formed of astrocytes, footplates of Muller cells, and a
basal lamina.

14
2. The nerve fibre layer – the ganglion cell axon fibres.
3. The ganglion cell layer – the nuclei of ganglion cells. Some of these ganglion cells are
photosensitive.
4. The inner plexiform layer – contains the synapses between the dendrites of ganglion
cells and amacrine cells. This layer also contains the axons of bipolar cells.
5. The inner nuclear layer – contains the nuclei of horizontal, bipolar and amacrine cells.
This layer is thicker in the centre of the retina owing to the increased density of cone-
connecting bipolar cells. Horizontal cells and amacrine cells concerned with cone
pathways are smaller and more closely packed in the central retina. The nuclei of
supporting Muller cells are also found in the inner nuclear layer.
6. The outer plexiform layer – contains the axons of the rods and cones. It also contains
the dendrites of horizontal and bipolar cells and synapses occur among these structures
within this layer. The outer plexiform layer is therefore sometimes referred to as the
outer synaptic layer and in the macular area it is termed the fibre layer of Henle.
7. The outer nuclear layer – consists of the cell bodies of rods and cones. In the central
retina the cone cell bodies outnumber the rods whereas the reverse is true of the
peripheral retina.
8. The outer limiting membrane (OLM) – this layer separates the inner segment portions
of the photoreceptors from their cell nuclei.
9. The rod and cone layer – this layer consists of the inner and outer segments of the rod
and cone photoreceptor cells.
10. The retinal pigment epithelium (RPE) - this is the most external layer of the retina and
consists of a single layer of supporting cells for the neural retina. RPE cells contain
melanin which absorbs light and minimises light scatter within the eye.
15
Figure 1.2 (anatomy of the retina)
Figure 1.3 Cellular anatomy of the retina
pupil
retina choroid sclera
lens
cornea
iris
Ciliary body
Optic nerve
LIGHT
Pigment epithelium
rods cones
OLM
Muller cells
horizontal cells bipolar cells
amacrine cells
Ganglion cells
inner limiting membrane nerve fibre layer LIGHT
16
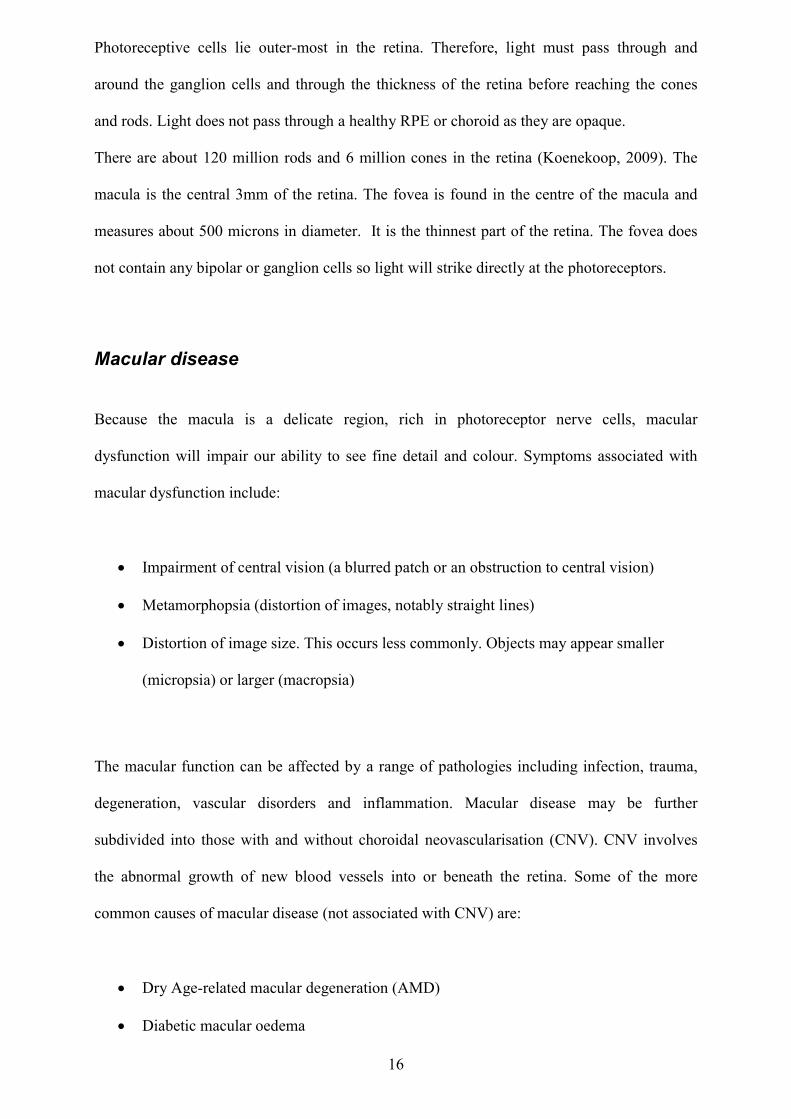
Photoreceptive cells lie outer-most in the retina. Therefore, light must pass through and
around the ganglion cells and through the thickness of the retina before reaching the cones
and rods. Light does not pass through a healthy RPE or choroid as they are opaque.
There are about 120 million rods and 6 million cones in the retina (Koenekoop, 2009). The
macula is the central 3mm of the retina. The fovea is found in the centre of the macula and
measures about 500 microns in diameter. It is the thinnest part of the retina. The fovea does
not contain any bipolar or ganglion cells so light will strike directly at the photoreceptors.
Macular disease Because the macula is a delicate region, rich in photoreceptor nerve cells, macular
dysfunction will impair our ability to see fine detail and colour. Symptoms associated with
macular dysfunction include:
Impairment of central vision (a blurred patch or an obstruction to central vision)
Metamorphopsia (distortion of images, notably straight lines)
Distortion of image size. This occurs less commonly. Objects may appear smaller
(micropsia) or larger (macropsia)
The macular function can be affected by a range of pathologies including infection, trauma,
degeneration, vascular disorders and inflammation. Macular disease may be further
subdivided into those with and without choroidal neovascularisation (CNV). CNV involves
the abnormal growth of new blood vessels into or beneath the retina. Some of the more
common causes of macular disease (not associated with CNV) are:
Dry Age-related macular degeneration (AMD)
Diabetic macular oedema
17
Macular hole
Epiretinal membrane
Central serous chorioretinopathy
Some of the more common causes of macular disease (associated with CNV) are:
Wet age-related macular degeneration
Macular degeneration associated with high myopia
Idiopathic CNV
Polypoidal choroidal vasculopathy
Choroiditis (which may have a variety of underlying causes)
Macular disease has a widely variable clinical presentation and a sometimes unpredictable
natural history and these are important confounding features when making a correct diagnosis
(Ferrara et al. 2008). An accurate and specific diagnosis is important due to the high
variability in visual prognosis and treatment options among the different disease entities.
Differential diagnosis can be challenging and quite often impossible on a clinical basis. For
example, AMD is the leading cause of blindness in the developed world (Carneiro and
Andrade, 2017) but many other disease entities have similar clinical signs and manifestations.
New imaging techniques such as optical coherence tomography are helpful in identifying
fundamental diagnostic features of AMD and the conditions that can mimic AMD.
Age-related macular degeneration The term ‘retinal disease’ describes a range of conditions affecting the retina. Age-related
macular degeneration (AMD) is a serious retinal disorder which results in progressive loss of
central vision. AMD accounts for more than half of all blind registrations in England and
Wales (Bunce and Wormald, 2006). In an update to these figures (based on data collected
18
between April 2007 and March 2008), Bunce, Xing and Wormald (2010) state that AMD is
still by far the leading cause of certified visual loss in England and Wales and that data based
on certification only documents people who are sufficiently sight-impaired to warrant support
(these figures are not estimates of the total numbers of newly blind people because not all
people are offered or accept certification). Wilde et al.(2017) suggest that advanced AMD
occurs more commonly in the UK Caucasian population than previously reported because
significant asymmetry occurs between the two eyes in patients with unilateral advanced
AMD. This results in visual impairment statistics not representing true prevalence of
advanced AMD.
AMD is classified into ‘dry’ and ‘wet’ forms of disease, the wet form being more aggressive
and destructive to vision. There are approximately 26,000 new cases of wet AMD each year
in the UK (Amoaku et al. 2012). The dry type affects approximately 85 to 90% of individuals
with AMD and tends to progress more slowly than the wet type (Michalska-Malecka et al.
2015). Wet AMD is caused by growth of abnormal blood vessels (which bleed and leak fluid)
under the retina. It affects approximately 10 to 15% of AMD sufferers but accounts for 90%
of all cases of severe visual loss from AMD (Soubrane et al. 2007).
Wet AMD can lead to a significant loss of vision within a very short period of time and such
visual loss can have a profound impact on an individual's quality of life and independence
(Mitchell and Bradley, 2006). The combined demographic impact of population growth,
population aging and unprecedented life expectancy seems certain to ensure an increase in
AMD prevalence (Michalska-Malecka et al. 2015). These changing demographics are
illustrated in Figure 1.4.
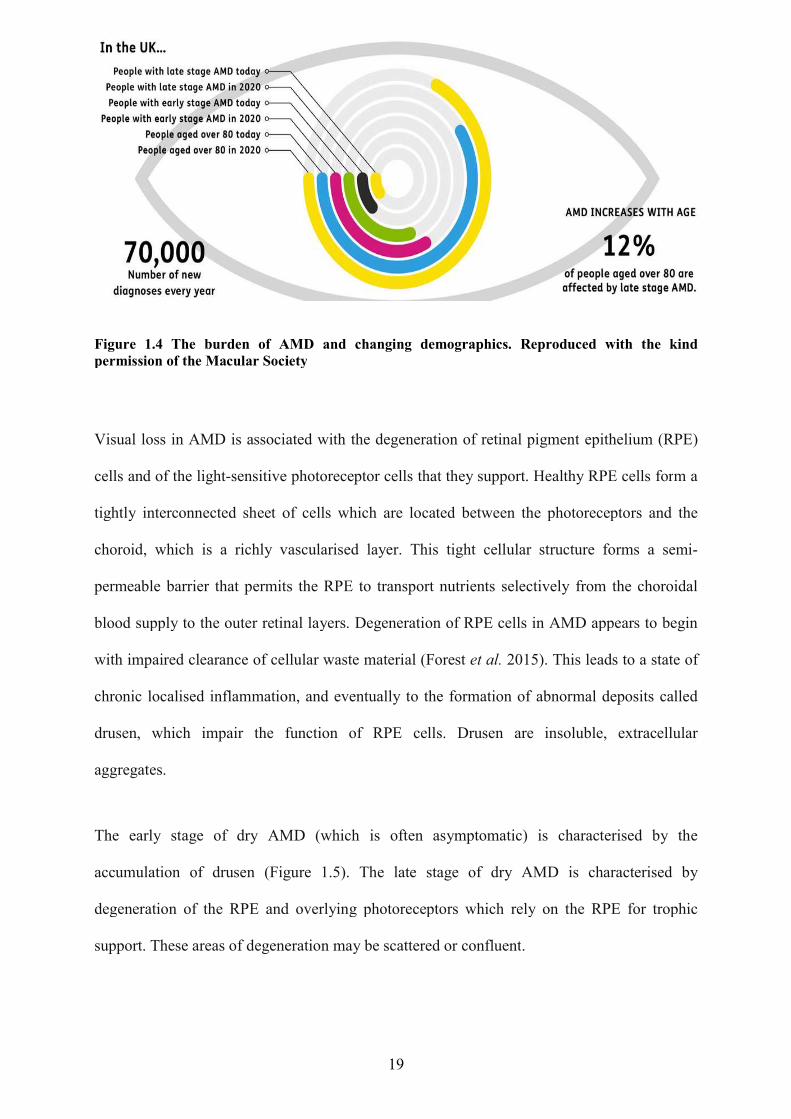
Figure 1.4 The burden of AMD and changing demographicspermission of the Macular Society
Visual loss in AMD is associated with the d
cells and of the light-sensitive
tightly interconnected sheet of cells which are located between the photoreceptors and the
choroid, which is a richly vascular
permeable barrier that permits the RPE t
blood supply to the outer retinal layers.
with impaired clearance of cellular waste material
chronic localised inflammation
drusen, which impair the function of RPE cells
aggregates.
The early stage of dry AMD (which is often asymptomatic)
accumulation of drusen (Figure 1.5)
degeneration of the RPE and overlying photoreceptors which rely on the RPE for trophic
support. These areas of degeneration may be scattered or confluent
19
burden of AMD and changing demographics. Reproduced with the kind permission of the Macular Society
in AMD is associated with the degeneration of retinal pigment
sensitive photoreceptor cells that they support. Healthy RPE cells for
tightly interconnected sheet of cells which are located between the photoreceptors and the
vascularised layer. This tight cellular structure forms a semi
permeable barrier that permits the RPE to transport nutrients selectively from the choroidal
blood supply to the outer retinal layers. Degeneration of RPE cells in AMD appears
with impaired clearance of cellular waste material (Forest et al. 2015). This leads to a state of
ised inflammation, and eventually to the formation of abnormal dep
which impair the function of RPE cells. Drusen are insol
The early stage of dry AMD (which is often asymptomatic) is characterised by the
(Figure 1.5). The late stage of dry AMD is characterised by
degeneration of the RPE and overlying photoreceptors which rely on the RPE for trophic
support. These areas of degeneration may be scattered or confluent.
. Reproduced with the kind
egeneration of retinal pigment epithelium (RPE)
Healthy RPE cells form a
tightly interconnected sheet of cells which are located between the photoreceptors and the
layer. This tight cellular structure forms a semi-
o transport nutrients selectively from the choroidal
ration of RPE cells in AMD appears to begin
his leads to a state of
, and eventually to the formation of abnormal deposits called
Drusen are insoluble, extracellular
is characterised by the
. The late stage of dry AMD is characterised by
degeneration of the RPE and overlying photoreceptors which rely on the RPE for trophic
20
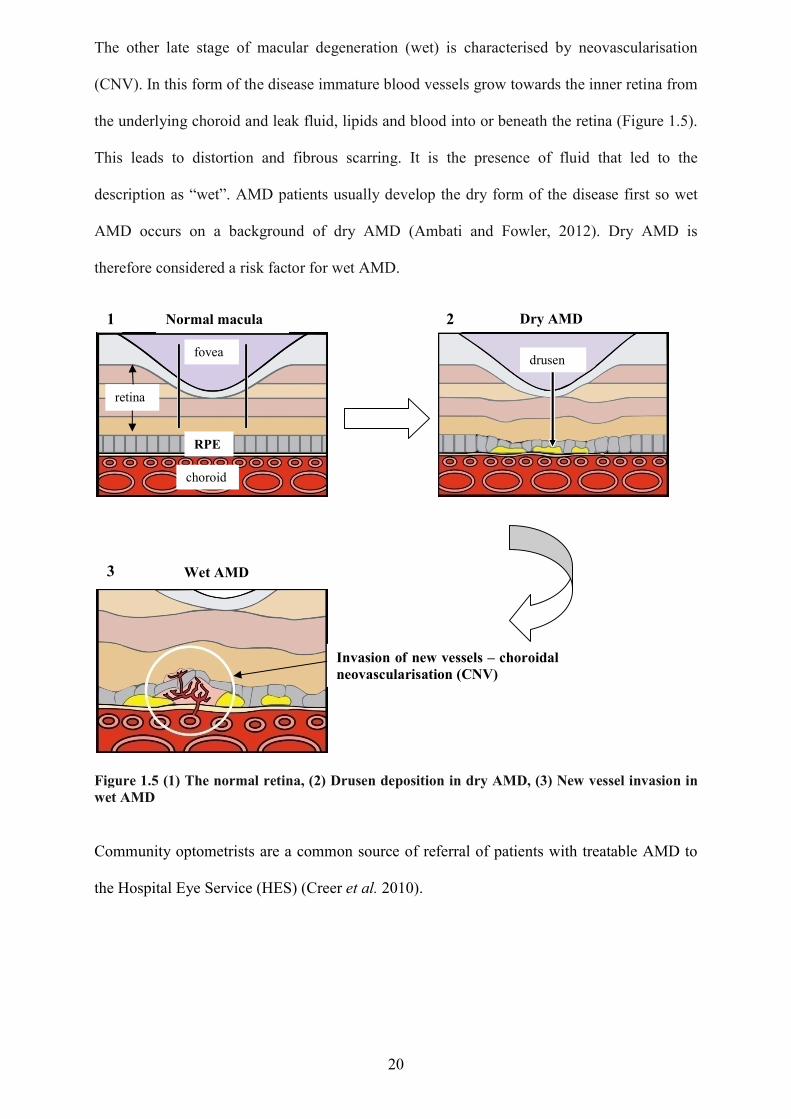
The other late stage of macular degeneration (wet) is characterised by neovascularisation
(CNV). In this form of the disease immature blood vessels grow towards the inner retina from
the underlying choroid and leak fluid, lipids and blood into or beneath the retina (Figure 1.5).
This leads to distortion and fibrous scarring. It is the presence of fluid that led to the
description as “wet”. AMD patients usually develop the dry form of the disease first so wet
AMD occurs on a background of dry AMD (Ambati and Fowler, 2012). Dry AMD is
therefore considered a risk factor for wet AMD.
Figure 1.5 (1) The normal retina, (2) Drusen deposition in dry AMD, (3) New vessel invasion in wet AMD
Community optometrists are a common source of referral of patients with treatable AMD to
the Hospital Eye Service (HES) (Creer et al. 2010).
RPE
fovea
retina
choroid
Normal macula Dry AMD
drusen
Wet AMD
Invasion of new vessels – choroidal neovascularisation (CNV)
1 2
3
21
Eye examination
Components of eye examination Periodic eye and vision examinations are considered part of preventative health care and a
complete eye examination involves a series of tests to evaluate the vision and detect eye
diseases. Many eye and vision problems have no obvious signs or symptoms and individuals
are often unaware that problems exist. The routine eye examination is an important tool in the
detection of asymptomatic eye disease and optometrists check opportunistically for disease of
the eye and elsewhere (Blakeney, 2012). Early diagnosis and treatment of vision problems are
important not only for maintaining good vision and prevention of visual loss but also for the
maintenance of good eye and general health (Grover, 2017).
Most eye examinations will commence by the examining optometrist asking the patient if
there is a specific reason why they are attending or if the consultation is simply routine.
Accurate history taking is as important in optometry as in any other field of medicine and if a
patient is experiencing problems, the optometrist will need to know what symptoms the
patient has, how long they have been experiencing them and whether any changes have
happened suddenly or gradually. The optometrist will also require information on the patient’s
general health and any medications they may be taking. The patient will also be asked about
close relatives who may have a history of eye diseases such as glaucoma.
According to the College of Optometrists guidelines, the exact format and content of an eye
examination is determined by both the professional's personal judgement and the minimum
legal requirements but as a minimum, a full eye examination should always include an
internal examination of the eye (College of Optometrists, 2017). This is legally underpinned
by the Opticians Act of 1948 which states that a key function of the eye examination is “to
perform, for the purpose of detecting signs of injury, disease or abnormality in the eye or
22
elsewhere, an intra-ocular examination, either by means of an ophthalmoscope or by such
other means as the doctor or optometrist considers appropriate”.
The retina is the only part of the central nervous system visible from the exterior and the
ocular fundus is the only location where the internal vasculature may be visualised. Much of
what can be seen in internal medicine is related to the vasculature so viewing the fundus is an
ideal way of getting a sense of the patient’s overall vascular health (Abramoff et al.2010).
In a letter to the British Medical Journal, Clarke (2014) opines that ophthalmology receives
more outpatient NHS referrals than any other speciality except trauma and orthopaedics and a
significant underlying reason for this lies in the model of eyecare under which optometrists
practice and are regulated in the UK. Under section 26 of the Opticians Act (revised in 1989),
an optometrist carrying out an NHS sight test must “perform such examinations of the eye for
the purpose of detecting injury, disease or abnormality in the eye” and “immediately
following the test to give the person whose sight he/she has tested a written statement – (i)
that he has carried out the examinations that the regulations require and (ii) that he is or is not
referring the patient to a registered medical practitioner”. Clarke believes that this is often
interpreted to mean that an optometrist conducting an NHS sight test has a responsibility to
refer any patient in whom an ocular disorder is detected to a medical practitioner and that
optometrists are “unconstrained by any disincentives to refer patients”. Clarke claims that as a
consequence, the work of optometrists consumes a considerable amount of NHS resources.
Clarke goes on to state that these so called “eye health checks” have never been subject to the
scrutiny of the UK National Screening Committee. However, it should be noted that
optometrists do not screen for disease in the true sense of the word but rather “case find” in
that they only examine people who present to their practices rather than all those at risk in a
population.
23
There is undoubtedly some benefit for patients with asymptomatic disease who may have
their eye disease detected early but Clarke cites a high rate of false positive referrals as the
price often paid (in terms of societal cost and patient anxiety) for the current model of NHS
optometric eyecare. A false positive is a test result which wrongly indicates that a particular
condition or attribute is present.
Clarke also suggests that General Practitioners may now feel less able to exercise their usual
gate-keeping function for patients referred by optometrists because of increasing
specialisation in optometry marked by new technology and terminology (GPs often have
minimal formal training in ophthalmology) (Baker et al. 2016).
The current study is centred on the need to minimise any waste which might be generated by
unnecessary referrals from ‘scattergun’ case finding of patients attending for OCT imaging at
optometric practices.
Clinical methods of fundus examination Examination of the ocular fundus is an essential skill for all eye clinicians and a basic fundus
examination may be carried out with an ophthalmoscope. Although many practitioners have
become familiar with some form of indirect ophthalmoscopy and biomicroscopy, the direct
hand-held ophthalmoscope is still a common instrument of choice for fundus examination.
The process of indirect ophthalmoscopy is so-called because the fundus is viewed through a
hand-held condensing lens. The image formed is close to the principle focus of the lens,
between the lens and the observer. The merits of direct versus indirect ophthalmoscopy are
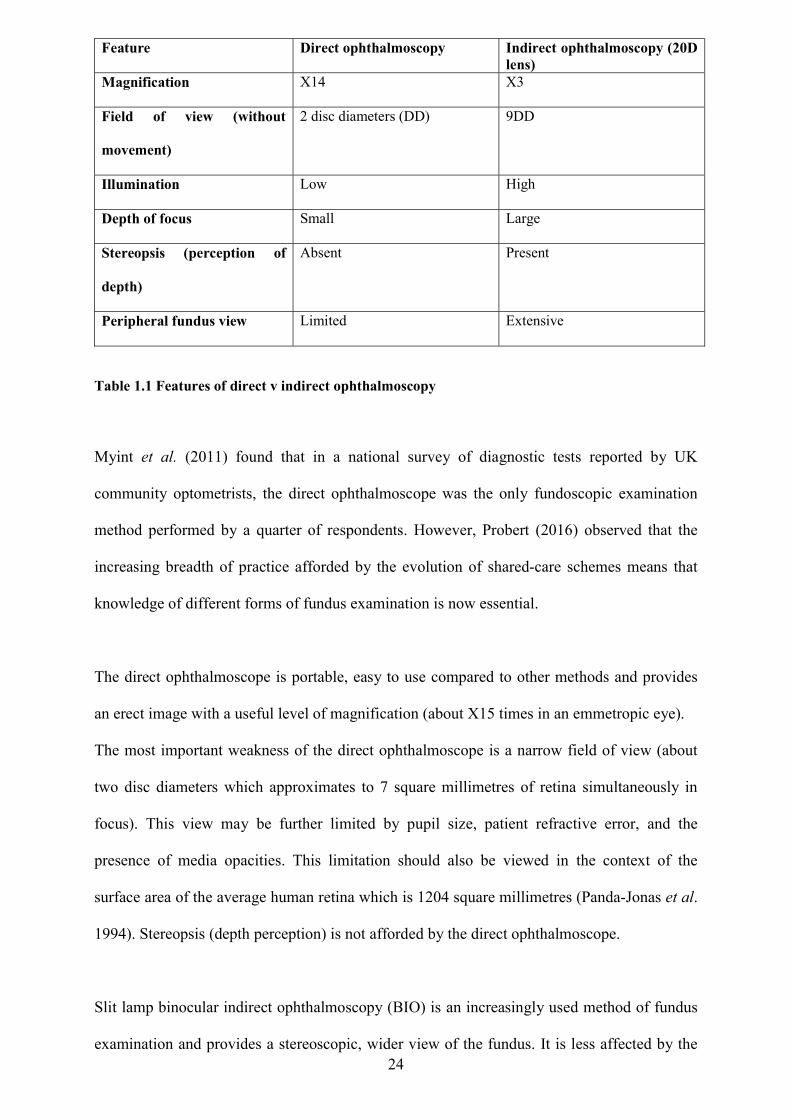
summarised in Table 1.1.
24
Feature Direct ophthalmoscopy Indirect ophthalmoscopy (20D lens)
Magnification X14 X3
Field of view (without
movement)
2 disc diameters (DD) 9DD
Illumination Low High
Depth of focus Small Large
Stereopsis (perception of
depth)
Absent Present
Peripheral fundus view Limited Extensive
Table 1.1 Features of direct v indirect ophthalmoscopy
Myint et al. (2011) found that in a national survey of diagnostic tests reported by UK
community optometrists, the direct ophthalmoscope was the only fundoscopic examination
method performed by a quarter of respondents. However, Probert (2016) observed that the
increasing breadth of practice afforded by the evolution of shared-care schemes means that
knowledge of different forms of fundus examination is now essential.
The direct ophthalmoscope is portable, easy to use compared to other methods and provides
an erect image with a useful level of magnification (about X15 times in an emmetropic eye).
The most important weakness of the direct ophthalmoscope is a narrow field of view (about
two disc diameters which approximates to 7 square millimetres of retina simultaneously in
focus). This view may be further limited by pupil size, patient refractive error, and the
presence of media opacities. This limitation should also be viewed in the context of the
surface area of the average human retina which is 1204 square millimetres (Panda-Jonas et al.
1994). Stereopsis (depth perception) is not afforded by the direct ophthalmoscope.
Slit lamp binocular indirect ophthalmoscopy (BIO) is an increasingly used method of fundus
examination and provides a stereoscopic, wider view of the fundus. It is less affected by the
25
presence of media opacities but the image provided is inverted and reversed and more
difficult to visualise through small pupils. This technique is more difficult to perform and
requires a slit lamp microscope (therefore not portable). An even wider field of view can be
achieved (at the expense of magnification) by binocular indirect ophthalmoscopy if the source
of illumination is head-mounted. This technique is particularly useful when the peripheral
retina needs to be examined for signs of detachment.
Contact lens ophthalmoscopy is an additional method of observing the peripheral retina but is
mainly practiced by hospital clinicians. Fundus examination can be greatly enhanced for all
techniques by the use of topical mydriatics (drugs which dilate the pupil).
Ocular imaging technology is now common in optometric practices but thorough fundus
examination remains a key component of an eye examination. Macular disease and other
posterior pole pathologies are leading causes of visual impairment and blindness worldwide.
In some cases, prompt ophthalmological care may be required. However, inefficient and
inappropriate referrals between primary eye care practitioners and ophthalmologists may
inhibit timely access to ophthalmology treatment centres. Ly et al. (2016) suggest that if
optometrists with a special interest in macular disease were to form an intermediate-tier
optometric imaging clinic, they would be well placed to better refine referrals and recommend
best management plans for patients with suspected macular disease.
Optical coherence tomography (OCT)
Technology This section describes the optical imaging technique of optical coherence tomography.
Most pathological conditions elicit changes in the tissue optical response that may be
investigated by one or more imaging modalities (Park et al. 2010). OCT is an optical imaging
technology which relies on the penetration and backscattering of light into tissue to construct
26
cross-sectional, tomographic images. Tissue is relatively opaque for visible light wavelengths
but is somewhat less absorbing at wavelengths of light near infrared (Fujimoto et al. 1995).
Imaging depth in OCT is limited by optical scattering rather than absorption because
scattering causes attenuation of the light signal (Schmitt et al. 1994). Scattering of light is
also strongly dependent on wavelength. The use of optimised wavelengths (1300nm) can
achieve imaging depths of 1 to 2mm in most tissues (Medina et al. 2014). This is shallow
compared to other imaging modalities such as ultrasound but is sufficient for many clinical
diagnostic applications such as ophthalmology. Because of the high transmissivity of ocular
media, depth penetration is considerable and this explains why OCT is used mainly in
eyecare. For instance, the corresponding application in dermatology is hindered by strong
scattering of light by epidermal tissue (Sudheendran et al. 2010). For tissue imaging, radiation
source wavelengths are restricted to the visible red and near-infrared (600 to 1300nm). This is
referred to as the 'therapeutic window' where tissue absorption is limited (Gambichler et al.
2010).
OCT is often described as the optical analogue of ultrasound because it generates images
using the time delay and magnitude of light echoes (Fujimoto and Swanson, 2016).
Ultrasound terms such as A-Scan and B-Scan have exact analogues in OCT. In simple terms,
A stands for amplitude and B stands for brightness. In an A-Scan the energy reflected back to
a probe will give a curve or amplitude. Higher peaks or waves correspond to more energy or
signal. In a B-Scan, the more energy returned the brighter the peak (or spot) displayed. The
two are often combined to give more information. This results in a repeating wave form that
also has brightness making it easier to read and interpret.
OCT is based on an optical technique known as Michelson low coherence interferometry
which measures echo delay and intensity of back-reflected or back-scattered infrared radiation
(800nm approx) from internal ocular microstructure. Differences in echo time and intensity
between the reflected light signal and that from a reference path are measured and converted
27
into high resolution images. The resolution can be as fine as 3 microns (Medina et al. 2014)
and OCT equipment achieving this level of axial resolution is now commercially available.
Even early versions of OCT equipment were achieving levels of axial resolution which could
not be achieved in living organisms by any other imaging modality (Fujimoto et al. 1995).
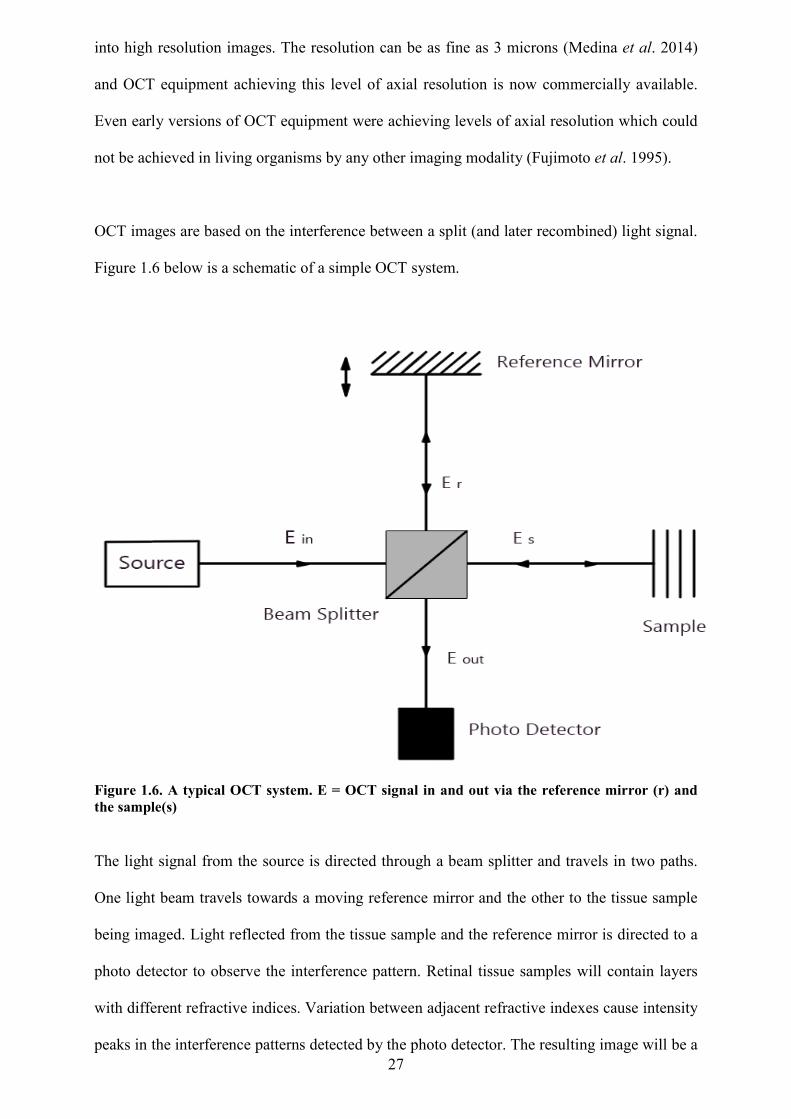
OCT images are based on the interference between a split (and later recombined) light signal.
Figure 1.6 below is a schematic of a simple OCT system.
Figure 1.6. A typical OCT system. E = OCT signal in and out via the reference mirror (r) and the sample(s)
The light signal from the source is directed through a beam splitter and travels in two paths.
One light beam travels towards a moving reference mirror and the other to the tissue sample
being imaged. Light reflected from the tissue sample and the reference mirror is directed to a
photo detector to observe the interference pattern. Retinal tissue samples will contain layers
with different refractive indices. Variation between adjacent refractive indexes cause intensity
peaks in the interference patterns detected by the photo detector. The resulting image will be a
28
line scan (sometimes referred to as an A-scan) of depth of the 3D volume to be analysed.
Multiple A-scans may then be used to construct 2-D cross-sections and 3-D volumes of the
tissue being imaged.
In its most basic form there are two types of OCT imaging system, namely the time-domain
OCT (TD-OCT) and the Fourier-Domain (sometimes referred to as Spectral-Domain) OCT.
In TD OCT a reference mirror is translated to match the optical path from reflections within
the sample (Figure 1.6). The range of depth is sampled one point at a time by moving the
reference mirror to produce an axial scan (A-Scan). This kind of serial sampling imposes
limits on the speed and sensitivity of imaging. The new Spectral-domain OCT (SD-OCT) is
faster and more efficient than TD-OCT because it detects reflections from the entire tissue
depth range simultaneously by employing a spectrometer in the receiver. The spectrometer
analyses the spectrum of reflected light signal and transforms it into information about the
depth of cellular structures within the tissue sample (Chen et al. 2005). The SD technology
eliminates the need to mechanically move the reference arm of the system with a resulting
increase in the speed with which images are received and the axial resolution achieved.
Because of not having any moving parts, the speed of SD-OCT systems in acquiring images is
very high in comparison to TD-OCT and this increase in resolution and scanning speed
permits high-density raster scanning of retinal tissue while minimising eye movement
artefacts (Schuman, 2008).
The arrival of modern ocular medical imaging technologies has enhanced both the diagnosis
and management of eye disease and the landscape of clinical eyecare is continuously being
affected by the broadening frontier of technology used in ocular imaging (Nadler et al. 2012).
With increasingly sophisticated technologies, eyecare professionals have never been better
placed to offer the highest standards in eye healthcare. One of the most exciting developments
in retinal imaging in recent years has been optical coherence tomography (OCT).
29
OCT was first described by Huang et al. (1991). It has since become a key diagnostic
technology in the ophthalmic subspeciality area of retinal disease. OCT is used widely in the
healthcare field, but particularly in eyecare because of the high transmissivity of healthy
ocular media. Costa et al. (2006) suggested two properties of OCT data which explained its
widespread adoption:
The results are accessible to the non-specialist where microscopic defects are grossly
and easily noticeable
Results are reproducible and quantitative in the hands of the specialist
In modern time-domain OCT technology, two or three dimensional cross-sectional
tomographic images of optical reflectivity are captured by this non-invasive, non-contact
technique thus delivering a micrometer-scale, cross sectional image through the retinal tissue.
This resembles a histological section (Chen and Lee, 2007) without the need for removal and
processing of tissue samples as in conventional histology.
Changes in optical reflectivity are illustrated by computer-generated colour coding. Warm
colours such as red, yellow and white indicate high reflectivity and cold colours (blue and
green) indicate low reflectivity. Images may also be illustrated in greyscale which is
preferable as false colours can be misleading. In greyscale, brighter shades replace warm
colours to indicate high reflectivity. Absence of reflection will therefore appear black.
OCT images are comparable to ultrasound B-mode sections. Both technologies present serial
or radial cross-sectional images in the same plane and produce data on the amplitude of
echoes scattered from the tissues at measured depths (Restori, 2008). Imaging by ultrasound
and radar is also reflectometry-based but several advantages are gained by the fact that OCT
employs light. The wavelength of light is around 0.001mm, which is shorter than that of
ultrasound (0.1mm) and radiowaves (greater than 10mm). As a result, the spatial resolution of
OCT is much higher. Light passes through the air-tissue interface easily. Therefore, unlike
30
ultrasound, OCT does not require probe-tissue contact or an immersion fluid (Costa et al.
2006).
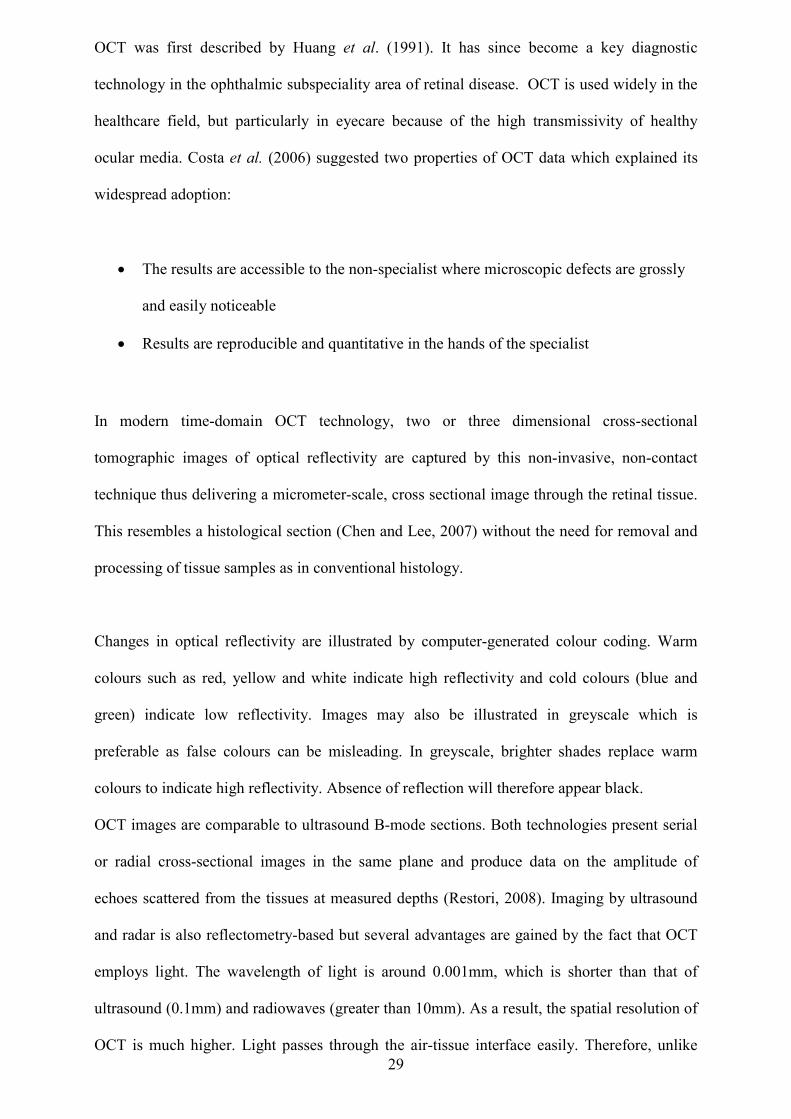
Optical coherence tomography of the retina OCT images demonstrate reproducible patterns of retinal morphology that correspond well
with the location of retinal layers seen on light microscopy. Horizontally aligned retinal
structures such as the nerve fibre layer, plexiform layers and retinal pigment epithelium show
high reflectivity whereas nuclear layers and photoreceptor inner and outer segments show a
relatively lower level of reflectivity (Tofli et al. 1997) (refer to cellular anatomy of the retina
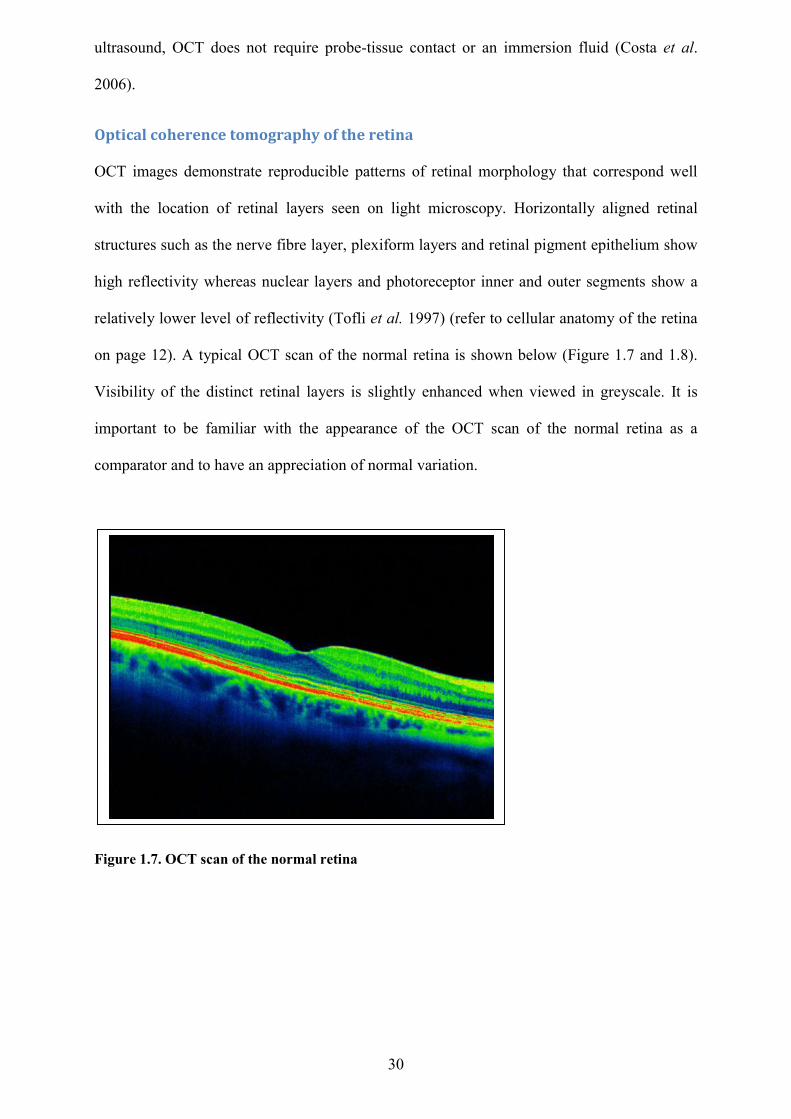
on page 12). A typical OCT scan of the normal retina is shown below (Figure 1.7 and 1.8).
Visibility of the distinct retinal layers is slightly enhanced when viewed in greyscale. It is
important to be familiar with the appearance of the OCT scan of the normal retina as a
comparator and to have an appreciation of normal variation.
Figure 1.7. OCT scan of the normal retina
31
The anterior hyperreflective band originates from the inner limiting membrane and retinal
nerve fibre layer. There is a characteristic central dip at the fovea (the foveola). Moving
posteriorly from the retinal surface there are alternating hyper and hyporeflective bands
representing the ganglion cell layer, the inner plexiform layer, the inner nuclear layer, the
outer plexiform layer and the outer nuclear layer. Posterior to the outer nuclear layer there are
three adjacent hyperreflective lines which represent the outer limiting membrane (OLM), the
photoreceptor inner and outer segment junction. There is a weak and patchy OCT signal from
the choroid which is located posterior to the retinal pigment epithelium.
Developments
The in-vivo structure of the choroid is only partially visualised by SD–OCT but the more
recent development of swept-source OCT (SS-OCT) has led to an increased visualisation of
the choroidal anatomy (Mrejen and Spaide, 2013). SS-OCT has the following advantages over
SD-OCT:
Figure 1.8 Layers of the normal retinal as represented by OCT (Ophthalmology Management, 2015)
32
Higher imaging speed. This means that high-resolution images may be obtained while
reducing the negative impact of the patient’s eye movement on the OCT scan quality
The use of a longer wavelength OCT signal source provides clearer images of deeper
ocular structures such as the choroid by overcoming scattering by the RPE
The longer wavelength SS-OCT means less light scattering by lens opacities.
Therefore SS-OCT delivers clearer images in patients with cataract compared to SD-
OCT
Optical coherence tomography angiography (OCTA) is a new imaging technique. It has a
potentially wide general applicability for retinal vascular disease because it provides a highly
detailed view of the retinal vasculature. It can detect changes in choroidal blood flow and
blood perfusion at the optic disc. It therefore has potential in the evaluation of common ocular
conditions such as choroidal neovascularisation and glaucoma. OCT angiography can in fact
image all layers of the retinal vasculature without the injection of dye (Spaide et al. (1) 2015).
The value of OCT in optometric practice
Impact on clinical eyecare and the case for OCT in optometric practice
Hermann van Helmholtz is credited by most for the invention of the ophthalmoscope, a hand-
held instrument for viewing the ocular fundus, more than 150 years ago. Most eyecare
practitioners perform ophthalmoscopy in some form, every day. All forms of fundus
photography, even with ultra-wide field imaging, do nothing more than accurately capture
what we can view directly with the ophthalmoscope. Diagnostic imaging by ophthalmoscopy
offers magnified visualisation of the fundus but this simple optical device is unable to image
subsurface features which may be of crucial diagnostic value.
33
As discussed before (page 17), there are two types of AMD: dry (atrophic) and wet
(neovascular or exudative). Diagnosis and a decision to treat a patient suspected of having a
sight-threatening condition such as 'wet' age-related macular degeneration (AMD) is often
based on an invasive test, fundus fluorescein angiography (FFA), undertaken in the hospital
setting. Until recently fluorescein angiography (FA) was regarded as the reference standard
imaging modality used to detect the presence of ‘wet’ AMD and other macular lesions. FFA
is an invasive technique and some serious, albeit rare, side-effects of allergy, anaphylaxis, and
cardiac complications have been reported (Chen and Lee, 2007). Adverse reactions (most
commonly nausea and vomiting) occur in under 5% of cases (Butner and Mc Pherson, 1983).
Overall, FA is a relatively safe procedure but safeguards need to be in place to manage
potential serious adverse reactions (Kwan et al. 2006). With FFA, a hospital setting is
required with a clinician such as a nurse required to inject a dye and a specialist photographer
required to identify and record the leaking of dye as it moves through the retinal and choroidal
vascular network (Cameron et al. 2011). Therefore, identifying patients whose retinal lesions
fulfil treatment criteria is time-consuming and imposes demands on hospital resources.
Although FA provides evidence of leakage in wet AMD it does not provide any anatomical
information about the precise retinal layer implicated (Regatieri et al. 2011). Unlike FFA,
OCT is a technique used to examine structures inside the eye non-invasively (Thomas and
Duguid, 2004).
There is a need for advanced diagnostic imaging technology in optometric primary care but
many other available imaging modalities (ultrasound, x-ray, CT, MRI) have significant
constraints that make them difficult to adapt to the primary care setting. Even in a cost-
conscious healthcare system, there is a need to introduce new imaging and quantitative
methods to ensure appropriate patient referral to subspecialists to improve diagnostic outcome
for every patient encounter. The evolution of OCT creates new opportunities to detect and
analyse changes in the retina earlier and with greater accuracy than has been previously
possible.
34
Clinical applications of OCT in optometric practice Although this study focuses on the use of OCT for macular and central retinal pathologies,
OCT is also utilised in anterior segment evaluations and other posterior pole evaluations, in
suspect glaucoma and numerous optic nerve pathologies. In all these investigations OCT
affords us a highly accurate, quantifiable, and repeatable technology (Drexler et al. 2001).
Macular disease Before the use of OCT in clinical practice, mainly qualitative methods were used to detect
changes in macular thickness such as slit lamp biomicroscopy and stereoscopic fundus
photography. The appropriate management of conditions associated with changes in retinal
thickness requires a quantitative method for analysing retinal thickness (Dobos, 2010). OCT
scanning can identify or confirm the presence of macular thickening and this is particularly
important when combined with other clinical findings such as retinal haemorrhages
(superficial and deep) and exudates or the subjective reporting of blurred vision or
metamorphopsia (distortion). On the other hand, a finding of reduced macular thickening in
neovascular age-related macular degeneration may be related to the success of intravitreal
anti-VEGF therapy. Documenting changes in macular thickening provides helpful insight into
guiding therapy and follow-up decisions (repeat injection versus monitoring). For example, a
reduction in macular thickening may be a sign of focal diabetic macular oedema which has
been responsive to focal laser photocoagulation (Salem et al. 2012). The clinical utility of
OCT has also been greatly enhanced by the development of normative databases and
progression analyses for retinal parameters. A normative database permits the clinician to
establish if the clinical parameters fall within normal limits.
Several retinal conditions are related to macular distortion caused by oedema such as diabetic
retinopathy, central serous chorioretinopathy and cystoid macular oedema. The retinal
35
integrity of the post-treatment patient may be co-managed by an optometrist using OCT who
can identify signs of resolution or exacerbation.
The vitreo-retinal interface OCT scanning provides structural evidence of deviation from the normal retinal architecture
and OCT is an increasingly important tool for diagnosing and monitoring a wide range of
vitreoretinal diseases (Chen and Lee, 2007) and in guiding surgical decisions (Do et al. 2006).
Visual distortion may be caused by a common phenomenon of the aging eye called posterior
vitreous detachment (PVD). The vitreous is a clear jelly-like substance that fills the eye,
taking up the space behind the lens and in front of the retina. The vitreous changes with age
by becoming more liquefied in the middle and shrinking. The vitreous is attached to the retina
(more strongly in some places than others) and as it shrinks, it comes away from the retina.
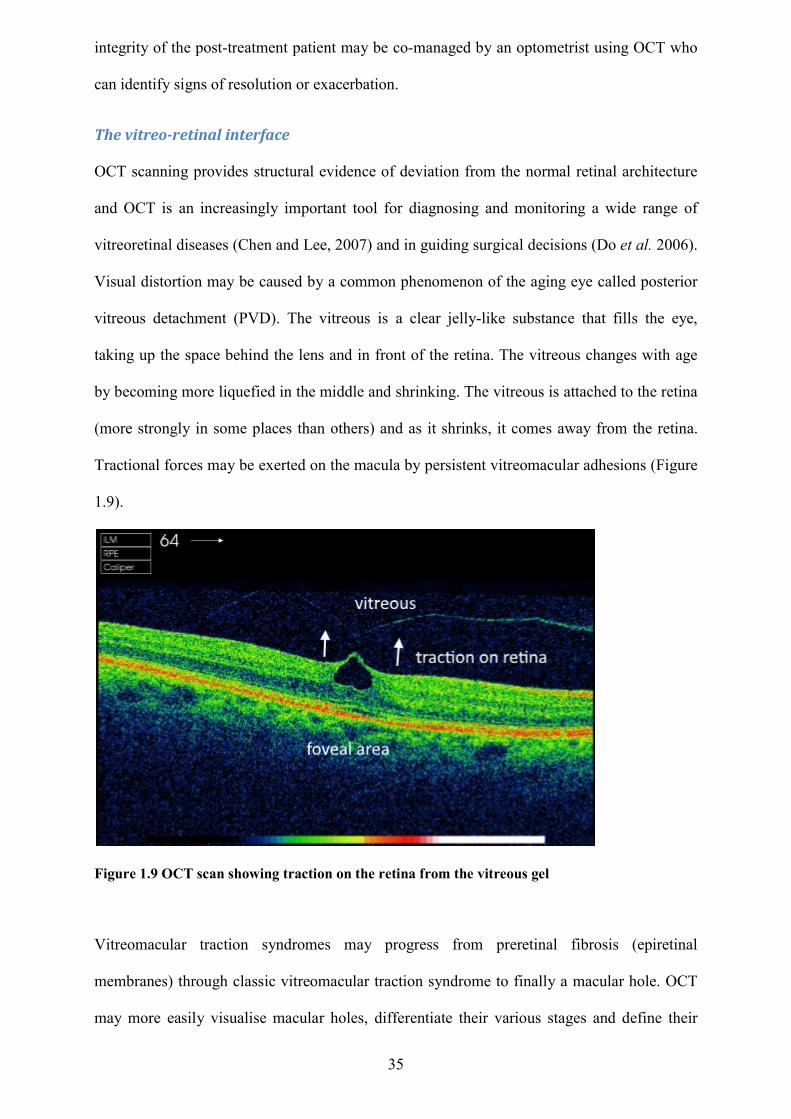
Tractional forces may be exerted on the macula by persistent vitreomacular adhesions (Figure
1.9).
Figure 1.9 OCT scan showing traction on the retina from the vitreous gel
Vitreomacular traction syndromes may progress from preretinal fibrosis (epiretinal
membranes) through classic vitreomacular traction syndrome to finally a macular hole. OCT
may more easily visualise macular holes, differentiate their various stages and define their
36
characteristics to facilitate referral and treatment decisions (Steel and Lotery, 2013). It is
important to differentiate between retinal thickening caused by vitreoretinal traction
syndromes and other causes of retinal thickening which may be intraretinal or subretinal in
origin.
Retinal vascular occlusion A useful insight into the various manifestations of acute retinal ischaemia is provided by
OCT. The form of presentation of retinal ischaemia will depend on the type and location of
the vascular event. Clinically, visible retinal whitening may occur in retinal locations not
affected by cotton wool spots (accumulations of axoplasmic material within damaged nerve
fibres which are markers of ischaemia). The spectrum of retinal ischaemia from various
causes manifests itself in the inner nuclear layer causing thickening and hyperreflectivity on
OCT. This provides insight into the pathological processes involved (Coady et al. 2015).
OCT has provided new insights into the morphological changes that occur in patients with
macular oedema secondary to retinal vein occlusion. By measuring retinal thickness, OCT has
become an invaluable tool in assessing response to treatment (Trichonas and Kaiser, 2014).
Glaucoma Glaucoma is a group of eye conditions which result in damage to the optic nerve and visual
loss. It is characterised by a particular form of optic nerve damage and visual field loss in
which elevated intaocular pressure is thought to be a risk factor. Glaucoma is a leading global
cause of irreversible blindness (Pomorska et al. 2012) with many of these cases undiagnosed
(Tielsch et al. 1991, Mitchell et al. 1996).
OCT provides high resolution, quantitative and objective assessment of the retinal cellular
layers affected by glaucoma (Schuman, 2008). Some early reports (based on histology and
glaucoma modelling) suggested that significant loss of retinal ganglion cells of up to 50%
37
may occur before a field defect is significant enough to be detected (Quigley et al.1989,
Sommer et al. 1991, Kerrigan-Baumrind et al. 2000, Nouri-mahdavi et al. 2011, Harwerth et
al. 1999).
Although it is a commonly held belief that structural damage precedes functional loss in
glaucoma, more recent evidence suggests that the two occur concurrently throughout the
progression of the disease (Denniss and Henson, 2009). In many patients structural measures
achieve statistical significance before functional measures but in some patients the opposite is
true. It is therefore optimal to measure both structure and function whenever possible. OCT
technology may therefore quantify nerve fibre and structural damage earlier than visual field
testing in some cases and some studies have already suggested that ganglion cell mapping and
pattern analysis improve diagnostic accuracy and demonstrate a potential for tracking
glaucoma progress (Tan et al. 2009).
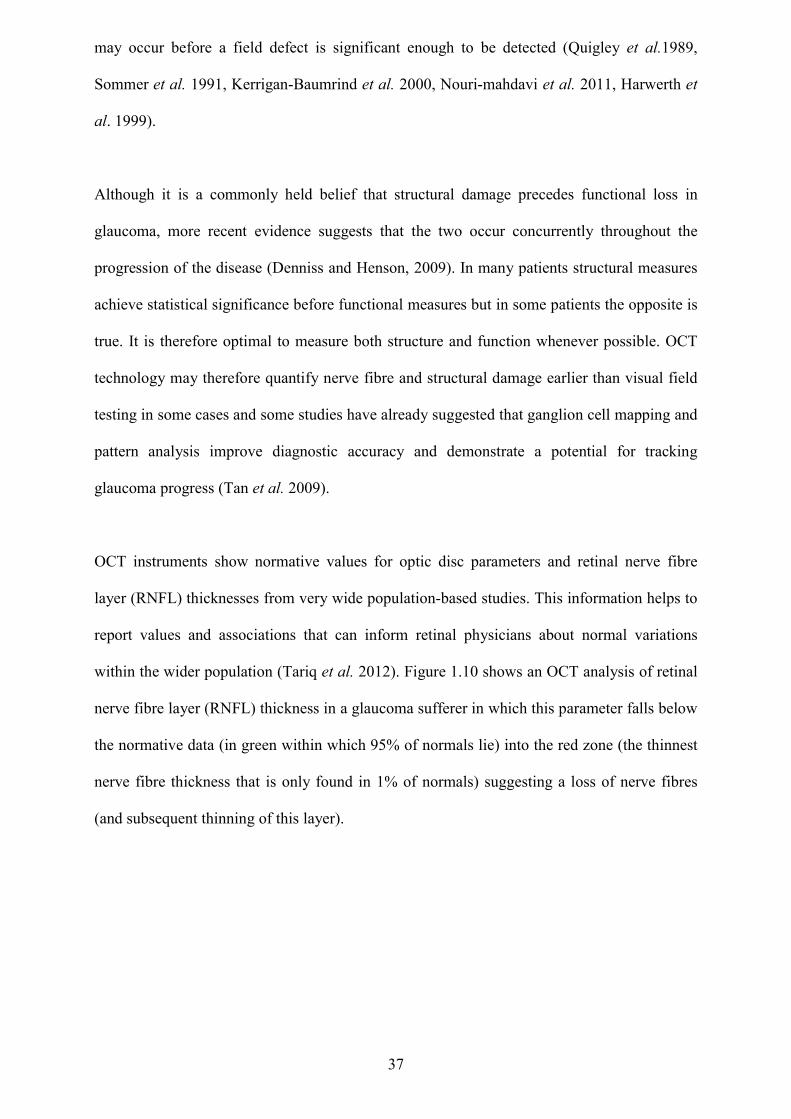
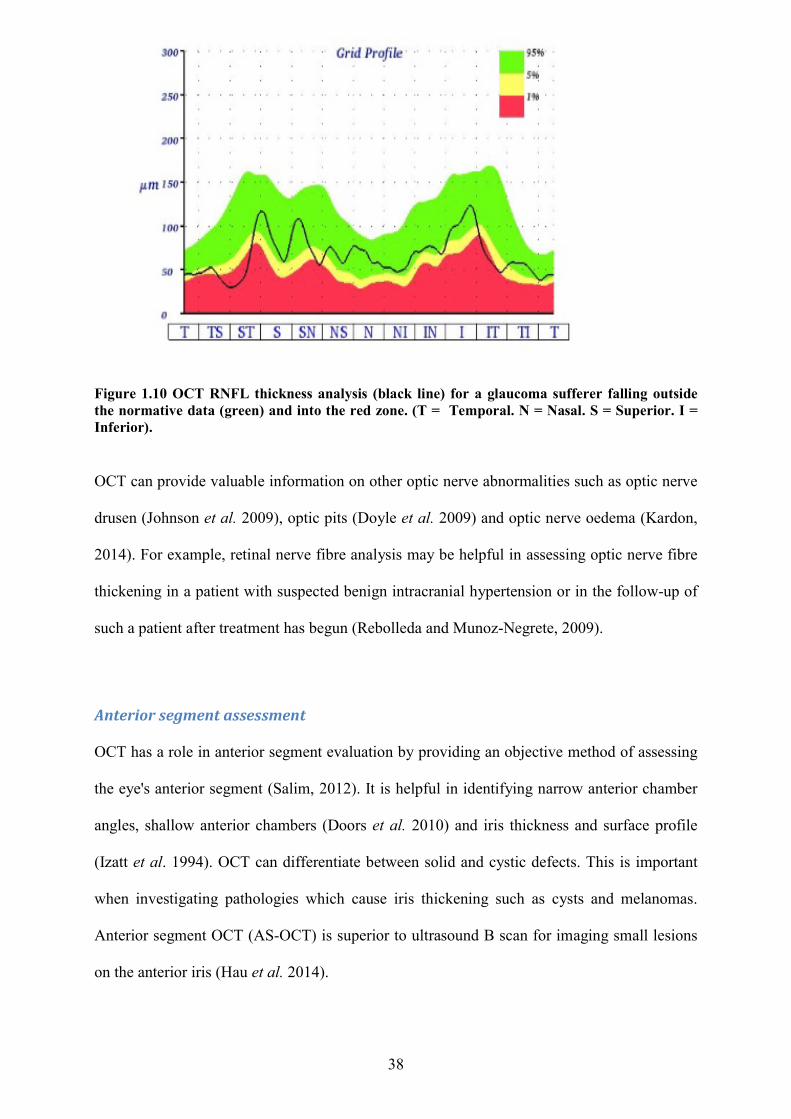
OCT instruments show normative values for optic disc parameters and retinal nerve fibre
layer (RNFL) thicknesses from very wide population-based studies. This information helps to
report values and associations that can inform retinal physicians about normal variations
within the wider population (Tariq et al. 2012). Figure 1.10 shows an OCT analysis of retinal
nerve fibre layer (RNFL) thickness in a glaucoma sufferer in which this parameter falls below
the normative data (in green within which 95% of normals lie) into the red zone (the thinnest
nerve fibre thickness that is only found in 1% of normals) suggesting a loss of nerve fibres
(and subsequent thinning of this layer).
38
Figure 1.10 OCT RNFL thickness analysis (black line) for a glaucoma sufferer falling outside the normative data (green) and into the red zone. (T = Temporal. N = Nasal. S = Superior. I = Inferior).
OCT can provide valuable information on other optic nerve abnormalities such as optic nerve
drusen (Johnson et al. 2009), optic pits (Doyle et al. 2009) and optic nerve oedema (Kardon,
2014). For example, retinal nerve fibre analysis may be helpful in assessing optic nerve fibre
thickening in a patient with suspected benign intracranial hypertension or in the follow-up of
such a patient after treatment has begun (Rebolleda and Munoz-Negrete, 2009).
Anterior segment assessment OCT has a role in anterior segment evaluation by providing an objective method of assessing
the eye's anterior segment (Salim, 2012). It is helpful in identifying narrow anterior chamber
angles, shallow anterior chambers (Doors et al. 2010) and iris thickness and surface profile
(Izatt et al. 1994). OCT can differentiate between solid and cystic defects. This is important
when investigating pathologies which cause iris thickening such as cysts and melanomas.
Anterior segment OCT (AS-OCT) is superior to ultrasound B scan for imaging small lesions
on the anterior iris (Hau et al. 2014).
39
OCT for communication Great potential exists for the use of OCT for clinician to clinician communication. OCT can
provide crucial information in the co-management of cases where a cause of reduced visual
acuity has not been clearly identified or in the many cases where eye diseases co-exist. For
example, in cases of macular oedema, macular hole or macular degeneration in the presence
of cataract, it may not be clear which of these conditions (cataract versus retinal disease) is
having the greater impact on visual function. This information, when it passes from the
primary care practitioner to secondary or tertiary care providers, may help predict surgical
outcomes. OCT may also identify macular disease which is not visible using the
ophthalmoscope or photography through dense cataract. Preoperative and postoperative OCT
assessments in eyes at high risk (diabetes, uveitis) of cystoid macular oedema (CME) may be
warranted and in any case, OCT has become a useful tool to detect and monitor CME after
cataract surgery (Kim and Bressler, 2009).
Detection of subtle macular abnormalities by conventional clinical methods (ophthalmoscopy
and biomicroscopy) through a cataract is challenging. A study by Creese et al. (2011)
suggested that the routine use of OCT before cataract surgery improves the accuracy of the
preoperative diagnostic process and plays an important role in avoiding misdiagnosis and
postoperative macular surprises. This study involved 162 patients (232 eyes with cataract)
with an average age of 73 years who were scheduled for cataract surgery. All the patients
were diagnosed with visually significant cataract and were listed for cataract surgery. The
study team selected consecutive patients attending the preoperative assessment clinics on days
(which were chosen at random) during the study period (May to September 2010). Macular
examinations were conducted using spectral domain OCT. Fourteen eyes (of 13 patients) were
excluded from the study because of the difficulty in obtaining good quality OCT scans.
Patients with clinically evident maculopathy were also excluded. Macular pathologies were
detected in 10 out of 218 eyes (4.6%). Treating ophthalmologists were able to defer 5 cataract
surgeries based on these OCT findings and refer these patients for medical retinal
40
consultations. In the other five patients, the OCT information facilitated a revision of the
prognostic aspect of the informed consent for cataract surgery. Creese et al. also remind us
that cataract surgery accounts for most malpractice claims in ophthalmology in the United
States with unrealistic patient expectations being a common underlying factor.
OCT presents an excellent opportunity for optometrists to communicate with
ophthalmologists, resulting in more effective referral, earlier diagnosis and clinical decision
making. Some studies have identified substantial benefit to patient, optometrist and retinal
specialist with the adoption of ocular telemedicine (Hanson et al. 2008, Cameron et al. 2009,
Kelly et al. 2011). These studies showed that patients benefited from a reduction in the
number of unnecessary visits to the retinal specialist. Optometrists benefitted from the
provision of a more comprehensive eye examination and an immediate referral when needed.
The retinal physician benefited from a reduction in the number of visits from patients who did
not require further investigation or treatment while testing time and efficiency were improved
for those who did.
Teleophthalmology Teleophthalmology involves the process of transmission and remote viewing of ocular
images via a web browser. A literature search has not found any randomised controlled trials
of teleophthalmology between primary and secondary care although teleradiology is a more
developed area of telemedicine which has led to the development of comprehensive
teleradiology guidelines by the Royal College of Radiologists for those who wish to deliver
teleradiology services (Royal College of Radiologists, 2010). Such a process involves the
sharing of patient-identifiable information within and between organisations and perhaps
across international boundaries. The Royal College of Radiologists (2010) suggest that the
changing methods of diagnostic imaging services and the increasing commercialisation of
aspects of healthcare including telemedicine means that there will be increased fragmentation
41
of where and how services are delivered. These changes will be mirrored in ophthalmology
which will require the setting of standards for sharing of patients' ocular imaging data via
teleophthalmology. Attention to guidelines and standards will maintain high-quality standards
of reporting, thereby ensuring patient safety and confidentiality.
Patient education OCT may be used for illustrative purposes and has an important place in patient education.
The patient may gain a greater understanding of his or her disease process or reason for
referral. OCT technology allows patients to view the images that illustrate their ocular
condition in comparison to normal results. This has the potential, with a suitable explanation,
to provide a clearer understanding of why their ocular condition is being monitored, leading to
increased patient confidence about the value of care provided. Educating patients about the
visual complications, risk factors and treatment options associated with their eye condition
plays an essential role in ongoing patient care.
The future An investigation into the current and anticipated use of equipment in community optometric
practice in the UK in 2013 showed that 15 percent of respondents were using OCT, up from 2
percent in 2007 (Dabasia et al. 2014). More notably, Dabasia et al. also observed that 43
percent of those anticipating purchasing specialist equipment in the next 12 months, planned
to buy an OCT. Such rapid changes in imaging technology and its application to practice will
have a bearing on the future clinical practice of optometry. OCT provides a diagnostic facility
which will function as an extension of optometric clinical practice and enable community
optometrists to provide better care for their patients. If optometrists are to be the focus for
community case finding of eye diseases such as AMD and diabetic retinopathy they will need
to have access to the latest technology so that they can detect and monitor treatment and share
in patient care. This has the potential to create a genuinely functional health-care team
approach to eye care in the current context of a high risk, aging population and a scenario of
capacity issues within specialist clinics. A question remains about whether the obstacles of the
42
cost and life cycle of new technology will be outweighed by the efficacy of the new
diagnostic facility of OCT.
The use of OCT images in research and data protection issues
Various settings on OCT instruments can ensure that OCT images are not identifiable to a
particular patient. Therefore OCT images can be exported without containing any patient
details, achieving anonymity. This approach can be justified because an OCT image is of
0.35mm of the internal structure of the eye and it would be impossible to identify a person
from their OCT image. This no doubt explains why it is commonplace for clinicians to
disseminate and discuss OCT images that have been anonymised without explicit consent
from the patient. A clear statement supporting this commonplace practice can be found in the
guidelines for authors seeking to publish in BMJ journals: "Images - such as x-rays,
laparoscopic images, ultrasound images, pathology slides or images of indistinct parts of the
body - may be used without consent so long as they are anonymised by removal of any
identifying marks and are not accompanied by text that could reveal the patient's identity
through clinical or personal detail" (BMJ, 2013). Mavroforou et al. (2010) note that images of
internal organs are one of five categories of anonymous recordings and note that both the UK
Data Protection Act (1998) and the US Privacy Rule do not restrict the use of this type of de-
identified information. They go on to state that the Court of Appeal in the UK has noted that
the protection of patients' privacy is safeguarded if private information has been used
anonymously.
Limitations of OCT Image interpretation relies on a comprehensive understanding of the theoretical background of
image generation. A recent paper on the classification of retinal and choroidal layers visible
on OCT has suggested that the definitions for various retinal layers have changed frequently
in the literature and have often been inconsistent with retinal anatomy and histology
(Staurenghi et al. 2014). Whilst there is no doubting the fact that OCT can resolve
intracellular structures and interfaces between the different cellular and nerve fibre layers of
43
the retina, these do not exactly correspond to microscopy findings (Ferreras et al. 2015).
Layers may easily be highlighted by stains in microscopy but may not necessarily be seen as
reflective structures in OCT. Interpretation of OCT results and their implications in clinical
situations must be tempered by the fact that some of these images are subject to artefacts
which may lead clinicians to wrong diagnoses or inappropriate management.
The use of ocular imaging for documentation and diagnosis of eye disease is rising. OCT is
one of a range of ocular imaging devices used to document baseline characteristics of the
optic nerve head (ONH) and for diagnosing glaucoma and glaucoma progression secondary to
loss of retinal nerve fibre layer (RNFL). Some of these data will fall outside normal limits
relative to normative databases. As a result, OCT imaging may provide artefacts which do not
represent genuine ocular disease but occur secondary to limitations of imaging technology
and its normative databases (Chong and Lee, 2012).
Care must be taken to ensure that OCT images have sufficient quality and the best OCT
images are captured when a cooperative patient with good fixation is correctly aligned with
the examining beam. OCT image signal degradation may be caused by media opacity (corneal
opacity, vitreous opacity or cataract). Dry eye is another source of artefact leading to reduced
signal and misidentification of retinal boundaries. Misalignment artefacts may be the result of
a patient with poor vision, poor fixation or simply poor attention.
Structures which appear hyperreflective on OCT scanning, such as normal retinal vessels,
haemorrhages and exudates, cause shadowing of underlying retinal structures with the loss of
potentially important underlying morphological detail (Puzyeyeva, 2011).
Artefacts may arise from the OCT image acquisition, intrinsic characteristics of the eye, eye
movement or computer image processing and display strategies (Spaide et al.(2). 2015).
Artefacts are not uncommon in OCT scanning. Interpretation of OCT images may be
44
qualitative or quantitative. Artefacts are more important for quantitative interpretation but
may be difficult to detect. OCT retinal thickness measurements are useful in guiding
treatment and re-treatment decisions in clinical trials and in monitoring response to treatment.
OCT possesses a wide range of image processing algorithms that can be used to obtain
quantitative information from OCT scanning, thus providing a sensitive and reproducible way
to monitor changes in retinal architecture and even retinal thickness (Arevalo et al. 2009).
Quantitative OCT analysis is based on the fact that OCT software can measure the distance
between the inner retina and outer retina reproducibly. OCT segmentation lines are
automatically drawn to the inner limiting membrane (ILM) by all available machines and the
retinal pigment epithelium (RPE) or the IS/OS junction (depending on the instrument) to
determine retinal thickness and create a topographic map. The definition of retinal boundaries
used by the automated segmentation algorithms differs between OCT devices (Talu, 2013),
even for normal eyes. If different machines use different anatomical lines as the outer
measurement, there will be inter-instrument inconsistencies in retinal thickness estimates.
A study by Puzyeyeva et al. (2011) reported on the clinical application of SD-OCT using a
series of case reports of patients with clinically defined common and/or classic eye diseases to
highlight the clinical utility and some of the potential limitations of OCT technology. In cases
of macular oedema secondary to diabetic retinopathy and choroidal neovascular membrane
where retinal thickness was greater than 400 microns, it was hard to discern the underlying
retinal detail (and therefore the pathology) and the choroid. Retinal thickness measurements
by SD-OCT in eyes with branch retinal vein occlusion were compromised by a significant
rate of segmentation errors in a study by Matt et al. (2011). Macular thickness measurements
in eyes with neovascular AMD did not approach the theoretical resolution of SD-OCT in a
study by Tah et al. (2014). Automatic segmentation procedures also gave rise to substantial
limitations in identifying areas of geographic atrophy (a common retinal disease) in current
SD-OCT devices in a study by Schutze et al. (2011). It is therefore important that image-
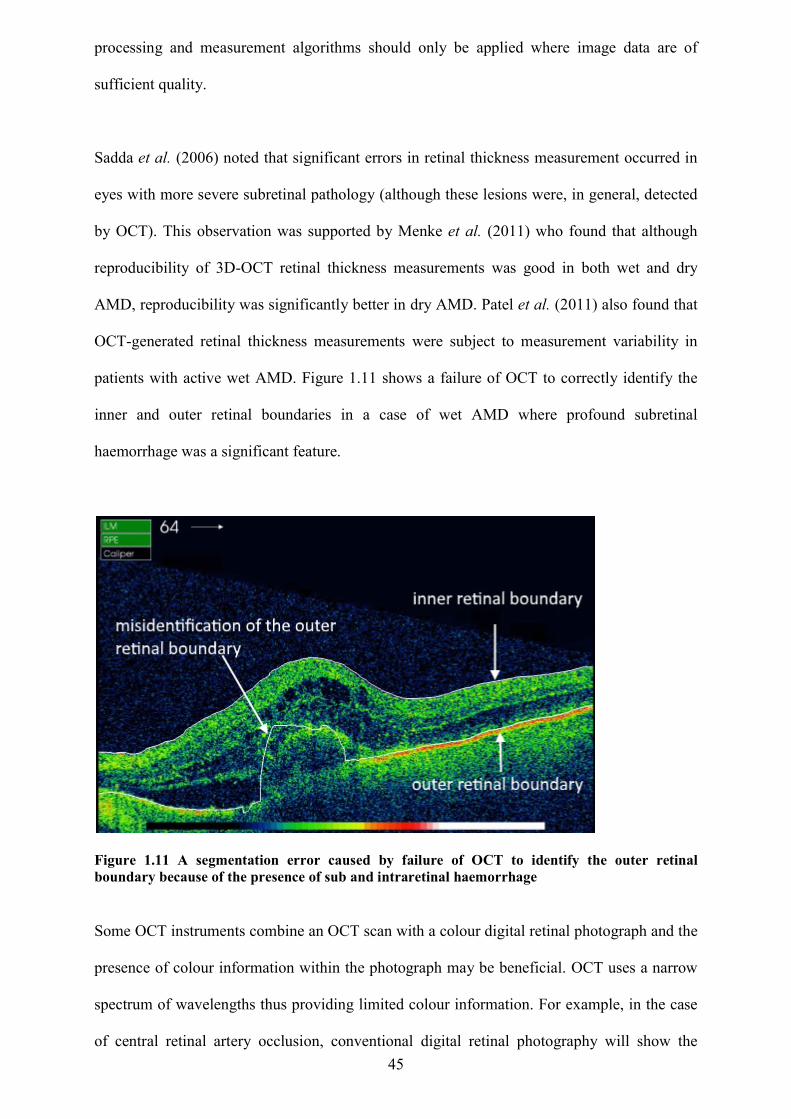
45
processing and measurement algorithms should only be applied where image data are of
sufficient quality.
Sadda et al. (2006) noted that significant errors in retinal thickness measurement occurred in
eyes with more severe subretinal pathology (although these lesions were, in general, detected
by OCT). This observation was supported by Menke et al. (2011) who found that although
reproducibility of 3D-OCT retinal thickness measurements was good in both wet and dry
AMD, reproducibility was significantly better in dry AMD. Patel et al. (2011) also found that
OCT-generated retinal thickness measurements were subject to measurement variability in
patients with active wet AMD. Figure 1.11 shows a failure of OCT to correctly identify the
inner and outer retinal boundaries in a case of wet AMD where profound subretinal
haemorrhage was a significant feature.
Figure 1.11 A segmentation error caused by failure of OCT to identify the outer retinal boundary because of the presence of sub and intraretinal haemorrhage Some OCT instruments combine an OCT scan with a colour digital retinal photograph and the
presence of colour information within the photograph may be beneficial. OCT uses a narrow
spectrum of wavelengths thus providing limited colour information. For example, in the case
of central retinal artery occlusion, conventional digital retinal photography will show the
46
typically pale retina suggestive of the presence of infarction more effectively than OCT. OCT
will however facilitate recognition of the acute and chronic stage of arterial occlusion
(Falkenberry et al. 2006).
Baranano et al. (2012) observed that the use of scanning protocols with reduced sampling
densities resulted in decreased detection of key features of wet AMD. Therefore, with the
increasing availability and use of OCT systems, there could be some benefit in optimising and
standardising OCT scanning protocols.
In ophthalmic oncology it is important to recognise a limitation of OCT, namely its relatively
poor penetration into deeply pigmented tissue. This limits its use for the detection of common
intraocular tumours (Medina et al. 2014). The horizontal and depth resolution of OCT have
significantly improved following the development of high-speed photodetectors and wide-
bandwidth tuneable light sources. The arrival of spectral domain OCT (SD-OCT) has further
enhanced image resolution (Sayanagi et al. 2008). As a result, error and artefact are less
frequently reported in more recent studies on OCT technology and significant benefits have
been reported for SD-OCT over the older time-domain OCT technology (Ericksson et al.
2011). Recognition of these artefacts is still important and will refine diagnosis thereby
preventing faulty treatment decisions (Ray et al. 2005).
OCT is unlikely to eliminate the need for a careful fundus examination, digital retinal
imaging, visual fields, and tonometry. Instead it will provide additional objective and
quantifiable data that are not available from other diagnostic sources. It is not always possible
to use diagnostic measures interchangeably; complementary use may be of higher clinical
value (Aschliesser et al. 2014).
47
Chapter 2: Literature review.
Overview This chapter describes a comprehensive literature search with the aims listed below:
Identify the challenges faced by community optometrists in correctly diagnosing
diseases of the central retina and accurately refining subsequent referrals to
ophthalmology services
Identify the need for a valid, sensitive and non-invasive method such as OCT for the
diagnosis and follow-up of patients with common retinal conditions such as AMD and
diabetic macular oedema (DMO) which is suited to the primary care setting of
community optometry
Discuss the burden of macular disease, capacity issues within specialist retinal clinics
and the likely increasing role of optometrists in co-management of macular disease
using OCT
Discuss the lack of resources specifically aimed at community optometrists who wish
to use OCT in practice to diagnose and manage patients with macular disease
Discuss current models of diagnostic reasoning and how these might apply to
optometric practice. Non-clinical influences on clinical decision-making are also
discussed.
Discuss the methods of assessing the diagnostic skills of practitioners and the potential
value of e-learning versus conventional teaching
Identify the current approaches to OCT training for optometrists
Discuss the potential of an internet-based resource to assist optometrists with
diagnostic and management decisions based on OCT scans
Search mode and resources The following section also provides an overview to position the research question in context,
review what other work has been done, identify gaps in knowledge and propose a rationale for
48
a new study to bridge these gaps. Most of the author’s literature searches were conducted
using Scopus and PubMed although some literature was also accessed using OpenAthens (via
the College of Optometrists library). A summary of the literature resources available to the
author are listed in Appendix 8. Searches for relevant literature began in November 2014 and
the search was last updated in June 2017.
Optical coherence tomography is used in several areas of medicine so literature searches were
conducted using a variety of combinations of key terms (detailed below) such as “optical
coherence tomography”, “optometrists” or “ optometry”, “macular disease” (used
interchangeably with “age-related macular degeneration”). Optical coherence tomography
was not in common use in optometric practices in the UK prior to 2010 so most searches for
OCT literature were limited to the last 7 years.
A PubMed search using the search terms “optical coherence tomography” and
“optometrist/optometry” produced 22 documents. Only five of these papers were relevant to
the scope of the review and these were chosen for detailed study. All 5 papers were used in
the literature review but only one of these papers looked at optometrists’ accuracy in
interpreting OCT scans and this paper was focussed on a single retinal disease.
A PubMed search using the terms “Age-related macular degeneration” and
“optometrist/optometry” produced 28 documents. Six of these documents were relevant to the
scope of the review and were studied in more detail. Four were chosen for use in the literature
review.
A PubMed search using the terms “macular disease” and “optometrist/optometry” produced
58 documents. Eleven were studied in more detail and one was suitable for use in the
literature review. The term “age-related macular degeneration” and “macular disease” were
used interchangeably but did not produce additional relevant papers.
49
A Scopus search using the same search terms and parameters was conducted resulting mostly
in duplication of search results. Searches were also conducted using the resources listed in
Appendix 8. and in all searches, some relevant publications were identified from the
bibliographies of these papers.
This chapter includes a wide-ranging discussion on current models of diagnostic reasoning
and clinical decision-making. An awareness of these models was thought to be crucial in the
design of an effective diagnostic guide. The author’s literature searches suggest that
diagnostic reasoning in optometry has not been widely investigated but this subject appears to
have been more widely studied in medicine, and other health professions. A combination of
the search terms “diagnostic reasoning” and “optometry” produced only three results only one
of which was suitable for review.
Pubmed or Scopus search terms such as “diagnostic reasoning” or “clinical decision-making”
produced multiple results and required to be significantly refined by searches within specific
medical specialities by the addition of keywords such as “radiology”, “dermatology”,
“nursing”, and radiography, to name but a few. Most searches for literature were concentrated
on the visual recognition domains (for example, interpretation of medical imaging scans).
This was thought to be most relevant to the current study. The term “theory of diagnostic
reasoning” produced useful background information on the models of clinical reasoning but
involved more exhaustive review of the many papers produced by this search.
The method of exam delivery (multiple choice questions linked to clinical vignettes) was also
subjected to literature review. Search terms included “multiple choice questions” and
“medical education” or “clinical vignettes” and “medical education” but produced multiple
results which required filtering (mostly limited to the past 7 years). The subject of E-learning
50
within medical education was again limited to more recent years because of the nature of such
wide search terms.
Optometric diagnosis and management of macular disease A study by Ly et al. (2016) assessed the optometric referral patterns of patients with
suspected macular disease to The Centre for Eye Health (CFEH) which was an intermediate-
tier optometric imaging clinic in Australia (comprising optometrists with a special interest in
macular disease). A retrospective review of patient records and referrals was performed for
patients who were examined at the CFEH over a 12 month period from 1/7/2013 to 30/6/2014
(n = 291). Data were analysed under the following headings: primary reason for referral;
patient demographic characteristics; diagnosed/suspected condition; CFEH diagnosis and
recommended management plan. Signs specified by the referring optometrist were typically
determined by funduscopic examination (such as drusen or pigmentary changes) although
some referrals were based on other factors such as reduced visual acuity, symptoms of
distortion or other ocular or family history.
Standard CFEH protocol required that all patients referred for macular assessment undergo
ocular imaging by optical coherence tomography. In this cohort of patients 84% were
recommended ongoing optometric care and only 16% required referral to an ophthalmologist
thus corroborating the conclusion that many cases of ocular disease may be managed by
optometrists. Ly et al. also note that OCT has emerged as an indispensable tool and its pattern
of rapid uptake by community optometrists (30% and rising in Australia) has led to
speculation that OCT will change its status from specialist imaging technique to a core test. It
is also noted that referring optometrists benefit from referring to an intermediate-tier imaging
optometry clinic by receiving direct feedback on the case diagnosis and associated best
practice management.
51
A comprehensive search of literature has identified a lack of research on the optometric
detection and diagnosis of AMD in practice. This is now more important owing to the recent
emergence of anti-vascular endothelial growth factor (anti-VEGF) drugs, expanding the
treatment options for all types of ‘wet’ AMD lesions.
In a UK-based study of the quality of optometry referrals to a neovascular age-related macular
degeneration clinic, Muen and Hewick (2011) found that optometrists performed to a less
than satisfactory standard in correctly identifying the clinical signs of ‘wet’ AMD and
especially in identifying subretinal fluid. This doctoral student’s literature search (conducted
several times between 2014 and 2017) suggests that this small study by Muen and Hewick is
the first to evaluate the quality of referrals to a wet AMD clinic using the quick access
(RARF) protocol. OCT technology was not widely available to optometrists during the period
of the study (2006 - 2009) and it must be assumed that participants to this study did not have
access to OCT and were not trained in this area by the consultant ophthalmologist. The study
does however highlight the challenges faced by community optometrists in identifying
important clinical signs of AMD (and conditions which may appear similar) in the absence of
effective imaging technology.
This prospective study was based in the Highlands NHS Trust and gathered data from all
optometry referrals using the standard Rapid Access Referral Form (RARF) from the College
of Ophthalmologists between the periods of December 2006 to August 2009. RARF forms are
used to refer patients suspected of having neovascular (wet) AMD directly to a retinal
specialist. Participants in the study (all of whom were community optometrists) previously
attended an educational event on wet AMD conducted by a consultant ophthalmologist with
special interest in macula disease. Participants were also instructed on how to correctly
complete the RARF. RARF forms were analysed for recorded history, clinical signs and the
final diagnosis. These findings were compared to the history findings, clinical signs and final
diagnosis recorded by an expert (a consultant ophthalmologist with special interest in macula
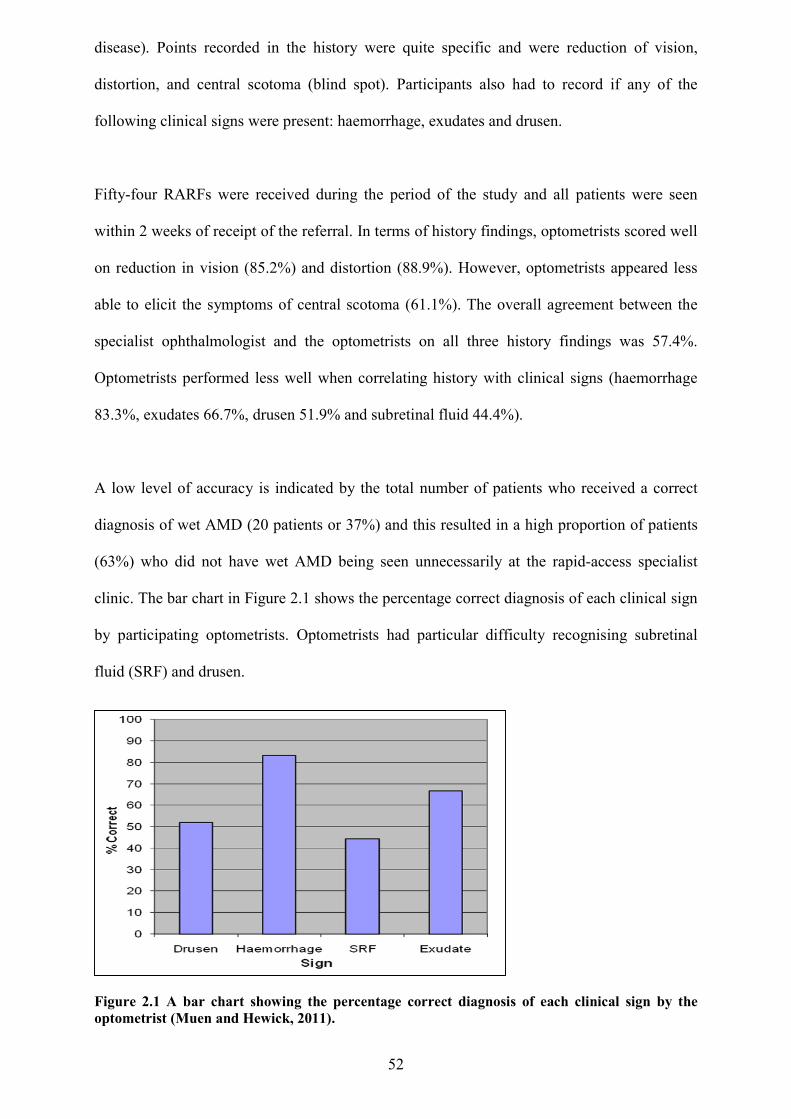
52
disease). Points recorded in the history were quite specific and were reduction of vision,
distortion, and central scotoma (blind spot). Participants also had to record if any of the
following clinical signs were present: haemorrhage, exudates and drusen.
Fifty-four RARFs were received during the period of the study and all patients were seen
within 2 weeks of receipt of the referral. In terms of history findings, optometrists scored well
on reduction in vision (85.2%) and distortion (88.9%). However, optometrists appeared less
able to elicit the symptoms of central scotoma (61.1%). The overall agreement between the
specialist ophthalmologist and the optometrists on all three history findings was 57.4%.
Optometrists performed less well when correlating history with clinical signs (haemorrhage
83.3%, exudates 66.7%, drusen 51.9% and subretinal fluid 44.4%).
A low level of accuracy is indicated by the total number of patients who received a correct
diagnosis of wet AMD (20 patients or 37%) and this resulted in a high proportion of patients
(63%) who did not have wet AMD being seen unnecessarily at the rapid-access specialist
clinic. The bar chart in Figure 2.1 shows the percentage correct diagnosis of each clinical sign
by participating optometrists. Optometrists had particular difficulty recognising subretinal
fluid (SRF) and drusen.
Figure 2.1 A bar chart showing the percentage correct diagnosis of each clinical sign by the optometrist (Muen and Hewick, 2011).
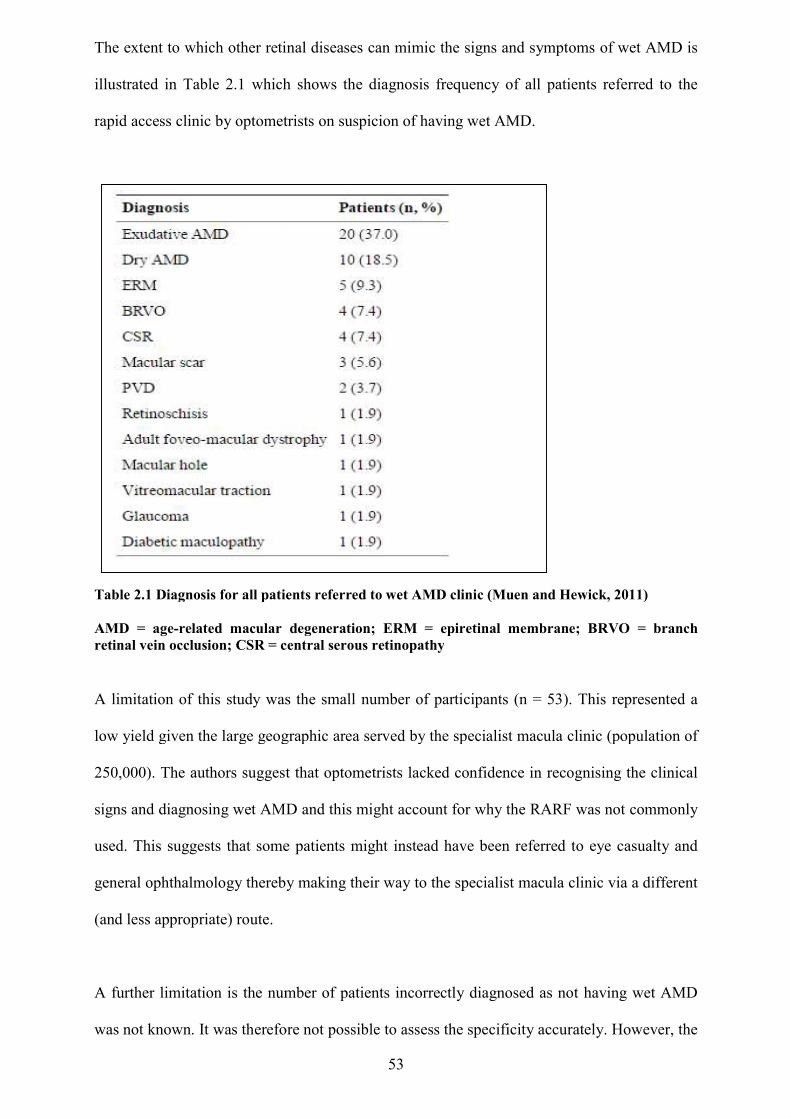
The extent to which other retinal diseases can mimic the signs and symptoms of wet AMD
illustrated in Table 2.1 which shows the diagnosis frequency of all patients referred to the
rapid access clinic by optometrists on suspicion of having wet AMD.
Table 2.1 Diagnosis for all patients referred to wet AMD clinic (Muen and Hewick, 2011) AMD = age-related macular degeneration; ERM retinal vein occlusion; CSR = central serous retinopathy
A limitation of this study was the small number
low yield given the large geographic area served by the specialist macula clinic (population of
250,000). The authors suggest that optometrists lacked confidence in recognising the clinical
signs and diagnosing wet AMD and this might account for why the RARF was not commonly
used. This suggests that some
general ophthalmology thereby making their way to the specialist macula
(and less appropriate) route.
A further limitation is the number of patients incorrec
was not known. It was therefore not
53
The extent to which other retinal diseases can mimic the signs and symptoms of wet AMD
which shows the diagnosis frequency of all patients referred to the
rapid access clinic by optometrists on suspicion of having wet AMD.
Diagnosis for all patients referred to wet AMD clinic (Muen and Hewick, 2011)
lated macular degeneration; ERM = epiretinal membrane; BRVO = branch inal vein occlusion; CSR = central serous retinopathy
this study was the small number of participants (n = 53). This represented a
low yield given the large geographic area served by the specialist macula clinic (population of
e authors suggest that optometrists lacked confidence in recognising the clinical
signs and diagnosing wet AMD and this might account for why the RARF was not commonly
some patients might instead have been referred to eye casualty
thereby making their way to the specialist macula clinic via a different
the number of patients incorrectly diagnosed as not having
was not known. It was therefore not possible to assess the specificity accurately. However, the
The extent to which other retinal diseases can mimic the signs and symptoms of wet AMD is
which shows the diagnosis frequency of all patients referred to the
Diagnosis for all patients referred to wet AMD clinic (Muen and Hewick, 2011)
= epiretinal membrane; BRVO = branch
n = 53). This represented a
low yield given the large geographic area served by the specialist macula clinic (population of
e authors suggest that optometrists lacked confidence in recognising the clinical
signs and diagnosing wet AMD and this might account for why the RARF was not commonly
referred to eye casualty and
clinic via a different
sed as not having wet AMD
possible to assess the specificity accurately. However, the
54
authors concluded (based on the ocular conditions referred) that optometrists in the study had
a low threshold for referring any abnormality but that the accuracy of referral could possibly
be improved by the creation of a telemedicine system with the ability to send pictures and
OCT scans with the referral.
The ECHOES trial compared the ability of ophthalmologists versus optometrists (optometrists
in the community and ophthalmologists in the Hospital Eye Service) to correctly identify
retinal lesions due to neovascular age-related macular degeneration. Regular review is an
important part of the long-term care of patients with neovascular AMD and this even applies
to patient in whom the disease is quiescent. Such reviews are costly and burdensome to health
services, patients and carers (Reeves et al 2016). Participants were asked to classify lesions
from vignettes which comprised clinical information, colour fundus photographs and OCT
scan images. The primary aim of this study, which involved 155 participants (96 completed
all assessments and formed the analysis population) was to compare the proportion of correct
lesion classifications made by community optometrists and ophthalmologists from clinical
vignettes. All participants received the same training which comprised attending two online
webinars and assessment by way of training vignettes.
In addition, an estimate was made of the cost-effectiveness of community follow-up by
optometrists compared with follow-up by ophthalmologists in the hospital eye service (HES).
The views of patients (and their representatives), optometrists, ophthalmologists and clinical
commissioners on the proposed care model were also collated.
The decision-making of optometrists was found to be non-inferior to ophthalmologists’ with
respect to the pre-specified limit of 10 per cent absolute difference. Most importantly, the
frequencies of sight-threatening errors (although small at 5.7% for optometrists and 6.2% for
ophthalmologists) were similar for both groups.
55
Although there was consensus that optometrist-led monitoring had the potential to reduce
clinical workload and be more patient-centred, some barriers for the implementation of this
model of shared care for AMD were identified in this study. The study questioned the ability
of the two professions to work collaboratively with ophthalmologists perception of
optometrists’ competence being identified as a potential barrier along with the financial
feasibility of shared care for Clinical Commissioning Groups (the mean care-pathway cost for
assessment was very similar by group).
The ECHOES study is the only study identified by the author’s literature search in which the
OCT diagnosis and management skills of optometrists were evaluated, albeit in a single
disease-focussed study. It should also be noted that all patients in the study already had a
confirmed diagnosis of wet AMD and optometrists were simply being assessed in terms of
their ability to detect and monitor macular changes from a “quiescent” disease baseline.
In a study into the optometric referral of suspect ‘wet’ AMD cases into a specialist retinal
clinic, Creer et al. (2010) usefully highlighted some of the conditions which mimic the signs
and symptoms of AMD and for which this mode of referral was not appropriate.
Manchester Royal Eye Hospital (MREH) ran an optometry-led fast-access direct referral
clinic, the Macular Assessment Referral Refinement Clinic (MARRC).It was established in
2006 to speed up the referral pathway for patients with suspect wet AMD. Patients with
suspect wet AMD could bypass consultant-led clinics and be referred for appropriate
treatment within a short time period. This novel approach was designed to improve AMD
prognosis, and screen out any patients who were not suitable for treatment.
This study was a retrospective audit based on the first 129 patients seen at the clinic between
October 2006 and October 2008 and although most patients (63%) were diagnosed with wet
AMD, 24% were diagnosed with dry AMD and the remaining 13% were given alternative
diagnoses (Table 2.2).
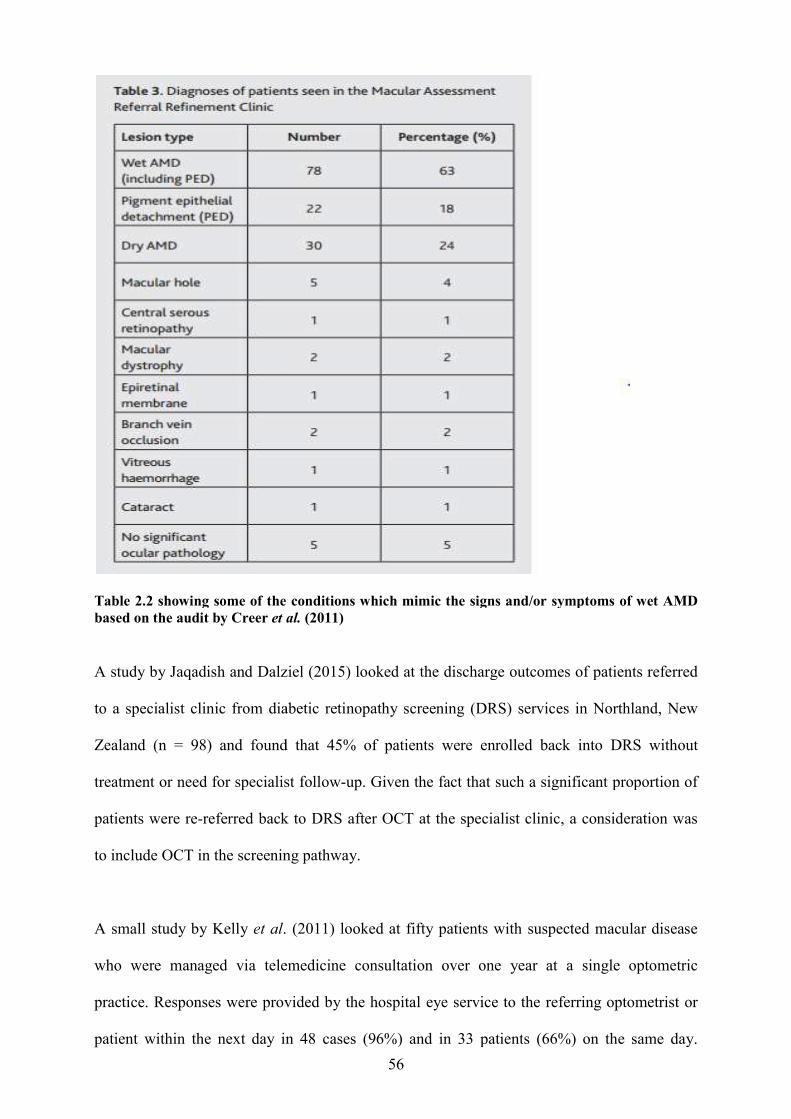
Table 2.2 showing some of the conditions which mimic the signs and/or symptoms of wet based on the audit by Creer et al.
A study by Jaqadish and Dalziel
to a specialist clinic from diabetic retinopathy screening (DRS) services in Northland, New
Zealand (n = 98) and found that 45% of patients were enrolled back into DRS without
treatment or need for specialist follow
patients were re-referred back to DRS after OCT at the specialist clinic, a consideration was
to include OCT in the screening pathway.
A small study by Kelly et al.
who were managed via telemedicine consultation over one year at a single optometric
practice. Responses were provided by the ho
patient within the next day in 48 cases (96%) and in 33 patient
56
showing some of the conditions which mimic the signs and/or symptoms of wet et al. (2011)
A study by Jaqadish and Dalziel (2015) looked at the discharge outcomes of patients referred
to a specialist clinic from diabetic retinopathy screening (DRS) services in Northland, New
Zealand (n = 98) and found that 45% of patients were enrolled back into DRS without
for specialist follow-up. Given the fact that such a significant proportion of
referred back to DRS after OCT at the specialist clinic, a consideration was
to include OCT in the screening pathway.
. (2011) looked at fifty patients with suspected macular disease
who were managed via telemedicine consultation over one year at a single optometric
practice. Responses were provided by the hospital eye service to the referring optometrist or
y in 48 cases (96%) and in 33 patients (66%) on the same day.
showing some of the conditions which mimic the signs and/or symptoms of wet AMD
(2015) looked at the discharge outcomes of patients referred
to a specialist clinic from diabetic retinopathy screening (DRS) services in Northland, New
Zealand (n = 98) and found that 45% of patients were enrolled back into DRS without
such a significant proportion of
referred back to DRS after OCT at the specialist clinic, a consideration was
fifty patients with suspected macular disease
who were managed via telemedicine consultation over one year at a single optometric
to the referring optometrist or
s (66%) on the same day.
57
Thirty-three patients (66%) required further "face to face" investigation and were therefore
triaged on clinical urgency. Seventeen cases were managed in the community and the author
identifies this as a potential cost improvement. Despite the limitation of small sample size this
important study highlighted the significant potential of OCT in telemedicine.
There are relatively few ophthalmologists in the UK per head of population and many more
optometrists (Violato et al. 2016). In recognising this fact, the author can see the potential for
community optometrists performing a diagnostic role during the acquisition and interpretation
of OCT images rather than burdening hospital eye services with this task, with
teleophthalmology links being used for more unusual or atypical cases.
The prognosis for an increasing number of patients with wet AMD has improved due to
recent developments in anti-vascular endothelial growth factor (anti-VEGF) AMD treatments.
This has resulted in an influx of new patients into specialist retinal clinics (Creer et al. 2010).
The timing of such referrals is crucial in the case of wet AMD as a delay in diagnosis and
treatment is associated with severe visual loss (Oliver-Fernandes et al. 2005; Sickenberg,
2001). Ideally, treatment of confirmed wet AMD should be within two weeks of initial
development of symptoms or detection of a treatable lesion (Royal College of
Ophthalmologists, 2009).
It has been recently reported that fewer than half of people suffering from AMD are receiving
treatment within the recommended two week timeframe. Furthermore, 41.8% of patients wait
between two and four weeks with 8.8% waiting more than eight weeks for an appointment
(Macular Disease Society, 2012). Capacity issues within specialist macular clinics will be
subject to further pressures as intravitreal injections are extended to other groups of patients
with macular oedema secondary to causes other than AMD such as diabetic macular oedema
and retinal vein occlusion (Ford et al. 2014).
58
AMD services in the NHS have had to adapt to increases in demand and there have been
improvements in rapid access and fast track processes for new patients but limited or
inadequate clinical capacity continues to threaten access to potentially sight-saving treatment
(Amaoku et al. 2012). Rapid access clinics exist for the provision of early assessment of
patients with suspect wet AMD lesions or sudden onset of symptoms. The success of such a
service depends on appropriate and timely referrals into the clinic, principally from
community optometrists. Patients attending specialist retinal clinics require appointments both
for regular treatment and also disease monitoring (Creer et al. 2010). Substantial workload is
associated with intravitreal injection of anti-VEGF agents because of the need for frequent
follow-up of these patients and according to the Royal College of Ophthalmologists (2013),
staffing of these clinics is well below expected levels. A particular difficulty centres round the
inability to discharge patients in order to accommodate new ones and most AMD specialists
agree that capacity problems are caused by the increased and recurrent long term follow-up
clinic visits required for wet AMD patients (RNIB, 2014). It has been suggested that, in the
absence of adequate ophthalmic medical manpower to staff AMD clinics, the potential for
recruiting non-medical staff (for example optometrists) should be explored. The overall
workload might therefore be contained if some roles within AMD clinics (such as clinical
assessments, re-treatment decisions and even intravitreal drug delivery) were undertaken by
other clinicians or technicians. In identifying some key capacity issues within AMD clinics
Amouku et al. (2012) suggested that in some HES facilities pressure on OCT clinical imaging
services is being aggravated by the increasing use of OCT imaging for other ophthalmic
disorders such as glaucoma. More demand on OCT imaging technology is likely to follow the
implementation of the NICE recommended treatments of retinal vein occlusions and some
forms of diabetic retinopathy with intravitreal therapies. The role of optometrists (and other
health professionals such as nurses and pharmacists) in primary care is expanding as they now
take on aspects of care such as prescribing. An extended role for optometrists in specialist
retinal clinics is a distinct possibility but this will require educational support, safe guidelines
59
for practice and mentoring in the particular practice area will be required to embed newly
acquired skills (Jarvis and Ker, 2014).
Community follow-up of previously treated and stable AMD patients by suitably trained
optometrists (under the supervision of a medical retina specialist) may reduce the burden on
hospital based AMD services and also carries the advantage of bringing the services into the
community, closer to the patient. If optometrists hope to be able to accurately refine their
referrals into specialist retinal clinics and expand their role into the co-management of AMD
patients, they will require non-invasive imaging technology such as OCT and the skills to use
it effectively.
Philosophies of educational practice
Diagnostic reasoning and clinical decision making If we are to embrace the principles of diagnostic medicine we must understand the cognitive
processes involved in diagnostic reasoning. Furthermore, we must identify weaknesses in
these processes and define how to employ the best teaching strategies on clinical diagnosis,
thereby reducing diagnostic errors.
Diagnosis is the cornerstone of the healthcare sciences (Body and Foex, 2008; Haynes and
Wilczynski, 2004) and clinical practice would be impossible without some form of diagnosis.
Diagnosis comes at the end of a process of using the history, physical examination, laboratory
findings, imaging studies and other investigations to identify the disease responsible for the
patient's illness or complaint. Clinicians can then make a more informed decision about
treatment and prognosis. By diagnosing patients, practitioners also infer an understanding of
the anatomical and pathophysiological mechanisms behind the disease process (Body and
Foex, 2009).
60
Body and Foex (2008) also suggest that the traditional concept of diagnosis derives from the
philosophical concept or paradigm of "positivism". Positivist physicians, having a preference
for empirical data (based on what could be observed, measured and quantified) adopt a neutral
position thereby making objective observations and generating hypotheses which could be
subjected to verification. Doctors may recognise disease by objectively investigating it using a
particular method and presenting the diagnosis as a fact. However, according to Body and
Foex (2008) the positivist paradigm becomes untenable when subjected to closer scrutiny as
according to the positivist paradigm every physician who observes the same piece of reality
will see the same thing. Body and Foex (2008) remind us that we intuitively know this to be
untrue and go on to suggest that a range of studies have demonstrated less than optimal
interobserver reliability when two independent physicians conduct basic techniques such as
taking a patient history or eliciting clinical signs. Body and Foex note that this is even true
among experts, an example being interobserver variation among radiologists reporting chest
radiographs (Albaum et al. 1996).
Errors which occur in medical diagnostics may include failure to generate the correct
hypotheses; misperception or misreading of the evidence (especially visual clues); and
misinterpretations of the available evidence (Bordage, 1999, Elstein and Schwarz, 2002).
The description and analysis of the psychological process employed in identifying and solving
complex diagnostic problems by expert physicians could be aimed at improving the
diagnostic performance of novices. Croskerry (2009) suggested that both systemic and
individual factors contribute to diagnostic error (missed or delayed diagnosis) and among the
many factors that impact clinical performance of the individual physician, the calibre of
cognition is the most relevant and merits most attention.
Elstein and Schwarz (2002) reviewed current understanding of the cognitive processes
involved in diagnostic reasoning in clinical medicine and suggested that the earliest
psychological formulation viewed diagnostic reasoning as a process of hypothesis testing.
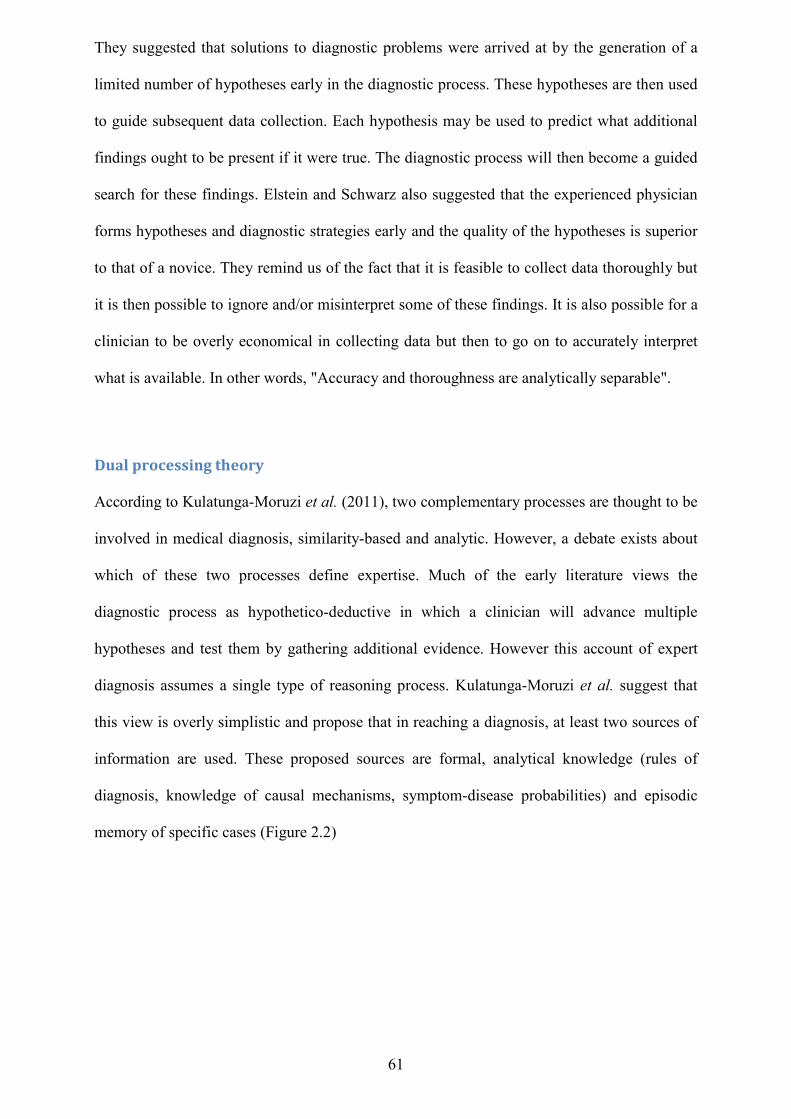
61
They suggested that solutions to diagnostic problems were arrived at by the generation of a
limited number of hypotheses early in the diagnostic process. These hypotheses are then used
to guide subsequent data collection. Each hypothesis may be used to predict what additional
findings ought to be present if it were true. The diagnostic process will then become a guided
search for these findings. Elstein and Schwarz also suggested that the experienced physician
forms hypotheses and diagnostic strategies early and the quality of the hypotheses is superior
to that of a novice. They remind us of the fact that it is feasible to collect data thoroughly but
it is then possible to ignore and/or misinterpret some of these findings. It is also possible for a
clinician to be overly economical in collecting data but then to go on to accurately interpret
what is available. In other words, "Accuracy and thoroughness are analytically separable".
Dual processing theory According to Kulatunga-Moruzi et al. (2011), two complementary processes are thought to be
involved in medical diagnosis, similarity-based and analytic. However, a debate exists about
which of these two processes define expertise. Much of the early literature views the
diagnostic process as hypothetico-deductive in which a clinician will advance multiple
hypotheses and test them by gathering additional evidence. However this account of expert
diagnosis assumes a single type of reasoning process. Kulatunga-Moruzi et al. suggest that
this view is overly simplistic and propose that in reaching a diagnosis, at least two sources of
information are used. These proposed sources are formal, analytical knowledge (rules of
diagnosis, knowledge of causal mechanisms, symptom-disease probabilities) and episodic
memory of specific cases (Figure 2.2)
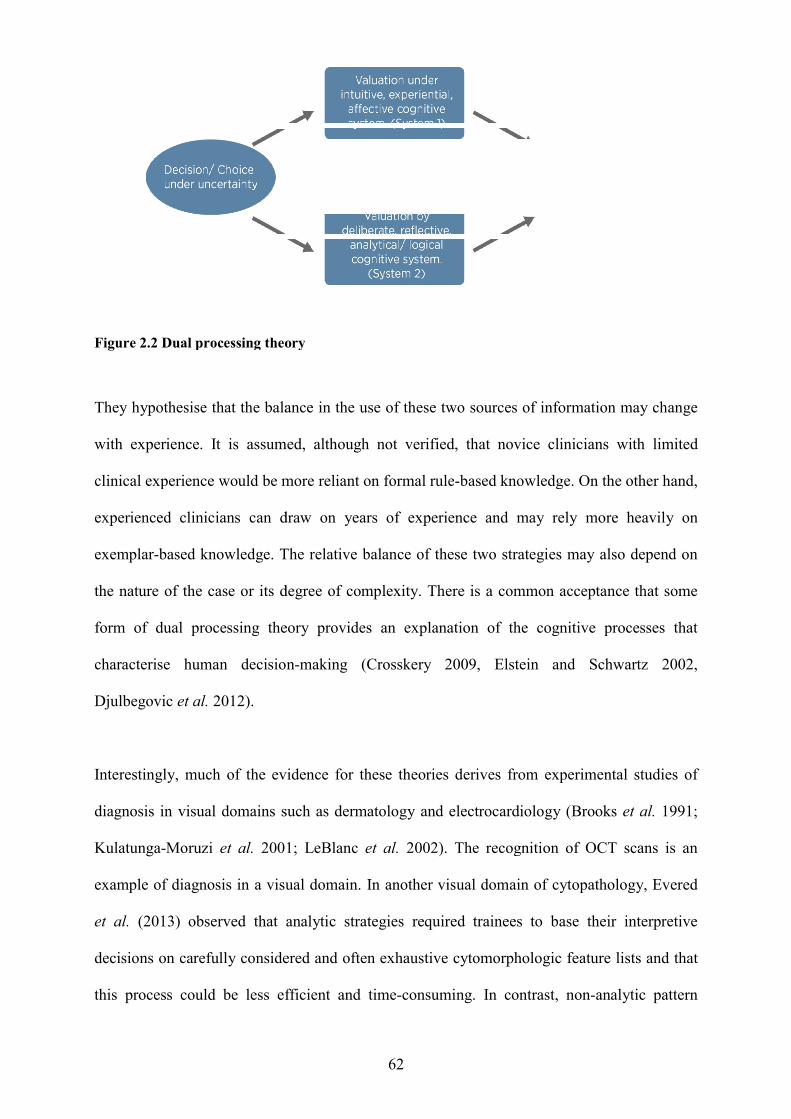
Figure 2.2 Dual processing theory
They hypothesise that the balance in the use of these two source
with experience. It is assumed, although not verified, that novice clinicians with limited
clinical experience would be more reliant on formal rule
experienced clinicians can draw on years of
exemplar-based knowledge. The relative balance of these two strategies may also depend on
the nature of the case or its degree of complexity.
form of dual processing the
characterise human decision
Djulbegovic et al. 2012).
Interestingly, much of the evidence for these theories derives from experimental studies of
diagnosis in visual domains such as dermatology and electrocardiology (Brooks
Kulatunga-Moruzi et al. 2001; LeBlanc
example of diagnosis in a visual domain.
et al. (2013) observed that analytic strategies required trainees to base their interpretive
decisions on carefully considered and often exhaustive cytomorphologic feature lists and that
this process could be less efficient and time
62
Dual processing theory
They hypothesise that the balance in the use of these two sources of information may change
with experience. It is assumed, although not verified, that novice clinicians with limited
clinical experience would be more reliant on formal rule-based knowledge. On the other hand,
an draw on years of experience and may rely more heavily on
based knowledge. The relative balance of these two strategies may also depend on
the nature of the case or its degree of complexity. There is a common acceptance that s
form of dual processing theory provides an explanation of the cognitive processes that
characterise human decision-making (Crosskery 2009, Elstein and Schwartz 2002,
much of the evidence for these theories derives from experimental studies of
osis in visual domains such as dermatology and electrocardiology (Brooks
2001; LeBlanc et al. 2002). The recognition of OCT scans is an
a visual domain. In another visual domain of cytopathology,
(2013) observed that analytic strategies required trainees to base their interpretive
decisions on carefully considered and often exhaustive cytomorphologic feature lists and that
ocess could be less efficient and time-consuming. In contrast, non
s of information may change
with experience. It is assumed, although not verified, that novice clinicians with limited
based knowledge. On the other hand,
and may rely more heavily on
based knowledge. The relative balance of these two strategies may also depend on
There is a common acceptance that some
cognitive processes that
making (Crosskery 2009, Elstein and Schwartz 2002,
much of the evidence for these theories derives from experimental studies of
osis in visual domains such as dermatology and electrocardiology (Brooks et al. 1991;
recognition of OCT scans is an
In another visual domain of cytopathology, Evered
(2013) observed that analytic strategies required trainees to base their interpretive
decisions on carefully considered and often exhaustive cytomorphologic feature lists and that
ontrast, non-analytic pattern
63
recognition strategies were not often encouraged during the training period, even though this
approach is characteristic of expert diagnostic behaviour.
In 2012 Djulbegovic et al. (2012) also described a model of clinical decision-making based on
dual processing theory which postulated that reasoning and decision-making can be described
as a function of both an intuitive, experiential, affective system (system 1) and/or an
analytical, deliberative processing system (system 2). This paper highlights a growing
recognition of the importance of system1 (fast, intuitive) and system 2 (slow, deliberate) at
different times, but few investigators have examined how to harness both types of processes
towards better clinical decision making and medical education.
Elstein and Schwartz (2002) argue that not all 'expert' clinicians perform to the same standard
and that expertise is dependent on the clinician’s mastery of their particular domain. Elstein
and Schwarz (2002) argue that this assertion challenges the hypothetico-deductive model of
clinical reasoning and that the accuracy of a diagnosis will not depend as much on strategy as
on mastery of content. They also suggest that the clinical reasoning of experts in familiar
situations often does not involve explicit testing of hypotheses. The speed, efficiency and
accuracy of expert physicians implies a different reasoning process than that used by novices.
So, expert physicians are thought to be more likely to use a hypothetico-deductive strategy
only when faced with more challenging cases and the clinical reasoning of experts is more a
case of pattern recognition or direct automatic retrieval. Elstein and Schwartz (2002) suggest
that this theory signals a shift from the study of judgment to the study of the organisation and
retrieval of memories.
Although most diagnostic errors are suspected to arise from cognitive biases associated with
rapid and unconscious reasoning or intuitive judgement (Croskerry, 2009), Norman et al.
(2014) demonstrated that simply encouraging slowing down and increasing attention to

64
analytical thinking is sufficient to increase diagnostic accuracy. In their words, “unexamined
intuitive judgements should be submitted to verification”.
Each situation is unique and may invoke different types of reasoning. Whilst an algorithmic
approach may be used in conditions where the information we collect from patients is discrete
and accurate, primary care clinicians may also use pattern recognition for the diagnosis of
common conditions. In situations where other modes of decision-making have failed, a more
exhaustive approach may be appropriate. However, such exhaustive approaches may not be
the most efficient or appropriate in the primary care or emergency setting.
Elstein and Schwartz (2002) identified and labelled some specific issues in problem solving
and decision making. Problem solving was rationalised into a dual system:
Hypothesis selection: a small number of hypotheses generated early in the diagnostic
process which are used to guide subsequent data collection. Additional findings are
predicted by each hypothesis
Pattern recognition or categorisation: experts, when in familiar situations, may not
form hypotheses (Brooks et al. 1991; Norman et al. 1992) but may instead employ a
form of clinical reasoning which simply involves pattern recognition or direct
automatic retrieval. A new case may be categorised by the extent to which it resembles
or evokes the memory of a previous case (Brooks et al. 1991). Alternatively clinical
experience may facilitate the construction of mental models, abstractions or
prototypes. In other words, a network of links is formed between clinical features and
diagnostic categories (Lemieux and Bordage, 1992).
Elstein and Schwartz (2002) suggest that an awareness of common types of cognitive errors
may help clinicians recognise and avoid them. Cognitive errors may be classified as those
65
concerned with pre-test probability (overestimation or underestimation of disease likelihood)
and failure to consider (in a meaningful way) all relevant possibilities. Probability errors
include:
Availability - clinicians wrongly estimate the prior probability of pathology because of
recent experience. Croskerry (2002) described availability as the tendency for things
to be judged if they come easily to mind. Things that are common are easily recalled
or experience may lead to overestimation of probability when there is memory of a
case that was dramatic (rare cases or cases that receive media attention). Elstein
(2002) also suggests that errors in the estimation of disease probability may be linked
to the perceived cost of mistakes. Croskerry (2002) defined non-availability as
something that might occur when insufficient attention is paid to that which is not
immediately present and suggested that novice clinicians are driven by availability
(more likely to bring common prototypes to mind). Experienced clinicians are more
willing to raise the possibility of an atypical variant.
Representation error – Elstein (2002) suggested that clinicians may judge the
probability of a disease based on how closely the patient's findings match classic
manifestations of the disease or disease category. In the case of representation error,
no account is taken of disease prevalence.
Support theory - this theory proposes that the subjective probability of an event is
inappropriately influenced by how detailed the description is. In clinical terms support
theory predicts that long, detailed case descriptions will be assigned a higher
subjective probability of the index disease than a brief description of the same case.
Anchoring errors – Croskerry described anchoring as a tendency to fixate on specific
features of a presentation too early in the diagnostic process. In other words, these
errors occur when clinicians steadfastly cling to an initial impression (jumping to
conclusions). In this type of diagnostic error, Elstein (2002) suggests that diagnostic
possibilities are not revised as much as they should be and instead diagnostic options
66
are revised up or down from the starting point (the "anchor") even as conflicting and
contradictory data accumulate. Confirmation bias occurs when physicians selectively
accept clinical data that supports a preferred diagnosis and ignore data that do not
(cherry-picking).
Elstein and Schwarz (2002) note that final opinions can sometimes be affected by the order in
which data are presented. For example, information presented later in a case may be afforded
more weight than information presented earlier.
The ultimate goal of all stages of medical education is to improve the health and health care of
the population. The models discussed so far have important practical applications for medical
decision-making and Croskerry (2009) suggests that they may be used as a template for
teaching decision theory. Specific operating characteristics of the models may explain how
diagnostic error occurs. A debate exists on how best to teach clinical diagnosis and thereby
reduce diagnostic errors. To arrive at a diagnosis, information of various types must be
considered and integrated. Croskerry (2009) also states that the recent model of reasoning and
decision-making (Dual Process Theory) has an immediate application in medical decision-
making and may provide some insight into the variety of theoretical approaches that have
been utilised in the past.
Clinical reasoning in optometric practice
Clinical reasoning as the core of medical competence has been the subject of many research
studies since the 1970's (Pelaccia et al. 2014) but despite this, it has rarely been referred to
within the discipline of optometry. Faucher et al. (2012) state that because the clinical
reasoning processes engaged in by optometrists have not previously been investigated, it is
not known whether models of clinical reasoning from other health professions can be
transposed to optometry. However, Faucher et al. do not indicate why they think that clinical
reasoning in optometry may be different to other health professions. It is important to
67
understand the cognitive activities that lead an optometric practitioner to make a diagnosis
and whereas there are a range of theories of clinical reasoning, the context in which a clinician
is making decisions may impact on reasoning. The concepts described and explained above
have been studied in a range of health professions. Models of reasoning may not legitimately
be applied universally to all situations and environments in which clinical practice takes
place. It is important to improve our understanding of how optometrists reach a diagnosis so
that the cognitive source of errors can be identified and remedial strategies formulated. This
could also inform optometric education and training strategies.
A thorough literature search on this subject matter has revealed that the clinical reasoning
strategies engaged in by optometric practitioners had not previously been investigated until a
small study by Faucher et al. (2012). This study was designed to make explicit the clinical
reasoning processes of optometrists at the "competent" and "expert" level. These processes
were compared to highlight characteristics of clinical reasoning expertise. Only four
competent-level and four expert-level optometrists participated in the study during which they
verbalised their reasoning during a complete eye examination on preselected patients.
Consultations were recorded on DVD and played back during feedback sessions when
optometrists could describe their mental processes. Although the researchers identified
analytical and non-analytical modes of reasoning amongst optometrists, these results should
be viewed within the context of significant study limitations which were readily
acknowledged. All participants were trained at the same school of optometry (all four
competent-level optometrists were from the same graduating class) so some of their
similarities may have been caused by their training. Also, optometrists' behaviour and
reasoning may have been influenced by filming of patient encounters (and feedback sessions)
and the presence of an optometrist observer.
68
Although this small study is likely to have been the first to investigate the clinical reasoning
of optometrists, it may pave the way for further research in this field. There is perhaps a need
to investigate clinical thinking and its related concepts specifically for the profession of
optometry. Optometric educators may be able to adapt their teaching and assessment methods
to the specific context of optometric practice. In this writer's opinion, clinical reasoning
amongst optometric clinicians is unlikely to be different from other health professionals.
However, a distinct set of circumstances does exist within the current model of primary
eyecare and the impact of this model on diagnostic accuracy and patient management requires
further investigation.
Medical algorithms Diagnostic and therapeutic algorithms are used across all professional boundaries and are
widely used to help minimize surgical intervention (Stoval and Ling, 1993), in areas of child
development (Wing et al. 2002), in screening for mental illness (Das et al. 2005) and in
predicting disease risk in individuals (D’Agostino et al. 2008). The use of algorithms is
becoming more widespread because computers have increasingly important roles in many
aspects of our lives. Modern computers go beyond explicitly programmed instructions and are
now capable of learning on their own. For example, some computer algorithms can facilitate
machine learning. The word algorithm is commonly used in computer science to refer to a
plan or strategy for solving a problem. A medical algorithm is a computation, formula or
look-up table used in healthcare and may take the form of a decision tree. Medical decisions
occur in many areas of medicine including medical test selection, diagnosis, and
treatment/management. A medical algorithm is often presented as a protocol. It is
strengthened if its contents are centred on evidence based medicine, regularly reviewed, and
compared with (and tempered by) expert opinion. Medical algorithms will usually indicate
appropriate history, physical examination, and laboratory tests (data) required. They will
make precise recommendations for diagnosis and treatment/management based on data
69
obtained. They include branching logic which carries the advantage of allowing
recommendations to be individualised.
Komaroff (1982) observes that over the past 50 years there has been an increasing attempt to
“transform the ‘art’ of medical decision-making into a science” with the purpose of
“supplementing what was recognised as a spontaneous, informal and implicit set of judgments
with the conclusions of a predetermined, formal and explicit scheme of logic”. Indeed, Van
den Ende (2005) notes that in developing countries medical algorithms have become the main
diagnostic and therapeutic strategy and suggests that the development of algorithms was
highly influenced by computer logic. However, Van den Ende (2005) also suggests that
algorithms may not always find favour among clinicians because of their counter-intuitive
logic.
Gill et al (2005) describes two approaches to draw statistical inferences: ‘frequentist’ and
Bayesian, and suggests that Bayesians do not interpret test results as a categorical probability
but as the degree to which positive or negative results adjust the probability of a given
disease. Validity can be afforded to both approaches even though they differ methodologically
and philosophically but the ‘frequentist’ approach is dominant in medical literature and is
increasingly applied in the clinical setting. Gill et al. (2005) suggest some irony in the fact
that clinicians apply “Bayesian reasoning in framing and revising differential diagnoses” and
use tests as opinion modifiers.
Komaroff (1982) suggests that the reasoning behind this ‘frequentist’ philosophy has been the
perception that clinicians make decisions in an idiosyncratic manner and therefore risk
compromising the quality of care or wasting valuable medical resources. Feinstein (1974)
states that as input data are converted to output conclusions, diagnostic reasoning must
navigate its way through a complex series of intermediate decisions and each decision will
preferably identify and explain entities cited in preceding stages. Feinstein reasons that
70
intermediate decisions are disregarded during the formulation of some statistical theories
linked to the diagnostic process. Feinstein therefore suggests that calculations of statistical
probability may not deliver the precise diagnosis.
Arriving at decisions by compressing individual details into the formulation of a general case
(despite the fact that individual details are often the essentials of clinical reasoning) is a
statistical approach. Errors may occur if a clinician makes decisions based on general
formulations whilst ignoring the uniqueness of individual patients. At the same time,
clinicians must eventually arrive at certain general formulations and Feinstein (1974) reminds
us that a clinician cannot practice medicine at all if he/she “regards each case as so unique that
no general principles of decision can be established”. Algorithms may be more effective if
combined with experience, sensitivity, and compassion. Feinstein (1974) suggests that there is
a risk that “strict adherence to an algorithmic standard might well lead to regimented and
uninspired decision-making”.
Komaroff (1982) quotes a clinician as saying, “I am being regimented if you give algorithms
to me but I am being systematic if I develop algorithms for myself”. Algorithms may
continue to play a role in medical decision-making and hypothetical benefits may continue to
outweigh theoretical risks.
Non-clinical influences on clinical decision-making
Hajjaj et al (2010) suggested that non-clinical influences could have a profound impact on
clinical decision-making within medicine and that this critically important aspect of daily
clinical practice is seldom formally considered. The optometry profession is undergoing a
technology revolution within an environment of ever-increasing competition. Advanced
imaging techniques are chargeable items (not funded by the NHS sight test) so, additional
71
diagnostic tests could be considered as a way of raising profits. A potentially serious ethical
problem of for-profit eyecare may be the incentives and organisational controls that may
adversely affect the optometrist-patient relationship thus creating conflicts of interest which
may diminish the quality of eyecare. Decision making within optometry may have additional
levels of complexity due to the expectations of the patient. Patients may request testing or
treatments that are not supported by guidelines and/or are not medically indicated. Such
requests may be based on misinformation, misunderstanding or anxiety.
Ocular imaging is used in optometric practice on patients with (or suspected of having) a
range of ocular conditions but also increasingly on normal patients. This highlights a problem
arising from the discovery of incidental abnormalities or findings. An incidental finding is a
finding which has potential health importance and is unknown to the patient. It is discovered
unexpectedly during an eye examination but is unrelated to the purpose or aims of the
examination.
Advances in modern imaging techniques now enable the detection of very minor
abnormalities that might have previously gone unnoticed. Incidental and clinically
insignificant findings may create a new challenge for optometrists. Such findings may also
raise ethical and legal issues which may not be addressed explicitly in guidelines. Growth in
use and perhaps overuse of diagnostic imaging may significantly impact on the quality and
costs of health care services. There may be modifiable factors involved in the unnecessary use
of ocular imaging but these factors are not easily identified and not enough is known about
their relative impact.
Evidence based medicine should form the basis of optometric management decisions but the
wide range of influences that optometrists are subjected to (consciously or subconsciously)
during the diagnostic and decision-making process should not be ignored. A lack of
72
understanding of non-clinical influences on optometric patient management could potentially
lead to suboptimal individual patient care.
VOMIT – “An acronym for our times” Richard Hayward (consultant neurosurgeon) first described the concept of 'victim of medical
imaging technology' (VOMIT) in a BMJ personal view in 2003 (Hayward 2003). He cited
two hypothetical cases of 'innocent pathology' found on magnetic resonance imaging (MRI)
which caused worry and anxiety in patients and their families. Hayward also suggested that
this anxiety may be further fuelled by internet searches and considerable time on the part of
the specialist would be needed to allay fears. McCoubrie and Reid (2013) suggest that the
term VOMIT has now passed into common medical parlance to describe all patients who
suffer physically and/or mentally as a result of false positive scan findings (including those
who are subjected to further unnecessary investigations for what turns out to be benign
pathology. McCoubrie and Reid (2013) however remind us that not all incidental findings are
trivial and that anxiety-inducing false positives can be prevented by good practice. Although
McCoubrie and Reid were commenting on radiological imaging modalities, they suggested
that this debate also applied to all investigations which were highly sensitive but not
particularly specific.
Hayward also suggested that the rise of clinical imaging (and reducing invasiveness) has
resulted in an exponential rise in volume and accuracy of information and this has caused
these investigations to move from being symptom driven to non-symptom driven. He further
suggested that the information flowing from these investigations and our knowledge of how
to deal with it may be several years out of step.
Lysdahl and Hofmann (2009) conducted a survey of 374 radiologists’(members of the
Norwegian Medical Association) perceptions of the causes of increasing and unnecessary use
73
of radiological investigations. The highest rated causes of increased use of radiological
investigations were the arrival and availability of new technology, patients’ demands,
clinicians’ intolerance for uncertainty (defensive medicine), expanded clinical indications and
availability.
These theories have particular resonance in the present research which centres round the
proliferation of a novel ocular imaging technology within community optometry.
E-learning versus traditional teaching E-learning refers to the use of internet technologies to deliver a broad array of solutions that
enhance knowledge and performance (Ruiz et al. 2006). E-learning is employed by medical
educators to improve the effectiveness of medical interventions. Web-based delivery of
education (e-learning) has revolutionised the modes of exchanging information and
optometric educators are unlikely to ignore this trend.
The evaluation of web-based applications versus conventional instruction in optometric
education has not been widely investigated and although ‘notes’ were the preferred learning
tool for optometry students in a survey study by Herse and Lee (2005), much has changed in
medical education since then. Text books also remain a corner stone for medical students but
the internet represents an important aid to support learning needs (Guarino et al. 2014).The
web is rapidly becoming an important clinical tool for doctors (Tang and Ng, 2006). Guarino
et al. (2014) also note that among the websites cited, Google and Wikipedia significantly
surpassed their peer-reviewed medical databases for the 368 medical students surveyed in
their study. It has been suggested that web-based delivery of identical content results in less
overall studying time as compared to textbook delivery in a specialisation within dentistry
(Ramseier et al. 2012). Ramseier et al. (2012) state that there is a difficulty in defining e-
learning as it may vary from simple text documents presented on a website to virtual

74
environments using sophisticated 3D simulations, all of which are very different. He also
reminds us that controlling for some confounding variables is a particular challenge when
comparing web-based with conventional learning as there may be more complex cognitive or
practical reasons underlying the various experimental outcomes.
Computerised devices such as tablets contain many technological features that are not found
in conventional print textbooks. Tablets offer backlighting for reading in low light. They have
search options and built-in dictionaries. Learner motivation and engagement with study
materials can be increased using videos and interactive diagrams. E-text books or papers can
be updated instantly with new information which is most important within a rapidly changing
healthcare system. The use of mobile devices by health care professionals has transformed
many aspects of daily clinical practice and this has led to a growth in the development of
medical software applications tailored to these devices which assist clinicians with many
important tasks including decision-making, education and training (Lee Ventola, 2014).
Today’s optometric educators face different challenges than their predecessors in teaching
tomorrow’s optometrists. Advances in ophthalmology and optometry and changes in eye care
delivery have increased demand on academic faculties. Also, changes in sites of eye care
delivery from acute eye care hospitals to community-based settings (including community
optometric practices) for chronic eye care will require adaptations in educational delivery.
Assessing the efficacy of clinical skills training
Assessing practitioners diagnostic skills The performance of clinicians in their day-to-day practice has emerged as an area of intense
public interest. Health care purchasers and patients want an effective means of identifying
excellent clinicians (Landon et al. 2003). In all phases of medical education, measurement of
a clinician's performance is necessary to determine the effectiveness of teaching methods and
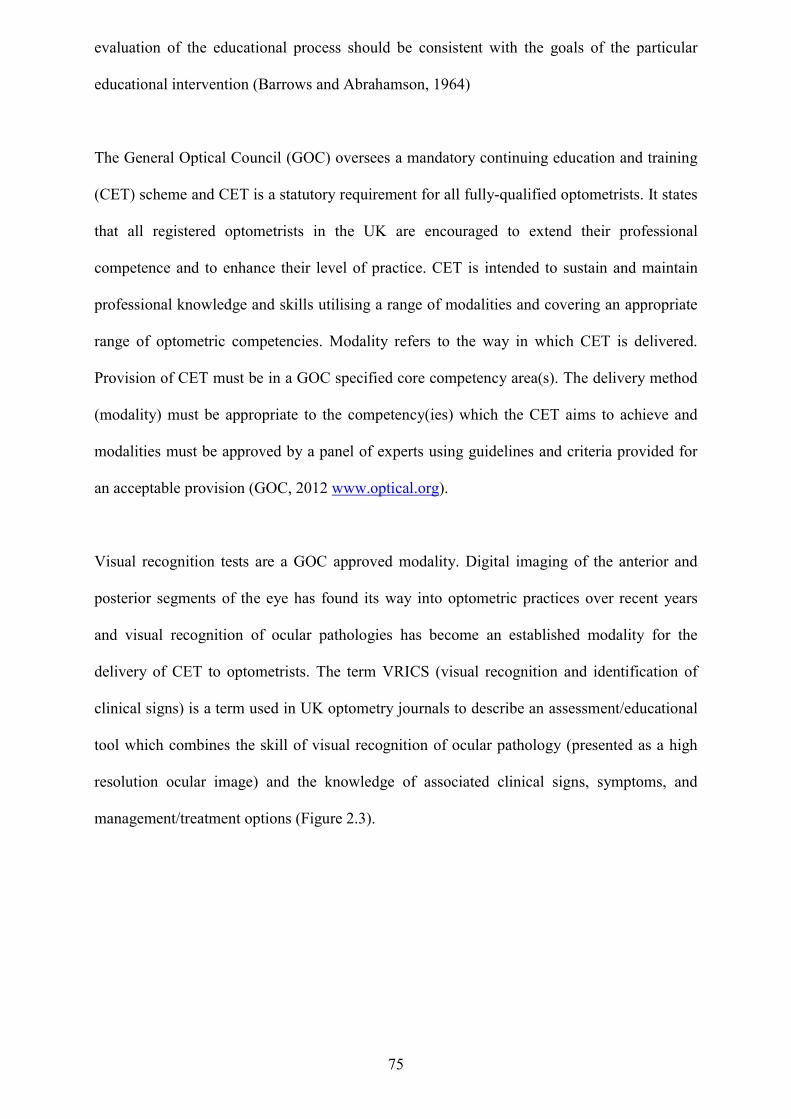
75
evaluation of the educational process should be consistent with the goals of the particular
educational intervention (Barrows and Abrahamson, 1964)
The General Optical Council (GOC) oversees a mandatory continuing education and training
(CET) scheme and CET is a statutory requirement for all fully-qualified optometrists. It states
that all registered optometrists in the UK are encouraged to extend their professional
competence and to enhance their level of practice. CET is intended to sustain and maintain
professional knowledge and skills utilising a range of modalities and covering an appropriate
range of optometric competencies. Modality refers to the way in which CET is delivered.
Provision of CET must be in a GOC specified core competency area(s). The delivery method
(modality) must be appropriate to the competency(ies) which the CET aims to achieve and
modalities must be approved by a panel of experts using guidelines and criteria provided for
an acceptable provision (GOC, 2012 www.optical.org).
Visual recognition tests are a GOC approved modality. Digital imaging of the anterior and
posterior segments of the eye has found its way into optometric practices over recent years
and visual recognition of ocular pathologies has become an established modality for the
delivery of CET to optometrists. The term VRICS (visual recognition and identification of
clinical signs) is a term used in UK optometry journals to describe an assessment/educational
tool which combines the skill of visual recognition of ocular pathology (presented as a high
resolution ocular image) and the knowledge of associated clinical signs, symptoms, and
management/treatment options (Figure 2.3).
Figure 2.3 VRICS CET event in Optometry Today (Association of Optometrists)
The domains of diagnosis, referral decision, urgency, likely tr
usually covered and questions are presented in multi
not find evidence of the term ‘VRICS’ used outside of UK optometry although visual
recognition tests are widely used as an educa
Attree (2006) reminds us that healthcare evaluators not only need valid and reliable methods
of assessing knowledge acquisition but also need to be able to assess the application of
knowledge to practice. There are c
outcomes especially within healthcare contexts where resources are scarce and confounding
variables are difficult to control
Current approaches to OCT training for optometrists Given the proliferation in use of OCT in optometric practice, questions remain on the
and availability of OCT training for optometrists who embrace this rapidly changing
technology. Optometrists’ scope of practice will change over time and the activities of
experienced optometrists will become more focussed and specialised. Ocular images
76
Figure 2.3 VRICS CET event in Optometry Today (Association of Optometrists)
The domains of diagnosis, referral decision, urgency, likely treatment, and review interval are
usually covered and questions are presented in multiple choice format. A literature search did
not find evidence of the term ‘VRICS’ used outside of UK optometry although visual
recognition tests are widely used as an educational tool across all clinical areas.
Attree (2006) reminds us that healthcare evaluators not only need valid and reliable methods
of assessing knowledge acquisition but also need to be able to assess the application of
knowledge to practice. There are complex relationships between educational inputs and
outcomes especially within healthcare contexts where resources are scarce and confounding
variables are difficult to control.
Current approaches to OCT training for optometrists
in use of OCT in optometric practice, questions remain on the
and availability of OCT training for optometrists who embrace this rapidly changing
Optometrists’ scope of practice will change over time and the activities of
ptometrists will become more focussed and specialised. Ocular images
xxxxxxxxxxxxxxxxxxxx
Figure 2.3 VRICS CET event in Optometry Today (Association of Optometrists)
eatment, and review interval are
literature search did
not find evidence of the term ‘VRICS’ used outside of UK optometry although visual
tional tool across all clinical areas.
Attree (2006) reminds us that healthcare evaluators not only need valid and reliable methods
of assessing knowledge acquisition but also need to be able to assess the application of
omplex relationships between educational inputs and
outcomes especially within healthcare contexts where resources are scarce and confounding
in use of OCT in optometric practice, questions remain on the quality
and availability of OCT training for optometrists who embrace this rapidly changing
Optometrists’ scope of practice will change over time and the activities of
ptometrists will become more focussed and specialised. Ocular images
xxxxxxxxxx xxxxxxxxxx
77
constitute a core portion of the information an optometrist uses to render diagnostic and
patient management decisions. OCT is one of the pillars of ocular imaging and plays a central
role in the management of a range of retinal diseases. Accurate interpretation of OCT is
rendered largely useless if it is followed by inappropriate patient management decisions.
Defining what is ‘normal’ (and an appreciation of normal variation) is a very challenging part
of the OCT learning curve for optometrists. Minor pathologies and other clinically
insignificant findings may not appear to significantly change the retinal surface when viewed
by conventional methods but may appear quite dramatic on OCT scanning. Optometrists
using OCT in daily practice should ideally have a working knowledge of the common retinal
diseases regularly presenting in optometric practice and their differential diagnosis. This
should include knowledge of: the signs and symptoms; the natural history and impact on
vision; the available treatments; the location of treatment centres and local referral protocols.
Practitioners should also be alert to the possibility of OCT instrument artefact. The science of
OCT scan recognition therefore needs to be matched to an understanding of an appropriate
patient management plan.
Accredited courses Optometrists may study at a small number of approved learning institutions across the UK
which provide higher qualifications within the higher qualifications framework of the College
of Optometrists (a modular approach to achieving College of Optometrists professional
qualifications). One of the courses available is the Professional Certificate in Medical Retina
which “provides community and hospital-based optometrists with knowledge of common
medical retina conditions and includes topics covering screening, referral and treatment
pathways with an emphasis on OCT interpretation and diabetic retinopathy grading” (College
of Optometrists, 2017).
78
OCT manufacturers offer staff training at the time of installation. Companies have also
exploited current technology (including the internet to offer webinars) to make training more
accessible and convenient for users. A clinician’s understanding of how the technology works
needs to match their understanding of what needs to be imaged and why. Whilst vendor
training is important, improving OCT competence should not stop with in-practice training.
OCT technology continues to evolve so the difficulty of keeping pace with innovation is
increasing.
Chapter summary This chapter has discussed the challenges faced by community optometrists in correctly
diagnosing retinal disease and appropriately refining subsequent referrals to ophthalmology
services. It has identified the strengths and limitations of current methods of ocular fundus
examination and suggested the need for a valid, sensitive and non-invasive method of fundus
examination such as OCT which is suited to the primary care setting of community
optometry. The role of optometrists in co-management of macular disease is likely to expand
owing to capacity issues within specialist retinal clinics and the increasing burden of macular
disease. The lack of resources specifically aimed at community optometrists who wish to use
OCT in practice to diagnose and manage patients with macular disease has also been
discussed.
The chapter has also outlined current approaches to OCT training for optometrists and the
potential value of internet delivery of education including the potential value of an internet-
based resource to assist optometrists with diagnostic and management decisions based on
OCT scans. Current models of clinical reasoning and methods of assessing diagnostic skills
are important in the design of educational resources and exam delivery, so they have been
discussed in detail.
79
Chapter 3: Methods This chapter will describe:
The experimental design of the study
The position of the researcher – ontology and epistemology
The outcome measures
An overview of statistical methods
The participants and recruitment process
The process of randomisation
The strategies used to maximise recruitment and minimise attrition
The method of vignette presentation – the exam host and exam format
The pilot study
The use of questionnaires and Google Analytics to measure some secondary outcomes
Study design
1. The methodology chosen to evaluate OCTAID was a randomised controlled trial
(RCT) comparing two groups of practitioners who underwent an online assessment of
their diagnostic and management skills based on OCT images before and after an
educational intervention. Participants were randomly allocated to one of two possible
educational interventions which were designed to assist in OCT interpretation. If they
were allocated to the first intervention (the control) they received a link to a
conventional OCT guide in addition to those resource/s they would normally use in
practice when interpreting an OCT image. Some materials are freely and readily
available via a Google search, but it was not assumed that all participants would have
access to such materials or would have sufficient background knowledge of OCT to be
able to conduct an effective search for relevant resources/materials. For this reason,
the control group were given access to an OCT paper (with permission from the
80
copyright holder) to provide an introduction to OCT of sufficient relevance to the
vignettes and quality to enable further searches for the information required to answer
questions within the assessments. If participants were allocated to the OCTAID
intervention group they were also permitted to use whatever resources they would
normally use but additionally they received access to the OCTAID website.
Participants’ usage of the interventions was monitored by use of questionnaires and an
overall assessment of the extent to which participants used the OCTAID site was
provided by the use of Google Analytics software. The RCT is widely considered to
be the most robust of research designs because the decision of randomising
participants to receive or not receive an intervention ensures that any differences in
outcome between the two groups can be attributed to the interventions and not to any
other unidentified external factors (Sibbald and Roland, 1998).
2. An expert panel was recruited to play an advisory role in the design of the diagnostic
algorithm and to act as a ‘reference standard’ in assessing practitioners’ diagnostic and
patient management skills by forming a consensus opinion on diagnosis/management
based on OCT scans.
3. The lead researcher invited optometrists to participate in the study as described in the
next section. A study information leaflet in PDF format was specially designed and
attached to the invitation email sent to the forums. Interested practitioners then
emailed the lead researcher to request a participant information sheet and a consent
form. A questionnaire was designed and circulated to establish participants’ previous
level of OCT experience. Participants were not excluded on the basis of previous
experience of OCT but the study co-varied for their level of experience in the analysis
of results. The lead researcher also provided a telephone number for those
practitioners who may have wished to ask further questions about the study.
Participant information sheets and consent forms were returned in pre-paid, addressed
envelopes to the lead researcher.
81
The main objective of the statistical analysis was to compare the change in vignette
performance before and after intervention.
The RCT is a rigorous way of determining whether a cause-effect relation exists between
intervention and outcome and was thought to the best match to the study title, research aims
and objectives and data collection methods. Outcomes were easily quantifiable (exam scores
expressed as numbers). Randomisation ensured that known and unknown baseline
confounding factors would balance out in the treatment and control groups.
Other study designs (including non-randomised controlled trials) may also detect associations
between intervention and outcome but the possibility that an association was caused by a third
factor (or factors) linked to both intervention and outcome, cannot be ruled out. Random
allocation ensures no systematic differences between intervention and control groups (known
and unknown) that might affect outcome.
An observational study would not have been useful in testing a novel educational
intervention. A cross-over design study (conducting an RCT using the same group twice)
would have involved having a group of participants in the study group and then the same
group crossing over into the control group (whilst randomly allocating them as to which
group they went into first) This approach would have required a smaller number of
participants. However, in the current study there would have been the logistical problem of
the ‘carry over’ effect whereby participants who were crossing over groups would still have
been experiencing the effect of the first educational intervention. Other quantitative
experiments (where one or more requirements for RCT classification are missing) employing
a ‘pre-post’ design would not have eliminated the possibility of confounding in the baseline
characteristics of the study and control groups.
82
Participants and researchers ideally should remain unaware of which intervention was given
until the study is completed. However, such double blind studies are not always feasible or
appropriate and this will be discussed in the context of this study later in this section.
Ontology and epistemology – the position of the researcher Researchers have a choice about their philosophical approach to a study but the importance of
being reflexive is not always acknowledged and once a researcher accepts a particular
epistemology, they tend to adopt methods that are characteristic of that position (Mauthner
and Doucet, 2003). Ontology and epistemology both act as anchors in the approach to a
research question. Each researcher will filter for preferences in their own world. These
preferences are derived from previously held beliefs or principles, motives or perhaps
constraints imposed by the research subject or question. As researchers filter for information
they may decide on the evidence to be collected and the evidence to be set aside when
building an argument. This can impact on the research methods and data-gathering
techniques.
This student author approached the research question from a positivist stance (a deductive and
more scientific view – “counting and measuring” quantitative research method). The
researcher is aware of the risk of bias in that the choice of view in the research field is linked
with the preferences of the researcher (and the variety and validity of what is already known).
Whilst all possible approaches to the study design were considered, a design was chosen that
was appropriate to the research question and the objectives of the researcher.
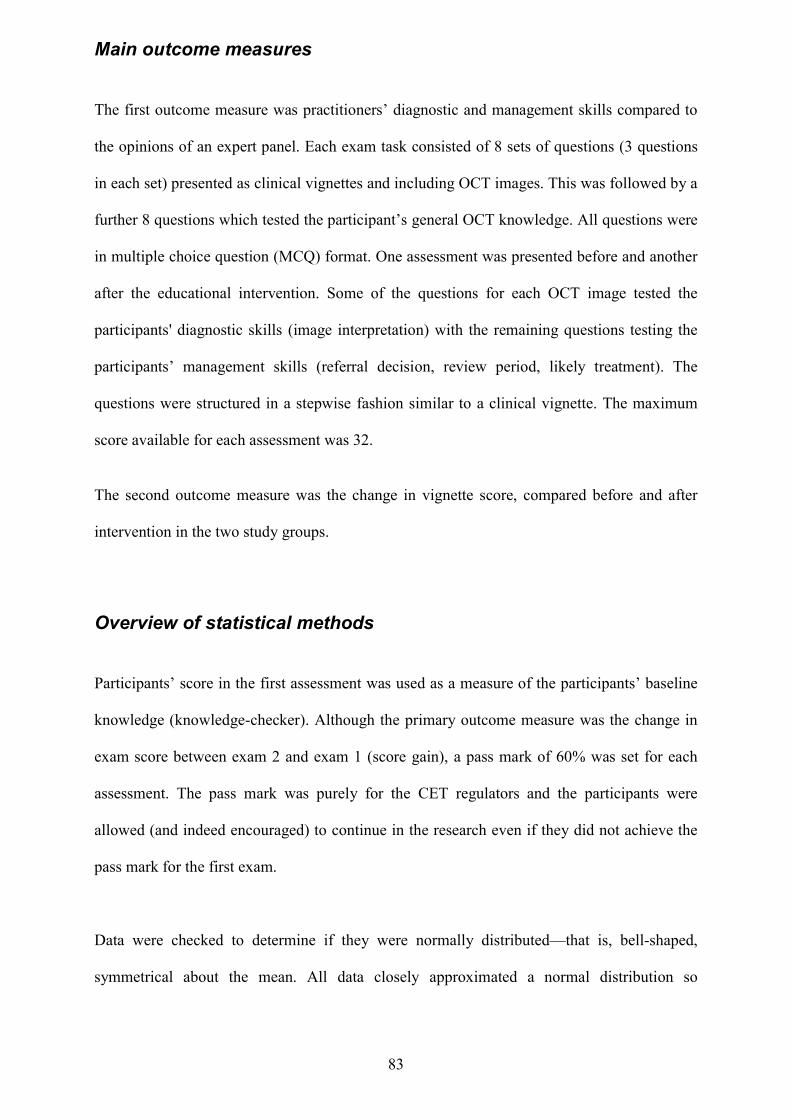
83
Main outcome measures The first outcome measure was practitioners’ diagnostic and management skills compared to
the opinions of an expert panel. Each exam task consisted of 8 sets of questions (3 questions
in each set) presented as clinical vignettes and including OCT images. This was followed by a
further 8 questions which tested the participant’s general OCT knowledge. All questions were
in multiple choice question (MCQ) format. One assessment was presented before and another
after the educational intervention. Some of the questions for each OCT image tested the
participants' diagnostic skills (image interpretation) with the remaining questions testing the
participants’ management skills (referral decision, review period, likely treatment). The
questions were structured in a stepwise fashion similar to a clinical vignette. The maximum
score available for each assessment was 32.
The second outcome measure was the change in vignette score, compared before and after
intervention in the two study groups.
Overview of statistical methods Participants’ score in the first assessment was used as a measure of the participants’ baseline
knowledge (knowledge-checker). Although the primary outcome measure was the change in
exam score between exam 2 and exam 1 (score gain), a pass mark of 60% was set for each
assessment. The pass mark was purely for the CET regulators and the participants were
allowed (and indeed encouraged) to continue in the research even if they did not achieve the
pass mark for the first exam.
Data were checked to determine if they were normally distributed—that is, bell-shaped,
symmetrical about the mean. All data closely approximated a normal distribution so
84
parametric methods were used (appendix 10). Non-parametric methods are typically less
powerful and less flexible than their parametric counterparts.
Categorical data were summarised as numbers and proportions. Participants’ pass/fail rate
was described and groups formally compared using Chi-square tests. Chi-square tests were
used to compare proportions between two independent groups and the data were presented as
a contingency table with one of the variables as rows and the other as columns. In the case of
the second exam assessment, there were low numbers in one cell (only 3 fails in exam 2 for
the OCTAID group). Because of these low numbers Fishers Exact test was the appropriate
test to use for the 2x2 table for the second exam results and to maintain consistency, was
therefore also used for comparing groups in the first exam assessment. Fisher’s exact test is
used when analysing two nominal variables. Fishers’ exact test is most commonly used in 2x2
tables and it is thought to be more accurate than the chi-squared test of independence when
expected numbers are small (Mc Crum-Gardner, 2008).
The Difference Score (the score in exam 2 minus the score in exam 1) or score gain reduced
the two measurements for each participant into one so in this analysis one measurement in
each of the two groups was compared using standard unpaired t-tests.
Secondary outcome measures The main outcomes are the essential and most relevant outcomes for decision-making and
those that form the basis of the summary of findings in any study. A pass mark was set for
each exam module and the difference in the pass rate between the study and control groups
was used as a secondary outcome measure.
Participants were asked (using short electronic questionnaires linked to the online study
modules) how long it took them to complete each exam task and how long they spent
studying the OCT educational tools provided for the study. The overall use of the OCTAID
85
website was monitored using Google Analytics software. The quality of the study in terms of
its value to OCT education and relevance to optometric practice (from the participants’
perspective) was also measured using a short feedback questionnaire.
Participants
Recruitment Participant recruitment is often a significant challenge in research studies. Successful
recruitment to the current study involved a number of activities including:
Identifying suitable and sufficiently motivated participants
Marketing the research study effectively
Adequately explaining the study to potential participants
Recruiting an adequate sample based on study goals and design
Obtaining informed consent and retaining participants until study completion
Maintaining ethical standards
All participants to this study were community optometrists with an interest in OCT but with
varying levels of OCT experience including those who may not have had access to OCT
equipment. Much of the recruitment effort was focussed on a number of online optometry
forums. The Optix OCT forum is provided by Optix Software as a free service for the
profession and is co-sponsored by Nidek (a leading supplier of OCT equipment). It is open to
all optometrists for the exchange of ideas and advice relating to the use of any brand of OCT
and interpretation of the results.
The optom.com is an online forum and chatroom for optometrists and has 7762 registered
users.
86
The University of Manchester Listserv service is an email –based server that allows users to
create, manage and control electronic mailing lists. Listserv manages list subscriptions and
archives of posted messages and optimises mass mail. Listserv allows any networked user to
subscribe to lists, receive postings and access list archives.
In a previous study design, a leading supplier of OCT equipment had indicated a willingness
to assist with recruitment to the study by making customers (both new and established) aware
of the study. This strategy would have entailed the supply of the study promotional leaflet
(appendix 3) to mainly new OCT users (by the training team) when they took delivery of their
equipment or during the initial training session. The author and research team did not request
(and were not supplied) with information about the OCT supplier’s clients.
The author (in consultation with supervisors) decided against this mode of recruitment for the
following reasons:
The Research Ethics Committe at LSBU expressed some reservations about
recruitment via an OCT supplier in their initial review of the study’s ethics application
on the grounds of the potential for recruitment to the study to be perceived as part of a
sales process.
It was felt that the recruitment task would be quite onerous and something of a
distraction for an OCT sales team striving to maximise sales opportunities in a highly
competitive market
There are several OCT suppliers in the UK and the research team did not wish the
study to be associated with one company. This might have been an inhibiting factor
for potential recruits and other OCT suppliers who may have felt less inclined to
recommend the study as a training resource
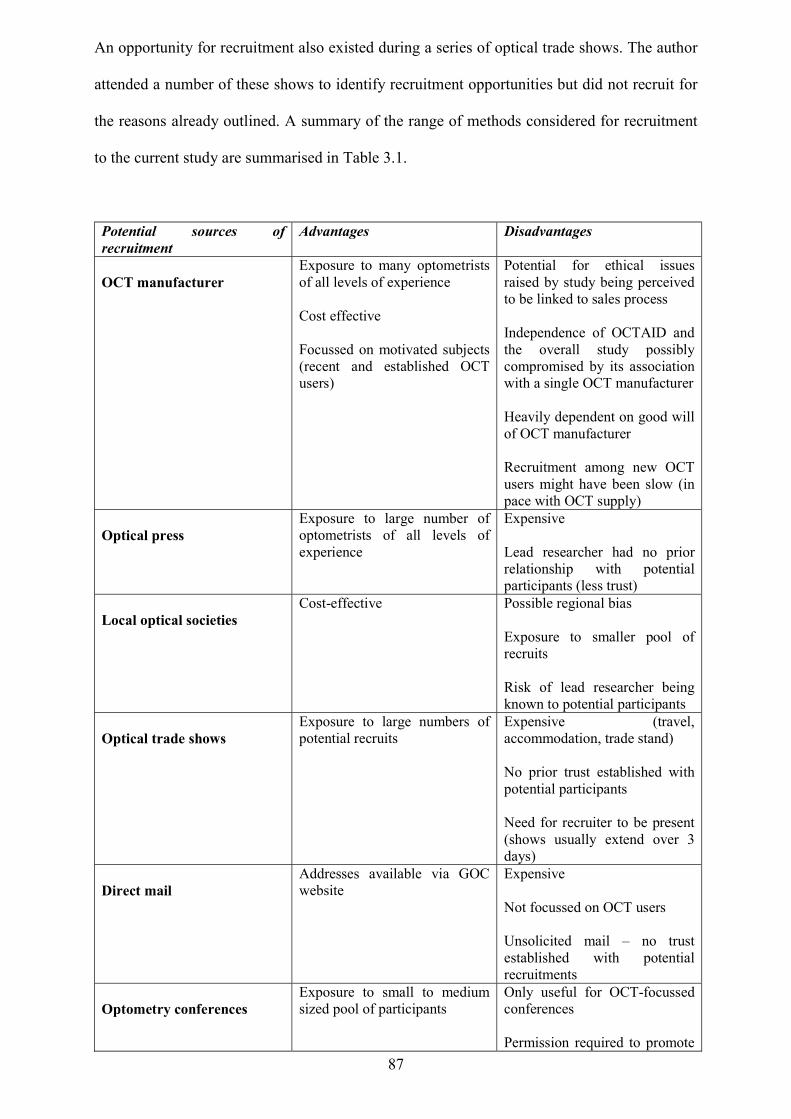
87
An opportunity for recruitment also existed during a series of optical trade shows. The author
attended a number of these shows to identify recruitment opportunities but did not recruit for
the reasons already outlined. A summary of the range of methods considered for recruitment
to the current study are summarised in Table 3.1.
Potential sources of recruitment
Advantages Disadvantages
OCT manufacturer
Exposure to many optometrists of all levels of experience Cost effective Focussed on motivated subjects (recent and established OCT users)
Potential for ethical issues raised by study being perceived to be linked to sales process Independence of OCTAID and the overall study possibly compromised by its association with a single OCT manufacturer Heavily dependent on good will of OCT manufacturer Recruitment among new OCT users might have been slow (in pace with OCT supply)
Optical press
Exposure to large number of optometrists of all levels of experience
Expensive Lead researcher had no prior relationship with potential participants (less trust)
Local optical societies
Cost-effective
Possible regional bias Exposure to smaller pool of recruits Risk of lead researcher being known to potential participants
Optical trade shows
Exposure to large numbers of potential recruits
Expensive (travel, accommodation, trade stand) No prior trust established with potential participants Need for recruiter to be present (shows usually extend over 3 days)
Direct mail
Addresses available via GOC website
Expensive Not focussed on OCT users Unsolicited mail – no trust established with potential recruitments
Optometry conferences
Exposure to small to medium sized pool of participants
Only useful for OCT-focussed conferences Permission required to promote
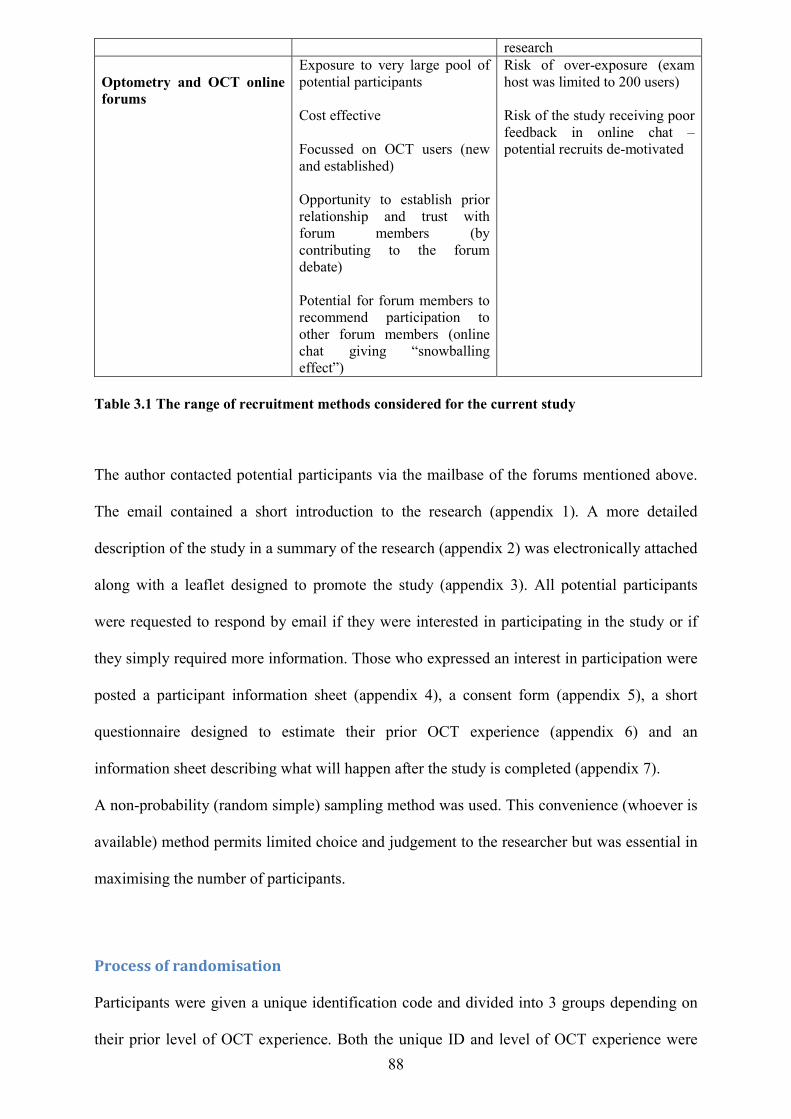
88
research Optometry and OCT online forums
Exposure to very large pool of potential participants Cost effective Focussed on OCT users (new and established) Opportunity to establish prior relationship and trust with forum members (by contributing to the forum debate) Potential for forum members to recommend participation to other forum members (online chat giving “snowballing effect”)
Risk of over-exposure (exam host was limited to 200 users) Risk of the study receiving poor feedback in online chat – potential recruits de-motivated
Table 3.1 The range of recruitment methods considered for the current study
The author contacted potential participants via the mailbase of the forums mentioned above.
The email contained a short introduction to the research (appendix 1). A more detailed
description of the study in a summary of the research (appendix 2) was electronically attached
along with a leaflet designed to promote the study (appendix 3). All potential participants
were requested to respond by email if they were interested in participating in the study or if
they simply required more information. Those who expressed an interest in participation were
posted a participant information sheet (appendix 4), a consent form (appendix 5), a short
questionnaire designed to estimate their prior OCT experience (appendix 6) and an
information sheet describing what will happen after the study is completed (appendix 7).
A non-probability (random simple) sampling method was used. This convenience (whoever is
available) method permits limited choice and judgement to the researcher but was essential in
maximising the number of participants.
Process of randomisation
Participants were given a unique identification code and divided into 3 groups depending on
their prior level of OCT experience. Both the unique ID and level of OCT experience were
89
written on a piece of paper, folded and placed in one of 3 boxes based on OCT experience.
The contents of each subgroup box was further divided in half by a third party randomly
choosing half of the pieces of paper. Half of each subgroup was allocated to the study
(OCTAID) group with the other half being allocated to the control group. The author played
no part in allocating participants to study groups but a pragmatic approach to masking was
adopted thereafter because the author needed to load participant details onto the LearnUpon
platform to assign them to the correct subgroup (ensuring that they were assigned to the
correct intervention and subgroup analysis). The author also needed to register an email
address for each participant in preparation for automated invitations and reminders from
LearnUpon. The author needed to have access to the participants email throughout the study,
not only to answer queries, deal with IT issues, and ensure correct allocation of CET points
but also to keep participants engaged, focussed and motivated.
LearnUpon hosted two courses for this study (OCTAID and Control) which were identical in
every way except for the educational intervention following completion of the first exam task.
Once assigned to a course on LearnUpon (and a subgroup for more detailed analysis),
participants could not be moved to another group, even in the event of withdrawal, failure to
register or enrol or failure to start or finish. The integrity of the original process of
randomisation was therefore preserved at the risk of attrition affecting one study group
disproportionately.
Sample size considerations
A sample size calculation was considered (Prajapati, Dunne, Armstrong, 2010), but the
absence of previous data concerning an educationally significant improvement in the OCT
exam, and the absence of data on the standard deviation of the exam results make such a
calculation less plausible. One possibility is to use pilot data or data from the first participants
to complete the study to obtain these measures but clearly the accuracy of these estimates will
90
be less than ideal. After discussion with the supervisory team it was concluded that
a sample size calculation may not be required in this study for two additional reasons. First,
there is a finite group of clinicians with OCT equipment. Second, the computerised nature of
the exams and of the interventions means that there is no practical ceiling on the number of
participants. It was decided to adopt a pragmatic approach to sample size and concentrate
efforts on recruiting the maximum possible number of participants in the time available. In
circumstances where effect size data are unavailable or considered less reliable, Cohen has
determined standardised effect sizes described as “small”, “medium” and “large” (Prajapati,
Dunne, Armstrong, 2010) and appendix 11 contains a sample size calculation based on
primary outcome data (mean values and standard deviations) from the current study.
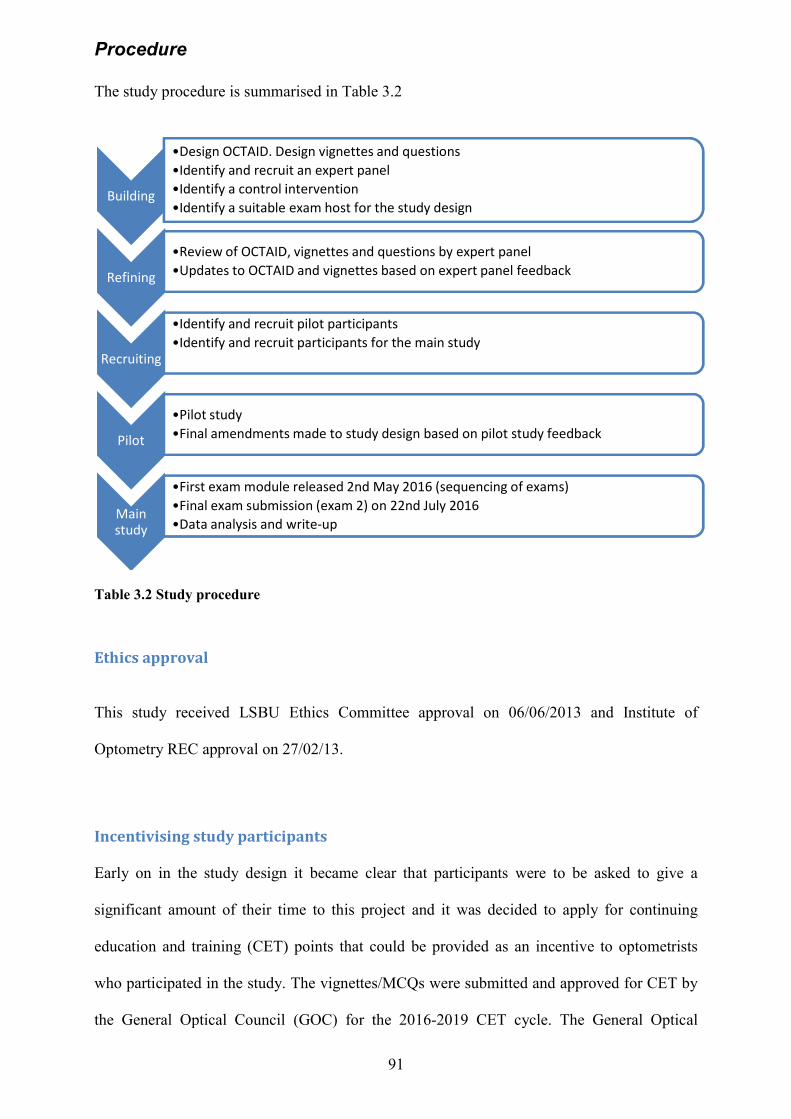
Procedure The study procedure is summarised in Table 3
Table 3.2 Study procedure
Ethics approval This study received LSBU Ethics Committee approval on 06/06/2013
Optometry REC approval on 27/02/13
Incentivising study participants Early on in the study design it became clear that participants were to be asked to give a
significant amount of their time to this project and it was decided to apply for cont
education and training (CET) points that could be provided as an incentive to optometrists
who participated in the study. The vignettes/MCQs were
the General Optical Council (GOC)
Building
•Design OCTAID. Design vignettes and questions•Identify and recruit an expert panel•Identify a control intervention•Identify a suitable exam host for the study design
Refining
•Review of OCTAID, vignettes and questions by expert panel•Updates to OCTAID and vignettes based on expert panel feedback
Recruiting
•Identify and recruit pilot participants•Identify and recruit participants for the main study
Pilot
•Pilot study•Final amendments made to study design based on pilot study feedback
Main study
•First exam module released 2nd May 2016 (sequencing of exams)•Final exam submission (exam 2) on 22nd July 2016•Data analysis and write
91
ocedure is summarised in Table 3.2
received LSBU Ethics Committee approval on 06/06/2013
Optometry REC approval on 27/02/13.
Incentivising study participants
Early on in the study design it became clear that participants were to be asked to give a
significant amount of their time to this project and it was decided to apply for cont
education and training (CET) points that could be provided as an incentive to optometrists
who participated in the study. The vignettes/MCQs were submitted and approved for CET by
the General Optical Council (GOC) for the 2016-2019 CET cycle. The Ge
Design OCTAID. Design vignettes and questionsIdentify and recruit an expert panelIdentify a control interventionIdentify a suitable exam host for the study design
Review of OCTAID, vignettes and questions by expert panelUpdates to OCTAID and vignettes based on expert panel feedback
Identify and recruit pilot participantsIdentify and recruit participants for the main study
Final amendments made to study design based on pilot study feedback
First exam module released 2nd May 2016 (sequencing of exams)Final exam submission (exam 2) on 22nd July 2016Data analysis and write-up
received LSBU Ethics Committee approval on 06/06/2013 and Institute of
Early on in the study design it became clear that participants were to be asked to give a
significant amount of their time to this project and it was decided to apply for continuing
education and training (CET) points that could be provided as an incentive to optometrists
submitted and approved for CET by
2019 CET cycle. The General Optical
Final amendments made to study design based on pilot study feedback
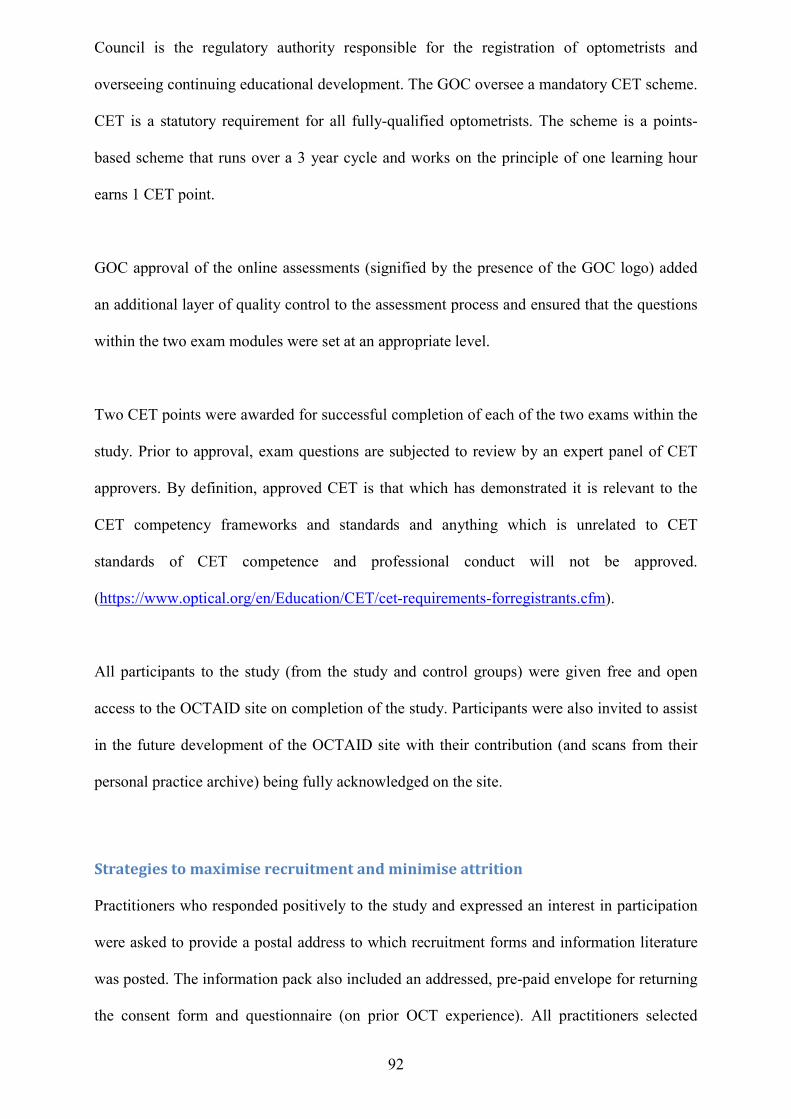
92
Council is the regulatory authority responsible for the registration of optometrists and
overseeing continuing educational development. The GOC oversee a mandatory CET scheme.
CET is a statutory requirement for all fully-qualified optometrists. The scheme is a points-
based scheme that runs over a 3 year cycle and works on the principle of one learning hour
earns 1 CET point.
GOC approval of the online assessments (signified by the presence of the GOC logo) added
an additional layer of quality control to the assessment process and ensured that the questions
within the two exam modules were set at an appropriate level.
Two CET points were awarded for successful completion of each of the two exams within the
study. Prior to approval, exam questions are subjected to review by an expert panel of CET
approvers. By definition, approved CET is that which has demonstrated it is relevant to the
CET competency frameworks and standards and anything which is unrelated to CET
standards of CET competence and professional conduct will not be approved.
(https://www.optical.org/en/Education/CET/cet-requirements-forregistrants.cfm).
All participants to the study (from the study and control groups) were given free and open
access to the OCTAID site on completion of the study. Participants were also invited to assist
in the future development of the OCTAID site with their contribution (and scans from their
personal practice archive) being fully acknowledged on the site.
Strategies to maximise recruitment and minimise attrition Practitioners who responded positively to the study and expressed an interest in participation
were asked to provide a postal address to which recruitment forms and information literature
was posted. The information pack also included an addressed, pre-paid envelope for returning
the consent form and questionnaire (on prior OCT experience). All practitioners selected

email as their preferred method of
their email would only be used for enrolment with the online exam host and for ongoing study
support from the author. Practitioners who returned their signed recruitment documents were
registered with the exam host (LearnUpon) and were then invited (using their preferred email)
by the exam host to the LearnUpon portal. Practitioners who did not return their recruitment
documents were reminded (twice
time they did not receive any further communication. This process
Figure 3.1.
Figure 3.1 The recruitment and enrolment process A number of strategies were adopted in order to avoid attrition from this study. A high
attrition had the potential to introduce bias and reduce the overall power of the study in terms
of its validity, generalisability and validity of results.
Automated reminders within the LearnUpon system were triggered at various stages and this
is described in the next section on the exam host. The course administrator (the author) was
93
email as their preferred method of communication throughout the study and understood that
their email would only be used for enrolment with the online exam host and for ongoing study
support from the author. Practitioners who returned their signed recruitment documents were
the exam host (LearnUpon) and were then invited (using their preferred email)
by the exam host to the LearnUpon portal. Practitioners who did not return their recruitment
twice only) by the author to return their documents after wh
time they did not receive any further communication. This process is summarised below in
Figure 3.1 The recruitment and enrolment process
A number of strategies were adopted in order to avoid attrition from this study. A high
attrition had the potential to introduce bias and reduce the overall power of the study in terms
of its validity, generalisability and validity of results.
Automated reminders within the LearnUpon system were triggered at various stages and this
s described in the next section on the exam host. The course administrator (the author) was
communication throughout the study and understood that
their email would only be used for enrolment with the online exam host and for ongoing study
support from the author. Practitioners who returned their signed recruitment documents were
the exam host (LearnUpon) and were then invited (using their preferred email)
by the exam host to the LearnUpon portal. Practitioners who did not return their recruitment
) by the author to return their documents after which
is summarised below in
A number of strategies were adopted in order to avoid attrition from this study. A high rate of
attrition had the potential to introduce bias and reduce the overall power of the study in terms
Automated reminders within the LearnUpon system were triggered at various stages and this
s described in the next section on the exam host. The course administrator (the author) was
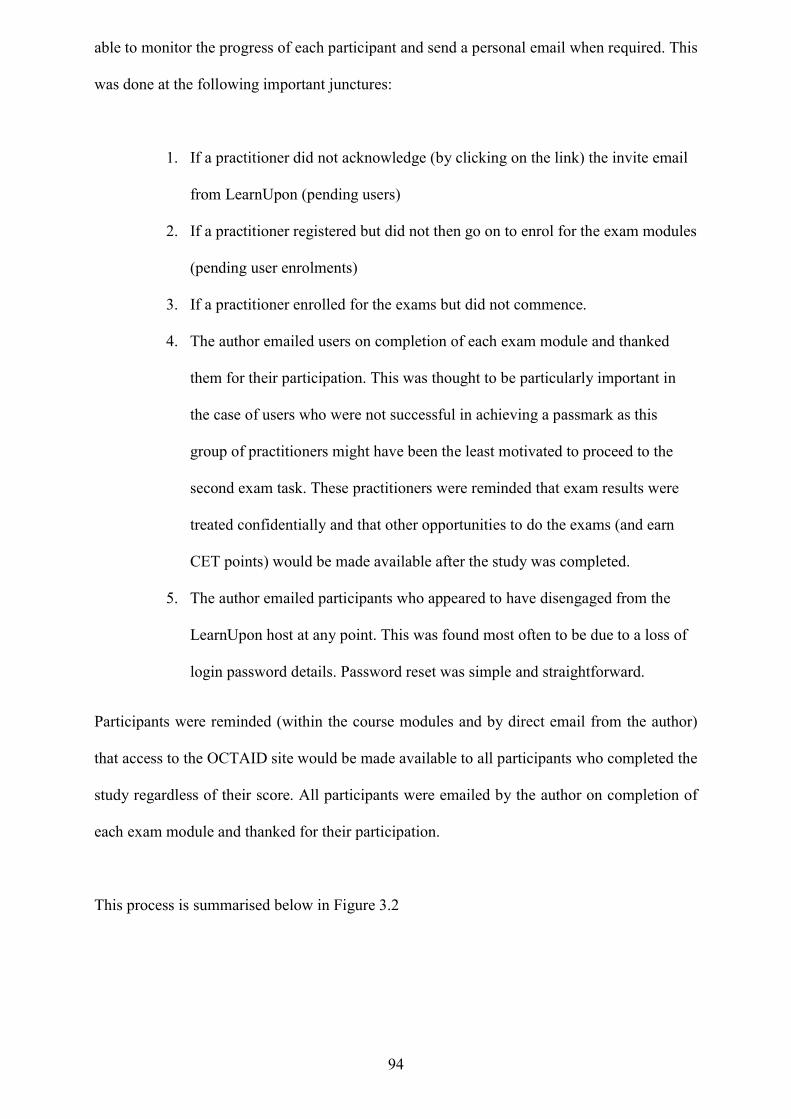
94
able to monitor the progress of each participant and send a personal email when required. This
was done at the following important junctures:
1. If a practitioner did not acknowledge (by clicking on the link) the invite email
from LearnUpon (pending users)
2. If a practitioner registered but did not then go on to enrol for the exam modules
(pending user enrolments)
3. If a practitioner enrolled for the exams but did not commence.
4. The author emailed users on completion of each exam module and thanked
them for their participation. This was thought to be particularly important in
the case of users who were not successful in achieving a passmark as this
group of practitioners might have been the least motivated to proceed to the
second exam task. These practitioners were reminded that exam results were
treated confidentially and that other opportunities to do the exams (and earn
CET points) would be made available after the study was completed.
5. The author emailed participants who appeared to have disengaged from the
LearnUpon host at any point. This was found most often to be due to a loss of
login password details. Password reset was simple and straightforward.
Participants were reminded (within the course modules and by direct email from the author)
that access to the OCTAID site would be made available to all participants who completed the
study regardless of their score. All participants were emailed by the author on completion of
each exam module and thanked for their participation.
This process is summarised below in Figure 3.2
95
Figure 3.2 Strategies for the retention of participants
The method of vignette presentation - the exam host The research assessed the performance of OCTAID compared with a control educational
intervention using clinical vignettes/MCQs. The clinical vignettes/MCQs were hosted online
by LearnUpon which is a learning management system designed for the delivery of online
training and examinations. LearnUpon is a multi-award winning company with over 1.5
million users worldwide. LearnUpon provides excellent flexibility for all formats of
examination design along with statistical analysis software.
The author invested considerable time and effort in identifying a suitable online host for the
vignette exams. Some of the current popular choices in the online survey market such as
Survey Monkey and the Bristol Online Survey were very limited in terms of:
Hosting exams which included high resolution images with large file sizes
Presenting exam questions in the sequenced fashion of a clinical vignette with the
option to prevent return to a previously answered question
Statistical analysis software and generation of charts
Retention of participants
Automated reminders
from LearnUpon
email reminders from lead researcher
Motivating messages
and instructions
within course modules
Careful monitoring of participants progress by
administrator
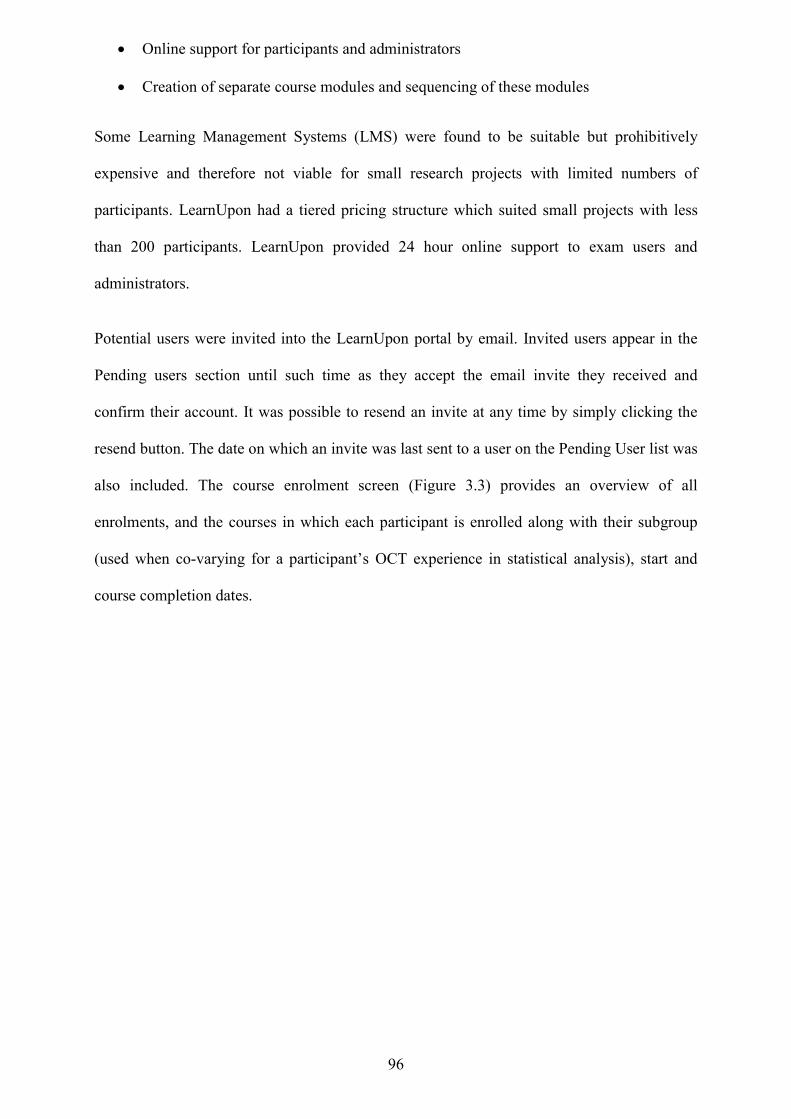
96
Online support for participants and administrators
Creation of separate course modules and sequencing of these modules
Some Learning Management Systems (LMS) were found to be suitable but prohibitively
expensive and therefore not viable for small research projects with limited numbers of
participants. LearnUpon had a tiered pricing structure which suited small projects with less
than 200 participants. LearnUpon provided 24 hour online support to exam users and
administrators.
Potential users were invited into the LearnUpon portal by email. Invited users appear in the
Pending users section until such time as they accept the email invite they received and
confirm their account. It was possible to resend an invite at any time by simply clicking the
resend button. The date on which an invite was last sent to a user on the Pending User list was
also included. The course enrolment screen (Figure 3.3) provides an overview of all
enrolments, and the courses in which each participant is enrolled along with their subgroup
(used when co-varying for a participant’s OCT experience in statistical analysis), start and
course completion dates.
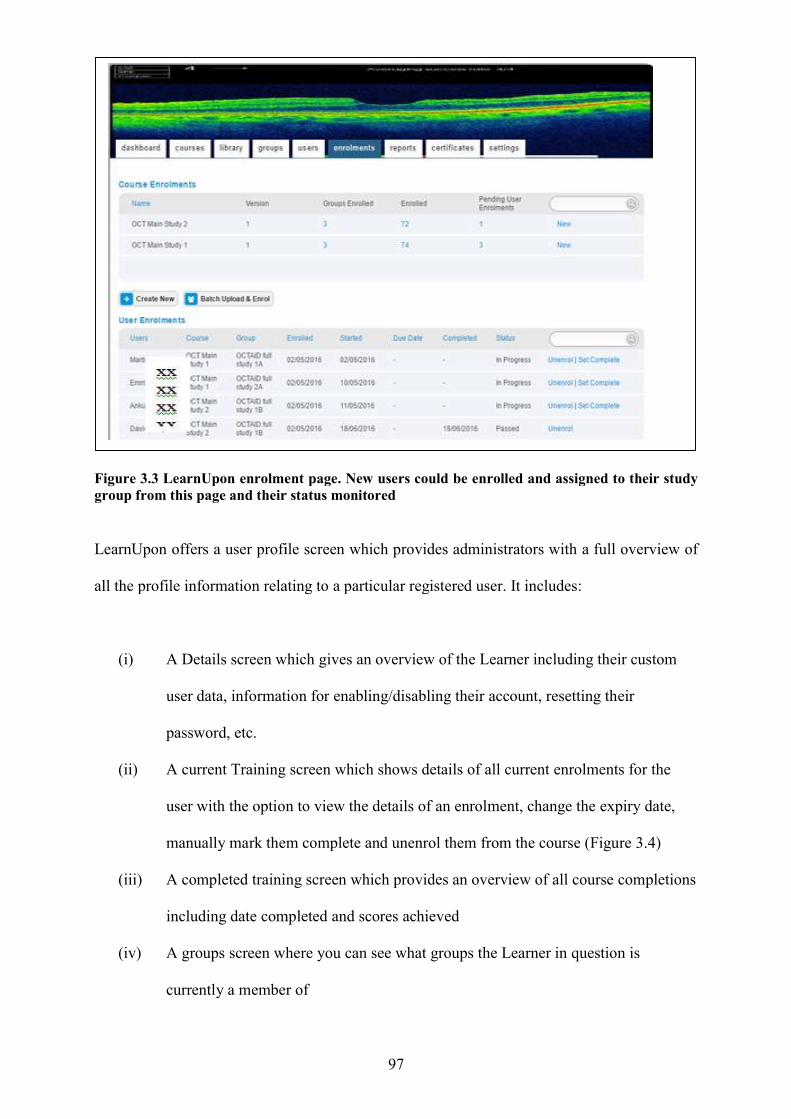
Figure 3.3 LearnUpon enrolment page. New users could be enrolled and assigned to their study group from this page and their status monito
LearnUpon offers a user profile screen which provides administrators with a full overview of
all the profile information relating to a particular registered user. It includes:
(i) A Details screen which gives an overview of the Learner including their c
user data, information for
password, etc.
(ii) A current Training screen which shows details of all current enrolments for the
user with the option to view the details of an enrolment, change the expiry da
manually mark them complete and unenrol them from the course
(iii) A completed training screen which provides an overview of all course completions
including date completed and scores achieved
(iv) A groups screen where you can see what groups the Le
currently a member of
97
.3 LearnUpon enrolment page. New users could be enrolled and assigned to their study group from this page and their status monitored
LearnUpon offers a user profile screen which provides administrators with a full overview of
all the profile information relating to a particular registered user. It includes:
A Details screen which gives an overview of the Learner including their c
information for enabling/disabling their account, resetting their
A current Training screen which shows details of all current enrolments for the
user with the option to view the details of an enrolment, change the expiry da
manually mark them complete and unenrol them from the course
A completed training screen which provides an overview of all course completions
including date completed and scores achieved
A groups screen where you can see what groups the Learner in question is
currently a member of
.3 LearnUpon enrolment page. New users could be enrolled and assigned to their study
LearnUpon offers a user profile screen which provides administrators with a full overview of
all the profile information relating to a particular registered user. It includes:
A Details screen which gives an overview of the Learner including their custom
enabling/disabling their account, resetting their
A current Training screen which shows details of all current enrolments for the
user with the option to view the details of an enrolment, change the expiry date,
manually mark them complete and unenrol them from the course (Figure 3.4)
A completed training screen which provides an overview of all course completions
arner in question is
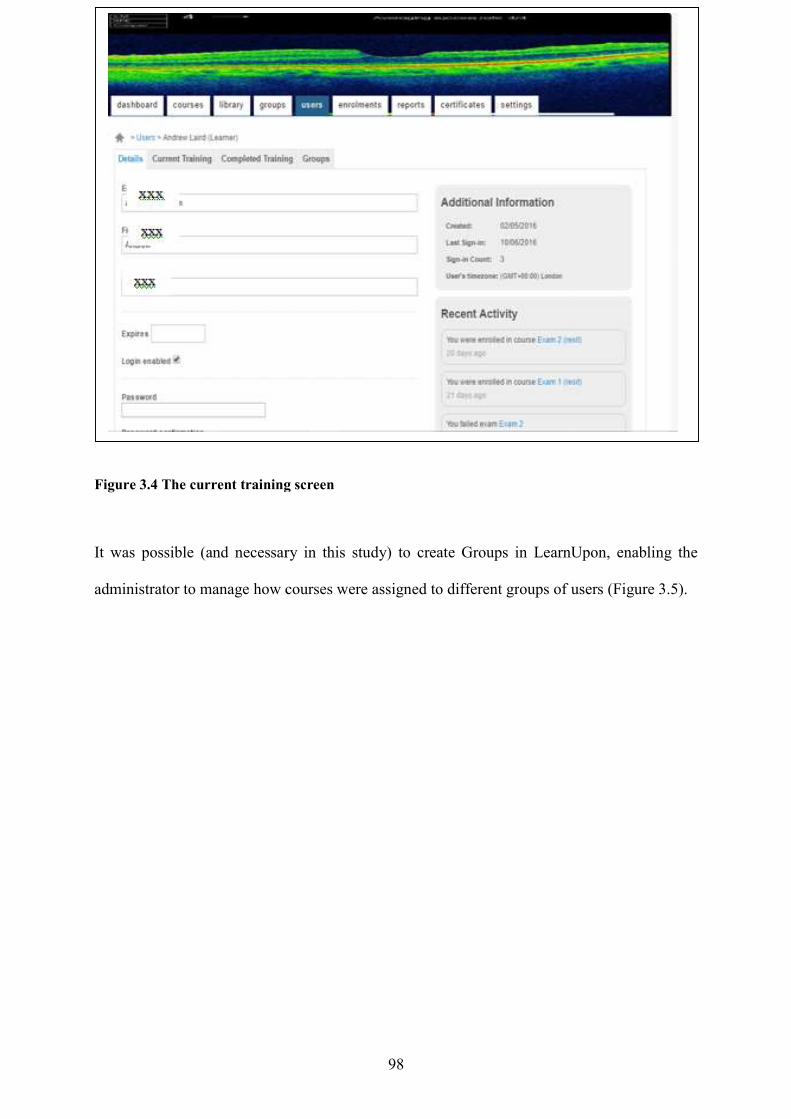
Figure 3.4 The current training screen
It was possible (and necessary in this study) to create Groups in LearnUpon, enabling the
administrator to manage how courses were assigned to different gr
98
.4 The current training screen
It was possible (and necessary in this study) to create Groups in LearnUpon, enabling the
administrator to manage how courses were assigned to different groups of users
It was possible (and necessary in this study) to create Groups in LearnUpon, enabling the
oups of users (Figure 3.5).
Figure 3.5 The Groups page showing users allocated to various subgroups
Courses in LearnUpon can be made up of many different types of content such as videos,
PDF documents, PowerPoint documents, SCORM
stands for Sharable Content Object Reference Model
developed for eLearning software products.
imported into the course. It was also pos
periods/due dates, exam options (for example, sequencing of questions/course modules,
timing of exams and randomisation of questions).
An important function of LearnUpon was the option to send reminders o
date to all participants who had not yet completed the course (i.e. everyone who was either
“not started” or “in progress”). Completion reminders could also be sent up to 4 times (2 were
chosen) to all participants who had not yet complet
they were enrolled.
99
.5 The Groups page showing users allocated to various subgroups
Courses in LearnUpon can be made up of many different types of content such as videos,
PDF documents, PowerPoint documents, SCORM courses, text and images, etc
Sharable Content Object Reference Model and it is a set of technical standards
developed for eLearning software products. Word, Powerpoint and PDF documents could be
imported into the course. It was also possible to set various course options such as valid
periods/due dates, exam options (for example, sequencing of questions/course modules,
timing of exams and randomisation of questions).
An important function of LearnUpon was the option to send reminders o
date to all participants who had not yet completed the course (i.e. everyone who was either
“not started” or “in progress”). Completion reminders could also be sent up to 4 times (2 were
chosen) to all participants who had not yet completed the course a set number of days after
Courses in LearnUpon can be made up of many different types of content such as videos,
courses, text and images, etc (SCORM
and it is a set of technical standards
Word, Powerpoint and PDF documents could be
sible to set various course options such as valid
periods/due dates, exam options (for example, sequencing of questions/course modules,
An important function of LearnUpon was the option to send reminders of an upcoming due
date to all participants who had not yet completed the course (i.e. everyone who was either
“not started” or “in progress”). Completion reminders could also be sent up to 4 times (2 were
ed the course a set number of days after
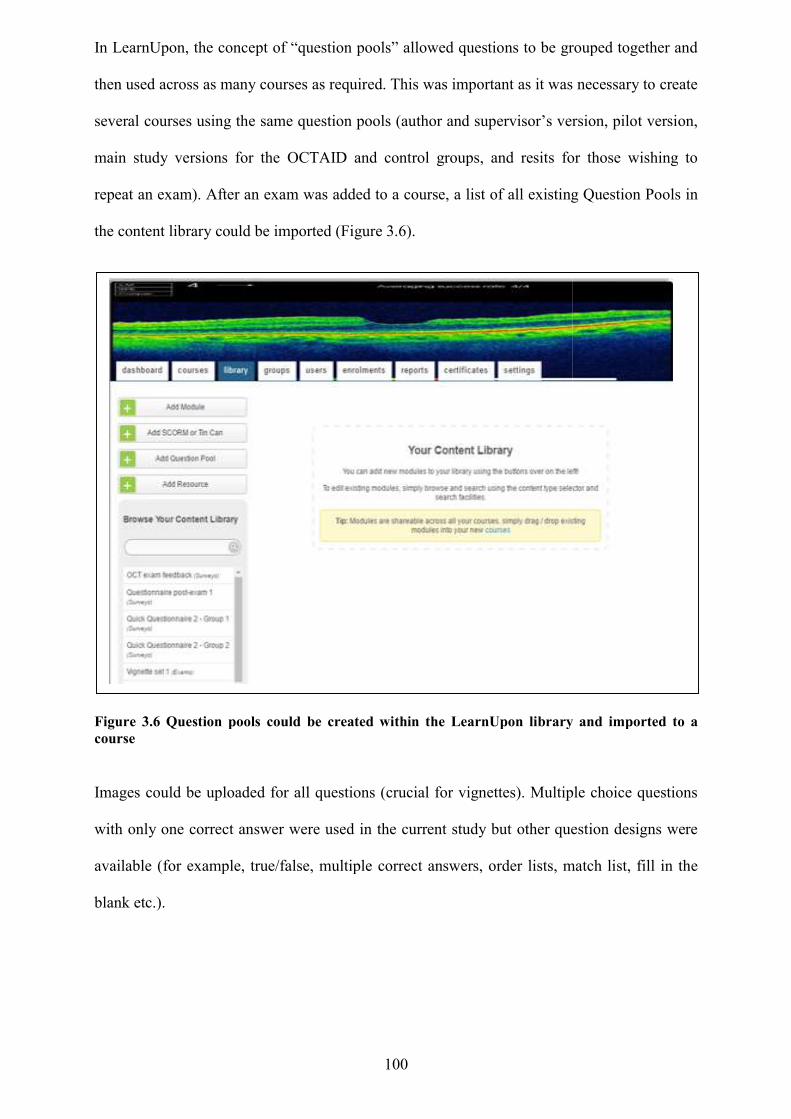
In LearnUpon, the concept of “question pools” allowed questions to be grouped together and
then used across as many courses as required. This was important as it was necessary to create
several courses using the same question pools (author and supervisor’s version, pilot version,
main study versions for the OCTAID and control groups, and resits for those wishing to
repeat an exam). After an exam was added to a course, a list of all existing Quest
the content library could be imported
Figure 3.6 Question pools could be created within the LearnUpon library and imported to a course
Images could be uploaded for all questions (crucial for vignettes
with only one correct answer were used in the current study but other question designs were
available (for example, true/false, multiple correct answers, order lists, match list, fill in the
blank etc.).
100
In LearnUpon, the concept of “question pools” allowed questions to be grouped together and
then used across as many courses as required. This was important as it was necessary to create
courses using the same question pools (author and supervisor’s version, pilot version,
main study versions for the OCTAID and control groups, and resits for those wishing to
repeat an exam). After an exam was added to a course, a list of all existing Quest
the content library could be imported (Figure 3.6).
.6 Question pools could be created within the LearnUpon library and imported to a
Images could be uploaded for all questions (crucial for vignettes). Multiple choice questions
with only one correct answer were used in the current study but other question designs were
available (for example, true/false, multiple correct answers, order lists, match list, fill in the
In LearnUpon, the concept of “question pools” allowed questions to be grouped together and
then used across as many courses as required. This was important as it was necessary to create
courses using the same question pools (author and supervisor’s version, pilot version,
main study versions for the OCTAID and control groups, and resits for those wishing to
repeat an exam). After an exam was added to a course, a list of all existing Question Pools in
.6 Question pools could be created within the LearnUpon library and imported to a
). Multiple choice questions
with only one correct answer were used in the current study but other question designs were
available (for example, true/false, multiple correct answers, order lists, match list, fill in the
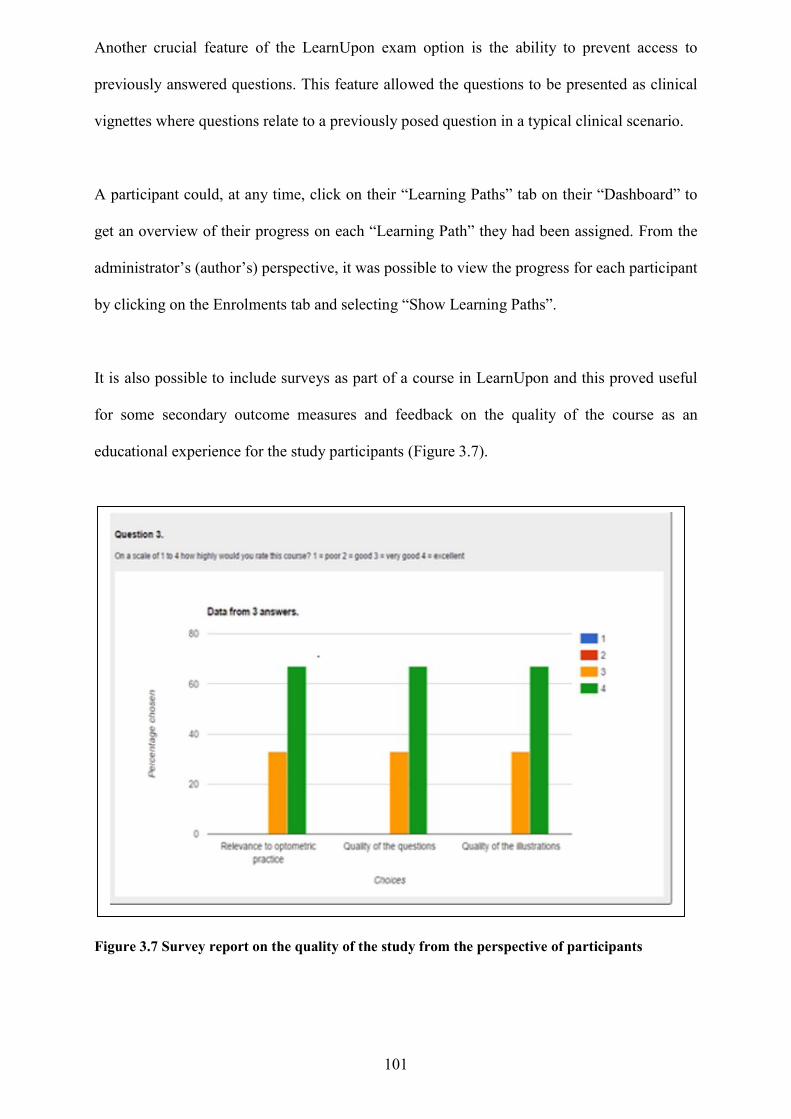
101
Another crucial feature of the LearnUpon exam option is the ability to prevent access to
previously answered questions. This feature allowed the questions to be presented as clinical
vignettes where questions relate to a previously posed question in a typical clinical scenario.
A participant could, at any time, click on their “Learning Paths” tab on their “Dashboard” to
get an overview of their progress on each “Learning Path” they had been assigned. From the
administrator’s (author’s) perspective, it was possible to view the progress for each participant
by clicking on the Enrolments tab and selecting “Show Learning Paths”.
It is also possible to include surveys as part of a course in LearnUpon and this proved useful
for some secondary outcome measures and feedback on the quality of the course as an
educational experience for the study participants (Figure 3.7).
Figure 3.7 Survey report on the quality of the study from the perspective of participants
102
There are ten main types of reporting available in LearnUpon. The current study utilised two
of these (exam report and survey report) for statistical purposes. These reports could be
generated in the form of charts, Microsoft Excel spreadsheets and in full transcript format
showing all answers to all questions for all participants. Reports could also be generated for
each sub-group of participants separately.
Masking of participants A pragmatic approach was taken to masking as it was not possible to mask participants for the
entire study duration. Participants were not told which study group they would be assigned to
and would not have been aware of this until after completion of the first exam task when they
were provided with a live link to the OCT training tool (OCTAID or control). There was not a
way of avoiding participants recognising the nature of the interventions they received. All
participants were informed that they would have free access to the OCTAID site after
completion of both exam modules. It was thought that this would help to avoid participant
attrition from the control group.
The control intervention The author and supervisors devoted much debate to the concept and selection of a control
intervention. The study was measuring the efficacy of the OCTAID resource (in terms of
vignette score improvement) by comparing it with conventional OCT resources available and
accessible to community optometrists. It was difficult to identify a control intervention which
could match OCTAID in terms of its scope and detail and the research team did consider the
option of not giving the control group any additional resource (as they were permitted to use
any OCT resource that they would usually refer to). However, a decision was made to provide
the control group with an additional resource for the following reasons:
It could not be assumed that all participants would have access to OCT resources
when they decided to commence the exam modules
103
Some participants in the control group would be likely to require an introductory
level of OCT training. For example, some participants may have lacked sufficient
knowledge of OCT technology and terminology to enable them to research
effectively for OCT resources which might be helpful to them in the exam modules.
It was thought important that all participants in the control group should be provided
with a resource common to all of them.
The control intervention that was finally chosen had open access status (although permission
for its use within the study was sought anyway and granted) and benefitted from the fact that
it provided a comprehensive knowledge of OCT that would be useful to both novice and
experienced OCT users. A live link to the control intervention is provided here:
http://commons.pacificu.edu/cgi/viewcontent.cgi?article=1011&context=coofac
The “open book exam”
A challenging dilemma was whether to allow the participants to take the vignettes whilst they
used their educational interventions or without access to these. The research team engaged in
lengthy discussions about this topic and key relevant literature will now be briefly
summarised.
Educators have long debated the usefulness of examinations and have striven to establish how
a learner’s experience of examinations might be more authentic and, in the process, more
constructively tailored to the desired learning outcomes (Williams and Wong, 2009).
Participants to the current study used OCT resources supplied (and permitted) during the
exam task. “Open book exams” are tests that allow text or materials being studied to be used
during the exam. An open book exam still requires an understanding of the material to be able
to interpret a question and provide a rational answer. In an open book exam the emphasis is
on applying information rather than memorising it or interpreting information in the context
of certain questions and scenarios rather than summarising it. A study by Theophilides and
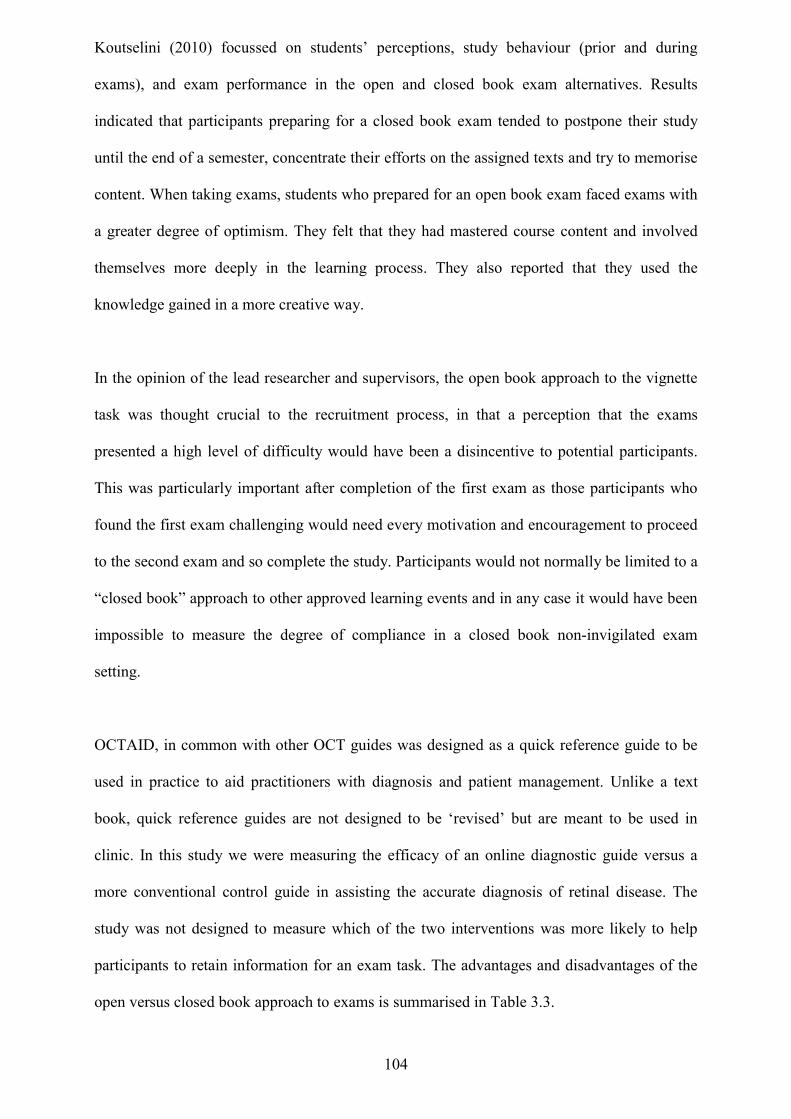
104
Koutselini (2010) focussed on students’ perceptions, study behaviour (prior and during
exams), and exam performance in the open and closed book exam alternatives. Results
indicated that participants preparing for a closed book exam tended to postpone their study
until the end of a semester, concentrate their efforts on the assigned texts and try to memorise
content. When taking exams, students who prepared for an open book exam faced exams with
a greater degree of optimism. They felt that they had mastered course content and involved
themselves more deeply in the learning process. They also reported that they used the
knowledge gained in a more creative way.
In the opinion of the lead researcher and supervisors, the open book approach to the vignette
task was thought crucial to the recruitment process, in that a perception that the exams
presented a high level of difficulty would have been a disincentive to potential participants.
This was particularly important after completion of the first exam as those participants who
found the first exam challenging would need every motivation and encouragement to proceed
to the second exam and so complete the study. Participants would not normally be limited to a
“closed book” approach to other approved learning events and in any case it would have been
impossible to measure the degree of compliance in a closed book non-invigilated exam
setting.
OCTAID, in common with other OCT guides was designed as a quick reference guide to be
used in practice to aid practitioners with diagnosis and patient management. Unlike a text
book, quick reference guides are not designed to be ‘revised’ but are meant to be used in
clinic. In this study we were measuring the efficacy of an online diagnostic guide versus a
more conventional control guide in assisting the accurate diagnosis of retinal disease. The
study was not designed to measure which of the two interventions was more likely to help
participants to retain information for an exam task. The advantages and disadvantages of the
open versus closed book approach to exams is summarised in Table 3.3.
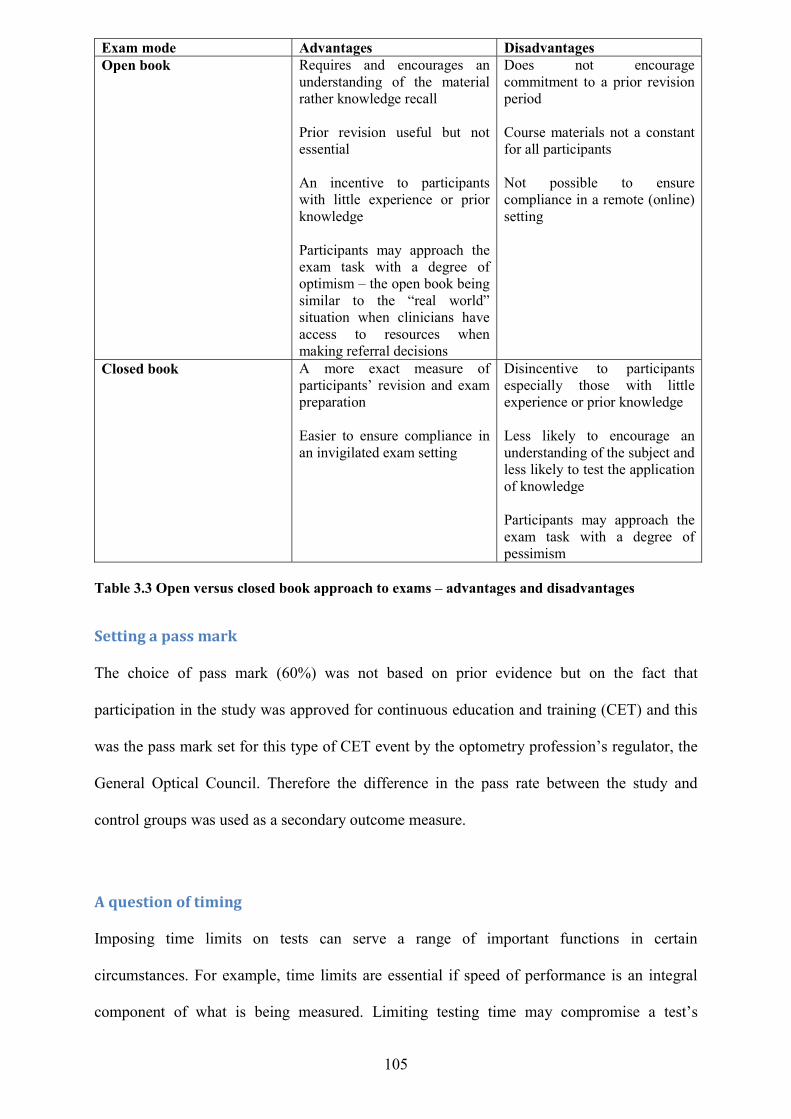
105
Exam mode Advantages Disadvantages Open book Requires and encourages an
understanding of the material rather knowledge recall Prior revision useful but not essential An incentive to participants with little experience or prior knowledge Participants may approach the exam task with a degree of optimism – the open book being similar to the “real world” situation when clinicians have access to resources when making referral decisions
Does not encourage commitment to a prior revision period Course materials not a constant for all participants Not possible to ensure compliance in a remote (online) setting
Closed book A more exact measure of participants’ revision and exam preparation Easier to ensure compliance in an invigilated exam setting
Disincentive to participants especially those with little experience or prior knowledge Less likely to encourage an understanding of the subject and less likely to test the application of knowledge Participants may approach the exam task with a degree of pessimism
Table 3.3 Open versus closed book approach to exams – advantages and disadvantages
Setting a pass mark
The choice of pass mark (60%) was not based on prior evidence but on the fact that
participation in the study was approved for continuous education and training (CET) and this
was the pass mark set for this type of CET event by the optometry profession’s regulator, the
General Optical Council. Therefore the difference in the pass rate between the study and
control groups was used as a secondary outcome measure.
A question of timing Imposing time limits on tests can serve a range of important functions in certain
circumstances. For example, time limits are essential if speed of performance is an integral
component of what is being measured. Limiting testing time may compromise a test’s
106
validity, or the ability of the test to accurately reflect what the test was designed to measure.
In this study the assessments were not intended to measure how quickly the participant could
answer questions. Validity of the vignettes within this study lay in the ability of the
assessments to provide a fair and accurate assessment of what had been learned. An educator,
Graham Whisen, suggests that educators should replace phrases like “you have five minutes
left” with phrases like “keep trying until you feel you have done all you can”
(http://ideaconnect.edublogs.org/2011/01/19/should-tests-have-time-limits/).
Exam sequencing The second exam was scheduled to be released 3 weeks after the release of the first exam.
This was to prevent participants from proceeding to the second exam before familiarising
themselves with the OCT educational interventions provided after completion of the first
exam. Not all participants started the study at the same and therefore the interval between the
availability of the first and second exam differed for each participant. Participants however
were advised within the course modules (and by email on completion of the first exam) not to
proceed to the second exam until after they had spent at least 2 weeks familiarising
themselves with their assigned OCT aid (OCTAID or control intervention).
Avoiding bias in the design of OCTAID, clinical vignettes and exam questions The lead researcher (and author) designed the OCTAID website, the clinical vignettes and
exam questions. Several measures were taken to avoid the possibility of the OCTAID site
having been specially tailored to the vignette task (or vice versa).These are summarised in
Table 3.4.
The two study supervisors were asked to scrutinise the OCTAID site as well as the control
educational intervention (as one of a range of resources available to participants) to ensure
that exam questions were not biased to favour either intervention. Similarly, the expert panel
107
were asked to verify that exam questions were pitched at a reasonable level of difficulty and
based on retinal conditions which community optometrists would commonly encounter in
daily practice.
Potential source of bias Action OCTAID site specifically tailored to vignettes
OCTAID site and vignettes subjected to review by study supervisors, expert panel, and pilots
Clinical vignettes specifically tailored to OCTAID site with limited hope of researching answers within currently available (and accessible) resources.
Vignettes subjected to review by study supervisors, expert panel, and piloted to ensure that questions were pitched at a reasonable level and based on retinal conditions commonly encountered by community optometrists Vignette questions reviewed and approved by the General Optical Council as suitable for optometric education
MCQ exam format Objective marking (only one correct answer in a well-designed question) – no marker bias Automated exam marking and reporting within the LearnUpon exam host
Table 3.4 Strategies to void bias in the OCTAID site, vignettes and exam questions
Pilot study Moore et al. (2011) define pilot studies as “preparatory studies designed to test the
performance characteristics and capabilities of study designs, measures, procedures,
recruitment criteria and operational strategies that are under consideration for use in a
subsequent, often larger, study”. They are sometimes referred to as mini versions of a full-
scale study or feasibility studies. Moore et al. (2011) suggest that pilot studies generally
contribute to the design and development of future primary (and possibly more costly) studies
by providing clarity to the research hypotheses being studied. More specifically, pilot studies
identify potential barriers to subsequent study completion, evaluate the appropriateness of
methods and procedures to participants and measure the time commitment required for study
participation. Pilot studies can also provide reliable estimates of the expected rates of missing
data and participant attrition (Moore et al. 2011). Leon et al. (2011) state that pilot studies are
a requisite initial step in exploring a novel intervention, although pilot studies are not
hypothesis testing studies because safety, efficacy and effectiveness are not evaluated in a
108
pilot. Leon et al. (2011) suggest that a pilot study does not provide a meaningful effect size
estimate for planning subsequent studies due to the imprecision inherent in data from small
samples. So, although pilot studies are a requisite initial step in exploring a novel intervention
and a crucial element in a good study design, feasibility results do not necessarily generalise
beyond the inclusion and exclusion criteria of the pilot design.
A pilot study was conducted to provide optimal information needed for the main study. It was
considered important that the design of this pilot study should be guided by the aims of the
main study and should therefore be similar to that of the larger subsequent study. So, the aims
and methods of the pilot study were aligned with the goals of the main study. For example,
the pilot study recruited participants from the same study population (UK optometrists with
varying OCT experience). It was hoped that a pilot study would identify and address issues
that might occur with respect to study design, sample selection, data collection/management
and data analysis.
Pilot study methods Informal enquiries among contacts of the author and supervisory team were made seeking
suitable volunteers. The pilot study preceded the main study and involved 6 optometrists of
varying degrees of OCT experience to reflect the range of experience of optometrists recruited
to the study. The pilot participants were selected on the basis of their previous OCT
experience as defined by the same questionnaire given to participants in the main study
(appendix 6). So rather than make a self-declaration about their OCT experience, participants
estimated how often they assessed OCT scans. It was thought that participants might struggle
to accurately rank themselves as ‘novice’, ‘intermediate’ or ‘expert’. For example, an expert
OCT users might be tempted to ‘downscale’ their level of experience when they are entering
an exam situation because they may feel that assessors’ expectations of their exam
performance might be high. For this reason, participants were asked how many OCT scans
they assessed in a typical month.
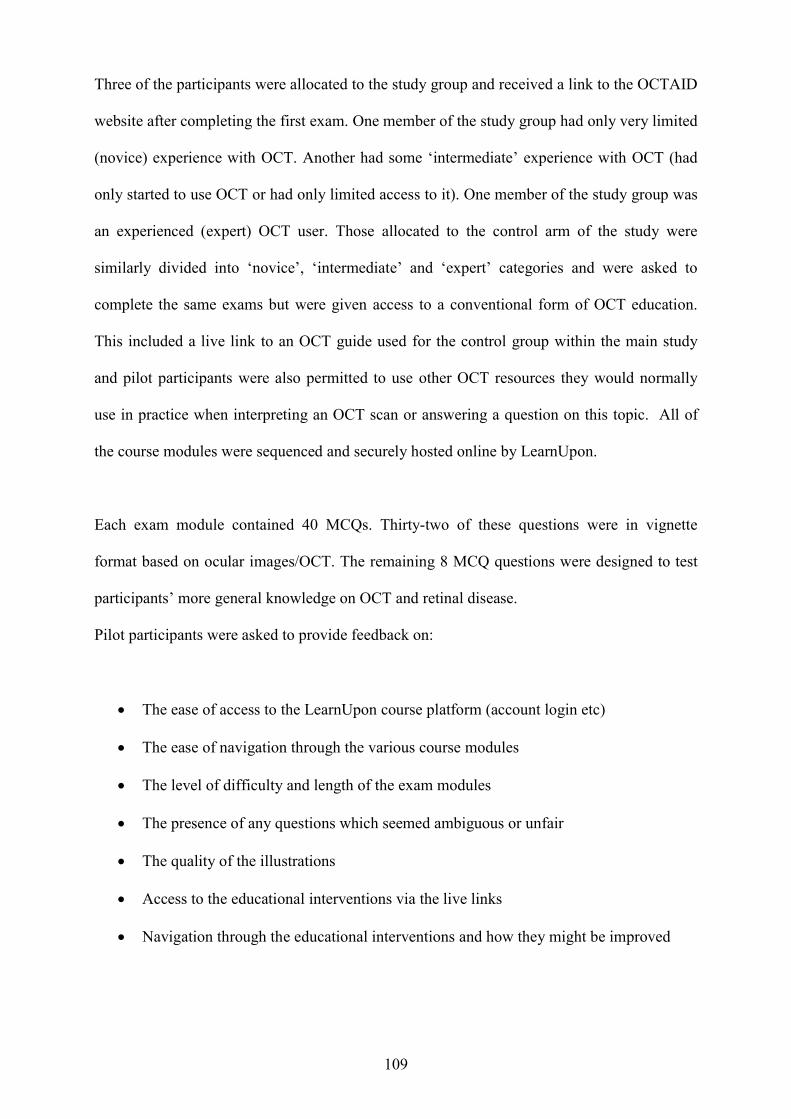
109
Three of the participants were allocated to the study group and received a link to the OCTAID
website after completing the first exam. One member of the study group had only very limited
(novice) experience with OCT. Another had some ‘intermediate’ experience with OCT (had
only started to use OCT or had only limited access to it). One member of the study group was
an experienced (expert) OCT user. Those allocated to the control arm of the study were
similarly divided into ‘novice’, ‘intermediate’ and ‘expert’ categories and were asked to
complete the same exams but were given access to a conventional form of OCT education.
This included a live link to an OCT guide used for the control group within the main study
and pilot participants were also permitted to use other OCT resources they would normally
use in practice when interpreting an OCT scan or answering a question on this topic. All of
the course modules were sequenced and securely hosted online by LearnUpon.
Each exam module contained 40 MCQs. Thirty-two of these questions were in vignette
format based on ocular images/OCT. The remaining 8 MCQ questions were designed to test
participants’ more general knowledge on OCT and retinal disease.
Pilot participants were asked to provide feedback on:
The ease of access to the LearnUpon course platform (account login etc)
The ease of navigation through the various course modules
The level of difficulty and length of the exam modules
The presence of any questions which seemed ambiguous or unfair
The quality of the illustrations
Access to the educational interventions via the live links
Navigation through the educational interventions and how they might be improved
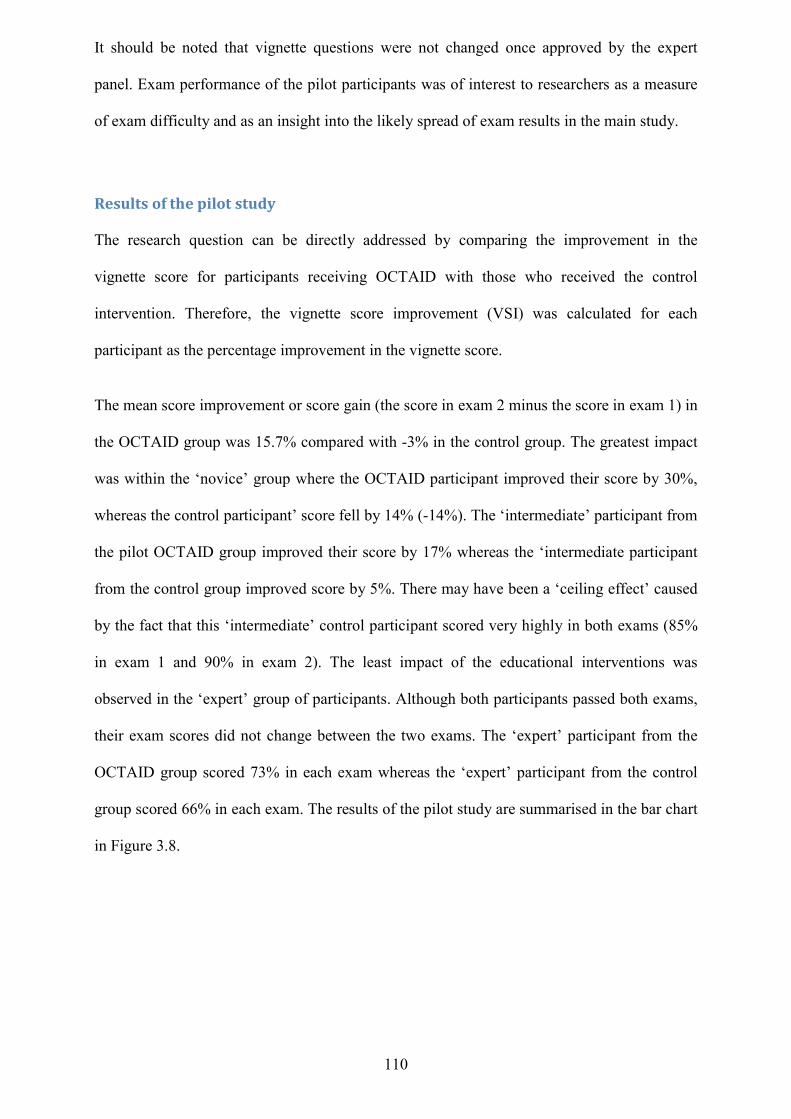
110
It should be noted that vignette questions were not changed once approved by the expert
panel. Exam performance of the pilot participants was of interest to researchers as a measure
of exam difficulty and as an insight into the likely spread of exam results in the main study.
Results of the pilot study The research question can be directly addressed by comparing the improvement in the
vignette score for participants receiving OCTAID with those who received the control
intervention. Therefore, the vignette score improvement (VSI) was calculated for each
participant as the percentage improvement in the vignette score.
The mean score improvement or score gain (the score in exam 2 minus the score in exam 1) in
the OCTAID group was 15.7% compared with -3% in the control group. The greatest impact
was within the ‘novice’ group where the OCTAID participant improved their score by 30%,
whereas the control participant’ score fell by 14% (-14%). The ‘intermediate’ participant from
the pilot OCTAID group improved their score by 17% whereas the ‘intermediate participant
from the control group improved score by 5%. There may have been a ‘ceiling effect’ caused
by the fact that this ‘intermediate’ control participant scored very highly in both exams (85%
in exam 1 and 90% in exam 2). The least impact of the educational interventions was
observed in the ‘expert’ group of participants. Although both participants passed both exams,
their exam scores did not change between the two exams. The ‘expert’ participant from the
OCTAID group scored 73% in each exam whereas the ‘expert’ participant from the control
group scored 66% in each exam. The results of the pilot study are summarised in the bar chart
in Figure 3.8.
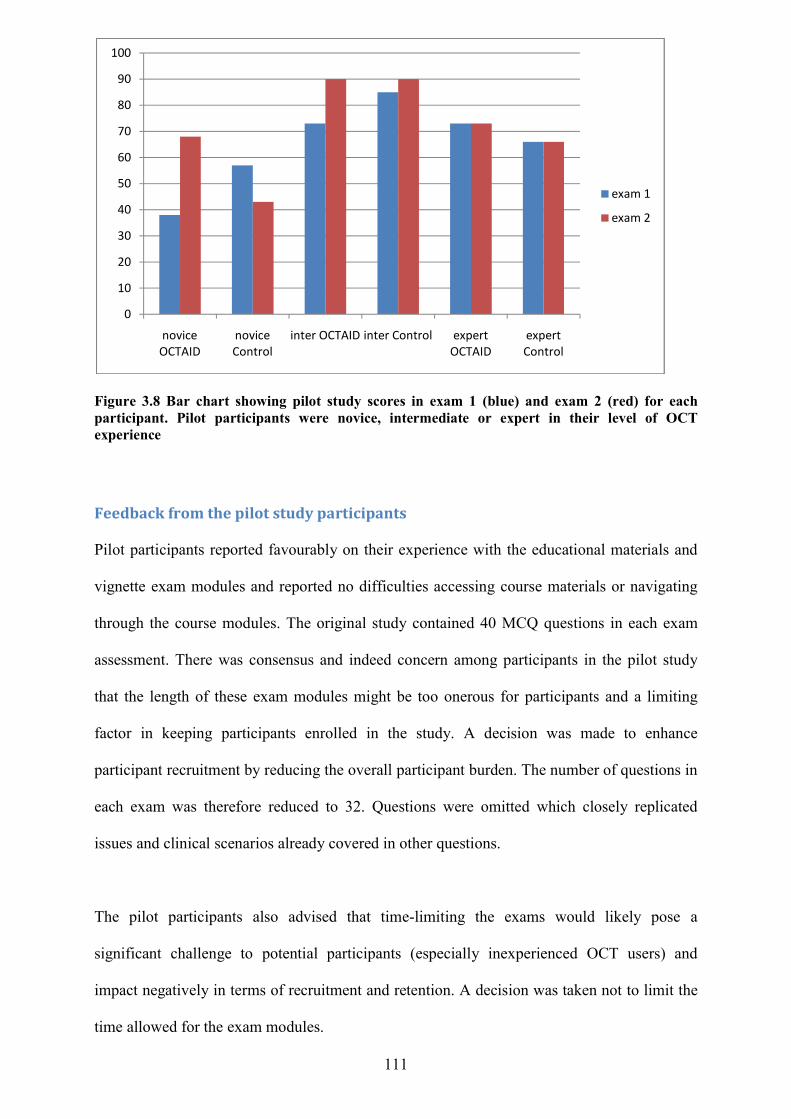
111
Figure 3.8 Bar chart showing pilot study scores in exam 1 (blue) and exam 2 (red) for each participant. Pilot participants were novice, intermediate or expert in their level of OCT experience
Feedback from the pilot study participants Pilot participants reported favourably on their experience with the educational materials and
vignette exam modules and reported no difficulties accessing course materials or navigating
through the course modules. The original study contained 40 MCQ questions in each exam
assessment. There was consensus and indeed concern among participants in the pilot study
that the length of these exam modules might be too onerous for participants and a limiting
factor in keeping participants enrolled in the study. A decision was made to enhance
participant recruitment by reducing the overall participant burden. The number of questions in
each exam was therefore reduced to 32. Questions were omitted which closely replicated
issues and clinical scenarios already covered in other questions.
The pilot participants also advised that time-limiting the exams would likely pose a
significant challenge to potential participants (especially inexperienced OCT users) and
impact negatively in terms of recruitment and retention. A decision was taken not to limit the
time allowed for the exam modules.
0
10
20
30
40
50
60
70
80
90
100
novice OCTAID
novice Control
inter OCTAID inter Control expert OCTAID
expert Control
exam 1
exam 2
112
Monitoring the use of the OCTAID site using Google Analytics (main study) Google analytics (GA) is a tool used mostly by advertisers to monitor and optimise ‘traffic’ to
their websites. The world of online marketing is very dynamic so it is crucial that a reporting
system provides actionable information on what is working and/or not working on a website.
For example, high numbers of new visitors may suggest that a marketing campaign has
successfully attracted new ‘traffic’ to the site whereas many repeat visitors may signal
engagement of users who have been attracted back to the site.
The use of the OCTAID site was monitored over the duration of the study and beyond to
ensure that participants had successfully accessed and used the website and that the number of
visitors to the site was at least equivalent to the number of participants in the OCTAID study
group. This number could only be approximate for the reasons outlined later in the results
section and participants to the study were not prohibited from sharing links to the OCTAID
site after they had completed their final exam module.

113
Chapter 4: Development of OCTAID This chapter provides an insight into:
The development of a new information resource, diagnostic algorithm and training
platform for OCT interpretation (OCTAID) and the rationale behind its design and
mode of delivery
The use of an expert panel in the design of OCTAID
The dominance of the internet in everyday life has revolutionised the exchange of information
and optometric educators have not ignored this trend. Slawson and Shaughnessy (2005)
suggested that to encourage high quality patient care in contemporary medicine using the best
evidence, it is not enough for medical schools to teach techniques for critically evaluating the
medical literature. They suggested that incorporating the best evidence into the reality of busy
clinical practice requires the applied science of information management. Hurwitz and
Slawson (2010) went on to suggest that internet sources need to be created that have the
readily available evidence-based answers to patient issues. In this way clinicians would not
need to spend a large proportion of their time researching questions on their own. Ideally,
information management would be built on a platform of EBM but would save the clinician
time and improve accuracy by having experts validate the evidence and make it easily
available.
For the present research, a new information resource, diagnostic algorithm and training
platform for OCT interpretation was developed (OCTAID). The live link to the OCTAID site
is www.octaid.co.uk and the details required are:
User name: user
Password: 0ptical1 (Note that the first character of the password is a zero)
When designing OCTAID the author took account of the two complementary processes
thought to be involved in medical diagnosis, similarity-based and analytic, even though some
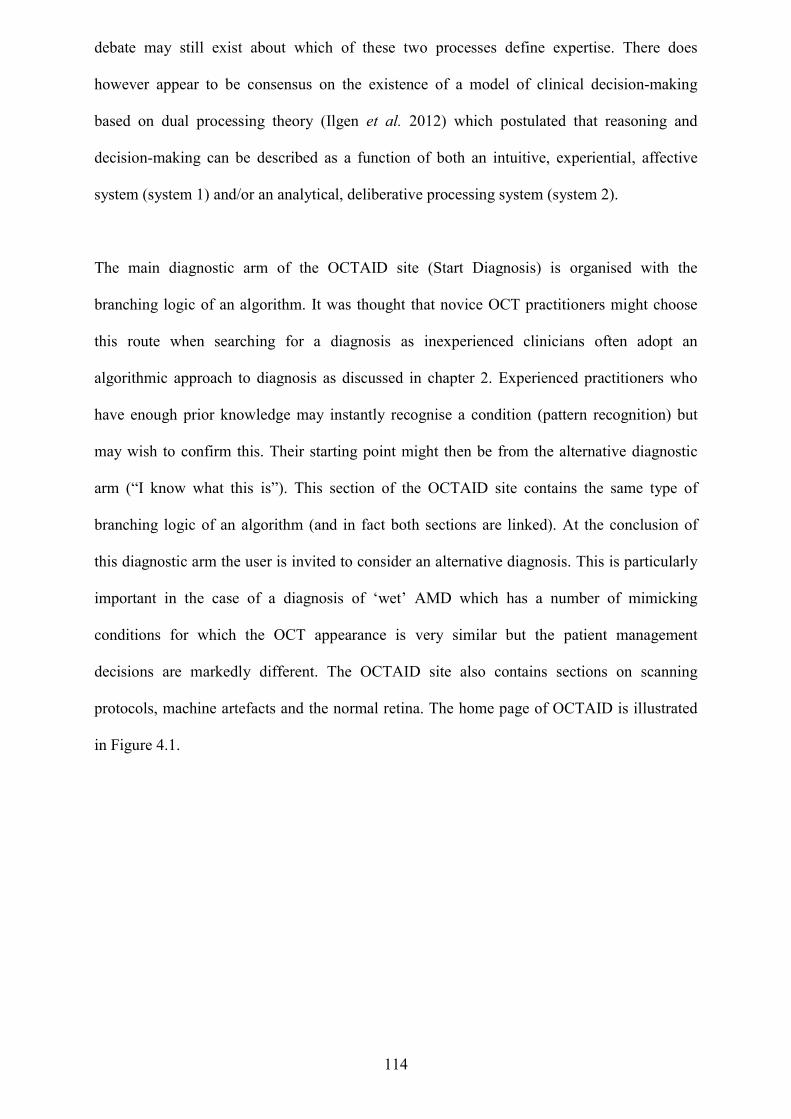
114
debate may still exist about which of these two processes define expertise. There does
however appear to be consensus on the existence of a model of clinical decision-making
based on dual processing theory (Ilgen et al. 2012) which postulated that reasoning and
decision-making can be described as a function of both an intuitive, experiential, affective
system (system 1) and/or an analytical, deliberative processing system (system 2).
The main diagnostic arm of the OCTAID site (Start Diagnosis) is organised with the
branching logic of an algorithm. It was thought that novice OCT practitioners might choose
this route when searching for a diagnosis as inexperienced clinicians often adopt an
algorithmic approach to diagnosis as discussed in chapter 2. Experienced practitioners who
have enough prior knowledge may instantly recognise a condition (pattern recognition) but
may wish to confirm this. Their starting point might then be from the alternative diagnostic
arm (“I know what this is”). This section of the OCTAID site contains the same type of
branching logic of an algorithm (and in fact both sections are linked). At the conclusion of
this diagnostic arm the user is invited to consider an alternative diagnosis. This is particularly
important in the case of a diagnosis of ‘wet’ AMD which has a number of mimicking
conditions for which the OCT appearance is very similar but the patient management
decisions are markedly different. The OCTAID site also contains sections on scanning
protocols, machine artefacts and the normal retina. The home page of OCTAID is illustrated
in Figure 4.1.
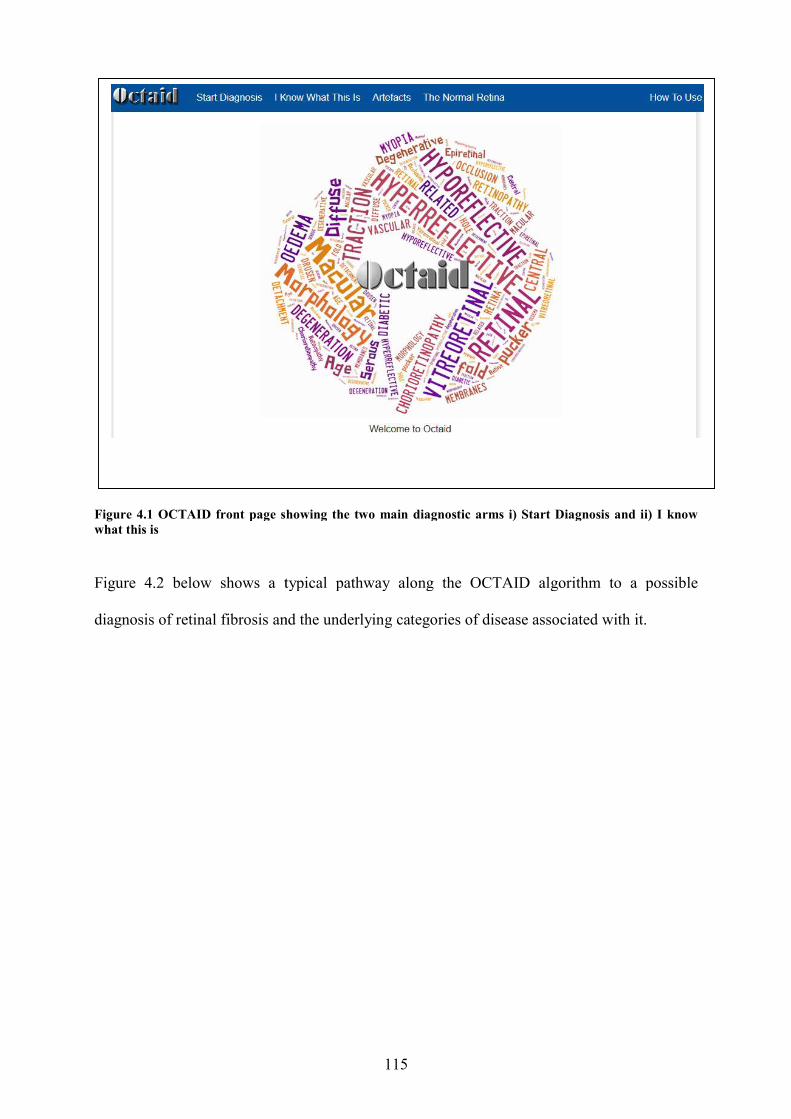
Figure 4.1 OCTAID front page showing the two main diagnostic arms i) Start Diagnosis and ii) I know what this is
Figure 4.2 below shows a typical pathway along the OCTAID algorithm to a possibl
diagnosis of retinal fibrosis and the underlying categories of disease associated with it
115
.1 OCTAID front page showing the two main diagnostic arms i) Start Diagnosis and ii) I know
.2 below shows a typical pathway along the OCTAID algorithm to a possibl
diagnosis of retinal fibrosis and the underlying categories of disease associated with it
.1 OCTAID front page showing the two main diagnostic arms i) Start Diagnosis and ii) I know
.2 below shows a typical pathway along the OCTAID algorithm to a possible
diagnosis of retinal fibrosis and the underlying categories of disease associated with it.
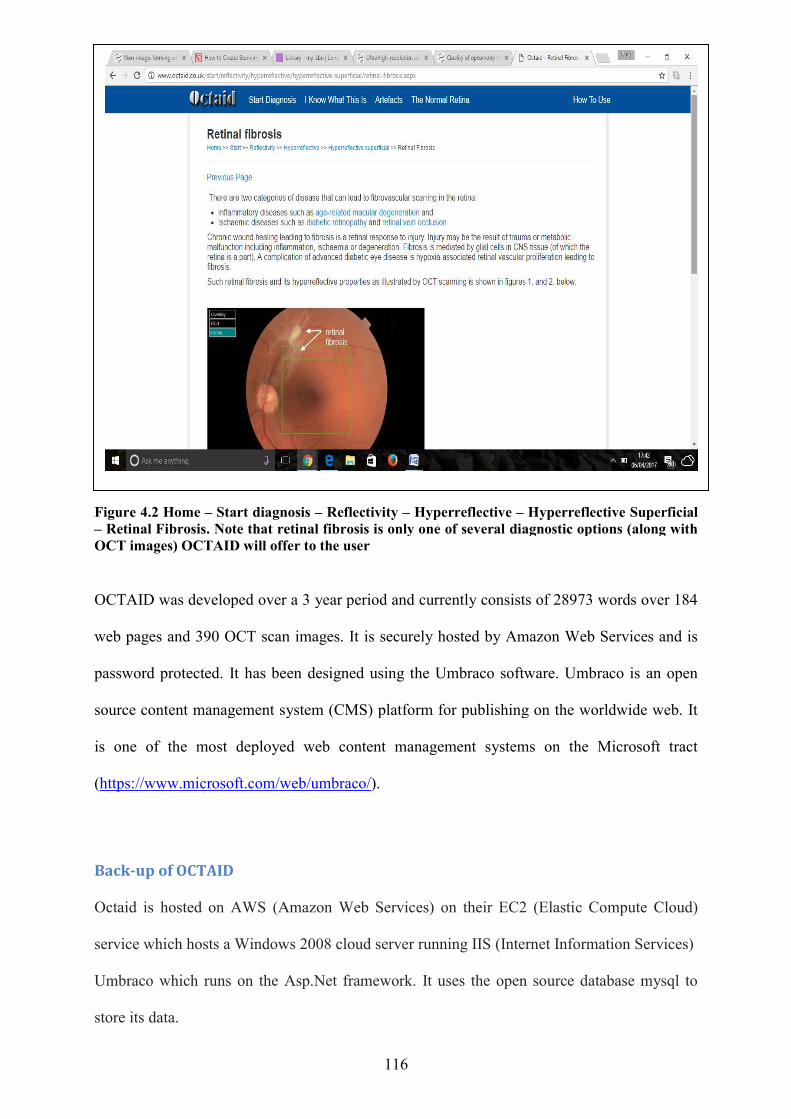
7
Figure 4.2 Home – Start diagnosis – Retinal Fibrosis. Note that retinal OCT images) OCTAID will offer
OCTAID was developed over a 3 year period
web pages and 390 OCT scan images. It is securely hosted by A
password protected. It has been designed using the Umbraco software. Umbraco is an open
source content management system (CMS) platform for publishing on the worldwide web. It
is one of the most deployed web content management sys
(https://www.microsoft.com/web/umbraco/
Back-up of OCTAID
Octaid is hosted on AWS (Amazon Web Services) on their EC2 (Elastic Compute Cloud)
service which hosts a Windows 2
Umbraco which runs on the Asp.Net framework. It uses the open source database mysql to
store its data.
116
Start diagnosis – Reflectivity – Hyperreflective – Hyperreflective Superficial Retinal Fibrosis. Note that retinal fibrosis is only one of several diagnostic options (along with
offer to the user
was developed over a 3 year period and currently consists of 28973 words over 184
web pages and 390 OCT scan images. It is securely hosted by Amazon Web Services and is
password protected. It has been designed using the Umbraco software. Umbraco is an open
source content management system (CMS) platform for publishing on the worldwide web. It
is one of the most deployed web content management systems on the Microsoft tract
https://www.microsoft.com/web/umbraco/).
Octaid is hosted on AWS (Amazon Web Services) on their EC2 (Elastic Compute Cloud)
service which hosts a Windows 2008 cloud server running IIS (Internet Information Services)
Umbraco which runs on the Asp.Net framework. It uses the open source database mysql to
Hyperreflective Superficial fibrosis is only one of several diagnostic options (along with
consists of 28973 words over 184
mazon Web Services and is
password protected. It has been designed using the Umbraco software. Umbraco is an open
source content management system (CMS) platform for publishing on the worldwide web. It
tems on the Microsoft tract
Octaid is hosted on AWS (Amazon Web Services) on their EC2 (Elastic Compute Cloud)
008 cloud server running IIS (Internet Information Services)
Umbraco which runs on the Asp.Net framework. It uses the open source database mysql to

117
To backup Octaid a scheduled task runs which does a mysql db export for that database along
with a compressed password protected backup the entire web application folder for umbraco
(containing application files and images). This is then sent to Dropbox.
An additional Amazon AMI (Amazon Machine Image) is also performed so that the entire
Windows operating system and all data can be retrieved from Amazon S3 (Simple secure
storage).
Expert panel A single, error-free test that can be used as a reference (gold) standard may not exist in many
diagnostic studies and the use of an imperfect reference standard may lead to errors in the
final disease classification. There is also a risk in adopting new testing methods which may be
inferior to existing methods. A widely used solution to the lack of a reference standard is
“panel diagnosis” in which two or more experts will assess the results from multiple tests in a
diagnostic study and reach a final diagnosis for each patient (Bertens et al. 2013).
Expert panels are an established consensus-finding method in clinical and health services
research (Khodyakov et al. 2011) and often use a modified Delphi structure. Khodyakov et al.
(2011) comment that although expert panels are a valuable tool for defining agreement on
challenging subjects, they have some disadvantages. Firstly, it is necessary to identify a
representative group of experts to form the panel and secondly, information-gathering must be
co-ordinated around experts’ schedules. Panel sizes are normally limited to ensure effective
input from each member but at the same time panels should be large enough to reflect the
diversity of opinion. Small panels of experts trained to a similar standard (who possess a
general understanding in the field of interest) have been shown to provide effective and
reliable responses that inform judgment and support effective decision making (Akins et al.
2005). Although panel diagnosis (also referred to in literature as consensus or expert
118
diagnosis) is often used as the reference standard, there is a lack of guidance on preferred
methodology (Bertens et al. 2013). Available literature currently offers limited guidance on
assembling and working with an expert panel for assigning a reference diagnosis for use in
research (Handels et al.2014).
Handels et al. (2014) make a case for the use of a heterogeneous panel made up of experts
with different backgrounds (although within the area of interest) and stated that heterogeneity
of backgrounds could help prevent domination by a particular expertise. In the current study,
expert panel members did not engage in dialogue with each other but rather with the author
thus avoiding the possibility of individual experts dominating the debate.
The level of clinical experience of individual members of an expert panel may influence the
degree to which each member might share in the exchange of feedback but the larger number
of years of clinical experience attributable to each member of the panel recruited for this study
might have been useful in preventing some panel members dominating the debate. Some
difference might exist between the diagnostic accuracy of a panel made up of individuals with
only a few years of experience and that of a very experienced panel but previous studies have
not recommended a specific level of experience.
In this study an expert panel was recruited to play an advisory role in the design of the
diagnostic algorithm and to act as a ‘reference standard’ in assessing practitioners’ diagnostic
and patient management skills by forming a consensus opinion on diagnosis/management
based on OCT scans. The panel assisted in ensuring that the vignettes covered a suitable range
of conditions and patient scenarios. The panel also helped to ensure that the two sets of
vignettes had a similar level of difficulty and covered similar conditions. The panel consisted
of two optometrists, two consultant ophthalmologists with special interest in medical retina
conditions and a biomedical scientist. The biomedical scientist had a special interest in ocular
imaging and technical expertise in OCT. All members of the expert panel were familiar with
119
OCT imaging and interpretation but it was thought that the strengths, limitations and artefacts
of OCT scanning technology would be best known by an expert OCT technician. A shortlist
of possible experts was drawn up based on: (i) a literature search of peer-reviewed
publications of potential panelists, (ii) contribution to OCT forums, (iii) experience with OCT
technology (in the case of a technician), and (iv) experience in OCT interpretation in a
recognised specialist retinal clinic. Following consultation with the study supervisors an
ordered list of preferred experts was made and the experts were approached in turn until the
panel was filled.
The Delphi technique is a group process used to survey and collect the opinions of experts on
a selected topic (Yousuf, 2007). The Delphi technique is not a single, clearly understood
procedure but a family of techniques. It features a series of stages in which information is
collected from panelists, then analysed and fed back to them as the basis for subsequent
stages. An opportunity then exists for individuals to revise their judgments on the basis of this
feedback. In conventional Delphi techniques there is some degree of anonymity for an
individual’s contributions whereas in conventional decision making, input is thought to be
very subjective and might therefore risk marginalising an individual’s critical judgment.
Myint et al (2010) developed a competency framework using a modified Delphi methodology
for optometrists with a specialist interest in glaucoma and found that the application of such a
consensus methodology allowed the development of a competency framework for glaucoma
specialisation by optometrists thus helping to shape the development of a speciality
curriculum.
A Delphi technique was initially considered in this study to collate expert panel feedback.
There are a variety of methodological interpretations of the Delphi technique and many
studies claiming to have used the technique have been widely published in nursing and allied
health literature (Powell, 2003). However, the author and supervisors formed a consensus that
normal Delphi methodology would not provide a practical solution to this study’s aims and

120
within a reasonable timescale. Expert panel members were not blinded from the identity of
other panel members or from each other’s opinion in the exchange of feedback because it was
thought that potential recruits to the expert panel would have been less likely to assist in the
study if they did not know the status and credentials of fellow panel members. The sheer
volume of work involved in a review of the OCTAID website and the clinical vignettes (80
questions in the pilot study) meant that repeated iterations after each amendment would have
been asking too much of the panel. Furthermore, there may have been difficulties in ensuring
adequate anonymisation of responses and the process of feedback recovery would have
imposed considerable time delays in completing the study. The technique of blinding the
experts from each other’s opinion may have avoided the potential negative effects of
individuals being swayed or intimidated by others. Although there existed in this study the
potential for bias towards dominant experts, no evidence of this emerged during feedback
exchanges.
This study’s approach to obtaining expert feedback was designed to secure the opinion of
experts without the need to bring them together face to face thus achieving a workable
consensus within time limits. This approach still allowed panellists to reappraise their views
in the light of the responses of the group as a whole but panel members were only required to
correspond with the author.
As with the Delphi method, the limitations of this technique lie in the necessary process of
selecting a suitable panel and the fact that the use of their views may limit the scope covered
in the development of diagnostic/referral criteria (Harrington, 1994).
The author conducted two separate face to face meetings with the two consultant
ophthalmologist members of the expert panel at Moorfields Eye Hospital. This method was
suggested by the author as it was thought that the feedback task would be much less onerous

121
(in terms of time commitment) for these very busy clinicians and it was proving difficult to
obtain replies to emails. All other expert panel members provided feedback by email.
122
Chapter 5: Development of vignettes to assess efficacy of OCTAID This chapter describes:
The clinical vignette format of assessment and the reasons why this exam format was
chosen for this study
The design of the clinical vignettes
The multiple choice question format and its integration into the clinical vignettes
The role of an expert panel in the design of the vignettes and exam questions
The role of a pilot study in the design of the vignettes and exam questions
The author designed all of the questions within the two exam modules. Each exam module
contained 8 sets of questions (3 questions in each set) presented as clinical vignettes and
included OCT images. A further 8 questions tested participants’ more general OCT and
medical retina knowledge. All questions were in MCQ format and because questions within
each vignette set were related to each other, it was not possible for participants to return to a
question once answered.
In the current research it was decided that in order to take account of the range of knowledge
required, the assessments should take the form of clinical vignettes covering the issues of scan
interpretation and patient management but also including more general questions relating to
OCT and retinal disease.
Clinical vignettes are a learning tool for medical students and other clinicians. Medical
doctors are often assessed in 5 domains: history taking, physical examination, radiologic and
laboratory testing, diagnostic accuracy and clinical treatment or management. Clinical
vignettes commonly take the form of computerized case simulations and are frequently used
by educators (Shah et al. 2007). They are designed to simulate patient consultations and
123
measure a clinician’s ability to diagnose and manage medical conditions (Peabody et al.
2004). A clinical vignette is typically designed and scored by skilled experts, can simulate a
range of medical conditions and will adopt a stepwise approach for diagnosis and the
management plan (Shah et al. 2007). Vignettes are a valid and cost-effective way of
measuring diagnostic skills and are therefore well suited to large scale assessments (Peabody
et al. 2004). Peabody et al. (2000) identified some uncertainty over the question of whether
vignettes reflect clinical practice or a practitioner’s competence at the vignette task. Some
research suggests that carefully designed computerised clinical vignettes can obtain valuable
data in measuring a clinician’s ability to diagnose and treat specific medical conditions
although other researchers suggest that practitioners may respond differently in a vignette as
they are in an assessment situation (Shah et al. 2007).
Optometric educators aspire to learning outcomes that produce competent practitioners.
Online formative assessments are widely used and popular in higher education settings (Velan
et al. 2008). Multiple choice questions (MCQs) were chosen as a method of assessment
within this study for sound practical and educational reasons. MCQs can be designed that
promote and measure critical thinking but significant thought commitment is required to
design MCQs and examination formats that are reliable and consistent with learning
objectives (Morrison and Free, 2001). MCQs are a well-established method of assessing
factual knowledge and are considered to be both reliable and discriminating. Some assessors
have questioned the use of MCQs in higher education because of their strong association with
assessing lower order cognition such as the recall of discrete facts (Scouller, 1998). However,
it is possible to design MCQ tests to test higher order cognition (such as synthesis, creative
thinking and problem solving) but these questions need to be more carefully designed if they
are to be valid and reliable (Palmer and Devitt, 2007).
MCQs are perhaps only one component in the assessment of clinical competence and perhaps
should not constitute the only form of assessment (Moss, 2001). However, the majority of
124
MCQs within this study were integrated effectively into clinical vignettes. Other forms of
clinical assessment involving extended writing would have placed a significant time burden
on potential participants and could have been an inhibiting factor in recruitment.
Participants can typically answer an MCQ more quickly than an essay question. Extra validity
may therefore be added to the MCQ exam format by the fact that a broader range of topics
may be covered within a given time.
MCQs allow objective scoring (there can only be one correct answer in a well-designed
question so marker bias is eliminated). In addition, MCQs are efficient and capable of
discrimination and can be combined with other assessment strategies (Brady, 2005). The
power of MCQs lies in the question design and the context within which the questions are
used.
MCQs are less effective at testing a participant’s ability to articulate an explanation or their
ability to produce creative ideas. However, these weaknesses were thought to be less relevant
in the context of this study.
Expert panel The same expert panel who provided a consensus opinion on the OCTAID website also
reviewed both of the vignette exam modules used in the research. Their task was to ensure
that the questions within the clinical vignettes:
Covered a range of retinal conditions and patient scenarios which would commonly be
encountered in optometric practice
Were not tailored to either OCTAID or the control OCT guide (or vice versa) in the
case of the second exam assessment so that no unfair advantage was conferred upon
either group
125
Had a reasonable level of difficulty
Were accurately presented and avoided confusion or ambiguity
In addition, the panel ensured that the same range of retinal conditions and patient scenarios
were covered in both exams and with the same level of difficulty. The level of exam difficulty
was an important measure. An exam that was too easy or too hard would not have produced
an appropriate spread of results (too many subjects at the higher or lower end of the score
range) thus making differentiation between participants more difficult. Also, a high level of
difficulty would have served as a disincentive to many participants or resulted in a high
attrition rate.
Pilot study Pilot study participants provided feedback on:
The length and level of difficulty of the exam task
The ease of navigation of the online exam
This is discussed in more detail in the methods section (pilot study results, page 110). A dropbox link to the clinical vignettes is provided here: https://www.dropbox.com/sh/uclppmkurvmjjbr/AADrCmy3Kfsc_JDsJWG6X9zsa?dl=0
126
Chapter 7: Results This chapter will provide:
A description of sample size, attrition rate and the study population
A summary of the general descriptive data
Comparative statistics (OCTAID v Control)
Results for secondary outcome measures
Participants and sample size One hundred and sixty signed consent forms were returned. Fifty percent (80) were randomly
allocated to the OCTAID group with the other half allocated to the control group. All of these
subjects were sent an automated email from the exam host (LearnUpon) which contained a
live link. By clicking on this link participants acknowledged receipt of their invitation and
were registered on the LearnUpon platform from where they were directed to enrol for the
study. One hundred and fifty participants registered on the LearnUpon platform and ten did
not. These 10 were termed “pending users”. Four participants registered on the LearnUpon
platform but did not then go on to enrol for the study. They were termed “pending user
enrolments”. One hundred and forty six participants fully enrolled for the study on the
LearnUpon platform. One hundred and thirty four participants completed the first exam
module (12 enrolled but did not start). Sixteen participants completed the first exam task but
did not go on to complete the second exam task.
A total of 118 out of the 160 participants, who returned their signed consent forms (74%),
participated fully in training and completed both assessments. They therefore formed the
analysis population. There were strategies employed to maximise recruitment, retain
participation and minimise attrition in this study and this has already been discussed in detail
in the chapter on study methods.
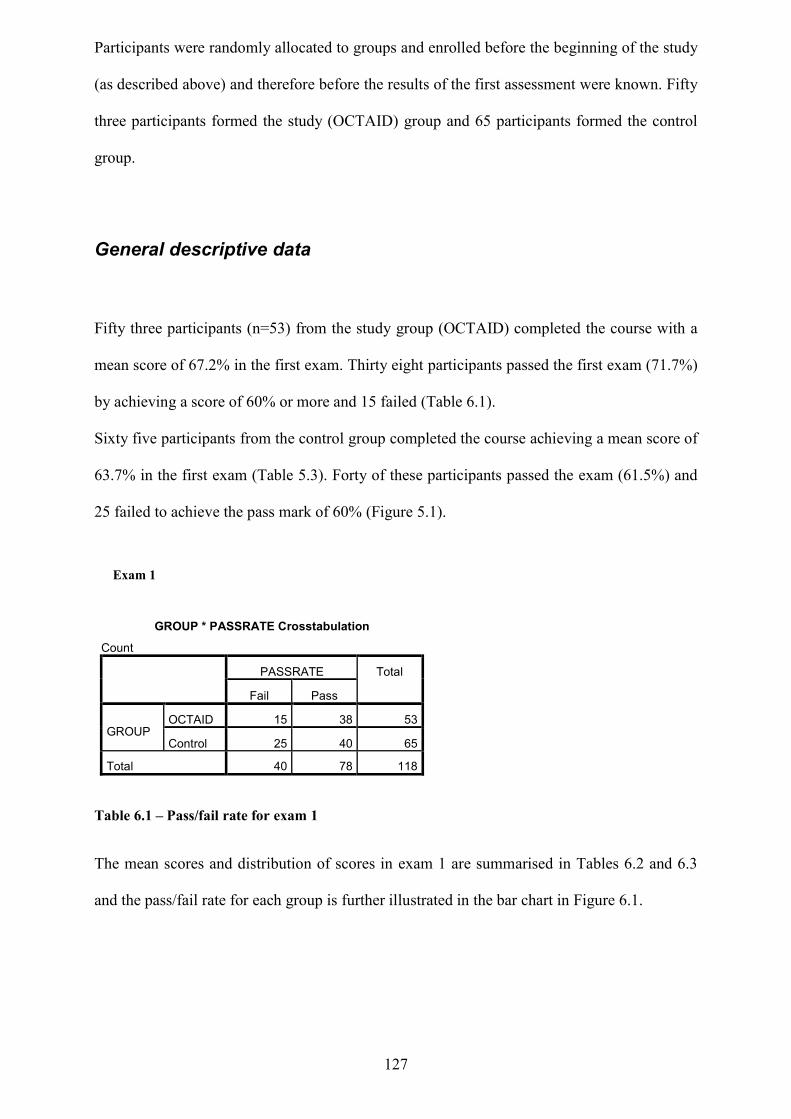
127
Participants were randomly allocated to groups and enrolled before the beginning of the study
(as described above) and therefore before the results of the first assessment were known. Fifty
three participants formed the study (OCTAID) group and 65 participants formed the control
group.
General descriptive data
Fifty three participants (n=53) from the study group (OCTAID) completed the course with a
mean score of 67.2% in the first exam. Thirty eight participants passed the first exam (71.7%)
by achieving a score of 60% or more and 15 failed (Table 6.1).
Sixty five participants from the control group completed the course achieving a mean score of
63.7% in the first exam (Table 5.3). Forty of these participants passed the exam (61.5%) and
25 failed to achieve the pass mark of 60% (Figure 5.1).
Table 6.1 – Pass/fail rate for exam 1 The mean scores and distribution of scores in exam 1 are summarised in Tables 6.2 and 6.3
and the pass/fail rate for each group is further illustrated in the bar chart in Figure 6.1.
GROUP * PASSRATE Crosstabulation
Count PASSRATE Total
Fail Pass
GROUP OCTAID 15 38 53
Control 25 40 65
Total 40 78 118
Exam 1
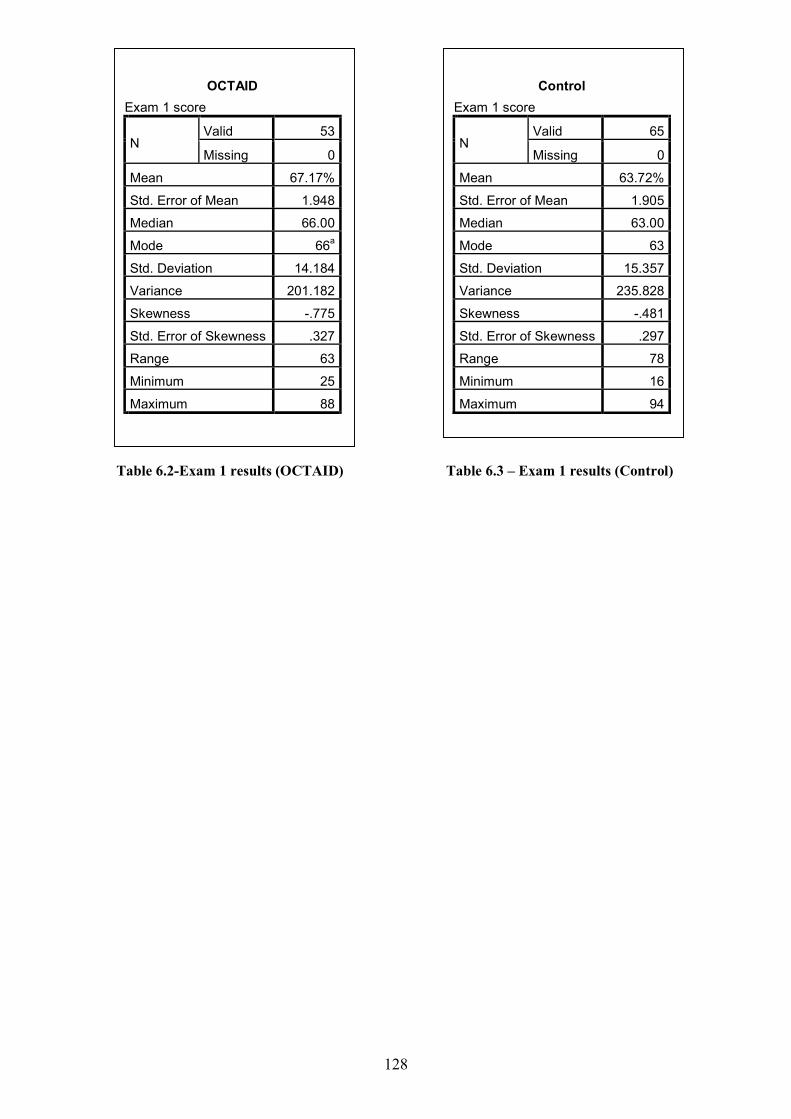
128
Table 6.2-Exam 1 results (OCTAID) Table 6.3 – Exam 1 results (Control)
OCTAID
Exam 1 score
N Valid 53
Missing 0
Mean 67.17%
Std. Error of Mean 1.948
Median 66.00
Mode 66a
Std. Deviation 14.184
Variance 201.182
Skewness -.775
Std. Error of Skewness .327
Range 63
Minimum 25
Maximum 88
Control
Exam 1 score
N Valid 65
Missing 0
Mean 63.72%
Std. Error of Mean 1.905
Median 63.00
Mode 63
Std. Deviation 15.357
Variance 235.828
Skewness -.481
Std. Error of Skewness .297
Range 78
Minimum 16
Maximum 94
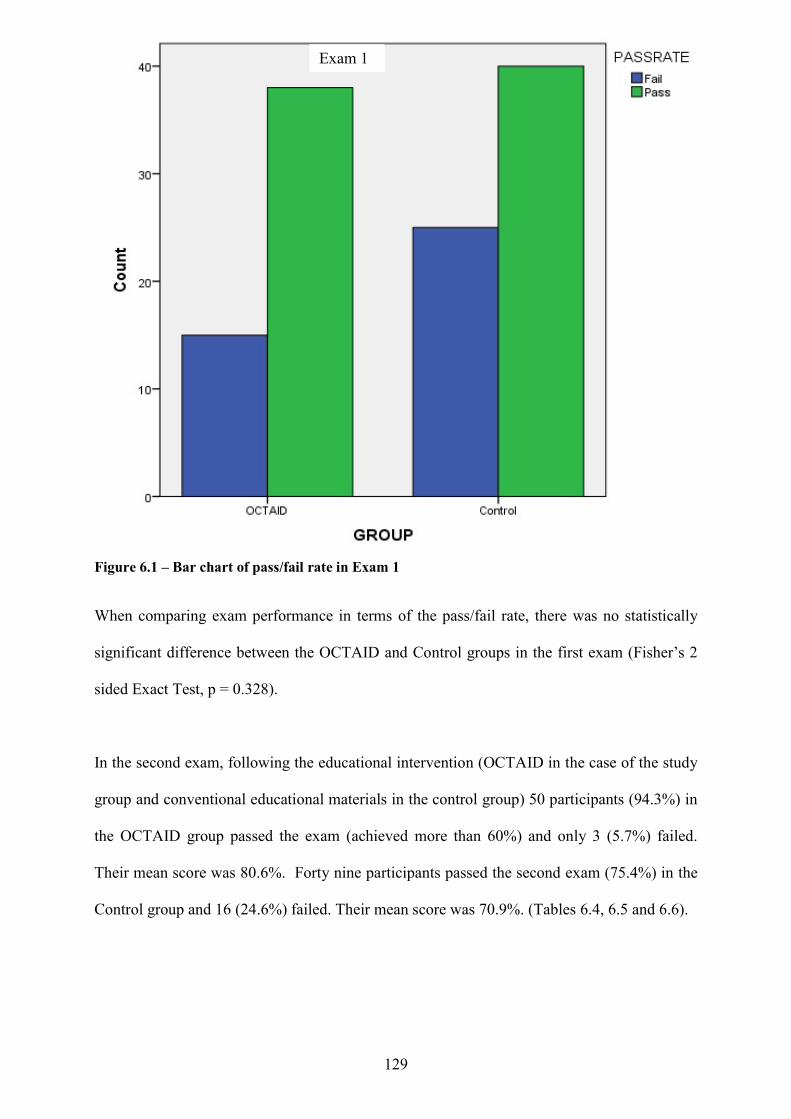
129
Figure 6.1 – Bar chart of pass/fail rate in Exam 1
When comparing exam performance in terms of the pass/fail rate, there was no statistically
significant difference between the OCTAID and Control groups in the first exam (Fisher’s 2
sided Exact Test, p = 0.328).
In the second exam, following the educational intervention (OCTAID in the case of the study
group and conventional educational materials in the control group) 50 participants (94.3%) in
the OCTAID group passed the exam (achieved more than 60%) and only 3 (5.7%) failed.
Their mean score was 80.6%. Forty nine participants passed the second exam (75.4%) in the
Control group and 16 (24.6%) failed. Their mean score was 70.9%. (Tables 6.4, 6.5 and 6.6).
Exam 1

130
Table 6.4 – Table of pass/fail rate Exam 2 Table 6.5 – Exam score for Exam 2 (OCTAID) Table 6.6 – Exam score for Exam 2 (Control) The bar chart in Figures 6.2 illustrates the pass/fail rates in Exam 2 for the OCTAID and
Control groups.
PASSRATE * GROUP Crosstabulation
Count Exam 2 GROUP Total
OCTAID CONTROL
PASSRATE Fail 3 16 19
Pass 50 49 99
Total 53 65 118
Control
Exam 2 score
N Valid 65
Missing 0
Mean 70.89%
Std. Error of Mean 1.623
Median 72.00
Mode 63
Std. Deviation 13.084
Variance 171.191
Skewness -.063
Std. Error of Skewness .297
Range 56
Minimum 41
Maximum 97
OCTAID
Exam 2 score
N Valid 53
Missing 0
Mean 80.57%
Std. Error of Mean 1.695
Median 81.00
Mode 91
Std. Deviation 12.337
Variance 152.212
Skewness -1.845
Std. Error of Skewness .327
Range 66
Minimum 31
Maximum 97
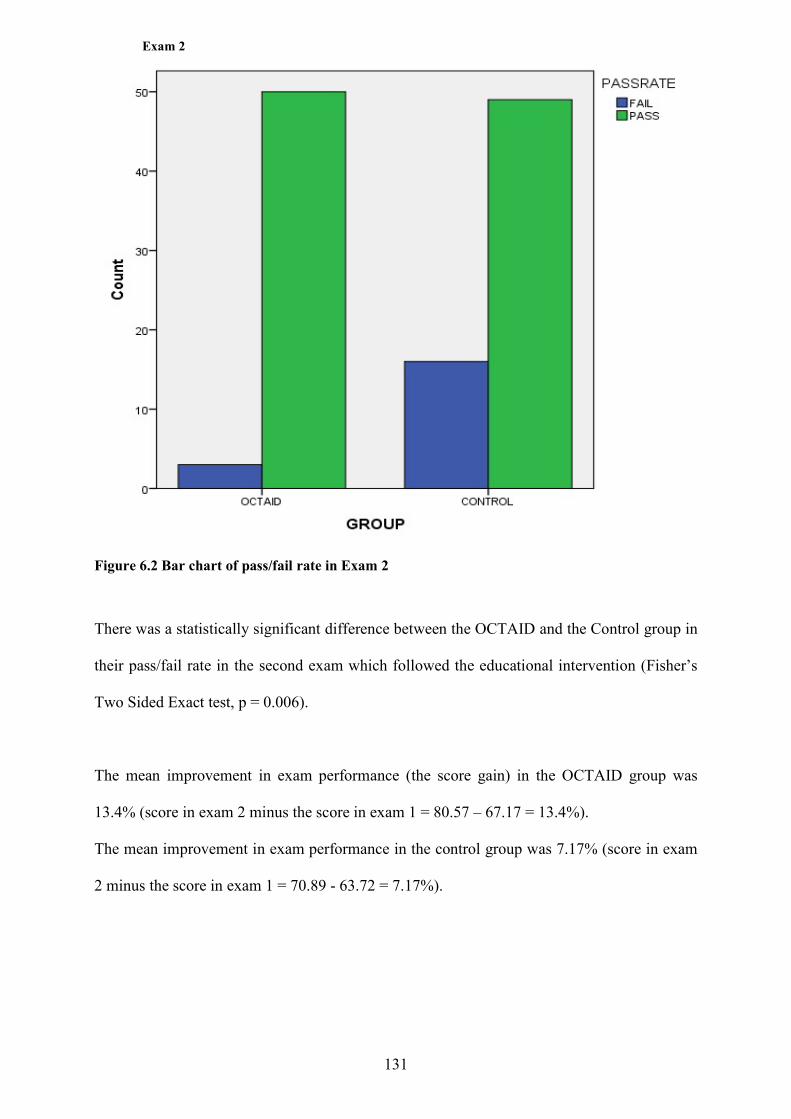
131
Exam 2
Figure 6.2 Bar chart of pass/fail rate in Exam 2 There was a statistically significant difference between the OCTAID and the Control group in
their pass/fail rate in the second exam which followed the educational intervention (Fisher’s
Two Sided Exact test, p = 0.006).
The mean improvement in exam performance (the score gain) in the OCTAID group was
13.4% (score in exam 2 minus the score in exam 1 = 80.57 – 67.17 = 13.4%).
The mean improvement in exam performance in the control group was 7.17% (score in exam
2 minus the score in exam 1 = 70.89 - 63.72 = 7.17%).
132
Comparative statistics: OCTAID v control The primary outcome measure was the change in exam score or improvement (score in exam
2 minus the score in exam 1). Participants were randomly allocated to OCTAID or Control
groups and enrolled at the beginning of the study and therefore before commencing the first
exam. Therefore, the scores in the first exam did not influence the allocation of participants to
groups and there was no re-allocation of participants in response to withdrawals from the
study. The score in the first exam was thought to be a reasonable measure of a participants
baseline OCT knowledge. Although the allocation of participants to groups was random,
statistical tests were conducted to test for possible differences between the groups in terms of
their performance in Exam 1(their baseline knowledge) using the Independent Samples T-test.
No statistically significant difference in mean exam 1 performance (p = 0.212) was identified
between the two groups of participants (2-tailed).
However, when comparing the two groups in their second exam performance (after the
intervention) a significant difference was found in their exam score. In each group the mean
Exam 1 score was compared with the mean Exam 2 score by calculating the percentage
improvement from Exam 1 to Exam 2. The OCTAID group improved by 13.4% compared
with an improvement of 7.2% in the control group.
The primary outcome measure was the change in exam score or improvement (score in exam
2 minus the score in exam 1). The mean improvement in exam scores between exam 1 and
exam 2 for each group is summarised in table 6.7 below:

133
Table 6.7 – Table showing score improvement
Applying the independent samples T test, a statistically significance difference between the
OCTAID and control groups was demonstrated with the OCTAID group showing a
significantly improved exam score compared with the control group (2-tailed p = 0.005).
This is further illustrated in the box/whisker chart in figure 6.5 below.
Figure 6.5 – Box whisker chart showing score improvement (OCTAID v Control) (In a box whisker chart the ends of the box are the upper and lower quartiles so the box spans the interquartile range – the median is marked bythe horizontal line inside the box)
The scatter dot charts in Figures 6.6 and 6.7 illustrate the different impact of each educational
intervention in terms of the improvement in exam score versus the participants’ baseline OCT
knowledge (exam 1 score).
Group Statistics
GROUP N Mean Std. Deviation Std. Error Mean
improvement OCTAID 53 13.62 12.662 1.739
Control 65 7.17 11.828 1.467
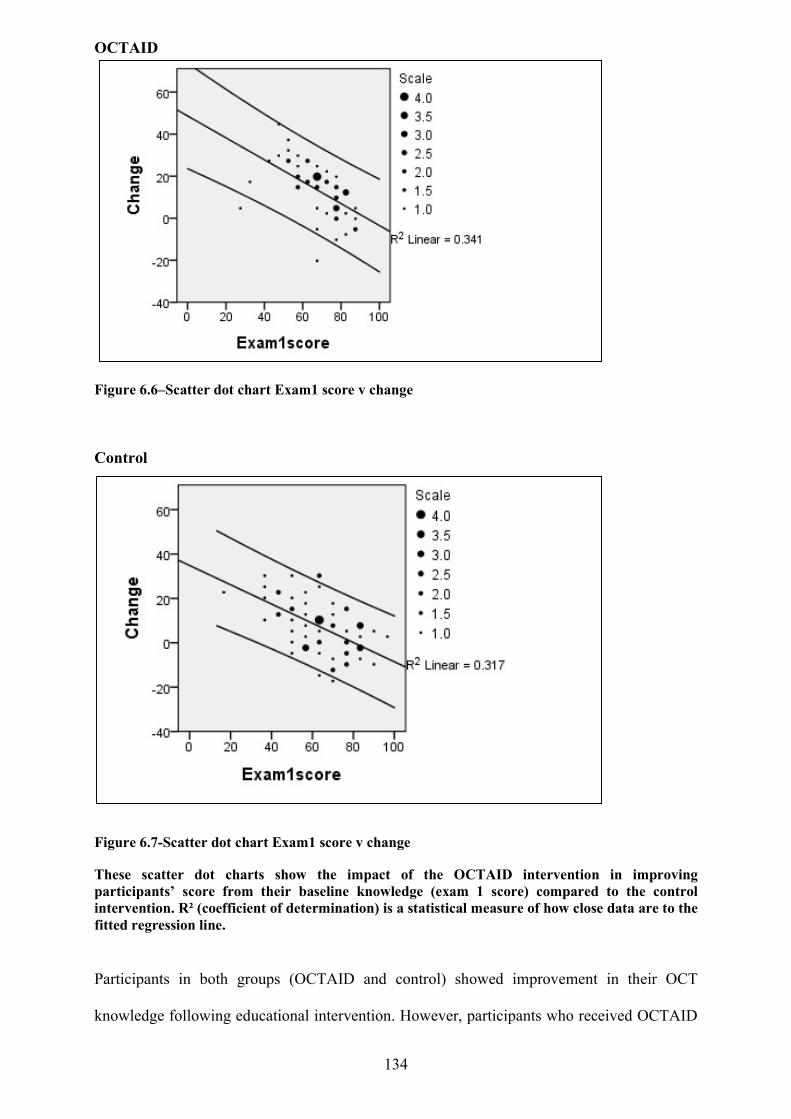
134
OCTAID
Figure 6.6–Scatter dot chart Exam1 score v change
Control Figure 6.7-Scatter dot chart Exam1 score v change These scatter dot charts show the impact of the OCTAID intervention in improving participants’ score from their baseline knowledge (exam 1 score) compared to the control intervention. R² (coefficient of determination) is a statistical measure of how close data are to the fitted regression line.
Participants in both groups (OCTAID and control) showed improvement in their OCT
knowledge following educational intervention. However, participants who received OCTAID
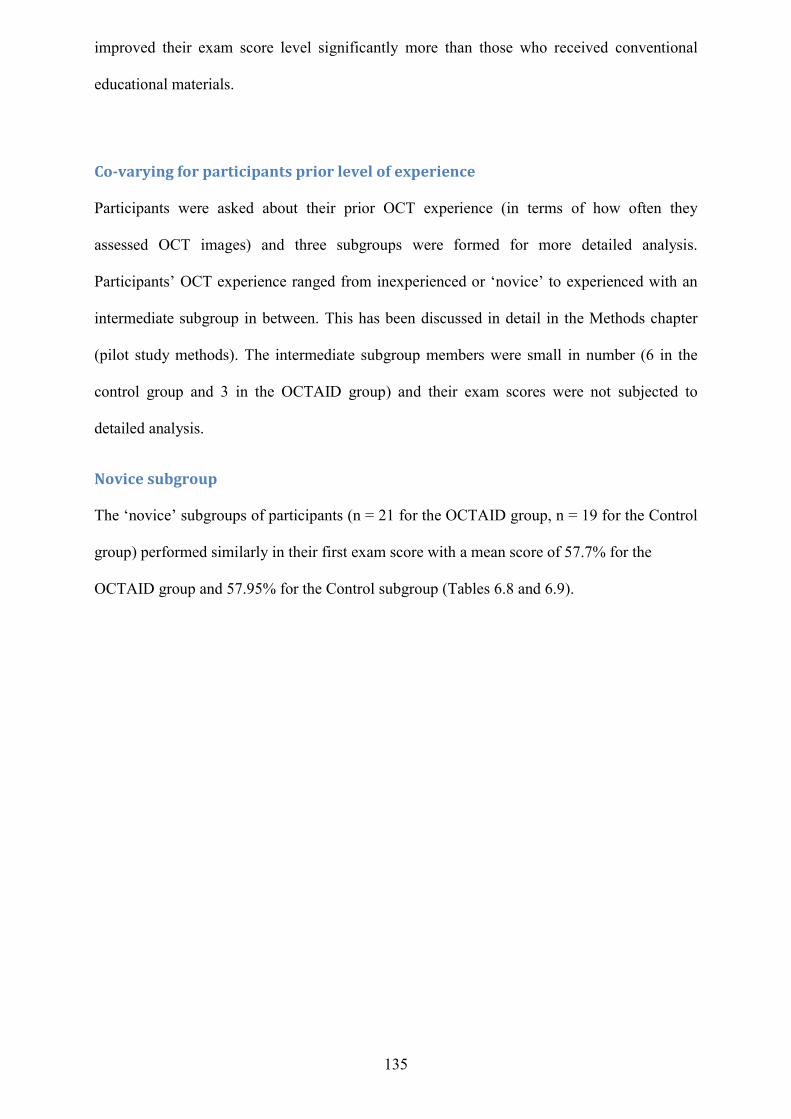
135
improved their exam score level significantly more than those who received conventional
educational materials.
Co-varying for participants prior level of experience Participants were asked about their prior OCT experience (in terms of how often they
assessed OCT images) and three subgroups were formed for more detailed analysis.
Participants’ OCT experience ranged from inexperienced or ‘novice’ to experienced with an
intermediate subgroup in between. This has been discussed in detail in the Methods chapter
(pilot study methods). The intermediate subgroup members were small in number (6 in the
control group and 3 in the OCTAID group) and their exam scores were not subjected to
detailed analysis.
Novice subgroup The ‘novice’ subgroups of participants (n = 21 for the OCTAID group, n = 19 for the Control
group) performed similarly in their first exam score with a mean score of 57.7% for the
OCTAID group and 57.95% for the Control subgroup (Tables 6.8 and 6.9).
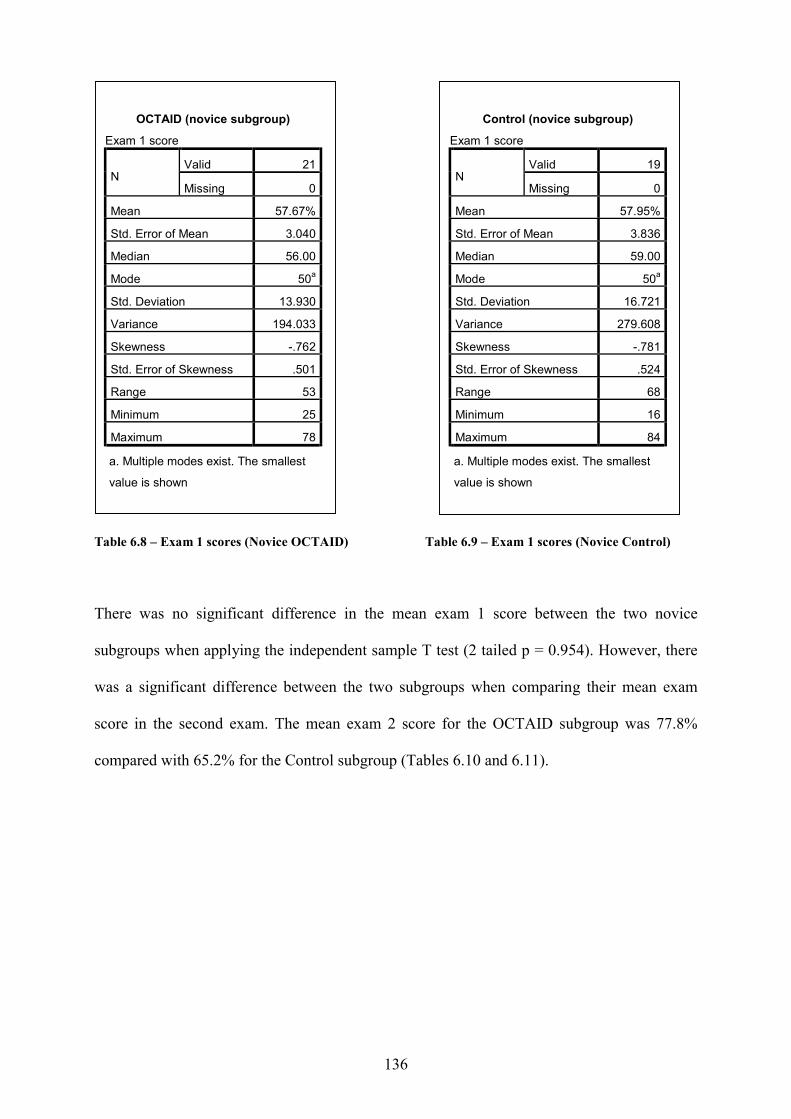
136
Table 6.8 – Exam 1 scores (Novice OCTAID) Table 6.9 – Exam 1 scores (Novice Control) There was no significant difference in the mean exam 1 score between the two novice
subgroups when applying the independent sample T test (2 tailed p = 0.954). However, there
was a significant difference between the two subgroups when comparing their mean exam
score in the second exam. The mean exam 2 score for the OCTAID subgroup was 77.8%
compared with 65.2% for the Control subgroup (Tables 6.10 and 6.11).
OCTAID (novice subgroup)
Exam 1 score
N Valid 21
Missing 0
Mean 57.67%
Std. Error of Mean 3.040
Median 56.00
Mode 50a
Std. Deviation 13.930
Variance 194.033
Skewness -.762
Std. Error of Skewness .501
Range 53
Minimum 25
Maximum 78
a. Multiple modes exist. The smallest
value is shown
Control (novice subgroup)
Exam 1 score
N Valid 19
Missing 0
Mean 57.95%
Std. Error of Mean 3.836
Median 59.00
Mode 50a
Std. Deviation 16.721
Variance 279.608
Skewness -.781
Std. Error of Skewness .524
Range 68
Minimum 16
Maximum 84
a. Multiple modes exist. The smallest
value is shown
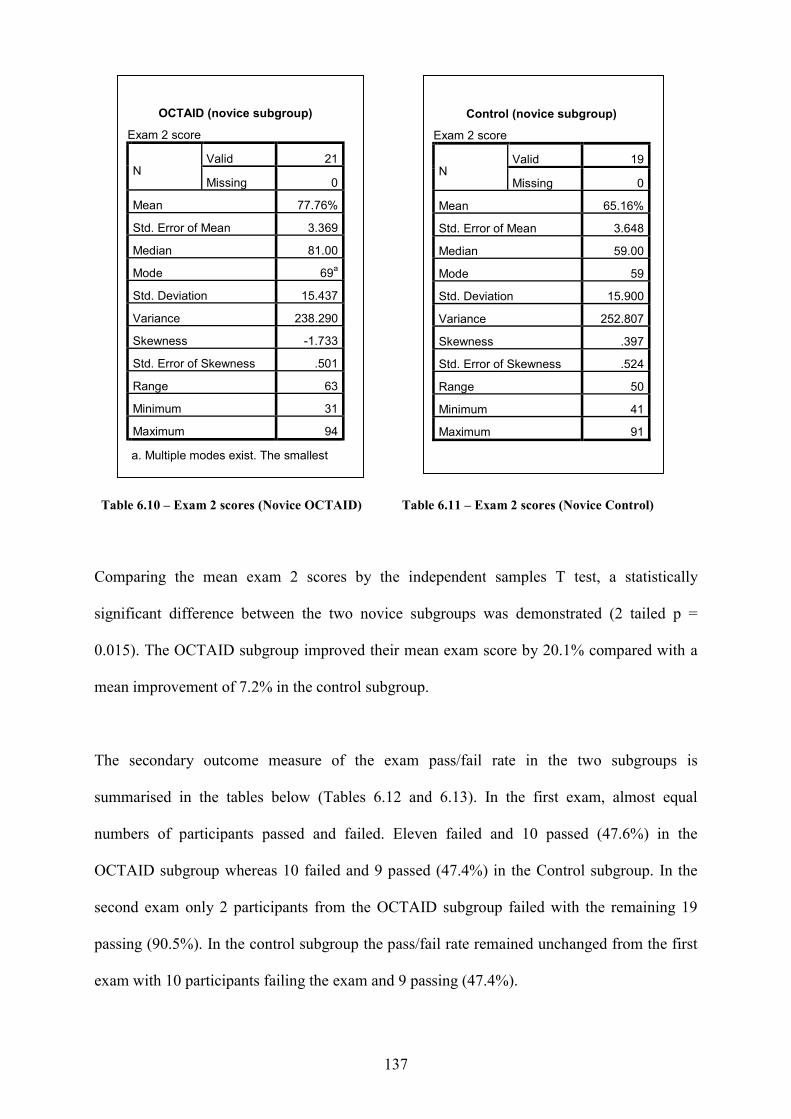
137
Table 6.10 – Exam 2 scores (Novice OCTAID) Table 6.11 – Exam 2 scores (Novice Control)
Comparing the mean exam 2 scores by the independent samples T test, a statistically
significant difference between the two novice subgroups was demonstrated (2 tailed p =
0.015). The OCTAID subgroup improved their mean exam score by 20.1% compared with a
mean improvement of 7.2% in the control subgroup.
The secondary outcome measure of the exam pass/fail rate in the two subgroups is
summarised in the tables below (Tables 6.12 and 6.13). In the first exam, almost equal
numbers of participants passed and failed. Eleven failed and 10 passed (47.6%) in the
OCTAID subgroup whereas 10 failed and 9 passed (47.4%) in the Control subgroup. In the
second exam only 2 participants from the OCTAID subgroup failed with the remaining 19
passing (90.5%). In the control subgroup the pass/fail rate remained unchanged from the first
exam with 10 participants failing the exam and 9 passing (47.4%).
OCTAID (novice subgroup)
Exam 2 score
N Valid 21
Missing 0
Mean 77.76%
Std. Error of Mean 3.369
Median 81.00
Mode 69a
Std. Deviation 15.437
Variance 238.290
Skewness -1.733
Std. Error of Skewness .501
Range 63
Minimum 31
Maximum 94
a. Multiple modes exist. The smallest
value is shown
Control (novice subgroup)
Exam 2 score
N Valid 19
Missing 0
Mean 65.16%
Std. Error of Mean 3.648
Median 59.00
Mode 59
Std. Deviation 15.900
Variance 252.807
Skewness .397
Std. Error of Skewness .524
Range 50
Minimum 41
Maximum 91

138
Table 6.12–Pass/fail rate Exam 1 (Novice groups)
Table 6.13–Pass/fail rate Exam 2 (Novice groups)
Chi square analysis of the pass/fail rate showed no significance difference between the
OCTAID and Control subgroups in Exam 1 (Fisher’s 2 sided exact test, p = 1.00). However, a
statistically significant difference was demonstrated between the two groups in their pass/fail
rate in Exam 2 with the OCTAID subgroup outperforming the Control subgroup in their pass
rate (Fisher’s Exact test 2 sided p = 0.005).
The mean changes in exam score (exam 2 score minus exam 1 score) are summarised in the
Table 6.14 below:
PASSRATE * GROUP Crosstabulation
Exam 1 (novice subgroup) GROUP Total
OCTAID Control
PASSRATE FAIL 11 10 21
PASS 10 9 19
Total 21 19 40
PASSRATE * GROUP Crosstabulation
Exam 2 (novice subgroup) GROUP Total
OCTAID Control
PASSRATE FAIL 2 10 12
PASS 19 9 28
Total 21 19 40
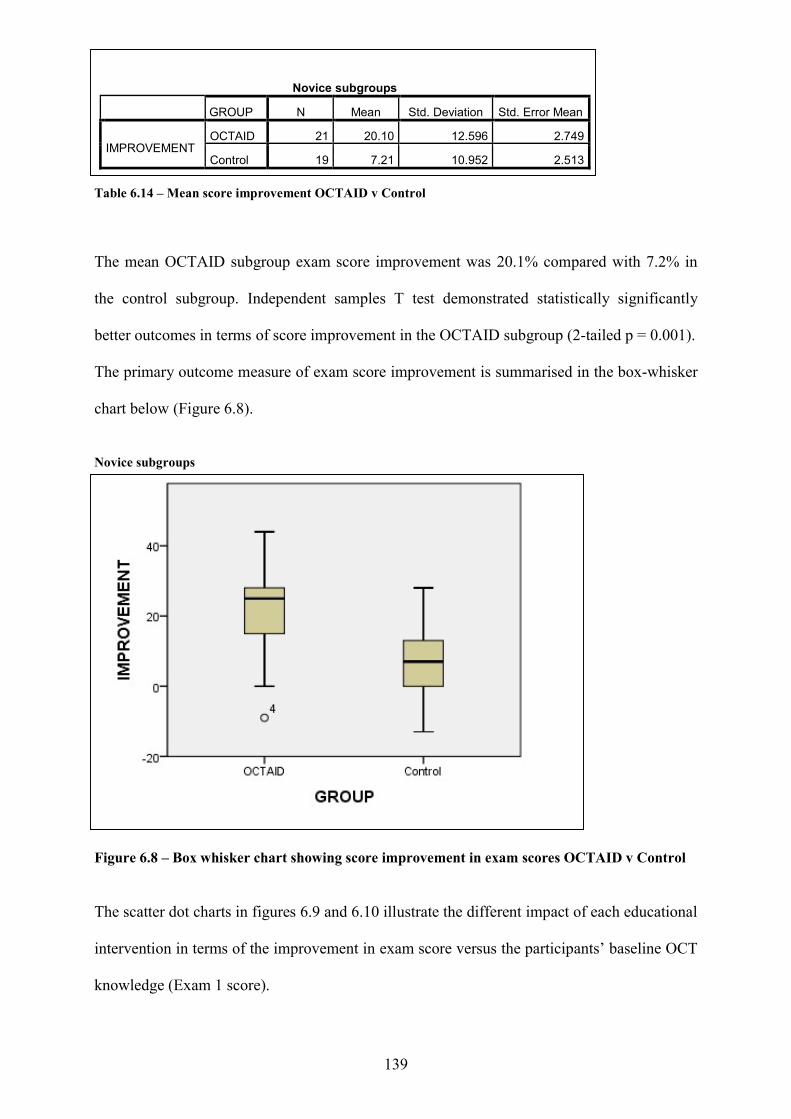
139
Table 6.14 – Mean score improvement OCTAID v Control
The mean OCTAID subgroup exam score improvement was 20.1% compared with 7.2% in
the control subgroup. Independent samples T test demonstrated statistically significantly
better outcomes in terms of score improvement in the OCTAID subgroup (2-tailed p = 0.001).
The primary outcome measure of exam score improvement is summarised in the box-whisker
chart below (Figure 6.8).
Novice subgroups Figure 6.8 – Box whisker chart showing score improvement in exam scores OCTAID v Control The scatter dot charts in figures 6.9 and 6.10 illustrate the different impact of each educational
intervention in terms of the improvement in exam score versus the participants’ baseline OCT
knowledge (Exam 1 score).
Novice subgroups
GROUP N Mean Std. Deviation Std. Error Mean
IMPROVEMENT OCTAID 21 20.10 12.596 2.749
Control 19 7.21 10.952 2.513
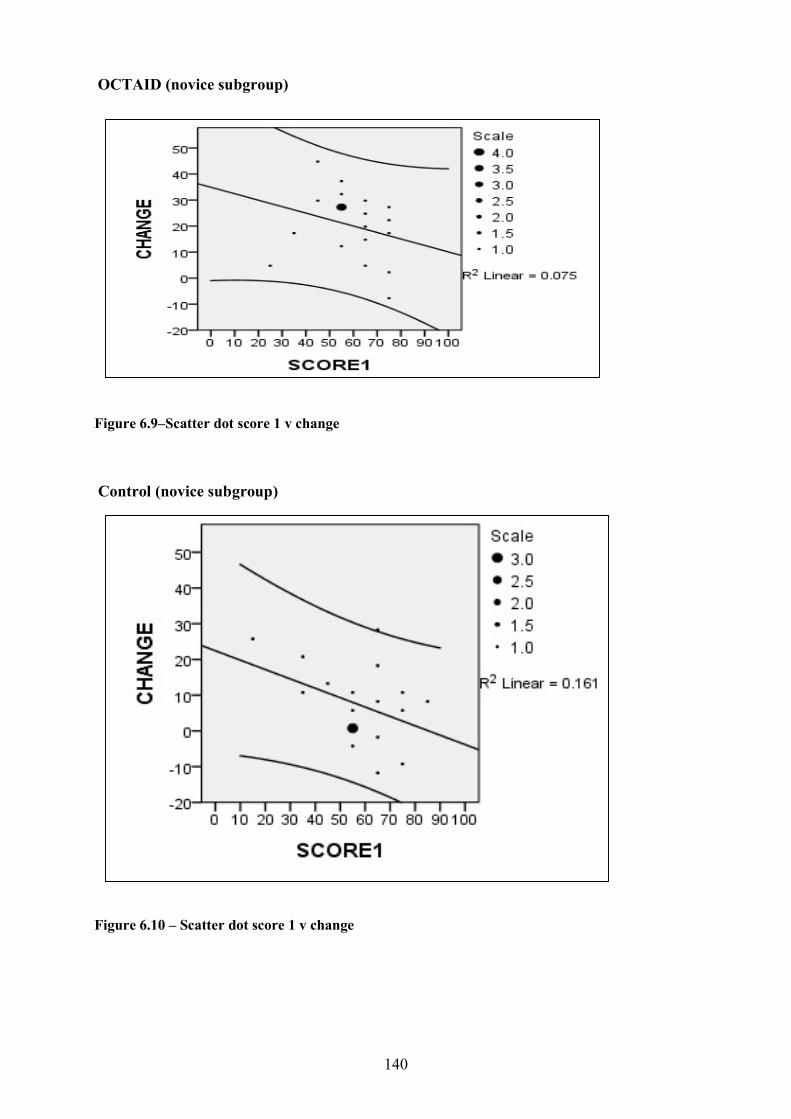
140
OCTAID (novice subgroup) Figure 6.9–Scatter dot score 1 v change Control (novice subgroup) Figure 6.10 – Scatter dot score 1 v change
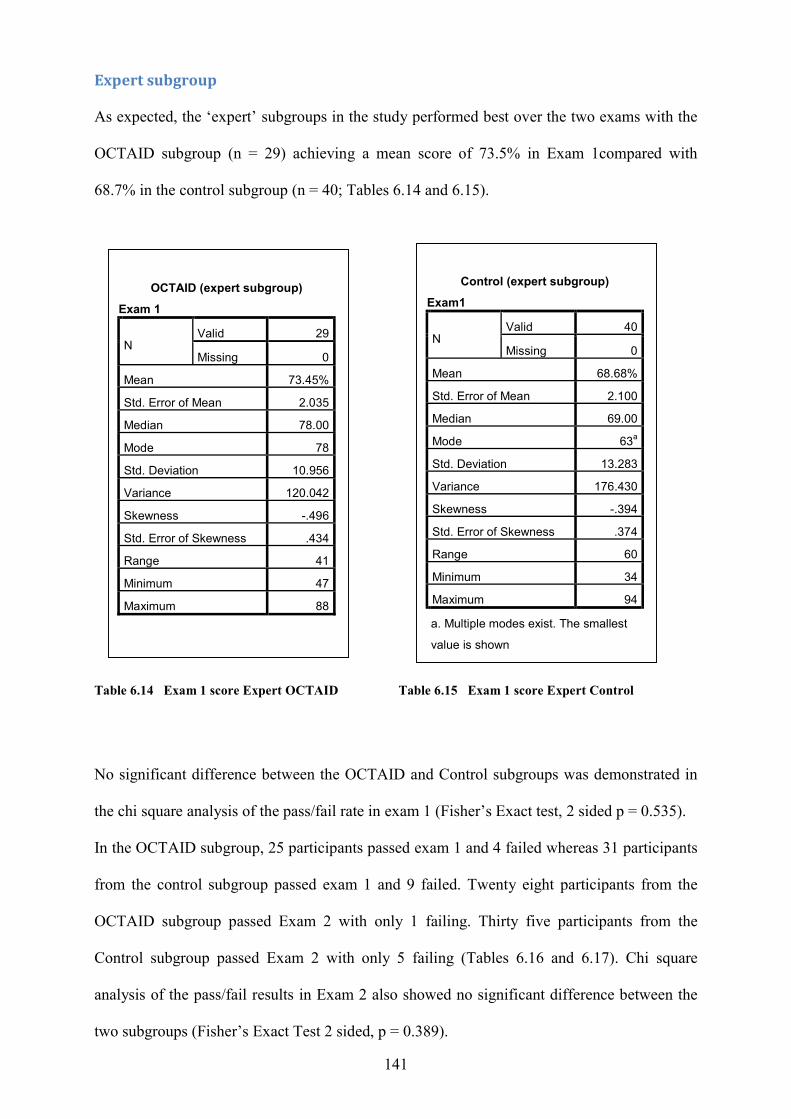
141
Expert subgroup As expected, the ‘expert’ subgroups in the study performed best over the two exams with the
OCTAID subgroup (n = 29) achieving a mean score of 73.5% in Exam 1compared with
68.7% in the control subgroup (n = 40; Tables 6.14 and 6.15).
Table 6.14 Exam 1 score Expert OCTAID Table 6.15 Exam 1 score Expert Control
No significant difference between the OCTAID and Control subgroups was demonstrated in
the chi square analysis of the pass/fail rate in exam 1 (Fisher’s Exact test, 2 sided p = 0.535).
In the OCTAID subgroup, 25 participants passed exam 1 and 4 failed whereas 31 participants
from the control subgroup passed exam 1 and 9 failed. Twenty eight participants from the
OCTAID subgroup passed Exam 2 with only 1 failing. Thirty five participants from the
Control subgroup passed Exam 2 with only 5 failing (Tables 6.16 and 6.17). Chi square
analysis of the pass/fail results in Exam 2 also showed no significant difference between the
two subgroups (Fisher’s Exact Test 2 sided, p = 0.389).
OCTAID (expert subgroup)
Exam 1
N Valid 29
Missing 0
Mean 73.45%
Std. Error of Mean 2.035
Median 78.00
Mode 78
Std. Deviation 10.956
Variance 120.042
Skewness -.496
Std. Error of Skewness .434
Range 41
Minimum 47
Maximum 88
Control (expert subgroup)
Exam1
N Valid 40
Missing 0
Mean 68.68%
Std. Error of Mean 2.100
Median 69.00
Mode 63a
Std. Deviation 13.283
Variance 176.430
Skewness -.394
Std. Error of Skewness .374
Range 60
Minimum 34
Maximum 94
a. Multiple modes exist. The smallest
value is shown
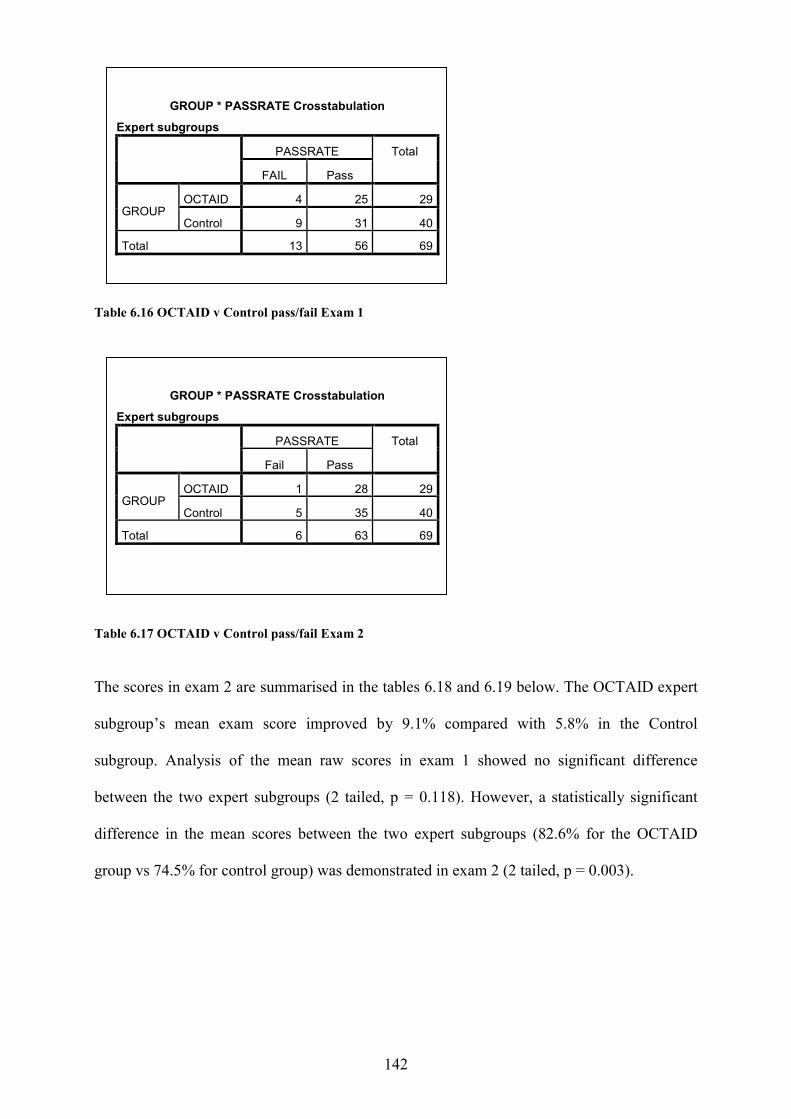
142
Table 6.16 OCTAID v Control pass/fail Exam 1
Table 6.17 OCTAID v Control pass/fail Exam 2
The scores in exam 2 are summarised in the tables 6.18 and 6.19 below. The OCTAID expert
subgroup’s mean exam score improved by 9.1% compared with 5.8% in the Control
subgroup. Analysis of the mean raw scores in exam 1 showed no significant difference
between the two expert subgroups (2 tailed, p = 0.118). However, a statistically significant
difference in the mean scores between the two expert subgroups (82.6% for the OCTAID
group vs 74.5% for control group) was demonstrated in exam 2 (2 tailed, p = 0.003).
GROUP * PASSRATE Crosstabulation
Expert subgroups PASSRATE Total
FAIL Pass
GROUP OCTAID 4 25 29
Control 9 31 40
Total 13 56 69
GROUP * PASSRATE Crosstabulation
Expert subgroups PASSRATE Total
Fail Pass
GROUP OCTAID 1 28 29
Control 5 35 40
Total 6 63 69
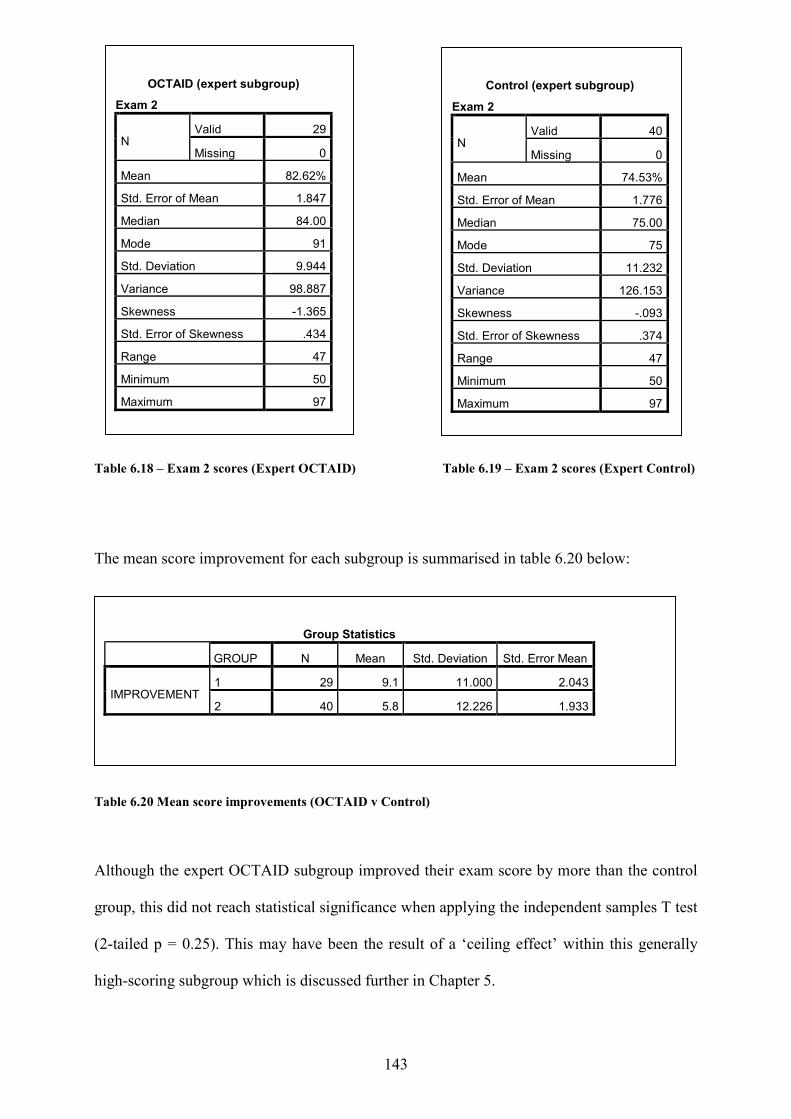
143
Table 6.18 – Exam 2 scores (Expert OCTAID) Table 6.19 – Exam 2 scores (Expert Control)
The mean score improvement for each subgroup is summarised in table 6.20 below:
Table 6.20 Mean score improvements (OCTAID v Control)
Although the expert OCTAID subgroup improved their exam score by more than the control
group, this did not reach statistical significance when applying the independent samples T test
(2-tailed p = 0.25). This may have been the result of a ‘ceiling effect’ within this generally
high-scoring subgroup which is discussed further in Chapter 5.
OCTAID (expert subgroup)
Exam 2
N Valid 29
Missing 0
Mean 82.62%
Std. Error of Mean 1.847
Median 84.00
Mode 91
Std. Deviation 9.944
Variance 98.887
Skewness -1.365
Std. Error of Skewness .434
Range 47
Minimum 50
Maximum 97
Control (expert subgroup)
Exam 2
N Valid 40
Missing 0
Mean 74.53%
Std. Error of Mean 1.776
Median 75.00
Mode 75
Std. Deviation 11.232
Variance 126.153
Skewness -.093
Std. Error of Skewness .374
Range 47
Minimum 50
Maximum 97
Group Statistics
GROUP N Mean Std. Deviation Std. Error Mean
IMPROVEMENT 1 29 9.1 11.000 2.043
2 40 5.8 12.226 1.933
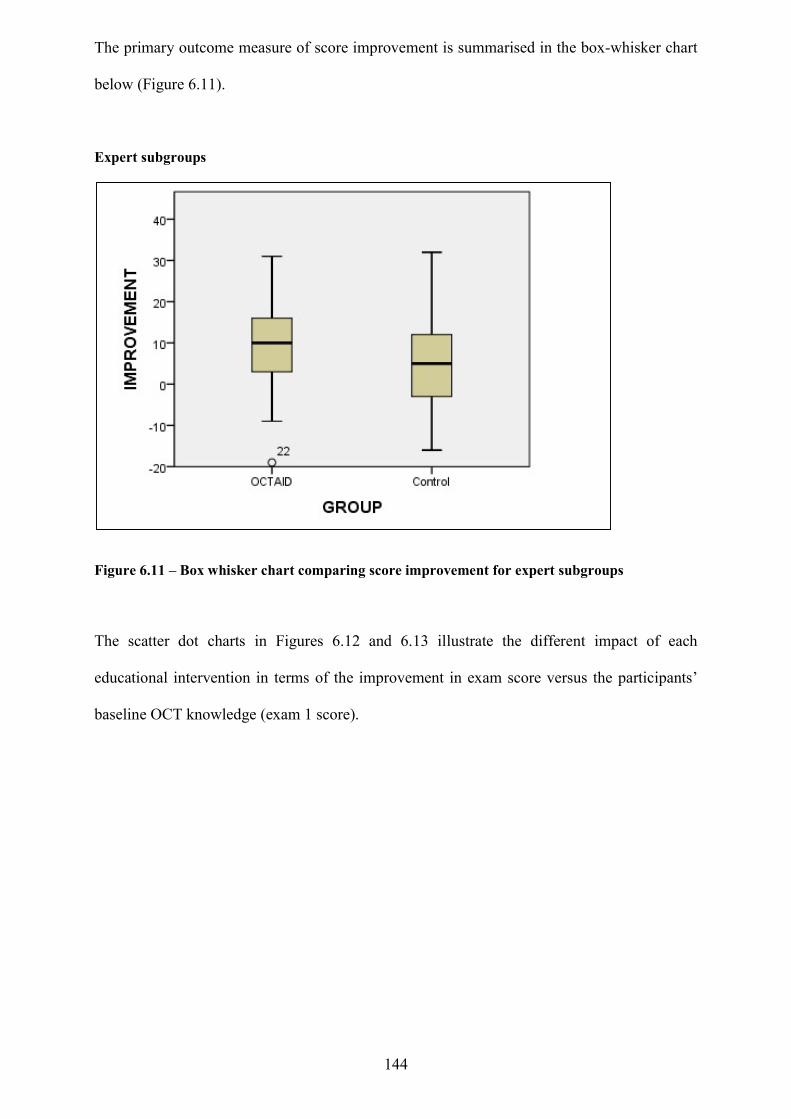
144
The primary outcome measure of score improvement is summarised in the box-whisker chart
below (Figure 6.11).
Expert subgroups
Figure 6.11 – Box whisker chart comparing score improvement for expert subgroups
The scatter dot charts in Figures 6.12 and 6.13 illustrate the different impact of each
educational intervention in terms of the improvement in exam score versus the participants’
baseline OCT knowledge (exam 1 score).
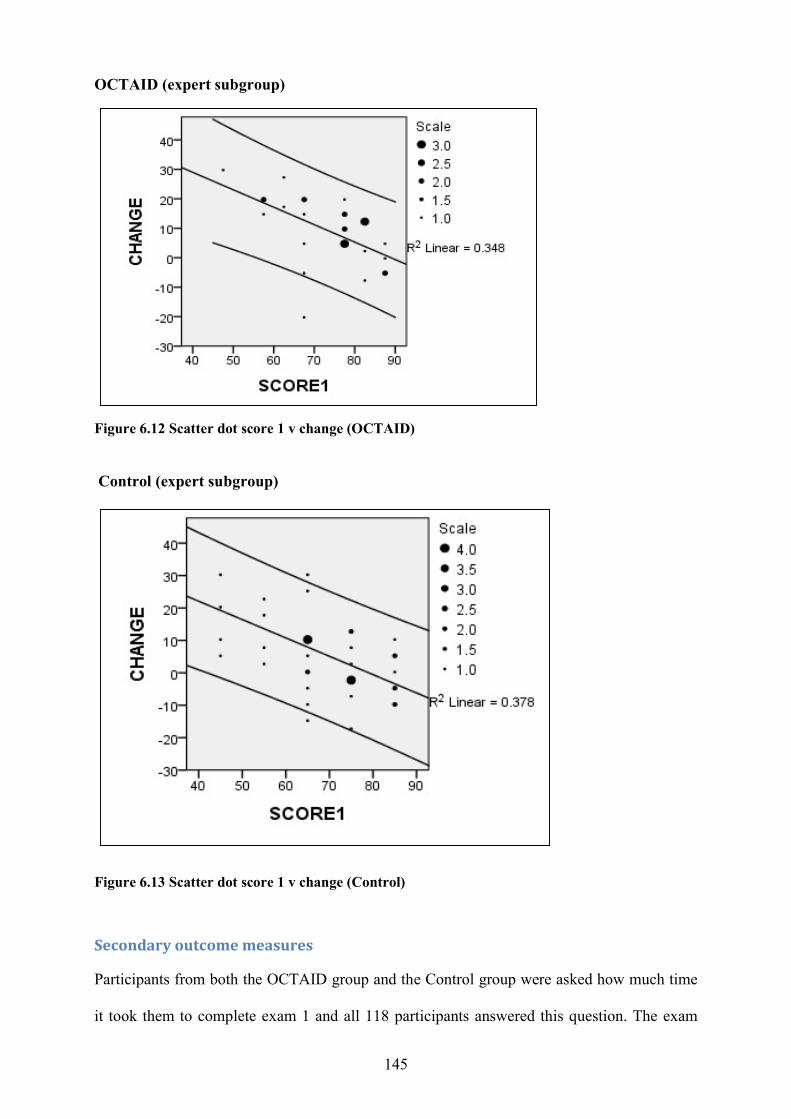
145
OCTAID (expert subgroup)
Figure 6.12 Scatter dot score 1 v change (OCTAID) Control (expert subgroup)
Figure 6.13 Scatter dot score 1 v change (Control)
Secondary outcome measures
Participants from both the OCTAID group and the Control group were asked how much time
it took them to complete exam 1 and all 118 participants answered this question. The exam
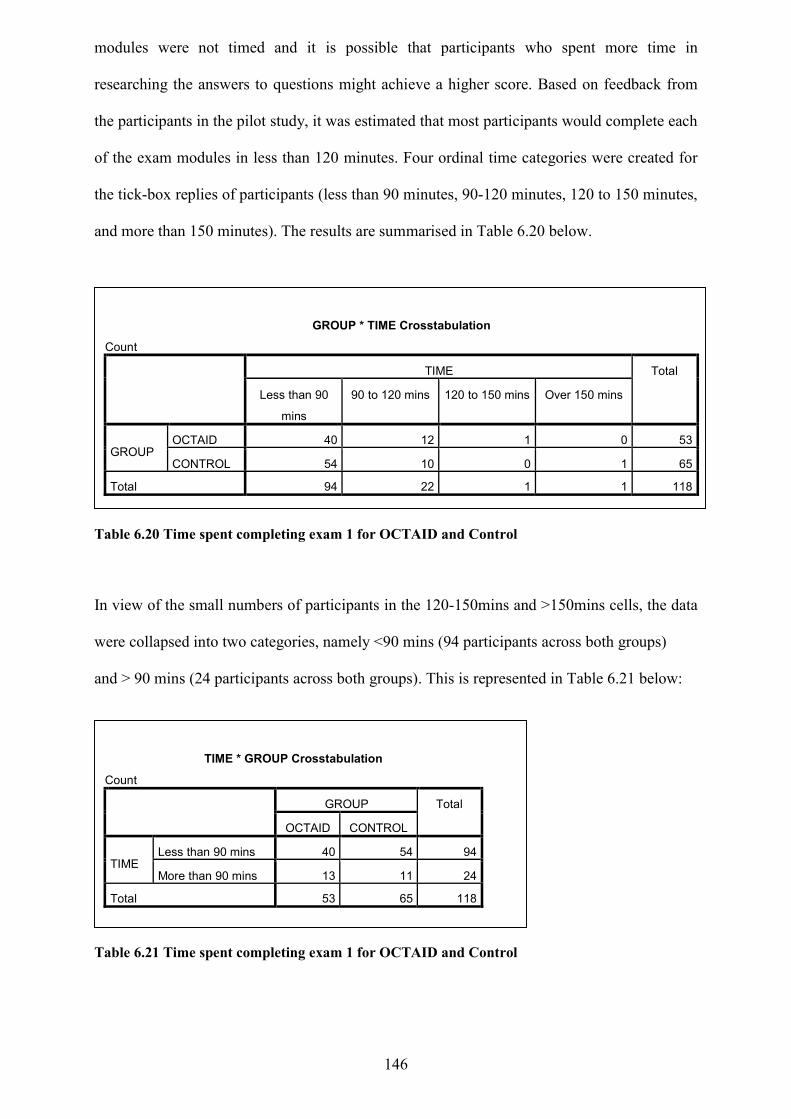
146
modules were not timed and it is possible that participants who spent more time in
researching the answers to questions might achieve a higher score. Based on feedback from
the participants in the pilot study, it was estimated that most participants would complete each
of the exam modules in less than 120 minutes. Four ordinal time categories were created for
the tick-box replies of participants (less than 90 minutes, 90-120 minutes, 120 to 150 minutes,
and more than 150 minutes). The results are summarised in Table 6.20 below.
Table 6.20 Time spent completing exam 1 for OCTAID and Control
In view of the small numbers of participants in the 120-150mins and >150mins cells, the data
were collapsed into two categories, namely <90 mins (94 participants across both groups)
and > 90 mins (24 participants across both groups). This is represented in Table 6.21 below:
Table 6.21 Time spent completing exam 1 for OCTAID and Control
GROUP * TIME Crosstabulation
Count TIME Total
Less than 90
mins
90 to 120 mins 120 to 150 mins Over 150 mins
GROUP OCTAID 40 12 1 0 53
CONTROL 54 10 0 1 65
Total 94 22 1 1 118
TIME * GROUP Crosstabulation
Count GROUP Total
OCTAID CONTROL
TIME Less than 90 mins 40 54 94
More than 90 mins 13 11 24
Total 53 65 118
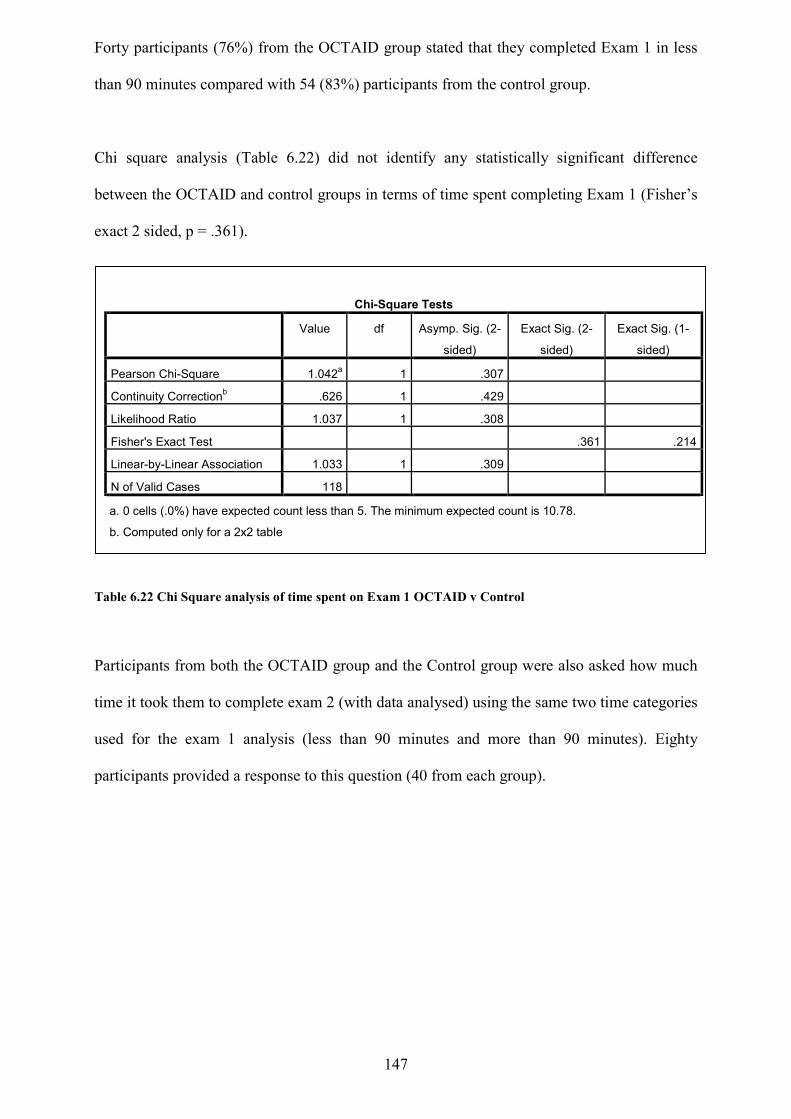
147
Forty participants (76%) from the OCTAID group stated that they completed Exam 1 in less
than 90 minutes compared with 54 (83%) participants from the control group.
Chi square analysis (Table 6.22) did not identify any statistically significant difference
between the OCTAID and control groups in terms of time spent completing Exam 1 (Fisher’s
exact 2 sided, p = .361).
Table 6.22 Chi Square analysis of time spent on Exam 1 OCTAID v Control
Participants from both the OCTAID group and the Control group were also asked how much
time it took them to complete exam 2 (with data analysed) using the same two time categories
used for the exam 1 analysis (less than 90 minutes and more than 90 minutes). Eighty
participants provided a response to this question (40 from each group).
Chi-Square Tests
Value df Asymp. Sig. (2-
sided)
Exact Sig. (2-
sided)
Exact Sig. (1-
sided)
Pearson Chi-Square 1.042a 1 .307
Continuity Correctionb .626 1 .429
Likelihood Ratio 1.037 1 .308
Fisher's Exact Test .361 .214
Linear-by-Linear Association 1.033 1 .309
N of Valid Cases 118
a. 0 cells (.0%) have expected count less than 5. The minimum expected count is 10.78.
b. Computed only for a 2x2 table
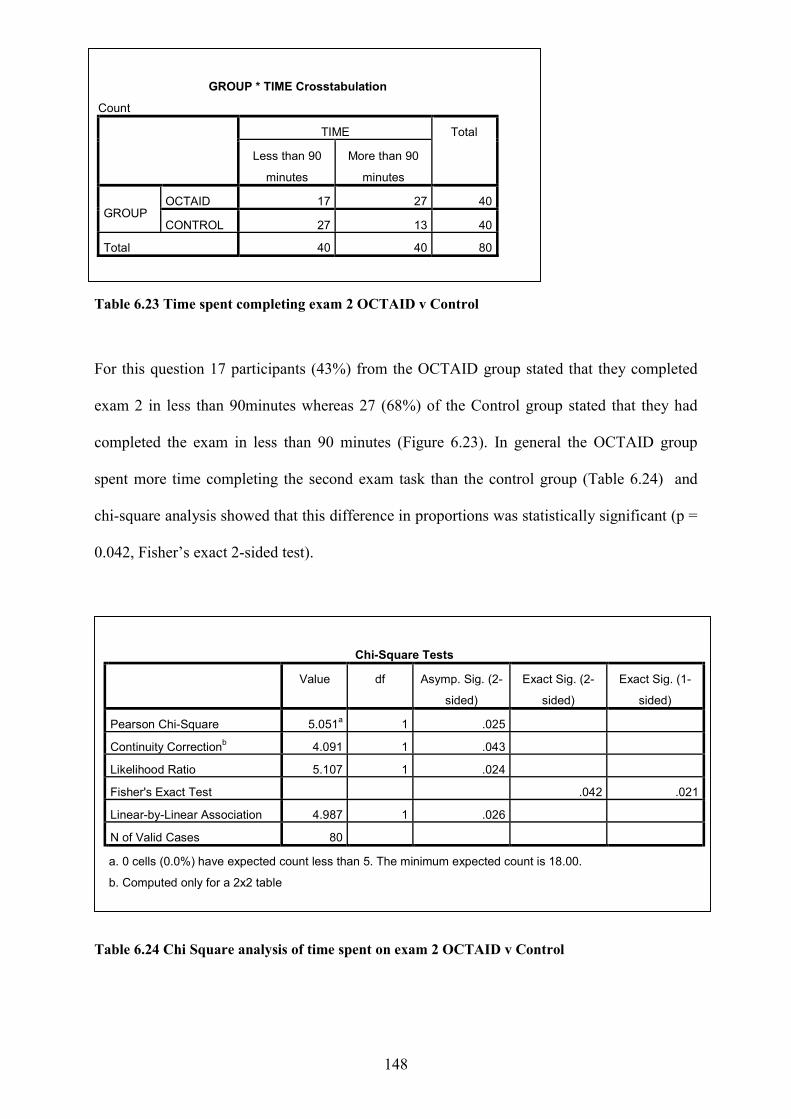
148
Table 6.23 Time spent completing exam 2 OCTAID v Control
For this question 17 participants (43%) from the OCTAID group stated that they completed
exam 2 in less than 90minutes whereas 27 (68%) of the Control group stated that they had
completed the exam in less than 90 minutes (Figure 6.23). In general the OCTAID group
spent more time completing the second exam task than the control group (Table 6.24) and
chi-square analysis showed that this difference in proportions was statistically significant (p =
0.042, Fisher’s exact 2-sided test).
Table 6.24 Chi Square analysis of time spent on exam 2 OCTAID v Control
GROUP * TIME Crosstabulation
Count TIME Total
Less than 90
minutes
More than 90
minutes
GROUP OCTAID 17 27 40
CONTROL 27 13 40
Total 40 40 80
Chi-Square Tests
Value df Asymp. Sig. (2-
sided)
Exact Sig. (2-
sided)
Exact Sig. (1-
sided)
Pearson Chi-Square 5.051a 1 .025
Continuity Correctionb 4.091 1 .043
Likelihood Ratio 5.107 1 .024
Fisher's Exact Test .042 .021
Linear-by-Linear Association 4.987 1 .026
N of Valid Cases 80
a. 0 cells (0.0%) have expected count less than 5. The minimum expected count is 18.00.
b. Computed only for a 2x2 table
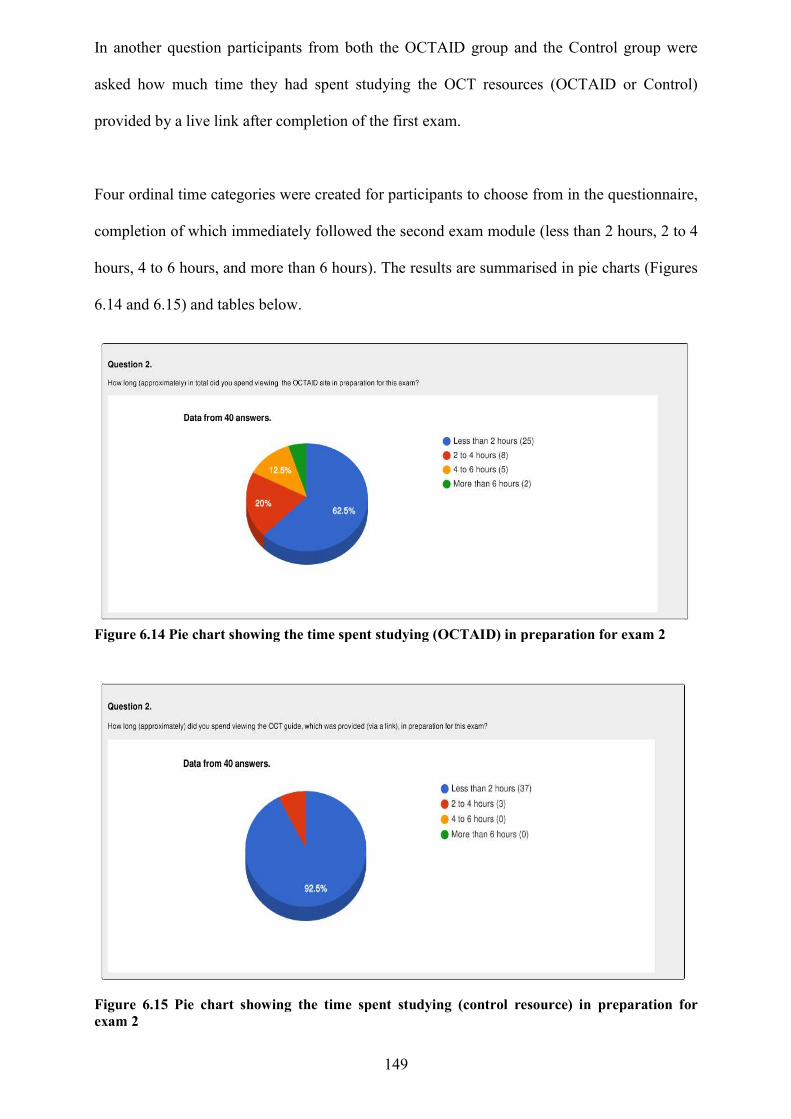
In another question participants from both the OCTAID group and the Control group were
asked how much time they had spent studying the OCT resources
provided by a live link after completion of the fi
Four ordinal time categories were
completion of which immediately followed the second exam module (less than 2 hours
hours, 4 to 6 hours, and more than 6 hours). The results a
6.14 and 6.15) and tables below.
Figure 6.14 Pie chart showing the time spent studying (OCTAID) in preparation for exam 2
Figure (Pie chart showing the time spent studying OCTAID in preparation for exa
Figure 6.15 Pie chart showing the time spent exam 2
149
participants from both the OCTAID group and the Control group were
they had spent studying the OCT resources (OCTAID or Control)
provided by a live link after completion of the first exam.
Four ordinal time categories were created for participants to choose from in the questionnaire
which immediately followed the second exam module (less than 2 hours
hours, 4 to 6 hours, and more than 6 hours). The results are summarised in
below.
.14 Pie chart showing the time spent studying (OCTAID) in preparation for exam 2
(Pie chart showing the time spent studying OCTAID in preparation for exam 2)
Pie chart showing the time spent studying (control resource)
participants from both the OCTAID group and the Control group were
(OCTAID or Control)
to choose from in the questionnaire,
which immediately followed the second exam module (less than 2 hours, 2 to 4
re summarised in pie charts (Figures
.14 Pie chart showing the time spent studying (OCTAID) in preparation for exam 2
) in preparation for
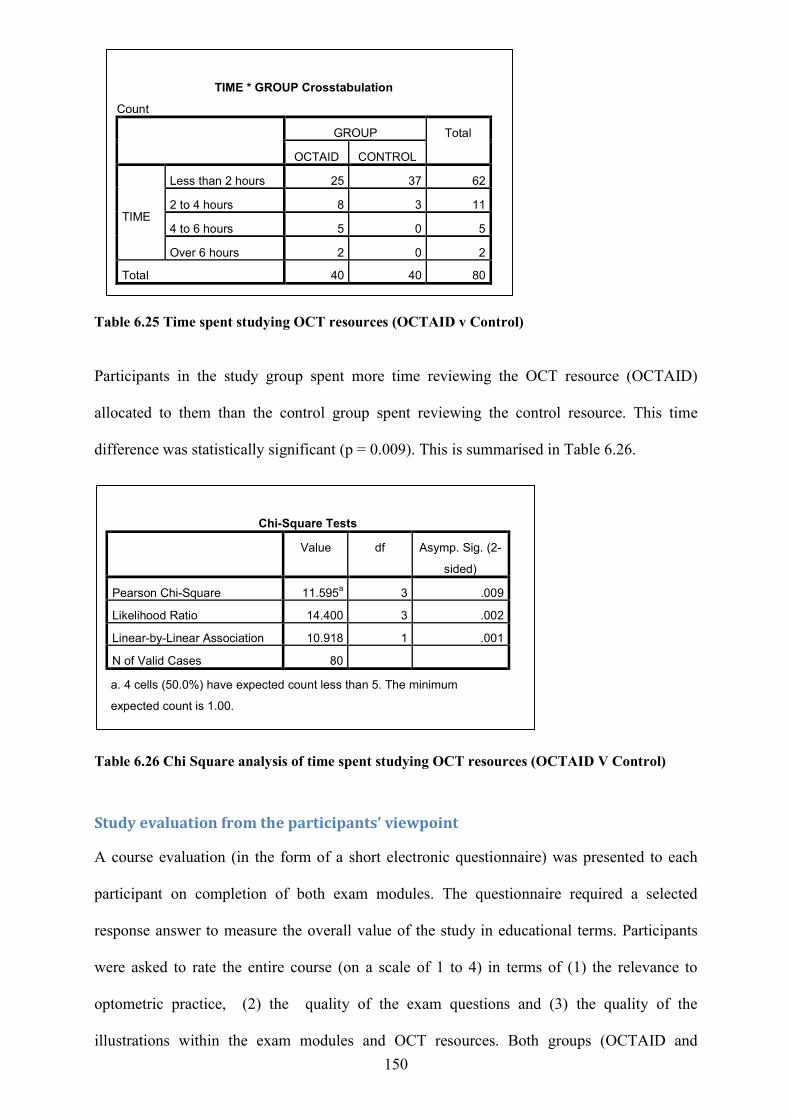
150
Table 6.25 Time spent studying OCT resources (OCTAID v Control)
Participants in the study group spent more time reviewing the OCT resource (OCTAID)
allocated to them than the control group spent reviewing the control resource. This time
difference was statistically significant (p = 0.009). This is summarised in Table 6.26.
Table 6.26 Chi Square analysis of time spent studying OCT resources (OCTAID V Control)
Study evaluation from the participants’ viewpoint
A course evaluation (in the form of a short electronic questionnaire) was presented to each
participant on completion of both exam modules. The questionnaire required a selected
response answer to measure the overall value of the study in educational terms. Participants
were asked to rate the entire course (on a scale of 1 to 4) in terms of (1) the relevance to
optometric practice, (2) the quality of the exam questions and (3) the quality of the
illustrations within the exam modules and OCT resources. Both groups (OCTAID and
TIME * GROUP Crosstabulation
Count GROUP Total
OCTAID CONTROL
TIME
Less than 2 hours 25 37 62
2 to 4 hours 8 3 11
4 to 6 hours 5 0 5
Over 6 hours 2 0 2
Total 40 40 80
Chi-Square Tests
Value df Asymp. Sig. (2-
sided)
Pearson Chi-Square 11.595a 3 .009
Likelihood Ratio 14.400 3 .002
Linear-by-Linear Association 10.918 1 .001
N of Valid Cases 80
a. 4 cells (50.0%) have expected count less than 5. The minimum
expected count is 1.00.
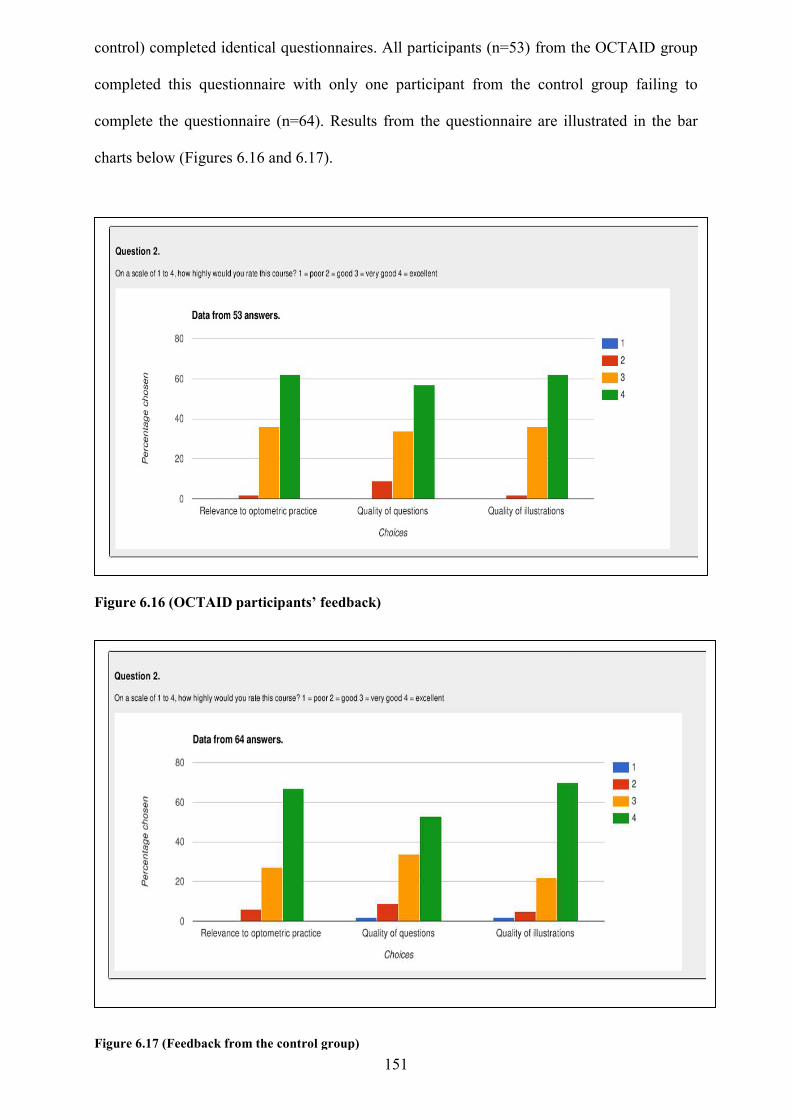
control) completed identical questionnaires.
completed this questionnaire with only one participant from the
complete the questionnaire (n=64). Results from the questionnaire are
charts below (Figures 6.16 and 6
Figure 6.16 (OCTAID participants
Figure 6.17 (Feedback from the control group)
151
control) completed identical questionnaires. All participants (n=53) from the OCTAID group
completed this questionnaire with only one participant from the control group failing to
estionnaire (n=64). Results from the questionnaire are illust
charts below (Figures 6.16 and 6.17).
(OCTAID participants’ feedback)
(Feedback from the control group)
All participants (n=53) from the OCTAID group
control group failing to
illustrated in the bar
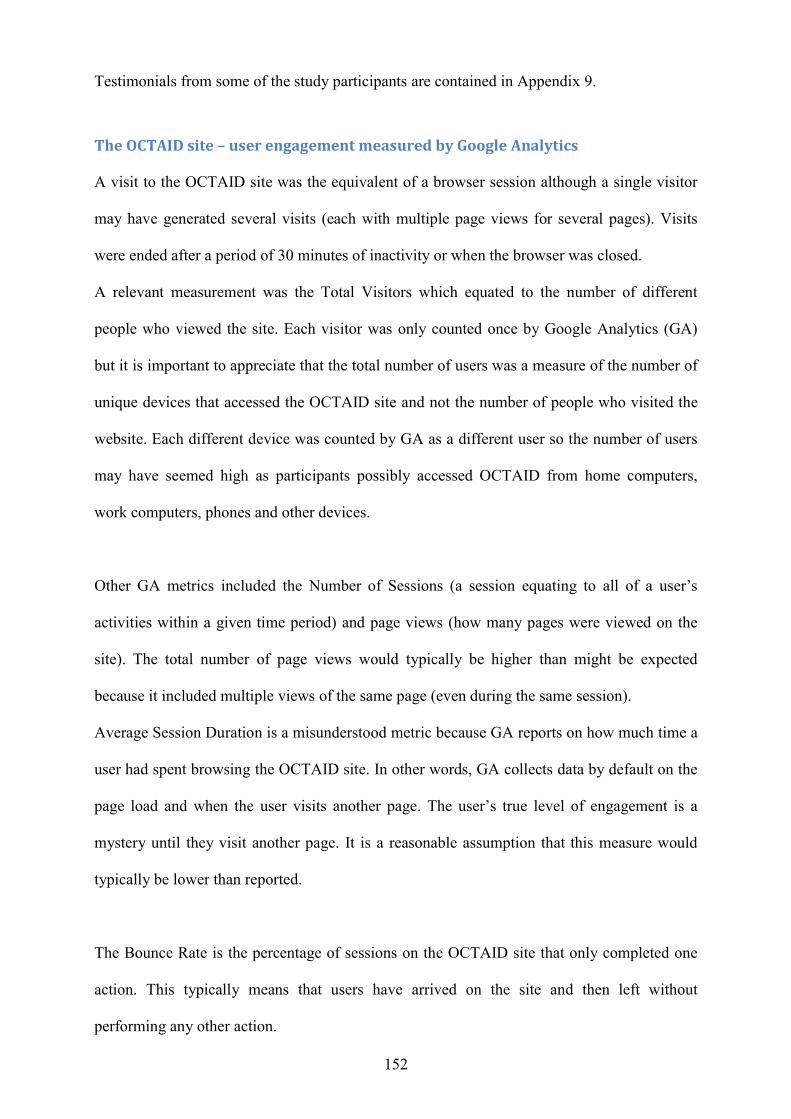
152
Testimonials from some of the study participants are contained in Appendix 9.
The OCTAID site – user engagement measured by Google Analytics A visit to the OCTAID site was the equivalent of a browser session although a single visitor
may have generated several visits (each with multiple page views for several pages). Visits
were ended after a period of 30 minutes of inactivity or when the browser was closed.
A relevant measurement was the Total Visitors which equated to the number of different
people who viewed the site. Each visitor was only counted once by Google Analytics (GA)
but it is important to appreciate that the total number of users was a measure of the number of
unique devices that accessed the OCTAID site and not the number of people who visited the
website. Each different device was counted by GA as a different user so the number of users
may have seemed high as participants possibly accessed OCTAID from home computers,
work computers, phones and other devices.
Other GA metrics included the Number of Sessions (a session equating to all of a user’s
activities within a given time period) and page views (how many pages were viewed on the
site). The total number of page views would typically be higher than might be expected
because it included multiple views of the same page (even during the same session).
Average Session Duration is a misunderstood metric because GA reports on how much time a
user had spent browsing the OCTAID site. In other words, GA collects data by default on the
page load and when the user visits another page. The user’s true level of engagement is a
mystery until they visit another page. It is a reasonable assumption that this measure would
typically be lower than reported.
The Bounce Rate is the percentage of sessions on the OCTAID site that only completed one
action. This typically means that users have arrived on the site and then left without
performing any other action.
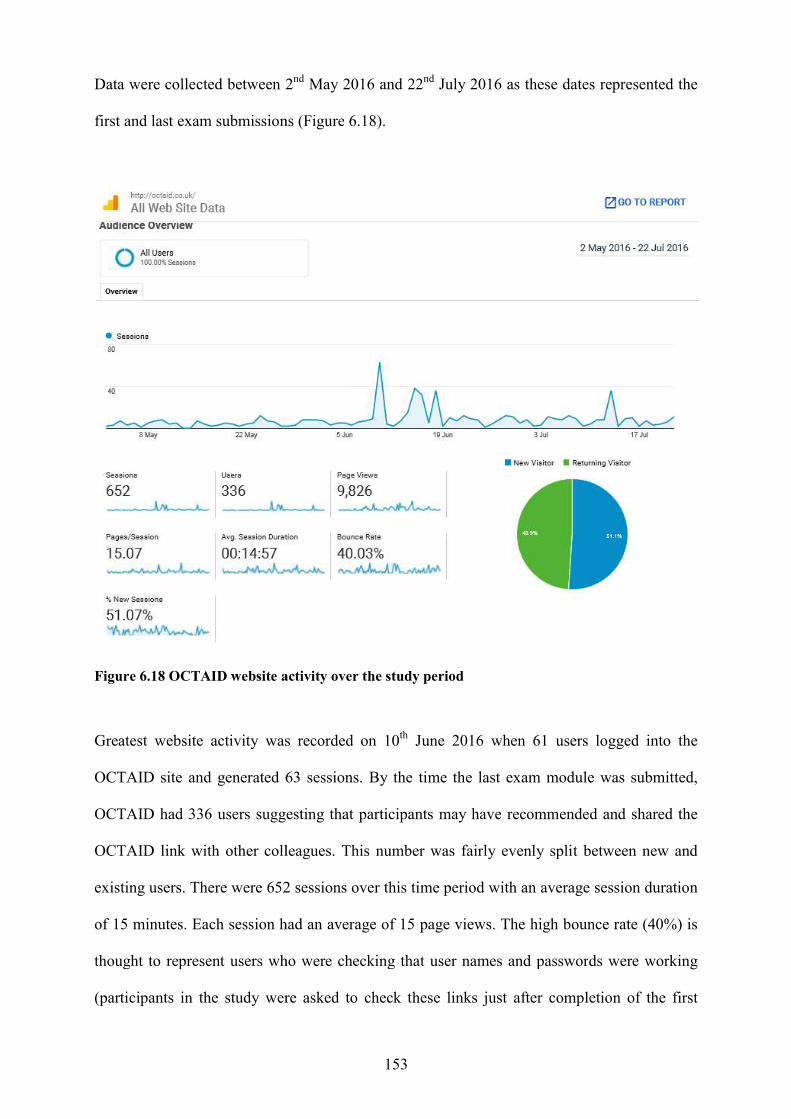
Data were collected between 2
first and last exam submissions (Figure
Figure 6.18 OCTAID website activity over the study period
Greatest website activity was recorded on 10
OCTAID site and generated 63 sessi
OCTAID had 336 users suggesting that participants may have
OCTAID link with other colleagues. This number was fairly evenly split between new and
existing users. There were 652
of 15 minutes. Each session had an average of 15 page views. The high bounce rate (40%) is
thought to represent users who were checking that user names and passwor
(participants in the study were asked to check these links just after completion of the first
153
2nd May 2016 and 22nd July 2016 as these dates represented the
first and last exam submissions (Figure 6.18).
.18 OCTAID website activity over the study period
Greatest website activity was recorded on 10th June 2016 when 61 users logged into the
OCTAID site and generated 63 sessions. By the time the last exam module was submitted,
suggesting that participants may have recommended and shared the
OCTAID link with other colleagues. This number was fairly evenly split between new and
existing users. There were 652 sessions over this time period with an average session duration
of 15 minutes. Each session had an average of 15 page views. The high bounce rate (40%) is
thought to represent users who were checking that user names and passwor
the study were asked to check these links just after completion of the first
ese dates represented the
June 2016 when 61 users logged into the
ons. By the time the last exam module was submitted,
recommended and shared the
OCTAID link with other colleagues. This number was fairly evenly split between new and
average session duration
of 15 minutes. Each session had an average of 15 page views. The high bounce rate (40%) is
thought to represent users who were checking that user names and passwords were working
the study were asked to check these links just after completion of the first
154
exam module (in the case of the OCTAID group) or on completion of the second exam
module (in the case of the control group).
Comparative statistics controlling for confounding variables
The existence of confounding variables in research makes it more difficult to establish a
causal link between intervention and outcome. Therefore, the potential for confounding
should be considered in the design and implementation of a study.
Missing outcome data, due to attrition during the study, raise the possibility that an observed
effect estimate is biased. To facilitate the complete and transparent reporting of the results of
this study (and therefore aid in the critical appraisal and interpretation), the author has
examined data relating to participants who did not complete the study.
Sixteen participants completed the first exam task but did not complete the second exam.
They therefore did not form part of the analysis. Twelve of these participants failed (did not
achieve 60% or more) this exam and this may account for their decision not to proceed to the
next exam module. They may have found the vignette task difficult and time consuming and
were perhaps poorly motivated for the second vignette task. Ten of these participants had
been allocated to the OCTAID study group (there was no re-allocation of participants to
groups once they had been assigned at the beginning of the study).
Twenty six participants failed to register for the study on the LearnUpon platform, failed to
fully enrol, or enrolled but did not start. Seventeen of these participants had been allocated to
the OCTAID study group and 9 had been allocated to the control group. The attrition rate
disproportionately affected the OCTAID group in terms of the earliest stages of the study
(registration and enrolment) but there was no re-allocation of participants to preserve the

155
integrity of the initial process of randomisation. Withdrawals after the first vignette task also
disproportionally affected the OCTAID group. A possible explanation could be that this
group of practitioners had been motivated only by the incentive of access to the OCTAID site
after completion of the first exam task.
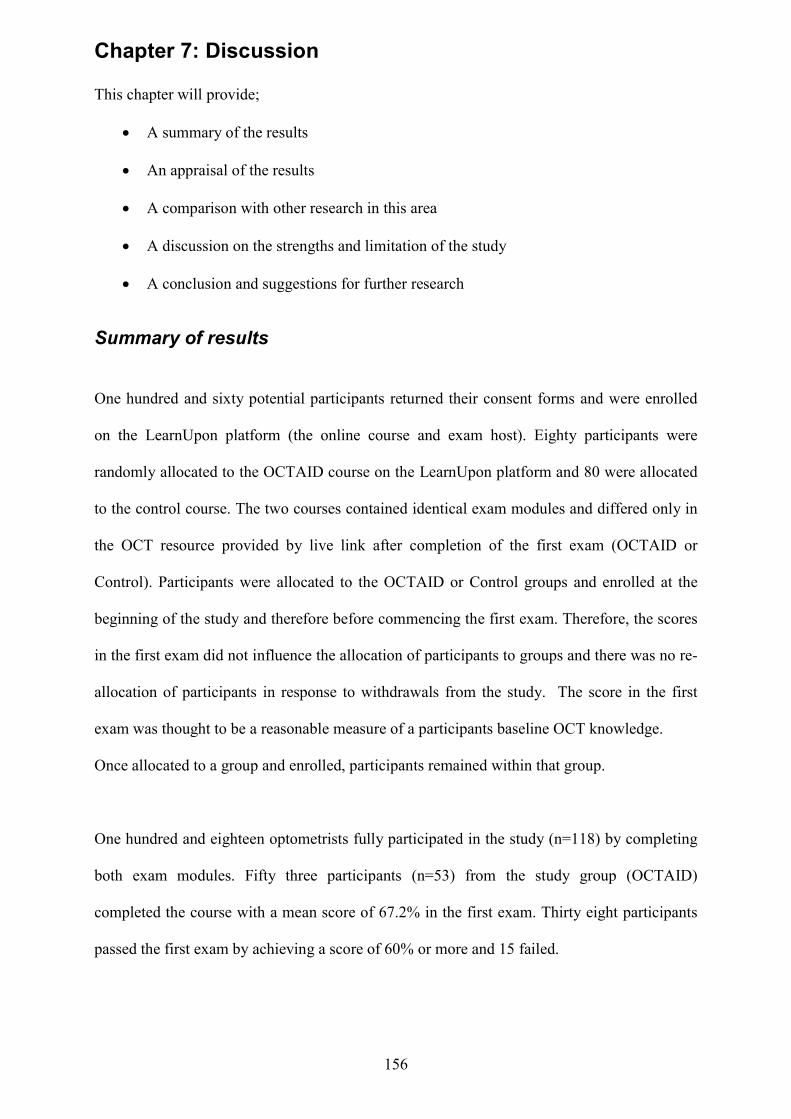
156
Chapter 7: Discussion This chapter will provide;
A summary of the results
An appraisal of the results
A comparison with other research in this area
A discussion on the strengths and limitation of the study
A conclusion and suggestions for further research
Summary of results One hundred and sixty potential participants returned their consent forms and were enrolled
on the LearnUpon platform (the online course and exam host). Eighty participants were
randomly allocated to the OCTAID course on the LearnUpon platform and 80 were allocated
to the control course. The two courses contained identical exam modules and differed only in
the OCT resource provided by live link after completion of the first exam (OCTAID or
Control). Participants were allocated to the OCTAID or Control groups and enrolled at the
beginning of the study and therefore before commencing the first exam. Therefore, the scores
in the first exam did not influence the allocation of participants to groups and there was no re-
allocation of participants in response to withdrawals from the study. The score in the first
exam was thought to be a reasonable measure of a participants baseline OCT knowledge.
Once allocated to a group and enrolled, participants remained within that group.
One hundred and eighteen optometrists fully participated in the study (n=118) by completing
both exam modules. Fifty three participants (n=53) from the study group (OCTAID)
completed the course with a mean score of 67.2% in the first exam. Thirty eight participants
passed the first exam by achieving a score of 60% or more and 15 failed.
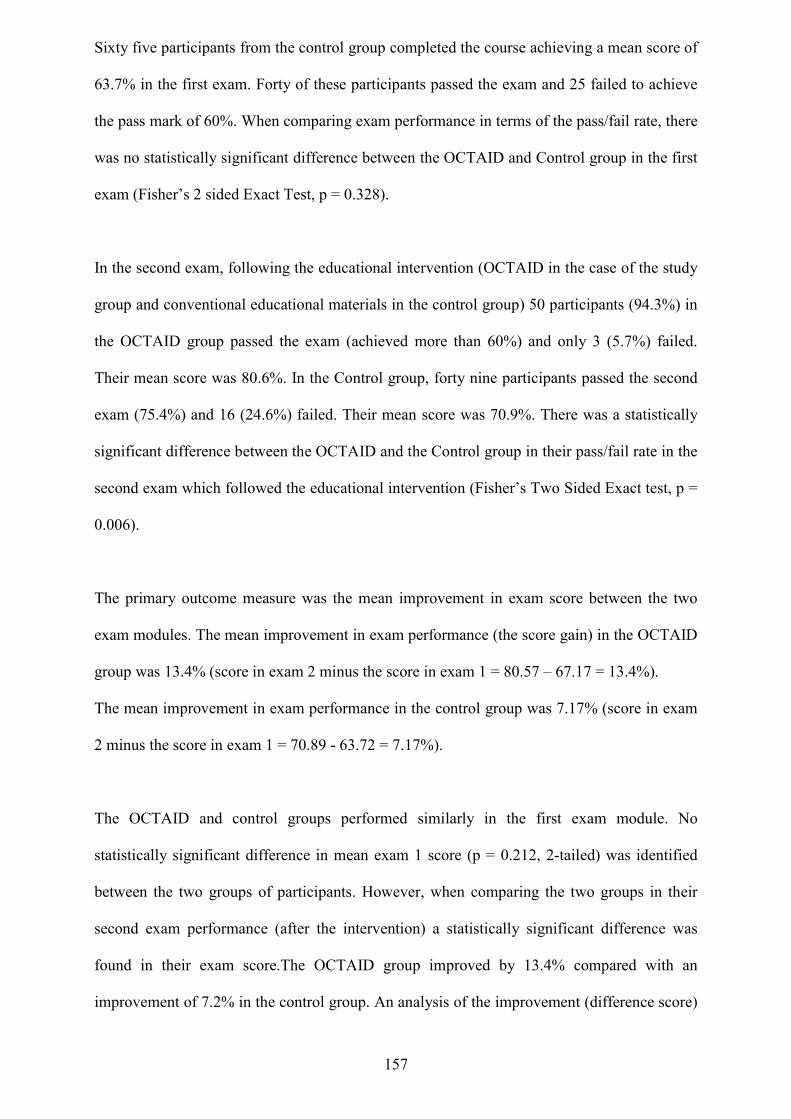
157
Sixty five participants from the control group completed the course achieving a mean score of
63.7% in the first exam. Forty of these participants passed the exam and 25 failed to achieve
the pass mark of 60%. When comparing exam performance in terms of the pass/fail rate, there
was no statistically significant difference between the OCTAID and Control group in the first
exam (Fisher’s 2 sided Exact Test, p = 0.328).
In the second exam, following the educational intervention (OCTAID in the case of the study
group and conventional educational materials in the control group) 50 participants (94.3%) in
the OCTAID group passed the exam (achieved more than 60%) and only 3 (5.7%) failed.
Their mean score was 80.6%. In the Control group, forty nine participants passed the second
exam (75.4%) and 16 (24.6%) failed. Their mean score was 70.9%. There was a statistically
significant difference between the OCTAID and the Control group in their pass/fail rate in the
second exam which followed the educational intervention (Fisher’s Two Sided Exact test, p =
0.006).
The primary outcome measure was the mean improvement in exam score between the two
exam modules. The mean improvement in exam performance (the score gain) in the OCTAID
group was 13.4% (score in exam 2 minus the score in exam 1 = 80.57 – 67.17 = 13.4%).
The mean improvement in exam performance in the control group was 7.17% (score in exam
2 minus the score in exam 1 = 70.89 - 63.72 = 7.17%).
The OCTAID and control groups performed similarly in the first exam module. No
statistically significant difference in mean exam 1 score (p = 0.212, 2-tailed) was identified
between the two groups of participants. However, when comparing the two groups in their
second exam performance (after the intervention) a statistically significant difference was
found in their exam score.The OCTAID group improved by 13.4% compared with an
improvement of 7.2% in the control group. An analysis of the improvement (difference score)
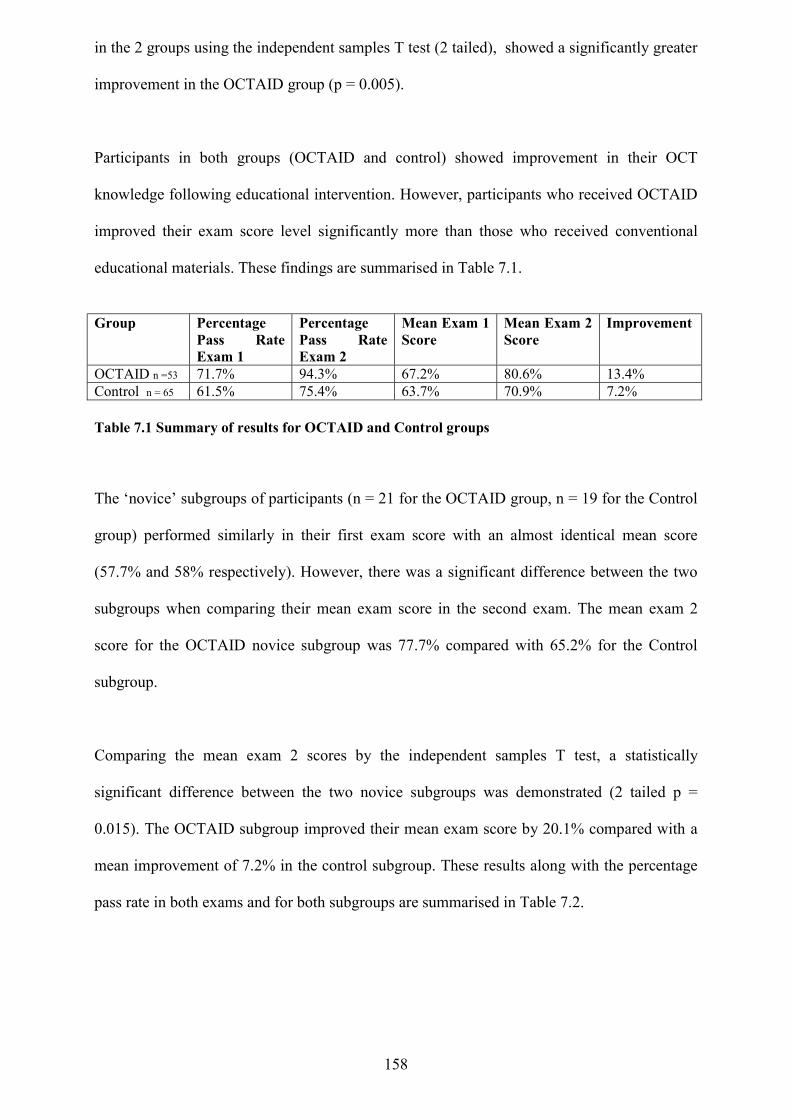
158
in the 2 groups using the independent samples T test (2 tailed), showed a significantly greater
improvement in the OCTAID group (p = 0.005).
Participants in both groups (OCTAID and control) showed improvement in their OCT
knowledge following educational intervention. However, participants who received OCTAID
improved their exam score level significantly more than those who received conventional
educational materials. These findings are summarised in Table 7.1.
Group Percentage
Pass Rate Exam 1
Percentage Pass Rate Exam 2
Mean Exam 1 Score
Mean Exam 2 Score
Improvement
OCTAID n =53 71.7% 94.3% 67.2% 80.6% 13.4% Control n = 65 61.5% 75.4% 63.7% 70.9% 7.2% Table 7.1 Summary of results for OCTAID and Control groups
The ‘novice’ subgroups of participants (n = 21 for the OCTAID group, n = 19 for the Control
group) performed similarly in their first exam score with an almost identical mean score
(57.7% and 58% respectively). However, there was a significant difference between the two
subgroups when comparing their mean exam score in the second exam. The mean exam 2
score for the OCTAID novice subgroup was 77.7% compared with 65.2% for the Control
subgroup.
Comparing the mean exam 2 scores by the independent samples T test, a statistically
significant difference between the two novice subgroups was demonstrated (2 tailed p =
0.015). The OCTAID subgroup improved their mean exam score by 20.1% compared with a
mean improvement of 7.2% in the control subgroup. These results along with the percentage
pass rate in both exams and for both subgroups are summarised in Table 7.2.
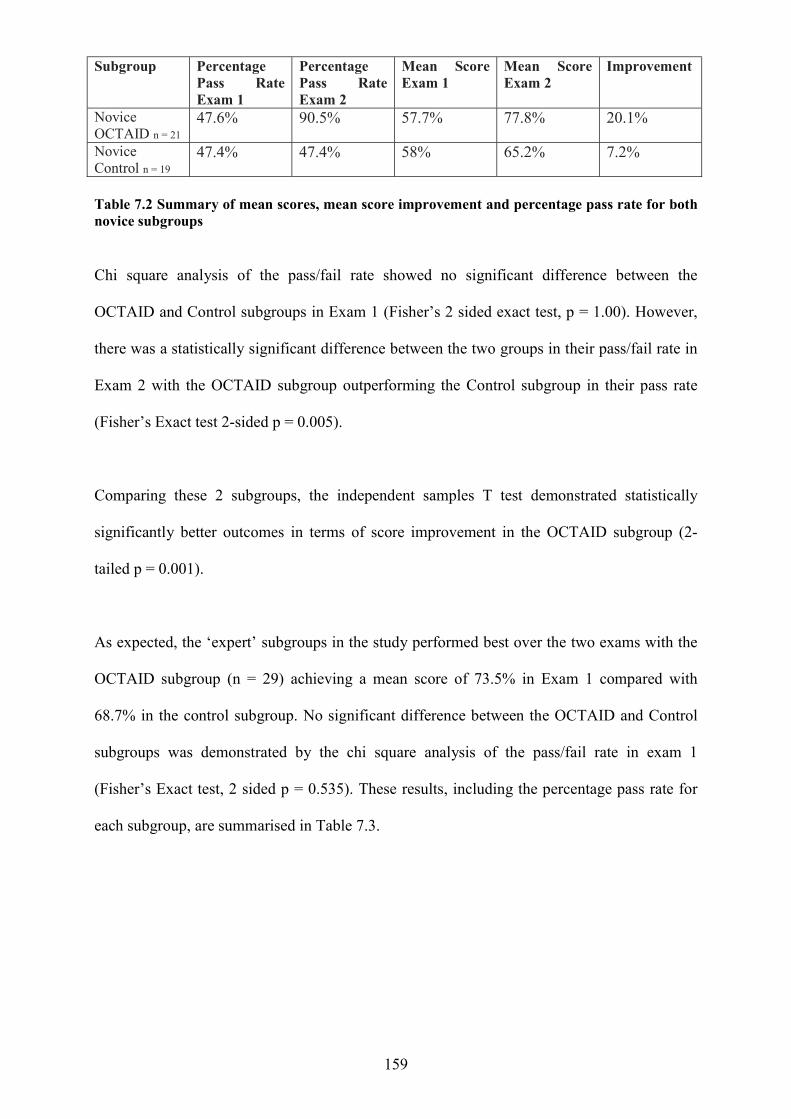
159
Subgroup Percentage
Pass Rate Exam 1
Percentage Pass Rate Exam 2
Mean Score Exam 1
Mean Score Exam 2
Improvement
Novice OCTAID n = 21
47.6% 90.5% 57.7% 77.8% 20.1%
Novice Control n = 19
47.4% 47.4% 58% 65.2% 7.2%
Table 7.2 Summary of mean scores, mean score improvement and percentage pass rate for both novice subgroups
Chi square analysis of the pass/fail rate showed no significant difference between the
OCTAID and Control subgroups in Exam 1 (Fisher’s 2 sided exact test, p = 1.00). However,
there was a statistically significant difference between the two groups in their pass/fail rate in
Exam 2 with the OCTAID subgroup outperforming the Control subgroup in their pass rate
(Fisher’s Exact test 2-sided p = 0.005).
Comparing these 2 subgroups, the independent samples T test demonstrated statistically
significantly better outcomes in terms of score improvement in the OCTAID subgroup (2-
tailed p = 0.001).
As expected, the ‘expert’ subgroups in the study performed best over the two exams with the
OCTAID subgroup (n = 29) achieving a mean score of 73.5% in Exam 1 compared with
68.7% in the control subgroup. No significant difference between the OCTAID and Control
subgroups was demonstrated by the chi square analysis of the pass/fail rate in exam 1
(Fisher’s Exact test, 2 sided p = 0.535). These results, including the percentage pass rate for
each subgroup, are summarised in Table 7.3.
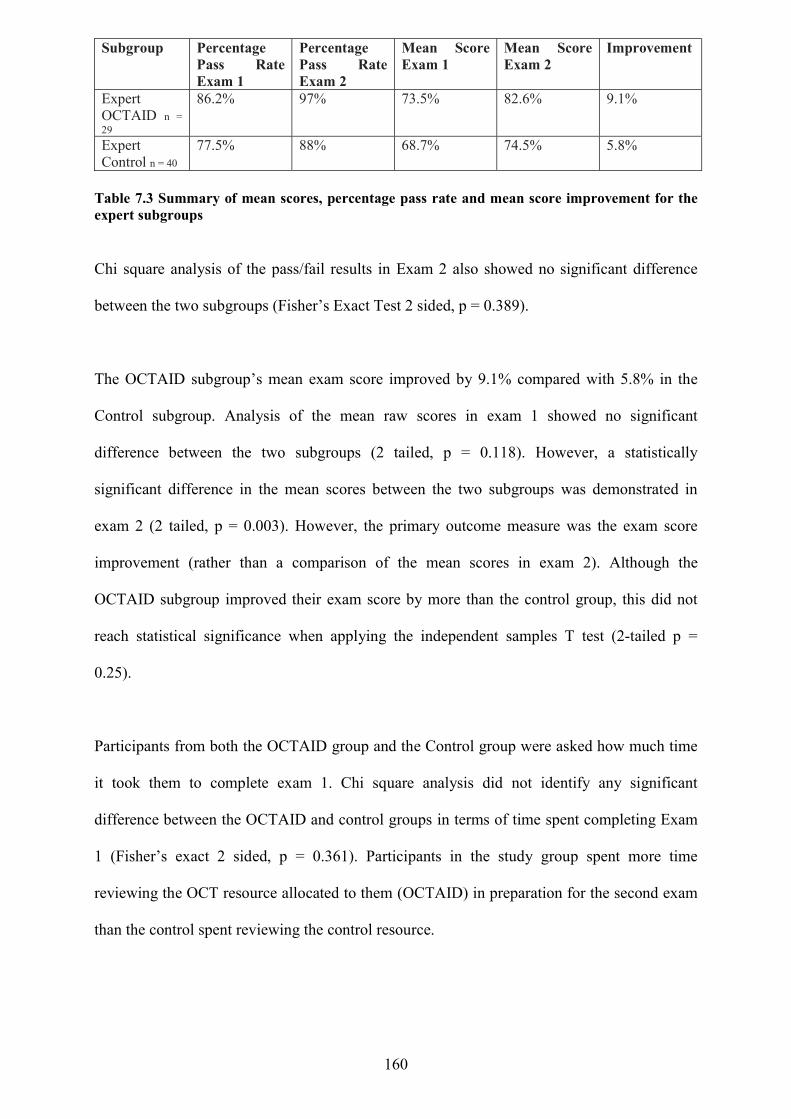
160
Subgroup Percentage Pass Rate Exam 1
Percentage Pass Rate Exam 2
Mean Score Exam 1
Mean Score Exam 2
Improvement
Expert OCTAID n = 29
86.2% 97% 73.5% 82.6% 9.1%
Expert Control n = 40
77.5% 88% 68.7% 74.5% 5.8%
Table 7.3 Summary of mean scores, percentage pass rate and mean score improvement for the expert subgroups
Chi square analysis of the pass/fail results in Exam 2 also showed no significant difference
between the two subgroups (Fisher’s Exact Test 2 sided, p = 0.389).
The OCTAID subgroup’s mean exam score improved by 9.1% compared with 5.8% in the
Control subgroup. Analysis of the mean raw scores in exam 1 showed no significant
difference between the two subgroups (2 tailed, p = 0.118). However, a statistically
significant difference in the mean scores between the two subgroups was demonstrated in
exam 2 (2 tailed, p = 0.003). However, the primary outcome measure was the exam score
improvement (rather than a comparison of the mean scores in exam 2). Although the
OCTAID subgroup improved their exam score by more than the control group, this did not
reach statistical significance when applying the independent samples T test (2-tailed p =
0.25).
Participants from both the OCTAID group and the Control group were asked how much time
it took them to complete exam 1. Chi square analysis did not identify any significant
difference between the OCTAID and control groups in terms of time spent completing Exam
1 (Fisher’s exact 2 sided, p = 0.361). Participants in the study group spent more time
reviewing the OCT resource allocated to them (OCTAID) in preparation for the second exam
than the control spent reviewing the control resource.
161
Appraisal of results If optometrists are to be the focus for community case finding of eye diseases such as AMD
and diabetic retinopathy they will need to have access to the latest technology. This will
improve detection of pathology, monitoring treatment and sharing in patient management.
This will help to create a genuinely functional health-care team approach to eye care in the
current context of a high risk, aging population and a scenario of workforce shortages and
capacity issues within specialist clinics. The arrival of optical coherence tomography and the
proliferation of its use in optometric practice has been a most important event for the
profession of optometry.
As noted in Chapters 1 and 2, community optometrists need help in learning how to interpret
OCT images and implement appropriate management. Advances in ophthalmology and
optometry and changes in eye care delivery have increased demand on academic institutions.
Also, changes in sites of eye care delivery from acute eye care hospitals to community-based
settings (including community optometric practices) for chronic eye care will require
adaptations in educational delivery.
E-learning is employed by medical educators to improve the effectiveness of medical
interventions. Web-based delivery of education (e-learning) has revolutionised the modes of
exchanging information and optometric educators are embracing this trend.
The author has suggested that it would be useful to have a diagnostic guide in the form of a
website which includes a structured and illustrated explanatory algorithm for interpreting
OCT images of retinal diseases (at various stages) commonly presenting to community
optometrists along with patient management decisions. Such a resource (OCTAID) has been
162
designed and its efficacy tested using clinical vignettes. In the present research OCTAID is
compared with conventional OCT educational material in a randomised controlled trial.
OCTAID users showed marked and statistically significant improvement in their vignette
score when compared with the group using conventional OCT resources. This improvement
was greatest in a subgroup of ‘novice’ OCT learners but not proven in a subgroup of
participants who were more experienced. The ‘expert’ groups, as expected, performed well in
both exams and both improved their scores between exams 1 and 2. These subgroups
performed similarly in exam 1 (no significant statistical difference between them). The
OCTAID expert subgroup outperformed the control group in the second exam but it was not
possible to demonstrate a statistically significant difference between these two expert
subgroups in terms of the score improvement from exam 1 to exam 2. There may have been a
‘ceiling effect’ in these generally high-scoring subgroups. The true extent of any difference
between the two subgroups is therefore difficult to establish.
The OCTAID group as a whole generally performed better (in terms of exam score gain) than
the Control group but took more time to complete the second exam task than the control
group in what was an ‘open book’ approach to exam assessment. Whilst it could be argued
that this may have been a factor in improving the exam score of the OCTAID group,
participants from both groups were allowed to take as much time as they wished to complete
the exam task. Participants using the OCTAID site may have felt more confident about
finding answers to vignette questions and therefore spent more time exploring the OCTAID
resource during the exam task. The OCTAID site may also have had novelty value and
participants’ curiosity may have incentivised them to explore the site for solutions to the
vignette task.
Mean exam scores improved between exam 1 and 2 and across both groups (OCTAID and
Control). Participant feedback ranked the study highly in terms of its contribution to OCT
163
education and the learning experience delivered.
Comparison with literature There is a paucity of literature on the accuracy and appropriateness of optometrists’ referrals
to secondary care based on OCT scans. This may reflect the fact that OCT is a relatively new
technology to optometric practice and that cost still represents a significant barrier to its
acceptance on a universal scale.
A study by Muen and Hewick (2011) concluded that optometrists lacked confidence in
recognising the clinical signs and diagnosing wet AMD and that optometrists in the study had
a low threshold for referring any abnormality. They went on to suggest that the accuracy of
referral could possibly be improved by the addition of OCT along the care pathway.
In a study into the optometric referral of suspect ‘wet’ AMD cases into a specialist retinal
clinic, Creer et al. (2010) usefully highlighted some of the conditions which mimic the signs
and symptoms of AMD and for which this mode of referral was not appropriate.
A study by Jaqadish and Dalziel (2015) looked at the discharge outcomes of patients referred
to a specialist clinic from diabetic retinopathy screening (DRS) services in Northland, New
Zealand (n = 98) and found that such a significant proportion of patients were re-referred back
to DRS after OCT at the specialist clinic. A consideration was to include OCT in the
screening pathway.
This doctorate student’s literature review has identified only one study which has evaluated
the effectiveness of optometric OCT users in classifying retinal lesions in patients with known
macular disease. The ECHOES trial had a very specific disease focus and compared the
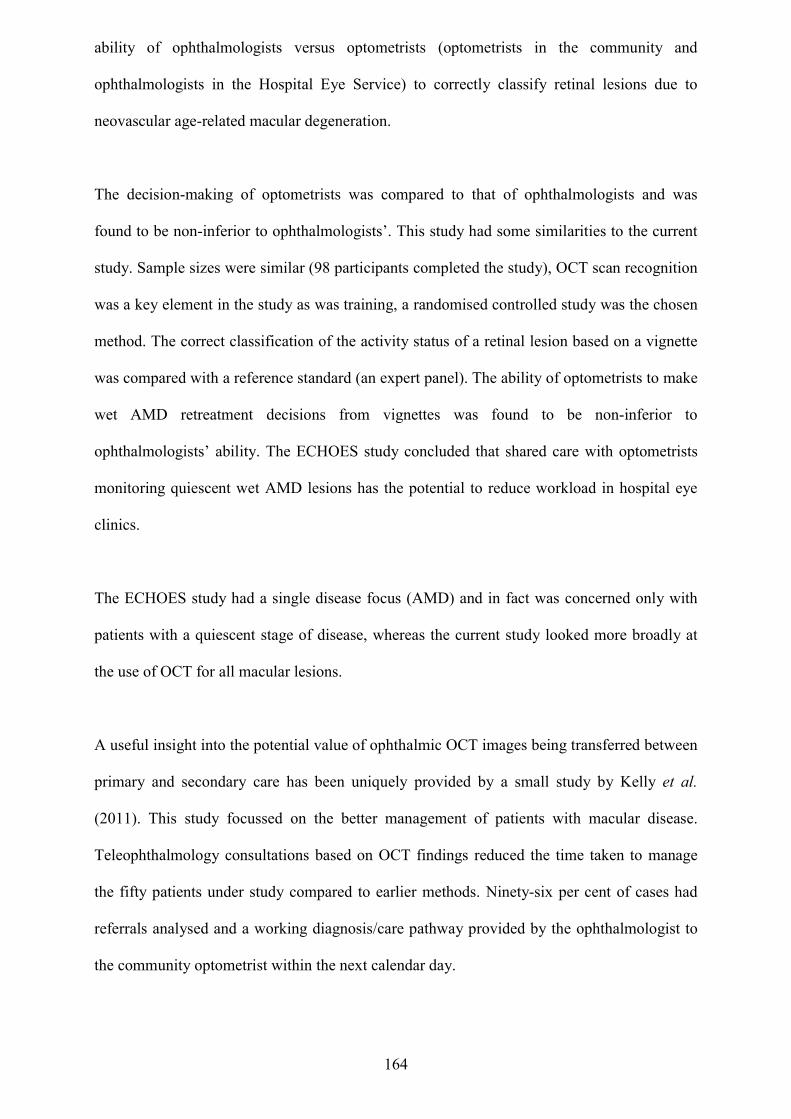
164
ability of ophthalmologists versus optometrists (optometrists in the community and
ophthalmologists in the Hospital Eye Service) to correctly classify retinal lesions due to
neovascular age-related macular degeneration.
The decision-making of optometrists was compared to that of ophthalmologists and was
found to be non-inferior to ophthalmologists’. This study had some similarities to the current
study. Sample sizes were similar (98 participants completed the study), OCT scan recognition
was a key element in the study as was training, a randomised controlled study was the chosen
method. The correct classification of the activity status of a retinal lesion based on a vignette
was compared with a reference standard (an expert panel). The ability of optometrists to make
wet AMD retreatment decisions from vignettes was found to be non-inferior to
ophthalmologists’ ability. The ECHOES study concluded that shared care with optometrists
monitoring quiescent wet AMD lesions has the potential to reduce workload in hospital eye
clinics.
The ECHOES study had a single disease focus (AMD) and in fact was concerned only with
patients with a quiescent stage of disease, whereas the current study looked more broadly at
the use of OCT for all macular lesions.
A useful insight into the potential value of ophthalmic OCT images being transferred between
primary and secondary care has been uniquely provided by a small study by Kelly et al.
(2011). This study focussed on the better management of patients with macular disease.
Teleophthalmology consultations based on OCT findings reduced the time taken to manage
the fifty patients under study compared to earlier methods. Ninety-six per cent of cases had
referrals analysed and a working diagnosis/care pathway provided by the ophthalmologist to
the community optometrist within the next calendar day.
165
Strengths and limitations The randomised controlled trial is a scientifically rigorous methodology for evaluating the
efficacy of an educational intervention but its success is contingent upon adequate sample
size, adherence to study protocols and retention of research participants. This study attracted
considerable interest from optometrist OCT users and those thinking of introducing this
imaging technology into their eye examination routine. The study had a good sample size (n =
118) and strategies for maintaining research participation were very effective. There was an
excellent sample retention rate (74%). The study was the subject of favourable appraisal by
OCT expert panel members, pilot participants and main study participants. Vignette scores
were reasonable with a balanced spread of results indicating that the exam questions had been
pitched at the correct level of difficulty. The statistical test of item analysis, where the quality
of individual questions are assessed by comparing participants’ question responses to their
total test scores, may provide additional insight if the examinations are used again in future
educational events.
The OCTAID site, all its tabs and links worked efficiently with no negative feedback. The
online exams were conducted and processed without difficulty. Overall, all IT utilities proved
to be robust and efficient. There were several potential limitations of this study which will
now be discussed.
Factors affecting recruitment to the study
Recruiting the required number of participants is vital to the success of any study. The lead
researcher and supervisors spent some time identifying appropriate sources for recruitment
and an early aim of this study was to identify the factors the researchers perceived as
influential in the recruitment of participants to this OCT-focussed research. There was
consensus among the research team that many individuals who might be willing to take part
166
in OCT-focussed research would value the potential benefits of participation, namely the
opportunity to access additional OCT resources.
Infrastructure, nature of the research, recruiter characteristics and participant characteristics
are all believed to influence the success of recruitment to clinically focused research
(Newington and Metcalfe, 2014). Newington and Metcalfe also suggest that a recruiter’s
professional role, personality and knowledge of the research project are influential factors in
the recruitment process.
Despite having had a good sample size and excellent sample retention, attrition through
failure to register, enrol, start or complete the study disproportionately affected the OCTAID
study group. A balance in numbers between the two study groups could have been better
preserved if there had been a re-allocation of participants to groups in response to early
withdrawals and non-starters. However, this would have interfered with the integrity of the
original process of randomisation and made the study design less robust.
The position of the researcher
The author (and recruiter) is a community optometrist with special interest in medical retina
and optical coherence tomography. The author is a known contributor to the Optix OCT
forum which was a key source of recruitment to this study. This may have had some positive
and also negative effects. By gaining some credibility with the forum, the author was able to
legitimise the research study. However, some forum members may have been wary of their
exam performance being known to a forum contributor and caused them to perform to a
higher than normal standard in assessment. On the other hand some forum members may have
been reticent to participate because their exam performance would have been known to a
fellow forum subscriber.
167
The position of the participants Researchers evaluate evidence to determine whether an intervention is directly responsible for
an outcome. The resulting studies follow a hierarchy in terms of the quality of evidence that
they can produce. Randomised double masked controlled studies are considered a reference or
“gold” standard in terms of the most convincing research design to determine whether an
intervention is directly responsible for an outcome (Sibbald and Roland, 1998).
In the current study, randomisation has aided the efforts to eliminate confounding by any
baseline variables. Although masking of participants for the entire duration of the study would
have gone some way towards eliminating confounding by co-interventions, it was not thought
to be helpful or practical in the context of this study design.
A simple random sampling technique was used in the current study. A more systematic or
stratified sampling technique may have helped to ensure that the sample included all
representative groups of practitioners but given the fact that there are a limited number of
practitioners using OCT, a sampling technique which maximised the number of participants
was thought to be a priority.
The author needed to communicate with participants (by email) at numerous stages in the
study for IT support related to the online exams and links to the educational interventions
used for the study. Participants’ progress was monitored as they made their way through the
various course modules to (1) allocate CET points on completion of an exam module in a
timely fashion, (2) identify participants who appeared to have forgotten to start or progress
through the course (forgetting login and password details was a common problem), (3)
identify participants who were unsuccessful in achieving a pass mark in the first exam
module. It was thought that these participants might have lacked the motivation to attempt the
second exam and were therefore reassured that their exam result remained confidential and
that the purpose of the first exam was a “knowledge checker” to test their baseline knowledge.
168
They were also reminded that two further exam attempts were permissible after the study was
completed.
This study compared two educational interventions and it would have been obvious to
participants which of the two interventions was new and which one was conventional. As an
incentive to participate, all participants to the study were, at the outset, also offered free
access to the OCTAID site after completion of the study and invited to join a new
professional community which would help to develop the OCTAID resource further.
Participants made a self-declaration about their previous level of OCT experience prior to
enrolment in the study. It is possible that relatively experienced OCT users might
‘downgrade’ their level of experience when they know they are about to be assessed. There is
always a difficulty in defining experience especially in terms of the use of new technology
because optometrists are unlikely to have continually assessed and evaluated their level of
experience. In asking participants about their previous level of OCT experience the question
was framed in terms of how many OCT scans they would assess in a normal month as
opposed to asking them if they were expert, novice or somewhere in between.
It could be hypothesised that studies like the present one are more likely to attract and recruit
optometrists who are confident in OCT scan diagnosis and patient management decisions.
Despite the assurances of confidentiality provided to all potential participants, those who were
perhaps less confident may not have wanted gaps in their knowledge to be exposed.
Study participation was open to all optometrists regardless of their OCT experience.
Participants were simply asked how many OCT scans they would have assessed in a typical
month. This may have included those who had no access to OCT in practice but intended to
introduce this technology to their practice in the near future. Their experience may therefore
have been limited to participation in training events, demonstrations of OCT by suppliers or
reading of OCT literature. This group of participants was therefore grouped with those who
169
had some access to OCT but perhaps only part-time or OCT may have been introduced to
their practice very recently (less than 3 months). This was clearly a heterogenous group.
The exam modules were not timed so it could be argued that participants’ scores may have
been influenced by the amount of time spent on the exams. Although the time spent on the
exam modules was not directly measured for each individual participant, a post-exam
feedback questionnaire (at the end of each exam) did ask participants how many minutes they
required to complete the exam. These answers may not have been an accurate reflection on
how much time each participant devoted to the exam modules. Similarly participants were
asked how much time they spent studying the OCT resources (OCTAID and control) in
preparation for and during the exams. Their responses in the post exam feedback may not
have accurately reflected the extent to which the resources were used. However, some data
were collected on the overall use of the OCTAID site using Google Analytics software. It was
not possible to collate such information on the use of the control intervention.
Participants’ performance in the vignette situation may not accurately reflect their
performance under clinical conditions in optometric practice.
The Control Intervention When researching the answers to questions in the exam modules, participants in both the
study group and the control group were permitted to use whatever resources they would
normally refer to when making a diagnostic or patient management decision based on an OCT
scan in their everyday practice. In addition to this the study group were provided with a link
to the OCTAID website and the control group were provided with a link to a conventional
OCT resource. Whilst it could be argued that the control intervention provided a less
comprehensive knowledge of OCT than the OCTAID site, the study was testing the efficacy
of the OCTAID site compared with conventional OCT resources of which the control
170
intervention was only one. We could not however be certain that the study and control groups
were accessing resources of equivalent content.
The Exam Modules Each exam module in the main study contained 32 questions. Twenty four of these questions
were based on OCT scan recognition and patient management decisions based on these scans.
Eight of the questions were based on more general OCT knowledge. This was more than
would normally be required to qualify for 2 CET points in other optometric training events.
Under GOC guidelines visual recognition tests earning a candidate 1 CET point and involving
1 hour of learning would typically involve 4 ocular image slides with 3 matching questions
for each image (12 in total). The two exam modules, along with the educational interventions
provided for study and reference, presented a high level of difficulty in terms of time and
commitment and this may have accounted for the fact that some participants did not start or
complete the study. The exam format (vignette) did not allow a participant to return to a
question, once answered and unanswered questions were marked as incorrect. This format
would have been unfamiliar to many participants who would normally be accustomed to
being able to review their answers before submission in other CET events.
Another important potential limitation was that optometrists’ self-reported practice in a
vignette setting may not predict actual practice. A large scale prospective study of optometry
referrals based on OCT images to the hospital eye service may provide more insight into
optometrists’ OCT knowledge in a variety of clinical settings.
The vignette exam modules were not timed although participants made a self-declaration of
how much time they spent on each exam and this was used as a secondary outcome measure.
The use of self-report data is widespread across diverse fields of research but open to
criticism. It is difficult to determine the extent of agreement between subjective (a self-report
171
questionnaire) and objective (directly measured) measurements of time spent on an exam task.
It is therefore possible that correlations between self-report and direct measures may have
been low. The costs and benefits of direct measurement need to be considered in any study to
determine if the added resources required justify the possible increase in precision of the
results.
The OCTAID site The OCTAID site was designed by the author who also designed the clinical vignette
assessments. Several steps were taken to avoid the possibility of exam questions being biased
to favour either OCT educational intervention and this has already been discussed in the
chapter on methods.
The OCTAID site was designed and constructed by the author, based (almost entirely) on his
own personal archive of OCT scans and retinal images. These images may not have illustrated
retinal disease to best effect and therefore may not have been the best examples to use for the
purpose of OCT education. OCT images from this personal archive may not have been
sufficient in number to fully illustrate a disease stage and variability. Not all images in this
personal archive were eligible to be used in the OCTAID site as a definitive diagnosis (a
comprehensive report from the hospital ophthalmology service) was not always available.
This was often because of a lack of feedback from the hospital eye service to which the
patient had been referred.
However, the suitability of images was validated by supervisors and, ultimately, by the expert
panel. One member of the expert panel, a consultant ophthalmologist commented that there
was no such thing as a textbook example because individual variation and the stage of disease
at presentation will always challenge clinicians at all levels of expertise. It was therefore
thought that multiple images demonstrating the entire spectrum of disease in terms of stage
172
and variability may be of more value educationally than a ‘perfect text book example’. In
future versions of the OCTAID site, it is thought that this problem could be addressed by
asking study participants to provide scans from their own archives after the completion of the
study thus empowering participants to build their own diagnostic guide.
Limited resources exist on optometric management of OCT-detectable lesions in optical
practice and this was a limiting factor in formulating patient management decisions on the
OCTAID website. The expert panel input proved to be an invaluable resource for informing
these decisions.
Confounding variables This study was perhaps limited by the inability to control some potentially confounding
factors. There may have been a novelty effect in the case of the OCTAID website where the
study group would have been aware of the novel nature of this educational intervention.
Consequently, the author could not be certain of the factors of most importance and was also
unable to define the element that actually led to improved outcomes. This could have been an
inherent quality of the educational methodology, the manner in which the content was
delivered or related to the interactivity with the computer interface.
Double blinding would have gone some way in ensuring that the preconceived views of
participants and researchers could not systematically bias the assessment of outcomes but this
was not practical in the context of the current study (as already discussed in the Methods
chapter).
173
Conclusions Today’s optometrists are increasing their utilization of non-invasive technologies like OCT to
aid in the observation of retinal anatomy and physiology in health and disease. The world of
diagnostic testing is highly dynamic with new tests being developed at a rapid rate and the
technology of existing tests is the subject of continuous improvement. Optical coherence
tomography is fast-becoming an invaluable tool in optometric practice where it is applied in
the diagnosis and management of patients with a variety of ocular conditions, both congenital
and acquired.
OCT has made substantial technological improvements over the years, removing many of the
barriers to its application in evaluation of retinal anatomy. As OCT technologies and
techniques continue to evolve, the challenge of keeping pace with innovation could be a
barrier to the delivery of appropriate care to patients. It is therefore important to design
accessible resources to bridge this gap.
OCT is a relatively new imaging technology and so the diagnostic accuracy of optometrists
using OCT to discriminate patients with referable retinal conditions has not yet been fully
established. The opportunistic finding of retinal lesions and subsequent patient management
decisions remains a difficult task for optometrists despite the rapid advancement in the
development of non-invasive imaging modalities such as OCT. Correct image interpretation
depends on some degree of understanding of the theoretical background of image generation
along with an awareness of the challenge presented by machine artefact. Optometrists using
OCT will require a detailed knowledge of retinal disease as represented by OCT and an
appreciation of normal variation. Incidental findings (especially findings of only minor
clinical significance) will require appropriate management or referral decisions which are
cognisant of the potential waste generated by unnecessary visits to ophthalmic services.
174
A rigorous evaluation process of the diagnostic accuracy of optometrists using OCT in every
day practice would go some way towards defining the causality and exploring strategies to
minimise diagnostic error in optometry. Studies to determine the diagnostic accuracy of
optometrists who use OCT in practice would form a vital part of the evaluation process. The
introduction of a resource such as OCTAID into optometric practice has the potential to
reduce the number of unwanted clinical consequences relating to diagnostic error and also
limit the health care costs relating to misdiagnosis and suboptimal patient management. There
is a need for the development of standards and protocols that will serve to improve clinical
application and interpretation. OCT needs to work synergistically with current models of eye
care and fit within the ecosystem of innovation, clinical excellence, competition and
practitioner education.
This thesis describes a method for improving the accuracy of OCT image-based diagnosis and
patient management by providing optometrists with an online guide in algorithmic form. The
data presented indicate benefits from this diagnostic tool, OCTAID, in improving the
combined skill of OCT scan recognition and patient management. The potential exists for
OCTAID to be used as a training tool for optometrists. There are potentially greater
improvements in diagnostic accuracy that can be realised through the future development of
the OCTAID site with the feedback and archive images of multiple users
These results illustrate the importance of designing accessible diagnostic aids to complement
new and improving retinal imaging technologies whilst improving the understanding of
retinal disease mechanisms. It is important to consider the applicability of the findings of this
study to clinical practice and policy and when interpreting the results of this study, one should
consider the diagnosis and treatment pathway to which the data could realistically be applied.
The ultimate clinical value of using a new diagnostic tool depends on whether it improves
patient outcomes beyond the outcomes achieved using older, more established OCT
resources.
175
A failure to standardise the science of OCT and retinal anatomy in health and disease could
undermine its value.
Recommendations for further work
Diagnostic reasoning Whilst it might seem reasonable to assume that the clinical reasoning processes engaged in by
practising optometrists are similar to those used by other health professions, there is little
evidence in this domain (Faucher et al 2012). It also seems possible that clinical reasoning
processes might be subjected to the unique influence of conditions within the optometric
profession including the current model of eyecare, and the commercial pressures relating to
this.
Further research on the diagnostic accuracy of optometrists using OCT imaging technology
and the factors influencing its use may help to confirm, complement or challenge our
findings.
The success of OCTAID may lie in aspects of its delivery rather than its content, the web
being the delivery medium of the educational content for the OCTAID group. The dominance
of the internet in everyday life has revolutionised modes of exchanging information.
Participants who study content via a web based application may generally perform better than
those who study identical content using more conventional (paper) resources. This requires
further investigation across a range of subjects.
Further development of OCTAID – Collaboration as a process of shared creation All participants in this study (including those in the control group) were provided free access
to the OCTAID site after the study was completed. Furthermore, they will be invited to assist
in developing the OCTAID site by providing feedback and supplying suitable OCT scans

176
from their personal archives which might better illustrate a broader range of retinal disease in
terms of phenotype and disease stage. The author believes this collaborative approach to
building a diagnostic guide to be unique.
Modern learning requires learners to be critical and independent thinkers but learners are also
required to be collaborative and interdependent problem solvers. A clear component of
collaboration is the ongoing interactions and communications that take place as learners work
together toward a common goal. Educationalists often suggest that the provision of interactive
learning opportunities is best practice because shared learning provides learners with an
opportunity to get involved in discussion and develop the skills of critical thinking and
reflection (Taylor and Parsons, 2011).
Diagnostic reasoning is a complex process and often takes place under conditions of
uncertainty and limited time. Diagnostic errors are not uncommon and in considering how
they might be avoided, Ely et al.(2011) observed that high-risk, high-reliability professionals
such as airline pilots and nuclear plant operators have reduced errors by using checklists and
that recently checklists have gained acceptance in medical settings and are now commonly
proposed tools to reduce diagnostic error (Sibbald et al. 2013). Ely et al. proposed extending
the checklist concept to diagnosis and describes three types of checklist:
A general checklist that prompts physicians to optimise their cognitive approach. This
could form the basis of the algorithmic approach to OCTAID
A differential diagnosis checklist to help physicians avoid a common cause of
diagnostic error - failure to consider the correct diagnosis as a possibility. OCTAID
includes a differential diagnosis approach which may be expanded and refined.
A checklist of common pitfalls

177
Ely et al. state that such checklists were developed informally and to date, have not been
subjected to rigorous evaluation but suggest that because of the complexity of diagnostic
reasoning, checklists might provide an alternative to reliance on intuition and memory in
clinical problem solving. The potential exists for this approach to diagnostic reasoning to be
applied to OCT scan interpretation and the OCTAID site is ideally designed to deliver such a
study.
It is hoped that OCTAID will become a learner-centred model of OCT education, thus
providing an opportunity for optometrists to take responsibility for their own learning within a
unique professional community.
178
Appendices
Appendix 1 – Email to potential recruits who subscribe to online optometry forums
Dear forum members,
We were wondering if members of this excellent forum would be interested in participating in
an OCT study for which we are currently recruiting. We would particularly welcome
participation from practitioners with little or no OCT experience. Some forum subscribers
may be thinking of introducing OCT into their practice in near future and may find this OCT
focussed CET event very useful. Some of you may have already been contacted via other
forums and indeed some have already agreed to participate. Thank you all for this.
The online exam host has limited capacity (200 participants max) and places on the study will
be allocated on a first come first served basis. Further information about the study is attached.
If you are interested, the lead researcher may be contacted (off-line please) at:
Best wishes,
Paul Grace, Bruce Evans, David Edgar
An updated summary of the research is attached:
179
Appendix 2 – summary of research (email attachment)
Summary of research
Limited guidance exists for optometrists using OCT for diagnostic and referral decisions. The
novel nature of OCT images presents considerable challenges for community optometrists in
interpreting OCT images to reach an accurate diagnosis of macular lesions and so make
appropriate referrals. We hypothesise that it would be useful to have a diagnostic guide in the
form of a website which would show OCT images of retinal diseases (at various stages)
commonly presenting to community optometrists along with patient management decisions.
The first goal of the research was to develop this online diagnostic algorithm (OCTAID) for
the diagnosis of central retinal lesions using OCT and this is now complete. A second goal of
the research is to evaluate the effectiveness of OCTAID in improving optometric diagnosis
using OCT. We have done this by designing an online assessment. The questions are in
multiple choice format so it should be possible to complete the task fairly quickly. Most of the
questions will take the form of ‘visual recognition and investigation of clinical signs’
(VRICS) based on OCT images but some questions will test your broader OCT knowledge.
The questions cover a range of common retinal conditions which participants are likely to
encounter in optometric practice. We are comparing two groups of practitioners who will
undergo an online assessment of their diagnostic and management skills based on OCT
images both before and after one of two educational interventions. OCTAID will be randomly
allocated to one group with the control group receiving a control intervention of standard
OCT training materials.
We may ask about participants' existing knowledge and experience of OCT so that we can
control for their level of experience. Participation will be open to any optometrist with an
interest in OCT, whether or not they subscribe to the Optix OCT forum.
This study has been approved as a CET event by the General Optical Council. A total of 4
points are available for successful completion of both MCQ tests.
Participants (both in the study group and control group) who complete both legs of the study
will have free access to the OCTAID website after the study is completed. It may also be
useful (with consensus opinion) for subscribers to donate interesting, anonymised scans from
their own personal archive in order to further develop the OCTAID site. For example, a 'scan
of the month' could be created for OCT scans which have caused particular challenge or
debate. This could be easily incorporated in a website. We believe that this novel and
collaborative approach to building a diagnostic guide may prove useful to OCT practitioners.
We hope you will find this interesting. Paul Grace, Dave Edgar, Bruce Evans.
Appendix 3 – study promotional l
180
study promotional leaflet (email attachment)
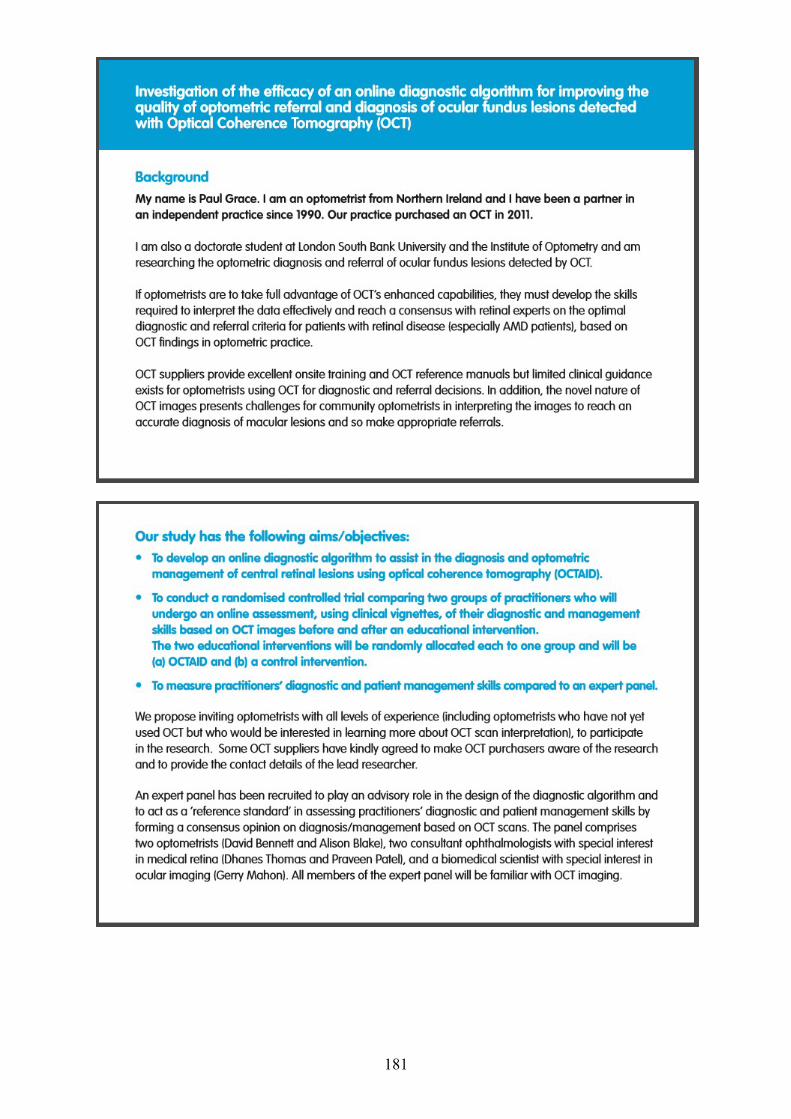
181

182
183
Appendix 4 – Participant information sheet
Participant information sheet
Investigation of the efficacy of an online diagnostic algorithm for improving the optometric referral and diagnosis of ocular fundus lesions detected with Optical Coherence Tomography You are being invited to take part in a research study. Before you decide whether or not to take part, it is important for you to understand why the research is being done and what it will involve. Please take time to read the following information carefully and discuss it with others if you wish. Feel free to ask me (the lead researcher) if there is anything that is not clear or if you would like more information. Take time to decide whether or not you wish to take part. Thank you for reading this. What is the purpose of the study? The new imaging modality of optical coherence tomography (OCT) is now available to optometrists. However, if optometrists are to take full advantage of OCT’s enhanced capabilities, they must develop the skill to interpret the data effectively. Although manufacturers provide helpful guidance for new users, interpreting OCT images presents challenges for practitioners particularly when making decisions around diagnosis and management of macular lesions. What is the aim of the study? The aim of the study is to test the usefulness of an online algorithm which we have developed to assist in the interpretation of OCT images. To test the algorithm we will conduct a randomised controlled trial comparing two groups of optometrists who will undergo an online assessment, using clinical vignettes (“virtual” patients), of their diagnostic skills based on OCT images of central retinal lesions. Some questions will also test more general OCT knowledge. Each group of practitioners will take the assessment both before and after receiving training (in technical terms an “educational intervention”) in interpretation of OCT images. There will be two different educational interventions which will be randomly allocated, each to one group. What will happen if I take part? If you decide to participate, simply sign and return the consent form enclosed in the pre-paid addressed envelope provided. We will contact you again (by email) to provide you with further information on how to participate in the research and we will only contact you if it is necessary. You will be asked on the consent form if you prefer to be contacted by email, phone or letter. You are welcome to contact the lead researcher at any time if you have any questions. He can be contacted by email, telephone or at the postal address provided on this form. The online assessments will mainly involve a series of multiple choice questions (MCQs) based on approximately 25 OCT images (in total for both exams). Some MCQs will test more general OCT knowledge. The assessment will follow a similar pattern to the Visual Recognition and Interpretation of Clinical Signs (VRICS)

184
assessments which will be familiar to many optometrists as an approved GOC modality for the delivery of Continuing Education and Training (CET). After the assessment you will be randomly allocated to one of two possible educational interventions which are designed to improve skills in OCT interpretation. The second assessment which will be in a similar format to the first will follow about 4 weeks later. All information will remain confidential and will only be used by the researchers. Four CET points are available for successful completion of both assessments and these points will be applied to the new 2016-2018 CET cycle. You are not required to conduct OCT scans for the purpose of this study and your patients are not part of this research. We are not asking you to change anything about when and how you use OCT in your day-to-day practice. Why have I been chosen? This study is aimed at all practitioners who have an interest in OCT. We wish to include those who regularly use OCT in daily practice and those who have some limited experience but perhaps feel the need for some guidance on OCT image interpretation and referral decision-making. We also welcome participation from practitioners who are not currently using OCT in practice but who are perhaps planning to use OCT in the near future and would like an introduction to OCT scan interpretation. You will be asked about your previous level of OCT knowledge. Will I benefit from participating in the study? We hope that all participants will benefit from the material presented in the online algorithm. If you have been allocated to the control group, we will be sending you the online algorithm after you complete the second assessment.
All data collected during the study will be anonymous and confidential. The results of the research may be presented at conferences or in research reports. However you will not be individually identified. All participants will be allocated a unique identifier on recruitment which protects their anonymity. They will only be referred to using this identifier throughout the study and in any subsequent study or publication.
Do I have to take part? Your participation in this research is entirely voluntary. It is completely up to you to decide whether or not to take part. If you do decide to take part you will be given this information sheet to keep and be asked to sign a consent form. If you decide to take part you are still free to withdraw at any time and without giving a reason. Confidentiality All data will be held confidentially on an encrypted hard drive for 12 months after the study is completed and will then be securely erased. No individual will be identified in any subsequent thesis, reports or publications. About the researcher My name is Paul Grace and I am an optometrist and a Professional Doctorate student conducting research based at London South Bank University and the Institute of Optometry. I hope that by participating in this research you will obtain useful insight into the interpretation of OCT images of central retinal lesions. The researcher has no financial interest in this study and the educational intervention will be made freely

185
available to all participants who complete the study. This study is self-funded and is scheduled to be published in 2016. This study has been reviewed by the Institute of Optometry Research Ethics Committee and the Research Ethics Committee at London South Bank University. The study is supervised by Prof. Bruce Evans and Prof. David Edgar. Contact for further information
Paul Grace (lead researcher) 30 Bristow Park Belfast BT96TH Tel. 02838327437 Mob. 07885117997 Email. [email protected]
If you have any issue that you are unable to resolve with the research team you can contact the Chair of the University Research Ethics Committee at [email protected].

186
Appendix 5 – Participant consent form CONSENT FORM Title of Investigation:
Investigation of the efficacy of an online diagnostic algorithm for improving the optometric referral and diagnosis of ocular fundus lesions detected with Optical Coherence Tomography I have read the attached information sheet on the research in which I have been asked to participate and have been given a copy to keep. I have had the opportunity to discuss the details and ask questions about this information. The Investigator has explained the nature and purpose of the research and I believe that I understand what is being proposed. I understand that my personal involvement and my particular data from this study will remain strictly confidential. I have been informed about what the data collected in this investigation will be used for, to whom it may be disclosed, and how long it will be retained. I understand that I am free to withdraw from the study at any time, without giving a reason for withdrawing. I would prefer to be contacted by: (tick one)
1) Email 2) Telephone 3) Letter 4) Any
I hereby fully and freely consent to participate in the study. Participant's Name: (Block Capitals) ………………………………. Participant's Signature: ………………………………. Date: ………………………………. As the Investigator responsible for this investigation I confirm that I have explained to the participant named above the nature and purpose of the research to be undertaken. Investigator's Name: …………………………………. Investigator's Signature: ………………………………… . Date: ………………………………….

187
Appendix 6 – participant OCT prior experience questionnaire Please complete and return this form in the prepaid envelope provided to: Paul Grace 30 Bristow Park Belfast BT96TH Northern Ireland Name: Address: Telephone number: Email: GOC number: (Four CET points will be available for successful completion of both assessments and these points will be applied to the 2016-2018 CET cycle) I would prefer to be contacted by: email.....post.....telephone (circle one)
We want to know about your prior knowledge and experience of OCT scan interpretation so we will ask you how often you view and assess OCT images in any context or situation*
*If you have access to OCT in practice (either full or part-time) you are likely to be viewing and assessing the OCT images of your own patients reasonably often.
If however you do not have access to OCT, you may still have some experience in OCT interpretation (for example in lectures, CET events, demonstrations by OCT suppliers).
How many OCT scans do you view and assess (in any context or situation) in a typical month? Please circle the most appropriate option:
1. Less than 5
2. 5 to 10
3. More than 10
188
Appendix 7 – participant post-study information
What will happen after the study is completed?
A total of 4 CET points (for the new 2016-2018 cycle) will be available for successful completion of both assessments. After the study is completed only participants who have completed the study (from both the study and control groups) will be given free access to the OCTAID. Feedback will be invited only from these participants and this feedback will form the basis of the site’s further development. Practitioners may be particularly interested in sharing some scans from their own archive especially when there is a full patient history and:
A confirmed and definitive diagnosis and management plan, for example, when there is a HES reply to the referral
A good quality scan illustrates a ‘typical’ example of a disease entity
A good quality scan illustrates an ‘atypical’ example of a disease where optometrists may find the diagnosis/management challenging
A good quality scan illustrates the staging of a disease (from early to advanced)
A mechanism will be formulated to measure consensus opinion on the content of the OCTAID site so that all participants can feel part of this collaborative venture. All scans/images will be fully acknowledged on the image captions.
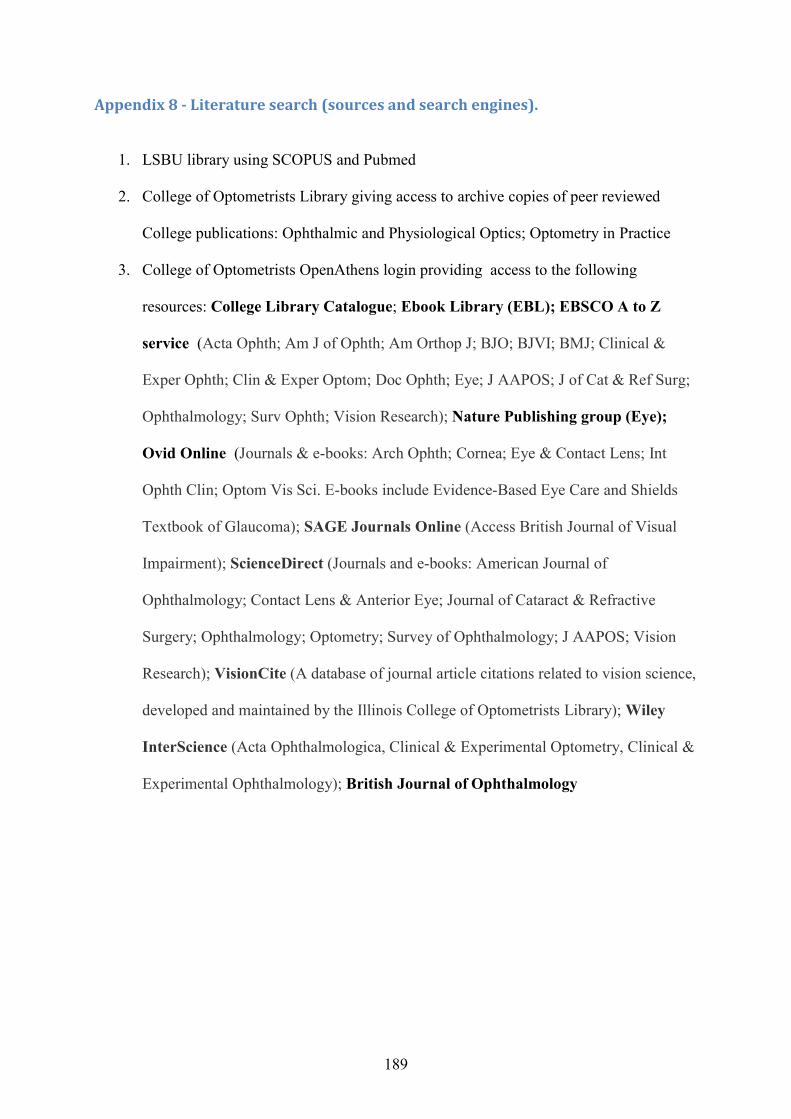
189
Appendix 8 - Literature search (sources and search engines).
1. LSBU library using SCOPUS and Pubmed
2. College of Optometrists Library giving access to archive copies of peer reviewed
College publications: Ophthalmic and Physiological Optics; Optometry in Practice
3. College of Optometrists OpenAthens login providing access to the following
resources: College Library Catalogue; Ebook Library (EBL); EBSCO A to Z
service (Acta Ophth; Am J of Ophth; Am Orthop J; BJO; BJVI; BMJ; Clinical &
Exper Ophth; Clin & Exper Optom; Doc Ophth; Eye; J AAPOS; J of Cat & Ref Surg;
Ophthalmology; Surv Ophth; Vision Research); Nature Publishing group (Eye);
Ovid Online (Journals & e-books: Arch Ophth; Cornea; Eye & Contact Lens; Int
Ophth Clin; Optom Vis Sci. E-books include Evidence-Based Eye Care and Shields
Textbook of Glaucoma); SAGE Journals Online (Access British Journal of Visual
Impairment); ScienceDirect (Journals and e-books: American Journal of
Ophthalmology; Contact Lens & Anterior Eye; Journal of Cataract & Refractive
Surgery; Ophthalmology; Optometry; Survey of Ophthalmology; J AAPOS; Vision
Research); VisionCite (A database of journal article citations related to vision science,
developed and maintained by the Illinois College of Optometrists Library); Wiley
InterScience (Acta Ophthalmologica, Clinical & Experimental Optometry, Clinical &
Experimental Ophthalmology); British Journal of Ophthalmology

190
Appendix 9 – Study participants’ feedback (testimonials) Hi Paul, Please find attached feedback form. Thank-you for letting me take part in your study. I found it very interesting and educational. Kind Regards ...................................................................................................................................................... I'm very glad I took part. My knowledge has increased significantly and I feel far more confident now. Thank you for giving me the opportunity to take part. Kind regards ...................................................................................................................................................... Above average presentation of learning aid with genuinely thought provoking questions. ..................................................................................................................................................... Novel idea and very very useful. Excellent CET ..................................................................................................................................................... Well, I learnt all sorts of things... Never heard of MacTel before, but have now thanks to OCTAID Also the common artifacts and the causes, was oblivious before... I could go on but sure you're very aware that there are loads of us v new to it all...too nervous to post on the Optix forum, (there are some of our local colleagues on there!!)....had v short intro from Topcon/other supplier....there is little out there to help...except Retina Revealed, I do look at that...College library has nothing on its shelves to borrow as everything out on loan.... So thank you for all your hard work Best wishes PS how about a 'search' feature on OCTAID? ..................................................................................................................................................... It definitely is a good aid when analysing images. Let me know when I can repeat the first exam ..................................................................................................................................................... Hi Paul What you are doing seems some good work here… I am already part of your OCT study and have completed the first part with a score of 75%. I signed up ages ago. I was wondering if it would be possible for me to have a Powerpoint of your case questions and images that I can use internally for my optoms, for me to run a training session aside from your study? This would be completely separate from your study of course? Won’t be offended if you say no.. Regards ............................................................................................................................................

191
A very useful tool that I shall continue to use in practice on a regular basis. Thank you very much .............................................................................................................................................. Excellent. Best OCT CET ever .................................................................................................................................................. The CET enabled me to reflect on my own and others practice. .................................................................................................................................................. Well presented and very relevant to daily practice I really enjoyed it, and learned a lot despite it being the introductory exam. Above average presentation of learning aid with genuinely thought provoking questions. More CET of this level / quality is what we should strive for ................................................................................................................................................. Excellent thought provoking content. I thought the questions were searching, and more challenging than I expected. I believe this will be very good for my personal development.
On the whole the presentation of this CET put me in a very realistic situation. Challenging scenarios but very relevant. I think it is a very worthwhile exercise. .............................................................................................................................................. Very good, and challenging, CET module – unlike so many in the domain. The questions (and the answers) caused me to go back to the training information and review what I’d “learned”. This was really helpful .................................................................................................................................................... Very good quality material throughout, would highly recommend. ................................................................................................................................................... A very useful tool that I shall continue to use in practice on a regular basis. Thank you very much ..................................................................................................................................................... A very interesting and engaging way of learning. .................................................................................................................................................... I found this CET extremely interesting, and very helpful. I would recommend anyone intending to use OCT in their practice to take part. It is extremely helpful for lone practitioners. A novel approach to educating and highly usable in daily practice Very enjoyable and thought-provoking
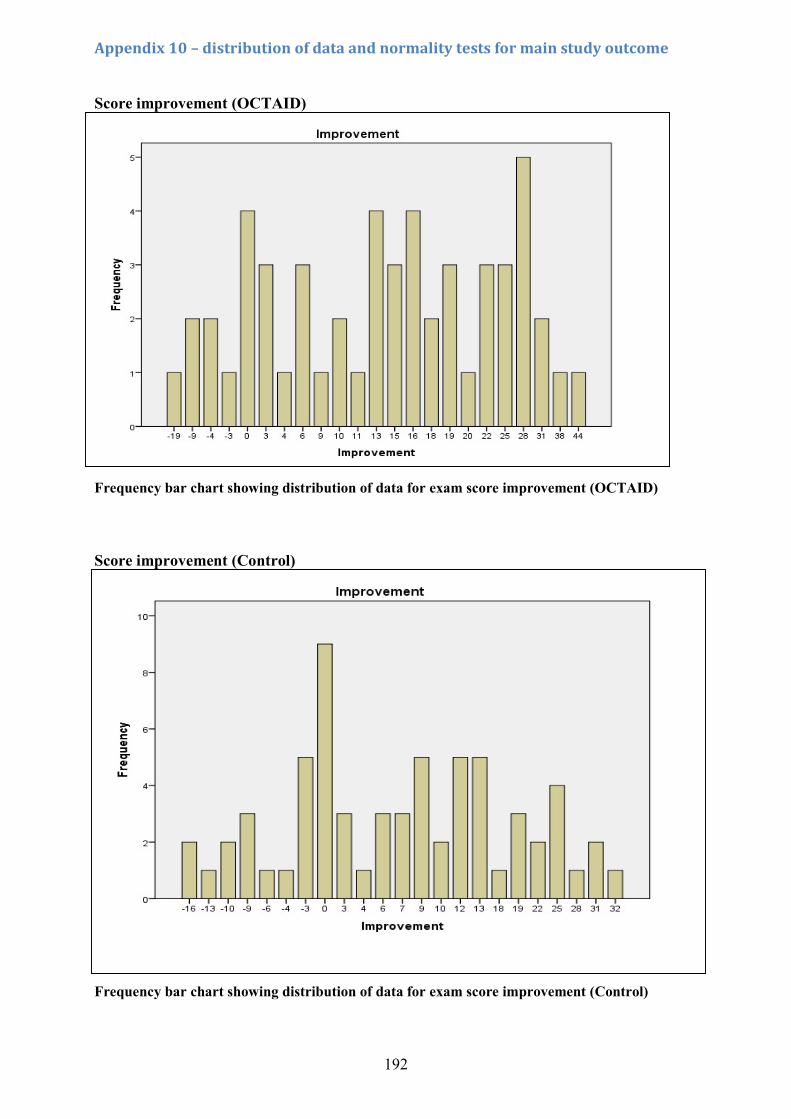
192
Appendix 10 – distribution of data and normality tests for main study outcome Score improvement (OCTAID) Frequency bar chart showing distribution of data for exam score improvement (OCTAID) Score improvement (Control)
Appendix 11 – Sample size calculation
Appendix 11 - Sample size calculation Cohen's d is a common way to measure effect size. The formula for Cohen's d is: d = M1 - M2 / S-pooled Where: M1 = mean of group 1 M2 = mean of group 2 S-pooled = the pooled standard deviation for the two groups S-pooled √ [(S1² + S2²) / 2] S1 = standard deviation of the OCTAID group S2 = standard deviation of the Control group Frequency bar chart showing distribution of data for exam score improvement (Control)

193
Tests of normality (Improvement score OCTAID v Control)
Tests of Normality
GROUP Kolmogorov-Smirnova Shapiro-Wilk
Statistic Df Sig. Statistic df Sig.
Improvement OCTAID .084 53 .200* .990 53 .943
Control .097 65 .200* .977 65 .268
*. This is a lower bound of the true significance.
a. Lilliefors Significance Correction

194
Appendix 11 – Sample size calculation
Cohen's d is a common way to measure effect size. The formula for Cohen's d is:
d = M1 - M2 / S-pooled
Where:
M1 = mean of group 1
M2 = mean of group 2
S-pooled = the pooled standard deviation for the two groups
S-pooled = √[(S1² + S2²) / 2]
Some general "rules of thumb" guidelines (to be used cautiously) exist whereby:
Small effect size = 0.2
Medium effect size = 0.5
Large effect size = 0.8
Large effect isn't necessarily better than small effect especially in settings where small
differences may have a major impact.
However we have utilised data (means and standard deviations) from the primary outcome
measures of the current study (mean exam score improvement) and have estimated a suitable
sample size:
Mean exam score improvement (OCTAID) = 13.62 S1 = 12.662 S1² = 160.326

195
Mean exam score improvement (Control) = 7.17 S2 = 11.828 S2² = 150.114
S-pooled = 12.252
So in the case of the current study Cohen's d = (13.62 - 7.17)/12.252 = 0.526
Sample size estimate based on a desired statistical power of 0.8 and a probability level of
0.05:
Minimum total sample size = 92 (1-tailed hypothesis)
Minimum sample size per group (1-tailed hypothesis) 46
Minimum sample size per group (2-tailed hypothesis) 58
Minimum total sample size (2-tailed hypothesis) 116
196
References
Abramoff, M. D., Garvin, M. K. and Sonka, M. (2010) Retinal imaging and image analysis, IEEE Reviews in Biomedical Engineering, 3, pp. 169-208.
Akins, R. B., Tolson, H. and Cole, B. R. (2005) Stability of response characteristics of a Delphi panel: Application of bootstrap data expansion, BMC Medical Research Methodology, 5 (37), pp. 1-12.
Albaum, M. N., Hill, L. C., Murphy, M., Li, Y. H., Fuhrman, C. R., Britton, C. A. et al. (1996) Interobserver reliability of the chest radiograph in community-acquired pneumonia, Chest, 110 (2), pp. 343-350.
Ambati, J. And Fowler, B.J. (2012) Mechanisms of age-related macular degeneration, Neuron, 75 (1), pp. 26-39
Amoaku, W., Blakeney, S., Freeman, M., Gale, R., Johnston, R., Kelly, S. P. et al. (2012) Action on AMD. Optimising patient management: Act now to ensure current and continual delivery of best possible patient care, Eye (Basingstoke), 26, pp. 2-21.
Arevalo, J. F., Sanchez, J. G. and Garcia, R. A. (2009) Artifacts and limitations in time-domain optical coherence tomography images, Retinal Angiography and Optical Coherence Tomography, Book Chapter, pp. 375-386.
Aschliesser, J. A., Gallimore, G., Kunjukunju, N., Rsabates, N. R., Koulen, P. and Nsabates, F. N. (2014) Clinical application of optical coherence tomography in combination with functional diagnostics: Advantages and limitations for diagnosis and assessment of therapy outcome in central serous chorioretinopathy, Clinical Ophthalmology, 8 , pp. 2337-2345.
Attree, M. (2006) Evaluating healthcare education: Issues and methods, Nurse Education in Practice, 6 (6), pp. 332-338.
Baker, H., Ratnarajan, G., Harper, R. A., Edgar, D. F. and Lawrenson, J. G. (2016) Effectiveness of UK optometric enhanced eye care services: a realist review of the literature, Ophthalmic and Physiological Optics, 36 (5), pp. 545-557.
Barañano, A. E., Keane, P. A., Ruiz-Garcia, H., Walsh, A. C. and Sadda, S. R. (2012) Impact of scanning density on spectral domain optical coherence tomography assessments in neovascular age-related macular degeneration, Acta Ophthalmologica, 90 (4), pp. 274-280.
Barrows, H. S. and Abrahamson, S. (1964) The programmed patient: A technique for appraising student performance in clinical neurology, Journal of Medical Education, 39 (8), pp. 802-805.
Bekerman, I., Gottlieb, P. and Vaiman, M. (2014) Variations in Eyeball Diameters of the Healthy Adults, Journal of Ophthalmology, 2014, pp. 1- 5.
Bertens, L. C. M., Broekhuizen, B. D. L., Naaktgeboren, C. A., Rutten, F. H., Hoes, A. W., van Mourik, Y. et al. (2013) Use of Expert Panels to Define the Reference Standard in Diagnostic Research: A Systematic Review of Published Methods and Reporting, PLoS Medicine, 10 (10), e1001531, pp. 1-17
Blakeney, S. (2012) The efficiency of the sight test as a tool for detection of disease, Optom Pract, 13, pp. 151-158.
197
Body, R. and Foex, B. (2009) On the philosophy of diagnosis: Is doing more good than harm better than "primum non nocere"? Emergency Medicine Journal, 26 (4), pp. 238-240.
Bordage, G. (1999) Why did I miss the diagnosis? Some cognitive explanations and educational implications, Academic Medicine, 74 (10 SUPPL.), pp. 138-143.
Boyce, T. (2014) Real patients coming to real harm. RNIB. Available from:
https://rnib.org.uk/sites/default/files/Real_patients_coming_to_real_harm_.pdf [Accessed 15/06/2017].
Brady, A. (2005) Assessment of learning with multiple-choice questions, Nurse Education in Practice, 5 (4), pp. 238-242.
Brooks, L. R., Norman, G. R. and Allen, S. W. (1991) Role of Specific Similarity in a Medical Diagnostic Task, Journal of Experimental Psychology: General, 120 (3), pp. 278-287.
Broussard, S. C. and Garrison, M. E. B. (2004) The Relationship Between Classroom Motivation and Academic Achievement in Elementary-School-Aged Children, Family and Consumer Sciences Research Journal, 33 (2), pp. 106-120.
Bunce, C. and Wormald, R. (2006) Leading causes of certification for blindness and partial sight in England & Wales, BMC Public Health, 6 (58), p. 7.
Bunce, C., Xing, W. and Wormald, R. (2010) Causes of blind and partial sight certifications in England and Wales: April 2007-March 2008, Eye, 24 (11), pp. 1692-1699.
Butner, R. W. and McPherson, A. R. (1983) Adverse reactions in intravenous fluorescein angiography, Annals of Ophthalmology, 15 (11), pp. 1084-1086.
Cameron, D., Laude, A., Dhillon, B., Armbrecht, A. and Vani, A. (2011) Is high-resolution OCT as good as FFA at detecting treatable wet AMD? Optometry in Practice, 12 (3), pp. 99-108.
Cameron, J. R., Ahmed, S., Curry, P., Forrest, G. and Sanders, R. (2009) Impact of direct electronic optometric referral with ocular imaging to a hospital eye service, Eye, 23 (5), pp. 1134-1140.
Carneiro, A. and Andrade, J. P. (2017) Nutritional and Lifestyle Interventions for Age-Related Macular Degeneration: A Review, Oxidative Medicine and Cellular Longevity, 2017, pp. 1-13.
Chen, J. and Lee, L. (2007) Clinical applications and new developments of optical coherence tomography: an evidence-based review, Clinical and Experimental Optometry, 90 (5), pp. 317-335.
Chen, T. C., Cense, B., Pierce, M. C., Nassif, N., Park, B. H., Yun, S. H. et al. (2005) Spectral domain optical coherence tomography ultra-high speed, ultra-high resolution ophthalmic imaging, Archives of Ophthalmology, 123 (12), pp. 1715-1720.
Chong, G. T. and Lee, R. K. (2012) Glaucoma versus red disease: Imaging and glaucoma diagnosis, Current Opinion in Ophthalmology, 23 (2), pp. 79-88.
198
Clarke, M. (2014) NHS sight tests include unevaluated screening examinations that lead to waste, BMJ (Online), 348 (March), p. 2084.
Coady, P. A., Cunningham, E. T., Vora, R. A., McDonald, H. R., Johnson, R. N., Jumper, J. M. et al. (2015) Spectral domain optical coherence tomography findings in eyes with acute ischaemic retinal whitening, British Journal of Ophthalmology, 99 (5), pp. 586-592.
College of Optometrists, (2017) Higher qualifications: Medical retina. College of Optometrists. Available from: https://www.college-optometrists.org/cpd-and-cet/training-and-qualifications/higher-qualifications.html [Accessed 02/03/2017].
College of Optometrists, (2013) The routine eye examination. College of Optometrists. Available from: http://guidance.college-optometrists.org/guidance-contents/knowledge-skills-and-performance-domain/the-routine-eye-examination/ [Accessed 05/02/2017].
Costa, RA. Skaf, M. Melo Jnr, LAS. (2006) Retinal assessment using optical coherence tomography, Progress in Retinal and Eye Research, 25, pp. 325-353.
Creer, R. Parkes, J. Charles, S. Harper, R. (2010) Optometric Management of Age-related Macular Degeneration: Referral and Referral Refinement Pilot Surveys, Optometry in Practice, 11, pp. 13-25.
Creese, K., Ong, D. and Zamir, E. (2012) Should macular optical coherence tomography be part of routine preoperative cataract assessment? Clinical and Experimental Ophthalmology, 40 (1), pp. 118-119.
Croskerry, P. (2009) Clinical cognition and diagnostic error: Applications of a dual process model of reasoning, Advances in Health Sciences Education, 14 (1 SUPPL), pp. 27-35.
Croskerry, P. (2002) Achieving quality in clinical decision making: Cognitive strategies and detection of bias, Academic Emergency Medicine, 9 (11), pp. 1184-1204.
Dabasia, P. L., Edgar, D. F., Garway-Heath, D. F. and Lawrenson, J. G. (2014) A survey of current and anticipated use of standard and specialist equipment by UK optometrists, Ophthalmic and Physiological Optics, 34 (5), pp. 592-613.
D'Agostino Sr., R. B., Vasan, R. S., Pencina, M. J., Wolf, P. A., Cobain, M., Massaro, J. M. et al. (2008) General cardiovascular risk profile for use in primary care: The Framingham heart study, Circulation, 117 (6), pp. 743-753.
Das, A. K., Olfson, M., Gameroff, M. J., Pilowsky, D. J., Blanco, C., Feder, A. et al. (2005) Screening for bipolar disorder in a primary care practice, Journal of the American Medical Association, 293 (8), pp. 956-963.
Denniss, J. and Henson, D. B. (2009) The Structure–Function Relationship in Glaucoma: Implications for Disease Detection, Optometry in Practice, (10), pp. 95-104.
Djulbegovic, B., Hozo, I., Beckstead, J., Tsalatsanis, A. and Pauker, S. G. (2012) Dual processing model of medical decision-making, BMC Medical Informatics and Decision Making, 12 (1), p. 94.
Do, D. V., Cho, M., Quan, D. N., Shah, S. M., Handa, J. T., Campochiaro, P. A. et al. (2006) The impact of optical coherence tomography on surgical decision making in epiretinal membrane and vitreomacular traction, Transactions of the American Ophthalmological Society, 104 , pp. 161-165.
199
Dobos, M. (2010) Utilizing optical coherence tomography in the diagnosis and management of cystoid macular oedema with topical treatment, Clinical Optometry, (2), pp. 105-112.
Doors, M., Berendschot, T. T. J. M., de Brabander, J., Webers, C. A. B. and Nuijts, R. M. M. A. (2010) Value of optical coherence tomography for anterior segment surgery, Journal of Cataract and Refractive Surgery, 36 (7), pp. 1213-1229.
Doyle, E., Trivedi, D., Good, P., Scott, R. A. and Kirkby, G. R. (2009) High-resolution optical coherence tomography demonstration of membranes spanning optic disc pits and colobomas, British Journal of Ophthalmology, 93 (3), pp. 360-365.
Drexler, W., Morgner, U., Ghanta, R. K., Kärtner, F. X., Schuman, J. S. and Fujimoto, J. G. (2001) Ultrahigh-resolution ophthalmic optical coherence tomography, Nature Medicine, 7 (4), pp. 502-506.
Elstein, A. S. and Schwarz, A. (2002) Evidence base of clinical diagnosis. Clinical problem solving and diagnostic decision making: Selective review of the cognitive literature, British Medical Journal, 324 (7339), pp. 729-732.
Ely, J. W., Graber, M. L. and Croskerry, P. (2011) Checklists to reduce diagnostic errors, Academic Medicine, 86 (3), pp. 307-313.
Eriksson, U., Alm, A. and Larsson, E. (2012) Is quantitative spectral-domain superior to time-domain optical coherence tomography (OCT) in eyes with age-related macular degeneration? Acta Ophthalmologica, 90 (7), pp. 620-627.
Euler, T., Haverkamp, S., Schubert, T. and Baden, T. (2014) Retinal bipolar cells: Elementary building blocks of vision, Nature Reviews Neuroscience, 15 (8), pp. 507-519.
Evans, B. J. W., Harle, D. E. and Cocco, B. (2005) Optometric referrals: Towards a two way flow of information? [4], British Journal of Ophthalmology, 89 (12), pp. 1663.
Evered, A., Walker, D., Watt, A. A. and Perham, N. (2013) To what extent does nonanalytic reasoning contribute to visual learning in cytopathology? Cancer Cytopathology, 121 (6), pp. 329-338.
Falkenberry, S. M., Ip, M. S., Blodi, B. A. and Gunther, J. B. (2006) Optical coherence tomography findings in central retinal artery occlusion, Ophthalmic Surgery Lasers and Imaging, 37 (6), pp. 502-505.
Faucher, C., Tardif, J. and Chamberland, M. (2012) Optometrists' clinical reasoning made explicit: A qualitative study, Optometry and Vision Science, 89 (12), pp. 1774-1784.
Feinstein, A. R. (1974) An analysis of diagnostic reasoning: III. The construction of clinical algorithms, Yale Journal of Biology and Medicine, 47 (1), pp. 5-32.
Ferrara, D. C., Freund, K. B. and Yannuzzi, L. A. (2008) How to spot diseases that mimic dry AMD, Review of Ophthalmology, 15, p. 9.
Ferreras, A., Figus, M., Frezzotti, P. and Iester, M. (2015) Advances in diagnostic imaging technologies to evaluate the retina and the optic disc, BioMed Research International, 2015, Article 371312.
200
Ford, J. A., Clar, C., Lois, N., Barton, S., Thomas, S., Court, R. et al. (2014) Treatments for macular oedema following central retinal vein occlusion: Systematic review, BMJ Open, 4 (2), pp. 1-9.
Forest, D. L., Johnson, L. V. and Clegg, D. O. (2015) Cellular models and therapies for age-related macular degeneration, DMM Disease Models and Mechanisms, 8 (5), pp. 421-427.
Fu, Y., Liao, H. W., Do, M. T. H. and Yau, K. W. (2005) Non-image-forming ocular photoreception in vertebrates, Current Opinion in Neurobiology, 15 (4), pp. 415-422.
Fujimoto, J. G., Brezinski, M. E., Tearney, G. J., Boppart, S. A., Bouma, B., Hee, M. R. et al. (1995) Optical biopsy and imaging using optical coherence tomography, Nature Medicine, 1 (9), pp. 970-972.
Fujimoto, J. and Swanson, E. (2016) The development, commercialization, and impact of optical coherence tomography, Investigative Ophthalmology and Visual Science, 57 (9), pp. 1-13.
Fujimoto, J. G., Brezinski, M. E., Tearney, G. J., Boppart, S. A., Bouma, B., Hee, M. R. et al. (1995) Optical biopsy and imaging using optical coherence tomography, Nature Medicine, 1 (9), pp. 970-972.
Gallego-Pinazo, R., Dolz-Marco, R., Pinazo Durán, M. D. and Díaz-Llopis, M. (2013) Need to consensus for novel findings by optical coherence tomography in patients with age-related macular degeneration, Acta Ophthalmologica, 91 (2), pp. 161.
Gambichler, T., Jaedicke, V. and Terras, S. (2011) Optical coherence tomography in dermatology: Technical and clinical aspects, Archives of Dermatological Research, 303 (7), pp. 457-473.
Gella, L., Raman, R. and Sharma, T. (2015) Macular thickness measurements using Copernicus Spectral Domain Optical Coherence Tomography, Saudi Journal of Ophthalmology, 29 (2), pp. 121-125.
General Optical Council (2012) Continuing education and training (CET). General Optical Council. Available from: https://www.optical.org/en/Education/CET/ [Accessed 02/03/2017].
Gharbiya, M., Grandinetti, F., Scavella, V., Cecere, M., Esposito, M., Segnalini, A. et al. (2012) Correlation between spectral-domain optical coherence tomography findings and visual outcome after primary rhegmatogenous retinal detachment repair, Retina, 32 (1), pp. 43-53.
Gill, C. J., Sabin, L. and Schmid, C. H. (2005) Why clinicians are natural bayesians, British Medical Journal, 330 (7499), pp. 1080-1083.
Grover, L. L. (2017) Making eye health a population imperative: A vision for tomorrow - A report by the committee on public health approaches to reduce vision impairment and promote eye health, Optometry and Vision Science, 94 (4), pp. 444-445.
Guarino, S., Leopardi, E., Sorrenti, S., De Antoni, E., Catania, A. and Alagaratnam, S. (2014) Internet-based versus traditional teaching and learning methods, Clinical Teacher, 11 (6), pp. 449-453.
201
Guay F., Chanal J., Ratelle C.F., Marsh H., Larose S. and Boivin B. (2010) Intrinsic, identified, and controlled types of motivation for school subjects in young elementary school children, British Journal of Educational Psychology, 80 (4), pp. 711-735.
Hajjaj, F. M., Salek, M. S., Basra, M. K. A. and Finlay, A. Y. (2010) Non-clinical influences on clinical decision-making: A major challenge to evidence-based practice, Journal of the Royal Society of Medicine, 103 (5), pp. 178-187.
Handels, R. L. H., Wolfs, C. A. G., Aalten, P., Bossuyt, P. M. M., Joore, M. A., Leentjens, A. F. G. et al. (2014) Optimizing the use of expert panel reference diagnoses in diagnostic studies of multidimensional syndromes, BMC Neurology, 14 (1), Article 190.
Hanson, C., Tennant, M. T. S. and Rudnisky, C. J. (2008) Optometric referrals to retina specialists: Evaluation and triage via teleophthalmology, Telemedicine and e-Health, 14 (5), pp. 441-445.
Harrington, J. M. (1994) Research priorities in occupational medicine: A survey of United Kingdom medical opinion by the Delphi technique, Occupational and Environmental Medicine, 51 (5), pp. 289-294.
Harwerth, R. S., Carter-Dawson, L., Shen, F., Smith III, E. L. and Crawford, M. L. J. (1999) Ganglion cell losses underlying visual field defects from experimental glaucoma, Investigative Ophthalmology and Visual Science, 40 (10), pp. 2242-2250.
Hau, S. C., Papastefanou, V., Shah, S., Sagoo, M. S., Restori, M. and Cohen, V. (2015) Evaluation of iris and iridociliary body lesions with anterior segment optical coherence tomography versus ultrasound B-scan, British Journal of Ophthalmology, 99 (1), pp. 81-86.
Haynes, R. B. and Wilczynski, N. L. (2004) Optimal search strategies for retrieving scientifically strong studies of diagnosis from Medline: Analytical survey, British Medical Journal, 328 (7447), pp. 1040-1042.
Hayward, R. (2003) VOMIT (victims of modern imaging technology) an acronym for our times, BMJ, 326 (7401), pp. 1273.
Herse, P. and Lee Boptom, A. (2005) Optometry and webct: A student survey of the value of web-based learning environments in optometric education, Clinical and Experimental Optometry, 88 (1), pp. 46-52.
Hildebrand, G. D. and Fielder, A. R. (2011) Anatomy and physiology of the retina, Pediatric Retina, (Book Chapter), pp. 39-65.
Hood, D. C. and Birch, D. G. (1995) Computational Models of Rod-Driven Retinal Activity, IEEE Engineering in Medicine and Biology Magazine, 14 (1), pp. 59-66.
Huang, D., Swanson, E. A., Lin, C. P., Schuman, J. S., Stinson, W. G., Chang, W. et al. (1991) Optical coherence tomography, Science, 254 (5035), pp. 1178-1181.
Hurwitz, S. R. and Slawson, D. C. (2010) Should we be teaching information management instead of evidence-based medicine? Clinical Orthopaedics and Related Research, 468 (10), pp. 2633-2639.
Ilgen, J. S., Humbert, A. J., Kuhn, G., Hansen, M. L., Norman, G. R., Eva, K. W. et al. (2012) Assessing diagnostic reasoning: A consensus statement summarizing theory, practice, and future needs, Academic Emergency Medicine, 19 (12), pp. 1454-1461.
202
Ingram, D. V. and Culham, L. E. (2001) Ophthalmologists and optometrists—interesting times? British Journal of Ophthalmology, 85 (7), pp. 769-770.
Izatt, J. A., Hee, M. R., Swanson, E. A., Lin, C. P., Huang, D., Schuman, J. S. et al. (1994) Micrometer-Scale Resolution Imaging of the Anterior Eye In Vivo With Optical Coherence Tomography, Archives of Ophthalmology, 112 (12), pp. 1584-1589.
Jagadish, P. and Dalziel, D. (2017) Discharge outcomes of patients referred to specialist eye clinic from diabetic retinopathy screening in Northland (2014-15), The New Zealand Medical Journal, 130 (1450), pp. 89-93.
Jarvis, I. and Ker, J. (2014) Ensuring standards for the extended role of optometry, Clinical Teacher, 11 (3), pp. 184-187.
Johnson, L. N., Diehl, M. L., Hamm, C. W., Sommerville, D. N. and Petroski, G. F. (2009) Differentiating optic disc edema from optic nerve head drusen on optical coherence tomography, Archives of Ophthalmology, 127 (1), pp. 45-49.
Kang, H. K. and Luff, A. J. (2008) Management of retinal detachment: A guide for non-ophthalmologists, BMJ, 336 (7655), pp. 1235-1240.
Kardon, R. (2014) Optical coherence tomography in papilledema: What am i missing? Journal of Neuro-Ophthalmology, 34 (SUPPL. 3), pp. 10-17.
Kelly, S. P., Wallwork, I., Haider, D. and Qureshi, K. (2011) Teleophthalmology with optical coherence tomography imaging in community optometry. Evaluation of a quality improvement for macular patients, Clinical Ophthalmology, 5 (1), pp. 1673-1678.
Kerrigan-Baumrind, L. A., Quigley, H. A., Pease, M. E., Kerrigan, D. F. and Mitchell, R. S. (2000) Number of ganglion cells in glaucoma eyes compared with threshold visual field tests in the same persons, Investigative Ophthalmology and Visual Science, 41 (3), pp. 741-748.
Khodyakov, D., Hempel, S., Rubenstein, L., Shekelle, P., Foy, R., Salem-Schatz, S. et al. (2011) Conducting Online Expert panels: A feasibility and experimental replicability study, BMC Medical Research Methodology, 11 (Article number 174).
Kim, S. J. and Bressler, N. M. (2009) Optical coherence tomography and cataract surgery, Current Opinion in Ophthalmology, 20 (1), pp. 46-51.
Koenekoop, R. K. (2009) Why do cone photoreceptors die in rod-specific forms of retinal degenerations, Ophthalmic Genetics, 30 (3), pp. 152-154.
Kolb, H. (1997) Amacrine cells of the mammalian retina: Neurocircuitry and functional roles, Eye, 11 (6), pp. 904- 923.
Komaroff, A. L. (1982) Algorithms and the 'art' of medicine, American Journal of Public Health, 72 (1), pp. 10-12.
Kreps, G. L. and Neuhauser, L. (2010) New directions in eHealth communication: Opportunities and challenges, Patient Education and Counseling, 78 (3), pp. 329-336.
Kulatunga-Moruzi, C., Brooks, L. R. and Norman, G. R. (2011) Teaching Posttraining: Influencing Diagnostic Strategy With Instructions at Test, Journal of Experimental Psychology: Applied, 17 (3), pp. 195-209.
203
Kulatunga-Moruzi, C., Brooks, L. R. and Norman, G. R. (2001) Coordination of Analytic and Similarity-Based Processing Strategies and Expertise in Dermatological Diagnosis, Teaching and Learning in Medicine, 13 (2), pp. 110-116.
Kwan, A. S. L., Barry, C., McAllister, I. L. and Constable, I. (2006) Fluorescein angiography and adverse drug reactions revisited: The Lions Eye experience, Clinical and Experimental Ophthalmology, 34 (1), pp. 33-38.
Landon, B. E., Normand, S. L. T., Blumenthal, D. and Daley, J. (2003) Physician Clinical Performance Assessment: Prospects and Barriers, Journal of the American Medical Association, 290 (9), pp. 1183-1189.
Laouri, M., Chen, E., Looman, M. and Gallagher, M. (2011) The burden of disease of retinal vein occlusion: Review of the literature, Eye, 25 (8), pp. 981-988.
Leblanc, V. R., Brooks, L. R. and Norman, G. R. (2002) Believing is seeing: The influence of a diagnostic hypothesis on the interpretation of clinical features, Academic Medicine, 77 (10 SUPPL.), pp. 67-69.
Lee Ventola, C. (2014) Mobile devices and apps for health care professionals: Uses and benefits, Pharmacy and Therapeutics (P&T), 39 (5), pp. 356-364.
Lemieux, M. and Bordage, G. (1992) Propositional versus structural semantic analyses of medical diagnostic thinking, Cognitive Science, 16 (2), pp. 185-204.
Leon, A. C., Davis, L. L. and Kraemer, H. C. (2011) The role and interpretation of pilot studies in clinical research, Journal of Psychiatric Research, 45 (5), pp. 626-629.
Levison, A. L. and Kaiser, P. K. (2014) Vitreomacular interface diseases: Diagnosis and management, Taiwan Journal of Ophthalmology, 4 (2), pp. 63-68.
Ly, A., Nivison-Smith, L., Hennessy, M. P. and Kalloniatis, M. (2016) Collaborative care of non-urgent macular disease: a study of inter-optometric referrals, Ophthalmic and Physiological Optics, 36 (6), pp. 632-642.
Lysdahl, K. B. and Hofmann, B. M. (2009) What causes increasing and unnecessary use of radiological investigations? a survey of radiologists' perceptions, BMC Health Services Research, 9 (Article 155).
Macular Disease Society (2012) Half of eye clinics fail to meet guidance on waiting times. Macular Disease Society press release. Vision 20/20 UK. Available from:
https://www.vision2020uk.org.uk/half-of-eye-clinics-fail-to-meet-guidance-on-waiting-times-macular-disease-society-press-release/ [Accessed 21/12/2016].
Matt, G., Sacu, S., Buehl, W., Ahlers, C., Dunavoelgyi, R., Pruente, C. et al. (2011) Comparison of retinal thickness values and segmentation performance of different OCT devices in acute branch retinal vein occlusion, Eye, 25 (4), pp. 511-518.
Mauthner, N. S. and Doucet, A. (2003) Reflexive accounts and accounts of reflexivity in qualitative data analysis, Sociology, 37 (3), pp. 413-431.
Mavroforou, A., Antoniou, G. and Giannoukas, A. D. (2010) Ethical and legal aspects on the use of images and photographs in medical teaching and publication, International Angiology, 29 (4), pp. 376-379.
204
McCoubrie, P. and Reid, J. H. (2013) Development of medical imaging technologies is the best way to advance clinical diagnostic accuracy and there is no such thing as VOMIT, Journal of the Royal College of Physicians of Edinburgh, 42 (4), pp. 326-332.
McCrum-Gardner, E. (2008) Which is the correct statistical test to use? British Journal of Oral and Maxillofacial Surgery, 46 (1), pp. 38-41.
McIntosh, R. L., Rogers, S. L., Lim, L., Cheung, N., Wang, J. J., Mitchell, P. et al. (2010) Natural History of Central Retinal Vein Occlusion: An Evidence-Based Systematic Review, Ophthalmology, 117 (6), pp. 1113-1123.e15.
Medina, C., Plesec, T. and Singh, A. (2014) Optical coherence tomography imaging of ocular and periocular tumours, British Journal of Ophthalmology, 98 , pp. 40-46.
Menke, M. N., Dabov, S., Knecht, P. and Sturm, V. (2011) Reproducibility of retinal thickness measurements in patients with age-related macular degeneration using 3D Fourier-domain optical coherence tomography (OCT) (Topcon 3D-OCT 1000), Acta Ophthalmologica, 89 (4), pp. 346-351.
Michalska-Małecka, K., Kabiesz, A., Nowak, M. and ͆piewak, D. (2015) Age related macular degeneration - Challenge for future: Pathogenesis and new perspectives for the treatment, European Geriatric Medicine, 6 (1), pp. 69-75.
Mitchell, J. and Bradley, C. (2006) Quality of life in age-related macular degeneration: A review of the literature, Health and Quality of Life Outcomes, 4 (Article 97).
Mitchell, P., Smith, W., Attebo, K. and Healey, P. R. (1996) Prevalence of open-angle glaucoma in Australia: The blue mountains eye study, Ophthalmology, 103 (10), pp. 1661-1669.
Moisseiev, E., Goldstein, M., Waisbourd, M., Barak, A. and Loewenstein, A. (2013) Long-term evaluation of patients treated with dexamethasone intravitreal implant for macular edema due to retinal vein occlusion, Eye (Basingstoke), 27 (1), pp. 65-71.
Moore, C. G., Carter, R. E., Nietert, P. J. and Stewart, P. W. (2011) Recommendations for planning pilot studies in clinical and translational research. Clinical and Translational Science, 4 (5), pp. 332-337.
Morrison, S. and Free, K. W. (2001) Writing multiple-choice test items that promote and measure critical thinking, Journal of Nursing Education, 40 (1), pp. 17-24.
Moss, E. (2001) Multiple choice questions: Their value as an assessment tool, Current Opinion in Anaesthesiology, 14 (6), pp. 661-666.
Mrejen, S. and Spaide, R. F. (2013) Optical coherence tomography: Imaging of the choroid and beyond, Survey of Ophthalmology, 58 (5), pp. 387-429.
Muen, W. J. and Hewick, S. A. (2011) Quality of optometry referrals to neovascular age-related macular degeneration clinic: A prospective study, JRSM Short Rep, 2 (8), pp. 64.
Myint, J., Edgar, D. F., Kotecha, A., Crabb, D. P. and Lawrenson, J. G. (2010) Development of a competency framework for optometrists with a specialist interest in glaucoma, Eye, 24 (9), pp. 1509-1514.
205
Nadler, Z., Wollstein, G., Ishikawa, H. and Schuman, J. S. (2012) Clinical application of ocular imaging, Optometry and Vision Science, 89 (5), pp. 543-553.
Newington, L. and Metcalfe, A. (2014) Factors influencing recruitment to research: Qualitative study of the experiences and perceptions of research teams, BMC Medical Research Methodology, 14 (1), Article 10.
Norman, G., Sherbino, J., Dore, K., Wood, T., Young, M., Gaissmaier, W. et al. (2014) The etiology of diagnostic errors: A controlled trial of system 1 versus system 2 reasoning, Academic Medicine, 89 (2), pp. 277-284.
Norman, G. R., Brooks, L. R., Coblentz, C. L. and Babcook, C. J. (1992) The correlation of feature identification and category judgments in diagnostic radiology, Memory & Cognition, 20 (4), pp. 344-355.
Nouri-Mahdavi, K., Nassiri, N., Giangiacomo, A. and Caprioli, J. (2011) Detection of visual field progression in glaucoma with standard achromatic perimetry: A review and practical implications, Graefe's Archive for Clinical and Experimental Ophthalmology, 249 (11), pp. 1593-1616.
Oliver-Fernandez A., Bakal J., Segal S., Shah G.K., Dugar A. and Sharma S. (2005) Progression of visual loss and time between initial assessment and treatment of wet age-related macular degeneration, Canadian Journal of Ophthalmology, 40 (3), pp. 313-319.
Olson, J., Sharp, P., Goatman, K., Prescott, G., Scotland, G., Fleming, A. et al. (2013) Improving the economic value of photographic screening for optical coherence tomography-detectable macular oedema: A prospective, multicentre, UK study, Health Technology Assessment, 17 (51), pp. 1-141.
Palmer, E. J. and Devitt, P. G. (2007) Assessment of higher order cognitive skills in undergraduate education: Modified essay or multiple choice questions? Research paper, BMC Medical Education, 7.
Panda-Jonas, S., Jonas, J. B. and Jakobczyk-Zmija, M. (1996) Retinal pigment epithelial cell count, distribution, and correlations in normal human eyes, American Journal of Ophthalmology, 121 (2), pp. 181-189.
Park, J., Jo, J. A., Shrestha, S., Pande, P., Wan, Q. and Applegate, B. E. (2010) A dual-modality optical coherence tomography and fluorescence lifetime imaging microscopy system for simultaneous morphological and biochemical tissue characterization, Biomedical Optics Express, 1 (1), pp. 186-200.
Patel, P. J., Chen, F. K., Ikeji, F., Richardson, M., Cruz, L. D. and Tufail, A. (2011) Intrasession repeatability of optical coherence tomography measures in active neovascular age-related macular degeneration, Acta Ophthalmologica, 89 (6), pp. 526-532.
Pauker, S. G. and Kassirer, J. P. (1980) The threshold approach to clinical decision making, New England Journal of Medicine, 302 (20), pp. 1109-1117.
Peabody, J. W., Luck, J., Glassman, P., Dresselhaus, T. R. and Lee, M. (2000) Comparison of vignettes, standardized patients, and chart abstraction: A prospective validation study of 3 methods for measuring quality, Journal of the American Medical Association, 283 (13), pp. 1715-1722.
206
Peabody, J. W., Luck, J., Glassman, P., Jain, S., Hansen, J., Spell, M. et al. (2004) Measuring the quality of physician practice by using clinical vignettes: A prospective validation study, Annals of Internal Medicine, 141 (10), pp. 771-780.
Pelaccia, T., Tardif, J., Triby, E., Ammirati, C., Bertrand, C., Dory, V. et al. (2014) How and when do expert emergency physicians generate and evaluate diagnostic hypotheses? A qualitative study using head-mounted video cued-recall interviews, Annals of Emergency Medicine, 64 (6), pp. 575-585.
Pomorska, M., Krzyzanowska-Berkowska, P., Misiuk-Hojlo, M., Zajac-Pytrus, H. and Grzybowski, A. (2012) Application of optical coherence tomography in glaucoma suspect eyes, Clinical and Experimental Optometry, 95 (1), pp. 78-88.
Powell C. (2003) The Delphi technique: Myths and realities, Journal of Advanced Nursing, 41 (4), pp. 376-382.
Prajapati, B., Dunne, M. and Armstrong, R., 2010. Sample size estimation and statistical power analyses. Optometry today, 16(07), pp.10-18.
Probert, C. (2016) Examination of the retina. MA Healthcare. Available from:
https://www.opticianonline.net/cet-archive/128 [Accessed 04/01/2017].
Provis, J. M., Dubis, A. M., Maddess, T. and Carroll, J. (2013) Adaptation of the central retina for high acuity vision: Cones, the fovea and the avascular zone, Progress in Retinal and Eye Research, 35, pp. 63-81.
Puzyeyeva, O. (2011) High-resolution optical coherence tomography retinal imaging: A case series illustrating potential and limitations, Journal of Ophthalmology, (Article ID 764183), pp. 1-6.
Quigley, H. A., Dunkelberger, G. R. and Green, W. R. (1989) Retinal ganglion cell atrophy correlated with automated perimetry in human eyes with glaucoma, American Journal of Ophthalmology, 107 (5), pp. 453-464.
Ramseier, C. A., Ivanovic, A., Woermann, U. and Mattheos, N. (2012) Evaluation of a web-based application versus conventional instruction in the undergraduate curriculum of fixed prosthodontics, European Journal of Dental Education, 16 (4), pp. 224-231.
Ray, R., Stinnett, S. S. and Jaffe, G. J. (2005) Evaluation of image artifact produced by optical coherence tomography of retinal pathology, American Journal of Ophthalmology, 139 (1), pp. 18-29.
Rebolleda, G. and Muñoz-Negrete, F. J. (2009) Follow-up of mild papilledema in idiopathic intracranial hypertension with optical coherence tomography, Investigative Ophthalmology and Visual Science, 50 (11), pp. 5197-5200.
Reeves, B. C., Scott, L. J., Taylor, J., Hogg, R., Rogers, C. A., Wordsworth, S. et al. (2016) The Effectiveness, cost-effectiveness and acceptability of Community versus Hospital Eye Service follow-up for patients with neovascular age-related macular degeneration with quiescent disease (ECHoES): A virtual randomised balanced incomplete block trial, Health Technology Assessment, 20 (80), pp. 1-120.
Regatieri, C. V., Branchini, L. and Duker, J. S. (2011) The role of spectral-domain OCT in the diagnosis and management of neovascular age-related macular degeneration. Ophthalmic
207
Surgery, Lasers & Imaging : The Official Journal of the International Society for Imaging in the Eye, 42 Suppl , pp. 56-66.
Restori, M. (2008) Imaging the vitreous: Optical coherence tomography and ultrasound imaging, Eye, 22 (10), pp. 1251-1256.
Royal College of Ophthalmologists (2009) Age-related macular degeneration: Guidelines for management. http://www.rcophth.ac.uk/page.asp?section=451§ionTitle=Clinical+Guidelines Royal College of Ophthalmologists. [Accessed 04/01/2016].
Royal College of Radiologists (2010) Standards for the provision of teleradiology within the UnitedKingdom. Available from:
https://www.rcr.ac.uk/sites/default/files/docs/radiology/pdf/BFCR%2810%297_Stand_telerad.pdf [Accessed accessed 31/03/2017].
Ruiz, J. G., Mintzer, M. J. and Leipzig, R. M. (2006) The impact of e-learning in medical education, Academic Medicine, 81 (3), pp. 207-212.
Sadda, S. R., Wu, Z., Walsh, A. C., Richine, L., Dougall, J., Cortez, R. et al. (2006) Errors in retinal thickness measurements obtained by optical coherence tomography, Ophthalmology, 113 (2), pp. 285-293.
Salem, W., Fraser-Bell, S. and Gillies, M. (2012) Clinical development of new treatments for diabetic macular oedema, Clinical and Experimental Optometry, 95 (3), pp. 297-305.
Salim, S. (2012) The role of anterior segment optical coherence tomography in glaucoma, Journal of Ophthalmology, (Article ID 476801), pp. 1-9.
Sayanagi, K., Sharma, S., Yamamoto, T. and Kaiser, P. K. (2009) Comparison of Spectral-Domain versus Time-Domain Optical Coherence Tomography in Management of Age-Related Macular Degeneration with Ranibizumab, Ophthalmology, 116 (5), pp. 947-955.
Schmitt, J. M., Knuttel, A., Yadlowsky, M. and Eckhaus, M. A. (1994) Optical-coherence tomography of a dense tissue: Statistics of attenuation and backscattering, Physics in Medicine and Biology, 39 (10), pp. 1705-1720.
Schuman, J. S. (2008) Spectral domain optical coherence tomography for glaucoma (an AOS thesis), Transactions of the American Ophthalmological Society, 106, pp. 426-458.
Schütze, C., Ahlers, C., Sacu, S., Mylonas, G., Sayegh, R., Golbaz, I. et al. (2011) Performance of OCT segmentation procedures to assess morphology and extension in geographic atrophy, Acta Ophthalmologica, 89 (3), pp. 235-240.
Scouller, K. (1998) The influence of assessment method on students' learning approaches: Multiple choice question examination versus assignment essay, Higher Education, 35 (4), pp. 453-472.
Shah, R., Edgar, D. and Evans, B. J. W. (2007) Measuring clinical practice, Ophthalmic and Physiological Optics, 27 (2), pp. 113-125.
Sibbald, B. and Roland, M. (1998) Understanding controlled trials: Why are randomised controlled trials important? BMJ, 316 (7126), p. 201.
208
Sibbald, M., de Bruin, A. B. H. and van Merrienboer, J. J. G. (2013) Checklists improve experts' diagnostic decisions, Medical Education, 47 (3), pp. 301-308.
Sickenberg M. (2001) Early detection, diagnosis and management of choroidal neovascularization in age-related macular degeneration: The role of ophthalmologists, Ophthalmologica, 215 (4), pp. 247-253.
Slawson, D. C. and Shaughnessy, A. F. (2005) Teaching evidence-based medicine: Should we be teaching information management instead? Academic Medicine, 80 (7), pp. 685-689.
Sommer, A., Katz, J., Quigley, H. A., Miller, N. R., Robin, A. L., Richter, R. C. et al. (1991) Clinically Detectable Nerve Fiber Atrophy Precedes the Onset of Glaucomatous Field Loss, Archives of Ophthalmology, 109 (1), pp. 77-83.
Soubrane, G., Cruess, A., Lotery, A., Pauleikhoff, D., Monès, J., Xu, X. et al. (2007) Burden and health care resource utilization in neovascular age-related macular degeneration: Findings of a multicountry study, Archives of Ophthalmology, 125 (9), pp. 1249-1254.
Spaide(2), R. F., Fujimoto, J. G. and Waheed, N. K. (2015) Image artifacts in Optical coherence tomography angiography, Retina, 35 (11), pp. 2163-2180.
Spaide(1), R. F., Klancnik, J. M., Jr. and Cooney, M. J. (2015) Retinal vascular layers imaged by fluorescein angiography and optical coherence tomography angiography, JAMA Ophthalmology, 133 (1), pp. 45-50.
Staurenghi, G., Sadda, S., Chakravarthy, U. and Spaide, R. F. (2014) Proposed lexicon for anatomic landmarks in normal posterior segment spectral-domain optical coherence tomography: The IN•OCT consensus, Ophthalmology, 121 (8), pp. 1572-1578.
Steel, D. H. W. and Lotery, A. J. (2013) Idiopathic vitreomacular traction and macular hole: A comprehensive review of pathophysiology, diagnosis, and treatment, Eye (Basingstoke), 27 (SUPPL), pp. 1-21.
Stovall, T. G. and Ling, F. W. (1993) Ectopic pregnancy: Diagnostic and therapeutic algorithms minimizing surgical intervention, Journal of Reproductive Medicine for the Obstetrician and Gynecologist, 38 (10), pp. 807-812.
Sudheendran, N., Mohamed, M., Ghosn, M. G., Tuchin, V. V. and Larin, K. V. (2010) Assessment of tissue optical clearing as a function of glucose concentration using optical coherence tomography, Journal of Innovative Optical Health Sciences, 3 (3), pp. 169-176.
Tah, V., Keane, P., Esposti, S., Allimuthu, J., Chen, F., Cruz, L. et al. (2014) Repeatability of retinal thickness and volume metrics in neovascular age-related macular degeneration using the Topcon 3-D OCT 1000, Indian Journal of Ophthalmology, 62 (9), pp. 941-948.
Talu, S. D. (2013) Optical coherence tomography in the diagnosis and monitoring of retinal diseases, ISRN Biomed Img., 2013, pp. 1-13.
Tan, O., Chopra, V., Lu, A. T. -., Schuman, J. S., Ishikawa, H., Wollstein, G. et al. (2009) Detection of Macular Ganglion Cell Loss in Glaucoma by Fourier-Domain Optical Coherence Tomography, Ophthalmology, 116 (12), pp. 2305-2314.e2.
Tang H. and Ng J.H.K. (2006) Googling for a diagnosis - Use of Google as a diagnostic aid: Internet based study, British Medical Journal, 333 (7579), pp. 1143-1145.
209
Tariq, Y. M., Li, H., Burlutsky, G. and Mitchell, P. (2012) Retinal nerve fiber layer and optic disc measurements by spectral domain OCT: Normative values and associations in young adults, Eye (Basingstoke), 26 (12), pp. 1563-1570.
Taylor, L. and Parsons, J. (2011) Improving student engagement, Current Issues in Education, 14 (1), pp. 1-32.
Thangaratinam, S. and Redman, C. W. (2005) The Delphi technique, The Obstetrician & Gynaecologist, 7 (2), pp. 120-125.
The BMJ (2017) Use of images. The BMJ. Available from: http://www.bmj.com/about-bmj/resources-authors/forms-policies-and-checklists/use-images [Accessed 23/12/13].
Theophilides, C. and Koutselini, M. (2000) Study Behavior in the Closed-Book and the Open-Book Examination: A Comparative Analysis, Educational Research and Evaluation, 6 (4), pp. 379-393.
Thomas, D. and Duguid, G. (2004) Optical coherence tomography - A review of the principles and contemporary uses in retinal investigation, Eye, 18 (6), pp. 561-570.
Tielsch, J. M., Sommer, A., Katz, J., Royall, R. M., Quigley, H. A. and Javitt, J. (1992) Racial variations in the prevalence of primary open-angle glaucoma: The Baltimore eye survey, Journal of the American Medical Association, 266 (3), pp. 369-374.
Tofli, C. A., Narayan, D. G., Boppart, S. A., Hcc, M. R., Fujimoto, J. G., Bimgmbcr, R. et al. (1997) A comparison of retinal morphology viewed by optical coherence tomography and by light microscopy, Archives of Ophthalmology, 115 (11), pp. 1425-1428.
Trichonas, G. and Kaiser, P. K. (2014) Optical coherence tomography imaging of macular oedema, British Journal of Ophthalmology, 98 (SUPPL. 2), pp. 24-29.
Van den Ende, J. (2005) Letter to editor: Why clinicians outperform algorithms, not only thanks to Rev Bayes. BMJ. Available from:
http://www.bmj.com/rapid-response/2011/10/30/why-clinicians-outperform-algorithms-not-only-thanks-reverend-bayes [Accessed 31/12/2016].
Vecino, E., Rodriguez, F., Ruzafa, N., Pereiro, X. and Sharma, S. C. (2016) Glia-neuron interactions in the mammalian retina, Progress in Retinal and Eye Research, 51 , pp. 1-40.
Velan, G. M., Jones, P., McNeil, H. P. and Kumar, R. K. (2008) Integrated online formative assessments in the biomedical sciences for medical students: Benefits for learning, BMC Medical Education, 8, 52, pp. 1-11
Violato, M., Dakin, H., Chakravarthy, U., Reeves, B. C., Peto, T., Hogg, R. E. et al. (2016) Cost-effectiveness of community versus hospital eye service follow-up for patients with quiescent treated age-related macular degeneration alongside the ECHoES randomised trial, BMJ Open, 6 (10), pp. 1-12
Whittaker, K. W., Ikram, K., Anderson, D. F., Kiel, A. W. and Luff, A. J. (1999) Non-Communication between Ophthalmologists and Optometrists, Journal of the Royal Society of Medicine, 92 (5), pp. 247-248.
Wilde, C., Poostchi, R., Mehta, R., MacNab, H., Hillman, J., Vernon, S. et al. (2017) Prevalence of age-related macular degeneration in an elderly UK Caucasian population - The

210
Bridlington Eye Assessment Project: a cross sectional study, Eye (Lond). 2017 Mar 10. doi: 10.1038/eye.2017.30. [Epub ahead of print]. (accessed 31/05/2017). Available at:
http://www.nature.com/eye/journal/vaop/ncurrent/abs/eye201730a.html
Williams, J. B. and Wong, A. (2009) The efficacy of final examinations: A comparative study of closed-book, invigilated exams and open-book, open-web exams, British Journal of Educational Technology, 40 (2), pp. 227-236.
Yousuf, M. I. (2007) Using experts' opinions through Delphi technique, Practical Assessment, Research and Evaluation, 12 (4), pp. 1-6
Yunoki, T., Miyakoshi, A., Nakamura, T., Fujita, K., Fuchizawa, C. and Hayashi, A. (2012) Treatment of macular edema due to branch retinal vein occlusion with single or multiple intravitreal injections of bevacizumab, Japanese Journal of Ophthalmology, 56 (2), pp. 159-164.
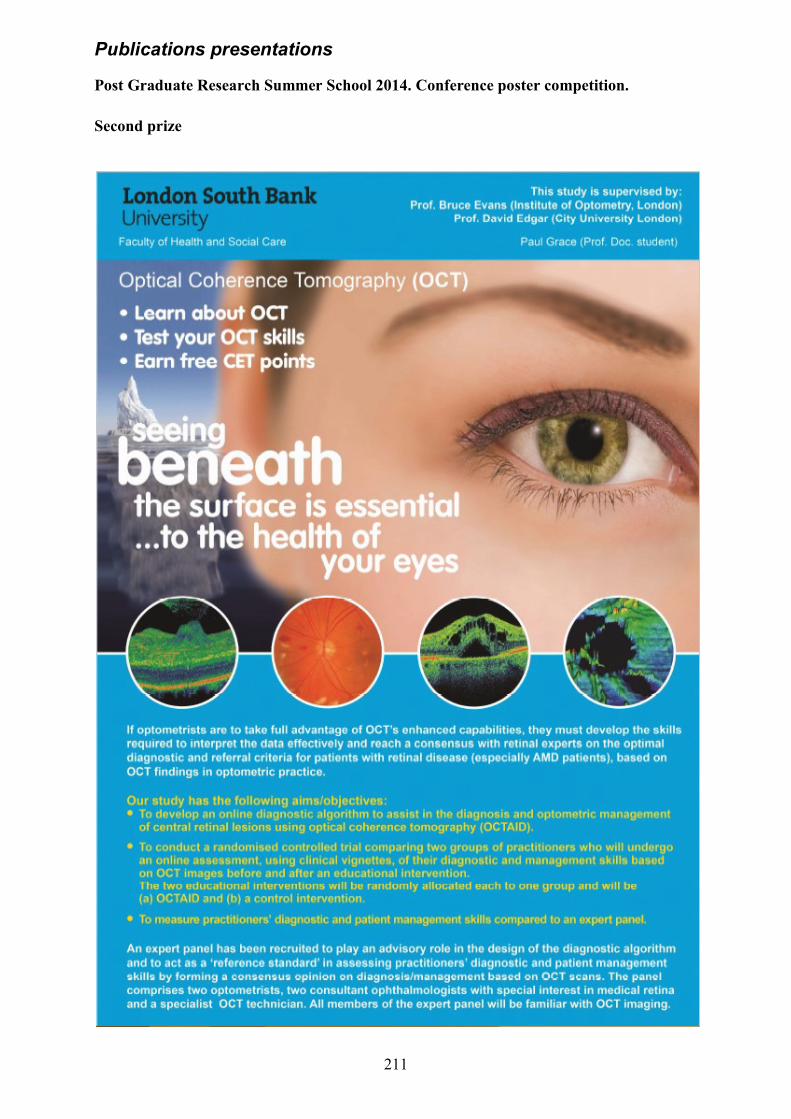
211
Publications presentations
Post Graduate Research Summer School 2014. Conference poster competition.
Second prize
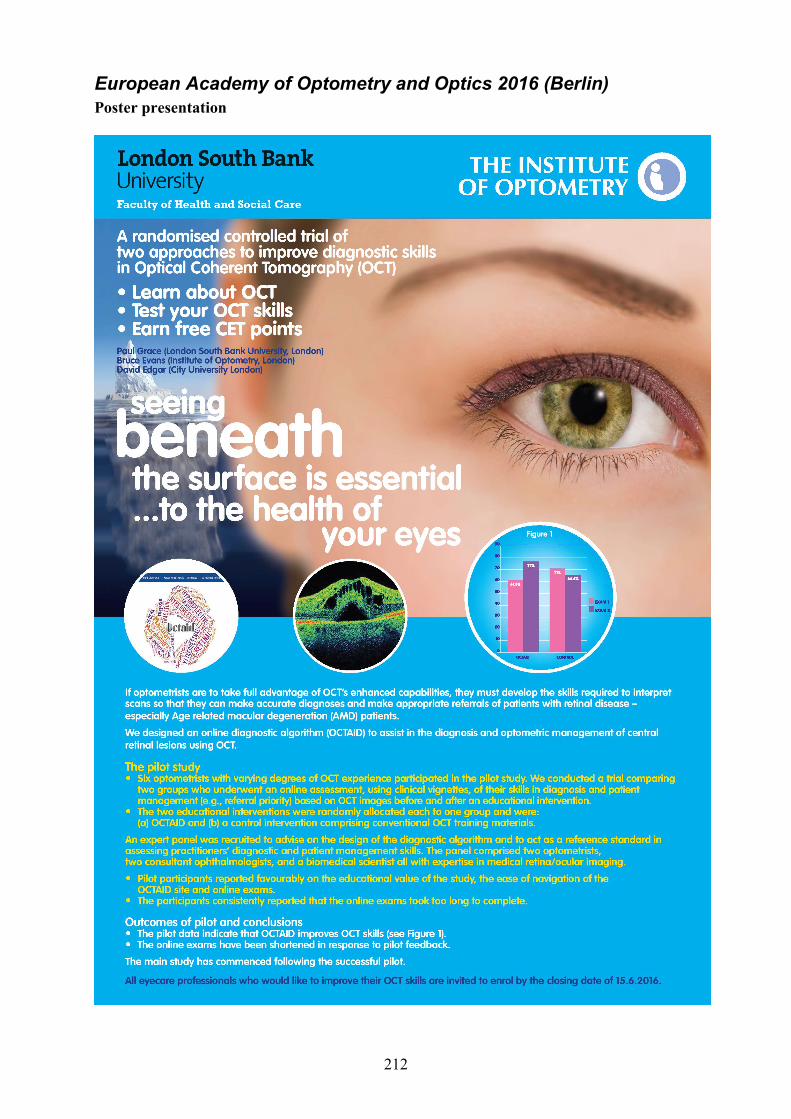
212
European Academy of Optometry and Optics 2016 (Berlin) Poster presentation
213
Research ethics committee documentation Governance : Administration Of Research Ethics Committee <[email protected]>
06/06/2013
to bjwe, Pamela, d.f.edgar, me
Dear Paul Thank you for your revised documents for your application to the University Research Ethics Committee entitled:Investigation of the efficacy of an online diagnostic algorithm for improving the optometric referral and diagnosis of ocular fundus lesions detected with Optical Coherence Tomography (OCT) (UREC 1307). I can now give full Chair's Approval. Best wishes for your research. A formal letter will be sent in due course. Sincerely Joan Professor Joan Curzio University Research Ethics Committee London South Bank University 106 Borough Road LONDON SE1 0AA
From: Paul Grace [[email protected]] Sent: 13 May 2013 08:56 To: Governance : Administration Of Research Ethics Committee Subject: Paul Grace Prof Doc Allied Health Resubmission
London South Bank University is a charity and a company limited by guarantee. Registered in England no. 986761. Registered Office: 103 Borough Road, London SE1 0AA.
Ronald Rabbetts, MSc, FCOptom, SMSA, DCLP 31 Warblington Street PORTSMOUTH, PO1 2ET Phone: 023 92816571 Email: [email protected] The Chair London South Bank University Research and Ethical Committee London 27 February 2013 Dear Sir/Madam Ref: Doctorate of Optometry application Paul Grace Investigation of the efficacy of an online diagnostic algorithm for improving the optometric referral and diagnosis of ocular fundus lesions detected with Optical Coherence Tomography (OCT) As Chairman of the Institute of Optometry's Research and Ethical Committee, I report that this application together with its documentation has been reviewed by the Institute's REC, and that Paul Grace has reviewed and corrected as appropriate the various minor suggestions and criticisms suggested by my committee members. Hence I confirm that the Institute of Optometry's Research and Ethical Committee now approves the application. Yours sincerely Ronald Rabbetts