DATA QUALITY ASSURANCE - WHO | World Health ...
40
Module 1 Framework and metrics version update - December 2020 DATA QUALITY ASSURANCE DATA QUALITY ASSURANCE
-
Upload
khangminh22 -
Category
Documents
-
view
1 -
download
0
Transcript of DATA QUALITY ASSURANCE - WHO | World Health ...

Module 1Framework and metricsversion update - December 2020
DATA QUALITY ASSURANCEDATA QUALITY ASSURANCEDATA QUALITY ASSURANCEDATA QUALITY ASSURANCE


Module 1Framework and metricsversion update - December 2020

Data quality review: a toolkit for facility data quality assessment. Module 1. Framework and metrics
ISBN 978-92-4-151272-5
© World Health Organization 2020
Some rights reserved. This work is available under the Creative Commons Attribution-NonCommercial-ShareAlike 3.0 IGO licence (CC BY-NC-SA 3.0 IGO; https://creativecommons. org/licenses/by-nc-sa/3.0/igo).
Under the terms of this licence, you may copy, redistribute and adapt the work for non-commercial purposes, provided the work is appropriately cited, as indicated below. In any use of this work, there should be no suggestion that WHO endorses any specific organization, products or services. The use of the WHO logo is not permitted. If you adapt the work, then you must license your work under the same or equivalent Creative Commons licence. If you create a translation of this work, you should add the following disclaimer along with the suggested citation: “This translation was not created by the World Health Organization (WHO). WHO is not responsible for the content or accuracy of this translation. The original English edition shall be the binding and authentic edition”.
Any mediation relating to disputes arising under the licence shall be conducted in accordance with the mediation rules of the World Intellectual Property Organization.
Suggested citation. Data quality review: a toolkit for facility data quality assessment. Module 1. Framework and metrics. Geneva: World Health Organization; 2017. Licence: CC BY-NC-SA 3.0 IGO.
Cataloguing-in-Publication (CIP) data. CIP data are available at http://apps.who.int/iris.
Sales, rights and licensing. To purchase WHO publications, see http://apps.who.int/bookorders. To submit requests for commercial use and queries on rights and licensing, see http://www.who.int/about/licensing.
Third-party materials. If you wish to reuse material from this work that is attributed to a third party, such as tables, figures or images, it is your responsibility to determine whether permission is needed for that reuse and to obtain permission from the copyright holder. The risk of claims resulting from infringement of any third-party-owned component in the work rests solely with the user.
General disclaimers. The designations employed and the presentation of the material in this publication do not imply the expression of any opinion whatsoever on the part of WHO concerning the legal status of any country, territory, city or area or of its authorities, or concerning the delimitation of its frontiers or boundaries. Dotted and dashed lines on maps represent approximate border lines for which there may not yet be full agreement.
The mention of specific companies or of certain manufacturers’ products does not imply that they are endorsed or recommended by WHO in preference to others of a similar nature that are not mentioned. Errors and omissions excepted, the names of proprietary products are distinguished by initial capital letters.
All reasonable precautions have been taken by WHO to verify the information contained in this publication. However, the published material is being distributed without warranty of any kind, either expressed or implied. The responsibility for the interpretation and use of the material lies with the reader. In no event shall WHO be liable for damages arising from its use.
Design and layout by L’IV Com Sàrl
Cont
ents
List of tablesTable 1.1. Recommended core indicators for the DQRTable 1.2. Data quality dimension, metrics and standard benchmarks
List of figuresFigure 1. The DQR methodologyFigure 2. Interaction of the disparate data quality activities
ContentsAcknowledgements . . . . . . . . . . . . . . . . . . . . . . . . . . . . . . . . . . . . . . . . . . . . . . . . . . . . . . . . . . . . . . . . . . v
Abbreviations . . . . . . . . . . . . . . . . . . . . . . . . . . . . . . . . . . . . . . . . . . . . . . . . . . . . . . . . . . . . . . . . . . . . . . . vi
Chapter 1. Background . . . . . . . . . . . . . . . . . . . . . . . . . . . . . . . . . . . . . . . . . . . . . . . . . . . . . . . . . . . . . . . 1
Chapter 2. Overview . . . . . . . . . . . . . . . . . . . . . . . . . . . . . . . . . . . . . . . . . . . . . . . . . . . . . . . . . . . . . . . . . 2
Objectives . . . . . . . . . . . . . . . . . . . . . . . . . . . . . . . . . . . . . . . . . . . . . . . . . . . . . . . . . . . . . . . . . . . . . . . 2
Scope of the DQR toolkit . . . . . . . . . . . . . . . . . . . . . . . . . . . . . . . . . . . . . . . . . . . . . . . . . . . . . . . . . . 2
Chapter 3. DQR methodology and resources . . . . . . . . . . . . . . . . . . . . . . . . . . . . . . . . . . . . . . . . . . . 4
Overall framework . . . . . . . . . . . . . . . . . . . . . . . . . . . . . . . . . . . . . . . . . . . . . . . . . . . . . . . . . . . . . . . . 4
Desk review . . . . . . . . . . . . . . . . . . . . . . . . . . . . . . . . . . . . . . . . . . . . . . . . . . . . . . . . . . . . . . . . . . . . . . 5
Site assessment of data quality: data verification and system assessment . . . . . . . . . . . . 10
Chapter 4. Data quality metrics . . . . . . . . . . . . . . . . . . . . . . . . . . . . . . . . . . . . . . . . . . . . . . . . . . . . . . 15
Core indicators . . . . . . . . . . . . . . . . . . . . . . . . . . . . . . . . . . . . . . . . . . . . . . . . . . . . . . . . . . . . . . . . . . 15
Dimensions of data quality . . . . . . . . . . . . . . . . . . . . . . . . . . . . . . . . . . . . . . . . . . . . . . . . . . . . . . . 17
Definitions, benchmarks and cut-offs . . . . . . . . . . . . . . . . . . . . . . . . . . . . . . . . . . . . . . . . . . . . . 19
Chapter 5. Governance, coordination, dissemination and use of results . . . . . . . . . . . . . . . . . 23
Governance and coordination . . . . . . . . . . . . . . . . . . . . . . . . . . . . . . . . . . . . . . . . . . . . . . . . . . . . 23
Dissemination and use of results . . . . . . . . . . . . . . . . . . . . . . . . . . . . . . . . . . . . . . . . . . . . . . . . . . 25
Annex 1: Recommended indicators . . . . . . . . . . . . . . . . . . . . . . . . . . . . . . . . . . . . . . . . . . . . . . . . . . 27
Core indicators . . . . . . . . . . . . . . . . . . . . . . . . . . . . . . . . . . . . . . . . . . . . . . . . . . . . . . . . . . . . . . . . . . 27
Additional indicators . . . . . . . . . . . . . . . . . . . . . . . . . . . . . . . . . . . . . . . . . . . . . . . . . . . . . . . . . . . . 27
iii

Data
Qua
lity A
ssur
ance
. Mod
ule 1
: Fra
mew
ork a
nd m
etric
s
Content of the toolkit
The DQR toolkit includes guidelines, tools and other resources for countries to implement and institutionalize a system for assuring the quality of their health-facility data. The following schema shows the different resources available that are further described within the document. These resources are also available for download at the following link: https://www.who.int/healthinfo/tools_data_analysis/en
Overall framework
and implementation
Module 1Framework and metricsversion update - December 2020
DATA QUALITY ASSURANCEDATA QUALITY ASSURANCEDATA QUALITY ASSURANCEDATA QUALITY ASSURANCE
Desk review of data quality
Module 2Discrete desk review of data quality
DATA QUALITY ASSURANCEDATA QUALITY ASSURANCE
Site assessment of data quality
Site assessment of data quality: data verification and system assessment
Module 3
DATA QUALITY ASSURANCEDATA QUALITY ASSURANCE
Data collection tool for discrete site assessment in (MS-Word and CSPro) with a user manual for
CSPro application
Training materials for data verification and system assessments
MS Excel analysis tool for facility/district data verification and
system assessment (with user guides)
Supervisory checklists in MS Excel
(with user guide)
Current document
Site assessment of data quality: data verification and system assessment
Module 3
i m p l e m e n tat i o n g u i d e
DATA QUALITY ASSURANCEDATA QUALITY ASSURANCE
Training materials for desk review of
data quality
WHO Deskreview tool in MS Excel
(with user guide) DQ app (with user guide)
Module 2Discrete desk review of data qualityi m p l e m e n tat i o n g u i d e
Please supply barcodes
DATA QUALITY ASSURANCEDATA QUALITY ASSURANCEDATA QUALITY ASSURANCEDATA QUALITY ASSURANCE
iv

Ackn
owle
dgem
ents
Acknowledgements
This toolkit is the result of collaboration between the World Health Organization (WHO), The Global Fund to Fight AIDS, Tuberculosis and Malaria (The Global Fund), Gavi, the Vaccine Alliance (Gavi) and the United States Agency for International Development (USAID)/MEASURE Evaluation.
The toolkit proposes a unified approach to data quality. It integrates and builds upon previous and current tools and methods designed to assess data quality at facility level, taking into account best practices and lessons learned from many countries.
Kavitha Viswanathan oversaw the technical development of the toolkit, with overall guidance provided by Kathryn O’Neill and with technical input from Ties Boerma, David Boone, Hong Anh Chu, Robert Pond, Olav Poppe, Claire Preaud, Ashley Sheffel, Amani Siyam, Knut Staring, Marina Takane and Wendy Venter.
All modules in the toolkit are based on technical contributions from WHO departments and external partners. The WHO departments included the Expanded Programme on Immunization, Global HIV Programme, Global Malaria Programme, Global Tuberculosis Programme, and Reproductive, Maternal, Newborn, Child, Adolescent Health (RMNCAH) and other agencies including the Global Fund, Gavi, John Snow/Measure Evaluation, University of Oslo and collaborating Health Information Systems Programme (HISP).
Particular thanks are due to the country partners that tested and implemented different components of the approach and provided valuable feedback, namely: Benin, Burkina Faso, Cote d’Ivoire, Cambodia, Democratic Republic of the Congo, Kenya, Mauritania, Sierra Leone, South Sudan, Togo, Uganda, Zambia, and Zanzibar in United Republic of Tanzania.
This toolkit has been produced with the support of grants from the Bloomberg Philanthropies Data for Health Initiative; Gavi; the Global Fund to Fight AIDS, Tuberculosis and Malaria; and the Norwegian Agency for Development Cooperation (Norad).
v

Data
Qua
lity A
ssur
ance
. Mod
ule 1
: Fra
mew
ork a
nd m
etric
s
Abbreviations
ANC Antenatal careART Antiretroviral therapyDHIS 2 Web-based, open source software used by countries chiefly as their health
information system for data management and monitoring of health programmes
DQIP Data quality improvement planDQR Data quality reviewDTP Diphtheria-tetanus-pertussisDTP3 Diphtheria-tetanus-pertussis three-dose vaccineGavi Gavi, the Vaccine AllianceHIV Human immunodeficiency virusHMIS Health management information systemIPT Intermittent preventive therapyMCV Measles-containing vaccineMDR-TB Multidrug resistant tuberculosisNGO Nongovernmental organizationPCV Pneumococcal conjugate vaccinePenta Pentavalent vaccinePMTCT Prevention of mother-to-child transmissionRDT Rapid diagnostic testRR Rifampicin-resistantSD Standard deviationTB TuberculosisThe Global Fund The Global Fund to Fight AIDS, Tuberculosis and Malaria TT Tetanus toxoid vaccineUSAID United States Agency for International Development WHO World Health Organization
vi

Chap
ter 1
. Bac
kgro
und
Chapter 1. Background
High-quality data is essential to monitor progress towards the Sustainable Development Goals (SDGs), WHO Triple Billion targets and national or subnational health priorities. It is also vital to strengthen country capacity to prevent, prepare for and respond to health emergencies such as COVID-19. Timely, reliable, actionable data is essential for delivering interventions to improve the health of populations1.
The recently published global reporton country capacity on health data and systems using the SCORE technical package, has highlighted that improving data quality is essential for policy and planning. Data availability does not automatically translate into availability of the quality data needed for policy, planning and patient health care. Data quality is a critical issue for health facilities with about 40% of countries not showing clear evidence that data quality assurance processes have been followed for their published health facility data.
The national health management information system (HMIS) and health and disease programme-specific reporting systems (where they exist) collect data on routine health services from health facilities in the national health-care system. All data are subject to quality limitations such as missing values, bias, measurement error and human errors in data entry and computation. This is especially true for health-facility data. Data from health facilities are widely used for a variety of purposes – including reporting, health-sector reviews, planning, programme monitoring, quality improvement and patient monitoring. It is critical to have a system of data quality review and improvement to ensure there is confidence that these data meet their different purposes.
The data quality landscape has many different tools and efforts for examining the quality of health-facility data. While efforts to improve data quality are commendable, there are limitations to these tools and approaches. For instance:
Independent, uncoordinated assessments carried out separately by different actors make it difficult to assess the capacity of health facilities to produce quality data more holistically.
Different assessments are inefficient in both the use of resources and the increased burden on staff at the periphery.
Ad hoc assessments often use non-standardized methodologies, making results difficult to generalize or compare.
1 https://cdn.who.int/media/docs/default-source/world-health-data-platform/score/who_2021-01-31_global-report-score_tb_v2.pdf?sfvrsn=cf86a4fb_3&download=true
1

Data
Qua
lity A
ssur
ance
. Mod
ule 1
: Fra
mew
ork a
nd m
etric
s
There has been less focus on the routine and regular review of data as part of a routine reporting/feedback process.
Building on existing mechanisms to assure data quality, this data quality review (DQR) toolkit represents a collaborative effort of WHO, the Global Fund, Gavi and USAID/MEASURE Evaluation to promote a harmonized approach and a common language for assessing and improving the quality of health-facility data. The methodology and metrics have been developed and selected on the basis of broad consultation with international health programme experts from leading donor and technical assistance agencies. The goal of the DQR is to contribute to the improvement of the quality of data used by countries for routine monitoring, annual health-sector reviews, programme planning and evaluation and to facilitate decision-making.
2
Chap
ter 2
. Ove
rvie
w
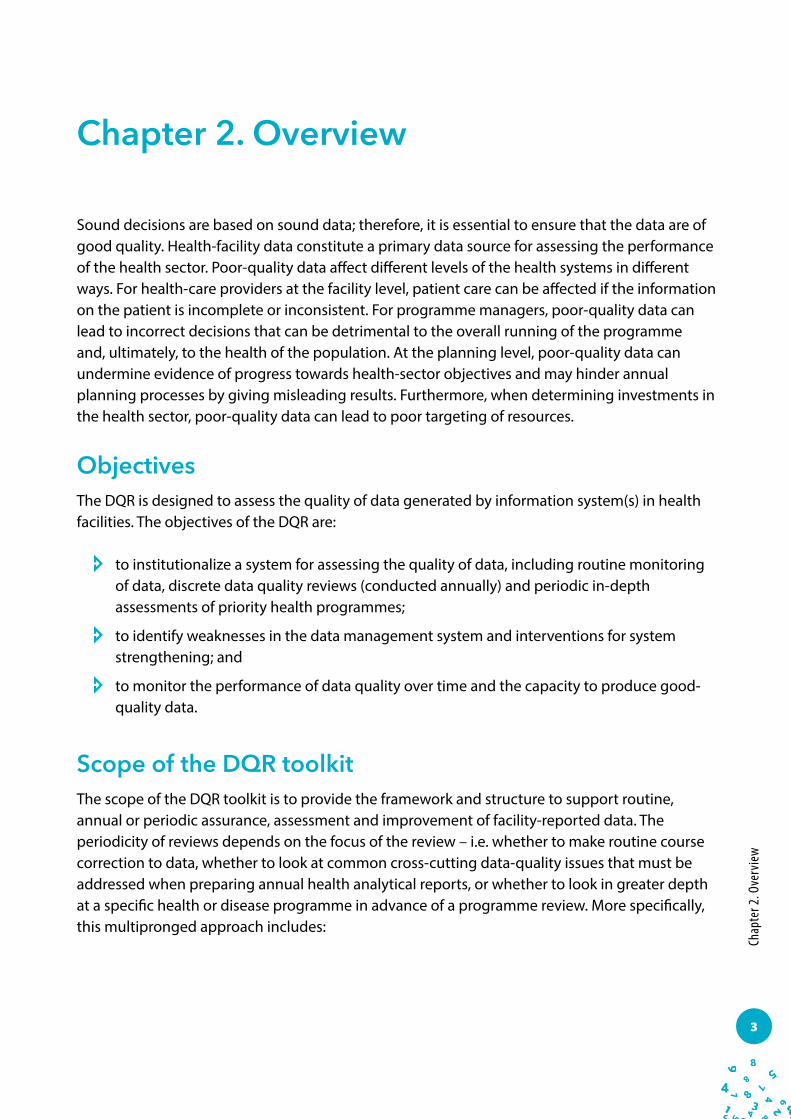
Chapter 2. Overview
Sound decisions are based on sound data; therefore, it is essential to ensure that the data are of good quality. Health-facility data constitute a primary data source for assessing the performance of the health sector. Poor-quality data affect different levels of the health systems in different ways. For health-care providers at the facility level, patient care can be affected if the information on the patient is incomplete or inconsistent. For programme managers, poor-quality data can lead to incorrect decisions that can be detrimental to the overall running of the programme and, ultimately, to the health of the population. At the planning level, poor-quality data can undermine evidence of progress towards health-sector objectives and may hinder annual planning processes by giving misleading results. Furthermore, when determining investments in the health sector, poor-quality data can lead to poor targeting of resources.
ObjectivesThe DQR is designed to assess the quality of data generated by information system(s) in health facilities. The objectives of the DQR are:
to institutionalize a system for assessing the quality of data, including routine monitoring of data, discrete data quality reviews (conducted annually) and periodic in-depth assessments of priority health programmes;
to identify weaknesses in the data management system and interventions for system strengthening; and
to monitor the performance of data quality over time and the capacity to produce good-quality data.
Scope of the DQR toolkitThe scope of the DQR toolkit is to provide the framework and structure to support routine, annual or periodic assurance, assessment and improvement of facility-reported data. The periodicity of reviews depends on the focus of the review – i.e. whether to make routine course correction to data, whether to look at common cross-cutting data-quality issues that must be addressed when preparing annual health analytical reports, or whether to look in greater depth at a specific health or disease programme in advance of a programme review. More specifically, this multipronged approach includes:
3

Data
Qua
lity A
ssur
ance
. Mod
ule 1
: Fra
mew
ork a
nd m
etric
s
Routine and regular reviews of data quality – or data quality assurance. These should be regular (e.g. monthly) reviews of data quality built into a system of checks of the HMIS or other programme reporting systems as part of a feedback cycle that identifies errors in near real-time so they can be corrected as they occur. This routine examination of data can be more holistic and either cross-cutting or programme-specific, and can be conducted by different users of data (e.g. HMIS managers, programme managers, etc.).
Discrete cross-sectional assessments. These are needed to look at the quality of health facility data being used both to measure the performance of the health sector and also for policy and planning purposes. While it is recommended that these assessments have an element of independence during implementation, it is very important that they are closely coordinated and managed by the Ministry of Health. Oversight from the Ministry of Health is critical for the ultimate use of these results to improve data quality. These assessments should be carried out before a planning cycle, such as in advance of an annual health-sector review (periodicity is country-specific).
Periodic in-depth programme-specific reviews of data quality. These should focus on a single disease or programme area and should be timed to meet the planning needs of the specific programmes (e.g. prior to programme reviews).
The DQR dimensions and metrics are universal and can be applied at the different levels of the health system in order to improve the quality of health-facility data. While these metrics can be relevant to patient-level data, for the current guidance the metrics are restricted to aggregate data.
4

Chap
ter 3
. DQR
Met
hodo
logy
and
reso
urce
s
Chapter 3. DQR methodology and resources
The DQR methodology comprises two separate processes (Figure 1), namely:
A desk review – a review of the quality of existing aggregated reported data, using standardized data-quality metrics. This can be done as part of routine and regular data-quality checks or as a discrete/cross-sectional assessment.
A site assessment – an assessment of data quality that requires visits to health facilities and district offices and includes verification of source data and an assessment of system capabilities to produce quality data. The site assessment can be part of a routine data quality assurance cycle that includes supervision or it may be conducted as a discrete/cross-sectional assessment.
The DQR toolkit includes guidelines and tools that lay the basis for a common understanding of data quality so that a regular mechanism for data quality assurance and review can be institutionalized. The toolkit enables countries to use appropriate guidance and tools to conduct a data quality review. The resources are described below according to their different uses.
Overall frameworkThe two documents listed here give overviews of the DQR framework and toolkit, as well as details of their implementation.1
The overall DQR framework is described in Module 1 (i.e. the current document). This lays out the overarching framework of the DQR and introduces the methodology, metrics and the contents of the toolkit.
1 To download, see: https://www.who.int/healthinfo/tools_data_analysis/en/ (accessed28 October 2020).
Module 1Framework and metricsversion update - December 2020
DATA QUALITY ASSURANCEDATA QUALITY ASSURANCEDATA QUALITY ASSURANCEDATA QUALITY ASSURANCE
5

Data
Qua
lity A
ssur
ance
. Mod
ule 1
: Fra
mew
ork a
nd m
etric
s
Desk reviewThe desk review examines the quality of data collected across four dimensions, namely: 1) completeness; 2) internal consistency; 3) external comparison with other data sources; and 4) external consistency of population data (e.g. denominators). Within each dimension there are one or more metrics that measure different functions/components of data quality. These are described in a following section. While this guidance on data quality is intended for use by ministries of health with their HMIS data, the data quality dimensions and metrics can be applied to other information systems. No new data collection is required to conduct a desk review of data quality. A more extensive discussion of the desk review of data quality can be found in Module 2.
Conducting a desk review of data quality has two different purposes:
to be conducted as a discrete assessment of the quality of routine health facility data in order to measure the adequacy of the data being used for planning and health-sector monitoring;
to review health facility data continuously (e.g. monthly) to detect errors in aggregation and reporting for real-time correction.
Data quality desk review – a discrete assessmentPerformance of the desk review conducted as a discrete assessment is recommended before annual health-sector reviews to give an overview of the quality of the data across different programme areas in the routine health information system. This discrete desk review of data quality compares the performance of the country health information system with recommended benchmarks2 for quality and flags for further review any subnational administrative units which fail to attain the benchmark. At the same time, the desk review may identify some large – and possibly erroneous – outlier values which warrant investigation and, if necessary, correction (“data cleaning”) before analysis of the data can proceed.
2 User-defined benchmarks can be established at the discretion of assessment planners.
6

Chap
ter 3
. DQR
Met
hodo
logy
and
reso
urce
s
Some recommended criteria for the desk review include:
A core set of tracer indicators (usually 4–5) selected across programme areas (i.e. cross-cutting)3 are examined in relation to the four dimensions mentioned above. This cross-cutting desk review of the recommended programme indicators across quality dimensions quantifies problems of data completeness and consistency by individual programme areas. It also provides valuable information on the overall adequacy of health-facility data to support planning and annual monitoring.
Maintain an “element of independence” in the conduct, analysis and interpretation of this desk review. This involves having an unbiased analyst present during the data quality desk review process. (This is different from a routine, continuous review of data quality where the collectors and users of the data are managing and reviewing the data).
Ensure leadership from the Ministry of Health in the oversight of this process and the use of results to improve data quality.
Implement before a review event, such as a health-sector review.
Conduct the desk review in conjunction with the discrete site assessment (although the desk review may alternatively be conducted separately).
Resources to support discrete desk review of data qualityThe following resources are available to support implementation of discrete data quality desk reviews.4
Module 2: Discrete Desk review of data quality is the main guidance document for conducting a desk review of data quality. The contents of this guidance document apply to both the discrete desk review of data quality and the continuous review of data quality. Accompanied this document is the Module 2: Desk Review of data quality Implementation Guide that describes the process required for implementation.
A tool in Microsoft Excel will automate analyses of data quality metrics (for countries that do not have DHIS 2). This Excel tool, which is accompanied by a user’s guide, is recommended for the discrete desk review of data quality (that should be conducted before a health-sector review) but not for routine checks of data quality.5 While the Excel tool has been developed to conduct a cross-cutting desk review of data quality across multiple programme indicators, it can also be used to conduct a discrete programme-specific desk review of data quality.
3 While a discrete assessment can also be done for a specific programme, in this document and the rest of the DQR toolkit the discrete assessment refers to a cross-cutting examination of data quality. The metrics of DQR are applicable to a programme-specific data quality assessment.
4 To download, see: https://www.who.int/healthinfo/tools_data_analysis/dqr_desk_review/en/ (accessed 28 October 2020).5 This is primarily because the Excel tool is designed to examine data quality at a point in time and because it requires considerable effort to format the data
for importing to the tool and considerable effort to import the data (i.e. cutting and pasting of data) in order to calculate the data quality metrics. Use of the tool for routine checks would require this process to be carried out each time, thus making it very cumbersome.
7

Data
Qua
lity A
ssur
ance
. Mod
ule 1
: Fra
mew
ork a
nd m
etric
s
The DQR metrics are incorporated in the DHIS 2 software as part of the WHO Data Quality App. This app can be used for a cross-cutting discrete assessment or a programme-specific discrete assessment and can generate a report. The WHO Data Quality App can also be used for continuous monitoring of data quality (see the next section). It is accompanied by a user’s guide for initial set-up and implementation.6
Training materials have been developed to help support in-person training on conducting a desk review of data quality. These materials contain presentations, a facilitator’s guide, a participants’ manual and exercises that can be adapted for any data quality desk review training.
Continuous desk review of data qualityChecking data quality should not be limited to discrete, annual assessments. Continuous monitoring and correcting of data to assure quality should be part of the routine cycle of collection, reporting, feedback and use of data. Some key characteristics of the continuous desk review of data quality are:
It is not necessary to limit data quality analysis to the tracer indicators (although they should be considered for inclusion as they are key programme indicators). Users can examine different indicators against the data quality metrics (including programme-specific continuous reviews).
A minimum monthly review of data quality is recommended at the level of the health facility and health district as well as higher levels. Ultimately, however, a country’s standard operating procedures for data quality assurance should be followed.
Some of the dimensions and metrics that are used for the discrete desk review assessment – such as completeness and timeliness of data, internal consistency of data, or comparison
6 As indicated in the previous section and also in the Framework document, the discrete DQR is cross-cutting and compares data quality of indicators across different programmes. In DHIS 2, this cross-cutting analysis will be possible only for the indicators that are collected within DHIS 2. For example, if HIV indicators are not reported into DHIS 2, the discrete DQR with the recommended core indicators will not be possible in DHIS 2 and will have to be conducted in the Excel tool. However, a discrete DQR with a different set of cross-cutting indicators can nevertheless be conducted in DHIS 2 using the WHO DQ app.
Module 2Discrete desk review of data quality
DATA QUALITY ASSURANCEDATA QUALITY ASSURANCE
WHO Deskreview tool in MS Excel (with user
guide)
DQ app (with user guide)
Training materials for desk review of data
quality
Module 2Discrete desk review of data qualityi m p l e m e n tat i o n g u i d e
Please supply barcodes
DATA QUALITY ASSURANCEDATA QUALITY ASSURANCEDATA QUALITY ASSURANCEDATA QUALITY ASSURANCE
8

Chap
ter 3
. DQR
Met
hodo
logy
and
reso
urce
s
with other related programme data – can also be used for continuous monitoring. However, other dimensions, such as external comparisons with other data sources and external consistency of population data, should be conducted annually.
The continuous desk review is conducted by the collectors and users of data and does not require any element of independence.
This concept has been reflected in the district data quality assurance training package (https://cdn.who.int/media/docs/default-source/data-quality-pages/district-dqa---training-package_2021.02.24.pdf?sfvrsn=f9395c62_3)
Resources to support continuous desk review of data qualityThe following resources are available to support implementation of continuous data quality desk reviews.7
Module 2: Desk review of data quality is the main guidance document for conducting a desk review of data quality. The contents of this guidance document apply to both the discrete desk review of data quality and the continuous review of data quality .
The DQR metrics are incorporated in the DHIS 2 software as part of the WHO Data Quality App. This app has multiple functionalities, including a special dashboard for routine, continuous monitoring of the quality of selected tracer indicators (either a cross-cutting set or programme-specific sets), an analysis function to review the internal consistency of any DHIS 2 data, and an Annual Report function which automatically generates an data quality report card based on the DQR framework. The WHO Data Quality App is accompanied by a user’s guide for initial set-up and implementation.
Training materials have been developed to help support in-person training on conducting a desk review of data quality. These materials contain presentations, a facilitator’s guide, a participants’ manual and exercises that can be adapted for any data quality desk review training. These training materials can be used for both DHIS 2 and the Excel data quality tools. Additional training materials have been developed specifically for the DHIS 2-based WHO Data Quality App by the University of Oslo.8
7 For download, see: https://www.who.int/healthinfo/tools_data_analysis/dqr_desk_review/en/ (accessed 28 October 2020).8 These materials include How to configure the WHO Data Quality Tool, How to use the WHO Data Quality Tool and How to configure alerts for outliers. A
series of videos will soon be released. The “How to” guides are designed to be used in conjunction with a special website that has model databases for realistic practice with the DHIS 2-based data desk review.
Module 2Discrete desk review of data qualityi m p l e m e n tat i o n g u i d e
Please supply barcodes
DATA QUALITY ASSURANCEDATA QUALITY ASSURANCEDATA QUALITY ASSURANCEDATA QUALITY ASSURANCE Training materials for
desk review of data quality
DQ app (with user guide)
Module 2Desk review of data qualityv e r s i o n u p d at e – d e c e m b e r 2 0 2 0
Please supply barcode
DATA QUALITY ASSURANCEDATA QUALITY ASSURANCEDATA QUALITY ASSURANCEDATA QUALITY ASSURANCE
9

Data
Qua
lity A
ssur
ance
. Mod
ule 1
: Fra
mew
ork a
nd m
etric
s
Figu
re 1.
The D
QR m
etho
dolo
gy
10

Chap
ter 3
. DQR
Met
hodo
logy
and
reso
urce
s
Site assessment of data quality: data verification and system assessmentThe site assessment of data quality involves conducting an assessment of data quality at health facilities and districts. While conducting a desk review, a reviewer can examine the completeness and consistency of data from health facilities. However, to determine the accuracy of health data, an assessment of data at the facility itself is required. There are two processes through which a site assessment can be conducted:
as a discrete sample survey of facilities and districts;
through the use of checklists conducted by facility staff and district supervisors as part of a routine system of data quality assurance.
Discrete site assessment at facilities and districts – data verification and system assessmentThe discrete cross-cutting site assessment of data quality at facility and district levels includes two different components, namely: 1) verification of source data and completeness of reporting for specific reporting periods, as sent from the facility to the next reporting level; and 2)a system assessment whereby the capacity of the system to produce quality data is measured. These two components are presented below and discussed in detail in Module 3.
Some key characteristics of the discrete site assessment are:
Use a core set of tracer indicators (usually 4–5) selected across programme areas (cross-cutting) for completeness and verification of source data.
A sound probability-based sampling methodology will help ensure that the results of the data verification are representative of all the units in that entity (e.g. health facilities).
A nationally representative assessment of health facilities usually has a sample of more than 100 facilities; this constitutes a sufficient sample for verification of data quality.
Primary data collection can be conducted as part of a larger health-facility assessment (e.g. to measure service availability and readiness) or as a discrete event.
The site assessment should be harmonized with the overall survey plans of countries.
The assessment should be conducted in tandem with the discrete desk review of data quality. Without the desk review of data quality, the information on data accuracy from the site assessment is not sufficiently informative. To summarize, the discrete site assessment should be conducted together with the discrete desk review in order to gather the most comprehensive information for the development of a data quality improvement plan.
11

Data
Qua
lity A
ssur
ance
. Mod
ule 1
: Fra
mew
ork a
nd m
etric
s
Data verificationThe objective of data verification is to measure the extent to which the information in the source documents has been summarized and reported accurately to the next level of reporting; the verification applies to each level of the reporting hierarchy (from the health-facility level to the national level). This allows errors that occur in the reporting of data to be identified and, for specific indicators, gives an estimate of the degree of over-reporting or under-reporting in the system at national level.
For data verification, data from source documents (e.g. registers, tally sheets, patient files) are compared to data reported through the HMIS in order to determine the proportion of reported results that can be verified from the source documents. The values for selected indicators from specific reporting periods are recounted using the relevant source document at the facility and are then compared to the value reported by the facility for the same reporting period.
In addition to verifying the consistency between source data and what has been reported, the independent assessment at facility and district levels also collects information on the completeness of reporting. This information can compared with the reporting completeness found through the desk review.
System assessmentThe system assessment measures the capacity of the system to produce good-quality data and evaluates the extent to which critical elements of the reporting system adhere to a set of minimally acceptable standards; it is the second part of the discrete site assessment component of data quality. Because the system assessment provides information on the potential determinants of data quality problems, it is recommended that it should be implemented with the data verification module which measures data quality at the site.
Both components of the site assessment can be included as part of a broader health facility assessment or they can be conducted as independent activities. The elements of the reporting system that are evaluated in the system assessment are:
trained staff;
guidelines;
stock-out of tools and reporting forms;
supervision and feedback; and
analysis and data use.
12

Chap
ter 3
. DQR
Met
hodo
logy
and
reso
urce
s
Resources to support discrete cross-cutting site assessment of data qualityThe following resources are available to support implementation of a site assessment of data quality:9
Module 3: Site assessment of data quality discusses the discrete site assessment and the supervisory checklists, and the metrics that can be calculated from the site assessment. This document is accompanied by the Implementation guide to support the implementation process.
Data collection instruments are available in MS Word and there are electronic data collection forms in CSPro10 for discrete assessment of data quality at facility and district levels. These instruments include both the data verification and system assessment (DV/SA) modules. There is also a users’ manual on the set-up and use of CSPro for the discrete site assessment.
An MS Excel tool can automate analysis of the data collected during the discrete assessment at facility/district levels. The tool includes a DV/SA (with users’ guides), including a facility DV/SA, district DV/SA, and additional data verification analyses for countries with electronic HMIS systems.
Training materials include presentations, a facilitator’s guide, a participants’ manual, and exercises on how to conduct the discrete site assessment along with DV/SA at facilities and districts. This training does not pertain to the supervisory checklists.
Routine data quality assurance – checklistsRoutine checklists are part of a system of routine (i.e. monthly) reviews of data quality of the HMIS or other programme reporting systems. Checklists are part of a feedback cycle that identifies and rectifies errors in near real-time. This routine system of data quality checks has three components: 1) monthly self-assessment of HMIS data conducted by health-facility staff; 2) a periodic (ideally quarterly) assessment of health-facility data by district-level staff during supervisory visits to the health facility; and 3) a periodic review of aggregate results from
9 To download, see: https://www.who.int/healthinfo/tools_data_analysis/dqr_data_verification/en/ (accessed 26 October 2020).10 For information about the Census and Survey Processing System (CSPro), including free download, see: https://www.census.gov/data/software/cspro.
html (accessed 22 April 2020).
Data collection tool for discrete site
assessment in (MS-Word and CSPro)
with a user manual for CSPro application
Training materials for data verification and system assessments
MS Excel analysis tool for facility/district data verification and system assessment (with user guides)
Site assessment of data quality: data verification and system assessment
Module 3
i m p l e m e n tat i o n g u i d e
DATA QUALITY ASSURANCEDATA QUALITY ASSURANCE
Site assessment of data quality: data verification and system assessment
Module 3
DATA QUALITY ASSURANCEDATA QUALITY ASSURANCE
13

Data
Qua
lity A
ssur
ance
. Mod
ule 1
: Fra
mew
ork a
nd m
etric
s
supervisory visits. Some key attributes for these checklists include: use of a core set of tracer indicators (recommended 3 indicators) selected across
programme areas (cross-cutting) for checking data quality;
implementation using a standard data quality checklist;
capability to examine different dimensions of data quality, including completeness, internal consistency and accuracy, and external comparisons (cross-checks);
a type of system assessment conducted by checking that best practices are in place to support production of good-quality data.
Monthly self-assessment of HMIS data by health-facility staffIf the facility has a dedicated staff member for data management, this person would be the appropriate staff member to conduct the data quality checks. Alternatively, the checklist should be applied by the staff person responsible for compiling and submitting the monthly report. The checklists can be completed on paper or in MS Excel. The Excel version can automatically calculate quality metrics. The data are automatically extracted to a flat file which can be exported to an aggregate file to combine the data with results for the same facility at different time periods. The checklist should be implemented as often as is necessary to achieve good-quality data, or at least once a month prior to compilation and submission of the monthly report. This self-assessment examines data quality in terms of:
completeness (examining data element completeness and source document completeness);
internal consistency (accuracy is examined by recounting the source data and checking against the value to be reported); consistency over time is examined by comparing the value of a data element to the value of the same data element at earlier time periods;
external consistency (including cross-checks between different data sources with the same/similar information); and
a short checklist of data management best practices – a “modified system-assessment”.
Periodic assessment by district-level staffThe routine checklists are intended to be used during regular supervisory visits to health facilities conducted by the district-level HMIS (or health programme management staff). These checklists can be implemented on paper or in MS-Excel. The Excel version can automatically calculate quality metrics. The data are automatically extracted to a flat file which can be exported to an aggregate file to combine the data with results for the same facility at different time periods or with results from different facilities. The following data quality dimensions are examined:
completeness (including monthly reporting completeness, data element completeness and source document completeness);
14

Chap
ter 3
. DQR
Met
hodo
logy
and
reso
urce
s
internal consistency accuracy is examined by recounting the source data and checking against the value to be reported; consistency over time is examined by comparing the value of a data element to the value of the same data element at earlier time periods;
external consistency (including cross-checks between different data sources with the same/similar information); and
a qualitative section of best practices which should be conducted in the facility to promote good data quality.
Periodic review of aggregate results from supervisory visits The periodic review of aggregate results of data quality checks during supervision is important in order to detect systematic problems of data quality across health facilities (at district and higher levels). While the checklists are developed to be implemented on paper, a version in Excel will calculate quality checks automatically. The data are automatically extracted to a flat file which can be exported to an aggregate file to be combined with results from the same facility at different time periods, or with results from different facilities. Both a district supervisor checklist and a facility data-manager checklist are available in Excel.
Resources to support routine site assessment of data qualityThe following resources are available to support implementation of routine site assessments of data quality:11
Module 3: Site assessment of data quality discusses both the discrete site assessment and the routine checklists, as well as the metrics that can be calculated from the site assessment. This document is accompanied by the Implementation guide to support the implementation process
Routine checklists in MS Excel are part of the routine data quality assurance and feedback cycle with a user’s guide.
11 To download, see: https://www.who.int/healthinfo/tools_data_analysis/dqr_data_verification/en/ (accessed 26 October 2’02
Site assessment of data quality: data verification and system assessment
Module 3
i m p l e m e n tat i o n g u i d e
DATA QUALITY ASSURANCEDATA QUALITY ASSURANCE
Site assessment of data quality: data verification and system assessment
Module 3
DATA QUALITY ASSURANCEDATA QUALITY ASSURANCE
Supervisory checklists in MS Excel
(with user guide)
15

Data
Qua
lity A
ssur
ance
. Mod
ule 1
: Fra
mew
ork a
nd m
etric
s
Chapter 4. Data quality metrics
The DQR examines data that are reported routinely through facility information systems and quantifies problems of data completeness, timeliness, consistency and accuracy in order to ascertain the extent to which the health-facility data are fit for purpose and include the following characteristics:
Quality data should be complete and timely – i.e. there is sufficient information available when required to make decisions about the health of the population and to target resources to improve health-system coverage, efficiency and quality.
Quality data should be consistent and reliable – i.e. data are plausible in view of what has previously been reported. Reliable data are those which remain consistent on repeated measurement.
Quality data should be accurate – i.e. data faithfully reflect the actual level of service delivery conducted in the health facility.
Core indicatorsThe DQR examines the quality of data by applying the data quality metrics to indicators reported from a health facility. As there are usually many indicators reported from health facilities, it may be difficult to examine the quality of data for all reported indicators. The selection of indicators will be based on the purpose of the data quality review. Regardless of the purpose of the data quality review — whether for routine data quality assurance or for a discrete assessment, whether for cross-cutting or programme-specific purposes — it is recommended to examine a limited set of indicators that give an overview of data quality.
Table 1.1 shows a set of recommended core indicators that can be used for a cross-cutting review of data quality. Indicators are included from antenatal care (ANC), immunization, human immunodeficiency virus (HIV), tuberculosis (TB) and malaria. The key criteria applied in the selection of these core indicators include:
An indicator is important for programme monitoring and evaluation (although this does not mean it is the most important indicator for the programme).
They are “tracer” indicators (i.e. results can be traced from the source to the national level, and are indicative of data quality for all indicators within a programme area).
16

Chap
ter 4
. Dat
a qua
lity m
etric
s
These indicators are widely available and are expected to be reported from most or all the facilities that are offering services for the selected disease/programme area.1
It is relatively straightforward to verify the data quality of the indicators. This requirement is especially important when selecting indicators for a cross-cutting site assessment.2
While these criteria are important for the selection of a cross-cutting data quality review, a programme-specific review can add other important indicators. However, some of the above criteria also are applicable for a programme-specific review.
3
While it is recommended that countries should select indicators from the core list, they may select other indicators or expand the set of indicators on the basis of their needs and the resources available. A full set of core and additional indicators is available in Annex 1. It is important to note, however, that the greater the number of indicators selected, the more time-consuming and costly the exercise will be. This is particularly relevant to the selection of indicators for the site assessment component of the cross-cutting DQR, whether conducted as a discrete assessment or as part of routine data quality assurance. A guiding principle for when a team of data collectors visits a facility to conduct the site assessment, or when a supervisor visits the health facility for supervision, is that they should verify only a limited set of indicators. This is recommended for cost and time efficiency and to minimize data collector/supervisor fatigue when reviewing large volumes of data that can have an impact the quality of information collected.
1 This criterion is important to note: an important programmatic indicator that has low frequency of occurrence in facilities offering the service in question would not be selected as a tracer indicator.
2 To minimize the burden of data collection and to reduce errors, a complicated indicator is not a viable candidate for inclusion.3 If the number of confirmed malaria cases is not collected, total malaria cases can be substituted. If possible confirmed cases should be disaggregated by
microscopy and RDT.
Table 1.1. Recommended core indicators for the DQR
Recommended DQR indicators
Programme area Abbreviated name Indicator name
Maternal health Antenatal care 1st visit (ANC1) coverage Number and % of pregnant women who received antenatal care at least once during pregnancy
Immunization DTP3/Penta3 coverage Number and % of children < 1 year receiving three doses of DTP/ Penta vaccine
HIV New on ART Number of people living with HIV who initiate ART
TB TB notification rate Number of new and relapse cases of TB that are notified per 100 000 population
Malaria Confirmed malaria cases3 Number of malaria cases positive by microscopy, RDT or molecular diagnostic test
Note: ANC = antenatal care; ART = antiretroviral therapy; DTP3 = diphtheria-tetanus-pertussis three-dose vaccine; Penta = pentavalent vaccine; RDT = rapid diagnostic test; TB = tuberculosis.
17

Data
Qua
lity A
ssur
ance
. Mod
ule 1
: Fra
mew
ork a
nd m
etric
s
If other priority indicators are not included in the core or additional lists, they can be selected (cautiously) to replace one or more of the core indicators. It should also be noted that not all data quality metrics apply to all indicators. For example, it may be difficult to obtain denominators at the subnational level or to make comparisons with measures of the indicator from other sources for some of the core and additional indicators (e.g. in HIV). In this case, the data quality checks can be performed only on the numerator data (the metrics for which are included in the DQR dimensions 1 and 2).
Dimensions of data qualityThis DQR framework examines each of the selected indicators from four perspectives, or dimensions, namely:
Dimension 1: completeness and timeliness of data;
Dimension 2: internal consistency of reported data;
Dimension 3: external comparison/cross-checks (with other data sources) – i.e. agreement with other sources of data such as surveys;
Dimension 4: consistency of population data (a review of denominator data used to calculate rates for performance indicators).
Completeness and timelinessThe completeness of the data is assessed by measuring whether all the entities that are supposed to report actually do so. This applies to health-facility reporting to districts and to district reporting to the regional or provincial levels. Timeliness of data is assessed by measuring whether the entities which submitted reports did so before a predefined deadline. The metrics for completeness and timeliness in the DQR include the following: Completeness and timeliness of district reporting: These metrics measure district
performance on completeness and timeliness of reporting.
Completeness and timeliness of facility reporting: These metrics measure facility performance on completeness and timeliness of reporting.
Completeness of indicator data (data element): This indicator measures the extent to which facilities that are supposed to report data on the selected core indicators are in fact doing so. This is different from overall reporting completeness in that it looks at completeness of specific data elements and not only at the receipt of the monthly reporting form.
Consistency of reporting completeness: This indicator examines trends in reporting completeness.
18

Chap
ter 4
. Dat
a qua
lity m
etric
s
The DQR metrics for completeness and timeliness are further defined in Table 1.2.
Internal consistency of reported dataInternal consistency of the data relates to the coherence of the data being evaluated. Internal consistency metrics examine: 1) coherence between the same data items at different points in time; 2) coherence between related data items; and 3) comparison of data in source documents and in aggregated reports. Four metrics of internal consistency are included in the DQR. These are:
Presence of outliers: This examines whether a data value in a series of values is extreme in relation to the other values in the series.
Consistency over time: The plausibility of reported results for selected programme indicators is examined in terms of the history of reporting of the indicators. Trends are evaluated to determine whether reported values are extreme in relation to other values that are reported during the year or over several years.
Consistency between indicators: Programme indicators which have a predictable relationship are examined to determine whether the expected relationship exists between those indicators. In other words, this process examines whether the observed relationship between the indicators, as shown in the reported data, is that which is expected.
Consistency of reported data and original records: This involves an assessment of the reporting accuracy of selected indicators through the review of source documents in health facilities and district offices. This element of internal consistency is measured by a data verification exercise which requires a record review to be conducted in a sample of health facilities and at district offices. It is the only dimension of data quality that requires additional collection of primary data.
External comparison/cross-checks (with other data sources)The level of agreement between two sources of data measuring the same health indicator is assessed. The two sources of data that are usually compared are data flowing through the HMIS or the programme-specific information system and data from a periodic population-based survey. The HMIS data can also be compared to pharmacy records or other types of data to ensure that the two sources fall within a similar range.
Consistency of population dataThis involves determining the adequacy of the population data used in evaluating the performance of health indicators. Population data serve as the denominator in the calculation of a rate or proportion and provide important information on coverage. This data quality
19

Data
Qua
lity A
ssur
ance
. Mod
ule 1
: Fra
mew
ork a
nd m
etric
s
measurement looks at the consistency of population trends and compares two different sources of related population estimates in order to ascertain the level of congruence between the two. If the two population estimates are discrepant or if population estimates differ dramatically over a period of time, the coverage estimates for a given indicator can be very different even though the programmatic result (i.e. the number of events) is the same. The higher the level of consistency, the more likely it is that the values represent the true population value.
Definitions, benchmarks and cut-offsThe DQR framework includes both benchmarks and cut-offs in the measurement of data quality, depending on the specific metric. A benchmark reflects the desired or acceptable level for a specific metric to reach. A cut-off flags units that have data anomalies and need further examination. The DQR toolkit includes recommended minimum benchmarks and cut-offs for quality. While these benchmarks allow countries to compare themselves to a benchmark, a country has flexibility in changing the benchmarks (albeit cautiously) to reflect that country but, ultimately, benchmarks will depend on the country that is implementing the DQR. For instance, a reporting rate of 80% might be acceptable in a country with historically low reporting performance but it will not be acceptable in other countries which have more mature systems and reporting rates closer to 100%. Sometimes these benchmarks also have to be examined in terms of in-country variations. For example, if TB is not prevalent in all parts of the country, the expected reports with non-missing and/or zero values will be less than 100%.
While examining cut-offs – e.g. when looking at consistency over time – if a district (or other subnational unit) has a ratio for the current year value to the average value of the preceding three years (for a specific indicator) that is more than ±33% different from the national ratio for the same indicator, the district is flagged for further scrutiny. It is recommended that the margin for cut-offs be maintained.
However, it is always important to keep in mind that not all flagged values are due to data quality problems. Variation in programme delivery or different disease epidemiology in different parts of a country can also play a role.
Table 1.2 shows the different metrics that are included in each of the four dimensions of data quality. The quality of data of recommended core indicators is examined against these
standard metrics. The benchmarks and cut-offs for measuring quality are also shown. These recommended benchmarks should be tailored to the country context. For example, while 90% is a widely accepted standard for completeness when conducting an annual desk review in a country where few districts achieve this standard, it may make sense to set a lower threshold in order to identify a smaller percentage of districts which have the most serious problem with incomplete reporting.
20

Chap
ter 4
. Dat
a qua
lity m
etric
s
Table 1.2. Data quality dimension, metrics and standard benchmarks
DIMENSION Dimension 1: Completeness of reportingOMPLETENESS OF REPORTINGAn assessment of each dimension should be conducted for each of the recommended core indicators: antenatal care, immunization, HIV, TB and malaria. Additional indicators can be selected according to the priority and focus of the data quality assessment.
Data quality metric Definition
National level Subnational level
Completeness of district reporting4
% of expected district monthly reports (previous 1 year) that are actually received
Number and % of districts that submitted 100% of expected monthly reports
Timeliness of district reporting % of submitted district monthly reports (previous 1 year) that are received on time (i.e. by the deadline for reporting)
Number and % of districts that submitted on time at least 75% of the monthly reports received at national level from the district5
Completeness of facility reporting6
% of expected facility monthly reports (previous 1 year) that are actually received
Number and % of districts with at least 90% of monthly facility reports received
Timeliness of facility reporting % of submitted facility monthly reports (previous 1 year) that are received on time (i.e. by the deadline for reporting)
Number and % of districts that received on time at least 75% of monthly facility reports that were submitted
Completeness of indicator data(% of data elements that are non-zero values, % of data elements that are non-missing values)Carry out each analysis separately
ANC first visit Number and % of districts with < 90% 1) non-zero values; 2) non-missing values
3rd dose DTP-containing vaccine7 Number and % of districts with < 90% 1) non-zero values; 2) non-missing values
Newly on ART Number and % of districts with < 90% 1) non-zero values; 2) non-missing values8
Notified cases of all forms of TB9 Number and % of districts with < 100%10 1) non-zero values; 2) non-missing values
Confirmed malaria cases Number and % of districts with < 100% 1) non-zero values; 2) non-missing values
Consistency of reporting completeness
Each information system
Evaluate the trend in completeness of reporting from district to national level over the past 3 years
Evaluate the trend in completeness from facility to district level over the past 3 years
Note: ANC = antenatal care; ART = antiretroviral therapy; DTP = diphtheria-tetanus-pertussis; TB = tuberculosis.
4 If there are vertical reporting systems, this metric will need to be calculated for each system.5 The denominator is reports received (not expected).6 If multiple forms are submitted monthly, the reporting completeness should be checked for the different forms. For example, if TB reporting is done on a
separate form from immunization reporting, facility reporting completeness should be measured for the separate monthly reports.7 Immunization programmes expect some months to have zero values for vaccination indicators.8 If HIV is not prevalent in all parts of the country or only in some key populations in some parts of the country, some districts will have less than 100% non-
zero/non-missing values.9 TB reporting generally takes place quarterly.10 If TB is not prevalent in all parts of the country, some districts will have less than 100% non-zero/non-missing values.
21
Data
Qua
lity A
ssur
ance
. Mod
ule 1
: Fra
mew
ork a
nd m
etric
s
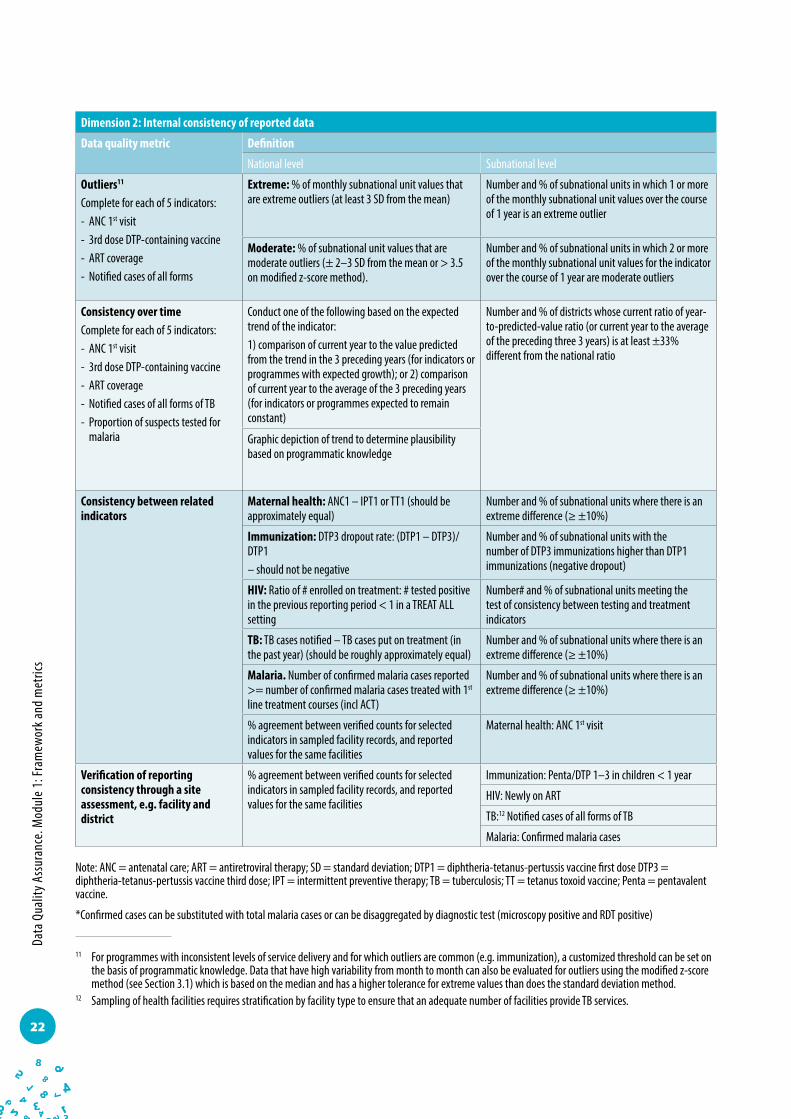
Dimension 2: Internal consistency of reported data
Data quality metric Definition
National level Subnational level
Outliers11 Complete for each of 5 indicators:- ANC 1st visit- 3rd dose DTP-containing vaccine- ART coverage- Notified cases of all forms
Extreme: % of monthly subnational unit values that are extreme outliers (at least 3 SD from the mean)
Number and % of subnational units in which 1 or more of the monthly subnational unit values over the course of 1 year is an extreme outlier
Moderate: % of subnational unit values that are moderate outliers (± 2–3 SD from the mean or > 3.5 on modified z-score method).
Number and % of subnational units in which 2 or more of the monthly subnational unit values for the indicator over the course of 1 year are moderate outliers
Consistency over timeComplete for each of 5 indicators:- ANC 1st visit- 3rd dose DTP-containing vaccine- ART coverage- Notified cases of all forms of TB- Proportion of suspects tested for
malaria
Conduct one of the following based on the expected trend of the indicator:1) comparison of current year to the value predicted from the trend in the 3 preceding years (for indicators or programmes with expected growth); or 2) comparison of current year to the average of the 3 preceding years (for indicators or programmes expected to remain constant)
Number and % of districts whose current ratio of year-to-predicted-value ratio (or current year to the average of the preceding three 3 years) is at least ±33% different from the national ratio
Graphic depiction of trend to determine plausibility based on programmatic knowledge
Consistency between related indicators
Maternal health: ANC1 – IPT1 or TT1 (should be approximately equal)
Number and % of subnational units where there is an extreme difference (≥ ±10%)
Immunization: DTP3 dropout rate: (DTP1 – DTP3)/DTP1– should not be negative
Number and % of subnational units with the number of DTP3 immunizations higher than DTP1 immunizations (negative dropout)
HIV: Ratio of # enrolled on treatment: # tested positive in the previous reporting period < 1 in a TREAT ALL setting
Number# and % of subnational units meeting the test of consistency between testing and treatment indicators
TB: TB cases notified – TB cases put on treatment (in the past year) (should be roughly approximately equal)
Number and % of subnational units where there is an extreme difference (≥ ±10%)
Malaria. Number of confirmed malaria cases reported >= number of confirmed malaria cases treated with 1st
line treatment courses (incl ACT)
Number and % of subnational units where there is an extreme difference (≥ ±10%)
% agreement between verified counts for selected indicators in sampled facility records, and reported values for the same facilities
Maternal health: ANC 1st visit
Verification of reporting consistency through a site assessment, e.g. facility and district
% agreement between verified counts for selected indicators in sampled facility records, and reported values for the same facilities
Immunization: Penta/DTP 1–3 in children < 1 year
HIV: Newly on ART
TB:12 Notified cases of all forms of TB
Malaria: Confirmed malaria cases
Note: ANC = antenatal care; ART = antiretroviral therapy; SD = standard deviation; DTP1 = diphtheria-tetanus-pertussis vaccine first dose DTP3 = diphtheria-tetanus-pertussis vaccine third dose; IPT = intermittent preventive therapy; TB = tuberculosis; TT = tetanus toxoid vaccine; Penta = pentavalent vaccine.
*Confirmed cases can be substituted with total malaria cases or can be disaggregated by diagnostic test (microscopy positive and RDT positive)
11 For programmes with inconsistent levels of service delivery and for which outliers are common (e.g. immunization), a customized threshold can be set on the basis of programmatic knowledge. Data that have high variability from month to month can also be evaluated for outliers using the modified z-score method (see Section 3.1) which is based on the median and has a higher tolerance for extreme values than does the standard deviation method.
12 Sampling of health facilities requires stratification by facility type to ensure that an adequate number of facilities provide TB services.
22

Chap
ter 4
. Dat
a qua
lity m
etric
s
Dimension 3: External comparison/ cross-checks (with other data sources)
Data quality metric Definition
National level Subnational level
ANC 1st visit Ratio of facility ANC1 coverage rates to survey ANC1 coverage rates
Number and % of aggregation units used for the most recent population-based survey (such as a province/state/region) whose ANC1 facility- based coverage rates and survey coverage rates show at least 33% difference
3rd dose DTP-containing vaccine Ratio of DTP3 coverage rates from routine data to survey DTP3 coverage rates
Number and % of aggregation units used for the most recent population-based survey (such as a province/state/region) whose DTP3 facility- based coverage rates and survey coverage rates show at least 33% difference
HIV — —
TB — —
Confirmed malaria cases Ratio of confirmed cases reported on the OPD form to confirmed cases reported on the laboratory form (RDT+ and microscopy+).13
Number and % of districts where confirmed cases from OPD form compared to confirmed cases reported in laboratory form show at least 33% difference
Comparison between programme and HMIS values
For selected indicators, compare the value aggregated for 12 months from the HMIS with the programme data
For selected indicators, compare the subnational unit values aggregated over 12 months for number and % of districts with > > 10% difference in annual values between the HMIS and programme data
Note: ANC = antenatal care; ART = antiretroviral therapy; DTP3 = diphtheria-tetanus-pertussis three-dose vaccine; HMIS = health management information system IPT = intermittent protective therapy; OPB = outpatient department; TB = tuberculosis.
DIMENSION Dimension 4: Consistency of ONSISTENCY OF population dataPOPULATION DATA(Evaluation of adequacy of denominators used for calculating performance indicators)
Data quality metric Definition
National level Subnational level
Consistency of population projections
Ratio of population projection of live births from the Country Census Bureau/Bureau of Statistics to a United Nations projection of live births for the country
—
Consistency between related denominators
For example: - Ratio of expected pregnancies to live births and
surviving infants - Consistency of live births with accepted estimate of
crude birth rates
Number and % of subnational units where there is an extreme difference (e.g. ± 10%) between the two denominators
Consistency of population trend Ratio of population values for selected indicator(s) from the current year to the predicted value from the trend in population values of up to 3 preceding years
Number and % of subnational units where there is an extreme difference (e.g. ± 10%) between the two denominators
Note: ANC = antenatal care; ART = antiretroviral therapy; DTP3 = diphtheria-tetanus-pertussis three-dose vaccine; HMIS = health management information system IPT = intermittent protective therapy; OPB = outpatient department; TB = tuberculosis.
13 This comparison can also be an example used for internal consistency between related indicators, depending on how the information is reported.
23

Data
Qua
lity A
ssur
ance
. Mod
ule 1
: Fra
mew
ork a
nd m
etric
s
Chapter 5. Governance, coordination, dissemination and use of results
Governance and coordinationTypically, routine checks of data quality are governed by the standard operating procedures (SOPs) of the country’s health facility information system(s). These SOPs for the management of routine health-facility data define the roles and responsibilities of the users and administrators of data. More broadly, the SOPs include the processes for performing routine data quality assurance and corrective action, including when the quality checks are performed, which quality checks are conducted, who performs them and how they are followed through with subsequent corrective action. Conducting a discrete assessment of data quality, especially before an annual review event, is not usually part of a country’s SOP. When it is conducted, it involves stakeholders who are different from those who manage routine data quality assurance.
As this guidance document explains, data quality is a matter of systems. While monitoring of data quality is conducted by different users of data (e.g. HMIS managers, programme managers), many of the issues of data quality are cross-cutting and not programme-specific. The same health-facility staff collect the same data for most health programmes. While errors in data can appear at different levels, the main data producer – and a common source across programmes – is the health facility.
The DQR framework includes both routine review of data quality (cross-cutting and programme-specific) and discrete assessments of data quality (cross-cutting and programme-specific). For successful implementation, the DQR framework requires the interaction of all the disparate data quality activities (Figure 2). Consequently, data quality assurance/review and improvement activities are/should be planned and conducted in a harmonized or aligned manner. Given that a cross-cutting data quality review and a programme-specific review address the same issue, it is important that the different activities and stakeholders (HMIS, programmes) are identified so that ultimately an improvement plan can address data quality issues holistically. It is recommended that a DQR coordinating group should be established to have oversight of the different DQR-related activities.
24

Chap
ter 5
. Gov
erna
nce,
coor
dina
tion,
diss
emin
atio
n an
d us
e of r
esul
tsDQR coordinating group at national levelBringing country stakeholders together is a critical first step towards successfully setting up and implementing the comprehensive DQR framework. One of the first activities is to identify and establish a group of core stakeholders at country level to oversee, coordinate and facilitate the planning and implementation of activities and the dissemination and use of findings.
The DQR coordinating group should comprise technical focal points among health-sector stakeholders from government (including the different programme stakeholders), development partners and multinational organizations. Technical working groups on monitoring and evaluation or governance boards for health information systems, which already exist in many countries, can serve as the DQR coordinating group.
Figure 2. Interaction of the disparate data quality activities
25

Data
Qua
lity A
ssur
ance
. Mod
ule 1
: Fra
mew
ork a
nd m
etric
s
The role of the DQR coordinating group is to:
develop a harmonized plan for the data quality review cycle;
identify technical support requirements for implementation and quality assurance;
identify funding sources;
monitor implementation of the DQR;
ensure promotion and dissemination of the findings.
While the role of the coordination group is broad and should include both routine and discrete data quality assessments, this is not the case in most countries. To institutionalize this process, it is important to establish this group with the primary role of coordinating the discrete assessments, but also tasked with the use and sharing of the results from these assessments with the broader stakeholder group that is involved in the management of health-facility data.
The implementation guide in this toolkit focuses on the processes, resources and coordination required for the implementation of a discrete DQR activity (both the cross-cutting desk review and the site assessment). It does not provide guidance on the more comprehensive processes, roles, responsibilities and coordination required for the broader DQR framework.
Dissemination and use of resultsA report presenting the findings of the discrete DQR (both desk review and site assessment) should be prepared along with an interpretation by managers and recommendations for system strengthening. The report should be disseminated to all staff who are expected to participate in planning initiatives (e.g. health-sector or programme review) several weeks prior to the planning event. Other stakeholders – such as donors, technical assistance organizations, relevant national and international nongovernmental organizations (NGOs), private-sector bodies (e.g. universities, civil society organizations) and concerned ministries – should receive copies of the report.1
On the basis of the findings of the results of the discrete, cross-cutting DQR and any other reports on data quality, a Data Quality Improvement Plan (DQIP) should be developed. Development of this plan should involve relevant internal stakeholders – both public, such as the Ministry of Health and National Statistics Office, and private, such as public health institutes – and external stakeholders (bilateral and multilateral donors and technical assistance agencies such as WHO).
1 It is recommended that the report includes an explanation of the statistical methods used for the calculation of the verification factor.
26

Chap
ter 5
. Gov
erna
nce,
coor
dina
tion,
diss
emin
atio
n an
d us
e of r
esul
ts
The DQIP should identify each data quality concern and the measure needed to strengthen the system and resolve each problem. The actions outlined in the plan should be specific, time-bound and costed. The plan should include a responsible organization with appropriate staff, a timeline for implementation, and identified resources to ensure that the necessary measures can be completed. If resources for strengthening the system are not available through the current budget, the DQR coordinating group should carry out advocacy among the donor community to raise the necessary resources. System strengthening should be prioritized so that measures with the highest likelihood of success, and those with the greatest impact on overall data quality, should be implemented first. There is more detailed discussion of the DQIP in the Implementation guide. The DQR coordinating group is responsible for monitoring the improvement plan regularly to ensure its implementation. As noted above, this responsibility will necessitate close interaction between the DQR coordinating group and other actors in the area of data quality.
27

Data
Qua
lity A
ssur
ance
. Mod
ule 1
: Fra
mew
ork a
nd m
etric
s
Recommended DQA indicators
Programme area Indicator name Full indicator
Maternal health Antenatal care 1st visit (ANC1) Number and % of pregnant women who received antenatal care at least once during pregnancy
Immunization DTP3/Penta3 Number (%) of children < 1 year receiving three doses of DTP/Penta vaccine
HIV/AIDS Newly on ART Number of people living with HIV who initiate ART
TB Notified cases of all forms of TB Number of new and relapse cases of TB that are notified per 100 000 population
Malaria Confirmed malaria cases1 Number of malaria cases positive by microscopy, RDT or molecular diagnostic test
Core indicators
Note: ANC = antenatal care; ART = antiretroviral therapy; DTP3 = diphtheria-tetanus-pertussis three-dose vaccine; Penta = pentavalent vaccine; RDT = rapid diagnostic test; TB = tuberculosis.
Additional indicators
1 If the number of confirmed malaria cases is not available, use all malaria cases.2 If this vaccine is not used in a country, substitute with another vaccine used in the national programme.
Annex 1: Recommended indicators
Recommended DQR indicators
Programme area Abbreviated name Indicator name
General Service utilization Number of outpatient department visits per person per year
Maternal health Antenatal care 4th visit (ANC4) Number (%) of women aged 15–49 years with a live birth in a given time period who received antenatal care, four times or more
Institutional delivery Number (%) of women who delivered in a health facility
Postpartum care coverage Number (%) of mothers and babies who received postpartum care within two days of childbirth (regardless of place of delivery)
Tetanus toxoid 1st dose Number (%) of pregnant women who received the 1st dose of tetanus-toxoid vaccine
Immunization DTP1-3/Penta1–3 Number (%) of children < 1 year receiving 1st dose, 2nd dose, and 3rd dose of DTP/Penta vaccines
MCV1 Number (%) of infants who have received at least one dose of measles-containing vaccine (MCV) by age 1 year
PCV 1–32 Number (%) of children < 1 year receiving 1st dose, 2nd dose and, 3rd dose of pneumococcal vaccines
28

Anne
x 1. R
ecom
men
ded
indi
cato
rs
Note: ANC = antenatal care; ART = antiretroviral therapy; DTP = diphtheria-tetanus-pertussis; MCV = measles-containing vaccine; MDR-TB = multidrug- resistant tuberculosis; PCV = pneumococcal conjugate vaccine; PMTCT = Prevention of mother-to-child transmission; RR = rifampicin-resistant; TB = tuberculosis.
Additional indicators, continuedRecommended DQR indicators
Programme area Abbreviated name Indicator name
HIV People living with HIV who have been diagnosed
Number (%) of people living with HIV who have been diagnosed
HIV care coverage Number (%) of people living with HIV who are receiving HIV care (including ART)
PMTCT ART coverage Number (%) of HIV-positive pregnant women who received ART during pregnancy
Currently on ART Number and % of people living with HIV who are currently receiving ART
ART retention Number (%) of people living with HIV and on ART who are retained on ART 12 months after initiation (and at 24, 36, 48, and 60 months)
Viral suppression Number (%) of people on ART who have suppressed viral load
TB Notified cases of all forms of TB Number of new and relapse cases of TB that are notified per 100 000 population – Assess if quarterly case notification report blocks 1 and 21 are correct as per standards and benchmarks (B1.4) for paper-based systems2
TB treatment success rate Number (%) of TB cases successfully treated (cured plus treatment completed) among TB cases notified to the national health authorities during a specified period – Assess if quarterly treatment outcome report block 1 is correct as per standards and benchmarks (B.14) for paper-based systems
Second-line TB treatment success rate Number (%) of TB cases successfully treated (cured plus treatment completed) among all confirmed RR-TB/MDR-TB cases started on second-line treatment during the period of assessment
TB-HIV Proportion of registered new and relapse TB patients with documented HIV status
Number of new and relapse TB patients who had an HIV test result recorded in the TB register, expressed as a percentage of the number registered during the reporting period
Proportion of HIV-positive new and relapse TB patients on ART during TB treatment
Number of HIV-positive new and relapse TB patients who received ART during TB treatment, expressed as a percentage of those registered during the reporting period
Malaria Proportion of malaria suspects tested Number (%) of all suspected malaria cases that received a parasitological test (microscopy or RDT). Number of suspected cases of malaria
Confirmed malaria cases cases treated with 1st line treatment course (including ACTs)
Number (%) of confirmed malaria cases treated that received first- line antimalarial treatment according to national policy at public- sector facilities
Malaria cases (presumed and con- firmed) treated with 1st line treatment course (including ACTs)
Number (%) of malaria cases (presumed and confirmed) that received first-line antimalarial treatment
IPTp3 Number (%) of pregnant women attending antenatal clinics who received three or more doses of intermittent preventive treatment for malaria according to national policy at public- sector facilities
1 Definitions and reporting framework for tuberculosis – 2013 revision. Document WHO/HTM/TB/2013.2. Geneva: World Health Organization; 2013 (http://apps.who. int/iris/bitstream/10665/79199/1/9789241505345_eng.pdf?ua=1, accessed 11 June 2015).
2 Standards and benchmarks for tuberculosis surveillance and vital registration systems: checklist and user guide. Document WHO/HTM/TB/2014.02. Geneva: World Health Organization; 2014 (http://apps.who.int/iris/bitstream/10665/112673/1/9789241506724_eng.pdf?ua=1, accessed 11 June 2015).
29

Notes. . . . . . . . . . . . . . . . . . . . . . . . . . . . . . . . . . . . . . . . . . . . . . . . . . . . . . . . . . . . . . . . . . . . . . . . . . . . . . . . . . . . . .
. . . . . . . . . . . . . . . . . . . . . . . . . . . . . . . . . . . . . . . . . . . . . . . . . . . . . . . . . . . . . . . . . . . . . . . . . . . . . . . . . . . . . .
. . . . . . . . . . . . . . . . . . . . . . . . . . . . . . . . . . . . . . . . . . . . . . . . . . . . . . . . . . . . . . . . . . . . . . . . . . . . . . . . . . . . . .
. . . . . . . . . . . . . . . . . . . . . . . . . . . . . . . . . . . . . . . . . . . . . . . . . . . . . . . . . . . . . . . . . . . . . . . . . . . . . . . . . . . . . .
. . . . . . . . . . . . . . . . . . . . . . . . . . . . . . . . . . . . . . . . . . . . . . . . . . . . . . . . . . . . . . . . . . . . . . . . . . . . . . . . . . . . . .
. . . . . . . . . . . . . . . . . . . . . . . . . . . . . . . . . . . . . . . . . . . . . . . . . . . . . . . . . . . . . . . . . . . . . . . . . . . . . . . . . . . . . .
. . . . . . . . . . . . . . . . . . . . . . . . . . . . . . . . . . . . . . . . . . . . . . . . . . . . . . . . . . . . . . . . . . . . . . . . . . . . . . . . . . . . . .
. . . . . . . . . . . . . . . . . . . . . . . . . . . . . . . . . . . . . . . . . . . . . . . . . . . . . . . . . . . . . . . . . . . . . . . . . . . . . . . . . . . . . .
. . . . . . . . . . . . . . . . . . . . . . . . . . . . . . . . . . . . . . . . . . . . . . . . . . . . . . . . . . . . . . . . . . . . . . . . . . . . . . . . . . . . . .
. . . . . . . . . . . . . . . . . . . . . . . . . . . . . . . . . . . . . . . . . . . . . . . . . . . . . . . . . . . . . . . . . . . . . . . . . . . . . . . . . . . . . .
. . . . . . . . . . . . . . . . . . . . . . . . . . . . . . . . . . . . . . . . . . . . . . . . . . . . . . . . . . . . . . . . . . . . . . . . . . . . . . . . . . . . . .
. . . . . . . . . . . . . . . . . . . . . . . . . . . . . . . . . . . . . . . . . . . . . . . . . . . . . . . . . . . . . . . . . . . . . . . . . . . . . . . . . . . . . .
. . . . . . . . . . . . . . . . . . . . . . . . . . . . . . . . . . . . . . . . . . . . . . . . . . . . . . . . . . . . . . . . . . . . . . . . . . . . . . . . . . . . . .
. . . . . . . . . . . . . . . . . . . . . . . . . . . . . . . . . . . . . . . . . . . . . . . . . . . . . . . . . . . . . . . . . . . . . . . . . . . . . . . . . . . . . .
. . . . . . . . . . . . . . . . . . . . . . . . . . . . . . . . . . . . . . . . . . . . . . . . . . . . . . . . . . . . . . . . . . . . . . . . . . . . . . . . . . . . . .
. . . . . . . . . . . . . . . . . . . . . . . . . . . . . . . . . . . . . . . . . . . . . . . . . . . . . . . . . . . . . . . . . . . . . . . . . . . . . . . . . . . . . .
. . . . . . . . . . . . . . . . . . . . . . . . . . . . . . . . . . . . . . . . . . . . . . . . . . . . . . . . . . . . . . . . . . . . . . . . . . . . . . . . . . . . . .
. . . . . . . . . . . . . . . . . . . . . . . . . . . . . . . . . . . . . . . . . . . . . . . . . . . . . . . . . . . . . . . . . . . . . . . . . . . . . . . . . . . . . .
. . . . . . . . . . . . . . . . . . . . . . . . . . . . . . . . . . . . . . . . . . . . . . . . . . . . . . . . . . . . . . . . . . . . . . . . . . . . . . . . . . . . . .
. . . . . . . . . . . . . . . . . . . . . . . . . . . . . . . . . . . . . . . . . . . . . . . . . . . . . . . . . . . . . . . . . . . . . . . . . . . . . . . . . . . . . .
. . . . . . . . . . . . . . . . . . . . . . . . . . . . . . . . . . . . . . . . . . . . . . . . . . . . . . . . . . . . . . . . . . . . . . . . . . . . . . . . . . . . . .
. . . . . . . . . . . . . . . . . . . . . . . . . . . . . . . . . . . . . . . . . . . . . . . . . . . . . . . . . . . . . . . . . . . . . . . . . . . . . . . . . . . . . .
. . . . . . . . . . . . . . . . . . . . . . . . . . . . . . . . . . . . . . . . . . . . . . . . . . . . . . . . . . . . . . . . . . . . . . . . . . . . . . . . . . . . . .
. . . . . . . . . . . . . . . . . . . . . . . . . . . . . . . . . . . . . . . . . . . . . . . . . . . . . . . . . . . . . . . . . . . . . . . . . . . . . . . . . . . . . .
. . . . . . . . . . . . . . . . . . . . . . . . . . . . . . . . . . . . . . . . . . . . . . . . . . . . . . . . . . . . . . . . . . . . . . . . . . . . . . . . . . . . . .
. . . . . . . . . . . . . . . . . . . . . . . . . . . . . . . . . . . . . . . . . . . . . . . . . . . . . . . . . . . . . . . . . . . . . . . . . . . . . . . . . . . . . .
. . . . . . . . . . . . . . . . . . . . . . . . . . . . . . . . . . . . . . . . . . . . . . . . . . . . . . . . . . . . . . . . . . . . . . . . . . . . . . . . . . . . . .
. . . . . . . . . . . . . . . . . . . . . . . . . . . . . . . . . . . . . . . . . . . . . . . . . . . . . . . . . . . . . . . . . . . . . . . . . . . . . . . . . . . . . .
. . . . . . . . . . . . . . . . . . . . . . . . . . . . . . . . . . . . . . . . . . . . . . . . . . . . . . . . . . . . . . . . . . . . . . . . . . . . . . . . . . . . . .
. . . . . . . . . . . . . . . . . . . . . . . . . . . . . . . . . . . . . . . . . . . . . . . . . . . . . . . . . . . . . . . . . . . . . . . . . . . . . . . . . . . . . .
. . . . . . . . . . . . . . . . . . . . . . . . . . . . . . . . . . . . . . . . . . . . . . . . . . . . . . . . . . . . . . . . . . . . . . . . . . . . . . . . . . . . . .
. . . . . . . . . . . . . . . . . . . . . . . . . . . . . . . . . . . . . . . . . . . . . . . . . . . . . . . . . . . . . . . . . . . . . . . . . . . . . . . . . . . . . .
30


Module 1Framework and metricsversion update - December 2020
DATA QUALITY ASSURANCEDATA QUALITY ASSURANCEDATA QUALITY ASSURANCEDATA QUALITY ASSURANCE