Seismic Response of a Tower as Measured by an Integrated RTK-GPS System
Upload
independentCategory
view
0download
0
Quality assessment of a network-based RTK GPS service in
the UK
Jose Aponte, Xiaolin Meng, Chris Hill, Terry Moore, Mark Burbidge, Alan Dodson
Abstract. Network-based Real Time Kinematic
(NRTK) GPS positioning is considered to be a
superior solution compared to the conventional
single reference station based Real Time
Kinematic (RTK) GPS positioning technique
whose accuracy is highly affected by the
distance dependent errors such as satellite
orbital and atmospheric biases. NRTK GPS
positioning uses raw measurements gathered
from a network of Continuously Operating
Reference Stations (CORS) in order to generate
more reliable error models that can mitigate the
distance dependent errors within the area
covered by the CORS. This technique has been
developed and tested considerably during recent
years and the overall performance in terms of
achievable accuracies, reliability and mobility is
as good as or even better than can be achieved
using the conventional RTK GPS positioning
technique.
Currently, there are several commercial NRTK
services around the world. In the United
Kingdom (UK), for instance, Leica Geosystems
in partnership with Ordnance Survey has been
offering a NRTK GPS service since 2006. This
service is called SmartNet and it can provide
continuous centimetric level of accuracy to its
subscribers.
However, NRTK GPS positioning is
particularly constrained by wireless data link
coverage, correction transmission delay and
completeness, GPS signal availability, etc.,
which could downgrade the positioning quality
of the NRTK results.
The paper presents some preliminary testing
results of an investigation of the SmartNet
service from the end users’ point of view. A
snapshot of the service’s performance was
carried out as part of a recent PhD studentship
jointly awarded by the UK's Engineering and
Physical Sciences Research Council (EPSRC)
and Leica Geosystems (UK) to conduct
comprehensive research into NRTK GPS
quality control measures at the Institute of
Engineering Surveying and Space Geodesy
(IESSG), the University of Nottingham. In
order to evaluate the service’s quality several
static and kinematic tests were performed using
the same type of equipment and in the same
way that the SmartNet subscribers would have
used it.
Centimetric accuracy was generally attained
during both static and kinematic tests. This high
accuracy was only affected by some level of
unavailability mainly caused by GPS signal
blockage. Additionally, the influence of the
number of satellites in view, dilution of
precision (DOP) and age of corrections (AoC)
over the accuracy and stability of the NRTK
GPS solution was also investigated during this
research and presented in the paper.
Keywords. Network RTK GPS, RTCM, GPRS,
performance, accuracy, quality assessment
criteria.
1. Introduction
Conventional RTK GPS positioning is a
technique that allows centimetre level accuracy
positioning in real time through effectively
differencing away similar errors and biases that
are caused by atmospheric effects and GNSS
satellite orbit errors (distance dependent errors)
and clock bias in carrier phase observations of
the receivers at both ends of a baseline (a
reference station and a rover). However, this
differential positioning technique is valid only
for short baseline lengths (<20km). As the
baseline length increases, the errors from both
receivers become less common and therefore
cannot be cancelled out (Wanninger 2004). This
phenomenon is called Spatial Decorrelation of
Errors and is the main limitation of
conventional RTK GPS positioning.
Additionally, the recommended maximum
baseline length for conventional RTK is about
10km due to the constraint of a radio modem
that transmits the data from the reference station
to the rover (Wegener and Wanninger 2005).
These limitations have constrained the
application scope of RTK GPS positioning, for
instance, in precise vehicle tracking where
mobility is a priority.
NRTK GPS positioning overcomes the
drawbacks of RTK GPS and increases the GPS
positioning accuracy by accurately modelling
the distance dependent errors at the rover
position using the raw measurements of an
array of CORS surrounding the rover site
(Wanninger 2004).
In addition to improving the positioning
accuracy, NRTK GPS brings many other
advantages to the service providers and users
community; as it attempts to achieve a good
balance between accuracy, productivity and
cost effectiveness. NRTK GPS substantially
reduces the costs of the network operators and
its users. Without it the network operators
would need a much denser network which is
costly to set-up and maintain. The overall
positioning costs will be much higher and
productivity much lower (users will need to set
up project based reference stations, and
therefore use at least two dual-frequency
receivers). Currently NRTK allows for the
transmission of coordinate transformation
parameters from the operators, which allows
users to continuously acquire the current site
grid transformation information without any
manual loading or localisation on the rover, and
thus better consistency in the quality of
coordinates can be maintained.
Taking advantage of NRTK’s benefits, many
NRTK commercial services have been
established in different countries in the past few
years. One example is the case of SmartNet,
which has operated in the UK by Leica
Geosystems (UK) in partnership with Ordnance
Survey Great Britain (OSGB) since January
2006.
Several recent static and kinematic trials by the
authors have demonstrated the high centimetric
accuracy that can be achieved by SmartNet
(Meng et al. 2007a). In general the final
positional quality of a NRTK GPS system as
discussed by Meng et al. (2007b) is directly
affected by many factors such as the hardware
and software package employed, deployment of
reference stations, GPRS wireless data link,
correction message transmission delay and
satellite signals availability.
This paper describes the preliminary results of
the research jointly funded by the EPSRC and
Leica Geosystems (UK), the purpose of which
was to investigate NRTK GNSS quality control
measures. The studies covered in this paper
include the analysis of the actual positional
quality of the SmartNet service from an end
user’s point of view, in terms of its accuracy,
precision, availability and also how different
factors such as the number of satellites in view
and their geometry might affect the positioning
accuracy.
2. SmartNet and the Master Auxiliary
Concept (MAC)
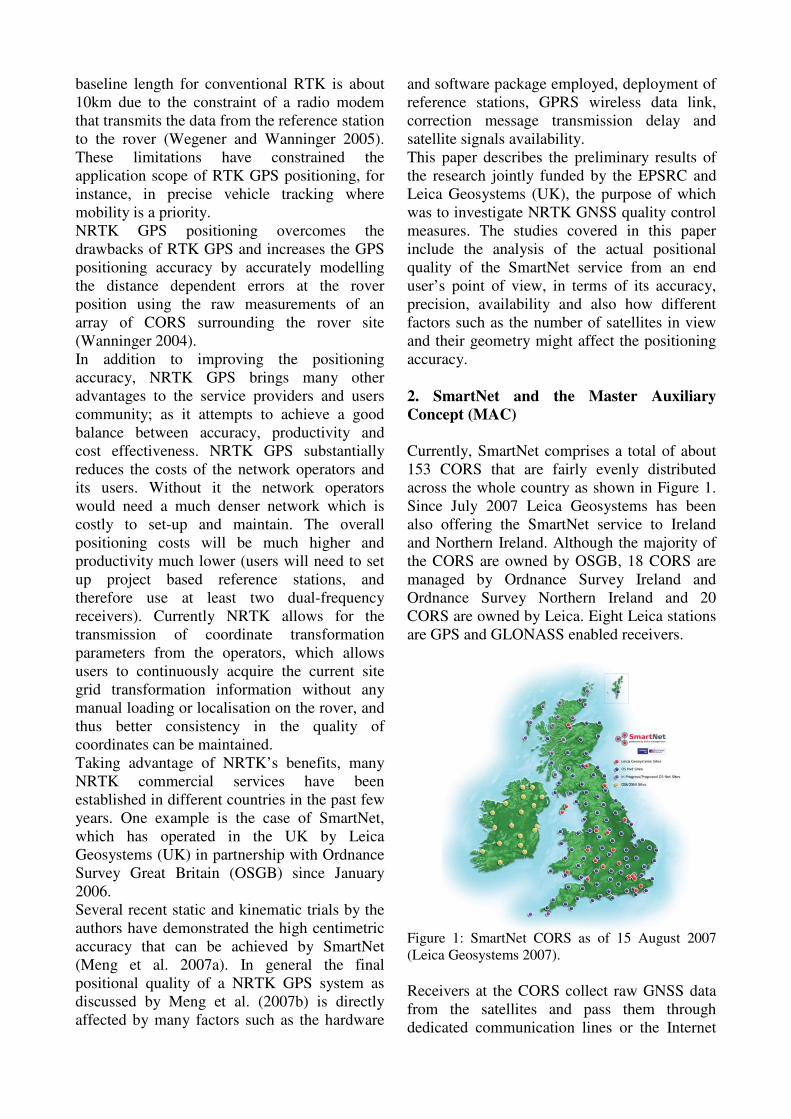
Currently, SmartNet comprises a total of about
153 CORS that are fairly evenly distributed
across the whole country as shown in Figure 1.
Since July 2007 Leica Geosystems has been
also offering the SmartNet service to Ireland
and Northern Ireland. Although the majority of
the CORS are owned by OSGB, 18 CORS are
managed by Ordnance Survey Ireland and
Ordnance Survey Northern Ireland and 20
CORS are owned by Leica. Eight Leica stations
are GPS and GLONASS enabled receivers.
Figure 1: SmartNet CORS as of 15 August 2007
(Leica Geosystems 2007).
Receivers at the CORS collect raw GNSS data
from the satellites and pass them through
dedicated communication lines or the Internet
to a network Control Centre (CC). At the CC a
Leica NRTK software suite called GPS Spider
processes the observations as per the MAC
technique in order to produce the NRTK
corrections. These are then broadcast to the
service’s subscribers via GSM/GPRS under the
Networked Transport of RTCM via Internet
Protocol (NTRIP) standard or via GSM without
the need of any particular protocol.
SmartNet is based on MAC, which is the most
recently developed NRTK GPS technique,
developed through joint research carried out by
Leica Geosystems and Geo++ in 2001 (Euler et
al. 2001). MAC is the basis of` the RTCM 3.1
format message which is the new standard for
Differential GNSS that fully supports NRTK
GPS (RTCM 2006).
A fundamental requirement of MAC is that the
phase measurements from the CORS are
reduced to a common ambiguity level. Euler et
al. (2001) state that “two reference stations are
said to be on a common ambiguity level if the
integer ambiguity for each phase range
(satellite-receiver pair) has been removed (or
adjusted) so that when double differences are
formed the integer ambiguity cancels”.
Once the common ambiguity level has been
achieved, full raw observation and coordinate
information for one reference station (called the
master station) and correction differences and
coordinate differences for all other stations in
the network (called auxiliary stations) are
transmitted to a rover station (Zebhauser et al.
2002). Brown et al. (2005b) explain that
“depending on its processing capabilities the
rover may use the correction difference
information to simply interpolate the error at its
location or to reconstruct the full observation
information from all reference stations in the
network”. The rover position is then calculated
using double differenced carrier phase.
3. Quality assessment methodology
Several static and kinematic tests were carried
out in order to evaluate the positional quality of
SmartNet. The dedicated static tests were to
evaluate the accuracy, precision and availability
of the SmartNet NRTK GPS solutions, whereas
the kinematic tests were intended to assess only
their accuracy (when compared with a more
accurate solution) and availability.
All the tests had a general objective, i.e., to
examine the influence of several factors on the
SmartNet solutions, such as the number of GPS
satellites in view and their geometry, and the
age of the NRTK corrections (AoC) when they
were received at the rover receiver.
As can be seen in Table 1, a total of eight static
tests were performed (TS1, TS2, TS3, TS4,
TS5, TS6, TS7 and TS8). Two kinematic tests
(TK1 and TK2) were carried out, one of which
was designed to evaluate the accuracy and
availability of SmartNet on a road section in a
built-up area (TK1) in the Nottingham city
centre.
The NRTK method or correction type used
during tests is also listed in Table 1. SmartNet
can offer three different correction services, i.e.
Broadcast-MAX, Auto-MAX (MAX) and i-
MAX. More details about these services can be
found in Burbidge (2006). As a way of
assessing the performance of different
correction types, it was planned to use a
particular message type each time. However,
due to the Broadcast-MAX correction service
not being activated, it was not possible to test it.
Thus only message types Auto-MAX (TS3, TS4
and TS6) and i-MAX (TS1, TS2, TS5, TK1 and
TK2) were used.In addition, TS7 and TS8 were
performed using conventional single reference
RTK in order to compare their results against
those from the NRTK GPS positioning tests.
Table 1: Details of the tests that were performed
using different correction services.
TS1 SmartNet I-MAX Static 10° 1
TS2 SmartNet I-MAX Static 10° 1
TS3 SmartNet MAX Static 10° 1
TS4 SmartNet MAX Static 10° 1
TS5 SmartNet I-MAX Static 10° 1
TS6 SmartNet MAX Static 10° 1
TS7 SmartNet Conv. RTK Static 10° 1
TS8 UoN/Leica Conv. RTK Static 10° 1
TK1 SmartNet I-MAX Kinematic 0° 20
TK2 SmartNet I-MAX Kinematic 0° 20
NRTK
method
Cut
off
angle
Obs.
rate
(Hz)
Obs.
methodTest
Network
Sercice
This investigation was mainly intended to
evaluate the quality of the SmartNet services
from the end users’ point of view; therefore, the
majority of the tests were carried out using the
service “as it is”. This means that, as SmartNet
is a commercial NRTK service in Great Britain,
the corrections received during the tests were
the same as any other subscribers would have
received if using the service at the same
location and time.
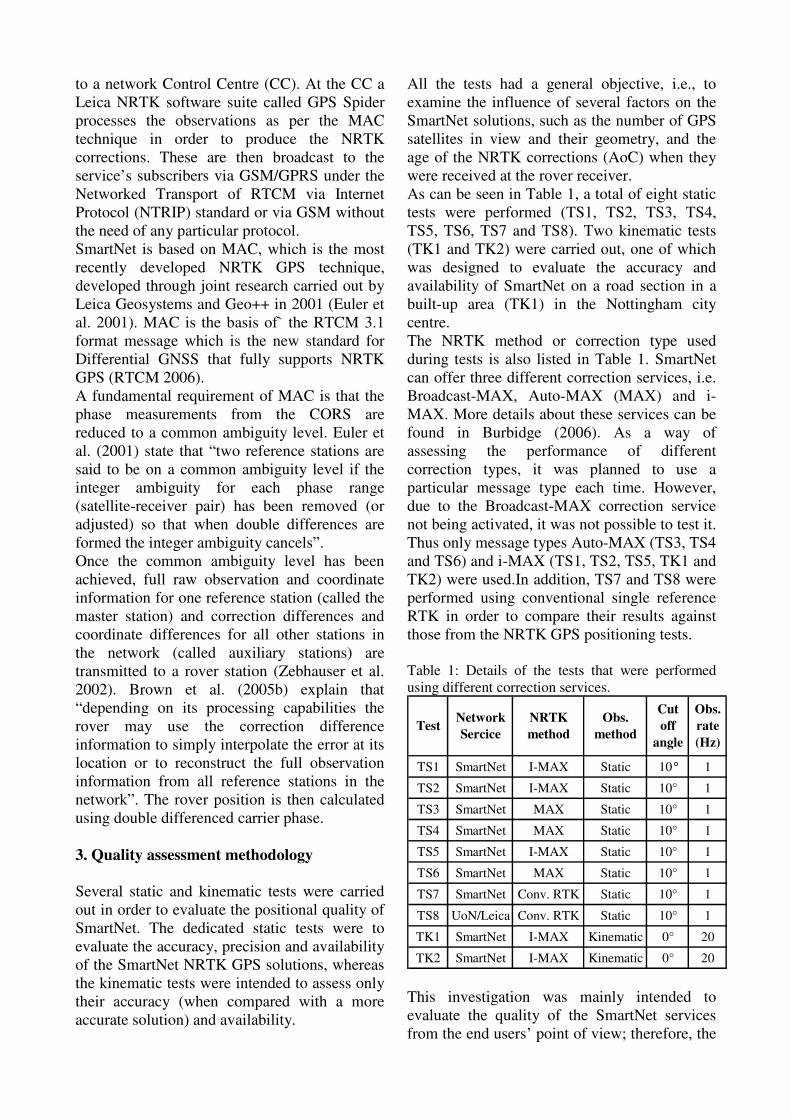
However, as the CORS configuration of the
SmartNet network included a reference station
(RS) located about 10km (KEYW) from the
rover site (see Figure 2), a new CORS
configuration was especially created for some
of these tests by removing KEYW from the
NRTK solution. The nearest RS to the rover site
was then located about 49km away, which
could be considered a typical configuration for
a NRTK GPS application (see Figure 3).
Figure 2: A SmartNet CORS configuration used
during the tests TS1, TS2, TS3, TS4, TK1 and TK2.
Except for kinematic tests (TK1 and TK2), the rover
site location is indicated in red (IES2) with the
nearest reference station (KEYW) located at
10.30km, the farthest (WELL) located at about
80.23km and the average distance between CORS is
about 47.32km.
Figure 3: A sparser SmartNet CORS configuration
used during TS5 and TS6. The distance of the rover
site (IES2) from the nearest reference station
(LICH) is 49.11km, and the farthest site (WELL) is
located at about 80.23km, and the average distance
between CORS is about 47.78km.
As already mentioned, two conventional RTK
tests were also performed. A short baseline test
called TS7 used KEYW as the reference station
(see Figure 2), and its results could be directly
compared against those from TS1, TS2, TS3
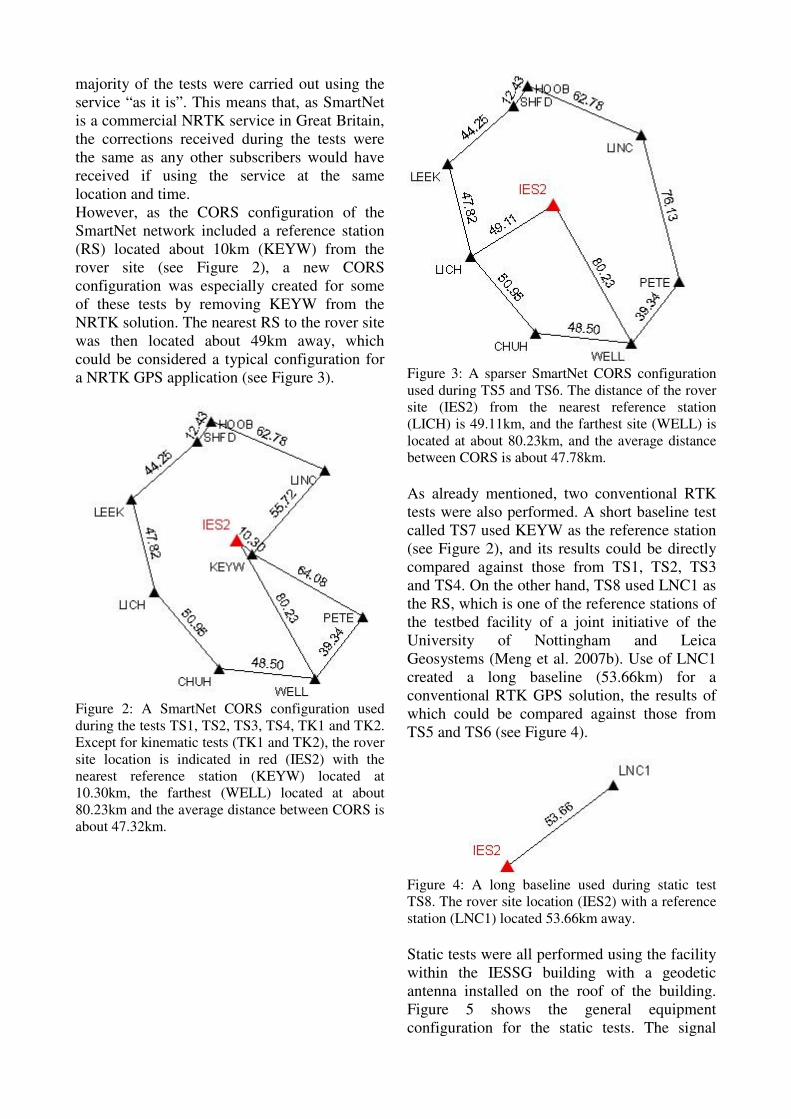
and TS4. On the other hand, TS8 used LNC1 as
the RS, which is one of the reference stations of
the testbed facility of a joint initiative of the
University of Nottingham and Leica
Geosystems (Meng et al. 2007b). Use of LNC1
created a long baseline (53.66km) for a
conventional RTK GPS solution, the results of
which could be compared against those from
TS5 and TS6 (see Figure 4).
Figure 4: A long baseline used during static test
TS8. The rover site location (IES2) with a reference
station (LNC1) located 53.66km away.
Static tests were all performed using the facility
within the IESSG building with a geodetic
antenna installed on the roof of the building.
Figure 5 shows the general equipment
configuration for the static tests. The signal
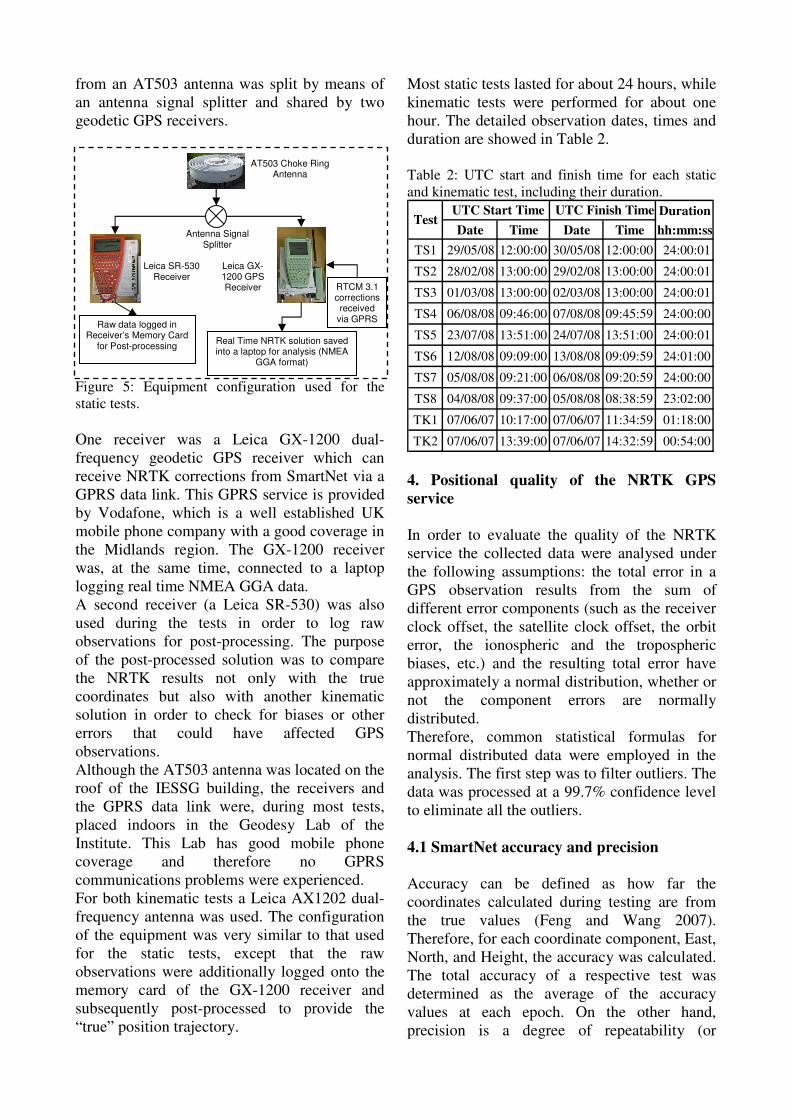
from an AT503 antenna was split by means of
an antenna signal splitter and shared by two
geodetic GPS receivers.
Figure 5: Equipment configuration used for the
static tests.
One receiver was a Leica GX-1200 dual-
frequency geodetic GPS receiver which can
receive NRTK corrections from SmartNet via a
GPRS data link. This GPRS service is provided
by Vodafone, which is a well established UK
mobile phone company with a good coverage in
the Midlands region. The GX-1200 receiver
was, at the same time, connected to a laptop
logging real time NMEA GGA data.
A second receiver (a Leica SR-530) was also
used during the tests in order to log raw
observations for post-processing. The purpose
of the post-processed solution was to compare
the NRTK results not only with the true
coordinates but also with another kinematic
solution in order to check for biases or other
errors that could have affected GPS
observations.
Although the AT503 antenna was located on the
roof of the IESSG building, the receivers and
the GPRS data link were, during most tests,
placed indoors in the Geodesy Lab of the
Institute. This Lab has good mobile phone
coverage and therefore no GPRS
communications problems were experienced.
For both kinematic tests a Leica AX1202 dual-
frequency antenna was used. The configuration
of the equipment was very similar to that used
for the static tests, except that the raw
observations were additionally logged onto the
memory card of the GX-1200 receiver and
subsequently post-processed to provide the
“true” position trajectory.
Most static tests lasted for about 24 hours, while
kinematic tests were performed for about one
hour. The detailed observation dates, times and
duration are showed in Table 2.
Table 2: UTC start and finish time for each static
and kinematic test, including their duration.
Duration
Date Time Date Time hh:mm:ss
TS1 29/05/08 12:00:00 30/05/08 12:00:00 24:00:01
TS2 28/02/08 13:00:00 29/02/08 13:00:00 24:00:01
TS3 01/03/08 13:00:00 02/03/08 13:00:00 24:00:01
TS4 06/08/08 09:46:00 07/08/08 09:45:59 24:00:00
TS5 23/07/08 13:51:00 24/07/08 13:51:00 24:00:01
TS6 12/08/08 09:09:00 13/08/08 09:09:59 24:01:00
TS7 05/08/08 09:21:00 06/08/08 09:20:59 24:00:00
TS8 04/08/08 09:37:00 05/08/08 08:38:59 23:02:00
TK1 07/06/07 10:17:00 07/06/07 11:34:59 01:18:00
TK2 07/06/07 13:39:00 07/06/07 14:32:59 00:54:00
Test UTC Start Time UTC Finish Time
4. Positional quality of the NRTK GPS
service
In order to evaluate the quality of the NRTK
service the collected data were analysed under
the following assumptions: the total error in a
GPS observation results from the sum of
different error components (such as the receiver
clock offset, the satellite clock offset, the orbit
error, the ionospheric and the tropospheric
biases, etc.) and the resulting total error have
approximately a normal distribution, whether or
not the component errors are normally
distributed.
Therefore, common statistical formulas for
normal distributed data were employed in the
analysis. The first step was to filter outliers. The
data was processed at a 99.7% confidence level
to eliminate all the outliers.
4.1 SmartNet accuracy and precision
Accuracy can be defined as how far the
coordinates calculated during testing are from
the true values (Feng and Wang 2007).
Therefore, for each coordinate component, East,
North, and Height, the accuracy was calculated.
The total accuracy of a respective test was
determined as the average of the accuracy
values at each epoch. On the other hand,
precision is a degree of repeatability (or
AT503 Choke Ring Antenna
Antenna Signal Splitter
Leica SR-530 Receiver
Leica GX-1200 GPS Receiver
Raw data logged in Receiver’s Memory Card
for Post-processing Real Time NRTK solution saved into a laptop for analysis (NMEA
GGA format)
RTCM 3.1 corrections received
via GPRS
closeness) that repeated measurements display,
and is therefore used as a means to describe the
quality of the data with respect to random errors
(Rizos 1999). It was represented by the standard
deviation (SD) of the solutions (3 sigma, about
99.7% of solutions).
The accuracy and precision obtained during the
tests is summarised in Table 3. The results in
this table are based on epochs with valid NRTK
observations. As can be seen, TS1, TS2, TS3
and TS4 had the best accuracy and precision of
all the tests, with most values at the millimetre
level. At the same time, results from the sparse
SmartNet CORS configuration tests (TS5 and
TS6) showed better accuracy and precision than
TS8 (conventional long baseline RTK test). The
accuracy and precision of the kinematic tests
were at the centimetre level.
Table 3: Accuracy (Ave.) and precision (SD) in
centimetres obtained during both static and
kinematic tests, for the East, North and Height
coordinate components.
Ave. SD (+/-) Ave. SD (+/-) Ave. SD (+/-)
TS1 0.08 0.43 -0.42 0.83 -0.76 1.17
TS2 0.06 0.47 -0.68 0.86 -0.89 1.17
TS3 0.04 0.84 -1.15 1.47 -1.70 1.52
TS4 -0.12 0.61 -0.54 1.11 -0.62 1.33
TS5 0.11 0.75 0.77 1.64 1.02 2.27
TS6 0.42 0.77 0.02 1.75 0.37 2.42
TS7 -0.29 0.64 -0.93 1.42 -1.05 1.57
TS8 1.62 0.79 -2.64 2.36 2.09 2.79
TK1 -1.05 1.44 -3.53 2.22 1.60 4.68
TK2 -1.11 1.62 -3.52 2.70 2.35 5.07
TestEast North Heigth
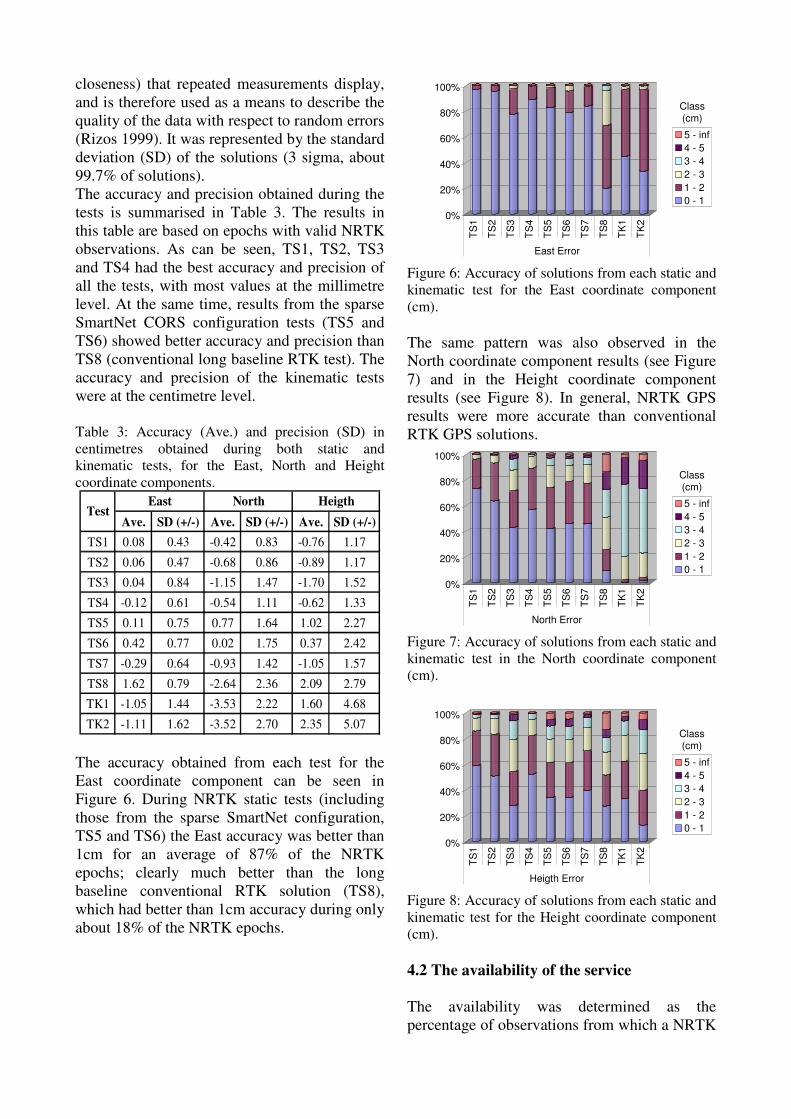
The accuracy obtained from each test for the
East coordinate component can be seen in
Figure 6. During NRTK static tests (including
those from the sparse SmartNet configuration,
TS5 and TS6) the East accuracy was better than
1cm for an average of 87% of the NRTK
epochs; clearly much better than the long
baseline conventional RTK solution (TS8),
which had better than 1cm accuracy during only
about 18% of the NRTK epochs.
0%
20%
40%
60%
80%
100%
TS
1
TS
2
TS
3
TS
4
TS
5
TS
6
TS
7
TS
8
TK
1
TK
2
East Error
5 - inf
4 - 5
3 - 4
2 - 3
1 - 2
0 - 1
Class(cm)
Figure 6: Accuracy of solutions from each static and
kinematic test for the East coordinate component
(cm).
The same pattern was also observed in the
North coordinate component results (see Figure
7) and in the Height coordinate component
results (see Figure 8). In general, NRTK GPS
results were more accurate than conventional
RTK GPS solutions.
0%
20%
40%
60%
80%
100%
TS
1
TS
2
TS
3
TS
4
TS
5
TS
6
TS
7
TS
8
TK
1
TK
2
North Error
5 - inf
4 - 5
3 - 4
2 - 3
1 - 2
0 - 1
Class(cm)
Figure 7: Accuracy of solutions from each static and
kinematic test in the North coordinate component
(cm).
0%
20%
40%
60%
80%
100%
TS
1
TS
2
TS
3
TS
4
TS
5
TS
6
TS
7
TS
8
TK
1
TK
2
Heigth Error
5 - inf
4 - 5
3 - 4
2 - 3
1 - 2
0 - 1
Class(cm)
Figure 8: Accuracy of solutions from each static and
kinematic test for the Height coordinate component
(cm).
4.2 The availability of the service
The availability was determined as the
percentage of observations from which a NRTK
GPS solution (integer ambiguities resolved) was
obtained during a test (Brown et al. 2005a).
This is a vital index for the good performance
of the SmartNet service. The accuracy and
precision of the position results directly depend
on whether the solution obtained is NRTK or
not.
A summary of the availability found during the
tests is given in Table 4. As can be seen, the
availability of the NRTK service during static
tests was always over 97.74%. The highest
availability was obtained during TS3 (99.77%),
while both conventional RTK tests (TS7 and
TS8) also showed high availability values over
99.80%. The lowest availability levels for static
NRTK tests were observed during TS5
(98.54%) and TS6 (97.74%). These tests were
performed using the sparse SmartNet CORS
configuration, which might indicate the
additional difficulties that NRTK faces when
resolving ambiguities at the rover side for
sparse CORS configurations.
Table 4: Number of possible NRTK epochs and
actual epochs in which a NRTK solution was
achieved, including the availability during each test.
TestPossible
Epochs
Actual
Epochs
Availability
(%)
TS1 86401 85535 99.00
TS2 86401 85678 99.16
TS3 86401 86205 99.77
TS4 86400 85735 99.23
TS5 86401 85135 98.54
TS6 86460 84506 97.74
TS7 86400 86224 99.80
TS8 82920 82777 99.83
TK1 93599 50905 54.39
TK2 64799 40736 62.87
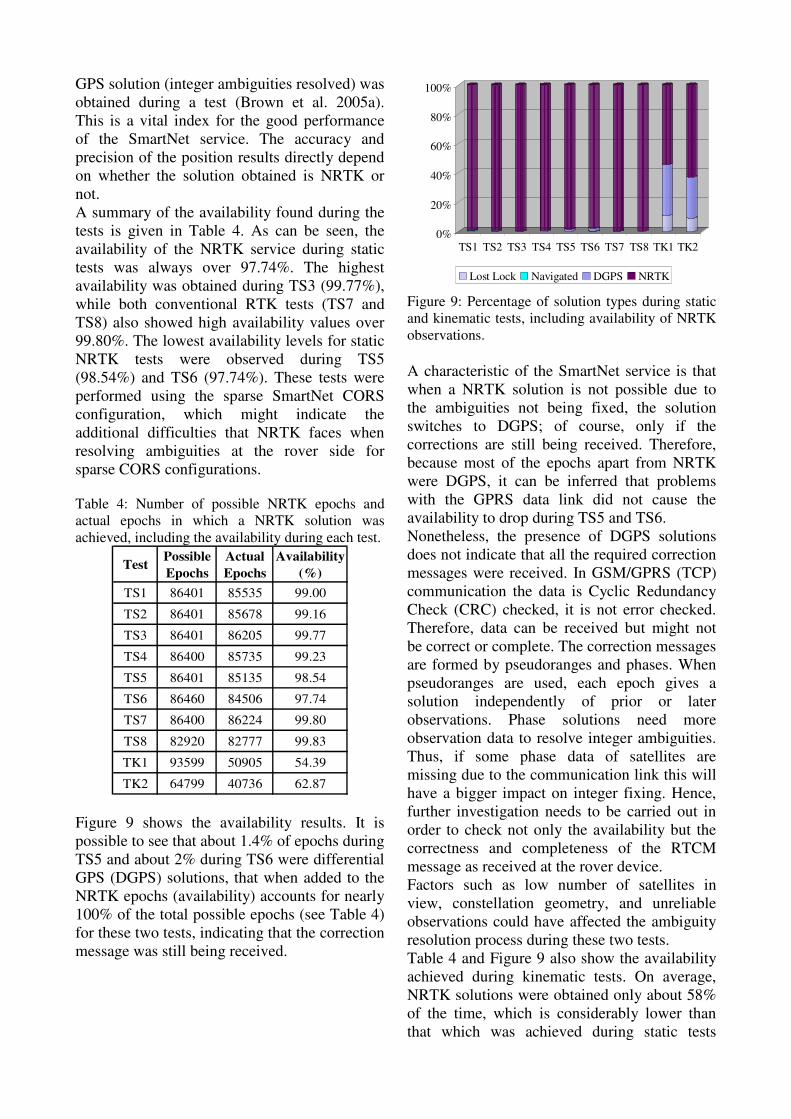
Figure 9 shows the availability results. It is
possible to see that about 1.4% of epochs during
TS5 and about 2% during TS6 were differential
GPS (DGPS) solutions, that when added to the
NRTK epochs (availability) accounts for nearly
100% of the total possible epochs (see Table 4)
for these two tests, indicating that the correction
message was still being received.
0%
20%
40%
60%
80%
100%
TS1 TS2 TS3 TS4 TS5 TS6 TS7 TS8 TK1 TK2
Lost Lock Navigated DGPS NRTK
Figure 9: Percentage of solution types during static
and kinematic tests, including availability of NRTK
observations.
A characteristic of the SmartNet service is that
when a NRTK solution is not possible due to
the ambiguities not being fixed, the solution
switches to DGPS; of course, only if the
corrections are still being received. Therefore,
because most of the epochs apart from NRTK
were DGPS, it can be inferred that problems
with the GPRS data link did not cause the
availability to drop during TS5 and TS6.
Nonetheless, the presence of DGPS solutions
does not indicate that all the required correction
messages were received. In GSM/GPRS (TCP)
communication the data is Cyclic Redundancy
Check (CRC) checked, it is not error checked.
Therefore, data can be received but might not
be correct or complete. The correction messages
are formed by pseudoranges and phases. When
pseudoranges are used, each epoch gives a
solution independently of prior or later
observations. Phase solutions need more
observation data to resolve integer ambiguities.
Thus, if some phase data of satellites are
missing due to the communication link this will
have a bigger impact on integer fixing. Hence,
further investigation needs to be carried out in
order to check not only the availability but the
correctness and completeness of the RTCM
message as received at the rover device.
Factors such as low number of satellites in
view, constellation geometry, and unreliable
observations could have affected the ambiguity
resolution process during these two tests.
Table 4 and Figure 9 also show the availability
achieved during kinematic tests. On average,
NRTK solutions were obtained only about 58%
of the time, which is considerably lower than
that which was achieved during static tests
(over 97%). Due to the routes travelled during
both kinematic tests the availability of TK2 was
about 8% better than that of TK1.
Except for an extra route in a built-up area in
the Nottingham city centre during TK1, the
same trajectory was travelled during both
kinematic tests. The data collection started at
the IESSG car park, continued on major roads
to junction 26 of the M1 Motorway, then went
south on the M1 to junction 24, and came back
by the same route to the IESSG car park where
the data collection finished. Additionally,
during TK1, some urban roads forming a ring
around the Nottingham city centre were covered
before returning back to the IESSG car park.
Figure 10 shows the 2D and 3D root mean
square error (RMSE) observed during TK1. It is
evident that there are many gaps when a NRTK
solution was not possible. In particular, the
availability in the built-up area is much lower
than for the rest of the route. Nevertheless, as
can also be seen, most of the achieved NRTK
epochs had 2D and 3D RMSE better than 5cm.
4.45 4.5 4.55 4.6
x 105
3.26
3.28
3.3
3.32
3.34
3.36
3.38
3.4
3.42
3.44
3.46x 10
5 2DRMSE
No
rth
ing
(m
)
Easting (m)4.45 4.5 4.55 4.6
x 105
3.26
3.28
3.3
3.32
3.34
3.36
3.38
3.4
3.42
3.44
3.46x 10
5 3DRMSE
No
rth
ing
(m
)
Easting (m) Figure 10: 2D and 3D RMSE errors observed during
TK1, represented over the route covered during the
test.
Many factors were found to cause the lack of
availability during the kinematic tests:
• GPS signal blockage and multipath
when passing under flyover bridges,
which are very common along the M1
motorway (refer to Figure 11). The
signal blockage and multipath caused
the ambiguity fix to be lost and therefore
the NRTK solution could not be
obtained. This situation occurred several
times while on the M1 and was clearly
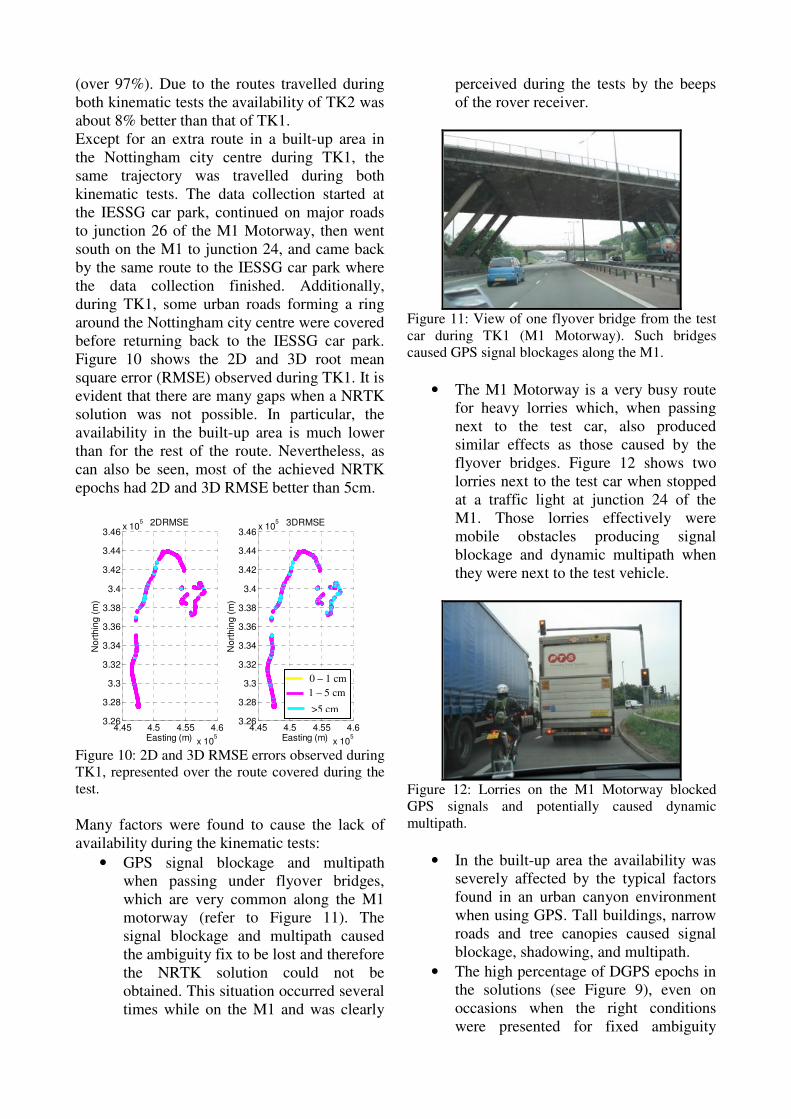
perceived during the tests by the beeps
of the rover receiver.
Figure 11: View of one flyover bridge from the test
car during TK1 (M1 Motorway). Such bridges
caused GPS signal blockages along the M1.
• The M1 Motorway is a very busy route
for heavy lorries which, when passing
next to the test car, also produced
similar effects as those caused by the
flyover bridges. Figure 12 shows two
lorries next to the test car when stopped
at a traffic light at junction 24 of the
M1. Those lorries effectively were
mobile obstacles producing signal
blockage and dynamic multipath when
they were next to the test vehicle.
Figure 12: Lorries on the M1 Motorway blocked
GPS signals and potentially caused dynamic
multipath.
• In the built-up area the availability was
severely affected by the typical factors
found in an urban canyon environment
when using GPS. Tall buildings, narrow
roads and tree canopies caused signal
blockage, shadowing, and multipath.
• The high percentage of DGPS epochs in
the solutions (see Figure 9), even on
occasions when the right conditions
were presented for fixed ambiguity
0 – 1 cm
>5 cm
1 – 5 cm
solutions (more than five satellites in
view and uninterrupted reception of the
RTCM message), might suggest some
problems in the cycle slip
detection/repair and/or ambiguity
resolution algorithms. However,
although this assumption needs further
investigation, these algorithms have
always demonstrated high robustness
during previous research (Brown et al.
2005a; Meng et al. 2007b).
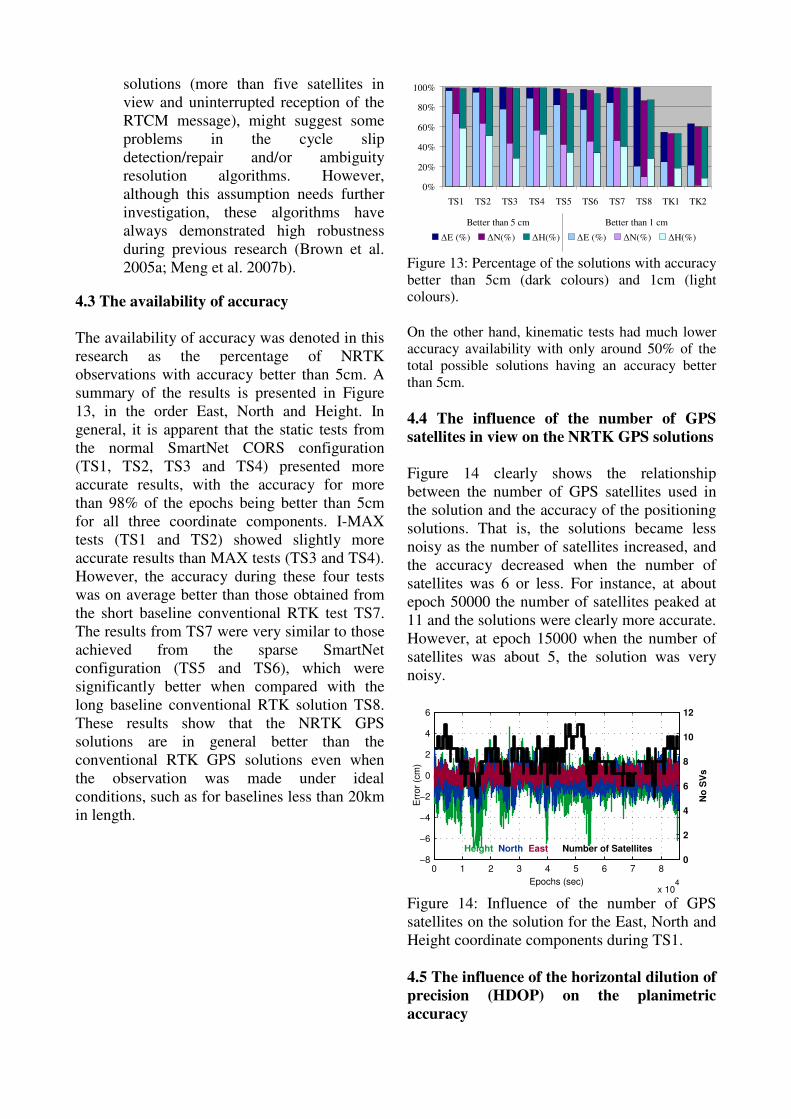
4.3 The availability of accuracy
The availability of accuracy was denoted in this
research as the percentage of NRTK
observations with accuracy better than 5cm. A
summary of the results is presented in Figure
13, in the order East, North and Height. In
general, it is apparent that the static tests from
the normal SmartNet CORS configuration
(TS1, TS2, TS3 and TS4) presented more
accurate results, with the accuracy for more
than 98% of the epochs being better than 5cm
for all three coordinate components. I-MAX
tests (TS1 and TS2) showed slightly more
accurate results than MAX tests (TS3 and TS4).
However, the accuracy during these four tests
was on average better than those obtained from
the short baseline conventional RTK test TS7.
The results from TS7 were very similar to those
achieved from the sparse SmartNet
configuration (TS5 and TS6), which were
significantly better when compared with the
long baseline conventional RTK solution TS8.
These results show that the NRTK GPS
solutions are in general better than the
conventional RTK GPS solutions even when
the observation was made under ideal
conditions, such as for baselines less than 20km
in length.
0%
20%
40%
60%
80%
100%
TS1 TS2 TS3 TS4 TS5 TS6 TS7 TS8 TK1 TK2
∆E (%) ∆N(%) ∆H(%) ∆E (%) ∆N(%) ∆H(%)
Better than 5 cm Better than 1 cm
Figure 13: Percentage of the solutions with accuracy
better than 5cm (dark colours) and 1cm (light
colours).
On the other hand, kinematic tests had much lower
accuracy availability with only around 50% of the
total possible solutions having an accuracy better
than 5cm.
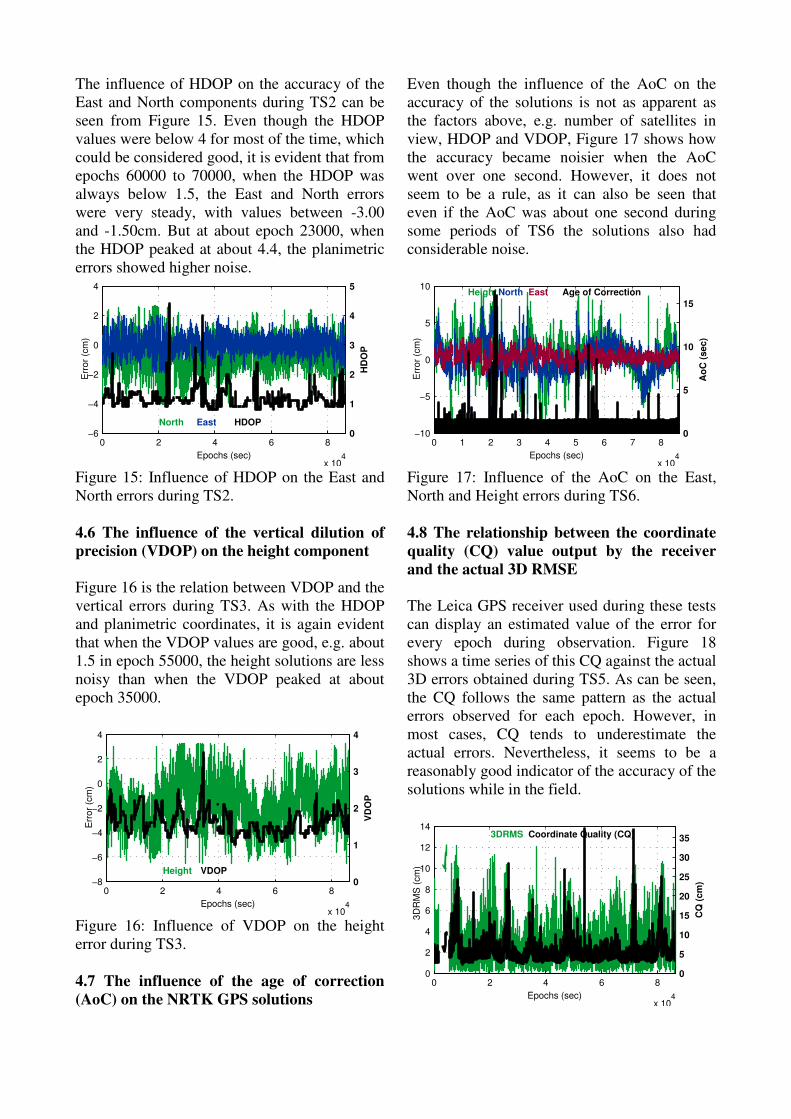
4.4 The influence of the number of GPS
satellites in view on the NRTK GPS solutions
Figure 14 clearly shows the relationship
between the number of GPS satellites used in
the solution and the accuracy of the positioning
solutions. That is, the solutions became less
noisy as the number of satellites increased, and
the accuracy decreased when the number of
satellites was 6 or less. For instance, at about
epoch 50000 the number of satellites peaked at
11 and the solutions were clearly more accurate.
However, at epoch 15000 when the number of
satellites was about 5, the solution was very
noisy.
0 1 2 3 4 5 6 7 8
x 104
−8
−6
−4
−2
0
2
4
6
Epochs (sec)
Err
or
(cm
)
Height North East Number of Satellites
0
2
4
6
8
10
12N
o S
Vs
Figure 14: Influence of the number of GPS
satellites on the solution for the East, North and
Height coordinate components during TS1.
4.5 The influence of the horizontal dilution of
precision (HDOP) on the planimetric
accuracy
The influence of HDOP on the accuracy of the
East and North components during TS2 can be
seen from Figure 15. Even though the HDOP
values were below 4 for most of the time, which
could be considered good, it is evident that from
epochs 60000 to 70000, when the HDOP was
always below 1.5, the East and North errors
were very steady, with values between -3.00
and -1.50cm. But at about epoch 23000, when
the HDOP peaked at about 4.4, the planimetric
errors showed higher noise.
0 2 4 6 8
x 104
−6
−4
−2
0
2
4
Epochs (sec)
Err
or
(cm
)
HDOPNorth East
0
1
2
3
4
5
HD
OP
Figure 15: Influence of HDOP on the East and
North errors during TS2.
4.6 The influence of the vertical dilution of
precision (VDOP) on the height component
Figure 16 is the relation between VDOP and the
vertical errors during TS3. As with the HDOP
and planimetric coordinates, it is again evident
that when the VDOP values are good, e.g. about
1.5 in epoch 55000, the height solutions are less
noisy than when the VDOP peaked at about
epoch 35000.
0 2 4 6 8
x 104
−8
−6
−4
−2
0
2
4
Epochs (sec)
Err
or
(cm
)
VDOPHeight
0
1
2
3
4
VD
OP
Figure 16: Influence of VDOP on the height
error during TS3.
4.7 The influence of the age of correction
(AoC) on the NRTK GPS solutions
Even though the influence of the AoC on the
accuracy of the solutions is not as apparent as
the factors above, e.g. number of satellites in
view, HDOP and VDOP, Figure 17 shows how
the accuracy became noisier when the AoC
went over one second. However, it does not
seem to be a rule, as it can also be seen that
even if the AoC was about one second during
some periods of TS6 the solutions also had
considerable noise.
0 1 2 3 4 5 6 7 8
x 104
−10
−5
0
5
10
Epochs (sec)
Err
or
(cm
)
HeightNorth East Age of Correction
0
5
10
15
Ao
C (
se
c)
Figure 17: Influence of the AoC on the East,
North and Height errors during TS6.
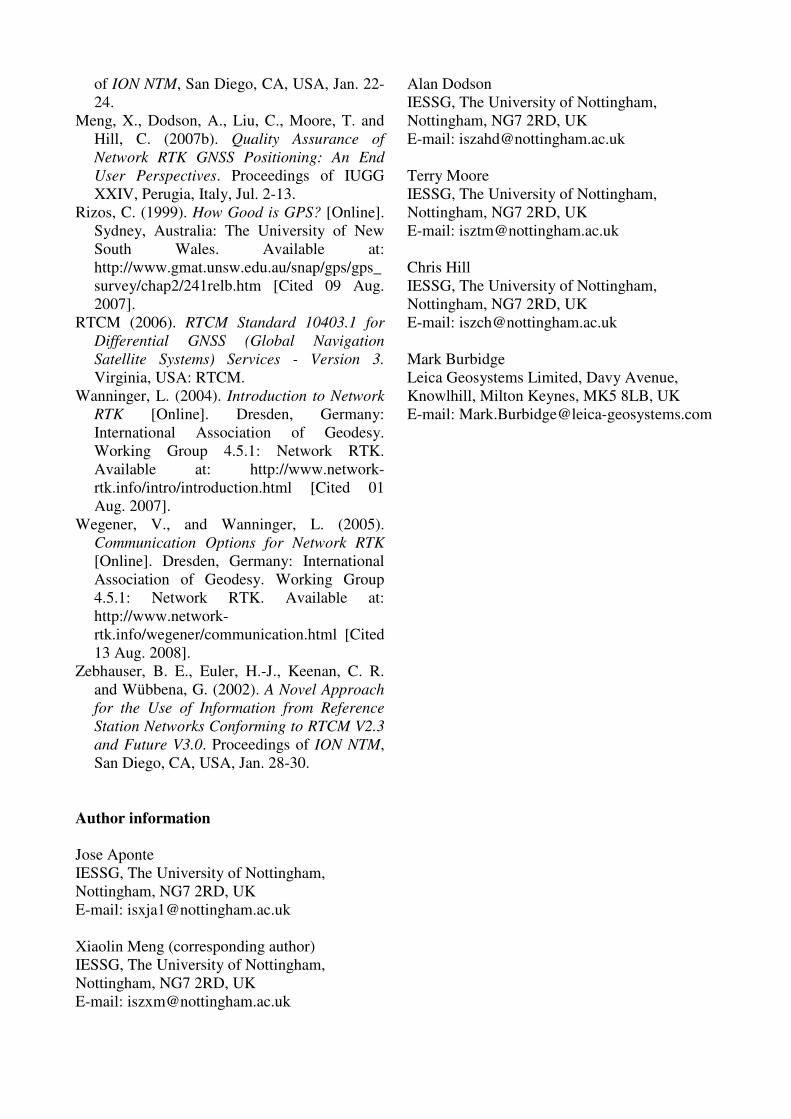
4.8 The relationship between the coordinate
quality (CQ) value output by the receiver
and the actual 3D RMSE
The Leica GPS receiver used during these tests
can display an estimated value of the error for
every epoch during observation. Figure 18
shows a time series of this CQ against the actual
3D errors obtained during TS5. As can be seen,
the CQ follows the same pattern as the actual
errors observed for each epoch. However, in
most cases, CQ tends to underestimate the
actual errors. Nevertheless, it seems to be a
reasonably good indicator of the accuracy of the
solutions while in the field.
0 2 4 6 8
x 104
0
2
4
6
8
10
12
14
Epochs (sec)
3D
RM
S (
cm
)
Coordinate Quality (CQ)3DRMS
0
5
10
15
20
25
30
35
CQ
(c
m)
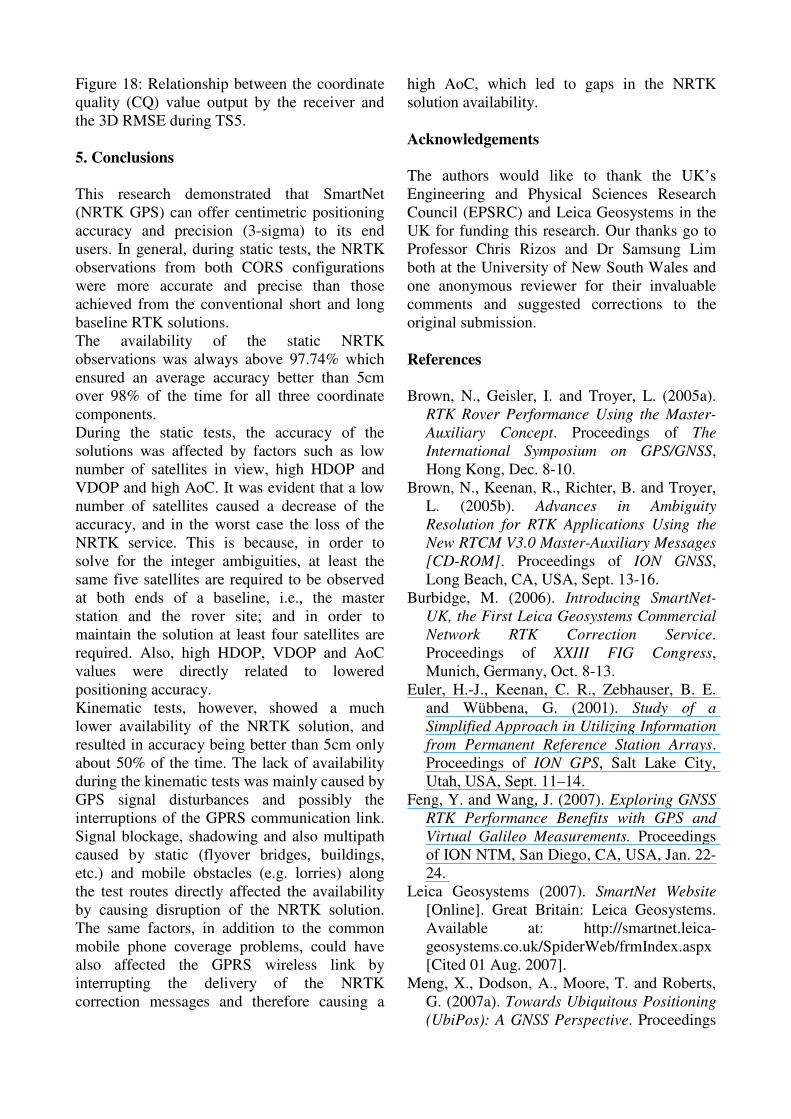
Figure 18: Relationship between the coordinate
quality (CQ) value output by the receiver and
the 3D RMSE during TS5.
5. Conclusions
This research demonstrated that SmartNet
(NRTK GPS) can offer centimetric positioning
accuracy and precision (3-sigma) to its end
users. In general, during static tests, the NRTK
observations from both CORS configurations
were more accurate and precise than those
achieved from the conventional short and long
baseline RTK solutions.
The availability of the static NRTK
observations was always above 97.74% which
ensured an average accuracy better than 5cm
over 98% of the time for all three coordinate
components.
During the static tests, the accuracy of the
solutions was affected by factors such as low
number of satellites in view, high HDOP and
VDOP and high AoC. It was evident that a low
number of satellites caused a decrease of the
accuracy, and in the worst case the loss of the
NRTK service. This is because, in order to
solve for the integer ambiguities, at least the
same five satellites are required to be observed
at both ends of a baseline, i.e., the master
station and the rover site; and in order to
maintain the solution at least four satellites are
required. Also, high HDOP, VDOP and AoC
values were directly related to lowered
positioning accuracy.
Kinematic tests, however, showed a much
lower availability of the NRTK solution, and
resulted in accuracy being better than 5cm only
about 50% of the time. The lack of availability
during the kinematic tests was mainly caused by
GPS signal disturbances and possibly the
interruptions of the GPRS communication link.
Signal blockage, shadowing and also multipath
caused by static (flyover bridges, buildings,
etc.) and mobile obstacles (e.g. lorries) along
the test routes directly affected the availability
by causing disruption of the NRTK solution.
The same factors, in addition to the common
mobile phone coverage problems, could have
also affected the GPRS wireless link by
interrupting the delivery of the NRTK
correction messages and therefore causing a
high AoC, which led to gaps in the NRTK
solution availability.
Acknowledgements
The authors would like to thank the UK’s
Engineering and Physical Sciences Research
Council (EPSRC) and Leica Geosystems in the
UK for funding this research. Our thanks go to
Professor Chris Rizos and Dr Samsung Lim
both at the University of New South Wales and
one anonymous reviewer for their invaluable
comments and suggested corrections to the
original submission.
References
Brown, N., Geisler, I. and Troyer, L. (2005a).
RTK Rover Performance Using the Master-
Auxiliary Concept. Proceedings of The
International Symposium on GPS/GNSS,
Hong Kong, Dec. 8-10.
Brown, N., Keenan, R., Richter, B. and Troyer,
L. (2005b). Advances in Ambiguity
Resolution for RTK Applications Using the
New RTCM V3.0 Master-Auxiliary Messages
[CD-ROM]. Proceedings of ION GNSS,
Long Beach, CA, USA, Sept. 13-16.
Burbidge, M. (2006). Introducing SmartNet-
UK, the First Leica Geosystems Commercial
Network RTK Correction Service.
Proceedings of XXIII FIG Congress,
Munich, Germany, Oct. 8-13.
Euler, H.-J., Keenan, C. R., Zebhauser, B. E.
and Wübbena, G. (2001). Study of a
Simplified Approach in Utilizing Information
from Permanent Reference Station Arrays.
Proceedings of ION GPS, Salt Lake City,
Utah, USA, Sept. 11–14.
Feng, Y. and Wang, J. (2007). Exploring GNSS
RTK Performance Benefits with GPS and
Virtual Galileo Measurements. Proceedings
of ION NTM, San Diego, CA, USA, Jan. 22-
24.
Leica Geosystems (2007). SmartNet Website
[Online]. Great Britain: Leica Geosystems.
Available at: http://smartnet.leica-
geosystems.co.uk/SpiderWeb/frmIndex.aspx
[Cited 01 Aug. 2007].
Meng, X., Dodson, A., Moore, T. and Roberts,
G. (2007a). Towards Ubiquitous Positioning
(UbiPos): A GNSS Perspective. Proceedings
of ION NTM, San Diego, CA, USA, Jan. 22-
24.
Meng, X., Dodson, A., Liu, C., Moore, T. and
Hill, C. (2007b). Quality Assurance of
Network RTK GNSS Positioning: An End
User Perspectives. Proceedings of IUGG
XXIV, Perugia, Italy, Jul. 2-13.
Rizos, C. (1999). How Good is GPS? [Online].
Sydney, Australia: The University of New
South Wales. Available at:
http://www.gmat.unsw.edu.au/snap/gps/gps_
survey/chap2/241relb.htm [Cited 09 Aug.
2007].
RTCM (2006). RTCM Standard 10403.1 for
Differential GNSS (Global Navigation
Satellite Systems) Services - Version 3.
Virginia, USA: RTCM.
Wanninger, L. (2004). Introduction to Network
RTK [Online]. Dresden, Germany:
International Association of Geodesy.
Working Group 4.5.1: Network RTK.
Available at: http://www.network-
rtk.info/intro/introduction.html [Cited 01
Aug. 2007].
Wegener, V., and Wanninger, L. (2005).
Communication Options for Network RTK
[Online]. Dresden, Germany: International
Association of Geodesy. Working Group
4.5.1: Network RTK. Available at:
http://www.network-
rtk.info/wegener/communication.html [Cited
13 Aug. 2008].
Zebhauser, B. E., Euler, H.-J., Keenan, C. R.
and Wübbena, G. (2002). A Novel Approach
for the Use of Information from Reference
Station Networks Conforming to RTCM V2.3
and Future V3.0. Proceedings of ION NTM,
San Diego, CA, USA, Jan. 28-30.
Author information
Jose Aponte
IESSG, The University of Nottingham,
Nottingham, NG7 2RD, UK
E-mail: [email protected]
Xiaolin Meng (corresponding author)
IESSG, The University of Nottingham,
Nottingham, NG7 2RD, UK
E-mail: [email protected]
Alan Dodson
IESSG, The University of Nottingham,
Nottingham, NG7 2RD, UK
E-mail: [email protected]
Terry Moore
IESSG, The University of Nottingham,
Nottingham, NG7 2RD, UK
E-mail: [email protected]
Chris Hill
IESSG, The University of Nottingham,
Nottingham, NG7 2RD, UK
E-mail: [email protected]
Mark Burbidge
Leica Geosystems Limited, Davy Avenue,
Knowlhill, Milton Keynes, MK5 8LB, UK
E-mail: [email protected]
Copyright © 2022 FDOKUMEN