Q4 FY 22 Earnings Review - Investor Relations | ReNew Power
36
1 Q4 FY 22 Earnings Review June 15, 2022
-
Upload
khangminh22 -
Category
Documents
-
view
0 -
download
0
Transcript of Q4 FY 22 Earnings Review - Investor Relations | ReNew Power
1
Q4 FY 22 Earnings ReviewJune 15, 2022

2
Disclaimer
This announcement contains certain forward-looking statements within the meaning of the federal securities laws, including statements regarding the services offered by ReNewEnergy Global, the markets in which ReNew Energy Global operates and ReNew Energy Global’s future potential financial and operational results. These forward-looking statements generally are identified by the words "believe," "project," "expect," "anticipate," "estimate," "intend," "strategy," "future," "opportunity," "plan," "may," "should," "will," "would," "will be," "will continue," "will likely result," and similar expressions. Forward-looking statements are predictions, projections and other statements about future events that are based on current expectations and assumptions and, as a result, are subject to risks and uncertainties. Many factors could cause actual future events to differ materially from the forward-looking statements in this announcement, including but not limited to, the ability to implement business plans, forecasts, and other expectations, the ability to identify and realize additional opportunities, and potential changes and developments in the highly competitive renewable energy and related industries. The foregoing list of factors is not exhaustive. You should carefully consider the foregoing factors and the other risks and uncertainties described in ReNew Energy Global's annual report on Form 20-F filed with the Securities and Exchange Commission (the "SEC") on August 27, 2021 and other documents filed by ReNew Energy Global from time to time with the SEC. These filings identify and address other important risks and uncertainties that could cause actual events and results to differ materially from those contained in the forward-looking statements. Forward-looking statements speak only as of the date they are made. Readers are cautioned not to put undue reliance on forward-looking statements, and ReNew Energy Global assumes no obligation and does not intend to update or revise these forward-looking statements, whether as a result of new information, future events, or otherwise. ReNew Energy Global gives no assurance that it will achieve its expectations.
This presentation contains financial measures which have not been calculated in accordance with International Financial Reporting Standards (“IFRS”), including Adjusted EBITDA and Cash Flow to equity (CFe) because they are a basis upon which our management assesses our performance and we believe they reflect the underlying trends and indicators of our business. Although we believe these measures may be useful for investors for the same reasons, these financial measures should not be considered as an alternative to IFRS financial measures as a measure of the Company's financial condition, profitability and performance or liquidity. In addition, these financial measures may not be comparable to similar measures used by other companies. At the Appendix to this presentation, we provide further descriptions of these non-IFRS measures and reconciliations of these non-IFRS measures to the corresponding most closely related IFRS measures.
Forward-Looking Statements
Non – IFRS Financial Measures

Agenda Highlights of Recent Developments01
FY 22 & Q4 FY 22 Highlights02
Guidance04
Sustainability And ESG03
Appendix05
3

4
RecentDevelopments
01

5
1
Renewable energy (RE) lowest cost electricity capacity in India Indian Govt. targets RE additions of ~400 GWs by 2030; Utility scale RE energy at ~3c/kWh 21 GWs of RE bids over next several months Long term, 25 year contracts with fixed tariffs provides predictability
ReNew’s commitment to capital discipline Growth only if returns are comfortably above cost of capital (current threshold 16 – 20% equity IRRs) Pursuing capital recycling to enhance returns and fund growth
2
3
ReNew’s competitive advantages enhances returns, increases growth opportunities Largest renewable energy company in India brings scale advantages Expertise across renewable energy technologies and full vertical integration provides a low cost and
differentiated competitive position
4
5
RE market evolving to value – added energy products Base-load from RE increasingly needed RE lower cost, green option for commercial customers than buying from the grid Green Hydrogen emerging market (~70% of green hydrogen plant cap ex is RE)
Strong electricity growth expected in India India electricity demand expected to double by 2030 India per capita energy consumption ~20% of China/ ~6% of US
Investment Proposition
Expected substantial Cash Flow/share growth through 2030
RNW one of the cheapest RE investments globally

Recent Developments
Sold 49% minority stake in RTC project
Signed ~2.5 GWs of PPAs
Received favorable court rulings for past due
receivables
Acquired 528 MWs IOC, L&T, ReNew Green Hydrogen JV
• ~1.6 GWs incremental of solar Power Purchase Agreements ("PPAs") signed since March 2022 with utilities; SECI (1,275 MW), MSEDCL (200 MW) and PSPCL (100 MW); with projects to be located in Rajasthan
• 491 MW of long-term agreements signed with corporate buyers; assets to be set up in states of Gujarat, Maharashtra, and Rajasthan. Customers include a large US tech major, Grasim and Netmagic.
• Signed definitive agreements to acquire 527.9 MW of operating wind and solar assets
• The projects (471.65 MW wind and 56.25 MW solar) are spread across eight Indian states. The total enterprise value is around $388 mn1 and likely full year EBITDA is $51-55 mn
1. 1 US$ = ₹ 75; subject to final closing adjustments
• Partnered with Mitsui, a leading trading and investment firm for a 49% divestment in the 1,300 MW Round The Clock (“RTC”) project
• This project will consist of three newly built wind farms and one solar plus battery storage farm across the states of Rajasthan, Karnataka and Maharashtra
• Favourable ruling from High Court against Andhra Pradesh DISCOM. AP has appealed to the Supreme Court which has yet to be admitted. AP exploring financing options for repayment.
• Received payments of more than $100 mn from Karnataka and Maharashtra DISCOMs in the last few months out of $141 mn outstanding as on December 31, 2021
• IndianOil, L&T and ReNew Power announced signing of binding term sheet for the formation of a Joint Venture (JV) company to develop the emerging green hydrogen sector in India.
• IndianOil currently consumes about 8% of India’s hydrogen consumption.
6

RNW
Organic Build
1. Assumes assets generate $110-120M of run rate EBITDA per illustrative 1 GW. Proceeds are used to buy back shares of RNW, assuming price as on June 9, 20222. Illustrative example only
7
Current financing structure
Cap Ex
100%
Debt
75%
Equity
25%
RNW
Illustrative Example of Minority Sale Economics (2)
Cap Ex
100%
Debt
75%
Minority investment
~15-20%
Minority sale increasesbase case
equity IRR to 20 – 25%
Company Equity
~5%-10%
~$0.50 - $0.55 EBITDA/ $1 of invested equity
~$0.70 - $0.80 EBITDA/ $1 of invested equity
Selling minority stakes at 9 – 10X EV/ EBITDA vs Build Cost at 7 – 8x EBITDA increases equity returns to 20 – 25% (up from 16 – 20% base case)
Capital recycling at 9 – 10x EBITDA increases EBITDA/share by ~5% for every 1 GW (1)
Illustrates intrinsic valuation of portfolio
Capital Recycling: Sale of Minority Stake Increases Returns
16 – 20% Equity IRR
Illustrative Example of Minority Stake Sale

Electricity Demand Growth has led to Blackouts and Rising Prices
8
Rise in Electricity Blackouts across India
Electricity prices have increased substantially in the past quarter
Record Energy and Peak Demand in FY22(1)
Energy demand +6-8% from pre-Covid levels
1. Source: Central Electricity Authority’s website2. Source: IEX India’s website3. Source: Government of India’s Integrated Power Development Scheme.
0.002.004.006.008.00
10.00IEX-Day Ahead Market (DAM) Price Movement2
Market Clearing Price (Rs/kWh) ReNew's Average Revenue Per Unit (Rs/kWh)
ReNew’sAverage Tariff
below spot prices
70
90
110
130
150
Apr May Jun Jul Aug Sep Oct Nov Dec Jan Feb Mar
Energy
FY 2020 (Pre COVID) FY 2022
100
120
140
160
180
200
220
Apr May Jun Jul Aug Sep Oct Nov Dec Jan Feb Mar
Peak
FY 2020 (Pre COVID) FY 2022
BU GW
Rs/kWh
0 2 4 6 8 10
Uttar Pradesh
Jharkhand
Haryana
India (avg)
April 2022 Daily Power Cuts in Various States (In Hours)3
Urban Rural
Population of ~240 mn
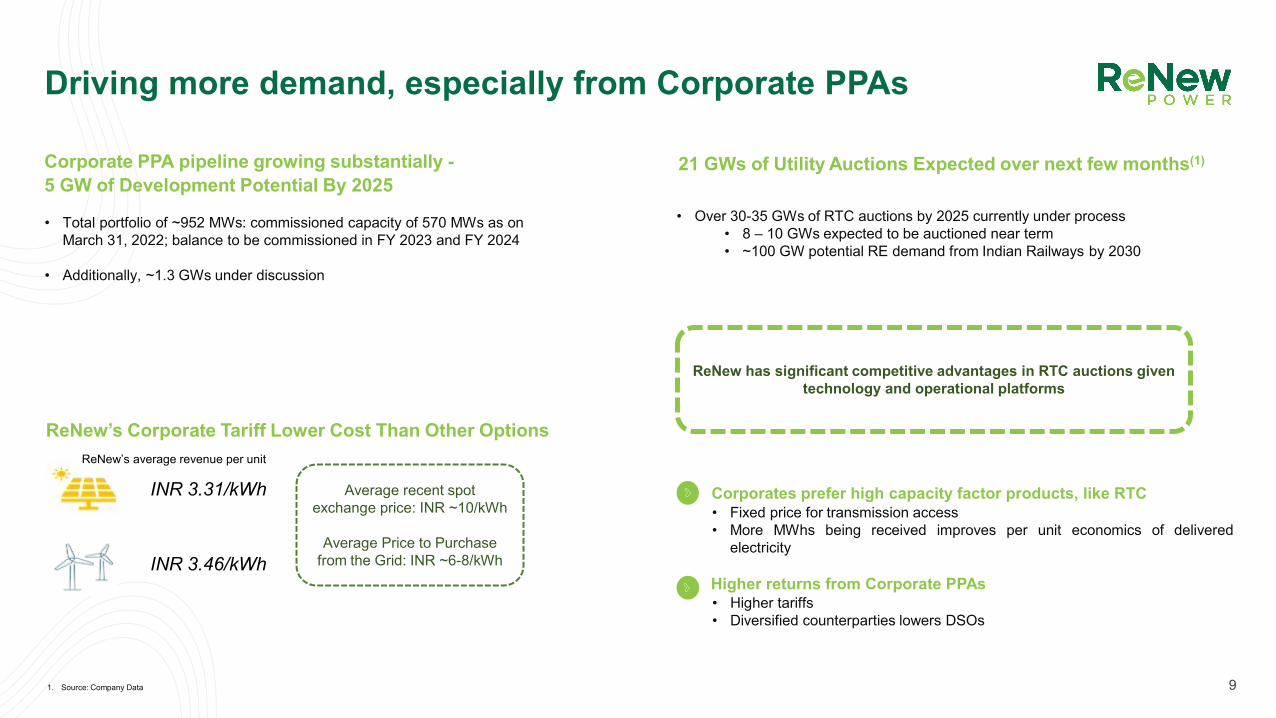
Driving more demand, especially from Corporate PPAs
9
Higher returns from Corporate PPAs• Higher tariffs• Diversified counterparties lowers DSOs
Corporates prefer high capacity factor products, like RTC• Fixed price for transmission access• More MWhs being received improves per unit economics of delivered
electricity
Corporate PPA pipeline growing substantially -5 GW of Development Potential By 2025
• Total portfolio of ~952 MWs: commissioned capacity of 570 MWs as onMarch 31, 2022; balance to be commissioned in FY 2023 and FY 2024
• Additionally, ~1.3 GWs under discussion
ReNew’s Corporate Tariff Lower Cost Than Other Options
INR 3.31/kWh
INR 3.46/kWh
Average recent spot exchange price: INR ~10/kWh
Average Price to Purchase from the Grid: INR ~6-8/kWh
21 GWs of Utility Auctions Expected over next few months(1)
• Over 30-35 GWs of RTC auctions by 2025 currently under process• 8 – 10 GWs expected to be auctioned near term• ~100 GW potential RE demand from Indian Railways by 2030
ReNew has significant competitive advantages in RTC auctions given technology and operational platforms
1. Source: Company Data
ReNew’s average revenue per unit

De-Risking Supply Chain by Increasing Self Supply
10
Significant shortage of solar modules in India for the next several years
BCD, ALMM2 rules • 40% BCD on solar modules and 25% BCD on solar cells’ imports applicable
starting 1st April, 2022.• As per ALMM, module procurement for any new government/commercial and
industrial tenders can be done only from the enlisted members of ALMM
ReNew’s Solar Manufacturing Plant Details (AC - GW)
PLI Updates
PLI – 1$600 mn allocation
PLI – 2$2,600 mn allocation
• 18 bids (54,809 MW) were receivedand LOAs were issued by IREDA tothree successful bidders for setting up8,737 MW capacity of fully integratedsolar PV module manufacturing units.
• Fresh bidding will happen forallocation, details yet to be finalized.
• Tender document to get published in 1-2 months and bid submission inanother 2-3 months.
Note: INR numbers converted to USD at 1 USD = 75 INR1. Expected New Demand less Domestic India Module Capacity; Converted to AC capacity by taking 40% overloading factor2. Approved list of models and manufacturers3. Assuming that the entire capacity will be towards fulfilling domestic demand
Increasing Module Capacity to 6.4 GW DC/3.3 GW AC• All capacity expected to be for self supply• Increased self supply secures and derisks ReNew’s growth of core
development business• Incremental capex is ~$140 - $160 mn (or 3-4% of 3 year committed cap ex)
2.11.2 1.1
Module Plant 1 Module Plant 2 Cell Plant
Net Capacity AC / GW
Particulars Module Plant 1 Module Plant 2 Cell Plant
Location Jaipur, Rajasthan Dholera, Gujarat Dholera, Gujarat
Expected Commissioning Q4’ FY 2023 Q2’ FY 2024 Q2’ FY 2024
Planned Capex $325 – 350 mn
3.3
13.3 13.5
7.39.0
0
3
6
9
12
15
2023 2024 2025 2026
India’s Module Supply Shortfall1 (GW AC)
ReNew’s New Module Capacity for self supply3
11
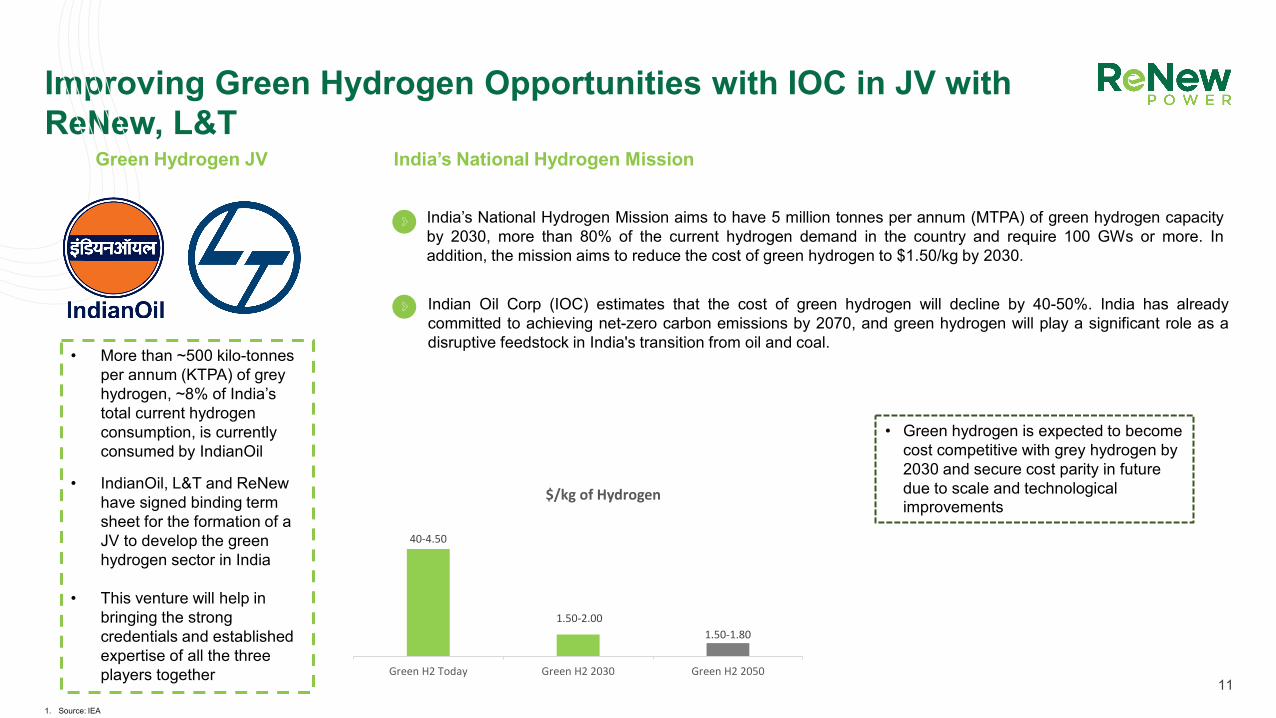
Improving Green Hydrogen Opportunities with IOC in JV with ReNew, L&T
Green Hydrogen JV
• More than ~500 kilo-tonnes per annum (KTPA) of grey hydrogen, ~8% of India’s total current hydrogen consumption, is currently consumed by IndianOil
• IndianOil, L&T and ReNew have signed binding term sheet for the formation of a JV to develop the green hydrogen sector in India
• This venture will help in bringing the strong credentials and established expertise of all the three players together
India’s National Hydrogen Mission
India’s National Hydrogen Mission aims to have 5 million tonnes per annum (MTPA) of green hydrogen capacityby 2030, more than 80% of the current hydrogen demand in the country and require 100 GWs or more. Inaddition, the mission aims to reduce the cost of green hydrogen to $1.50/kg by 2030.
Indian Oil Corp (IOC) estimates that the cost of green hydrogen will decline by 40-50%. India has alreadycommitted to achieving net-zero carbon emissions by 2070, and green hydrogen will play a significant role as adisruptive feedstock in India's transition from oil and coal.
• Green hydrogen is expected to become cost competitive with grey hydrogen by 2030 and secure cost parity in future due to scale and technological improvements
1. Source: IEA
40-4.50
1.50-2.001.50-1.80
Green H2 Today Green H2 2030 Green H2 2050
$/kg of Hydrogen

12
02
FY 22 & Q4 FY 22 Highlights

Key Highlights
Total Portfolio• Total Portfolio (commissioned and committed) of 10,688 MWs,(1)
an addition of ~243 MWs in installed capacity this quarter. Subsequent to the end of the quarter, the Company entered into definitive agreements to purchase 528 MWs and signed PPAs bringing the total portfolio to 12.8 GWs.
• 7,567 MWs Commissioned Capacity and 3,121 MWs of Committed Capacity comprised of 2,018 MWs with PPAs and 1,103 MWs with Letters of Award
Installed Capacity• YoY growth of 35% from 5.60 GW to 7.57 GW• Projects added in last 1 year3 include wind projects: SECI 6 (137
MW), SECI 7 (35 MW), solar projects : SECI III (300 MW), GUVNL (105 MW), SECI IV (300 MW), SECI VI (300 MW), and Mah PhII (300 MW), corporate/B2B projects : 249 MW.
Weighted Average PLF• Wind: 25.4% for FY22 vs 22.9% for FY 21• Solar: 23.1% for FY22 vs 22.2% for FY 21
Q4 FY 22• Wind: 18.3% for Q4 FY22 vs 18.4% for Q4 FY 21• Solar: 26.1% for Q4 FY22 vs 22.1% for Q4 FY 21
Key metrics (INR Mn)
13
54,491
69,195
13,438
17,615
41,870
55,144
8,557
12,787
6,691
12,888
-1,609-5,016
FY 21 FY 22 Q4 FY 21 Q4 FY 22
Total Income (or revenue) Adjusted EBITDA Cash Flow to Equity2 2
1. Capacity as on 31 March, 2022. A few projects have been subsequently added post 31st March, 2022 including SECI RAJ IV (600 MW + 375 MW), SECI IX (300 MW), PSPCL (100 MW), MSEDCL (200 MW), 18.8 MW Corporate Projects and acquisition of 527.9 of operating wind and solar projects which has increased our capacity to ~12.8 GW
2. Total Income (or revenue) includes finance income of (a) INR 2,013 Mn in FY 22 and INR 3,354 Mn in FY 21; (b) INR 679 Mn in Q4 FY 22 and INR 1,725 Mn in Q4 FY 21. However, finance income is not included in Adjusted EBITDA3. Includes organic projects
Q4 FY 22 and 12M FY 22 Overview
14
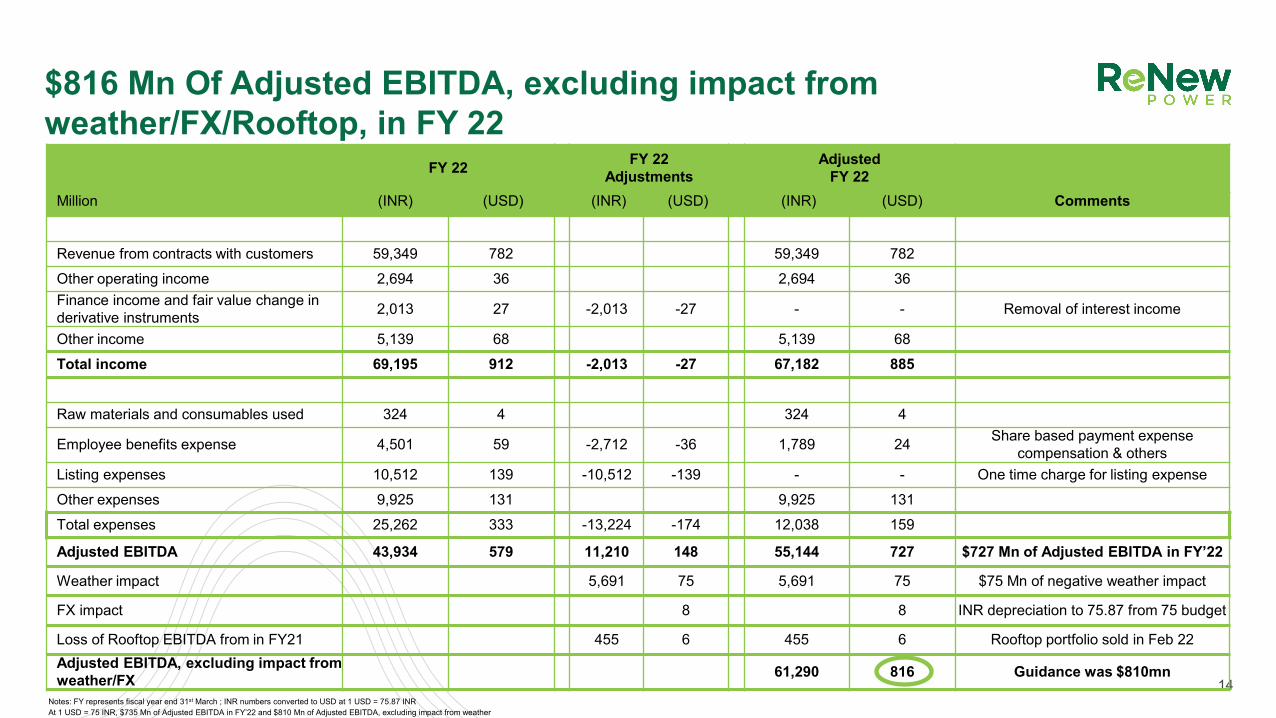
FY 22 FY 22Adjustments
AdjustedFY 22
Million (INR) (USD) (INR) (USD) (INR) (USD) Comments
Revenue from contracts with customers 59,349 782 59,349 782Other operating income 2,694 36 2,694 36Finance income and fair value change in derivative instruments 2,013 27 -2,013 -27 - - Removal of interest income
Other income 5,139 68 5,139 68Total income 69,195 912 -2,013 -27 67,182 885
Raw materials and consumables used 324 4 324 4
Employee benefits expense 4,501 59 -2,712 -36 1,789 24 Share based payment expense compensation & others
Listing expenses 10,512 139 -10,512 -139 - - One time charge for listing expenseOther expenses 9,925 131 9,925 131Total expenses 25,262 333 -13,224 -174 12,038 159
Adjusted EBITDA 43,934 579 11,210 148 55,144 727 $727 Mn of Adjusted EBITDA in FY’22
Weather impact 5,691 75 5,691 75 $75 Mn of negative weather impact
FX impact 8 8 INR depreciation to 75.87 from 75 budget
Loss of Rooftop EBITDA from in FY21 455 6 455 6 Rooftop portfolio sold in Feb 22Adjusted EBITDA, excluding impact from weather/FX 61,290 816 Guidance was $810mn
Notes: FY represents fiscal year end 31st March ; INR numbers converted to USD at 1 USD = 75.87 INRAt 1 USD = 75 INR, $735 Mn of Adjusted EBITDA in FY’22 and $810 Mn of Adjusted EBITDA, excluding impact from weather
$816 Mn Of Adjusted EBITDA, excluding impact from weather/FX/Rooftop, in FY 22

Receivables Situation Improved
Note: INR numbers converted to USD at 1 USD = 75 INR1. Includes SECI and NTPC2. AP – Andhra Pradesh, MP – Madhya Pradesh, TG – Telangana, KA – Karnataka, Mah - Maharashtra
262 272256
212
188 195 184
132
Q1 FY22 Q2 FY22 Q3 FY22 Q4 FY22
Overall DSO DSO (w/o AP)
ReNew Is Taking Proactive Measures For Expediting Collections
GOI Also Prioritizing Clearing Discom Dues• Gov’t of India invoked the tripartite agreement between SECI, certain
state govts. and Reserve Bank of India• Mandating opening Letters of Credit from Discoms• Discom liquidity package of ~$18 Bn to assist Discoms in clearing past due bills• Govt of India formulating new scheme for faster payment by Discoms
Expect DSOs to rise in 1Q & 2Q FY’23 due to seasonality• DISCOMs pay in equal installments over the year whereas the majority of
wind generation is in the first six months of the fiscal year
Offtaker (INR Mn) DSO
Central Government1 12AP, MP, TG, KA, Mah2
386Corporates 10Others 45
Total 212
Recent Updates• Request filed by AP DISCOMs seeking time extension for processing payments to
RE generators. AP DISCOMs also appealed High Court ruling to the SupremeCourt but appeal not yet admitted. AP exploring financing options for payment.
• Received payments of ~$70 mn in Q4 FY 2021-22 and Q1 FY 2022-23 fromKarnataka DISCOMs post favourable order from Karnataka High Court. Also,received ~$32 mn from MSEDCL during the same period.
• For a 60 MW project, regulator ordered MP to pay past dues within 30 days,petitions are being filed for other wind projects; pursuing actions in Telangana
• Policy advocacy• Working more closely with Discoms• Legal recourse
DSOs improve as Central Gov’t becomes a larger % of assets(1,2)
AP, MP, TG, KA
and Mah53%
Central Government
30%
Corporates 7%
Others 10%
7.6 GWs
AP, MP, TG, KA and
Mah35%Central
Government48%
Corporates 8%Others 9%
12.8 GWs
15

Under construction projects are expected to have equity returns of 16 - 20%
(RTC project equity returns is expected to be above 20%)
Solar project Cost$0.5 - $0.6 mn/MW
Wind project cost$0.9 - 1.0 mn/MW
Solar projects with COD in FY 22 not materially impacted by price increase
No significant utility scale solar CODs expected near term
For wind projects; while supply prices have marginally risen compared to bid assumptions; this has been partially offset by optimization in BoS & lower interest rates. Supply terms locked in for pipeline projects
Risk Mitigation
Further optimization in Balance of System through measures such as higher efficiency modules cost has led to reduction in BoS cost by 20 - 25%
Self EPC and savings on BoS/BoP costs should provide additional savings
16
Note: INR numbers converted to USD at 1 USD = 75 INR
Initiatives To Mitigate Supply Cost Inflation Has ShieldedReNew
Recent solar PPA signings for projects won 18-24 months ago –some impact, mitigated partially through self supply & interest rate declines
Higher prices factored into future bids for both wind & solar
17
Current term sheets at 8 - 8.5% versus current marginal average debt cost of ~8.9%
Current term sheets for lending at 8.25% - 8.5% compared to term sheets closed at 8.75% - 9.00% around 12-15 months back
Limited near term impact from rising interest rates
• >3/4th of debt is with fixed interest rate.
• <18% exposed to interest rate increases in near term
• 100bps change in interest rates would impact CFe by only ~2% (impact will be ~$10 mn)
Financing/Refi and Fixed Rates Lowers Interest Rate Risk
Since March’21 till recently, interest rates for variable debt have fallen by more than 100bp through refinancing and rate reductions from existing lenders.These savings should more than offset the anticipated rate hikes over the next 12 months
FY22 interest saving activities resulted in savings of ~$7 Mn
Conditional redemption of $525 mn 6.67% (~10.5% in INR) Senior Secured Notes Due 2024 should result in annual savings on the all in interestcost of ~$10 mn. We received a NBFC sanction for 8 - 8.5% to refinance this note.
Note: INR numbers converted to USD at 1 USD = 75 INR
~15% of outstanding debt, or ~$890 million, to be refinanced in the next two years.
• ~$400 million prefund with Green Bond issuance in Jan 2021 at average INR interest of around 8-8.5%
• ~$200 million will be retired through amortization
• We expect remaining ~$300mn of debt to be refinanced at rates higher than current term sheets but lower than current cost of that debt
~76% of ReNew’s outstanding debt is fixed rate for an average period of ~4 years

18
04
Sustainability And ESG

19
ReNew Is Leading The Energy Transition In India And Is Committed To Global Sustainable Development Goals
Our ESG targets Progress as of FY 22
Emissions To be validated as carbon neutral (scope 1 & 2) Verified as ‘carbon neutral’ for our operations across more than 100 sites and facilities for FY21
Develop science-based targets (scope 1, 2 & 3), validated by SBTi for net zero emissions by 2025
Scope 3 emissions to be disclosed in the upcoming sustainability report in Sep ’22
Create carbon sink by planting 100,000 trees across areas of operations 2025
Tree plantation campaign initiated on World Environment Day across ~ 70 sites
Water Be water positive by 2030 332,700 KL (approx.) of water saved (5X as compared to FY21) by deploying robotic cleaning of solar panels* for FY22
Waste Zero solid waste to landfill by 2030 All e-waste (including solar modules, cables etc.) and batteries sent to authorized recyclers
Social Impact Positively impact 2.5 million people through CSR initiatives by 2030
Impacted over 650,000 people across 10 states and covering over 250+ villages till FY22
Skill 1,000 salt pan workers as solar panel/pump technicians for enhancing their livelihood by 2024
MoU with UNEP and SEWA signed to deliver on the program
Governance Mitigate ESG risks to ensure no critical risks (in ERM) by 2025Link ESG performance with executive compensation by 2025
Established ESG Policy and 3-tier ESG governance across board, management, and working group levels
Disclosures To report on sustainability performance annually and adopt TCFD
Released 1st Sustainability Report per GRI standards in Sep ‘21; sustainability report launch scheduled for Sep ‘22 in alignment with GRI, SASB & TCFD
Envi
ronm
ent
Soci
alG
over
nanc
e
4 million homes powered by clean energy for FY-22
Ranked among top 10 REproducers (globally) on
ESG Risk Ratings by Sustainalytics
* Based on water requirement of 2.5 litre/cycleSource: Company Information
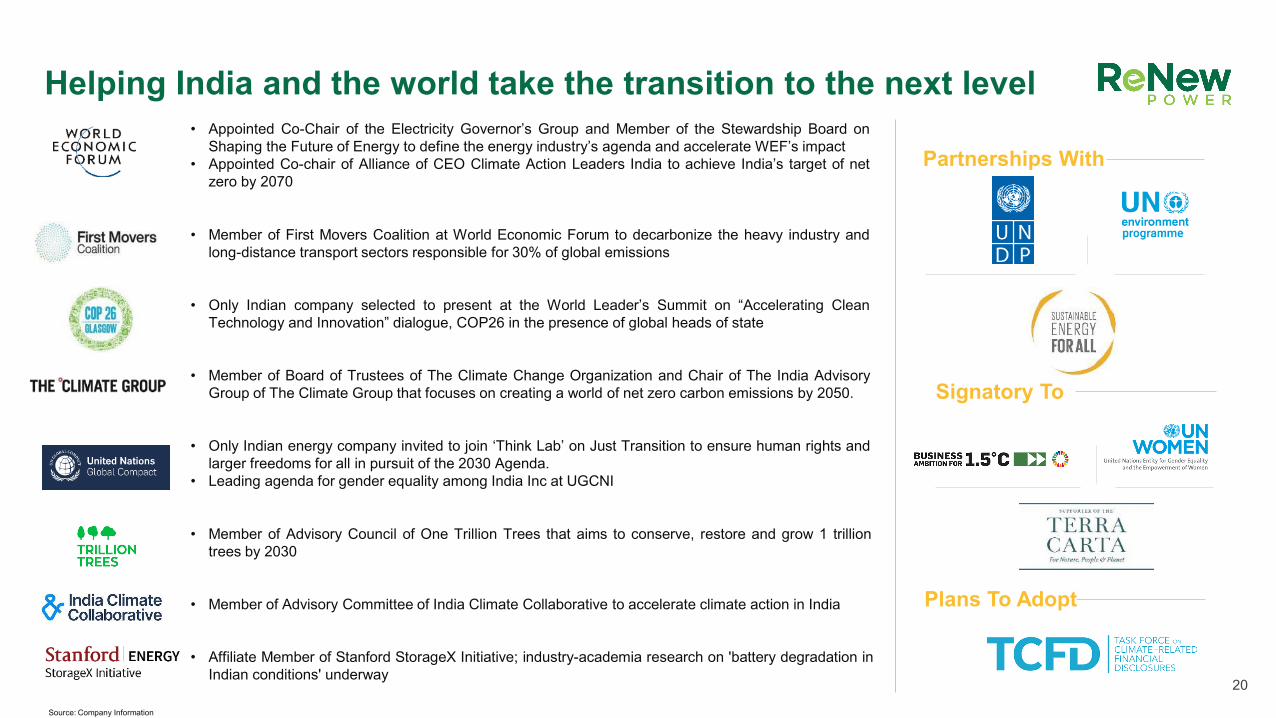
Plans To Adopt
Signatory To
20
Partnerships With
Helping India and the world take the transition to the next level• Appointed Co-Chair of the Electricity Governor’s Group and Member of the Stewardship Board on
Shaping the Future of Energy to define the energy industry’s agenda and accelerate WEF’s impact• Appointed Co-chair of Alliance of CEO Climate Action Leaders India to achieve India’s target of net
zero by 2070
• Member of First Movers Coalition at World Economic Forum to decarbonize the heavy industry andlong-distance transport sectors responsible for 30% of global emissions
• Only Indian company selected to present at the World Leader’s Summit on “Accelerating CleanTechnology and Innovation” dialogue, COP26 in the presence of global heads of state
• Only Indian energy company invited to join ‘Think Lab’ on Just Transition to ensure human rights andlarger freedoms for all in pursuit of the 2030 Agenda.
• Leading agenda for gender equality among India Inc at UGCNI
• Member of Board of Trustees of The Climate Change Organization and Chair of The India AdvisoryGroup of The Climate Group that focuses on creating a world of net zero carbon emissions by 2050.
• Member of Advisory Council of One Trillion Trees that aims to conserve, restore and grow 1 trilliontrees by 2030
• Member of Advisory Committee of India Climate Collaborative to accelerate climate action in India
• Affiliate Member of Stanford StorageX Initiative; industry-academia research on 'battery degradation inIndian conditions' underway
Source: Company Information

21
Community-Based Water Management (Benchmark CSR case study recognized by Ministry
of Corporate Affairs) Gift Warmth
Source: Company Information
Impacting Communities With Sustainability InitiativesCSR Report 2021-22
https://renewpower.in/corporate-social-responsibility/
Lighting Lives – Electrification Of SchoolsWomen for Climate – Entrepreneurship and Skilling
22
02
Guidance

INR 310 - 327 Bn
INR 429 – 451 Bn
5.4x
5.1x
4
4.5
5
5.5
6
0
1000
2000
3000
4000
5000
6000
7000
7.6 GWs 12.8 GWs
23
Adjusted EBITDA/shareNet Debt(1) & Leverage(2) At Operating Capacity Of 7.6 GWs And 12.8 GWs
Capex (Committed Capacity By Year)(4) Cash Flow To Equity/share(5)
Net Debt 3 Net Debt/Run Rate EBITDA
Note: We intend to add to committed capacity only once PPA is signed in future; exchange rate of 1 USD = 75.87 INR has been taken, accordingly Adjusted EBITDA – FY22 Actual is $727 mn, YTD Commissioned is $757 - 799 mn, Total Portfolio is $1,106 – 1,175 mn1. Including corporate debt; 12.8 GWs net debt assumes one year of Cash Flow to equity for 7.6 GWs; net debt reduced by excess cash balance after incurring capex for 7.6 GW or 12.8 GWs respectively; Excludes capex & debt for manufacturing 2. Net debt/Run Rate EBITDA; includes corporate debt; excludes capex for manufacturing 3. Estimated Net Debt for Operating Capacity of 7.6 GW and Total Capacity of 12.8 GW; 4. Capex is for 5.2 GW (excluding already incurred) beyond 7.6 GW of commissioned capacity as on 31st March,2022; doesn’t include duty impact; 5.CFe is calculated as EBITDA less tax expenses, debt servicing (interest cost and amortisation), change in working capital and maintenance capex. 5. Based on RNW stock price as the market close on June 14, 2022.
FY22 Actual Commissioned Run Rate(7.6 GWs)
FY23e EBITDA Total Portfolio Run Rate(12.8 GWs)
INR 133 - 141
INR 67 Bn($907 Mn)H1 FY22
FY 23 FY 24 FY 25
INR 173 Bn
INR 92 BnINR 12 Bn
Guidance
INR 195 - 207
INR 155 - 160
FY22 Actual Commissioned Run Rate(7.6 GWs)
FY23e CFe Total Portfolio Run Rate(12.8 GWs)
INR 40 - 43
INR 60 - 65
INR 49 - 53
Current shares outstanding: ~431 million
Current Cash
Flow to equity Yield is
~13% on current
portfolio5
INR 128
INR 194 Bn
INR 95 Bn
Capex for manufacturing
Capex excluding manufacturingINR 22 Bn
INR 2 Bn INR 30

24
05
Appendix

25
Q4 FY 22 Q4 FY 22Adjustments
AdjustedQ4 FY 22
Million (INR) (USD) (INR) (USD) (INR) (USD) Comments
Revenue from contracts with customers 14,946 197 14,946 197Other operating income 466 6 466 6Finance income and fair value change in derivative instruments 679 9 -679 -9 - - Removal of interest income
Other income 1,524 20 1,524 20Total income 17,615 232 -679 -9 16,936 223
Raw materials and consumables used 132 2 132 2
Employee benefits expense 1,078 14 -492 -6 586 8 Share based payment expense compensation & others
Listing expenses - - - - One time charge for listing expenseOther expenses 3,430 45 3,430 45Total expenses 4,640 61 -492 -6 4,148 55Adjusted EBITDA 12,974 171 -187 -2 12,787 169 $169 Mn Adjusted EBITDA in Q4' FY’22Weather impact 1,517 20 1,517 20 $20 Mn of negative weather impactAdjusted EBITDA, excluding impact from weather 14,304 189 $189 Mn of Adjusted EBITDA,
excluding impact from weather
$189 Mn Adjusted EBITDA, excluding impact of weather, in Q4 FY 22
Notes: FY represents fiscal year end 31st March ; INR numbers converted to USD at 1 USD = 75.87 INR
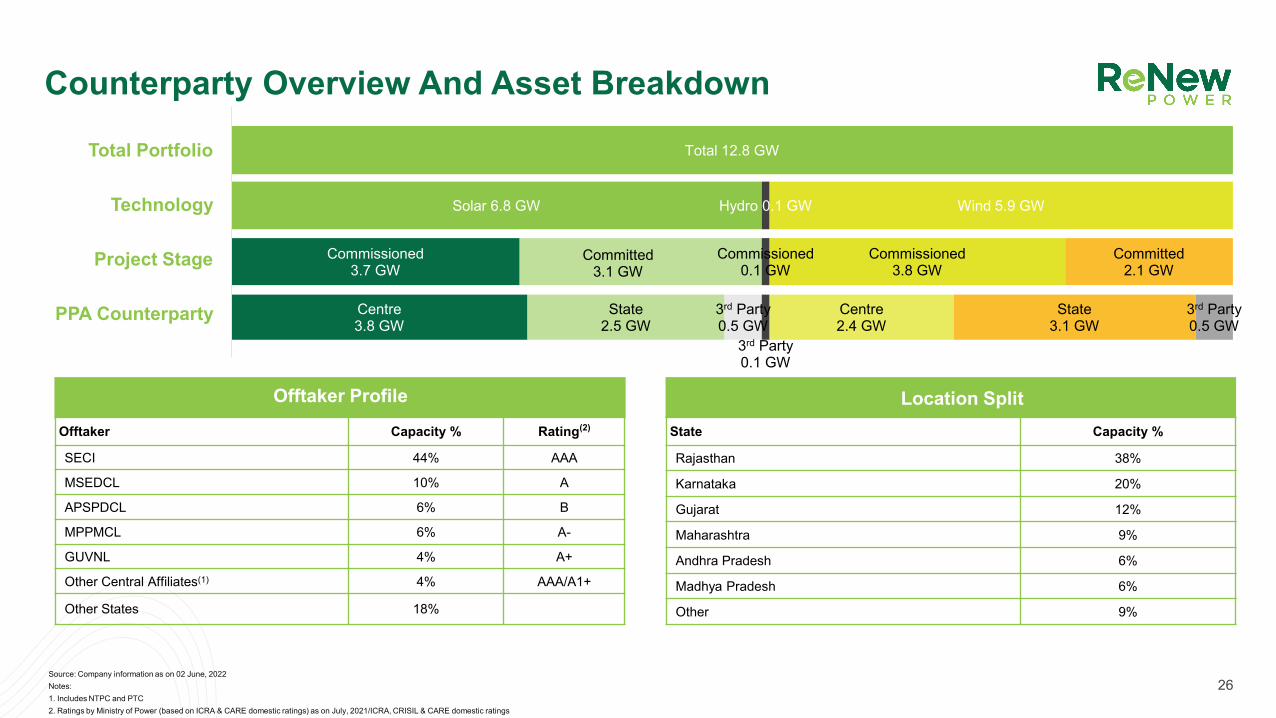
Source: Company information as on 02 June, 2022Notes:1. Includes NTPC and PTC2. Ratings by Ministry of Power (based on ICRA & CARE domestic ratings) as on July, 2021/ICRA, CRISIL & CARE domestic ratings
Solar 6.8 GW Hydro 0.1 GW Wind 5.9 GW
Commissioned 3.7 GW
Committed 3.1 GW
Commissioned0.1 GW
Commissioned3.8 GW
Committed2.1 GW
Total 12.8 GWTotal Portfolio
Technology
Project Stage
PPA Counterparty
Offtaker Capacity % Rating(2)
SECI 44% AAA
MSEDCL 10% A
APSPDCL 6% B
MPPMCL 6% A-
GUVNL 4% A+
Other Central Affiliates(1) 4% AAA/A1+
Other States 18%
State Capacity %
Rajasthan 38%
Karnataka 20%
Gujarat 12%
Maharashtra 9%
Andhra Pradesh 6%
Madhya Pradesh 6%
Other 9%
Offtaker Profile Location Split
26
Centre3.8 GW
State2.5 GW
3rd Party0.5 GW
3rd Party0.1 GW
Centre2.4 GW
State3.1 GW
3rd Party0.5 GW
Counterparty Overview And Asset Breakdown
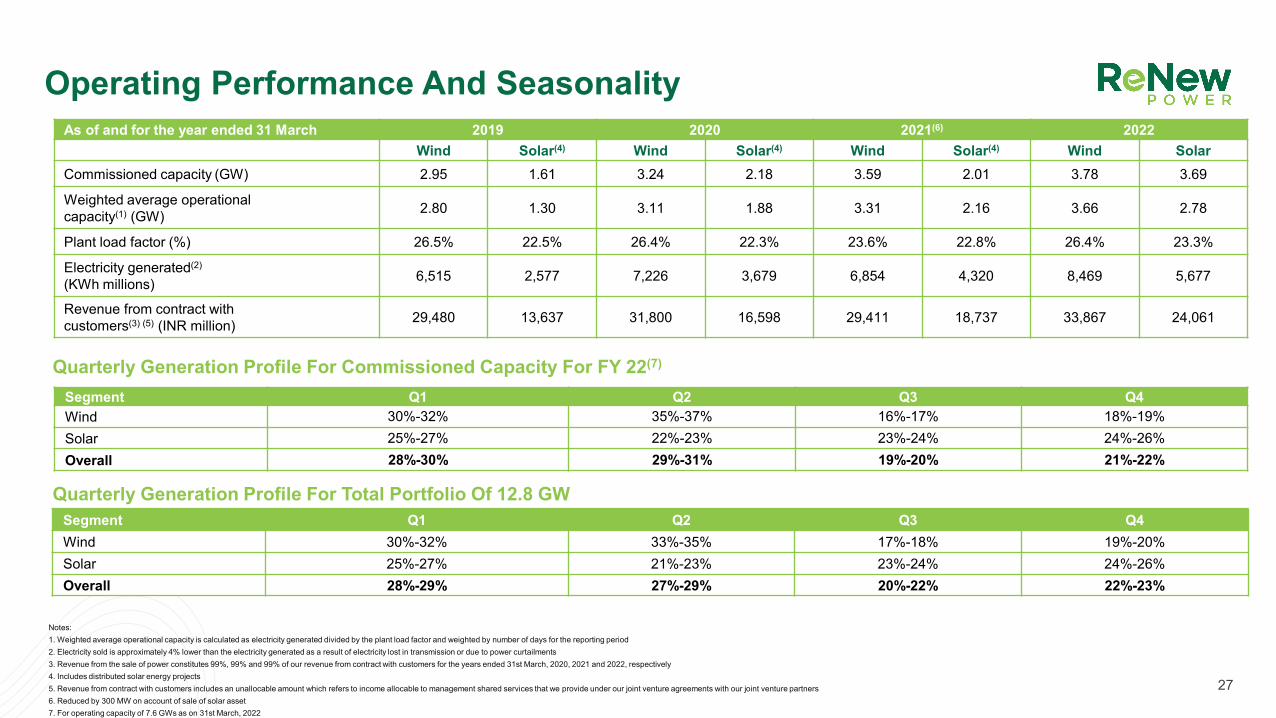
Notes: 1. Weighted average operational capacity is calculated as electricity generated divided by the plant load factor and weighted by number of days for the reporting period2. Electricity sold is approximately 4% lower than the electricity generated as a result of electricity lost in transmission or due to power curtailments3. Revenue from the sale of power constitutes 99%, 99% and 99% of our revenue from contract with customers for the years ended 31st March, 2020, 2021 and 2022, respectively4. Includes distributed solar energy projects5. Revenue from contract with customers includes an unallocable amount which refers to income allocable to management shared services that we provide under our joint venture agreements with our joint venture partners6. Reduced by 300 MW on account of sale of solar asset7. For operating capacity of 7.6 GWs as on 31st March, 2022
Segment Q1 Q2 Q3 Q4Wind 30%-32% 35%-37% 16%-17% 18%-19%Solar 25%-27% 22%-23% 23%-24% 24%-26%Overall 28%-30% 29%-31% 19%-20% 21%-22%
Segment Q1 Q2 Q3 Q4Wind 30%-32% 33%-35% 17%-18% 19%-20%Solar 25%-27% 21%-23% 23%-24% 24%-26%Overall 28%-29% 27%-29% 20%-22% 22%-23%
As of and for the year ended 31 March 2019 2020 2021(6) 2022Wind Solar(4) Wind Solar(4) Wind Solar(4) Wind Solar
Commissioned capacity (GW) 2.95 1.61 3.24 2.18 3.59 2.01 3.78 3.69
Weighted average operationalcapacity(1) (GW) 2.80 1.30 3.11 1.88 3.31 2.16 3.66 2.78
Plant load factor (%) 26.5% 22.5% 26.4% 22.3% 23.6% 22.8% 26.4% 23.3%
Electricity generated(2)
(KWh millions) 6,515 2,577 7,226 3,679 6,854 4,320 8,469 5,677
Revenue from contract withcustomers(3) (5) (INR million) 29,480 13,637 31,800 16,598 29,411 18,737 33,867 24,061
Quarterly Generation Profile For Commissioned Capacity For FY 22(7)
Quarterly Generation Profile For Total Portfolio Of 12.8 GW
27
Operating Performance And Seasonality

Equity26.3%
Secured Bank Loan
12.3%
Secured Loan from FIs18.3%
Senior Overseas Green Bonds
38.1%
INR Bonds4.3%
Working Capital Loan0.7%
Total Funding: $8.0bn
(2)
(3)
6.00%
6.67%6.45%
5.88%
5.38%
4.00%
4.50% 4.50%
Feb'17 Mar'19 Sep'19 Jan'20 Oct'20 Feb'21 Apr'21 Jan'22
Coupon Rate (%) Weighted Average Cost of Debt
Reduction in cost of debt
1.72%
Weighted average cost of debt: 6.25% (4)
Weighted average cost of debt: 4.53% (4)
Outstanding Funding (31st March 2022)(1) Raised US$3.5bn+ In Bond Offerings Through 8 USD Bond Offerings At Competitive Rates
Size ($mn) 475 525 300 450 325 460 585 400
Tenor (yrs) 5.0 4.5-5.0 3.0 7.0 3.5 6.0 7.25 5.25
Raised > $10 Bn since 2011 through greenfield/corporate debt and refinancing
USD bonds are hedged Corporate rating of Ba2 by Moody’s
USD bonds are rated BB- by S&P, BB-/ BB by Fitch and Ba3 by Moody’s
1. Assumes 1 USD = 75 INR2. Based on actual USD amount raised3. Senior USD Green Bonds stated based on the actual USD amount raised; 4. Weighted by issue size
Ability to refinance existing debt at lower interest cost, longer tenor, top-ups to release liquidity and less onerous restricted payment conditions
Increases liquidity for financing capex of new projects
28
Track Record Of Efficient Capital Raise From Diverse Sources Of Funding

By Debt Type
Note: Debt doesn’t include unsecured CCDs1. Chart excludes Euro which constitutes ~1% of total debt2. For dollar bonds, assumes cost basis average depreciation in INR for the last 20 years3.Conditional redemption notice for $525Mn bond has been issued, For the onshore financing solution ReNew have received an NBFC sanction of INR 34.8 Bn Facility for a period of 5 years with interest rate of 8.5% p.a. fixed for a period of 3 years.
By Currency(1)
By Interest Rate
By Maturity(1)
Corporate debt11%
Project debt89% Fixed Rate
76%
Variable Rate24%
US Dollars68% (fully hedged)
INR 32%
Interest cost for the outstanding debt as of March 31, 2022 is ~8.9%2
29
Debt Profile
0 - 2 years15%
2 - 4 years15%
> 4 years70%
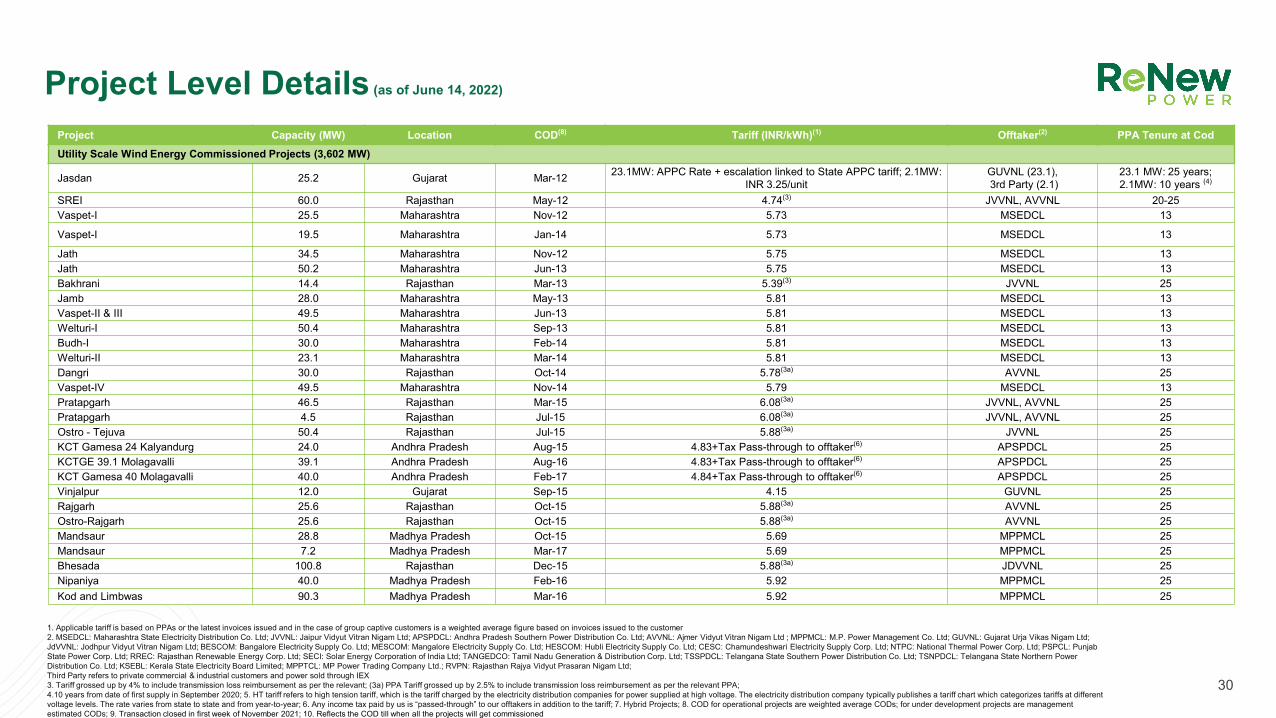
Project Capacity (MW) Location COD(8) Tariff (INR/kWh)(1) Offtaker(2) PPA Tenure at CodUtility Scale Wind Energy Commissioned Projects (3,602 MW)
Jasdan 25.2 Gujarat Mar-12 23.1MW: APPC Rate + escalation linked to State APPC tariff; 2.1MW: INR 3.25/unit
GUVNL (23.1),3rd Party (2.1)
23.1 MW: 25 years;2.1MW: 10 years (4)
SREI 60.0 Rajasthan May-12 4.74(3) JVVNL, AVVNL 20-25Vaspet-I 25.5 Maharashtra Nov-12 5.73 MSEDCL 13
Vaspet-I 19.5 Maharashtra Jan-14 5.73 MSEDCL 13
Jath 34.5 Maharashtra Nov-12 5.75 MSEDCL 13Jath 50.2 Maharashtra Jun-13 5.75 MSEDCL 13Bakhrani 14.4 Rajasthan Mar-13 5.39(3) JVVNL 25Jamb 28.0 Maharashtra May-13 5.81 MSEDCL 13Vaspet-II & III 49.5 Maharashtra Jun-13 5.81 MSEDCL 13Welturi-I 50.4 Maharashtra Sep-13 5.81 MSEDCL 13Budh-I 30.0 Maharashtra Feb-14 5.81 MSEDCL 13Welturi-II 23.1 Maharashtra Mar-14 5.81 MSEDCL 13Dangri 30.0 Rajasthan Oct-14 5.78(3a) AVVNL 25Vaspet-IV 49.5 Maharashtra Nov-14 5.79 MSEDCL 13Pratapgarh 46.5 Rajasthan Mar-15 6.08(3a) JVVNL, AVVNL 25Pratapgarh 4.5 Rajasthan Jul-15 6.08(3a) JVVNL, AVVNL 25Ostro - Tejuva 50.4 Rajasthan Jul-15 5.88(3a) JVVNL 25KCT Gamesa 24 Kalyandurg 24.0 Andhra Pradesh Aug-15 4.83+Tax Pass-through to offtaker(6) APSPDCL 25KCTGE 39.1 Molagavalli 39.1 Andhra Pradesh Aug-16 4.83+Tax Pass-through to offtaker(6) APSPDCL 25KCT Gamesa 40 Molagavalli 40.0 Andhra Pradesh Feb-17 4.84+Tax Pass-through to offtaker(6) APSPDCL 25Vinjalpur 12.0 Gujarat Sep-15 4.15 GUVNL 25Rajgarh 25.6 Rajasthan Oct-15 5.88(3a) AVVNL 25Ostro-Rajgarh 25.6 Rajasthan Oct-15 5.88(3a) AVVNL 25Mandsaur 28.8 Madhya Pradesh Oct-15 5.69 MPPMCL 25Mandsaur 7.2 Madhya Pradesh Mar-17 5.69 MPPMCL 25Bhesada 100.8 Rajasthan Dec-15 5.88(3a) JDVVNL 25Nipaniya 40.0 Madhya Pradesh Feb-16 5.92 MPPMCL 25Kod and Limbwas 90.3 Madhya Pradesh Mar-16 5.92 MPPMCL 25
30
Project Level Details (as of June 14, 2022)
1. Applicable tariff is based on PPAs or the latest invoices issued and in the case of group captive customers is a weighted average figure based on invoices issued to the customer 2. MSEDCL: Maharashtra State Electricity Distribution Co. Ltd; JVVNL: Jaipur Vidyut Vitran Nigam Ltd; APSPDCL: Andhra Pradesh Southern Power Distribution Co. Ltd; AVVNL: Ajmer Vidyut Vitran Nigam Ltd ; MPPMCL: M.P. Power Management Co. Ltd; GUVNL: Gujarat Urja Vikas Nigam Ltd; JdVVNL: Jodhpur Vidyut Vitran Nigam Ltd; BESCOM: Bangalore Electricity Supply Co. Ltd; MESCOM: Mangalore Electricity Supply Co. Ltd; HESCOM: Hubli Electricity Supply Co. Ltd; CESC: Chamundeshwari Electricity Supply Corp. Ltd; NTPC: National Thermal Power Corp. Ltd; PSPCL: Punjab State Power Corp. Ltd; RREC: Rajasthan Renewable Energy Corp. Ltd; SECI: Solar Energy Corporation of India Ltd; TANGEDCO: Tamil Nadu Generation & Distribution Corp. Ltd; TSSPDCL: Telangana State Southern Power Distribution Co. Ltd; TSNPDCL: Telangana State Northern Power Distribution Co. Ltd; KSEBL: Kerala State Electricity Board Limited; MPPTCL: MP Power Trading Company Ltd.; RVPN: Rajasthan Rajya Vidyut Prasaran Nigam Ltd;Third Party refers to private commercial & industrial customers and power sold through IEX3. Tariff grossed up by 4% to include transmission loss reimbursement as per the relevant; (3a) PPA Tariff grossed up by 2.5% to include transmission loss reimbursement as per the relevant PPA; 4.10 years from date of first supply in September 2020; 5. HT tariff refers to high tension tariff, which is the tariff charged by the electricity distribution companies for power supplied at high voltage. The electricity distribution company typically publishes a tariff chart which categorizes tariffs at different voltage levels. The rate varies from state to state and from year-to-year; 6. Any income tax paid by us is “passed-through” to our offtakers in addition to the tariff; 7. Hybrid Projects; 8. COD for operational projects are weighted average CODs; for under development projects are management estimated CODs; 9. Transaction closed in first week of November 2021; 10. Reflects the COD till when all the projects will get commissioned
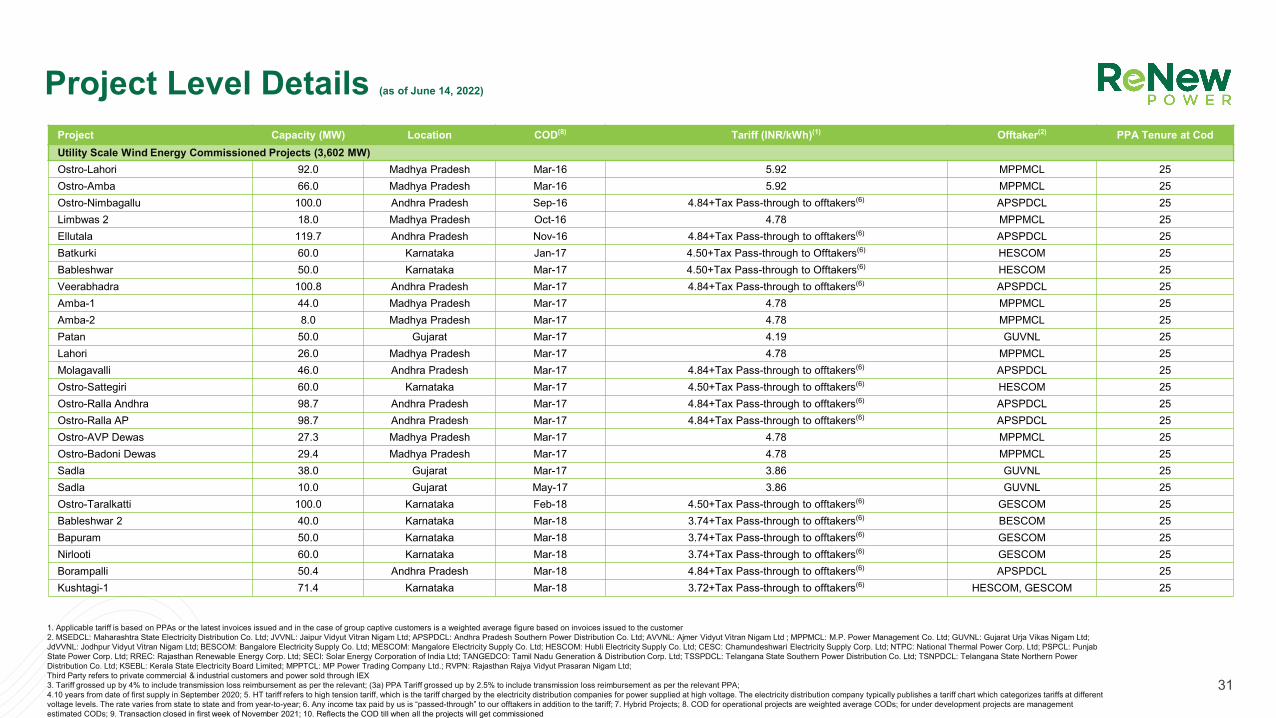
Project Capacity (MW) Location COD(8) Tariff (INR/kWh)(1) Offtaker(2) PPA Tenure at CodUtility Scale Wind Energy Commissioned Projects (3,602 MW)Ostro-Lahori 92.0 Madhya Pradesh Mar-16 5.92 MPPMCL 25Ostro-Amba 66.0 Madhya Pradesh Mar-16 5.92 MPPMCL 25Ostro-Nimbagallu 100.0 Andhra Pradesh Sep-16 4.84+Tax Pass-through to offtakers(6) APSPDCL 25Limbwas 2 18.0 Madhya Pradesh Oct-16 4.78 MPPMCL 25Ellutala 119.7 Andhra Pradesh Nov-16 4.84+Tax Pass-through to offtakers(6) APSPDCL 25Batkurki 60.0 Karnataka Jan-17 4.50+Tax Pass-through to Offtakers(6) HESCOM 25Bableshwar 50.0 Karnataka Mar-17 4.50+Tax Pass-through to Offtakers(6) HESCOM 25Veerabhadra 100.8 Andhra Pradesh Mar-17 4.84+Tax Pass-through to offtakers(6) APSPDCL 25Amba-1 44.0 Madhya Pradesh Mar-17 4.78 MPPMCL 25Amba-2 8.0 Madhya Pradesh Mar-17 4.78 MPPMCL 25Patan 50.0 Gujarat Mar-17 4.19 GUVNL 25Lahori 26.0 Madhya Pradesh Mar-17 4.78 MPPMCL 25Molagavalli 46.0 Andhra Pradesh Mar-17 4.84+Tax Pass-through to offtakers(6) APSPDCL 25Ostro-Sattegiri 60.0 Karnataka Mar-17 4.50+Tax Pass-through to offtakers(6) HESCOM 25Ostro-Ralla Andhra 98.7 Andhra Pradesh Mar-17 4.84+Tax Pass-through to offtakers(6) APSPDCL 25Ostro-Ralla AP 98.7 Andhra Pradesh Mar-17 4.84+Tax Pass-through to offtakers(6) APSPDCL 25Ostro-AVP Dewas 27.3 Madhya Pradesh Mar-17 4.78 MPPMCL 25Ostro-Badoni Dewas 29.4 Madhya Pradesh Mar-17 4.78 MPPMCL 25Sadla 38.0 Gujarat Mar-17 3.86 GUVNL 25Sadla 10.0 Gujarat May-17 3.86 GUVNL 25Ostro-Taralkatti 100.0 Karnataka Feb-18 4.50+Tax Pass-through to offtakers(6) GESCOM 25Bableshwar 2 40.0 Karnataka Mar-18 3.74+Tax Pass-through to offtakers(6) BESCOM 25Bapuram 50.0 Karnataka Mar-18 3.74+Tax Pass-through to offtakers(6) GESCOM 25Nirlooti 60.0 Karnataka Mar-18 3.74+Tax Pass-through to offtakers(6) GESCOM 25Borampalli 50.4 Andhra Pradesh Mar-18 4.84+Tax Pass-through to offtakers(6) APSPDCL 25Kushtagi-1 71.4 Karnataka Mar-18 3.72+Tax Pass-through to offtakers(6) HESCOM, GESCOM 25
31
1. Applicable tariff is based on PPAs or the latest invoices issued and in the case of group captive customers is a weighted average figure based on invoices issued to the customer 2. MSEDCL: Maharashtra State Electricity Distribution Co. Ltd; JVVNL: Jaipur Vidyut Vitran Nigam Ltd; APSPDCL: Andhra Pradesh Southern Power Distribution Co. Ltd; AVVNL: Ajmer Vidyut Vitran Nigam Ltd ; MPPMCL: M.P. Power Management Co. Ltd; GUVNL: Gujarat Urja Vikas Nigam Ltd; JdVVNL: Jodhpur Vidyut Vitran Nigam Ltd; BESCOM: Bangalore Electricity Supply Co. Ltd; MESCOM: Mangalore Electricity Supply Co. Ltd; HESCOM: Hubli Electricity Supply Co. Ltd; CESC: Chamundeshwari Electricity Supply Corp. Ltd; NTPC: National Thermal Power Corp. Ltd; PSPCL: Punjab State Power Corp. Ltd; RREC: Rajasthan Renewable Energy Corp. Ltd; SECI: Solar Energy Corporation of India Ltd; TANGEDCO: Tamil Nadu Generation & Distribution Corp. Ltd; TSSPDCL: Telangana State Southern Power Distribution Co. Ltd; TSNPDCL: Telangana State Northern Power Distribution Co. Ltd; KSEBL: Kerala State Electricity Board Limited; MPPTCL: MP Power Trading Company Ltd.; RVPN: Rajasthan Rajya Vidyut Prasaran Nigam Ltd;Third Party refers to private commercial & industrial customers and power sold through IEX3. Tariff grossed up by 4% to include transmission loss reimbursement as per the relevant; (3a) PPA Tariff grossed up by 2.5% to include transmission loss reimbursement as per the relevant PPA; 4.10 years from date of first supply in September 2020; 5. HT tariff refers to high tension tariff, which is the tariff charged by the electricity distribution companies for power supplied at high voltage. The electricity distribution company typically publishes a tariff chart which categorizes tariffs at different voltage levels. The rate varies from state to state and from year-to-year; 6. Any income tax paid by us is “passed-through” to our offtakers in addition to the tariff; 7. Hybrid Projects; 8. COD for operational projects are weighted average CODs; for under development projects are management estimated CODs; 9. Transaction closed in first week of November 2021; 10. Reflects the COD till when all the projects will get commissioned
Project Level Details (as of June 14, 2022)

Project Capacity (MW) Location COD(8) Tariff (INR/kWh)(1) Offtaker(2) PPA Tenure at CodUtility Scale Wind Energy Commissioned Projects (3,602 MW)Ostro - Kutch (SECI 1) 250.0 Gujarat Oct-18 3.46 PTC 25SECI II 230.1 Gujarat Oct-19 2.64 SECI 25GUVNL 35.0 Gujarat Oct-19 2.45 GUVNL 25MSEDCL Bid 76.0 Maharashtra Dec-19 2.85 MSEDCL 25SECI III 300.0 Gujarat Dec-20 2.44 SECI 25SECI VI 136.6 Karnataka Sep-21 2.82 SECI 25SECI VII 35.2 Gujarat Dec-21 2.81 SECI 25Utility Scale Wind Energy Committed Projects (625 MW)SECI VI 163.4 Karnataka Q2 FY 23 2.82 SECI 25SECI VII 15.4 Gujarat Sep-22 2.81 SECI 25
527.9 MWs Acquisition
8.4 Rajasthan Mar-11 4.10 AVVNL 2012.0 Rajasthan Jul-11 4.10 – 4.46 JdVVNL 2016.8 Karnataka Mar-09 3.40 BESCOM 2055.3 Gujarat Jun-15 3.47 – 4.19 GUVNL 20-2530.0 Karnataka Mar-18 3.74 HESCOM 2516.0 Kerala Mar-17 4.09 KSEBL 25142.9 Madhya Pradesh Jul-15 4.78 – 5.92 MPPMCL 25145.1 Maharashtra Aug-13 5.33 – 5.81 MSEDCL 1315.0 Madhya Pradesh Mar-11 4.35 MPPTCL 255.0 Rajasthan Mar-03 5.71 RVPN 20
Total Utility Scale Wind Energy 4,227.1Utility Scale Solar Energy Commissioned Projects (3,296 MW)VS- Lexicon 10.0 Rajasthan Feb-13 8.69 NTPC 25VS- Symphony 10.0 Rajasthan Feb-13 8.48 NTPC 25Sheopur 50.0 Madhya Pradesh Jun-15 6.97 MPPMCL 25VS-Star Solar 5.0 Rajasthan Jul-15 6.45 RREC 25VS-Sun Gold 5.0 Rajasthan Jul-15 6.45 RREC 25
Adoni 39.0 Andhra Pradesh Mar-16 5.98 for year 1 with 3% escalation till year 10, 10th year tariff applicable from 11th year APSPDCL 25
32
1. Applicable tariff is based on PPAs or the latest invoices issued and in the case of group captive customers is a weighted average figure based on invoices issued to the customer 2. MSEDCL: Maharashtra State Electricity Distribution Co. Ltd; JVVNL: Jaipur Vidyut Vitran Nigam Ltd; APSPDCL: Andhra Pradesh Southern Power Distribution Co. Ltd; AVVNL: Ajmer Vidyut Vitran Nigam Ltd ; MPPMCL: M.P. Power Management Co. Ltd; GUVNL: Gujarat Urja Vikas Nigam Ltd; JdVVNL: Jodhpur Vidyut Vitran Nigam Ltd; BESCOM: Bangalore Electricity Supply Co. Ltd; MESCOM: Mangalore Electricity Supply Co. Ltd; HESCOM: Hubli Electricity Supply Co. Ltd; CESC: Chamundeshwari Electricity Supply Corp. Ltd; NTPC: National Thermal Power Corp. Ltd; PSPCL: Punjab State Power Corp. Ltd; RREC: Rajasthan Renewable Energy Corp. Ltd; SECI: Solar Energy Corporation of India Ltd; TANGEDCO: Tamil Nadu Generation & Distribution Corp. Ltd; TSSPDCL: Telangana State Southern Power Distribution Co. Ltd; TSNPDCL: Telangana State Northern Power Distribution Co. Ltd; KSEBL: Kerala State Electricity Board Limited; MPPTCL: MP Power Trading Company Ltd.; RVPN: Rajasthan Rajya Vidyut Prasaran Nigam Ltd;Third Party refers to private commercial & industrial customers and power sold through IEX3. Tariff grossed up by 4% to include transmission loss reimbursement as per the relevant; (3a) PPA Tariff grossed up by 2.5% to include transmission loss reimbursement as per the relevant PPA; 4.10 years from date of first supply in September 2020; 5. HT tariff refers to high tension tariff, which is the tariff charged by the electricity distribution companies for power supplied at high voltage. The electricity distribution company typically publishes a tariff chart which categorizes tariffs at different voltage levels. The rate varies from state to state and from year-to-year; 6. Any income tax paid by us is “passed-through” to our offtakers in addition to the tariff; 7. Hybrid Projects; 8. COD for operational projects are weighted average CODs; for under development projects are management estimated CODs; 9. Transaction closed in first week of November 2021; 10. Reflects the COD till when all the projects will get commissioned
Project Level Details (as of June 14, 2022)

Project Capacity (MW) Location COD(8) Tariff (INR/kWh)(1) Offtaker(2) PPA Tenure at CodUtility Scale Solar Energy Commissioned Projects (3,296 MW)
Cumbum 21.0 Andhra Pradesh Mar-16 5.98 for year 1 with 3% escalation till year 10, 10th year tariff applicable from 11th year APSPDCL 25
Mehbubnagar-1 100.0 Telangana May-16 6.73 TSSPDCL 25Sadashivpet 24.0 Telangana Jun-16 6.8 TSSPDCL 25Mandamarri 48.0 Telangana Feb-17 5.59 TSNPDCL 25Alland 20.0 Karnataka Mar-17 4.86 BESCOM 25Bhalki 20.0 Karnataka Mar-17 4.85 BESCOM 25Siruguppa 20.0 Karnataka Mar-17 4.76 HESCOM 25Humnabad 20.0 Karnataka Mar-17 4.86 HESCOM 25Charanka 40.0 Gujarat Mar-17 4.43 SECI 25Mulkanoor 30.0 Telangana Mar-17 5.59 TSNPDCL 25Chincholi 20.0 Karnataka Apr-17 4.84 BESCOM 25Minpur 65.0 Telangana Jun-17 5.59 TSSPDCL 25Dichipally 143.0 Telangana Jun-17 5.59 TSNPDCL 25Devdurga 20.0 Karnataka Sep-17 4.76 MESCOM 25Ostro-Wanaparthy 50.0 Telangana Sep-17 5.59 TSSPDCL 25MPSolar II 51.0 Madhya Pradesh Oct-17 5.46 MPPMCL 25Yadgir 20.0 Karnataka Oct-17 4.85 BESCOM 25Honnali 20.0 Karnataka Nov-17 5.05 BESCOM 25Turuvekere 20.0 Karnataka Nov-17 4.84 BESCOM 25Mahbubnagar 2 100.0 Telangana Nov-17 4.66 NTPC 25Ostro-Rajasthan 60.0 Rajasthan Nov-17 5.07 NTPC 25Pavagada 50.0 Karnataka Dec-17 4.8 NTPC 25Bhadla 50.0 Rajasthan Apr-19 2.49 SECI 25TN 100 100.0 Tamil Nadu Sep-19 3.47 TANGEDCO 25Mah Ph I 250.0 Rajasthan Oct-19 2.72 MSEDCL 25
Karnataka 140 140.0 Karnataka Oct-19 3.22 MESCOM, BESCOM, GESCOM, CESC 25
33
1. Applicable tariff is based on PPAs or the latest invoices issued and in the case of group captive customers is a weighted average figure based on invoices issued to the customer 2. MSEDCL: Maharashtra State Electricity Distribution Co. Ltd; JVVNL: Jaipur Vidyut Vitran Nigam Ltd; APSPDCL: Andhra Pradesh Southern Power Distribution Co. Ltd; AVVNL: Ajmer Vidyut Vitran Nigam Ltd ; MPPMCL: M.P. Power Management Co. Ltd; GUVNL: Gujarat Urja Vikas Nigam Ltd; JdVVNL: Jodhpur Vidyut Vitran Nigam Ltd; BESCOM: Bangalore Electricity Supply Co. Ltd; MESCOM: Mangalore Electricity Supply Co. Ltd; HESCOM: Hubli Electricity Supply Co. Ltd; CESC: Chamundeshwari Electricity Supply Corp. Ltd; NTPC: National Thermal Power Corp. Ltd; PSPCL: Punjab State Power Corp. Ltd; RREC: Rajasthan Renewable Energy Corp. Ltd; SECI: Solar Energy Corporation of India Ltd; TANGEDCO: Tamil Nadu Generation & Distribution Corp. Ltd; TSSPDCL: Telangana State Southern Power Distribution Co. Ltd; TSNPDCL: Telangana State Northern Power Distribution Co. Ltd; KSEBL: Kerala State Electricity Board Limited; MPPTCL: MP Power Trading Company Ltd.; RVPN: Rajasthan Rajya Vidyut Prasaran Nigam Ltd;Third Party refers to private commercial & industrial customers and power sold through IEX3. Tariff grossed up by 4% to include transmission loss reimbursement as per the relevant; (3a) PPA Tariff grossed up by 2.5% to include transmission loss reimbursement as per the relevant PPA; 4.10 years from date of first supply in September 2020; 5. HT tariff refers to high tension tariff, which is the tariff charged by the electricity distribution companies for power supplied at high voltage. The electricity distribution company typically publishes a tariff chart which categorizes tariffs at different voltage levels. The rate varies from state to state and from year-to-year; 6. Any income tax paid by us is “passed-through” to our offtakers in addition to the tariff; 7. Hybrid Projects; 8. COD for operational projects are weighted average CODs; for under development projects are management estimated CODs; 9. Transaction closed in first week of November 2021; 10. Reflects the COD till when all the projects will get commissioned
Project Level Details (as of June 14, 2022)

Project Capacity (MW) Location COD(8) Tariff (INR/kWh)(1) Offtaker(2) PPA Tenure at CodUtility Scale Solar Energy Commissioned Projects (3,296 MW)SECI Raj 110.0 Rajasthan Feb-21 2.49 SECI 25GUVNL 105.0 Gujarat Apr-21 2.68 GUVNL 25SECI III 300.0 Rajasthan Aug-21 2.55 SECI 25SECI IV 300.0 Rajasthan Dec-21 2.54 SECI 25Mah Ph II 300.0 Rajasthan Nov-21 2.75 MSEDCL 25Acquisition - Telangana(9) 260.0 Telangana Jun-17 5.65 TSNPDCL, TSSPDCL 25SECI VI 300.0 Rajasthan Dec-21 2.71 SECI 25Utility Scale Solar Energy Committed Projects (2,531 MW)SECI-Rihand 100.0 UP Q1 FY 24 3.29 SECI 25SECI Raj IV 975.0 Rajasthan Q3 FY24 2.18 SECI 25PSPCL 100.0 Rajasthan Q3 FY24 2.33 PSPCL 25MSEDCL 6 200.0 Rajasthan Q4 FY24 2.43 MSEDCL 25
527.9 MWs Acquisition16.3 Telangana Mar-15 6.49 TSSPDCL 2540.0 Tamil Nadu Sep-15 6.28 TANGEDCO 25
SECI VIII 200.0 Rajasthan PPA Awaited 2.51 SECI 25
SECI IX 700.0 Rajasthan PPA Awaited for 300 MW 2.37 SECI 25
GUVNL IX (Dholera) 200.0 Gujarat PPA Awaited 2.79 GUVNL 25Total Utility Scale Solar Energy 5,827.3
34
1. Applicable tariff is based on PPAs or the latest invoices issued and in the case of group captive customers is a weighted average figure based on invoices issued to the customer 2. MSEDCL: Maharashtra State Electricity Distribution Co. Ltd; JVVNL: Jaipur Vidyut Vitran Nigam Ltd; APSPDCL: Andhra Pradesh Southern Power Distribution Co. Ltd; AVVNL: Ajmer Vidyut Vitran Nigam Ltd ; MPPMCL: M.P. Power Management Co. Ltd; GUVNL: Gujarat Urja Vikas Nigam Ltd; JdVVNL: Jodhpur Vidyut Vitran Nigam Ltd; BESCOM: Bangalore Electricity Supply Co. Ltd; MESCOM: Mangalore Electricity Supply Co. Ltd; HESCOM: Hubli Electricity Supply Co. Ltd; CESC: Chamundeshwari Electricity Supply Corp. Ltd; NTPC: National Thermal Power Corp. Ltd; PSPCL: Punjab State Power Corp. Ltd; RREC: Rajasthan Renewable Energy Corp. Ltd; SECI: Solar Energy Corporation of India Ltd; TANGEDCO: Tamil Nadu Generation & Distribution Corp. Ltd; TSSPDCL: Telangana State Southern Power Distribution Co. Ltd; TSNPDCL: Telangana State Northern Power Distribution Co. Ltd; KSEBL: Kerala State Electricity Board Limited; MPPTCL: MP Power Trading Company Ltd.; RVPN: Rajasthan Rajya Vidyut Prasaran Nigam Ltd;Third Party refers to private commercial & industrial customers and power sold through IEX3. Tariff grossed up by 4% to include transmission loss reimbursement as per the relevant; (3a) PPA Tariff grossed up by 2.5% to include transmission loss reimbursement as per the relevant PPA; 4.10 years from date of first supply in September 2020; 5. HT tariff refers to high tension tariff, which is the tariff charged by the electricity distribution companies for power supplied at high voltage. The electricity distribution company typically publishes a tariff chart which categorizes tariffs at different voltage levels. The rate varies from state to state and from year-to-year; 6. Any income tax paid by us is “passed-through” to our offtakers in addition to the tariff; 7. Hybrid Projects; 8. COD for operational projects are weighted average CODs; for under development projects are management estimated CODs; 9. Transaction closed in first week of November 2021; 10. Reflects the COD till when all the projects will get commissioned
Project Level Details (as of June 14, 2022)

Project Type Capacity (MW) Location COD(8) Tariff (INR/kWh)(1) Offtaker(2) PPA Tenure at Cod
Utility Scale Firm Power Committed Projects (1704 MW)
PP-I (7)Wind 322.0
Karnataka PPA Awaited Off Peak - 2.88; Peak - 6.85 SECI 25Solar 81.0
RTC-I (7)
Wind 601.0 Karnataka
Q2 FY24 2.9 for year 1 with 3% escalation till year 15, from 16th to 25th year 15th year tariff will apply SECI 25Wind 300.0 Maharashtra
Solar 400.0 Rajasthan
Total Firm Power 1,704.0
35
Project Capacity (MW) Location COD(8) Tariff (INR/kWh)(1) Offtaker(2) PPA Tenure at CodHydro Power Project (99 MW)Acquisition - L&T Hydro 99.0 Uttarakhand Dec-20 Third Party
1. Applicable tariff is based on PPAs or the latest invoices issued and in the case of group captive customers is a weighted average figure based on invoices issued to the customer 2. MSEDCL: Maharashtra State Electricity Distribution Co. Ltd; JVVNL: Jaipur Vidyut Vitran Nigam Ltd; APSPDCL: Andhra Pradesh Southern Power Distribution Co. Ltd; AVVNL: Ajmer Vidyut Vitran Nigam Ltd ; MPPMCL: M.P. Power Management Co. Ltd; GUVNL: Gujarat Urja Vikas Nigam Ltd; JdVVNL: Jodhpur Vidyut Vitran Nigam Ltd; BESCOM: Bangalore Electricity Supply Co. Ltd; MESCOM: Mangalore Electricity Supply Co. Ltd; HESCOM: Hubli Electricity Supply Co. Ltd; CESC: Chamundeshwari Electricity Supply Corp. Ltd; NTPC: National Thermal Power Corp. Ltd; PSPCL: Punjab State Power Corp. Ltd; RREC: Rajasthan Renewable Energy Corp. Ltd; SECI: Solar Energy Corporation of India Ltd; TANGEDCO: Tamil Nadu Generation & Distribution Corp. Ltd; TSSPDCL: Telangana State Southern Power Distribution Co. Ltd; TSNPDCL: Telangana State Northern Power Distribution Co. Ltd; KSEBL: Kerala State Electricity Board Limited; MPPTCL: MP Power Trading Company Ltd.; RVPN: Rajasthan Rajya Vidyut Prasaran Nigam Ltd;Third Party refers to private commercial & industrial customers and power sold through IEX3. Tariff grossed up by 4% to include transmission loss reimbursement as per the relevant; (3a) PPA Tariff grossed up by 2.5% to include transmission loss reimbursement as per the relevant PPA; 4.10 years from date of first supply in September 2020; 5. HT tariff refers to high tension tariff, which is the tariff charged by the electricity distribution companies for power supplied at high voltage. The electricity distribution company typically publishes a tariff chart which categorizes tariffs at different voltage levels. The rate varies from state to state and from year-to-year; 6. Any income tax paid by us is “passed-through” to our offtakers in addition to the tariff; 7. Hybrid Projects; 8. COD for operational projects are weighted average CODs; for under development projects are management estimated CODs; 9. Transaction closed in first week of November 2021; 10. Reflects the COD till when all the projects will get commissioned
Project Capacity (MW) Location COD(8) Tariff (INR/kWh)(1) Offtaker(2) PPA Tenure at CodCorporate Wind Energy Commissioned Projects (178 MW)Tadas 34.4 Karnataka Feb-13 7.24 + escalation linked to HT Tariff(5) 3rd Party 10Tadas 16.0 Karnataka Apr-13 7.24 + escalation linked to HT Tariff(5) 3rd Party 10Chikodi 18.0 Karnataka Jun-13 5.77 + escalation linked to HT Tariff(5) 3rd Party 10Lingasugur 40.0 Karnataka Dec-15 5.88 + escalation linked to HT Tariff(5) 3rd Party 10Ron 40.0 Karnataka Aug-16 5.83 + escalation linked to HT Tariff(5) 3rd Party 10Jogihalli 4.8 Karnataka Dec-16 6.08 + escalation linked to HT Tariff(5) 3rd Party 10Jogihalli 7.2 Karnataka Jun-17 6.08 + escalation linked to HT Tariff(5) 3rd Party 10Babaria(7) 17.6 Gujarat Feb-22 3.43 Grasim 25
Project Level Details (as of June 14,2022)

36
1. Applicable tariff is based on PPAs or the latest invoices issued and in the case of group captive customers is a weighted average figure based on invoices issued to the customer 2. MSEDCL: Maharashtra State Electricity Distribution Co. Ltd; JVVNL: Jaipur Vidyut Vitran Nigam Ltd; APSPDCL: Andhra Pradesh Southern Power Distribution Co. Ltd; AVVNL: Ajmer Vidyut Vitran Nigam Ltd ; MPPMCL: M.P. Power Management Co. Ltd; GUVNL: Gujarat Urja Vikas Nigam Ltd; JdVVNL: Jodhpur Vidyut Vitran Nigam Ltd; BESCOM: Bangalore Electricity Supply Co. Ltd; MESCOM: Mangalore Electricity Supply Co. Ltd; HESCOM: Hubli Electricity Supply Co. Ltd; CESC: Chamundeshwari Electricity Supply Corp. Ltd; NTPC: National Thermal Power Corp. Ltd; PSPCL: Punjab State Power Corp. Ltd; RREC: Rajasthan Renewable Energy Corp. Ltd; SECI: Solar Energy Corporation of India Ltd; TANGEDCO: Tamil Nadu Generation & Distribution Corp. Ltd; TSSPDCL: Telangana State Southern Power Distribution Co. Ltd; TSNPDCL: Telangana State Northern Power Distribution Co. Ltd; KSEBL: Kerala State Electricity Board Limited; MPPTCL: MP Power Trading Company Ltd.; RVPN: Rajasthan Rajya Vidyut Prasaran Nigam Ltd;Third Party refers to private commercial & industrial customers and power sold through IEX3. Tariff grossed up by 4% to include transmission loss reimbursement as per the relevant; (3a) PPA Tariff grossed up by 2.5% to include transmission loss reimbursement as per the relevant PPA; 4.10 years from date of first supply in September 2020; 5. HT tariff refers to high tension tariff, which is the tariff charged by the electricity distribution companies for power supplied at high voltage. The electricity distribution company typically publishes a tariff chart which categorizes tariffs at different voltage levels. The rate varies from state to state and from year-to-year; 6. Any income tax paid by us is “passed-through” to our offtakers in addition to the tariff; 7. Hybrid Projects; 8. COD for operational projects are weighted average CODs; for under development projects are management estimated CODs; 9. Transaction closed in first week of November 2021; 10. Reflects the COD till when all the projects will get commissioned
Project Capacity (MW) Location COD(8) Tariff (INR/kWh)(1) Offtaker(2) PPA Tenure at CodCorporate Wind Energy Committed Projects (298 MW)Otha(7) 11.0 Gujarat Sep-22 3.43 Grasim 25Other Corporate Projects(7) 262.0 Multiple Q3 FY24(10) 3.25 – 3.95 3rd Party -527.9 MWs Acquisition 25.2 Karnataka Jun-12 4.00 3rd Party 20Corporate Solar Energy Commissioned Projects (392 MW)Ittigi 50.0 Karnataka Jan-17 5.98 + escalation linked to HT Tariff or predefined escalation(5) 3rd Party 08-10 years
Raichur 50.0 Karnataka May-17 5.57 + escalation linked to HT Tariff or predefined escalation or no escalation 3rd Party 08-12 years
Wadgare 20.0 Karnataka Dec-17 5.17 + escalation linked to HT Tariff or predefined escalation or no escalation 3rd Party 10
Nirna 20.0 Karnataka Mar-18 5.31 + escalation linked to HT Tariff or predefined escalation or no escalation 3rd Party 10
Ladha 20.0 Karnataka Mar-18 4.96 + escalation linked to HT Tariff or predefined escalation or no escalation 3rd Party 10
Welturi 20.0 Maharashtra Dec-21 3.37 Mahindra CIE 25Babaria(7) 6.7 Gujarat Feb-22 3.43 Grasim 25Bandarwada 43.0 Maharashtra Mar-22 2.81 M&M 25Other Corporate Projects 162.0 Multiple - 3.37 – 3.67 3rd Party -Corporate Solar Energy Committed Projects (84 MW)Otha(7) 16.7 Gujarat Sep-22 3.43 Grasim 25Other Corporate Projects(7) 67.3 Multiple Q3 FY23(10) 3.06 – 3.95 3rd Party -Total Corporate Projects 951.9Total Portfolio 12,809.2Total Commissioned 7,566.5Total Committed 5,242.7
Project Level Details (as of June 14,2022)