
Put in Your Postcode, Out Comes the Data: A Case Study
15
Put in your postcode, out comes the data: A Case Study Tope Omitola 1 , Christos L. Koumenides 1 , Igor O. Popov 1 , Yang Yang 1 , Manuel Salvadores 1 , Martin Szomszor 2 , Tim Berners-Lee 1 , Nicholas Gibbins 1 , Wendy Hall 1 , mc schraefel 1 , and Nigel Shadbolt 1 1 Intelligence, Agents, Multimedia (IAM) Group School of Electronics and Computer Science University of Southampton, UK { t.omitola, clk1v07, ip2g09, yy1402, ms8, timbl, nmg, wh, mc, nrs }@ecs.soton.ac.uk 2 City eHealth Research Centre City University London, UK [email protected] Abstract. A single datum or a set of a categorical data has little value on its own. Combinations of disparate sets of data increase the value of those data sets and helps to discover interesting patterns or relationships, facilitating the construction of new applications and services. In this paper, we describe an implementation of using open geographical data as a core set of “join point”(s) to mesh different public datasets. We describe the challenges faced during the implementation, which include, sourcing the datasets, publishing them as linked data, and normalising these linked data in terms of finding the appropriate “join points” from the individual datasets, as well as developing the client application used for data consumption. We describe the design decisions and our solutions to these challenges. We conclude by drawing some general principles from this work. Key words: Public Sector Information, Linked Data, Public Open Data, Data Publication, Data Consumption, Semantic Web. 1 Introduction In the private consumption of goods and services, there is a drive to put the consumer at the centre of production, i.e. to co-produce the goods and services consumers want. This drive has also come to the production and consumption of public goods and services. Citizens want governments to improve the delivery of public services. One way to improve the delivery is to put the citizen as the co-producer of these goods and services. There are concrete cases of these, where citizens are at the heart of service designs and accountability. A good example is Patients Know Best 3 , where the principle is the “empowerment of health workers 3 http://www.patientsknowbest.com/
-
Upload
independent -
Category
Documents
-
view
4 -
download
0
Transcript of Put in Your Postcode, Out Comes the Data: A Case Study
Put in your postcode, out comes the data: ACase Study
Tope Omitola1, Christos L. Koumenides1, Igor O. Popov1, Yang Yang1,Manuel Salvadores1, Martin Szomszor2, Tim Berners-Lee1, Nicholas Gibbins1,
Wendy Hall1, mc schraefel1, and Nigel Shadbolt1
1 Intelligence, Agents, Multimedia (IAM) GroupSchool of Electronics and Computer Science
University of Southampton, UK{ t.omitola, clk1v07, ip2g09, yy1402, ms8, timbl, nmg, wh, mc, nrs
}@ecs.soton.ac.uk2 City eHealth Research Centre
City University London, [email protected]
Abstract. A single datum or a set of a categorical data has little valueon its own. Combinations of disparate sets of data increase the value ofthose data sets and helps to discover interesting patterns or relationships,facilitating the construction of new applications and services. In thispaper, we describe an implementation of using open geographical dataas a core set of “join point”(s) to mesh different public datasets. Wedescribe the challenges faced during the implementation, which include,sourcing the datasets, publishing them as linked data, and normalisingthese linked data in terms of finding the appropriate “join points” fromthe individual datasets, as well as developing the client application usedfor data consumption. We describe the design decisions and our solutionsto these challenges. We conclude by drawing some general principles fromthis work.
Key words: Public Sector Information, Linked Data, Public Open Data,Data Publication, Data Consumption, Semantic Web.
1 Introduction
In the private consumption of goods and services, there is a drive to put theconsumer at the centre of production, i.e. to co-produce the goods and servicesconsumers want. This drive has also come to the production and consumptionof public goods and services. Citizens want governments to improve the deliveryof public services. One way to improve the delivery is to put the citizen as theco-producer of these goods and services. There are concrete cases of these, wherecitizens are at the heart of service designs and accountability. A good example isPatients Know Best3, where the principle is the “empowerment of health workers
3 http://www.patientsknowbest.com/

2 Authors Suppressed Due to Excessive Length
and patients to be creative with information”. An example of co-production hereis the opening up of access and communications to:
– patients’ records,
– their medical doctors and consultants, and
– other information, such as treatments, care, etc.
For this to be more seamless, citizens need to have access to public data,and there will need to be linkage of these data and records across organisationalboundaries to help patients make informed decisions, and to enable the qualityof care to be monitored. Therefore, the provision and opening up of governmentdata contributes to the improvement of the delivery of public services.
With a view to this, governments around the world are opening up govern-ment data to enable, among other things, this process of citizens’ co-production.Questions such as: “Where can I find a good school, hospital, investment advisor,employer?”, and more complex questions, such as the integration of these do-mains and their potential relationships, can be more easily answered than theyare at present, using open government data.
In the United States, the government has set up data.gov4 for the publicationof public data. The United Kingdom government has set up a public data store5
where large quantities of public sector information have been freed up or pub-lished, ranging from geospatial, statistical, financial, and legal data. While mostof these data are published in spreadsheet or comma-separated-values (csv) for-mats, publishing them in structured machine-processable formats will be highlyuseful for ease of linking to other data sources and for ease of re-use.
Although the Semantic Web offers solutions to publishing data in a struc-tured machine-processable format, the requirement for agreed ontologies hasoften presented a hurdle in the deployment of these technologies [2]. The LinkedData6 movement advocates a bottom-up approach to ontology agreement [6]by publishing data in a structured machine-processable formats, such as RDF,before agreeing on ontologies for specific applications. The benefits for makingdata available in a structured and machine-processable formats include:
1. End users know what to expect, and find content easier to read,
2. Online services can aggregate accurate, up to date, and comprehensive in-formation, and
3. Data re-users will find it easier to create new combinations of data that aremore relevant to end users.
There have been many efforts in publishing data as linked data. Some note-worthy examples include
4 http://www.data.gov5 http://www.data.gov.uk6 The term “Linked Data” refers to a style of publishing and interlinking structured
data on the Web [http://www.w3.org/DesignIssues/LinkedData.html].
Put in your postcode, out comes the data: A Case Study 3
1. The London Gazette7, where linked data was used to maximise the re-useof the information within it, and as a vehicle for the government to servesemantically enabled official information, and
2. The New York Times8, which, in 2009, published its news vocabularies aslinked open data.
There are some examples of linking data sources from different domains. Suchexamples include:
1. BBC’s Music Beta[7]. This links data across BBC9 domains with data fromMusicBrainz10, and DBpedia11. The BBC maintains data of programmes,music, artists, etc, but most of these information are stored in data silos. Formany years, it has been difficult for the BBC to have an “across domain”look at its data; Music Beta provides a solution to this.
2. Linked Movie Database[8]. This is an RDF data source of movies, which arethe results of interlinking data from disparate data sources, such as RDFBook Mashup12, MusicBrainz, Geonames13, and DBpedia.
A noteworthy example in the public sector is the Postcode paper14 which,by using London (United Kingdom) postcodes, provides an integrated viewof local services, environmental information, and crime statistics of neighbour-hoods. However, there are challenges with providing an integrated view of linkeddatasets. These include:
1. (the case of) sourcing, or discovering, the appropriate datasets,2. their formats,3. which “join point”(s) to use,4. data interlinking issues (i.e. setting links between entities in different data
sources), and5. building the client applications to consume the data
This paper describes the results and analyses from experiments carried outfrom selecting and combining some United Kingdom public datasets that can beused to infer relationships amongst these data. Berners-Lee and Shadbolt [1] laidout the benefits of publishing non-personal public computer-readable data forreuse. We set out to implement some of the ideas set out in their paper, and touse administrative entities (geographic) data, from the UK’s Ordnance Survey,as a “join point” to mesh data for crime, mortality rates, and hospital waitingtimes. By meshing, we mean the ability to naturally merge together a dynamic
7 http://www.london-gazette.co.uk/8 http://data.nytimes.com/9 http://www.bbc.co.uk
10 http://musicbrainz.org/11 http://dbpedia.org/About12 http://www4.wiwiss.fu-berlin.de/bizer/bookmashup/13 http://www.geonames.org/14 http://blog.newspaperclub.co.uk/2009/10/16/data-gov-uk-newspaper/

4 Authors Suppressed Due to Excessive Length
set of information sources, and a join-point is a point of reference shared byall datasets. As most of these data were not linked data and were published bydifferent departments of government, we describe the processes we undertookto convert them into a linked data format, the challenges encountered, and thesolutions we devised. Building clients to consume these data also posed its ownchallenges, which we describe.
2 Related Work
The provision and consumption of public data have been an ongoing effort formany years. These vary from the solutions used in the linked and the non-linkeddata space.
2.1 Non-linked Data space
1. Mashups used for many years as a mechanism to provide and consumepublic data. They fuse data from two or more Web applications to create anew service. The website, GeoWorldBank15 is an example of a data mashupfrom Google16 and the World Bank to display a country’s statistics, such asits population and its income level. A mashup application is comprised ofthree different components that are disjoint, both logically and physically.These are: the API/content providers, the mashup site, and the client’s Webbrowser. Mashups provide many benefits, such as the provision of access tomassive amounts of content which no individual could gather on their own,and lowering the barriers to developing novel applications. They have somedisadvantages, and these include:(a) Data pollution. Some of these data sources may contain erroneous or
inconsistent data, compromising the value provided by the mashup.(b) If a mashup uses screen scraping as part of building it, one small change
in the data markup of any of the source sites may compromise the qualityof the mashup.
(c) Mashups are implemented against a fixed number of data sources andcan not take advantage of new data sources that appear on the Web.
2. Other Third-party Datastores There are a few charity or non-profitbased institutions who provide, through APIs and bulk file downloads, dataof members of a country’s governmental institutions. Some are: (a) Gov-Track.us17, a website providing a set of tools used to research and track theactivities in the U.S. Congress, using congressional district maps, or search-ing by name, or using the U.S. ZIP code. It provides two main access to itsdata, via raw XML files and APIs, and (b) TheyWorkForYou18 a websitethat provides data on the Members’ and the Houses of the United KingdomParliament, through using a set of APIs and raw XML files.
15 http://geo.worldbank.org/16 http://maps.google.co.uk/17 GovTrack.us18 http://www.theyworkforyou.com/

Put in your postcode, out comes the data: A Case Study 5
2.2 Linked Data space
There are many initiatives around the world making public data available. Theseinclude:
– DBpedia: A community effort to extract structured information fromWikipedia, linking this information to other datasets, and making it availableon the Web.
– GeoNames: GeoNames integrates geographical data, such as place names,population, etc, from various sources. It gives access to users to manuallyedit, correct, and add new names.
– Data.gov.uk19: This is U.K. government central place to publish public dataas RDF.
– The Ordnance Survey20: Great Britain’s national mapping agency, providinggeographic data used by government, businesses, and individuals. It provideslinked data format of the administrative and voting regions in Great Britain.This data includes the names, census code, and area of the regions of GreatBritain.
In DBpedia and GeoNames, as they are user-community based initiatives, thereare risks of introducing data redundancy and/or data pollution. Data.gov.uk isonly open to registered members, and many of the data it points to are not yetpublished in RDF format. The Ordnance Survey, however, is an authoritativesource of the data it produces.
3 Application Case Study
3.1 Introduction
We investigated the use of disparate sets of data in an effort to better under-stand the challenges of their integration using Semantic Web approaches. Partof this investigation involved ascertaining the datasets that were available, theirformats, and converting them into (re)usable formats, asking our questions, andalso linking our data back into the linked data cloud21. The issue we started withwas how to deal with linked data that are centred around the democratic systemof political representation in the United Kingdom. We noticed that a lot of UKgovernmental data are already referenced by geography. The Ordnance Surveyhave produced a number of ontologies and an RDF data set that represents thekey administrative entities in the UK [3]. The questions we asked were whatkinds of problems will be encountered from developing a service that uses anadministrative entity, i.e. geography data, linked with other data, such as crimi-nal statistics data, the Members of Parliament of these entities (their data), themortality rates of these entities, and the National Health Service (NHS) hospitalwaiting times.
19 http://data.hmg.gov.uk/about20 http://www.ordnancesurvey.co.uk/oswebsite/21 http://linkeddata.org

6 Authors Suppressed Due to Excessive Length
3.2 Design Decisions
1. Sourcing the datasets. Since many of the datasets of interest were not yet inlinked data format, we could not take advantage of the automatic resourcediscovery process as enunciated in [10]. We sourced the data by going to therelevant department of government websites. Some datasets were in PDFand HTML formats, while some were in XLS formats. We decided againstscraping, for reasons outlined in section 2.1. For reasons of data fidelity,ability to source from a wider range of public sector domains, and to haveincreased value that comes from many information linkages, we chose theones in XLS formats. In future, we do expect many of these datasets to besourced via the U.K. government’s public datastore22. This should aid thediscovery process of consuming (linked) data.
2. Selection of RDF as the normal form: We decided to use RDF as the normalform for the datasets. RDF offers many advantages, such as provision of anextensible schema, self-describing data, de-referenceable URIs, and, as RDFlinks are typed, safe merging (linking) of different datasets. We chose theRDF/Turtle representation of RDF triples for its compactness and clarity.
3. We chose a central 4store [4] system to store and manage our RDF triples.4store provides a robust, scalable, and secure platform to manage RDFtriples23.
4. Modelling multidimensional data. The real world is complex, multidimen-sional (of space and time) and multivariate, and so are our chosen datasets.They contain dimensions such as time, geographical regions, employment or-ganisations, etc. For example, one of the datasets, the datasets for recordedcrime for England and Wales 2008/09, has dimensions such the “Police ForceAreas of England and Wales” and the types of recorded crimes, e.g. burglary.To model this multi-dimensionality, we chose SCOVO[5]. SCOVO is an ex-pressive modelling framework for representing complex statistics.
5. Many of the datasets we used have notions of geography or region. Tojoin them together, we used geographical location data as the set of “joinpoint”(s). We chose to use the Ordnance Survey’s geographical datasets [3]as our set of join points. The Ordnance Survey datasets are relatively stableand fairly authoritative.
6. Although our datasets had concepts of geography, the names given to partic-ular geographical regions differ. As many of these regions refer to the samegeographical boundaries, we used owl:sameAs to assert equivalences betweenthem.
7. Consumption of data. We used Exhibit24 to develop the client application.Exhibit allows quick development of Web sites that support various data-centric interactions such as faceted browsing and various representation for-mats over data such as tables, timelines, thumbnail views, etc.
22 http://data.hmg.gov.uk/about23 As of 2009-10-21 it’s running with 15B triples in a production cluster to power the
DataPatrol application(http://esw.w3.org/topic/LargeTripleStores)24 http://simile.mit.edu/wiki/Exhibit/API

Put in your postcode, out comes the data: A Case Study 7
4 Public Sector DataSets - Publication and Consumption
4.1 Datasets
We used five major datasets. Table 1 lists the data sets used, their formats, anda brief description of the data. They include datasets of Members of Parliament(MPs), Lords, their corresponding constituencies and counties, relevant websites,MPs’ expenses and votes, and statistical records about crime, hospital waitingtime, and mortality rates.
Data Source Format Dataset
Publicwhip.org.uk HTML MP Votes Records, Divisions, Policies
Theyworkforyou.com XML Dump Parliament, Parliament expenses
Homeoffice.gov.uk Excel Spreadsheet Recorded crime (English and Wales2008/09)
Statistics.gov.uk Excel Spreadsheet Hospital Waiting List Statistics (English2008/09)
Performance.doh.gov.uk Excel Spreadsheet Standardised mortality ratios by sex (En-glish and Wales 2008)
Ordancesurvey.co.uk Linked Data National mapping agency, providing themost accurate and up-to-date geographicdata
Table 1. Targeted Government data sources, formats, and description of dataset.
4.2 Modelling the datasets
Most of our vocabularies come from Friend-of-a-Friend (FOAF)25, Dublin Core(DC)26, and SCOVO ontologies, thereby following the advice given in [9] tore-use terms from well-known vocabularies.
Modelling the datasets for Recorded Crimes. Each row, of the spreadsheet pro-vided by the Home Office27, consisted of data of each Police Force area in Eng-land and Wales, and for a particular row, its columns contained the recordedcrime values for the following offences, “Violence against the person”, “Rob-bery”, “Burglary”, “Offences against vehicles”, etc. The time period under dis-cussion, i.e. 2008/09, the geographical areas and regions, and the different typesof criminal offences are scovo:Dimension(s). A snippet of the RDF/Turtleschema representation is shown below:
25 http://xmlns.com/foaf/spec/26 http://dublincore.org/documents/dcmes-xml/27 http://www.homeoffice.gov.uk/about-us/publications/non-personal-data/

8 Authors Suppressed Due to Excessive Length
:TimePeriod rdf:type owl:Class;
rdfs:subClassOf scovo:Dimension.
:TP2008_09 rdf:type :TimePeriod.
:GeographicalRegion rdfs:subClassOf scovo:Dimension;
dc:title "Police force area, English region and Wales".
:CriminalOffenceType rdf:type owl:Class;
rdfs:subClassOf scovo:Dimension.
Modelling the Hospital Waiting List. Each row, of this dataset28, consisted ofdata for each health care provider, or a National Health Service (NHS) HospitalTrust, in England and Wales. The columns consisted of various data that were ofno interest to us. One of the columns, “Patients waiting for admission by weekswaiting”, was made up of several columns which had data for patients waiting forhospital operations, and each of these columns was divided into weekly waitingtimes, from those waiting between 0 and 1 week, continuing to those waitingfor more than thirty weeks. We modelled the data as follows. The time period,2008/09, the NHS Hospital Trust (e.g. South Tyneside NHS Foundation Trust),and the waiting periods are scovo:Dimension(s). The value for patients thathad been waiting for hospital operation from between zero to one week at SouthTyneside NHS Foundation Trust is modelled as:
:A_RE9 rdf:type waitt:OrgName; dc:title "RE9";
rdfs:label "South Tyneside NHS Foundation Trust";
statistics:SHA "Q30"; statistics:org_code "RE9".
:ds1_1_2 rdf:type scovo:Item; rdf:value 185;
scovo:dataset :ds1; scovo:dimension :w0to01week;
scovo:dimension :A_RE9; scovo:dimension :TP2008_09.
Modelling the UK Parliament. The datasets of information for MPs, Lords, con-stituencies, counties, MPs’ expenses and votes were downloaded from the Parlia-ment Parser29. Most of these were raw XML files. The Parliament Parser providesstructured versions of publicly available data from the UK parliament. Membersof parliament and lords were modelled as foaf:person(s) with parliament iden-tities corresponding to their roles in the Parliament at different time periods.Constituencies and counties were embodied as dc:jurisdiction(s) and linked totheir corresponding MP and Lord identities via the dc:coverage property. Polit-ical parties and the Houses themselves were in turn modelled as foaf:group(s),while MPs expenses and votes were modelled using the SCOVO ontology.
4.3 Converting Datasets to RDF
Most of our data were in spreadsheet or comma-separated-values (csv) formats.There are inherent problems with re-using data published in spreadsheet format.These include:
28 http://www.performance.doh.gov.uk/waitingtimes/index.htm29 http://ukparse.kforge.net/parlparse/
Put in your postcode, out comes the data: A Case Study 9
1. little or no explicit semantic description, or schema, of the data. An exampleof this can be seen from the Hospital Waiting List where there were codesgiven names such as “SHA Code”, and “Org Code”, without explanation oftheir relationships with the rest of the data in the spreadsheet.
2. more difficult to integrate, or link, data from disparate data sources. Anexample of this can be seen from the Home Office data where each area’svalue for a crime was given. It will be good to know how this data wasarrived, and linking it with the data sources from whence they come wouldhave been useful (e.g. for provenance and validation).
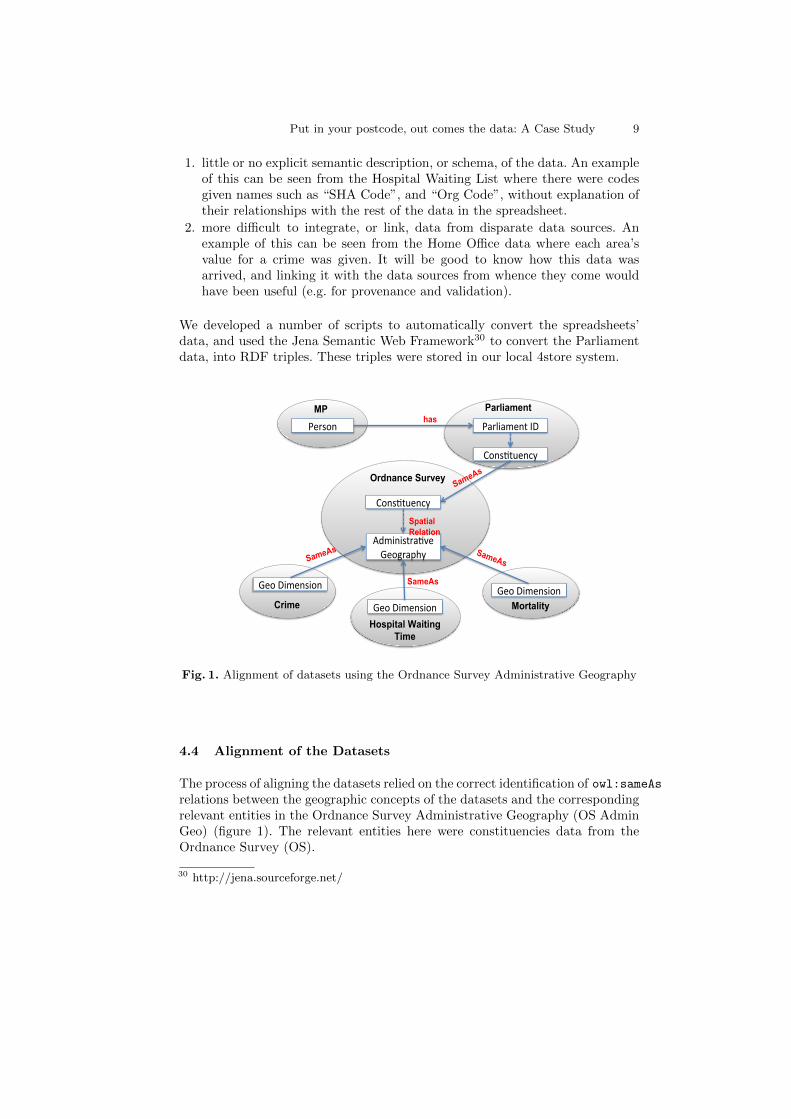
We developed a number of scripts to automatically convert the spreadsheets’data, and used the Jena Semantic Web Framework30 to convert the Parliamentdata, into RDF triples. These triples were stored in our local 4store system.
Person
Cons)tuency
Parliament ID
Geo Dimension
Administra)ve Geography
Cons)tuency
MP Parliament
Crime Mortality
Hospital Waiting Time
Geo Dimension Geo Dimension
Ordnance Survey
SameAs SameAs
SameAs
Spatial Relation
has
SameAs
Fig. 1. Alignment of datasets using the Ordnance Survey Administrative Geography
4.4 Alignment of the Datasets
The process of aligning the datasets relied on the correct identification of owl:sameAsrelations between the geographic concepts of the datasets and the correspondingrelevant entities in the Ordnance Survey Administrative Geography (OS AdminGeo) (figure 1). The relevant entities here were constituencies data from theOrdnance Survey (OS).
30 http://jena.sourceforge.net/

10 Authors Suppressed Due to Excessive Length
Aligning the datasets for Recorded Crimes We made use of our local 4storeand also of the OS sparql endpoint at “http://api.talis.com/stores/ordnance-survey/services/sparql”. Our goal was to set owl:sameAs equivalences betweenthe geographical entities (geo names) in our dataset and respective (Westmin-ster) constituencies as defined by the OS. The geographical entities in the OS areof several types, some are civil parishes, some are constituencies, and some arecounties. A county usually contains a set of constituencies (and parishes). Wequeried the OS for the type of geo name in our dataset. If a constituency, we setthe geo name to be the same as the OS identifier for that constituency. If the geoname is a county, we queried the OS for the list of constituencies it contained,and we set the geo name to be the same as the individual members’ identi-fiers of that list. For example, the geo name Cumbria, represented in our 4storeas http://enakting.ecs.soton.ac.uk/statistics/data/Cumbria, has manyparishes, but only four constituencies. We set Cumbria to be the same as thesefour constituencies, shown below (to save space, only one is shown):
<http://enakting.ecs.soton.ac.uk/statistics/data/Cumbria>
<http://www.w3.org/2002/07/owl#sameAs>
<http://data.ordnancesurvey.co.uk/id/7000000000024876>.
However, we encountered a few special cases. A police force region in ourdataset was known as “Yorkshire and the Humber Region”, but the OS didnot have this but had an entity called “Yorkshire & the Humber” which werethe same. We manually had to query the OS for this and also to give us theconstituencies under ‘Yorkshire & the Humber”, and set them to be the sameas the “Yorkshire and the Humber Region” in our dataset.
Aligning the Hospital Waiting List The geographical entity here was the fullname of each NHS Trust in England and Wales, e.g. “South Tyneside NHSFoundation Trust”. We employed the Google Maps API31 to get the locations ofthese NHS Trusts. The Google Maps API returned for each geographical entity,with increasing precision, the Administrative Area, Sub Administrative Area,Locality, as well as their lat/long coordinates. We then manually queried theOS, using string matching, for the constituency names of this entity. In casethe string matching operation failed, we queried TheyWorkForYou API, for theconstituencies, giving it the lat/long values.
Aligning the UK Parliament Data In the United Kingdom, boundaries of con-stituencies and constituency names change every few years. This affected the pre-cise alignment of the data from the Parliament Parser and the OS Admin Geo.The Parliament Parser solves the problem of constituencies changes by assigninga new identifier to it32. The Ordnance Survey, however, only defines constituen-
31 http://code.google.com/apis/maps/32 “Unique identifiers and alternative names for UK parliamentary constituen-
cies. A constituency is given a new id whenever its boundaries change.” [seehttp://ukparse.kforge.net/svn/parlparse/members/constituencies.xml]

Put in your postcode, out comes the data: A Case Study 11
cies according to their latest classification by the UK Parliament. Therefore, onlya partial alignment of these two datasets was possible.
4.5 Linked Data Consumption
The application scenario we envisaged is as follows: a user wants to find outsome information about their geographical region - political, social etc. Theyhave no knowledge, however, of the kind of data they might find nor are theyknowledgeable in all the various geographical entities their place of residence ispart of. Following on the methodology as described in the Postcode paper, theapplication acts as an aggregator of information based on the user’s postal code,which they input at the start of the application. The application then tries togenerate views of data from different topics along with widgets that allow theuser to further explore the data retrieved.
Fig. 2. Displaying data, as timeline, of some British Members of Parliament.
In the application33, the geographical region acts as the context for the dis-played data, and is the central point from which the application follows links tofind the data to display. For example, the application starts off showing politicalinformation, such as the political representatives for that area. Since in our datathe constituency is the lowest geographic entity in the hierarchy, it starts byshowing the political representation for that constituency. The interface showsthe different MPs that have served or are in office for that constituency, plotsa timeline view of their terms in office (Figure 2), and shows data about theirvoting records (Figure 3), and expenses (Figure 4). Additionally, the applicationgenerates facets for the user to quickly filter through the information. To keep
33 The application is at http://psiusecase.enakting.org/

12 Authors Suppressed Due to Excessive Length
the load of information low and present relevant information, we restrict theapplication to presenting data for MPs for the last two decades. We note thatthe application accounts for any temporal inconsistencies by matching the timeperiods between these aggregated data, as there are cases where a certain MPhad served in two different constituencies and data on their expenses are avail-able only for one of those terms. In such cases information is restricted only tothat which applied for the period they are in office for the constituency currentlyunder view. Going up the hierarchy, at each level the application tries to finddata about different topics. For example, it finds the county which contains theconstituency and tries to retrieve crime data for that county. If it finds data, itdisplays them.
Fig. 3. Displaying voting record data for selected British Members of Parliament.
5 Conclusions and Future Work
In an effort to provide greater transparency amongst public sector depart-ments and to target public services to areas of best need, governments are ac-tively opening up public data. However much of these data are in non-linkedformats. The data models are difficult to understand and re-use, and closed toweb-scale integration. Publishing these data in linked data format would makeit easier for them to be re-useable and interlinked.
In this work, we took data from disparate public data sources converting theminto linked data format using geographical data, as the set of “join point”(s),

Put in your postcode, out comes the data: A Case Study 13
Fig. 4. Displaying expenses data for a selected British Member of Parliament.
to compose them together to form a linked integrated view. Several issues andchallenges needed to be solved to build an integrated view of these disparatedatasets.
5.1 Challenges in Data Publication
1. Although there is an increase in the amount of public data being madeavailable, there is still a paucity of data in the right formats. Most data arestill in HTML, PDF, and XLS formats, publishing and re-publishing thesedata in linked form will be very useful,
2. Many of these disparate datasets may not cover the same temporal intervals.This may make comparison over time complex. Most of the missing data arelikely to be stored in hard-to-reach places in their respective governmentdepartments. As more of them are published, future temporal interval mis-alignments will be mitigated,
3. Data/Instance (Ontology) Alignment. Whenever there is more than one wayto structure a body of data, there will be data and semantic heterogene-ity when they are joined together. Because they are more flexible, semi-structured data exacerbates this problem, and as there will be more of them,the linked data cloud will add to this. Various mechanisms have addressedthese problems. Semi-automatic mechanisms use an admixture of human andsoftware, e.g. see [12], while fully automated methods, such as [13], aim todiscover data and schema overlaps with no human intervention. We did notuse any automatic methods in this exercise, and used mainly manual meth-ods. Linking datasets required us to resort to string matching. This method
14 Authors Suppressed Due to Excessive Length
is certainly unscalable to hundreds and thousands of linked datasets that areexpected to come on stream in the next few years.
5.2 Challenges in Data Consumption
1. One of the biggest challenges we experienced was the low level of inter-operability between the user interface (UI) and the underlying data. Thismeant that data consumption was not direct and needed to be convertedand re-modelled in order to be shown in the UI. This conversion, however,was not straightforward as we had to frequently query the store and use aproxy to construct an entirely new data model for the UI. This highlightstwo important issues pertaining to UI over heterogeneous data:(a) The lack of UIs to quickly browse, search or visualise views on a wide
range of differently modelled data, and(b) Suitable tools which allow efficient aggregation and presentation of data
to the UI from multiple datasets. The efficient and scalable retrieval ofresources is particularly important for UIs which change views and re-quire frequent querying of various datasets. Some approaches to tacklingthis problem were described in [11].
2. In the real world, the data publishers and consumers may be different en-tities, and this is what we enforced in our case study. Our data consumershad partial knowledge of the domain and found it difficult to understand thedomain and the data being modelled. This is best illustrated in the case ofthe hierarchy of the administrative geography. Some constituencies can bemapped into the administrative region of counties, while some are parts ofcounties. Querying or browsing the data did not help in this instance. Thispoints out the need for a mechanism, or a toolset, that helps developers givebetter description of the domain being modelled,
We have re-published the data we generated into the linked data cloud34. Re-solving data and schema heterogeneity is a heuristic semi-automatic process. Infuture work, we aim to explore the application of data mining techniques toreduce the time it takes a human expert to align instances and/or schema. Wehave built a backlinking service35 to the Linking Open Data cloud. We aim tofurther integrate the backlinking service to our datasets. In addition, we aim toprovide an efficient scalable user interface able to visualise and search multipledatasets.
6 Acknowledgements
This work was supported by the EnAKTing project, funded by EPSRC projectnumber EI/G008493/1. We thank Gianluca Correndo, Ian Millard, and HughGlaser for their contributions.
34 mortality.psi.enakting.org, nhs.psi.enakting.org, crime.psi.enakting.org35 backlinks.psi.enakting.org
Put in your postcode, out comes the data: A Case Study 15
References
1. Tim Berners-Lee and Nigel Shadbolt: Put in your postcode, outcomes the data. in “The Times” Nov 18, 2009 (Available from:http://www.timesonline.co.uk/tol/comment/columnists/guest contributors/article6920761.ece.Last accessed 13 Dec. 2009)
2. Alani Harith, Dupplaw David, Sheridan John, O’Hara Kieron, Darlington John,Shadbolt Nigel, and Tullo Carol: “Unlocking the Potential of Public Sector Infor-mation with Semantic Web Technology”. pub. Lecture Notes in Computer Science,vol. 4825/2008, 2007
3. Ordnance Survey Data: http://data.ordnancesurvey.co.uk/4. S. Harris, N. Lamb, and N. Shadbolt: 4store: The Design and Implementation of
a Clustered RDF Store. In The 5th International Workshop on Scalable SemanticWeb Knowledge Base Systems (SSWS2009).
5. M. Hausenblas, W. Halb, Y. Raimond, L. Feigenbaum, and D. Ayers: SCOVO:Using Statistics on the Web of Data. In European Semantic Web Conference 2009(ESWC 2009).
6. T. Tiropanis, H. Davis, D. Millard, M. Weal, S. White, and G. Wills: SemanticTechnologies for Learning and Teaching in the Web 2.0 era - A survey. In Web-Sci’09: Society On-Line, 2009.
7. G. Kobilarov, T. Scott, Y. Raimond, S. Oliver, C. Sizemore, M. Smethurst, C.Bizer, and R.Lee: Media Meets Semantic Web - How the BBC Uses DBpedia andLinked Data to Make Connections. In 6th European Semantic Web Conference,ESWC 2009, pp. 723-737. pub. Springer, 2009.
8. O. Hassanzadeh and M. Consens: Linked Movie Data Base. In Linked Data on theWeb (LDOW2009).
9. C.Bizer, R. Cyganiak, and T. Heath: How to Publish Linked Data on the Web.http://www4.wiwiss.fu-berlin.de/bizer/pub/LinkedDataTutorial/
10. M. Hausenblas: Linked Data Applications - The Genesis And The Challenges ofUsing Linked Data On The Web. DERI TECHNICAL REPORT 2009-07-26, July2009.
11. D. Smith and m. schraefel: Interactively using Semantic Web knowl-edge: Creating scalable abstractions with FacetOntology. Unpublished.http://eprints.ecs.soton.ac.uk/17054/ (Last accessed 2009-12-19).
12. Y. Kalfoglou and M. Schorlemmer: Ontology mapping: the state of the art. In TheKnowledge Engineering Review Journal, vol. 18, 2003.
13. M. Salvadores, G. Correndo, B. Rodriguez-Castro, N. Gibbins, J. Darlington, andN. Shadbolt: LinksB2N: Automatic Data Integration for the Semantic Web. InInternational Conference on Ontologies, DataBases, and Applications of Semantics(ODBASE 2009).