publication of results 1st hy / 2021 - Palfinger AG
30
PALFINGER Presentation of Results 1st HY / 2021 Vienna, July 30, 2021 PUBLICATION OF RESULTS 1ST HY / 2021
-
Upload
khangminh22 -
Category
Documents
-
view
1 -
download
0
Transcript of publication of results 1st hy / 2021 - Palfinger AG

PALFINGER Presentation of Results 1st HY / 2021
Vienna, July 30, 2021
PUBLICATION OF RESULTS 1ST HY / 2021

PALFINGER Presentation of Results 1st HY / 2021
ANDREAS KLAUSER
CEO
21-07-30

PALFINGER Presentation of Results 1st HY / 2021 3
1st HY/2021 at a glance
RECORD YEAR
ON TRACK
2021
STRESSED SUPPLY CHAIN
AS LIMITING FACTOR
1st half yearWORLDWIDE MARKET CONDITIONS
REMAIN VERY POSITIVE IN MANY SEGMENTS
BEST QUARTERLY REVENUE AND RESULTS IN
PALFINGER’S HISTORY IN Q2
21-07-30
PALFINGER Presentation of Results 1st HY / 2021 4
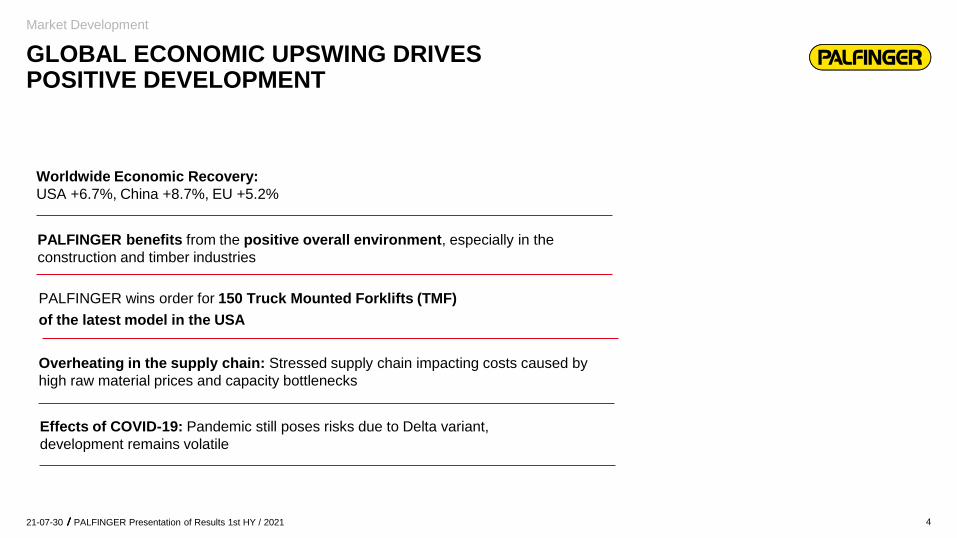
Effects of COVID-19: Pandemic still poses risks due to Delta variant,
development remains volatile
Worldwide Economic Recovery:
USA +6.7%, China +8.7%, EU +5.2%
PALFINGER benefits from the positive overall environment, especially in the
construction and timber industries
Overheating in the supply chain: Stressed supply chain impacting costs caused by
high raw material prices and capacity bottlenecks
GLOBAL ECONOMIC UPSWING DRIVESPOSITIVE DEVELOPMENT
Market Development
PALFINGER wins order for 150 Truck Mounted Forklifts (TMF)
of the latest model in the USA
21-07-30

OWN DIGITAL FORMAT IS A GLOBAL SUCCESS
PALFINGER WORLD TOUR 2021
Continuation of interactive online event, the PALFINGER World Tour,
connected customers and partners from all over the world
8,700 views and over 11,100 registrations
from more than 70 countries
Presentation of innovative product solutions and regional
requirements under the tagline “Challenge Accepted”
Three regions in three days: MARINE, LATAM, NAM
PALFINGER Presentation of Results 1st HY/202121-07-30

SUSTAINABILITY IS A CORE ELEMENT OF OUR STRATEGY AND OUR DAILY ACTIVITIES
Responsible Employer Eco-efficient Production
Sustainable ProductsFair Business and Governance
Corporate responsibility
PALFINGER Presentation of Results 1st HY/202121-07-30
Sustainability Council established to secure implementation of ESG strategy

PALFINGER AG 7
PALFINGER GLOBALLY WELL POSITIONED
EUR > 1.75 billion targeted revenue in 2021
More than 11,600 employees
34 production sites & around 5,000
service centers worldwide
Revenue split (1st HY 2021)64% EMEA
20% NAM
4% LATAM
5% APAC
7% CIS
21-07-30 PALFINGER Presentation of Results 1st HY/2021
PALFINGER at a glance
PALFINGER Presentation of Results 1st HY / 2021 8
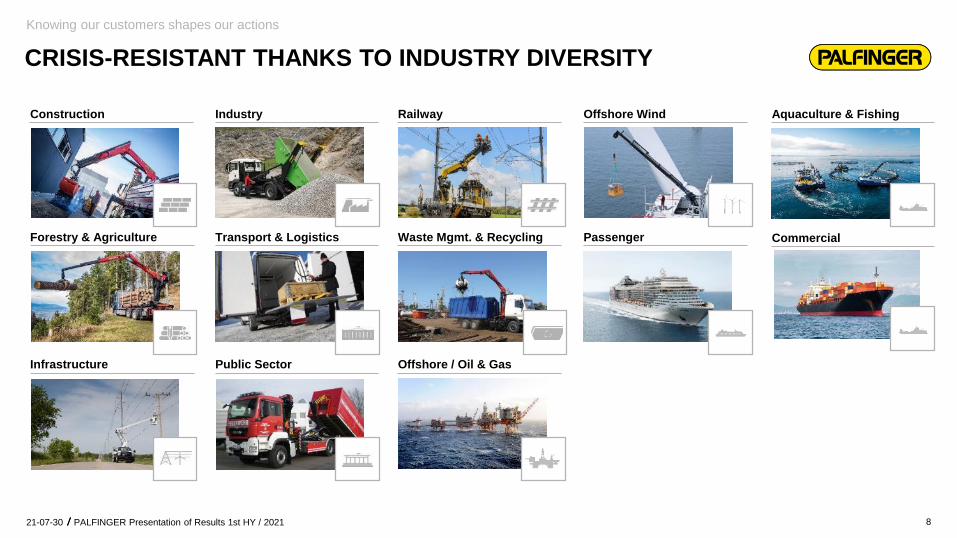
CRISIS-RESISTANT THANKS TO INDUSTRY DIVERSITY
Knowing our customers shapes our actions
IndustryConstruction
Forestry & Agriculture
Infrastructure
Railway
Waste Mgmt. & RecyclingTransport & Logistics
Public Sector Offshore / Oil & Gas
Aquaculture & FishingOffshore Wind
Passenger Commercial
21-07-30

PALFINGER Presentation of Results 1st HY / 2021 9
INNOVATIVE AND POWERFUL PRODUCT PORTFOLIO
Technology as a driving force
PASSENGER
SYSTEMSACCESS
PLATFORMS
RAILWAY
SYSTEMS
TURNKEY
SOLUTIONS
DAVITS BOATSWIND
CRANESTRUCK-MOUNTED
FORKLIFTS
OFFSHORE
CRANES
MARINE
CRANES
WINCHESLOADER
CRANES
TIMBER &
RECYCLING
HOOKLIFTS &
SKIP LOADERS
TAIL
LIFTS
BRIDGE
INSPECTION &
MAINTENANCE
21-07-30
Technology as a driving force

PALFINGER Presentation of Results 1st HY / 2021 10
PALFINGER INVESTS IN DIGITALIZATION
PALFINGER Digitalization
IT Digital Backbone
Business with DataStrucInspect
Digital end-to-end
Processes
Digital CustomerSmart Services
Smart Lifting Solutions
Autonomous Systems
Telematics
Electrification
21-07-30

PALFINGER Presentation of Results 1st HY / 2021
FELIX STROHBICHLER
CFO
21-07-30

PALFINGER Presentation of Results 1st HY / 2021 12
SEGMENT
SALES & SERVICE
21-07-30

PALFINGER Presentation of Results 1st HY / 2021 13
PALFINGER BENEFITS FROM STRONG TAILWIND FROM THE MARKET
Segment Sales & Service
01
02
Record order intake in all regions, resulting in record order book level
Good product mix leads to profitability above record half year 2019
03 Price increases reflected in this segment
04Service business in Region Marine severely impacted by COVID-19, improvements expected in the coming months
30/07/21

PALFINGER Presentation of Results 1st HY / 2021 14
in EUR million 1st HY/2020 1st HY/2021 Δ%
External revenue 683.0 823.9 +20.6%
EBITDA 75.1 99.7 +32.8%
EBIT 49.9 82.5 +65.3%
EBIT margin 7.3% +10.0% –
PROFITABILITY AT DOUBLE-DIGIT LEVEL
Segment Sales & Service
21-07-30

PALFINGER Presentation of Results 1st HY / 2021 15
SEGMENT
OPERATIONS
21-07-30

PALFINGER Presentation of Results 1st HY / 2021 16
PRODUCTION SITES WORKING AT FULL CAPACITY
Segment OPERATIONS
01
02
SAP S/4 HANA implemented at 8 EMEA production sites for 1,200 users
Good economic situation leads to improved revenue from manufacturing for third parties
03 Production sites working at full capacity as a result of high order intake introduced special shift system
04 Stressed internal and external supply chain
30/07/21
05 Higher material costs will impact this segment in 2nd half year

PALFINGER Presentation of Results 1st HY / 2021 17
in EUR million 1st HY/2020 1st HY/2021 Δ%
External revenue 46.8 60.2 +28.6%
EBITDA 20.0 44.8 +124.0%
EBIT 2.2 27.6 +1,154.5%
FULL CAPACITY UTILIZATION LEADS TO STRONG INCREASE IN PROFITABILITY
Segment OPERATIONS
21-07-30

PALFINGER Presentation of Results 1st HY / 2021 18
UNIT
HOLDING
21-07-30

PALFINGER Presentation of Results 1st HY / 2021 19
in EUR million 1st HY/2020 1st HY/2021 Δ%
EBITDA -10.2 -11.3 +10.8%
EBIT -13.4 -18.0 +34.3%
LABOR MARKET CONDITIONS SLOW DOWN INVESTMENT IN STRATEGIC INITIATIVES
HOLDING unit
21-07-30

PALFINGER Presentation of Results 1st HY / 2021 20
PALFINGER
GROUP
21-07-30

PALFINGER Presentation of Results 1st HY / 2021 21
in EUR million 1st HY/2019 1st HY/2020 1st HY/2021Δ%
2020/21
Revenue 893.4 729.8 884.1 +21.1%
EBITDA 120.1 84.9 133.5 +57.2%
EBITDA margin 13.4% 11.6% +15.1% -
EBIT (operating result) 83.3 38.7 92.1 +137.8%
EBIT margin 9.3% 5.3% +10.4% -
Consolidated net result 43.6 15.1 56.1 +271.1%
In accordance with IFRS, slight rounding differences possible.
PROFITABILITY SIGNIFICANTLY BETTER THAN RECORD HY 2019 DESPITE CYBERATTACK
PALFINGER Group
21-07-30

PALFINGER Presentation of Results 1st HY / 2021 22
32,9
45,9
40,2
30,0
43,0
28,431,6
36,9
46,1
41,4
0
5
10
15
20
25
30
35
40
45
50
1st HY/2017 1st HY/2018 1st HY/2019 1st HY/2020 1st HY/2021
1)
Net Investments
Depreciation, amortization and
impairment1) Including additions from leasing (IFRS 16); excluding divestment of 2.5% from Sany Lifting Solutions (EUR 28.6 million).
In accordance with IFRS, slight rounding differences possible.
BIGGEST INVESTMENT PROGRAM EVER IN IMPLEMENTATION
PALFINGER Group
21-07-30

PALFINGER Presentation of Results 1st HY / 2021 23
in EUR million 06/30/2019 06/30/2020 06/30/2021
Financial liabilities (FV) 1) 621.6 572.0 491.2
Financial receivables 51.6 77.7 105.1
Net financial debt 570.1 494.3 386.1
Ø interest debt FV 2) 1.65% 1.49%2) 1.35%
Avg. remaining term debt 4.49 years 4.43 years 3.55 years
Equity 589.6 622.9 669.2
2) Excluding currency hedging costs.
In accordance with IFRS, slight rounding differences possible.
1) Including EUR 56.8 million leasing liabilities according to IFRS 16 (06/2020: EUR 55.6 million)
SUSTAINABLE REDUCTION OF NET FINANCIAL DEBT DUE TO OPTIMIZED WORKING CAPITAL MANAGEMENT
PALFINGER Group
21-07-30

PALFINGER Presentation of Results 1st HY / 2021 24
06/30/2019 06/30/2020 06/30/2021
Equity ratio 35.8% 38.8% 39.3%
Gearing 96.7% 79.4% 57.7%
Net debt/EBITDA 2.66 2.62 1.63
VERY STRONG BALANCE SHEET STRUCTURE – NETDEBT / EBITDA RATIO AT BEST LEVEL SINCE 2007
In accordance with IFRS, slight rounding differences possible.
PALFINGER Group
21-07-30

PALFINGER Presentation of Results 1st HY / 2021 25
in EUR million 1st HY/2019 1st HY/2020 1st HY/2021
EBTDA 111.8 76.5 129.0
+/- non-cash income from at-equity companies -6.1 -1.5 -4.5
+/- change in working capital -28.9 -6.3 -28.9
+/- cash flow from tax payments -19.0 -2.7 -13.7
Cash flow from operating activities 57.8 66.0 81.9
+/- cash flow from investing activities -10.5 -27.9 -45.1
Cash flow after changes in working capital and investments 47.3 38.1 36.8
+/- cash flow from interest on borrowings adjusted for tax expenditure 5.1 4.7 4.2
Free cash flow 52.4 42.8 41.0
In accordance with IFRS, slight rounding differences possible.
GOOD PROFITABILITY LEADS TO STRONG CASH FLOW
PALFINGER Group
21-07-30
1) Including divestment of 2.5% from Sany Lifting Solutions (EUR 28.6 million)
1)

PALFINGER Presentation of Results 1st HY / 2021
OUTLOOK 2021
ANDREAS KLAUSER
21-07-30

PALFINGER Presentation of Results 1st HY / 2021 27
Positive market environment and full order books provide
good visibility until year end
Target for 2021: Revenue above EUR 1.75 billion
EBIT above EUR 150 million
Historic investment volume in 2021 of over EUR 100 million in implementation;
additionally, PALFINGER acquires corporate headquarters in Bergheim
Planned reversal of cross-holding with SANY increases headroom for
investments and strategic acquisitions
2021: RECORD YEAR ON TRACK
Outlook 2021
Limitations in the supply chain, high raw material prices,
capacity bottlenecks and COVID-19 are risk factors
21-07-30

PALFINGER Presentation of Results 1st HY / 2021 28
average EBIT margin over the
economic cycle
average ROCE over the economic
cycle
FINANCIAL TARGETS 2024 #1EUR 2 billion 10% 10%
Revenue from organic growth
MARKET LEADER FOR CRANE AND LIFTING SOLUTIONS
CLEAR STRATEGY TO ACHIEVE MID-TERM FINANCIAL TARGETS BY 2024 AT THE LATEST
Financial targets 2024
21-07-30

PALFINGER Presentation of Results 1st HY / 2021
STAY HEALTHY!

This presentation includes forward-looking statements based on all currently available information. Actual
developments may therefore differ from the expectations depicted.
+43 662 2281-81008
+43 662 2281-81006
+43 662 2281-81100
ANDREAS KLAUSER FELIX STROHBICHLER HANNES ROITHER
CEO CFO Group spokesperson
PALFINGER AG
Lamprechtshausener Bundesstraße 8
5101 Bergheim
www.palfinger.ag
INVESTOR RELATIONS AND PRESS CONTACT