(Public Pack)Agenda Document for Overview & Scrutiny ...
384
Overview & Scrutiny Committee Date: Monday 8 March 2021 Time: 10.00 am Public meeting Yes Venue: This meeting will be held virtually via Microsoft Teams Click here to view the meeting. Membership Councillor Lisa Trickett (Chair) Birmingham City Council Councillor Cathy Bayton (Vice-Chair) Association of Black Country Authorities Councillor Naeem Akhtar Coventry City Council Councillor Ahmad Bostan Sandwell Metropolitan Borough Council Paul Brown Black Country Local Enterprise Partnership Councillor Chris Cade Warwickshire Non-Constituent Local Authorities Councillor Dean Carroll Shropshire Non-Constituent Local Authorities Councillor Mike Chalk Worcestershire Non-Constituent Local Authorities Councillor Peter Fowler Birmingham City Council Councillor Robert Grinsell Joint Coventry/Solihull Representive Councillor Angus Lees Dudley Metropolitan Borough Council Mike Lyons Greater Birmingham & Solihull Local Enterprise Partnership Councillor Suky Samra Walsall Metropolitan Borough Council Councillor Lucy Seymour-Smith Birmingham City Council Councillor Stephen Simkins Association of Black Country Authorities Councillor Paul Sweet City of Wolverhampton Council Councillor Diane Todd Staffordshire Non-Constituent Authorities Councillor Kate Wild Solihull Metropolitan Borough Council Sarah Windrum Coventry & Warwickshire Local Enterprise Partnership Quorum for this meeting shall be 13 members If you have any queries about this meeting, please contact: Contact Tanya Patel, Governance Services Officer Telephone 0121 214 7689 Email [email protected] Public Document Pack
-
Upload
khangminh22 -
Category
Documents
-
view
2 -
download
0
Transcript of (Public Pack)Agenda Document for Overview & Scrutiny ...

Overview & Scrutiny Committee
Date: Monday 8 March 2021
Time: 10.00 am Public meeting Yes
Venue: This meeting will be held virtually via Microsoft TeamsClick here to view the meeting.
MembershipCouncillor Lisa Trickett (Chair) Birmingham City CouncilCouncillor Cathy Bayton (Vice-Chair) Association of Black Country AuthoritiesCouncillor Naeem Akhtar Coventry City CouncilCouncillor Ahmad Bostan Sandwell Metropolitan Borough CouncilPaul Brown Black Country Local Enterprise PartnershipCouncillor Chris Cade Warwickshire Non-Constituent Local AuthoritiesCouncillor Dean Carroll Shropshire Non-Constituent Local AuthoritiesCouncillor Mike Chalk Worcestershire Non-Constituent Local
AuthoritiesCouncillor Peter Fowler Birmingham City CouncilCouncillor Robert Grinsell Joint Coventry/Solihull RepresentiveCouncillor Angus Lees Dudley Metropolitan Borough CouncilMike Lyons Greater Birmingham & Solihull Local Enterprise
PartnershipCouncillor Suky Samra Walsall Metropolitan Borough CouncilCouncillor Lucy Seymour-Smith Birmingham City CouncilCouncillor Stephen Simkins Association of Black Country AuthoritiesCouncillor Paul Sweet City of Wolverhampton CouncilCouncillor Diane Todd Staffordshire Non-Constituent AuthoritiesCouncillor Kate Wild Solihull Metropolitan Borough CouncilSarah Windrum Coventry & Warwickshire Local Enterprise
Partnership
Quorum for this meeting shall be 13 members
If you have any queries about this meeting, please contact:
Contact Tanya Patel, Governance Services OfficerTelephone 0121 214 7689Email [email protected]
Public Document Pack

AgendaPage 2 of 3
AGENDANo. Item Presenting Pages
Meeting Business Items
1. Apologies for Absence Chair None
2. Declarations of InterestsMembers are reminded of the need to declare any disclosable pecuniary interests they have in an item being discussed during the course of the meeting. In addition, the receipt of any gift or hospitality should be declared where the value of it was thought to have exceeded £25 (gifts) or £40 (hospitality).
Chair None
3. Chair's Remarks Chair None
4. Minutes - 11 January 2021 Chair 1 - 6
5. Matters Arising Committee member meeting attendance
2020/21
Chair 7 - 8
Items for Discussion
6. Economic Funding Tracker Julia Goldsworthy 9 - 12
7. Mayoral Question Time: Budget - Response from the Mayor to recommendations presented to the WMCA Board on 13 November 2020
Chair 13 - 16
8. WM2041 Five Year Plan: 2021 - 2026 Ed Cox 17 - 350
9. 'Economic Needs of the Black Country' Scrutiny Review - Summary of Findings
Councillor Ahmad Bostan
351 - 360
10. Effectiveness of Transport Delivery Committee in Overseeing the Delivery of WMCA Transport Policies - Update on Recommendations
Tim Martin 361 - 366
11. WMCA Scrutiny Review on the Effectiveness of the WMCA's Governance Structures in Delivering the Policy Objectives of the WMCA - Update on Recommendations
Tim Martin 367 - 370
12. Transport Scrutiny Sub-Committee Minutes(a) Monday 22 February 2021
Councillor Cathy Bayton
371 - 376
13. Forward Plan Lyndsey Roberts 377 - 380

AgendaPage 3 of 3
(a) WMCA Board

This page is intentionally left blank

Overview & Scrutiny Committee
Monday 11 January 2021 at 2.00 pm
Minutes
PresentCouncillor Lisa Trickett (Chair) Birmingham City CouncilCouncillor Ahmad Bostan Sandwell Metropolitan Borough CouncilPaul Brown Black Country Local Enterprise
PartnershipCouncillor Peter Fowler Birmingham City CouncilCouncillor Robert Grinsell Joint Coventry/Solihull RepresentativeCouncillor Angus Lees Dudley Metropolitan Borough CouncilCouncillor Lucy Seymour-Smith Birmingham City CouncilCouncillor Stephen Simkins Association of Black Country AuthoritiesSarah Windrum Coventry & Warwickshire Local
Enterprise Partnership
In AttendanceMubasshir AjazGareth Bradford West Midlands Combined AuthorityDeborah Cadman West Midlands Combined AuthorityEd Cox West Midlands Combined AuthorityDan Essex West Midlands Combined AuthorityLinda Horne West Midlands Combined AuthorityTim Martin West Midlands Combined AuthorityAisha Masood Young Combined Authority Lyndsey Roberts West Midlands Combined Authority
ItemNo.
Title
93. Inquorate MeetingThe meeting was inquorate and therefore decisions taken at the meeting would be submitted to the WMCA Board on 12 February 2021 for formal approval.
94. Apologies for AbsenceApologies for absence were received from Councillor Cathy Bayton (Association of Black Country Authorities), Councillor Naeem Akhtar (Coventry City Council), Councillor Chris Cade (Warwickshire Non-Constituent Authorities), Councillor Dean Carroll (Shropshire Non-Constituent Local Authorities), Councillor Suky Samra (Walsall Metropolitan Borough Council) and Councillor Diane Todd (Staffordshire Non-Constituent Local Authorities).
Page 1
Agenda Item 4

95. Declarations of InterestsCouncillor Stephen Simkins declared that he was the City of Wolverhampton Council’s Cabinet Member for City Economy.
96. MinutesThe minutes of the meetings held on 2 November 2020, 23 November 2020 and 11 December 2020 were agreed as a correct record.
97. Matters ArisingThe committee expressed their disappointment in not being able to achieve the level of quoracy for the majority of committees taken place this municipal year. The Chair requested that the Monitoring Officer, Scrutiny Officer and Governance Services Manager report back at the next meeting any new potential mechanisms in order to achieve quoracy going forward.
98. Mayoral Question Time: Policy - Response from the Mayor to Recommendations presented to the WMCA Board on 13 November 2020The committee noted the response received from the Mayor is respect of the issues it had identified following the Policy Q&A on 16 October 2020.
The Chair expressed her concern as to whether the response reflected the reality of the lived experienced of the neediest within the communities of the region and highlighted a concern of the region having to continue to bid for funds from Government. She sought clarity as to how the Adult Education Budget were targeted towards the benefit of the BAME community and how that fund was closing inequalities within the region.
Councillor Stephen Simkins felt that the COVID-19 pandemic had exposed weaknesses across the region but felt that should be taken forward in a positive light to progress and make changes. He felt that the Mayor’s response had not included on how best scrutiny could add value to future schemes / policies. He indicated that all future policies should address the inequalities across the region whilst tackling deprivation.
Councillor Ahmad Bostan felt that greater understanding of the WMCA work in respect of the skills agenda targeting BAME communities was required as he felt that this area was often neglected. Councillor Angus Lees felt that all both the WMCA and local authorities needed to work in partnership to address the future regeneration of the region as he felt this was currently done in isolation. Councillor Stephen Simkins wanted to see the WMCA plan and deliver initiatives targeted at education and skills in ensure providers achieved targets and ensured those within the region had opportunities to access formal education. Councillor Angus Lees noted that level of non-school ready children was high in the region and suggested that the education process from start to finish was looked at further.
Page 2

The Chief Executive reported that the Senior Leadership Team had focused on the key deliverables for each portfolio and expressed commitment to deliver on each of those in joint partnership with local authorities, acknowledging and accepting the challenges arising from the COVID-19 pandemic and highlighting that a youth employment taskforce had been implemented to tackle and address some of the challenges young people faced. The Chief Executive stressed that the Recovery Co-ordination Group continued to look at the community recovery prospectus and have committed to continue the recovery work and push forward with the economic recovery asks to Government.
99. The Health of the Region 2020 - Regional Health Impact COVID-19The committee received a presentation from the Director of Inclusive Growth & Public Service Reform on the health and wellbeing inequalities and impacts of the COVID-19 pandemic in the West Midlands. Information was provided on the regional health impact of COVID-19 which was concluded by a task and finish group formed of representatives from WMCA, Public Health England, local authorities, NHS, universities and the voluntary and community sector. The report highlighted a higher likeliness of death from COVID-19 in BAME communities compared to white population.
Councillor Ahmad Bostan welcomed the report and requested that the committee had oversight on the various streams being set up to address and improve outcomes for the BAME communities. He felt that the report lacked comments on adequate housing as this impacted on health inequalities and provided an example of those families with gardens and being able to go out and exercise and other families not being any to have access. He also suggested a link between physical health and mental health as well as further work to address the meaning of BAME and which communities were included as not all communities shared all commonalities.
Councillor Lucy Seymour-Smith sought information on initiatives for ‘invisible’ illnesses and those infants missing out of baby classes and socialization and the effects that may have, also highlighting the need for consideration of families in temporary housing and those younger children who experienced family bereavement.
The Director of Inclusive Growth & Public Service Reform highlighted the progress in engaging with partners and integrated care systems to target health inequalities and achieve key outputs. He also felt that housing was a key contributing factor to health inequalities and felt that the commitments outlined in the report sought to address this.
Recommended to the WMCA Board that:
(1) The presentation be noted.
(2) The comments made by the committee be noted.
Page 3

100. Housing & Land Portfolio UpdateThe committee received a presentation from the Director of Housing & Regeneration on the role of the Housing & Land Delivery Board, terms of referenced for the board, the deliverables of the board, the progress of funds the board had received and information relating to the COVID-19 recovery plan.
The Chair expressed her concern on the number of families in temporary housing and overcrowded hostels and bed & breakfast accommodation across the region. She understood from previous discussions that this was not the responsibility of the WMCA but felt it should be playing a strategic part in housing in terms of responding to the needs of the region and playing an enabling and supportive role. She also felt that homelessness and adequate living conditions should be items for consideration of policies being brought forward.
Councillor Stephen Simkins expressed his disappointment that full allocations had not been received with his local authority from Government on applications made for future development on high streets / town centres and therefore would look to the WMCA to develop those worthy schemes. He hoped that future applications to Government would not consist of bidding but move towards more a strategic assessment of need. Councillor Stephen Simkins suggested that future scrutiny work focused on future housing proposals being taken forward by the WMCA to enable the committee to add value to those proposals.
The Director of Housing & Regeneration commented that the team had already been approach be a number of local authorities in regard to future high street / town centre funds and sought to support them in addressing their funding gaps and bring forward future schemes. He also stressed that himself and other relevant officers within the organisation continued to push Government on the flexibility of funding deployment and had seen some flexibility in criteria of new funds.
Recommended to the WMCA that:
(1) The presentation be noted.
(2) The comment made by the committee be noted.
101. Transport Scrutiny Sub-Committee MinutesThe committee consider the minutes of the Transport Scrutiny Sub-Committee held on the 30 November 2020.
Councillor Peter Fowler referenced the minutes and sought further information on the use of average speed cameras within communities and what initiatives were taking place to address pavement parking.
Recommended to the WMCA Board:
The minutes of the meeting held on 30 November 2020 be approved.
Page 4

102. Forward PlanThe committee noted a forward plan of items that were to be reported to future meetings of the committee and the WMCA Board.
103. Date of the next meetingMonday 8 March 2021 at 10.00am.
The meeting ended at 4.15 pm.
Page 5

This page is intentionally left blank

Attendance at Overview & Scrutiny Committee 2020/21
Committee Member Representing Jun. Jul. Sep. Oct. Nov. Nov. Dec. Jan. Mar.
Councillor Naeem Akhtar Coventry
Councillor Cathy Bayton Black Country Authorities
Paul Brown Black Country LEP
Councillor Ahmad Bostan Sandwell
Councillor Chris Cade Warwickshire
Councillor Dean Carroll Shropshire
Councillor Mike Chalk Worcestershire
Councillor Brian Douglas-Maul Walsall - - -Councillor Peter Fowler Birmingham
Councillor Robert Grinsell Coventry/Solihull
Councillor Angus Lees Dudley
Mike Lyons Greater Birmingham & Solihull LEP
Councillor Sukhy Samra Walsall - - - - -Councillor Stephen Simkins Black Country Authorities
Councillor Lucy Seymour-Smith Birmingham
Councillor Paul Sweet Wolverhampton
Councillor Diane Todd Staffordshire
Councillor Lisa Trickett Birmingham
Councillor Kate Wild Solihull
Sarah Windrum Coventry & Warwickshire LEP
Green shading means the meeting was quorate
Red shading means the meeting was inquorate
Page 7
Agenda Item
5

This page is intentionally left blank

Covid-19: Economic recovery asks and funding
Of the 31 asks in ‘Recharge the West Midlands’, 24 propositions have been either allocated funding or are in policy areas where we believe the Government has allocated money (e.g. through the November Spending Review and Winter Economic Plan).
In addition to the schemes which were part of our £3.2 billion recovery plan, we estimate the Government has provided c£9.0bn of further support for the West Midlands over the last 12 months through schemes like grants for small businesses, furlough and additional funding for councils.
The tables below outline Government funding announcements related to:
Table 1 - Specific projects and priorities in the ‘Recharge the West Midlands’ proposition. Those secured and with a clear local/regional delivery route are in bold, to distinguish from measures delivered by other/national means.
Table 2 - Other Government funding providing emergency economic support.
Table 1 – Funding related to ‘Recharge the West Midlands’ Regional asks Funding package, statements and indications
[GBF = £66m allocation for Getting Building Fund]Create green manufacturing jobs
Project GREAT (£85m) Gigafactory (£250m) EV charging (£35m) Very Light Rail - VLR (£114m) Fuel poverty and regional retrofit
programme (£100m) Repowering the Black Country
(£30m)
Verbal support for the Gigafactory proposal – the Prime Minister said: “the whole of the West Midlands is now a global centre of battery technology and batteries for EVs and that is the vision of Mayor Andy Street, and we will back that vision”. Government set aside £500m towards a UK Gigafactory and joint venture partnership established between Coventry City Council and Coventry Airport Ltd.
£1bn national Automotive Transformation Fund, with £500m national programme for electric vehicle charging.
£14.115m for VLR schemes in Dudley and Coventry [GBF] A national £2bn "green homes grant" programme to help make homes
more energy efficient and £1bn to improve energy efficiency of public buildings.
Repowering the Black Country was one of six projects funded through the Industrial Decarbonisation Challenge in January 2021.
Maximise job creation UK Central (£95m) Curzon Street / Digbeth (£131m) Cultural Catalyst (£80m)
£9.96m for completing the cultural capital project in Coventry and the Commonwealth Games economic legacy for the Ricoh Arena [GBF]
£23.3m for cultural assets from the Cultural Recovery Fund £3m from GBSLEP for the Creative Content Hub Spending Review: £118.5m one-year Birmingham Commonwealth
Games funding to support the games in 2022 and funding from the Cultural Investment Fund for Coventry’s UK City of Culture 2021 programme.
Invest in healthcare innovation Birmingham Life Sciences Park
(£60m) ReSCue (£54m) Grand Central Diagnostic Hub
(£13m) Radical Health Prevention Fund
(£10m)
£10.86m – Precision Health Tech Accelerator, part of Birmingham Life Sciences Park [GBF]
Spending Review: £325m for the NHS to invest in new diagnostics equipment and £559m to support the modernisation of technology across the health and care system
Build better digital and transport links Metro (£101m) Sprint (£61) WMRP (£84m) Local connectivity (£86m) Fibre (£16m) 5G Accelerator (£28m)
£15.1m for University Station [GBF] £1m for WM5G application accelerator [GBF] £11m for Dudley Interchange [TCF and Integrated Transport Block] £24m for Birchley Island [MRN funding] Spending Review: £4bn “Levelling Up Fund” to invest in local
infrastructure plus confirmation of £4.2bn five-year, consolidated intra-city transport settlements for mayoral combined authorities from 2022/3, with £50m for MCAs in 2021/2 for preparatory work.
Spending Review: £300m in 2021/22 for bus services, covering Covid support and transformation. A further £120m in 2021/22 for cleaner, greener, quieter zero emission buses.
Page 9
Agenda Item 6

Regional asks Funding package, statements and indications[GBF = £66m allocation for Getting Building Fund]
Spending Review: £200m to continue flagship digital infrastructure programmes, including Local Full Fibre Networks and the 5G Testbeds and Trials Programme.
Regenerate brownfield sites and build new homes
Urban Transformation Fund (£200m)
National Brownfield Institute (£24m)
Affordable Housing (£400m) Advanced Methods of
Construction (£50m)
£14.875m for National Brownfield Land Institute [GBF] £84m of the Brownfield Fund allocated to the WMCA, with a further
£24m secured through the competitive element. £12bn national programme to build 180,000 new affordable homes. £50m national funding set aside for Advanced Manufacturing in
Construction factories and market development costs.
Get people back into work Supporting young people - one off
support (training, tracking, wage subsidy) (£272m)
Getting the West Midlands back to work (£33m)
Future Skills, Future Jobs (£60m) Future Skills, Future Jobs (FE
capital plan) (£185m)
A Plan for Jobs 2020 speech: Kickstart Scheme – £2bn work experience programme for 16-24 year
olds that have been unemployed for more than six months. £1.4bn to increase Job Centre Plus capacity and double work coach
numbers. Spending Review: £2.9bn Restart scheme to help more than one million
unemployed people find work - £400m in 2020/21. Additional £9m for lifetime skills guarantee to develop level 3 skills.
Payment of £2,000 to employers in England for each new apprentice they hire aged under 25, and a £1,500 payment for each new apprentice they hire aged 25 and over. A further £111m extra will be added to the traineeship budget, employers will be paid £1,000 per trainee.
£200m for college improvements and £72m in 2021/22 to support the commitment to build 20 Institutes of Technology
£32m over two years for the National Careers Service to fund careers advice for 269,000 more people.
Spending Review: £375m from the National Skills Fund in 2021/22. And £17m to expand sector based work academies.
For the West Midlands: £2.0m for West Midlands digital retraining £5.2m more for West Midlands Adult Education Budget for 2020/21 £2.6m for high value courses for 18 and 19 year olds
o £2.6m for sector based work academiesBack our region’s businesses
Speed to Scale Region (£382m) Restart, reposition and transform
(£60m) Productivity Factory (£90m) Enterprise Investment Growth
Fund
£1.9m confirmed for extending the ‘Made Smarter’ pilot to the West Midlands in 2021/22.
£20m for Growth Hubs nationally, including £1.5m allocated to West Midlands LEPs/Growth Hubs.
Spending Review: £557.5m capital funding for the British Business Bank, including new instruments.
Spending Review: £11.1bn R&D funding (out of an overall government R&D package of £14.6bn). This will include a further £400m for UKRI for core science and £350m for UKRI to support strategic government priorities and the whole research and innovation ecosystem.
Total £244.8m secured directly for the West Midlands, plus opportunities to secure more investment via national programmes
Source of funding: Getting Building Fund A Plan for Jobs Other national interventions
Table 2 – West Midlands uptake of major national funding support
Funding DetailsBusiness loans1 Coronavirus Business Interruption Loan Scheme (CBILS) - £1.486bn
Bounce Back Loans (BBLS) - £3.521bn Future Fund - £18.6m
1 Across West Midlands six LEP (NUTS1 geography)Page 10

Business grants payments by Local Authorities
Grants paid by WMCA local authorities to Winter Economic Plan - £589m Grants paid by WMCA local authorities under the LRSG, ARG, Christmas
payment – around £164mLocal Authority additional funding WMCA Local Authorities - £423m across tranches of emergency funding
and council tax support grant. Furlough support Around £2.8bn in furlough payments across the 3LEP area Self-employment support2 £984m worth of claims Town centres £500,000 - £1m for each area in the towns fund to spend on improvements
to parks, high street and transport, £5.75m for the WM:o Bloxwich - £750,000o Dudley - £1,000,000o Rowley Regis - £750,000o Smethwick - £750,000o Walsall - £750,000o West Bromwich - £750,000o Wolverhampton £1,000,000
Three non-constituency towns have also received funding (Nuneaton, Redditch and Telford)
Travel £m for Travel 2020/21 o Local package to support bus and transport services (using the WMCA
transport levy)o Dedicated school services: £2m (Department for Education)o Light Rail Support: £7m (17 March 2020 to 26 March 2021)o Pothole and Challenge Fund: £17.862mo Emergency/Active Travel Fund: £17m
Other business support measures This includes Government spending that has benefited West Midlands businesses but is not able to ascertain an accurate regional figure. Examples include the “Eat out to help out” vouchers in August 2020, Business Rates relief and the temporary cut to VAT on food, accommodation and attractions from 20% to 5% for six months.
Total £9.0bn in loans, grants and other financial support Source of funding:
Government’s Support for Business A Plan for Jobs Other national interventions
2 Across West Midlands six LEP (NUTS1 geography)
Grand total for all funding £9.24bn, plus opportunities to secure more investment via national programmes
Page 11

This page is intentionally left blank

West Midlands Combined Authority, 16 Summer Lane, Birmingham, B19 3SD
Tel: 0345 303 6760 wmca.org.uk
Cllr Lisa Trickett Chair of WMCA Overview and Scrutiny Committee Cc: Members of the Overview and Scrutiny Committee
10 February 2021
Dear Cllr Trickett I’m writing in response to the comments included in the minutes of the Overview and Scrutiny meeting on the Budget, which you kindly invited me to reflect and comment upon. I understand that you have requested that I write back to you ahead of your Overview and Scrutiny meeting due to be held on the 8th March, however I thought it would be sensible to respond ahead of the WMCA Board meeting, at which the 2021/2 budget will be presented for approval. I shall address each of the committee’s comments in turn, however before doing so it’s only right that I repeat my expression of thanks to the whole WMCA team and all portfolio leaders for their contribution, especially the Portfolio Lead for Finance, Cllr Bob Sleigh and the team for their work in achieving a proposed balanced budget for 2021/2. It is a testament to everyone’s efforts that the draft budget was approved unanimously by the WMCA Board in January. The proposed budget protects our frontline services and maintains our ambitious infrastructure investments and brownfield regeneration programme, without charging our citizens any Mayoral precept for the fourth year running. This is something we should all be proud of, perhaps none more so than at these times of financial uncertainty for many. Firstly, regarding your committee’s concerns about the risks associated with the need to use reserves to achieve the proposed balanced budget for 2021/22 and the limitations of this approach in the long-term, this risk is clearly noted in the budget report. The budget report contains the appropriate statement from the WMCA’s S151 Officer and it is noted in the report that this has been discussed with our external auditors. The budget report also refers to a commitment to a full review of WMCA strategic priorities. It’s important to note that the Financial Monitoring Report and Draft Budget Report, which were both considered and approved by West Midlands Combined Authority
Page 13
Agenda Item 7

West Midlands Combined Authority, 16 Summer Lane, Birmingham, B19 3SD
Tel: 0345 303 6760 wmca.org.uk
Board on 15 January 2021, included a forecast showing a surplus position of £1.0m for 2020/21. With further income and savings secured since the completion of that forecast, the budget report includes an expectation that sufficient surplus will have been generated in the current financial year to support the earmarked use of reserves in 2021/22.
I should stress that whilst there are some uncertainties and acknowledged risks to our ability to deliver a balanced budget, I firmly believe our proposed approach is the right one. I trust that members of your committee would all share the desire to protect our front-line services and investments at this time, not least because the pandemic makes our collective role supporting our citizens and driving forward our investments in the economy more vital than ever. However, given the risks to revenue which were acknowledged when the WMCA Board approved the draft budget in January, Leaders will shortly be considering a proposal to allocate £10m from increased ‘head-room’ in the Investment Programme to provide further financial resilience.
In relation to your committee’s comments regarding the need to give early consideration to the decisions required to provide greater financial certainty and mitigate the consequences of any decisions that need to be taken, I think it’s only fair to acknowledge that many of the potential risks that may emerge are difficult to assess due to the unprecedented situation we face as a country. As I noted above, there is a clear commitment to undertake a strategic review of our activities, and to progress our business transformation project which is designed to ensure that our energies and funding remain focussed on meeting the priorities and needs of our citizens. It should also be noted that discussions have been taking place very regularly between both local authority leaders, and with the Finance Directors group, regarding the potential impact of any emerging financial pressures. In terms of ensuring that future planning and modelling should reflect and address the priorities and needs of the region and its diverse communities, I would hope that members of your committee would agree that our record here is good, whilst there is clearly more to do to ensure that as we recover from the pandemic opportunities exist for all members of the community. We have discussed previously the work of our Productivity and Skills team to raise attainment levels across the region. A significant majority of our Adult Education Budget goes to support BAME communities, such as the recent work to step up the targeting of digital training among under-represented groups. These are initiatives we hope to continue, with a recent submission of a proposal to the Department of Education for funding to extend our successful retraining pilots in digital and construction and to scale up our digital bootcamps, and extend them to more sectors such a healthcare, logistics and the ‘green’ jobs of the future.
Page 14

West Midlands Combined Authority, 16 Summer Lane, Birmingham, B19 3SD
Tel: 0345 303 6760 wmca.org.uk
You’ll be aware of the work being undertaken to ensure that we have a deep and genuine understanding of the public transport needs of our citizens so that we design services which meet their needs, whilst progressing with our plans for new stations, the metro expansion, Sprint and new travel options, such as our bike hire scheme. Our investments in transport are all about improving connectivity across the region, enabling more people to access job and other opportunities, whilst unlocking new investment across the region. All of which are being progressed while we have ensured that the WMCA’s existing public transport services have been protected during the pandemic, providing vital support to the whole community and especially those on low incomes. I mentioned earlier proposals to use the new headroom in the Investment Programme to provide the WMCA with financial resilience. Leaders will also be considering proposals to use £2m of this to enable us to invest in our ambitious plans to achieve carbon neutrality by 2041. Building on the work already underway across directorates to achieve our ambitious climate objectives, this new significant investment would provide stimulus to our efforts to secure a green recovery and provide new job opportunities for our citizens. These are just a few examples where there is a shared commitment to ensure our activities address the challenging and changing circumstances we face. I’m confident that further improving our efforts to increase skills and training, continuing to provide better public transport, and help our citizens grasp the opportunities arising from our determination to achieve carbon neutrality, will continue to form significant priorities following the strategic review to which we are committed. Regarding your committee’s desire for the WMCA to have greater flexibility over the use of its direct funding, this is an area in which we wholeheartedly agree. Our use of the Transforming Cities Fund is perhaps the primary demonstration of the speed at which we can make decisions, act flexibly and progress projects which are of benefit to the region if we are allowed to make more decisions ourselves. You will be aware that our submission to both the Comprehensive Spending Review and the forthcoming Budget focused on the need for the Government to provide greater financial freedom and sustainability for the Combined Authority and local authorities in the region, with a longer-term approach enabling us to plan ahead more effectively, and crucially to adopt the systems we require locally to meet the needs of our citizens. I mentioned in my letter to your committee following our discussion on policy, that I shared the disappointment that the Government had delayed the publication of its devolution proposals. Nonetheless in conversations with Government we continue to press the case for increased and sustainable funding to improve our ability to deliver
Page 15
West Midlands Combined Authority, 16 Summer Lane, Birmingham, B19 3SD
Tel: 0345 303 6760 wmca.org.uk
benefits for our citizens, often joining forces with our colleagues in our local authorities and in other Combined Authorities. I’ll also repeat my belief that we would all agree that local authorities have demonstrated their crucial role during the coronavirus crisis and achieved real results despite limited powers and resources, and that we must all continue to argue that central government must learn from this experience and provide us with the funding we need. And finally, in turning to your committee’s specific comments regarding the transport budget, I’m grateful that you welcomed our commitment to protect accessible and supported transport services from any reductions in service levels. The proposal I mentioned above to earmark £10m from the additional Investment Programme headroom is in large part based on an acknowledgement of the potential risks to the funding of transport and recovery of revenues, together with the enormous uncertainty facing the bus operator market throughout the country. I should add that TfWM are undertaking a great deal of work to understand the longer-term impact of the pandemic on patronage levels and they are in frequent communication with Department of Transport officials, as I am with Ministers, to ensure that we are ready to adapt accordingly and protect the services upon which so many of our citizens rely. I trust that members of your committee will consider this to have been a considered and comprehensive response to their comments, and I’m hopeful that the proposed budget, which has been influenced by your input, will be approved by the WMCA Board.
Yours sincerely
Andy Street Mayor of the West Midlands
Page 16
Overview and Scrutiny CommitteeDate 8th March 2021
Report title WM2041 Five Year Plan: 2021 - 2026
Portfolio Lead Cllr Ian Courts
Accountable ChiefExecutive
Deborah [email protected]
AccountableEmployee
Ed Cox, Director of Public Service [email protected]
Jacqueline Homan, Head of [email protected]
The text of this report is the draft text of the proposed report to WMCA Board on 19th March 2021.
Recommendation(s) for action or decision:
The WMCA Board is recommended to:
1. Receive the independent advice given to the WMCA by WSP on the first Five Year Plan.
2. Agree the need to adopt the ‘Accelerated’ scenario to deliver the first Five Year Plan and set the region on course for net zero carbon by 2041.
3. Agree the delivery plan presented in this paper to accelerate the WMCA work on net zero.
4. Agree the Investment Programme funding option to be applied to the development of priority initiatives as detailed within Section 3.
5. Note the availability of Investment Programme funding is subject to the increase in the affordable limit being approved following consideration of the Financial Monitoring Report at this Committee.
Purpose The development of the Five Year Plan (FYP) to meet the WM2041 net zero ambition has been supported by the commissioning of WSP to provide an independent evidence base as to how this might be achieved. This report summarises the independent advice and outcomes
Page 17
Agenda Item 8

from that work for the Combined Authority Board. The report also provides an outline of the next steps for delivery.
2. Background 2.1 Following the approval of WM2041: A Programme for Implementing an Environmental
Recovery in June 2020, the WMCA and stakeholders committed to producing five-year delivery plans (four in total) to indicate the programmes that would need to be put in place to deliver the overall goal of net zero carbon target for the West Midlands by 2041.
2.2 A tender was issued for consultancy support for the FYP in July 2020. This was developed with input from low carbon leads in the constituent local authorities as well as with a WMCA cross-directorate working group. WSP were awarded the contract and work began in September 2020. They have since presented updates of their work to the October 2020 and December 2020 Environment and Energy Boards, as well as Strategic Transport Board in November 2020 and Energy Capital Board in December 2020. In February 2021, the Environment and Energy Board had a special meeting to review the evidence base and WSP’s proposals for a FYP.
2.3 The FYP aims to indicate how we create the right conditions for accelerating delivery and raising ambition to position the West Midlands as a leader in addressing climate change and futureproofing the region. This is done through exploring the social and economic, as well as environmental, benefits for delivering net zero, e.g. creating jobs, achieving better social outcomes and, building healthier, happier and better connected places to live. The plan presented here will be challenging but presents significant opportunities for people and businesses in the West Midlands, for example by 2026 we could see 21,000 new jobs across numerous sectors – in the first FYP, these will particularly be in the domestic retrofit sector and in the electrification of transport.
2.4 In addition, this FYP enables the WMCA to position itself favourably to respond to, and deliver, ambitions being set out by the UK government in recent (and upcoming) policy initiatives and legislation, all of which carry economic opportunity. These include the Ten Point Plan for a Green Industrial Revolution; the recent Energy White Paper; and in 2021, it is also expected that the Environment Bill will receive Royal Assent. The WMCA is also making preparations to have a high profile as part of the COP26 activities this year.
2.5 The development of the FYP has involved a huge stakeholder engagement exercise.
WSP, and the WMCA Environment Team, have engaged extensively with constituent local authorities on the plan to ensure that people are aware of the findings and the areas where we are suggesting that coordination at a regional level makes sense for delivery. This has included presenting findings to respective climate change boards at Birmingham, Dudley, Sandwell and Wolverhampton. Engagement has also taken place through 1:1 meetings and working groups with industry, universities, environmental NGOs etc. In total, over 240 individuals across 97 different organisations and institutions have been consulted as part of the plan.
2.6 This FYP report represents independent advice from WSP to the WMCA from which we will work to deliver the recommended actions (outlined in Paragraph 2.14 below) in collaboration with stakeholders from across the region.
Page 18

Modelling and goals for 2021-2026
2.7 The modelling that has taken place to produce the first FYP has identified the measures that will need to be taken to reach net zero. These take into account: the maturity of technology, public acceptance of measures, ensuring a just transition, enabling the creation of jobs, and the transition of the West Midlands economy to a net zero future.
2.8 The modelling takes business as usual (BAU) as the starting point, on which the other recommended measures build. BAU includes: The carbon factor of the electricity grid as it continues to decarbonise Minimum Energy Efficiency Standards (MEES) Housing growth Commercial growth Electrification / hydrogen use in transport Local authority decarbonisation targets for their own estate Other organisation’s decarbonisation targets Other committed projects across the region (including renewable energy
projects etc).
2.9 From the modelling, the additional recommended measures fall broadly into retrofit (domestic and commercial); addressing industrial emissions; transport-related measures and strategic land use (exploring both tree planting and use of land for large-scale renewable generation). An overview of those goals and some of the co-benefits of delivery is shown below:
2.10 In the WSP report, each goal is taken in turn, exploring the delivery at low, medium, high and very high levels of implementation. The option is there to combine very high outcomes in some areas that are more progressed with medium/ low outcomes in others. A ‘West Midlands Carbon Calculator’ has been developed by WSP to sit alongside the FYP to enable the exploration of future scenarios. This will be made publicly available for everyone to use.
Page 19

2.11 The top five decarbonisation priorities, which have been identified as having the greatest impact in carbon terms, are:
1. Domestic energy efficiency measures and heating retrofit2. Commercial energy efficiency measures3. Modal shift towards active travel measures4. Increased uptake of electric vehicles5. Planting trees and enhancing natural capital
2.12 Understanding what needs to be prioritised, dependencies and the sequencing of implementation will also be important. For example, planting trees and enhancing natural capital will not reduce carbon significantly by 2026, but we know we need to do this at significant scale in the context of reaching net zero by 2041. An example of a key dependency would be that effective heating retrofit is dependent on energy efficiency measures also having been undertaken in homes.
2.13 Using a combination of the measures identified, 3 scenarios have been developed to achieve net zero. These are:
Moderate: this is beyond ‘business as usual’ delivery pace, and accelerates activity in selected sectors, but will only achieve a 37% reduction in carbon emissions from 2021 - 2041. This is not the recommended route for delivery.
Accelerated (outlined in more detail in Paragraph 2.14). A much more rapid and aggressive delivery pace across sectors, with most goals set at a “high” implementation rate. This will achieve a 94% reduction in carbon emissions by 2041 with the final 6% currently needing to be addressed through offsetting, although as new technologies emerge we will update how this could be met.
Maximum. It is at the limit or beyond what it is technically possible, even ignoring legislative competence and finance restrictions. It would require large behaviour change from people and could create unintended consequences for a just transition. For this reason, this has not been recommended, but can be explored by those seeking to understand what is required and whether the 2041 ambition can be achieved through a more aggressive trajectory.
2.14 The independent advice, provided by WSP, recommends the WMCA should adopt the
Accelerated scenario in the first FYP. Modelling for the goals and scenarios provides an indication of the delivery required to reach net zero. The specific level of interventions will be developed through policy and business cases, for example, the detail of the transport goals will be subject to development of the new Local Transport Plan and they are only intended as an indication of how the West Midlands could decarbonise each sector.
Page 20

Required level of interventions on different goals to achieve the Accelerated Scenario
1. D
omes
tic
Ener
gy E
ffici
ency
2. D
omes
tic
Hea
ting
Ret
rofit
3. D
omes
tic P
V
4. C
omm
erci
al
Ener
gy E
ffici
ency
5. C
omm
erci
al
Hea
ting
Ret
rofit
6. C
omm
erci
al P
V
7. In
dust
rial
Ener
gy E
ffici
ency
8. In
dust
rial P
V
9. A
void
ing
Trav
el
10. S
hifti
ng T
rave
l
11. I
mpr
ovin
g Tr
avel
(Bus
/ Ta
xi)
12. I
mpr
ovin
g Tr
avel
(HG
V)
13. I
mpr
ovin
g Tr
avel
(Acc
eler
ate
EVs)
14. L
and
Use
- R
enew
able
s
15. N
atur
al C
apita
l
Very HighHighMediumLow
In practical terms, this means:
Goal Accelerated scenario deployment to 2026
Accelerated scenario deployment for net zero
1. Domestic energy efficiency
294,000 homes 1.1m homes (100%)
2. Domestic heating system
292,000 homes 1.1m homes (100%)
3. Domestic photovoltaics
415MWp (116,000 dwellings, out of 1,178,260)
830MWp
4. Commercial energy efficiency
37,000 buildings 73,400 buildings
5. Commercial heating retrofit
37,000 buildings 73,400 buildings
6. Commercial photovoltaics
353MWp (7,060 buildings, out of 74,040)
705MWp
7. Industrial energy efficiency
10% energy efficiency, 17% deployment of H2 and 20% CCS for high temp.
15% energy efficiency, 33% deployment of H2 and 40% CCS for high temp.
8.Industrial microgeneration
96MWp (960 systems, out of 27,180 industrial buildings)
96MWp
9. Avoid 9% people telecommuting and 6.25% reduction in trips
35% people telecommuting (50% of the time), 25% less personal / retail trips
Page 21

10. Shift 59% trips of by car Shift to 35% of trips by car
11. Improve travel (bus and taxi)
100% electrification by 2030
100% taxis & buses electrification
12. Improve travel (HGVs)
25% of HGVs are electrified
100% of HGVs are electrified
13. Improve travel (accelerated EVs)
15% of cars are electrified
100% of cars are electrified
14. Land use - renewables
30MW wind and 224MWp solar
59MW wind and 448MWp of solar potential
15. Land use - natural capital
13% forest cover/20% peri-urban areas
13% WMCA tree coverage
2.15 Following this Accelerated path to net zero will mean a 33% emissions reduction by 2026 (against a 2016 baseline). This will result in a highly ambitious route to net zero by 2041, allowing for the commitment to ensure a just transition that does not leave anyone behind (our commitment in #WM2041: Actions to meet the climate crisis with inclusivity, prosperity and fairness). The forecast cost of this ambition is £4.3bn by 2026 and delivery could create 21,000 additional new direct jobs in low-carbon sectors.
2.16 Successful delivery of many of the goals is dependent on a number of conditions, in particular having:
public hearts and minds support for the policies and actions e.g. in transport, land-use and domestic goals;
integrated infrastructure planning and place-based input to regulatory mechanisms governing transport, housing and energy, e.g. requiring further devolution from a UK Government, working with Local Highway Authority and Planning Authority; and
the mechanisms and political support in place at all levels to secure the necessary increased funding levels which will needed to be found in terms of revenue and capital expenditure;
a supply chain that is engaged with the transition and a skilled workforce able to meet demand.
Investment and financing
2.17 The gross investment cost (excluding issues around system management, industry and some transport goals) is estimated to be £4.3bn by 2026 and £15.3bn over the 20-year period. Costs associated with transport are only covered in a limited sense, with detail to be developed in the upcoming Local Transport Plan (LTP) review.
The £4.3bn gross investment cost identified for the FYP does not represent costs to the CA directly but will need to come from multiple sources depending on the nature of the intervention/ programme. In some instances there are business cases for the costs to be covered by the private sector (e.g. broadband for home working). In others WMCA
Page 22

and other public sector bodies will be needed to play different roles, which will all require revenue funding:
to facilitate delivery (e.g. investment in renewables); provide support through regulation to drive the transition (e.g. through planning
and building regulations); resource to access central government funding (e.g. for EV charging); to unlock private investment through blended green finance mechanisms; provide direct funding, especially where there is significant social value in doing
so.
2.18 Addressing the 15 goals identified will mostly require initial investment to get programmes up-and-running. Some of this will need to come from public sector sources, including devolution of resource from national government as part of the UK’s programme for carbon reduction. However, for many things there may also be a commercial return on investment, which will require us to continue to develop relationships with industry, landowners and the finance sector in order to realise the opportunities that reaching net zero in the West Midlands presents.
The table below indicates the variety of potential funding sources that could be used to deliver the goals.
Name Gross Investment
Costs to 2026
Gross Investment
Costs to 2041
Potential Funding Source
Domestic Energy Efficiency Retrofit
£0.62 billion £2.5 billion - Green loans where homeowners are able to pay- Public funding for local authority owned stock- Property owners for rented accommodation
Domestic Heat Pumps Retrofit
£2.28 billion £9.6 billion - Grant funding or incentives- Social landlords’ investment- Private homeowners voluntarily and later mandatorily
Domestic Solar (PV)
£332 million £664 million - Property owners- Green loans- Private sector investment
Commercial Energy Efficiency
£365 million £731 million - Property owners voluntarily and later mandatorily- Green loans- Private sector investment
Commercial Heat Pumps
£76 million £321 million - Property owners voluntarily and later mandatorily- Public Sector funding or incentives
Commercial Microgeneration
£270 million £540 million - Property owners- Green loans- Private sector investment
Page 23

Industrial Microgeneration
£72 million £72 million - Property owners- Green loans- Private sector investment
Transport - Demand Reduction
£23 million £91 million - Mainly infrastructure providers- Potential gap funding for hard to reach areas- Seed funding for private organisations for community / delivery hubs
Transport (Fuel Switching) Taxi / Bus
£178 million £356 million - Private finance- Green loans
Land Use - Natural Capital
£57 million £229 million - Public Sector – Environmental Land Management Scheme- Private sector – Carbon offsetting- New Development – Biodiversity Net Gain
Land Use - Renewables
£71 million £283 million - Private finance
2.19 The Marginal Abatement Cost Curve (MACC) in the report indicates broadly which measures will be more or less cost effective:
The areas to the left of the graph are those where there is a commercial return on investment. The width of the bar on the chart indicates the potential carbon saving that could be achieved. It is important to note, however, that the costs do not include the start-up and management of the programme itself (e.g. the resource/ staffing requirements, business case development etc) and so should be used as a guide only.
Page 24

2.20 No significant additional funding has yet been secured for this although some potential small-scale investment opportunities are being worked through, such as the roll-out of all-electric buses in Coventry. The FYP will require investment through a variety of routes, including local authorities, central government, private sector investment as well as WMCA. Many of the interventions outlined in this document will require comprehensive business cases to be developed in order to ascertain more accurate costs/benefits and produce the detail for the financing and delivery. The WMCA is currently working to explore the different financing mechanisms that will need to be put in place in order to deliver on all aspects of the plan, through a Green and Social Finance Working Group.
There is also the need to resource the delivery programme set out in section 2.22 below and following and to put in place the capacity required to co-ordinate such an ambitious agenda. To this end, it is proposed that resources are made available from the Investment Fund, subject to the extension to the Investment Programme affordable limit, to drive forward this programme.
Investment Fund Proposals
2.21 It is proposed that Investment Fund resources are used for the following purposes:
a) Net Zero Neighbourhood Demonstrator Evidence suggests that retrofit-at-scale is unlikely to be achieved in the short-term without significant incentive and intervention and that this will be most likely achieved at a neighbourhood scale. Our proposal is to invest in a ‘demonstrator’ neighbourhood where we can show the potential to unlock a place-based approach to achieving several decarbonisation goals. The Net Zero Neighbourhood might include some of the following:
A programme of street-by-street ‘deep retrofit’ and domestic heat and energy initiatives;
New build investment in Zero Carbon Homes; Future mobility innovations, EV charging infrastructure and car-sharing clubs; Smart energy, micro-generation and digital infrastructure; Investment in the public realm, natural capital and green space.
There is significant scope for using this approach to unlock co-investment through a range of sources including existing housing and transport programmes; private sector investment; government retrofit programmes including LAD2; the Network Innovation Challenge fund; and other green investment vehicles. Similar approaches are being developed in West Yorkshire and Edinburgh. There is also consideration that the programme could be developed as a competition. Any programme of this nature will also include detailed arrangements concerning monitoring and evaluation, returns on investment and governance and accountability structures.
A more detailed proposal will need to be worked up in partnership with local authority officers and would be subject to detailed financial and legal due diligence and formal agreement by the Investment Board.
b) Sustainable Market for Affordable Retrofit Technologies (SMART) Hub Despite the scale of the challenge concerning domestic energy efficiency and retrofit, the market remains under-developed with significant challenges both in terms of generating demand and stimulating supply chains. This proposal is to create a core capacity in the
Page 25

region to unlock funding and activate a sustainable market for affordable retrofit technologies. This will involve:
Creating dedicated capacity to work more closely with local authority housing and retrofit teams to access government funding, take a more systematic approach to stock assessment and streamline complex referral routes and procurement frameworks;
Working closely with the retrofit supply chain to develop and produce heat pumps and other new retrofit products at scale in conjunction with wider MMC initiatives;
Working closely with skills providers to ensure we maximise training and apprenticeship opportunities in relation to this burgeoning market.
c) Core capacity to drive forward the wider Five Year Plan Delivery Programme Section 2.22 below and following sets out a broad programme of activity across many of the FYP goals stimulating new activity and unlocking finance to support investment. At present the large majority of this programme is being driven by 3 dedicated staff in the Environment Team and 3 in Energy Capital who are not funded by the Combined Authority. To this end we propose a carefully targeted increase in core capacity in a small number of key priority areas including:
Energy infrastructure including smart energy networks and EV charging; Green manufacturing, industrial decarbonisation and the circular economy; Green finance and investment; Natural capital and place-based approaches; Behaviour change, business engagement and lobbying; Energy and environment data, innovation and economy.
d) Community Green Grants Scheme The importance of natural capital in both mitigating climate change, as well as boosting resilience to it, is highlighted in the FYP. In addition to this, we know natural capital provides significant co-benefits in terms of health and well-being to people and communities. And yet access to good quality green space varies significantly across the region as has been highlighted in a recently commissioned study. To this end we propose creating a grants programme that would provide capital investment to enhance green space in targeted areas around the region. Grants of up to £50,000 would be provided to support projects where there is significant local support and community engagement as well as green and social benefit.
A more detailed proposal will need to be worked up in partnership with local authority officers and would be subject to detailed financial and legal due diligence and formal agreement by the Investment Board.
Delivery ‘next steps’ and governance structures 2.22 The FYP will require new routes for delivery; these are sketched out in outline delivery
plans in WSP’s report. The recommendation to the CA Board is that we accelerate work focused on 17 ‘next steps’, aligned to the main priorities of FYP Accelerated Scenario, many of which are already underway:
Page 26

FYP Theme Delivery next stepsDomestic SMART Hub for Retrofit Delivery and Net Zero
Neighbourhood Model Warm Homes Save Lives Programme
Commercial Commercial Green Energy Taskforce Local Area Energy Planning & Network
Connections FundIndustrial Industrial Decarbonisation and Green
Manufacturing Taskforce Circular Economy Roadmap
Transport Updated Local Transport Plan Infrastructure for Zero Emissions Vehicles
(IZEV) StrategyLand Use Natural Capital Board and WM Natural Capital
Programme Community Green Grants programme Large-scale Renewables Programme
Systems Management & governance
Green Skills Strategy WM2041 Behaviour Change and Business
Pledge roll-out Place-based data hub Net Zero Citizens’ Panel WMCA Carbon Literacy Programme Whole-system governance including Net Zero
Delivery Board
2.23 Domestic Retrofit and Energy Efficiency
2.23.1 Establish a SMART Hub for retrofit delivery This would be a partnership programme between the WMCA housing and environment teams and Energy Capital, to develop a long-term market for retrofit that is supported by manufacturers in the region. It also means that we should not be building new homes that will require retrofit in a few years’ time. The SMART (Sustainable Market for Affordable Retrofit Technologies (SMART) Hub will bring together dedicated capacity to work more closely with local authority housing and retrofit teams and drive forward the regional retrofit agenda.
The next steps involve demonstrating ambition across both retrofit and new build at scale, showing how advanced technologies can be deployed, but also stimulating the able to pay market, encouraging consequential behavioural change activity and establishing the scale of financing and delivery vehicles necessary to stimulate the manufacturing and installation supply chain to invest and grow over the long term.
2.23.2 Net Zero Neighbourhood Demonstrator.A Net Zero Neighbourhood would focus on delivery of energy efficiency and retrofit for buildings, it is at this spatial level that the finance can be unlocked and the benefits of a programme can be realised in terms of a wider contribution to place-making that cannot be achieved through a ‘one home at a time’ approach. This could therefore also include opportunities for community energy schemes, public realm and natural capital improvement, active travel, EV car clubs and digital infrastructure that all contribute to
Page 27

the creation of a truly net zero neighbourhood that brings broader health and wellbeing and economic outcomes. This programme could potentially be kick started by helping Local Authorities to draw down their funding allocations available under the Local Authority Delivery (LAD) 2 Scheme funded by BEIS. The criteria for selecting the neighbourhood within the West Midlands will be developed, but would include opportunities for adjacent investment (e.g. in transport, housing, natural capital and energy), level of deprivation and fuel poverty, housing stock type and tenure and availability of LAD 2 funding for area based programmes.
2.23.3 Warm Homes Saves Lives fuel poverty programme The West Midlands has the highest fuel poverty gap of all the English regions and the second highest incidence of fuel poverty. Without addressing these foundations, the energy efficiency measures outlined in the FYP will be undermined and the carbon savings sought from the domestic market will not be achieved. Building on our existing programme, new work will include the demonstration of new CRM referral system, better targeted energy efficiency measures delivered through partnerships with providers, potentially through a more co-ordinated provider framework, the development of an innovative Social Impact Bond mechanism for fuel poverty and lobbying of BEIS for future ECO funding to be further devolved to LAs. This co-ordinated approach will help to shape and access national programmes and ensure the long-term funding is directed to where it is needed most in the West Midlands.
2.24 Commercial Efficiency and Local Area Energy Planning
2.24.1 Commercial Green Energy Taskforce.The WSP report indicates that there are significant carbon savings to be made in the commercial sector. Whilst the technologies might be the same as the domestic sector, the approach to delivery is different. Establishing this taskforce will be the first step in developing a clear understanding of how we accelerate this work in the West Midlands in terms of retrofitting and realising the renewable potential of commercial buildings.
2.24.2 Local Area Energy Plan and a revolving Network Connections Fund This would address the pressing short-term cost barriers to decarbonisation and green growth to overcome the problem of high cost of network connections for electric charging infrastructure, new developments such as the Giga Factory and other demands on the energy networks, through demand aggregation. Building on the Energy Transition project supported by the SED Board in August 2020, in order to identify where investment should take place, the WMCA should develop a Local Area Energy Plan and investment in shared expert capacity through Energy Capital to map out the implications of transport, housing and industry’s decarbonisation plans and represent the requirements of the region through the Distribution Network Operators Business Planning processes, which determine where investment is made in the region’s energy infrastructure and where it is left to the market to invest. This would need to be expanded beyond Coventry City, where Energy Capital’s current innovation project (RESO) is focused, and to enable deeper engagement with Western Power Distribution and Cadent across the whole region and identify ways to affordably fund network connections that support the region’s decarbonisation plans.
2.25 Industrial Decarbonisation and the Circular Economy
2.25.1 A LEP-led Industrial Decarbonisation and Green Manufacturing Taskforce.
Page 28

The WSP report indicates that there are significant carbon savings to be made in the industrial sector, but exploration into this issue has shown the complexity of solutions, including new technology and circular economy opportunities. There is an opportunity to share learning from the Black Country Industrial Cluster Decarbonisation programme funded by BEIS. It is therefore recommended that the WMCA works with the LEPs to establish a special Taskforce to develop a collaborative work programme on these issues and supports the Black Country in accessing future funding and explore opportunities for expanding solutions identified across the wider West Midlands.
2.25.2 Circular Economy Routemap.The circular economy was highlighted as a priority in the June 2020 CA Board paper, WM2041: A Programme for Implementing an Environmental Recovery. Since then, a circular economy taskforce has been established and Useful Projects have been commissioned to support the development of a routemap by mid-2021, to understand where the West Midlands is uniquely placed to accelerate work on the circular economy. This will build on regional strengths, including: the circular economy work in Wolverhampton (including Wolverhampton University); the Repowering the Black Country work, exploring the potential of circular economy in industrial processes; and the activity that supports business engagement, for example International Synergies’ work on industrial symbiosis. The routemap will provide a clear understanding of what our next steps should be, the ‘big wins’ for the West Midland and the investment required to deliver.
2.26 Transport
2.26.1 An updated Local Transport Plan. WMCA Board approved the approach for an updated LTP at its meeting on 24th July 2020. A review of the LTP is underway and is being progressed with the constituent authorities. Developing and managing the West Midlands LTP is one of WMCA’s key statutory functions undertaken by TfWM. The current LTP, Movement for Growth, was adopted in 2016 but significant developments and changes have taken place in the last 5 years including increasing concerns regarding the climate emergency. The FYP outlines indicative mode shares and desirable reductions in transport carbon emissions. These could be progressed by enabling changes in consumer choices in line with the proposed “avoid, shift, improve” framework for reducing emissions and already adopted re-mode, re-route, re-time and remove journeys approach in the WMCA adopted Congestion Management Plan (containing a significant behaviour change programme). The scale and pace of change will be heavily dependent on public hearts and minds support for demand managed policies in transport and land-use policy changes required to support such a scale of change. The new LTP will be published in early 2022.
2.26.2 Infrastructure for Zero Emissions Vehicles (IZEV) Strategy.This strategy, due to be completed in March 2021, builds on the West Midlands & Warwickshire ULEV Strategy approved by WMCA Board in January 2020, the decision by the CA Board to support the development of a Network of Transit Charging Stations across the region and the work of Midlands Connect. The strategy will recommend a partnership programme which reaches beyond TfWM’s current role in strategic action planning for the Park and Ride estate and exploring options for collaboration in delivery of chargepoint infrastructure, into integrated infrastructure planning and delivery. It recognises the regional priority to facilitate the decarbonisation of public sector transport options and support modal shift, whilst at the same time enabling those individuals and service providers that do require private vehicles, to confidently make the transition to
Page 29
zero emission vehicles, and supporting vehicle manufacturers in the transition from the production of internal combustion engine to electrically powered vehicles.
This programme recognises the unique role that local authorities have in being able to bring together operators with complimentary charging requirements to establish charging hubs, supported by OZEV funding, which can be developed around the needs of the users and the availability of network capacity. A template for this approach can be seen in the development of Coventry and Warwickshire’s Low Carbon Transport and Energy Hub or Tyseley Energy Park. This programme recognises the value of collaboration between transport and energy network operators, both to overcome short term barriers such as electrical network capacity costs and set the region on a pathway to achieve longer term goals in transport decarbonisation such as the provision of infrastructure to support the development of biofuel and hydrogen solutions.
2.27 Land Use
2.27.1 Natural Capital Action Plan and Board. We will bring together stakeholders from across the region to provide support for work on biodiversity net gain and nature-based solutions. This will include a wide range of issues, including: tree planting, taking responsibility for a Local Nature Recovery Strategy and work to support funding and roll out of community green grants. Delivery will happen in conjunction with local partners and also in working with large scale infrastructure projects like the Commonwealth Games and HS2. An initial natural capital action plan for the WMCA is being presented to the March 2021 Environment and Energy Board.
2.27.2 Large-scale renewable energy projects.The FYP identifies opportunities to use land within the WMCA area that is ideally suited for utility scale solar and wind electricity generation. The areas identified should be mapped, investigated further and prioritised where considered suitable. Working closely with key stakeholders including local authorities, communities and landowners, the WMCA and Energy Capital public sector can play an important role though helping developers to link up with end users to establish Power Purchase Agreements, supporting community energy groups to bring forward schemes, and even investing in schemes to create a return on investment which could be reinvested to support other areas of delivery of WM2041. This programme can be scaled up depending on the availability of funds, from a small neighbourhood community scheme to support the SMART hub programme, to larger developments supporting industrial and commercial decarbonisation.
2.27.3 Community Green Grants.The importance of natural capital in both mitigating climate change, as well as boosting resilience to it, is highlighted in the FYP. In addition to this, we know natural capital provides significant co-benefits in terms of health and well-being to people and communities. However, access to green space is not equitable, a situation that has been brought into sharp relief during the Covid-19 lockdowns. Using data that WMCA and other regional partners have available, we know the neighbourhoods where there is currently deficit of access to green space and are seeking to work with delivery partners across the West Midlands to provide community grants to roll out projects to create, enhance and improve access.
Page 30

2.28 Skills, Systems Management and Governance
2.28.1 Green Skills Strategy.
Work with Colleges West Midlands and the Jobs and Skills Delivery Board to develop a Green Skills Strategy linked closely with investment and job growth, introducing skills training in key areas that exhibit early job demand and demand for new or updated skills, in particular:
o Vehicle manufacture / technology (including Battery operatives and increased EV/ hybrid vehicle maintenance and repair)
o Transport (including Planning, management and co-ordination)o Built environment (including Heat pump installers – specifically F gas, Retrofit co-
ordinators and customer management, Electrical installers, Commercial, procurement, project management)
o New industry / manufacture (including Product design)o Energy (including Solar installers)o Tech (including Smart systems, data analysis, software design, Use of 5G)
2.28.2 Behaviour change and business pledge roll out.There was a strong message coming through the original consultation on WM2041 that people across the region wanted more information on what they could do to reduce their carbon footprint. Behaviour change has also emerged very strongly as a crucial part of delivering net zero in the UK Climate Change Committee’s 6th Carbon Budget, being implicated in 59% of the UK’s actions to reduce emissions. The WMCA Environment Team has commissioned the national Behavioural Insights Team to advise us with this work. We will be working with key stakeholders such as TfWM who will deliver sector specific activity to drive a step change in this area of work. In addition to this, the WMCA has worked with regional businesses from the Mayor’s Economic Impact Group to develop and launch a ‘Net Zero Business Pledge’ to support businesses in building action plans to reach net zero and to showcase some of the excellent work already being led by business in this area.
2.28.3 Create a place-based ‘Centre for Climate Data’We propose working closely with regional partners to bring together information to inform decisions on net zero and produce independent models and predictions. Relevant data could cover private and public emissions, utilities rollout and repair (particularly energy and fibre), planning, transport, public health, and supply/demand in key parts of the economy (e.g. domestic heat pumps, retrofit firms). This will be linked with the Digital Roadmap and plans for a WM Datastore.
2.28.4 Net Zero Citizens’ Panel.Citizens’ panels and assemblies have proven to be a valuable part of the decision-making process around climate change solutions and driving behaviour change initiatives. They have been used at national level (e.g. the UK Climate Assembly, which reported in September 2020) as well as at the local authority level – for example, in Wolverhampton. Birmingham has also recently announced its intention to develop a citizens’ assembly for the climate emergency to develop their climate change plans. A Net Zero Citizens’ Panel, will form an important part of testing solutions and informing decisions on programmes developed from the FYP. In particular, it will ensure that we
Page 31

are upholding the WM2041 principle of achieving net zero without leaving anyone behind.
2.28.5 WMCA carbon literacy programme.As well as working with stakeholders across the region to deliver on the net zero ambitions, the WMCA will show leadership through a carbon literacy programme being established and rolled out for all staff. This will be happening from March 2021 onwards and will be an important part of the behaviour change work. The business pledge will encourage all organisations to complete carbon literacy training.
2.28.6 Whole system governance.The key ‘systems managers’, from a WMCA perspective are: Energy Capital; Transport for West Midlands and the WMCA Environment Team. Achieving net zero will require more than just a series of initiatives by each of these organisations though; it will require systems integration and whole systems change, to ensure that West Midlands citizens are able to make zero carbon choices. It will also require the generation of systems data to support the systems governance. A proposed structure to enable this is a Net Zero Delivery Board. It is suggested that this is a Technical Board with responsibility for achieving the 2041 target. This Board should have an outward focus, with the aim of creating an informed interface between the WMCA and the wider systems of which the West Midlands is a part; including our electricity network, gas network, communications network, transport system and planning system at a local level.
Page 32

2.29 Crucially, these agencies will need to work increasingly closely with BEIS, Ofgem and key energy infrastructure agencies such as WPD and Cadent. There will also need to be close collaboration with other teams across the WMCA, for example Housing and Land and Productivity and Skills. These different parts of the programme will be brought together in the WM2041 Net Zero Delivery Board. The Environment and Energy Board will remain the main governing body for guiding the programme and approving workplans.
2.30 Local authorities have a key role to play in delivering net zero. The WMCA will need to seek joint approaches with local authorities to deliver at scale, where appropriate, to set the conditions for net zero delivery, respecting subsidiarity and relevant duties and powers.
2.31 It is of critical importance to recognise that this is not just a plan for the WMCA, however. Whilst the work has focused on what the role for the WMCA might be in the journey to net zero, action and delivery will be required by individuals, communities, local authorities and business. There is a role for everyone in delivering the net zero ambition and the report also outlines delivery plans for each of the areas in turn. The key message is that we need to act fast, together in order to make net zero by 2041 a reality.
3. Financial Implications 3.1 The FYP document estimates that the indicative gross cost of transition during 2021-26
is £4.3bn. The overall cost of the programme to 2041 is being estimated at £15.3bn.
3.2 The FYP will require investment through a variety of routes, including local authorities, central government, private sector investment as well as WMCA. Many of the interventions outlined in this document will require comprehensive business cases to be developed in order to ascertain more accurate costs/benefits and produce the detail for the financing and delivery. The WMCA is currently working to explore the different financing mechanisms that will need to be put in place in order to deliver on all aspects of the plan, through a Green and Social Finance Working Group.
3.3 No significant additional funding has yet been secured for this although some potential small-scale investment opportunities are being worked through, such as the roll-out of all-electric buses in Coventry.
3.4 Options for use of Investment Programme funding are available however, subject to the extension to the Investment Programme affordable limit, which is the subject of a separate report to this Committee.
3.5 The distribution of the increase in the Investment Programme affordable limit is provisionally laid out in the Financial Monitoring Report which makes an allowance of £20.5m to fund recovery priorities such as WM2041, Town Centres Programmes, Co-invest and the CWC City Learning Quarter.
3.6 Options for use of the Investment Programme funding for WM2041 initiatives have been developed for consideration by WMCA Board as follows:
Page 33

3.7 The options detailed above are affordable in the context of the available funding from the Investment Programme but will leave a reduced balance for other recovery initiatives as detailed above.
3.8 All of the work-streams above demonstrate a clear link to the WM2041 strategy and Five Year Plan. In order to facilitate decision making, each of the options detailed above will deliver the following:
Option Deliverable
Option A
This will deliver a Net Zero Neighbourhood demonstrator and will provide the minimum required capacity for the SMART Retrofit Hub. It will also provide additional capacity and capability required across Energy Capital and the Environment teams to deliver the Investment Programme proposals and to mobilise the work on the FYP delivery for one year.
Option B
Option B will deliver all of the above plus additional investment into the Net Zero Neighbourhood programme, which will both enable more activity as well as increase opportunity to leverage in additional investment. This option will also support the roll out of a programme of Community Green Grants to increase access to green space where there is currently a deficit. The grants programme will also support the natural capital elements of the FYP, tree-planting, micro-generation and biodiversity net gain across the West Midlands.
Option C
Option C will deliver all of the above plus additional community green grants to extend impact across the WMCA region. It will also provide additional capacity to Energy Capital and the Environment teams to deliver the Investment Programme proposals and to mobilise the work on the FYP delivery for two years.
3.9 Should WMCA Board agree a funding allocation from the Investment Programme, assurance on cost outputs and approval to spend the budget will be obtained via the WMCA Single Assurance Framework.
3.10 This funding will help develop some of the interventions outlined in the FYP.
4. Legal Implications None from this FYP. We will work closely with colleagues in the Legal Team during business case development as these progress for each of the priority interventions. 5. Equalities Implications
Page 34

The equalities implications of this paper – and the activities it proposes – should create net positive effects in terms of the impacts on citizens and communities. Underpinning all the work on WM2041 is the need for it to be a ‘just transition’ (deliberately mitigating the cost of changes for those least able to bear it) and it seeks to embed environmental goals as part of an overall approach to economic growth that is more inclusive.
6. Inclusive Growth Implications WM2041 was established as a programme that had inclusive growth embedded within it. The commitment to transition to net zero in the WM2041 plans, as well as the alignment with the UN Sustainable Development Goals, underpin our whole approach to addressing climate change. This runs through the FYP, where we have highlighted co-benefits around addressing climate change. These range from reduction of fuel poverty through an extensive retrofit programme, through to natural capital solutions and widening access to green space for people across the region.
In addition to the solutions themselves, the FYP also outlines the numbers and types of jobs that might be created as part of the region’s actions to decarbonise. This includes reskilling opportunities for people currently working in ‘high carbon’ sectors to ensure that opportunities are available for everyone to be part of the transition to net zero.
7. Geographical Area of Report’s Implications The report concentrates on the seven constituent authorities. Different parts of the FYP may involve non-constituent authorities as part of delivery. These relationships will be developed on a case-by-case basis. 8. Other Implications None. 9. Schedule of Background Papers
Five Year Plan Summary documentFive Year Plan independent technical report
Page 35

This page is intentionally left blank
WMCA 5 Year Plan 2021-26 | Page 1
WM2041 – Five Year Plan 2021-26Executive Summary
DRAFT (awaiting the final
design version)
Page 37

WMCA 5 Year Plan 2021-26 | Page 2
This summary of the first five year plan sets out how the West Midlands Combined Authority area can start to deliver net zero carbon emissions by 2041. It covers:
1. Summary of the Summary
2. Background
3. Where are we now?
4. Stakeholder Engagement & Data Review
5. Sectoral Analysis
6. Carbon Modelling Results
7. Delivery Plan
8. Jobs and Skills
DRAFT
Page 38

WMCA 5 Year Plan 2021-26 | Page 3
In 2019 the West Midlands Combined Authority (WMCA) set the region a target to be net zero by 2041 and meet the ambitions set out by the Paris Agreement.
This is the first five year plan to demonstrate how the region could deliver the 2041 target and it shows:
The Five Year Plan – Summary of the Summary
• Under a highly ambitious ‘Accelerated’ scenario, delivery across domestic, commercial, industrial, transport and land use sectors could result in a 33% reduction by 2026 (against 2016) and net zero by 2041. The “Accelerated” scenario is recommended to be used as the standard to set the delivery goal ambitions.
• When considering current efforts and actions and the scale and pace required, the region is currently not on target for 2041.
• The change in delivery pace required is huge and unprecedented. It requires collaboration and delivery across all sectors well beyond current efforts.
• Delivery of this five year plan to move the region to a net zero carbon society will represent an investment in the region’s future and create a better West Midlands.
• Although action and investment within the region and by WMCA is crucial, the goals will require devolution of powers, additional government investment and action by the public.
• Gross extra investment required under the ‘Accelerated’ scenario is £4.3bn by 2026. However, net investment will be much lower due to operational savings.
• 41% of delivery is related to technology, 16% requires behaviour changes and 43% is a combination of both. (Taken from Committee on Climate Change, Sixth Carbon Budget)
• Delivering the ‘Accelerated’ scenario could create 21,000 jobs by 2026 and 72,000 by 2041.
DRAFT
Page 39

WMCA 5 Year Plan 2021-26 | Page 4
1. Set up a Regional Retrofit Taskforce to work with stakeholders to unlock investment to deliver energy efficient homes for up to 294,000 dwellings, with low carbon heating in 292,000, at a total cost of £3.2bn, reducing energy bills, fuel poverty and creating jobs.
2. Unlock investment of up to £70m in land based renewables and £483m on rooftop PV by 2026.
3. Energy Capital will support local authorities, LEPs and stakeholders to undertake and implement local area energy planning, enable net zero energy systems and renewables delivery.
4. Be a pathfinder for energy devolution and regulatory change to drive competitiveness of the region’s industrial and commercial sectors, positioned as a global leader in the net zero transition as part of the WM industrial strategy.
5. Support changes in the way we travel through reduction in car usage, and a much higher modal share of public transport and cycling. TfWM will continue to work with local authorities to deliver improvements to active travel and public transport as set out in the existing Local Transport Plan (LTP), Movement for Growth, as well as producing an updated LTP.
To set the region on course to deliver the net zero target by 2041, WMCA have identified key priorities for delivery, working with regional stakeholders.
6. Implement the Zero Carbon Homes Routemap which provides clear actions and targets for reducing operational, embodied and whole life emissions for new residential development.
7. Work with stakeholders to secure inward investment that supports green growth, including a battery Gigafactory and electric vehicle charging facilities, powered by clean energy infrastructure.
8. Launch a Net Zero Business Pledge to enable businesses in the region to become champions and understand how they can play their part as well as a Net Zero Citizens’ Panel and behaviour change programme.
9. Establish a regional natural capital board to produce a natural capital plan for the West Midlands to increase forestry cover from 1.5 to 13% at a cost of £60m up to 2026.
10. Work with stakeholders to develop and drive behaviour change initiatives across the region.
11. Work with colleges, universities and employers to develop the skills and training programmes required to provide the work force for the net zero transition.
DRAFT
Page 40
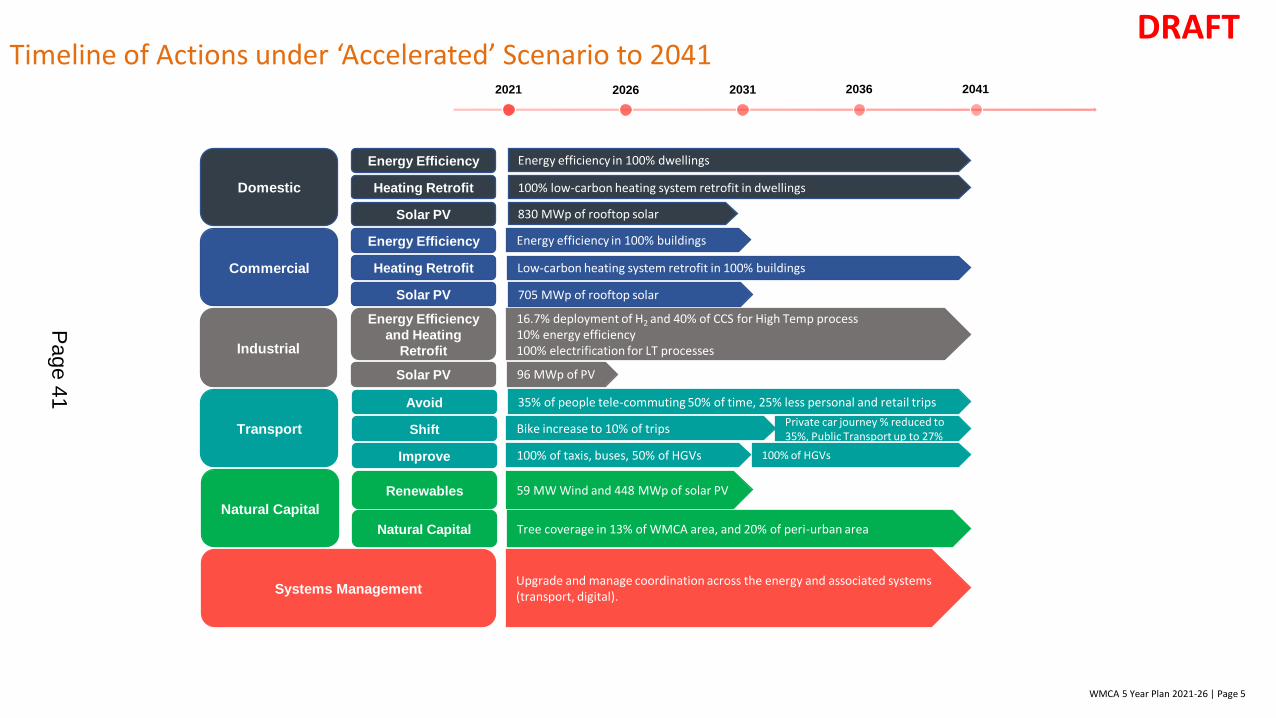
WMCA 5 Year Plan 2021-26 | Page 5
Timeline of Actions under ‘Accelerated’ Scenario to 2041DRAFT
Domestic
Commercial
Industrial
Transport
Natural Capital
Systems Management
Energy Efficiency
Heating Retrofit
Solar PV
Energy Efficiency
Heating Retrofit
Solar PV
Energy Efficiency
and Heating
Retrofit
Solar PV
Avoid
Shift
Improve
Renewables
Natural Capital
2021 2026 2031 2036 2041
Energy efficiency in 100% dwellings
100% low-carbon heating system retrofit in dwellings
830 MWp of rooftop solar
Energy efficiency in 100% buildings
Low-carbon heating system retrofit in 100% buildings
705 MWp of rooftop solar
16.7% deployment of H2 and 40% of CCS for High Temp process 10% energy efficiency 100% electrification for LT processes
96 MWp of PV
35% of people tele-commuting 50% of time, 25% less personal and retail trips
Private car journey % reduced to 35%, Public Transport up to 27%
Bike increase to 10% of trips
100% of taxis, buses, 50% of HGVs 100% of HGVs
59 MW Wind and 448 MWp of solar PV
Tree coverage in 13% of WMCA area, and 20% of peri-urban area
Upgrade and manage coordination across the energy and associated systems (transport, digital).
Page 41

WMCA 5 Year Plan 2021-26 | Page 6
CO2 Modelling results for 2041 and 2026 (Accelerated Scenario)
✓ Modelling shows implementing all goals gives a 94% reduction by 2041 – net zero is realistic
The ‘accelerated’ scenario results in a 33% reduction to 8.1 MtCO2 per year by 2026 (against a 2016
baseline).
Carbon modelling shows that there is a gap between what is technically possible and socially tolerable
and the Tyndall target of 4.9MtCO2 per year by 2026 .
DRAFT
Page 42

WMCA 5 Year Plan 2021-26 | Page 7
Background
DRAFT
Page 43

WMCA 5 Year Plan 2021-26 | Page 8
Background
Following the approval of the ‘WM2041: A Programme for Implementing an Environmental Recovery ’ in June 2020, the WMCA and stakeholders committed to producing five-year delivery plans with interim carbon budgets and other metrics in support of delivering the net zero carbon target for the West Midlands by 2041.
The aim of this first Five Year Plan (FYP) is to provide clear guidance on the types of measures that will need to be implemented in the 2021-2026 timeframe to reach net zero by 2041.
The West Midlands Combined Authority and stakeholders, must understand where and how investment is required in programmes of delivery and policy changes to support the 2041 target.
The West Midlands Combined Authority also needs to understand how this should be sequenced and the combination of approaches that will need to be taken to get them to a position of net zero by 2041.
DRAFT
Page 44

WMCA 5 Year Plan 2021-26 | Page 9
#WM2041 – Goals and Principles
The original WM2041 plan (published in January 2020) suggested that becoming zero carbon needed to take account of wider social, economic and environmental principles. These are:
Change our economy without leaving anyone
behind
Invest in the resilience of our places
Use our industrial past to create a new future
Create places and connections that help us to meet the climate
challenge
Decouple prosperity from the consumption
of energy and resources
DRAFT
Page 45

WMCA 5 Year Plan 2021-26 | Page 10
Alignment with the UN Sustainable Development Goals
3. Invest in comfortable homes and buildings
2. Make space for sustainable transport
4. Build wealth, and recycle it throughout the region through skills and community ownership
1. Unite people across the region by creating common cause and addressing inequalities
Investing in mitigating and adapting to climate breakdown is
essential for the future of the WMCA region.
The WMCA is committed to a model of inclusive growth
which judges economic activity by the quality of its
outcomes for people and place, aligned with UNSDGs.
DRAFT
Page 46

WMCA 5 Year Plan 2021-26 | Page 11
Evidence based plan
Funding sources, financing and
investment
Common vision for stakeholders
Different existing and potential new routes to delivery
A step change
The first Five Year Plan (FYP) aims to:
Provide an evidence
based spatial plan,
linking up WM2041
and local authority
delivery plans,
projects and
investment
programmes.
Represent a step change
in the way the region
works together to deliver
against environmental
priorities for an inclusive,
prosperous and fair
transition.
Outline the funding
sources, financing and
investment to deliver the
FYP.
Outline different existing and potential new routes to delivery and where this is best led by communities, the public sector, the private sector, or a mixture.
Create a common vision for stakeholdersacross the West Midlands with a strategic plan, policies and outline of practical devolution opportunities to deliver WM2041.
DRAFT
Page 47

WMCA 5 Year Plan 2021-26 | Page 12
Where are we now?
DRAFT
Page 48

WMCA 5 Year Plan 2021-26 | Page 13
About the West Midlands Combined Authority region
It covers an area of over
90,000HaBirmingham, Coventry, Dudley,
Sandwell, Solihull, Walsall, Wolverhampton
2.9m people in
1.15 million homes
0 2 4 6 8 10 12 14
Birmingham
Coventry
Dudley
Sandwell
Solihull
Walsall
Wolverhampton
Proportion of households fuel poor (%)
There is significant variation across the seven local authorities including the levels of fuel poverty (the national average for
fuel poverty is 10.3%) and in the indices of multiple deprivation
0 5 10 15 20 25 30 35 40 45
Birmingham
Coventry
Dudley
Sandwell
Solihull
Walsall
Wolverhampton
Proportion of LSOAs in most deprived 10% nationally
88,600 businesses
across the seven authorities
78,400 businesses employing fewer than 10 people with a similar number turning over less than £1million
1,000 businesses employing more than 100 people with a similar number turning over more than £10million
1.4 million cars registered
in the West Midlands Combined Authority (including 32,000 ultra low emissions vehicles)
75 million vehicle miles taking place annually in the West
Midlands Combined Authority. Over 60% of all journeys are made by car.
455 public EV chargers in the West Midlands
Combined Authority of which 97 are ‘rapid’
DRAFT
Page 49

WMCA 5 Year Plan 2021-26 | Page 14
GHG Emissions in the West Midlands Combined Authority
11,385 ktCO2 emitted across
the seven boroughs in 2018
This broadly mirrors the split in energy consumption for 2018 of
50,238 GWh
CO2
Industry & Commercial
32%
Domestic39%
Transport29%
Energy Use by End User
45% of energy consumption is gas, 32% from petroleum products,
21% from electricity and 2% from other sources
Energy consumption is split evenly between Domestic, Commercial &
Industrial and Transport
The vast majority of gas consumption is for space and water heating, and cooking, whereas petroleum is almost completely
used for transport.
0% 20% 40% 60% 80% 100%
UK Heating Appliances in Homes (%)
Gas Central Heating Electric Storage Heating Oil Central Heating
Other Communal Heating0.000
0.050
0.100
0.150
2020 2025 2030 2035 2040
Emis
sio
ns
Fact
or
(kgC
O2/k
Wh
)
Projected Decarbonisation of Electricity
Page 50

WMCA 5 Year Plan 2021-26 | Page 15
Scope of carbon emissions in FYP
• To estimate carbon emissions from the seven constituent local authorities by considering fuel use within the local authority geographic area only. This is a standard method for regional analysis.
• The rationale for this methodology is that:• The dataset has been developed for use by local authorities and devolved administrations for targeting and
monitoring carbon reduction and energy efficiency policies • Sub-national energy use and GHG emissions data are available from central government. • There is a level of consistency between the reporting from local authorities and allows for easier comparison
and benchmarking.
• The four main fuel categories considered are:• Natural gas • Electricity • Road transport fuels • Residual (non-electricity, non-gas and non-road transport) fuels
• This approach does mean, however, that only energy use undertaken within the physical boundary is considered. Other emissions, such as from the release of fluorinated gases, often used in refrigeration, are omitted.
DRAFT
Page 51

West Midlands Combined Authority area energy consumption
0
10,000
20,000
30,000
40,000
50,000
60,000
70,000
2005 2006 2007 2008 2009 2010 2011 2012 2013 2014 2015 2016 2017 2018A
nn
ual
En
ergy
Co
nsu
mp
tio
n (G
Wh
)
Birmingham Coventry Dudley Sandwell Solihull Walsall Wolverhampton
• Energy consumption in the region is around 50,000 GWh
per annum
• This has fallen by 20% since 2005
• The share is split between domestic (39%),
commercial/industry (32%) and transport (29%)
• 45% of this natural gas, 21% electricity and 32% petroleum
DRAFT
Page 52

• Greenhouse gas emissions in the West Midlands Combined
Authority around 11 MtCO2 per annum
• This has fallen 36% since 2005, mainly due to the
decarbonisation of electricity
• The split of emissions by end-user is:
• domestic (34%),
• commercial/industry (30%) and
• transport (36%)
• The split of emissions by fuel is:
• natural gas (37%),
• electricity (22%) and
• petroleum (36%)
0
2,000
4,000
6,000
8,000
10,000
12,000
14,000
16,000
18,000
20,000
2005 2006 2007 2008 2009 2010 2011 2012 2013 2014 2015 2016 2017 2018A
nn
ual
GH
G E
mis
sio
ns
(ktC
O2)
Birmingham Coventry Dudley Sandwell Solihull Walsall Wolverhampton
West Midlands Combined Authority area GHG Emissions DRAFT
Page 53

Birmingham➢ Council own emissions net zero by 2030.➢ Authority-wide net zero by 2030.➢ Clean air zone from summer 2021➢ Leading energy expertise - Birmingham Energy Institute at University of
Birmingham, Tyseley Energy Park, Energy and Bioproducts Research Institute (EBRI), Energy Systems Catapult
➢ EV charging infrastructure rollout
Coventry➢ Council own emissions net zero by 2030➢ All electric bus city by 2025➢ EV charging infrastructure & RESO project
Dudley➢ Low carbon place project➢ LED streetlighting completion
Walsall➢ Council own emissions net zero
by 2050Wolverhampton➢ Council own emissions net zero
by 2028 and LA wide by 2041➢ New Cross Hospital 6.9MW
solar array
The region is doing a lot already
Sandwell➢ Council own emissions net zero by 2030
and LA wide by 2041➢ Town centre heat network
Solihull➢ Council own emissions net zero by 2030 and LA wide by 2041➢ Town centre heat network➢ Airport net zero by 2033➢ JLR net zero by 2030Birmingham
SolihullCoventry
Walsall
Sandwell
Dudley
Wolverhampton
➢ University research programmes for the built environment
DRAFT
Page 54

WMCA investment and programme development DRAFT
• WMCA is investing in a range of transport schemes being delivered by TfWM totalling £1.1bn including Active Travel supporting cycling and walking, Sprint Bus networks, new and improved rail stations and Midland Metro tram network.
• Regional retrofit programme development to outline investment and opportunities to deliver energy efficiency in buildings. WMCA also helped secure £1m funding to support people in fuel poverty.
• Zero Carbon Homes Charter and Routemap produced to show how the region can deliver zero carbon homes by 2025.
• Energy Capital board brings together key stakeholders for the region’s energy transition, ensuring it supports green growth and removes barriers at the local level. The board is developing the regulatory and devolution requests to government.
• Circular Economy taskforce established Nov 2020 to identify the business and social opportunities by adopting more circular, less wasteful approaches.
• Developed a Green Innovation Challenge with WM5G & 5PRING Accelerator to support new business solutions to our WM2041 challenges that could make use of 5G.
• WM Virtual Forest website launched to accelerate tree planting with regional stakeholders.
• £2m WMCA investment to support Wildlife Ways in Solihull.
• Developed West Midlands National Park concept with Birmingham City University.
Cir
cula
r &
Gre
en
Ec
on
om
yB
uild
ings
Ener
gyTr
ansp
ort
Nat
ura
l C
apit
al
Page 55

National Policy Timeline
Pre-2020
Minimum energy Efficiency Standards (MEES) for new let of at least EPC E
MEES expanded to cover existing Private Rental Sector
Green Home Grants for dwellings
Grid Carbon of 233gCO2/kWh
2020
2023MEES expanded to cover existing non-domestic lets
2025MEES expanded to minimum EPC C for Private Rental Sector, new lets only
Future Homes Standard for construction of new dwellings
Grid Carbon of 175gCO2/kWh
2028
MEES expanded to minimum EPC C for all Private Rental Sector
Heat Pump target installation of 600,000 per year
2030MEES expanded to minimum EPC C for non-domestic lets
Grid Carbon of 137gCO2/kWh
New Car Ban for petrol and diesel engines
10 Point Plan delivered
Clean Growth Strategy as many homes at EPC C as possible
New Car Ban for hybrid engines
Grid Carbon of 68gCO2/kWh
Post-2040
Decarbonised Railwaysmainly electrified in the West Midlands by 2040
National Net Zero target by 2050
Grid Carbon continues to decarbonise
National policy could result in 7% reduction by 2026 for the region
2026
2035
DRAFT
Page 56

WMCA 5 Year Plan 2021-26 | Page 21
Stakeholder Engagement & Data Review
DRAFT
Page 57

WMCA 5 Year Plan 2021-26 | Page 22
The Role of WSP…
240 individuals actively
engaged
97 different organisations
Methods of engagement:
• Regular progress meetings;
• One to one virtual meetings;
• Surveys;
• Presentation at an existing West Midlands network or
meetings; and
• Virtual Workshops (specifically to present on the
WM2041 Five Year Plan).
‘We know and understand that the green agenda is a priority and the direction of the broad
ambitions, however there is limited precision on the details and so, unfortunately little gets done.’
‘Consideration of people’s mindset is important; they are generally supportive of climate change until they either have to change their ways or
spend money’
‘Current committed actions will only move the dial a little – there is a need to go beyond business as
usual’
DRAFT
Page 58

WMCA 5 Year Plan 2021-26 | Page 23
Key Findings from Stakeholders
Interventions
• Energy efficiency, alternative modes of transport and alternative fuels need to be the focus.• Recognition of the importance of nature-based solutions, which should go beyond just tree planting.• Interventions should not just be technological – behaviour change is key.• There are existing commitments around net zero, and varying degrees of implementation that should be
included.
Jobs and Skills
• Engagement and alignment between educational institutions and employment providers is key. • The partnerships and delivery mechanisms are already in place. • Low carbon jobs and skills is still in its infancy with limited confidence and understanding of what the ‘Green
Recovery’ actually means in terms of jobs and skills.• Renewable energy and automotive skills perceived as most important, by most respondents.
Delivery Mechanisms
• Integration and alignment across the region is vital – we all have a role.• Local authorities need to have a central role in delivering and supporting private organisations.• Importance of having a regional approach with the West Midlands Combined Authority.• Engagement and collaboration with suppliers and wider industry seen as key to delivery.• Behaviour change and acceptability of interventions and how they are delivered is important.• There is a need for support through the planning system and consistent policy on land use.
Resources
• Main barriers – access to finance & funding structure, followed by regional powers & infrastructure.• Clear structures and avenues for funding for each intervention would instil confidence.• There is a need for national grid to be able support energy efficient transitions. • The plan needs to include real costs, practicalities, accessible funding options and constraints.• Concerns were raised around paybacks and how much time these might take to be realised.
DRAFT
Page 59

WMCA 5 Year Plan 2021-26 | Page 24
Sectoral Analysis
DRAFT
Page 60

WMCA 5 Year Plan 2021-26 | Page 25
Sectoral Breakdown
SYSTEM MANAGEMENT
Do
mes
tic
Lan
d U
se
Co
mm
erci
al
Tran
spo
rt
Ind
ust
rial
Net Zero
DRAFT
Page 61

WMCA 5 Year Plan 2021-26 | Page 26
15 Main Goals
Domestic
Commercial
Industrial
Transport
Land Use
- Lower energy bills & fuel poverty- Reduce inequalities
Co-benefits of delivery
- Boosting regional competitiveness- Retain energy spend in region - New business opportunity & economic growth
- Cleaner air- Better physical & mental health
- Adapting to climate change- Enhancing biodiversity- Better physical & mental health
These are the 15 main goals and modelling of carbon reduction.*
1 Domestic energy efficiency retrofit
2 Domestic heating retrofit
3 Domestic solar PV
4 Commercial energy efficiency retrofit
5 Commercial heating retrofit
6 Commercial solar PV
7 Industrial energy efficiency & fuels
8 Industrial renewables
9 Avoiding travel
10 Shifting travel
11 Improving passenger service fleets
12 Improving freight fleets
13 Improving private vehicles
14 Land use (renewables)
15 Land use (natural capital)
*The areas of waste and offsetting are not considered in this analysis
DRAFT
Page 62

WMCA 5 Year Plan 2021-26 | Page 27
Delivery Scenarios
1 2 3 4 5 6 7 8 9 10 11 12 13 14 15
Very High
High
Medium
Low
Sector delivery levels for each goal are mainly set at ‘Medium’ or ‘Low’ but are still beyond the business as usual delivery pace.
1 2 3 4 5 6 7 8 9 10 11 12 13 14 15
Very High
High
Medium
Low
A much more rapid and aggressive delivery pace across sectors, with most set at a
“High”. Energy efficiency and fuel switching for industry is medium as the
majority of technologies required are at an early stage of development. Due to its
much smaller scale, solar PV in industrial buildings has been set at a very high
level.
This reference scenario for the plan – it is hugely ambitious.
1 2 3 4 5 6 7 8 9 10 11 12 13 14 15
Very High
High
Medium
Low
This scenario was developed to illustrate what would be required to meet the 2026
target. It is at the limit or beyond what it is technically possible, even ignoring
legislative competence and finance restrictions. It would require large behaviour
change from people and could create unintended consequences. It has not been used,
but can be explored by those seeking to understand what is required.
Three delivery scenarios, moderate, accelerated and maximum, have been considered to show what would be required to reach the
2026 and 2041 targets. A ‘West Midlands Carbon Calculator’ tool has been developed and will be available for people to create their own
scenarios for reaching net zero. These are indicative and specific targets will be set out in business cases and policy that follow the FYP.
Accelerated
Moderate
Maximum 2026 2041
2041
2041
2026
2026
DRAFT
Page 63

WMCA 5 Year Plan 2021-26 | Page 28
Ambition and Timeline under ‘Accelerated’ Scenario to 2041 DRAFT
Domestic
Commercial
Industrial
Transport
Natural Capital
Systems Management
Energy Efficiency
Heating Retrofit
Solar PV
Energy Efficiency
Heating Retrofit
Solar PV
Energy Efficiency
and Heating
Retrofit
Solar PV
Avoid
Shift
Improve
Renewables
Natural Capital
2021 2026 2031 2036 2041
Energy efficiency in 100% dwellings
100% low-carbon heating system retrofit in dwellings
830 MWp of rooftop solar
Energy efficiency in 100% buildings
Low-carbon heating system retrofit in 100% buildings
705 MWp of rooftop solar
16.7% deployment of H2 and 40% of CCS for High Temp process 10% energy efficiency 100% electrification for LT processes
96 MWp of PV
35% of people tele-commuting 50% of time, 25% less personal and retail trips
Private car journey % reduced to 35%, Public Transport up to 27%
Bike increase to 10% of trips
100% of taxis, buses, 50% of HGVs 100% of HGVs
59 MW Wind and 448 MWp of solar PV
Tree coverage in 13% of WMCA area, and 20% of peri-urban area
Upgrade and manage coordination across the energy and associated systems (transport, digital).
Page 64

WMCA 5 Year Plan 2021-26 | Page 29
Goal 1 – Energy Efficiency RetrofitThe installation of specific measures including smart meters, smart thermostats, cavity and solid wall insultation, loft insulation, double glazing and behaviour change.
Goal Level Deployment to end of 2025
<CO2 2026
Low 36,200 dwellings 14kt
Medium 122,000 dwellings 47kt
High 294,000 dwellings 113kt
Very High 1,178,260 dwellings 453kt
Goal 2 – Heating Retrofit
Alongside energy efficiency measures, the installation of renewable heating (nominally air source heat pump) to provide heating and hot water. Hydrogen as an alternative after 2026.
Goal Level Deployment to end of 2025
<CO2 2026
Low 14,000 dwellings 27kt
Medium 20,000 dwellings 37kt
High 292,000 dwellings 559kt
Very High 1,169,000 dwellings 2,238kt
Goal 3 – Solar PV
Microgeneration within homes consisting primary of rooftop solar. Photovoltaics will be the vast majority. Could include storage but this doesn’t change the carbon impact.
Goal Level Deployment to end of 2025
<CO2 2026
Low 156MW of PV 23kt
Medium 207MW of PV 31kt
High 415MW of PV 62kt
Very High 830MW of PV 123kt
Domestic Retrofit
Proportion of savings in 2026 (at High goal level)
DRAFT
0
500
1000
1500
2000
2500
0
200,000
400,000
600,000
800,000
1,000,000
1,200,000
1,400,000
Low Medium High Very High
An
nu
al G
HG
Red
uct
ion
(ktC
O2)
No
. of
Dw
ellin
gsNo. of Homes GHG Saving in 2026
0
20
40
60
80
100
120
140
0
100
200
300
400
500
600
700
800
900
Low Medium High Very High
An
nu
al G
HG
Red
uct
ion
(ktC
O2)
Inst
alle
d C
apac
ity
(MW
)
Solar Deployment GHG Saving in 2026
0
50
100
150
200
250
300
350
400
450
500
0
200,000
400,000
600,000
800,000
1,000,000
1,200,000
1,400,000
Low Medium High Very High
An
nu
al G
HG
Red
uct
ion
(ktC
O2)
No
. of
Dw
ellin
gs
No. of Homes GHG Saving in 2026
Page 65

WMCA 5 Year Plan 2021-26 | Page 30
Goal 4 – Energy EfficiencyEnergy efficiency measures applied to offices, retail and other commercial property types, as identified in the Building Energy Efficiency Surveys
Goal Level Deployment to end of 2025
<CO2 2026
Low 12.5% potential 37kt
Medium 25% potential 75kt
High 50% potential 149kt
Very High 100% potential 299kt
Goal 5 – Heating Retrofit
Applied to a 26,000 retail and 18,000 offices (excluding industry). Replacement of fossil fuel boilers with nominally air source heat pumps. Heat pump COP of 2.75
Goal Level Deployment to end of 2025
<CO2 2026
Low 870 buildings 2kt
Medium 1,250 buildings 2.7kt
High 18,400 buildings 40kt
Very High 73,400 buildings 162kt
Goal 6 – Solar PV
Rooftop Solar PV on commercial properties.
Photovoltaics will be more beneficial in the shorter term as the grid is still comparatively high carbon
Goal Level Deployment to end of 2025
<CO2 2026
Low 132 MW of PV 20kt
Medium 176 MW of PV 26kt
High 353 MW of PV 52kt
Very High 705 MW of PV 105kt
Commercial Retrofit
Proportion of savings in 2026 (at High goal level)
DRAFT
0
50
100
150
200
250
300
350
0.00%
25.00%
50.00%
75.00%
100.00%
Low Medium High Very High
An
nu
al G
HG
Red
uct
ion
(ktC
O2)
Rea
lised
Po
ten
tial
Realised Potential GHG Saving in 2026
0
20
40
60
80
100
120
140
160
180
0
10,000
20,000
30,000
40,000
50,000
60,000
70,000
80,000
Low Medium High
An
nu
al G
HG
Red
uct
ion
(ktC
O2)
Nu
mb
er o
f B
uild
ings
Proportion of properties GHG Saving in 2026
0
20
40
60
80
100
120
0
100
200
300
400
500
600
700
800
Low Medium High Very High
An
nu
al G
HG
Red
uct
ion
(ktC
O2)
Inst
alle
d C
apac
ity
(MW
)
Solar Deployment GHG Saving in 2026
Page 66

WMCA 5 Year Plan 2021-26 | Page 31
Goal 7 – Energy Efficiency & FuelsCovering steel and iron, mineral products, chemicals, mechanical / electrical engineering, vehicles manufactures, textiles, food and beverages, printing, paper and other industries.
Goal Level Description <CO2 2026
Low 5% EE, 8% H2, 10% CCS 118kt
Medium 10% EE, 17% H2, 20% CCS 109kt
High 15% EE, 33% H2, 40% CCS 120kt
Very High 15% EE, 33% H2, 40% CCS 120kt
Goal 8 – Renewables
Rooftop Solar PV on industrial properties. Other opportunities such as waste to energy also likely, but not captured here.
Goal Level Description <CO2 2026
Low 18 MW of PV 3kt
Medium 24 MW of PV 4kt
High 48 MW of PV 7kt
Very High 96 MW of PV 14kt
Industrial Retrofit
Proportion of savings in 2026 (at High goal level)
DRAFT
102
104
106
108
110
112
114
116
118
120
122
0
5
10
15
20
25
30
35
40
45
Low Medium High Very High
An
nu
al G
HG
Red
uct
ion
(ktC
O2)
Tech
no
logy
Dep
loym
ent
Energy Efficiency Hydrogen CCS GHG Saving in 2026
0
2
4
6
8
10
12
14
16
0
20
40
60
80
100
120
Low Medium High Very High
An
nu
al G
HG
Red
uct
ion
(ktC
O2)
Inst
alle
d C
apac
ity
(MW
)Solar Deployment GHG Saving in 2026
Page 67

WMCA 5 Year Plan 2021-26 | Page 32
Goal 9 – Avoiding travel
Increased take up of working from home or working at local hubs. 5-10% work from homes (pre-pandemic levels).Reduction in travel by 25% for retail and business (excluding commuting)
Goal Level Description <CO2 2026
Low 4.4% people/1.6% red. 27kt
Medium 6.6% people/3.1% red. 45kt
High 9% people/6.25% red. 72kt
Very High 35% people/25% red. 308kt
Transport
Goal 10 – Shifting travel
Long term strategy shift in travel in line with city regions such as Munich, Stuttgart and Dusseldorf, where car use accounts for typically 35 - 45% of all journeys, compared to 63% in WMCA.
Goal Level Description <CO2 2026
Low Car: 63%, PT: 8%, B: 3% 146kt
Medium Car: 60%, PT: 10%, B: 4% 188kt
High Car: 59%, PT: 11%, B: 5% 213kt
Very High Car: 35%, PT: 27%, B: 10% 1,306kt
Goal 11 – Improving passenger service fleets
Mandate the electrification of 21,300 taxis and 2,300 buses throughout the region.
Goal Level Description <CO2 2026
Low 2041 Target 45kt
Medium 2035 Target 60kt
High 2030 Target 91kt
Very High 2025 Target 181kt
Proportion of savings in 2026 (at High goal level)
0
20
40
60
80
100
120
140
160
180
200
2015
2020
2025
2030
2035
2040
2045
Low Medium High Very High
An
nu
al G
HG
Red
uct
ion
(ktC
O2)
En
d Y
ear
Year GHG Saving in 2026
DRAFT
0
50
100
150
200
250
300
350
0
5
10
15
20
25
30
35
Low Medium High Very High
An
nu
al G
HG
Red
uct
ion
(ktC
O2)
Per
cen
tage
WfH Trips Reduction GHG Saving in 2026
0
200
400
600
800
1000
1200
1400
0
10
20
30
40
50
60
70
Low Medium High Very High
An
nu
al G
HG
Red
uct
ion
(ktC
O2)
Per
cen
tage
of
Trip
sCar Cycling GHG Saving in 2026
Page 68

WMCA 5 Year Plan 2021-26 | Page 33
Transport
Goal 12 – Improving freight fleets
In line with Midlands Connect Tool, consider the decarbonisation of HGVs nationwide.Assumed electrification, but realise the solution may be a mix of technologies
Goal Level Description <CO2 2026
Low 12.5% of HGVs 52kt
Medium 17% of HGVs 69kt
High 25% of HGVs 104kt
Very High (Same as High) 104kt
Goal 13 – Improving private vehicles
An accelerated uptake during the 2020s, ahead of the 2030 ICE Ban, will increase carbon savings in the shorter term.The CCC projections were used as trajectories.
Goal Level Description <CO2 2026
Low 8% by 2026 161kt
Medium 13% by 2026) 188kt
High 15% by 2026 198kt
Very High (Same as High) 198kt
Proportion of savings in 2026 (at High goal level)
DRAFT
0
20
40
60
80
100
120
0%
5%
10%
15%
20%
25%
30%
Low Medium High Very High
An
nu
al G
HG
Red
uct
ion
(ktC
O2)
Pro
po
rtio
n o
n L
ow
Car
bo
n F
uel
s
Proportion in 2050 GHG Saving in 2026
0
50
100
150
200
250
0%
2%
4%
6%
8%
10%
12%
14%
16%
Low Medium High Very High
An
nu
al G
HG
Red
uct
ion
(ktC
O2)
Pro
po
rtio
n o
f El
ectr
ic C
ars
Proportion in 2050 GHG Saving in 2026
Page 69

WMCA 5 Year Plan 2021-26 | Page 34
Strategic Land Use
Goal 14 – Renewables
Utility scale Solar PV and Wind across the region on poorer quality land. GIS mapping has been undertaken to understand what area is most suitable.
Goal Level Description <CO2 2026
Low 109 MW PV / 12.5 MW Wind 24kt
Medium 111 MW PV / 14 MW Wind 24kt
High 224 MW PV / 30 MW Wind 50kt
Very High 448 MW PV / 59 MW Wind 100kt
Goal 15 – Natural Capital
Enhancing natural capital to sequester carbon. While reducing carbon will be one of the benefits. Wider ecological benefits should be realised as part of this effort.
Goal Level Description <CO2 2026
Low – 1 tree per person/2.5% forest cover
15kt
Medium 8% forest cover/20% peri-urban areas
20kt
High 13% forest cover/20% peri-urban areas
32kt
Very High (Same as High) 32kt
Proportion of savings in 2026 (at High goal level)
0
20
40
60
80
100
120
0
50
100
150
200
250
300
350
400
450
500
Low Medium High Very High
GH
G R
edu
ctio
n (k
tCO
2)
Inst
alle
d C
apac
ity
(MW
)
PV Wind GHG Saving in 2026
DRAFT
0
5
10
15
20
25
30
35
0%
5%
10%
15%
20%
25%
Low Medium High Very High
An
nu
al G
HG
Red
uct
ion
(ktC
O2)
Per
cen
tage
of
WM
CA
Forest Cover Agro-forest GHG Saving in 2026
Page 70

WMCA 5 Year Plan 2021-26 | Page 35
Marginal abatement cost curve (MACC) of ‘Accelerated’ scenario to 2041
The MACC indicates broadly which measures will be more or less cost effective in terms of emissions reduction. These are ranked left to right.
Economic modelling goes to 2041 to allow time for payback beyond 2026, those some measures may have savings well beyond that.
Areas below the x-axis are those where there is a commercial return on investment; while the width of the bar indicates the potential carbon saving that could be achieved.
Costs do not include the start-up and management of the programme itself (e.g. the resource/ staffing requirements, business case development etc). In addition the investment and savings may be attributed to different parties.
The MACC provides the basis for further business case development, highlighting key projects and roles for the WMCA.
DRAFT
(800.00)
(600.00)
(400.00)
(200.00)
-
200.00
400.00
0 10,000 20,000 30,000 40,000 50,000
Mar
gin
al A
bat
emen
t C
ost
(£
/tC
O2
)
GHG Emissions Saving to 2041 (ktCO2)
Marginal Abatement Cost Curve
1 Commercial Microgeneration 2 Industrial Microgeneration
3 Domestic Solar (PV) 4 Transport - Demand Reduction / Digital Connectivity
5 Commercial Energy Efficiency 6 Transport (Fuel Switching) Taxi
7 Transport (Fuel Switching) Bus 8 Land Use - Renewables
9 Domestic Energy Efficiency Retrofit 10 Domestic Heat Pumps Retrofit
11 Commercial Heat Pumps 12 Land Use - Afforestation
Page 71

WMCA 5 Year Plan 2021-26 | Page 36
Summary of investment required by 2026 DRAFT
No. Measure Investment to 2026
1 Domestic energy efficiency retrofit £623m
2 Domestic heating retrofit £2,275m
3 Domestic solar PV £332m
4 Commercial energy efficiency retrofit £365m
5 Commercial heating retrofit £76m
6 Commercial solar PV £270m
7 Industrial energy efficiency & fuels Unquantified
8 Industrial renewables £72m
9 Avoiding travel £23m
10 Shifting travel Unquantified
11 Improving passenger service fleets £178m
12 Improving freight fleets Unquantified
13 Improving private vehicles Unquantified
14 Land use (renewables) £71m
15 Land use (natural capital) £57m
Page 72
WMCA 5 Year Plan 2021-26 | Page 37
Carbon Modelling Results
DRAFT
Page 73
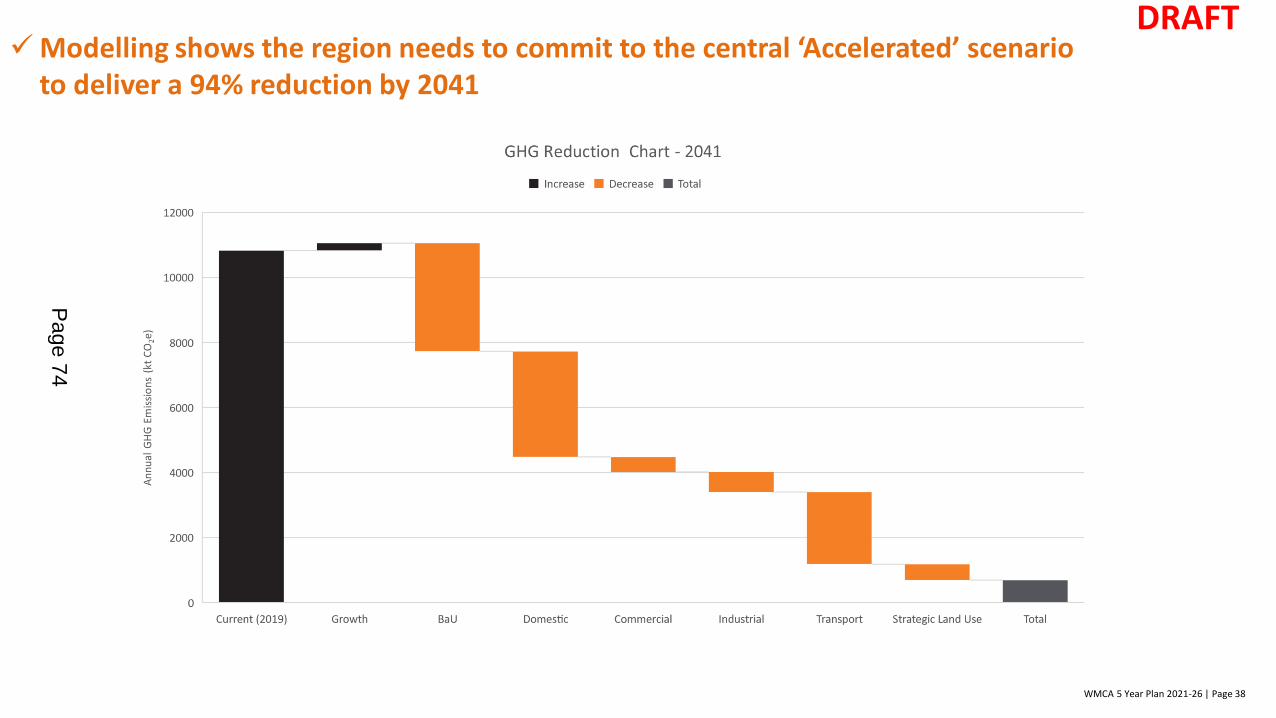
WMCA 5 Year Plan 2021-26 | Page 38
✓Modelling shows the region needs to commit to the central ‘Accelerated’ scenario to deliver a 94% reduction by 2041
DRAFT
Page 74

WMCA 5 Year Plan 2021-26 | Page 39
What does this mean for the first FYP by 2026?
Modelling of the ‘Accelerated’ scenario shows that a 33% reduction is possible by 2026 against a 2016 baseline.
The region would be emitting 8.1Mt CO2 per year.
The suggested Tyndall Centre target for the region to stay within the Paris Commitment is to emit no more than 4.9Mt CO2 by 2026.
This would require radical actions, some of which are not thought feasible in the timescale due to legal, social and financial requirements.
DRAFT
Page 75

WMCA 5 Year Plan 2021-26 | Page 40
What we would need to do reach 4.9Mt CO2 by 2026?
• Retrofit all 1.1 million homes by the end of 2025 and install heat pumps at the same time.
• Retrofit 100% of retail, offices and a range of other non-domestic properties to their maximum potential.
• Maximise rooftop solar across domestic, commercial and industrial sites as well as ground mount – 2.1GW potential of solar to be installed.
• Electrify 100% of taxis (21,000 ) and buses (2,300) within the region.
• Demand management to encourage reduction in travel, and mode and destination shifting, and to avoid demand rebound.
• Cutting car share from 63% of trips to 35%.
DRAFT
Page 76

WMCA 5 Year Plan 2021-26 | Page 41
Ambition and Timeline under ‘Accelerated’ Scenario to 2026
- Given the impetus to decarbonise as soon as possible the report sets out a hugely ambitious, but realistic ‘Accelerated’ to net zero by 2041.
- The WMCA recognises the urgency of carbon reduction and will push the region to accelerate net zero delivery in sectors, where feasible, especially where they bring other benefits to people, the economy and our environment.
DRAFT
Page 77

WMCA 5 Year Plan 2021-26 | Page 42
What does net zero look like?Delivering a net zero society will require significant and unprecedented change. The changes will directly affect people and we need to ensure the transition is fair.
Where do we need to be… Where are we now….
Goal Deployment required for net zero Currently installed in West Midlands Accelerated scenario delivery for 2026
1. Energy efficient
homes1.1m homes (100%)
Smart thermostats at 6% of homes . Smart meters at 31% homes. 27%
of homes with cavity walls have them unfilled. 18% of lofts are insulated
and easy to treat . 7% of homes do not have double glazing.
294,000 homes
2. Heating retrofit 1.1m homes (100%) Almost all homes are on fossil fuel boilers 292,000 dwellings3. Solar PV on rooftops 830MWp Approximately 63MWp to date. 415MWp
4. Energy efficiency 73,400 buildings TBC 37,000 buildings
5. Heating retrofit 73,400 buildings77% of heating and hot water by gas or oil in offices, similarly 63% of
heating and hot water by gas for retail 37,000 buildings
6. Solar PV on rooftops 705MWp Approximately 26MWp to date across non-domestic in total 353MW p
7. Energy efficiency 15% energy efficiency Emerging technologies10% EE, 17% H2, 20% CCS
8. Low carbon heating
retrofit
33% deployment of H2 and 40% CCS for
high temp. 100% electrification of low tempNot yet commercialised technology 17% H2, 20% CCS.
9. Solar PV on rooftops 96MWp Approximately 26MWp to date across non-domestic in total 96MWp
10. Avoid35% people telecommuting 50% of time,
25% less personal / retail trips5-10% work from homes (pre-pandemic levels)
9% people telecommuting and 6.25%
reduction in trips
11. Improve 100% taxis & buses electrification ~1% of buses 100% electrification by 203012. Shift Shift to 35% trips by car 63% of trips by car currently 59% trips by car
13. Renewables 59MW wind and 448MWp of solar potential <20MW of solar 30MW wind and 224MWp solar
14. Natural capital 13% WMCA tree coverage 1% WMCA tree coverage13% forest cover/20% peri-urban areas
Do
mes
tic
Co
mm
erci
alIn
du
stri
alTr
ansp
ort
Lan
d U
seDRAFT
Page 78

WMCA 5 Year Plan 2021-26 | Page 43
Delivery Plan
DRAFT
Page 79

WMCA 5 Year Plan 2021-26 | Page 44
Delivery requires significant acceleration across all sectors by all stakeholders if we are to achieve the 2041 target.
• Local authorities have a key role to play alongside the WMCA. The WMCA is seeking joint approaches to deliver at scale and set the conditions for net zero delivery.
• Private and voluntary sector are needed to collaborate and deliver projects
• Universities and colleges will need to work with employers to ensure there is no skills gap.
• Communities have to work to meet the challenge and ensure a just and equitable transition.
• People will need to make significant changes to their lifestyles which will positively impact on their health and wellbeing.
Lead on or work with others in the region to deliver carbon emissions reduction
The West Midlands Combined Authority can support others to deliver
Using the West Midlands Combined Authority to influence action by others indirectly
To enable FYP delivery, the West Midlands Combined Authority will: DRAFT
Page 80
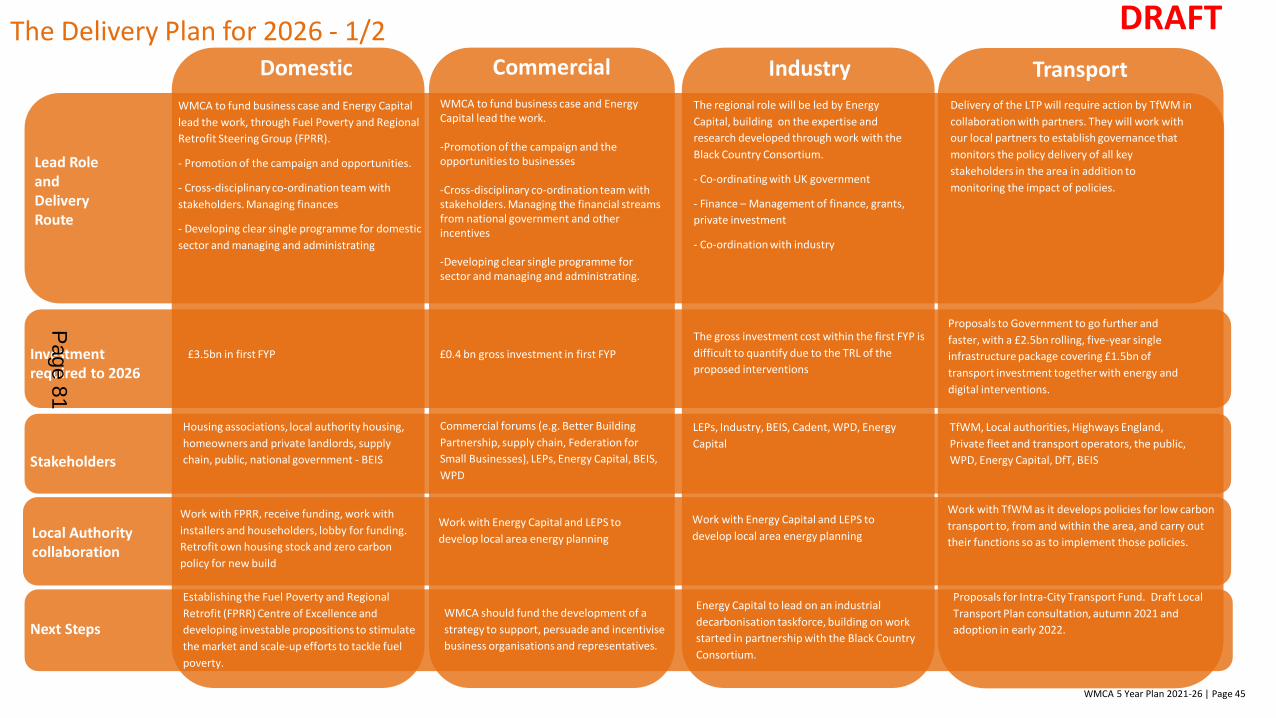
WMCA 5 Year Plan 2021-26 | Page 45
The Delivery Plan for 2026 - 1/2Domestic TransportIndustryCommercial
Lead Role and Delivery Route
Investment required to 2026
Stakeholders
Next Steps
WMCA to fund business case and Energy Capital
lead the work, through Fuel Poverty and Regional
Retrofit Steering Group (FPRR).
- Promotion of the campaign and opportunities.
- Cross-disciplinary co-ordination team with
stakeholders. Managing finances
- Developing clear single programme for domestic
sector and managing and administrating
£3.5bn in first FYP
Housing associations, local authority housing,
homeowners and private landlords, supply
chain, public, national government - BEIS
Establishing the Fuel Poverty and Regional
Retrofit (FPRR) Centre of Excellence and
developing investable propositions to stimulate
the market and scale-up efforts to tackle fuel
poverty.
WMCA to fund business case and Energy Capital lead the work.
-Promotion of the campaign and the opportunities to businesses
-Cross-disciplinary co-ordination team with stakeholders. Managing the financial streams from national government and other incentives
-Developing clear single programme for sector and managing and administrating.
£0.4 bn gross investment in first FYP
Commercial forums (e.g. Better Building
Partnership, supply chain, Federation for
Small Businesses), LEPs, Energy Capital, BEIS,
WPD
WMCA should fund the development of a
strategy to support, persuade and incentivise
business organisations and representatives.
The regional role will be led by Energy
Capital, building on the expertise and
research developed through work with the
Black Country Consortium.
- Co-ordinating with UK government
- Finance – Management of finance, grants,
private investment
- Co-ordination with industry
The gross investment cost within the first FYP is
difficult to quantify due to the TRL of the
proposed interventions
LEPs, Industry, BEIS, Cadent, WPD, Energy
Capital
Energy Capital to lead on an industrial
decarbonisation taskforce, building on work
started in partnership with the Black Country
Consortium.
Delivery of the LTP will require action by TfWM in
collaboration with partners. They will work with
our local partners to establish governance that
monitors the policy delivery of all key
stakeholders in the area in addition to
monitoring the impact of policies.
Proposals to Government to go further and
faster, with a £2.5bn rolling, five-year single
infrastructure package covering £1.5bn of
transport investment together with energy and
digital interventions.
TfWM, Local authorities, Highways England,
Private fleet and transport operators, the public,
WPD, Energy Capital, DfT, BEIS
Proposals for Intra-City Transport Fund. Draft Local
Transport Plan consultation, autumn 2021 and
adoption in early 2022.
Local Authority collaboration
Work with FPRR, receive funding, work with
installers and householders, lobby for funding.
Retrofit own housing stock and zero carbon
policy for new build
Work with Energy Capital and LEPS to
develop local area energy planning
Work with TfWM as it develops policies for low carbon
transport to, from and within the area, and carry out
their functions so as to implement those policies.
Work with Energy Capital and LEPS to
develop local area energy planning
DRAFT
Page 81

WMCA 5 Year Plan 2021-26 | Page 46
Land Use – Natural Capital
Lead Role and Delivery Route
Investment required to 2026
Stakeholders
Next Steps
This will be led by the Environment Team at the West Midlands Combined Authority:
- Promotion of the opportunities around tree planting and other nature-based solutions
- Co-ordinating with local authorities
- Programme Management
£60m within first FYPA budget of ~£200k per annum would be appropriate with 2 or 3 staff dedicated to its management, within the wider team.
Landowners, local authorities, NGOs, business representatives, universities, developers, DEFRA group (to include Natural England, Environment Agency and Forestry Commission) and LEPs.
The WMCA should fund the initial management and administration to promote this with others through a regional natural capital board, develop the full business case, co-ordinating with the stakeholders.
Land Use - Renewables
It is proposed that this is led by Energy Capital, working closely with the WMCA Environment Team and local authorities and regional stakeholders to unlock investment opportunities. The routes to delivery may be different for each opportunity but the emphasis will need to be on delivering at pace and scale.
£50m gross investment within first FYPA budget of ~£200k per annum would be appropriate with 1 or 2 staff dedicated to its management, within the wider team.
Landowners, local authorities, investors and developers
The WMCA should fund the initial management and administration to promote this with others, develop the full business case, co-ordinating with the stakeholders.
Local Authority collaboration
Work with WMCA and other stakeholders to ensure existing natural capital plans are joined up with cross-boundary opportunities. Lobby gov for funding. Develop policies at local level with natural capital group and a natural capital accounting approach.
Work with Energy Capital to identify available land and rooftops, as well as stakeholder opportunities, to install renewables. Develop preferred route to delivery and business cases where LA owned investment.
Cross-cuttingThis will be led by the Environment Team at the West Midlands Combined Authority and will include:
- Management of net zero business pledge
- WM2041 behaviour change, working with communications teams and region stakeholders
- Programme management, administration and reporting of WM2041 progress, including providing the secretariat function for the WM2041 Net Zero Delivery Board
Funding to oversee programme delivery within the WMCA Environment Team. Some elements of the programme may attract external funding, for example, the Net Zero Business Pledge.
Local authorities and key stakeholders such as Sustainability West Midlands to support delivery. All regional stakeholders to be engaged as appropriate
The WMCA should fund the initial management and administration to develop the initiatives.
There are opportunities to work with the WMCA Environment Team to deliver the cross cutting wok on business engagement, carbon literacy and behaviour change programmes.
Delivery Plan for 2026 - 2/2 DRAFT
Page 82
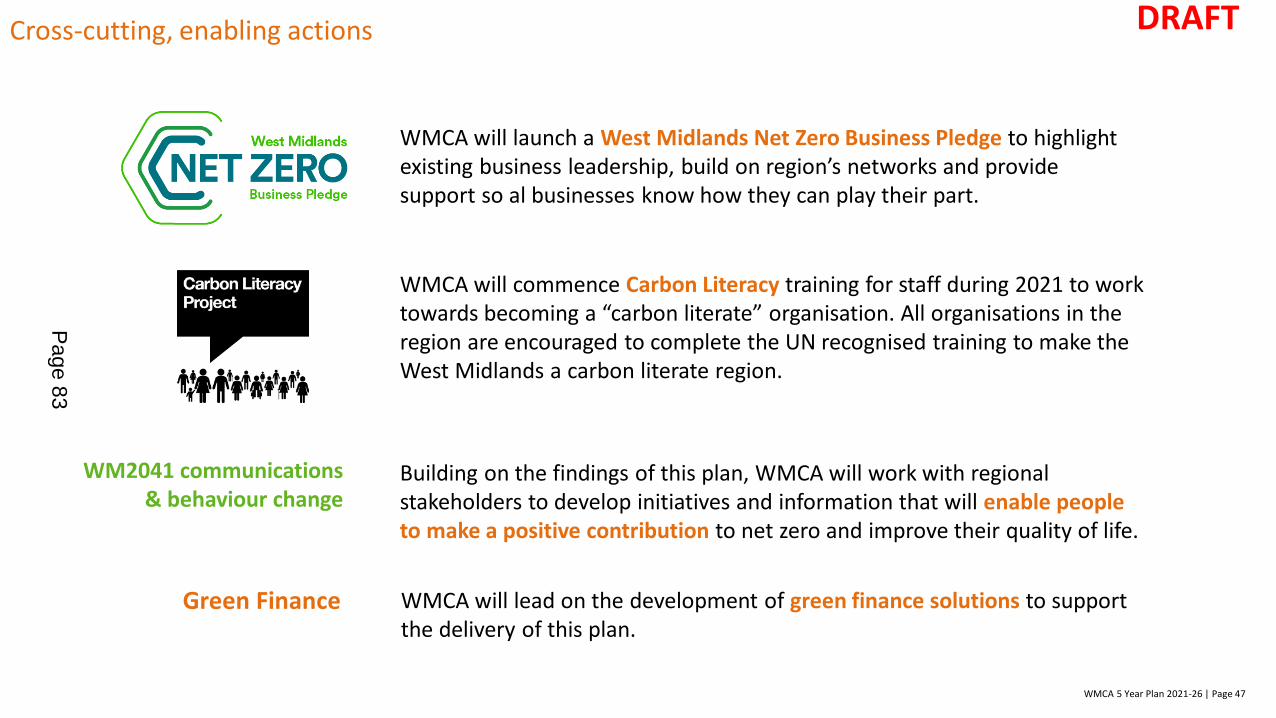
WMCA 5 Year Plan 2021-26 | Page 47
Cross-cutting, enabling actions
WM2041 communications & behaviour change
WMCA will launch a West Midlands Net Zero Business Pledge to highlight existing business leadership, build on region’s networks and provide support so al businesses know how they can play their part.
WMCA will commence Carbon Literacy training for staff during 2021 to work towards becoming a “carbon literate” organisation. All organisations in the region are encouraged to complete the UN recognised training to make the West Midlands a carbon literate region.
Green Finance
Building on the findings of this plan, WMCA will work with regional stakeholders to develop initiatives and information that will enable people to make a positive contribution to net zero and improve their quality of life.
WMCA will lead on the development of green finance solutions to support the delivery of this plan.
DRAFT
Page 83

WMCA 5 Year Plan 2021-26 | Page 48
WMCA’s role in systems management & governance – subject to budget approval DRAFT
In order to ensure a cross-cutting approach to net zero delivery, it is proposed that a new WM2041 Net Zero Delivery Board is established that will:
• Provide oversight of progress against strategy, business cases and delivery to achieve both 2026 and longer term 2041 ambitions;
• Take responsibility for the achievement of net zero goals across the region and advocate for the necessary resources and powers to achieve this.
• Recognise the importance of and facilitate integrated transport, energy and planning at a local level in delivering net zero.
• Enable effective intelligence and data transfer between sectors to enable this.• Keep an eye on the goal and identify policy and regulatory barriers to the achievement of net zero by 2041 in the
region and take action to remove these• Bring together local authorities where appropriate to deliver at scale and the pace required, respecting
subsidiarity and relevant duties and powers;• Recognise the key role of LEPs, businesses, third sectors and education institutions, engaging them in a co-
ordinated and strategic way around net zero delivery;• Receive input from a Net Zero Citizens’ Panel to test solutions and inform decisions developed from the FYP;• Get the region behind net zero and communicating a story together which is compelling and demonstrates
commitment;• Report progress to the WMCA Environment and Energy Board.
Page 84

WMCA 5 Year Plan 2021-26 | Page 49
There will be an ongoing need to monitor performance and report back findings annually to the Environment and Energy Board, which must then be able to inform project planning, specification and resources, including:
• Reviews on delivery and carbon reduction progress (annually)
• Data collection, validation and interpretation (quarterly)
• Defining methodology for performance monitoring (one-off)
• Auditing including governance, risk management and financial control (annually)
• Monitoring and scrutinise performance and reporting against targets (annually)
• Technological assessments and reviews of emerging best practices (twice per FYP period)
• Dissemination of learnings (annually)
• Review of changes in national policy (quarterly)
• External/independent auditing (annually)
Monitoring and Reporting DRAFT
Page 85

WMCA 5 Year Plan 2021-26 | Page 50
Jobs & Skills
DRAFT
Page 86

WMCA 5 Year Plan 2021-26 | Page 51
Where we are Today
Automotive , Logistics, Manufacturinghave shaped the sub-regional economy
• 170,000 jobs in Industry• 116,000 jobs in Transport related roles• 17,000 jobs in Energy sector• 74,000 jobs in Construction and Built
Environment
Control of own Adult Education Budget
Significant changes in existing occupations
will happen at the low and medium-skill
levels
New and emerging occupations will
require higher-level qualifications
Sector Number of jobs
Agriculture, forestry and fishing 400
Mining and quarrying 300
Manufacturing 133,000
Electricity, gas, steam and air conditioning supply 5,500
Water supply; sewerage, waste management and remediation
activities
10,800
Construction 58,600
Wholesale and retail trade; repair of motor vehicles 183,200
Transportation and storage 66,600
Accommodation and food service activities 81,000
Information and communication 30,000
Financial and insurance activities 42,100
Real estate activities 24,400
Professional, scientific and technical activities 84,700
Administrative and support service activities 135,100
Public administration and defence; compulsory social security 50,000
Education 126,800
Human health and social work activities 178,500
Arts, entertainment and recreation 23,300
Other service activities 24,800
DRAFT
Page 87

WMCA 5 Year Plan 2021-26 | Page 52
Green and low carbon skills
1. Low-carbon electricity: Wind power, solar PV, hydropower, nuclear, CCS
2. Low-carbon heat: Renewable heat, heat networks and CHP
3. Alternative fuel: Bioenergy and hydrogen production
4. Energy efficient products: Insulation, lighting, monitoring and control systems
5. Low-carbon services: Low-carbon financial, IT, and advisory services
6. Low-emission vehicles & infrastructure: Low-emission vehicles & infrastructure, fuel cells and
energy storage systems
Around half of automotive companies produce vehicle components in the West Midlands
Increased demand for electric cars will increase jobs in West Midlands - existing manufacturing
capacity
Most jobs created in the WMCA will be in manufacturing low emission vehicles, battery packs and
modules in giga factories situated near existing production sites. Wider mobility services and
products may also play a role and affect demand for new vehicles and create opportunities for
employment in the wider mobility sector.
Also install low carbon heating technologies, energy efficiency products and solar installations
DRAFT
Page 88

WMCA 5 Year Plan 2021-26 | Page 53
New Jobs Created…
Sector Goals Jobs created
Domestic Energy Efficiency Retrofit coordinators, installers and designers
Fuel Switching Heat pump installers
Microgeneration Solar PV installers
Commercial Energy Efficiency Retrofit coordinators, installers and designers
Fuel Switching Heat pump installers
Microgeneration Solar PV installers
Industry Energy Efficiency and Fuel
Switching
Retrofit coordinators, installers and designers, Heat pump
installers
Microgeneration Solar PV installers
Transport Demand Reduction (WFH) Digital skills, jobs in more rural areas in local workspace
hubs, goods deliveries
Fuel Switching (HGVs) Hydrogen, Electric vehicle manufactures
Fuel Switching (Buses, Taxis) Petrol and diesel engine manufacturers
Demand Reduction (Trips) Increase in LGV services and driver from more deliveries
Mode Shift Increased public transport operators & and wider mobility
services and products
EV Uptake EV vehicle manufacturing
Land Use Renewables Solar and wind installers
Natural Capital Tree planters, ecologists, environmental managers,
woodland managers
DRAFT
Page 89

WMCA 5 Year Plan 2021-26 | Page 54
Others Lost…
Sector Goals Jobs lost
Domestic Energy Efficiency
Fuel Switching Gas boiler maintenance repairs
Microgeneration
Commercial Energy Efficiency
Fuel Switching Gas boiler maintenance repairs and gas
transmission
Microgeneration
Industry Energy Efficiency and Fuel
Switching
Microgeneration
Transport Demand Reduction (WFH) Reduced demand for City services such as food and
beverage stores
Vehicle manufacturers
Fuel Switching (HGVs) Petrol and diesel engine manufacturers
Fuel Switching (Buses, Taxis) Petrol and diesel engine manufacturers
Demand Reduction (Trips) Vehicle manufacturers
Mode Shift Vehicle manufacturers
EV Uptake Petrol and diesel vehicle manufacturing
Land Use Renewables
Natural Capital
DRAFT
Page 90
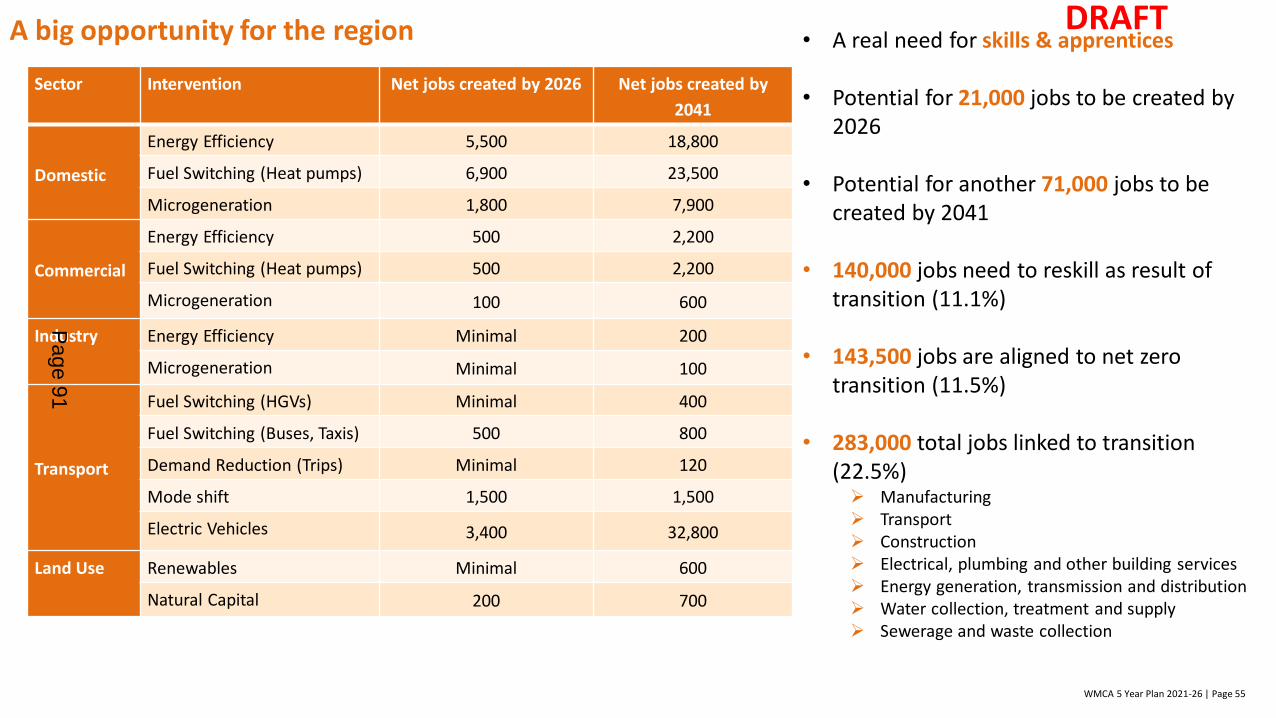
WMCA 5 Year Plan 2021-26 | Page 55
A big opportunity for the region
Sector Intervention Net jobs created by 2026 Net jobs created by
2041
Domestic
Energy Efficiency 5,500 18,800
Fuel Switching (Heat pumps) 6,900 23,500
Microgeneration 1,800 7,900
Commercial
Energy Efficiency 500 2,200
Fuel Switching (Heat pumps) 500 2,200
Microgeneration 100 600
Industry Energy Efficiency Minimal 200
Microgeneration Minimal 100
Transport
Fuel Switching (HGVs) Minimal 400
Fuel Switching (Buses, Taxis) 500 800
Demand Reduction (Trips) Minimal 120
Mode shift 1,500 1,500
Electric Vehicles 3,400 32,800
Land Use Renewables Minimal 600
Natural Capital 200 700
• A real need for skills & apprentices
• Potential for 21,000 jobs to be created by 2026
• Potential for another 71,000 jobs to be created by 2041
• 140,000 jobs need to reskill as result of transition (11.1%)
• 143,500 jobs are aligned to net zero transition (11.5%)
• 283,000 total jobs linked to transition (22.5%)➢ Manufacturing➢ Transport ➢ Construction➢ Electrical, plumbing and other building services➢ Energy generation, transmission and distribution➢ Water collection, treatment and supply➢ Sewerage and waste collection
DRAFT
Page 91

WMCA 5 Year Plan 2021-26 | Page 56
A Day in the Life
DRAFT
Page 92

WMCA 5 Year Plan 2021-26 | Page 57
A day in the life of a West Midlands resident in 2026
Early Morning Mid-Morning AfternoonMidday Evening
7:30 AMAmelia wakes up in her warm home that she has fully retrofitted with loft and wall insulation and new glazing. She no longer has to worry about condensation covered windows or draughts.
7:55 AMAfter breakfast she walks over to her home office, with planning permission from the council she no longer has to work from her dining table!
8:00 AMAmelia works flexibly from home and no longer commutes every day. She uses the extra time to start work early and run errands at lunchtime.
8:05 AMEveryone in the street now has ultra-fast broadband so tele-conferencing is a breeze, even when her partner is also connected.
12:30 PMIt’s a bright sunny day so the rooftop solar panels are generating all of the electricity the home needs. Amelia puts the washing machine on a low temperature wash to take full advantage.
1:00 PMAmelia stops for lunch in the new community pocket park and then heads round the corner to collect some parcels from her local collection hub.
1:30 PMAmelia has a busy afternoon so heads to a flexible office space her company has rented. Once she finishes meetings Amelia makes the final arrangements for a community tree planting event at the weekend.
5:30 PMThere are plenty of electric taxis close by, but instead she rents a bike and uses the newly installed cycle lanes with her parcels in her backpack.
6:00 PMDropping off thebike Amelia opens her phone and turns up the home temperature using her smart thermostat which connects to the heat pump.
9:00 PMAfter dinner, she logs on to the college website to view the new modules available. Amelia is learning new skills to meet the demands of her business clients who want to reduce their carbon impact and improve their competitiveness.
Who is Amelia? Amelia (pronouns: she/her) is in her early thirties working in the professional services industry. She lives in the West Midlands with her partner at their two bedroom home which they own together.
DRAFT
Page 93

WMCA 5 Year Plan 2021-26 | Page 58
Contacts:Barny Evans
[email protected]+44 7827 306 501
As one of the world's leading professional services firms, WSP provides technical expertise and strategic advice to clients in the Transportation & Infrastructure, Property & Buildings, Environment, Industry, Resources (including Mining and Oil & Gas) and Energy sectors, as well as offering project and program delivery and advisory services. Our experts include engineers, advisors, technicians, scientists, architects, planners, surveyors and environmental specialists, as well as other design, program and construction management professionals. With approximately 48,000 talented people globally, we are uniquely positioned to deliver successful and sustainable projects, wherever our clients need us.
www.wsp.com
Page 94

FEBRUARY 2021 CONFIDENTIAL
West Midlands Combined Authority
NET ZERO 2041
Five Year Plan
Independent Technical Report
Page 95

West Midlands Combined Authority
NET ZERO 2041
Five Year Plan
CONFIDENTIAL
TYPE OF DOCUMENT (VERSION) CONFIDENTIAL
PROJECT NO. 70076572
DATE: FEBRUARY 2021
WSP
The Mailbox
Level 2
100 Wharfside Street, Birmingham
B1 1RT
Phone: +44 121 352 4700
WSP.com
Page 96

NET ZERO 2041 CONFIDENTIAL | WSP Project No.: 70076572 February 2021 West Midlands Combined Authority
QUALITY CONTROL
Issue/revision Draft issue Final Draft First Issue
Remarks Draft Report for Comment
Draft Report for Comment
For Distribution
Date 24/12/20 16/01/21 29/01/21
Prepared by Eve Peverley, Sabbir Sidat, Josh Simmons, Adrian Regueira-Lopez
Eve Peverley, Sabbir Sidat, Josh Simmons, Adrian Regueira-Lopez
Eve Peverley, Sabbir Sidat, Josh Simmons, Adrian Regueira-Lopez
Signature
Checked by Sabbir Sidat Sabbir Sidat Sabbir Sidat
Signature
Authorised by Barny Evans Barny Evans Barny Evans
Signature
Project number 70076572 70076572 70076572
Page 97
NET ZERO 2041 CONFIDENTIAL | WSP Project No.: 70076572 February 2021 West Midlands Combined Authority
CONTENTS
1 BACKGROUND AND CONTEXT 9
1.1 CLIMATE CHANGE 9
1.2 NATIONAL CONTEXT 10
1.3 WEST MIDLANDS COMBINED AUTHORITY CONTEXT 10
1.4 FIVE YEAR PLANS 12
1.5 WORKING IN PARTNERSHIP 14
1.6 WHAT IS ALREADY UNDERWAY? 14
1.7 DEVELOPMENT OF FIVE YEAR PLAN 18
2 ENERGY & EMISSIONS OVERVIEW 20
2.1 WEST MIDLANDS COMBINED AUTHORITY ENERGY USE 20
2.2 WEST MIDLANDS COMBINED AUTHORITY GHG EMISSIONS 22
2.3 DOCUMENT REVIEW 25
3 STAKEHOLDER ENGAGEMENT 26
3.1 INTRODUCTION 26
3.2 STAKEHOLDER MAP 26
3.3 SUMMARY OF FINDINGS FROM ENGAGEMENT 27
4 ENERGY AND CARBON MODEL 31
4.1 INTRODUCTION 31
4.2 METHODOLOGY 31
4.3 BUSINESS AS USUAL (BAU) 34
4.4 SUMMARY OF GOALS MODELLED 35
4.5 ASSESSMENT OF SCENARIOS 90
5 ECONOMIC MODELLING 103
Page 98

NET ZERO 2041 CONFIDENTIAL | WSP Project No.: 70076572 February 2021 West Midlands Combined Authority
6 JOBS AND SKILLS 109
6.1 INTRODUCTION 109
6.2 REVIEW 109
6.3 WEST MIDLANDS COMBINED AUTHORITY JOBS AND SKILLS BASELINE 113
6.4 GOALS – JOB IMPACTS 115
6.5 SUPPLY-SIDE 120
7 DELIVERY AND FINANCE 126
7.1 WEST MIDLANDS COMBINED AUTHORITY ROLE 126
7.2 THE DELIVERY PLAN 126
7.3 MONITORING AND REPORTING 135
8 APPENDICES 136
TABLES
Table 1 – Summary of Stakeholder Engagement 27
Table 2 – Commercial energy efficiency potential 45
Table 3 – Industrial energy efficiency potential 56
Table 4 – Example modal change (selected data) 67
Table 5 – Summary of Accelerated Scenario 97
Table 6 – Economic Modelling Assumptions 104
Table 7 – Marginal Abatement Costs of Goals to 2041 107
Table 8 – Investment Costs 107
Table 9 - Broad sector jobs and skills qualitative impact 111
Table 10 – Employment in Transport sector in West Midlands Combined Authority 113
Table 11 - Employment in Built Environment sector in West Midlands Combined Authority
113
Table 12 - Employment in Energy sector in West Midlands Combined Authority 114
Table 13 - Employment in Industry sector in West Midlands Combined Authority 114
Page 99

NET ZERO 2041 CONFIDENTIAL | WSP Project No.: 70076572 February 2021 West Midlands Combined Authority
Table 14 - Goals and high-level jobs impacts 116
Table 15 - Goals and high-level net jobs impacts 117
Table 16 – Industries and jobs impacted 119
FIGURES
Figure 1 – West Midlands Combined Authority Inclusive Growth Framework and SDGs 12
Figure 2 - Project Aims 13
Figure 3 – Overview of the West Midlands Combined Authority Area (constituent members)
14
Figure 4 – Overview of key projects in the seven local authorities 15
Figure 5 – Overview of businesses across the West Midlands Combined Authority (left) and
the transport challenges (right) 18
Figure 6 – West Midlands Combined Authority Energy Use 2005-2018 20
Figure 7 – Annual Energy Consumption Splits 2018 20
Figure 8 – West Midlands Combined Authority Annual GHG Emissions 22
Figure 9 – West Midlands Combined Authority Annual GHG Emissions Splits 23
Figure 10 – West Midlands Combined Authority Annual GHG Emissions Share 23
Figure 11 – WSP’s approach to modelling goals and scenarios 32
Figure 12 – WSP’s approach to the net zero strategy 32
Figure 13 – Goals and Intervention Areas 35
Figure 14 – Goal 1 GHG Emission Saving and Deployment in 2026 37
Figure 15 – Goal 1 Proportion of GHG Emission Saving in 2026 (Accelerated Scenario) 37
Figure 16 – Goal 2 GHG Emission Saving and Deployment in 2026 40
Figure 17 – Goal 2 Proportion of GHG Emission Saving in 2026 (Accelerated Scenario) 40
Figure 18 – Goal 3 GHG Emission Saving and Deployment in 2026 43
Figure 19 – Goal 3 Proportion of GHG Emission Saving in 2026 (Accelerated Scenario) 43
Figure 20 – Goal 4 GHG Emission Saving and Deployment in 2026 46
Figure 21 – Goal 4 Proportion of GHG Emission Saving in 2026 (Accelerated Scenario) 47
Figure 22 – Goal 5 GHG Emission Saving and Deployment in 2026 50
Figure 23 – Goal 5 Proportion of GHG Emission Saving in 2026 (Accelerated Scenario) 50
Page 100

NET ZERO 2041 CONFIDENTIAL | WSP Project No.: 70076572 February 2021 West Midlands Combined Authority
Figure 24 – Goal 6 GHG Emission Saving and Deployment in 2026 53
Figure 25 – Goal 6 Proportion of GHG Emission Saving in 2026 (Accelerated Scenario) 53
Figure 26 – Goal 7 GHG Emission Saving and Deployment in 2026 57
Figure 27 – Goal 7 Proportion of GHG Emission Saving in 2026 (Accelerated Scenario) 57
Figure 28 – Goal 8 GHG Emission Saving and Deployment in 2026 60
Figure 29 – Goal 8 Proportion of GHG Emission Saving in 2026 (Accelerated Scenario) 60
Figure 30 – Goal 9 GHG Emission Saving and Deployment in 2026 63
Figure 31 – Goal 9 Proportion of GHG Emission Saving in 2026 (Accelerated Scenario) 64
Figure 32 – Goal 10 GHG Emission Saving and Deployment in 2026 68
Figure 33 – Goal 10 Proportion of GHG Emission Saving in 2026 (Accelerated Scenario) 68
Figure 34 – Goal 11 GHG Emission Saving and Deployment in 2026 71
Figure 35 – Goal 11 Proportion of GHG Emission Saving in 2026 (Accelerated Scenario) 72
Figure 36 – Goal 12 GHG Emission Saving and Deployment in 2026 74
Figure 37 – Goal 12 Proportion of GHG Emission Saving in 2026 (Accelerated Scenario) 74
Figure 38 – Goal 13 GHG Emission Saving and Deployment in 2026 78
Figure 39 – Goal 13 Proportion of GHG Emission Saving in 2026 (Accelerated Scenario) 78
Figure 40 – Identified potential for utility scale wind 81
Figure 41 – Identified potential for large ground-mounted solar 81
Figure 42 – Goal 14 GHG Emission Saving and Deployment in 2026 82
Figure 43 – Goal 14 Proportion of GHG Emission Saving in 2026 (Accelerated Scenario) 83
Figure 16 –Identified potential for natural capital solutions in agricultural land 84
Figure 45 –Identified potential for natural capital solutions in peri-urban land 85
Figure 46 – Goal 15 GHG Emission Saving and Deployment in 2026 86
Figure 47 – Goal 15 Proportion of GHG Emission Saving in 2026 (Accelerated Scenario) 87
Figure 48 – Summary of Five Year Plan scenarios VS business as usual and proposed
Tyndall carbon budget 90
Figure 49 – Moderate scenario 91
Figure 50 – GHG reduction waterfall chart in 2026 (moderate scenario) 92
Figure 51 – Moderate scenario cumulative effects 93
Figure 52 – Accelerated scenario 94
Figure 53 – Proposed timeline of goals 95
Page 101

NET ZERO 2041 CONFIDENTIAL | WSP Project No.: 70076572 February 2021 West Midlands Combined Authority
Figure 54 – GHG reduction waterfall chart in 2026 (accelerated scenario) 96
Figure 55 – Accelerated scenario cumulative effects 97
Figure 56 – Summary of Accelerated Scenario to 2026 98
Figure 57 – Maximum scenario 99
Figure 58 – GHG reduction waterfall chart in 2026 (maximum scenario) 100
Figure 59 – Maximum scenario cumulative effects 101
Figure 60 – MACC to 2041 (exc. Goals 10, 12 and 13) 105
Page 102

NET ZERO 2041 CONFIDENTIAL | WSP Project No.: 70076572 February 2021 West Midlands Combined Authority 9
1 BACKGROUND AND CONTEXT
WSP have been commissioned by the West Midlands Combined Authority (WMCA) to develop the
first FYP to support them in their commitment to achieve net zero carbon by 2041. It was developed,
working with the WMCA project team and key stakeholders including the seven constituent local
authorities, Transport for West Midlands and Energy Capital. This plan focuses on what the WMCA
is best placed to deliver, in partnership, to play its part in securing a low carbon future.
The FYP is split into the following documents:
▪ Summary document
▪ Technical report
▪ Technical appendices
1.1 CLIMATE CHANGE
It is known that climate change is happening today and is the result of greenhouse gas emissions
caused by human activity. Impacts from climate change are already being felt across the globe and
will continue to increase in the future. Action to limit future global greenhouse gas emissions will
help restrict future changes in the climate system.
Whilst there is no clear threshold where climate change moves from safe to dangerous, it is
expected that there will be disruptions and irreversible losses of natural habitats and resources,
even with a 1.5 or 2°C rise in global temperatures. However, with rapid global action to cut
greenhouse gas emissions, it is possible to limit rises in temperatures to no more than 1.5 – 2°C. On
the other hand, if no action is taken, global temperatures could increase by 4°C or more by the end
of the century.
Globally, the Intergovernmental Panel on Climate Change has identified a range of concerns for the
future, including:
▪ Irreversible impacts – even at more moderate changes in global temperature, particularly for
Arctic ecosystems and coral reefs.
▪ Extreme weather events.
▪ Severe impacts on the world’s poorest and most vulnerable populations.
▪ Environmental and economic damage.
▪ Large-scale singular events (such as further sea level rise as major ice sheets melt over
Greenland and Antarctica).
In the UK:
▪ The average annual temperature is around 1°C warmer than the pre-industrial period.
▪ The chances of experiencing hot summers like in 2018 have doubled in recent decades and
are now about 10-20% per year. Unchecked this will rise to 50% by 2050.
▪ Sea level has risen by 16cm since 1900 and will continue to rise due to time lags in the
climate system.
Page 103
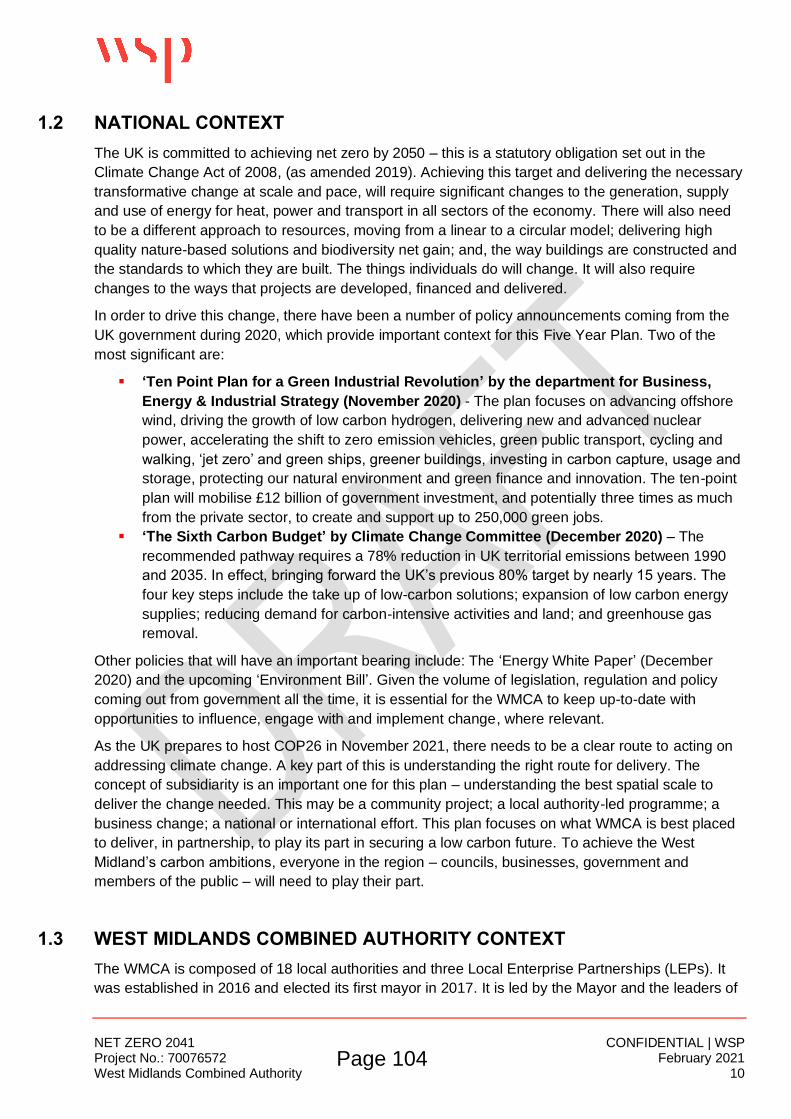
NET ZERO 2041 CONFIDENTIAL | WSP Project No.: 70076572 February 2021 West Midlands Combined Authority 10
1.2 NATIONAL CONTEXT
The UK is committed to achieving net zero by 2050 – this is a statutory obligation set out in the
Climate Change Act of 2008, (as amended 2019). Achieving this target and delivering the necessary
transformative change at scale and pace, will require significant changes to the generation, supply
and use of energy for heat, power and transport in all sectors of the economy. There will also need
to be a different approach to resources, moving from a linear to a circular model; delivering high
quality nature-based solutions and biodiversity net gain; and, the way buildings are constructed and
the standards to which they are built. The things individuals do will change. It will also require
changes to the ways that projects are developed, financed and delivered.
In order to drive this change, there have been a number of policy announcements coming from the
UK government during 2020, which provide important context for this Five Year Plan. Two of the
most significant are:
▪ ‘Ten Point Plan for a Green Industrial Revolution’ by the department for Business,
Energy & Industrial Strategy (November 2020) - The plan focuses on advancing offshore
wind, driving the growth of low carbon hydrogen, delivering new and advanced nuclear
power, accelerating the shift to zero emission vehicles, green public transport, cycling and
walking, ‘jet zero’ and green ships, greener buildings, investing in carbon capture, usage and
storage, protecting our natural environment and green finance and innovation. The ten-point
plan will mobilise £12 billion of government investment, and potentially three times as much
from the private sector, to create and support up to 250,000 green jobs.
▪ ‘The Sixth Carbon Budget’ by Climate Change Committee (December 2020) – The
recommended pathway requires a 78% reduction in UK territorial emissions between 1990
and 2035. In effect, bringing forward the UK’s previous 80% target by nearly 15 years. The
four key steps include the take up of low-carbon solutions; expansion of low carbon energy
supplies; reducing demand for carbon-intensive activities and land; and greenhouse gas
removal.
Other policies that will have an important bearing include: The ‘Energy White Paper’ (December
2020) and the upcoming ‘Environment Bill’. Given the volume of legislation, regulation and policy
coming out from government all the time, it is essential for the WMCA to keep up-to-date with
opportunities to influence, engage with and implement change, where relevant.
As the UK prepares to host COP26 in November 2021, there needs to be a clear route to acting on
addressing climate change. A key part of this is understanding the right route for delivery. The
concept of subsidiarity is an important one for this plan – understanding the best spatial scale to
deliver the change needed. This may be a community project; a local authority-led programme; a
business change; a national or international effort. This plan focuses on what WMCA is best placed
to deliver, in partnership, to play its part in securing a low carbon future. To achieve the West
Midland’s carbon ambitions, everyone in the region – councils, businesses, government and
members of the public – will need to play their part.
1.3 WEST MIDLANDS COMBINED AUTHORITY CONTEXT
The WMCA is composed of 18 local authorities and three Local Enterprise Partnerships (LEPs). It
was established in 2016 and elected its first mayor in 2017. It is led by the Mayor and the leaders of
Page 104

NET ZERO 2041 CONFIDENTIAL | WSP Project No.: 70076572 February 2021 West Midlands Combined Authority 11
the seven metropolitan constituent authorities, each of whom holds a portfolio. Non-constituent
authorities – including eleven local authorities from the wider region and the LEPs – also play a part,
and they collaborate to shape and govern the regional economy.
In June 2019, the WMCA declared a climate emergency and, in July 2019, the Combined Authority
Board received a paper from the Tyndall Centre outlining the trajectory that would be necessary in
order to reach net zero carbon emissions by 2041. This work includes two interim targets of 36%
reduction by 2022 and 69% reduction by 2027. The WMCA’s response to this was the publication of
the paper ‘#WM2041: Actions to meet the climate crisis with inclusivity, prosperity and fairness: a
discussion document’. The paper contained 73 climate actions of varying scale, complexity and
investment requirement and was approved by the WMCA Board in January 2020. The local
authorities that form the WMCA have varying net zero carbon targets (outlined in Section 1.6),
including earlier targets for council operations.
An extensive consultation process followed, which concluded in March 2020, at which point the UK
was hit by the COVID-19 pandemic. It became clear that WM2041 had potential for both addressing
climate change, but also to support a ‘programme for implementing an environmental recovery’
(June 2020). This outlined the short-term actions that would have the potential to bring social and
economic, as well as environmental benefit, to the region at a time that has been hugely challenging
for communities and business. Along with immediate actions, this paper outlined longer term plans
for delivery of WM2041 moving from strategy to delivery at scale.
The WMCA is well-placed to convene stakeholders and to work with local authorities to build the
scale required for investment in many of the schemes that will be required to reach net zero. As
Local Transport Authority it has a duty to develop, publish and implement a Local Transport Plan
and in doing so have regard to relevant national policy including Environment Acts, Climate Change
Acts. In June 2018 WMCA’s Strategic Economic Development (SED) Board formally tasked Energy
Capital, a public-private partnership working on energy infrastructure, hosted by the WMCA, with
responsibility for delivering the targets set out in the Regional Energy Strategy which includes
delivering the region’s share of carbon emission reductions and leading energy related activities on
behalf of the WMCA.
The recent Sixth Carbon Budget from the Climate Change Committee also recognises the
importance of Local Authorities in delivering on carbon reduction, including key powers and duties,
for example: planning powers over buildings and transport; enforcement of building regulations;
powers to ensure buildings meet basic energy efficiency standards; and, duties and powers to
protect the environment, wildlife and heritage.
Inclusive growth is a more deliberate and socially purposeful model of economic growth –
measured not only by how fast or aggressive it is; but also, by how well it is created and shared
across the whole population and place, and by the social and environmental outcomes it realises
for our people.
The need to recognise wider co-benefits is a central theme of the WM2041 plans. The need for this
to be a just and inclusive transition runs through all their work on climate change, which is reflected
through alignment to WMCA’s model of inclusive growth and to the global context established by the
United Nation’s Sustainable Development Goals (SDGs).
Page 105

NET ZERO 2041 CONFIDENTIAL | WSP Project No.: 70076572 February 2021 West Midlands Combined Authority 12
Figure 1 – West Midlands Combined Authority Inclusive Growth Framework and SDGs
1.4 FIVE YEAR PLANS
If WM2041 is the vision of where the WMCA region needs to get to, then the Five Year Plans are
how it can get there. They will package up activity under WM2041 into programmes of work with
clear milestones and, will provide the opportunity to measure progress towards the carbon reduction
target.
The trajectory and overall budget for the region was proposed by the Tyndall Centre undertaking a
review in line with the Paris COP agreements, and adopted by the WMCA in July 2019. The aim of
this first (and subsequent) FYPs is to provide clear guidance on the types of measures that will need
to be implemented to reach net zero by 2041. The WMCA, along with their stakeholders, must
understand where and how to invest in programmes of delivery and develop policy to support the
2041 target. The WMCA also want to understand how this should be sequenced and the
combination of approaches that are needed to get to a position of net zero carbon emissions. This
also needs to be considered in the context of UK policy and regulation and the extent to which it
currently enables/ challenges the ability to achieve net zero sub-nationally.
Importantly, the FYPs need to give the people of the region the confidence that these substantial
policies and investments are going to unlock positive outcomes for them and their places. WM2041
expresses WMCA’s commitment to a net zero pathway that achieves the following outcomes:
▪ We will change our economy without leaving anyone behind.
▪ We will invest in the resilience of our places.
▪ We will use our industrial past to create a new future.
▪ We will create places and connections that help us to meet the climate challenge.
Page 106
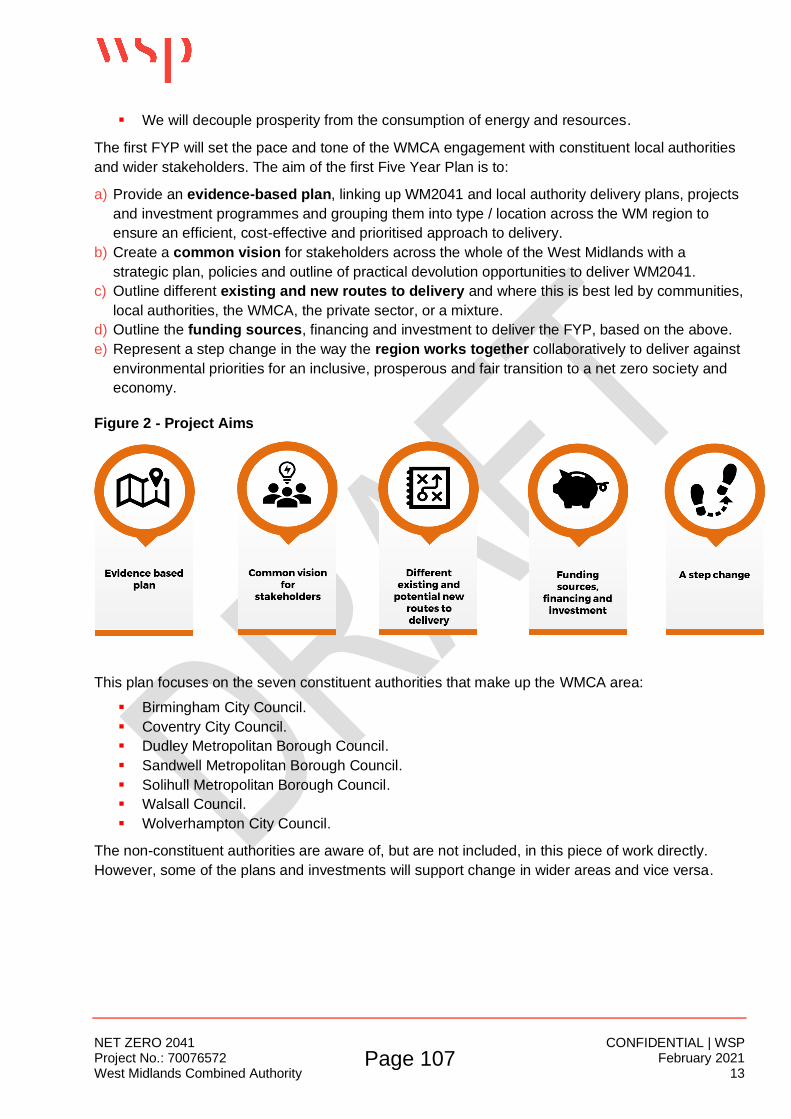
NET ZERO 2041 CONFIDENTIAL | WSP Project No.: 70076572 February 2021 West Midlands Combined Authority 13
▪ We will decouple prosperity from the consumption of energy and resources.
The first FYP will set the pace and tone of the WMCA engagement with constituent local authorities
and wider stakeholders. The aim of the first Five Year Plan is to:
a) Provide an evidence-based plan, linking up WM2041 and local authority delivery plans, projects
and investment programmes and grouping them into type / location across the WM region to
ensure an efficient, cost-effective and prioritised approach to delivery.
b) Create a common vision for stakeholders across the whole of the West Midlands with a
strategic plan, policies and outline of practical devolution opportunities to deliver WM2041.
c) Outline different existing and new routes to delivery and where this is best led by communities,
local authorities, the WMCA, the private sector, or a mixture.
d) Outline the funding sources, financing and investment to deliver the FYP, based on the above.
e) Represent a step change in the way the region works together collaboratively to deliver against
environmental priorities for an inclusive, prosperous and fair transition to a net zero society and
economy.
Figure 2 - Project Aims
This plan focuses on the seven constituent authorities that make up the WMCA area:
▪ Birmingham City Council.
▪ Coventry City Council.
▪ Dudley Metropolitan Borough Council.
▪ Sandwell Metropolitan Borough Council.
▪ Solihull Metropolitan Borough Council.
▪ Walsall Council.
▪ Wolverhampton City Council.
The non-constituent authorities are aware of, but are not included, in this piece of work directly.
However, some of the plans and investments will support change in wider areas and vice versa.
Page 107

NET ZERO 2041 CONFIDENTIAL | WSP Project No.: 70076572 February 2021 West Midlands Combined Authority 14
Figure 3 – Overview of the West Midlands Combined Authority Area (constituent members)
1.5 WORKING IN PARTNERSHIP
Addressing climate change will be a collaborative effort. Ensuring that the right governance and
engagement in place for delivery will be critical for success. This will need to take place alongside
local authority partners to ensure that full account is taken of plans and work happening locally and
that regional plans are not replicating or confusing local activity but rather complementing and
enabling it. Indeed, several local authorities in the region have already pledged to achieve zero
carbon status for their estate and local authority area (under varying timeframes).
In addition to working closely with local authorities, there is a clear role for a range of regional
partners in developing the plans, and delivering the projects, to take the region to 2041, including:
▪ UK government - It is clear that delivery requires a close working relationship with the UK
government, including requests for devolution of powers and resources to support the region
in achieving net zero.
▪ The public – Public support will be crucial to enable the change through personal decisions
and behaviours.
▪ Business - The private sector has a role to play in its own decarbonisation plans, as well as
through project collaboration and financing and investment.
▪ Economic Development Bodies – Including LEPs and Midlands Engine
▪ Other public sector organisations – Such as the Environment Agency, and NHS Trusts.
▪ Universities - The West Midlands universities undertake world-leading research in many of
the relevant areas of this plan.
▪ Voluntary organisations and environmental Non-Governmental Organisations (NGOs)
– Some of the areas in the plan will need to work with community-based groups and NGOs
who may be best-placed to deliver some of the initiatives that will come from this plan.
1.6 WHAT IS ALREADY UNDERWAY?
Much is already happening across the West Midlands region to work towards a net zero carbon
society. Birmingham, Sandwell, Solihull and Wolverhampton councils have all committed to their
organisations achieving net zero carbon status by 2030 or earlier. The overall impact of this will be
small in percentage terms but provides significant leadership and gives confidence to supply chains
to focus on low carbon goods and services.
Page 108

NET ZERO 2041 CONFIDENTIAL | WSP Project No.: 70076572 February 2021 West Midlands Combined Authority 15
Other local delivery programmes include:
Figure 4 – Overview of key projects in the seven local authorities
WMCA’s WM2041 programme activity includes:
Energy
▪ Energy Capital is a public-private partnership working on energy
infrastructure, hosted by the WMCA, leading on the delivery of the Regional
Energy Strategy and a wide range of energy-related projects for the WMCA,
including: defining Energy Innovation Zones to support the development of
local energy solutions, designing smart local energy systems for Coventry
and Rugeley and working with Government to develop policies and systems
to support these. The Energy Capital board brings together key stakeholders
to support the region’s energy transition, ensuring it enables green growth and
removes barriers at the local level. Energy Capital was set up to explore new
models of regional energy governance and delivery and is designing and
championing the WMCA’s regulatory and devolution requests to government
to enable the net zero transition for the region.
Buildings
▪ WMCA has developed a Zero Carbon Homes Charter as part of its work on
housing and land. This sets out the benefits and costs for improving building
standards. New homes and other buildings will need to be zero carbon, or at
least not utilising fossil fuel heating in the near future, the focus therefore
shifts to retrofitting homes. The Charter aims for all new homes to meet zero
carbon standards from 2025.
Page 109

NET ZERO 2041 CONFIDENTIAL | WSP Project No.: 70076572 February 2021 West Midlands Combined Authority 16
▪ A Fuel Poverty and Regional Retrofit programme is in development to
outline investment and opportunities to deliver energy efficiency in buildings.
Retrofitting homes to be fit for purpose is also underway especially around
council owned housing stock. There are 140,000 households in fuel poverty in
the region (with rates exceeding 12% in areas of Birmingham, Coventry and
Wolverhampton) with large estates of 1950/60s housing. The experience
already present within councils will be vital in improving building insulation
levels along with behaviour change advice and energy literacy all of which will
have significant benefits.
▪ WMCA’s Single Commissioning Framework supports a brownfield first
approach which involves regenerating the region’s former industrial sites and
vacant urban plots, helping to protect the Green Belt.
▪ WMCA launched the WM Design Charter which supports the delivery of low
carbon developments, climate resilience, and capitalising on low carbon
technological innovations to build sustainable communities.
Transport
▪ WMCA is investing in a range of transport schemes being delivered by TfWM
totalling £1.1bn including Active Travel supporting cycling and walking,
Sprint Bus networks, new and improved rail stations and Midland Metro
tram network.
▪ WMCA is working with local authorities in the region to co-ordinate and
support the transition to electric and alternative fuelled transport. A ULEV
strategy was developed for the WMCA by Cenex and an energy
infrastructure strategy to support this transition is being developed by Energy
Capital.
▪ The current long-term transport strategy in the West Midlands will see a shift
in emphasis of travel in line with typical large European city regions where car
use accounts for typically 40% of all journeys, compared to 63% in the West
Midlands Metropolitan Area. In addition, the Cycle Charter sets a target for
10% of all journeys to be made by bike in the West Midlands Metropolitan
Area by 2033. The current committed actions are insufficient to meet these
objectives.
Circular Economy
▪ Waste generated and general consumption patterns are considered in several
studies. The WMCA has initiated a Circular Economy Taskforce, which will
have a routemap developed to indicate where there are areas of opportunity
and the Black Country programme around industrial clusters also has the
circular economy at its heart. Whilst there are opportunities around reusing
waste and the circular economy as well as around waste to energy, especially
for industry, the starting point is reducing the waste created in the first place.
Natural Capital
Page 110

NET ZERO 2041 CONFIDENTIAL | WSP Project No.: 70076572 February 2021 West Midlands Combined Authority 17
▪ Natural capital and increasing green cover are a focus. WMCA has launched
its Virtual Forest tree planting platform to support the goal of planting a tree
for every person in the West Midlands, which supports the ambition in the UK
government’s 10-point plan points. This sits within the context of wider
greening initiatives, improving air quality and improving biodiversity and
habitats. The goal set out here, is to go further.
Green Growth
▪ WMCA is also looking to its industrial heritage to support a low carbon future.
This is attracting new industry to the region, e.g. a potential new Gigafactory
for battery production, as well as supporting existing business, e.g. electric
vehicle production at Jaguar Land Rover. The West Midlands accounts for 9%
of manufacturing employment in Britain (with the highest concentration of
manufacturers) which presents an opportunity to lead in this field
▪ Large energy users in the region, have already implemented many of the
‘quick wins’ when it comes to energy efficiency and are working actively to
bring further efficiencies around circular economy and co-location. Ensuring
industries remain competitive is also a priority, as such the regional energy
strategy is core to any regional industrial strategy.
▪ A number of private sector businesses in the region are showing leadership in
delivering net zero including:
o Severn Trent’s ambition to be net zero by 2030 and its aim to plant 1.3 million trees by 2030;
o A pledge by National Express to only buy zero emission buses going forward – the company bought its last diesel bus in 2019;
o E.on ditching all fossil fuel generated electricity in 2015 with customers now receiving renewables as standard;
o Cadent switching all its pipes to plastic to transport hydrogen while looking at hydrogen-ready boilers;
o BT has already switched to 100% renewable electricity and is looking to reduce supply chain emissions by 87% by 2030.
▪ The region as whole is aiming for continued growth, with HS2 stations at
Birmingham and Solihull both pledging to achieve net zero as well as a
number of new residential and commercial developments, regeneration
works, heat networks and transport initiatives.
Page 111

NET ZERO 2041 CONFIDENTIAL | WSP Project No.: 70076572 February 2021 West Midlands Combined Authority 18
Figure 5 – Overview of businesses across the West Midlands Combined Authority (left) and
the transport challenges (right)
1.7 DEVELOPMENT OF FIVE YEAR PLAN
WSP were commissioned to develop the first FYP. This has involved the following:
▪ Reviewing the current situation and planned activities in the region both by the public and
private sector. This allowed understanding of the current capabilities, knowledge base and
ambition levels already present. Where possible, any greenhouse gas emissions reduction
associated with these activities were quantified.
▪ Speaking to the public and private sector stakeholders to ensure the plan considered their views
and addressed key concerns.
▪ Reviewing reports, policies and data available for the region to build the Five Year Plan
effectively on these previous studies and avoid replication.
▪ A jobs and skills analysis for the region. This meant understanding the existing strengths of the
region which could be built upon, the jobs and skills which were under threat as well as those
which would be likely to grow and expand.
▪ Energy and Greenhouse Gas (GHG) emission modelling for the WMCA (covering the seven
constituent members) including:
o Establishing and baseline and understanding of current emissions and sources.
o Business as usual projection to map out how GHG emissions would change based on
existing committed and likely actions.
o Modelling of each of the goals, policies and interventions to quantify their impact and
resultant progress towards the net zero target and ability to meet carbon budgets.
o Recommended goals which may be targeted in order to meet the WMCA’s targets.
Page 112

NET ZERO 2041 CONFIDENTIAL | WSP Project No.: 70076572 February 2021 West Midlands Combined Authority 19
▪ A financial overview of the cost and payback of each of the recommended goals.
▪ Delivery plans which outline the resources required.
Chapter Summary
❖ The UK is committed to achieving net
zero by 2050 – this will require
significant changes throughout the
economy and in people’s lifestyles.
❖ The first Five Year Plan (FYP) will set the pace
and tone of the WMCA engagement with
constituent local authorities and wider
stakeholders.
❖ In June 2019, the WMCA declared a
climate emergency and subsequently
set a target to reach net zero carbon
emissions by 2041.
❖ Much is already happening across the West
Midlands region including developing zero
carbon homes, circular economy, Energy
Innovation Zones and smart energy
management.
❖ The Five Year Plans need to give
confidence in making the right
decisions for people, place and
economy.
❖ Challenges remain around energy-intensive
industries, fuel poverty, fossil fuels in transport
and heating, and the rate of change.
Page 113

NET ZERO 2041 CONFIDENTIAL | WSP Project No.: 70076572 February 2021 West Midlands Combined Authority 20
2 ENERGY & EMISSIONS OVERVIEW
2.1 WEST MIDLANDS COMBINED AUTHORITY ENERGY USE
Energy use across the WMCA in 2018 was approximately 50,000 GWh; Figure 4 represents a
reduction of around 20% since 20051.
Figure 6 – West Midlands Combined Authority Energy Use 2005-2018
Figure 7 – Annual Energy Consumption Splits 2018
1 2018 data have been used throughout the analysis available from the Department for Business,
Energy & Industrial Strategy (BEIS), which publishes with a two-year lag.
0
10,000
20,000
30,000
40,000
50,000
60,000
70,000
2005 2006 2007 2008 2009 2010 2011 2012 2013 2014 2015 2016 2017 2018
An
nu
al E
ne
rgy
Co
nsu
mp
tio
n (
GW
h)
West Midlands Combined Authority Energy Consumption
Birmingham Coventry Dudley Sandwell Solihull Walsall Wolverhampton
Industry & Commercial
32%
Domestic39%
Transport29%
2018 Energy Consumption by End UserCoal &
Manufactured Fuels1%
Petroleum32%
Gas45%
Electricity21%
Bioenergy & Wastes
1%
2018 Energy Consumption by Fuel
Page 114

NET ZERO 2041 CONFIDENTIAL | WSP Project No.: 70076572 February 2021 West Midlands Combined Authority 21
Emissions Scope
To estimate carbon emissions from the seven constituent local authorities, a slightly different
methodology is used for setting the boundary rather than the Scope 1, 2, 3 process used by many
organisations. It considers fuel use within the local authority geographic area only. This is a typical
approach used by many local authorities in the UK.
The rationale for this methodology is that sub-national energy use and GHG emissions data are
easily available from central government. This simplifies the process of data collection. Similarly, it
means that there is a level of consistency between the reporting from local authorities and allows
for easier comparison and benchmarking.
This approach does however mean that only energy use undertaken within the physical boundary
is considered. Other emissions, such as from the release of fluorinated gases, often used in
refrigeration) are omitted.
The four main fuel categories considered are:
▪ Natural gas (generally metered data)
▪ Electricity (generally metered data but excluding energy generated and self-consumed as well
as some very large industrial consumers)
▪ Road transport fuels (estimated based on vehicle and road types)
▪ Residual (non-electricity, non-gas and non-road transport) fuels (estimated)
The sub-national dataset use has been specifically developed for use by local authorities and
devolved administrations for targeting and monitoring carbon reduction and energy efficiency
policies. This dataset differs slightly but is broadly similar to data available from the Digest of UK
Energy Statistics (DUKES) and Energy consumption in the UK (ECUK).
▪ It has been assumed domestic energy consumption patterns in the WMCA broadly mirror the
country as a whole, that the vast majority of gas use for domestic users is for space
heating (76%) and domestic hot water generation (22%) with only 2% used for cooking as
per the ECUK datasets.
▪ In contrast, only 22% of domestic electricity use is for heating and hot water; this is
generally in properties with electric panel or storage heaters (Economy 7). The majority of
electrical usage within homes is associated with lighting (13%) and appliances (59%).
▪ As no area-specific data is available for commercial and industrial energy use, national level
data has been used for the most recent year available to split fuel usage by end-use. This
approach is not ideal, but the region is reasonably representative of the wider country, with
an emphasis on manufacturing.
▪ On that basis, 47% of gas use for commercial and industrial users is for heating and
domestic hot water generation, with a further 11% used in high temperature processes,
22% in low temperature processes, 6% for drying/separation, 4% cooking and 10% unknown
heat generation.
▪ Only 11% of electricity for commercial and industrial users is used for heating and hot
water with a further 19% used in high and low temperature processes as well as drying.
Page 115

NET ZERO 2041 CONFIDENTIAL | WSP Project No.: 70076572 February 2021 West Midlands Combined Authority 22
About 5% is used for cooking, 6% for computing, 11% for cooling/ventilation, with the rest
attributed to lighting, compressors and motors.
▪ Transport energy consumption is predominantly road transport petroleum use. As sub-
national data sets are being used to quantify energy consumption, aviation is not included or
considered within the scope of this assessment in line with the budgeting methodology used.
▪ Petrol and diesel cars make up the majority of petroleum consumption accounting for
64% of the total, the Heavy Goods Vehicles (HGV) and Light Goods Vehicles (LGV) fleet
make up 15% to 17% of the total each with about 4% of petroleum use from the 2,300 buses
operating in the region.
▪ In the last few years energy consumption from light goods vehicles has grown steadily.
The full reasons for the growth in van miles are not fully understood but are not all e-
commerce.
2.2 WEST MIDLANDS COMBINED AUTHORITY GHG EMISSIONS
GHG emissions associated with energy use have reduced 36% from 2005-2018. These emissions
savings are primarily from electricity grid decarbonisation.
Figure 8 – West Midlands Combined Authority Annual GHG Emissions
0
2,000
4,000
6,000
8,000
10,000
12,000
14,000
16,000
18,000
20,000
2005 2006 2007 2008 2009 2010 2011 2012 2013 2014 2015 2016 2017 2018
An
nu
al G
HG
Em
issi
on
s (k
tCO
2)
Combined Authority GHG Emissions
Birmingham Coventry Dudley Sandwell Solihull Walsall Wolverhampton
Page 116

NET ZERO 2041 CONFIDENTIAL | WSP Project No.: 70076572 February 2021 West Midlands Combined Authority 23
Figure 9 – West Midlands Combined Authority Annual GHG Emissions Splits
Figure 10 – West Midlands Combined Authority Annual GHG Emissions Share
▪ Whilst emissions from gas and petroleum have remained static, the decarbonisation of the
electricity grid has meant that emissions from that sector have fallen rapidly, a trend which
is predicted by BEIS to continue into the future, (see Treasury Green Book projections).
▪ The carbon intensity of electricity is already lower than gas and so, in order to meet the
WMCA’s and UK wide carbon emissions targets, a shift away from gas use will be a priority
for buildings, while shifting away from petroleum is also needed in the transport sector.
Industry & Commercial
30%
Domestic34%
Transport36%
2018 GHG Emissions by End User
Gas37%
Electricity22%
Other Fuels5%
Petroleum36%
2018 GHG Emissions by Fuel
-
2,000
4,000
6,000
8,000
10,000
12,000
14,000
16,000
18,000
2005 2006 2007 2008 2009 2010 2011 2012 2013 2014 2015 2016 2017 2018
An
nu
al G
HG
Em
issi
osn
(ktC
O2)
Annual GHG Emissions Share
Gas Electricity Petroleum Other
Page 117

NET ZERO 2041 CONFIDENTIAL | WSP Project No.: 70076572 February 2021 West Midlands Combined Authority 24
▪ 30% of GHG emissions in 2018 were from commercial and industrial activities, whilst 36%
were from transport and 34% from domestic energy consumption. These splits differ from
energy consumption owing to the relative carbon factors for the fuels used.
▪ On a fuel basis, transport emissions (mainly petroleum consumption) represent 36% of
emissions, while the combustion of natural gas results in 37% of GHG emissions. Meanwhile
electricity consumption only accounts for 22% of emissions in 2018.
2.2.1 THE POTENTIAL IMPACT OF COVID-19
There is a two-year delay between the present day and the most recent data available, therefore the
recent shift in energy consumption associated with the COVID-19 pandemic has not been captured
in this report.
Although it will not be until 2022 that the data will be available, it is likely that there will be short and
long-term impacts on energy use and CO2 emissions, including on transport, commercial uses and
home energy demand. Office, retail, industrial and transport emissions are likely to have fallen whilst
dwelling energy use is likely to have risen especially over winter months. There is also the risk of a
high carbon rebound as the region emerges from lockdown, with people being able to travel once
again and likely to choose to travel by car rather than public transport for reasons of personal safety.
2.2.2 TYNDALL CENTRE CARBON BUDGET WORK
Whilst the net zero target by 2041 is a clear end target, there is also a projected trajectory to stay
within the WMCA’s overall carbon budget proposed by the Tyndall Centre.
The Tyndall Centre2 in 2019 quantified the carbon budget for the wider West Midlands for 2020 to
2100, based on science-based targets and their interpretation of the Paris Climate Change
Agreement (December 2015). The projected trajectory in this report was based on translating the
“well below 2°C and pursuing 1.5°C” global temperature target and equity principles in the Paris
Agreement to a national UK carbon budget.
Based on the analysis, for the West Midlands to make its ‘fair’ contribution towards the Paris Climate
Change Agreement, it needed to both reach zero by 2041, but also stay within a cumulative carbon
dioxide emissions budget of 126 MtCO2. This is based around the equity principles in the Paris
Climate Change Agreement where ‘developed’ nations have a smaller share of the global carbon
budget available than ‘developing’ nations.
As the subject of this study is limited to the seven constituent authorities, WSP have re-calculated
this (using a similar methodology) to a cumulative carbon dioxide emissions budget of 74.1 MtCO2
for the period of 2020 to 2100. Using the methodology adopted by the Tyndall Centre, this would
give a carbon budget of 34 MtCO2 for the seven constituent authorities in the 2021 – 2026 budget
period.
2 https://governance.wmca.org.uk/documents/s3219/Appendix.pdf
Page 118
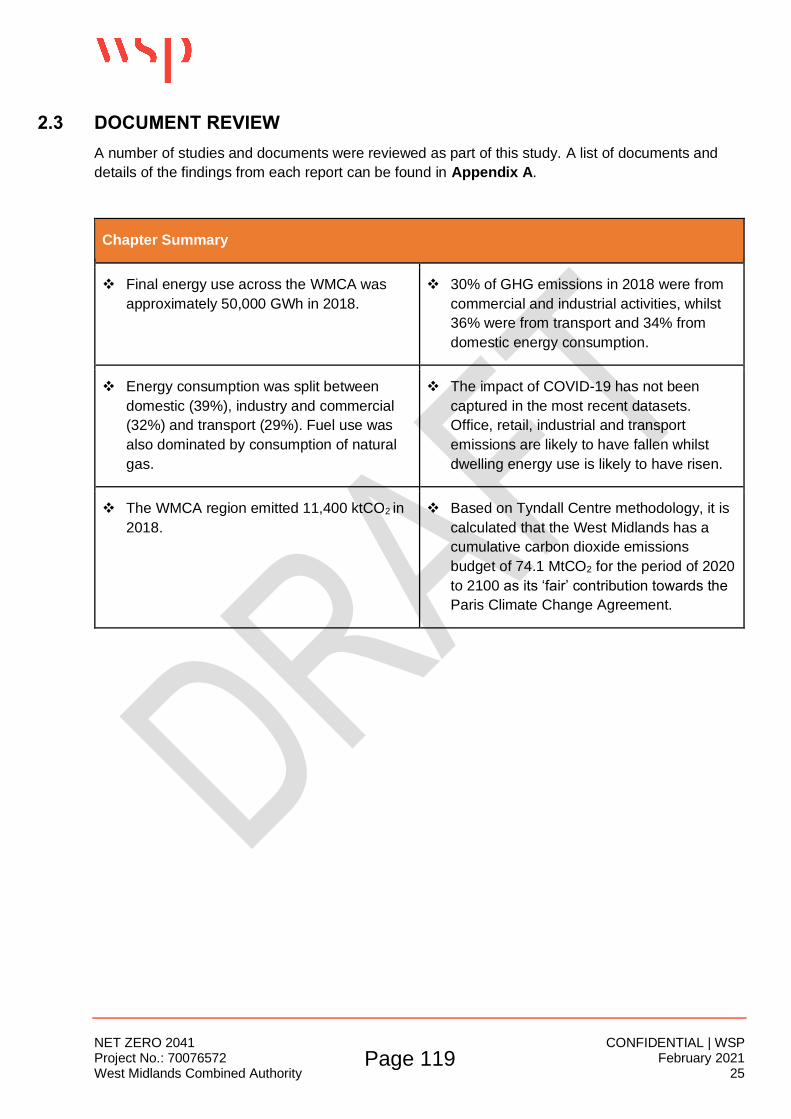
NET ZERO 2041 CONFIDENTIAL | WSP Project No.: 70076572 February 2021 West Midlands Combined Authority 25
2.3 DOCUMENT REVIEW
A number of studies and documents were reviewed as part of this study. A list of documents and
details of the findings from each report can be found in Appendix A.
Chapter Summary
❖ Final energy use across the WMCA was
approximately 50,000 GWh in 2018.
❖ 30% of GHG emissions in 2018 were from
commercial and industrial activities, whilst
36% were from transport and 34% from
domestic energy consumption.
❖ Energy consumption was split between
domestic (39%), industry and commercial
(32%) and transport (29%). Fuel use was
also dominated by consumption of natural
gas.
❖ The impact of COVID-19 has not been
captured in the most recent datasets.
Office, retail, industrial and transport
emissions are likely to have fallen whilst
dwelling energy use is likely to have risen.
❖ The WMCA region emitted 11,400 ktCO2 in
2018.
❖ Based on Tyndall Centre methodology, it is
calculated that the West Midlands has a
cumulative carbon dioxide emissions
budget of 74.1 MtCO2 for the period of 2020
to 2100 as its ‘fair’ contribution towards the
Paris Climate Change Agreement.
Page 119

NET ZERO 2041 CONFIDENTIAL | WSP Project No.: 70076572 February 2021 West Midlands Combined Authority 26
3 STAKEHOLDER ENGAGEMENT
3.1 INTRODUCTION
Achieving net zero across the WMCA area by 2041 will take a collective effort from all types of
organisations. Therefore, it was important as part of this first Five Year Plan (FYP), that key regional
stakeholders were identified, to understand their views, provide an opportunity to input into this plan,
and also to identify where existing resources can be used.
3.2 STAKEHOLDER MAP
Using experience and knowledge of the region, along with WMCA’s existing links and networks,
WSP established a long list of proposed stakeholders to potentially engage with on the project.
This list was verified with the WMCA project team and then a rating was applied to the individual
stakeholders to identify which stakeholders should be prioritised for engagement.
In total, WSP, with the wider WMCA team, identified 110 organisations with which to engage. This
included local authorities, universities, the private sector, NGOs and the WMCA itself. In total 240
individuals across 97 organisations were consulted as part of this project.
Further details on the engagement is included in the Appendix B.
Page 120

NET ZERO 2041 CONFIDENTIAL | WSP Project No.: 70076572 February 2021 West Midlands Combined Authority 27
3.3 SUMMARY OF FINDINGS FROM ENGAGEMENT
A summary of the information gathered from the first stage of engagement is outlined in the
following table. This is split by subject (general, goals, jobs and skills, delivery and resources) while
also identifying where the comments came from.
Table 1 – Summary of Stakeholder Engagement
Who Feedback
General
Local Authorities / Private Sector
There are a variety of regional, individual and organisational commitments relating to the net zero agenda and varying degrees of implementation. Many, even where no specific targets have yet to be established, are recognising it and as a minimum beginning to respond to it. Some of the organisations have publicly committed to net zero targets by specific dates whereas other have not yet set targets.
Goals
Local Authorities, Energy Capital and Housing Associations
Energy efficiency (residential, commercial and industrial) were identified by respondents as being an important area of focus.
Local Authorities, Energy Capital, Education Providers, TfWM, Midlands Connect and Midlands Metro
Alternative modes of transport and alternative fuel transport (electric and hydrogen for larger vehicles) were identified by respondents as being an important area of focus for many. Demand reduction/ management was also identified as important.
Local Authorities, Energy Capital, Education Providers, Private Sector
Interventions already taking place include consideration and implementation of renewable and energy efficiency technologies, such as solar and electrification of fleet.
Local Authorities, Housing Associations, Private Sector
There is uncertainty around the roles of natural gas and hydrogen – the plan needs to allow for that uncertainty
Local Authorities, NGOs, Private Sector
Recognition of the importance of natural capital solutions – not just tree planting, and the wider benefits for biodiversity and health and well-being
Local Authorities, NGOs, Housing Associations, Private Sector
Interventions should not just be technological – behavioural change needs to form a key component of this transition.
Page 121
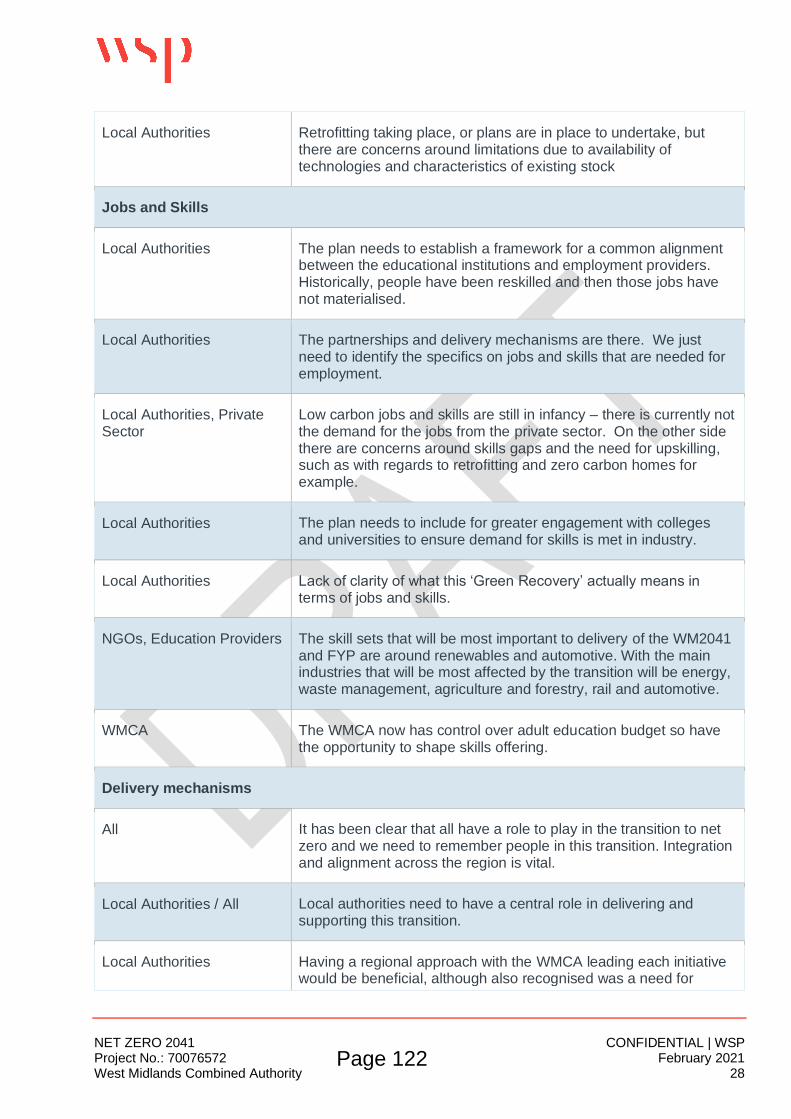
NET ZERO 2041 CONFIDENTIAL | WSP Project No.: 70076572 February 2021 West Midlands Combined Authority 28
Local Authorities Retrofitting taking place, or plans are in place to undertake, but there are concerns around limitations due to availability of technologies and characteristics of existing stock
Jobs and Skills
Local Authorities The plan needs to establish a framework for a common alignment between the educational institutions and employment providers. Historically, people have been reskilled and then those jobs have not materialised.
Local Authorities The partnerships and delivery mechanisms are there. We just need to identify the specifics on jobs and skills that are needed for employment.
Local Authorities, Private Sector
Low carbon jobs and skills are still in infancy – there is currently not the demand for the jobs from the private sector. On the other side there are concerns around skills gaps and the need for upskilling, such as with regards to retrofitting and zero carbon homes for example.
Local Authorities The plan needs to include for greater engagement with colleges and universities to ensure demand for skills is met in industry.
Local Authorities Lack of clarity of what this ‘Green Recovery’ actually means in terms of jobs and skills.
NGOs, Education Providers The skill sets that will be most important to delivery of the WM2041 and FYP are around renewables and automotive. With the main industries that will be most affected by the transition will be energy, waste management, agriculture and forestry, rail and automotive.
WMCA The WMCA now has control over adult education budget so have the opportunity to shape skills offering.
Delivery mechanisms
All It has been clear that all have a role to play in the transition to net zero and we need to remember people in this transition. Integration and alignment across the region is vital.
Local Authorities / All Local authorities need to have a central role in delivering and supporting this transition.
Local Authorities Having a regional approach with the WMCA leading each initiative would be beneficial, although also recognised was a need for
Page 122

NET ZERO 2041 CONFIDENTIAL | WSP Project No.: 70076572 February 2021 West Midlands Combined Authority 29
flexibility as to how individual organisations might implement / integrate or collaborate, such as offsetting and retrofitting to maintain standards.
WMCA Each intervention may require different delivery mechanisms.
Local Authorities, WMCA, Private Sector
There is a need to look beyond short-term and focus on how to deliver medium and long-term aspirations.
WMCA, Private Sector Engagement and collaboration with suppliers and wider industry are key, and further development of energy efficiency markets.
Local Authorities, NGOs, Housing Associations, Private Sector
Behaviour change, acceptability of interventions and how they are delivered is important. We will not be able to do this without support.
Local Authorities, NGOs, WMCA
There is a need for support through the planning system and consistent policy on land use - the region can be supported by national and local initiatives where the WMCA has no planning powers.
Resources
Education Providers, NGOs The main resource barriers in the region to be considered as part of the plan are around finance and the funding structure, followed by regional powers and infrastructure.
Education Providers, NGOs Clear avenues for funding for each intervention would instil confidence.
WMCA There is a need for National Grid to be able support energy efficient transitions.
Local Authorities, Private Sector
The plan needs to include real costs, practicalities, accessible funding options and constraints.
WMCA, Private Sector, Education Providers, NGOs
Some concerns raised around paybacks and how much time these might take to be realised.
Page 123

NET ZERO 2041 CONFIDENTIAL | WSP Project No.: 70076572 February 2021 West Midlands Combined Authority 30
Chapter Summary
❖ Stakeholders differed in their view of key
areas of focus, but work is needed across
all areas.
❖ A regional approach is needed with local
authorities being central to delivery.
❖ Behavioural change needs to form a key
component of this transition.
❖ Funding is seen as a major barrier.
Page 124

NET ZERO 2041 CONFIDENTIAL | WSP Project No.: 70076572 February 2021 West Midlands Combined Authority 31
4 ENERGY AND CARBON MODEL
4.1 INTRODUCTION
A techno-economic model for the WMCA region was created, drawing on data and modelling from
various sources. The aim of this model was to characterise the region and understand the total
impact of each of the identified goals on it.
4.2 METHODOLOGY
4.2.1 SUMMARY OF APPROACH
Step 1 – Prepare a baseline
An energy and GHG emissions baseline was created for the combined seven constituent local
authorities. When considering the historical energy and GHG emissions associated with the region,
the primary data sources used were:
▪ Sub-national total final energy consumption data.
▪ UK local authority and regional carbon dioxide emissions national statistics: 2005 to 2017.
▪ Government emission conversion factors for greenhouse gas company reporting.
This was projected forward using other data sources, including:
▪ Projections of changes in energy consumption in both domestic and non-domestic sectors.
▪ Green Book supplementary guidance: valuation of energy use and greenhouse gas emissions for
an appraisal (for forecasts for the decarbonisation of electricity).
Using the above data sources, an estimate of the projected GHG emissions associated with energy
consumption in the WMCA was generated. (Covered under Section 2).
Step 2 –Business-As-Usual (BAU) scenario
To this baseline, the impact of a ‘Business-As-Usual’ scenario was considered, including all the
actions which are likely to be undertaken or have already been confirmed in the region or nationally.
(Covered under 4.3)
Step 3 – Model goals
15 separate goals were modelled to understand the potential for each on GHG reduction. These
goals are based on stakeholder engagement, the literature review undertaken, existing, and
understanding of future, government policy and WSP’s experience in the field. In each case, there
are four separate goal levels; low, medium and high and very high (the latter representing an
ambition beyond what is currently considered realistic). (Covered under 4.4).
Step 4 – Model scenarios
Three scenarios were developed, based on a differing level of achievement in each of the 15 goals.
These are ‘Moderate’, ‘Accelerated’ and ‘Maximum’. (Covered under 4.5).
Page 125

NET ZERO 2041 CONFIDENTIAL | WSP Project No.: 70076572 February 2021 West Midlands Combined Authority 32
Figure 11 – WSP’s approach to modelling goals and scenarios
4.2.2 INTERVENTION AREAS
The approach undertaken for this study was to split the opportunity areas for reducing GHG
emissions under the following headings:
Figure 12 – WSP’s approach to the net zero strategy
▪ Domestic – There are opportunities related to energy consumption and generation attached to
dwellings. This is further split into energy consumption reduction and efficiency, use of
decarbonised fuels (primarily the electrification of heat considering the 5-year timeframe) and
lastly renewable energy generation (primarily rooftop photovoltaics).
▪ Commercial – There are opportunities related to energy consumption and generation attached to
non-dwellings. This is further split into energy consumption reduction and efficiency, use of
Page 126

NET ZERO 2041 CONFIDENTIAL | WSP Project No.: 70076572 February 2021 West Midlands Combined Authority 33
decarbonised fuels (primarily the electrification of heat considering the 5-year timeframe) and
lastly renewable energy generation (primarily rooftop photovoltaics).
▪ Industrial - There are opportunities related to energy consumption and generation attached to
high energy consumption industries e.g. cement manufacturing, steel and iron manufacturing etc.
Specifically, the focus is on processes which use high temperatures and therefore may require
technologies which are not yet commercialised such as hydrogen and carbon capture and
storage.
▪ Transport – There are emissions associated with all forms of personal and goods transport. This
was built around the A-S-I concept of avoid, shift and lastly improve. Firstly, opportunities to
reduce the need to travel were considered. Next, where travel is needed it should favour active
travel and low carbon modes of transport. Lastly, each of the transport modes should switch to
low carbon fuel sources, likely to be electrical in the short term, but potentially hydrogen, biofuels
or other technologies further out in time.
▪ Land Use – There are opportunities to reduce GHG emissions by considering large-scale land
use options. The focus here is on low value land and how this can be used to improve natural
capital or the potential for renewable energy generation. (See spatial mapping Appendix C for
details).
▪ System Management - Underpinning all of these aspects are considerations around system
management, ensuring that the infrastructure needed to support the changes is in place. The
infrastructure and human management needed to support decarbonisation across the WMCA will
need to evolve to meet the needs of the technologies and wider behavioural changes that will be
deployed over the next 20 years. The two biggest areas in which significant changes are
expected are electricity and gas.
Hydrogen infrastructure upgrades have been considered in this study and could play a role in
most of the sectors. They have been assumed only in the industrial sector as an option to support
high-temperature process heating, based on on-site container as feedback from the stakeholders
was that hydrogen in the mains gas network would not be available until post-2030. The cost of
hydrogen fuel (being multiple times higher than natural gas or heat pumps) along with limited
availability of suitable boilers means this technology is not considered in the short term for the
domestic sector.
Many of the technologies that have been identified involve the replacement of a gas-powered
heating system with one that uses electricity. This applies to heat pumps as well as heat
networks, and it is assumed that all new heat networks will use a low carbon source of heat
rather than gas; as is the case with all three of the networks currently planned for the region.
There are existing heat networks in the region for which there is no simple solution to make them
low carbon at present.
The combination of electrifying transport and heat will increase electrical demand substantially
with estimates, (by the National Grid and others) suggesting a two to three-fold increase in the
annual demand, depending on the use of hydrogen and energy efficiency. Although smart energy
systems and management could reduce the costs of dealing with this if implemented effectively,
achieving net zero will result in significant cost to consumers nationally (see below), as
Page 127

NET ZERO 2041 CONFIDENTIAL | WSP Project No.: 70076572 February 2021 West Midlands Combined Authority 34
importantly, the electrical and gas infrastructure is regulated nationally and makes local
investment for anticipated needs challenging. How costs are apportioned and how energy
regulation is changed to enable the achievement of net zero will be an important issue for local
areas when determining their route to decarbonisation.
4.3 BUSINESS AS USUAL (BAU)
After the baseline and targets were established the next step was consideration of where policies,
plans and trends would take the region, if no other action was taken; the Business-As-Usual
Scenario. These actions already represent a significant step change from the way things have
happened in the past and would require continued effort in order to bring to fruition. The main factors
are listed below and explained further in Appendix D:
▪ Decarbonisation of electricity.
▪ Minimum energy Efficiency Standards (MEES).
▪ Housing growth.
▪ Commercial growth.
▪ Electrification / hydrogen use in transport.
▪ Council decarbonisation.
▪ Organisation decarbonisation.
▪ Other committed projects.
Modelling for the BAU has not simply assumed that local authority area wide targets are delivered,
rather it reflects the activity underway.
Page 128

NET ZERO 2041 CONFIDENTIAL | WSP Project No.: 70076572 February 2021 West Midlands Combined Authority 35
4.4 SUMMARY OF GOALS MODELLED
Goals have been proposed to deliver CO2 emissions savings and concomitant benefits in line with
the wider aims of WM2041. The assumptions which underpin these are described in Appendix E.
Modelling for the goals and scenarios provides an indication of the delivery required to reach net
zero. The specific level of interventions will be developed through policy and business cases, for
example, the detail of the transport goals will be subject to development of the new Local Transport
Plan.
A West Midlands Carbon Calculator has been produced so that people can review the goals and
scenarios to understand different pathways to achieving net zero carbon.
Figure 13 – Goals and Intervention Areas
Page 129

NET ZERO 2041 CONFIDENTIAL | WSP Project No.: 70076572 February 2021 West Midlands Combined Authority 36
4.4.1 GOAL 1 – DOMESTIC ENERGY EFFICIENCY RETROFIT
Description
The installation of specific measures, (where not already present), including smart meters, smart
thermostats, cavity and solid wall insulation, loft insulation, double glazing and other water saving
measures, alongside behaviour change.
The savings potential for these measures all vary, but data exists on the average savings that can
be attributed to each. No major changes are needed to the overall property construction.
Smart meters can still be installed at 69% of dwellings, smart thermostats (94%), cavity (14%) and
solid wall insultation (27%), loft insulation (18%), double glazing (7%). These figures only cover
properties classed as 'easy to treat' rather than all remaining dwellings. There may also be
restrictions in conservation areas for certain external features such as glazing or external cladding.
This means that while some properties may need several pieces of work undertaken, others may
already have the above installed and need no further actions. It is likely the solution would be a
multi-measure approach as appropriate to each home, which would be less disruptive, and cheaper.
Planning Implications3
Most of the initiatives under Goal 1 would not require planning permission, as they would not lead to
external alterations to buildings by virtue of the Town and Country Planning Act 1990 (as amended).
Where proposals relate to Listed Buildings, they are likely to require consent (including insulation
and window replacement). Some authorities may also control double glazing in Conservation Areas
too, through Article 4 Directions.
Goal Levels
The aim is to reach 100% of homes to incorporate all of the above technologies as well as water
saving devices.
▪ Low – Local authority owned dwellings, socially rented and private rented dwellings
(486,660) by 2041; equivalent to 36,200 dwellings by 2026.
Local authorities are already responsible for their own housing stock and so are undertaking these
actions as a matter of course. As such experience and supply chains already exist. Minimum Energy
Efficiency Standards (MEES) already exists for the rented sector. Over the last few years, these
have expanded both in coverage and minimum ratings that should be achieved. In addition, the
threshold for capital expenditure has also been raised leading to a larger onus on landlords. There is
also currently a benefit to installing efficient gas boilers, which may work against the aims of Goal 2.
▪ Medium – All dwellings (1,178,000 dwellings) by 2041; equivalent to 122,000 dwellings by
2026.
3 This section draws out current planning considerations with regards to implementation rather than suggestions or recommendations for planning policy.
Page 130

NET ZERO 2041 CONFIDENTIAL | WSP Project No.: 70076572 February 2021 West Midlands Combined Authority 37
The owner-occupied housing stock is the hardest to reach as the responsibility is for the homeowner
and as such it will need to be attractive to the homeowner or they must be persuaded of the wider
benefits to society.
▪ High – All dwellings in WMCA (1,178,000 dwellings) by 2031; equivalent to 294,000
dwellings by 2026.
The high level would see a much higher deployment rate than the medium scenario and would
require a rapid increase in the rate of deployment of energy efficiency, driving the supply chain and
demand from owners. The relatively low intrusiveness of the measures considered makes this
easier to achieve.
▪ Very High – All dwellings in WMCA (1,178,000 dwellings) by 2026
Figure 14 – Goal 1 GHG Emission Saving and Deployment in 2026
Figure 15 – Goal 1 Proportion of GHG Emission Saving in 2026 (Accelerated Scenario)
Co-benefits and Inclusive Growth
• This intervention will directly work to reduce fuel poverty and its consequences by reducing
energy consumption and increasing thermal comfort.
0
50
100
150
200
250
300
350
400
450
500
0
200,000
400,000
600,000
800,000
1,000,000
1,200,000
1,400,000
Low Medium High Very High
An
nu
al G
HG
Red
uct
ion
(ktC
O2)
No
. of
Dw
ellin
gs
No. of Homes GHG Saving in 2026
0% 10% 20% 30% 40% 50% 60% 70% 80% 90% 100%
Page 131

NET ZERO 2041 CONFIDENTIAL | WSP Project No.: 70076572 February 2021 West Midlands Combined Authority 38
• The greatest potential for carbon reduction will come from the homes in the worst condition,
creating an incentive to prioritise people in poor quality housing.
• A reduction in dwelling boiler use will result in improved air quality.
• The investment required to deliver this goal will create significant employment opportunities
at a variety of skills levels, creating opportunities for local people.
Improving dwelling insulation may not directly result in a reduction in fuel use, as people who have
been underheating their homes may use the same fuel more effectively. But overall, the benefits of
investing into domestic energy efficiency retrofit has the potential will accrue to every resident of this
region and has high potential for delivering inclusive growth.
We will change our economy
without leaving anyone behind P
os
itiv
e
Imp
ac
t
− Reduction in fuel poverty and improved health and wellbeing
− Benefitting the least well off in society the most
We will invest in the resilience of
our places Po
sit
ive
Imp
ac
t
− Reduction of energy demand
− Improved building resilience to changes in external conditions
We will use our industrial past to create a new
future Ne
utr
al
− No impact
We will create places and
connections that help us to meet
the climate challenge
Po
sit
ive
Imp
ac
t
− Improved climate resilience of buildings
We will decouple
prosperity from the
consumption of energy and resources
Po
sit
ive
Imp
ac
t
− Reduction in energy consumption
Page 132

NET ZERO 2041 CONFIDENTIAL | WSP Project No.: 70076572 February 2021 West Midlands Combined Authority 39
4.4.2 GOAL 2 – DOMESTIC HEATING SYSTEM RETROFIT
Description
The retrofit of non-fossil-fuel heating systems in dwellings is one of the key actions necessary to
decarbonise the domestic sector and offers significant carbon savings. This goal assumes that heat
pumps will be the technology of choice, as they are currently the low-carbon technology with the
largest decarbonisation potential. As such, the Government has committed to 600,000 heat pump
retrofit installations by 2028 in their recent Ten Point Plan. While hydrogen may be an option in the
longer term, it is unlikely to be commercially available in the next five years.
Due to the different way in which heat pumps operate to gas boilers, an important part of retrofitting
heat pumps consists in ensuring a good design and installation has taken place, as well as
educating the user on how to operate the new system. Heat pump retrofits will generally require
other energy efficiency measures installed beforehand or at the same time, which would enable a
lower-sized heat pump to be installed (therefore reducing its cost) and operate at lower
temperatures, which increases heat pump efficiency. A well-designed heat pump system in a well-
insulated home should result in lower running costs. As such, coordination of Goals 1 and 2 will be
required.
There are currently a number of Government schemes that financially support the retrofit of heat
pumps, such as the Domestic Renewable Heat Incentive, the Green Homes Grant (which has been
extended until 2022), as well as an upcoming Clean Homes Grant.
Planning Implications
An air source heat pump on domestic premises is considered to be permitted development (PD), not
needing an application for planning permission, provided limits and conditions of Part 14 Class G of
the General Permitted Development Order 2015 (as amended) (GDPO), are met (not detailed in full
here).
These PD rights apply to the installation, alteration or replacement of an air source heat pump on a
house or block of flats, or within the curtilage (garden or grounds) of a house or block of flats,
including on a building within that curtilage. A block of flats must consist wholly of flats (e.g. should
not also contain commercial premises)
There are further restrictions in Conservation Areas and World Heritage Sites and the rights do not
apply to installations within the curtilage of a Listed Building or within a site designated as a
Scheduled Ancient Monument. In instances where the rights do not apply the requisite consent
would need to be sought.
Goal Levels
The aim is to achieve heating system retrofits in 100% of homes by 2041. This exceeds the national
targets, as set out by the Climate Change Committee, to achieve close to 100% decarbonisation by
2050. Rapid action is required this decade to meet this target.
▪ Low – 331,000 dwellings by 2041, and 13,850 by 2026.
This scenario assumes a less ambitious installation trajectory, with slow deployment in the 2020s
and a ramp up after 2030s. It would be broadly in line with the recently announced UK government
Page 133

NET ZERO 2041 CONFIDENTIAL | WSP Project No.: 70076572 February 2021 West Midlands Combined Authority 40
Ten Point Plan. Local authorities should aim to undertake these in their own housing stock, in
combination with energy efficiency measures.
▪ Medium – 550,000 dwellings by 2041; equivalent to 20,000 by 2026.
This scenario assumes the deployment trajectory modelled in the Sixth Carbon Budget report. This
trajectory is based on a ban on gas boilers in 2033, and other fuels in 2028. The trajectory is not
linear, and the majority of installations take place after 2031. Local authority and socially rented
dwellings could be prioritised.
▪ High – All dwellings in WMCA (1,178,000) by 2041; equivalent to 292,000 by 2026.
This is the maximum deployment that is considered as achievable, as it exceeds national targets
and it assumes a linear level of deployment from 2021, in order to match the FYP’s aims. It is
expected that a small portion of dwellings cannot install heat pumps due to planning issues or lack
of technical feasibility, but these may use other sources, and could be dealt with post-2026.
▪ Very High – All dwellings in WMCA (1,178,000) by 2026
Figure 16 – Goal 2 GHG Emission Saving and Deployment in 2026
Figure 17 – Goal 2 Proportion of GHG Emission Saving in 2026 (Accelerated Scenario)
0
500
1000
1500
2000
2500
0
200,000
400,000
600,000
800,000
1,000,000
1,200,000
1,400,000
Low Medium High Very HighA
nn
ual
GH
G R
edu
ctio
n (k
tCO
2)
No
. of
Dw
ellin
gs
No. of Homes GHG Saving in 2026
0% 10% 20% 30% 40% 50% 60% 70% 80% 90% 100%
Page 134

NET ZERO 2041 CONFIDENTIAL | WSP Project No.: 70076572 February 2021 West Midlands Combined Authority 41
Co-benefits and Inclusive Growth
• This intervention will directly work to reduce air pollution currently generated by gas boilers.
• In conjunction with Goal 1, it should deliver affordable heat and thermal comfort to their
users, improving their health and well-being. However, care must be taken to ensure
residents can make efficient use of heat pumps.
• There is an opportunity to create shared heat pump infrastructure for groups of homes in
areas of medium and high density, to ensure that any upfront cost is manageable, and
efficiency maximised. This also creates opportunities for models of community heat
ownership, including co-operative and mutual models
• The growth of the heat pump market will create significant business opportunities and new
jobs, such as potential manufacturing plants and design and installation companies. It is also
a complementary skill set to many existing jobs: for example, if you know how to fit a boiler,
you may learn how to fit a heat pump.
We will change our economy
without leaving anyone behind P
os
itiv
e
Imp
ac
t
− In conjunction with Goal 1, delivering affordable heat and thermal comfort
We will invest in the resilience of
our places Po
sit
ive
Imp
ac
t
− Reduction in dependence on fossil fuels
− Buildings will decarbonise with the electricity grid making them ‘Future Ready’
We will use our industrial past to create a new
future Po
sit
ive
Imp
ac
t
− Using engineering and manufacturing base to develop heat pump manufacture and associated systems.
We will create places and
connections that help us to meet
the climate challenge
Po
sit
ive
Imp
ac
t
− Buildings will decarbonise with the electricity grid making them ‘Future Ready’
We will decouple
prosperity from the
consumption of energy and resources
Po
sit
ive
Imp
ac
t
− Reduction in use in fossil fuels
Page 135

NET ZERO 2041 CONFIDENTIAL | WSP Project No.: 70076572 February 2021 West Midlands Combined Authority 42
4.4.3 GOAL 3 – DOMESTIC PHOTOVOLTAICS
Description
With a rapid decline in installation costs in the last few years, PV is a cost-effective way to reduce
carbon emissions. It can significantly reduce the amount of electricity a property needs to draw from
the network and if combined with energy storage, it can help reduce electricity consumption when it
is more expensive and higher carbon.
The government’s flagship Feed-In Tariff scheme that led to the installation of over 5.6 GWp of solar
PV in the UK, with 2.6 GW on domestic roofs, has come to an end. It was replaced in 2020 with the
Smart Export Guarantee, where energy suppliers are obligated to remunerate excess PV generation
to the grid, although the greatest benefit remains in the displacement of the need to buy energy from
the grid. Average prices for installed systems continued to fall, but the reduction in incentives has
dampened the market for residential solar.
Other microgeneration technologies exist, such as micro-wind or solar thermal, but have not been
considered due to lack of commercial maturity and their low installation levels at present.
The Birmingham Solar PV Study report (December 2016) used a GIS analysis to determine the
potential for solar rooftop and ground-mounted potential across Birmingham City Council. This has
been extrapolated to the rest of the WMCA based on the number of domestic dwellings. The results
of this were validated by comparing against regional Western Power Grid projections for 2030 for
the West Midlands, based on the Future Energy Scenarios methodology, and adjusted CCC
projections for rooftop solar PV potential by 2050 on a national scale. Both showed that an estimate
was of the same scale and of reasonable accuracy: 830 MW in comparison to 773 MW from CCC
projections and 555 MW from WPD (projected only to 2030).
A number of deployment models may be utilised including private investment, self-funding and
community solar. In the latter case this could provide a revolving income for the West Midlands
Combined Authority for reinvestment into community investments4.
A conservative capacity factor (which represents the energy yield of a technology) of 9.7%
(equivalent to 850 kWh/kWp) was used. The electricity generated is assumed as zero carbon, with
carbon savings resulting from the displacement of grid electricity, which has a certain amount of
associated carbon. For this reason, solar PV carbon savings are greater the higher the grid carbon
intensity; as such, this goal will be the more effective the earlier it is deployed.
Planning Implications
The installation of solar panels and equipment on domestic buildings can be PD - either building
mounted or standalone equipment in curtilage of houses of a block of houses. There are, however,
important limits and conditions, which must be met to benefit from these rights (Part 14 Classes A
and B of the GPDO).
Panels must not be installed on or within the setting of a Listed Building or on a site designated as a
Scheduled Ancient Monument. In instances where the rights do not apply the requisite consent
would need to be sought.
4 https://www.hecommunityenergy.org/
Page 136
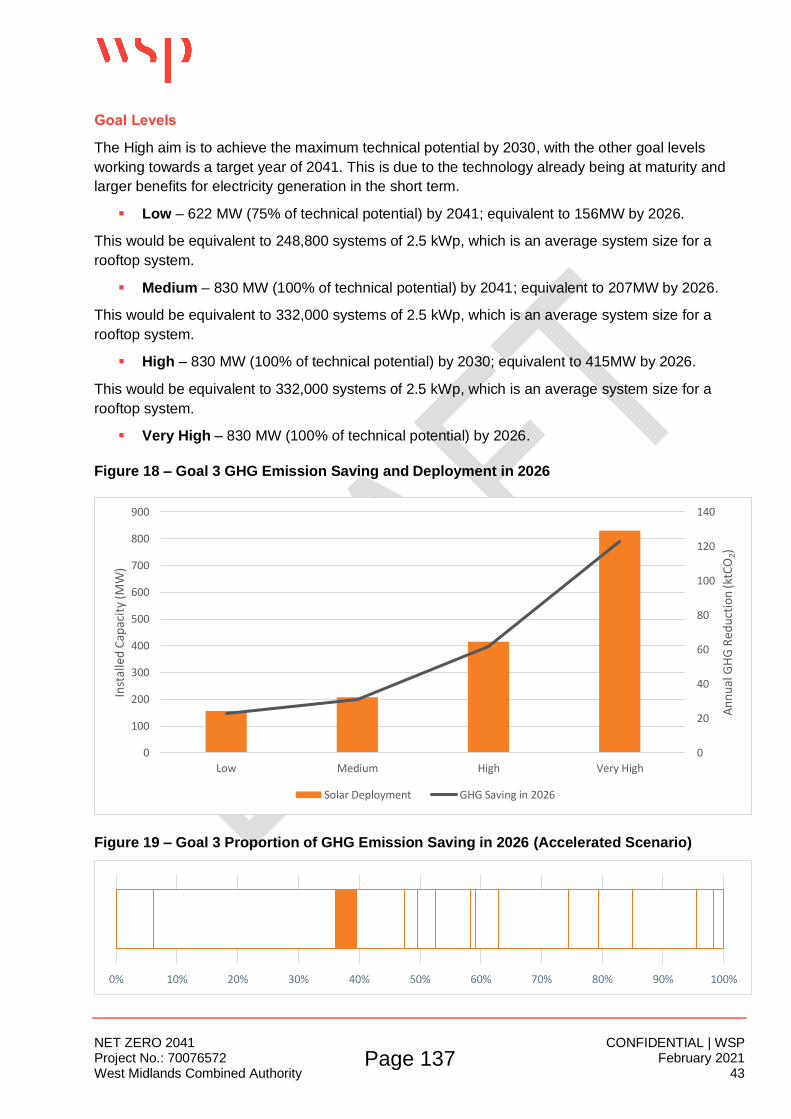
NET ZERO 2041 CONFIDENTIAL | WSP Project No.: 70076572 February 2021 West Midlands Combined Authority 43
Goal Levels
The High aim is to achieve the maximum technical potential by 2030, with the other goal levels
working towards a target year of 2041. This is due to the technology already being at maturity and
larger benefits for electricity generation in the short term.
▪ Low – 622 MW (75% of technical potential) by 2041; equivalent to 156MW by 2026.
This would be equivalent to 248,800 systems of 2.5 kWp, which is an average system size for a
rooftop system.
▪ Medium – 830 MW (100% of technical potential) by 2041; equivalent to 207MW by 2026.
This would be equivalent to 332,000 systems of 2.5 kWp, which is an average system size for a
rooftop system.
▪ High – 830 MW (100% of technical potential) by 2030; equivalent to 415MW by 2026.
This would be equivalent to 332,000 systems of 2.5 kWp, which is an average system size for a
rooftop system.
▪ Very High – 830 MW (100% of technical potential) by 2026.
Figure 18 – Goal 3 GHG Emission Saving and Deployment in 2026
Figure 19 – Goal 3 Proportion of GHG Emission Saving in 2026 (Accelerated Scenario)
0
20
40
60
80
100
120
140
0
100
200
300
400
500
600
700
800
900
Low Medium High Very High
An
nu
al G
HG
Red
uct
ion
(ktC
O2)
Inst
alle
d C
apac
ity
(MW
)
Solar Deployment GHG Saving in 2026
0% 10% 20% 30% 40% 50% 60% 70% 80% 90% 100%
Page 137

NET ZERO 2041 CONFIDENTIAL | WSP Project No.: 70076572 February 2021 West Midlands Combined Authority 44
Co-benefits and Inclusive Growth
• This intervention will directly work to reduce energy bills for residents and shield them from
price volatility, which can help tackle fuel poverty in the region.
• Solar PV, if paired with energy storage, can also provide flexibility services to the energy
system and back-up power in case of power outages. Such a large programme of PV
installations could help build capacity and develop a local supply chain of installers.
• It creates opportunities for community, municipal and other forms of local ownership of solar
PV and storage equipment.
We will change our economy
without leaving anyone behind P
os
itiv
e
Imp
ac
t
− Generating renewable electricity, offsetting fuel bills and potentially providing source of income
We will invest in the resilience of
our places Po
sit
ive
Imp
ac
t
− Renewable energy generation improving self-sufficiency
We will use our industrial past to create a new
future Ne
utr
al
− No impact
We will create places and
connections that help us to meet
the climate challenge
Po
sit
ive
Imp
ac
t
− Reduce reliance on fossil fuel powered electricity generation and work towards decarbonisation of electricity grid
We will decouple
prosperity from the
consumption of energy and resources
Po
sit
ive
Imp
ac
t
− Improved self-sufficiency
Page 138

NET ZERO 2041 CONFIDENTIAL | WSP Project No.: 70076572 February 2021 West Midlands Combined Authority 45
4.4.4 GOAL 4 – COMMERCIAL ENERGY EFFICIENCY RETROFIT
Description
The goal analyses the carbon savings from the installation of a range of energy efficiency measures,
such as building fabric, building controls, energy management systems, lighting installation or
building services distribution systems. The potential savings from these measures for office, retail
and other (education, health, hospitality buildings) types of non-domestic buildings was obtained
from the abatement model in BEIS’ Building Energy Efficiency Survey. This model considered the
applicability of each measure to the particular type of building. This means that while some buildings
may need several pieces of work undertaken, others may already have some of them installed and
therefore will not need no further actions.
A mechanism by which some of these measures could be delivered are the Minimum Energy
Efficiency Standards (MEES) for the rented sector, which requires an EPC rating of E required
before granting a new tenancy or by 2023. In addition, the recently announced Public Sector
Decarbonisation Scheme should be utilised by local authorities and other public bodies to deliver the
less economically-viable measures.
The technical potential and cost effectiveness for energy efficiency measure5 varies by the type of
building, with retail and office buildings having a lower overall potential reduction than health or
education buildings. In addition, within those energy reduction opportunities, the proportion of cost-
effective and socially cost-effective6 measures also vary by sector, as can be seen in the table
below. The measures include building fabric improvement, building controls, distribution systems,
systems management, lighting, ventilation equipment etc.
Table 2 – Commercial energy efficiency potential
Sector Energy reduction technical potential
Cost effective (<3-year payback)
Socially cost-effective
Retail 34% 23% 41%
Office 38% 20% 20%
Hospitality 25% 39% 37%
Health 41% 55% 60%
Education 45% 32% 64%
Community, arts & leisure 43% 19% 22%
As electricity consumption is much more significant in commercial buildings than domestic buildings,
energy efficiency measures achieve less carbon savings as electricity quickly decarbonises in the
2030s, even if in energy terms this goal is of a similar scale to the equivalent domestic one.
5https://assets.publishing.service.gov.uk/government/uploads/system/uploads/attachment_data/file/565748/BEES_overarching_report_FINAL.pdf 6 A measure is socially cost-effective if the total benefits to society outweigh the total costs to society over the lifetime of the measure. The reference study considered the capital expenditure, operational expenditure, social cost of energy, air quality impacts, and value of emissions, all discounted at the social discount rate.
Page 139
NET ZERO 2041 CONFIDENTIAL | WSP Project No.: 70076572 February 2021 West Midlands Combined Authority 46
Planning Implications
Most of the initiatives would not require planning permission, as they would not lead to external
alterations to buildings, so would not be considered to be development by virtue of the Town and
Country Planning Act 1990 (as amended).
All types of insulation are likely to require consent where they relate to Listed Buildings and of
course window replacement will certainly need express consent. Some authorities may also control
double glazing in Conservation Areas too, through Article 4 Directions. Running new services within
a Listed Building would also require express consent.
Goal Levels
The goal is to achieve the maximum technical potential (all of the savings which are possible and
are cost effective using current technology) from these energy efficiency measures across all 26,000
retail buildings, 18,000 offices and 30,000 other commercial buildings. Policy and regulatory
mechanisms will be required to deliver measures which aren’t economically viable.
▪ Low – 50% of technical potential by 2041; equivalent to 12.5% by 2026.
This scenario aims to capture carbon savings if mainly only cost-effective social cost-effective
measures were applied across all building types. Local authorities will have a role to play buildings
such as schools, care homes and other council buildings implement energy efficiency measures.
▪ Medium – 100% of energy reduction technical potential by 2041; equivalent to 25% by 2026.
This scenario aims to capture carbon savings if mainly only social cost-effective measures were
applied across all building types.
▪ High – 100% of overall energy reduction potential by 2031; equivalent to 50% by 2026.
This scenario exceeds the national targets set out in its Clean Growth Strategy of reducing energy
consumption in commercial (and industrial) building by 20% by 2030. Additional mechanisms will be
required to improve commercial buildings.
▪ Very High – 100% of overall energy reduction potential by 2026.
Figure 20 – Goal 4 GHG Emission Saving and Deployment in 2026
Page 140

NET ZERO 2041 CONFIDENTIAL | WSP Project No.: 70076572 February 2021 West Midlands Combined Authority 47
Figure 21 – Goal 4 Proportion of GHG Emission Saving in 2026 (Accelerated Scenario)
Co-benefits and Inclusive Growth
• This intervention will directly reduce gas and oil consumption, which will result in an
improvement in air quality.
• In addition, by reducing expenditure in energy consumption, businesses may improve their
competitiveness and exposure to energy price volatility.
• Rebound effects are less likely in a commercial setting, as the level of controls and thermal
comfort is typically higher than in residential areas.
We will change our economy
without leaving anyone behind P
os
itiv
e
Imp
ac
t
− Reduction in energy consumption
We will invest in the resilience of
our places Po
sit
ive
Imp
ac
t
− Reduction in dependence on energy
− Improved building resilience to changes in external conditions
0
50
100
150
200
250
300
350
0.00%
25.00%
50.00%
75.00%
100.00%
Low Medium High Very High
An
nu
al G
HG
Red
uct
ion
(ktC
O2)
Rea
lised
Po
ten
tial
Realised Potential GHG Saving in 2026
0% 10% 20% 30% 40% 50% 60% 70% 80% 90% 100%
Page 141

NET ZERO 2041 CONFIDENTIAL | WSP Project No.: 70076572 February 2021 West Midlands Combined Authority 48
We will use our industrial past to create a new
future Ne
utr
al
− No impact
We will create places and
connections that help us to meet
the climate challenge
Po
sit
ive
Imp
ac
t
− Improved climate resilience of buildings
We will decouple
prosperity from the
consumption of energy and resources
Po
sit
ive
Imp
ac
t
− Reduction in energy consumption
Page 142

NET ZERO 2041 CONFIDENTIAL | WSP Project No.: 70076572 February 2021 West Midlands Combined Authority 49
4.4.5 GOAL 5 – COMMERCIAL HEATING SYSTEM RETROFIT
Description
This goal quantifies the carbon emission savings from replacing fossil fuels (natural gas and oil)
employed in the generation of heating and hot water in commercial buildings. Energy efficiency
savings from Goal 4 have been included to avoid double counting. Heat pumps are assumed as the
default technology, as the one with the highest decarbonisation potential amongst available
solutions. Where there is a long-term source of waste heat, these could be used with different forms
of heat pumps to improve efficiency. Hydrogen may become an alternative at a later date.
As per the previous goal, the mechanisms for delivery may include MEES for the rented sector, or
the Public Sector Decarbonisation Scheme. In the private sector the landlord / tenant split of
investment / benefit is a challenge. Whilst the Renewable Heat Incentive is currently in place this will
likely end within the coming year. The government’s Heat Strategy is due to be published in early
2021, while the future Building Standard will also come into place.
The policy ambition on decarbonising heat in commercial buildings is less ambitious; there aren’t
any specific targets the national Government is working towards. However, the CCC considers that
earlier shifts from gas and other fossil fuels to low-carbon heating are feasible, with gas boilers
being banned between 2030-2033 and oil boilers between 2025-2026.
Planning Implications
Installations of air source heat pumps on non-domestic land would require planning permission, and
where relevant, Listed Building Consent.
Goal Levels
The goal is to achieve heating system retrofits in 100% of properties by 2041, in line with the
equivalent domestic goal. Action on this goal during the 2020s is required to meet this target.
▪ Low – 21,000 commercial buildings by 2041; equivalent to 870 by 2026.
This scenario assumes an equivalent deployment trajectory to the domestic low scenario, which
assumes slow deployment in the 2020s and a significant increase after 2030s.
▪ Medium – 34,600 commercial buildings by 2041; equivalent to 1,250 by 2026.
This scenario assumes an equivalent deployment trajectory to the domestic medium scenario,
based around the CCC Sixth Carbon Budget report modelling. The trajectory is not linear, and the
majority of installations take place after 2031. Local authority and socially-rented dwellings could be
prioritised, which would help tackle fuel poverty as part of the WMCA’s strategy.
▪ High – All commercial buildings by 2041; equivalent to 18,400 by 2026.
This assumes a linear level of deployment from 2021, in order to match the FYP’s targets.
▪ Very High – All 73,400 commercial buildings by 2026.
Page 143

NET ZERO 2041 CONFIDENTIAL | WSP Project No.: 70076572 February 2021 West Midlands Combined Authority 50
Figure 22 – Goal 5 GHG Emission Saving and Deployment in 2026
Figure 23 – Goal 5 Proportion of GHG Emission Saving in 2026 (Accelerated Scenario)
Co-benefits and Inclusive Growth
• This intervention will directly work to reduce air pollution currently generated by gas boilers.
• Commercial heat pumps, though at a smaller scale than domestic, also have the potential to
generate significant business opportunities and new jobs, such as potential manufacturing
plants and locally based design and installation companies.
We will change our economy
without leaving anyone behind N
eu
tra
l
− No impact on people
We will invest in the resilience of
our places Po
sit
ive
Imp
ac
t
− Reduction in dependence on fossil fuels
− Buildings will decarbonise with the electricity grid making them ‘Future Ready’
0
20
40
60
80
100
120
140
160
180
0
10,000
20,000
30,000
40,000
50,000
60,000
70,000
80,000
Low Medium High
An
nu
al G
HG
Red
uct
ion
(ktC
O2)
Nu
mb
er o
f B
uild
ings
Proportion of properties GHG Saving in 2026
0% 10% 20% 30% 40% 50% 60% 70% 80% 90% 100%
Page 144

NET ZERO 2041 CONFIDENTIAL | WSP Project No.: 70076572 February 2021 West Midlands Combined Authority 51
We will use our industrial past to create a new
future Po
sit
ive
Imp
ac
t
− Using engineering and manufacturing base to develop heat pump manufacture and supply chain, but will need to compete with internationally established competitors
We will create places and
connections that help us to meet
the climate challenge
Po
sit
ive
Imp
ac
t
− Buildings will decarbonise with the electricity grid making them ‘Future Ready’
We will decouple
prosperity from the
consumption of energy and resources
Po
sit
ive
Imp
ac
t
− Reduction in use in fossil fuels
Page 145

NET ZERO 2041 CONFIDENTIAL | WSP Project No.: 70076572 February 2021 West Midlands Combined Authority 52
4.4.6 GOAL 6 – COMMERCIAL PHOTOVOLTAICS
Description
The installation of solar PV on commercial rooftops has been carried out at a similar level to
domestic rooftops, with the Government’s feed-in tariff scheme delivering around 1.6 GW in
commercial installations (excluding ground-mounted) in the UK and 89 MW in the WMCA. PVs are a
mature and cost-effective technology and could be deployed widely across commercial buildings to
reduce carbon emissions. Other microgeneration technologies exist, such as micro-wind, but have
not been considered due to lack of commercial maturity and very low uptake at present.
For systems which have a reasonable payback, fully financed options are currently available and so,
where commercial organisations do not have the capital themselves, this is not necessarily a barrier.
This technology can also be used as an engagement tool within communities7.
The Birmingham Solar PV Study report (December 2016) carried out a GIS analysis to determine
the potential for solar rooftop and ground-mounted potential across Birmingham City Council,
including commercial buildings. In addition, the Black Country Energy Strategy report identified at
least a potential for 180 MWp of solar PV across the region. No specific data was available for
Walsall and Coventry local authorities, so the potential for Birmingham was extrapolated to these
areas based on the number of commercial buildings. This was compared to directly extrapolating the
Birmingham study to the rest of the region, with both results within an acceptable margin of each
other: 706 MW compared to 781 MW, respectively. The more conservative option was selected.
A conservative capacity factor of 9.7% (equivalent to 850 kWh/kWp) was used. The electricity
generated is assumed as zero carbon, with carbon savings resulting from the displacement of grid
electricity, which has a certain amount of associated carbon. This leads to the same phenomenon
explained in the domestic goal, where carbon savings from PV are greater the earlier it is deployed,
as grid electricity continues to decarbonise.
Planning Implications
The installation of Solar PV panels on non-domestic premises is considered to be permitted
development under Part 14 Classes J and K of the GPDO, provided all the conditions are met.
There are also certain restrictions in Conservation Areas and where a proposal relates to a Listed
Building consent would be required.
Goal Levels
▪ Low – 529 MW (75% of technical potential) by 2041; equivalent to 132MW (2,640 systems)
by 2026.
This would be equivalent to 10,580 systems of 50 kWp by 2041, which is an average size for a
commercial rooftop system (they have the potential to be much larger).
▪ Medium – 706 MW (100% of technical potential) by 2041; equivalent to 176MW (3,520
systems) by 2026.
7 https://artandenergy.org/tag/plymouth-energy-community/
Page 146

NET ZERO 2041 CONFIDENTIAL | WSP Project No.: 70076572 February 2021 West Midlands Combined Authority 53
This would be equivalent to 14,120 systems of 50 kWp by 2041, which is an average size for a
commercial rooftop system (they have the potential to be much larger).
▪ High – 706 MW (100% of technical potential) by 2031; equivalent to 353MW (7,060 systems)
by 2026.
This would be equivalent to 14,120 systems of 50 kWp by 2031 which is an average size for a
commercial rooftop system (they have the potential to be much larger).
▪ Very High – 706 MW (14,120 systems) by 2026
Figure 24 – Goal 6 GHG Emission Saving and Deployment in 2026
Figure 25 – Goal 6 Proportion of GHG Emission Saving in 2026 (Accelerated Scenario)
Co-benefits and Inclusive Growth
• This intervention will directly work to reduce energy bills for businesses and reduce their
exposure to energy price volatility. Such a large programme of PV installations, together with
the domestic goal, could help build capacity and develop a strong local supply chain.
0
20
40
60
80
100
120
0
100
200
300
400
500
600
700
800
Low Medium High Very High
An
nu
al G
HG
Re
du
ctio
n (k
tCO
2)
Inst
alle
d C
apac
ity
(MW
)
Solar Deployment GHG Saving in 2026
0% 10% 20% 30% 40% 50% 60% 70% 80% 90% 100%
Page 147

NET ZERO 2041 CONFIDENTIAL | WSP Project No.: 70076572 February 2021 West Midlands Combined Authority 54
• It creates opportunities for community, municipal and other forms of local ownership of solar
PV and storage equipment.
We will change our economy
without leaving anyone behind P
os
itiv
e
Imp
ac
t − Generating renewable electricity, offsetting fuel bills
We will invest in the resilience of
our places Po
sit
ive
Imp
ac
t
− Renewable energy generation improving self-sufficiency
We will use our industrial past to create a new
future Po
sit
ive
Imp
ac
t
− Potential to create strong local supply chains
We will create places and
connections that help us to meet
the climate challenge
Po
sit
ive
Imp
ac
t
− Reduce reliance on fossil fuel powered electricity generation and work towards decarbonisation of electricity grid
We will decouple
prosperity from the
consumption of energy and resources
Po
sit
ive
Imp
ac
t
− Reduced consumption of resources.
Page 148

NET ZERO 2041 CONFIDENTIAL | WSP Project No.: 70076572 February 2021 West Midlands Combined Authority 55
4.4.7 GOAL 7 – INDUSTRY ENERGY EFFICIENCY AND FUEL SWITCHING
Description
The West Midlands economy is different from the rest of the UK, due to its unique industrial make
up, with a large concentration of jobs in the manufacturing industry. The West Midlands has globally
competitive supply chains, including those in equipment manufacturing and component
manufacturing. Many of the supply chain firms across the region are leading innovators in new
materials and manufacturing processes, working in the aerospace, marine, automotive and rail
supply chains. It is estimated that the West Midlands Combined Authority area includes 27,000
industrial buildings and 6,400 industrial organisations.
Industry is one of the most difficult areas to decarbonise, with many of the identified solutions at the
early stages of commercial scale or even technical viability. As such, a review on the topic was
undertaken, to understand the key technologies and their potential across a number of industries
and processes. This included the CCC Hydrogen in a low-carbon economy report and supporting
reports, BEIS Industrial Decarbonisation and Energy Efficiency Roadmaps to 2050, the EU
Hydrogen Strategy and academic research on the potential for electrification of industrial heat.
Energy intensive industries in the UK are already highly incentivised to be as energy efficient as
possible to ensure competitiveness. Despite that, smaller firms often lack the capital or long-term
certainty to invest and measures which put industries at a competitive disadvantage are unlikely to
go ahead. There are opportunities in the areas symbiotic relationships between industry in the area,
some of which are being explored by the Black Country Consortium. These have not been quantified
in this analysis, but may be significant, in terms of efficiency and competitiveness.
High temperature processes in industry are particularly difficult to decarbonise. Hydrogen could play
an important role in this sector, although only a few pilot projects have been developed. Research
for the CCC identified that, of the processes examined where hydrogen could play a role, 16.6%
could only be decarbonised through hydrogen (on an energy basis). This was taken as a reference
for the medium scenario. In addition, wastes and biofuels are already being used in industry where
the opportunity arises, whilst this is expected to continue it is expected that overall the potential from
hydrogen is greater. Direct electricity ill also play a role, but the cost difference with natural gas
makes this limited at present.
The energy efficiency and CCS potential was based on the BEIS Industrial Decarbonisation and
Energy Efficiency Roadmaps, carried out by WSP and DNV-GL, which established the potential for
CCS and energy efficiency for a range of sectors, as can be seen in the table below. The CCS
potential was applied directly to each sector, and an average 10% energy efficiency saving was
applied to low temperature and other secondary processes as a medium scenario.
Page 149

NET ZERO 2041 CONFIDENTIAL | WSP Project No.: 70076572 February 2021 West Midlands Combined Authority 56
Table 3 – Industrial energy efficiency potential
No. in Industrial Businesses in WMCA Area
CCS Energy Efficiency
Iron and Steel 150 45% 0%
Cement 30 62% 9%
Chemicals 140 45% 9%
Glass 40 39% 16%
Ceramics 45 17% 0%
Pulp and Paper 485 41% 0%
Food and Drink 380 0% 36%
Lastly, low and medium temperature applications such as cooling, space heating, steam generation
and drying were assumed to be electrified, through a combination of established technologies such
as heat pumps, chillers, mechanical vapour recompression, electrical boilers, heaters and furnaces.
Planning Implications
Considering the type of technology employed, planning permission is likely to be needed for the
larger interventions. This may be significant, especially in cases where hydrogen pipeline may be
needed externally to the site.
Goal Levels
The goal is to achieve a reasonable potential by 2041, due to the lack of maturity of the technologies
and their lack of financial viability. Industrial decarbonisation is likely to be driven by national policy,
and large-scale trials for some of the technologies used in this goal are likely to take place. The
WMCA will ensure that opportunities for these to take place in the region are grasped.
▪ Low – 8.3% of energy in high-temperature processes replaced by hydrogen, 10% of
potential for capturing remaining emissions through CCS, electrification of low temperature
processes and 5% of energy efficiency in low-temperature and secondary processes, by
2026.
▪ Medium – 16.7% of energy in high-temperature processes replaced by hydrogen, 20% of
potential for capturing remaining emissions through CCS, electrification of low temperature
processes and 10% of energy efficiency in low-temperature and secondary processes, by
2026.
▪ High – 33.3% of energy in high-temperature processes replaced by hydrogen, 40% of
potential for capturing remaining emissions through CCS, electrification of low temperature
processes and 15% of energy efficiency in low-temperature and secondary processes, by
2026.
▪ Very High – No change from the high scenario
Page 150

NET ZERO 2041 CONFIDENTIAL | WSP Project No.: 70076572 February 2021 West Midlands Combined Authority 57
Figure 26 – Goal 7 GHG Emission Saving and Deployment in 2026
Figure 27 – Goal 7 Proportion of GHG Emission Saving in 2026 (Accelerated Scenario)
Co-benefits and Inclusive Growth
• This intervention can lead to opportunities for jobs and businesses to be created around the
reconversion of industrial processes and in the supply of the necessary technologies. This
would be particularly well suited to the West Midlands, given its industrial background and
expertise.
We will change our economy
without leaving anyone behind P
os
itiv
e
Imp
ac
t
− Opportunities for jobs creation
We will invest in the resilience of
our places Ne
utr
al
− No impact
102
104
106
108
110
112
114
116
118
120
122
0
5
10
15
20
25
30
35
40
45
Low Medium High Very High
An
nu
al G
HG
Red
uct
ion
(ktC
O2)
Tech
no
logy
Dep
loym
ent
Energy Efficiency Hydrogen CCS GHG Saving in 2026
0% 10% 20% 30% 40% 50% 60% 70% 80% 90% 100%
Page 151

NET ZERO 2041 CONFIDENTIAL | WSP Project No.: 70076572 February 2021 West Midlands Combined Authority 58
We will use our industrial past to create a new
future Po
sit
ive
Imp
ac
t
− Focuses on industrial presence in the West Midlands
We will create places and
connections that help us to meet
the climate challenge
Ne
utr
al
− No impact
We will decouple
prosperity from the
consumption of energy and resources
Po
sit
ive
Ne
ga
tive
− Reduction in energy consumption
− Need to ensure international competitiveness
Page 152

NET ZERO 2041 CONFIDENTIAL | WSP Project No.: 70076572 February 2021 West Midlands Combined Authority 59
4.4.8 GOAL 8 – INDUSTRY PHOTOVOLTAICS
Description
The installation of solar PV in industrial premises has the potential to contribute to the
decarbonisation of its electricity consumption. However, to date, the level of installations has been
very low. Through the Government’s feed-in-tariff programme, only 294 MW of industrial installations
took place, of which only 2.3 MW were installed in the WMCA area. Other technologies, such as
micro-wind or energy from waste, have not been considered in this analysis.
Fully-financed solutions are also available and so there is good potential for a targeted campaign for
large rooftop solar systems.
CCC projections for rooftop solar PV potential by 2050 on a national scale were used to estimate the
technically feasible amount of PV which could be expected in industrial settings.
A conservative capacity factor of 9.7% (equivalent to 850 kWh/kWp) was used. The electricity
generated is assumed as zero carbon, with carbon savings resulting from the displacement of grid
electricity, which has a certain variable amount of associated carbon (decreasing to almost zero by
2040).
Planning Implications
The installation of Solar PV panels on non-domestic premises is considered to be permitted
development under Part 14 Classes J and K of the GPDO provided the required conditions are met.
There are certain restrictions in Conservation Areas and the rights do not apply for Listed Buildings
or within the site of a Scheduled Ancient Monument.
Goal Levels
The goal is to install up to 96MW across the West Midlands Combined Authority area.
▪ Low – 72 MW (75% of what was identified as possible) by 2041; equivalent to 18MW by
2026.
This would be equivalent to 720 systems of 100 kWp, which is an average size for an industrial solar
system (they have the potential to be much larger).
▪ Medium – 96 MW (100% of what was identified as possible) by 2041; equivalent to 24MW
by 2026.
This would be equivalent to 960 systems of 100 kWp, which is an average size for an industrial solar
system (they have the potential to be much larger).
▪ High – 96 MW by 2031; equivalent to 48MW by 2026.
This would be equivalent to 960 systems of 100 kWp, which is an average size for an industrial solar
system (they have the potential to be much larger).
▪ Very High – 96 MW by 2026.
Page 153

NET ZERO 2041 CONFIDENTIAL | WSP Project No.: 70076572 February 2021 West Midlands Combined Authority 60
Figure 28 – Goal 8 GHG Emission Saving and Deployment in 2026
Figure 29 – Goal 8 Proportion of GHG Emission Saving in 2026 (Accelerated Scenario)
Co-benefits
• This intervention will directly work to reduce energy bills for businesses and reduce their
exposure to energy price volatility.
• Solar PV, if paired with energy storage, can also provide flexibility services to the energy
system and back-up power in case of power outages.
• This goal is small, but combined with the large programme of PV installations for the
domestic and commercial goals, it could help build capacity and develop a strong local
supply chain of installers. The manufacture of solar equipment is unlikely to take place in the
region.
0
2
4
6
8
10
12
14
16
0
20
40
60
80
100
120
Low Medium High Very High
An
nu
al G
HG
Red
uct
ion
(ktC
O2)
Inst
alle
d C
apac
ity
(MW
)
Solar Deployment GHG Saving in 2026
0% 10% 20% 30% 40% 50% 60% 70% 80% 90% 100%
Page 154

NET ZERO 2041 CONFIDENTIAL | WSP Project No.: 70076572 February 2021 West Midlands Combined Authority 61
We will change our economy
without leaving anyone behind P
os
itiv
e
Imp
ac
t
− Opportunities for jobs creation
We will invest in the resilience of
our places Po
sit
ive
Imp
ac
t
− Reduction in reliance on fossil fuels
We will use our industrial past to create a new
future Po
sit
ive
Imp
ac
t
− Focusses on industrial presence in the West Midlands
We will create places and
connections that help us to meet
the climate challenge
Ne
utr
al
− No impact
We will decouple
prosperity from the
consumption of energy and resources
Po
sit
ive
Imp
ac
t
− Increase in self-generation
Page 155

NET ZERO 2041 CONFIDENTIAL | WSP Project No.: 70076572 February 2021 West Midlands Combined Authority 62
4.4.9 GOAL 9 – AVOIDING TRAVEL (DEMAND REDUCTION/ DIGITAL CONNECTIVITY)
Description
It is possible to avoid travel and in turn to reduce GHG emissions associated with transport. This can
be undertaken with limited impacts on economic and social activity by such as by accessing
services digitally, accessing goods digitally (which can substitute passenger miles for much fewer
freight miles; although action and management would be needed to mitigate this), consolidating trips
so that overall fewer trips are undertaken.
This goal explores the decarbonisation potential from trip demand reduction, one of the key routes to
decarbonising transport. This has been undertaken by considering specifically reductions in
commuting, business trips and personal business trips achieved through digitisation. Whilst this is
not an exhaustive assessment of the potential to avoid travel, it does quantify what may be possible.
This would result in a large change compared to the status quo.
The CCC sixth budget report assumed total car miles falling by 9% by 2035 compared to business-
as-usual, due to increased active travel, modal shift to public transport and increased working from
home8. This goal tackles some of these activities: commuting, personal business and retail trips (and
more will be included in later goals), which could reduce their associated transport emissions
through the use of digital connectivity which enables people to carry out activities remotely.
The West Midlands Combined Authority recently released their digital roadmap9 which emphasised
the role of digital connectivity both in helping the economy to recover but also reducing GHG
emissions. Digital connectivity will improve access to jobs and services for everyone within the West
Midlands Combined Authority.
The extent to which people can work from home was identified from ONS research which
established that 35% of people in the West Midlands were able to work from home to some extent
during the first COVID induced lockdown in 2020 (this is lower than the UK average of almost 47%).
In addition, data is taken from an academic paper, (Global e-Sustainability Initiative) as to the
frequency people are able to work from home. The emissions savings are based on the number of
miles saved across cars and public transport.
Data on the total retail and personal business trips distance is obtained from Government data.
Assuming a reduction in these trips due to e-commerce and more and more services being available
on-line, carbon savings can be calculated. Potential changes to the modal share of car usage have
been included to avoid double counting, and the carbon savings calculation considers the up-take
trajectory of electric vehicles.
Planning Implications
Planning considerations associated with creating community spaces will be needed, as well as wider
consideration of adapting dwellings for home working and ensuring newly constructed dwellings are
8 This was identified as part of the ‘balanced pathway’ with car miles reducing through a mixture of avoiding travel and shifting to other modes. More ambitious and plausible scenarios were also considered as part of that study. The study also considered the UK as a whole, whilst the West Midlands Combined Authority area is on the whole much more urban and therefore better able to shift to other modes of transport. 9 https://www.wmca.org.uk/news/wmca-unveils-plan-for-region-s-digital-future/
Page 156

NET ZERO 2041 CONFIDENTIAL | WSP Project No.: 70076572 February 2021 West Midlands Combined Authority 63
fit for purpose. Planning implications may also extend to the management of deliveries (ensuring
there are secure places for deliveries and consolidation centres).
Within city and town centres, the economy is likely to shift considerably and so changes of use of
buildings from offices and retail may also need to be controlled and managed. Wider planning
implications are discussed in the forthcoming Local Transport Plan (LTP) Review.
Whilst digitisation may reduce the need to commute or travel for other forms of business, the full
benefits may not be realised as these trips often can be replaced by others (such as long-distance
leisure trips). To an extent, this can be managed through road space re-allocation to support active
travel and public transport.
Goal Levels
The goal is to maximise the potential for transport demand reduction and incorporate the CO2
emissions savings described above. This would have an impact on other forms of transport that
need to be managed, (such as increasing LGV usage) as well as considerations for planning, such
as. homes having adequate spaces for home-working).
▪ Low – Only half of people who are able to work from home do (17.5%), an average of 130
days per year by 2041. In addition, only 6.25% of retail and personal business trips are
reduced. This is equivalent to 4.4% of people working from home (who are able to) and 1.6%
reduction in retail and personal business trips by 2026.
▪ Medium – About three quarters of people who are able to work from home do (26%), an
average of 130 days per year by 2041. In addition, 12.5% of retail and personal business
trips are reduced by 2041. This is equivalent to 6.6 % of people working from home (who are
able to) and 3.1% reduction in retail and personal business trips by 2026.
▪ High – Every person who is able to work from home do (35%), as found in the ONS report,
an average of 130 days per year by 2041. In addition, 25% of retail and personal business
trips are reduced by 2041. This is equivalent to 9% of people working from home (who are
able to) and 6.3% reduction in retail and personal business trips by 2026.
This would be a lower level of home-working than seen during the pandemic (35% of people,
full-time). Ensuring people have access to fast broadband services and places to work will be
key. In addition, the impacts of e-commerce need to be managed, including consolidated
delivery centres, efficient delivery services, electrification of LGVs).
▪ Very High – 35% of people working from home (who are able to) and 25% reduction in retail
and personal business trips by 2026.
Figure 30 – Goal 9 GHG Emission Saving and Deployment in 2026
Page 157

NET ZERO 2041 CONFIDENTIAL | WSP Project No.: 70076572 February 2021 West Midlands Combined Authority 64
Figure 31 – Goal 9 Proportion of GHG Emission Saving in 2026 (Accelerated Scenario)
Co-benefits and Inclusive Growth
• This goal will directly reduce the use of transport and associated energy and emissions. This
will have a significant impact on congestion, (at peak times in the case of commuting) which
will result in an improvement to air quality and safety (of particular benefit in cities).
• In addition, digital connectivity will improve access to jobs and services for everyone,
independently of their background or location. This would result in wider benefits to the
wellbeing and prosperity of people. However, the regional focus on digital inclusivity will need
to deliver at pace.
• There is an opportunity to use demand reduction as a basis on which to strengthen local
economies, creating greater local opportunities, improved amenities and increased resident
satisfaction.
0
50
100
150
200
250
300
350
0
5
10
15
20
25
30
35
Low Medium High Very High
An
nu
al G
HG
Red
uct
ion
(ktC
O2)
Per
cen
tage
WfH Trips Reduction GHG Saving in 2026
0% 10% 20% 30% 40% 50% 60% 70% 80% 90% 100%
Page 158

NET ZERO 2041 CONFIDENTIAL | WSP Project No.: 70076572 February 2021 West Midlands Combined Authority 65
We will change our economy
without leaving anyone behind P
os
itiv
e
Ne
ga
tive − Digital connectivity has the potential to improve access to
jobs
− Major impact on city centre economy. The nature of city centres may need to evolve, with some of the economy distributing away from centres
We will invest in the resilience of
our places Po
sit
ive
Imp
ac
t − Reduction in reliance on transport infrastructure and use of
petrol / diesel vehicles
We will use our industrial past to create a new
future Ne
utr
al
− No impact
We will create places and
connections that help us to meet
the climate challenge
Po
sit
ive
Imp
ac
t
− Creating local economies
We will decouple
prosperity from the
consumption of energy and resources
Po
sit
ive
Imp
ac
t
− Reduction in reliance on transport infrastructure and use of petrol / diesel vehicles
Page 159

NET ZERO 2041 CONFIDENTIAL | WSP Project No.: 70076572 February 2021 West Midlands Combined Authority 66
4.4.10 GOAL 10 – SHIFTING TRAVEL
Description
Shifting transport to lower carbon models consists of two linked elements. Firstly, shift current trips
to use lower carbon modes where feasible is need. This could be undertaken by various methods
including encouraging active travel to demand management. Secondly, there is a need to increase
the number of trips between places that are more easily accessed by lower carbon modes (by
changing where trips are going, focusing development in places more easily served by lower carbon
modes and investing in transport infrastructure and subsidy to improve provision and affordability of
lower carbon modes), and then travelling by those modes.
Estimates of the potential to deliver carbon savings through modal shift are based on sources
described. The full potential to shift modes will be explored in the LTP development with greater
spatial, place and people understanding of the West Midlands Combined Authority region.
The analysis on transport mode shift was carried out following consultation and a review on the
subject, including the Movement for Growth strategy (September 2017), the National Cycling and
Walking Investment Strategy (April 2017), the Birmingham Cycling Revolution, the West Midlands
Cycling Charter (September 2015), and academic papers on the car usage reduction in European
Cities. The Movement for Growth Strategy envisages a shift from around 65% of trips made by car,
to 35-45%, as part of a transition to a more typical European city mode share. There is an ambition
for bike trips to increase ten-fold by 2033 and public transport is envisaged to cover a significantly
larger share of trips in the WMCA. This is intended to be achieved by a significant improvement of
public transport infrastructure, such as the introduction of a fully integrated rail and rapid transit
network that connects the main city centres, and an aspiration to increase to 100% the amount of
people that can reach the three main centres within 45 minutes by public transport in the morning
commute (currently 49%). Demand management or restrictions may be needed to enable this level
of transition. Micro-mobility can offer further savings if replacing car journeys, but regulation is
required before such solutions are adopted.
This goal analyses the carbon savings that can be achieved through a modal shift and uses
aspirations from the Movement for Growth strategy for car and bicycle usage, set for 2041 and
2033, respectively. This is used in combination with Government data for the number of trips per
distance range for the West Midlands to calculate savings. The total energy saving is split across
fuels to avoid double counting carbon savings from electrification of transport.
Transport for the West Midlands has a pivotal role in achieving this goal and there is already a
prepared strategy with specific plans to ensure this takes place. Investment in infrastructure
will need to be supported by other policy measures to help encourage behaviour change to
increase the uptake of public transport use as well as increased walking and cycling.
Planning Implications
Planning permission will be required as part of redesigning transport infrastructure and transport-
orientated planning of developments. Planning policy should also ensure that additional transport
demand from new development is minimised and supports / encourages the use of sustainable
modes. This includes considerations of the form of new developments and where they should be
(dense, mixed-use developments located close to adequate transport links) as well as the need to
Page 160

NET ZERO 2041 CONFIDENTIAL | WSP Project No.: 70076572 February 2021 West Midlands Combined Authority 67
retrofit and enable land use change in the existing urban environment, so that the existing urban
environment can be adapted to improve local provision of key services and amenities.
Goal Levels
The goal is to achieve the aspirations set out in the Movement for Growth strategy, achieving a car
mode share of 35% in 2041 and 10% of trips carried out by bike in 2033. This also results in a large
increase in public transport usage as well as a small increase in walking. It is emphasised that a
large step change is needed here; although funding and infrastructure are a barrier to achievement,
public acceptance and desire for behaviour change is the biggest issue.
▪ Low – Car modal share reduces to 50% by 2041, and only 50% of the cycling target is
achieved by 2033. Public transport would cover 18% of all trips. This is equivalent a
reduction in car modal share to 63%, public transport up to 8% and cycling at 3% by 2026.
▪ Medium – Car modal share reduces to 40% by 2041, and 75% of the cycling target is
achieved by 2033. Public transport would cover close to 25% of all trips. This is equivalent a
reduction in car modal share to 60%, public transport up to 10% and cycling at 4% by 2026.
▪ High – Car modal share is successfully reduced to 35% by 2041, and the cycling target is
achieved by 2033. Public transport would cover close to 27% of all trips. This is equivalent a
reduction in car modal share to 59%, public transport up to 11% and cycling at 5% by 2026.
▪ Very High – This is equivalent a reduction in car modal share to 35%, public transport up to
27% and cycling at 10% by 2026.
Table 4 – Example modal change (selected data)
Mode Trips per person
<1 mile (Current)
Trips per person <1 mile (High Goal)
Trips per person 2-5 mile (Current)
Trips per person 2-5 mile (High Goal)
Walking 174 183 9 10
Bicycle 1 14 3 33
Car Driver 26 13 127 66
Local Bus 1 5 17 86
Page 161

NET ZERO 2041 CONFIDENTIAL | WSP Project No.: 70076572 February 2021 West Midlands Combined Authority 68
Figure 32 – Goal 10 GHG Emission Saving and Deployment in 2026
Figure 33 – Goal 10 Proportion of GHG Emission Saving in 2026 (Accelerated Scenario)
Co-benefits and Inclusive Growth
• This goal will directly reduce the use of energy for travel and their associated emissions, by
shifting transport from private, low-occupancy forms of transport to low-carbon options, such
as active travel and public transport.
• This will reduce air pollution and associated health issues, as well as road traffic casualties.
• Active forms of travel can help tackle a range of other health issues, such as obesity and
mental ill-health, while public transport can provide access to the main centres for more
people, increasing prosperity and people’s quality of life.
• The redistribution of space away from single occupancy vehicles and towards shared spaces
for active travel and public transport creates a more equitable region, where those without
cars can access.
• As space is remodelled, opportunities including increased sustainable urban drainage
schemes to boost resilience to floods and overheating, and increases biodiversity arise.
0
200
400
600
800
1000
1200
1400
0
5
10
15
20
25
30
Low Medium High Very High
An
nu
al G
HG
Red
uct
ion
(ktC
O2)
Per
cen
tage
of
Trip
s
Public Transport Cycling GHG Saving in 2026
0% 10% 20% 30% 40% 50% 60% 70% 80% 90% 100%
Page 162

NET ZERO 2041 CONFIDENTIAL | WSP Project No.: 70076572 February 2021 West Midlands Combined Authority 69
We will change our economy
without leaving anyone behind P
os
itiv
e
Imp
ac
t
− Shifting transport away from private car use and increase public transport will positively impact deprived communities
We will invest in the resilience of
our places Po
sit
ive
Imp
ac
t
− As space is remodelled, opportunities to improve resilience can also be taken
We will use our industrial past to
create a new future N
eu
tra
l
− No impact
We will create places and
connections that help us to meet
the climate challenge
Po
sit
ive
Imp
ac
t
− Increased public transport provision
We will decouple prosperity from
the consumption of energy and
resources
Po
sit
ive
Imp
ac
t
− Reduction in reliance on private transport
Page 163

NET ZERO 2041 CONFIDENTIAL | WSP Project No.: 70076572 February 2021 West Midlands Combined Authority 70
4.4.11 GOAL 11 – IMPROVING TRAVEL (BUS AND TAXI ELECTRIFICATION)
Description
This goal explores the carbon savings which can be derived from electrification of buses and taxis in
the West Midlands Combined Authority area. This is in the context of wider electrification of public
transport including railways, (which is planned to take place) and the tram network (which is already
electrified). Electric transport solutions offer a much lower operational cost compared to
conventional internal combustion engine alternatives, which makes them very attractive where high
distances are travelled. The upfront cost is the main barrier to adoption, but with rapidly falling
battery prices, cost parity is expected by the mid-2020s.
Local authorities have some limited direct control over taxi licences and the bus services that
operate in their districts (around 90% are completely commercially operated). However central
government are supportive of all-electric bus cities (with Coventry already receiving funding for this),
whilst options to use powers in the 2017 Bus Services Act are also being explored. This could be
used to accelerate the uptake of low-carbon solutions. Installation of the necessary infrastructure
(mainly charging points) is important and may be led by the WMCA and will require careful charging
to minimise costs. The Climate on Change Committee projects that there should be around 390,000
charging points in the UK by 2035 to support the electrification of transport, from around 21,500
chargers today. For taxis, charging points will need to be located in suitable locations that do not
disrupt routines, such as on-street chargers for overnight charging or during day-time breaks). For
buses, centralised charging stations at depots are likely to be the preferred solution. This will
comprise a mixture of private and public chargers.
Hydrogen may play a role in the decarbonisation of transport, (particularly of heavier and larger
vehicles) and is being trialled in Birmingham. However, large scale change has been excluded from
the analysis for this Five Year Plan as it is not available at the scale necessary now. This should be
re-evaluated in subsequent plans.
The electrification of rail is already considered as part of business as usual with a high likelihood of it
being undertaken within the next 20 years. However, there may be a role for the WMCA to
accelerate this change.
The WMCA may also consider looking at how the electrification of bus and rail services rail can
support other transport modes to electrify. For example, through the sharing of electrical capacity
and the provision of charging points for vehicles and bikes at stations or depots and whether the use
of storage and renewable energy generation on site could support the business case for
electrification, by reducing the impact on the electricity network and thus connection costs. By
working the Distribution Network Operators, the WMCA can ensure that future capacity is planned
for effectively. Where funding is made available by Government to support the deployment of such
charging facilities, the WMCA could play a role in ensuring that the West Midlands accesses its
share.
Page 164

NET ZERO 2041 CONFIDENTIAL | WSP Project No.: 70076572 February 2021 West Midlands Combined Authority 71
Planning Implications
There are no known planning implications for the installation of individual chargers, unless the
technology requires on street charging opportunities or modification is needed to any of the existing
infrastructure.
The increase in electrical demand and need for centralised charging may also necessitate the
careful planning and locating of depots or charging hubs. There will be a need for public transport
operators to have appropriate depot locations and for the introduction of ZEV infrastructure.
Goal Levels
Electrifying buses and taxis by 2030 would involve an upfront investment to replace the fleet of
buses and taxis, which would be recovered in the following years due to lower operational costs.
Incentives for taxi drivers, as well as mechanisms linked to licensing could be used. Bus
replacements should be future-proofed, and any new bus purchased in the WMCA from 2021 should
be electric (or hydrogen).
▪ Low – All taxis and buses are electrified by 2041; equivalent to 5,300 electric taxis and 480
electric busses by 2026.
▪ Medium – All taxis and buses are electrified by 2036; equivalent to 7,100 electric taxis and
770 electric busses by 2026.
▪ High – All taxis and buses are electrified by 2031; equivalent to 10,650 electric taxis and
1,150 electric busses by 2026.
▪ Very High – All 21,300 taxis and 2,300 buses are electrified by 2026.
Figure 34 – Goal 11 GHG Emission Saving and Deployment in 2026
0
20
40
60
80
100
120
140
160
180
200
2015
2020
2025
2030
2035
2040
2045
Low Medium High Very High
An
nu
al G
HG
Red
uct
ion
(ktC
O2)
End
Yea
r
Year GHG Saving in 2026
Page 165

NET ZERO 2041 CONFIDENTIAL | WSP Project No.: 70076572 February 2021 West Midlands Combined Authority 72
Figure 35 – Goal 11 Proportion of GHG Emission Saving in 2026 (Accelerated Scenario)
Co-benefits and Inclusive Growth
• This goal will directly reduce the use of fossil fuels for transport and their associated
emissions.
• One of the main benefits from electric forms transport is their lack of NOx pollution and
noise, improving the health and wellbeing of people (particularly in cities).
We will change our economy
without leaving anyone behind N
eu
tra
l
− No impact
We will invest in the resilience of
our places Ne
utr
al
− No impact
We will use our industrial past to
create a new future N
eu
tra
l
− No impact
We will create places and
connections that help us to meet
the climate challenge
Ne
utr
al
− Electrified transport may be cheaper and more efficient.
We will decouple prosperity from
the consumption of energy and
resources
Po
sit
ive
Imp
ac
t
− Improved efficiency of public transport
0% 10% 20% 30% 40% 50% 60% 70% 80% 90% 100%
Page 166

NET ZERO 2041 CONFIDENTIAL | WSP Project No.: 70076572 February 2021 West Midlands Combined Authority 73
4.4.12 GOAL 12 – IMPROVING TRAVEL (HEAVY GOODS VEHICLE ELECTRIFICATION)
Description
This goal looks at the carbon emissions savings which can be derived from electrification of HGVs in
the context of the WMCA area. Whilst alternatives to electrification are also under development and
are not discounted here, within the first Five Year Plan electrification is considered the only realistic
option. Similar to the previous goal, the electrification of HGVs will be driven by the much lower
costs per mile than diesel alternatives as well as carbon savings. Electric HGVs are less
commercially developed, and the upfront costs will also be a barrier, although there has been a
recent increase in the number of models available.
The CCC has recently published analysis in which they assume almost 100% of HGV sales to be
low-carbon by 2040. Hydrogen may have a role in the decarbonisation of heavy goods vehicles, but
due to its lack of availability it has not been included in the analysis for the Five Year Plan. In
addition, there are concerns around its economic viability due to its low energy efficiency compared
to an electric solution. This should be re-evaluated in subsequent Five Year Plans.
The WMCA and the individual local authorities have limited control over the fleet of HGVs which is
used but can exert some influence through charging infrastructure and suggested policy on access
restrictions, such as Clean Air Zones and Low Emissions Zones. Decarbonising HGVs and
providing the necessary infrastructure will require national, and potentially international, action,
support and regulation. A starting point may be to focus on a strategy around the first/last mile.
Planning Implications
There are no known planning implications for the installation of individual chargers, unless the
technology requires on street charging opportunities or modification is needed to any of the existing
infrastructure.
The increase in electrical demand and need for centralised charging may also necessitate the
careful planning and locating of depots or charging hubs. There will be a need for hauliers to have
appropriate depot locations and for the introduction of ZEV infrastructure.
Planning implications may be pan regional / national. Issues with delivering refuelling / charging
infrastructure in surrounding Local Authorities and on the Strategic Road Network could hinder
deployment.
Goal Levels
The goal is to push the electrification of HGVs to 100% by 2041. Some of this share may be taken
up by hydrogen in the 2030s but is uncertain. Large-scale national trials are likely to take place in
the 2020s, as recommended by the CCC, and the WMCA is well placed to lead the way in this area.
The public infrastructure required to support this will include ultra-rapid public charge points and
hydrogen refuelling stations, in addition to depot charging points and refuelling facilities. In addition,
efficiency from improved HGV logistics to reduce miles driven by lorries, such as the usage of
consolidation centres, extended delivery windows and higher loading, will be key to achieving
carbon reduction targets.
Page 167

NET ZERO 2041 CONFIDENTIAL | WSP Project No.: 70076572 February 2021 West Midlands Combined Authority 74
▪ Low – 75% of HGVs are decarbonised by 2051; equivalent to 12.5% by 2026.
▪ Medium – All HGVs are decarbonised by 2051; equivalent to 17% by 2026.
▪ High – All HGVs are decarbonised by 2041; equivalent to 25% by 2026.
▪ Very High – No additional scenario was modelled (due to the lack of technical maturity of
solutions needed)
Figure 36 – Goal 12 GHG Emission Saving and Deployment in 2026
Figure 37 – Goal 12 Proportion of GHG Emission Saving in 2026 (Accelerated Scenario)
Co-benefits and Inclusive Growth
This goal will directly reduce the use of diesel for heavy goods vehicles and their associated
emissions. In addition, this will reduce their air pollution when driving in cities in the case of electric
lorries, with significant benefits around health and well-being, as well as noise.
0
20
40
60
80
100
120
0%
5%
10%
15%
20%
25%
30%
Low Medium High Very High
An
nu
al G
HG
Red
uct
ion
(ktC
O2)
Pro
po
rtio
n o
n L
ow
Car
bo
n F
uel
s
Proportion in 2050 GHG Saving in 2026
0% 10% 20% 30% 40% 50% 60% 70% 80% 90% 100%
Page 168

NET ZERO 2041 CONFIDENTIAL | WSP Project No.: 70076572 February 2021 West Midlands Combined Authority 75
We will change our economy
without leaving anyone behind N
eu
tra
l
− No impact
We will invest in the resilience of
our places Ne
utr
al
− No impact
We will use our industrial past to
create a new future P
os
itiv
e
Imp
ac
t
− Working with commercial and industrial partners as well as the automotive sector
We will create places and
connections that help us to meet
the climate challenge
Ne
utr
al
− No impact
We will decouple prosperity from
the consumption of energy and
resources
Po
sit
ive
Imp
ac
t
− Reduced use of fossil fuel vehicles
Page 169

NET ZERO 2041 CONFIDENTIAL | WSP Project No.: 70076572 February 2021 West Midlands Combined Authority 76
4.4.13 GOAL 13 – IMPROVING TRAVEL (ACCELERATED EV UPTAKE)
Description
The West Midlands Combined Authority area has a rich tradition in car manufacturing. It is home to
more than 430 specialist automotive firms, including 36 of the top 50 global suppliers with 40% of all
cars exported from the UK made in the West Midlands. Leading brands including Jaguar Land
Rover, Aston Martin, BMW and Tata all have a significant presence in the region. There is a drive to
attract new Gigafactory for battery production, as well as to support existing business, such as the
new electric vehicle production at Jaguar Land Rover.
The electrification of cars and light goods vehicles is happening at a faster pace than previously
anticipated, due to reduced battery prices and a recent increase in UK’s ambition. The Government
has recently announced the ban on the sale of new petrol and diesel cars and LGVs from 2030, (this
has been included as part of Business as Usual), and the CCC has modelled a feasible pathway for
electric cars which achieves significant penetration in the 2020s, with 46% of the car fleet electrified
by 2030, as part of their advice to Government on the sixth carbon budget (2033-2037). Therefore,
this goal aims to explore the carbon savings available from the electrification of cars according to the
CCC scenarios, which take place earlier than the pathways assumed under business-as-usual
scenario. Energy savings from this intervention are linked to those in the business as usual
scenario, to avoid double counting from the electrification of cars.
The WMCA and Transport for the West Midlands has a big role in enabling the transition to electric
transport solutions by ensuring that charging provision is in place for all, not just where it is the most
profitable to locate services and that this capacity is affordable, by working the Distribution Network
Operators to ensure that future capacity is planned for effectively. This will include opportunity
charging hubs, intended for longer journeys, as well as destination and residential charging hubs,
where off-street parking is not available. Where funding is made available by Government to support
the deployment of such charging facilities, the WMCA could play a role in ensuring that the West
Midlands accesses its fair share.
Fundamental to this goal will be understanding the role of cars in the future which is linked to modal
shift and reduction in car dependency. Whilst there may be an increase in the demand for electric
cars proportionally, overall car demand may fall as individual car ownership may become less
common in favour of the sharing economy, such as car clubs.
Planning Implications
There are no known planning implications for the installation of individual chargers, unless the
technology requires on street charging opportunities or modification is needed to any of the existing
infrastructure.
The increase in electrical demand and need for centralised charging may also necessitate the
careful planning and locating of depots or charging hubs. There will be a need for fleets, such as
car hire clubs to have appropriate locations for the introduction of ZEV infrastructure.
Planning implications may be pan regional / national. Issues with delivering refuelling / charging
infrastructure in surrounding Local Authorities and on the Strategic Road Network could hinder
deployment.
Page 170

NET ZERO 2041 CONFIDENTIAL | WSP Project No.: 70076572 February 2021 West Midlands Combined Authority 77
Wider aspects around the transition to electric vehicles may also be considered. Decisions around
any infrastructure planning or investments should consider that the role of the car in future may be
different than today, to avoid the risk of becoming redundant in a few years’ time. For examp le, new
models of car ownership may emerge such as private fleets, car clubs or the use of private hire
vehicles which could have a more significant role and should be incentivised through the planning
system.
Goal Levels
The goal is based around three different scenarios which are part of the latest Climate change
Committee analysis as part of their advice to Government on their Sixth Carbon Budget.
▪ Low – An EV trajectory in line with the Headwinds scenario10, which assumes a lower level
of societal/behavioural change and innovation. As such, only 8% of cars are electric by 2026,
rising to 88% by 2041.
▪ Medium – An EV trajectory in line with the Balanced Pathway scenario11, which achieves
significant progress throughout the 2020s and a balanced level of societal/behavioural
change and innovation. As such,13% of cars are electric by 2026, rising to 92% by 2041.
▪ High – An EV trajectory in line with the Tailwinds Pathway scenario12, which achieves net
zero before 2050 and assumes considerable success on both societal/behavioural change
and innovation. As such,15% of cars are electric by 2026, rising to 94% by 2041.
▪ Very High – No additional scenario was modelled for this goal, as it is considered that the
High scenario trajectory is as ambitious as possible.
10 The CCC’s Headwinds scenario, assumed that policies only manage to bring forward societal/behavioural change and innovation at the lesser end of the scale. People change their behaviour and new technologies develop, but we do not see widespread behavioural shifts or innovations that significantly reduce the cost of green technologies ahead of our current projections. 11 The CCC’s Balanced Net Zero Pathway, as a scenario that reaches net zero by 2050. It was designed to drive progress through the 2020s, while creating options in a way that seeks to keep the exploratory scenarios open. 12 The CCC’s Tailwinds scenario assumes considerable success on both innovation and societal / behavioural change and goes beyond the Balanced Pathway to achieve net zero before 2050.
Page 171

NET ZERO 2041 CONFIDENTIAL | WSP Project No.: 70076572 February 2021 West Midlands Combined Authority 78
Figure 38 – Goal 13 GHG Emission Saving and Deployment in 2026
Figure 39 – Goal 13 Proportion of GHG Emission Saving in 2026 (Accelerated Scenario)
Co-benefits and Inclusive Growth
• This goal will significantly reduce the use of fossil fuels for transport and their associated
emissions.
• In addition, one of the main benefits from electric forms of transport is their lack of NOx
pollution, and noise, improving the health and wellbeing of people (particularly in cities).
We will change our economy
without leaving anyone behind P
os
itiv
e
Imp
ac
t − Potential for re-engineering the internal combustion engine supply chain to support electrification, creating employment and skills opportunities.
− Change in car ownership models.
We will invest in the resilience of
our places
Ne
utr
al /
Ne
ga
tive
− EVs can reduce the cost of travel, potentially increasing strain on road networks.
0
50
100
150
200
250
0%
2%
4%
6%
8%
10%
12%
14%
16%
Low Medium High Very High
An
nu
al G
HG
Red
uct
ion
(ktC
O2)
Pro
po
rtio
n o
f El
ectr
ic C
ars
Proportion in 2050 GHG Saving in 2026
0% 10% 20% 30% 40% 50% 60% 70% 80% 90% 100%
Page 172

NET ZERO 2041 CONFIDENTIAL | WSP Project No.: 70076572 February 2021 West Midlands Combined Authority 79
We will use our industrial past to create a new
future Po
sit
ive
Ne
ga
tive
− Working with automotive sector and supply chain
− May reduce demand for vehicles as a whole
We will create places and
connections that help us to meet
the climate challenge
Ne
utr
al
− No impact
We will decouple
prosperity from the
consumption of energy and resources
Po
sit
ive
Imp
ac
t
− Reduced use of fossil fuel vehicles
Page 173

NET ZERO 2041 CONFIDENTIAL | WSP Project No.: 70076572 February 2021 West Midlands Combined Authority 80
4.4.14 GOAL 14 – LAND USE: RENEWABLES
Description
This goal considers the use of land within the West Midlands Combined Authority for generating
renewable electricity. Offsetting and installation of renewable energy generating equipment is
considered separately, not as part of this study.
Geographic Information Systems (GIS) analysis was used to identify areas that are ideally suited for
utility-scale solar and wind developments as used for this goal. The list of criteria included
requirements on the type of land as well as resource constraints. The approach was conservative,
not including historic landfill sites for solar and only considering areas with wind speeds above
6.5m/s @45m. The results of the GIS mapping can be found below.
For photovoltaics (solar farms), the 896ha of land was identified, with 875ha being at least 1ha.
Eleven parcels of land were identified as part of this assessment as being over 10ha; and totalling
630ha (70% of the total land available). Whilst consideration of DNO connections were not
considered at this point, the areas identified should be further investigated and prioritised if
considered suitable.
More detail on the GIS process is provided in Appendix C.
To calculate energy and carbon savings, a density of 2 ha per MW was used in line with industry
standards. An average capacity factor was used to calculate energy generation.
For wind generation potential, 389ha of land was identified across 52 sites. A density of 9ha per MW
was used. This was validated against a range of UK wind farms. For areas of less than 20ha, a
density of 1 MW per 3ha was used, as projects with very few turbines, such as in a farm, require
less spacing. The average UK wind capacity factor was used to calculate energy generation taken
from BEIS data.
The public sector can play a major role in the delivery of this though helping developers to link up
with end users to establish PPAs, working with community energy groups to bring forward schemes,
and invest in schemes to create a return.
Page 174

NET ZERO 2041 CONFIDENTIAL | WSP Project No.: 70076572 February 2021 West Midlands Combined Authority 81
Figure 40 – Identified potential for utility scale wind
Figure 41 – Identified potential for large ground-mounted solar
Page 175

NET ZERO 2041 CONFIDENTIAL | WSP Project No.: 70076572 February 2021 West Midlands Combined Authority 82
Planning implications
Utility-scale solar and wind development would require planning permission. Developments of this
nature are often landscape sensitive and can be controversial.
Goal Levels
The goal is to push these to 100% of their technical potential. The timeframe varies depending on
the scenario.
▪ Low – Only areas larger than 1 ha are used for PV, and 3 ha for wind.
This is equivalent to 437 MW of solar PV, 34 MW of wind in large sites and a further 16 MW in sites
smaller than 20 ha. This should be in place by 2041. This is equivalent to 109MW of PV and
12.5MW of wind by 2026.
▪ Medium – Only areas larger than 0.5 ha are used for PV, and areas larger than 2 ha for
wind.
This is equivalent to 443 MW of solar PV, 34 MW of wind in large sites and a further 21 MW in sites
smaller than 20 ha. This should be in place by 2041. This is equivalent to 111MW of PV and 14MW
of wind by 2026.
▪ High – All area available is used for solar PV, and areas larger than 1 ha are used for wind.
This is equivalent to 448 MW of solar PV, 34 MW of wind in large sites and a further 25 MW in sites
smaller than 20 ha. This should be in place by 2030. This is equivalent to 224MW of PV and 30MW
of wind by 2026.
▪ Very High – This is equivalent to 448MW of PV and 34MW of wind by 2026.
Figure 42 – Goal 14 GHG Emission Saving and Deployment in 2026
0
20
40
60
80
100
120
0
50
100
150
200
250
300
350
400
450
500
Low Medium High Very High
GH
G R
edu
ctio
n (k
tCO
2)
Inst
alle
d C
apac
ity
(MW
)
PV Wind GHG Saving in 2026
Page 176

NET ZERO 2041 CONFIDENTIAL | WSP Project No.: 70076572 February 2021 West Midlands Combined Authority 83
Figure 43 – Goal 14 Proportion of GHG Emission Saving in 2026 (Accelerated Scenario)
Co-benefits and Inclusive Growth
• Large-scale renewable projects can generate jobs in the region during their construction, as
well as for maintenance purposes.
• Electricity generated by these projects could become a source of cheap, clean electricity for
large commercial and industrial players in the region through Power Purchase Agreements
(PPAs).
• In addition, smaller scale renewable projects can become a source of alternative income for
landowners, such as farmers, or for community organisations
We will change our economy
without leaving anyone behind N
eu
tra
l
− No impact
We will invest in the resilience of
our places Po
sit
ive
Imp
ac
t
− Potential source of cheap energy or income generation
We will use our industrial past to
create a new future P
os
itiv
e
Imp
ac
t
− Working with supply chain for installing and maintaining systems
We will create places and
connections that help us to meet
the climate challenge
Ne
utr
al
− No impact
We will decouple prosperity from
the consumption of energy and
resources
Po
sit
ive
Imp
ac
t
− Generation of renewable energy reduces fossil fuel use
0% 10% 20% 30% 40% 50% 60% 70% 80% 90% 100%
Page 177

NET ZERO 2041 CONFIDENTIAL | WSP Project No.: 70076572 February 2021 West Midlands Combined Authority 84
4.4.15 GOAL 15 – LAND USE: NATURAL CAPITAL
Description
Where greenhouse gas emissions are unavoidable, tree planting and more specifically, increasing
the area of sustainably managed forests, has an important role to play in achieving net zero carbon
emissions through direct sequestration of carbon dioxide from the atmosphere.
In addition to afforestation there are a number of broader nature-based solutions that can contribute
to meeting net zero targets by locking up carbon over the long term. This includes improved
management of semi-natural habitats such as heathland and grassland, better soil conservation and
land use for agro-forestry.
Currently, forest cover in the WMCA is about 1.5% of the area13, agriculture 20% and urban/built up
areas 70%, of which 57% is discontinuous urban fabric. The best opportunity for afforestation is on
agricultural land of poorer quality and which will be repurposed with an associated shift in payments
through the Environmental Land Management Scheme.
GIS mapping was undertaken as part of this project in order to help quantify the land availability for
large-scale afforestation and carbon sequestration. This included agricultural land and peri-urban
land, where more street style tree planting can play a role.
Figure 44 –Identified potential for natural capital solutions in agricultural land
13 According to Corine land cover map 2018 categories for forests plus the area of land classified as Ancient Woodland Sites. This is aligned with the approach used by the CCC in: Committee on Climate Change, 2018, Land Use: Reducing emissions and preparing for climate change
Page 178

NET ZERO 2041 CONFIDENTIAL | WSP Project No.: 70076572 February 2021 West Midlands Combined Authority 85
Figure 45 –Identified potential for natural capital solutions in peri-urban land
The methodology employed considered the area within the boundaries of the seven local authorities
as a whole and used a number of constraints to exclude locations deemed unsuitable. The results of
the GIS mapping for the potential for natural capital solutions can be seen above.
Planning Implications
There is an opportunity to identify and secure sites for afforestation through local policy and to
incentivise developers to consider planting trees as part of development proposals.
Forestry for commercial purposes or on a significant scale that it may be deemed to lead to a
change of use of the land may need planning permission.
Goal Levels
▪ Low – 2 million trees by 2026 and 2.9 million by 2041.
This would be equivalent to meeting a target of 1 tree planted for every person in the WMCA, in line
with the Virtual Forest initiative being led by the WMCA, launched in January 2020. It would be
equivalent to planting woodland in 2% of the WMCA area.
▪ Medium – 2.9 million trees by 2026 and 11.7 million by 2041.
The Climate Change Committee (CCC) advised the UK government to increase UK forestry cover
from 13% to at least 17% by 2050. However, England is well behind that target to date at 10%. The
Page 179

NET ZERO 2041 CONFIDENTIAL | WSP Project No.: 70076572 February 2021 West Midlands Combined Authority 86
medium scenario applies a target of 10% forest cover, to bring it in line with the rest of England. This
is equivalent to 9,000 ha.
In addition to repurposing suitable agricultural land, implementation should focus on increasing tree
cover and green spaces within urban areas and creating woodland areas close to urban centres,
such as through the delivery of the West Midlands National Park. The density of tree cover in urban
areas is significantly lower. 28ha of urban tree cover would be equivalent in carbon sequestration of
1ha of woodland but provide more co-benefits.
It was assumed that trees could be planted on up to 20% of the peri-urban land available14
(approximately 10,000ha).
▪ High – 5.7 million trees by 2026 and 19 million by 2041.
The GIS mapping identified that 15% of the WMCA area is suitable for woodland planting according
to the criteria applied. This would meet the previous forestry cover target set by the Independent
Panel on Forestry in 2012 but not the latest figure of 17-19% set by the Committee on Climate
Change in 2020. In addition, some of the land identified will be used for the development of utility
scale solar PV and wind installations. These areas have been discounted to avoid double counting.
Therefore, the maximum area which can be utilised is 13% of the total WMCA area, equivalent to
almost 12,000 ha.
In addition, the same level of tree planting peri-urban areas has been assumed in this scenario.
▪ Very High – As high
Figure 46 – Goal 15 GHG Emission Saving and Deployment in 2026
14 Peri-urban land is taken from the Corine land cover map 2018 layer for discontinuous urban fabric (urban structures and transport networks associated with vegetated areas and bare surfaces are present and occupy significant surfaces in a discontinuous spatial pattern. The impermeable features like buildings, roads and artificially surfaced areas range from 30 to 80 % land coverage).
0
5
10
15
20
25
30
35
0%
5%
10%
15%
20%
25%
Low Medium High Very High
An
nu
al G
HG
Red
uct
ion
(ktC
O2)
Per
cen
tage
of
WM
CA
Forest Cover Agro-forest GHG Saving in 2026
Page 180

NET ZERO 2041 CONFIDENTIAL | WSP Project No.: 70076572 February 2021 West Midlands Combined Authority 87
Figure 47 – Goal 15 Proportion of GHG Emission Saving in 2026 (Accelerated Scenario)
Co-benefits and Inclusive Growth
• Forests and urban planting provide a wide range of environmental, social and health
benefits.
• Beyond the climate mitigation benefits of nature-based solutions, they contribute to climate
resilience and adaptation and a wide range of other societal benefits including health and
wellbeing.
• Ensuring that urban planting is well conceived, carried out and maintained is an important
part of ensuring that carbon sequestration and other benefits can be realised – this is an
opportunity to create jobs and encourage community ownership and stewardship.
We will change our economy
without leaving anyone behind N
eu
tra
l
− No impact
We will invest in the resilience of
our places Po
sit
ive
Imp
ac
t
− Nature-based solutions provide additional resilience to climate change.
We will use our industrial past to create a new
future Ne
utr
al
− No impact
We will create places and
connections that help us to meet
the climate challenge
Ne
utr
al
− Wide range of environmental, social and health benefits
We will decouple
prosperity from the
consumption of energy and resources
Po
sit
ive
Imp
ac
t
− Trees and other natural capital capture CO2
0% 10% 20% 30% 40% 50% 60% 70% 80% 90% 100%
Page 181

NET ZERO 2041 CONFIDENTIAL | WSP Project No.: 70076572 February 2021 West Midlands Combined Authority 88
4.4.16 SYSTEM MANAGEMENT
The achievement of these goals will require significant investment and dedicated long term resource
commitments. To achieve these goals will not simply require new programmes of work, but inherent
systems change, particularly in the way infrastructure, including transport, housing, commercial and
energy infrastructure is planned for.
In terms of changes to the transport system, local authorities, the WMCA, Network Rail and
Highways England have the opportunity to develop policy and strategies to invest in line with the
goals identified. The West Midlands Local Transport Plan is under review and the new Strategy will
provide a more detailed and developed understanding of the change required to the transport
system and the measures required to deliver it.
In the case of electricity and gas, current regulation does not align with local authorities or regions.
The infrastructure is run by distribution network operators, the National Grid, and gas distributors.
These are regulated by Ofgem and investment decisions are controlled. The costs of upgrading the
electrical network in the UK for heat have been estimated to be £25bn15. Meanwhile, the Committee
on Climate Change estimated that the rapid uptake of electric vehicles and heat pumps could
increase total expenditure on distribution networks by up to £50 billion by 2035, or £1.8 billion per
year16. If this was to be reflected on a per capita basis would mean that the cost of upgrading the
electrical network for WMCA would be circa £2.2bn. The gas network is more uncertain with the
possibility of conversion to hydrogen, a slow decommissioning process, or a mix.
There are things that the region can do to ensure that energy system costs are not prohibitive and
do not result in business cases for schemes being destroyed by hefty network connection charges.
Local Area Energy Planning is a vital first step to understand the potential impact of decarbonisation
programmes on the local network spatially. Engaging with the energy infrastructure planning
process is then required, as energy infrastructure is planned in investment cycles agreed with
Ofgem, so it is important to ensure the Distribution Network Operators aware of deployment
programmes years in advance of connection, so that developments can be factored into network
upgrade planning. Sharing data between transport, spatial planning and energy planning processes
is a vital first step to achieving the system change necessary to remove barriers to decarbonisation.
Smart solutions to decarbonisation
In order to optimally balance the energy networks, it will be necessary to actively manage each of
these components; both nationally and locally. Although the expected electrical demand is double or
treble current overall amounts, the main issue for network is actually the peak of that demand.
Smart local energy systems can be designed and built to enable cost signals to change usage
patterns to address some of these peak systems issues. For example, utilising the storage potential
within electric vehicles using vehicle-to-grid technologies, as well as simpler temporal considerations
to charging behaviour (so that charging occurs at the most opportune time and not contributing to
peaks). Similarly heating systems may also adapt to usage patterns, to use energy when more
appropriate (potentially storing heat or preheating homes ahead of predicted demand). Many
estimates of the potential energy consumption increase as a result of electrification assume
behaviour or the way we use energy is unchanged. Whereas there are large opportunities to reduce
15 https://nic.org.uk/app/uploads//Element-Energy-and-E4techCost-analysis-of-future-heat-infrastructure-Final.pdf 16 https://www.theccc.org.uk/wp-content/uploads/2019/05/CCC-Accelerated-Electrification-Vivid-Economics-Imperial-1.pdf
Page 182

NET ZERO 2041 CONFIDENTIAL | WSP Project No.: 70076572 February 2021 West Midlands Combined Authority 89
demand through initiatives such as hub charging, freight exchange and shared vehicle ownership
schemes. These new markets also offer significant new high value jobs and business opportunities.
To make the most of these opportunities new responsibilities for smart local energy systems need to
be adopted locally. The goal here is to ensure better understanding across the transport, buildings
and energy sectors of the opportunities that exist and how to harness them.
This does not directly affect the modelling results but will be crucial as an enabler. These issues are
sought to be addressed in the Systems Management element of the Delivery Plans.
Planning
To be effective the objectives of this programme should be rooted in local planning policy and
aligned with national guidance. Local policy in particular can act as a lever to require, incentivise
and/ or encouraging change and delivery. The National Planning Policy Framework does reference
the need for planning to support the infrastructure required for the transition.
Page 183

NET ZERO 2041 CONFIDENTIAL | WSP Project No.: 70076572 February 2021 West Midlands Combined Authority 90
4.5 ASSESSMENT OF SCENARIOS
Three scenarios have been considered concerning the pace and trajectory of the required transition,
‘Moderate’, ‘Accelerated’ and ‘Maximum’.
The scenarios are:
■ The Moderate scenario sets out a trajectory that would not meet the 2026 or 2041 goal but
does indicate the actions required to meet the reductions targeted in 2026 by the much later date
of 2041. Even this scenario, which represents the slowest delivery pace, is beyond the current
efforts, defined as business as usual in the graph below.
■ The Accelerated scenario is the reference scenario for this plan. It is ambitious and will require
a step-change in delivery. It will meet the 2041 net zero target but not at the rate of the Tyndall
trajectory.
■ The Maximum scenario would align with the Tyndall 2026 trajectory, and net zero by 2041. Its
reliance on Very High goal levels, almost throughout, means that it is at or beyond the limits of
what is technically feasible, even ignoring legislative competence and financial restrictions.
Policies associated with this scenario would also not enable a just transition to net zero, which is
a key principle of WM2041, because it would lead to large scale job losses or restrictions to
current rights. For this reason, it has not been proposed, but can be explored by those seeking
to understand what is required.
Figure 48 – Summary of Five Year Plan scenarios VS business as usual and proposed Tyndall
carbon budget
Page 184

NET ZERO 2041 CONFIDENTIAL | WSP Project No.: 70076572 February 2021 West Midlands Combined Authority 91
4.5.1 THE ‘MODERATE’ SCENARIO
A lower-level goal scenario was defined, with individual levels for each goal defined as per the figure
below, mainly set at either ‘Medium’ or ‘Low’, except for commercial solar PV.
Figure 49 – Moderate scenario
1. D
om
esti
c En
ergy
Eff
icie
ncy
2. D
om
esti
c H
eati
ng
Ret
rofi
t
3. D
om
esti
c P
V
4. C
om
mer
cial
En
ergy
Eff
icie
ncy
5. C
om
mer
cial
Hea
tin
g R
etro
fit
6. C
om
mer
cial
PV
7. I
nd
ust
rial
En
ergy
Eff
icie
ncy
8. I
nd
ust
rial
PV
9. A
void
ing
Trav
el
10. S
hif
tin
g Tr
ave
l
11. I
mp
rovi
ng
Trav
el (
Bu
s /
Taxi
)
12. I
mp
rovi
ng
Trav
el (
HG
V)
13. I
mp
rovi
ng
Trav
el (
Acc
eler
ate
EVs)
14. L
and
Use
(R
en
ewab
les)
15. L
and
Use
(N
atu
ral C
apit
al)
Very High
High
Medium
Low
While it is the scenario with a lower goal level being considered, it still represents a step-change in
progress across many areas. For example, some of the following targets would need to be met (a
full description of each goal at each level of goal is provided in section 4.5):
▪ The retrofitting by 2041 of all local authority owned dwellings (about 145,000), and all socially
and privately rented dwellings (about 132,000 and 210,000, respectively) to a reasonable
standard, with around a quarter of those completed by 2026.
▪ The retrofitting of 332,000 heat pumps in existing dwellings by 2041, and 14,000 by 2026
(the assumed uptake trajectory for heat pumps is not linear).
▪ A 20% reduction in energy use across all 74,000 offices, retail and other commercial
buildings (e.g. health, education) by 2041, with a quarter of those completed by 2026.
▪ The installation of about 1.6 GW of solar across the domestic, commercial and industrial built
environment by 2041, with about 400 MW to be installed by 2026.
▪ The introduction of hydrogen in high-temperature industrial processes to cover 8% of their
energy needs, as well as 25% of potential for capturing the remaining emissions with CCS, a
5% improvement in energy efficiency and electrification of low-temperature processes.
Page 185

NET ZERO 2041 CONFIDENTIAL | WSP Project No.: 70076572 February 2021 West Midlands Combined Authority 92
▪ A reduction in car usage to 50% of all trips (from 63% today), and an associated increase of
cycling to 5%. The modal share of public transport is expanded to 18% of all trips.
The carbon modelling of the 15 goals at the level of goal in this scenario shows a reduction in
carbon emissions of 24% by 2026 from 2016 levels, and close to 68% by 2041 if implementation
started immediately. This scenario would not be sufficient to reach net zero until after 2050.
Figure 50 – GHG reduction waterfall chart in 2026 (moderate scenario)
Page 186

NET ZERO 2041 CONFIDENTIAL | WSP Project No.: 70076572 February 2021 West Midlands Combined Authority 93
Figure 51 – Moderate scenario cumulative effects
4.5.2 THE ‘ACCELERATED’ SCENARIO
The ‘Accelerated’ scenario is ambitious and contains a much more rapid and aggressive set of goals
across the different sectors, with most set at a “high” goal level. The main exception is energy
efficiency and fuel switching measures in the industrial sector, as the majority of technologies
involved are at an earlier stage of commercial and even technical development. Solar PV in
industrial buildings, due to its much smaller scale, ease of financing incentive for end users, has
been set at a very high level.
-
2,000
4,000
6,000
8,000
10,000
12,000
14,000
16,000
18,000
20
05
20
06
20
07
20
08
20
09
20
10
20
11
20
12
20
13
20
14
20
15
20
16
20
17
20
18
20
19
20
20
20
21
20
22
20
23
20
24
20
25
20
26
20
27
20
28
20
29
20
30
20
31
20
32
20
33
20
34
20
35
20
36
20
37
20
38
20
39
20
40
20
41
An
nu
al G
HG
Em
issi
on
s (k
t C
O2e
)
WMCA GHG Emissions - Cumulative Effects
Remaining Emissions BaU Domestic Commercial Industrial Transport Strategic Land Use
Page 187

NET ZERO 2041 CONFIDENTIAL | WSP Project No.: 70076572 February 2021 West Midlands Combined Authority 94
Figure 52 – Accelerated scenario
1. D
om
esti
c En
ergy
Eff
icie
ncy
2. D
om
esti
c H
eati
ng
Ret
rofi
t
3. D
om
esti
c P
V
4. C
om
mer
cial
En
ergy
Eff
icie
ncy
5. C
om
mer
cial
Hea
tin
g R
etro
fit
6. C
om
mer
cial
PV
7. In
du
stri
al E
ner
gy E
ffic
ien
cy
8. In
du
stri
al P
V
9. A
void
ing
Trav
el
10. S
hif
tin
g Tr
ave
l
11. I
mp
rovi
ng
Trav
el (
Bu
s /
Taxi
)
12. I
mp
rovi
ng
Trav
el (
HG
V)
13. I
mp
rovi
ng
Trav
el (
Acc
eler
ate
EVs)
14. L
and
Use
(R
en
ewab
les)
15. L
and
Use
(N
atu
ral C
apit
al)
Very High
High
Medium
Low
This is the reference scenario considered in the modelling and contains a set of goals with the
necessary ambition to a cause a very significant reduction in the region’s carbon emissions, while
still being technically feasible. The scale of the changes and actions needed will require the right
national and regional policies, access to finance, public acceptance and development of a number of
supply chains (e.g. energy efficiency in buildings).
Some of the targets that would need to be achieved are listed below, to illustrate the magnitude of
the challenge (a full description of each goal at each goal level is provided in section 4.5):
▪ Energy efficiency retrofit, to a reasonable standard 294,000 dwellings in the WMCA by 2026 at a cost of £0.6bn.
▪ The installation of low-carbon heating in 292,000 dwellings completed by 2026. Due to this goal’s timescales, heat pumps (predominantly air-source) are likely to be the dominant technology at a gross cost of £2.3bn within the first FYP.
▪ The installation of about 863 MWp of rooftop solar PV across the region’s domestic, commercial and industrial buildings by 2026 at a cost of £0.3bn. Additionally, 253.5 MWp of large-scale solar PV and wind farms are deployed in suitable locations identified.
▪ More aggressive energy efficiency measures in the commercial sector equivalent to 37,000 commercial buildings by 2026 (costing £0.4bn).
▪ A much more significant role for hydrogen is needed in industrial high-temperature processes, covering 16.7% of their energy demand, as well as 50% of potential for capturing the remaining emissions with CCS. Other secondary and low-temperature processes are made 10% more efficient and electrified.
Page 188
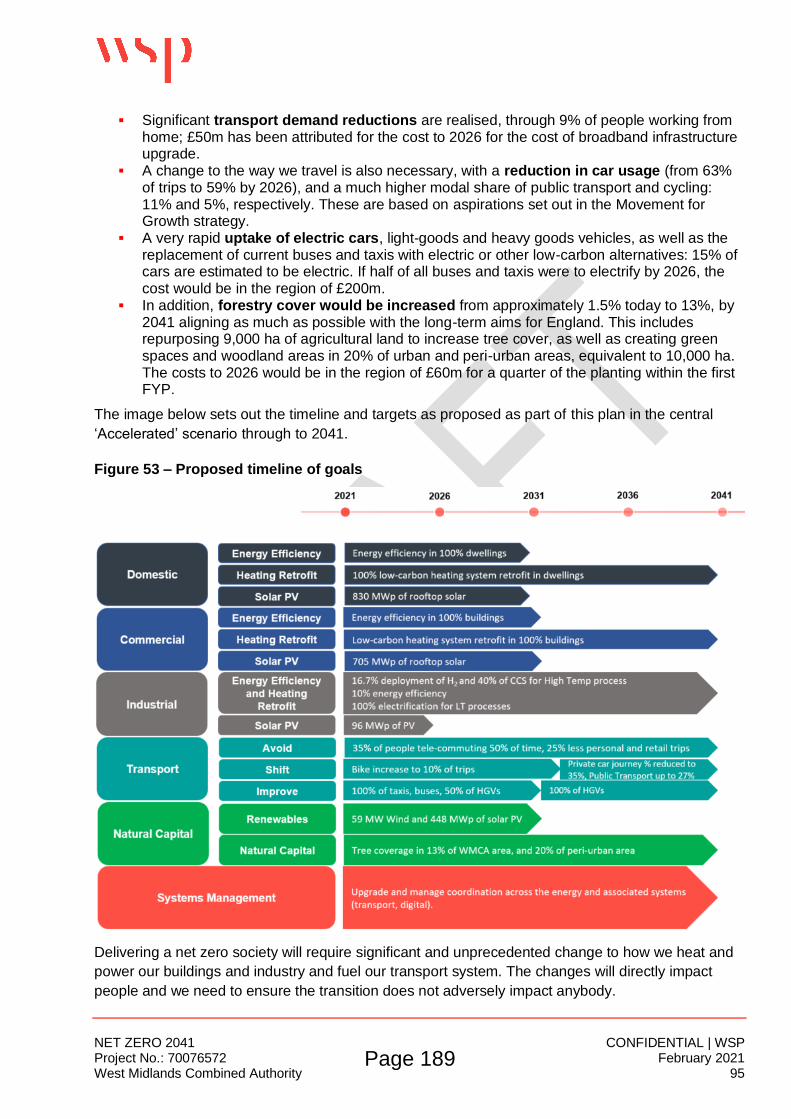
NET ZERO 2041 CONFIDENTIAL | WSP Project No.: 70076572 February 2021 West Midlands Combined Authority 95
▪ Significant transport demand reductions are realised, through 9% of people working from home; £50m has been attributed for the cost to 2026 for the cost of broadband infrastructure upgrade.
▪ A change to the way we travel is also necessary, with a reduction in car usage (from 63% of trips to 59% by 2026), and a much higher modal share of public transport and cycling: 11% and 5%, respectively. These are based on aspirations set out in the Movement for Growth strategy.
▪ A very rapid uptake of electric cars, light-goods and heavy goods vehicles, as well as the replacement of current buses and taxis with electric or other low-carbon alternatives: 15% of cars are estimated to be electric. If half of all buses and taxis were to electrify by 2026, the cost would be in the region of £200m.
▪ In addition, forestry cover would be increased from approximately 1.5% today to 13%, by 2041 aligning as much as possible with the long-term aims for England. This includes repurposing 9,000 ha of agricultural land to increase tree cover, as well as creating green spaces and woodland areas in 20% of urban and peri-urban areas, equivalent to 10,000 ha. The costs to 2026 would be in the region of £60m for a quarter of the planting within the first FYP.
The image below sets out the timeline and targets as proposed as part of this plan in the central
‘Accelerated’ scenario through to 2041.
Figure 53 – Proposed timeline of goals
Delivering a net zero society will require significant and unprecedented change to how we heat and
power our buildings and industry and fuel our transport system. The changes will directly impact
people and we need to ensure the transition does not adversely impact anybody.
Page 189

NET ZERO 2041 CONFIDENTIAL | WSP Project No.: 70076572 February 2021 West Midlands Combined Authority 96
The modelling of this scenario results in an almost complete decarbonisation by 2041, at 94%
compared to the 2016 baseline, and 33% by 2026, as can be seen in the graph below:
Figure 54 – GHG reduction waterfall chart in 2026 (accelerated scenario)
This scenario shows a much higher reduction in carbon emissions both by 2026 and 2041 than the
Moderate scenario, and it indicates that it is possible for the WMCA to meet their goal of becoming
net zero carbon by 2041. Achieving the goals considered in this scenario will require an
unprecedented effort to decarbonise every sector, in most cases ahead of the rest of the UK.
Despite this, this scenario only achieves a 33% reduction by 2026 (compared to 2016 baseline).
The cumulative effects of the different sectors can be seen in the following graph. It is clear that the
domestic and transport sectors represent the two sectors with the highest level of reductions, with
business as usual (which includes measures such as the 2030 petrol and diesel car and LGV ban)
also being significant. This scenario shows that meeting longer term net-zero carbon targets is
possible, but that achieving that requires decisive and strong intervention measures and time for
their effect to compound.
Page 190
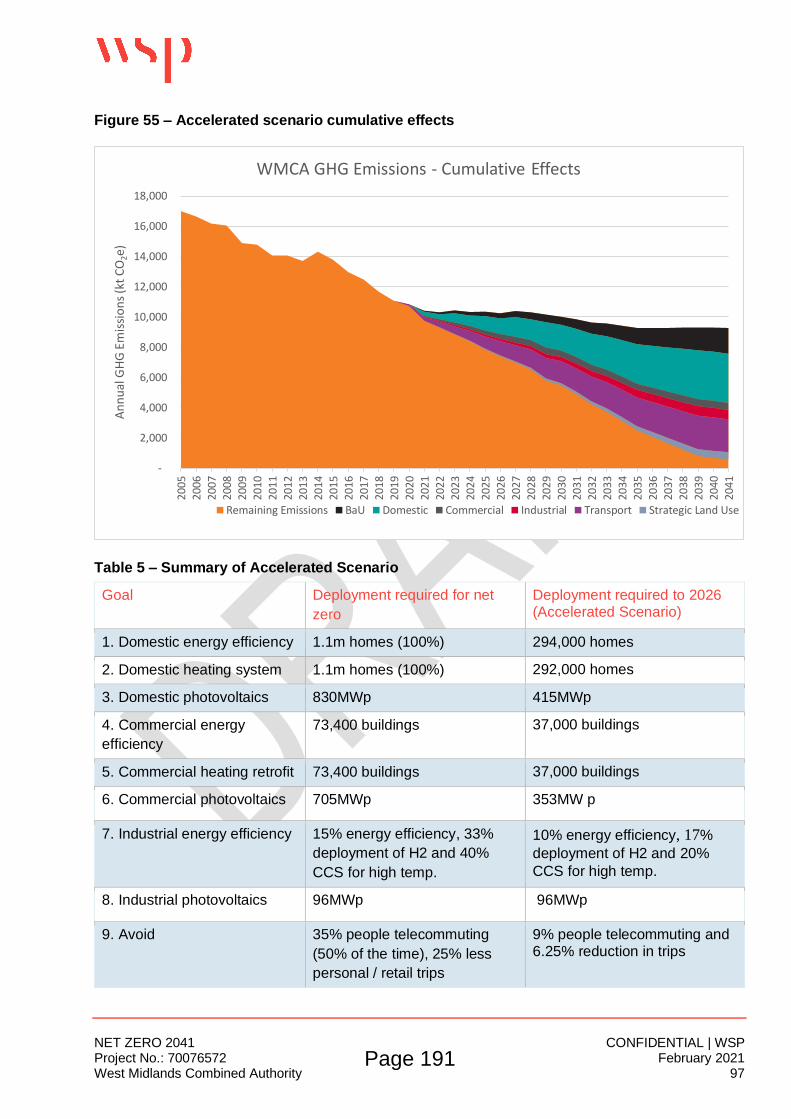
NET ZERO 2041 CONFIDENTIAL | WSP Project No.: 70076572 February 2021 West Midlands Combined Authority 97
Figure 55 – Accelerated scenario cumulative effects
Table 5 – Summary of Accelerated Scenario
Goal Deployment required for net
zero
Deployment required to 2026 (Accelerated Scenario)
1. Domestic energy efficiency 1.1m homes (100%) 294,000 homes
2. Domestic heating system 1.1m homes (100%) 292,000 homes
3. Domestic photovoltaics 830MWp 415MWp
4. Commercial energy
efficiency
73,400 buildings 37,000 buildings
5. Commercial heating retrofit 73,400 buildings 37,000 buildings
6. Commercial photovoltaics 705MWp 353MW p
7. Industrial energy efficiency 15% energy efficiency, 33%
deployment of H2 and 40%
CCS for high temp.
10% energy efficiency, 17%
deployment of H2 and 20%
CCS for high temp.
8. Industrial photovoltaics 96MWp 96MWp
9. Avoid 35% people telecommuting
(50% of the time), 25% less
personal / retail trips
9% people telecommuting and 6.25% reduction in trips
-
2,000
4,000
6,000
8,000
10,000
12,000
14,000
16,000
18,000
20
05
2006
20
07
20
08
20
09
20
10
20
11
20
12
20
13
20
14
2015
20
16
20
17
20
18
20
19
20
20
20
21
20
22
20
23
20
24
20
25
2026
20
27
20
28
20
29
20
30
20
31
20
32
20
33
20
34
2035
20
36
2037
20
38
20
39
20
40
20
41
An
nu
al G
HG
Em
issi
on
s (k
t C
O2e
)
WMCA GHG Emissions - Cumulative Effects
Remaining Emissions BaU Domestic Commercial Industrial Transport Strategic Land Use
Page 191

NET ZERO 2041 CONFIDENTIAL | WSP Project No.: 70076572 February 2021 West Midlands Combined Authority 98
10. Shift Shift to 35% trips by car 59% trips by car
11. Improve travel (bus and
taxi)
100% taxis & buses
electrification
100% electrification by 2030
12. Improve travel (HGVs) 100% of HGVs are electrified 25% of HGVs are electrified
13. Improve travel
(accelerated EVs)
100% of cars are electrified 15% of cars are electrified
14. Land use - renewables 59MW wind and 448MWp of
solar potential
30MW wind and 224MWp solar
15. Land use - natural capital 13% WMCA tree coverage 13% forest cover/20% peri-
urban areas
Figure 56 – Summary of Accelerated Scenario to 2026
Page 192

NET ZERO 2041 CONFIDENTIAL | WSP Project No.: 70076572 February 2021 West Midlands Combined Authority 99
4.5.3 THE ‘MAXIMUM’ SCENARIO
The ‘Maximum’ scenario was developed as an illustration of what would be required to be in line
with the trajectory outlined by the Tyndall Centre, particularly with regards to the speed of
implementation of the measures already modelled so far. As such, the main difference between the
level of goals set at “very high” with those at “high” is the fact that they are completed by 2026, with
the scope remaining unmodified. Doing so is likely to be at the limit or beyond what it is technically
possible and would require large behaviour change, legislative change, very large financial
investment from government, and private and public collaboration. Following this scenario would,
arguably, not allow for a just transition.
Figure 57 – Maximum scenario
1. D
om
esti
c En
ergy
Eff
icie
ncy
2. D
om
esti
c H
eati
ng
Ret
rofi
t
3. D
om
esti
c P
V
4. C
om
mer
cial
En
ergy
Eff
icie
ncy
5. C
om
mer
cial
Hea
tin
g R
etro
fit
6. C
om
mer
cial
PV
7. I
nd
ust
rial
En
ergy
Eff
icie
ncy
8. I
nd
ust
rial
PV
9. A
void
ing
Trav
el
10. S
hif
tin
g Tr
ave
l
11. I
mp
rovi
ng
Trav
el (
Bu
s /
Taxi
)
12. I
mp
rovi
ng
Trav
el (
HG
V)
13. I
mp
rovi
ng
Trav
el (
Acc
eler
ate
EVs)
14. L
and
Use
(R
en
ewab
les)
15. L
and
Use
(N
atu
ral C
apit
al)
Very High
High
Medium
Low
This scenario sets most goals at a “very high” level, with the exception of areas where technologies
required are not yet mature, such in industry or HGVs, and afforestation, as carbon sequestration
from afforestation requires longer time frames. Lastly, the EV uptake goal has not been modified, as
it is already a very aggressive projection in the Accelerated scenario.
The results of modelling this scenario show a 64% reduction in GHG emissions from 2016 by 2026,
and virtually 100% by 2040. For example, some of the following targets would need to be met:
▪ The retrofitting of all dwellings (1,178,000) to a reasonable standard by 2026.
▪ The retrofitting of all dwellings with heat pump by 2026.
▪ A 20% reduction in energy use across all 74,000 offices, retail and other commercial
buildings (e.g. health, education) by 2026.
Page 193

NET ZERO 2041 CONFIDENTIAL | WSP Project No.: 70076572 February 2021 West Midlands Combined Authority 100
▪ The installation of about 1.6 GW of solar across the domestic, commercial and industrial built
environment by 2026
▪ A decrease in car usage to 35% of all trips (from 63% today), and an associated increase of
cycling to 10%.
Figure 58 – GHG reduction waterfall chart in 2026 (maximum scenario)
The nature of this scenario shows aggressive and drastic reductions from 2021, as can be seen in
the graph below, which are unlikely to be achievable in practice, but which set the way to meet the
2026 carbon target. The domestic and transport sectors are largely decarbonised by 2025.
Page 194

NET ZERO 2041 CONFIDENTIAL | WSP Project No.: 70076572 February 2021 West Midlands Combined Authority 101
Figure 59 – Maximum scenario cumulative effects
4.5.4 APPROACH TO CARBON OFFSETTING OR CAPTURE
Where any GHG emissions remain after maximising all opportunities to reduce consumption, the
option remains to offset the balance. In this scenario, emissions are instead reduced elsewhere to
compensate for emissions released within the WMCA. There are many schemes that are in
operation which can facilitate this each with their own standards and accreditation; some are more
reputable than others and there is often a concern over the GHG emissions reduction would have
occurred under business as usual.
Some offsetting schemes include the Clean Development Mechanism and the Gold standard
amongst many others. The local planning policy regime also offers an opportunity to consider
carbon off-setting.
Whilst there are many other standards for carbon offsetting available, the scale of the West
Midlands means that offsetting and any large differences would be substantial and have a political
dimension. The use of offsetting will be considered separately by the WMCA and is not part of this
study.
Carbon Insetting
Whereas carbon offsetting considers GHG reduction by activity outside of the WMCA’s direct or
indirect operations, insetting refers specifically to GHG reductions that are directly related or within
the sphere of influence (including within the geography of the region or within its supply chain).
The Tyndall Centre has advised that the recommended budgets here are the minimum requirement
for meeting the Paris Agreement – i.e. the maximum CO2 emissions budget. Therefore, adopting a
smaller cumulative CO2 budget than the one presented, with accelerated reduction rates leading to
-2,000
-
2,000
4,000
6,000
8,000
10,000
12,000
14,000
16,000
18,000
20
05
20
06
20
07
20
08
20
09
20
10
20
11
20
12
20
13
20
14
20
15
20
16
20
17
20
18
20
19
20
20
20
21
20
22
20
23
20
24
20
25
20
26
20
27
20
28
20
29
20
30
20
31
20
32
20
33
20
34
20
35
20
36
20
37
20
38
20
39
20
40
20
41
An
nu
al G
HG
Em
issi
on
s (k
t C
O2e
)
WMCA GHG Emissions - Cumulative Effects
Remaining Emissions BaU Domestic Commercial Industrial Transport Strategic Land Use
Page 195

NET ZERO 2041 CONFIDENTIAL | WSP Project No.: 70076572 February 2021 West Midlands Combined Authority 102
an earlier zero carbon year, is compatible with this approach. The use of carbon offsets to meet an
earlier target year, are not however considered consistent with this approach.
Carbon removals via negative emissions technologies (such as carbon capture) are not included,
but tree planting is. The Committee of Climate Change include a significant role for these
technologies in their analysis. Doing so increases the size of a carbon budget and allows the WMCA
to exceed budgets in the short term. However, carbon removal technologies are still at a very early
stage of development and whether they can be successfully deployed at sufficient scale is highly
uncertain. While they are an important technology to develop and the Combine Authority should
consider this as an option as progress is made.
Chapter Summary
❖ An energy and carbon model was
developed for the WMCA area. This
considered current and projected future
GHG emission to 2041 under Business-As-
Usual.
❖ The effect of achieving 15 separate goals
were modelled to understand the impact to
2026 and 2041. For each, different goal
levels were also considered to understand
what combination would be needed to meet
reduction targets.
❖ The approach considered domestic,
commercial, industrial, transport and land
use; all underpinned by the requirement for
system management.
❖ The target of being net zero carbon by 2041
is achievable but requires considerable
effort and a step change in actions
according to the ‘Accelerated’ scenario.
❖ Consideration was also undertaken of the
WMCA’s role to enable, influence and
deliver.
❖ Meeting the Tyndall 2026 trajectory would
require a very high rate of change, which is
arguably not deliverable, for financial, legal
and technical reasons.
Page 196

NET ZERO 2041 CONFIDENTIAL | WSP Project No.: 70076572 February 2021 West Midlands Combined Authority 103
5 ECONOMIC MODELLING
In order to understand the potential costs, overlaps and opportunities associated with each of these
interventions, economic modelling was undertaken. Here, the major capital investment elements
were quantified under the ‘Accelerated’ scenario, (where known), and any operational savings/costs
were captured to 2041 only. Only the key capital flows were captured and there are likely to be
many wider considerations that would be needed for a comprehensive economic model. This model
did however allow for the understanding of the broad costs and value for money.
The costs associated with system management and transportation have not been incorporated,
partially due to the fact that they are already budgeted and due to the complexity of the financial
flows. Similarly, the costs of administration and institutional requirements are not included.
A Marginal Abatement Cost Curve (MACC) was developed to aid this process as a way of
visualising this data and ranking / comparing different goals and technologies by plotting the
marginal abatement cost (the Net Present Value (NPV) over the GHG saving potential – in £ per
tonne of carbon) against the absolute GHG saving. The most financially advantageous / cost
effective projects appear to the left of the chart, with those below 0, indicating a positive financial
return. The MACC does also not take account for set up of the programmes and projects, or their
management; this is considered under the delivery section.
Correct use and interpretation and use of the MACC can aid the decision-making process and help
with prioritisation but should only be used as part of wider understanding of the goals, inter-
dependency and local context. Full details of the assumptions made for each NPV calculation can
be found in Appendix F.
The costs associated with the various goals represent the gross cost, with many providing a good
financial return. In some cases, however, the cost of implementation may be split between various
parties, whilst similarly the beneficiary may be wholly or partially different to the investor. As such,
even though many actions have a payback, it may not be to the investor.
The figure below shows the most economically advantageous projects, but as all goals are required,
it does not indicate optionality. Instead the value is in the figure is in understanding the project
financial measures and where the WMCA should focus their resources.
The total net present value of the investment required over a 20-year timeline (from 2021 to 2041
with a 3.5% discount rate) is minus £3.9bn. This indicates that there will be only a partial financial
return on investment. This does ignore that technological interventions are likely to fall in costs and
any saving from reducing the risk of climate change impacts. The Committee on Climate Change
have stated that this scale of investment is “appropriate to accept it given the potential
consequences and cost of inaction.”
The process is based on the gradual roll out of goals in line with the technical analysis, and so some
of the goals will only be implemented in 2040 and so give little opportunity to payback. As such,
goals which are implemented over a shorter / sooner timeline have an advantage. The savings from
these measures are often long lasting, beyond the 2041 horizon.
For similar reason the total net present value of the investment required over the first Five Year Plan
(from 2021 to 2026) is minus £3.3bn. Similarly, the sum of the total gross investment required
within the first Five Year Plan is 4.3bn.
Page 197

NET ZERO 2041 CONFIDENTIAL | WSP Project No.: 70076572 February 2021 West Midlands Combined Authority 104
Table 6 – Economic Modelling Assumptions
Goal Included within economic modelling Not included within economic modelling
Goal 1 – Domestic Energy Efficiency
Capex for individual measures and resultant fuel savings (assuming a gas boiler counterfactual)
Replacement of equipment at end of life, air quality impact, carbon cost
Goal 2 – Domestic Heating system Retrofit
Capex for heat pump installation and resultant fuel cost changes
O&M costs / savings, economies of scale, air quality impact, carbon cost
Goal 3 – Domestic Solar PV Capex of installed system and electricity savings assuming 100% self-consumption
O&M costs / savings, inverter replacement at end of life, economies of scale, air quality impact, carbon cost
Goal 4 – Commercial
Energy Efficiency
Capex for individual measures and resultant fuel
savings (gas, electricity and oil)
Replacement of equipment at end of life, air
quality impact, carbon cost etc.
Goal 5 – Commercial Heating system Retrofit
Capex for heat pump installation and resultant fuel cost changes
O&M costs / savings, economies of scale, air quality impact, carbon cost
Goal 6 – Commercial Solar
PV
Capex of installed system and electricity savings
assuming 100% self-consumption
O&M costs / savings, inverter replacement at
end of life, economies of scale, air quality impact, carbon cost
Goal 7 – Industrial Energy
Efficiency and Fuel Switching
Not modelled – insufficient data / confidence
Goal 8 – Industrial Solar PV Capex of installed system and electricity savings assuming 100% self-consumption
O&M costs / savings, parts replacement, economies of scale, air quality impact, carbon
cost
Goal 9 – Transport Demand Reduction
Installation of ultrafast broadband to homes currently not connected (181,000) and resultant
commuting fuel reduction
Air quality impact, carbon cost, additional vehicle costs savings (maintenance, insurance)
Goal 10 – Transport Mode Shift
Not modelled
Goal 11 – Bus and Taxi
Electrification
Additional CAPEX over internal combustion engine
equivalent, OPEX saving
Air quality impact, carbon cost,
Goal 12 – HGV Electrification
Not modelled
Goal 13 – Transport
Accelerated EV Uptake
Not modelled
Goal 14 – Land Use Renewables
Installed costs of equipment and income at £50 per MWh
Land purchase costs, O&M, equipment replacement, insurance
Goal 15 – Land Use Natural
Capital
Cost of woodland establishment and management Land purchase costs, air quality impact, carbon
cost
Page 198

NET ZERO 2041 CONFIDENTIAL | WSP Project No.: 70076572 February 2021 West Midlands Combined Authority 105
Figure 60 – MACC to 2041 (exc. Goals 10, 12 and 13)
(800.00)
(600.00)
(400.00)
(200.00)
-
200.00
400.00
0 10,000 20,000 30,000 40,000 50,000
Mar
gin
al A
bat
emen
t C
ost
(£
/tC
O2
)
GHG Emissions Saving to 2041 (ktCO2)
Marginal Abatement Cost Curve
1 Commercial Microgeneration 2 Industrial Microgeneration3 Domestic Solar (PV) 4 Transport - Demand Reduction / Digital Connectivity5 Commercial Energy Efficiency 6 Transport (Fuel Switching) Taxi7 Transport (Fuel Switching) Bus 8 Land Use - Renewables9 Domestic Energy Efficiency Retrofit 10 Domestic Heat Pumps Retrofit11 Commercial Heat Pumps 12 Land Use - Afforestation
Page 199

NET ZERO 2041 CONFIDENTIAL | WSP Project No.: 70076572 February 2021 West Midlands Combined Authority 106
Marginal Abatement Cost Curves
Projects which have the lowest cost per CO2e reduction appear to the left, with projects with the
least savings to the right; with the actual amount of savings (either lifetime or per annum) denoted
by the width of the project along the x-axis. Projects which appear below the horizontal axis (and
have a marginal abatement cost of less than £0) save money over their lifetime, while those above
the axis increase overall costs over the project life.
The results show that technologies which are well established, such as photovoltaics represent
quick wins (have the best payback / have the best NPVs) but overall are of limited value, denoted by
the width of the columns which represent GHG emissions savings. Part of this is due to the
decarbonisation of the electricity grid which means that generation has diminishing returns further
out in time.
Energy efficiency measures are more significant in terms of carbon saving, although payback
periods are not as attractive. Commercial measures are especially attractive but are harder to
influence in the short term due to uncertainty brought about by the COVID pandemic. Domestic
energy efficiency measures are shown as having a negative NPV by 2041, owing to the slower
payback rates and the deployment curve assumed. Improvements in building fabric have a
perpetual benefit not captured within the calculations.
The combination of domestic energy efficiency and heat pump represent the majority of GHG
emissions savings. As explained in the appending there is a large scope to reduce the cost of this
goal; a capex reduction of at least 30% may be possible for large scale roll outs combined with bulk
purchasing, training and changes to VAT. However, the biggest obstacle here is the lack of
immediate return from any investment. The operating costs would be broadly similar to that of a gas
boiler, until the expected reduction in electricity prices, later in this decade.
Costs associated with transport are only covered in a limited sense, with more detail found in the
upcoming LTP review. The electrification of taxis and buses both provide a return on investment and
therefore there are opportunities to provide private investment. The costs associated with digital
connectivity are relatively small however the majority of the effort would be around planning and
working with employers as well as ensuring the learnings of being forced to work from home are
captured and properly addressed.
The MACC does not capture the actions which will be undertaken as part of business as usual,
which will also require significant support and investment. For example, the ban on new homes with
gas boilers will come into force in 2025, whilst there will be a ban on new internal combustion engine
cars from 2030. Both of these would need support in order to ensure a just transition.
Page 200

NET ZERO 2041 CONFIDENTIAL | WSP Project No.: 70076572 February 2021 West Midlands Combined Authority 107
Table 7 – Marginal Abatement Costs of Goals to 2041
Name Marginal Abatement Cost (£ per tCO2)
NPV
Domestic Energy Efficiency Retrofit £189 -£981m
Domestic Heat Pumps Retrofit £254 -£7,690m
Domestic Solar (PV) -£698 £869m
Commercial Energy Efficiency -£400 £1,291m
Commercial Heat Pumps £320 -£501m
Commercial Microgeneration -£788 £961m
Industrial Microgeneration -£782 £154m
Transport - Demand Reduction -£626 £1,599m
Transport (Fuel Switching) Taxi -£165 £295m
Transport (Fuel Switching) Bus -£58 £247m
Land Use - Natural Capital £394 -£169m
Land Use - Renewables £4 £2m
Table 8 – Investment Costs
Name Investment Costs to 2026
Investment Costs to 2041
Potential Funding Source
Domestic Energy Efficiency Retrofit
£0.62 billion £2.5 billion - Green loans where homeowners are able to pay - Public funding for local authority owned stock - Property owners for rented accommodation
Domestic Heat Pumps Retrofit
£2.28 billion £9.6 billion - Grant funding or incentives - Social landlords’ investment - Private homeowners voluntarily and later mandatorily
Domestic Solar (PV)
£332 million £664 million - Property owners - Green loans - Private sector investment
Commercial Energy Efficiency
£365 million £731 million - Property owners voluntarily and later mandatorily - Green loans - Private sector investment
Commercial Heat Pumps
£76 million £321 million - Property owners voluntarily and later mandatorily - Public Sector funding or incentives
Commercial Microgeneration
£270 million £540 million - Property owners - Green loans - Private sector investment
Industrial Microgeneration
£72 million £72 million - Property owners - Green loans - Private sector investment
Page 201

NET ZERO 2041 CONFIDENTIAL | WSP Project No.: 70076572 February 2021 West Midlands Combined Authority 108
Transport - Demand Reduction
£23 million £91 million - Mainly infrastructure providers - Potential gap funding for hard to reach areas - Seed funding for private organisations for community / delivery hubs
Transport (Fuel Switching) Taxi / Bus
£178 million £356 million - Private finance - Green loans
Land Use - Natural Capital
£57 million £229 million - Public Sector – Environmental Land Management Scheme - Private sector – Carbon offsetting - New Development – Biodiversity Net Gain
Land Use - Renewables
£71 million £283 million - Private finance - Public sector investment
The gross investment cost, excluding issues around system management, industry and transport is
estimated to be £4.3bn by 2026 and £15.3bn over the 20-year period. The sources of funding for
this will vary, with much of it coming from individuals, some from business, some from local and
regional public investment and in some from national government regulation or incentives. What is
clear is that there will need to be a step change in investment, with more detail provided in the
Delivery section.
Chapter Summary
❖ High-level economic modelling was
undertaken for each of the goals.
❖ The gross investment cost, excluding
issues around system management,
industry and transport is estimated to be
£4.3bn within the first Five Year Plan.
❖ Whilst some goals have a positive NPV,
others do not. In addition, there is often a
gap between the funder and beneficiary.
❖ The gross investment cost, excluding
issues around system management,
industry and transport is estimated to be
£15.3bn over the 20-year period.
Page 202

NET ZERO 2041 CONFIDENTIAL | WSP Project No.: 70076572 February 2021 West Midlands Combined Authority 109
6 JOBS AND SKILLS
6.1 INTRODUCTION
To meet the 2041 target, and progress towards the more immediate interim targets, there will be
jobs lost and created and new skills required. There are unique economic characteristics that mean
certain industry-sectors are key to a successful and just transition in the region. Therefore, it was
important as part of this first Five Year Plan (FYP) to understand the scale and range of new jobs
that are likely to emerge in the WMCA, the skills needs associated with these jobs and the current
and potential capacity of the education, training and skills development infrastructures to address
these needs. The analysis begins with a critical review of existing research to understand the forms
of economic activity that are emerging with regard to net zero.
6.2 REVIEW
The goals and overall transition to a low carbon economy will create jobs in green sectors, and jobs
will be lost or change in their ‘brown’ counterparts currently with high environmental or carbon
footprints. This will have knock-on effects on employment in associated supply chains. Changes in
existing occupations are expected to happen at the low and medium-skill levels. New and emerging
occupations more often require higher-level qualifications. A review of the latest research and local
policy relating to low carbon and green jobs and skills was undertaken to develop the FYP.
6.2.1 SKILLS TRANSITION
Meeting net zero targets will have a significant impact on the labour market, and it is vital that those
affected are provided with the right education, training and re-skilling opportunities to meet future job
needs.
To prepare well for the long term, education and training policies need to be aligned to meet the
future new skill demands. STEM skills, as well as managerial, and leadership skills will be important
for the transition. Many of these are specific new skills such as knowledge of sustainable materials
and electrification technologies, carbon footprinting skills or environmental impact assessment.
Training policy evolution is important to ensure a smooth transition of workers across sectors in the
short term. These programmes will be particularly important to facilitate the transition of low-skilled
workers from jobs in declining sectors to jobs with similar skills in emerging sectors17. The transition
to green growth will need to be managed alongside megatrends such as population ageing,
globalisation, an overall shift towards a service- and knowledge-based economy, and increased
digitisation and automation of production processes.
The West Midlands is well-known for having a large and dynamic workforce engaged in the high-
precision manufacturing and production of vehicles. Around half of automotive companies produce
vehicle components in the West Midlands18. Across the WMCA, current estimates suggest an
opportunity for 72,000 new direct jobs to be created in low-carbon sectors in gross terms19. Most of
17 Employment Implications of Green Growth: Linking jobs, growth, and green policies, OECD report for G7 Environmental ministers, June 2017 18 Automotive Council Mapping UK Automotive. Accessed on 8th December 2020. Available from: https://www.automotivecouncil.co.uk/mapping-ukautomotive/ 19 Local green jobs – accelerating a sustainable economic recovery, Ecuity, 2020
Page 203

NET ZERO 2041 CONFIDENTIAL | WSP Project No.: 70076572 February 2021 West Midlands Combined Authority 110
these jobs would be focused on manufacturing low emission vehicles, battery packs and modules in
the proposed giga-factories, situated near existing production sites. Additionally, jobs will be created
installing low carbon heating technologies, energy efficiency products and solar panel installations.
The skill requirements for these new jobs include:
▪ Solar - Solar technician skill requirements will be demand led. Level 3 Electrical Installations
qualification are required to install grid connected solar.
▪ Hydrogen fuel cells - The primary skill demand is expected to be for highly skilled workers
including engineers and scientists that can support innovation and research activities.
▪ Electric vehicles - Job preservation of existing automotive services and growth in need for skills
ranging from infrastructure installation, servicing and other high skilled jobs. This sub-sector could
feasibly capitalise on existing expertise from automotive manufacturing workers in localities
where current automotive operations are downsizing.
▪ Energy Efficient products - Employment in key supply chain operations including in R&D,
manufacturing and services is largely satisfied by the regional workforce in the operations’ key
localities. These increasingly require highly skilled software engineering expertise.
▪ Green stimulus - Involves ‘retrofit’ of millions of homes over the next two decades, consisting of
multiple, integrated building fabric measures, new heating systems such as heat pumps and
controls, and the widespread adoption of rooftop solar.
▪ Professional services/ financial services and consultancy - Skill and training requirements
are broadly influenced by wider sustainability agenda and infrastructure projects. There is also a
need for people with engineering and customer service skills for the retrofit market, including
being able to work with vulnerable customers.
▪ Natural Capital - Urban tree management and jobs in forestry/woodland management and
environmental management.
There is a need to promote training and qualifications in these areas throughout the WMCA area
and the UK, otherwise there will be an under-capacity of people especially in the short to medium
term. For example, a recent Government research project20 into the heat pump manufacturing
supply chain indicated that generally heat pump manufacturers are not concerned with training the
UK workforce as other industries (boiler, HVAC, and chiller manufacturers) have transferable skills,
but there is a potential shortfall in F-gas certified installation engineers that could have an impact on
the type of heat pump deployed and the rate of deployment. There are currently around 50,000
qualified engineers in the UK and according to a one heat pump manufacturer a rapid growth in heat
pump installations could cause a potential shortfall in F-gas certified installation engineers in the UK.
A transition to net zero will also reduce demand for certain high-carbon services and technologies,
such as fossil fuel extraction, processing and distribution, aviation, fossil fuel machinery and
vehicles, and livestock and dairy. This could see jobs in some key sectors significantly affected,
although there will also be new employment opportunities in each area.
The Government's recently established Green Jobs Taskforce will be at the heart of the transition to
Net Zero. The taskforce forms part of the Government’s 10 Point Plan to drive a green industrial
revolution and it will set the direction for the job market as om the desired transition to a high-skill,
20 Heat Pump Manufacturing Supply Chain Research Project Report, Research carried out by Eunomia Research & Consulting Ltd on behalf of the Department for Business, Energy and Industrial Strategy, 2020. https://www.gov.uk/government/publications/heat-pump-manufacturing-supply-chain-research-project
Page 204

NET ZERO 2041 CONFIDENTIAL | WSP Project No.: 70076572 February 2021 West Midlands Combined Authority 111
low carbon economy. Its key aim is to focus on the immediate and longer-term challenges of
delivering skilled workers for the UK’s transition to net zero. The taskforce has already highlighted
some of the key roles required to deliver net zero. These include Gigafactory production operators,
heat pump installers and arboriculturalists which have already been identified in this review.
Table 9 presents qualitative assessment of the expected impacts in four broad industry sectors that
have been identified in this literature review. These sectors are considered which are vital to the
WMCA economy and the net zero transition.
Table 9 - Broad sector jobs and skills qualitative impact
Sector Jobs and skills impacts
Transport
▪ Transition to electric or hydrogen vehicles will create jobs in automotive manufacturing and the transition in the WM will have to be handled smoothly, given the significant size of the industry in the sub-region.
▪ Many of the existing jobs will have skills or aptitudes that are transferrable. ▪ Driving and process line jobs are likely to reduce and will need new skills. ▪ Development, deployment and maintenance of EV charging infrastructure and the
electrical and engineering ▪ R&D related to electrification and hydrogen technologies will also potentially create new
jobs across the WM HE and FE sectors in collaboration with national and international research agencies
▪ An overall modal shift towards public transport and low carbon non-car transport services and vehicles, is also important, generating a need not only for technical engineering and transport planning skills, but also services around transport management and coordination, forecasting and finance/PPP/revenue management
Built Environment
▪ Commercial and housing retrofit will provide a huge stimulus for new employment creation and skills upgrade
▪ The skills requirement for professional trades, particularly electrical and shifting to factory construction will be significant
▪ The national push for investment in major infrastructure will make considerable demands on the civil engineering sector
▪ Need for people with engineering and customer service skills for the retrofit market which includes being able to work with vulnerable customers
Energy
▪ New jobs arising will cover the likes of energy efficiency retrofit, heat pump installation and retrofit, renewable energy design and installation, hydrogen specialists, energy systems balancing specialists and materials specialists
▪ Technical skills needed for Carbon Capture and Storage may be similar to existing industry skills in sectors such as power generation, chemicals or oil and gas
Heavy industry
▪ Decarbonisation of the UK’s important traditional heavy industrial base will be underpinned by decarbonising the power sector and introduction of new technologies
▪ New types of manufactured product, such as those taking plastic electronics and silicon electronics approaches
▪ Redesign of existing products with a focus on resource efficiency and a cradle to cradle approach, in which materials are continually recycled, will require more engineers to create these systems
▪ Minor reskilling for different treatment and processing of waste to energy ▪ A low-CO2 industrial transition can offer similar employment levels to today as circular
economy solutions in manufacturing are typically more labour-intensive, so implementing them would create additional jobs in the overall value chains
▪ Awareness and understanding of sustainable development issues and specialists such as energy managers for larger businesses.
▪ IT specialists to design and operate systems applicable to logistics, smart operating systems, and environmental control
Page 205

NET ZERO 2041 CONFIDENTIAL | WSP Project No.: 70076572 February 2021 West Midlands Combined Authority 112
Further details from the net zero skills literature review are included in the Appendix G-1.
6.2.2 JOBS AND SKILLS POLICY IN WEST MIDLANDS COMBINED AUTHORITY
The West Midlands Regional Skills Plan (RSP) builds on the key targets in the West Midlands
Combined Authority Strategic Economic Plan (June 2016) and West Midlands Local Industrial
Strategy (September 2018) that by 2030 the region’s productivity, salaries, skills attainment and
labour market participation match or exceed the national average. The strategy outlines the plan to
achieve this through inclusive growth, ensuring that everyone can gain the skills and support they
need to access new opportunities and benefit from a stronger regional economy.
The West Midlands Combined Authority’s Productivity and Skills Commission (which was set up with
the aim to tackle the issues surrounding unemployment, job skills and increasing the region's
productivity) and ensured the skills needs of businesses are met, with a particular focus on the
needs of businesses in transformational sectors such as low carbon technologies and advanced
manufacturing. Opportunities identified in the West Midlands Local Industrial Strategy21, WMCA
Strategic Economic Plan SEP22 and RSP23 include:
▪ Targeting people out of work and whose skills do not match labour market demand
▪ Engaging with businesses to develop employer-led sector skills strategies to support greater
innovation in seven transformational and three enabling sectors including low carbon
▪ Use of the devolved 19+ adult education budget
▪ Developing further initiatives such as the Black Country Skills Factory
▪ Identification of Skills Investment Zones for targeted activity to raise skills and work with
unemployed people and those whose skills don’t match demand
The importance of improving skills to match future labour market demand is demonstrated
throughout the WMCA’s, Local Enterprise Partnerships’ (LEPs’) and Local Authorities’ skills and
economic strategies. The low carbon energy technology clusters are considered a strength in the
region and will be at the heart of skills development in the next 20 years. Advanced manufacturing,
building technologies, digital and business and professional services are considered to be
transformative sectors where there is a desire to increase the number of skilled people and the level
of their skills.
The Sustainability West Midlands Local Carbon Evidence Base report24 highlights the need for
opportunities for young people to develop the skills they need so that the low carbon sector can
expand in the future. This is particularly relevant in the construction sector which, although strong in
the West Midlands, lacks the skills to adequately innovate. Investment should be made in institutions
to ensure these skills can be cultivated.
The actions outlined in the RSP will be an important aspect of the transition that will occur in the
next two decades as result of net zero however ensuring coordination with local colleges,
21 West Midlands Local Industrial Strategy https://www.wmca.org.uk/media/3094/west-midlands-local-industrial-strategy-single-page.pdf 22 West Midlands Combined Authority Strategic Economic Plan https://www.wmca.org.uk/media/1382/full-sep-document.pdf 23 West Midlands Combined Authority Regional Skills Plan https://www.wmca.org.uk/media/2274/regional-skills-plan.pdf 24 West Midlands Local Industrial Strategy, Low Carbon Evidence Base, Sustainability West Midlands, 2018
Page 206
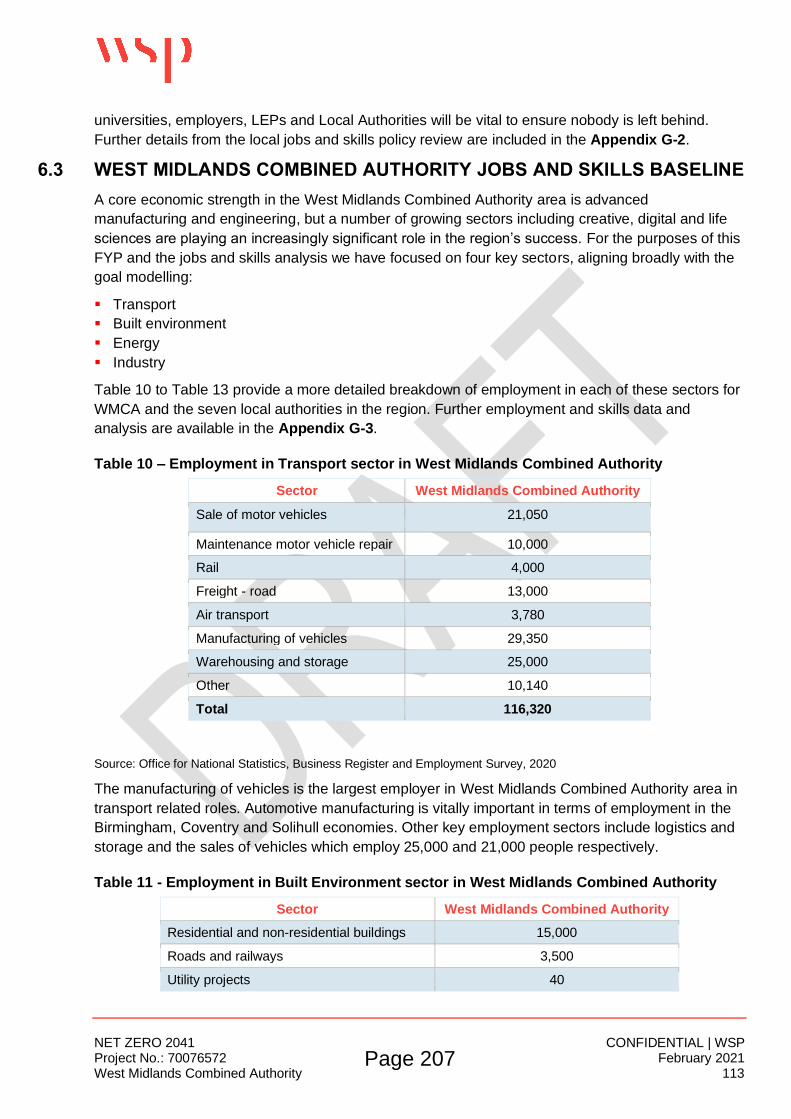
NET ZERO 2041 CONFIDENTIAL | WSP Project No.: 70076572 February 2021 West Midlands Combined Authority 113
universities, employers, LEPs and Local Authorities will be vital to ensure nobody is left behind.
Further details from the local jobs and skills policy review are included in the Appendix G-2.
6.3 WEST MIDLANDS COMBINED AUTHORITY JOBS AND SKILLS BASELINE
A core economic strength in the West Midlands Combined Authority area is advanced
manufacturing and engineering, but a number of growing sectors including creative, digital and life
sciences are playing an increasingly significant role in the region’s success. For the purposes of this
FYP and the jobs and skills analysis we have focused on four key sectors, aligning broadly with the
goal modelling:
▪ Transport
▪ Built environment
▪ Energy
▪ Industry
Table 10 to Table 13 provide a more detailed breakdown of employment in each of these sectors for
WMCA and the seven local authorities in the region. Further employment and skills data and
analysis are available in the Appendix G-3.
Table 10 – Employment in Transport sector in West Midlands Combined Authority
Sector West Midlands Combined Authority
Sale of motor vehicles 21,050
Maintenance motor vehicle repair 10,000
Rail 4,000
Freight - road 13,000
Air transport 3,780
Manufacturing of vehicles 29,350
Warehousing and storage 25,000
Other 10,140
Total 116,320
Source: Office for National Statistics, Business Register and Employment Survey, 2020
The manufacturing of vehicles is the largest employer in West Midlands Combined Authority area in
transport related roles. Automotive manufacturing is vitally important in terms of employment in the
Birmingham, Coventry and Solihull economies. Other key employment sectors include logistics and
storage and the sales of vehicles which employ 25,000 and 21,000 people respectively.
Table 11 - Employment in Built Environment sector in West Midlands Combined Authority
Sector West Midlands Combined Authority
Residential and non-residential buildings 15,000
Roads and railways 3,500
Utility projects 40
Page 207

NET ZERO 2041 CONFIDENTIAL | WSP Project No.: 70076572 February 2021 West Midlands Combined Authority 114
Sector West Midlands Combined Authority
Other civil engineering projects 2,250
Demolition and site preparation 800
Electrical, plumbing and other installation activities
16,000
Building completion 12,000
Real estate activities 24,400
Total 73,990
Source: Office for National Statistics, Business Register and Employment Survey, 2020
Over 24,000 people are employed in real estate related activities in West Midlands Combined
Authority area in the built environment and construction related roles. The next largest area is
electrical, plumbing and other construction related roles which employs 16,000 people. Other key
employment areas in this sector include construction of buildings and other building finishing
activities.
Table 12 - Employment in Energy sector in West Midlands Combined Authority
Sector West Midlands Combined Authority
Mining and quarrying 295
Electric power generation, trans. and dist. 4,000
Manufacture of gas; distribution of gas 1,500
Steam and air conditioning supply -
Water collection, treatment and supply 3,500
Sewerage and waste collection 7,300
Total 16,595
Source: Office for National Statistics, Business Register and Employment Survey, 2020
Approximately 5,500 people are employed in the generation and distribution of electricity and gas in
the West Midlands Combined Authority area. During the transition it is expected that these will
become key employers in future. Waste and sewage collection roles are important in this sector now
and will become increasingly important as we change the way we handle waste.
Table 13 - Employment in Industry sector in West Midlands Combined Authority
Sector West Midlands Combined Authority
Food and beverage 56,510
Textiles 28,175
Wood 5,800
Refined petroleum products 200
Basic chemicals 1,850
Page 208

NET ZERO 2041 CONFIDENTIAL | WSP Project No.: 70076572 February 2021 West Midlands Combined Authority 115
Plastics products 7,000
Building materials 1,310
Metal 38,800
Electronic products 2,440
Machinery 13,850
Furniture 7,000
Other manufacturing 7,140
Total 170,075
Source: Office for National Statistics, Business Register and Employment Survey, 2020
The top three manufacturing sectors in the West Midlands Combined Authority area in terms of
employment are food and beverage, metal and textiles which collectively employs over 123,000
people in the region. Industry accounts for 21% of emissions, with manufacturing representing 11%
of this total. As government, investors and consumers push manufacturers to place more
importance on what they can do to achieve the net zero targets there will be a need to ensure that
jobs in industries are protected or adapted.
Some of the sectors above will be part of the Low Carbon Environmental Goods & Services
(LCEGS) sector. Currently estimates of employment in this sector are only available at a national
level through ONS. Sustainability West Midlands have recently been commissioned by the Midlands
Energy Hub to complete understand the current state of the LCEGS sector in the Midlands and
where support is needed to help grow the sector. The outputs which will include information at local
authority and LEP level, along with a Midlands wide report should be considered alongside this FYP.
This section shows the importance of these broad sectors in terms of local employment and the
local economy with over 350,000 people employed in these sectors25. Net zero provides new
opportunities for businesses in these sectors to thrive but will require new skills in their workforces.
Currently there is a mismatch between demand and skills needs in the green economy. Businesses
don’t know they have a skill need and are unaware of the opportunities arising from increased
workforce capability26. The Government’s appointed climate action champion, Nigel Topping, has
said both the private sector and local governments will need to come up with pathways to achieve to
net zero by 205027. These pathways must also be created through local skills policy and training in
the West Midlands to support businesses in these sectors throughout the transition to net zero to
ensure that the goals outlined in this FYP can be achieved.
6.4 GOALS – JOB IMPACTS
6.4.1 JOBS CREATED
Analysis has been undertaken regarding the expected job impacts of the goals outlined in section 4.
25 This figure does not include jobs losses as a result of the coronavirus pandemic. 26 ProEnviro, Skills for a low carbon and resource efficient economy: A review of evidence (2007). A report commissioned by Defra. 27 https://www.climatechangenews.com/2020/02/26/uks-nigel-topping-seeks-broad-movement-drive-global-economy-net-zero-2050/
Page 209

NET ZERO 2041 CONFIDENTIAL | WSP Project No.: 70076572 February 2021 West Midlands Combined Authority 116
A qualitative assessment of the impacts around net zero has been outlined in Table 14.
Table 14 - Goals and high-level jobs impacts
Sector Goals Jobs created Jobs lost/changed Net Effect
Domestic Energy Efficiency Retrofit coordinators, installers and designers
Increase
Fuel Switching Heat pump installers Gas boiler maintenance repairs
Increase
Microgeneration Solar PV installers Increase
Commercial Energy Efficiency Retrofit coordinators, installers and designers
Increase
Fuel Switching Heat pump installers Gas boiler maintenance repairs and gas transmission
Increase
Microgeneration Solar PV installers Increase
Industry Energy Efficiency and Fuel Switching
Retrofit coordinators, installers and designers Heat pump installers
Increase
Microgeneration Solar PV installers Increase
Transport Demand Reduction (WFH)
Opportunity to encourage digital skills IT and service sector jobs in more rural areas in local workspace hubs
Reduced demand for City Centre services such as food and beverage stores Vehicle manufacturers
Nil
Fuel Switching (HGVs)
Hydrogen / Electric vehicle manufacturers
Petrol and diesel engine manufacturers
Increase
Fuel Switching (Buses, Taxis)
Petrol and diesel engine manufacturers
Petrol and diesel engine manufacturers
Increase
Demand Reduction (Trips)
Increase in LGV services and drivers
Vehicle manufacturers
Minimal Increase
Mode Shift Increased public transport operators and other non-car services/products
Vehicle manufacturers Increase
EV Uptake EV vehicle manufacturing Petrol and diesel vehicle manufacturing
Increase
Land Use Renewables Solar and wind infrastructure installers and maintenance
Increase
Natural Capital Tree planters, ecologists Increase
WSP undertook an analysis to forecast the future number of jobs created by the kind of changes
indicated by the modelling for 2026 and 2041 based on the Accelerated scenario. The method
Page 210

NET ZERO 2041 CONFIDENTIAL | WSP Project No.: 70076572 February 2021 West Midlands Combined Authority 117
adopted is based on research and additionality guidance set out in HCA’s Additionality Guide28 and
considers direct and indirect jobs created in the supply chain and local economy. Research has
been paired with the inputs and outputs from the carbon modelling for most of the goals to estimate
expected jobs created for FYP period and until 2041. Where goals are not expected to have
noticeable impact on jobs these have not been modelled.
The Working from Home Transport Demand goal has not been modelled in the jobs analysis as the
net effect is uncertain and may even be nil. Increased home working could create employment
opportunities to in the IT sector to ensure network can handle the increase demand at local joint
working hubs and from home. The reduced demand for travel into towns and cities would have an
impact on employment in the food and beverage industry as well as public transport.
While supporting evidence is limited, this aimed to identify and quantify the number of workers
required to either manufacture, install and operate and maintain for each goal and in associated
supply chains. This included new low carbon technologies, natural capital and transport mode shift
to more active and public transport modes. Combining the research and analysis in the carbon
modelling with employments enabled an estimation of the number of new jobs required for each goal
by 2026 and 2041. A more detailed explanation of the methodology and assumptions is presented
in the Appendix G-4.
Table 15 - Goals and high-level net jobs impacts
Sector Intervention Jobs created by 2026 Jobs created by 2041
Domestic Energy Efficiency 5,500 18,800
Fuel Switching (Heat pumps) 6,900 23,500
Microgeneration 1,800 7,900
Commercial Energy Efficiency 500 2,200
Fuel Switching (Heat pumps) 500 2,200
Microgeneration 100 600
Industry Energy Efficiency Minimal change 200
Microgeneration Minimal change 100
Transport Fuel Switching (HGVs) Minimal change 400
Fuel Switching (Buses, Taxis) 500 800
Demand Reduction (Trips) Minimal change 120
Mode shift 1,500 1,500
28 Homes and Communities Agency, Additionality Guide, Fourth Edition 2014 https://assets.publishing.service.gov.uk/government/uploads/system/uploads/attachment_data/file/378177/additionality_guide_2014_full.pdf (note that several aspects of this additionality guidance are also contained in DCLG’s Appraisal Guide of December 2016)
Page 211

NET ZERO 2041 CONFIDENTIAL | WSP Project No.: 70076572 February 2021 West Midlands Combined Authority 118
Electric Vehicles 3,400 32,800
Land Use Renewables Minimal change 600
Natural Capital 200 700
Approximate total jobs (net)
21,000 92,420
In total the proposed goals could create around 21,000 jobs in the WMCA economy by 2026 and
just over 90,000 jobs by 2041. These results are broadly similar to jobs impacts analysis undertaken
by Ecuity (on behalf of the Local Government Association) which estimated that over 72,000 direct
jobs could be created in low carbon technology sectors in the West Midlands29. If the WMCA does
not develop a pool of workers, however, with the skills needed for the goals such as retrofit these
jobs will not be created to this scale or timeframe.
The education and training institutions currently provide a strong starting point in terms of
development especially in high skilled jobs. There is, however, need for local colleges and other
training providers to provide specific training programmes for these goals. Training in heat pump
fitting, solar PV and retrofit is available nationally through training providers such as NICEIC30 and
Retrofit Academy31. These same courses are currently not available through local colleges and local
training providers in the West Midlands at the scale required to achieve the goals. Section 6.5
discusses this in more detail.
6.4.2 PROTECTING JOBS
The size of the overall job turnover created by Net Zero is likely to be relatively small compared to
overall labour market movements. OECD analysis32 suggests that it is unlikely the transition towards
greener growth will result in large job skill demand changes outside those experienced during mass
motorisation and the digital revolution.
The WMCA labour market must have sufficient flexibility of labour across sectors to smooth
employment effects. This means that labour markets need to allow workers to change jobs, location
and shift across sectors without long periods of unemployment. This is crucial to reducing the overall
costs of the transition to Net Zero. The net job gains from Net Zero will depend on how the UK
economy is affected by the policy. If overall economic activity is reduced, this puts a negative
pressure on employment in all sectors.
The Grantham Institute have estimated the overall proportion of employees in each sector in the UK
that will be affected by the greening of employment based on current understanding of how sectors
29 Local green jobs – accelerating a sustainable economic recovery, Ecuity, 2020 https://www.ecuity.com/wp-content/uploads/2020/06/Local-green-jobs-accelerating-a-sustainable-economic-recovery_final.pdf 30 https://www.niceic.com/contractor/training-courses/renewables-courses
31 https://www.retrofitacademy.org/
32 Employment Implications of Green Growth: Linking jobs, growth, and green policies, OECD report for the G7 Environment Ministers,2017 https://www.oecd.org/environment/Employment-Implications-of-Green-Growth-OECD-Report-G7-Environment-Ministers.pdf
Page 212

NET ZERO 2041 CONFIDENTIAL | WSP Project No.: 70076572 February 2021 West Midlands Combined Authority 119
will change33. Around a fifth of current jobs (21%) in the UK have skills for which demand could grow
in the green economy or could require reskilling – affecting more than 6 million people.
Approximately 10% of workers have skills that could be in more demand, while 10% are more likely
to need reskilling. Crucially this does not mean these jobs will be lost but does point to the need for
a comprehensive UK policy and labour market responses to manage the transition. The West
Midlands Combined Authority through it’s Skills Advisory Board will set the commissioning direction
for the adult education budget. This is discussed further in section 6.5.1.
The sectoral impacts are highly varied and show that manufacturing, construction and transport
have a high proportion of jobs affected by the transition relative to retail, information, finance and
healthcare, as would be expected. Alongside the East Midlands and Yorkshire and the Humber, the
West Midlands region is considered to have the highest proportions of jobs that could be exposed to
the transition. If the same exposure rates that have been calculated by the Grantham Institute34 in
the for the West Midlands region are applied to the WMCA this suggests that:
▪ c.140,000 jobs need to reskill as result of transition (11.1%)
▪ c.143,500 jobs are aligned to net zero transition (11.5%)
▪ c.283,500 total jobs impacted by transition (22.5%)
The employment sector breakdown presented in section 5.3 showed the sectors where employment
in the West Midlands Combined Authority area is concentrated. Over the next 5 years it is important
that jobs and skills policy is also focused on those sectors that identified as likely to be affected
most, both positively and negatively by the transition to net zero. These include:
Table 16 – Industries and jobs impacted
Sector Approx. No. of Jobs Affected in the West Midlands area
Food and beverage processing and manufacturing 57,000
Textiles 28,000
Metal 39,000
Maintenance and repair of motor vehicles 10,000
Rail 4,000
Manufacturing of vehicles 29,000
Warehousing and storage 25,000
Construction and building finishing 27,000
Electrical, plumbing and other construction installation 26,000
33 Investing in a just transition in the UK, Grantham Research Institute on Climate Change and the Environment, 2019 https://www.lse.ac.uk/granthaminstitute/wp-content/uploads/2019/02/Investing-in-a-just-transition-in-the-UK_Full-policy-report_40pp-2.pdf
Page 213

NET ZERO 2041 CONFIDENTIAL | WSP Project No.: 70076572 February 2021 West Midlands Combined Authority 120
Electric power generation, transmission and distribution 4,000
Water collection, treatment and supply 4,000
Sewerage and waste collection 7,000
Approximate Total 260,000
Particular skills gaps have been identified by the Climate Change Committee such as heat pump
and energy efficiency installation, further gaps should be identified and action to address these
prioritised35. Further Education (FE) providers will be crucial in ensuring young people are captured
and trained to meet the needs of the evolving labour market. More than ever it will be important for
FE providers to clearly show students ‘routes for progression’, that is, how their training and learning
can have a meaningful impact on their employment options and progression prospects.
The other priorities are rapidly to scale up supply chains for heat pumps and to develop the option of
hydrogen for heat. Proper enforcement of standards, including avoiding overheating risks, and an
effective approach to skills are essential.
Whilst there is some interaction between the supply side (FE/HE/Training providers) and demand
side (private-sector businesses) there is a need for greater coordination to develop and map career
pathways in the net zero economy. It is likely that workers will have transferrable skills who have
undertaken apprenticeship or other non-degree qualifications. WMCA, Colleges West Midlands
should continue to develop collaborative working with businesses to develop the courses and skills
that businesses require.
6.5 SUPPLY-SIDE
The West Midlands will draw on the expertise of its colleges, universities, Catapult centres and
research strengths, to deliver net zero. These stakeholders are central to improving the skills base in
the region and there will need to be a strong focus on developing skills alongside improving
infrastructure during the transition period. A review of the current and future situation with regards to
jobs and skills development in the West Midlands Combined Authority area was undertaken. A
summary of this review is presented here. Further analysis is available in the Appendix G-5.
6.5.1 WMCA KEY LEVERS AND STAKEHOLDERS
Through devolution, the West Midlands Combined Authority holds a circa £130m annual Adult
Education Budget36 through which it funds basic adult (19+) skills provision and higher-level skills
provision aligned to priorities set out in the West Midlands Combined Authority Regional Skills Plan
(RSP). This will rise to £140m in next financial year.
As set out in the RSP, the West Midlands Combined Authority also aims to accelerate the uptake of
good quality apprenticeships in the region through its West Midlands Apprenticeships Levy Fund.
The aim is to maximise apprenticeship levy investment for the West Midlands through a regional
campaign targeting employers, young people, employees and stakeholders to consider
apprenticeships. The WMCA is also unlocking £40m in Apprenticeship Levy funding to support
35 The Sixth Carbon Budget, The UK’s path to Net Zero, Climate Change Committee (2020) 36 https://www.wmca.org.uk/what-we-do/productivity-skills/adult-education-budget/
Page 214

NET ZERO 2041 CONFIDENTIAL | WSP Project No.: 70076572 February 2021 West Midlands Combined Authority 121
apprenticeships for Small and Medium Enterprises (SMEs), targeting science, technology,
engineering and mathematics (STEM) skills in priority sectors and supply chains.
To oversee the RSP, the WMCA brings together major stakeholders from across the public and
private sectors as the Skills Advisory Board. This Board also acts as the region’s Skills Advisory
Panel (SAP). SAPS are local partnerships that work to identify and address local skills priorities.
They aim to strengthen the link between employers and skills providers – including colleges,
independent training providers and universities.
Reporting to the Board, the WMCA hosts a number of employer-led taskforces in RSP priority
sectors, to develop and steer the delivery of additional skills provision for upskilling and reskilling
adults. The WMCA has gained over £10m in National Retraining Fund and National Skills Fund
grants to this end.
More recently, in response to the impact of COVID-19, the WMCA has established a Jobs and Skills
Delivery Board. Bringing together local partners from a range of sectors, this Board will plan the
region’s recovery actions with regards to jobs and skills, including developing skills provision for
emerging green jobs. In 2020 the Government announced £375 million for the National Skills Fund
in England. This includes funding for a new level 3 adult offer and to expand skills bootcamps. The
skills bootcamps idea is based on the pilot ‘Beats the Bots’ digital bootcamps37 run by the WMCA in
2019. The WMCA has received an additional £9m to support the roll out of the Governments
National Lifetime Entitlement (as part of the National Skills Fund). This is to increase the delivery of
economically valuable level 3 qualifications to adults aged over 24. This provides an opportunity to
fund a boost in training that will support the skills needed for green jobs although many of the
current qualifications do not include the new skills needed yet.
These programmes will tackle high unemployment in specific areas by supporting those out of work
and on low incomes in targeted communities. Net zero and advanced manufacturing will be hugely
important aspect of this. There will be c. £130m of investment in future training and skills provision
through the devolved Adult Education Budget and there will be further funding opportunities through
the National Skills Fund.
Through the stakeholder engagement and literature review, WSP has identified there is a lack of
coordination between the supply-side and demand-side in regard to net zero. Ensuring that training
provision is tailored to jobs demand from local employers is vital for an inclusive net zero economy
and to achieve the outcomes outlined in 15 goals in this FYP. The Skills Advisory Board need to
create stronger connections between local education providers and the private sector to match skills
provision with future employment opportunities.
6.5.2 COLLEGES
Further education is vital in supporting skills development across the region and providing an
infrastructure which offers technical and vocational education from levels 1 to 5. Colleges West
Midlands is a formal strategic partnership of 20 colleges, including all colleges within the WMCA.
They drive collaboration across sectors and specialisms to create a network of clusters driving
innovation and skills and Higher education providers that are driving multidisciplinary skills
development to modernise industrial practice.
37 https://www.wmca.org.uk/news/contracts-awarded-for-5m-beat-the-bots-fund/
Page 215

NET ZERO 2041 CONFIDENTIAL | WSP Project No.: 70076572 February 2021 West Midlands Combined Authority 122
This needs to be replicated for the net zero economy. Current courses, apprenticeships and
qualifications at colleges in the WMCA cover a number of key areas related to net zero:
▪ Construction (Levels 1 – 3, brick laying, carpentry)
▪ Plumbing and gas (Level 2 and 3 Diploma in Plumbing and Domestic heating)
▪ Electrical (Level 2 and 3 Diploma in Electrical Installation)
▪ Manufacture engineering
▪ Mechanical engineering
▪ Vehicles maintenance and repair
These courses will need to be adapted for emerging roles in the net zero economy. For example,
vehicle maintenance and repair courses will need to focus on electric vehicles (EVs). Currently
Solihull College and South & City College Birmingham offer specific course for EV maintenance.
Expanding the roll-out of electric vehicle maintenance and repair qualifications to other colleges to
ensure accelerated EV uptake (Goal 13) can be delivered.
A recent training competition was run by the Department for Business, Energy & Industrial Strategy
where grant funding was awarded to a range of suppliers appointed to deliver accredited training at
scale to the low carbon installation sector in support of the delivery of the Green Home Voucher
Scheme. As a result of this Dudley College will now provide training support to those who will be
retrofitting housing stock across the Midlands through short and intensive courses including:
▪ NICEIC Heat Pumps and Solar Thermal (NOS aligned)
▪ NICEIC Solar Thermal (NOS aligned)
▪ City and Guilds F-Gas
▪ NICEIC Basic Energy Efficiency for Smart Meter Operative
▪ NICEIC Package for Heating and Water Controls
▪ City and Guilds 239 Inspection and Test.
The Retrofit Academy will also deliver the Open College Network West Midlands Level 5 Diploma in
Retrofit Coordination and Risk Management with the region. Other colleges will also need to expand
the roll-out of heat pump installation and maintenance training programmes to ensure that the
residential and commercial retrofit goals outlined in this FYP can be achieved. In the future there
may also be substantial needs in hydrogen ready boilers and generation.
Our stakeholder engagement shows that local authorities and colleges, (and employers) are still
unclear about what is specifically needed in terms of jobs and skills. Local Authorities and colleges
need this from employers in order to develop suitable skills provision. If this information can be
distilled, Local Authorities and colleges partnerships will be able to mobilise fairly quickly using
existing channels and mechanisms. Ensuring that training provision is tailored to jobs demand from
local employers is vital for an inclusive net zero economy. Stronger connections between local
education providers and the private sector are key to matching skills provision and local employment
opportunities.
Page 216

NET ZERO 2041 CONFIDENTIAL | WSP Project No.: 70076572 February 2021 West Midlands Combined Authority 123
Two Institutes of Technology (IoT) have been developed to deliver higher technical education in the
West Midlands. Dudley IoT has been redeveloped to provide teaching and research environment for
higher level skills programmes in sectors where there are skills shortages and therefore employment
opportunities including in advanced manufacturing, modern construction methodologies and medical
engineering. The Greater Birmingham and Solihull IoT focuses on advanced manufacturing and
industry through greater collaboration of further and higher education and creating pathways from
level three to level six apprenticeships. Both IoTs form a key part of creating a world class technical
education system in the West Midlands.
Workers are needed to deliver major infrastructure projects such as HS2 that will support net zero.
The National College for Advanced Transport & Infrastructure in Birmingham provides training that
will give learners skills and lead to careers in areas such as civil engineering, systems engineering
and digital design. It is vital that courses and qualifications have a focus on infrastructure for
sustainable and active transport whilst also educating people about new materials projects will be
using in the future.
Colleges already have focus on areas in the priority sectors – digital, construction and advanced
manufacturing. The Newcastle College Energy Academy is a recent example of a college
implementing a strategy for improving the skills base for Low Carbon technology.
In 2018, Newcastle College’s Energy Academy38 launched a new strategy to deliver highly
vocational, employer-led STEM education and training for the energy sector. In recent years, the
academy had lost its connections with local industry, but since opening, more than 1,200 students
38 https://www.ncl-coll.ac.uk/world-class-facilities/energy-academy
Demand-side stakeholder engagement
As part of the stakeholder engagement, there were one-to-one meetings with significant
employers in the area such as JLR and Cemex. The jobs and skills impact of net zero was an
important part of these discussions. An online survey was also distributed through a number of
organisations. The main findings from the engagement exercises was as follows:
▪ Low carbon jobs and skills are still in infancy – there is not the demand at present for the
jobs from the private sector.
▪ There are concerns around skills gaps and the need for upskilling, such as with regards to
retrofitting and zero carbon homes.
▪ Believe that heavy industry will be the sector most negatively affected by the transition.
▪ Need for greater engagement with colleges and universities to ensure demand for skills is
met in industry.
▪ General view that more skills are needed when it comes to developing and implementing
renewable technologies / low carbon products. Companies are keen to invest in hydrogen
and other skillsets.
▪ Automotive industry facing skills challenges in terms of autonomous driving and connected
cars. More confident that jobs can transition for electric vehicles manufacturing.
More detail on the stakeholder engagement undertaken as part of this project can be found in
Appendix A.
Page 217

NET ZERO 2041 CONFIDENTIAL | WSP Project No.: 70076572 February 2021 West Midlands Combined Authority 124
have been trained, with many now working within the energy sector. The initial success of the
college was brought about by strong ties with industry; this has not been maintained. WMCA has
demonstrated it has the ability to deliver responsive training through its providers however this
needs to be paired with employer demand for these skills. As highlighted in engagement with
employers as part of the development of the FYP, they are currently not able to indicate their need
for certain jobs roles and skills in the net zero economy.
While investing in R&D for education institutions across the country is essential in tackling both
regional and racial inequality and ensuring an adequate provision of skills in industrial clusters.
However, to ensure best and appropriate training to deliver the 15 net zero goals in the FYP, the
WMCA must build even stronger connections between education providers and employers so that
demand-led training programmes can be developed.
6.5.3 UNIVERSITIES
The region’s research strengths across its universities are well established. The current sub-regional
set-up is able to support provision of new skills and aptitudes for net zero. The West Midlands’ mix
of universities, anchor companies, research and development facilities, knowledge networks and
skilled workforce provides the foundations to support the transition to net zero. The universities in
the West Midlands Combined Authority area include Aston University Birmingham; University of
Birmingham; Birmingham City University; University College Birmingham; Coventry University;
Newman University Birmingham; University of Warwick; and University of Wolverhampton.
The West Midlands Combined Universities group brings together around 100,000 staff and students,
offering research, innovation, skills development and technological opportunities. The three
universities that make up the group (Birmingham City University, Coventry University and the
University of Wolverhampton) have a strong history of connecting organisations with students for
jobs and work placements, as well as training and development opportunities for existing workers.
Aligning with the low carbon and net zero future, the combined universities are developing a centre
of excellence to support areas of need including sustainable construction methods and materials,
low emission transport and fuels, and renewable energy generation39. This will address the huge
opportunities for employment and economic growth identified in the low carbon sector through
continued investment in enterprise, Research & Development (R&D), and knowledge transfer.
In addition to the research centres the universities offer undergraduate and postgraduate degrees
that will support development of net zero skills base and strong talent pool in region. These degrees
will be at the forefront at developing a skills base for newly created roles en-route to the net zero
economy.
6.5.4 SKILLS HUBS AND PROGRAMMES
Throughout the West Midlands Combined Authority area, there are a number of programmes in
place to provide training and support for local businesses, especially for SMEs.
Across all of these programmes there is common aim to supply individuals with the appropriate skills
and aspirations to meet current and future needs of a highly technical industry. Whilst these will
address shortages of specific skillsets which support the region’s strategic opportunities there is
need to improve skills that will directly support the transition to net zero. Some of the training offered
39 http://www.wmcu.ac.uk/areas-of-expertise/
Page 218

NET ZERO 2041 CONFIDENTIAL | WSP Project No.: 70076572 February 2021 West Midlands Combined Authority 125
in these programmes will support the transition to net zero however more will need to be done. More
specific sustainability and lower skilled training programmes especially those with lower skills levels
will be needed in these transformational sectors:
▪ Advanced Manufacturing – Working with more automation and new materials
▪ Transport technologies – EV maintenance and repair
▪ Construction – Heat pump fitting and repair
▪ Environmental Technologies - renewable energy, such Solar, Hydrogen and Fuels Cells
▪ Business Services – Improving sustainability in services and products
This will enable the region to take advantage of current growth opportunities in the transformational
sectors and "future-proof” the skills base of a workforce.
…
Chapter Summary
❖ The goals and overall transition to a low
carbon economy will create jobs in green
sectors, while jobs will be lost in their
‘brown’ counterparts.
❖ A core economic strength of the WMCA is
in advanced manufacturing and
engineering, but growing sectors including
creative, digital and life sciences.
❖ Stakeholder engagement with employers
indicates many are currently not able to
specify their need for particular skills in the
net zero economy; this disconnect needs to
be addressed.
❖ The transport sector currently supports over
116,000 jobs, the built environment almost
74,000, the energy sector 16,000 and
industry 170,000.
❖ Create industry transition pathways in
partnership with local businesses to support
industries during the transitionary period
❖ The goals have the potential of creating
over 20,000 jobs by 2026 and 90,000 jobs
by 2041.
❖ It is recommended a net zero skills forum
for education providers and businesses to
identify trends and work collaboratively to
highlight skills gaps and prioritise future
training provision
❖ c.140,000 jobs need to reskill as result of
transition’ support is needed to ensure
employees are able to transition to the
evolving needs of these industries.
Page 219

NET ZERO 2041 CONFIDENTIAL | WSP Project No.: 70076572 February 2021 West Midlands Combined Authority 126
7 DELIVERY AND FINANCE
To achieve the goals and level of delivery outlined in the ‘Accelerated’ scenario will require a
qualitative and quantitative change in the resources deployed in these areas currently. The rate of
increase in uptake required is large in most cases, and in some is at the edge of what is realistic the
region will need to be bold to achieve its 2041 target. The first FYP is at a disadvantage, because in
certain areas the region are at a standing-start, and delivery will need to ramp-up the supply chain,
finance, delivery management and uptake. The later five-year plans should benefit from a strong
structure and pipeline. All of the delivery plan summaries are aligned to the ‘Accelerated’ scenario.
7.1 WEST MIDLANDS COMBINED AUTHORITY ROLE
In terms of the role the WMCA is able to play in meeting the GHG reduction commitments, there are
three main areas for focusing efforts:
• Deliver – Delivery of the goals would vary from the WMCA taking a complete leadership and
delivery role, for example through Transport for the West Midlands, or as a partnership with
other stakeholders such as local authorities and business, or as a facilitator with others
taking leadership, but the WMCA providing assistance and support.
• Enable – Where the WMCA cannot directly reduce GHG emissions, working with others to
put in place the necessary infrastructure, policy, controls and wider support for others.
• Influence – where there is no direct method of reducing GHG emissions. Indirectly
influencing the behaviour and actions of others.
Fundamentally, the West Midlands Combined Authority will need to shift away from traditional
spending in order to meet the challenge. New funding will need to be secured and they will have to
work collaboratively to secure funding for the region and consider how they can support others to
enable change.
7.2 THE DELIVERY PLAN
The delivery route to 2026 is outlined in the following tables.
In each area, there is an indication where the balance lies between the WMCA delivering, working in
partnership with others, or requiring national government to change policy or devolve powers or
resources/funding.
Delivery requires significant acceleration across all sectors by all stakeholders if the 2041
target is to be achieved. In some cases, the only realistic route to delivering the goals will be
through national government commitment or devolution. Other stakeholders have a key part to play
including:
■ Local authorities have a similarly key role to play alongside the WMCA. The WMCA will
need to seek joint approaches to deliver at scale where appropriate to set the conditions for
net zero delivery.
Page 220

NET ZERO 2041 CONFIDENTIAL | WSP Project No.: 70076572 February 2021 West Midlands Combined Authority 127
■ Delivery is dependent on adequate funding and resourcing; these may come from a variety
of avenues and sources.
■ Businesses and Industries will need to lead the way and work with the WMCA and each
other to ensure create mechanisms for change which do not put them at a competitive
disadvantage.
■ Private and voluntary sector organisations are needed to collaborate and deliver projects
■ Universities and colleges will need to work with employers to ensure there is no skills gap.
■ Communities have to come together to meet the challenge and ensure a just and equitable
transition.
■ People will need to make significant changes to their lifestyles, most of which will positively
affect health and wellbeing. However, systems need to be in place to enable this change.
Page 221

NET ZERO 2041 CONFIDENTIAL | WSP Project No.: 70076572 February 2021 West Midlands Combined Authority 128
DOMESTIC – Retrofit energy efficiency measures, install rooftop solar and heat pumps (or other fossil-fuel free heating) to all homes i.e. Goals 1, 2 & 3
Investment and Funding
The required investment is estimated at a gross £3.5bn over the five-year plan, to
achieve the required level of deployment. The sources of this will be varied, including
the public and housing associations, but a lot of the finance will have to come through
either existing, private or new taxpayer funded streams. Some of this money will be
deployed as part of the normal replacement cycle and investment in the private homes
sector, but current rates of deployment indicate this will be small in the first FYP.
Relevant sources of finance include:
• Private homeowner / landlord investment
• Private Sector - Fit-for-Free solar models and revolving finance
• Green Homes Grant
• ECO funding
• Local Authority Delivery funding
• Social Housing (to meet 2030 target)
• Government funding on heat pump deployment in line with 10 Point Plan - TBC
Governance
Energy Capital to develop the Fuel Poverty and Regional Retrofit
Programme structures to develop business case and investment plans to
deliver directly where appropriate or persuade and incentivise where
ownership is private.
UN Sustainable Development Goals
Stakeholders
The main stakeholders are expected to be:
• Housing Associations
• Local Authority Housing
• Homeowners and private landlords
• Supply Chain – Installers, manufacturers and assessors
• National Government – BEIS, Treasury
• Midlands Energy Hub
Dependencies
The goals are dependent on:
• Housing associations
• Local authorities
• Homeowners and private landlords
• Supply Chain
• National Government – BEIS
• Midlands Energy Hub
Job creation
Professional Associations, engineering
companies and training providers to
maximise opportunities for local jobs and
skills around solar, retrofit and heat pump
installation.
Around 14,000 jobs created by 2026.
Resources
vary substantially depending on the level of volvement. Marketing and promotion
would require additional funding and may be attracted from funding bodies identified.
Local Authorities
Work with Energy Capital and other stakeholders to ensure plans are co-
ordinated and benefits of aggregation are realised. Develop policies at local
level around planning and own homes, receive any devolved funding, work
with installers and householders, lobby for funding. Retrofit own housing
stock and adopt Zero Carbon Homes Charter for new build.
WMCA Role
Influencing Enabling Delivery
Promotion of the campaign and the opportunities, particularly in the
private sector.
Provision of cross-disciplinary co-ordination, team with stakeholders.
Managing the financial streams from national government and other
incentives
Developing clear single programme for domestic sector and
managing and administrating. Possibly managing procurement and
frameworks for deployment.
Devolution Asks – Funding to be decentralised and increased in line with national government commitments.
NEXT STEPS
This will be confirmed by WMCA in the next steps.but will dependResource requirements willEstablishing the Fuel Poverty and Regional Retrofit (PRR) Centre of Excellence and developing investable
propositions to stimulate the market and scale-up efforts to tackle fuel poverty. Delivery of the measures will be undertaken by private contractors, with oversight and co-ordination from Energy Capital, housing
associations and local authorities.
Page 222

NET ZERO 2041 CONFIDENTIAL | WSP Project No.: 70076572 February 2021 West Midlands Combined Authority 129
COMMERCIAL – Retrofit energy efficiency measures, install rooftop solar and heat pumps (or other fossil-fuel free heating) to all non-domestic buildings i.e. Goals 4, 5 & 6
Investment and Funding
The required investment is estimated at a gross £1.6bn in total, to achieve the required
level of deployment, and over £100m per annum in the FYP. The sources of this will be
varied, mainly the private sector, but there may also be taxpayer funding for upgrades.
Some of this money will be deployed as part of the normal replacement cycle and
investment, but current rates of deployment indicate this will be small in the first FYP.
Most of the investment will be driven by private sector decision making. In addition, there
are policy drivers that will drive investment in the energy efficiency area:
Minimum Energy Efficiency Standards (MEES) for commercial sector requires an EPC
rating of E or better by 2023 and the UK government is consulting on a requirement for a
B rating by 2030.
Relevant sources of finance include:
• Private sector investment
• Fit for free solar investors
• BEIS funding for SME energy efficiency
• BEIS funding for heat networks in dense clusters
Governance
Energy Capital to convene sub-group of the wider Fuel Poverty and
Regional Retrofit programme to develop strategy to support, persuade
and incentivise business organisations and representatives.
UN Sustainable Development Goals
Stakeholders
The main stakeholders are expected to be:
• Commercial Forums – Better Building Partnership, FSB
• LEPs
• Energy Capital
• BEIS
• WPD
Dependencies
The goals are dependent on:
• Delivery in commercial sector is largely dependent on private
organisation decision making.
• Delivery will be driven somewhat by national government
legislation or devolution around minimum energy efficiency
standards (MEES)
• Underlying system management – Large scale heat-pump and
solar deployment will require an underlying electrical system that
can manage
Job creation
Professional Associations, engineering
companies and training providers to
maximise opportunities for local jobs and
skills around solar, retrofit and heat
electrification.
About 1,000 jobs by 2026.
Resources
Resource requirements will vary substantially but will depend on the level of direct
involvement. This will be confirmed by WMCA in the next steps
Local Authorities
Work with Energy Capital and other stakeholders to ensure plans are co-
ordinated and benefits of aggregation are realised. Promotion to local
businesses.
WMCA Role
Influencing Enabling Delivery
Promotion of the campaign and the opportunities to business
organisations
Cross-disciplinary co-ordination, team with stakeholders. Managing
the financial streams from national government and other incentives
Developing clear single programme for commercial sector and
managing and administrating, either directly or through a third party.
This may work by offering an advice service, guidance on incentives
framework suppliers and an assurance service.
Devolution Asks – BEIS funding to be decentralised.
NEXT STEPS
WMCA should fund the development of a strategy to support, persuade and incentivise business organisations and representatives. Delivery of the measures will be undertaken by private contractors, with
oversight and co-ordination from Energy Capital and business organisations.
Page 223

NET ZERO 2041 CONFIDENTIAL | WSP Project No.: 70076572 February 2021 West Midlands Combined Authority 130
INDUSTRIAL– Industrial energy efficiency, zero carbon fuel-switching for heat (H2 or elec.), carbon capture and storage, and renewable energy, Goals 7 & 8
Investment and Funding
The total investment required has not been quantified, except for solar, as the
interventions are pre-commercial at present. The Black Country Consortium indicate that
£90m of direct enabling funding will be required for the Black Country Cluster to initial
industrial decarbonisation programme, including staffing. It is anticipated this will attract
£400m of private investment. If successful, this approach could be replicated across the
rest of the West Midlands. The initial funding has been provided by UKRI.
All of the investment will require private sector decision making. There are limited policies
that are specific in the industrial sector. Minimum Energy Efficiency Standards apply to
buildings, and Climate Change Agreements.
Relevant sources of finance include:
• BEIS
• UKRI
• Private Industry
There are limited policy levers around the industrial sector, with no EU ETS scale industry
in the West Midlands. Work by the CCC and others highlights the challenge of ensuring
emissions reductions without damaging competitiveness and “offshoring” the emissions.
Most heavy energy users are focused already on energy efficiency, but many have limited
capacity for investment. The Black Country Consortium have a strategy around symbiotic
industrial co-location and taking opportunities around the principles of the circular
economy, which will be developed both through the energy devolution and circular
economy strands of work.
Governance
Energy Capital to convene group to develop business case with the
LEPs, building on work from Black Country Consortium. A West
Midlands Industrial Decarbonisation Taskforce could extend the
consortium’s work across the whole region, bringing in the Circular
Economy Taskforce
UN Sustainable Development Goals
Stakeholders
The main stakeholders are expected to be:
• LEPs
• Industrial organisations
• BEIS
• Cadent / WPD
• Energy Capital
• International sector groups
Dependencies
The goals are dependent on:
• Private sector investment is required at scale to achieve the
goals required
• The govt. strategy for transition to hydrogen for the W.Midlands
• Carbon capture and storage will require UK govt. investment
• International collaboration may be required to increase
environmental standards globally.
Job creation
Professional Associations, engineering
companies and training providers to
maximise opportunities for local jobs and
skills.
Few direct jobs indicated by 2026. Many
more possible around new industrial hubs,
fuel switching and CCS, but dependent on
sector development.
Resources
The staffing resources for this work have not been estimated, partly because much of the
investment is pre-commercial. The Black Country Consortium have funding from UKRI to
scope out a programme of energy efficiency.
Local Authorities
Work with the LEPs and Energy Capital and other stakeholders to
ensure plans are co-ordinated and benefits of aggregation are realised.
WMCA Role
Influencing Enabling Delivery
Promotion of the campaign and the opportunities to business
organisations.
Provision of cross-disciplinary co-ordination, team with stakeholders.
Managing the financial streams from national government and other
incentives.
Developing clear single programme for commercial sector and
managing and administrating. Possibly managing procurement and
frameworks for deployment.
Devolution Asks – The WMCA has produced an Energy Devolution Deal which has been submitted to government, including decentralisation of funding.
NEXT STEPS
Energy Capital should support the work of Black Country Consortium and the initial funding from UKRI to develop the business case for investment and the necessary resources for the region.
Continue to discuss with national government regarding Energy Devolution Deal.
Use the taskforce to consider how the circular economy opportunities identified by the Black Country Consortium can guide investment and development across the region.
Page 224

NET ZERO 2041 CONFIDENTIAL | WSP Project No.: 70076572 February 2021 West Midlands Combined Authority 131
TRANSPORT – Develop and implement policies for low carbon transport to, from and within the area ensuring the integration with land use, energy and digital connectivity policy Goals 9-13
Investment and Funding
The WMCA is investing over £1bn into a programme of transport investment over
the next 5 years
They have already set out proposals to Government to go further and faster, with
a £2.5bn rolling, five-year single infrastructure package covering £1.5bn of
transport investment together with energy and digital interventions.
Sources of finance include:
• Intra-City Transport Fund
• Government grants (e.g. Bus, Cycle, Rail, ZEV, Innovation)
• New potential funding – National Infrastructure Bank
• New potential funding – locally raised revenues
• New potential green and social investment models may access corporate
and retail investors.
• Development contributions/CIL/Infrastructure Levy
• Private sector investment (bus / fleet operators)
Governance
Development and delivery of a new local transport plan (LTP) will require action
by TfWM in collaboration with partners. They will work with our local partners to
establish governance that monitors the policy delivery of all key stakeholders in
the area in addition to monitoring the impact of policies.
UN Sustainable Development Goals
Stakeholders
The main stakeholders are expected to be:
• Local Authorities
• LEPs
• Transport Operators / Fleet Operators
• Highways England / Network Rail
• Midlands Connect
• NGOs
• DfT / BEIS / MHCLG
• Private Sector (DNOs, Hydrogen Developers etc.)
Resources
Responding to the climate emergency will require additional resources within the
Combined Authority, TfWM and local authorities. Due to the scale and pace
required for many of the potential actions will require activity above and beyond
existing Business As Usual resources.
Dependencies
The goals are dependent on:
• Significant behaviour change in travel patterns
• Policy and infrastructure scheme delivery by local partners
• Political leadership and consensus – national, regional and local
• Funding
• Devolution - Powers / Financial Freedoms
• Job/Skills
Job creation
Some jobs in the WMCA will be in
manufacturing low emission vehicles and
infrastructure. Opportunities as new and
innovative transport models evolve e.g.
shared mobility, micro mobility.
About 5,400 new jobs by 2026.
WMCA Role
Influencing Enabling Delivery
• Developing an ambitious Local Transport Plan demonstrating
leadership in inclusive, zero carbon transport system.
• Overseeing and monitoring of the LTP to support WM2041
• Cementing position as a global leader in new transport
solutions, technologies and innovations
• R&D supporting robust, evidence led policy
development
• Scheme development
• Securing regional funding and investment
• Securing additional powers and financial freedoms
• Cross-disciplinary co-ordination, resource management,
facilitating connections to relevant schemes and bodies,
accelerated learning from other regions.
• Co-ordinating the transport system with partners (Regional Traffic
Co-ordination Centre, Bus Alliance, West Midlands Rail Executive
• Collaborative delivery of schemes within the LTP
• Decarbonise WMCA’s transport assets
• Secure bus emissions improvement through partnership or
franchising Continue to deliver travel demand management
programme, influencing behaviours through communications and
information
Devolution Asks –The WMCA will need to work collaboratively to develop a rolling five-year infrastructure programme supported with the necessary coherent and consistent funding and relevant local powers
and freedoms.
NEXT STEPS
• West Midlands proposals for Intra-City Transport Fund developed that meet the objectives of driving inclusive growth and #WM2041 (net zero carbon emission) goals
• West Midlands forthcoming LTP review, starting a conversation on the future of transport in West Midlands
• Draft West Midlands Local Transport Plan published for consultation, summer/autumn 2021 and adoption in early 2022.
Page 225

NET ZERO 2041 CONFIDENTIAL | WSP Project No.: 70076572 February 2021 West Midlands Combined Authority 132
NATURAL CAPITAL – Increase tree cover to 13% across the WMCA area with a combination of woods and peri-urban planting. Develop a regional natural capital plan i.e. Goals 15
Investment and Funding
The total investment required is estimated at £390m, assuming no land is
purchased. The funding for planting trees will come from landowners or investors,
paid back through schemes, such as those below. In some cases, planting may
be carried out as part of regeneration projects, new development or estate
improvement, outside any direct support scheme.
Sources of finance include:
• Private sector awards (e.g. Severn Trent Water Great Big Nature Boost)
• Government grants (e.g. Countryside Stewardship Grant, Nature for
Climate Fund)
• Smaller grants, (e.g. Tree Council Branching Out Fund for schools and
communities)
• New potential funding mechanisms as addressed in UK govt. 10 Point
Plan (e.g. ELMS, biodiversity and carbon credits)
• New potential green and social investment models may access corporate
and retail investors.
• Community Green Grants
Investment for broader natural capital approaches will be developed in the work
under next steps.
Governance
WMCA to convene a regional natural capital group that builds on existing
networks and ensures they are well connected to adaptation, inclusive growth
and industrial programmes and policies.
UN Sustainable Development Goals
Stakeholders
The main stakeholders are expected to be:
• DEFRA
• Landowners – farmers, public bodies, Severn Trent Water
• Local Authorities/ LEPs/ LNPs
• NGOs – Wildlife Trusts, Woodland Trust, RSPB, Canal & River Trust
• Local tree planting, nature and parks groups
• Environment Agency, Forestry Commission, Natural England
Dependencies
The goals are dependent on:
• Landowners - willingness for planting
• DEFRA – Funding and alignment with regional goals
• Supply Chain
• Ongoing maintenance and management
Job creation
Connect with professional associations
and training providers to develop skills
and unlock the potential for 400 jobs by
2026. Resources
To convene and manage the approach to delivery will require a programme
management and co-ordination staffing budget of ~£200k per annum for 2 - 3
staff within the WMCA Environment team. Marketing and promotion would
require additional funding and may be attracted from funding bodies identified.
Local Authorities
Work with WMCA and other stakeholders to ensure existing natural capital plans
are joined up with cross-boundary opportunities.
Develop policies at local level with natural capital group and a natural capital
accounting approach.
Co-ordinate tree planting activity and promote the Virtual Forest
WMCA Role
Influencing Enabling Delivery
Promotion of the opportunities around tree planting and natural
capital, e.g. through the Virtual Forest, health and wellbeing
programmes, mayoral support, communications and behaviour
change programmes.
Provision of cross-disciplinary co-ordination, resource
management, facilitating connections to relevant national or
international schemes and bodies, accelerated learning from
other regions.
Programme management - a central function to identify opportunities,
guide applications and investigate new investment and delivery models.
Devolution Asks – Allocation of ELMS funding and others to WMCA to manage. Request responsibility for a local nature recovery strategy with the regional natural capital group overseeing.
NEXT STEPS
WMCA should fund the initial management and administration of a natural capital strategic plan for the region in the context of ecosystem services, inclusive growth and post-COVID recovery. Delivery of tree-
planting will be undertaken by other stakeholders, with support and co-ordination provided by WMCA, building on the networks developed as part of the West Midlands Virtual Forest.
Page 226
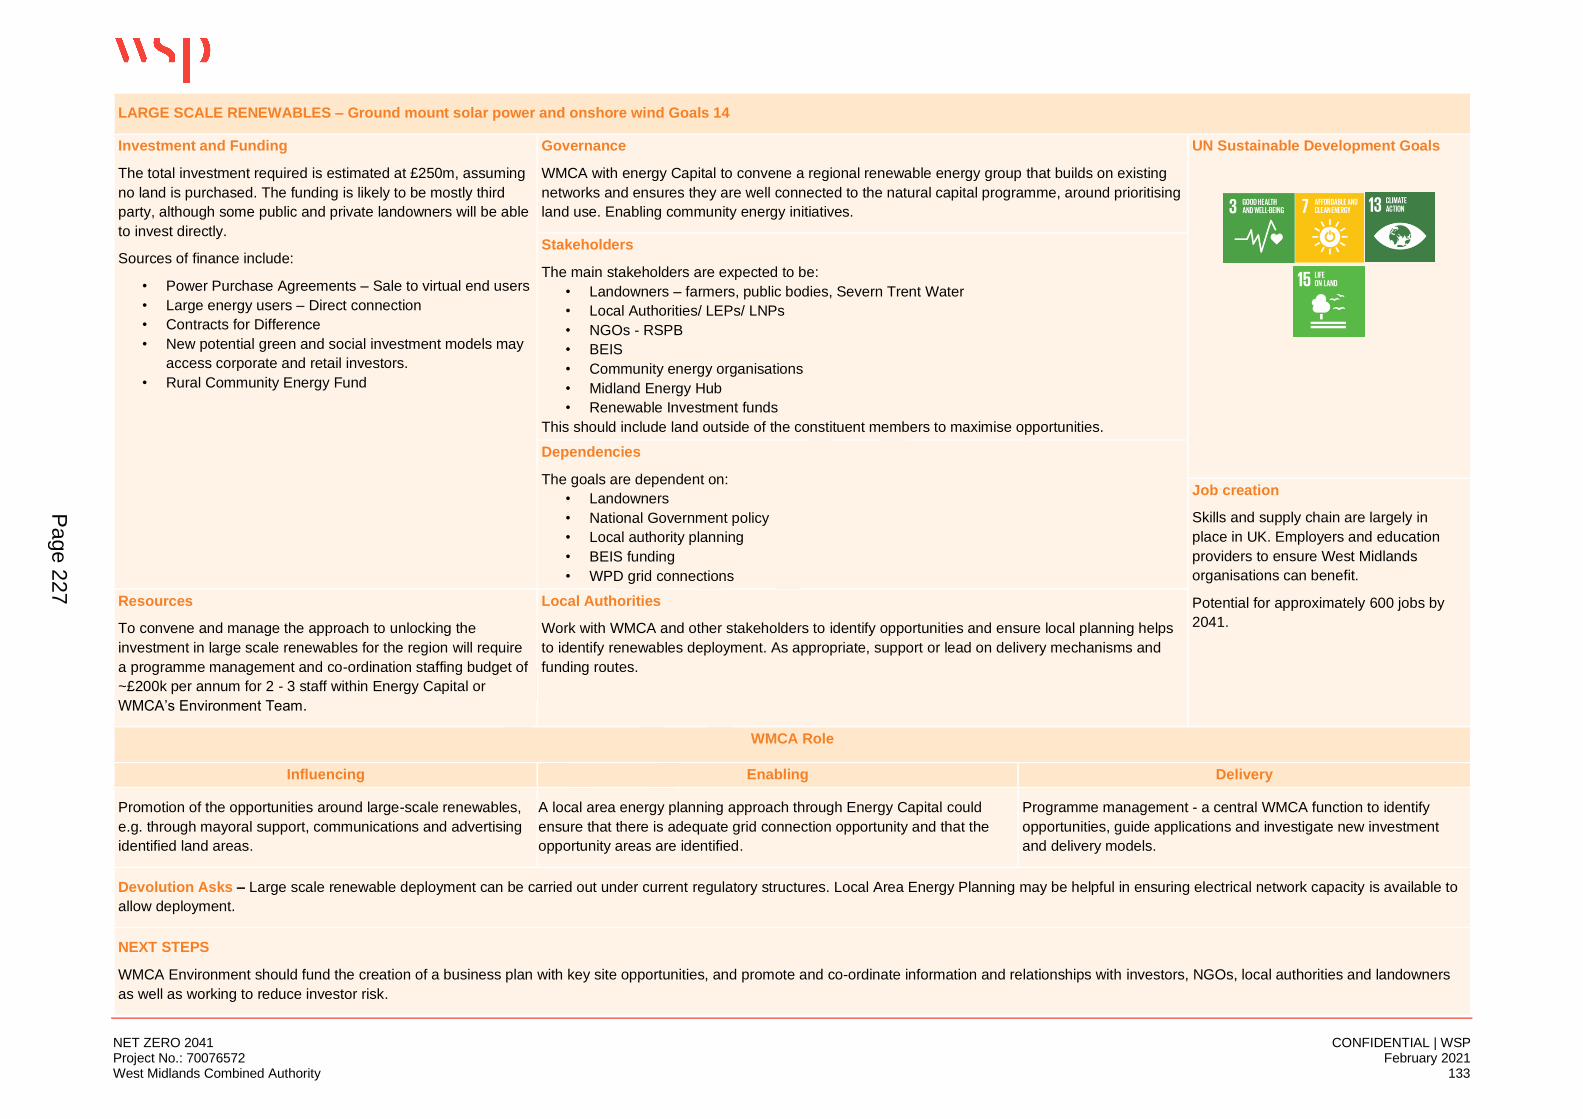
NET ZERO 2041 CONFIDENTIAL | WSP Project No.: 70076572 February 2021 West Midlands Combined Authority 133
LARGE SCALE RENEWABLES – Ground mount solar power and onshore wind Goals 14
Investment and Funding
The total investment required is estimated at £250m, assuming
no land is purchased. The funding is likely to be mostly third
party, although some public and private landowners will be able
to invest directly.
Sources of finance include:
• Power Purchase Agreements – Sale to virtual end users
• Large energy users – Direct connection
• Contracts for Difference
• New potential green and social investment models may
access corporate and retail investors.
• Rural Community Energy Fund
Governance
WMCA with energy Capital to convene a regional renewable energy group that builds on existing
networks and ensures they are well connected to the natural capital programme, around prioritising
land use. Enabling community energy initiatives.
UN Sustainable Development Goals
Stakeholders
The main stakeholders are expected to be:
• Landowners – farmers, public bodies, Severn Trent Water
• Local Authorities/ LEPs/ LNPs
• NGOs - RSPB
• BEIS
• Community energy organisations
• Midland Energy Hub
• Renewable Investment funds
This should include land outside of the constituent members to maximise opportunities.
Dependencies
The goals are dependent on:
• Landowners
• National Government policy
• Local authority planning
• BEIS funding
• WPD grid connections
Job creation
Skills and supply chain are largely in
place in UK. Employers and education
providers to ensure West Midlands
organisations can benefit.
Potential for approximately 600 jobs by
2041.
Resources
To convene and manage the approach to unlocking the
investment in large scale renewables for the region will require
a programme management and co-ordination staffing budget of
~£200k per annum for 2 - 3 staff within Energy Capital or
WMCA’s Environment Team.
Local Authorities
Work with WMCA and other stakeholders to identify opportunities and ensure local planning helps
to identify renewables deployment. As appropriate, support or lead on delivery mechanisms and
funding routes.
WMCA Role
Influencing Enabling Delivery
Promotion of the opportunities around large-scale renewables,
e.g. through mayoral support, communications and advertising
identified land areas.
A local area energy planning approach through Energy Capital could
ensure that there is adequate grid connection opportunity and that the
opportunity areas are identified.
Programme management - a central WMCA function to identify
opportunities, guide applications and investigate new investment
and delivery models.
Devolution Asks – Large scale renewable deployment can be carried out under current regulatory structures. Local Area Energy Planning may be helpful in ensuring electrical network capacity is available to
allow deployment.
NEXT STEPS
WMCA Environment should fund the creation of a business plan with key site opportunities, and promote and co-ordinate information and relationships with investors, NGOs, local authorities and landowners
as well as working to reduce investor risk.
Page 227

NET ZERO 2041 CONFIDENTIAL | WSP Project No.: 70076572 February 2021 West Midlands Combined Authority 134
Systems management, behaviour change and governance
A number of initiatives that cut across all areas have been identified through stakeholder
engagement and the development of this plan. These will mostly be co-ordinated by the WMCA
Environment Team with extensive stakeholder input, given the cross-cutting nature of delivery.
Initiative Description & next steps for WMCA Stakeholder role
West Midlands Net Zero Business Pledge
WMCA will launch a West Midlands Net Zero Business Pledge to highlight existing business leadership, build on region’s networks and provide support so al businesses know how they can play their part.
Working closely with Sustainability West Midlands, business leaders and local authorities to develop and support the pledge and its associated programme.
Carbon Literacy WMCA will commence Carbon Literacy training for staff during 2021 to work towards becoming a “carbon literate” organisation.
All organisations in the region are encouraged to complete the UN recognised training to make the West Midlands a carbon literate region.
Behaviour change and communications
Building on the findings of this plan, WMCA will work with regional stakeholders to develop initiatives and information that will enable people to make a positive contribution to net zero and improve their quality of life.
This includes a proposal to develop a regional Citizens Assembly to support decision making for the net zero transition.
Work closely with WMCA to align messaging and ensure local plans (local authority, business or third sector) and communications are co-ordinated and supportive of a just transition to net zero.
People in the West Midlands will be critical in shaping this work too.
Green Finance WMCA will lead on the development of green finance solutions and mechanisms to support the delivery of this plan, based on the business cases that result from each delivery plan.
Input expertise and requirements on a project by project basis to support delivery.
Citizens’ Panel WMCA will work with other local authorities to establish a representative Citizen’s Panel that can provide opinion and feedback on the plans and delivery.
Page 228

NET ZERO 2041 CONFIDENTIAL | WSP Project No.: 70076572 February 2021 West Midlands Combined Authority 135
7.3 MONITORING AND REPORTING
There will be an ongoing need to monitor performance and report back findings annually to the
Environment and Energy Board, which must then be able to inform project planning, specification
and resources, including:
▪ Reviews on delivery and carbon reduction progress (annually)
▪ Data collection, validation and interpretation (quarterly)
▪ Defining methodology for performance monitoring (one-off)
▪ Auditing including governance, risk management and financial control (annually)
▪ Monitoring and scrutinise performance and reporting against targets (annually)
▪ Technological assessments and reviews of emerging best practices (twice per FYP period)
▪ Dissemination of learnings (annually)
▪ Review of changes in national policy (quarterly)
▪ External/independent auditing (annually)
WM2041 GOVERNANCE
In order to ensure a cross-cutting approach to net zero delivery, it is proposed that a new WM2041
Net Zero Delivery Board is established that will:
■ Provide oversight of progress against strategy, business cases and delivery to achieve both
2026 and longer term 2041 ambitions;
■ Take responsibility for the achievement of net zero goals across the region and advocate for the necessary resources and powers to achieve this.
■ Recognise the importance of and facilitate integrated transport, energy and planning at a local level in delivering net zero.
■ Enable effective intelligence and data transfer between sectors to enable this.
■ Keep an eye on the goal and identify policy and regulatory barriers to the achievement of net zero by 2041 in the region and take action to remove these
■ Bring together local authorities where appropriate to deliver at scale and the pace required,
respecting subsidiarity and relevant duties and powers;
■ Recognise the key role of LEPs, businesses, third sectors and education institutions, engaging
them in a co-ordinated and strategic way around net zero delivery;
■ Receive input from a Net Zero Citizens’ Panel to test solutions and inform decisions developed
from the FYP;
■ Get the region behind net zero and communicating a story together which is compelling and
demonstrates commitment;
■ Report progress to the WMCA Environment and Energy Board.
Page 229

NET ZERO 2041 CONFIDENTIAL | WSP Project No.: 70076572 February 2021 West Midlands Combined Authority 136
8 APPENDICES
Appendix A – Document Review
Appendix B – Stakeholder Engagement
Appendix C – MACC Assumptions
Appendix D – GIS Mapping
Appendix E – Assumptions under Business-As-Usual
Appendix F – Goals Assumptions
Appendix G – Jobs & Skills Appendices
G-1 Transition Literature Review
G-2 Jobs & Skills Policy Literature Review
G-3 Jobs & Skills Baseline Data
G-4 Supply Side Review
G-5 Goals Jobs Analysis
Page 230

CONFIDENTIAL
The Mailbox
Level 2
100 Wharfside Street, Birmingham
B1 1RT
wsp.com
Page 231

This page is intentionally left blank
www.wsp.com
APPENDIX A – DOCUMENT REVIEW
Key Findings
▪ There have been many studies on the subject of energy efficiency and GHG reduction in the region especially over
the last few years. This coupled with recent national government announcements (i.e. 10-point plan) and Climate
Change Committee have built up a strong understanding and evidence of the types of actions that need to be
undertaken
▪ The West Midlands is the largest regional economy outside of London. The combination of energy-intensive
industries and high levels of fuel poverty makes the region especially sensitive to energy prices. There are high
concentrations of manufacturing and motorways and limited access to renewable generation such as offshore
wind. The West Midlands accounts for 9% of manufacturing employment in Britain (with the highest concentration
of manufacturers).
▪ Several local authorities in the region have already pledged to achieve zero carbon status for their estate (under
various timeframes). Whilst these, in themselves, have limited impact, there is a strong symbolism and the
contribution is valuable.
▪ Large energy users in the region already have undertaken many of the ‘quick wins’ when it comes to energy
efficiency and are working actively to bring further efficiencies around circular economy and co-location. Ensuring
industries remain competitive is also a priority as such a regional energy strategy is core to any regional industrial
strategy.
▪ The built environment is a major focus both in terms of actions which reduce fuel poverty but also reducing energy
consumption. There are 140,000 households in fuel poverty in the region (rates exceeding 12% in areas of
Birmingham, Coventry and Wolverhampton) with large estates of 1950s/60s housing. Improving building insulation
levels along with behaviour change advice and energy literacy would have significant benefits.
▪ New homes and other buildings will be zero carbon or at least not utilising fossil fuel heating in the near future, the
focus therefore shifts to retrofitting homes.
▪ There is a need to a shift in transport modes to reduce reliance on cars and increase accessibility of employment
via public and active travel within a 45-minute commute time.
▪ The long-term strategy will see a shift in emphasis of travel in line with typical large European city regions where
car use accounts for typically 40% of all journeys, compared to 63% in the West Midlands Metropolitan Area. In
addition, the Cycle Charter sets a target for 10% of all journeys to be made by bike in the West Midlands
Metropolitan Area by 2033.
▪ Whilst a ban on internal combustion engines will come in by 2030, this is likely to be too late to affect the carbon
budget greatly over the next few years and demand reduction measures may be needed to curb transport fuel
consumption, private car use and increase active travel, public transport, micro-mobility and demand response
solutions.
▪ Waste generated and general consumption patterns are considered in several studies. Whilst there are
opportunities around reusing waste and the circular economy as well as around waste to energy, especially for
industry, the starting point is reducing the waste created in the first place.
▪ Natural capital and increasing green cover is a focus. The virtual forest goal of planting a tree for every person in
the west midlands is a starting point, government’s 10-point plan points to greater ambition. Any strategy must be
Page 233

Page 2
in the context of wider greening initiatives, improving air quality and improving biodiversity and habitats.
▪ There are a number of initiatives already being undertaken across the region include Energy Innovation Zones
(such as at Tyseley) and smart energy management in Coventry. Key industries are also being attracted to the
region such as a new Giga Factory for battery production whilst the likes of Jaguar Land Rover have already
moved to electric vehicle production.
Page 234

Page 3
The following are the main documents and data reviewed as part of the plan process:
Energy
Renewable Energy Capacity Study for West Midlands (March 2011)
The focus of this study is to present the results of the potential of all the technologies considered at a regional scale
across the West Midlands. The study reveals potential accessible renewable energy resource of 54.2GW of the West
Midlands as a whole.
Powering West Midlands Growth - A regional Approach to Clean Energy Innovation (March 2018)
This document provides an overview of clean energy trends in the UK and Worldwide, and the West Midlands
approach to these, along with regional challenges and a strong focus on Energy Innovation Zones (EIZs).
The West Midlands is the largest regional economy outside of London. Its combination of energy-intensive industries
and high levels of fuel poverty makes the region especially sensitive to energy prices. Meanwhile it has a high
concentration of manufacturing and motorways, with limited access to renewable generation such as offshore wind.
Four EIZs are proposed across West Midlands; with strictly only clean energy being consumed and generated within
the zone. Each EIZ would be proposed by a group of businesses/organisations with the size determined by local
priorities, i.e. energy poverty/industrial energy prices/low-carbon transport infrastructure.
Energy as an Enabler (March 2018)
This document outlines the linkages between local energy strategy, productivity and growth whilst having an economic
focus. To reduce industrial energy costs, like in Germany, they must be passed on to customers - unfeasible in this
region due to large pockets of fuel poverty levels. A regional energy strategy is core to the regional industrial strategy.
There is a need for a strategic focus on encouraging modern/smart energy infrastructure to support large-scale
deployment of future mobility technologies and clean growth technologies
Distributed generation and demand study (January 2018)
Technology growth scenarios to 2030 are presented. Technologies covered include solar PV, onshore wind,
hydropower, energy-from-waste, anaerobic digestion, gas and diesel peaking plant (which have had significant growth
in the last 18 months of network connection applications for these plants in particular). Detailed growth scenarios are
presented and analysed for each. Offshore generation is not included as West Midlands is landlocked with landfill gas,
sewage gas, CHP and biomass assessed as unlikely to have material effect on distribution network, so growth of
these is not considered in the report.
There is a general downward trend in energy demand though EV & heat pumps could have a regionally specific
impact on demand.
A Regional Energy Strategy for the West Midlands (November 2018)
The aim of this document is to deliver a vision for energy across the region by 2030. The focuses of this strategy
include:
▪ Reducing energy costs for strategic industrial sectors
▪ Reducing fuel poverty across region, hit government energy efficiency targets 5 years ahead of schedule
▪ Reducing regional carbon emissions
▪ Creating regional energy infrastructure that adds £1bn to GVA by 2025
Page 235

Page 4
There are several lessons learned from initiatives such as Energiesprong and Catapult's Smart Systems including the
need for a diversity of approaches, attention to detail (especially around skills programmes, training, cultural changes)
and new business models. There are also significant opportunities for leading the way in terms of electric vehicles in
the area such as potential for a £80M National Battery Manufacturing Development Centre in Coventry, with a strong
presence from Jaguar Land Rover in the region, strategic strengths in advanced manufacturing, low carbon tech,
transport and logistics and construction.
Black Country Utilities Infrastructure Capacity Study (September 2019)
This report specifically covers electricity, gas and telecommunications. It identifies four strategic centres -
Wolverhampton, Walsall, West Bromwich and Brierley Hill
There is sufficient power to support all existing planned housing/commercial growth. Potential in most locations to
support growth from new Black Country plan (to 2038). Power constraints close to Rushall substation (Walsall). No
other potential abnormal costs/technical constraints associated with prospective housing/commercial growth identified.
Powering Growth: Black Country Energy Strategy (February 2020)
This report is the final report for the project to develop an energy strategy for the Black Country Local Enterprise
Partnership (BCLEP) as part of a wider regional Energy Strategy for the WMCA. The aims of the strategy include the
identification and evaluation of a technical and commercial evidence base; and establishment of a pipeline of projects
that could receive future investment.
The report covers the work done in the project from late November 2017 to early February 2018 and includes:
▪ A summary of the data collected and analysed;
▪ Findings on the current costs of energy and comparison with other countries;
▪ Our view on approaches and technologies to help reduce costs, including those that can be applied now and likely
to be applied in future. This includes heat and electrical technologies, covering energy from waste, district heating,
PV, energy storage and demand management;
▪ Proposed next steps for this energy strategy.
The work shows where the largest energy demands are currently found and indicates clusters of current and future
buildings and businesses where action is likely to be most effective. It is already evident that:
▪ There are many businesses in the area where the nature of their work means they have large energy demands,
and so efforts to reduce their operational costs are important. Greater support for energy efficiency is a key
starting point;
▪ The many buildings with large rooves in the area mean that there are opportunities for significant PV arrays, but
this needs to be considered with full knowledge of the strength of the electrical grid and the contractual
arrangements that may be necessary;
▪ There are opportunities to consider around using heat from existing and planned energy from waste plants.
Innovating to Net Zero (March 2020)
The Innovating to Net Zero UK report by Energy systems Catapult modelled 100s of potential pathways to 2050 –
ramping up or down different technologies and behaviour changes – to understand the combinations, interactions and
trade-offs of competing decarbonisation approaches. This report identifies the technologies, products and services
which are most important to meeting Net Zero. It recommends what needs to happen during this Parliament to deliver
Net Zero levels of investment, infrastructure and innovation.
Net Zero narrows the set of viable pathways for the future energy system. Where an 80% target allowed considerable
variation in relative effort across the economy, with some fossil fuels still permissible in most sectors, Net Zero leaves
little slack. Success depends on innovation across the whole system; in technology, land use change and behaviour. Page 236
Page 5
Net Zero requires switching to low carbon technologies wherever we can, tackling demand for hard-to-treat activities
(aviation and livestock), and ensuring sufficient carbon sequestration to offset any residual emissions. Each of these
elements faces significant barriers and technology and land use changes are constrained by maximum feasible
deployment rates and competing uses of land. Net Zero requires society-wide adoption of low carbon heating and
transport technologies. It may also mean limiting growth in aviation demand and changing diets. Serious societal
engagement is therefore essential to the UK’s ability to meet Net Zero
Recharge the West Midlands (June 2020)
This is an investment case to government. In essence harnessing the potential of green technology and electrification
there is the potential to unlock 51,700 green jobs with an investment of £614m.
▪ £250m battery 'Gigafactory' and £35m investment in electric network to develop battery/charging technology to
adapt to EVs, creating 10,100 jobs and 29,700 job years in construction
▪ £100m to eliminate fuel poverty for 50,000 homes by end of 2022, creating 26,000 jobs and safeguard 5,240 jobs
▪ £95m to accelerate development UK Central HS2 interchange, £70m regenerate wider Curzon St. and Digbeth
area (Martinau Galleries development), £61m to develop creative and cultural hub - 30,000 jobs and 4,300 new
homes
▪ £80m investment in cultural sector (to adapt to COVID-19), creating and safeguarding 3,000 jobs
▪ £330m investment in transport infrastructure schemes: £101 m upgrading the metro scheme, £61m development
of 'sprint' bus network, £84m upgrade rail services, £86m accelerate local connectivity, 3,900 job years in
construction, improve journey times, improve access to cycle network
▪ £200m brownfield regeneration, delivery of 15,000 new homes, support 11,720 job years. £24m development of
new National Brownfield Institute
▪ £400m investment in affordable housing, 20,000 additional affordable homes, support 23,400 job years.
▪ £550 skills investment, help young people get apprenticeships, retraining, upskilling for jobs of the future
Heat Networks Project Pipeline (June 2020)
3 district heat networks are actively being supported, with a further 2 additional not being supported.
Carbon Emission Reduction Study for the City of Birmingham (June 2020)
This report undertaken by Anthesis covers the city of Birmingham. Emissions directly related to Council Scope 1, 2
and 3 activities and operations represent 417,772 tCO2e, just 8% of the total emissions of the city. Meanwhile Scope 3
incudes Schools, social housing, commercial properties and leased properties. Although the direct emissions that the
Council controls or has strong influence over is relatively small, the Council still has an important role in stimulating
and influencing action across the city.
The council declared an aspiration for the city to be net zero carbon by 2030 or soon after as a just transition allows;
ensuring communities are engaged in the process; protecting employment; ensuring a just transition and reducing
existing inequalities in the city. Policies and projects including the Birmingham Development Plan and Birmingham
Connected supporting the reduction of carbon emissions to mitigate against climate change in planning and
development, sustainable transport, heating and powering the city, research and partnerships.
Over 3,100 new homes have been built by Birmingham Municipal Housing Trust (BMHT) since 2009 to high design
specifications, at least EPC band B. In addition, 60,213 households (c14.7%) had ECO measures installed between
2013 and November 2019. The Birmingham District Heating network, first launched in 2007, has been expanded to
comprise three schemes serving a range of building types in the City Centre such as John Lewis, Aston Uni,
Birmingham Children's hospital plus council offices and homes. This currently utilised gas-fired CHP and gas boilers
and so switching this to a decarbonised source will be a priority.
A new Clean Air Zone ‘Brum Breathes’ was established within the ring-road being implemented in Summer 2020.
Together with this a cycling and walking investment plan for active travel is in place. Page 237

Page 6
Birmingham is a global centre for industry and commerce and the West Midlands is the UK’s largest centre for
manufacturing and engineering. Its distinctive strengths include low carbon transport innovation, data-driven health
and life sciences, and globally competitive supply chain firms. Advanced manufacturing and engineering – particularly
automotive – is a defining strength of Greater Birmingham’s economy, employing more than 36,500. Supply chain
capabilities encompass a range of technologies and sectors including advanced digital design, composites,
manufacturing metrology, metal precision manufacturing, advanced robotics, low emissions vehicles, research and
development on batteries, energy storage, powertrains, and light-weighting.
Sandwell Climate Change strategy (2020-2028)
The Action Plan covers six key themes:
▪ Council estate and operations - solar PV, refurbishment, streetlighting LEDs, electrification of fleet
▪ The built environment - energy efficient, new homes
▪ Transport - mode shift
▪ Waste - reduce waste generated, 65% recycling target
▪ Adaptation - plant 15,000 trees, carbon sequestration, heatwave response, GIS mapping
▪ Natural Capital
Sandwell Green Space Strategy (2020-2030)
This Green Space Strategy covers the period 2020 to 2030 aligned with the timeframe for the Sandwell Vision 2030. It
outlines 52 separate actions for the borough.
Repowering the Black Country (June 2020)
The purpose of this prospectus is to engage partners and funders in a compelling vision to make the Black Country
the world’s first zero carbon manufacturing cluster. The industrial vision for the Black Country has four interlinked
elements:
▪ 1. Identification and reconfiguration of strategically-significant supply chains within the region using circular
economy principles
▪ 2. Provision of local zero carbon energy infrastructure designed specifically to support these new industrial eco-
systems (zero carbon hubs)
▪ 3. Process optimisation within every individual element of the circular supply chains and hubs coupled with mass
engagement of businesses across the Black Country in the vision
▪ 4. Effectively dovetailing Black Country industrial development into the context of national decarbonisation and the
development of complementary clusters across the UK
Indicates growth and circular economy savings. These are very high, not in line with other reporting, and have not
been included in growth or business as usual analysis.
A-Z of Midlands Planning (September 2020)
With COVID-19 and a new planning white paper having far-reaching impacts on an arguably already complex, and
intricate planning system, WSP put together a series of regional planning guides to help navigate this complicated
world of planning.
These high-level, guide cover topics including housing delivery, planning performance, population change and
planning policy, and provide a visual overview that can be used to benchmark data against other cities.
There are aims for development of 200,00 homes by 2031, fuelled by an investment in construction skills
development, promotions of brownfield remediation (although there are issues concerning viability & deliverability)
fund and development of a 'design charter'. Page 238

Page 7
National Centre for the Decarbonisation of Heat (September 2020)
The proposed National Centre for Decarbonisation of Heat (NCDH) can allow the UK to lead in commercialising low
carbon heat solutions. It argues that addressing heat decarbonisation is complex and requires a full ‘systems’
approach. The Centre (based at Tyseley Energy Park) will for the first time bring all aspects of this approach together
under a physical centre, convening industry around goals. The 6 core elements will include:
▪ 1. Start-up incubator (called D4E)
▪ 2. Digital manufacturing accelerator
▪ 3. Adjacent 1,000 real-home trial area (Living Lab)
▪ 4. Skills and training academy
▪ 5. Standards & verification coordination
▪ 6. Green Finance Institute strategic alliance
West Midlands Regional Energy System Operator – RESO (October 2020)
The RESO will provide a detailed design for a smart local energy system covering Coventry, a city of 360,000 people,
with a business model for rapid rollout of similar designs across the West Midlands and UK. The design will support
Coventry's zero carbon policy objectives and show 25% bill reductions for citizens. It will demonstrate the immediate
replicability and robustness of our approach by generating a preliminary design for East Birmingham and North
Solihull, home to nearly 300,000 people
The delivery partnership brings together local infrastructure providers and authorities including Cadent Gas, Western
Power Distribution, Transport for the West Midlands, Coventry City Council and the West Midlands Combined
Authority, two universities, one large company and three SMEs.
A regional market system will be developed which enables cross-vector real time trading between gas, electricity and
transport assets.
Page 239

Page 8
Growth, Carbon & Economy
West Midlands Local Industrial Strategy (May 2019)
The Local Industrial Strategy for the West Midlands builds on the heritage of the region’s manufacturing, research and
technology sectors. The strategy sets out how the West Midlands will take advantage of the incredible skills,
infrastructure and innovation of the region. Most pertinent is the outlook on the future of mobility:
▪ West Midlands aiming to deploy first fully operational connected autonomous vehicles in the region in advance of
2022 Commonwealth Games
▪ Manufacturing steer towards batteries, connected autonomous vehicles and electric powertrain components -build
on current manufacturing expertise and supply chain strengths
▪ £20m future mobility zone (between Birmingham, Solihull & Coventry) government investment
There are also commitments to have the highest electric vehicle adoption & connected autonomous vehicles (CAV)
share of vehicle use anywhere in UK, to be the national centre for CAV, electric motor manufacture and supply chains
for the full range of EVs.
Setting Climate Change Commitments for West Midlands Combined Authority Area (June 2019)
This report by the Tyndall Centre provides an overview of WMCA advisory climate change targets and carbon budget
figures, derived from Paris agreement commitments. The recommended carbon is budget based on a 'grandfathering'
(most widely applicable regime within UK) allocation regime for sub-dividing UK sub-national energy CO2 only carbon
budget - one common approach ensures consistency across LAs, and to ensures total of LAs budgets does not
exceed UK budget (i.e. avoid LAs choosing allocation regime which allows them the largest carbon budget).
Key targets include:
▪ 1) Stay within a cumulative CO2 emissions budget of 126 MtCo2 for 2020-2100
▪ 2) Initiate immediate CO2 mitigation programme - to deliver annual emissions reduction rate averaging 13.4%
▪ 3) Reach zero or near zero carbon by 2041
If aviation and shipping emissions continue to increase, they will take an increasing share of UK carbon budget.
Report recommends WMCA consider strategies for significantly limiting growth in these areas.
WMCA State of the Region (July 2020)
This is the most recent annual overview report of the region's current economic and social standing, with particular
focus on the impact of covid-19. The geographic make-up of the region includes the 3-LEP area (Greater Birmingham
& Solihull, the Black Country, Coventry & Warwickshire), three cities (Birmingham, Coventry, Wolverhampton), four
boroughs (Dudley, Sandwell, Solihull, Walsall). Included are details of regional progress on each of the UN
Sustainable Development Goals, with figures surrounding economics/commercial growth, employment & business,
demographics
Key activities identified include:
▪ West Midlands Green Financing
▪ West Midlands Clean Growth Challenge
▪ WM Circular Economy Taskforce
▪ Community Green Grants
▪ Reinforcing the region's energy infrastructure to support green growth
▪ Active Travel
▪ Urban Transformation Fund (Brownfield sites)
▪ Communications and behaviour change
Page 240
Page 9
Housing
WMCA Zero Carbon Homes Charter (September 2020)
WMCA’s Zero Carbon Homes Charter frames WMCA and its partners’ commitment and long-term objectives to deliver
zero carbon homes in the region by 2025. The Charter will be incorporated into WMCA's Single Commissioning
Framework, defining WMCA's aspirations for new zero carbon development and setting out the approach it would like
to see those seeking WMCA investment to undertake.
Principle 1: Zero Carbon Regional Ambition
▪ All new developments are net zero carbon.
▪ Commitment to work together with partners (developers, housebuilders, community) to deliver zero-carbon
growth.
▪ Deliver high-quality zero carbon homes (based on UKGBC definition addressing operational energy).
▪ Nominate zero-carbon champions to lead on specific principles.
Principle 2: Sustainable Growth
▪ Spatial planning/site allocation considers sustainable development.
▪ Ensure sustainable density and connectivity.
▪ Work towards low-carbon mobility, transit-oriented development, promote a shift to active travel modes of
transport.
▪ New development support sustainable growth within the West Midlands.
Principle 3: Energy Efficiency and Water Saving
▪ Energy efficiency is the most effective long-term guarantee to get a low-carbon emission housing stock.
▪ Build homes that require no heating (hook for Route map to have a minimum energy efficiency standard for its
building fabric/space heating demand based LETI/RIBA targets).
▪ Optimise fabric performance. Through passive design and high insulation, achieve a low space heating demand.
▪ Reduce hot water demand, adopt heat recovery solutions and conserve water (low water use fittings reduce
energy demand associated with hot water).
▪ Express wider benefits such as saving money for residents and reducing impact of new homes on water demand
in the region.
▪ Step change to include unregulated emissions (appliances etc).
Principle 4: Decarbonising Heating Systems
▪ Use of electric-led solutions with efficient heat pumps.
▪ Invest in decentralised district energy options beyond individual solutions and encourage community-wide energy
solutions.
▪ Explore data-driven energy systems and smart dynamic energy networks
▪ Supported by decarbonisation of the grid.
Principle 5: Homes Fit for the Future
▪ Environment modelling to check thermal comfort, avoid over-heating (and address UHI).
▪ Ensure data-driven smart systems, monitoring and POE (link with reducing maintenance costs).
▪ Circular principles for construction, reduce waste and reuse materials. Building in layers principle. This has an
added benefit of reducing upfront embodied carbon.
▪ Flexibility/adaptability and climate resilience. Building homes fit for the future.
— Build in flexibility and adaptability to embed future technological innovation.
Principle 6: Maximising Renewable Energy Generation
▪ Include off-site and on-site renewable generation:
— Invest in PVs (individual solution).
— Invest in large-scale renewable energy networks.
— Encourage community- based energy solutions.
— Benefits: Provide competitive price and local supply of renewable energy.
▪ Complement with battery storage and smart dynamic energy grid.
Page 241

Page 10
▪ Carbon offsetting (based on carbon neutrality definition of first reduce then offset). Offsetting to be clearly stated
as a last resort in Charter.
Principle 7: Innovative Supply Chains
▪ Short-term acceleration of construction supply chain to deliver zero-carbon homes.
▪ Use procurement powers to strengthen and support local zero carbon supply chain.
— Embed zero carbon requirements in procurement.
▪ Early engagement and partnerships with supply chains to deliver zero-carbon homes.
▪ Embed innovation in construction including MMC/AMC.
Principle 8: Collaboration and Knowledge-Sharing
▪ Use WMCA power as an anchor institution to boost collaboration and knowledge-sharing and maximise lobbying
powers.
▪ Set up a learning feedback loop to learn from first houses delivered. Ensure proper monitoring to improve future
delivery.
— Potential to set up an industry forum to share knowledge, learning and feedback.
— Provide quantitative data on carbon savings/cost uplift to inform future projects.
▪ Create knowledge schemes:
— Build skills in Passivhaus standards, renewable energy, innovative financing mechanisms, alternative delivery
models to accelerate delivery of zero carbon homes.
— Training for optimal use of heat pumps and other technologies (still a lot of questions around operational heat
pumps).
▪ Pool resources and funding.
— Potential to set up a carbon fund that can be used to support developers that want to go further (an
innovation-led fund).
— Explore innovative financing mechanism for zero-carbon interventions.
Principle 9: Zero-Carbon Policy
▪ Longer-term capacity-building of West Midlands economic sectors to support wider transition to zero-carbon.
▪ Develop strong policy that support transition to zero-carbon (enabling policy landscape).
— Added benefit of providing certainty to housebuilders to build zero-carbon homes.
▪ Engage with regional businesses to capitalise on low-carbon opportunities, boost R&D and pace of technological
innovations.
— Link with LEPs, WM2041 aspirations, and regional industrial strategy.
▪ Support a green new deal for West Midlands.
— Boost productivity and earning power in a clean and inclusive way.
— Support reskilling and employment (through policy and funding).
— Provide funding to businesses to support zero-carbon projects.
Principle 10: Pilot Projects and Energy Innovation Zones
▪ Embrace low-carbon innovations to help the shift towards zero-carbon.
— Explore potential of new technologies (AI, V2G, battery storage, solar tiles etc.)
▪ Designate Energy Innovation Zones.
▪ Commit to low-carbon innovation regional pilot projects.
▪ Set up low-carbon innovation hub.
— Use previous best practice project in area as first case studies to inform pilot projects.
▪ Launch innovation challenges."
Principle 11: Community Engagement
▪ Engage community to adopt sustainable behaviours.
— Reduce energy use, identify where energy is waste (implement POE) and explain benefits (save money/fuel
poverty).
▪ Engage communities with new tech (proper use).
— Link to white paper and move towards digitalisation.
▪ Maximise social value (introduce SROI), social equity, ensure everyone benefits from sustainable growth.
Principle 12: Community Stewardship Page 242
Page 11
▪ Support local community ownership models/alternative models: community companies, CICs etc.
— Example: Ownership of solar farm etc.
▪ Support community-led financing models: crowdfunding, community share issues etc.
▪ Promote shared ownership/local asset management approaches"
WMCA Route to Zero Carbon Homes (October 2020)
This baseline gap analysis has been carried out by Useful Projects. This analysis assesses the region’s programme of
housing delivery and, based on current standards, their carbon performance. Scenarios for achieving zero carbons
are modelled for the pipeline of homes that are planned to be delivered in the region from 2020 to 2031. This includes
an appraisal of the CO2 emission and costs associated with closing the gap between current performance and zero
carbon. As part of the baseline study, an interactive tool has been developed so that WMCA can test alternatives and
update its pathway to zero carbon as new information comes forward.
This study focuses on the 219,038 new homes being delivered in the region, to be defined as ‘WMCA area’, by 2031.
It focuses on residential properties and does not address retrofitting of existing homes, which is being covered in a
separate workstream led by Energy Capital.
Useful Projects conducted a review of the policy landscape across the 17 local authorities within WMCA and found
that:
▪ All local authorities encourage developers to maximise sustainability within development, where it is viable.
▪ Standards such as BREEAM Excellent, Code for Sustainable Homes (above level 3) and Building for Life are
specifically mentioned in policy document for the local authorities.
▪ Specific policies encourage resource use minimisation including reducing carbon emissions, water and energy
consumption. Local authorities have adopted ambitious aspirations but have not set specific targets in terms of
CO2 emissions or resource use minimisation.
▪ All local authorities encourage high-quality building standards with some mentions of enhancing insulation and
airtightness standards. None specifically mention Passivhaus standards.
▪ All local authorities encourage on-site renewable energy generation and the use of low carbon technologies to
help reduce carbon emissions and increase energy resilience.
Page 243

Page 12
Jobs & Skills
See separate appendices on Jobs and Skills.
Page 244

Page 13
Transport
Movement for Growth (June 2016)
This is the West Midlands Strategic Transport Plan which covers the five challenges and needs around an effective
transport system; Economic Growth and Economic Inclusion, Population Growth and Housing Development,
Environment, Public Health and Social Well-Being. The objectives break down into the following:
▪ ECON1 To support growth in wealth creation (GVA) and employment (jobs) in the West Midlands Metropolitan
Area, as a prized national economic asset.
▪ ECON2 To support improved levels of economic well-being for people with low incomes in the West Midlands
Metropolitan Area to help make it a successful, inclusive, European city region economy.
▪ POP1 To help meet future housing needs, by supporting new housing development in locations deemed
appropriate by local planning authorities, following their consideration of sustainable development criteria.
▪ ENV1 To significantly improve the quality of the local environment in the West Midlands Metropolitan Area.
▪ ENV2 To help tackle climate change by ensuring large decreases in greenhouse gas emissions from the West
Midlands Metropolitan Area.
▪ PUBH1 To significantly increase the amount of active travel in the West Midlands Metropolitan Area
▪ PUBH2 To significantly reduce the number and severity of road traffic casualties in the West Midlands
Metropolitan Area
▪ PUBH3 To assist with the reduction of health inequalities in the West Midlands Metropolitan Area
▪ SOC1 To improve the well-being of socially excluded people.
TfWM Transport Briefing Notes (October 2016)
This document builds upon ‘Movement for Growth’ to outline what is needed in each of the four tiers
▪ National and Regional Tier - National highway connections, based on Highways England’s strategic highway
network of motorways and trunk roads. National and regional passenger rail services and coach services, rail
freight capacity and rail freight interchanges.
▪ Metropolitan Tier - An integrated Metropolitan Rail and Rapid Transit Network (Rail, Metro and Sprint Bus Rapid
Transit) with high quality main centre interchanges and supporting park and ride provision.
▪ Local Tier - High quality local bus services integrated with the rail and rapid transit network, accessible transport,
local roads, local cycle networks integrated with the Strategic Cycle Network and attractive, safe conditions for
walking and cycling.
▪ Smart Mobility Tier - Intelligent mobility services to help make the most of transport capacity and help inform
people of the travel options available to them. This includes the development and delivery of a trial “Mobility as a
Service” (MaaS) initiative
The Road to Zero Next steps towards cleaner road transport and delivering our Industrial Strategy (July 2018)
This strategy is built around a core mission: to put the UK at the forefront of the design and manufacturing of zero
emission vehicles and for all new cars and vans to be effectively zero emission by 2040. These bold ambitions need to
be matched by bold action which can only achieve them with:
▪ adequate vehicle supply
▪ a strong consumer base and the right market conditions
▪ a fit for purpose infrastructure network
Birmingham Clean Air Zone Full Business Case (December 2018)
This document provides the business case for the clear air zone. While the benefits are primarily focussed around air
quality impacts, wider benefits of reduce GHG emissions are also acknowledged.
Page 245

Page 14
WMCA Cycling Charter (June 2019)
The Charter aims to raise levels of cycling across the West Midlands Metropolitan area to 5% of all trips by 2023. This
represents a 400% increase in cycling journeys from the 1% baseline. This ten-year target is not the end of a journey
but a start – to where we see the West Midlands where cycling is naturally commonplace. By 2033, we want to raise
cycling to 10% of all trips.
▪ Leadership - A high-profile local cycling champion, committed Leadership, leadership at all levels
▪ Cycling Network - A high quality and coherent cycle network across the West Midlands for commuting and local
trips that meets the needs of all levels of cyclists. The needs of all road users, including cyclists, are considered
from the outset. Through the Planning Process, we will ensure developers cater for the needs of cyclists. Cycling
will be better integrated with public transport. The promotion and encouragement of an extension of 20mph speed
zones where appropriate in urban areas.
▪ Promoting - Affordable (and free where possible) cycle training available to all adults and children. Safely sharing
our roads. An integrated marketing approach to increasing cycling across the region.
▪ Funding - Funding and resources will be secured. Funding will be sought to deliver a high-quality strategic cycle
network across the region. Cycling will receive a ‘fair share of the pot’. Co-ordination of resources and expertise
from a range of partners.
Midlands HS2 Growth Strategy 2020 (2020)
This document looks to build on the original ‘Midlands HS2 Growth Strategy’ that was submitted to Government in
April 2015. The original submission outlined key aspirations that the region had as it looked to capitalise on the
construction of HS2. The approach considers both the short- and long-term needs of the region, ranging from our
immediate response to repair the economic and social damage from COVID-19 through the delivery of the West
Midlands’ recovery plan, to their role in the global commitment to combat climate change.
Levelling up - HS2 is turbocharging the levels of employment and investment in the West Midlands. These economic
benefits will be seen in new jobs, improved places to live, work and visit, and strengthened economic outlook for the
region and the UK. We now have the opportunity to work together with HS2 to ensure that our plans can progress in
parallel and bring forward the economic benefits, while reducing the cost to the taxpayer through public private
funding.
Covid Recovery - By advancing our existing development plans, we have the opportunity to accelerate and maximise
the benefits of HS2. This will allow the government to assist in our efforts to rebuild and recharge the West Midlands
economy, bringing forward more than 16,000 jobs, build more than 4,000 new homes and deliver an instant boost to
the economy of more than £250m.
Climate Change - HS2 through the greener travel it unlocks is critical to the UK’s response to global warming,
including the net zero target of 2050 and the West Midlands target of 2041. The released rail capacity is essential to
our efforts to switch people into public transport, improving our local train services. At the same time HS2 will provide
the rail paths for freight, enabling the UK to take 2.6m lorries off the roads each year.
Phase 2 - The full benefits of HS2 come from the whole network. It is essential that Phases 2a & 2b are delivered in
full as soon as possible, directly linking Birmingham, Nottingham, Sheffield, Manchester, and Leeds, to create an
economic area equivalent to Germany’s North Rhine-Westphalia. In addition, the 60 miles of high-speed track, which
will link the West Midlands to Crewe should be utilised to bring the forward benefits of HS2 to the West Midlands,
North West and Scotland.
Strong Relationships - Delivering HS2 in the region has seen palpable progress in terms of collaborative working
between HS2 and the West Midlands delivery partners. A faster, more transparent and joined-up decision making
process, facilitates more efficient use of resources both by HS2 and other public and private sector partners, reducing
delays and costs.
Page 246

Page 15
Recommendation One: That this partnership approach increases further, building on the groups established, to
ensure engagement at the critical junctures between HS2 and the regional plans, which will deliver the wider
economic benefits of the programme.
Interregional collaboration - The scale of the impact of HS2 in the region has led to the West Midlands becoming a
testbed for the delivery of the project. This has led to a shared understanding on the importance of regional ambitions
and how they build upon the work of HS2. The vision, governance and funding mechanisms that have been developed
form a blueprint for the regions benefiting from future phases of the HS2 network.
Recommendation Two: That going forward there is more importance placed on wider, more collaborative work
between the key regions along the route, enabling the learnings from Phase One to be adopted in Phase Two.
National Governance - The recent Oakervee Review revealed the need to ensure transparency, clarity, and
openness and that there needs to be a new approach to the delivery of HS2, not just in the Midlands, but across the
entire trace. The review also highlighted that there were gaps in our evidence base that in reality mapped directly back
to some of the strategic challenges that we are faced with in not only the delivery of HS2 within the Midlands, but also
in addressing wider national context.
Recommendation Three: That a National HS2 Growth Delivery Board (NHGDB) be formed, that would look to
provide strategic guidance and advice across the entire HS2 programme and would give an objective view on how the
programme was progressing. The NHGDB would offer direction and clarity to the existing Places Group. Acting as a
‘unitary board’ the NHGDB would be expected to act in the best interests of the nation as a whole and to have an
impartial input into the decision-making process.
Environment - HS2 has the potential to be a catalyst for the green revolution that is required for the nation to meet its
climate targets and shape the emerging economies of the 21st century. The opportunities HS2 enables are much
greater than existing approaches, highlighting the need for further thinking in this area.
Recommendation Four: We recommend that we work directly with DEFRA to shape future policy to detail how
across the UK, regions can exploit the wider impacts and opportunities, beyond the trace of HS2, to deliver the
essential improvements to the and environment and green economy
TfWM ULEV Strategy (January 2020)
Cenex was commissioned by Transport for West Midlands (TfWM) and its partner authorities to support the creation of
an evidence-based region-wide Ultra-Low Emission Vehicle Strategy. The objectives of the study were to:
▪ Frame the strategy within the wider context of industrial strategy, alternative fuels, skills provision and traffic
congestion;
▪ Provide a clear analysis of the current direction of travel;
▪ Develop evidenced projections of the development of the ULEV market;
▪ Analyse the opportunities this presents to TfWM within its footprint; and
▪ Review the options available to minimise barriers and challenges.
Climate Emergency and the Transport Policy Gap (February 2020)
Three challenges in the implementation/development/planning of the West Midlands transport system:
▪ Further climate change risks
▪ Accounting for 'locked-in' impacts of climate change
▪ Moving around people/goods while meeting international targets to limit global warming
Government policy focuses on use of ultra-low/zero emissions vehicles to reduce GHG emissions. CCC
recommended this should be furthered to all new cars/vans being 'effectively zero emission' by 2030. Stronger policies
needed to reduce growth in demand for travel - shift to ULEVs. insufficient.
Key limits: Page 247

Page 16
▪ pace of change: lower emission vehicles will not 'permeate the vehicle fleet rapidly enough'.
▪ production carbon footprint: EV production is more carbon intensive than normal vehicle production- 2-6 years
before these are outweighed by EV emission savings
▪ increases to consumption - fuel duty frozen, larger vehicles boom. More demand for larger vehicles could limit
carbon savings.
Decarbonising Transport Setting the Scene (March 2020)
The Government is developing an ambitious plan to accelerate the decarbonisation of transport. The Transport
Decarbonisation Plan (TDP) will set out in detail what government, business and society will need to do to deliver the
significant emissions reduction needed across all modes of transport, putting us on a pathway to achieving carbon
budgets and net zero emissions across every single mode of transport by 2050.
Whilst there have been recently published strategies to reduce GHG emissions in individual transport modes, the
journey to net zero demands that transport as a whole sector moves further, faster. The TDP will take a coordinated,
cross-modal approach to deliver the transport sector’s contribution to both carbon budgets and net zero.
Technical measures, such as the need for rapid renewal of the road vehicle fleet with zero emission vehicles, are well
understood and will deliver substantial reductions in GHG emissions over the long term. But to deliver the reductions
needed now and set us on a credible pathway to net zero, we also need to consider how we travel and how our goods
and services reach us today. This is needed in parallel to the rapid development and deployment of clean technology.
The six priorities for the Transport Decarbonisation Plan are:
Accelerating modal shift to public and active transport
▪ Help make public transport and active travel the natural first choice for daily activities
▪ Support fewer car trips through a coherent, convenient and cost-effective public network; and explore how we
might use cars differently in future
▪ Encourage cycling and walking for short journeys
▪ Explore how to best support the behaviour change required
Decarbonising how we get our goods
▪ Consider future demand and changing consumer behaviour for goods
▪ Transform ‘last-mile’ deliveries – developing an integrated, clean and sustainable delivery system
▪ Optimise logistics efficiency and explore innovative digitally-enabled solutions, data sharing and collaborative
platforms
UK as a hub for green transport technology and innovation
▪ Utilise the UK's world-leading scientists, business leaders and innovators to position the UK as an internationally
recognised leader of environmentally sustainable technology and innovation in transport
▪ Build on expertise in the UK for technology developments and capitalise on near market quick wins
Decarbonisation of road vehicles
▪ Support the transition to zero emission road vehicles through:
— regulatory framework
— strong consumer base
— market conditions
— vehicle supply
— refuelling and recharging infrastructure
— energy system readiness
▪ Maximise benefits through investment in innovative technology development, and development of sustainable
supply chains
Place-based solutions
▪ Consider where, how and why emissions occur in specific locations
▪ Acknowledge a single solution will not be appropriate for every location Page 248

Page 17
▪ Address emissions at a local level through local management of transport solutions
▪ Target support for local areas, considering regional diversity and different solutions
Reducing carbon in a global economy
▪ Lead international efforts in transport emissions reduction
▪ Recognise aviation and maritime are international by nature and require international solutions
▪ Harness the UK as a global centre of expertise, driving low carbon innovation and global leadership, boosting the
UK economy
Black Country ULEV Strategy (May 2020)
The Black Country aims to lead the West Midlands on the road to net-zero by accelerating and amplifying the EV
transition in anticipation of a 2035 ban on the sale of conventional vehicles. The objectives of the study were to:
▪ Build upon the existing Transport for West Midlands ULEV Strategy Report by Cenex;
▪ Baseline the current Black Country situation;
▪ Develop and analyse scenarios projecting the number of EVs, infrastructure, energy demand and grid capacity
constraints;
▪ Calculate the benefits associated with these scenarios;
▪ Create and agree a five-year ULEV vision; and
▪ Outline an implementation plan to deliver the vision.
Traction Decarbonisation Network Strategy (July 2020)
The Rail Industry Decarbonisation Taskforce has identified three possible traction technologies which are sufficiently
mature to replace diesel – battery, electric and hydrogen. Each of these technologies has different technical
capabilities which mean that not all are suitable for all types of rail services. That being said, for the vast majority
(75%) will be decarbonised via electrification of the railways including the main routes within the West Midlands.
Accelerating mode shift to public & active transport (July 2020)
This presentation by Jillian Anable (University of Leeds) outlines three routes to travel demand reduction and therefore
reducing GHG emissions:
▪ Avoid: reduce the distance people need to travel
▪ Shift: Shift toward sustainable travel
▪ Improve: Improve emissions performance of vehicles
Research shows that more cycling/public transport use doesn't necessarily mean lower car use and doesn't guarantee
a smaller carbon footprint. In addition, destination shift is important and should be considered in tandem with mode
shift.
TfWM Carbon Calculator and Scenarios (August 2020)
This report by Atkins was commissioned to inform the LTP review by helping to extend understanding of:
▪ The scale of the transport decarbonisation challenge as expressed in the different net zero targets and
trajectories;
▪ The carbon impact of different approaches to achieving transport decarbonisation and the potential balance
required between technological and behavioural measures; and
▪ The implications of areas of uncertainty in the projections of transport emissions
The report concludes that there is a need for rapid and substantial action – estimated emissions already exceed the
trajectory for the WMCA 2041 net zero target, and the position is forecast to worsen through the 2020s.
Page 249

Page 18
Electrification of public and private transport is key. The greater energy efficiency of electric vehicles and projected
rapid decarbonisation of electricity supply means that efficient use of electric vehicles will maximise the amount of
mobility that can be maintained within the limits of the decarbonisation targets.
However, mitigation will be required to ensure that electrification of the fleet does not generate inequality issues by
limiting car mobility to the use of new, expensive vehicles. A move to shared mobility with pay as you go access to
electric vehicles could be one approach to address this; and/or cause an increase in vehicle production emissions by
accelerating the turnover of the fleet.
A substantial reduction in car vehicle kilometres will be required to meet the targets. An equivalent effect to a
reduction in car vehicle kilometres could also be achieved by reducing the size and therefore energy requirements of
the vehicles used. This would involve reversing the current trend to larger, less energy efficient vehicles such as SUVs
and a move towards the use of much smaller vehicles (micro cars and smaller) to retain personal mobility where
public transport is not viable, whilst reducing the energy and emissions intensity of each journey.
The reduction in passenger kilometres could also be lower than the required reduction in car vehicle kilometres if
occupancy increase and mode shift to more efficient modes is achieved. Shared mobility could again play a role in
providing fair access to limited available mobility. Changes in trip patterns and numbers are also likely to be required
to contribute to the change, given the scale of vehicle kilometre reduction required. Public transport could not
accommodate all of the displaced journeys, even if it served the right movements.
Page 250

www.wsp.com
APPENDIX B – STAKEHOLDER ENGAGEMENT
1. STAKEHOLDER LIST AND MAPPING
An initial exercise was undertaken with West Midlands Combined Authority (WMCA) to map the
key stakeholders who were prioritised for engagement with as part of the WM2041 Five Year Plan.
The following list outlines the organisations that were identified within the stakeholder map to
initially be consulted with.
▪ Accord Housing Association ▪ Network Rail
▪ Birmingham and Black Country Wildlife Trust ▪ Newman University
▪ Birmingham City Council ▪ North Warwickshire Borough Council
▪ Birmingham City University ▪ Nuneaton and Bedworth Borough Council
▪ Birmingham International Airport ▪ Redditch Borough Council
▪ Birmingham Metropolitan College ▪ Royal Society for the Protection of Birds – RSPB
▪ Birmingham Youth Strike 4 Climate ▪ RSSB
▪ Black Country Chamber of Commerce ▪ Rugby Borough Council
▪ Black Country Consortium ▪ Sandwell College
▪ Black Country Local Enterprise Partnership ▪ Sandwell Metropolitan Borough Council
▪ Cadent Gas ▪ Severn Trent
▪ Cannock Chase District Council ▪ Shropshire Council
▪ Cemex ▪ Shropshire Housing Group
▪ Citizen Housing ▪ Sixth Form College Solihull
▪ City College Coventry ▪ Solihull Metropolitan Borough Council
▪ City of Bristol College (Campus in Knowle) ▪ Stourbridge College
▪ City of Wolverhampton ▪ Stratford-on-Avon District Council
▪ Client Earth ▪ Sustainability West Midlands
▪ Climate Action Network West Midlands ▪ Sustainable Housing Action Partnership
▪ Colleges West Midlands ▪ Tamworth Borough Council
▪ Commonwealth Games ▪ Telford and Wrekin Council
▪ Coventry and Warwickshire Chamber of
Commerce ▪ The Federation of Small Businesses
▪ Coventry and Warwickshire Local Enterprise
Partnership ▪ Trades Union Congress
▪ Coventry City Council ▪ Transport for West Midlands
Page 251
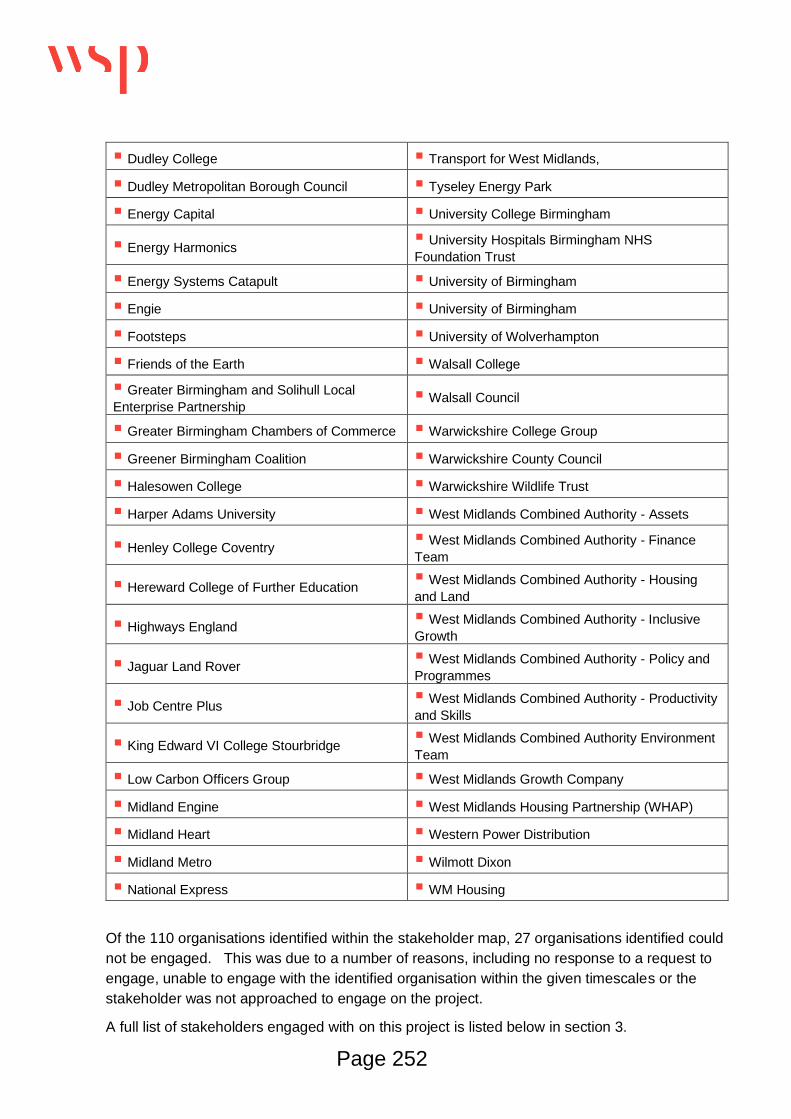
Page 2
▪ Dudley College ▪ Transport for West Midlands,
▪ Dudley Metropolitan Borough Council ▪ Tyseley Energy Park
▪ Energy Capital ▪ University College Birmingham
▪ Energy Harmonics ▪ University Hospitals Birmingham NHS
Foundation Trust
▪ Energy Systems Catapult ▪ University of Birmingham
▪ Engie ▪ University of Birmingham
▪ Footsteps ▪ University of Wolverhampton
▪ Friends of the Earth ▪ Walsall College
▪ Greater Birmingham and Solihull Local
Enterprise Partnership ▪ Walsall Council
▪ Greater Birmingham Chambers of Commerce ▪ Warwickshire College Group
▪ Greener Birmingham Coalition ▪ Warwickshire County Council
▪ Halesowen College ▪ Warwickshire Wildlife Trust
▪ Harper Adams University ▪ West Midlands Combined Authority - Assets
▪ Henley College Coventry ▪ West Midlands Combined Authority - Finance
Team
▪ Hereward College of Further Education ▪ West Midlands Combined Authority - Housing
and Land
▪ Highways England ▪ West Midlands Combined Authority - Inclusive
Growth
▪ Jaguar Land Rover ▪ West Midlands Combined Authority - Policy and
Programmes
▪ Job Centre Plus ▪ West Midlands Combined Authority - Productivity
and Skills
▪ King Edward VI College Stourbridge ▪ West Midlands Combined Authority Environment
Team
▪ Low Carbon Officers Group ▪ West Midlands Growth Company
▪ Midland Engine ▪ West Midlands Housing Partnership (WHAP)
▪ Midland Heart ▪ Western Power Distribution
▪ Midland Metro ▪ Wilmott Dixon
▪ National Express ▪ WM Housing
Of the 110 organisations identified within the stakeholder map, 27 organisations identified could
not be engaged. This was due to a number of reasons, including no response to a request to
engage, unable to engage with the identified organisation within the given timescales or the
stakeholder was not approached to engage on the project.
A full list of stakeholders engaged with on this project is listed below in section 3.
Page 252

www.wsp.com
2. APPROACH
2.1 STAGES OF ENGAGEMENT
During the stakeholder mapping process, it was identified that there needed to be two stages of
engagement carried out within this limited timescale;
1) the listening and information gathering stage and;
2) the testing stage.
The first stage of engagement, to listen, was the largest piece of engagement. Typically, this
included:
▪ an introduction to the project; and
▪ some initial information gathered around
o organisational net zero aspirations;
o regional programmes and projects;
o areas of focus; and
o barriers to implementation
The second stage of engagement, to present and test, the findings of the report with selected
groups. A set of standard questions were developed for engagement which were adapted as
appropriate for each stakeholder dependent upon their responses, type of organisation and their
areas of concern.
An initial Request for Information template (RFI) was developed for all seven constituent
authorities.
2.2 ENGAGEMENT CHANNELS
Due to the variety and number of stakeholders proposed to engage with, a number of different
stakeholder engagement channels were identified for participation, including (online) progress
meetings, 1-2-1s, workshops and surveys.
The choice of the engagement channel was influenced by the existence of established
meetings/forums that could be used for engagement. From this, the prioritisation rating was
established as part of the initial stakeholder mapping.
A standard set of questions were developed to guide conversation and engagement focusing on
four key focus areas:
1. Interventions
2. Jobs and Skills
3. Delivery Mechanisms
4. Resources
Those mapped stakeholders were initially contacted through existing networks, introduced through
existing contacts or contacted directly. Further detail is provided below on the types of
engagement channels.
Page 253
Page 4
▪ Regular progress meetings were used to inform and engage with existing stakeholders on
the progress of the project and to update and gain feedback upon the types of
interventions. The following regular meetings were periodically used for engagement:
o Project specific progress meetings with the West Midlands Combined Authority
Environmental team and additional less frequent progress meeting with the wider
West Midlands Combined Authority team
o Transport for West Midlands (TfWM);
o Presentations to the West Midlands Combined Authority Environment and Energy
Board and Energy Capital;
o Low Carbon Officers Group (LCOG); and
o Fuel Poverty Regional Retrofit (FPRR) programme working group
▪ One to one meetings included with but not limited to;
o Various Representatives from all 7 constituent local authorities (e.g. Sandwell MBC,
Walsall Council)
o Private organisations with a strong regional presence (e.g. Birmingham Airport,
Jaguar Land Rover (JLR), Cemex,)
o Representatives from Energy Capital Board (e.g. Cadent, Energy Systems
Catapult,)
o Specialist Interest organisations (e.g. WM Growth company, Severn Trent)
o Universities.
The Survey
An online survey was drafted that covered the four key focus areas. The survey included a 5-
minute presentation about the project and then the survey itself with a mixture of open text
response or fixed choice responses. The survey was used to ensure that feedback could be
received from those individuals or organisations that could not attend meetings or presentations
and to ensure a wider reach of feedback (in particular for end user organisations). The survey was
distributed through the following networks:
▪ West Midlands Combined Authority wider project team networks (to cascade to their own
Task forces and working groups, e.g. Fuel Poverty and Retrofit working group, led by
Energy Capital
▪ Low Carbon officers Group network
▪ Regional business networks including; Confederation for British Industry, Green Business
Clubs Network, Federation of Small Businesses, Chambers of Commerce
▪ The regions Local Enterprise Networks (LEP)
▪ Transport networks (e.g. Bus Operators Network, Logistics UK network)
▪ A number of organisations directly (e.g. WPD, Engie)
Page 254

Page 5
Presentation at existing networks/ meetings included:
▪ Sustainable Housing Association Partnerships (SHAP)
▪ Mayor’s Roundtable
Online Workshops
▪ West Midlands Sustainable Housing Association Partnerships (SHAP)
▪ Universities
▪ NGOs (including the Wildlife Trust, Natural England, Friends of the Earth)
3. STAKEHOLDER ENGAGEMENT
Overall, across the project 246 individuals were met, across 97 different organisations (some of
whom were not originally identified in the stakeholder map), through a variety of different
communication channels between October and December 2020. Due to the variety and number of
stakeholders proposed to engage with as part of the stakeholder map, a number of different
stakeholders’ engagement channels were identified for participation, including:
- Regular progress meetings;
- One to one virtual meetings;
- Online surveys;
- Presentation at an existing West Midlands network or meetings; and
- Virtual Workshops (specifically to present on the WM2041 Five Year Plan).
Individuals from the following organisations have been engaged with through progress meetings,
one to one virtual meetings, as part of an existing West Midlands network or meetings or as part of
virtual workshops:
Anthesis Leeds Beckett University
Ark Consultancy LEVC
Aston University Low Carbon Homes Ltd
Atkins Malvern Hills Community Led Housing Group
Barnsley council Mayors Roundtable
BBC Wildlife Trust Midland Heart
Birmingham and Black Country LEP (BBCLEP)
Midlands Connect
Birmingham Airport Midlands Energy Hub
Birmingham City Council Midlands Metro
Birmingham City University Natural England
Birmingham Open Spaces Network Rail
Black Country Housing Group NHF Page 255

Page 6
Bmet Orbit
Bournville & Cotteridge Ward Perkins&Will
Bournville Trust Pioneer Group
BRE Global Platform
Bromford Procure Plus
BT Red Pillar Group
C&W Wildlife Trust Rooftop Housing Group
Cadent RSPB
Calderdale MBC Rugby Borough Council
Canal and Rivers Trust Sandwell Metropolitan Borough Council
Climate Action Network West Midlands (CANWM)
Sandwell Metropolitan Borough Council
Cemex Severn Trent
Citizen Housing SHAP
Climate Change Members Steering Group Sandwell
Solihull College
Connected to Growth Solihull Community Housing
Coventry City Council Solihull Metropolitan Borough Council
Coventry University Sotherm SMS
Druids Heath and Monyhull Council Sustainable West Midlands
Dudley and Black Country Unesco Tamworth Council
Dudley College of Technology Transport for West Midlands (TfWM)
Dudley Council Totally Modular Limited
Environment Agency (EA) Tyseley Energy Park
EcoBirmingham University of Birmingham
Energy Capital University of Warwick
Energy Systems Catapult University of Wolverhampton
Engage Malvern University of Wolverhampton
EON Urban Growth Company
Footsteps Urban Splash
Forest of Mercia Tree Planting Walsall Council
Forestry Commission Walsall Housing Group (WHG)
Friends of the Earth Warwick Business School
Federation of Small Businesses (FSB) Warwickshire County Council
Greater Birmingham and Solihull LEP (GBSLEP)
Wearablecare
GDHV UK LTD West Midlands Combined Universities / University of Wolverhampton
Glen Dimplex Heating and Ventilation West Midlands Growth Company
Housing Plus West Midlands National Park
IOT West Midlands Combined Authority
Pick Everard Wolverhampton City Council
JLR Page 256
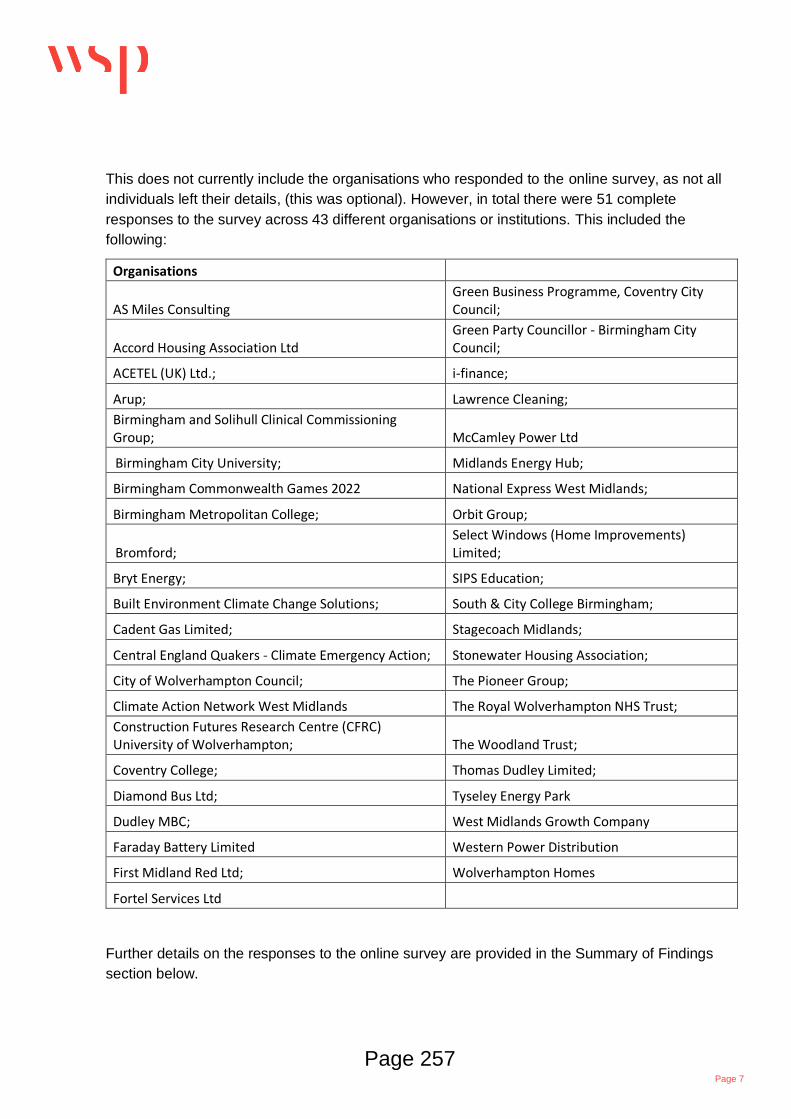
Page 7
This does not currently include the organisations who responded to the online survey, as not all
individuals left their details, (this was optional). However, in total there were 51 complete
responses to the survey across 43 different organisations or institutions. This included the
following:
Organisations
AS Miles Consulting Green Business Programme, Coventry City Council;
Accord Housing Association Ltd Green Party Councillor - Birmingham City Council;
ACETEL (UK) Ltd.; i-finance;
Arup; Lawrence Cleaning;
Birmingham and Solihull Clinical Commissioning Group; McCamley Power Ltd
Birmingham City University; Midlands Energy Hub;
Birmingham Commonwealth Games 2022 National Express West Midlands;
Birmingham Metropolitan College; Orbit Group;
Bromford; Select Windows (Home Improvements) Limited;
Bryt Energy; SIPS Education;
Built Environment Climate Change Solutions; South & City College Birmingham;
Cadent Gas Limited; Stagecoach Midlands;
Central England Quakers - Climate Emergency Action; Stonewater Housing Association;
City of Wolverhampton Council; The Pioneer Group;
Climate Action Network West Midlands The Royal Wolverhampton NHS Trust;
Construction Futures Research Centre (CFRC) University of Wolverhampton; The Woodland Trust;
Coventry College; Thomas Dudley Limited;
Diamond Bus Ltd; Tyseley Energy Park
Dudley MBC; West Midlands Growth Company
Faraday Battery Limited Western Power Distribution
First Midland Red Ltd; Wolverhampton Homes
Fortel Services Ltd
Further details on the responses to the online survey are provided in the Summary of Findings
section below.
Page 257

www.wsp.com
4. SUMMARY OF FINDINGS
4.1 REGULAR MEETINGS
The table below shows the organisations with whom regular meetings were held. Key points which arose during these meetings are also summarised under
four key categories: interventions, jobs and skills, delivery mechanisms and resources.
Organisation Interventions Jobs and Skills Delivery Mechanisms Resources
TfWM WM Transport Plan currently
being developed. Atkins are
developing a ‘Green Paper’.
Within this, modal change seen
as main method to reduce
emissions.
Carbon quantification tools in
progress of being developed.
Engagement key between transport
and net zero carbon.
Potential issue with lack of joined up
approach in timescales.
Pop up stakeholder engagement work
undertaken.
Resources: emphasised the need
to ‘stop talking about carbon
targets and start talking about
carbon budgets’. Concerns that
budgets will be exceeded;
transport reduction only option.
Energy Capital Looking at alternative fuels and
transport modes. Emphasise
need to not just focus on
electrification but also alternative
fuels.
ULEV programme and strategy
(in development).
Scaling up retrofit.
Overall Steering Group taking
strategic lead in this area.
3 PFER (Prospering from an
Energy Revolution) Innovate UK
sponsored projects: Coventry
RESO, Rugeley Zero Carbon
Housing Estate and Sandwell
Greenskies.
Antsy Clean Hub development.
Queries raised as to whether
new competencies needed.
One to ones with key stakeholders.
Existing partnership with energy sector
/ companies.
Regional Energy Strategy.
ULEV Strategy and Energy
Infrastructure Strategy also discussed.
Lobby activity on energy devolution
with University of Birmingham.
Felt there is no mandate for
decarbonisation and no overarching
strategy.
Queries relating to demand and
whether new powers are needed.
Queried whether central
Government need to be asked for
financial support. But caution also
raised about sharing MAC curve;
‘risk of politicians to focus on
certain projects which have
financial benefits rather than big
picture’.
Resources may be required for
the ULEV programme.
Queries raised regarding where
the public sector might be able to
add value and unlock barriers to
market development.
Needing to go beyond ROI.
Page 258

Page 9
Preparation of the energy system to
achieve decarbonisation needs
addressing. Query raised in relation to
whether certain partners should be
worked with.
Renewal of contracts.
Needs to be an ‘overall fundamental
shift in the way we work, not bits here
and there’.
Hydrogen potential also discussed with
reference to specific trials.
Electric infrastructure already at
capacity in some parts of the
Midlands.
Lobbying role important for CA;
rail industry finite budgets.
There is a need to understand
what happens to infrastructure
and how this is paid for.
West Midlands
Combined
Authority Energy
and Environment
Board
Consideration of supply chain
and local procurement key. As
are utilities.
Recognition of the value of
green spaces by people during
Covid discussed; ‘there has not
been equality of access to that
green space’.
Consideration of blue spaces
also discussed.
Key focus on landscape and
how this is ‘a feature of culture
and identity’.
Emphasis on the need for people
working together.
People action and behavioural change
is a key element.
Consistent message required to
engage people.
Financial cost and getting most
from investments.
Page 259

Page 10
4.2 WORKSHOPS
One-off workshops were also held. The organisations with whom these took place are listed in the below table as above with a summary of their responses in
relation to interventions, jobs and skills, delivery mechanisms and resources, where relevant.
Organisation Interventions Jobs and Skills Delivery Mechanisms Resources
Sustainable
Housing Action
Partnership (SHAP)
Fuel Poverty and Regional
Retrofit Programme (FPRRP) in
place.
Hydrogen unlikely until 2038.
Queries raised with regards to
placemaking and how this
should be factored in.
Switching off the gas network
(for hydrogen) may risk jobs
and existing manufacturers.
Importance of self-build community led
projects highlighted and engaging
people around new affordable homes.
Potential local hotspots of
shortfalls with regards to grid
capacity.
Concerns over the carbon budget.
WM Housing
Associations and
Partnerships
(WMHAP)
All respondents were acting on
retro-fitting stock and upgrading
where they can, but this is
limited based on availability of
technologies and existing stock
characteristics. Only one
respondent was already building
net zero carbon homes as part
of pilot.
The immaturity of low-carbon /
energy efficiency markets and
products were highlighted.
Many currently focusing on
fabric of existing homes and
improving EPC ratings.
There is a lack of knowledge
and training among current
workforces with regards to
design, delivery and
implementation of heating
and energy efficiency
technologies.
Some benefits may be achieved
through a combined delivery approach
but there is also a need to recognise
differences between different
organisations.
National energy infrastructure
highlighted as a potential barrier
or concern and as an area which
needs to be developed to enable
zero carbon houses to be reality.
Higher costs / subsidy and
investment requirements flagged
as another potential concern with
regards to delivery of zero carbon
homes.
Wildlife Groups
(including: Natural
England, Environment
Agency, Black Country
Consortium, Sandwell
Council, Coventry and
Some have set or are in the
process of setting net zero
carbon, or carbon neutral,
targets by specified years.
Some groups had not yet
established specific net-zero
Respondents were asked ‘how can we
make it easier for organisations to
support delivery of WM2041?’.
Key points:
Finance and funding structure
was highlighted as one of the
largest concerns / barriers to
delivery. Followed by:
infrastructure, technological,
Page 260

Page 11
Warwickshire Wildlife
Trust, Birmingham and
Black Country Wildlife
Trust, Dudley Council,
RSPB, Friends of the
Earth, Canal and
Rivers Trust,
Birmingham Open
Spaces Forum
(BOSF), SHAP,
Forestry Commission.
targets but are working towards
other green goals.
Regional projects initiatives:
Nature Recovery Network, WM
National Park, woodland / tree-
planting, Black Country Plan,
Black Country UNESCO Global
Geopark mentioned, for
example.
Most important opportunities for
achieving net zero in the region
believed to be: woodland and
tree planting alternative modes
of transport, industrial energy
efficiency and commercial
renewables.
- Becoming more open and
transparent
- Maximising engagement
- Clear leadership and coordination
- Provision of information and guidance
- Provision of resources (e.g. financial
support).
planning restrictions, legislation
and human resource.
West Midlands
Combined
Authority and
Universities
Meeting
Only one comment regarding
productivity knock on effect
and inclusivity effect –
multiplier effect (unsure to
what this relates)
West Midlands
Combined
Authority Policy
Working Group
Over 160 interventions in total
across the West Midlands
Combined Authority.
Actions plans are in place for 3
LEPs.
Atkins undertaking work with
TfWM.
Method of carbon accounting
and monitoring also being
looked into.
Query raised on the public sector’s role
in de-risking projects and sectors.
There is a need to consider systems
and leveraging private finance; and for
leadership from the West Midlands
Combined Authority.
MACC will help prioritise; but there is a
need to understand ‘what is palatable
as well as politically acceptable’.
Page 261
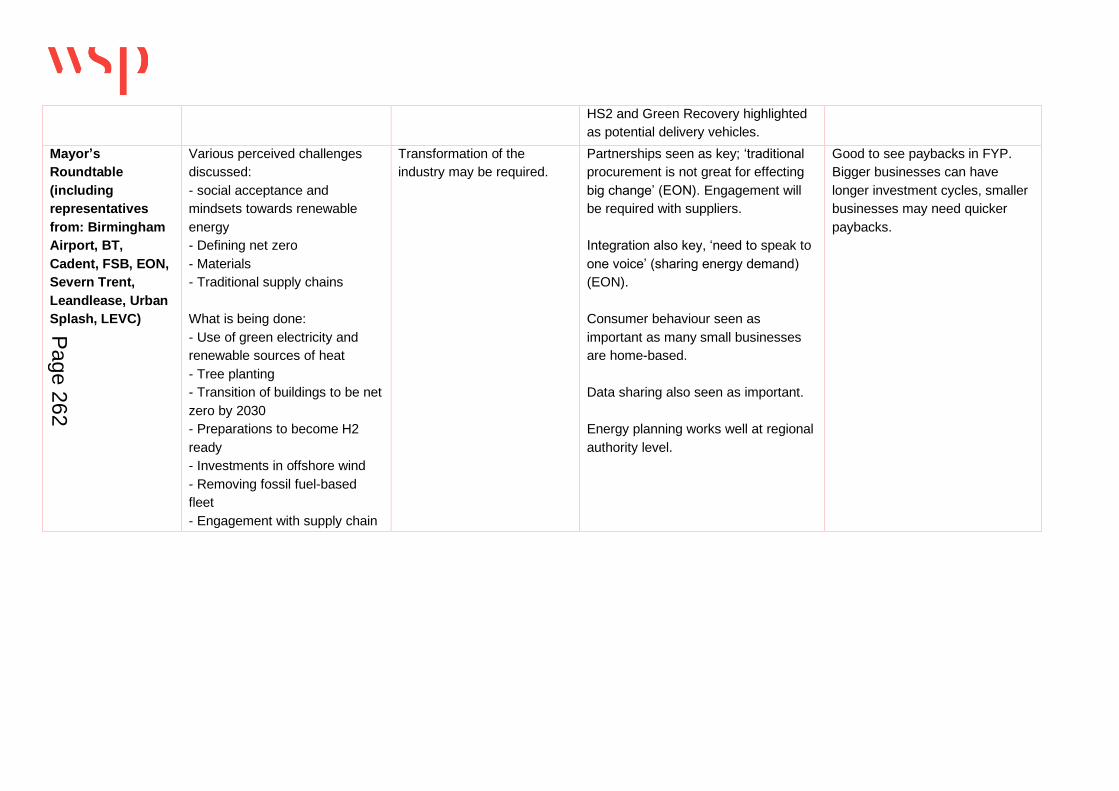
Page 12
HS2 and Green Recovery highlighted
as potential delivery vehicles.
Mayor’s
Roundtable
(including
representatives
from: Birmingham
Airport, BT,
Cadent, FSB, EON,
Severn Trent,
Leandlease, Urban
Splash, LEVC)
Various perceived challenges
discussed:
- social acceptance and
mindsets towards renewable
energy
- Defining net zero
- Materials
- Traditional supply chains
What is being done:
- Use of green electricity and
renewable sources of heat
- Tree planting
- Transition of buildings to be net
zero by 2030
- Preparations to become H2
ready
- Investments in offshore wind
- Removing fossil fuel-based
fleet
- Engagement with supply chain
Transformation of the
industry may be required.
Partnerships seen as key; ‘traditional
procurement is not great for effecting
big change’ (EON). Engagement will
be required with suppliers.
Integration also key, ‘need to speak to
one voice’ (sharing energy demand)
(EON).
Consumer behaviour seen as
important as many small businesses
are home-based.
Data sharing also seen as important.
Energy planning works well at regional
authority level.
Good to see paybacks in FYP.
Bigger businesses can have
longer investment cycles, smaller
businesses may need quicker
paybacks.
Page 262

Page 13
4.3 ONE-TO-ONE MEETINGS
As above, findings and key discussion points from the organisations with whom one-to-one meetings were also held are included in this section. All seven of
the West Midlands Combined Authorities constituent authorities were issued with a Request for Information (RFI) form to complete prior to one to one
discussion.
Organisation Interventions Jobs and Skills Delivery Mechanisms Resources
West Midlands
Combined
Authority – Various
including: Land
and Homes,
Productivity and
Skills, Inclusive
Growth, Finance
and Investment,
Strategic Transport
Board
Land and Homes: Zero Carbon
Homes by 2025 initiative
involving baseline gap analysis
and production of a Roadmap.
Skeleton Zero Carbon Homes
Charter.
Zero Carbon Home Officer
Working Group established and
Zero Carbon House Taskforce.
Inclusive Growth:
Focusing on East Birmingham
and North Solihull corridors.
Have developed a Social
Economy Business Plan,
focusing on social enterprises.
There is a Social Economy
Taskforce.
Community Energy Birmingham.
Finance and Investment:
There is a need to go beyond
‘business as usual’, current
committed actions ‘will only
move the dial a little’.
In data gathering, accounting for
projects where funding is likely.
Productivity and Skills: plans
and strategies already exist
e.g. Strategic Economic
Plan; a work recovery
programme ‘Recharge the
WM Plan’; a Local Industrial
Strategy; and the Fuel
Poverty and Regional Retrofit
Programme (FPRRP)
(includes productivity and
skills).
Need to engage with
universities.
Engagement with colleges;
‘all colleges should be a high
priority on the skills front’.
Jobs in region need to be
considered with relation to
cars. Region utilises a lot of
cars as well as
manufacturers them.
Need to focus on blue collar
jobs and upskilling whole
economy. Focus on inclusion
Planning White Paper – but still
‘vague’.
See existing plans and strategies listed
under Interventions.
Engagement with other organisations,
e.g. Greater Birmingham and Solihull
LEP, Birmingham City Council.
There is a need for a ‘structured
approach in particular to large industry
who are members of the Economic
Impact Group’.
Role of enabler with regards to
community leadership.
Creation of fund similar to Bristol City
Fund.
Consideration of crowd funding.
Importance of Natural Capital and
potential multi-benefits.
Cannot leave all to the private sector to
avoid people being ‘left behind’.
Single assurance framework in place
but does not currently include carbon.
Limited data relating to housing.
‘Gap between rhetoric and actual
response’, employers need to do
more.
Approach based on Doughnut
Economics book. Must be a net
benefit from developments.
Region can contribute more to
self-sufficiency.
Constrained resources and
capacity. Need to balance long
and short-term needs.
Quantification process in place,
need to differentiate between
what is funded or just plans.
Value for money important, what
will give the biggest impact for
smallest investment. There is a
need to understand likely payback
and returns for different
technologies.
Page 263
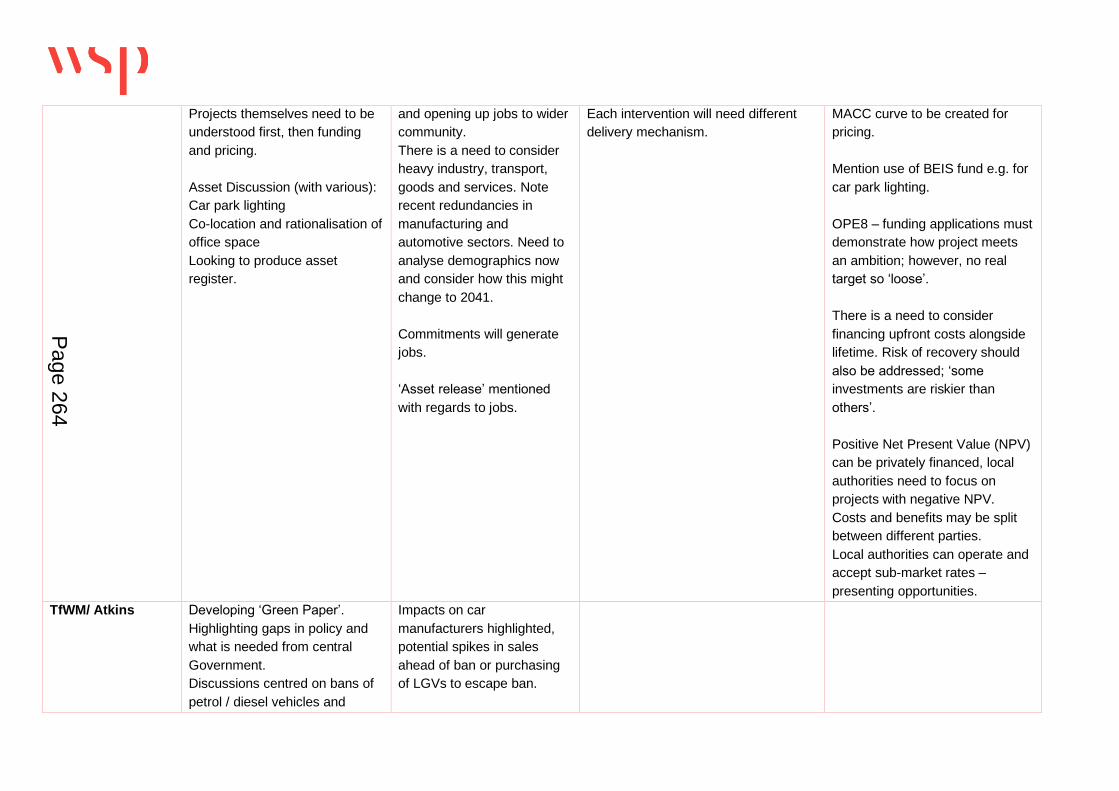
Page 14
Projects themselves need to be
understood first, then funding
and pricing.
Asset Discussion (with various):
Car park lighting
Co-location and rationalisation of
office space
Looking to produce asset
register.
and opening up jobs to wider
community.
There is a need to consider
heavy industry, transport,
goods and services. Note
recent redundancies in
manufacturing and
automotive sectors. Need to
analyse demographics now
and consider how this might
change to 2041.
Commitments will generate
jobs.
‘Asset release’ mentioned
with regards to jobs.
Each intervention will need different
delivery mechanism.
MACC curve to be created for
pricing.
Mention use of BEIS fund e.g. for
car park lighting.
OPE8 – funding applications must
demonstrate how project meets
an ambition; however, no real
target so ‘loose’.
There is a need to consider
financing upfront costs alongside
lifetime. Risk of recovery should
also be addressed; ‘some
investments are riskier than
others’.
Positive Net Present Value (NPV)
can be privately financed, local
authorities need to focus on
projects with negative NPV.
Costs and benefits may be split
between different parties.
Local authorities can operate and
accept sub-market rates –
presenting opportunities.
TfWM/ Atkins Developing ‘Green Paper’.
Highlighting gaps in policy and
what is needed from central
Government.
Discussions centred on bans of
petrol / diesel vehicles and
Impacts on car
manufacturers highlighted,
potential spikes in sales
ahead of ban or purchasing
of LGVs to escape ban.
Page 264

Page 15
introduction of ICE cars on
roads.
Birmingham City
Council (BCC)
Council aiming to be carbon
neutral by 2030, but recognise
further work required for city as a
whole.
Further work to be done on
retrofitting and procurement.
Route to Zero – aiming to be first
net zero city.
Some actions already happening
include:
- Cargo bike / workplace parking
levy
- Birmingham Development Plan
- Birmingham Local Plan and
Future Homes Standard
- EV charging network project
- Clean Air Zone
- Hydrogen buses
- Passivhaus pilot project
There are a number of major
developments in the next 5
years in the City including for
example: Commonwealth
Games, HS2 and Curzon, Peery
Barr Masterplan (transport),
metro extension and housing
regeneration schemes.
Route to Zero (R20) is the
main route.
The Covid-19 Recovery plan
provides a hook to R20 and
linking with the universities.
R20 will be main route for delivery.
Movement for Growth to capture
Birmingham Plan (update to
commence).
Birmingham Transport Plan has
number of deliverables which should
be aligned too.
Replacement of Big City Plan is also
taking place; to be replaced by Our
Future City Plan – Birmingham 2040.
Decision to be made with regards to
how best to communicate with
stakeholders.
Working with West Midlands
Combined Authority through:
- lobbying around planning policy
- freeing up resources for large scale
retrofit
- standards for rented properties
- regional renewable energy potential
- sharing best practice
Council alone:
- reducing own emissions
- local transport infrastructure
- own social housing
Action plan is being developed in line
with Anthesis report.
Part of BEIS decarbonisation of
heat programme.
Proposed WMCA can help
support with:
− Influencing government
on areas like housing
retrofit and new homes
standards / regulations
− Support collaboration
between different
stakeholders and policy
agendas
− Sharing best practice
− Identifying funding
sources e.g. for delivery
of sustainable transport
projects.
Page 265

Page 16
Wolverhampton
City Council
Declared a Climate Emergency.
Carbon reduction target
consulted on; set for 2041 target
for wider city and 2028 for
council activities.
Certified green electricity
scheme implemented for
streetlighting, signals and civic
buildings. Office rationalisation
taking place.
Plans for fleet transformation,
working alongside Midlands
Energy Hub.
Trialling some electric fleet (e.g.
bin lorries).
Feasibility study for a district
heating scheme taking place.
Heat mapping has already been
undertaken. Plans in place for
district heating scheme from
council owned EfW plant.
Building PV at Beaumont
Harbour.
EV charging points.
Discuss specifically delivery of district
heating schemes; depend upon
business case, e.g. council or private
partnership.
Working groups in place to inform
internal climate change emergency
strategic group. Also have a separate
Climate Change Advisory Group
consisting of internal stakeholders
only.
Delivery action plan in place (on
website).
Part of the Birmingham and Black
Country LEP energy group.
To engage with Universities and NHS
trusts.
Mention some funding schemes,
e.g. CEF financing from European
funding for PV at Beaumont
Harbour.
Fund available for capital work.
Sandwell
Metropolitan
Borough Council
Have set net zero targets; 2030
for council themselves and wider
2041 target for the Borough.
Carbon Plan in process of being
updated. High level carbon
strategy established which
incorporates action plans.
In process of developing a
Skills Strategy as part of
wider ‘Reset and Recovery
Plan’. Within this, green skill
sectors highlighted.
Action plan also in place for
‘community wealth building’
that covers social value
alongside jobs and skills.
Behavioural change important –
people making right decisions.
Behaviour Change Unit at Warwick
University being worked with.
Do raise a concern that acceptability of
climate change interventions needs to
be considered. Consideration of
people’s mindset is important; People
Won £50,000 for innovation in
relation to heat networks
(InnovateUK fund).
Actions considered to be
‘expensive but straightforward’ (in
reference to FYP).
Page 266

Page 17
LEAP scheme in Sandwell
highlighted; installation of over
10,000 energy saving measures
in over 800 homes. And ECO3
scheme which helps private
sector residents to improve
energy efficiency of own homes.
Energy from Waste plant project
mentioned in relation to 2
projects at West Bromwich and
Smethwick. In additional to other
smaller development projects.
Interest in e-scooters as form of
green travel.
Only some wind sites realistic.
Potential for solar on council
buildings being assessed.
Currently considering proposals
for ASHP based district heating
systems to 3 Council-owned
high-rise blocks (and
surrounding low-rise).
Contractor appointed to manage
Detailed Project Development
(DPD) of two large heat network
schemes within Sandwell.
Currently procuring a contractor
to undertake DPD itself.
Express desire to recognise
new skills and discuss
growth in logistics, health
and welfare.
SME manufacturers make up
most of area that are looking
to future proof themselves.
Have a number of
employment skills
partnerships e.g. with DWP,
Chambers of Commerce,
Sandwell colleges. Also, a
Business Ambassadors
group.
Construction is key in the
area and this provides
apprenticeships.
Social value with contractors
helping a shift toward local
jobs.
Highlight that there can be
miscommunication between
industry and colleges with
regards to what skills are
needed.
Black Country Skills
Partnership exists as LEP
initiative to address skills
shortages in advanced
are generally supportive of climate
change but can find it difficult to
change or spend money on it.
Highlight certain schemes ‘coming
forward’ e.g. heat networks and
retrofitting schemes.
Believe there is a need to work
together, Sandwell focus on waste but
economies of scale will help for
aspects like transport and heat uses.
Transport officers working with TfWM.
WMCA can support with the
resources to be able to support
homes and businesses to become
low carbon through energy
efficiency measures. Providing
sources of funding which can be
accessed by either councils,
business, residents and schools
which support low
carbon measures and which are
easy to apply for.
Page 267

Page 18
manufacturing, transport,
construction, environmental
technologies and business
services.
Walsall Council Council operations to be net
zero by 2050 but no target for
wider authority.
Declaration of climate
emergency in September 2019
and subsequent climate
emergency action plan.
Schemes include Future High
Streets Fund of £25m.
Potentially to be invested in
Active Travel.
No other major delivery plans for
decarbonisation.
Carbon Reduction paper going
to cabinet.
Planning electric buses.
Number of recycling plants in
area.
Significant developments include
Willenhall and Darlaston station.
Black Country have a
Recovery plan that includes
green jobs, focused on sites
and developments.
Walsall College as part of
their Capital Investment Plan
have asked to expand their
Engineering Centre for
training around Electric
Vehicles / new service centre
There is a need to
understand more on who the
suppliers are.
Recognise that "green
homes" issue is growing and
the need for installation of
smart meters, etc.
Currently no overall strategy
in place.
Largest devolution element is
in adult education (currently
£120,000 in adult skills).
Also, huge demand around
logistics (HGV drivers).
Regional plans focus on
engineering, automotive etc.
Walsall is focuses on Health
and social care, logistics.
Climate emergency action plan derived
from climate emergency declaration in
2019 for carbon reduction. Internal
working group has since also been
established.
Feeding back on planning white paper;
currently unclear on how this will affect
ability to guide.
Delivery with regards to transport need
to be joint, in partnership with West
Midlands Combined Authority.
Housing needs to have a regional
delivery approach, need to avoid local
authorities ‘playing each other off with
lower standards’. Have a Housing
Strategy in place for 2020-2025.
Land use requires consistent policy
that each local authority can then use
and tweak.
Other relevant strategies in place /
planned:
- Black Country Core Strategy
- Movement for Growth and Walsall’s
Transport Strategy 2017-2022
- Walsall Cycling Strategy
- Draft Waste Strategy
Creating resource in ‘Clean and
Green Directorate’: business case
put together for a fixed term
Climate Change Programme
Manager into Clean and Green
Service Structure; part of wider
Proud Transformation
Programme.
Future High Streets fund
mentioned (£25m).
Funding secured for re-opening of
Darlaston train station.
However no major climate change
investment programmes currently
underway.
Place emphasis on aligning
ambitions with WMCA in Carbon
Neutral Council cabinet paper
October 2020; particularly for
making cases for investment in
the region.
Page 268

Page 19
There is no green jobs and
skills plans/ strategy.
Although there will be
planning documents on how
to use the low carbon
network. There are also
economic plans locally.
Regionally there is a sector
skills plan developed that call
off funding based upon skills
plan. Where there are not
enough skills in that regional
plans, then locally would put
in a specific request and
follow up with a pilot.
With regards to jobs and
skills, could be delivered
through a number of different
mechanisms through - local
colleges looking for capital
investment e.g. through town
deals or growth deals.
Solihull
Metropolitan
Borough Council
Have agreed a Climate Change
Emergency Statement of Intent
which outlined activities.
2030 net zero target for the
council; preliminary target of
2041 for region Carbon
Management Plan in place;
emissions reduction of 49% so
far.
Local jobs – but keen to
collaborate and be regional.
Economic Recovery Strategy
in place – emphasise desire
to be more linked to West
Midlands Combined Authority
approach.
Working on employment and
skills piece pushing ‘forward
Alignment with West Midlands
Combined Authority targets for carbon
reduction (2041).
Net Zero Action Plan development in
progress; expected to be finalised in
Summer 2021.
Carbon Management is governed by a
Carbon Board chaired by an Assistant
Director. Progress is also monitored
The WMCA can help support with
joint access to funding and
financing, and access to novel
financing.
Note they are ready to use
funding, when available in relation
to social housing.
Page 269

Page 20
Purchasing green electricity to
reduce emissions from
streetlighting.
A Climate Change Prospectus
also exists which is reviewed
annually and outlines activities
which will contribute to Solihull’s
transition to a low carbon
economy, and an Annual Carbon
Report.
Major projects:
- UKC hub area – focused on
new HS2 interchange station
(includes mixed used
development)
- 15,000 new homes anticipated
in next Local Plan cycle
- Town centre redevelopments
(and other specific areas) e.g.
Eastgate / Westgate, Kingshurst
Village centre regeneration
project.
- DHN in town centre to be
ASHP based
- Renewable energy potential;
about to conduct feasibility
studies into possibilities
- Social housing potential (ready
to use funding when available)
Other interventions:
- Kingshurst development aiming
for net zero
thinking’ on economy. Key
considerations raised in
relation to alignment with
existing strategies, alignment
of delivery plans with
workforce and industry, what
the ‘green agenda’ really
means, upskilling.
Already working with Solihull
College, however historically
some cases of no jobs
materialising. Key employers
are NEC, airport and JLR.
Refer to a ‘green recovery’
but emphasise the need to
understand ‘what are the
jobs and when are they going
to be available’.
annually by the Council’s Budget
Strategy Group against an
approved carbon budget. Solihull
Climate Change Commission also in
place for carbon management.
Engagement with West Midlands
Combined Authority One Home
Agenda with regards to social housing.
Uncertainty with regards to achieving
net zero for housing but note that stock
‘pretty good’.
Regional approach needed for
offsetting.
Have JLR, the NEC and the airport,
although tend to be more service
sector focus.
Delivery mechanism for jobs and skills
well established, partners in place
already (e.g. DWP).
Social value elements need to be
factored into larger contracts e.g. HS2
mapping out monthly skills to identify
what jobs would be required and when.
Something similar would be ideal.
Page 270

Page 21
- UK Central Hub Area HS2
station and 5000 homes
- Electrification of airport and
JLR by 2030
- Energy Innovation Zone
- Use of biomass for tower
blocks
Coventry City
Council
No climate emergency plan
currently in place; however, an
existing Climate Change Carbon
Reduction Plan was in place
which is now due for renewal.
This is to focus on whole City as
opposed to just City Council.
Undertake own greenhouse gas
reporting and part of Climate
Disclosure Project (CDP)
submissions.
Potential Joint Venture to
address energy issues.
Looking into use of biogas and
hydrogen for vehicles.
Feasibility studies considering
solar farm conversion.
Regional Energy Systems
Operator (RESO) project in
Coventry.
Using new SPDs (SUDs and
energy).
3 main RSLs which focus on
discussions around energy
Developing low skilled
people to fill new high skilled
jobs.
Also working with Coventry
University through a Social
Enterprise Unit.
Council also considering how
enterprises could provide
opportunities for training long
term unemployed and low
skilled workers to develop
new transferable skills. Also
focusing on supporting
innovation and the
development of new
environmental
technologies, (seen as a
source of employment to
many in the future).
RESO project to guide – major
infrastructure works (see Resources
column).
Joint Venture commission being
proposed to address energy issues
across the city. This is yet to be
confirmed but they report that this may
look at community ownership of
infrastructure.
Formation of multi-agency commission
to lead the development of a city wide
Sustainable Coventry Strategy.
Highlight importance of a regional
approach to maintain standards, e.g.
zero carbon homes work, with regards
to energy infrastructure, retrofitting
homes and transport where there is
overlap with the CA.
As highlighted in interventions – new
Climate Change reduction plan /
strategy aimed to be finalised Spring
2021. Key focus of this reported to be
Support of the WMCA and
funding from the UK
Government’s Innovate UK has
enabled the set-up of a Regional
Energy Systems Operator
(RESO) Project to look at the
environmentally sound ways of
generating and supplying heat
and power across the City.
Outcomes of research will provide
vital information to help
addressing climate change within
the organisation.
City Council will also establish an
independent commission of
stakeholders to mobilise
businesses, communities and
voluntary organisations across the
City into developing a new
Citywide Climate Change and
Sustainability Strategy and Action
Plan.
Programmes recently
announced which are yet to be
fully operational:
Page 271
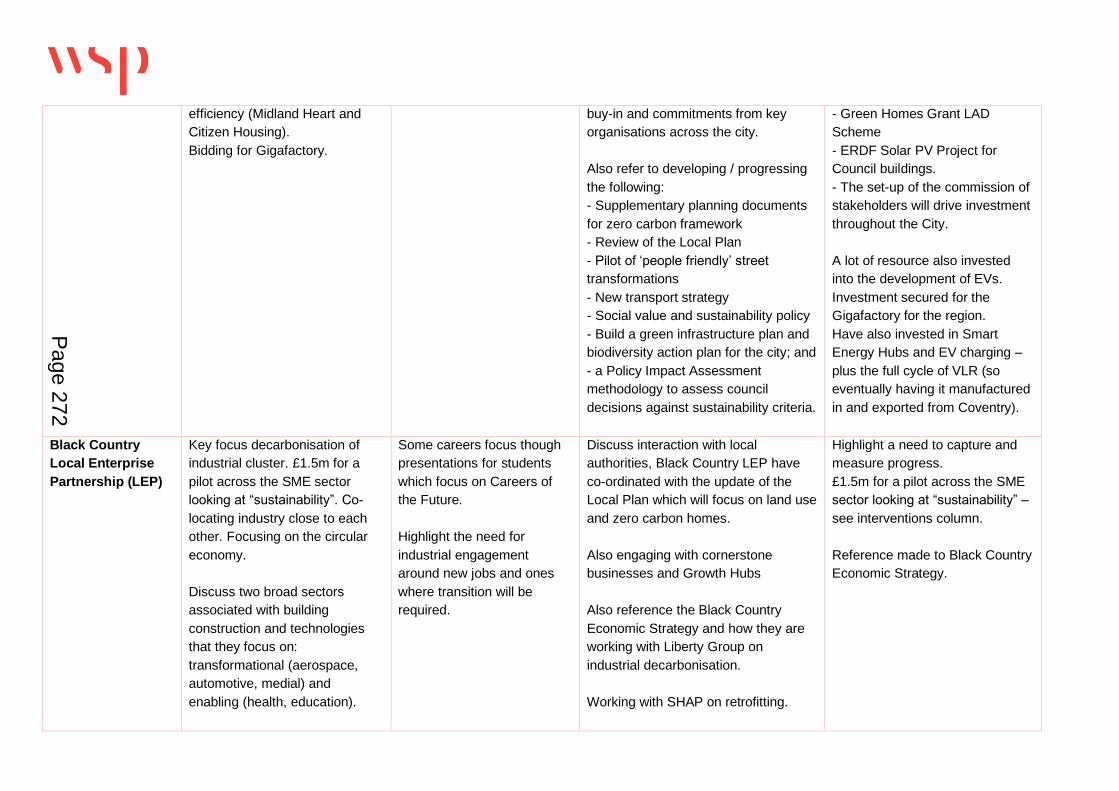
Page 22
efficiency (Midland Heart and
Citizen Housing).
Bidding for Gigafactory.
buy-in and commitments from key
organisations across the city.
Also refer to developing / progressing
the following:
- Supplementary planning documents
for zero carbon framework
- Review of the Local Plan
- Pilot of ‘people friendly’ street
transformations
- New transport strategy
- Social value and sustainability policy
- Build a green infrastructure plan and
biodiversity action plan for the city; and
- a Policy Impact Assessment
methodology to assess council
decisions against sustainability criteria.
- Green Homes Grant LAD
Scheme
- ERDF Solar PV Project for
Council buildings.
- The set-up of the commission of
stakeholders will drive investment
throughout the City.
A lot of resource also invested
into the development of EVs.
Investment secured for the
Gigafactory for the region.
Have also invested in Smart
Energy Hubs and EV charging –
plus the full cycle of VLR (so
eventually having it manufactured
in and exported from Coventry).
Black Country
Local Enterprise
Partnership (LEP)
Key focus decarbonisation of
industrial cluster. £1.5m for a
pilot across the SME sector
looking at “sustainability”. Co-
locating industry close to each
other. Focusing on the circular
economy.
Discuss two broad sectors
associated with building
construction and technologies
that they focus on:
transformational (aerospace,
automotive, medial) and
enabling (health, education).
Some careers focus though
presentations for students
which focus on Careers of
the Future.
Highlight the need for
industrial engagement
around new jobs and ones
where transition will be
required.
Discuss interaction with local
authorities, Black Country LEP have
co-ordinated with the update of the
Local Plan which will focus on land use
and zero carbon homes.
Also engaging with cornerstone
businesses and Growth Hubs
Also reference the Black Country
Economic Strategy and how they are
working with Liberty Group on
industrial decarbonisation.
Working with SHAP on retrofitting.
Highlight a need to capture and
measure progress.
£1.5m for a pilot across the SME
sector looking at “sustainability” –
see interventions column.
Reference made to Black Country
Economic Strategy.
Page 272
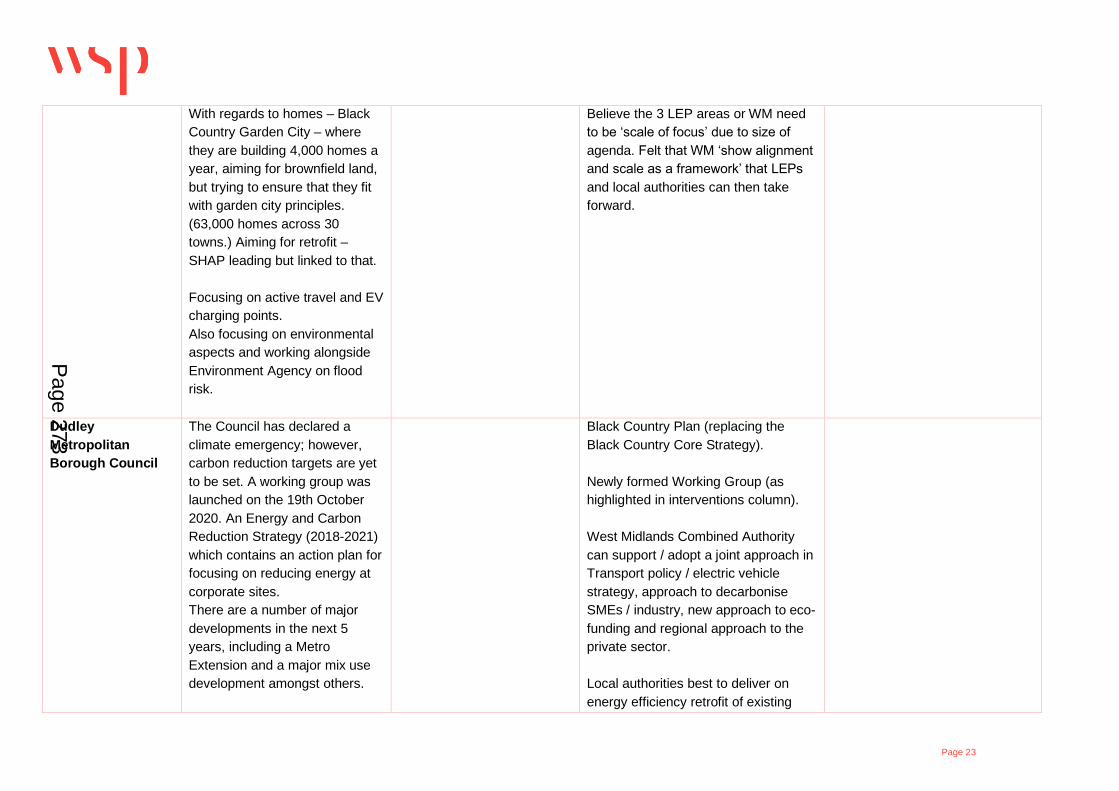
Page 23
With regards to homes – Black
Country Garden City – where
they are building 4,000 homes a
year, aiming for brownfield land,
but trying to ensure that they fit
with garden city principles.
(63,000 homes across 30
towns.) Aiming for retrofit –
SHAP leading but linked to that.
Focusing on active travel and EV
charging points.
Also focusing on environmental
aspects and working alongside
Environment Agency on flood
risk.
Believe the 3 LEP areas or WM need
to be ‘scale of focus’ due to size of
agenda. Felt that WM ‘show alignment
and scale as a framework’ that LEPs
and local authorities can then take
forward.
Dudley
Metropolitan
Borough Council
The Council has declared a
climate emergency; however,
carbon reduction targets are yet
to be set. A working group was
launched on the 19th October
2020. An Energy and Carbon
Reduction Strategy (2018-2021)
which contains an action plan for
focusing on reducing energy at
corporate sites.
There are a number of major
developments in the next 5
years, including a Metro
Extension and a major mix use
development amongst others.
Black Country Plan (replacing the
Black Country Core Strategy).
Newly formed Working Group (as
highlighted in interventions column).
West Midlands Combined Authority
can support / adopt a joint approach in
Transport policy / electric vehicle
strategy, approach to decarbonise
SMEs / industry, new approach to eco-
funding and regional approach to the
private sector.
Local authorities best to deliver on
energy efficiency retrofit of existing
Page 273

Page 24
£2.5m ERDF project to fit council
homes with A rated gas boilers
and smart thermostats.
Heat mapping undertaken but
concluded few opportunities.
Similar outcome for wind
turbines. (Both looked at as part
of Black Country Utilities
Infrastructure Study).
£2.5m ERDF (£5m total) “low
carbon place” project in place
which is a joint initiative between
Corporate Landlord Service and
the council housing department.
Council homes are being fitted
with A rated gas boilers and
smart thermostats that link to a
landlord portal.
A retrofit contractor has also
been appointed and is delivering
whole building energy efficiency
retrofit to certain corporate
buildings, such as the Council
House.
estate and social housing (part of
Energy extra – vehicle for delivery).
Connected to
Growth Meeting
Potential of travel policies discussed
and how politically viable these are.
Economic gain key focus of work.
Cadent Have committed to be carbon
neutral by 2026 (including
offsets).
- Converting emergency
response vehicles
- Purchasing green energy
- Looking into heat and flexible
power and transport (recognition
Replacing pipes is going on
until 2032. Once that is done
there won’t be such an
emergency need as they will
be safer or just in the
replacement market.
Are keen to invest in
hydrogen and other skillsets.
Hynet being focused on for commercial
and industrial.
Flexible power – growing power
generation required locally to balance
and be used with solar and wind.
Need a plan for everyone on home
heating.
Highlight that 2026 target for own
business operations subject to
funding.
Recognise potential of hydrogen
in future.
Biomethane also discussed but
limited end resources.
Page 274

Page 25
that there is a need to move
away from natural gas)
- Hydrogen indicated as potential
for future in relation to vehicles.
Looking at also blending 15%
hydrogen into gas network but
no set date. Envisage late 2030s
for complete hydrogen switch
out.
- Encouraging biomethane for
home heating but limited end
resources
There is no skills gaps
because it isn’t required yet,
but there will be.
West Midlands Combined Authority
can help by creating Regional Energy
System Operator and having local
energy plan.
National plan also needed however to
work beyond regional approach.
Need to raise awareness in the public
at scale.
Final determination in 2021 on
regulated revenue.
Will be a mechanism to ask for
regulated funding and money for
trials.
Can unlock net-zero re-opening
funding if strategic scale
opportunity exists.
Climate Change
Members Steering
Group Sandwell
Maintain an Action Log.
PV alternative funding stream –
public sector decarbonisation
scheme (moved from oil / gas
fired), and potential pledge to
join UK100 scheme.
Expectation FYP to explain
what types of jobs we will
see, and skills required, don’t
want to take away from
people.
Behavioural change; focus on being
inclusive – ‘best teachers in our society
are children’. Should be getting people
to think about choices.
Want to ensure alignment of aims of
targets with West Midlands Combined
Authority and ensure collaboration.
PV alternative funding stream.
WM Growth There are three main aims of the
company:
- Transformational capital
attraction
- End-occupier attraction
- Visitor attraction (though not
really tourism)
Currently looking at:
- Future mobility space
- Life sciences
- Demographics and device
manufacture
Main growth around ‘prof-
tech’ currently.
Megatrends around
digitalisation and
urbanisation.
Long term declines in
manufacturing taking place,
due to Brexit and now
affected by Covid.
Systemic change / gear shift
projects now a focus (e.g.
giga factory, circular
May have more qualitative targets in
future. Working on fewer projects.
Focusing on green growth and
economic inclusion.
Mention work with University of
Birmingham in relation to
demographics and device
manufacturing.
Global markets will take long time
to recover. Demand for offices
changing.
Want to move away from
facilitation to investment
promotion.
Page 275

Page 26
- Digital and creative
Also refer to a £23.9 million
programme working with the
halo effect from the
commonwealth games.
economy centre of
excellence).
Work with Warwick
University and University of
Birmingham in relation to skill
development.
Cemex Refer to a site in Rugby which is
responsible for 1.2 million tonnes
CO2 annually.
Work undertaken on alternative
fuels to help reduce process
emissions from clinker. Using
hydrogen generated on site (low
quantities).
Also recirculating high-grade
heat.
Global target of zero carbon by
2050 for Cemex globally; 35%
reduction for cement by 2030
(likely to be achieved sooner in
UK).
Net zero brings in contracts
for specialist jobs, alongside
using the global network and
experts (from Cemex) if
needed.
How CEMEX communicate
with employees is their
concern; however, work is
‘CAPEX heavy which brings
confidence’. One of area’s
biggest employers.
Have 3 priorities:
- Confidence
- Reputation
- Communication
In discussions with BEIS (carbon
capture team). Conscious that carbon
capture technologies need to ‘link up’
to meet targets.
Planning support will be required for
new equipment, particularly where
residents in close proximity.
Plan needs to include real costs,
practicalities, constraints.
Within the Tyndall report there is
a specific exclusion for cement
production which is ‘a necessity
for growth’; feel therefore this
should not be included in FYP
budget.
Demand for electricity and grid
constraints reported as big issues.
Carbon capture requires
additional electricity demand.
Energy Systems
Catapult
Refer to Innovating Net Zero
Report (one digitalisation, one
nuclear) and an ESME model
which factors in energy and
costs required in two emissions
reduction scenarios.
Energy Path Networks tool –
what local area energy plans
need to do.
ESME model.
WM need local energy plan. Example
discussed in Newcastle between
network operators and local authority.
Queries around funding for this.
Energy and costs considered in
model for emissions reduction.
Useful graph showing policy gaps
and subsidies.
Discussions around how local
authority budgets are restricted
for implementation of tools (e.g.
Page 276

Page 27
Have a 6-point plan for steps to
zero carbon buildings.
2050 calculator) and local carbon
budgets.
Price control mechanism through
Ofgem. Attempting to lobby
government on energy systems.
WM lack of capacity; needs to be
addressed now.
Pace financing – link to property
assets – property tax/ council tax.
Could use that to finance some of
these initiatives. Finance
mortgages – could that be used to
finance initiatives.
University of
Birmingham
Currently working on strategy
and have zero carbo target for
2050. Report against UNSDGs.
There is a lot of pressure from
students who want the University
to declare a climate emergency.
R20 Task Force – heat task
force for Birmingham. Pilot
projects with Tyseley Energy
Park mentioned and potential for
scaling up hydrogen.
Also refer to:
- Low carbon fuels, and
hydrogen buses, hydrogen for
rail.
Belief that skills are currently
under-invested in however
some colleges are helping
with this. Many boiler
manufacturers in the region;
engineers need upskilling
(e.g. to fit heat pumps).
Currently this seen as a
‘massive’ skills gap.
Big opportunities for regional
investment in jobs and skills.
Preparing delivery of strategic
framework to council June 2021.
Discussed potential of joining Mayor
Round Table.
Raised a query regarding costs /
penalties for not meeting 2041 targets.
Collaboration with industry / wider
organisations mentioned several times
(e.g. JLR, Tyseley Energy Park, City
Council, Airport).
Emphasis placed on understanding
‘realism’ of how to deliver different
efficiency technologies (e.g. hydrogen
and heat referred to).
Reviewing investment
opportunities to 2026 and also in
process of identifying funding
streams.
Need to identify what is
‘reasonably accessible’; what they
do or don’t have access to in
terms of funding.
Critical infrastructure needed to
help deliver.
Local authority need more
resource to help with planning
and capacity to deliver.
Page 277

Page 28
Severn Trent Operational target for Scope 1
and 2 emissions reduction by
2030.
Looking at alternative power
sources (e.g. reducing GHGs
from sewage) and heat recovery
possibilities.
Circular economy and getting
more value from sewage.
Focusing on water efficiency and
behavioural experiences.
Big Nature Boost (biodiversity
improvements).
Ensuring people are
upskilled; no specific gap
currently.
Key areas of focus for meeting
emissions reductions: electric vehicles,
renewable energy sources (purchasing
and producing).
West Midlands Combined Authority
could help by linking up EV and public
transport opportunities, and through
broader climate change awareness.
Believe that overall there are a number
of opportunities to work together.
Climate Adaptation plans a good
opportunity to collaborate.
Believe realistically 10-15 years to
make changes.
Low Carbon
Officers Group
Aiming to get a routemap
completed for journey to zero
carbon homes standard and
charter.
Some PassivHaus housing
being developed.
Have reviewed planning policies
with 17 local authorities in
region.
Human capital and technology
key.
Building Regulations.
Query if possible, to build
completely zero carbon homes.
Capital cost uplift – does not
consider economies of scale.
Network Rail Emissions limited; instead point
to relevance of modular shift.
Currently looking at ‘rapid
response rail’.
Most of Birmingham is accessed by
the ports of Southampton and
Felixstowe so would be very difficult to
get to by train, using the existing
network.
ULEV Strategy
Working Group
Queries as to whether focus
should be on electrification only.
Encouraging modal shift in transport.
Potential co-location of energy
infrastructure for this.
Standoff from investors until clear
what direction to take.
Page 278

Page 29
Continues to be challenges with
regards to decisions about
alternative fuels.
Potential for hydrogen
possibilities in region discussed.
Lobbying role for the West Midlands
Combined Authority.
Refer to finite rail budgets which
should be spent within the region
as opposed to elsewhere.
Issues with diesel cars in
Birmingham City Centre; a way off
electrification yet.
Midlands Metro Delivery of tram network.
Currently only transport people;
would potentially need to
consider moving goods too.
Particular concern over jobs
and skills within this context.
Will employ additional 120
people in next year and 450
by 2023.
New jobs will be around
maintenance and
engineering; currently
training own workers for
these skills. However
unsociable hours and low
pay.
Would welcome more
apprenticeships.
Benefit to night time
economy (most jobs
undertaken during this
period).
Discuss investments (£millions)
being made in trams and tram
extensions over next few years.
Forest of Mercia
Tree Planting
Chat about the Forest of Mercia
aims, project ambition and
progress to date.
Midlands Connect Currently refreshing strategy
which will have key sustainability
theme.
Wider Midlands Engineer
perspective – looking to
support substantial economic
growth
Emphasis importance of the need to
target stakeholders to consider end-to-
end journeys, currently trying to gather
mobile data for this.
Narrative for why and when
investment in road schemes
required.
Page 279

Page 30
‘End to End’ journeys project
mentioned which looks at
stakeholders’ journeys.
Study planned on offsetting.
Also discuss projects relating to
their Transport Decarbonisation
Pathway work:
- Carbon Baseline Study and
‘MCTool’
- Acceleration of EV charging
infrastructure
- Alternative fuels for freight and
logistics
- Rail decarbonisation and
electrification of the network
They are considering ‘triple planning’
which focuses on role of digital
mobility.
Local strategy review.
Need to establish policy position on
acceptable impacts of infrastructure on
natural capital.
Focused on medium to long term
opportunities and timeframes and
understanding Future Transport
Zones; query ‘who is responsible for
which policy lever?’
Natural England Chat about the NE initiative of
the Heathland Heartland project
to connect Cannock Chase SAC
and Sutton Park and some
information on carbon storage
for different habitat types.
Birmingham
International
Airport (BHX) and
Urban Growth
Company
Sustainability Strategy 2020-
2025 in place.
Net zero carbon airport by 2033
through focusing on operations
and increasing use and
generation of renewable energy
(solar key).
Have already invested in electric
vehicles.
For reducing scope 1 and 2: smart
meters, building management
systems, data management,
measuring performance and target
setting, behavioural change, asset
replacement, energy saving projects,
carbon programme manager.
Scope 3: review of flight paths, use of
green fleet, green airfield strategy.
Nothing seen as coming from
hydrogen until 2030s.
Money and resources seen as
‘immediate’ issues. Currently
looking into other funding
streams.
Page 280
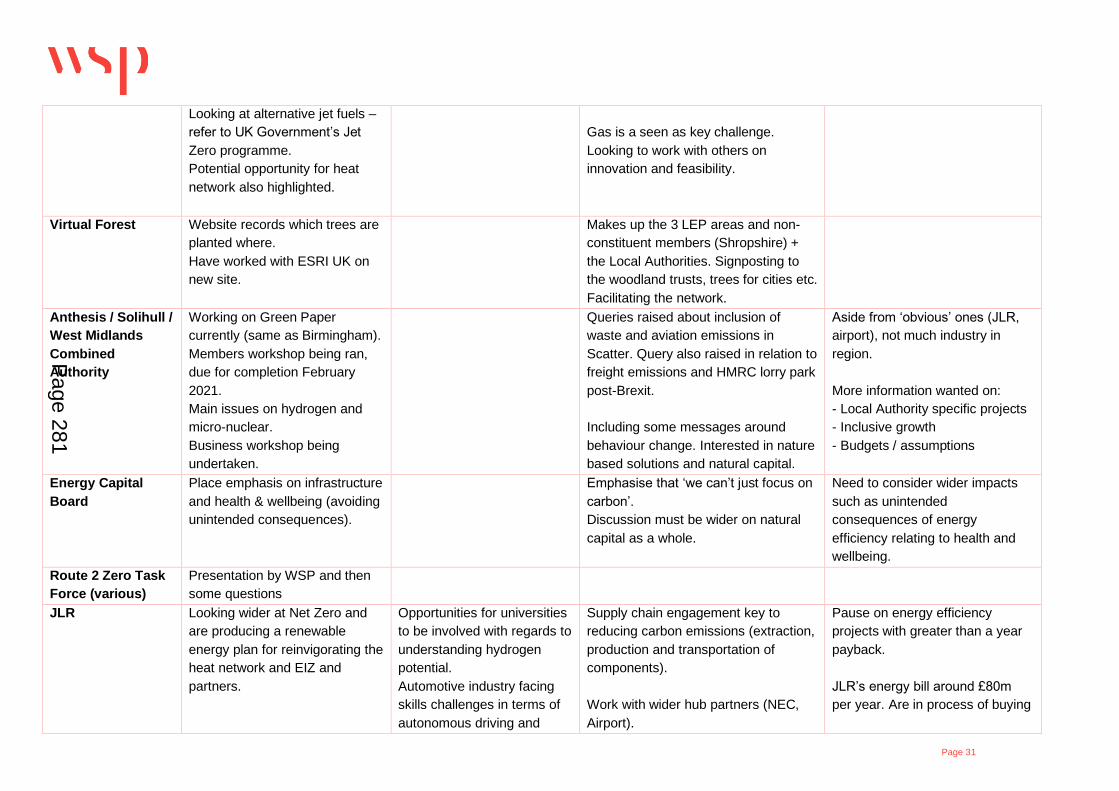
Page 31
Looking at alternative jet fuels –
refer to UK Government’s Jet
Zero programme.
Potential opportunity for heat
network also highlighted.
Gas is a seen as key challenge.
Looking to work with others on
innovation and feasibility.
Virtual Forest Website records which trees are
planted where.
Have worked with ESRI UK on
new site.
Makes up the 3 LEP areas and non-
constituent members (Shropshire) +
the Local Authorities. Signposting to
the woodland trusts, trees for cities etc.
Facilitating the network.
Anthesis / Solihull /
West Midlands
Combined
Authority
Working on Green Paper
currently (same as Birmingham).
Members workshop being ran,
due for completion February
2021.
Main issues on hydrogen and
micro-nuclear.
Business workshop being
undertaken.
Queries raised about inclusion of
waste and aviation emissions in
Scatter. Query also raised in relation to
freight emissions and HMRC lorry park
post-Brexit.
Including some messages around
behaviour change. Interested in nature
based solutions and natural capital.
Aside from ‘obvious’ ones (JLR,
airport), not much industry in
region.
More information wanted on:
- Local Authority specific projects
- Inclusive growth
- Budgets / assumptions
Energy Capital
Board
Place emphasis on infrastructure
and health & wellbeing (avoiding
unintended consequences).
Emphasise that ‘we can’t just focus on
carbon’.
Discussion must be wider on natural
capital as a whole.
Need to consider wider impacts
such as unintended
consequences of energy
efficiency relating to health and
wellbeing.
Route 2 Zero Task
Force (various)
Presentation by WSP and then
some questions
JLR Looking wider at Net Zero and
are producing a renewable
energy plan for reinvigorating the
heat network and EIZ and
partners.
Opportunities for universities
to be involved with regards to
understanding hydrogen
potential.
Automotive industry facing
skills challenges in terms of
autonomous driving and
Supply chain engagement key to
reducing carbon emissions (extraction,
production and transportation of
components).
Work with wider hub partners (NEC,
Airport).
Pause on energy efficiency
projects with greater than a year
payback.
JLR’s energy bill around £80m
per year. Are in process of buying
Page 281

Page 32
Refer to Destination Zero which
is part of their internal strategy
and comprises various
workstreams.
Identification of significant
carbon emissions pieces – tail
pipe emissions and carbon
associated with components.
Key focus on more efficient
boilers and radiant gas.
Carbon offsetting done in the UK
and abroad.
Internally made a commitment,
although there is not a formally
published target; encouraging
sites to aim for net zero.
Undertake carbon and energy
reporting.
Looking at district heating and
alternative fuel sources. Partial
heat replacement with hydrogen
discussed. Use of CHP motors
in plants.
Have installed solar panels at
some sites and looking to
expand. Also discuss
involvement with EfW.
connected cars. There is a
lot of work going on in battery
development; R&D in
Coventry, electric motors will
be developed in
Wolverhampton. A lot of skill
required in design, also
welding etc. Electric cars
straighter forward to put
together - still have a lot of
both.
Have a software hub in
Manchester and have
automation skills centre in
Ireland and other pockets in
Gaydon and Coventry.
Discuss potential for finance model /
commercial relationship with regards to
installing solar panels on land adjacent
to plants (based on cost per year
reductions where JLR buy electricity).
REGOs (carbon free energy for
this year).
Have an electricity use prediction
for each plant but have not
estimated what electricity would
be needed to replace methane.
Page 282

Page 33
4.4 SURVEYS
An online survey was also distributed through a number of different groups, task forces and organisations to seek engagement from a wider range of
stakeholders.
The survey consisted of both open and closed questions, relating to the four key topic areas including proposed interventions, jobs and skills, delivery
mechanisms and resources. A summary of the questions asked and the findings from the surveys has also been outlined below.
Individuals who responded to the questions had the opportunity to leave their names and their organisations. The organisations that provided a response to
the survey is outlined above.
A summary of the findings have been outlined below.
Q1: If you have set carbon ambitions and targets please outline what these are.
▪ Zero carbon futures, several mentioned targets to become net zero by particular dates (e.g. 2030, 2050), others point to specific emissions reduction
targets across Scope 1, 2 and 3 (specific to individual organisations).
▪ Common approaches (from housing respondents) to achieving carbon ambitions / targets mentioned include fabric first approaches, minimum EPC
ratings (e.g. C or above by a particular date), technological and renewable energy solutions, offsetting. Others mention reducing reliance on fossil
fuels (e.g. Stonewater).
▪ Others point to personal emissions reductions being encouraged, e.g. through transport choices.
▪ Some organisations (e.g. The Pioneer Group, Central England Quakers, Birmingham Metropolitan College) have no direct carbon targets currently
but reductions are planned as part of wider initiatives (e.g. SAP, SHIFT metrics, Eco Church scheme framework, engagement with Carbon Trust).
▪ Some organisations do not currently have their own specific carbon targets; others however are in the process of formulating (e.g. Bromford, The
Woodland Trust, SIPS Education, South and City College Birmingham)
▪ Some respondents reported no specific targets or were uncertain (e.g. i-finance, Coventry College, Birmingham Commonwealth Games).
Page 283

Page 34
Q2: What do you see as the most important opportunities for climate change and carbon in the region?
Q3: What climate change and carbon management plans, strategies and projects have already been completed in your organisation?
▪ References made to existing environmental and sustainability management systems, strategies and corporate plans / roadmaps which commit to
carbon footprint reductions and net zero strategies (e.g. Orbit Group, Stonewater, CFRC University of Wolverhampton, Midlands Energy Hub,
Western Power Distribution). Some of these appear to be more developed than others (based on response).
▪ Many highlight existing commitments and stand-alone policies (Coventry College, Pioneer Group).
0
2
4
6
8
10
12
14
What do you see as the most important opportunities for climate change and carbon in the region?
Page 284

Page 35
▪ Others mention specifies such as: installation of renewable energy technologies and replacement of fossil fuel sources, use of green energy tariffs
and grants to support RE implementation, retrofitting of workplace / public buildings and houses (e.g. Bromford, Stonewater, Central England
Quakers, Birmingham City University, South and City College Birmingham, Wolverhampton Homes, City of Wolverhampton Council to name a few).
▪ Others highlight internal behavioural changes among employees such as staff travel, water and energy usage at workplaces (The Woodland Trust
South and City College Birmingham, Birmingham City University), educational efforts also mentioned e.g. posters, climate change champions by
Climate Action Network West Midlands and staff training rollouts at City of Wolverhampton Council.
▪ Some no response or limited information: Stagecoach Midlands, i-finance, SIPS education, Thomas Dudley Ltd, Dudley Metropolitan Borough
Council.
▪ Some mentioned specific forums / groups which have been set up or run with a focus on carbon (or wider sustainability): e.g. City of Wolverhampton
Council have held a citizen’s consultation to advise on the Climate Action Plan, South & City College Birmingham have established a new
Sustainability Focus Group, Climate Change Champions in schools by Climate Action Network West Midlands
Q4: What projects have you delivered, or will you deliver, to reduce carbon emissions?
▪ Key aspects mentioned:
▪ Corporate commitments and calculation of carbon footprints.
▪ Procurement approaches e.g. social value in contracts (Orbit Group), specific procurement strategy targets (The Pioneer Group).
▪ Sustainable transport initiatives e.g. shifts to electric vehicles / hybrids (Orbit Group, The Pioneer Group, BCU, City of Wolverhampton Council); use of
technology to reduce travel also highlighted by A S Miles Consulting Ltd specifically.
▪ Switches being made to purchase renewable energy in buildings and implementation of renewable energy technologies. Dudley MBC also specifically
mention determining planning applications which incorporate use of renewable energies.
▪ Behavioural changes being encouraged among employees – e.g. focusing on transport again, energy use, waste and use of materials (Coventry
College, South & City College).
▪ Creation of specific groups focusing on carbon e.g. Carbon Forum and Innovation Hub by Orbit Group, Woodland Trust Virtual Forest tool.
▪ Housing association respondents highlighted specific initiatives / projects in new homes e.g. utilising of renewable energy technologies, SAP ratings,
modular housing, achieving certain EPC ratings. Built Environment Climate Change Solutions point to battery storage pilots with Wolverhampton
Homes for example.
Page 285

Page 36
▪ Some talked about working in partnerships or influencing others e.g. The Woodland Trust working with number of councils to strengthen tree policies,
Central England Quakers influence national / local government on achieving net zero, Climate Action Network West Midlands – school carbon
champions.
Q5: Which organisations or networks do you think will play a key part in the success of the delivering net zero carbon for the region by 2041?
▪ Some respondents stated that everyone has a role to play (including authorities, government, general public, housing associations) (e.g. Orbit Group,
National Express West Midlands, City of Wolverhampton Council).
▪ Others were more focused on specific organisations; e.g. the role of local authorities was mentioned by majority of respondents.
▪ Respondents tended to include themselves in addition to other specific networks and organisations (particularly policy leaders including local
authorities and national government, several mentioned local regional networks too like enterprise partnerships and colleges for delivering skillsets).
▪ Respondents from energy / infrastructure sectors appear to show recognition that their input key to aiding delivery also.
Q6: Which industries are going to be affected by delivery of the WM2041 (positively and negatively)?
0 5 10 15 20 25 30 35 40
Automative
Heavy industry
Construction
Rail
Waste management
Agriculture and forestry
Logistics
Aerospace
Financial
Energy
Which industries are going to be affected by delivery of the WM2041?
Strong Negative Moderate Negative No Impact Moderate Positive Strong Positive
Page 286

Page 37
Q7: What specialised (or more general) skillsets do you think will be important to support delivery of WM2041?
Q8: How do you see the labour market and skills base will change in the West Midlands to adapt to net zero and clean growth?
▪ General overview that more skills are needed when it comes to developing and implementing renewable technologies / low carbon products. Growth of
this market is also required and suitable education / training to be made available.
▪ Many respondents also discuss the need for upskilling and adaptation of existing workforce, and supply chains for retrofitting, offsite construction,
implementation of renewable energy technologies and low carbon products.
▪ Investment may be required for upskilling. For example, Stonewater summarise that people with existing skills in fossil fuel technology will be required
to adapt. Some believe labour market will require restructuring (e.g. Central England Quakers, CFRC University of Wolverhampton, The Pioneer
Group).
Page 287
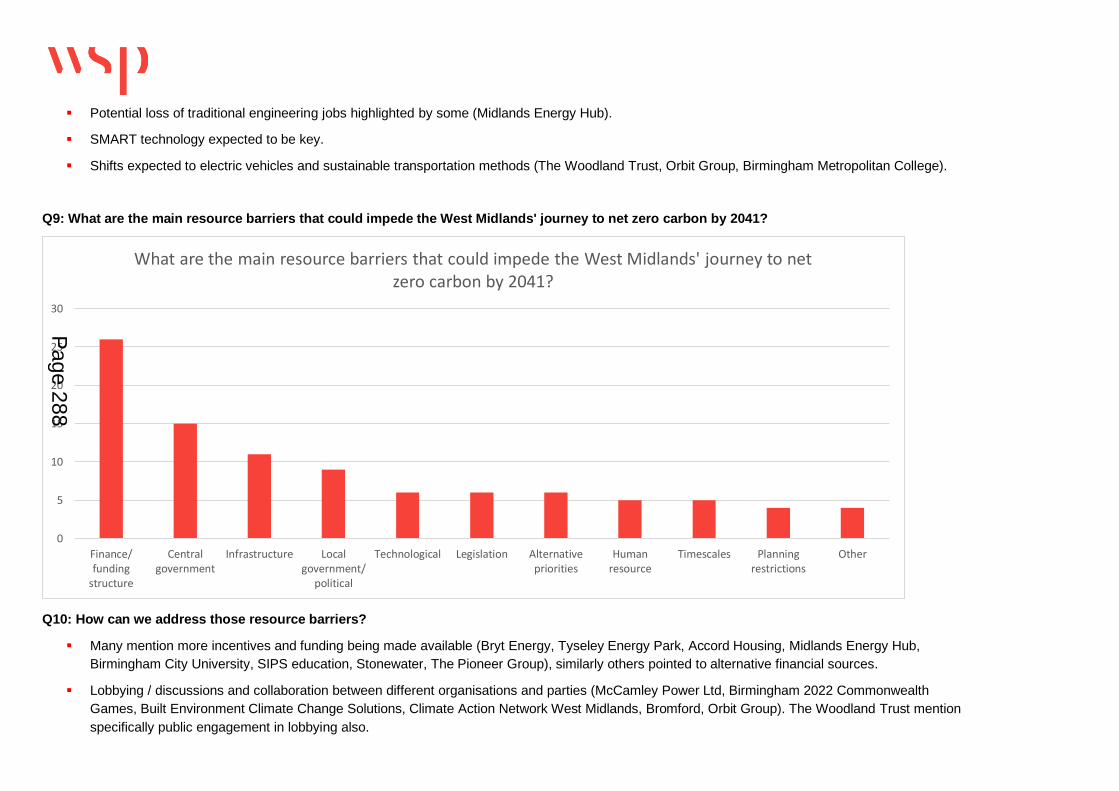
Page 38
▪ Potential loss of traditional engineering jobs highlighted by some (Midlands Energy Hub).
▪ SMART technology expected to be key.
▪ Shifts expected to electric vehicles and sustainable transportation methods (The Woodland Trust, Orbit Group, Birmingham Metropolitan College).
Q9: What are the main resource barriers that could impede the West Midlands' journey to net zero carbon by 2041?
Q10: How can we address those resource barriers?
▪ Many mention more incentives and funding being made available (Bryt Energy, Tyseley Energy Park, Accord Housing, Midlands Energy Hub,
Birmingham City University, SIPS education, Stonewater, The Pioneer Group), similarly others pointed to alternative financial sources.
▪ Lobbying / discussions and collaboration between different organisations and parties (McCamley Power Ltd, Birmingham 2022 Commonwealth
Games, Built Environment Climate Change Solutions, Climate Action Network West Midlands, Bromford, Orbit Group). The Woodland Trust mention
specifically public engagement in lobbying also.
0
5
10
15
20
25
30
Finance/funding
structure
Centralgovernment
Infrastructure Localgovernment/
political
Technological Legislation Alternativepriorities
Humanresource
Timescales Planningrestrictions
Other
What are the main resource barriers that could impede the West Midlands' journey to net zero carbon by 2041?
Page 288

Page 39
▪ Some suggested more training and investment being made to educate (e.g. Dudley Metropolitan Borough Council, South & City College, Birmingham
Metropolitan College).
▪ Others also highlighted changes may be required in legislation / policy (City of Wolverhampton Council, Dudley Metropolitan Borough Council).
Q11: Have potential sources of funding been identified for future projects related to net zero and Clean Growth? If so, what are these?
▪ Some respondents have identified what funding will be required, some of these also mention specific sources (Orbit Group, CFRC University of
Wolverhampton, Coventry College, Climate Action Network West Midlands, Birmingham City University, South & City College Birmingham, Midlands
Energy Hub, City of Wolverhampton Council and some more).
▪ Some respondents left section blank, potentially indicating that this has not been looked into or uncertainty.
▪ Several said no, with some indicating further clarity is needed (e.g. Dudley Metropolitan Borough Council, Birmingham Metropolitan College, SIPS
Education, Stonewater, Select Windows, Accord Housing Association, Birmingham 2022 Commonwealth Games, Western Power Distribution).
Q12: How can the FYP support your aims and ambitions?
▪ Building infrastructure, providing education and ‘levelling the playing field in planning against other developers’ (Orbit Group).
▪ Securing and enabling funding central and bringing down costs of innovative low carbon products mentioned by some (Stonewater, Bromford, CFRC
University of Wolverhampton).
▪ Setting clear focus and priorities was mentioned by several respondents, some also pointed to sharing ambitions and knowledge (e.g. South & City
College, Midlands Energy Hub).
▪ Some mentioned specifics, e.g. Birmingham City University focused on transport, procurement and planning commitments and requirements.
▪ ‘Co-ordination for the deployment of retrofit measures’ (Bromford).
▪ Several respondents left this question blank. Others were unsure (e.g. SIPS Education, Built Environment Climate Change Solutions).
Q13: Is there anything else you would like to add?
▪ Orbit Group discussed the importance of working with other social housing landlords, ensuring people have appropriate skills and queried suitable
sustainable supply chain frameworks (asking for specific feedback).
▪ Climate Action Network West Midlands left a comment stating that ‘carbon neutral by 2041 is too late’.
▪ Birmingham City University indicated that they would like to be ‘kept in the loop’ with future West Midlands Combined Authority developments in this
area.
▪ Midlands Energy Hub wanted to see ‘more ambitious actions’ from West Midlands Combined Authority.
Page 289

Page 40
▪ Accord Housing Association left a comment that ‘There is a need to understand that this will take time and investment to see a ROI, having greater
impact.’
▪ Tyseley Energy Park emphasised the importance of developing an integrated approach to aspects such as power, transport, heat, waste and recycling
across the west Midlands.
▪ Respondent queried whether there should be more appeal to the public for action, and whether there could be more incentives for people to look after
planet.
▪ Bryt Energy raised a concern about the impact of COVID and the fact that some solutions are ‘not breakeven by 3-5 years.
Page 290

www.wsp.com
APPENDIX C – GIS MAPPING
MAPPING LAYERS
Geographic Information System (GIS) mapping was undertaken as part of this project in order to help quantify the land
availability for utility scale Photovoltaics and Wind generation as well as large-scale afforestation / carbon
sequestration.
The methodology employed considered the area within the boundaries of the seven local authorities as a whole. From
this, 35 additional mapping layers were overlaid to exclude locations which were deemed not suitable; these varied for
each of the three maps generated. Typically, the approach has been conservative where possible such as not
including historic landfill sites for solar and only considering areas with wind speeds @45m >6.5m/s.
Table 1 - GIS Layers
SR.
NO
DATASET AVAILABLE FOR
ENGLAND SOLAR WIND
CARBON
SEQUESTRATION REMARK
1 Agricultural Land Classification
Grades Post 1988 Survey
Exclude Grade 1,
2, 3a & 5
Exclude Grade 1,
2, 3a & 5
Exclude Grade 1,
2, 3a & 5
2 Ancient Woodland Exclude Exclude Exclude
3 Areas of Outstanding Natural
Beauty
N/A N/A N/A None in Area of Interest
(AOI)
4 Battlefields N/A N/A N/A None in AOI
5 Built Up Areas Exclude Exclude Exclude 100m buffer
6 Country Parks Exclude Exclude Exclude
7 Countryside and Rights of Way
(CRoW)
Exclude Exclude Exclude Areas of Registered
Common Land
8 Doorstep Greens Exclude Exclude Exclude
9 England Coast Path Route N/A N/A N/A None in AOI
10 Flood Zone2 Include Include Exclude
11 Flood Zone3 Exclude Exclude Exclude
12 Heritage Coasts N/A N/A N/A None in AOI
13 Historic Landfill No No Exclude
14 Listed Buildings No apply 20m
buffer around
No apply 20m
buffer around
Exclude 20m buffer
15 Local Authority Greenbelt
boundaries
Exclude Exclude Include Greenbelt land can be
planted on, do not Exclude
16 Local Nature Reserves Exclude Exclude Exclude
17 Millennium Greens Exclude Exclude Exclude 20m buffer
18 National Grid Tower Exclude Exclude Exclude 20m buffer
Page 291

Page 2
19 National Grid Substation Exclude Exclude Exclude 100m buffer
20 National Grid Cable Exclude Exclude Exclude 10m buffer
21 National Nature Reserves Exclude Exclude Exclude
22 National Parks N/A N/A N/A None in AOI
23 National Trails N/A N/A N/A None in AOI
24 Noabl (Wind Speed) N/A Exclude areas
<6.5m/s
N/A Use 45m surface, >=6.5 m/s
should be included
25 Parks and Gardens Exclude Exclude Exclude
26 Permitted Waste Sites
Authorised Landfill
Exclude Exclude Exclude
27 Priority Habitat Exclude Exclude Exclude
28 Provisional Agricultural Land
Classification
Exclude Class 1,
2 & 5
Exclude Class 1,
2 & 5
Exclude Class 1, 2
& 5
3 & 4 can be used for all
types, do not exclude
29 Ramsar N/A N/A N/A None in AOI
30 Scheduled Monuments Exclude Exclude Exclude
31 Sites of Special Scientific
Interest
Exclude Exclude Exclude
32 Special Areas of Conservation Exclude Exclude Exclude
33 Special Protection Areas N/A N/A N/A None in AOI
34 Statutory Main River Exclude Exclude Exclude 5m buffer
35 World Heritage Sites N/A N/A N/A None in AOI
Page 292

Page 3
MAPPING RESULTS
For photovoltaics (solar farms), the 896ha of land was identified (parcels of land over 0.1 ha) and 875ha was identified
as being at least 1ha. The trend here was for limited parcels of large areas of land being identified. Eleven parcels of
land were identified as part of this assessment as being over 10ha; and totalling 630ha (70% of the total land
available). Whilst consideration of DNO connections were not considered at this point, the areas identified should be
further investigated and prioritised if considered suitable.
Figure 1 -GIS Mapping of Solar Capacity (Highlighted in Orange)
Page 293

Page 4
For Wind generation potential, the 389ha of land was identified (parcels of land over 0.1 ha). In total 52 sites were
identified. As different wind turbines have different efficiencies, different assumptions were made for the potential of
larger land parcels (82% of which was more than 10ha).
Figure 2 - GIS Mapping of Wind Capacity (Highlighted in Pink)
Page 294

Page 5
For natural capital (Afforestation), the 13,102ha of land was identified (parcels of land over 0.1 ha) and 13,040ha was
identified as being at least 1ha. Again, the trend here was for limited parcels of large areas of land being identified.
Nineteen parcels of land were identified as part of this assessment as being over 100ha; and totalling 11,394ha (87%
of the total land available).
Figure 3 - GIS Mapping of Afforestation Potential (Highlighted in Blue)
As the three mapping exercises were undertaken independently, there has been no consideration for overlapping
areas or prioritisation. As many of the mapping layers considered and criteria used were similar there is overlap in the
areas identified. As such it is not viable to undertake all three of these initiatives to their full potential. In addition, this
assessment has only considered the techno-economic requirements; practically there are further constraints around
land ownership, land use prioritisation and other constraints which will need to be considered.
Table 2 - GIS Summary of Results
PARCEL SIZE
SOLAR FARMS WIND TURBINES AFFORESTATION
No. Area (ha) No. Area (ha) No. Area (ha)
>0.1ha 135 896 52 389 345 13,102
>1ha 76 874 27 379 168 13,040
>10ha 11 631 5 320 59 12,662
Page 295

Page 6
In addition to the main afforestation areas available, it was felt important to show how urban trees could provide
significant decarbonisation benefits as well as the benefits around the five principles of WM2041, in terms of improving
the West Midlands as a place to live across a wider area. To do this the “non-continuous urban” area was identified as
locations where trees could be planted, albeit at 3.6% of the density of that used for forestry. These areas are shown
below.
Figure 4 - GIS Mapping of peri-urban tree Potential (Highlighted in Red)
Page 296
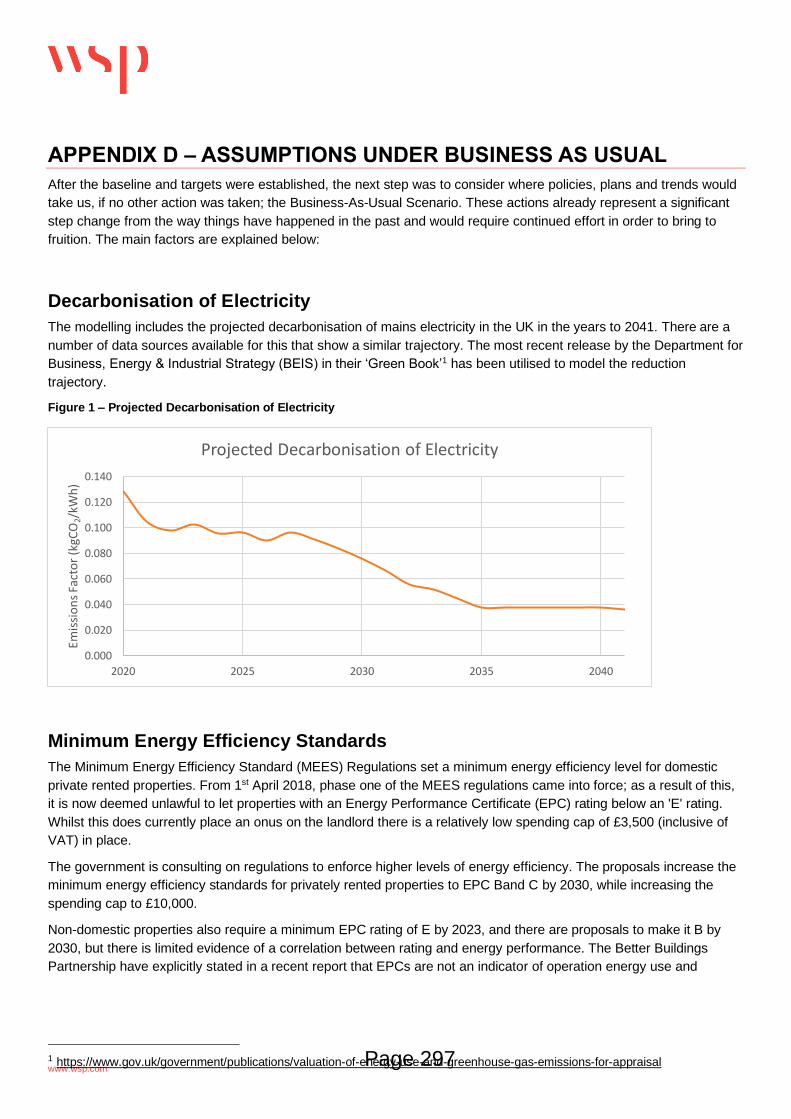
www.wsp.com
APPENDIX D – ASSUMPTIONS UNDER BUSINESS AS USUAL
After the baseline and targets were established, the next step was to consider where policies, plans and trends would
take us, if no other action was taken; the Business-As-Usual Scenario. These actions already represent a significant
step change from the way things have happened in the past and would require continued effort in order to bring to
fruition. The main factors are explained below:
Decarbonisation of Electricity
The modelling includes the projected decarbonisation of mains electricity in the UK in the years to 2041. There are a
number of data sources available for this that show a similar trajectory. The most recent release by the Department for
Business, Energy & Industrial Strategy (BEIS) in their ‘Green Book’1 has been utilised to model the reduction
trajectory.
Figure 1 – Projected Decarbonisation of Electricity
Minimum Energy Efficiency Standards
The Minimum Energy Efficiency Standard (MEES) Regulations set a minimum energy efficiency level for domestic
private rented properties. From 1st April 2018, phase one of the MEES regulations came into force; as a result of this,
it is now deemed unlawful to let properties with an Energy Performance Certificate (EPC) rating below an 'E' rating.
Whilst this does currently place an onus on the landlord there is a relatively low spending cap of £3,500 (inclusive of
VAT) in place.
The government is consulting on regulations to enforce higher levels of energy efficiency. The proposals increase the
minimum energy efficiency standards for privately rented properties to EPC Band C by 2030, while increasing the
spending cap to £10,000.
Non-domestic properties also require a minimum EPC rating of E by 2023, and there are proposals to make it B by
2030, but there is limited evidence of a correlation between rating and energy performance. The Better Buildings
Partnership have explicitly stated in a recent report that EPCs are not an indicator of operation energy use and
1 https://www.gov.uk/government/publications/valuation-of-energy-use-and-greenhouse-gas-emissions-for-appraisal
0.000
0.020
0.040
0.060
0.080
0.100
0.120
0.140
2020 2025 2030 2035 2040
Emis
sio
ns
Fact
or
(kgC
O2/
kWh
)
Projected Decarbonisation of Electricity
Page 297

Page 2
according to their data there is no correlation between EPC rating and how efficiently a building uses energy2. For this
reason, a benefit has not been applied in the modelling.
Whilst it is generally true that a property with a better EPC rating would consume less energy (gas and electricity) and
the government is pushing a ‘fabric first’ approach, this is not necessarily the case3.
Figure 2 - Average annual consumption of domestic properties by energy efficiency band, 2015
Housing Growth
Each of the seven local authorities within the West Midlands Combined Authority are projecting growth in housing for
the foreseeable future4,5. These studies indicate an objective assessment of needs totalling 10,875 dwellings per
annum for at least the next decade. The assumption made within the modelling is that this need is fully met each year.
The mix of housing types would broadly match the current typology across the region and meet minimum size
guidance.
In the short term to 2025, the assumed energy consumption associated with these dwellings is current new build
standards and utilising gas boilers to provide heating and hot water. Post-2025, it is assumed the ‘Future Homes
Standard’ will be in place and that gas boilers for new build developments will not be allowed. Instead it has been
assumed air-source heat pumps would nominally be installed, although the actual mix of technologies may include
other types of heat pump in the short term and potentially other technologies further out in time.
2https://www.betterbuildingspartnership.co.uk/sites/default/files/media/attachment/Call%20for%20evidence%20-%20Energy%20Performance%20Certificates%20in%20Buildings.pdf 3https://assets.publishing.service.gov.uk/government/uploads/system/uploads/attachment_data/file/669734/Domestic_Energy_Consumption_by_Energy_Efficiency_and_Environmental_Impact.pdf 4 Greater Birmingham and Black Country Housing Market Area (GBBCHMA) Housing Need and Housing Land Supply Position Statement 5 Coventry City Council Strategic Housing Land Availability Assessment (SHLAA) Page 298

Page 3
Commercial Growth
Due to the uncertainty over the last year brought about by the COVID-19 pandemic, there is a degree of caution
around the projections for commercial growth. The data used have been provided by the West Midlands Growth
Company and are outlined below:
Table 1 – Commercial Growth Assumptions
SECTOR
CURRENT
EMPLOYMENT
10-YEAR
FORECAST % CHANGE
Processional Services 200,000 14,823 7%
Business Services 250,000 17,521 7%
Health and Care 400,000 10,000 3%
Hospitality and Leisure 180,000 12,212 7%
Transport and Logistics 190,000 8,333 4%
Construction 160,000 3,939 2%
Education 260,000 2,500 1%
Public Sector 750,000 38,404 5%
Tech and digital 70,000 3,585 5%
Advanced Engineering 50000 4339 9%
Arts and Entertainment 70000 8127 12%
Manufacturing 230000 -27000 -12%
Wholesale and Retail 460000 -6000 -1%
Electrification / Hydrogen use in transport
There are several datasets projecting the change of fuels in surface transport. Although the data used here are
focused on electrification, due to the timeline, this may involve hydrogen in the future.
The Transport Analysis Guidance (TAG) data book was used to understand what a conservative outlook on how
vehicle fuel use may change to 2041. the spreadsheet produced by the Department for Transport provides the
proportion of cars, light goods vehicles (LGVs) and other vehicles mileage using petrol, diesel and electricity. Within
this data book, vehicles are projected to electrify such that 34% of cars are powered by electricity by 2041 and 16% of
LGVs. It also projects that other types of road vehicles will remain unchanged in fuel use.
More recently there has been announced a ban on the sale of new internal combustion engine cars by 2030. Again, a
conservative approach has been considered for this with no change over the expected trajectory, and then the
modelling of the effect of stock turnover from 2030.
Assuming electric cars are sold at the same rate as current new cars, we would see almost complete electrification by
2041. That being said, there may be changes in behaviour such as a surge in purchasing prior to the ban (consumers
bringing forward purchasing) or stock dumping by retailers or a culture of maintaining ICE cars developing post 2030
which would mean stock turnover would take longer. It is also possible that prior to 2030 the sale of electric cars
gradually increases as infrastructure improvements accelerate and acceptance of the technology becomes
widespread.
Page 299

Page 4
During the stakeholder engagement process, the decarbonisation of railways was also explored. Whilst there are
several competing technologies each with their own strengths and weaknesses, of the 15,400 single track kilometres
(STK) of unelectrified rail network in Great Britain, the vast majority will be electrified; particularly so in the West
Midlands
Figure 3 – Traction Decarbonisation Strategy
Council Decarbonisation
Five of the seven local authorities have committed to decarbonising their estate emissions. These are summarised
below where data was available.
Table 2 – Local Authority Estate Emissions
LOCAL AUTHORITY COUNCIL ESTATE TARGET SCOPE 1 (TCO2) SCOPE 2 (TCO2)
Birmingham 2030 7,595 24,093
Coventry N/A 4,098 5,805
Dudley N/A - -
Sandwell 2030 10,485 9,841
Solihull 2030 1,514 1,727
Walsall 2050 6,541 11,331
Wolverhampton 2028 7,649 8,043
Page 300

Page 5
Organisation Decarbonisation
Several large organisations have also committed to becoming zero carbon over the next 20 years. This includes
Birmingham Airport and Jaguar Land Rover. The combined benefit of these commitments has been estimated.
Summary of Committed Projects
As part of the stakeholder engagement and literature review a list of 71 separate actions were identified across the
seven local authorities and the West Midlands Combined Authority as a whole. These were filtered to understand a)
projects which were sufficiently committed such that there was a decent probability of it going ahead, and b) were of
significant size in terms of GHG reduction (i.e. represented at least 0.1% of GHG emissions of the West Midlands
Combined Authority).
The result was a set of seven actions, five of which related to local authority estate emissions (as per the above table).
The remaining actions include:
▪ Birmingham airport’s commitment to be zero carbon by 2033
▪ Jaguar Land rover’s commitment to be zero carbon by 2030
▪ The ‘Virtual Forest’ aims to plant 4 million trees in the wider West Midlands (1 for every person)
▪ Birmingham’s Clean Air Zone
Page 301

This page is intentionally left blank

www.wsp.com
APPENDIX E – MODELLING GOALS’ ASSUMPTIONS
The modelling carried out as part of this project was done using WSP’s local authority carbon model (which can also
be applied to multiple local authorities, as it was done in this project). This model was created to assist in the
quantification of baseline GHG emissions as well as the potential cumulative benefits of a range of project-specific
carbon reduction measures or goals. Some of these processes have been automated. The main sources of this model
are the sub-national dataset of total final energy consumption statistics1, journey to work statistics2, and government
conversion factors3.
In addition, for each of the measures or goals modelled, four levels ranging from “Very High” to “Low” have been
developed, which vary the level of ambition for each goal. This was automated so that each scenario selected the right
level of ambition for each goal.
The measures or goals were largely based on specific West Midlands literature or reports, input from the stakeholders
consulted throughout this project, as well as wider available projections, such as those from the CCC, and WSP’s own
calculations.
A breakdown of the results is shown below, with carbon reductions provided for each goal and each scenario.
Table 1 - Summary Goal CO2 Emission Reductions
Sector
Goal
Scenarios
Very High High Medium Low
2025 2040 2025 2040 2025 2040 2025 2040
Domestic Energy Efficiency Retrofit -452.9 -452.9 -226.4 -452.9 -113.2 -452.9 -46.8 -187.1
Domestic Heating System Retrofit -2237.8 -2741.4 -559.4 -2741.4 -37.3 -1395.6 -26.5 -777.3
Domestic Solar PV -123.2 -47.8 -61.6 -47.8 -30.8 -47.8 -23.1 -35.9
Commercial Energy Efficiency -298.7 -218.3 -149.4 -218.3 -74.7 -218.3 -37.3 -218.3
Commercial Heating System Retrofit -161.5 -204.4 -40.4 -204.4 -2.7 -96.3 -1.9 -58.0
Commercial Solar PV -104.8 -40.7 -52.4 -40.7 -26.2 -40.7 -19.7 -30.5
Industrial Energy Efficiency and Fuel
Switching
-120.1 -682.2 -120.1 -682.2 -108.9 -619.2 -117.6 -610.6
Industrial Solar PV -14.2 -5.5 -7.1 -5.5 -3.6 -5.5 -2.7 -4.1
Transport Demand Reduction
(Digital Connectivity) -148.1 -115.0 -37.0 -115.0 -27.8 -86.2 -18.5 -57.5
Transport Bus and Taxi Electrification
-181.1 -181.1 -90.6 -181.1 -60.4 -181.1 -45.3 -181.1
Transport Demand Reduction -160.1 -156.7 -34.7 -107.4 -17.3 -53.7 -8.7 -26.8
Transport HGV Electrification -103.8 -499.1 -103.8 -499.1 -69.2 -332.7 -51.9 -249.6
Transport Mode Shift -1306.0 -1306.0 -213.3 -772.2 -187.9 -661.8 -146.4 -444.4
Transport Accelerated EV Uptake -197.5 -513.7 -197.5 -513.7 -188.1 -516.7 -161.2 -511.3
Land-Use Afforestation -31.6 -442.4 -31.6 -442.4 -19.9 -278.3 -14.9 -101.0
Land-Use Renewables -100.1 -38.9 -50.1 -38.9 -24.4 -38.7 -23.7 -38.5
1 https://www.gov.uk/government/collections/total-final-energy-consumption-at-sub-national-level 2 https://www.nomisweb.co.uk/census/2011/qs701ew 3 https://www.gov.uk/government/collections/government-conversion-factors-for-company-reporting
Page 303

Page 2
A full breakdown of all assumptions per goal is provided below:
Domestic Energy Efficiency Retrofit
This goal considered a basic retrofit package considering the potential of a number on measured designed to reduce
heating consumption. This goal considered the fact that some homes will have already had some of these measures
installed. The energy efficiency measures are considered to only impact on energy consumption for space heating.
The energy savings for each measure have been taken from a variety of sources, which is provided in the table below.
Behavioural change is not captured in this goal, and as such the energy efficiency savings from each measure have
been assumed in full. However, it is widely recognised that energy consumption typically increases after energy
efficiency measures are installed (i.e. the ‘rebound’ effect), thereby reducing the amount of energy savings eventually
achieved. Energy efficiency improvements from Minimum Energy Efficiency Standards regulations have been included
under Business as Usual scenarios, and as such discounted from the effect of this goal.
Household energy use has been taken from NEED Framework data (End-Use tables). The number of properties in the
West Midlands Combined Authority has been taken from Council Tax Data (Table CTSOP3.0). In addition, the number
of properties per ownership type was obtained from Government data.
Table 2 – Energy savings and applicability of energy efficiency measures considered in the Domestic Efficiency Retrofit goal
Measure Energy Saving Applicability Total Saving
Smart Thermostats 6.7%4 94.0%5 6.3%
Smart Meters 2.2%6 69.1%7 1.5%
Cavity Wall Insulation 10.2%8 14.0%9 1.4%
Solid Wall Insulation 17.7%8 27.0%9 4.8%
Loft Insulation 6.3%8 18.2%9 1.1%
Double Glazing 15.0%10 6.7%11 1.0%
MEES -1.5% 41.3% -0.6%
Domestic Heat Pump Retrofit
This goal considers the benefit of replacing current fossil fuel heating systems (assumed as gas boilers as they are
the predominant technology) within dwellings with heat pumps. It has been assumed that the majority of them will be
air source heat pumps, and a conservative heat pump seasonal CoP of 2.65 has been used.
The energy consumption of dwellings was based on that of the previous goal (based on NEED framework data12), with
the effect of energy efficiency measures already considered, in order to avoid double counting. The pace of the energy
efficiency goal is higher than that of the domestic heat pump retrofit, so it has been assumed that energy efficiency
measures have taken place before or at the time of retrofitting a heat pump.
The number of dwellings considered was based around current targets set by the CCC13 (of around a million heat
pumps installed per year, nationally, by 2030) and the Government’s Ten Point Plan14 (of 600,000 heat pumps
installed per year by 2028). In addition, the high scenario assumes a linear deployment trajectory to 2041, where all
homes will be retrofitted (except the fraction which already has a heat pump). The number of installed heat pumps
currently installed and total number of heat pumps installed were based on data from the Heat Pump Association15.
4 https://www.bi.team/publications/evaluating-the-nest-learning-thermostat/ 5 http://campaign.yougov.com/rs/060-QFD-941/images/YouGov_UK_2018_08_smart_homes.pdf 6 https://assets.publishing.service.gov.uk/government/uploads/system/uploads/attachment_data/file/830668/smart-meters-benefits-realisation.pdf 7 https://www.gov.uk/government/statistics/smart-meters-in-great-britain-quarterly-update-june-2020 8 https://yougov.co.uk/topics/technology/articles-reports/2018/08/10/almost-quarter-britons-now-own-one-or-more-smart-h 9 https://www.gov.uk/government/statistics/household-energy-efficiency-statistics-detailed-report-2018 10 https://energysavingtrust.org.uk/home-energy-efficiency/energy-efficient-windows 11 https://www.gov.uk/government/statistics/english-housing-survey-2018-energy-report 12 https://www.gov.uk/government/statistics/energy-consumption-in-the-uk 13 https://www.theccc.org.uk/publication/sixth-carbon-budget/ 14 https://www.gov.uk/government/publications/the-ten-point-plan-for-a-green-industrial-revolution 15 https://www.heatpumps.org.uk/wp-content/uploads/2019/11/A-Roadmap-for-the-Role-of-Heat-Pumps.pdf Page 304

Page 3
National figures were scaled down to the West Midlands Combined Authority based on the number of dwellings,
obtained from UK16, Scottish17 and Northern Irish18 Government sources. The uptake trajectories are provided below
(new-build installations have been removed, as those are already considered under the Business as Usual scenario):
Table 3 – Domestic heat pump installation trajectories per scenario
Year Annual Installations
High Medium Low
2020 809 809 809
2021 55,645 1,700 1,575
2022 55,645 2,266 1,874
2023 55,645 2,954 2,144
2024 55,645 4,249 2,790
2025 55,645 5,828 3,493
2026 55,645 11,493 7,444
2027 55,645 17,280 11,130
2028 55,645 22,825 14,304
2029 55,645 28,288 17,121
2030 55,645 34,804 20,340
2031 55,645 35,896 21,046
2032 55,645 37,029 21,778
2033 55,645 38,163 22,510
2034 55,645 39,215 23,190
2035 55,645 40,429 23,974
2036 55,645 41,675 24,780
2037 55,645 42,956 25,607
2038 55,645 44,270 26,456
2039 55,645 45,620 27,328
2040 55,645 47,005 28,224
2041 55,645 48,428 29,143
Total 1,178,260 602,086 365,962
Domestic Solar PV
This goal considers the impact of installing rooftop solar on existing dwellings. For this, the Birmingham PV Study
(provided by the WMCA, as it is not publicly available) a GIS analysis to determine the potential for solar rooftop and
ground-mounted potential across Birmingham City Council. This has been extrapolated to the rest of the WMCA
based on the number of domestic dwellings19. The results of this were validated by comparing against regional
Western Power Grid projections20 for 2030 for the West Midlands, based on the Future Energy Scenarios
methodology, and adjusted CCC projections21 for rooftop solar PV potential by 2050 on a national scale.
A conservative capacity factor (which represents the energy yield of a technology) of 9.7% (equivalent to 850
kWh/kWp) was used.
16 https://www.gov.uk/government/statistics/council-tax-stock-of-properties-2019 17 https://www.nrscotland.gov.uk/statistics-and-data/statistics/statistics-by-theme/households/household-estimates/2019 18 https://www.communities-ni.gov.uk/topics/housing-statistics 19 https://www.gov.uk/government/statistics/council-tax-stock-of-properties-2019 20 https://www.westernpower.co.uk/downloads/4025 21 https://d423d1558e1d71897434.b-cdn.net/wp-content/uploads/2019/05/20200418-CCC-Accelerated-Electrification-final-report.pdf
Page 305

Page 4
A summary of the results of these calculations is shown below:
Table 4 – Results for the Domestic Solar PV goal
Local Authority No. Dwellings PV Potential PV Generation
Birmingham 444,440 312,900 kW 265,965,000 kWh
Coventry 142,770 100,515 kW 85,437,456 kWh
Dudley 138,740 97,677 kW 83,025,794 kWh
Sandwell 133,620 94,073 kW 79,961,847 kWh
Solihull 92,500 65,123 kW 55,354,519 kWh
Walsall 116,210 81,816 kW 69,543,229 kWh
Wolverhampton 109,980 77,429 kW 65,815,027 kWh
WMCA 1,178,260 829,533 kW 705,102,873 kWh
Commercial Energy Efficiency
This goal considered the installation of a series of energy efficiency measures on a range a non-domestic building
types. Data for the number and floor area of non-domestic properties per type and per local authority was obtained
from UK government data22, as well as energy usage per fuel and end-use for offices, retail and other commercial
buildings23. The energy intensity (per floor area) for each type of building is then calculated at a national level and,
using the number of different types of non-domestic properties across the WMCA, the total WMCA energy
consumption is obtained. The results for offices, retail and other buildings are shown below:
The ‘other buildings’ category comprises several types of buildings and sectors, such as education, health, hospitality
or arts and leisure. The combined energy consumption of these types of buildings was based on the number of jobs
for each subsector, which were provided by WMCA.
The abatement potential for each type of building, (e.g. office, retail, other) was taken from the Business Energy
Efficiency Survey24. A breakdown of those savings was provided as part of the description of Goal 5 in the main
report.
Table 5 – Total energy usage in office buildings in the WMCA, per fuel and end-use
Energy Usage
Fuel (kWh)
Electricity Gas Oil District Heating
Other Total
Heating 95,431,128 532,719,490 76,938,265 6,424,585 63,875,061 775,388,530
Hot Water 28,477,797 37,901,308 35,818,889 361,088 4,893,086 107,452,168
Cooling 112,117,059 1,095,211 21,509,731 0 0 134,722,002
Fans 73,259,880 0 0 0 0 73,259,880
Lighting 152,260,363 0 0 0 0 152,260,363
Subtotal 461,546,228 571,716,009 134,266,886 6,785,673 68,768,147 1,243,082,943
Other 521,773,114 22,027,976 36,334,532 21,178 17,052 580,139,935
Total 983,319,342 593,743,985 170,601,417 6,764,495 68,751,095 1,823,222,878
22 https://www.gov.uk/government/statistics/non-domestic-rating-stock-of-properties-2020 23 https://www.gov.uk/government/statistics/energy-consumption-in-the-uk 24 https://www.gov.uk/government/publications/building-energy-efficiency-survey-bees
Page 306

Page 5
Table 6. Total energy usage in retail commercial buildings in the WMCA, per fuel and end-use
Energy Usage
Fuel (kWh)
Electricity Gas Oil District Heating
Other Total
Heating 11,302,206 444,668,199 57,743,813 17,427,020 38,783,712 418,537,522
Hot Water 6,674,418 107,918,752 14,407,747 1,789,681 9,251,832 104,616,291
Cooling 12,723,860 117,563 61,147 16,821 0 12,867,453
Fans 27,453,234 0 0 0 0 27,453,234
Lighting 44,945,732 0 0 0 0 44,945,732
Subtotal 100,097,280 405,891,298 53,031,066 14,124,580 35,276,009 608,420,232
Other 39,644,680 57,418,150 4,304,478 1,036,095 10,571,611 112,975,014
Total 139,741,960 463,309,448 57,335,543 15,160,675 45,847,619 721,395,246
Table 7. Total energy usage in other commercial buildings in the WMCA, per fuel and end-use
Energy Usage
Fuel (kWh)
Electricity Gas Oil Distric Heating
Other Total
Heating 11,302,206 444,668,199 57,743,813 17,427,020 38,783,712 418,537,522
Hot Water 6,674,418 107,918,752 14,407,747 1,789,681 9,251,832 104,616,291
Cooling 12,723,860 117,563 61,147 16,821 0 12,867,453
Fans 27,453,234 0 0 0 0 27,453,234
Lighting 44,945,732 0 0 0 0 44,945,732
Subtotal 100,097,280 405,891,298 53,031,066 14,124,580 35,276,009 608,420,232
Other 39,644,680 57,418,150 4,304,478 1,036,095 10,571,611 112,975,014
Total 139,741,960 463,309,448 57,335,543 15,160,675 45,847,619 721,395,246
Commercial Heat Pump Retrofit
This goal considers the benefit of replacing current fossil fuel heating systems (predominantly gas boilers) within
commercial properties with air source heat pumps. It uses energy consumption data from the previous goal, in order to
avoid double counting. The heating CoP of the replacement heat pumps has been assumed to be of 2.75.
The replacement trajectories have been assumed to be equivalent to those in the domestic heat pump retrofit goal,
adjusted to cover all 74,040 retail, office and other commercial buildings. A breakdown of non-domestic buildings in
the WMCA seven local authorities is provided below:
Table 8 – Breakdown of non-domestic buildings across WMCA’s local authorities
LA Type
Retail Office Industry Other All
Birmingham 11,230 8,960 9,980 17,510 47,680
Coventry 2,630 1,660 2,220 2,350 8,860
Dudley 2,790 1,730 3,760 2,380 10,670
Sandwell 2,920 1,030 4,490 2,790 11,220
Page 307
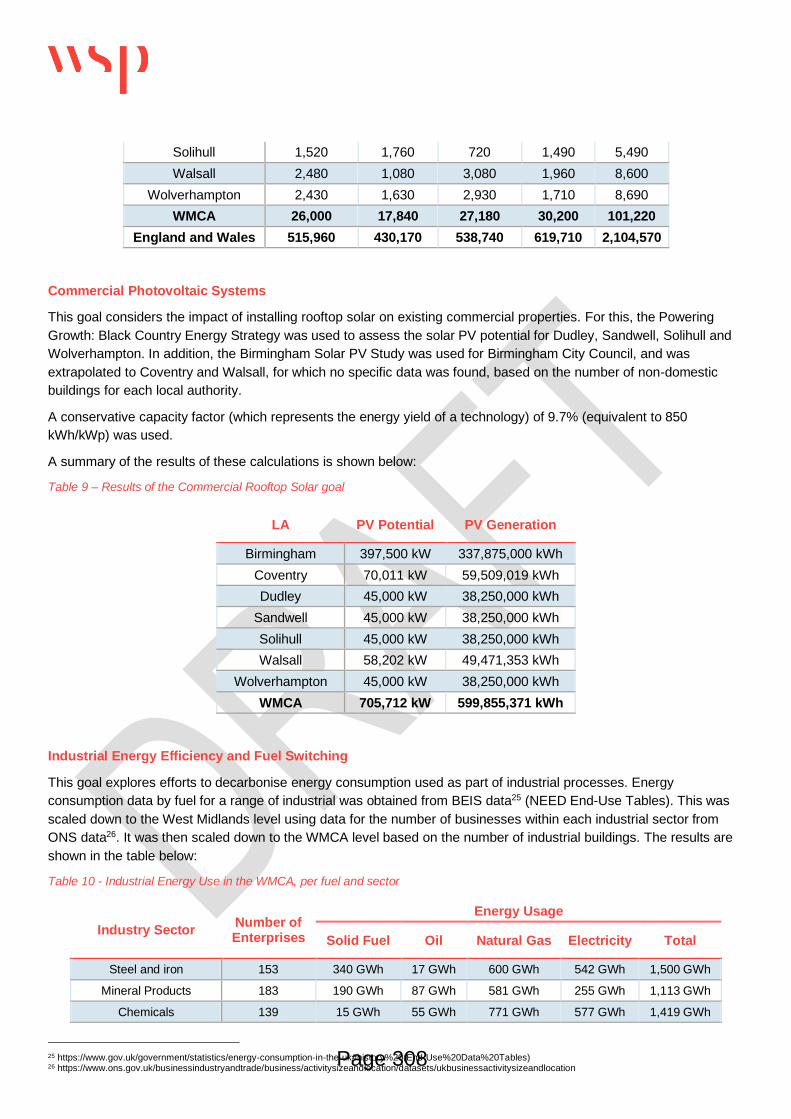
Page 6
Solihull 1,520 1,760 720 1,490 5,490
Walsall 2,480 1,080 3,080 1,960 8,600
Wolverhampton 2,430 1,630 2,930 1,710 8,690
WMCA 26,000 17,840 27,180 30,200 101,220
England and Wales 515,960 430,170 538,740 619,710 2,104,570
Commercial Photovoltaic Systems
This goal considers the impact of installing rooftop solar on existing commercial properties. For this, the Powering
Growth: Black Country Energy Strategy was used to assess the solar PV potential for Dudley, Sandwell, Solihull and
Wolverhampton. In addition, the Birmingham Solar PV Study was used for Birmingham City Council, and was
extrapolated to Coventry and Walsall, for which no specific data was found, based on the number of non-domestic
buildings for each local authority.
A conservative capacity factor (which represents the energy yield of a technology) of 9.7% (equivalent to 850
kWh/kWp) was used.
A summary of the results of these calculations is shown below:
Table 9 – Results of the Commercial Rooftop Solar goal
LA PV Potential PV Generation
Birmingham 397,500 kW 337,875,000 kWh
Coventry 70,011 kW 59,509,019 kWh
Dudley 45,000 kW 38,250,000 kWh
Sandwell 45,000 kW 38,250,000 kWh
Solihull 45,000 kW 38,250,000 kWh
Walsall 58,202 kW 49,471,353 kWh
Wolverhampton 45,000 kW 38,250,000 kWh
WMCA 705,712 kW 599,855,371 kWh
Industrial Energy Efficiency and Fuel Switching
This goal explores efforts to decarbonise energy consumption used as part of industrial processes. Energy
consumption data by fuel for a range of industrial was obtained from BEIS data25 (NEED End-Use Tables). This was
scaled down to the West Midlands level using data for the number of businesses within each industrial sector from
ONS data26. It was then scaled down to the WMCA level based on the number of industrial buildings. The results are
shown in the table below:
Table 10 - Industrial Energy Use in the WMCA, per fuel and sector
Industry Sector Number of Enterprises
Energy Usage
Solid Fuel Oil Natural Gas Electricity Total
Steel and iron 153 340 GWh 17 GWh 600 GWh 542 GWh 1,500 GWh
Mineral Products 183 190 GWh 87 GWh 581 GWh 255 GWh 1,113 GWh
Chemicals 139 15 GWh 55 GWh 771 GWh 577 GWh 1,419 GWh
25 https://www.gov.uk/government/statistics/energy-consumption-in-the-uk#history%20(End-Use%20Data%20Tables) 26 https://www.ons.gov.uk/businessindustryandtrade/business/activitysizeandlocation/datasets/ukbusinessactivitysizeandlocation Page 308

Page 7
Mechanical Engineering 2,387 5 GWh 0 GWh 742 GWh 428 GWh 1,176 GWh
Electrical Engineering 354 1 GWh 0 GWh 124 GWh 243 GWh 369 GWh
Vehicles 319 21 GWh 118 GWh 338 GWh 253 GWh 730 GWh
Food and beverages 380 17 GWh 42 GWh 718 GWh 407 GWh 1,184 GWh
Textiles, leather 315 16 GWh 18 GWh 101 GWh 95 GWh 229 GWh
Paper, printing 486 25 GWh 14 GWh 172 GWh 387 GWh 599 GWh
Other industries 1,709 205 GWh 29 GWh 495 GWh 1,325 GWh 2,054 GWh
Total 6,425 836 GWh 381 GWh 4,643 GWh 4,514 GWh 10,373 GWh
The role for each of the technologies and measures identified has been defined based on a literature review, which
included Element Energy and Jacobs’ Industrial Fuel Switching Market Engagement Study27, WSP’s Industry
Decarbonisation Pathways report series28, the EU hydrogen strategy29 and an academic paper on the potential for
electrification of industrial heat30. Further detail on how this goal was modelled is provided in this goal’s description.
Industrial Photovoltaic Systems
This goal considers the impact of installing rooftop solar on existing industrial properties. The 2050 potential for
rooftop PV31 at a national scale, as estimated by Vivid Economics, is scaled down to the WMCA level based on the
relative number of industrial buildings32. The amount of PV installed on industrial premises relative to domestic and
commercial buildings is taken from Ofgem’s FiTS data33 from September 2020 on historical installations.
While there is potential for solar PV to contribute to industry’s electricity demand, this is something that hasn’t
significantly been taken up so far in the WMCA area – with existing installations under the FiT scheme only amounting
to 2.5 MW across 25 installations. This is also a trend at a national level, with only slightly over 5% of solar PV being
installed in an industrial setting (as per the Ofgem data).
Transport Demand Reduction
This goal considers the potential of reducing the number of commuting, retail and personal business trips from
increased remote working and digitalisation of services. This is assumed to be enabled by increased availability of fast
broadband connections, a higher flexibility in public and private sector policies around working arrangements and
other actions such as the creation of local flexible working spaces, thereby reducing commuting distances and the
need for public or private transportation.
Working population, employment level data and the fraction of people who can work from home (35%) was identified
from ONS research34, and the frequency they are able to from an academic paper35 from the Global e-Sustainability
Initiative. The emissions savings are based on the number of miles saved across cars and public transport, taken from
Government data36, as well as fuel efficiency data for petrol and diesel cars37. Fuel efficiency data for buses was taken
from real fuel consumption averages38 of buses across a number of routes, published by Transport for London.
Changes to the way in which we will travel in the future are considered to avoid double counting.
27 https://assets.publishing.service.gov.uk/government/uploads/system/uploads/attachment_data/file/824592/industrial-fuel-switching.pdf 28 https://www.gov.uk/government/publications/industrial-decarbonisation-and-energy-efficiency-roadmaps-to-2050 29 https://ec.europa.eu/commission/presscorner/detail/en/FS_20_1296 30 https://iopscience.iop.org/article/10.1088/1748-9326/abbd02/pdf 31 https://d423d1558e1d71897434.b-cdn.net/wp-content/uploads/2019/05/20200418-CCC-Accelerated-Electrification-final-report.pdf 32 https://www.gov.uk/government/statistics/non-domestic-rating-stock-of-properties-2020 33 https://www.ofgem.gov.uk/environmental-programmes/fit/contacts-guidance-and-resources/public-reports-and-data-fit/feed-tariffs-quarterly-report 34 https://www.ons.gov.uk/employmentandlabourmarket/peopleinwork/employmentandemployeetypes/bulletins/regionallabourmarket/march2020 35 http://www.gesi.org/research/download/13 36 https://www.gov.uk/government/statistical-data-sets/tsgb01-modal-comparisons 37 https://www.gov.uk/government/statistical-data-sets/energy-and-environment-data-tables-env 38 https://tfl.gov.uk/info-for/media/press-releases/2014/october/new-routemaster-buses-on-route-453
Page 309

Page 8
Data on the total retail and personal business trips distance is obtained from Government data. Reduction of car trips
considers the increased penetration of electric vehicles over time, in order to avoid overestimating carbon savings.
Transport Modal Shift
This goal analyses the carbon savings that can be achieved through a modal shift in the way we travel. It specifically
uses targets from the Movement for Growth strategy39 for car and bicycle usage, set for 2041 and 2033, respectively,
with car usage reducing from around 65% of trips to 35-45%, and bike trips make up 10% of all trips. In addition,
public transport is envisaged to cover a much larger proportion of trips. This is in line with some other European cities,
such as Munich, as reported in an academic paper40.
The number of trips for the West Midlands and fuel efficiency data has been obtained from Government data41,42
(specific to the West Midlands) to calculate savings. The total energy saving is split across fuels (petrol, diesel and
electricity) on an annual basis to avoid double counting carbon savings from electrification of transport.
The present and future distribution of trips in the WMCA (as per the High scenario) is compared to that of Munich in
the graph below:
Bus and Taxi Fleets
This goal explores the electrification of buses and taxis in the WMCA area. The number of licensed taxis and average
distanced travelled per person in the WMCA is taken from Government data43, 44. Fuel consumption and efficiency
data for ICE45 (Government data) and electric cars46 (Low Carbon Vehicle Partnership data) is used to calculate
gasoline and diesel savings and increased electricity consumption.
Petroleum total consumption for buses in the WMCA is available from the model (based on sub-national Government
data47) and fuel efficiency from London buses’ consumption averages48. Electric bus energy consumption is taken
from LowCVP data49.
39 https://www.tfwm.org.uk/strategy/movement-for-growth/ 40 https://www.researchgate.net/publication/301903071_Reducing_car_dependence_in_the_heart_of_Europe_Lessons_from_Germany_Austria_and_Switz_erland 41 https://www.gov.uk/government/statistical-data-sets/nts03-modal-comparisons 42 https://www.gov.uk/government/statistical-data-sets/energy-and-environment-data-tables-env 43 https://www.gov.uk/government/statistical-data-sets/taxi01-taxis-private-hire-vehilces-and-their-drivers 44 https://assets.publishing.service.gov.uk/government/uploads/system/uploads/attachment_data/file/833569/taxi-and-phv-england-2019.pdf 45 https://www.gov.uk/government/statistical-data-sets/energy-and-environment-data-tables-env 46 https://www.lowcvp.org.uk/initiatives/lceb/local-policy/lta-toolkit.htm 47 https://www.gov.uk/government/collections/total-final-energy-consumption-at-sub-national-level 48 https://tfl.gov.uk/info-for/media/press-releases/2014/october/new-routemaster-buses-on-route-453 49 https://www.lowcvp.org.uk/initiatives/lceb/local-policy/lta-toolkit.htm
Figure 1 – Comparison of transport modal share distribution in WMCA (current), in WMCA by 2041 and in Munich.
25.57% 27.00% 27.00%
10.00% 17.00%5.20%
26.81%23.00%
67.01%
35.00% 33.00%
0.00%
20.00%
40.00%
60.00%
80.00%
100.00%
120.00%
WMCA (2020) WMCA (2041) Munich
Mode Share
Walk Bicycle Public Transport Car
Page 310

Page 9
Heavy Goods Vehicle Fleet
This goal considers the decarbonisation of HGVs and its associated carbon reduction from lower consumption of
diesel. While there is still uncertainty in terms of the technology which will displace conventional HGVs, it has been
assumed that a direct-electric solution will be used, as it will provide the lowest operational costs. However, it is
acknowledged that other solutions, such as hydrogen, could have a role in the decarbonisation of HGVs. A hydrogen
solution will result in higher electricity requirements to decarbonise HGVs, owing to the energy lost in the production,
transportation and storage of hydrogen when compared to a direct-electric solution.
Petroleum total consumption for buses in the WMCA is available from the model (based on sub-national Government
data50). Fuel efficiency for HGVs is taken from Government data51, and energy efficiency for electric HGVs is taken
from an academic analysis carried out by Transport & Environment52. The amount of required electricity to
decarbonise HGVs can therefore be calculated.
Accelerated EV uptake
The Business as Usual scenario already considers the 2030 ICE ban for cars and vans announced by the
Government in November 2020, as part of their Ten Point Plan53. This has been modelled as a slow, natural
replacement cycle of vehicles over their life period out to 2050. However, the CCC’s most recent analysis, published in
December 2020, to meet their advised Sixth Carbon Budget , projects a much higher uptake of electric vehicles during
the 2020s and 2030s. As such, this goal considers the shift in carbon savings from the updated timeline.
This goal uses data from the CCC's recently released Sixth Carbon Budget54 on the projected trajectory for new EV
car sales55. Car sales in 2020 are taken from Government data. Car life is assumed as 14 years. The high goal uses
the Tailwinds scenario, the medium goal uses the Balanced Pathway scenario and the low goal uses the Headwinds
scenario. The EV uptake trajectory for each scenario can be seen below:
Table 11. EV uptake trajectories according to each of the CCC scenarios.
Year Tailwinds Balanced Pathway Headwinds
2020 1.19% 1.19% 1.19%
2021 1.48% 1.45% 1.37%
2022 2.43% 2.31% 2.01%
2023 3.96% 3.66% 2.89%
2024 6.45% 5.80% 4.11%
2025 10.48% 9.16% 5.80%
2026 14.95% 13.02% 7.98%
2027 19.93% 17.44% 10.81%
2028 25.47% 22.51% 14.50%
2029 31.65% 28.34% 19.32%
2030 38.54% 35.05% 25.64%
2031 45.37% 41.81% 32.03%
2032 52.14% 48.61% 38.50%
2033 58.85% 55.35% 45.04%
2034 65.50% 62.03% 51.68%
2035 71.57% 68.17% 57.97%
2036 77.26% 73.96% 64.05%
2037 82.38% 79.26% 69.86%
2038 86.60% 83.82% 75.32%
2039 89.40% 87.23% 80.30%
2040 91.75% 90.16% 84.79%
2041 93.60% 92.53% 88.65%
50 https://www.gov.uk/government/collections/total-final-energy-consumption-at-sub-national-level 51 https://www.gov.uk/government/statistical-data-sets/energy-and-environment-data-tables-env 52 https://www.transportenvironment.org/sites/te/files/publications/20180725_T%26E_Battery_Electric_Trucks_EU_FINAL.pdf 53 https://www.gov.uk/government/publications/the-ten-point-plan-for-a-green-industrial-revolution 54 https://www.theccc.org.uk/publication/sixth-carbon-budget/ 55 https://www.gov.uk/government/statistical-data-sets/all-vehicles-veh01 Page 311

Page 10
Land Use Natural Capital
This goal and the assumptions behind the calculations have been provided separately in Appendix C.
Land Use Renewables
This goal considered the potential for the development of large-scale renewable installations, namely onshore wind
and solar PV. This goal used input from the GIS analysis, which identified areas that are ideally suited for solar and
wind development. The list of constraints includes requirements on the type of land as well as resource constraints.
For wind developments, a density of 9 ha per MW was used, as per the West Midlands Renewable Capacity Study56.
This was validated against a range of UK wind farms (Whitelee57, Scout Moor58 and Cefn Croes59). For areas of less
than 20 ha, a density of 1 MW per 3 ha was used, as projects with very few turbines (e.g. in a farm) require less
spacing. The average UK wind factor of 26.6% was used to calculate energy generation (conservative assumption, as
new wind farms are better designed), taken from BEIS data60.
For solar developments, a density of 2 ha per MW61 was used. The average UK solar PV factor of 11.1% was used to
calculate energy generation, taken from BEIS data62.
56 https://www.stratford.gov.uk/doc/205885/name/ED481%20Renewable%20Energy%20Capacity%20Study%20for%20the%20West%20Midlands%20March%202011.pdf/https://www.stratford.gov.uk/doc/205885/name/ED481%20Renewable%20Energy%20Capacity%20Study%20for%20the%20West%20Midlands%20March%202011.pdf/ 57 https://www.scottishpowerrenewables.com/pages/whitelee.aspx 58 http://www3.lancashire.gov.uk/council/meetings/displayFile.asp?FTYPE=M&FILEID=8454 59 https://www.thewindpower.net/wind-farm-1452-cefn-croes-inc-devils-bridge-bryn-du-nffo-contract-nd-nd.php 60 https://www.gov.uk/government/statistics/energy-trends-section-6-renewables 61 https://www.solar-trade.org.uk/solar-farms/#:~:text=Some%20facts%20about%20solar%20farms&text=%E2%80%93%20For%20every%205MW%20installed%2C%20a,megawatts%20(MW)%20of%20installation 62 https://www.gov.uk/government/statistics/energy-trends-section-6-renewables
Page 312
www.wsp.com
APPENDIX F – MACC ASSUMPTIONS
Marginal Abatement Cost Curves (MACC) are regularly used by organisations concerned with the climate change.
They help visualise complex data about carbon costs and emissions volumes. It is a way of ranking and comparing
different technologies, actions or projects by cost and GHG saving. The MACC is an aid to decision making that
provides a simple way of identifying which projects are the most cost effective per unit of CO2e abated and which
options offer the greatest abatement potential.
Projects which have the lowest cost per CO2e reduction appear to the left, with projects with the least savings to the
right; with the actual amount of savings (either lifetime or per annum) denoted by the width of the project along the x-
axis. Projects which appear below the horizontal axis (and have a marginal abatement cost of less than £0) save
money over their lifetime, while those above the axis increase overall costs over the project life.
The development of a MACC allows the size and cost of carbon reduction options to be compared.
The creation of the MACC curve for each of the goals modelled for the Combined Authority involves a number of
steps. The following parameters are considered:
▪ total project costs (CAPEX)
▪ project implementation year (i.e. when CAPEX is committed/savings start)
▪ project lifetime (i.e. how long savings continue for)
▪ annual energy or other OPEX savings, split by fuel (excluding carbon price or other financial incentives / support
mechanisms)
▪ fuel prices
▪ carbon emission factors for the fuels
From the above data, the Net Present Value (NPV) of each intervention and the lifetime GHG savings can be
calculated.
In (NPV) calculations, cash inflows are traditionally shown as positive values and cash outflows are negative values.
However, the notation for MACC curves is that a positive NPV equates to a negative carbon abatement cost (i.e. the
lifetime cost is a net saving).
The Marginal Abatement Cost is therefore calculated by dividing the negative value of the NPV of the cashflows by the
lifetime GHG savings, which is not discounted. The NPV value considers the current year (e.g. 2021) as year 0, with
all cash flows discounted back to this year using the specified discount rate (3.5% in this case). Discounting reflects
the fact that the cost or savings today are more valuable than a similar cost or saving in the distant future. Low
discount rates increase the long-term net benefit of a technology compared to its initial cost and so brings more
technologies under the zero line of the MACC.
The Marginal Abatement Cost in £/tCO2e is obtained by dividing the negative of the NPV of the project (in today’s
prices) by the total CO2e abated by the project over its lifetime. In line with current World Bank guidance, the CO2
saving itself is not discounted over time.
The results for each measure are then stored in ascending order of £/tCO2e (y-axis of MACC curve) with the largest
negative figure first (i.e. measures which result in a net cash inflow) and the largest positive figure last, (i.e. measures
with a net cash outflow). Next to each of the projects the lifetime and annual carbon savings (tCO2) are presented (x-
axis of MACC curve).
A MACC can be used to aid decision making; however, it does not replace technical knowledge and experience; it
does not tell you which projects to implement and which not. It simple provides a graphical representation of the least
cost approach to meeting carbon targets. Similarly, it does not necessarily consider which technologies are mutually
exclusive or inter-dependent or factor in risk in any way.
Page 313

Page 2
In preparing the Marginal Abatement Cost Curve for each of the goals, a number of assumptions were made. These
are listed below.
Global Assumptions
The following data sources were used across the model
▪ Retail Gas Prices - Treasury Green Book, Table 5, Central Estimate
▪ Retail Electricity Price - Treasury Green Book, Table 5, Central Estimate
▪ Retail Petroleum Price – BEIS Fossil fuel price assumptions: 2019
▪ Gas Emissions Factor (static value) – BEIS Greenhouse gas reporting: conversion factors 2020
▪ Electricity Emissions Factors to 2041 - Treasury Green Book, Table 1
▪ Petroleum Emissions Factor (static value) – BEIS Greenhouse gas reporting: conversion factors 2020
Domestic Energy Efficiency
This goal considered a basic retrofit package considering the potential of a number on measured designed to reduce
heating consumption. These have been assumed to be applicable to homes which currently do not have the
technology and where it may be installed (e.g. 14% of dwellings with cavity walls are insulated). Whilst the key
measures are listed below there are other methods of reducing heating and domestic hot water consumption such as
improving air tightness or fitting tap aerators. Behavioural change is also not captured below; this has the potential to
have significant impact but will require long-term, continual action to maintain. Alternatively, whole-house retrofits
(such as enerphit) may be employed and have even larger impact.
APPLICABILITY BUNGALOW FLAT TERRACED SEMI-DETACHED DETACHED OTHER
Smart Thermostats 94% £150 £150 £150 £150 £150 £150
Smart Meters 69% £- £- £- £- £- £-
Cavity Wall Insulation 14% £500 £300 £350 £480 £550 £436
Solid Wall Insulation 27% £5,000 £4,300 £5,500 £7,000 £8,900 £6,140
Loft Insulation 18% £430 £180 £180 £180 £220 £238
Double Glazing 7% £5,800 £1,200 £3,200 £4,800 £5,000 £4,000
Energy savings are based on a reduction in gas consumption, though broadly similar savings could be achieved if an
air source heat pump were assumed.
2021 TO 2041 2021 TO 2026
Discount Rate 3.50% 3.50%
NPV -£874,128,835 -£1,027,110,445
Total Carbon Saving (tCO2) 7,425,781 33,908
Marginal Abatement Cost (£/tCO2) £117 £1,620
Domestic Heat Pump Retrofit
This goal considers the benefit of replacing current fossil fuel heating systems (predominantly gas boilers) within
dwellings with nominally air source heat pumps. An average (existing) gas boiler efficiency of 75% is assumed and
Page 314

Page 3
heat pump COP of 2.65. wider costs around modifying heating distributions systems are not considered as are
electrical infrastructure upgrades.
BUNGALOW FLAT TERRACED SEMI-DETACHED DETACHED OTHER
Capex per unit £7,700 £6,900 £8,100 £8,100 £10,800 £6,934
No of Properties 48,390 251,980 358,610 373,520 130,660 15,100
The capital costs above are based on present day installation costs for individual units. These are like to reduce,
because:
▪ Legislation – the ban on gas boilers due to come in force in 2025 will push widespread take up of this technology
allowing for further competition (new entrants into the market place) and economies of scale
▪ Training – currently there are relatively few heating engineers qualified to install a heat pump. As the number of
people trained up increases the labour costs are more likely to fall.
▪ Standardisation – Standardisation of installations may mean less time is required to design and maintain
systems while also opening up installation to less qualified personnel.
▪ Mass Rollout – By undertaking a mass roll out, the economies of scale could be further achieved via centralised
purchasing
▪ Removing the 20% VAT rate on heat pump equipment and the 5% VAT rate on heat pump labour costs1
Figure 1 - Current cost breakdown of a 40 kW ASHP (retrofit)2
Domestic Photovoltaic Systems
This goal considers the impact of installing rooftop solar on existing dwellings. An installed cost of £800 per kWp has
been assumed here which is less than the current market rate for domestic systems. There are several bulk solar
1 https://www.london.gov.uk/sites/default/files/heat-pump-retrofit-in-london-v2.pdf 2https://assets.publishing.service.gov.uk/government/uploads/system/uploads/attachment_data/file/498962/150113_Delta-ee_Final_ASHP_report_DECC.pdf Page 315

Page 4
purchasing schemes operational within the UK. Data from Solar Together London suggests that on average bulk
purchasing has reduced costs by 35%. The 35 per cent average discount of the panels over market prices ranges
from 10 per cent discount for the smallest solar photovoltaic system in the scheme (four panels) to 41 per cent for the
largest system of 36 panels. The most common system of 10 panels comes in at 31 per cent below the baseline
market price3.
What is proposed by this project is an order of magnitude higher than the reference projects, so there are potential
further savings to be had, but, as this is already a commercialised technology this will be more on the installation costs
than the cost of equipment.
Commercial Energy Efficiency
This goal considered the energy abatement potential of a range a non-domestic building types. The cost for
abatement were pro-rataed from the table below for the building stock in the Combined Authority.
Figure 2 - Abatement Potential by Sector4
Commercial Heat Pump Retrofit
This goal considers the benefit of replacing current fossil fuel heating systems (predominantly gas boilers) within
commercial properties with nominally air source heat pumps. A slightly higher CoP of 2.75 is assumed here. A cost of
£27 per sqm is assumed here for a building level air source heat pump system with refrigerant distribution to fan coil
units and a separate system for domestic hot water preparation.5
3 https://www.london.gov.uk/press-releases/mayoral/mayor-expands-solar-panel-scheme 4https://assets.publishing.service.gov.uk/government/uploads/system/uploads/attachment_data/file/565748/BEES_overarching_report_FINAL.pdf 5 https://www.london.gov.uk/sites/default/files/low_carbon_heat_-_heat_pumps_in_london_.pdf Page 316

Page 5
Commercial Photovoltaic Systems
This goal considers the impact of installing rooftop solar on existing commercial properties. An installed cost of £750
per kW has been assumed here which is typical for a medium sized commercial system.
Industrial Energy Efficiency and Fuel Switching
This goal has not been included within the MACC due to the level of uncertainty around the costs for full
implementation. Resources should be devoted around research and development as well as working with local actors
to trial projects and technologies.
Industrial Photovoltaic Systems
This goal considers the impact of installing rooftop solar on existing industrial properties. An installed cost of £750 per
kW has been assumed here which is typical for a medium sized commercial system. Other renewable technologies
are also possible especially around usage of biomass and wastes as well as via the use of circular economy
principles.
Transport Demand Reduction
This goal considers the potential of reducing the need to demand and digitisation of services. This is already
underway with the increase in working from home, (especially during the recent pandemic), as well as growth in online
shopping. The cost attributed to this goal is related to providing ultrafast broadband to all dwellings within the WMCA.
The current penetration of ultrafast broadband varies across the seven local authorities from 71% to 93% of
dwellings6. In total the number of dwellings that are still without are in the region of 180,000. The cost of providing
broadband to homes averages less than £500 per dwelling7, though it is likely the outstanding dwellings are those
considered harder to reach.
The true cost of this goal is associated with ensuring rebound effects are limited. This includes:
▪ Creating local flexible working spaces which reduces commuting distances and allows people to reach offices by
walking or via active travel. It is likely that in the future many people would still choose to not fully work from home
and this would facilitate this and provide a halfway house between working from home and travelling to large
central offices.
▪ Many homes also do not have adequate space for a home office and so working from home in the long term
would be unsustainable (working from bedrooms, in noisy environments or on kitchen counters may have physical
and mental health implications). There is a role in planning in ensuring all new dwellings have adequate home
working spaces and also understanding the changes that may be needed to existing dwellings.
▪ Creating local community spaces which centralise deliveries. The key here is to reduce the number of LGV
deliveries that go street to street and instead have local delivery locations where people can reach via walking.
This goes hand in hand with other freight exchange initiatives.
Transport Modal Shift
This goal has not been included within the MACC due to the level of uncertainty around the costs for full
implementation and indirect impacts. There are some known costs associated with proving additional infrastructure
say to facilitate active and public travel (cycle pathways, BRT routes etc). But wider costs are more difficult to
estimate. In order to create transport modal shifting, there will also require a change in planning such that destinations
6 https://www.wmca.org.uk/media/2230/infrastructure.pdf 7 https://www.ispreview.co.uk/index.php/2019/06/ofcom-uk-examines-the-cost-of-deploying-full-fibre-broadband.html Page 317

Page 6
are co-located next to public transport rather than only being accessible by cars (transport-orientated developments).
This would be a rapid shift in how cities are planned. Another consideration is demand management measures to
reduce the reliance on cars; this includes increasing the cost of driving to make it less desirable.
Bus and Taxi Fleets
There are over 21,000 licensed taxis in the Combined Authority and the analysis is based on each operated 30,000
miles per annum. The figures have been obtained from the Low Carbon Vehicle Partnership8 and only the additional
costs (over what is assumed to be committed) included.
CAPEX OPEX
Electric Taxi (e.g. Nissan Leaf) £25,190 £1,255
Normal Taxi (e.g. Skoda Octavia) £19,810 £2,936
Additional cost £5,380 -£1,681
A similar source was used to estimate the capital and operational cost for electric buses. The capex was assumed to
be £105,000 more to purchase and £18,000 per annum cheaper to operate9.
In both of these cases the infrastructure costs associated with developing charging hubs at key locations are not
included.
Heavy Goods Vehicle Fleet
This goal has not been included within the MACC due to the level of uncertainty around the costs for full
implementation. As HGVs operate nationally as well as internationally there is a wider need for co-operation and
linking thinking to prevent stranded assets.
Accelerated EV uptake
This goal has not been included within the MACC due to the level of uncertainty around the costs for full
implementation. The goal is linked to the assumptions made by the Committee on Climate Change and would need
considerable resources to ensure adequate infrastructure is in place. Planning will also play a major role as will local
initiatives similar to the electric vehicle experience centre in Milton Keynes.
Land Use Natural Capital
The costs presented here includes the cost woodland planting and establishment costs and woodland management
costs. The cost of these activities exceed £230 million. The key point here is that there is no nature payback or income
stream mechanism considered. It is likely income will be available either from sale of timber or the proposed
government ELM scheme.
Land Use Renewables
8 http://www.lowcvp.org.uk/assets/reports/LowCVP_Low_Emission_Taxi_Guide-March_2019_Update.pdf 9 http://www.lowcvp.org.uk/assets/presentations/7.%20Fast%20Charging%20in%20Nottingham%20-%20Steve%20Cornes,%20NCC.pdf Page 318

Page 7
The present-day costs of photovoltaics include cost of modules, inverters, grid costs, balance of system costs etc. the
rental of land is also included as a minor cost. The total cost is estimated to in the region of £500,000 per MWp.
Equipment costs are likely to drop over the next ten years.
BEIS electricity generation costs are used to estimate the installed cost of wind at £1m per MW10.
There are no obvious income mechanisms currently and therefore it is assumed there is an income from Power
Purchase Agreements (PPA) at around £50 per MWh.
10 https://www.gov.uk/government/publications/beis-electricity-generation-costs-2020 Page 319

This page is intentionally left blank

www.wsp.com
APPENDIX G – JOBS & SKILLS APPENDICES
APPENDIX G-1 – TRANSITION LITERATURE REVIEW
As part of the literature review approximately 20 studies, policy documents and academic papers relating to
net zero jobs & skills and the green economy have been reviewed. However, for the purposes of the Five
Year Plan not all items that were reviewed are included as part of this appendix; only the material most
relevant to the West Midlands Combined Authority Five Year Plan have been included.
SKILLS TRANSITION
Skills related to jobs in the renewable sector, construction and waste management are amongst those
required for a low-carbon economy. “Green skills” were defined and listed by the government report for a
Green Economy1 as follows:
1. Resource efficiency,
2. The low-carbon industry,
3. Climate resilience; and
4. Skills to manage natural assets.
Current government policy hasn’t always matched demand for green skills with supply of green skills. A
National Open College Network report highlighted the need to address skills across all sectors with a focus
on:
▪ Management skills to enable identification of potential and confidence pushing forward performance
improvements and digital changes,
▪ Employability and generic skills, particularly literacy, numeracy, digital and cognitive skills; and
▪ Technical skills and knowledge, to support the transition to an AI- and digital-based economy.
Meeting Net Zero targets will have a significant impact on the labour market, and it is vital that those in their
early years of employments and those in the latter years of their working career are provided with the right
education, training and re-training opportunities to meet future job needs. Increased investment in the
green sector and increased demand for certain occupations may not affect skills needed in some
occupations, for example demand for railway workers may increase due to greater investment in public
transport2.
Table 1 provides an overview of the levels of skill and occupational change involved in moving towards
green jobs. It takes as its starting point the degree of skill change required on the labour market, matches
this with corresponding occupational change and specifies the typical skills response required and gives
examples for each level.
Table 1 - Changes in skills and occupations for green jobs
Skill change Change Examples Skills response
Low Changing established
occupation
Welder for wind turbines
production
On-the-job and short training
courses
1 Cutting Carbon, Growing Skills, TUC (2020) 2 Skills for Green Jobs A Global View, International Labour Organisation, 2011
Page 321

Page 2
Medium Changing of emerging
occupation
Mechanic for EV/hydrogen
vehicles
Training Courses
High New and emerging Smart energy systems Longer training courses and
university degrees
The level of occupational change depends on the degree of skills change: from none (for example railway
worker) to high when new occupations emerge, (for example that of smart energy analyst or heat pump
engineer). In the middle of this range are numerous established occupations whose content is altered with
the adoption of new green technologies or of new green methods of production. These include engineers,
managers or technicians who install and maintain new technologies or implement new energy efficiency
standards.
Emissions-intensive manufacturing, in particular the automotive sector and related supply chains, is shifting
focus to electric vehicles. Increased investment in green sector and increased demand for certain
occupations may not affect skills need in some occupations, for example demand for railway worker may
increase due to greater investment in public transport. To prepare well for the long term, education and
training policies need to be aligned to meet the future new skill demands. STEM skills, as well as technical,
managerial, and leadership skills will be important for the transition.
In 2008 a green skills checklist3 was developed by the Government on the skills implications of the
transition to a low-carbon and resource-efficient economy. The list includes ten broad groups of skills (tier
1), relevant across sectors, which are broken down into general skills categories (tier 2) and more specific
skills (tier 3).
Table 2 - Green skills checklist
Tier 1 Tier 2 Tier 3
Design skills Eco-design Design for disassembly, design for recyclability, design for the
environment, design for effective energy use, legislation and
regulatory compliance.
Green manufacturing Legislation and regulatory compliance, integration of process waste
Materials specification
Life-cycle
assessment/costing
Waste skills Waste quantification and
monitoring
Waste production calculations, mass balance, waste audit
Waste process studies Material/substance flow analysis, resource utilization mapping life-
cycle assessment
Waste management
systems
Objective setting, legislative and regulatory compliance, collection,
segregation, waste cycle management, 3R implementation (reduce,
reuse, recycle), hazardous waste management, landfill
requirements, communications/implementation campaigns
Waste minimisation Industrial symbiosis, integration of process waste
Waste technologies Recycling, waste-to-energy
Energy
skills
Energy minimization Energy reduction programmes, heat recovery and re-use, energy
efficient technologies, energy-efficient practices, communications/
implementation campaigns, enhanced capital allowance
technologies and schemes
3 Pro Enviro: Skills for a low-carbon and resource efficient economy (LCREE), Report for DEFRA (2008). Page 322
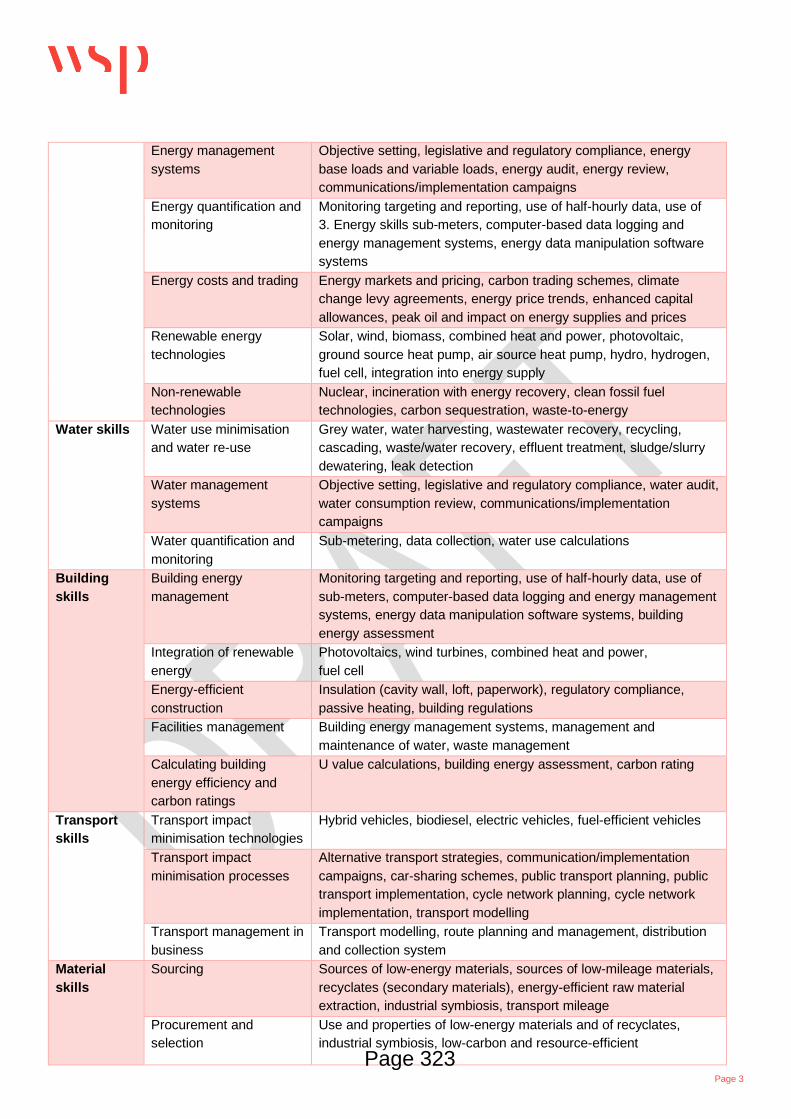
Page 3
Energy management
systems
Objective setting, legislative and regulatory compliance, energy
base loads and variable loads, energy audit, energy review,
communications/implementation campaigns
Energy quantification and
monitoring
Monitoring targeting and reporting, use of half-hourly data, use of
3. Energy skills sub-meters, computer-based data logging and
energy management systems, energy data manipulation software
systems
Energy costs and trading Energy markets and pricing, carbon trading schemes, climate
change levy agreements, energy price trends, enhanced capital
allowances, peak oil and impact on energy supplies and prices
Renewable energy
technologies
Solar, wind, biomass, combined heat and power, photovoltaic,
ground source heat pump, air source heat pump, hydro, hydrogen,
fuel cell, integration into energy supply
Non-renewable
technologies
Nuclear, incineration with energy recovery, clean fossil fuel
technologies, carbon sequestration, waste-to-energy
Water skills Water use minimisation
and water re-use
Grey water, water harvesting, wastewater recovery, recycling,
cascading, waste/water recovery, effluent treatment, sludge/slurry
dewatering, leak detection
Water management
systems
Objective setting, legislative and regulatory compliance, water audit,
water consumption review, communications/implementation
campaigns
Water quantification and
monitoring
Sub-metering, data collection, water use calculations
Building
skills
Building energy
management
Monitoring targeting and reporting, use of half-hourly data, use of
sub-meters, computer-based data logging and energy management
systems, energy data manipulation software systems, building
energy assessment
Integration of renewable
energy
Photovoltaics, wind turbines, combined heat and power,
fuel cell
Energy-efficient
construction
Insulation (cavity wall, loft, paperwork), regulatory compliance,
passive heating, building regulations
Facilities management Building energy management systems, management and
maintenance of water, waste management
Calculating building
energy efficiency and
carbon ratings
U value calculations, building energy assessment, carbon rating
Transport
skills
Transport impact
minimisation technologies
Hybrid vehicles, biodiesel, electric vehicles, fuel-efficient vehicles
Transport impact
minimisation processes
Alternative transport strategies, communication/implementation
campaigns, car-sharing schemes, public transport planning, public
transport implementation, cycle network planning, cycle network
implementation, transport modelling
Transport management in
business
Transport modelling, route planning and management, distribution
and collection system
Material
skills
Sourcing Sources of low-energy materials, sources of low-mileage materials,
recyclates (secondary materials), energy-efficient raw material
extraction, industrial symbiosis, transport mileage
Procurement and
selection
Use and properties of low-energy materials and of recyclates,
industrial symbiosis, low-carbon and resource-efficient
Page 323

Page 4
procurement, cost impact of climate change on material
procurement
Material use and impact
quantification
Material usage calculations, life-cycle assessment and costing
Management systems Material use planning, material flow process design and
implementation, energy-efficient process design and
implementation
Impact and use
minimisation
Life-cycle assessment and costing, energy-efficient process
implementation, material flows analysis
Financial
skills
Investment models Carbon trading, EU Emissions Trading Scheme, UK Emissions
Trading Scheme, enhanced capital allowances
New/alternative financial
models
Energy technologies investment models, carbon derivatives
investment models, calculation of payback/return on investment
Quantification of climate
change impacts
Impact assessment of climate change on business finances, impact
of climate change on materials availability and cost, carbon
neutrality and associated cost/opportunities (costs of doing
nothing), risk/opportunity assessment models for adaptation and
mitigation, insurance risks/opportunities of a low-carbon economy
Principles of low-carbon
and resource-efficient
Polluter pays principle, externalities economies
Tools of low-carbon and
resource-efficient
Climate Change Levy agreements, enhanced capital allowances,
cost – economies benefit analysis, low-carbon and resource-
efficient procurement
Management
skills
Impact assessment Energy use calculations, water use calculations, waste production
calculations, carbon foot-printing calculations, emissions
measurement
Business planning RE planning, low-carbon planning, integration of RE and low carbon
into business planning cycles, climate change risks, climate change
adaptation and mitigation responses (as part of business risk
management), understanding low-carbon and resource efficiency
skills requirements and long-term planning
Awareness raising Communication/implementation campaigns skills
Opportunities
management
Identification of low-carbon and resource efficiency opportunities,
cost–benefit analysis
Risk management Identification of low-carbon and resource scarcity risks, cost–benefit
analysis
Day to day management Low-carbon and resource-efficient procurement, integration of low-
carbon and resource efficiency skills, due diligence, management
systems, low-carbon and resource efficiency skills requirements for
recruitment
Policy and
planning
skills
Built environment master
planning and
implementation
Low-carbon spatial planning, zero waste planning, resource-
efficient planning, low-carbon and resource-efficient urban design,
building regulations, public transport planning and implementation,
cycle network planning and implementation
Strategy development Impact assessment and modelling, principles of low-carbon and
planning skills resource efficiency
Strategy implementation Understanding of skills needs for HR managers, low-carbon and
resource-efficient material sourcing and procurement, awareness
raising/communications skills Page 324

Page 5
It is clear both from this checklist and from the definitions of green skills quoted above that the West
Midlands needs a broad range of knowledge, technical, managerial and conceptual skills at its disposal.
Many of these are specific new skills such as knowledge of sustainable materials, carbon footprinting skills
or environmental impact assessment.
It is also clear that some of these skills are not necessarily green or low carbon but are only as green as the
context in which they are applied. For example, knowledge of building regulations only leads to more
energy-efficient buildings if the right regulations are in place. Building skills may be green only when they
are applied in the green building industry. However, this does not make building skills as such irrelevant for
green jobs. The essential point is that skills are possessed by the workforce, who can apply them in
different contexts.
Training policies are important to ensure a smooth transition of workers across sectors in the short term.
These programmes will be particularly important to facilitate the transition of low-skilled workers from jobs
in the declining sectors to jobs with similar skills in emerging sectors4.
▪ Supply side policies - Active labour market programmes and skill development systems to facilitate a
smooth re-integration of jobseekers into employment.
▪ Demand side policies - Strong product market competition and moderate employment protection are
important to facilitate the creation of new competitive green sectors.
▪ Income support - Unemployment insurance and in-work benefits can help to ensure that the transition
is not achieved at the cost of excessive insecurity or inequality for workers.
▪ Regional support policies - Regions with a heavy reliance on fossil fuel and energy intensive
industries might require specifically targeted policy measures to facilitate the transition.
Specifically, targeted labour market policies might be necessary in geographic regions with a high share of
the labour force working in fossil fuel and energy-intensive sectors.
Jobs created
Across the UK there could be as many as 694,000 direct jobs employed in the low-carbon and renewable
energy economy by 20305.
▪ Nearly half (46%) of the total low-carbon jobs by 2030 will be in clean electricity generation and
providing low-carbon heat for homes and businesses. These jobs will range from manufacturing wind
turbines, deploying solar PV, constructing nuclear reactors, installing heat pumps and maintaining
energy-system infrastructure.
▪ Over one-fifth (21%) of jobs by 2030 will be involved in installing energy efficiency products ranging
from insulation, lighting and control systems.
▪ Around 19% of jobs in 2030 will be involved in providing low-carbon services (financial, legal and IT)
and producing alternative fuels such as bioenergy and hydrogen.
▪ A further 14% of jobs will be directly involved in manufacturing low-emission vehicles and the
associated infrastructure. These jobs will range from manufacturing electric vehicles and hydrogen
vehicles, manufacturing EV batteries from the proliferation of giga factories and sustaining low-carbon
mobility by installing electric vehicle charge-points and hydrogen refuelling stations.
The West Midlands is well-known for having a large and dynamic workforce engaged in the manufacturing
and production of vehicles. Around half of automotive companies produce vehicle components in the West
4 Employment Implications of Green Growth: Linking jobs, growth, and green policies, OECD report for G7 Environmental ministers, June 2017 5 Local green jobs – accelerating a sustainable economic recovery, Ecuity, 2020 Page 325

Page 6
Midlands6. Increased demand for electric cars will increase jobs in West Midlands existing manufacturing
capacity lies. This could be in the North West of England and West Midlands where automotive
manufacturing supply chains are already well developed.
Across the West Midlands Combined Authority, there could be an estimated 72,000 jobs working in low-
carbon sectors7. Most of these jobs would be focused on manufacturing low emission vehicles, battery
packs and modules in factories situated near existing production sites. Additionally, jobs could be created
installing low carbon heating technologies, energy efficiency products and solar panel installations. The skill
requirements for these new jobs include:
▪ Solar - Solar technician skill requirements will be demand led. Level 3 Electrical Installations
qualification are required to install grid connected solar. There is a relatively robust installer base
due to previous boom in the sector, but this will have to increase.
▪ Hydrogen fuel cells - The primary skill demand is expected to be for highly skilled workers
including engineers and scientists that can support innovation and research activities. There is a
need for UK higher education institutions to deliver key skills such as engineering, physics and other
core STEM subjects within the workforce.
▪ Electric vehicles - Job preservation of existing automotive services and growth in need for skills
ranging from infrastructure installation, servicing and other high skilled jobs. This sub-sector could
feasibly capitalise on existing expertise from automotive manufacturing workers in localities where
current automotive operations are downsizing
▪ Energy Efficient products - Employment in key supply chain operations including in R&D,
manufacturing and services is largely satisfied by the regional workforce in the operations’ key
localities. However, increasingly requiring highly skilled software engineering expertise has
anecdotally required a change in a recruitment tactic to broaden recruitment to wider regions
▪ Green stimulus - involves ‘retrofit’ of millions of homes over the next two decades, involving
multiple, integrated building fabric measures, new heating systems such as heat pumps and
controls, and the widespread adoption of rooftop solar.
▪ Professional services/ financial services and consultancy - Skill and training requirements are
broadly influenced by wider sustainability agenda and infrastructure projects.
There is a need to promote training and qualifications in these areas throughout the WMCA and the UK,
otherwise there could be an under-capacity in workers especially in the short to medium term. For example,
a recent Government research project8 into the heat pump manufacturing supply chain indicated that
generally heat pump manufacturers are not concerned with skilling of the UK workforce as other industries
(boiler, HVAC, and chiller manufacturers) have transferable skills. There is a potential shortfall in F-gas
certified installation engineers that could have an impact on the type of heat pump deployed and the rate of
deployment. There are currently around 50,000 of qualified engineers in the UK which could be a significant
issue if heat pump growth takes place in the short term as expected. Refrigerant handling in the
6 Automotive Council Mapping UK Automotive. Accessed on 8th December 2020. Available from: https://www.automotivecouncil.co.uk/mapping-ukautomotive/ 7 Local green jobs – accelerating a sustainable economic recovery, Ecuity, 2020 8 Heat Pump Manufacturing Supply Chain Research Project Report, Research carried out by Eunomia Research & Consulting Ltd on behalf of the Department for Business, Energy and Industrial Strategy, 2020. https://www.gov.uk/government/publications/heat-pump-manufacturing-supply-chain-research-project Page 326

Page 7
manufacturing process requires F-gas (Category 1) certification9. Without a promotion and increased levels
of training, there could be a shortfall in F-gas certified installation engineers in the short to medium term.
A transition to Net Zero will also reduce demand for certain high-carbon services and technologies, such as
fossil fuel extraction, processing and distribution, aviation, fossil fuel machinery and livestock and dairy.
This could see jobs in some key sectors significantly affected, though in each area there will also be new
employment opportunities:
▪ The oil and gas sector is likely to be heavily affected in by 2041 due to falling international demand
for oil and gas. Opportunities in this sector could involve a shift towards offshore renewables, CCUS
and hydrogen, with measures to manage the carbon footprint of imported fuels.
▪ Falling demand for fossil fuelled vehicles, resulting from a transition to electric vehicles, is likely to
reduce the number of jobs available in manufacturing and servicing these vehicles. The West
Midland’s already produces electric vehicles, and opportunities exist for the UK to have a large
share of future electric vehicle, and potentially battery, production and electric vehicle maintenance.
▪ Jobs in UK aviation and aeronautics sectors could be impacted.
▪ Income to livestock and dairy farms could be affected if meat and dairy consumption falls by the 20-
50% envisaged in our scenarios. The UK’s farms and their 450,000 workers will need to be
engaged and supported in the transition to low-carbon farming practices.
▪ Demand for manufacturing of some products or materials would likely reduce within the more
circular economy. This could lead to a shift of some manufacturing towards recycling-based
manufacturing and re-use-based services. The transition will also require some industries, such as
manufacturing, to change the technologies, fuels or processes they use to costlier ones, while they
continue to provide the same type of products or services.
The Governments newly created Green Jobs Taskforce will be at the heart of the transition to net zero. The
taskforce forms part of the Government’s 10 Point Plan to drive a green industrial revolution and it will set
the direction for the job market as we transition to a high-skill, low carbon economy. Its key aim is to focus
on the immediate and longer-term challenges of delivering skilled workers for the UK’s transition to net
zero. The taskforce has already highlighted some of the key roles required to deliver net zero. These
include gigaplant production operators, heat pump installers and tree planters which have already been
identified in this literature review.
Table 3Error! Reference source not found.Table 3 presents qualitative assessment of the expected
impacts in four broad industry sectors that have been identified in this literature review. These sectors are
considered which are vital to the West Midlands Combined Authority economy and the net zero transition.
Table 3 – Jobs and skills sector analysis
Sector Jobs and skills
Transport ▪ Transition to electric or hydrogen vehicles will create jobs in automotive
manufacturing and the transition in the WM will have to be handled
smoothly, given the significant size of the industry in the sub-region.
9 PPL Training (2020) F-Gas (Category 1) | City & Guilds 2079-11 (FCAT1), accessed July 2020, available at
https://www.ppltraining.co.uk/training-course/mechanical-and-electrical-technical/f-gas/f-gas-category-1- city-and-guilds-2079
Page 327

Page 8
▪ Many of the existing jobs will have skills or aptitudes that are transferrable.
▪ Driving and process line jobs are likely to reduce and will need new skills.
▪ Development, deployment and maintenance of EV charging infrastructure
and the electrical and engineering
▪ R&D related to electrification and hydrogen technologies will also potentially
create new jobs across the WM HE and FE sectors in collaboration with
national and international research agencies
▪ An overall modal shift towards public transport is also important, generating
a need not only for technical engineering and transport planning skills, but
also services around transport management and coordination, forecasting
and finance/PPP/revenue management
Built
Environment
▪ Commercial and housing retrofit will provide a huge stimulus for new
employment creation and skills upgrade
▪ The skills requirement for professional trades, particularly electrical and
shifting to factory construction will be significant
▪ The national push for investment in major infrastructure will make
considerable demands on the civil engineering sector
▪ Need for people with engineering and customer service skills for the retrofit
market which includes being able to work with vulnerable customers
Energy ▪ New jobs arising will cover the likes of energy efficiency retrofit, heat pump
installation and retrofit, renewable energy design and installation, hydrogen
specialists, energy systems balancing specialists and materials specialists
▪ Technical skills needed for Carbon Capture and Storage may be similar to
existing industry skills in sectors such as power generation, chemicals or oil
and gas
Heavy industry ▪ Decarbonisation of the UK’s important traditional heavy industrial base will
be underpinned by decarbonising the power sector and by the introduction
of new technologies
▪ New types of manufactured product, such as those taking plastic electronics
and silicon electronics approaches
▪ Application of lean manufacturing methods
▪ Redesign of existing products with a focus on resource efficiency and a
cradle to cradle approach, in which materials are continually recycled
▪ Minor reskilling for different treatment and processing of waste to energy
▪ Awareness and understanding of sustainable development issues
▪ and specialists such as energy managers for larger businesses
▪ IT specialists to design and operate systems applicable to logistics, smart
operating systems, and environmental control
The findings from the literature review show some of the emerging roles that Net Zero will create need
specific new skills and training and as such that there will need to train the WMCA labour force. it is also
clear, however, that some of these new roles do not necessarily require dramatic increase in skill levels and
can even make use of existing strengths in the West Midlands.
Page 328

Page 9
APPENDIX G-2 - JOBS & SKILLS POLICY LITERATURE REVIEW
WMCA
Table 4 presents a summary of relevant policies relating to jobs and skills and low carbon economy within
the WMCA.
Table 4 – WMCA/LEP’s jobs and skills policy summary
Document Conclusions
West Midlands Strategic Economic Plan
The SEP sets out the vision for improving the quality of life of everyone who lives and works in the West Midlands with a focus on skills, innovation, transport and inward investment. Priority actions and SMART objectives are focused in the following areas ▪ New manufacturing economy ▪ Creative and digital ▪ Environmental technologies ▪ Medical and life sciences ▪ Skills for growth and employment for all ▪ Housing ▪ HS2 growth ▪ Exploiting the economic geography. There are four SMART objectives focused on employment and skills: ▪ To improve the balance between the skills that businesses need and the skills of local
people so that they have the skills and qualifications to access jobs ▪ Average earnings of working age population will be 13% above UK averages with the
living wage as the foundation minimum wage ▪ Proportion of people qualified to NVQ4 or above will have increased to 36% to match
the national average and the number with no qualifications will have fallen to 9% to match and then better exceed the national average
▪ Unemployment rate will be below the national average The WMCA’s Productivity and Skills Commission supported net zero by ensuring the skills needs of businesses are met, with a particular focus on the needs of businesses in transformational sectors such as low carbon technologies and advanced manufacturing.
West Midlands Local Industrial Strategy
The West Midlands LIS sets out how the West Midlands will take advantage of the existing skills, infrastructure and innovation in the region to contribute towards the UK’s Grand Challenges. Construction and low carbon and future mobility technology are considered sector strengths in the WMCA. It specifically highlights that low carbon and environmental technology, skills and jobs are important as the sector is considered the most productive sector in the region based on GVA per employee, followed by digital and creative business, professional and financial services. Sets out the five strategic action areas: ▪ Prepare young people for future life and work ▪ Create regional networks of specialist, technical education and training to help drive
skills and productivity ▪ Accelerate the take up of good-quality apprenticeships across the region ▪ Deliver inclusive growth by giving more people the skills to get and sustain good jobs
and careers ▪ Strengthen collaboration between partners to support achieving more collectively
West Midlands Regional Skills Plan
The Skills Plan builds on the targets in the WMCA SEP; by 2030 the region’s productivity, salaries, skills attainment and labour market participation levels match or exceed the national average. The strategy outlines the plan to achieve this through inclusive growth, ensuring that everyone can gain the skills and support they need to access new opportunities and benefit from a stronger regional economy. Advanced manufacturing, building technologies, digital and business and professional services are considered to be transformative sectors where there is a desire to increase the number of skilled people and the level of their skills.
WM2041 - Actions to meet the climate crisis
The framework outlined in this paper summaries the reasons to address climate breakdown and to adapt to climate change the opportunity it provides to create a highly productive, low carbon economy in the West Midlands. It reflects on the potential actions needed and suggests who needs to take these forwards. It also highlights a £40bn investment Page 329

Page 10
with inclusivity, prosperity and fairness
programme will be required over the 21 years (2020-2041) to deliver net zero. The high-level actions are as follows: ▪ the West Midlands economy needs to shift to one which is zero carbon and abides by
circular economy principles, while enabling the people of the region to build and enjoy their prosperity
▪ boost resilience to ‘locked in’ climate breakdown ▪ reconcile strong sectors like automotive without locking the region into congestion,
polluted air and climate breakdown. ▪ build more places, and more connectivity between places in the West Midlands ▪ save energy and resources without reducing shared prosperity
Black Country Local Enterprise Partnership - Strategic Economic Plan 2017-33
As part of the SEP the LEP have identified 3 overarching themes and 10 drivers of change to inform the plan. The themes are as follows; ▪ People - Raising Employability, Education and Skills ▪ Place -Transforming the Black Country Infrastructure and Environment ▪ Business – Improving Black Country Business Competitiveness As part of the aim to improve skills supply chain in the region there is a desire to extend the existing Black Country Skills Factory model beyond manufacturing to other growth sectors such as low carbon technologies. Expanding training programmes for emerging and changing roles as result of transition to lower carbon economy will be vital in ensuring there is suitable pool of workers in the region to deliver net zero by 2041.
Greater Birmingham and Solihull Local Enterprise Partnership - Strategic Economic Plan 2016-35
The overarching objective of the SEP is to create jobs and grow the economy of Greater Birmingham and in so doing raise the quality of life for its inhabitants. Successful delivery depends on: ▪ Increasing business and workforce productivity and competitiveness – particularly by
raising skills ▪ Stimulating demand led innovation ▪ Increasing private sector investment including overseas investment ▪ Increasing business survival and growth ▪ Increasing exports particularly amongst Small and Medium Sized Enterprises (SMEs) ▪ More inclusive growth that delivers benefits more widely and reduces unemployment,
particularly in those parts of Birmingham and North Solihull with persistently high rates. The plan highlights the importance of low carbon energy technologies clusters to achieving these objectives. The region is developing and commercialising new technologies which will be key to delivering smarter, more sustainable and more inclusive growth. The LEP wants local people to be inspired and skilled to fill employment opportunities that will come forward in future and continue to develop their skills. To do this the LEP have identified three key themes as part of their skills framework: ▪ Ignite – igniting interest in jobs, raising awareness of career pathways, inspiring and
influencing career choices. ▪ Accelerate – targeting those in work, to make skills and career progression, and drive
increased productivity ▪ Retune – targeting unemployed people and those in employment whose skills no longer
match labour market demand, ensuring they can gain skills or re-train to access the jobs created.
Coventry and Warwickshire Local Enterprise Partnership – Skills strategy
The overall aim of the Skills strategy is to drive forward growth in the area, remove barriers to growth and to create more high value jobs. The skills strategy seeks to support this by developing a workforce with the right skills to meet employers’ needs. Currently the proportion of the workforce within the LEP area that is employed in Manufacturing and in Energy and Water is above the national average. Within these sectors, the LEP has particular strengths in Advanced Manufacturing and Engineering and Low Carbon Technologies, and in associated R&D supplied by major internationally renowned companies, plus private and public sector research establishments. The two primary goals of the CWLEP Skills Strategy are to: ▪ promote significant upskilling of the local population so that it can take advantage of the
future job opportunities that are likely to arise ▪ improve the work-readiness of new entrants to the labour market, including those
gaining employment in the many lower skills occupations that will still exist The skills strategies outline how the CWLEP plan to achieve this through agreements with employers, local authority’s and provider stakeholders to: ▪ provide more apprenticeship places and work placements; Page 330

Page 11
▪ support SMEs by clarifying and better tailoring the training available to them, and providing a one-stop-shop for assistance;
▪ encourage local providers, including universities, to align their offer to LEP priorities, and in association with local employers to design tailored programmes linking qualifications to career progression in specific organisations;
▪ strengthen provision for the unemployed and for NEETs, including via involving voluntary agencies alongside mainstream providers;
▪ in conjunction with the National Careers Service and by other appropriate means, strengthen the publicity given to qualification and career paths available via locally based employers;
▪ coordinate as appropriate with emerging skills policies and action plans in adjoining LEPs and Authorities
▪ regular examination of the data relating to skills supply and demand so as to help reach informed judgements about the future directions of skills provision in the area.
LOCAL AUTHORITIES
Table 5 presents a summary of relevant Local Authority policies relating to jobs and skills and low carbon
economy within the WMCA.
Table 5 – WMCA Local Authority’s jobs and skills policy summary
Document Conclusions
Birmingham Skills Investment Plan
Ambition to get Birmingham residents in new jobs coming to the area from major employers and SME’s. Aims to create 70,000 new jobs by 2026 reduce employment rate and reduce people claiming welfare benefits. Skills and qualifications focus in the following areas:
▪ Business and financial services ▪ STEM subjects (Advanced engineering and manufacturing) ▪ Information technology ▪ Health and social work ▪ HS2
Walsall Council: Employment and Skills Board
Brings together key strategic private, public and voluntary sector agencies to address the issues within their agreed priority of ‘Ensuring People Possess the Skills to Work & Support Growth’. They work to ensure support for unemployed and local people possess skills to enter and progress in work.
The Coventry Employment and Skills Plan: response to COVID-19
The plan is a response to the COVID-19 pandemic and sets out the scale of the economic challenge and the local impact this has for the residents of Coventry. This includes:
▪ Ensuring all education and training providers have clear progression pathways which are responsive and lead into the local labour market.
▪ Digital skills courses ▪ Increasing the skills courses offer across Coventry and sharing data and resources
across FEs, ITPs, and Coventry City Council's Adult Education Service.
City of Wolverhampton Strategic Economic Plan 2019 – 2024
Wolverhampton’s Strategic Economic Plan will help to drive key priorities of Black Country Strategic Economic Plan
▪ People through a working and inclusive city ▪ Business through an enterprising city ▪ Place through a vibrant and future city
Vision 2030 Sandwell
Vision 2030’ sets out ambitions for the borough on ten key themes: ▪ Raising aspirations and resilience ▪ Healthier for longer and safer ▪ Young people to have skills for the future ▪ Raising the quality of schools ▪ Lowering crime and antisocial behaviour ▪ Excellent public transport to the region and beyond ▪ Major new housing along transport routes and employment sites ▪ Create environments in the six towns where people choose to live ▪ Hosting industries of the future ▪ National reputation for getting things done
Page 331

Page 12
Solihull Council Plan 2020-2025
Delivering Sustainable Inclusive Growth based on: 1. Building a vibrant economy 2. Promoting and delivering social value 3. Enabling communities to thrive 4. Actioning our climate change declaration 5. Improving skills and access to good work
As part of this plan Solihull plan to undertake education, skills and employment activities and responsive employment support, targeted at people from the most disadvantaged groups and communities in the area.
Dudley Council Dudley Council declared a climate emergency and are discussing proposals to reduce their carbon footprint
Page 332

www.wsp.com
APPENDIX G-3 - JOBS & SKILLS BASELINE DATA
The core of economic strength of the WMCA is in advanced manufacturing and engineering but a number
of growing sectors including creative, digital and life sciences are playing an increasingly significant role in
the region’s success. Table 6 provides a breakdown of key employment sectors in the WMCA.
Table 6 - Employment sectors in WMCA, 2019
Sector Number of
jobs
Agriculture, forestry and fishing 410
Mining and quarrying 295
Manufacturing 132,685
Electricity, gas, steam and air conditioning supply 5,500
Water supply; sewerage, waste management and remediation activities 10,800
Construction 58,590
Wholesale and retail trade; repair of motor vehicles and motorcycles 183,275
Transportation and storage 66,600
Accommodation and food service activities 80,975
Information and communication 30,060
Financial and insurance activities 42,110
Real estate activities 24,400
Professional, scientific and technical activities 84,675
Administrative and support service activities 135,145
Public administration and defence; compulsory social security 50,000
Education 126,750
Human health and social work activities 178,500
Arts, entertainment and recreation 23,250
Other service activities 24,800
Source: Office for National Statistics, Business Register and Employment Survey, 2020
This demonstrates the strengths in the automotive sector, alongside Logistics, Textiles and other
specialised Manufacturing which have shaped the sub-regional economy, and all carry inherent transition
challenges.
To understand which sectors are of greater or less importance to the WMCA economy, location quotients
have been calculated. Location quotients (LQ) indicate which industries or occupations account for a higher
share of employment in an area relative to a benchmark location – usually Great Britain. This provides an
indication of the degree of specialisation across sectors within a local economy (compared to the national
average). LQ is calculated by comparing an industry’s share of employment against the national share. The
general rule for analysing LQ calculated is as follows:
▪ Value > 1 – The industry is more important locally than it is nationally
▪ Value = 1 – The industry is equally important locally and nationally
▪ A value < 1 – The industry is less important locally than it is nationally
Table 7 - Location Quotient comparing WMCA against Great Britain
Page 333

Page 14
Sector West Midlands:
Great Britain
Agriculture, forestry and fishing 0.0
Mining and quarrying 0.1
Manufacturing 1.3
Electricity, gas, steam and air conditioning supply 1.0
Water supply; sewerage, waste management and remediation activities 1.3
Construction 0.8
Wholesale and retail trade; repair of motor vehicles and motorcycles 1.0
Transportation and storage 1.1
Accommodation and food service activities 0.8
Information and communication 0.6
Financial and insurance activities 1.0
Real estate activities 1.1
Professional, scientific and technical activities 0.8
Administrative and support service activities 1.2
Public administration and defence; compulsory social security 0.9
Education 1.2
Human health and social work activities 1.1
Arts, entertainment and recreation 0.7
Other service activities 1.0
Source: Calculated based on the Office for National Statistics, Business Register and Employment Survey, 2020
This shows the importance of the manufacturing, automotive and logistics sectors in the West Midlands
compared to Great Britain. It will be important throughout the transition to Net Zero to focus on these
sectors and ensure that training and skills programmes for the 5-year plan.
SKILLS LEVELS AND QUALIFICATIONS
High-skilled jobs require more specialised skills to be developed and this is measured by the level of
qualifications the person has. Qualifications are defined under the National Vocational Qualifications (NVQ)
assessment. The following is a breakdown of NVQs and their associated qualifications:
No Qualifications
No formal qualifications held.
Other Qualifications
Includes foreign qualifications and some professional qualifications.
NVQ1 Equivalent
Fewer than five GCSEs at grades A-C, foundation GNVQ, NVQ 1, intermediate one national qualification
(Scotland) or equivalent.
NVQ2 Equivalent
Five or more GCSEs at grades A-C, intermediate GNVQ, NVQ 2, intermediate two national qualifications
(Scotland) or equivalent.
NVQ3 Equivalent
Two or more A levels, advanced GNVQ, NVQ 3, two or more higher or advanced higher national
qualifications (Scotland) or equivalent. Page 334

Page 15
NVQ4 Equivalent and Above
Higher National Diploma, Degree and Higher Degree level qualifications or equivalent.
No Qualifications The key areas to observe in terms of determining the skill level of a local labour market are by looking at
levels of ‘No qualifications’, NVQ2 and ‘NVQ4 and above’. Higher levels of qualifications generally
correspond to higher employment rates with people with degree-level qualifications or above more likely to
be working in ‘professional’ and ‘technical’ roles where the median gross weekly earnings are higher.
According to the last census; fewer than half of those with “no qualifications” were in some sort of
employment compared to roughly 80% of people who had at least one qualification.
The WMCA has a high rate of its working population with no qualifications. Solihull is the only authority
which performs better than rest of the country. The percentage of the working population with No
Qualifications has fallen over the previous 5 years from 16.3% to 13.4%, a decrease of 2.9 percentage
points but is still above the Great Britain average of 7.7% respectively.
NVQ2
Having NVQ2 level qualifications is a minimum requirement for most jobs, corresponding to the standard
five GCSE’s at grades A-C (generally English and Mathematics are required subjects).
The percentage of the working population with NVQ 2 qualifications and above in WMCA is below the
Great Britain average. The WMCA had a rate of 67.0% at the end of 2019 compared to 63.2% in 2015 but
this is below the GB rate of 75.6%.
NVQ4
It will be bridging the gap between the number of people with NVQ 2 and those with NVQ3/4 which will help
drive the transition to Net Zero.
Solihull has the highest share of people with NVQ4 or above in the WMCA with a rate of 44.9%. This is
higher than the Great Britain average of 40.3% however the WMCA rate of 31% is below this. The WMCA
has experienced a growth in NVQ4 rate since 2015. Bridging the gap between those obtaining NVQ2 and
NVQ4 qualifications in WMCA should be the priority as this will help to address some of the existing skills
gaps.
COVID-19
COVID-19 impacts on the labour market in the long-term are currently unclear and are still unfolding. To
fully understand the impact on the labour market it will take months to see how this has been affected and
could take years for some industries to recover fully. The impacts on the UK economy have been
significant, however the government and the Bank of England are still trying to help stabilise the economy
with a series of employment-related policies. Even with the support of these market interventions, it is
estimated that Gross Domestic Product could decrease by up to 11% this year compared to last year.
The October 2020, Claimant Count data (the measure of number people claiming unemployment benefits)
released in November 2020 shows the early impacts of COVID-19 on the UK labour market. To understand
the full impact on the labour market, observing the monthly Claimant Count data in April and May 2021 will
be important as this will show whether the extension of the Job Retention Scheme and the Self-
Employment Income Support Scheme has delayed unemployment rather than stopped unemployment from
occurring.
Page 335

Page 16
Table 8 shows a sharp increase in unemployment, locally, regionally and nationally comparing October
2020 against October 2019. Across WMCA, there has been an increase of 94,000 in the number of
unemployed people.
Table 8 - Claimant Count in October 2020 vs October 2019,
Area Claimant Count, October 2020
Claimant Count, October 2019
Difference
England 2,228,150 1,240,610 +987,540
WMCA 171,450 77,620 +93,830
Birmingham 81,815 34,495 +47,320
Coventry 16,695 9,455 +7,240
Dudley 14,285 6,030 +8,255
Sandwell 19,280 9,420 +9,860
Solihull 7,495 3,880 +3,615
Walsall 14,945 7,055 +7,890
Wolverhampton 16,940 7,290 +9,650
Source: Office for National Statistics, Labour Market Overview, November 2020
The above shows that Birmingham is the area with the largest increase in the number of Claimant Count
claims followed by Sandwell. The increase in claims in Birmingham account for 50% of the total increase in
claims in the WMCA. Table 9 shows the relative impact comparing the unemployment rate to the working
population.
Table 9 - Percentage of population aged 16-64 unemployed,
Area % unemployed, April 2020
% unemployed, April 2019
England 6.3 3.5
WMCA 9.3 4.2
Birmingham 11.2 4.7
Coventry 6.7 3.8
Dudley 7.4 3.1
Sandwell 9.4 4.6
Solihull 5.8 3.0
Walsall 8.6 4.1
Wolverhampton 10.4 4.5
Source: Office for National Statistics, Labour Market Overview, May 2020
Table 9 shows that Birmingham saw the biggest increase in unemployment rate from 4.7% in October 2019
to 11.2% in October 2020, a year-on-year increase of 6.5 percentage points. In relative terms, WMCA has
seen larger increase than the rest of England. The unemployment rate in October 2019 was 4.2% in
WMCA and 3.5% in England, and this increased to 9.3% and 6.3% respectively. Due to the extension of
the job retention scheme it will not be until the monthly Claimant Count data is released in April and May of
2021 that the impact on unemployment will be confirmed and, therefore, the underlying trends in the data
as the Government’s two flagship schemes to support furloughed workers will end.
Job Retention and Self-Employment Schemes
On the 11th June, HMRC created two new monthly statistical bulletins showing the number of furloughed
employees as part of the Coronavirus Job Retention Scheme (CJRS) and the number of claimants on the
Self-Employment Income Support Scheme on a local authority level. The data is correct as of 31st July
2020.
Page 336

Page 17
Table 10 - Number of Furloughed Employees by Business Size
Employer size Total number of employers furloughing
Total number of employments
furloughed
Total value of claims made
(£million)
1 181,800 182,500 922
2 to 4 286,200 538,700 2,963
5 to 9 132,800 479,000 3,108
10 to 19 79,800 487,300 3,364
20 to 49 61,700 686,500 5,089
50 to 99 19,400 426,700 3,194
100 to 249 11,400 483,500 3,651
250+ 7,400 1,803,200 13,889
Unknown 600 6,500 32
Total 781,300 5,093,900 36,210
Source: HMRC, Coronavirus Job Retention Scheme statistics: October 2020
The table above shows the number employers and employers furloughed as of July 31st. At the peak of the
crisis the number of people furloughed was higher than the above. In terms of business size, those with two
to four employees have been most affected. Large businesses (more than 250+ employees) represented
the greatest number of people furloughed.
The impact on sectors has varied greatly with some industries more able to adjust to changing
circumstances than others. Many people working in the Professional Services may be able to work from
home whilst other services are reliant on being on site or at a specific location.
Table 11 - Top five sectors by number of employees furloughed as of July 31st 2020
Sector Total number of employments
furloughed
Total value of claims made
(£million)
Total 5,093,900 36,210
Accommodation & food services 1,028,700 5,730
Wholesale and retail; repair of motor vehicles 801,000 6,914
Business administration and support services 546,000 3,367
Manufacturing 444,400 4,452
Professional, scientific and technical 408,200 2,695
Source: HMRC, Coronavirus Job Retention Scheme statistics: October 2020
The total value of claims since March shows that Wholesale & Retail sector was the most impacted sector
in the economy, resulting from the government decision to close non-essential shops making people unable
to work and leading to firms putting employees on furlough. Accommodation & Food services and
Manufacturing have also been significantly impacted by the Government’s lockdown directives. The top five
sectors make up 64% of all claims by value.
Geographic breakdowns of number of employees furloughed has been provided by HMRC for CJRS
claims. The West Midlands was the fifth most affected region of the UK after London, South East North
West and the East of England.
Table 12 - Number of employees furloughed by local authority as at 31st August 2020
Area Number of people furloughed
United Kingdom 3,274,900
West Midlands 278,400
West Midlands Combined Authority
139,500
Birmingham 55,400 Page 337

Page 18
Coventry 16,600
Dudley 14,800
Sandwell 15,900
Solihull 12,600
Walsall 12,800
Wolverhampton 11,400
Source: HMRC, Coronavirus Job Retention Scheme statistics: October 2020
It will take time, effort and investment for the UK economy to recover from the global crisis triggered by the
COVID-19 pandemic. Even amidst the current pandemic, there is still an urgent need to respond to the
challenges of climate change and deliver Net Zero. Well-designed employment programmes can make
distinct contributions to mitigating and adapting to the effects of climate change whilst also creating jobs.
These should highlight the potential jobs that the green industrial revolution could bring to regions that have
suffered industrial decline from the pandemic such as retail, hospitality and manufacturing. This will help
create long-term and sustainable employment in the WMCA.
Page 338

www.wsp.com
APPENDIX G-4 - GOALS JOBS ANALYSIS
JOBS CREATED
WSP have undertaken high-level analysis regarding the expected job impacts of the goals outlined in the
main report. A qualitative assessment of the impacts regarding the Net Zero has been outlined in Table 13.
Table 13 – Goals and high-level jobs impacts
Sector Goals Jobs created Jobs lost Net Effect
Domestic Energy Efficiency Retrofit coordinators,
installers and designers
Increase
Fuel Switching Heat pump installers Gas boiler
maintenance repairs
Increase
Microgeneration Solar PV installers Increase
Commercial Energy Efficiency Retrofit coordinators,
installers and designers
Increase
Fuel Switching Heat pump installers Gas boiler
maintenance repairs
and gas transmission
Increase
Microgeneration Solar PV installers Increase
Industry Energy Efficiency and
Fuel Switching
Retrofit coordinators,
installers and designers
Heat pump installers
Increase
Microgeneration Solar PV installers Increase
Transport Demand Reduction
(WFH)
Opportunity to encourage
digital skills
IT and service sector jobs
in more rural areas in
local workspace hubs
Reduced demand for
City Centre services
such as food and
beverage stores
Vehicle manufacturers
Nil
Fuel Switching (HGVs) Hydrogen /
Electric vehicle
manufacturers
Petrol and diesel
engine manufacturers
Increase
Fuel Switching (Buses,
Taxis)
Petrol and diesel engine
manufacturers
Petrol and diesel
engine manufacturers
Increase
Demand Reduction
(Trips)
Increase in LGV services
and drivers from more
deliveries
Vehicle manufacturers
Minimal
Increase
Mode Shift Increased public
transport operators
Vehicle manufacturers Increase
EV Uptake EV vehicle manufacturing Petrol and diesel
vehicle manufacturing
Increase
Land Use Renewables Solar and wind
infrastructure installers
and maintenance
Increase
Afforestation Tree planters, ecologists Increase
Page 339

Page 20
WSP has undertaken some high-level analysis to forecast the future number of jobs created by each
intervention per sector for 2026 and 2041 based on the High carbon modelling scenario. The method
adopted is based on research and additionality guidance set out in HCA’s Additionality Guide10. Research
has been paired with the inputs and outputs from the carbon modelling for most of the goals to estimate
expected jobs created for the five-year plan period and until 2041. Where goals are not expected to have
noticeable impact on jobs these have not been modelled.
WSP analysed the goals required to meet Net Zero by 2050. WSP used a mix of sources (more detail can
be found in section 5 of the main report) to enable estimation of the uptake of goals by 2041 to meet Net
Zero. To inform the pathway over the next two decades WSP developed a time series for the uptake of
each goal. For example, the expected percentage of electric vehicles usage in 2026 and 2041 was used to
estimate job creation in the EV sectors.
WSP then researched and estimated the employment requirements associated with each goal11 and
existing employment levels within the WMCA. While supporting evidence is limited at this stage this aimed
to identify and quantify the number of workers required to either manufacture, install and operate and
maintain for each goal and in associated supply chains. This included new low carbon technologies, natural
capital and transport mode shift to more active and public transport modes. Combining the research and
analysis in the carbon modelling with employments enabled an estimation of the number of new jobs
required for each goal by 2026 and 2041.
The additionality calculations are based on the standard steps set out in the guidance. This covers:
▪ The level of ‘leakage’, (i.e. the proportion of new jobs that are expected to be created for residents
outside of WMCA);
▪ The level of ‘displacement’, (i.e. the proportion of new employment generated that will simply be
displaced from neighbouring areas);
▪ The level of ‘substitution’ , (i.e. the proportion of new employment generated that will be substituted from
one activity for a similar one); and
▪ The economic ‘multiplier’ impacts, (i.e. the additional jobs generated in supply chains, indirect
employment, and through the expenditure of employees, induced employment).
To calculate the extent of additionality, the following assumptions were made and were applied to both the
intervention and reference cases:
▪ Leakage: a Low impact of 10% was selected (based on Table 4.3 in the Additionality Guide: Fourth
Edition);
▪ Displacement: a Low impact of 10% was selected (based on Table 4.8 in the Additionality Guide: Fourth
Edition);
▪ Substitution: a Low impact of 25% was selected (based on Table 4.10 in the Additionality Guide: Fourth
Edition); and
▪ Multiplier: a multiplier value has been chosen based on the Office for National Statistics industry
multiplier rates published in 2019.
Using the MHCLG formula for the following additionality rate and multiplier rates have been calculated for
each intervention. Additionality is the extent to which the jobs would be created that would not have
10 Homes and Communities Agency, Additionality Guide, Fourth Edition 2014 https://assets.publishing.service.gov.uk/government/uploads/system/uploads/attachment_data/file/378177/additionality_guide_2014_full.pdf (note that several aspects of this additionality guidance are also contained in DCLG’s Appraisal Guide of December 2016) 11 Transport Demand (WFH and trips) and Land Use (Renewables) goals have not been modelled in the jobs analysis as there is expected to be limited impact. Page 340

Page 21
occurred in the absence intervention such as the net zero gaols. Economic multipliers refer to the increased
economic activity (jobs, expenditure or income) associated with additional local income, local supplier
purchases and longer term development effects from new jobs created as result of net zero goals.
Table 14 - Additionality and Multipliers
Sector Goals Additionality Multiplier
Domestic Energy Efficiency 0.51 1.97
Fuel Switching 0.51 1.97
Microgeneration 0.51 5.71
Commercial Energy Efficiency 0.51 5.71
Fuel Switching 0.51 5.71
Microgeneration 0.51 5.71
Industry Energy Efficiency and Fuel Switching 0.51 1.97
Microgeneration 0.51 1.97
Transport Fuel Switching (HGVs) 0.51 1.97
Fuel Switching (Buses, Taxis) 0.51 1.47
Demand Reduction (Trips) 0.51 1.47
Mode Shift 0.51 1.47
Electric Vehicles 0.51 3.05
Land Use Renewables 0.51 5.71
Afforestation 0.51 3.05
Domestic
▪ Energy Efficiency – 5,500 jobs created by 2026 and 18,800 jobs by 2041
▪ Fuel Switching (Heat pumps) - 6,900 jobs created by 2026 and 23,500 jobs by 2041
▪ Microgeneration - 1,800 jobs created by 2026 and 7,900 jobs by 2041
Commercial
▪ Energy Efficiency – 500 jobs created by 2026 and 2,200 jobs by 2041
▪ Fuel Switching (Heat pumps) - 500 jobs created by 2026 and 2,200 jobs by 2041
▪ Microgeneration - 100 jobs created by 2026 and 600 jobs by 2041
Industry
▪ Energy Efficiency – 10 jobs created by 2026 and 200 jobs by 2041
▪ Microgeneration - 10 jobs created by 2026 and 100 jobs by 2041
Transport
▪ Fuel Switching (HGVs) – no jobs created by 2026 and 400 jobs by 2041
▪ Fuel Switching (Buses, Taxis) - 500 jobs created by 2026 and 800 jobs by 2041
▪ Demand Reduction (Trips) – 40 jobs created by 2026 and 120 jobs by 2041
▪ Mode shift – 1,500 jobs created by 2026 and 1,500 jobs by 2041
▪ Electric Vehicles – 3,400 jobs created by 2026 and 32,800 jobs by 2041
Land use
▪ Renewables - 40 jobs created by 2026 and 600 jobs by 2041
▪ Afforestation – 200 jobs created by 2026 and 700 jobs by 2041
In total the proposed goals could create 21,000 jobs in the WMCA economy by 2026 and just over 92,000
jobs by 2041. However, if the WMCA does not develop a pool of potential workers with the skills needed for Page 341

Page 22
the goals such as retrofit these jobs will not be created to this scale or timeframe. There is an opportunity
for the WMCA to be at the forefront of Net Zero skills development and to create a competitive advantage
over other regions.
Table 15 - Goals and high-level jobs impacts summary
Sector Goals New roles created Jobs
created by
2026
Jobs
created
by 2041
Domestic Energy Efficiency Retrofit coordinators,
installers and designers 5,500 18,800
Fuel Switching Heat pump installers 6,900 23,500
Microgeneration Solar PV installers 1,800 7,900
Commercial Energy Efficiency Retrofit coordinators,
installers and designers 500 2,200
Fuel Switching Heat pump installers 500 2,200
Microgeneration Solar PV installers 100 600
Industry Energy Efficiency and
Fuel Switching
Retrofit coordinators,
installers and designers 10 200
Microgeneration Heat pump installers 10 100
Transport Fuel Switching (HGVs) Hydrogen and Electric
vehicle manufacturers 0 400
Fuel Switching (Buses,
Taxis)
Petrol and diesel engine
manufacturers 500 800
Demand Reduction
(Trips)
Increase in LGV services
and drivers from more
deliveries
40 120
Mode Shift Increased public transport
operators 1,500 1,500
Electric Vehicles EV vehicle manufacturing 3,400 32,800
Land Use Renewables Solar and wind
infrastructure installers
and maintenance
40 600
Afforestation Tree planters, ecologists 200 700
Total 21,000 92,420
Page 342

www.wsp.com
APPENDIX G-5 - SUPPLY SIDE REVIEW
COLLEGES
Colleges West Midlands is a formal strategic partnership of 20 colleges, including all colleges within the
West Midlands Combined Authority. Further Education is vital in supporting skills development across the
region and providing an infrastructure which offers technical and vocational education from levels 1 to 5.
Colleges West Midlands aim to raise the technical skills of young people and adults in full-time education,
upskilling in the workplace, undertaking an apprenticeship or pursuing a higher education programme either
full or part-time. They drive collaboration across sectors and specialisms to create a network of clusters
driving innovation and skills and Further Education providers that are driving multidisciplinary skills
development to modernise industrial practice.
Current courses, apprenticeships and qualifications at colleges in the West Midlands Combined Authority
cover a number of key sectors:
▪ Construction (Levels 1 – 3, brick laying, carpentry)
▪ Plumbing and gas (Level 2 and 3 Diploma in Plumbing and Domestic heating)
▪ Electrical (Level 2 and 3 Diploma in Electrical Installation)
▪ Manufacturing engineering
▪ Mechanical engineering
▪ Vehicles maintenance and repair
These courses will need to be adapted for emerging roles in the net zero economy. For example, vehicle
maintenance and repair courses will need to focus on EVs as there are differences with petrol cars.
Currently oSouth & City College Birmingham offer a specific course for EV maintenance. Vehicle training
programmes in all colleges will need to incorporate more qualifications relating to EVs. Colleges will also
need to roll-out heat pump installation and maintenance training programme as gas boilers will need to be
replaced by heat pumps, in both commercial and domestic buildings. Through the stakeholder engagement
for the Five Year Plan it’s been highlighted that EV and retrofit courses are being currently being developed
for colleges in region and some courses in these study areas are now available. This demonstrates the
education and training sector in the West Midlands Combined Authority ability to adapt and respond quickly
to changing skills requirements. This needs to be matched with employer demand however our
engagement indicates that many employers are not able specify their need for skills for net zero.
Two Institutes of Technology (IoT) have been developed to deliver higher technical education in the West
Midlands. Dudley IoT has been redeveloped to provide teaching and research environment for higher level
skills programmes in sectors where there are skills shortages and therefore employment opportunities
including in advanced manufacturing, modern construction methodologies and medical engineering. The
Greater Birmingham and Solihull IoT focuses on advanced manufacturing and industry through greater
collaboration of further and higher education and creating pathways from level three to level six
apprenticeships. Both IoTs form a key part of creating a world class technical education system in the West
Midlands.
Workers are needed to deliver major infrastructure projects such as HS2 that will support net zero. The
National College for Advanced Transport & Infrastructure in Birmingham provides training that will give
learners skills and lead to careers in areas such as civil engineering, systems engineering and digital
Page 343
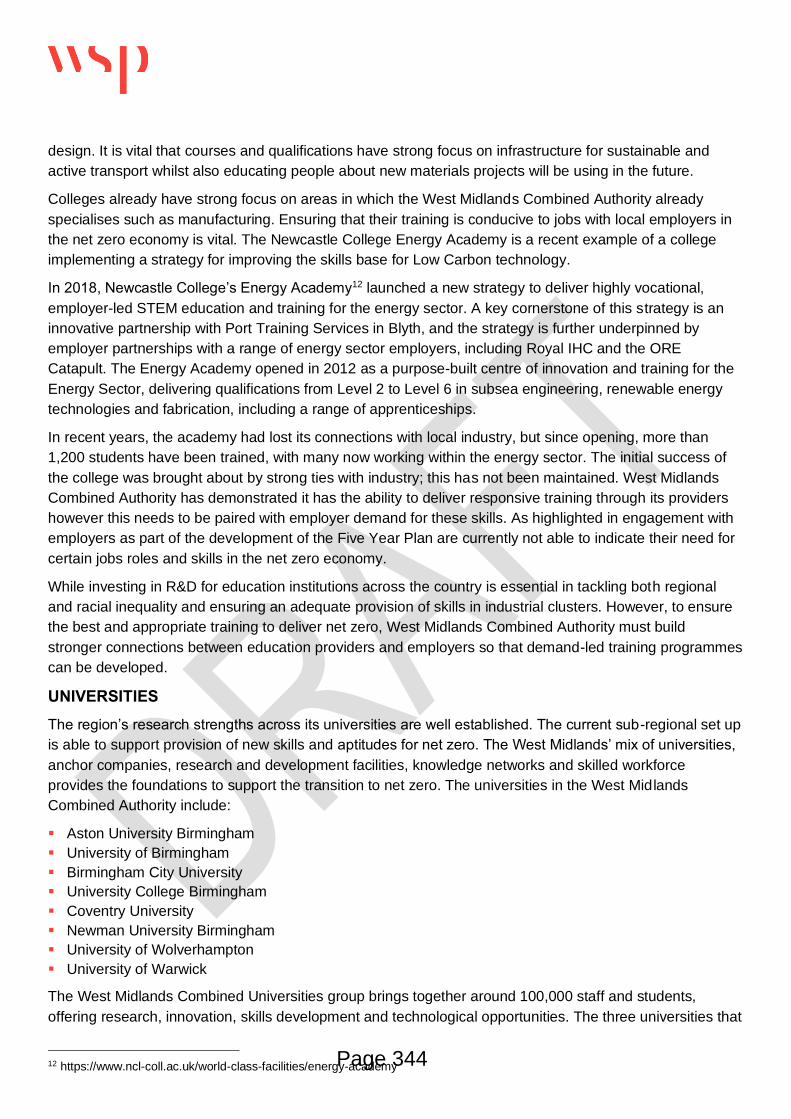
Page 24
design. It is vital that courses and qualifications have strong focus on infrastructure for sustainable and
active transport whilst also educating people about new materials projects will be using in the future.
Colleges already have strong focus on areas in which the West Midlands Combined Authority already
specialises such as manufacturing. Ensuring that their training is conducive to jobs with local employers in
the net zero economy is vital. The Newcastle College Energy Academy is a recent example of a college
implementing a strategy for improving the skills base for Low Carbon technology.
In 2018, Newcastle College’s Energy Academy12 launched a new strategy to deliver highly vocational,
employer-led STEM education and training for the energy sector. A key cornerstone of this strategy is an
innovative partnership with Port Training Services in Blyth, and the strategy is further underpinned by
employer partnerships with a range of energy sector employers, including Royal IHC and the ORE
Catapult. The Energy Academy opened in 2012 as a purpose-built centre of innovation and training for the
Energy Sector, delivering qualifications from Level 2 to Level 6 in subsea engineering, renewable energy
technologies and fabrication, including a range of apprenticeships.
In recent years, the academy had lost its connections with local industry, but since opening, more than
1,200 students have been trained, with many now working within the energy sector. The initial success of
the college was brought about by strong ties with industry; this has not been maintained. West Midlands
Combined Authority has demonstrated it has the ability to deliver responsive training through its providers
however this needs to be paired with employer demand for these skills. As highlighted in engagement with
employers as part of the development of the Five Year Plan are currently not able to indicate their need for
certain jobs roles and skills in the net zero economy.
While investing in R&D for education institutions across the country is essential in tackling both regional
and racial inequality and ensuring an adequate provision of skills in industrial clusters. However, to ensure
the best and appropriate training to deliver net zero, West Midlands Combined Authority must build
stronger connections between education providers and employers so that demand-led training programmes
can be developed.
UNIVERSITIES
The region’s research strengths across its universities are well established. The current sub-regional set up
is able to support provision of new skills and aptitudes for net zero. The West Midlands’ mix of universities,
anchor companies, research and development facilities, knowledge networks and skilled workforce
provides the foundations to support the transition to net zero. The universities in the West Midlands
Combined Authority include:
▪ Aston University Birmingham
▪ University of Birmingham
▪ Birmingham City University
▪ University College Birmingham
▪ Coventry University
▪ Newman University Birmingham
▪ University of Wolverhampton
▪ University of Warwick
The West Midlands Combined Universities group brings together around 100,000 staff and students,
offering research, innovation, skills development and technological opportunities. The three universities that
12 https://www.ncl-coll.ac.uk/world-class-facilities/energy-academy Page 344

Page 25
make up the group (Birmingham City University, Coventry University and the University of Wolverhampton)
have a strong history of connecting organisations with students for jobs and work placements, as well as
training and development opportunities for existing workers. With knowledge of the skills gaps currently
facing the region, the institutions are ideally placed to provide tailored training to fulfil business needs and
connect students and jobseekers with vacancies.
Aligning with the low carbon and net zero economy, the combined universities are developing a centre of
excellence to support areas of need including sustainable construction methods and materials, low
emission transport and fuels, and renewable energy generation13. This will address the huge opportunities
for employment and economic growth identified in the low carbon sector through continued investment in
enterprise, Research and Development (R&D), and knowledge transfer.
Business and university partnerships will embed digital and creative expertise in electric vehicle design and
manufacturing and support the development of new supply chains. For example, Coventry University’s
National Transport Design Centre and the Advanced Manufacturing and Engineering Institute provide
industry ready graduates and research in electric vehicle and powertrain technologies.
There are further opportunities to collaborate with the research capabilities of universities across the
Combined Authority in areas of Low Carbon and sustainable developments including:
▪ Low Impact Buildings Grand Challenge (Coventry University) - covering a wide range of aspects
from low carbon construction systems to intelligent monitoring and user experience of new building
technologies.
▪ European Bioenergy Research Institute (Aston University) - centre of excellence for bioenergy and
biofuels by pyrolysis and gasification. High level industrial research and industry test centre.
▪ Institute of Enefty Research and Policy (University of Birmingham) - the University is a world
leading specialist in low carbon energy and are particularly strong in bio-fuels bio waste to energy,
supercritical fluids and hydrogen fuel cell development, testing and storage.
▪ Sustainable Environment Research Group (Aston University) - SERG brings together experts from
backgrounds including civil engineering, mechanical engineering, hydrology, ecology and computer
modelling. The group aims to develop tools and technologies that conserve and rehabilitate ecosystems
while enabling international development.
▪ Bioenergy Research Group (Aston University) - The objective of the BERG is to apply chemical-
engineering science and technology to help provide the world with sufficient energy, fuels and chemicals
from renewable and sustainable resources to meet tomorrow's needs. BERG is developing novel
thermal processes whereby agricultural wastes, fast-growing wood, annual crops and biogenic wastes
can be thermally converted in a biorefinery, using both fast pyrolysis and intermediate pyrolysis, into oils
and gases which can, in turn, be used to generate electricity and produce transport fuels and chemicals.
▪ Centre for Hydrogen and Fuel Cells Research (University of Birmingham) - Collaborative research,
R&D, testing of fuel cells, student placements, training in hydrogen fuel cell technology, hydrogen
storage and hydrogen creation from waste materials.
▪ Hydrogen Fuel Cell Vehicles (Coventry University) - Coventry is at the head of developments in
‘green’ vehicle technologies. Researchers are also involved with the development of an automotive
hybrid power flywheel system; including thermal modelling, vehicle system energy modelling, as well as
control and sensor development work.
▪ Thermofluid Engineering (Coventry University) - Thermofluids Engineering group's work is focused
on automotive aftertreatment applications. The group provides both technical expertise and dedicated
13 http://www.wmcu.ac.uk/areas-of-expertise/ Page 345

Page 26
test facilities. The research focuses on the development and validation of simulation techniques to
predict the flow performance of after-treatment systems for spark ignition and diesel engines.
▪ Warwick Manufacturing Group - broad range of research including Low Carbon Vehicle Technology
Project with industrial and HEI partners. The Vehicle Energy Facility tests hybrid powerplants,
sustainable green materials, software integration, integrated power control, mechanical energy
conversion. Advanced Manufacturing covers opportunities for research, development, prototyping and
practical application in the areas of Advanced Materials, Innovation and Vehicles.
▪ Polymer Research (Aston University) - Polymer processing and performance including development
of new materials and effects of accelerated ageing and weathering.
▪ Premium Vehicle Lightweight Technologies - advanced materials to lighten vehicles and cut down on
CO2 emissions. Includes advanced materials for exterior panels, different forms of lubrication, joining
technologies, simulation.
▪ Manufacturing Technology Centre (University of Birmingham, Lead Partner with Rolls Royce) -
collaborative research and practical applications, manufacturing development, problem solving and
improving competitiveness.
In addition to the research centres the universities offer renowned undergraduate and postgraduate
degrees that will support development of net zero skills base and strong talent pool in region. Degrees
include:
▪ Civil engineering (BEng and MEng)
▪ Environmental science (BSc)
▪ Chemical engineering (BEng and MEng)
▪ Sustainable engineering (MSc)
▪ Automotive engineering (BEng)
▪ Construction project management (BSc)
▪ Gastronomy and food sustainability (MSc)
Theses degree will be at the forefront at developing a skills base for newly created roles in the net zero
economy. In addition to those institutions in the West Midlands Combined Authority, there also universities
in the surrounding areas with strong research facilities and networks in these same fields such as Keele
University and Staffordshire University.
LOW CARBON
In 2018 Sustainability West Midlands Based undertook a review14 and analysis of the low carbon sector in
the region to inform the development of the new West Midlands Local Industrial Strategy. Sustainability
West Midlands suggests that the following areas should be highlighted to as particular strengths of the
West Midlands Combined Authority upon which to build.
▪ EIT Climate-KIC - a European knowledge and innovation community, working towards a prosperous,
inclusive, climate resilient society founded on a circular, zero-carbon economy.
▪ Energy Innovation Zones - framework for focused energy infrastructure investment meeting local
community needs. They are mechanisms for risk-managed transition to an appropriate energy
infrastructure for the future.
▪ Energy Capital - a smart energy innovation partnership for the West Midlands. The aim is to make the
West Midlands one of the most attractive locations to build innovative clean energy technology
companies in the world.
14 West Midlands Local Industrial Strategy, Low Carbon Evidence Base, Sustainability West Midlands, 2018 Page 346

Page 27
▪ Energy Research Accelerator - ERA is the UK’s first cross-disciplinary energy research hub in the UK
drawing on the expertise and world-class facilities of many of the Midlands Innovation group of
universities, including Aston, Birmingham and Warwick.
▪ Energy System Catapult - Based in Birmingham, the Energy Systems Catapult supports innovators in
unleashing opportunities from the transition to a clean, intelligent energy system.
▪ CABLED successor activity - The CABLED project ran from 2009 to June 2012 and showcased
electric cars across Birmingham and Coventry, making ultralow-carbon vehicles available to real users
and collected data on everyday use. Government could use this as an opportunity to invest in local trials
that focus on innovative low carbon transport technologies, such as rapid charging points or alternative
fuels such as hydrogen.
▪ Autonomous vehicle development - Early cluster in the West Midlands with activity and existing
assets (such as JLR, HORIBA MIRA, Centre for Connected & Autonomous Automotive Research,
Warwick Manufacturing Group etc.), there is an opportunity to make the West Midlands the UK’s
national centre for autonomous vehicle testing and development.
The West Midlands Combined Authority demonstrates particularly significant activity and expertise in
research, development and projects pertaining to low emission vehicles, energy storage and systems,
renewable energy and fuel cell and battery technologies. Therefore, further collaboration and investment
between the private sector and education is needed to strengthen skills base in these areas.
CHAMBERS OF COMMERCE
The Greater Birmingham, Black Country, Coventry and Warwickshire Chambers of Commerce provide
regional business support for firms based within or doing business across the West Midlands Combined
Authority. The services and initiatives these agencies provide platforms and opportunities for businesses to
grow, connect and become part of a thriving network. They are considered a leading provider of training
and development, including apprenticeships for young people and adults as well as higher education and
business to business courses. The Chambers of Commerce work with employers to design and develop
courses which are up to date and relevant to industry and individual needs. At the moment no training
courses are offered around sustainability and the green economy. There will be a need for training
providers to offer programmes with a greater focus on sustainability and reducing carbon emissions for
local businesses which then can passed onto their employees. New courses will need to be accredited by
the British Chambers of Commerce.
SKILLS HUBS AND PROGRAMMES
Throughout the West Midlands Combined Authority, there a number of programmes in place to provide
training and support for local businesses, especially for Small and Medium Enterprises (SME’s). These
have been developed with the aim of local businesses to be as successful as they can be by supporting the
development of a skilled and talented workforce. A list of the current jobs and skills programmes and short
description is provided below.
▪ Adult skills for work (ASW) – This a programme which provides funded and part funded training which
aims to help adults in employment within Birmingham, Coventry, Dudley and Sandwell to improve their
skills and improve their future through progression in their work or by finding better paid employment.
ASW is funded through the West Midlands Combined Authority Adult Education Budget. The following
priority sectors for training have been identified to target in their area; Construction; Digital; Business
and Professional Services; Engineering and Advanced Manufacturing.
▪ Skills and Apprenticeship Hub – this is part of the GBSLEP Growth Hub providing advice, guidance, and
access to a provider network to support any workforce development needs employers across the Page 347

Page 28
Greater Birmingham and Solihull area. Working with local, regional, and national providers and
stakeholders in public and private sectors to deliver skills solutions.
▪ Coventry & Warwickshire Skills 4 Growth – This is a European Social Fund project managed by
Coventry City Council, working in partnership with the Coventry and Warwickshire Local Enterprise
Partnership and Growth Hub to deliver accredited training ranging from leadership and management
through to technical and soft skills for SME’s. The focus is on the skills needs and gap of a company,
with customised packages developed to address business requirements and support growth.
▪ Greater Birmingham Supplier Skills Programme (SSP) - The SSP is a three-year programme Co-funded
by the European Social Fund. Birmingham City Council has selected Skills Training UK as one of a
small number of training partners for the employee upskilling programme in the GBSLEP region. The
programme aims to improve management expertise, workforce capability and capacity, providing
essential tools to help SME’s sustain their performance and productivity.
▪ The Black Country Skills Factory – This is an employer-led education and training collaboration being
coordinated by Black Country Consortium Ltd with funding via the Skills Funding Agency. The aim of the
project is to address skills shortages in the five transformational sectors in the Black Country; Advance
Manufacturing; Transport technologies; Construction; Environmental Technologies; and Business
Services.
▪ The Elite Centre for Manufacturing Skills (ECMS) - This an employer-led training facility located in the
Black Country, designed to support the UK industry in upskilling and multi-skilling the workforce, with
particular focus on developing technical skills and knowledge in engineering, manufacturing, casting and
metal forming sectors. ECMS is funded by The Black Country LEP and collaboration between, University
of Wolverhampton, Dudley College, Cast Metals Federation, Confederation of British Metalforming and
Institute of Cast Metals Engineers.
▪ Skills Support for the Workforce (SSW) - Programme developed to upskill employees within small and
medium-sized businesses in the Black Country by providing recognised accredited qualifications and
training courses. SSW is co-financed by the Education and Skills Funding Agency and the European
Social Fund. SSW in the Black Country is managed by Serco in partnership with the BC LEP.
The majority of the training available in the West Midlands Combined Authority is commissioned through
the Adult Education Budget. The skills and qualifications data in Appendix E shows that the proportion of
people with qualifications above NVQ2 and NVQ4 in the combined authority has grown since the devolution
of the Adult Education Budget. The numerous training programmes that have been put in place over the in
recent years are supporting the main aims the Strategic Economic Plan, Local Industrial Strategy and
Regional Skills Plan.
Across all of these programmes there is common aim to supply individuals with the appropriate skills and
aspirations to meet current and future needs of a highly technical industry. Whilst these will address
shortages of specific skillsets which support the region’s strategic opportunities there is need to improve
skills that will directly to support goals outlined in the Five Year Plan. The programmes highlighted above
provide a foundation to support the transition to net zero, however more specific sustainability and lower
skilled training programmes are needed especially those with lower skills levels.
These will be needed in these transformational sectors:
▪ Advance Manufacturing – e.g. working in a more automation and with new materials;
▪ Transport technologies – e.g. EV maintenance and repair.
▪ Construction – e.g. heat pump fitting and repair;
▪ Environmental Technologies - e.g. renewable energies;
▪ and Business Services – e.g. improving sustainability in services and products.
Page 348

Page 29
This will enable the region to take advantage of current growth opportunities in the transformational sectors
and "future-proof” the skills base of a workforce whilst ensuring no one is left behind.
Page 349

This page is intentionally left blank

1
Overview & Scrutiny CommitteeDate 8 March 2021
Report title ‘Economic Needs of the Black Country’ Scrutiny Review - Summary of Findings
Members Undertaking the Review
Councillors Ahmad Bostan (Chair), Cathy Bayton, Angus Lees and Lisa Trickett.
AccountableEmployee
Tim Martin, Head of Governance, Clerk & Monitoring Officeremail: [email protected]: (0121) 214 7435
Recommendation(s) for decision:
The Overview & Scrutiny Committee is recommended to:
(1) Endorse the observations and conclusions of the scrutiny review group, as set out within the report, for further consideration by the WMCA, Black Country local authorities and the Black Country LEP.
(2) To note that the conclusions of this scrutiny review will be reported to the WMCA Board on 19 March 2021.
Page 351
Agenda Item 9

2
Purpose
1. To consider the findings of a scrutiny review undertaken to understand whether the regional economic recovery proposals, which the WMCA were supporting and enabling, were meeting the needs that had been identified within the Black Country sub-region. In addition, the review also considered whether the specific sub-regional needs were being adequately considered during the development of wider regional policies and delivered sustainably.
Background
2. The region’s economic response to COVID-19 has had several different components, reflecting the different phases of the UK’s recovery from the pandemic. These components have included:
The short term pivoting of existing projects and the deployment of local measures to provide immediate support.
A regional investment case to Government to kickstart recovery in the medium term. The need for a longer-term reset of economic strategies, including the Local
Industrial Strategy, Regional Skills Plan and the Strategic Economic Plan.
3. This approach to regional economic recovery has been guided by ten priorities for recovery. The priorities, which would be the focus over the coming months and years of the region’s recovery from the economic impacts of the pandemic, were identified as:
Ensuring our residents were kept safe and healthy Getting people who lose their jobs back into work quickly Supporting our local businesses New investment in technology and innovation Building more homes faster and reshaping our town centres Accelerating our transport construction plans Making sure the recovery was inclusive and worked for everyone Stepping up our green growth plans Taking the West Midlands out to the world Regaining control of our own recovery
4. At its meeting on 7 September 2020, the Overview & Scrutiny Committee agreed to undertake a scrutiny review to consider whether the regional economic recovery proposals were meeting the specific needs identified within the Black Country sub-region. The key objectives for the review were identified as being to:
(a) Understand the economic needs of the Black Country sub-region to enable a post-COVID-19 recovery.
(b) Understand the regional economic recovery proposals and how they specifically impacted on the Black Country sub-region.
(c) Determine the degree to which the economic recovery proposals were likely to adequately address the Black Country’s economic needs.
(d) Understand how the identified economic needs of the Black Country sub-region influenced and shaped policy development within the WMCA.
Page 352

3
5. The review group was chaired by Councillor Ahmad Boston and also comprised Councillor Cathy Bayton, Councillor Angus Lees and Councillor Lisa Trickett. The review was undertaken during December 2020 and January 2021 and was supported by Jonathan Skinner (Head of Economy & Local Industrial Strategy), Jordan Gerrard (Graduate, Strategy) and Lyndsey Roberts (Scrutiny Officer).
Evidence Gathering 6. The review group sought a range of written and verbal evidence to help inform its
conclusions and recommendations. A briefing note was prepared by the WMCA’s Strategy Team that summarised the West Midlands approach to economic recovery. It provided a greater understanding on how the region’s economic response to COVID-19 had several different components that reflected the different stages of the UK’s recovery from the pandemic.
7. The review group considered a report ‘The State of Economic Justice in Birmingham and the Black Country’, and an independent piece of research led by the New Policy Institute and funded by the Barrow Cadbury Trust that was published in 2019. It drew together regional data and focussed on ‘economic justice’, in particular the extent to which the West Midlands economy was delivering financial security and general wellbeing to the population of the region.
8. In support of the findings of this report, the review group received a presentation from Dr Peter Kenway from the New Policy Institute on a further piece of research that highlighted key information regarding the state of ‘economic justice’ in Birmingham and the four Black Country local authority areas. It focussed on how different groups were experiencing economic wealth and opportunity, and the ongoing systemic and structural barriers faced by many in achieving financial resilience. The research explored and highlighted the extent to which economic prosperity was felt equally across the population. Some of the key data presented to the review group (and which refer to the period before the pandemic) included:
56% of children in the Black Country live in local areas which are within the most deprived fifth of all local areas in England. 36% of children in the Black Country live in low-income households (‘income poverty’)
In order to reach the England-wide average employment rate of 75%, 45,000 more Black Country residents needed to be in jobs.
82% of those that work in the Black Country also live within this area; the Black Country had one of the lowest levels of job density (jobs per head of
population) in the country; Managerial and professional jobs had a much smaller share of all jobs in the Black
Country (38%) than in other parts of the WMCA area (around 50%). Too many residents of the Black Country had only level 1 qualifications or below (31%
of 25 to 29 year olds) and too few achieved level 3 qualifications (19% of 25 to 29 year olds)
9. As 56% of children in the Black Country live in the local area which are among the most deprived fifth of all local areas in England and 36% of children in the Black Country live in low-income households, it was clear that measures were needed now, rather than waiting until they hit the employment market. In addition, as 82% of those that worked in the Black Country also lived within the area, there was a need to focus on the local geography and the local workforce rather than expect pan-regional solutions to provide the answers to
Page 353

4
Black Country problems. The panel commented that too many young children lacked school readiness, and this was embedding at an early age the disadvantages.
10. The review group used this data and information as an evidence base to help frame its questions for key witnesses.
11. In addition to the written evidence submitted, the review group conducted online face-to-
face interviews with a range of key witnesses to gain their understanding and insight into investment in the Black Country and whether the recovery proposals were likely to meet the needs of the Black Country sub-region. This helped build a better understanding as to whether the Black Country was getting a ‘fair deal’. These key witnesses were:
• Councillor Wasim Ali (Deputy Leader of Sandwell Metropolitan Borough Council)
• Councillor Ian Brookfield (Leader of the City of Wolverhampton Council and WMCA Portfolio Lead for Economy & Innovation)
• Julia Goldsworthy (Director of Strategy, WMCA)• Helen Martin (Director of Regeneration & Enterprise, Dudley Metropolitan
Borough Council)• Sarah Middleton (Chief Executive of the Black Country Consortium)• Julie Nugent (Director of Productivity and Skills, WMCA)• Councillor Stephen Simkins (Representative of the Association of Black Country
Authorities)• Tom Westley (Chair of the Black Country Local Enterprise Partnership)
Emerging Themes and Considerations
12. During the consideration of the written and oral evidence gathered during the course of the review, a number of broad themes emerged.
Funding and Resources
13. It was clear that access to external funding sources was a key driver for securing the economic rejuvenation that the Black Country needed. Local authorities, the WMCA and the LEP were not funded sufficiently to be able to adequately drive economic regeneration themselves or to bring about the transition in jobs and skills that communities in the Black Country needed, and therefore the ability to attract funding into the region was the single biggest factor in being able to drive local economic development that properly addressed need. It was clear that the Black Country needed economic interventions that are reflective of the differing needs and requirements of the Black Country.
14. The review group heard concerns that public investment was often short-term and disjointed although this was often a function of the need to bid for external funds, which in turn drove a project by project approach. The review group heard calls for a ‘whole place’ strategy to be developed, financed and implemented to better align investment across local authorities, LEP and WMCA. There was a concern that the region’s local authorities were not always joined up in their plans, and that more strategic alignment could result in securing greater funding.
Page 354

5
15. There was a strong sense that when funding had been secured, it was not at the scale necessary to fully tackle the needs of the region. An asset-backed approach was needed that recognised what was distinct within the different parts of the Black Country and how this distinctiveness connected to the economic geography of the region.
Learning and Skills
16. The importance of education and skills became increasingly apparent during the scrutiny review. The review group repeatedly heard of the need for skills and training pathways to enable the communities within the Black Country to gain meaningful employment and develop a career path. This need was only strengthened by the lasting impact of COVID-19 on the local economy. The importance of upskilling people to take advantage of new and innovative technologies was highlighted.
17. The review group was alerted to the importance of public authorities collectively adopting a ‘whole life’ approach to education and skills needs. Too many young children were said to be lacking school readiness, and this was embedding at an early age the disadvantages that would impact individuals when they were seeking employment as well as the wider economic productivity capacity of the Black Country. It was important that the Black Country LEP gave greater recognition to this in its planning and strategies.
18. The education and skills offer was reported to be disconnected from the lived experience of too many residents. The Black Country was a region that had skills, but had low educational qualifications and consideration needed to be given as to how prior learning was used to bring out the competences and skills that residents had gained through their lived experience. The value of employer engagement that sought to ensure that skills obtained outside of formal qualifications were recognised during the recruitment process was highlighted.
19. The review group heard of the work being undertaken to identify the mix of skills likely to be needed by employers both now and as the implications of the UK’s withdrawal from the European Union became more evident, the engagement with businesses within the Black Country, regulations and incentives driving the behaviour and attitude of employers, the merits of qualifications compared to practical skills, the WMCA’s focus on matching the unemployed to vacancies, engagement with businesses to achieve high level skills and removing funding barriers to enable an increase in the attainment of level 3 qualifications. This was particularly important given the expected impact of Brexit to businesses in the region.
20. As a result of the COVID-19 pandemic, there was significant concern that younger people could be further marginalised due to the strong competition for employment caused by an increase in rates of unemployment. The importance of a new updated regional skills plan become apparent, along with the need to set out a new social economic landscape accompanied by an efficient supply chain for skills. This, along with the development of career pathways, was considered to provide a more joined-up regional approach.
Page 355

6
Governance and Responsibility
21. The review group considered the role and scope of the Black Country’s collaborative structures, including the Black Country LEP and Association of Black Country Authorities. It was felt there could be confusion around the role of different bodies within the Black Country, with the jigsaw of LEP, ABCA, local authorities and the WMCA making the setting of a single vision and economic strategy a challenge. In extreme cases, these bodies might all have different (even competing) objectives and solutions.
22. The review group acknowledged that the Black Country had a 30 Year Vision, but that this was published in May 2003 and there had been significant changes in the economic landscape in the 17 years since then. It was not clear that this vision was still collectively owned and reflected the current need and requirement of the Black Country region, nor was it aligned to subsequent economic strategies within each borough. The frustrations of some of the key witnesses and members of the review group about this fact was apparent.
23. The review group also noted the LEP’s focus on developing high value growth areas. The review group was keen to be reassured that all economic sectors within the Black Country were given the opportunity to grow and develop to take advantage of emerging economic sectors. The review group stressed the importance of all partners championing the needs of the broad diversity of businesses that make up the region.
Structures and Interdependencies
24. The review group received strong representations that the Black Country had a clear sense of self-identity and that many of the structural problems linked to economic growth were apparent across its four local authority areas. This spatial geography and shared complexity required close strategic alignment between its public authorities in order to tackle the problems that had been recognised. Some local authorities have also been proactive in working with other authorities outside of the Black Country on issues of mutual interest.
25. The review group considered whether more clarity was needed when there were opportunities in common and when there needed to be greater focus on the distinctiveness of each local authority area. It was also recognised that measuring success through GVA could have the effect of hiding other social and economic challenges within communities.
Recommendations
26. After considering the written and oral evidence presented to it, the review group considered that there were a number of clear and consistent themes to have emerged to justify a series of recommendations that could be considered by the WMCA Board. These recommendations reflect the broad weight of evidence received and are therefore considered to be worthy of more detailed consideration by the relevant authorities.
27. In making these recommendations, the panel would like to thank all those councillors and officers who gave their evidence in an open and collaborative spirit. Members of the review panel saw a clear willingness from all those involved to contribute positively to the scrutiny review and were encouraged by the commitment shown by all participants to improve the communities and economy of the Black Country.
Page 356

7
28. The recommendations fall under four key areas of activity:
(1) Coherence of the Funding LandscapeComplex funding streams and processes can hinder delivery of impactful projects. Future devolution agreements need to simplify funding to the region and ensure funding is available where it is needed. The importance of the speed and urgency in rectifying this could not be overstated by the review panel.
(2) Scaling-up immediate support for businesses and people whose jobs were at risk
The need to urgently review regional skills plan that provided a clear strategy for career pathways.
The WMCA needed to review and understand the updated publication from the New Policy Institute that identified key information regarding the state of ‘economic justice’ in Birmingham and the Black Country local authority areas and assess whether its policies addressed the challenges identified in the report. This updated version of the report was published on 1st February 2021 and an Executive Summary is attached as an appendix. The full report is available from the Barrow Cadbury Trust website.
The need for an employment taskforce to address the economic needs of the Black Country.
The WMCA should consider brokering a region-wide common understanding and vision for the skills, training and employment needs of the Black Country.
(3) Working towards a long-term, whole-life approachRecognising that many residents in the Black Country were born, work and then retire in the Black Country, a more joined-up whole-life approach to targeted support needs to be implemented throughout public authorities and other stakeholders in recognition of the inter-dependency between education, skills, employment and health.
(4) Co-ordination, governance and accountability across the Black Country The Black Country’s economic, social and wellbeing outcomes were
interlinked and co-dependent. It was therefore vital that decisions made by the region’s public bodies were joined up, and best practice shared widely.
Local authorities were most likely best placed to understand the needs of localities. It was important therefore that the structural architecture existed that enabled this knowledge of place to shape wider regional economic strategy. The review group were unpersuaded that this architecture currently existed in a robust enough state, and this might therefore be something that required a more in-depth scrutiny review to be undertaken during the coming year.
Page 357

8
Financial Implications
29. There are no direct financial implications immediately arising out of the recommendations contained within this report.
Legal Implications
30. There are no direct legal implications immediately arising out of the recommendations contained within this report.
Equalities Implications
31. There are no direct equality implications arising out of the recommendations contained within the report.
Inclusive Growth Implications
32. There are no direct inclusive growth implications arising out of the recommendations contained within the report.
Geographical Area of Report’s Implications
33. The report relates to the Black Country area, comprising the Constituent authority areas of Dudley, Sandwell, Walsall and Wolverhampton.
Other Implications
34. There are no further specific implications arising out of the recommendations contained within the report.
Page 358
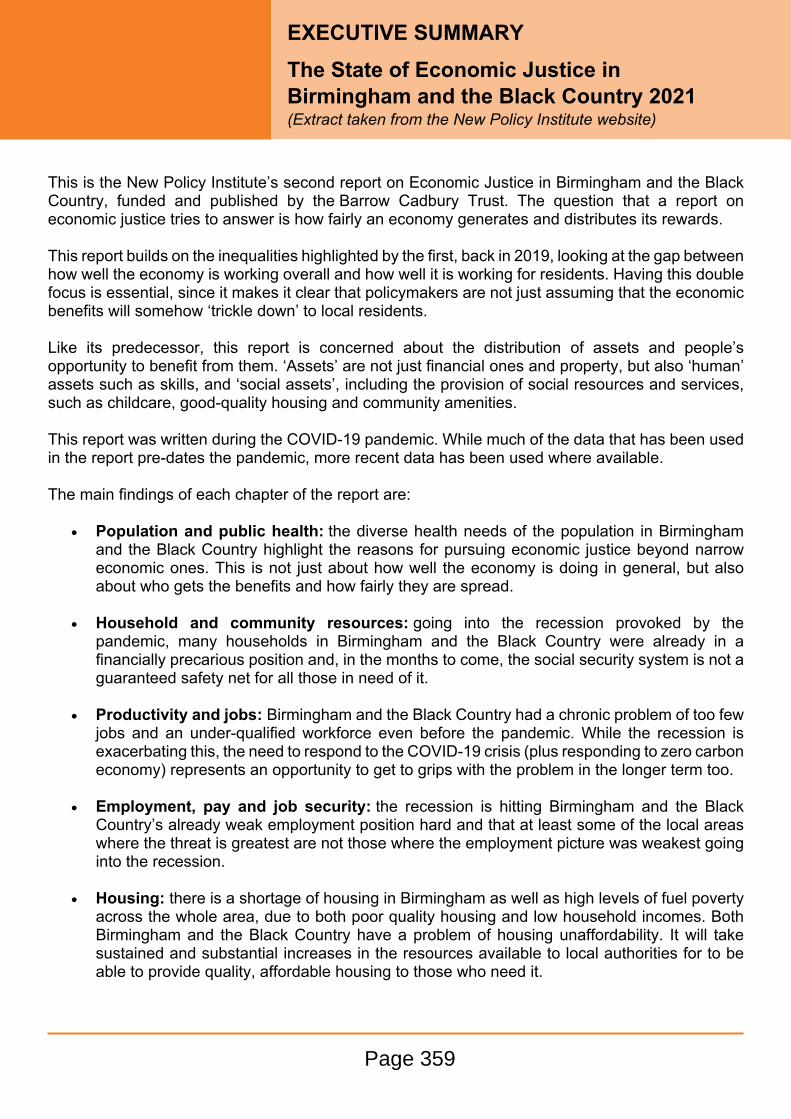
EXECUTIVE SUMMARYThe State of Economic Justice in Birmingham and the Black Country 2021(Extract taken from the New Policy Institute website)
This is the New Policy Institute’s second report on Economic Justice in Birmingham and the Black Country, funded and published by the Barrow Cadbury Trust. The question that a report on economic justice tries to answer is how fairly an economy generates and distributes its rewards.
This report builds on the inequalities highlighted by the first, back in 2019, looking at the gap between how well the economy is working overall and how well it is working for residents. Having this double focus is essential, since it makes it clear that policymakers are not just assuming that the economic benefits will somehow ‘trickle down’ to local residents.
Like its predecessor, this report is concerned about the distribution of assets and people’s opportunity to benefit from them. ‘Assets’ are not just financial ones and property, but also ‘human’ assets such as skills, and ‘social assets’, including the provision of social resources and services, such as childcare, good-quality housing and community amenities.
This report was written during the COVID-19 pandemic. While much of the data that has been used in the report pre-dates the pandemic, more recent data has been used where available.
The main findings of each chapter of the report are:
Population and public health: the diverse health needs of the population in Birmingham and the Black Country highlight the reasons for pursuing economic justice beyond narrow economic ones. This is not just about how well the economy is doing in general, but also about who gets the benefits and how fairly they are spread.
Household and community resources: going into the recession provoked by the pandemic, many households in Birmingham and the Black Country were already in a financially precarious position and, in the months to come, the social security system is not a guaranteed safety net for all those in need of it.
Productivity and jobs: Birmingham and the Black Country had a chronic problem of too few jobs and an under-qualified workforce even before the pandemic. While the recession is exacerbating this, the need to respond to the COVID-19 crisis (plus responding to zero carbon economy) represents an opportunity to get to grips with the problem in the longer term too.
Employment, pay and job security: the recession is hitting Birmingham and the Black Country’s already weak employment position hard and that at least some of the local areas where the threat is greatest are not those where the employment picture was weakest going into the recession.
Housing: there is a shortage of housing in Birmingham as well as high levels of fuel poverty across the whole area, due to both poor quality housing and low household incomes. Both Birmingham and the Black Country have a problem of housing unaffordability. It will take sustained and substantial increases in the resources available to local authorities for to be able to provide quality, affordable housing to those who need it.
Page 359

About this reportThis report was funded by the Barrow Cadbury Trust and written by the New Policy Institute. The facts presented and views expressed in this report are those of the authors and not necessarily those of the Barrow Cadbury Trust.
Levels of deprivation across Birmingham and the Black Country are the highest in England for an area of this size. Over recent years, this disadvantage has, at least in relative terms, worsened, and it is not spread evenly, with some populations faring much worse than others. The deep and chronic disadvantage described in this report can, however, be alleviated if those with their hands on the economic levers – national, regional and local authorities, local enterprise partnerships and large employers – explicitly address the question of how economic benefits are distributed.
The full report is available from the Barrow Cadbury Trust website.
Page 360

Overview & Scrutiny Committee
Date 8 March 2021
Report title Effectiveness of Transport Delivery Committee in Overseeing the Delivery of WMCA Transport Policies - Update on Recommendations
Overview & Scrutiny Committee Lead
Councillor Cathy Bayton, Councillor Ahmad Bostan and Councillor Angus Lees
AccountableEmployee
Tim Martin, Head of Governance, Clerk andMonitoring Officeremail: [email protected]: (0121) 214 7435
Recommendation(s) for action or decision:
The Overview & Scrutiny Committee is recommended to:
(1) Note the progress on the implementations of the recommendations agreed by the WMCA Board on 17 January 2020.
Page 361
Agenda Item 10

1. Purpose
1.1 The purpose of the report is to inform the committee of the progress made with the implementation of the recommendations arising from the Transport Governance Scrutiny Review undertaken last year.
2. Background
2.1 During 2019/20, the Overview & Scrutiny Committee undertook a scrutiny review on theeffectiveness of transport governance within the West Midlands Combined Authority. At its meeting on 17 January 2020, the WMCA Board considered the findings of the scrutiny review and subsequently approved the recommendations made in the scrutiny review’s final report.
2.2 The scrutiny review reached four key conclusions, namely:
Recommendation 1 - Strengthen Transport Delivery Committee Recommendation 2 - Establish a Strategic Transport Board Recommendation 3 - Establish a Transport Scrutiny Sub-Committee Recommendation 4 - Improve governance oversight
2.3 The review group was chaired by Councillor Cathy Bayton, Vice-Chair of the Overview & Scrutiny Committee and also comprised Councillor Ahmad Boston and Councillor Angus Lees. The review was undertaken during November 2019 and was supported by William Britton (Transport Strategy Researcher), Dan Essex (Governance Services Manager) and Lyndsey Roberts (Scrutiny Officer).
3. Progress Update
3.1 Recommendation 1: Strengthen Transport Delivery Committee
3.1.1 The scrutiny review panel recognised the value of the Transport Delivery Committee in many areas of the work it undertook, but considered that it could become more effective following a review of its terms of reference and a more structured approach to developing its workplan for the year. There were also a number of recommendations supporting greater visibility to the work of its Lead Member Reference Groups and the relation between the Chair of the committee and the Portfolio Lead for Transport.
3.1.2 Progress in implementing these recommendations has not progressed at the pace initially anticipated. The outbreak of the COVID-19 pandemic at the start of 2020 and the subsequent impact that the three national lockdowns had on the public transport network has meant that the focus of the committee, officers from Transport for West Midlands and the wider WMCA has rightly been on managing this, particularly in respect of scaling the transport network down and then back up in response to the changing travel trends throughout the year. Transport Delivery Committee have of course been involved in monitoring these issues as well.
3.1.2 In the recent Q&A with the Chair of Transport Delivery Committee, members of Transport Scrutiny Sub-Committee reiterated the need for this strengthening of the committee and the work will now be undertaken over the coming months ready for approval in the new mayoral term.
Page 362
3.2 Recommendation 2: Establish a Strategic Transport Board
3.2.1 In spring 2020, the WMCA established a Strategic Transport Board that helped to facilitate closer engagement between the Portfolio Lead for Transport and cabinet members for transport within its constituent authorities. Whilst the setting of transport policy remained the responsibility of the WMCA Board, the Strategic Transport Board now provides a structured forum to discuss regional transport matters and share issues and ideas and provided the mechanism to resolve problems earlier within the lifecycle of transport policy and strategy development.
3.2.2 The Strategic Transport Board is supported by a number of advisors, including the Managing Director for Transport West Midlands, Policy, Strategy & Innovation Director for Transport for West Midlands and team, together with senior transport officers from each constituent council. The board meets on a monthly basis and has discussed a number of strategic matters including:
E-scooter trials across the region Emergency Active Travel Fund
WM2041 - Developing the First Five Year Carbon Plan Review of the West Midlands Local Transport Plan and approaches to community
engagement to support strategy development Pot-holes and Highways Challenge funding Moving Traffic Offences Supported travel policies West Midlands Ultra Low Emission vehicles
3.3 Recommendation 3: Establish a Transport Scrutiny Sub-Committee
3.3.1 The WMCA needed rigorous scrutiny of its transport policy making and delivery and in the autumn 2020 the Overview & Scrutiny Committee established its Transport Scrutiny Sub-Committee, was set up to scrutinise transport policy as determined by the WMCA Board and transport delivery that was the responsibility of Transport Delivery Committee.
3.3.2 The sub-committee, which is chaired by Councillor Cathy Bayton and its membership largely drawn from the transport scrutiny committees within constituent authorities, meets on a bi-monthly basis and has scrutinised a number of transport related matters this year including:
Student Transport Arrangements (‘return to school’) Supported Travel Policies Review Update HS2 Growth Strategy Refresh Bus Byelaws Development of the Local Transport Plan Emergency Active Travel Fund Regional Road Safety Commonwealth Games Transport Plan
Page 363

3.3.3 In October 2020, the sub-committee questioned Councillor Ian Ward, Portfolio Lead for Transport on transport policy matters. A number of recommendations were considered by the Overview & Scrutiny Committee and shared with the WMCA Board on 13 November. These recommendations have led to proposals for a review of alternative ticketing policies, which will be undertaken during 2021/22.
3.3.4 A further Q&A session was held with Councillor Kath Hartley, Chair of the Transport Delivery Committee, on transport delivery matters last month.
3.3.5 For the forthcoming year, the sub-committee would like to work closely with the Strategic Transport Board to develop its annual work programme in terms of pre- development and pre-decision scrutiny matters.
3.4 Recommendation 4: Governance Oversight
3.4.1 The scrutiny review concluded that significant aspects of the transport governance arrangements had been inherited – and remained unchanged – from the West Midlands Integrated Transport Authority/Centro, organisations that were subsumed into the WMCA when it was established in 2016. Included within these arrangements were the payment of basic and special responsibility allowances to members of Transport Delivery Committee, an arrangement that was not replicated within any other WMCA board/committee. Given that these allowances were last reviewed more than five years ago, and by a predecessor organisation, it was recommended that the WMCA Board should carry out a periodic review so that it may confidently adopt a scheme of allowances that appropriately recognise the requirements of membership of the WMCA Board and its committees.
3.4.2 It is proposed that a review of allowances is carried out in the new mayoral term.
4. Financial Implications
4.1 There are no direct financial implications arising out of the recommendations contained within this report.
5. Legal Implications
5.1 There are no direct legal implications arising out of the recommendations contained within this report.
6. Equalities Implications
6.1 There are no direct equality implications arising out of the recommendations contained within this report.
7. Inclusive Growth Implications
7.1 There are no direct inclusive growth implications arising out of the recommendations contained within this report.
8. Geographical Area of Report’s Implications
8.1 The WMCA exercises transport powers overwhelmingly in respect of the area covered by its constituent authority members.
Page 364

9. Other Implications
9.1 There are no further specific implications arising out of the recommendations contained within the report.
Page 365

This page is intentionally left blank

Overview & Scrutiny Committee
Date 8 March 2021
Report title WMCA Scrutiny Review on the Effectiveness of the WMCA’s Governance Structures in Delivering the Policy Objectives of the WMCA - Update on Recommendations
Overview & Scrutiny Committee Leads
Councillor Lisa Trickett (Chair), Councillor Ahmad Bostan, Councillor Peter Fowler, Councillor Stephen Simkins and Aisha Masood
AccountableEmployee
Tim Martin, Head of Governance, Clerk andMonitoring Officeremail: [email protected]: (0121) 214 7435
Recommendation(s) for action or decision:
The Overview & Scrutiny Committee is recommended to:
(1) Note and comment on the current position and progress made on the observations and conclusions arising from the Governance Review presented to the Strategic Leadership Team in October 2020.
Page 367
Agenda Item 11

1. Purpose
1.1 The purpose of the report is to inform the committee of the progress made with the observations and conclusions arising from the Governance Review undertaken last year.
2. Background
2.1 During 2019/20, the Overview & Scrutiny Committee undertook a high-level review assessing the current governance arrangements of the West Midlands Combined Authority and whether they were appropriate to deliver its aims and policy objectives, given the growth of its remit and influence in recent years. The WMCA’s Strategic Leadership Team considered the findings of the scrutiny review at its meeting on 7 October 2020, which Councillor Lisa Trickett attended to present the report and answer any questions.
2.2 The review group was chaired by Councillor Lisa Trickett and comprised of Councillor Ahmad Bostan, Councillor Peter Fowler, Councillor Stephen Simkins, Councillor Simon Peaple (former member of the Overview & Scrutiny Committee) and Aisha Masood (representing the Young Combined Authority). The review was undertaken during February 2020 and was supported by supported by Dan Essex (Governance Services Manager) and Lyndsey Roberts (Scrutiny Officer)
3. Emerging Themes and Considerations
3.1 The issues and considerations undertaken by the review group, given the broad remit covered by ‘governance’, meant that rather than narrow and specific recommendations for implementation, members wished to provoke a more thoughtful debate amongst the Mayor, Constituent Authority Leaders and the Strategic Leadership Team as to how that governance might better evolve in the coming years. At the time the panel was gathering evidence, the expectation was that a new four-year Mayoral would commence following elections in May 2020, and that this could provide a window whereby these matters were able to be debated openly and thoughtfully, and supporting an evolution of the WMCA’s governance arrangements. Whilst the deferral of Mayoral elections until May this year, and the wider considerations prompted by the continuing COVID-19 pandemic meant that this window of reflection did not happen, the conclusions reached during the scrutiny review still hold true and deserve consideration.
4. Observations and Findings
4.1 The conclusions of the scrutiny review were grouped into a number of thematic strands:
General Governance Observations Cultures and Behaviours Political Leadership Place Shaping Investment and Funding Strategies Outcome-Based Reporting Audit Oversight Political Challenge and Oversight within the WMCA Consultation & Engagement Young Combined Authority
Page 368

5. Progress Update
5.1 Following the presentation of the scrutiny panel’s findings to the Strategic Leadership Team, it was acknowledged that the many of the observations were matters that required consideration and reflection at a political, rather than operational, level. This would involve discussions between the Mayor and the leaders of the WMCA’s constituent authorities.
5.2 The wider response required from the WMCA and local authorities to the Covid pandemic during the last year has inevitably meant that the capacity of the Mayor and council leaders to give time to reflect on these matters has understandably been limited. The postponement of the Mayoral and local elections to May this year has also meant that the scope for introducing wider political reform during the year was limited.
5.3 However, given the importance of the issues raised by the scrutiny panel, it would now seem timely to re-start these considerations immediately after the local elections when the Mayor would be beginning a three-year mandate and the political complexion of the wider region would be clearer. To support this, the Head of Governance was tasked by the Strategic Leadership Team to facilitate this engagement with the Mayor and Leaders to ensure that the important work undertaken by the scrutiny panel fed into wider governance considerations. It is expected that this engagement would begin in May immediately following the local elections. Updates will be provided to this committee as they progressed through 2021/22.
6. Financial Implications
6.1 There are no direct financial implications arising out of the recommendations contained within this report.
7. Legal Implications
7.1 There are no direct legal implications arising out of the recommendations contained within this report.
8. Equalities Implications
8.1 There are no direct equality implications arising out of the recommendations contained within this report.
9. Inclusive Growth Implications
9.1 There are no direct inclusive growth implications arising out of the recommendations contained within this report.
10. Geographical Area of Report’s Implications
10.1 The WMCA exercises transport powers overwhelmingly in respect of the area covered by its constituent authority members.
11. Other Implications
11.1 There are no further specific implications arising out of the recommendations contained within the report.
Page 369

This page is intentionally left blank

Page 1 of 5
Transport Scrutiny Sub-Committee
Monday 22 February 2021 at 10.30 am
Minutes
PresentCouncillor Cathy Bayton (Chair) Association of Black Country AuthoritiesCouncillor Philip Bateman MBE City of Wolverhampton CouncilCouncillor Liz Clements Birmingham City CouncilCouncillor Ken Hawkins Solihull Metropolitan Borough CouncilCouncillor Gurmeet Singh Sohal Walsall Metropolitan Borough CouncilCouncillor Jackie Taylor Sandwell Metropolitan Borough Council
In AttendancePete Bond Transport for West MidlandsDan Essex West Midlands Combined AuthorityDavid Harris Transport for West MidlandsCouncillor Kath Hartley Chair of Transport Delivery CommitteeKashmire Hawker Young Combined Authority Graham Jones Transport for West MidlandsLyndsey Roberts West Midlands Combined AuthorityAnne Shaw Transport for West Midlands
ItemNo.
Title
23. Inquorate MeetingThe meeting was inquorate and therefore decisions taken at the meeting would be submitted to the Overview & Scrutiny Committee on 8 March 2021 for formal approval.
24. Declarations of InterestCouncillor Philip Bateman declared non-prejudicial interests in respect of his involvement in the Canal & River Trust and the receipt of a pension from West Midlands Travel, Councillor Jackie Taylor declared a non-prejudicial interest in respect of her involvement in the board of Midland Connect, and Kashmire Hawker declared a non-prejudicial interest in respect of his involvement in the organising committee for Birmingham 2022.
25. Minutes - 30 November 2020The minutes of the meeting held on the 19 October 2020 were agreed as a correct record.
Page 371
Agenda Item 12

Page 2 of 5
26. Q&A with Chair of Transport Delivery CommitteeThe Chair welcomed Councillor Kath Hartley, Chair of Transport Delivery Committee, members of the sub-committee and Kashmire Hawker from the Young Combined Authority to the question time.
Councillor Kath Hartley updated the sub-committee on Transport Delivery Committee’s roles and responsibilities, the changes to the committee since its establishment in 2012, and the outstanding need to review its terms of reference and to provide a role profile to its members.
Councillor Jackie Taylor questioned Councillor Kath Hartley on both her and the committee members’ relationship with elected members within Constituent Authorities, the Mayor and the engagement with district cabinet members for transport. Councillor Kath Hartley noted that Transport Delivery Committee members had previously highlighted gaps in communication with colleagues from Constituent Authorities and highlighted the need for these relationships to be strengthened. She also considered that the relationship between Transport Delivery Committee members and cabinet members for transport should be included within the proposed role profiles.
Kashmire Hawker questioned Councillor Kath Hartley on how the Transport Delivery Committee engaged with other WMCA policies, such as WM2041 and the carbon reduction targets it contained. He also asked to what level of engagement she had with the Mayor and the Portfolio Lead for Transport. Councillor Kath Hartley felt that the co-ordination between the WMCA’s boards could be improved upon, and hoped that the work undertaken on the governance review would help achieve this. With regard to her relationship with the Portfolio Lead for Transport, she conceded that this largely operated at an informal level and there was little direct engagement with the Mayor on transport matters.
Councillor Liz Clements thanked Councillor Kath Hartley for the commitment she demonstrated to the role of Chair of Transport Delivery Committee and for ensuring views of both local members and residents were heard in key transport decisions. However, Councillor Liz Clements queried the work undertaken by the Lead Member Reference Groups and how the findings and recommendations of these groups could be given greater visibility. Councillor Kath Hartley reported that the member reference groups were implemented in 2017 and felt that a change to the terms of reference could reflect better engagement from those reference groups.
Councillor Philip Bateman sought to understand better the frustrations she experienced as Chair. Councillor Kath Hartley indicated the need for the committee to have a clearly understood terms of reference, as well as defined role descriptions for the Chair, Vice-Chair and members of the committee. She considered that the committee had much to offer as being the ‘voice of passengers’ in as part of the WMCA’s decision making processes.
Page 372

Page 3 of 5
Councillor Jackie Taylor questioned how the committee ensured equality issues were at the core of its decisions. Councillor Kath Hartley informed the sub-committee that an equality impact assessment was always completed and felt that equality was a thread that ran throughout the work of the Transport Delivery Committee, although noted that she hoped there would be a better gender balance amongst the committee’s membership in future years. Councillor Jackie Taylor also enquired about the role of the committee in terms of the recent Gigafactory proposals that were announced for Coventry and how they would improve connectivity to this employment site and other parts of the region. The Director of Integrated Transport Services reported that work had begun to look into this important issue, also noting that a review of the bus network would be undertaken post COVID-19 and how the pandemic had impacted the network.
The Chair questioned the performance management role the committee undertook in respect of Transport for West Midlands and how its workplan for the year was set. Councillor Kath Hartley explained the work planning process the committee undertook, including a metro operations report focusing on passengers at every other meeting.
Recommended to the Overview & Scrutiny Committee that:
(1) The terms of reference of the Transport Delivery Committee be reviewed and updated to reflect the changed role of the committee since the establishment of the WMCA and clearly setting out the specific role and responsibilities the WMCA Board wished the committee to undertake, to include a responsibility for a performance monitoring role of Transport for West Midlands.
(2) Transport Delivery Committee member role profiles be developed as a priority to give clarity as to what was expected of those councillors appointed to the committee.
(3) The committee's annual work planning process be reviewed to more closely align the responsibilities of the committee with the transport-related deliverables contained within the WMCA's Annual Plan and other strategic policies.
(4) The role and purpose of the committee's Lead Member Reference Groups be reviewed to improve their accountability and transparency, including to ensure that all members of the committee were fully involved in formal decision making and the discussions and decisions made at these meetings being reported publicly to the Transport Delivery Committee.
(5) The relationship between the Chair of the committee, the Mayor and the Portfolio Lead for Transport be strengthened and formalised so as to ensure proper engagement and collaboration between transport policy and delivery.
Page 373

Page 4 of 5
27. Commonwealth Games - Transport PlanThe committee received a presentation from the Director of Network Resilience on the Commonwealth Games Transport Plan. Information shared with the sub-committee related to Transport for West Midlands’ role in the Commonwealth Games transport planning and the commitments made by both the WMCA and Transport for West Midlands in terms of transport provisions for the games.
Following Councillor Jackie Taylor’s query on ensuring that there were appropriate transport facilities in place, the Director of Network Resilience confirmed that work was being undertaken to ensure that there was a games route network in place to deliver individuals to all spectator locations. Councillor Philip Bateman queried the planning of security arrangements of the transport network for the Commonwealth Games. The Director of Network Resilience informed the sub-committee that responsibility sat with the Chief Constable of West Midlands Police, but confirmed that additional resources would be made available during the course of the games and dedicated funding had been identified for this.
Following Kashmire Hawker’s questions on maintaining traffic flows ahead of, during and after the games, the Director of Network Resilience reported that following the establishment of the Regional Transport Co-ordination Centre this would be used to provide a multi-modal, multi-agency oversight of the performance on the transport network and that work had also been undertaken to improve CCTV coverage across the network. The Commonwealth Games Technical Director indicated that as part of the preparatory work to ensure the integrity of the transport network, data regarding traffic patterns and locations from where spectators were travelling from would be gathered.
Councillor Liz Clements queried as to what contingency planning had been discussed in relation to any delays to planning and/or the delay of games themselves, as well as the consideration of social distancing arising from COVID-19 travel restrictions. The Director of Network Resilience commented that transport planning was continuing on the basis of the games running to full capacity, whilst working closely with partner agencies and the Government in respect of any COVID-19 restrictions that might be in force at the time.
The Chair noted Dudley’s comparative lack of transport connectivity and queried as to how Transport for West Midlands was working with local tourist attractions and hospitality to ensure the maximum knock-on commercial impact for the region. The Director of Network Resilience reported that the Organising Committee continued to work closely with local authorities to ensure the region’s key tourist attractions were showcased and that a trade and tourism programme was being established to help promote these attractions.
Page 374

Page 5 of 5
Recommended to the Overview & Scrutiny Committee that:
(1) The importance of capitalising on the whole-region offer of the Commonwealth Games be supported, along with the need for strong working relationships with all delivery partners, specifically in respect of the tourism offer of the region and Transport for West Midlands’ ability to help enable towns who were not hosting sporting events to be able to capitalise on the economic benefits hosting the Commonwealth Games provided.
(2) The sub-committee seek to further understand the transport-related benefits communities across the region would derive from the hosting of the Commonwealth Games at a future meeting, particularly how the legacy effects of the intention for the games to be environmentally sustainable could be used to support the region’s wide carbon reduction strategies in subsequent years.
(3) The firm commitment that the Commonwealth Games would commence as planned in July 2022 be welcomed, but the need for a strong contingency plan for circumstances where this turned out not to be possible (eg. a continuation of COVID-19 restrictions) be supported.
(4) The sub-committee to be provided with a copy of the Commonwealth Games Legacy Plan when it was published in March.
28. Forward PlanThe sub-committee noted its workplan of items of potential business for consideration at future meetings, along with items being considered at future meetings of the WMCA Board.
The meeting ended at 12.30 pm.
Page 375

This page is intentionally left blank

1
WEST MIDLANDS COMBINED AUTHORITYFORWARD PLAN: MARCH 2021 - SEPTEMBER 2021
Title of Report Description of Purpose Date of MeetingKey
Decision (Y/N)
Lead Portfolio Holder Lead Officer Confidential Category
Financial Monitoring Report 2020/21
To consider the latest financial position.
19 March 2021 No Cllr Bob Sleigh Linda Horne No Finance
Black Country Scrutiny Review - Summary of Findings
To consider a report of Overview & Scrutiny Committee.
19 March 2021 No n/a Tim Martin No Overview & Scrutiny
Economic Impact of COVID-19
To consider the economic impact of the pandemic.
19 March 2021 No Cllr Ian Brookfield
Julia Goldsworthy No Economy & Innovation
WM2041: Five Year Plan
To approve a five year plan relating to the WM2041 carbon reduction targets.
19 March 2041 Yes Cllr Ian Courts Ed Cox No Environment, Energy & HS2
Page 377
Agenda Item
13

2
Title of Report Description of Purpose Date of MeetingKey
Decision (Y/N)
Lead Portfolio Holder Lead Officer Confidential Category
Adoption of Revised Code of Conduct
To consider the adoption of a revised code following recommendations from the LGA.
19 March 2021 Yes n/a Tim Martin No Governance
Coventry - Electric Bus City
To consider a report on proposals.
19 March 2021 Yes Cllr Ian Ward Laura Shoaf No Transport
Commonwealth Games Transport Plan
To approve a draft plan for consultation purposes.
11 June 2021 Yes Cllr Ian Ward Laura Shoaf No Transport
Annual Plan 2021/22 Approval
To approve the 2021/22 WMCA Annual Plan.
23 July 2021 Yes n/a Deborah Cadman No Governance
Page 378

3
Title of Report Description of Purpose Date of MeetingKey
Decision (Y/N)
Lead Portfolio Holder Lead Officer Confidential Category
Local Transport Plan Consultation Approval
To approve the draft local transport plan proposals for consultation.
17 September 2021
Yes Cllr Ian Ward Laura Shoaf No Transport
Page 379

This page is intentionally left blank