(Public Pack)Agenda Document for Cabinet, 13/12/2016 10:00
144
eastsussex.gov.uk CABINET TUESDAY, 13 DECEMBER 2016 10.00 AM COUNCIL CHAMBER, COUNTY HALL, LEWES MEMBERSHIP - Councillor Keith Glazier (Chair) Councillors Nick Bennett, Bill Bentley, Chris Dowling, David Elkin (Vice Chair), Carl Maynard, Rupert Simmons and Sylvia Tidy A G E N D A 1 Minutes of the meeting held on 15 November 2016 (Pages 3 - 6) 2 Apologies for absence 3 Disclosures of interests Disclosures by all members present of personal interests in matters on the agenda, the nature of any interest and whether the member regards the interest as prejudicial under the terms of the Code of Conduct. 4 Urgent items Notification of items which the Chair considers to be urgent and proposes to take at the appropriate part of the agenda. Any members who wish to raise urgent items are asked, wherever possible, to notify the Chair before the start of the meeting. In so doing, they must state the special circumstances which they consider justify the matter being considered urgent. 5 Council Monitoring 2016/17: Quarter 2 (Pages 7 - 42) Report by Chief Executive 6 Shadow Sub National Transport Body for the South East (Pages 43 - 46) Report by Director of Communities, Economy and Transport 7 Expansion of Orbis partnership with reference to Brighton & Hove City Council (Pages 47 - 60) Report by Chief Operating Officer 8 Annual Progress Report for Looked After Children's Services (Pages 61 - 134) Report by Director of Children’s Services 9 Annual Audit Letter 2015/16 (Pages 135 - 144) Report by Chief Operating Officer 10 Any other items considered urgent by the Chair 11 To agree which items are to be reported to the County Council PHILIP BAKER Assistant Chief Executive County Hall, St Anne’s Crescent LEWES BN7 1UE 5 December 2016
-
Upload
khangminh22 -
Category
Documents
-
view
4 -
download
0
Transcript of (Public Pack)Agenda Document for Cabinet, 13/12/2016 10:00

eastsussex.gov.uk
CABINET TUESDAY, 13 DECEMBER 2016 10.00 AM COUNCIL CHAMBER, COUNTY HALL, LEWES MEMBERSHIP - Councillor Keith Glazier (Chair)
Councillors Nick Bennett, Bill Bentley, Chris Dowling, David Elkin (Vice Chair), Carl Maynard, Rupert Simmons and Sylvia Tidy
A G E N D A 1 Minutes of the meeting held on 15 November 2016 (Pages 3 - 6)
2 Apologies for absence
3 Disclosures of interests
Disclosures by all members present of personal interests in matters on the agenda, the nature of any interest and whether the member regards the interest as prejudicial under the terms of the Code of Conduct.
4 Urgent items
Notification of items which the Chair considers to be urgent and proposes to take at the appropriate part of the agenda. Any members who wish to raise urgent items are asked, wherever possible, to notify the Chair before the start of the meeting. In so doing, they must state the special circumstances which they consider justify the matter being considered urgent.
5 Council Monitoring 2016/17: Quarter 2 (Pages 7 - 42)
Report by Chief Executive
6 Shadow Sub National Transport Body for the South East (Pages 43 - 46) Report by Director of Communities, Economy and Transport
7 Expansion of Orbis partnership with reference to Brighton & Hove City Council (Pages 47 - 60) Report by Chief Operating Officer
8 Annual Progress Report for Looked After Children's Services (Pages 61 - 134) Report by Director of Children’s Services
9 Annual Audit Letter 2015/16 (Pages 135 - 144) Report by Chief Operating Officer
10 Any other items considered urgent by the Chair
11 To agree which items are to be reported to the County Council
PHILIP BAKER Assistant Chief Executive County Hall, St Anne’s Crescent LEWES BN7 1UE 5 December 2016

Contact Andy Cottell, 01273 481955, Email: [email protected] NOTE: As part of the County Council’s drive to increase accessibility to its public meetings, this meeting will be broadcast live on its website and the record archived for future viewing. The broadcast/record is accessible at www.eastsussex.gov.uk/yourcouncil/webcasts/default.htm

CABINET MINUTES of a meeting of the Cabinet held on 15 November 2016 at Council Chamber, County Hall, Lewes
PRESENT Councillors Keith Glazier (Chair) Councillors Nick Bennett, Bill Bentley, Chris Dowling, David Elkin (Vice
Chair), Carl Maynard, Rupert Simmons and Sylvia Tidy
Members spoke on the items indicated
Councillor Barnes – items 5 and 6 (minutes 40 and 41) Councillor Blanch – items 5 and 7 (minutes 40 and 42) Councillor Daniel – item 5 (minute 40) Councillor Davies – item 6 (minute 41) Councillor Field – items 5 and 6 (minutes 40 and 41) Councillor Shuttleworth – item 5 (minute 40) Councillor Stogdon – items 5, 6 and 7 (minutes 40, 41 and 42) Councillor Taylor – item 6 (minute 41) Councillor Tutt – item 6 (minute 41) Councillor Ungar – item 5 (minute 40) Councillor Webb – items 5 and 7 (minutes 40 and 42)
38 MINUTES OF THE MEETINGS HELD ON 11 AND 18 OCTOBER 2016 38.1 The minutes of the meetings of the Cabinet held on 11 October and 18 October 2016 were agreed as correct records 39 REPORTS 39.1 Copies of the reports referred to below are included in the minute book. 40 EAST SUSSEX BETTER TOGETHER ACCOUNTABLE CARE MODEL 40.1 The Cabinet considered a report by the Director of Adult Social Care and Health 40.2 It was RESOLVED to:
1) agree to continue to progress work to develop a local fully integrated Accountable Care Model across the East Sussex Better Together footprint, as set out in the report, involving a transitional year in 2017/18;
2) agree to receive a further report to Cabinet in July 2017 setting out a business case for the future organisational arrangements to implement a full Accountable Care Model in 2018/19;
3) agree to a transition year of Accountable Care through forming a commissioner provider alliance to manage collectively, with East Sussex Better Together Commissioning Partners, the health and social care system in 2017/18; and
4) to delegate authority to the Chief Executive, in consultation with the Leader of the Council, to take any action considered appropriate to give effect to, or in consequence of the above resolutions, including (but not limited to) determining the services included, agreeing and entering into an agreement which will govern the alliance and pooled budget arrangements with the East Sussex Better Together partners
Page 3
Agenda Item 1

Reason 40.3 As outlined through the Council’s Reconciling Policy, Performance and Resources process it is predicted if nothing changes between current and projected demand and available health and social care budgets the anticipated funding gap will be over £200million by 2020/21. We have made strong progress already through our East Sussex Better Together (ESBT) programme to integrate services and redesign care pathways in line with best practice, however, we also need to transform the way services are organised and provided to bridge the financial gap, which requires full integration to achieve a health and social care economy that is sustainable in the long-term. 40.4 Taking account of learning from elsewhere, and after local deliberation, moving to a fully integrated model of Accountable Care offers the best opportunity to achieve the full benefits of an integrated system. It is equally the case that formal integration on this scale would represent significant risks to all the organisations involved in our health and care system. A transitional year of Accountable Care, under an alliance arrangement, would allow for the collaborative learning and evaluation to take place between the ESBT programme partners and other stakeholders, to further develop the evidence base locally for increased levels of formal integration and designing the appropriate contractual and funding arrangements to suit local preferences. Over the medium term there will also be a need to have dialogue with national Government in order to achieve our aims and objectives. 40.5 Accountable Care models based on a whole population capitated budget and longer outcomes based contracts are an opportunity to transform commissioning and service provision. Significant amounts of engagement have taken place with local decision-makers and stakeholders to both share the rationale for moving to an Accountable Care Model and the potential options. Consensus has been reached that a transitional year is the most effective way to further develop the evidence base, allowing collaborative learning to take place across the constituent parts of the local health and care system in keeping with the local circumstances of strong partnership working. 40.6 The Cabinet has agreed that authority is delegated to the Chief Executive, in consultation with the Leader of the Council, to take the necessary actions to continue work towards developing a local Accountable Care Model and to implement a commissioner provider alliance for 2017/18. This will include agreeing the services included, and entering into the necessary contractual arrangements, such as those related to pooled and aligned budgets, and an agreement which will govern the alliance. 41 EAST SUSSEX BROADBAND: NEXT STEPS 41.1 The Cabinet considered a report by the Director of Communities, Economy and Transport. 41.2 It was RESOLVED to: 1) note the progress to date on the rollout of superfast broadband in East Sussex; 2) approve the proposals for a third phase of procurement for broadband infrastructure and related services; and 3) agree to delegate to the Director of Communities, Economy and Transport authority to continue with necessary action to give effect to this
Page 4

Reason 41.3 East Sussex is now in a position where 95-96% superfast coverage is predicted by the end of 2017 (from a baseline in 2012 where only 3% of premises had superfast coverage). The e-Sussex project has been successful and there is now an opportunity to pursue as close to 100% coverage as possible, with no further capital funding being required from the Authority. The Cabinet has therefore agreed proposals for a third phase of procurement for broadband infrastructure and related services 42 TREASURY MANAGEMENT STEWARDSHIP REPORT 2015/16 AND MID YEAR REPORT 2016/17 42.1 The Cabinet considered a report by the Chief Operating Officer 42.2 It was RESOLVED to note the Treasury Management performance in 2015/16 and the mid year review for the first half of 2016/17 Reason 42.3 The report fulfils the requirement to submit an annual/half yearly report in the form prescribed in the Treasury Management Code of Practice. Short term lending throughout the year saw returns increase steadily from 0.66% to 0.73%. This reflects the objective to ensure so far as possible in the financial climate, a prudent approach with security and liquidity as the main criteria before yield. Exposure to future risk continues to be minimised through proactive and constant review of the treasury management policy. The emphasis must continue to be able to pre-empt/react quickly if market conditions worsen. 43 ITEMS TO BE REPORTED TO THE COUNTY COUNCIL 43.1 The Cabinet agreed that no items should be reported to the County Council
Page 5

This page is intentionally left blank

Report to: Cabinet
Date: 13 December 2016
Report by: Chief Executive
Title: Council Monitoring Report – quarter 2 2016/17
Purpose: To report Council Plan and Finance monitoring for quarter 2 2016/17
RECOMMENDATIONS
Cabinet is recommended to:
1) note the latest monitoring position for the Council; and2) approve the amendments to the performance measures and targets set out in paragraph 2.1
1. Introduction
1.1 This report sets out the Councilôs position and year-end projections for the Council Plantargets, Revenue Budget, Capital Programme, Savings Plan, together with Risks for quarter 2(July ï September) 2016.
1.2 Broad progress against the Councilôs four strategic priority outcomes is summarised belowand an overview of finance and performance data is provided in the Corporate Summary atAppendix 1. Strategic risks are reported at Appendix 7.
2. Overview of 2016/17 Council Plan
2.1 More detail of progress against each of our priority outcomes for 2016/17 is set out inparagraph 3 below. Of the 67 Council Plan targets, 48 (72%) are rated green, 14 (21%) arerated amber, 2 (3%) are rated red, and 1 (1%) is TBC awaiting outturns. 2 measures (3%) areproposed for amendment to reflect the latest position:
Appendix 2 (see ref i) ï óNumber of carers known to Adult Social Careô: we are unable toreport on this target it is therefore proposed to amend measure to óNumber of carerssupported through short-term crisis interventionô. New 2016/17 target of ó675ô proposed toreplace ó>7,626ô target relating to the previous measure.
Appendix 5 (see ref iii) ï óNumber of new apprenticeships with the County Council (ESCCand schools)ô: due to the introduction of the Apprenticeship Levy in 2017 we are proposingto amend the target for this year. New 2016/17 target ó46ô proposed to replace ó56ô.
2.2 At quarter 2, the gross projected year-end overspend within service departments is Ã8.3m(Ã12.7m at quarter 1). The main areas of overspend are:-
Ã6.1m in Adult Social Care (Ã8.7m at quarter 1), mainly the result of ongoing pressures onIndependent Sector Care. In 2015/16, the Adult Social Care overspend was mitigated bythe deployment of the Better Care Fund contingency. The position continues to bemonitored and is included within the development of the East Sussex Better TogetherStrategic Investment Plan and ongoing discussions with Clinical Commissioning Groups.
A Ã2.8m overspend in Childrenôs Services (Ã4.0m at quarter 1). This is within ISEND,Looked after Children, and Home to School Transport, and is the result of demand ledpressures (detail is provided in Appendix 4). Childrenôs Services has carried out a reviewof all costs across the department, including: reviewing recruitment activity and holdingvacancies open for longer; a review of staff on non-permanent contracts and agencyworkers; and bringing forward savings from later years into 2016/17. Having alsoscrutinised ISEND pressure areas the Schools Forum has agreed the use of Ã1.9mSchools DSG Reserve. Childrenôs Services are working to improve forecasting models inthis area, including Home to School Transport costs (the latter with CET colleagues).
Page 7
Agenda Item 5

2.3 There are budget pressures across all departments, at the moment within Communities,Economy and Transport, Business Services and Governance these are being successfullycontained and there is nothing of significance to report.
2.4 Within centrally held budgets there is a projected reduction in income for the Councilôsshare of the East Sussex Business Rates Pool and the Business Rates Cap Compensationreceived from the Department for Communities and Local Government totalling Ã0.2m. TheCouncilôs share of the pool reflects the quarter 2 projections showing a reduction, mainly due toa significant increase in appeal provision by all billing authorities in East Sussex.
2.5 Following receipt of updated figures reflecting schools converting to academy status, thereis also a pressure of Ã0.2m for Education Services Grant (ESG). Further conversions up toMarch 2017 would add to this pressure, but it should not be material. The overall overspend oncentrally held budgets is therefore currently forecast at Ã0.4m in 2016/17.
2.6 Work is ongoing within Services to reduce or mitigate the overall overspend. The generalcontingency provision of Ã3.4m is available which would, on current projections, reduce the netoverspend to Ã5.4m. Following the review of Minimum Revenue Provision Policy and thetreasury management budgets there will be a reduced charge to revenue in 2016/17. Normalpractice is to transfer any net treasury management underspend to the capital programme toreduce borrowing, but this could be used to mitigate a net overspending on the General Fund ifrequired.
2.7 The quarter 2 Capital Programme is monitored against the revised programme submittedto the Council as part of State of the County in June plus approved variations. The forecastexpenditure for the year is projected at Ã98.4m against a current budget of Ã121.8m, a variationof Ã23.4m (Ã12.5m at quarter 1). The additional movement at quarter 2 of Ã10.9m comprisesslippage of Ã12.8m, offset by spend in advance of Ã2.2m, and a net underspend of Ã0.3m. Aspart of RPPR, the current capital programme will be adjusted to reflect the updated forecastposition at quarter 2 including any further approved variations.
2.8 The additional Capital slippage at quarter 2 mainly comprises:
Ã6.0m on Broadband (Ã7.9m total slippage) after a re-profiling of payments.
Ã1.8m on Terminus Road (Ã4.6m total slippage). The result of necessary designalternations following Bus operator concerns regarding the current plan. The change sincequarter 1 is due to Highways reviewing whether any other LEP projects could be broughtforward to ensure expenditure remained in line with the agreed LEP funding profile.
Ã1.4m on the Schools Basic Need Programme. Of this Ã0.8m relates to the schooldevelopment at Frant, which has been delayed as a result of the housing development notproceeding as fast as initially anticipated. The pressure for places has therefore slippedout of the current approved programme. The remaining Ã0.6m relates to Cradle Hill theresult of planning delays, and Ninfield due to negotiations with the Parish Council on theland and lease.
Ã0.6m on Bexhill Hastings Link Road Complimentary Measures. Mainly due to a reviewthat was expected to take place earlier in the year now taking place in December,therefore delaying any measures until 2017/18.
Ã0.4m on ASC House adaptations. This scheme is demand led and currently there is alow demand.
In addition, there is a risk associated with the delivery by Costain of the Local TransportPlan, while this may result in some slippage, at this stage it is not possible to quantify.
2.9 The slippage on Terminus Road and Queensway have been offset by bringing forwardexpenditure of Ã2.0m on the North Bexhill Access Road to ensure the South East LEP fundingis used as agreed. Further spend in advance of Ã0.3m has occurred due to the unexpectedvolume of grants and loans applied for by businesses from the Councilôs Economic InvestmentFund. This is offset by a reduced spend in advance of Ã0.1m on the Schools Basic NeedProgramme. The net underspend of Ã0.3m is mainly due to the removal of the forecast
Page 8

overspend reported at quarter 1 on the Bexhill Hastings Link Road. The contractors have re-profiled payments and any impact will not materialise until future years.
2.10 The Strategic Risk Register, Appendix 7, has been reviewed. Risk 1 (Roads), Risk 6(Local Economic Growth) and Risk 7 (Schools) all have updated Risk Control measures. Nonew risks have been added to the Strategic Risk Register for this review, and no existing riskshave been removed. All risk scores, both pre and post mitigation, remain unchanged.
3. Progress against Council Priorities
Driving economic growth
3.1 126 online learning courses were completed in our libraries in quarter 2 on topics such asEnglish, Maths and IT (Appendix 5).
3.2 87.1% of primary schools in the county are judged to be good or outstanding. Althoughthis is slightly lower than the national rate of 89.4% it has increased by 10.1 percentage pointssince August 2015, over the same period the national rate increased by 5.6 percentage points.77.8% of secondary schools are judged as good or outstanding compared to 77.6% nationally.For the 2015/16 academic year, the percentage of pupils achieving 5+ GCSEs at A*-C,including English and mathematics was 57.5% against a national average of 57%. At Key Stage4 the East Sussex Progress 8 score was +0.04, significantly higher than the national average of-0.03. The East Sussex Attainment 8 score was 49.1, 0.8 below the national average (Appendix4).
3.3 We have provided grants and loans worth over Ã870,000 to businesses in 2016/17, whichexpect to create 97 jobs (Appendix 5).
3.4 27 apprentices have been recruited during 2016/17, of these 12 were recruited by theCouncil, nine by Costain CH2M, and six in schools. The current apprenticeship retention rate is93% (Appendix 5).
3.5 We have invested over Ã7m on 110 schemes of work to maintain and improve thecondition of the countyôs roads during 2016/17 (Appendix 5).
Keeping vulnerable people safe
3.6 29 victims of financial abuse were visited by Trading Standards officers in quarter 2.During the visits the officers mentored, and were assisted by, volunteers from Age Concern andCitizens Advice. The National Trading Standards Scams Team has selected East Sussex as thepilot area for the Against Scams Partnership initiative (Appendix 5).
3.7 We opened 21 new mental capacity pre-proceedings cases in quarter 2, to ensure thatmembers of the community who are mentally incapacitated are protected. We also opened 31new pre-proceedings cases involving children to try to keep children in their families, and wherethat isnôt possible to secure them a safe placement with relatives, in a foster home or by way ofadoption (Appendix 6).
3.8 A network of domestic abuse champions is being introduced to bring practitioners from arange of agencies together (Appendix 2).
Helping people help themselves
3.9 The project manager for the road safety project, made possible by Ã1m of Public Healthfunding, has begun developing a range of behavioural change initiatives aimed at reducing thenumber of people Killed or Seriously Injured (KSI) on the countyôs roads. Driver error has beenidentified as a contributory factor in 90-95% of KSI so this is the focus of the project. Provisionaldata for April to June 2016 shows that there were 76 KSI on the countyôs roads, with 10 of thesebeing fatalities. 10 of the KSI and one of the fatalities happened on trunk roads which are theresponsibility of Highways England (Appendix 5).
3.10 A new diabetes prevention programme called Healthier You is helping people at greatestrisk of developing Type 2 diabetes to avoid the disease. The programme supports people tochange their lifestyle ï maintaining a healthy weight and being more active ï to reduce their risk(Appendix 2).
Page 9
Making best use of resources
3.11 We are aiming to reduce our cost of occupancy of corporate buildings (per sq. metre) by2% in 2016/17. There have been reductions in utilities costs and service charges during quarter2. However pressures from the National Living Wage, security measures, and increased wastedisposal duty are presenting a challenge (Appendix 3).
Becky Shaw, Chief Executive
Page 10

How to read this report
This report integrates monitoring for finance, performance and risk. The contents of the reportare as follows:
Cover report
Appendix 1 Corporate Summary
Appendix 2 Adult Social Care and Health
Appendix 3 Business Services
Appendix 4 Childrenôs Services
Appendix 5 Communities, Economy and Transport
Appendix 6 Governance
Appendix 7 Strategic Risk Register
Cover report, Appendix 1
The cover report and Appendix 1 provide a concise corporate summary of progress against ourCouncil Plan Targets, Revenue Budget, Savings Targets, and Capital Programme.
The cover report highlights a selection of key topics from the departmental appendices, for thefour Council priorities:
driving economic growth;
keeping vulnerable people safe;
helping people help themselves; and
making best use of resources.
More information on each of these topics is provided in the relevant departmental appendixreferenced in brackets, e.g. (Appendix 2). More detailed performance and finance data is alsoavailable in the departmental appendices.
Departmental Appendices 2 - 6
The departmental appendices provide a single commentary covering issues and progressagainst key topics for the department (including all those mentioned in the cover report). This isfollowed by data tables showing progress against Council Plan Targets, Savings Targets,Revenue Budget, and Capital Programme for the department.
For each topic, the commentary references supporting data in the tables at the end of theappendix, e.g. (ref i). The tables include this reference in the ónote refô column on the right handside. Where the commentary refers to the Revenue Budget or Capital Programme, it may referto all or part of the amount that is referenced in the table, or it may refer to several amountsadded together.
Strategic Risk Registers Appendix 7
Appendix 7 contains commentary explaining mitigating actions for all Strategic Risks.
Page 11

APPENDIX 1
Council Monitoring Corporate Summary – Q2 2016/17
Council Plan performance targets
Priority Red Amber GreenAmend /
Delete (AD)TBC
Driving economic growth 0 7 24 1 0
Keeping vulnerable people safe 0 2 10 0 0
Helping people help themselves 2 3 13 1 1
Making best use of resources 0 2 1 0 0
Total 2 14 48 2 1
Q2 2016/17 Q2 2016/17
There are 67 individual measures in the Council Plan.
Appendix 2 ASC – 1 red, 2 amber, 1 amend,1 to be confirmed
Appendix 3 BSD – 3 amber
Appendix 4 CSD – 6 amber
Appendix 5 CET – 1 red, 3 amber, 1 amend
Red, 2,3%Amber,
14,21%
Green,48,
72%
Amend/Delete,2, 3%
TBC, 1,1%
Revenue budget outturn (net £000)
-10,000
-9,000
-8,000
-7,000
-6,000
-5,000
-4,000
-3,000
-2,000
-1,000
0
1,000
2,000
3,000
4,000
Q1 Q2 Q3 Q4
£0
00
Un
ders
pen
dO
vers
pen
d
ASC (Adult Social Care) BS (Business Services)CET (Communities, Economy & Transport) CS (Children's Services)G (Governance) PH (Public Health)SC (Safer Communities) CHB (Centrally Held Budgets)CF (Corporate Funding) Total over/underspend
PH, 0 (0%)SC, 0 (0%)
CHB, 3,180 (6.3%)
BS, 371 (1.7%)
GS, 86 (1.1%)
CS, -2,796 (-4.3%)
CET, 83 (0.1%)
ASC, -6,059 (-3.7%)
Total over/underspend, -5,376 (-1.5%)
CF, -241 (-0.1%)
Page 12

APPENDIX 1
Revenue budget summary (£000)
Planned (£000)Q2 2016/17 (£000)
Projected outturn (Over) / under spend
Gross Income Net Gross Income Net Gross Income Net
Service Expenditure
ASC 231,352 (68,166) 163,186 237,790 (68,545) 169,245 (6,438) 379 (6,059)
Safer Communities 723 (337) 386 1,197 (811) 386 (474) 474 -
Public Health 33,998 (33,998) - 33,859 (33,859) - 139 (139) -
BSD 49,236 (26,999) 22,237 48,699 (26,833) 21,866 537 (166) 371
CSD 330,326 (265,721) 64,605 332,799 (265,398) 67,401 (2,473) (323) (2,796)
CET 106,903 (46,085) 60,818 107,353 (46,618) 60,735 (450) 533 83
GS 8,505 (1,006) 7,499 8,441 (1,028) 7,413 64 22 86
Total Service Spend 761,043 (442,312) 318,731 770,138 (443,092) 327,046 (9,095) 780 (8,315)
Centrally Held Budgets
TreasuryManagement 27,566 - 27,566 27,566 - 27,566 - - -
Funding Cap Prog. 8,878 - 8,878 8,878 - 8,878 - - -
General Contingency 3,390 - 3,390 - - - 3,390 - 3,390
Pensions 6,299 - 6,299 6,299 - 6,299 - - -
Contrib. to Reserves 3,765 - 3,765 3,765 - 3,765 - - -
Corporate Grants - (58) (58) - (58) (58) - - -
Education ServicesGrant - - - - 200 200 - (200) (200)
Levies 441 - 441 446 - 446 (5) - (5)
Other 300 - 300 305 - 305 (5) - (5)
Total Centrally Held 50,639 (58) 50,581 47,259 (58) 47,201 3,380 (200) 3,180
Total 811,682 (442,370) 369,312 817,397 (442,950) 374,447 (5,715) 580 (5,135)
Corporate Funding
Business Rates - (71,400) (71,400) - (71,168) (71,168) - (232) (232)
Revenue SupportGrant - (45,107) (45,107) - (45,107) (45,107) - - -
Council Tax - (247,223) (247,223) - (247,213) (247,213) - (10) (10)
New Homes Bonus - (2,878) (2,878) - (2,879) (2,879) - 1 1
Transition Grant - (2,704) (2,704) - (2,704) (2,704) - - -
Total CorporateFunding 0 (369,312) (369,312) 0 (369,071) (369,071) 0 (241) (241)
Total 811,682 (811,862) 0 817,397 (812,021) 5,376 (5,715) 339 (5,376)
Page 13

APPENDIX 1
Revenue savings summary 2016/17 £000
Department2016/17 (£'000) – Q2 Forecast
Target Achieved Slipped UnachievedASC 7,955 3,898 4,057 -BSD 312 312 - -CS 4,985 4,542 276 167CET 3,117 3,117 - -GS 180 180 - -Centrally Held 3,000 3,000 - -Total Savings 19,549 15,049 4,333 167ASC - - - -BSD - - - -CS - - - -CET - - - -GS - - - -Centrally Held - - - -Permanent Variations 0 0 0 0Total Permanent Savings & Variations 19,549 15,049 4,333 167ASC - 431 (431) -BSD - - - -CS - - - -CET - - - -GS - - - -Centrally Held - - - -Temporary Variations 0 0 0 0Total Savings with Variations 19,549 15,480 3,902 167
Page 14

APPENDIX 1
Capital programme (gross £ millions) – approved projects
Key: Current budget Forecast Actuals Variance
Capital programme summary (£000)
Approved projectTotal project – all
years*
2016/17 (£000)
In year monitor Q2 Analysis of variation
Budget Projected BudgetActualto date
Projected2016/17
Variation(over) /under
budget
(Over) /underspend
Slippageto future
year
Spend inadvance
ASC 22,208 22,208 4,132 1,141 3,298 834 - 834 -
BSD 67,798 67,798 15,409 3,697 14,645 764 - 764 -
CS 66,670 65,670 22,514 10,663 20,800 1,714 - 1,825 (111)
CET 460,333 460,228 79,633 10,765 59,640 19,993 45 22,509 (2,561)
GS 157 128 74 3 3 71 29 42 -
Total 617,166 617,092 121,762 26,269 98,386 23,376 74 25,974 (2,672)
Scheme SpecificIncome 24,374 6,626 23,764 610
Capital Reserves - - - -
Section 106 - - - -
Non Specific Grants 35,083 17,525 35,083 -
Capital Receipts 6,268 - 6,268 -
Revenue Contributions 10,723 2,118 9,087 1,636
Borrowing 45,314 - 24,184 21,130
Total 121,762 26,269 98,386 23,376
*This includes current budget for all finite current projects plus 5 years of rolling programmes.
Centrally held budgets
The Treasury Management (TM) Strategy, which provides the framework for managing the Council’s borrowingrequirement, continues to reflect a policy of ensuring minimum risk whilst aiming to deliver secure realisticinvestment income on the Council’s cash balances. Investment rates available in the market have been lower duringthe quarter following the Bank of England base rate cut on the 4
thAugust to 0.25%. The average level of funds
available for investment purposes during the quarter was £292m. These funds were available on a temporary basis,and the level of funds available was mainly dependent on the timing of precept payments, receipt of grants andprogress on the Capital Programme. The total amount received in short term interest for the three months to 30September 2016 was £479k at an average rate of 0.65%.
At 30 September 2016, the majority of the Council’s external debt was held as long term loans (£275.4m), and no
£121.2 £121.8
£108.7
£98.4
£6.7
£26.3
£12.5
£23.4
0
20
40
60
80
100
120
140
Q1 Q2 Q3 Q4
£m
illo
ns
Q2 analysis of variance:Slippage: £25.97mUnder Spend: £0.18mOver Spend: (£0.1m)Spend in Advance: (£2.7m)
Page 15

APPENDIX 1
cost effective opportunities have arisen in the twelve months to restructure the existing debt portfolio. On September30
ththe Council repaid £2.6m which had reached its maturity date a further £2m is due to be repaid on the 31
st
December 2016. The Accounts & Pensions team have set up a recording process for trigger rate monitoring andwork to an agreed protocol for potential future borrowing activity to fund the current capital programme.
The Council’s budgeted cost of external interest, relating to both long and short-term borrowing for the year is£16.2m.
Centrally held budgets include a general contingency of £3.4m. This will be held to offset the projected serviceoverspend of £10.0m. Following the review of Minimum Revenue Provision Policy and the treasury managementbudgets there will be a reduced charge to revenue in 2016/17. Normal practice is to transfer any net treasurymanagement underspend to the capital programme to reduce borrowing, but this could be used to mitigate a netoverspending on the General Fund if required.
General balances
The General Fund balance was £10.0m as at 31 March 2016. General balances are held to manage risk and allowthe Council to manage unforeseen financial circumstances without the need to make immediate savings.
Schools balances as at 31 March 2016 were £14.9m.
Outstanding debt analysis (£ millions)
The value of debt over 5 months at Quarter 2 has increased to £2.906m when compared to the 2015/16 outturn of£2.190m. The majority of this is due to CCG debt of £521k moving into the 5 months to 12 months age category.CCG outstanding debt is monitored on a monthly basis by Service Finance colleagues directly with the CCG. AgeDebt continues to be a high priority focus area with a continuous improvement approach to continually re-engineersystems and processes. Regular ASC debt case review meetings ensure that the most appropriate steps are takento recover debt promptly in consideration of the residents' circumstances and in accordance with the Care Act.
Page 16

APPENDIX 2
Adult Social Care and Health – Q2 2016/17
Summary of progress on Council Priorities, issues arising, and achievements
Summary of successes and achievements – Between April and September 2016, 100% (4,697) of working ageadults and older people supported by Adult Social Care received self-directed support. 98.4% of new clients whoreceived short-term services to increase their independence made no further request for support. 891 adults with alearning disability were in settled accommodation, an increase from 869 in 2015/16. 879 referrals were made to theMemory Assessment Service. 843 new referrals were supported by STEPS this included 462 supported with HousingSupport, 333, supported with Navigator Service and 48, supported through the gateway service. Work on ESBT isprogressing well and Cabinet considered proposals for the next steps towards developing an integrated care modeland initial proposals for the transitional year in 2016/17 at its meeting on 15 November.
NHS Health checks – Since April 2013 over 117,000 eligible patients have been offered an NHS Health Check inEast Sussex with more than half of those offered taking up the opportunity. As the programme moves into its fourthyear almost seven in ten have been offered their health check (against a target of 65%). East Sussex also continuesto lead the way in ensuring that people take up their NHS Health Check with over one third (35.1%) of all adults aged40-74 in East Sussex who don’t already have a cardiovascular disease having had an NHS Health Check, comparedwith around a quarter (25.5%) on average across the South East and 29.8% nationally.
National Diabetes Prevention Programme – We are pleased to be involved in the first wave of Healthier You, thenew national diabetes prevention programme. Now, people in East Sussex at greatest risk of developing Type 2diabetes are set to benefit from increased help to avoid the disease. Healthier You is being rolled out nationally and isthe first evidence-based Type 2 diabetes prevention programme to be provided on this scale. The programme willsupport people to make changes to their lifestyle - maintaining a healthy weight and being more active – to reducetheir risk. The programme will begin working with local people in October.
Chlamydia Screening – This measure is reported a quarter in arrears. Both the number of people aged 15-25 testedfor Chlamydia and the number of positive tests for Chlamydia in this age group has shown a sharp increase in Q1 of2016/17. This is the highest quarterly rate of positive tests recorded since 2012 when monitoring of this target beganand is very encouraging in terms of us meeting the overall target for the year. For us to meet the 2016/17 target, arate of 2,300 positive tests for chlamydia per 100,000 people aged 15-24 years is required. In Q1 we achieved a rateof 2,125 positive tests per 100,000 15-24 year olds, which is close to the rate that we consistently need to meetacross the remainder of the financial year in order to meet the target. This increase in positivity indicates that we arescreening the right people.
Direct Payments – at 30th September 2016, 34.3% of adults and older people were receiving Direct Payments(1,613 people). Previous investigation into the overall Direct Payment process showed that support provided to someDirect Payment clients at the set up stage could be improved. These improvements are currently being outlined andfinalised. Having seen a decrease in performance from 35.6% in March 2016 to 34.8% in April 2016, the decrease inDirect payments has now levelled off and has remained at 34.4% in the last two months.
Despite performance decreasing from 42% in 2014/15 to 35.6% in 2015/16 we are still in the top performingauthorities nationally (28th highest out of 152). It should also be noted that sustainability of performance in relation toDirect Payments appears to be an issue experienced by many local authorities. 51 out of 152 authorities saw a dropin their Direct Payment performance between 2014/15 and 2015/16.
Several areas were examined to look at potential options for short term potential performance improvements however,detailed investigation of these areas has shown that: a) these would be highly resource intensive, b) would furthercomplicate the process, impacting on the sustainability of people staying on Direct Payments, c) are unlikely to besustainable over longer periods of time and d) would not have delivered significant benefit or improved outcomes toclients.
Longer term performance improvements are being implemented, such as offering additional support to clients andpractitioners at the point that the Direct Payment is being set-up. The added responsibility of becoming an employerhas been identified as a barrier to clients who employ Personal Assistants (PAs) and a new service provided by oneof the Direct Payment support services is being used as a way of reducing this barrier. Further improvements will beimplemented, the effects of which will be realised in 2017/18.
Support with Confidence – The current membership of Support With Confidence has reduced to 144. A total of 5members have been approved since July however seven existing members have also resigned from the scheme inthis quarter. The five new members are all Personal Assistants. We currently have 95 applications on the ledger ofwhich 79 are PAs. We anticipate that that the number of approvals will increase in Q3.
Carers – Since the implementation of the new client database, LAS, a number of issues have arisen that mean thatthe number of carers assessed or reviewed during the year we cannot be monitored, benchmarked or reported
Page 17

APPENDIX 2
confidently (ref i). These issues are unlikely to be resolved until the system is upgraded in early 2017 it is proposedthat this measure is deleted for the 2016/17 and replaced it with the "Number of carers supported through short-termcrisis intervention". Target for year = 675 carers. Current performance against this proposed target for April to June2016 is 248.
Smoking Cessation – This measure is reported a quarter in arrears. In order to hit their annual target, we wouldexpect the specialist stop smoking service to have achieved at least 420 individuals to have achieved a 4-week quitby the end of Q1. However, performance was significantly lower with just 282 individuals achieving that outcome. As aresult of this continued underperformance and ongoing data issues, although a recovery plan is in place a formalcontract query notice has now been raised with the provider. (67% of target (420) achieved).
Safer Communities – The Strategic Assessment of Community Safety 2016 is being finalised. The document thisyear focuses on the risk and harm associated with those areas identified as current threats to vulnerable adults,vulnerable young people and the wider community in the field of community safety in East Sussex. It incorporatesinformation gathered from those individuals who attended the Safer People, Safer Places event in May alongsiderelevant data and expert knowledge from lead officers.
Future priorities and workstreams were finalised at the partnership Resources and Performance meeting in October.
Serious Organised Crime – The Scams Working Group continues to meet and recently discussed service mappingacross the county. This outlined which agencies are working together and the group discussed possible gaps/ areasto be developed, particularly within the voluntary and community sector.
Domestic Abuse – We’re introducing a network of champions to bring together practitioners from a range ofspecialist agencies. The champions will act as a point of contact and be ‘in-house’ specialists within their service. Thechampion’s network will be supported by the Safer East Sussex Team and will complement any existing domesticabuse and sexual violence champions locally.
Substance Misuse – As part of the development of the Recovery Community in East Sussex, a fund was madeavailable for innovative work. In total, eight projects were funded and will run for two years. The projects will besupported by the Safer East Sussex Team Community Development Officer as they are rolled out in different areas ofthe county. The Community Development Officer will support with promotion, referrals and partnership workingbetween all projects which benefit the recovery community.
Revenue Budget Summary
Adult Social Care – There is a projected overspend of £6.059m (ref vii), comprising overspends of £4.854m in theIndependent Sector (ref v) and £1.205m within Directly Provided Services and Assessment and Care Management(ref vi); compared to an overspend position of £8.693m projected at Q1. The total net budget of £163.186mincorporates savings totalling £7.95m, of which £4.057m is projected to slip to 2017/18 due to overspend and delaysin delivering specific service developments and change.
Independent Sector: Pressures continue with a 17% increase in the number of packages presented to panels and a5% increase in the average cost of these packages of care compared to 2015/16. This has directly impacted on theability to deliver the £3m savings in Community Based services (ref ii), primarily within Physical Support, SensorySupport and Support for Memory Cognition. Learning Disability Support has, in recent months, become responsiblefor two unplanned high-cost clients, in addition to increasing costs through service activity.
Directly Provided Services and Assessment and Care Management: Pressures reflect the slippage and re-phasing ofservice savings, £626,000 made up of £160,000 within the Commissioning Grants Prospectus (ref iii) and £466,000for All Other Savings (ref iv), to 2017/18 and staffing pressures, as teams work to meet activity levels.
The pressure continues to be monitored and is included within the development of the East Sussex Better TogetherStrategic Investment Plan (Eastbourne, Hailsham & Seaford CCG and Hastings and Rother CCG), which sets out howpooled health and social care budgets will be spent (£846.133m in 2016/17). The Strategic Investment Plan identifies arange of schemes which will mitigate increasing demands on services and will be reflected in budgets through theReconciling Policy Performance and Resources process.
Within the High Weald Lewes Havens area we continue to work with the CCG to align our plans as per previous years.
Extract from minutes of the ESBT Programme Board on 9 Nov 2016:
”Finance Update: John O’Sullivan presented the above item and recommended that the Board note the update. JohnO’Sullivan reported that the strategic investment plan position was being presented as a whole system position andthat the supporting papers provide the next step financial view of whole system current performance in year.
John O’Sullivan reported that previously a commissioner surplus of £8.7m was reported to Board members. TheESHT planned deficit of £31.3m is now included which therefore results in a planned whole system deficit of £22.6m.Year-end positions have been included and from a Local Authority (LA) position there is a net deficit of £8.4m.
Page 18

APPENDIX 2
John O’Sullivan reported that, in relation to the Better Care Fund (BCF), there is a forecast contingency of £1.3mavailable however this is to be used to manage risks elsewhere in the system.”
Public Health – The Public Health (PH) budget at £28.747m comprises the PH grant allocation of £28.697m and £50,000addition Public Health England income for drug/ alcohol prevention carried forward from 2015/16. At 30 September 2016there is a projected overspend of £1m, which will be funded from reserves. In addition to the PH Grant, £4.112m hasbeen allocated from reserves to meet the costs of a number of one-off projects.
Public Health Reserves: At 30 September 2016, projected Public Health reserves stood at £10.173m comprising projects(£6.905m), health protection (£1.200m) and underspend (£2.068m) reserves.
Capital Programme Summary – The Capital Programme has projected expenditure of £3.298m against an approvedprogramme of £4.132m resulting in slippage of £834,000 due to: specific scheme delays as a result of constructionissues (ref viii and x) (£415,000), projects will complete in early 2017/18, and a lower level of calls on demand ledschemes in House Adaptations (ref xiii) (£419,000). The underspend on Greenwood (ref ix) (£33,000), WarwickHouse (ref xi) (£34,000) and House Adaptations (ref xiii) (£3,000) will be used to cover the overspend in Sidley (refxii) (£70,000).
Page 19

APPENDIX 2
Performance exceptions(Q1 – Red and Amber RAG rated targets, and amendments
Q2-4 – RAG status changed to Red, Amber, Green, and amendments)
Performance measureOutturn
15/16Target 16/17
16/17 RAG Q2 16/17outturn
NoterefQ1 Q2 Q3 Q4
Priority - Helping people help themselves
Amendment requested from:
Number of carers known to Adult SocialCare (those assessed, reviewed and/orreceiving a service during the year)
To:
Number of carers supported through short-term crisis intervention
7626
Amendmentrequested
from:
>7,626
To:
675
G AD 248 i
Savings exceptions(Projected - Red = will not be delivered but may be mitigated; Amber = on track to deliver but not in
the year (& may be mitigated); Green = on track to deliver in the year)
Service description2016/17 (£'000) – Q2 Forecast
Noteref
Target Achieved Slipped UnachievedSavingsCommunity Based Services: Review and focus on servicesto meet personal care needs, in line with personal budgets
3,000 - 3,000 - ii
Commissioning Grants Prospectus 1,317 1,157 160 - iii
Supporting People 2,158 1,727 431 -
All Other Savings 1,480 1,014 466 - iv
Total Savings 7,955 3,898 4,057 0
Variations to Planned SavingsNone - - - -
Permanent Variations 0 0 0 0Total Permanent Savings & Variations 7,955 3,898 4,057 0
Supporting People Reserve - 431 (431) -
Temporary Variations 0 431 (431) 0
Total Savings with Variations 7,955 4,329 3,626 0
Page 20

APPENDIX 2
Revenue budget
DivisionsPlanned (£000)
Q2 2016/17 (£000)Noteref
Projected outturn (Over) / under spend
Gross Income Net Gross Income Net Gross Income Net
Adult Social Care:
Physical Support, SensorySupport and Support forMemory & Cognition
89,771 (38,533) 51,238 93,148 (38,625) 54,523 (3,377) 92 (3,285)
Learning DisabilitySupport
45,077 (4,002) 41,075 45,820 (4,132) 41,688 (743) 130 (613)
Mental Health Support 7,120 (1,158) 5,962 7,886 (968) 6,918 (766) (190) (956)
Subtotal IndependentSector
141,968 (43,693) 98,275 146,854 (43,725) 103,129 (4,886) 32 (4,854) v
Physical Support, SensorySupport and Support forMemory & Cognition
16,651 (5,746) 10,905 16,873 (5,489) 11,384 (222) (257) (479)
Learning DisabilitySupport
8,861 (1,265) 7,596 8,944 (1,173) 7,771 (83) (92) (175)
Mental Health Support 2,404 (2,380) 24 2,514 (2,459) 55 (110) 79 (31)
Substance MisuseSupport
609 (133) 476 609 (133) 476 - - -
Equipment & AssistiveTechnology
7,077 (4,046) 3,031 7,077 (4,046) 3,031 - - -
Other 6,327 (3,898) 2,429 6,313 (3,898) 2,415 14 - 14
Supporting People 9,156 (990) 8,166 9,424 (990) 8,434 (268) - (268)
Assessment and CareManagement
27,831 (3,302) 24,529 27,949 (3,295) 24,654 (118) (7) (125)
Management and Support 9,595 (2,370) 7,225 10,175 (2,809) 7,366 (580) 439 (141)
Service Strategy 873 (343) 530 1,058 (528) 530 (185) 185 -
Subtotal DirectlyProvided Services
89,384 (24,473) 64,911 90,936 (24,820) 66,116 (1,552) 347 (1,205) vi
Total Adult Social Care 231,352 (68,166) 163,186 237,790 (68,545) 169,245 (6,438) 379 (6,059) vii
Total Safer Communities 723 (337) 386 1,197 (811) 386 (474) 474 0
Public Health:
Health Improvementservices
4,728 (4,728) - 4,728 (4,728) - - - -
Drug and alcohol services 6,101 (6,101) - 6,101 (6,101) - - - -
Sexual health services 4,160 (4,160) - 4,154 (4,154) - 6 (6) -
Children's Public HealthServices - Including thenew Health Visitingservice
8,769 (8,769) - 8,769 (8,769) - - - -
NHS Health Checks 930 (930) - 930 (930) - - - -
Other programmes andnon-contracted services
4,059 (4,059) - 4,065 (4,065) - (6) 6 -
Deposit to UnderspendReserve
- - - - - - - - -
Subtotal Core Service 28,747 (28,747) 0 28,747 (28,747) 0 0 0 0
Draw from UnderspendReserve
1,139 (1,139) - 1,000 (1,000) - 139 (139) -
One Off Projects fundedfrom Project Reserves
4,112 (4,112) - 4,112 (4,112) - - - -
Total Public Health 33,998 (33,998) 0 33,859 (33,859) 0 139 (139) 0
Page 21

APPENDIX 2
Capital programme
Approved project
Total project –all years (£000)
2016/17 (£000)
Noteref
In year monitor Q2 (£000)Analysis of
variation (£000)
Budget Projected BudgetActualto date
Projected2016/17
Variation(over) /under
budget
(Over) /underspend
Slippageto future
year
Spendin
advance
OP Service Improvements 536 536 136 5 25 111 - 111 - viii
Social Care InformationSystems
4,258 4,258 131 88 131 - - - -
Greenwood, Bexhill 463 430 39 6 6 33 33 - - ix
LD Service Opportunities 5,107 5,107 3,194 1,049 2,890 304 - 304 - x
Warwick House, Seaford 7,331 7,297 119 4 85 34 34 - - xi
Extra Care / SupportedAccommodationProjects:
Sidley, Bexhill-on-Sea 807 877 - - 70 (70) (70) - - xii
Continuing Programme
House Adaptations forPeople with Disabilities
3,332 3,329 486 (11) 64 422 3 419 - xiii
Refurbishment –Registration standards
374 374 27 - 27 - - - -
Total ASC Gross 22,208 22,208 4,132 1,141 3,298 834 0 834 0
Page 22

APPENDIX 3
Business Services – Q2 2016/17
Summary of progress on Council Priorities, issues arising, and achievements
Summary of successes and achievements – As previously reported, we have been collaborating with Brighton &Hove City Council (BHCC) to explore the possibility of them joining and integrating with the Orbis Partnership. Overthe last six months, BHCC have been carrying out due diligence to determine whether they wish to proceed. We arenow able to confirm that on 13 October 2016, BHCC’s Policy, Resources and Growth Committee fully supported therecommendation to join the Orbis partnership. This is a positive endorsement of the Partnership and we will nowcommence integrating BHCC into the Partnership and concluding our own due diligence. Once concluded, arecommendation will be taken to respective Cabinets of East Sussex and Surrey County Councils seeking to expandthe Partnership to formally include BHCC.
The appointment of the Orbis Finance Director means that all services within Orbis now have single leadership. Workhas continued with the appointment of the leadership teams in both Procurement and the IT & Digital Service. All ofthese developments have contributed towards a reduction to date in the number of senior management posts by 25%,this already exceeds the expectation set out in the business plan.
Orbis is undertaking several opportunities to develop and share its expertise, both internally and externally, tomaximise the opportunity for growth and development, including participation in a Shared Services Summit,nominations for awards and the launch of the EPIC+ staff development programme. A ‘People and Change’ updatewas detailed in the 21 October Orbis Joint Committee report.
Asset Investment Strategy – The key site programme has progressed with forecasting of capital receipts againstcurrent risk factors in order to facilitate best value ahead of disposal. Work on the Asset Investment Strategycontinues, however presentation of the report to Cabinet in November has been deferred pending further stakeholderengagement to shape the principles and direction of the strategy (ref i).
Reduction in CO2 emissions – We aim to reduce the amount of CO2 arising from County Council operations by 3%on the 2015/16 outturn. During Q1 and Q2 we have achieved a 6.3% weather adjusted reduction. Around a quarter ofthis reduction is due to improvements at County Hall. Sackville House contributed a fifth of this figure, understood tobe a result of changes to air conditioning and heating settings and changes in occupancy. Sites targeted by the EnergyTeam for housekeeping measures also made a contribution (Southview Close and Linden Court). Projects on themaintenance planned programme and schools lighting projects are being progressed. Four energy surveys carried outas a trial by Orbis colleagues in Kingston are being reviewed, with the aim of including projects in next year's plannedprogramme. The first course of Ashden energy workshops for schools completed in September and a second batch ofschools are due to start in early November.
Property operations – During 2016/17, we aim to achieve a 2% (£147) reduction on last year’s cost of occupancy ofcorporate buildings per sq metre. An area of focus that has been successfully implemented during Q2 is utilities, wherehistorical investment through initiatives such as Salix will deliver an estimated end of year outturn 9% lower than the2015/16 baseline. Much larger outturn reductions are forecast within Service Charges (22%), and a redesign ofsupport services to Sackville House (following the transfer of Council staff into County Hall) will secure an estimated58% reduction on the annual Hired and Contracted Services value. However, pressures arising from the introduction ofthe National Living Wage, reactive security measures at a number of corporate sites, and increasing waste disposalduty will need to be offset against some of these efficiencies. Current figures and planned initiatives indicate that thetargeted level of efficiencies (2%) remains deliverable but with a small increase in pressure elsewhere within the spendcategories (ref ii).
Social Value – The Q2 outturn for spend with local suppliers is 44% of the total spend (over the last 12 months wehave spent £179m with 4,305 local suppliers). We are continuing to maintain our visibility in the market to promotecontract opportunities for local businesses; at the Best 4 Biz conference in October we presented on how localsuppliers can apply for opportunities more effectively through our e-sourcing tool, the SE Shared services platform thathas now over 18,000 suppliers registered.
Savings achieved through procurement, contract and supplier management activities – During Q1 and Q2,£3.9m of procurement, contract and supplier management related savings have been signed off. These savingscomprise £1.8m planned Reconciling Policy, Performance and Resources (RPPR) savings, £1.2m Capital, and £800kother ‘revenue’ savings supporting known budgetary pressures. The forecast for the remainder of the year indicates anoutturn of £6.1m against a target of £6.5m. The shortfall is a result of the Newhaven Port Access Road project beingmoved from 2016/17 to 2017/18. Procurement will continue to work with services to obtain further savings within Q3and Q4.
ICT infrastructure – 99.9% of key services were available during core hours (08:00 to 17:00 Monday to Friday exceptthe Local Area Network where availability has been extended to be 24/7). Weekend and planned unavailability isexcluded. The 2015/16 annual IT Customer Survey showed 79% of staff were satisfied with the technology tools
Page 23

APPENDIX 3
provided. This is the benchmark for future improvement. The next annual survey will be launched during Q3.
Wellbeing – The 2016/17 Q1 and Q2 sickness absence outturn for the whole authority (excluding schools) is 3.86days lost per FTE employee, which represents a decrease of 5.5% since the same period last year. Stress relatedabsence has seen a significant reduction. However it still continues to be the primary driver of absences across theorganisation. There are a number of interventions in place to reduce and sustain reductions in absence.
A new wellbeing plan was launched on 19 September 2016 to enable managers and employees to discuss anywellbeing concerns at an early stage and put in place a shared agreement to prevent absences in the future. An LGAgrant of £10k has been successfully applied for to provide an online mindfulness programme, part of which will betailored specifically for staff absent with work related stress. The evaluation process will include data andrecommendations for the future direction for employees who are absent with stress-related illness. The programme isdue to commence in January 2017. In signing up to the ‘Time to Change’ plan the Council has committed to reducingthe stigma surrounding mental health. Collaborative opportunities are being explored with Public Health colleaguesand the mental health charity; ‘Time to Change’. This may include management training and development of onlineresources.
Revenue Budget Summary – The Business Services revenue budget is currently forecasting to underspend by£371k. £351k of this results from the early delivery of 2017/18 Orbis savings (ref vii). This is due to holding vacanciesacross a number of Orbis services in advance of restructures. 2016/17 savings are forecast to be delivered in full (refiii). Other significant variances include: a £50k shortfall of income from the capital programme for Procurement supportto county infrastructure projects (ref iv); a £100k shortfall of internal print income to the IT service (ref vi); and a £186kunderspend in Property as a result of one-off backdated income from mobile phone network operators for use of theCouncil’s aerial (ref v).
Capital Programme Summary – The Business Services Capital Programme is currently forecasting slippage of£764k. £614k relates to the Core Systems Capital Programme, where no material expenditure is forecast in 2016/17.A number of solutions to a joint Orbis back office system are under consideration (ref viii). The £150k slippage in theIT investment programme relates to the IT Asset Management System, the requirements for which are under reviewwhile the impact of Orbis is considered (ref ix).
Page 24

APPENDIX 3
Council Plan Performance Exceptions(Q1 – Red and Amber RAG rated targets, and amendments
Q2-4 – RAG status changed to Red, Amber, Green, and amendments)
Performance measure Outturn 15/16 Target 16/1716/17 RAG
Q2 16/17 outturn Note refQ1 Q2 Q3 Q4
Priority – Making best use of resources
Develop an assetinvestment strategy basedon a balanced portfolioapproach
Target not met,timeline
reviewed andrevised
completion dateset for
September 2016
Assetinvestment
strategydeveloped and
approved
G A
Work on strategycontinues.
Presentation ofreport to Cabinet
in Novemberdeferred pending
further stake-holder engage-ment to shape
strategy.
i
Cost of occupancy ofcorporate buildings per sq.metre
A baseline hasbeen established£150 / sq. metre
'£147 / sq.metre
(2% reductionon 2015/16baseline)
G A
Current figures &planned initiativesindicate targeted
level ofefficiencies (2%)
remainsdeliverable but
with a smallincrease inpressure
elsewhere withinthe spendcategories.
ii
Savings exceptions(Projected - Red = will not be delivered but may be mitigated; Amber = on track to deliver but not in
the year (& may be mitigated); Green = on track to deliver in the year)
Service description2016/17 (£'000) – Q2 Forecast
Noteref
Target Achieved Slipped UnachievedSavingsESCC savings from efficiencies generated by the Orbispartnership
312 312 - - iii
Total Savings 312 312 0 0Variations to Planned Savings
- - - -Permanent Variations 0 0 0 0Total Permanent Savings & Variations 0 0 0 0
- - - -Temporary Variations 0 0 0 0Total Savings with Variations 312 312 0 0
Page 25

APPENDIX 3
The below table represents the East Sussex 2016/17 Revenue Budget, and includes a line which is thecontribution to Orbis Partnership. The second table shows the total Orbis Partnership 2016/17 RevenueBudget, of which East Sussex hold a 30% share.
Revenue Budget
DivisionsPlanned (£000)
Q2 2016/17 (£000)Noteref
Projected outturn (Over) / under spendGross Income Net Gross Income Net Gross Income Net
Management &Support
85 (302) (217) 85 (302) (217) - - -
Personnel & Training 303 (382) (79) 303 (366) (63) - (16) (16)Finance 2,982 (1,745) 1,237 2,982 (1,745) 1,237 - - -Procurement 4 (86) (83) 4 (36) (33) - (50) (50) ivNon Specific Budgets 262 - 262 262 - 262 - - -Property 23,621 (19,030) 4,592 23,435 (19,030) 4,406 186 - 186 vICT Services 5,906 (5,454) 452 5,906 (5,354) 552 - (100) (100) viBusiness Ops 157 - 157 157 - 157 - - -Contribution to OrbisPartnership
15,916 - 15,916 15,566 - 15,566 351 - 351 vii
Total BSD 49,236 (26,999) 22,237 48,699 (26,833) 21,867 537 (166) 371
Orbis Partnership Revenue Budget
Divisions Planned (£000)Q2 2016/17 (£000) Note
refProjected outturn (Over) / under spend
Gross Income Net Gross Income Net Gross Income NetBusiness Operations 10,874 (5,679) 5,195 10,874 (5,679) 5,195 - - -Finance 10,679 (1,244) 9,435 10,279 (1,244) 9,035 400 - 400HR 5,630 (566) 5,064 5,390 (566) 4,824 240 - 240IT 18,946 (1,587) 17,360 18,646 (1,587) 17,060 300 - 300Management 2,255 - 2,255 2,140 - 2,140 115 - 115Procurement 3,652 (154) 3,498 3,652 (154) 3,498 - - -Property 11,500 (1,202) 10,298 11,360 (1,177) 10,183 140 (25) 115Total Orbis 63,536 (10,431) 53,105 62,341 (10,406) 51,935 1,195 (25) 1,170
ESCC Contribution(30%)
15,916 15,566 351
SCC Contribution(70%)
37,189 36,369 819
Total 53,105 51,935 1,170
Capital programme
Approved project
Total project – allyears (£000)
2016/17
Noteref
In year monitor Q2 (£000)Analysis of
variation (£000)
Budget Projected BudgetActualto date
Projected2016/17
Variation(over) /under
budget
(Over) /underspend
Slippageto future
year
Spend inadvance
Core SystemsDevelopment
623 1,470 623 4 9 614 - 614 - viii
The Link 69 2,718 69 (12) 69 - - - -
SALIX Contract 380 2,644 380 5 380 - - - -
AGILE 9,029 9,029 3,239 1,007 3,239 - - - -
Capital BuildingImprovements
40,898 40,898 9,048 2,376 9,048 - - - -
ICT StrategyImplementation
11,039 11,039 2,050 317 1,900 150 - 150 - ix
Total BSD Gross 62,038 67,798 15,409 3,697 14,645 764 0 764 0
Page 26

APPENDIX 4
Children’s Services – Q2 2016/17Summary of progress on Council Priorities, issues arising, and achievements
Summary of successes and achievements:Early years – The percentage of pupils achieving a good level of development at the early years foundation stage inacademic year 2015/16 has increased by 1.45 percentage points to 75.7%. East Sussex was 1st amongst ourstatistical neighbours, 2nd amongst our geographical neighbours and 6.4 percentage points above the nationalaverage.Key Stage 1 – 81% of pupils in East Sussex in academic year 2015/16 were working at the expected level in phonicsat the end of Year 1. This is an increase of 5 percentage points and means that East Sussex is now in line with thenational average for the first time since this measure was introduced.Schools judged by Ofsted as good or outstanding – 87.1% of primary schools are judged to be good or outstandingagainst a national average of 89.4%. This is an increase of 10.1 percentage points since August 2015 in East Sussex.The national average increased by 5.6 percentage points during the same period. 77.8% of secondary schools arejudged as good or outstanding in line with the national average of 77.6%, and, 100% of maintained special schoolsare judged as good or outstanding against a national average of 93.2%.The Special Educational Needs and Disability (SEND) Matrix – The SEND Matrix of provision and need is a tool tosupport schools, settings and colleges in planning for appropriate SEND provision, and was drawn up in consultationwith school colleagues. The first draft was issued in February 2016 and the final version in September 2016 whichtook into account feedback from schools and other services including sensory needs and children’s integrated therapyservices. The Matrix and associated process should help schools to identify areas of required professionaldevelopment to effectively deliver the provision necessary to support different areas of SEND and levels of need.Social care – The duration and percentage of completed care proceedings has improved and is now within therecommended national parameters of 26 weeks. The impact of this is more timely permanence planning for childrenand a positive impact on the Council’s budget.
Attainments academic year 2015/16 – The new measures at Key Stages 1, 2 and 4 are not comparable withprevious years. Data for Key Stages 2, 4 and 5 is provisional. At Key Stage 1, the percentage of pupils in EastSussex achieving the expected standard was higher than the national average in reading, writing and mathematics.
Key Stage 1- % pupils achieving the expected standard at Key Stage 1 in Academic year 2015/16
Reading Writing Maths
National 74.10% 65.50% 72.60%
East Sussex 75.60% 68.90% 75.00%
The percentages of pupils in East Sussex achieving the expected standard at Key Stage 2 in reading, writing andmathematics, separately and combined were all below the national average in academic year 2015/16. This wasdisappointing and we will be working with schools to improve their tracking of whether pupils are on course to meetthe expected standard in each subject and ensure that they take the necessary actions in order for all children tomake expected progress.
At Key Stage 4 the East Sussex Progress 8 score was +0.04, significantly higher than the 2015/16 national averageof -0.03 and placing us third highest among our statistical neighbours. The East Sussex Attainment 8 score was 49.1,0.8 below the academic year 2015/16 national average placing us 10th out of 11 statistical neighbours. As theAttainment 8 and Progress 8 measures are new the Department for Education has also published data for academicyear 2015/16, the percentage of pupils achieving 5+ GCSEs at A*-C, including English and mathematics. For EastSussex this was 57.5% against a national average of 57%.
At Key Stage 5, initial analysis of the 2015/16 A Level outcomes indicate that the overall A*-E pass rate at 98.2% hasimproved by 0.7 percentage points and is now in line with the nationally reported pass rate. The proportion of A Levelpasses at A*-B (44.7%) and A*-C (74.2%) have both improved and are the highest they have been over the last threeyears. However, despite this, our overall results are still likely to continue to underperform against nationalbenchmarks. Addressing the challenge of supporting young people to achieve at A Level across East Sussexcontinues to require a coherent approach across a number of providers and will be addressed through a commitmentto the shared principle of working together through the Post-16 Education Improvement Partnership. This is anotherarea where the method of measuring attainment will change, and briefings will be circulated appropriately.
ISEND Demand
Whilst the proportion of pupils with SEN support that is provided by schools in East Sussex is lower than the nationalaverage, the proportion with a statement or Education, Health and Care (EHC) plan is higher. Benchmarking data inthis area is limited, but suggests that nationally and regionally, there is no simple correlation between characteristicswithin local authorities and the identification of SEND need, demand and spend.
Page 27

APPENDIX 4
Significant changes have taken place in SEND, creating financial pressures, these include: Statutory changes in provision for SEND through the Children and Families Act 2014: extended the provision of statutory assessment for an Education Health and Care Plan (EHCP) from age 16
to 19 and for the provision of SEND support from age 19 to 25, but with no additional funding; heightened parental expectations, leading to more requests for additional provision and high-cost placements; revised consultation process for SEND assessment through which schools can challenge the LA and refuse
the placement of a child with an EHCP; and changed responsibilities for the provision of education in Tier 4 Health placements, shifting costs from health
to education Mainstream and special schools’ capacity and willingness to manage pupils’ learning and behaviour
effectively; Parental lack of confidence in mainstream provision; Partners’ prescription of statutory assessment and recommendations for additional or independent provision
the cost of which is carried by SEND.
The pressures arising from these changes will be addressed through five key strands of work to reduce the number ofhigh cost placements. This work will be supported by investment of £0.5m investment from the transformation fund in2016/17 and 2017/18
Building capacity and inclusive ethos in mainstream schools – targeted interventions with mainstreamschools, and work through Education Improvement Partnerships, to improve Quality First Teaching andconfidence in supporting more children with higher levels of need.
Improving parental confidence in local provision – ensuring that parents receive consistent messages fromschools and support services around the ability of local schools to support their children appropriately, withintheir local community.
Robustly implementing the East Sussex post-16 pathways and ceasing EHCPs at age 16 where they are notrequired for the young person’s chosen pathway. Targeting as appropriate the young people age 12-15 tostrengthen their targets for independence and academic progression to ensure that they are ready fortransition at the age-appropriate date without the need for an ongoing EHCP.
Increasing the number of local special school places – increasing the number of places through thedevelopment of specialist facilities in mainstream schools, Free Schools or Capital Programme.
Working with partners, ESBT and C4Y, to take a joined up approach to planning the use of resourcesavailable.
Discussions have taken place with the Schools Forum to ensure that the funding in each of the blocks in the DirectSchools Grant reflect actual spend and it is likely that the amount in the High Needs Block will be increased in2017/18 in line with the growth in demand. In the longer term, it is anticipated that the work set out in the paragraphabove will help schools to continue to support children within mainstream provision. This, subject to a successful freeschool bid which would increase provision of special school places should bring the budget into a more balancedposition in the future. Progress will be monitored and any effects on future years budget pressures will be taken intoaccount as part of the RPPR process.
Percentage of annual SEND review meetings where the child gave their view and/or participated – (ref i)During Q2 the percentage of young people who gave their views and/or participated in their annual review meetingwas 78.2% (470 out of 601), cumulatively the percentage for 2016/17 is 83.2% (747 out of 898) against a 90% target.The shortfall is due to an overhaul of the annual review system which took place late July. A new annual reviewprocess has been developed which will focus on pupil views. By December 2016 a bank of resources will be availableon line to help gather pupil views and work with SEN Co-ordinator (SENCo) cluster groups to embed this.
Safeguarding –The rate of children on a Child Protection Plan (ref ii) has increased during Q2 and at 42.7 iscurrently slightly outside the target of 41 per 10,000. The safeguarding unit is routinely reviewing all plans that areapproaching 18 months duration at the third review. Consideration is also being given to whether there should be aformal review process. Consideration is also being given to whether there should be a review by heads of service ofcases approaching 18 months and over.
Revenue Budget Summary – The £64.605m net budget for the year is forecast to be overspent by year end by£2.796m (ref viii), a £1.175m reduction in the forecast overspend since Q1. The forecast overspend areas totalling£3.052m are explained in the following table and are offset by small underspends of £0.256m in Children’s ServicesCentral Resources. Many of the reductions result from the Children’s Services review of all costs across thedepartment, including: reviewing recruitment activity and holding vacancies open for longer; a review of staff on non-permanent contracts and agency workers; identifying new savings for 2016/17; and bringing forward savings fromlater years into 2016/17. Work has also been undertaken to review and model the demographic pressures on ISENDcosts (including Home to School Transport (HTST) costs). A further risk is also from the net cost of asylum seekingchildren – currently this is not a significant pressure (£0.051m net placement costs for 10 children within the Q2forecast). It should be noted this figure is likely to increase in future years as further children transfer, and does notinclude the additional costs of social workers, Independent Reviewing Officers (IROs), English as an Additional
Page 28

APPENDIX 4
Language support (EALs), etc.
Forecastoverspenddivisions
Q2variance
(£000)
Changefrom Q1(£000)
Commentary
Early Help andSocial Care(ref v)
(995) 521
Pressures continue on Looked After Children (LAC) costs (£1.464m)offset by £0.469m of underspends in the rest of the division. The LACpressure arises from the need for agency placement for a few complexand vulnerable LAC teenagers.Mitigations (£0.521m) principally comprise additional £267k TroubledFamilies grant income due to an increase in the number of familiesexpected to be turned around; and forecast reduction in Localityforecast costs of £263k.
Education andISEND(ref vi)
(1,676) 506
ISEND has been under considerable pressure, as reported at Q1, buthas reduced by £506k for Q2. The improvement reflects furthermitigations (which now total £3.250m) including use of one-off DSGreserves (£2.455m (including £1.9m agreed by Schools Forum)) andother reductions in spend (£0.463m). These partially offset the full yearpressure of £4.926m from the lack of local mainstream provision andhigh needs placements costs from the current cohort of children,leaving the net pressure forecast of £1.676m.
Communication,Planning andPerformance(ref vii)
(381) (20)
Within the forecast overspend of £0.381m, HTST costs are forecastingan overspend of £0.487m, particularly due to increasing cost rates forstatutory SEND transport from the start of the new academic year.Further work is being undertaken with CET colleagues to review theHTST position, which is partially offset by underspends in other parts ofthe division totalling £0.106m.
Total (3,052) 1,007
Within the above forecast, £4.542m of the planned £4.985m savings for 2016/17 are on track (ref iv), with a further£0.276m at risk of slippage. The remaining £0.167m currently due to be unachieved is within LAC (ref iii), due to thereasons described above. The department continues to seek ways to bring these back on track or to mitigate them,and these figures include £0.107m of savings brought forward from the MTFP.
Capital Programme Summary – The £22.514m capital budget for 2016/17 is forecast to be underspent by £1.714m(ref xi). This is mainly due to slippage across several projects, principally within the Basic Needs Programme (ref x).Offsetting this, there is also some spend in advance on the Basic Needs Programme, as well as small overspendsfrom final payments and retention principally on the Etchingham project (ref ix) that will be met from 2017/18 funds.The overall 5 year programme ending in 2017/18 is on track and forecasted to stay within budget.
Page 29

APPENDIX 4
Performance exceptions(Q1 – Red and Amber RAG rated targets, and amendments
Q2-4 – RAG status changed to Red, Amber, Green, and amendments)
Performance measure Outturn 15/16 Target 16/1716/17 RAG Q2 16/17
outturnNoterefQ1 Q2 Q3 Q4
Priority – Helping people help themselves
% of annual SEND review meetingswhere the child gave their view and/orparticipated
90.1% 90% G A 83.2% i
Priority – Keeping vulnerable people safe
Rate of children with a Child ProtectionPlan
43.8 41 G A 42.7 ii
Savings exceptions(Projected - Red = will not be delivered but may be mitigated; Amber = on track to deliver but not in
the year (& may be mitigated); Green = on track to deliver in the year)
Service description2016/17 (£'000) – Q2 Forecast
Noteref
Target Achieved Slipped UnachievedSavingsEarly Help 2,071 2,007 107 -Children's Support Services (including Music, Watersports,DofE and Safeguarding quality assurance)
309 350 23 -
Home to School Transport 173 173 - -Locality Services 992 846 146 -Specialist Services 138 138 - -Looked after Children 884 717 - 167 iiiYouth Offending Team 124 124 - -SLES 171 171 - -ISEND 123 123 - -Total Savings 4,985 4,649 276 167Variations to Planned SavingsEarly achievement of Early Help (£44k) and SupportServices (£63k) savings brought forward
- (107) - -
Permanent Variations 0 0 0 0Total Permanent Savings & Variations 4,985 4,542 276 167
Temporary Variations 0 0 0 0Total Savings with Variations 4,985 4,542 276 167 iv
Page 30

APPENDIX 4
Revenue budget
DivisionsPlanned (£000)
Q2 2016/17 (£000)Noteref
Projected outturn (Over) / under spendGross Income Net Gross Income Net Gross Income Net
Central Resources 3,099 (7,237) (4,138) 2,843 (7,237) (4,394) 256 - 256Early Help and SocialCare
58,365 (11,508) 46,857 59,799 (11,947) 47,852 (1,434) 439 (995) v
Education and ISEND 74,730 (6,530) 68,200 75,490 (5,614) 69,876 (761) (916) (1,676) viCommunication, Planningand Performance
20,248 (4,306) 15,941 20,782 (4,460) 16,322 (534) 154 (381) vii
DSG non Schools - (62,256) (62,256) - (62,256) (62,256) - - -Schools 173,885 (173,885) - 173,885 (173,885) - - - -Total Children’sServices
330,326 (265,721) 64,605 332,799 (265,398) 67,401 (2,473) (323) (2,796) viii
Capital programme
Approved project
Total project –all years (£000)
2016/17 (£000)
Noteref
In year monitor Q2 (£000)Analysis of
variation (£000)
Budget Projected BudgetActualto date
Projected2016/17
Variation(over) /under
budget
(Over) /underspend
Slippageto future
year
Spendin
advance
ASDC (Aiming High ShortBreaks: Disabled children)
477 477 13 1 13 - - - -
St Peters Chailey 26 30 - 4 4 (4) (4) - -
Mobile ReplacementProgramme
7,392 7,412 150 55 168 (18) (20) 2 -
Etchingham School 7,492 7,564 - 69 72 (72) (72) - - ix
St Mary Magdalene -retention
- 6 - 6 6 (6) (6) - -
Shinewater School - roof - - - 39 - - - - -
Family Contact 341 341 38 2 38 - - - -
House Adaptations forDisabled Children's Carers
1,255 1,255 294 60 74 220 - 220 -
Schools Delegated Capital 928 928 928 159 928 - - - -
Universal Infant FreeSchool Meals
1,961 1,961 689 445 579 110 - 110 -
Early Years 2 Year Oldgrant
3,031 3,031 257 43 117 140 - 140 -
Czone replacement 230 230 147 32 147 - - - -
Basic Need Programme 43,537 43,435 19,998 9,748 18,654 1,344 102 1,353 (111) x
Total CSD Gross 66,670 65,820 22,514 10,663 20,800 1,714 0 1,825 (111) xi
Page 31

APPENDIX 5
Communities, Economy & Transport – Q2 2016/17
Summary of progress on Council Priorities, issues arising, and achievements
Summary of successes and achievements – 126 online learning courses were completed in our libraries, helpingpeople to improve their skills. 27 apprentices have been recruited so far in 2016/17. We ran a work readinessprogramme, in partnership with Medway Youth Trust, Sussex Downs College and Costain CH2M, to recruit anumber of civil engineering apprentices. A Project Manager for the road safety project, which utilises £1m of PublicHealth funding, has been appointed and has begun developing a range of behavioural change initiatives aimed atreducing the number of KSIs on the county’s roads. Greenways, 2.5 miles of paths which run alongside the BexhillHastings Link Road and offer a safe route for pedestrians, cyclists and equestrians, opened in July 2016. TradingStandards made 29 positive interventions to protect vulnerable consumers. The Uckfield town centre improvementscheme, which includes widening and improving the pavement and new lighting, has been completed. Improvementsworks have also begun in Hailsham with new pedestrian crossings and changes to the road layout to deal withexpected increases in traffic and improve the area for pedestrians, the works are expected to be complete by the endof 2016/17.
Paragraphs marked (GS) below highlight important contributions to the East Sussex Growth Strategy.
East Sussex Growth Hub (GS) – The Lets Do Business Group has been awarded the contract to continue runningthe Business East Sussex service until 31 March 2018. The procurement process to invest the money secured bythe South East Business Boost project to expand and enhance the services offered by the Growth Hub is movingforward with a contract due to start in April 2017.
Inward Investment (GS) – One large and one small Grants and Loans Panels were held in Q2. During 2016/17grants and loans totalling over £870,000 have been provided to 27 businesses who expect to create 97 jobs in EastSussex. Locate East Sussex is currently working with 14 businesses which wish to relocate into the county.Alongside Essex County Council we submitted a bid on 20 September 2016 to the European Regional DevelopmentFund (ERDF). The funding will provide improved and expanded inward investment services for three years. We areexpecting a decision on the bid to be announced by the end of 2016/17.
Broadband (GS) – The list of initial areas to be connected to superfast broadband as part of our second contractwith BT has now been published and includes, amongst other areas, parts of Battle and Crowborough; a full list canbe found in the news section of www.esussex.org. At the end of September 2016 take-up of improved broadband inthose areas already connected was 32% against a benchmark target of 20%.The budget is slipping £7.9m in linewith the current expected deployment roll out and the account is £4.3m in credit following accruals for invoicesrelating to last year that have not yet been paid (ref x).
Online Learning in Libraries (GS) – 126 online learning courses were completed in our libraries in Q2. Theseincluded 80 Learndirect courses on IT, maths and English, and 46 Learn My Way courses. The increase in coursecompletions compared to Q1 2016/17 was due, in part, to the implementation of our new IT for You project whichaims to improve people’s IT skills. IT for You tutors are identifying people who attend their training sessions andreferring them on to Learn My Way courses, which is equipping people with enhanced IT skills (ref i).
Apprenticeships (GS) – A total of 27 apprentices have been recruited by the end of Q2 2016/17. 12 of these wererecruited by the Council, with nine at Costain CH2M, as per their commitments under the new Highways contact, andsix in schools. Three work readiness programmes were held in July and August with 35 young people attending tolearn basic skills needed in the workplace and learn more about apprenticeships. The retention rate for theapprenticeship programme is currently 93%. Due to the introduction of the Apprenticeship Levy in 2017/18 we areplanning to reduce the number of apprentices recuited in 2016/17, with a new cohort of apprentices due to start inMay 2017, as such we are proposing to amend the target for the number of new apprenticeships with the Council.Proposed amendment to target: from 56 to 46 (ref iii).
Cultural Destinations (GS) – The second stage of the Tourism South East research into tourism in East Sussexhas been completed and we are currently investigating ways to present the findings on ESiF. A bid for CulturalDestinations Round 2 funding has been submitted and we are expecting to hear the result of the bid in February2017. The bid includes funding to create a ‘Geocaching trail’ with caches created by artists focussed on the CoastalCultural Trail.
Queensway Gateway Road – Blackwell has been appointed as the main contractor for the road, site investigationhas been completed and construction of the haul road has begun.
Newhaven Port Access Road – We have continued discussions with the Department for Transport (DfT) on thebusiness case for the road and work has continued on preparing bids for funding. Work on the detailed design of therailway bridge and embankments which will form part of the road construction is due to start shortly. The tender forconstruction is due to take place in early 2017, with main construction expected to begin in summer 2017. The
Page 32

APPENDIX 5
budget has therefore slipped £4.4m (ref xiv).
Terminus Road, Eastbourne – Design work on proposals to relocate some of the bus stops from Cornfield Roadhas taken place. Consultation on the proposals and the tender for the construction works are due to take place bythe end of 2016/17, with work expected to begin in late 2016/17 or early 2017/18 (ref ii) as a result these is £4.6m ofbudget slippage (ref xvi).
Road Safety – The Project Manager for the road safety project, utilising £1m of Public Health funding, has beenappointed and has begun developing a range of behavioural change initiatives aimed at reducing the number of KSIson the county’s roads. Driver error is identified as a contributory factor in 90% - 95% of collisions which result in aKSI so this is the main focus of the project. There were 76 KSI on the county’s roads between April and June 2016,reported a quarter in arrears, with six of these being fatalities. 10 of the KSI and one of the fatalities happened ontrunk roads which are managed by Highways England. The KSI total is lower than the corresponding period in 2015,104, and also 2014, 94. The figure is also below the 2005-2009 baseline quarterly average of 95 KSI.
Road Condition – We have continued to implement maintenance projects to maintain and improve the condition ofthe county’s Principal, Non-Principal and Unclassified roads, so far during 2016/17 we’ve delivered 110 schemes ofimprovements investing £7m in the county’s roads.
Trading Standards – Trading Standards officers made 29 positive interventions with victims of financial abuseduring Q2. During these visits the officers mentored, and were supported by, volunteers from Age Concern and theCitizens Advice Bureau, this is one example of how we are trying to improve our service to the public by working inpartnership with other organisations. We also took part in a fraud awareness event at NatWest bank during which weengaged with 22 customers and gave them advice on how best to protect themselves and vulnerable familymembers from financial abuse. Four call blockers were installed in people’s homes to try and prevent them fallingvictim to telephone fraudsters. The Rapid Action Team (RAT) made three interventions to prevent vulnerableconsumers becoming victims of rogue traders. The National Trading Standards Scam Team has also recentlyselected East Sussex as a pilot area to roll out the East Sussex Against Scams Partnership initiative (ESASP).
Revenue Budget Summary – At Q2 there is a forecast budget underspend of £83k and CET is expected to deliverall 2016/17 planned savings. The main overspends are in Waste where there is a combination of reduced landfill gasincome and increased waste disposal costs offset by reduced data system costs; and Fleet Management where areduction in the size of the fleet has resulted in a lower than expected level of recovery of insurance costs. Thisoverspend has been partly reduced by an underspend in Concessionary Fares, where successful negotiations haveprevented any price increases this year (ref vi). Several small underspends and additional income withinRegistration Services contribute to the Communities underspend (ref v). A pressure within Planning has arisen thisyear as a result of Government removal of the specific flood grant; in year, this has been mitigated by movementsacross the department but this will remain as a pressure in 2017/18. There are various small over and underspendsin some other services (ref iv, vii, viii).
Capital Programme Summary – There is a forecast expenditure of £59.6m against an approved programme of£79.9m. Of the variation £22.5m is slippage, £2.6m is spend in advance and £45k is underspend. The mostsignificant slippages are for: Broadband, £7.9m, (ref x); Terminus Road, £4.6m (ref xvi); and Newhaven PortAccess Road, £4.4m (ref xiv). There is also slippage on Hastings Library, £2.6m, which will be spent next year onfurniture, equipment, fees and retention (ref ix); East Area Depot, £1.2m, where discussions are still ongoing replans for the new site (ref xv); Bexhill to Hastings Link Road Complimentary Measures £636k, where measureshighlighted from the Bexhill to Hastings Link Road review will be implemented next year (ref xii); and in a number ofEconomic Development projects. Work on the North Bexhill Access Road is being accelerated to ensure we canutilise the available South East Local Enterprise Partnership Grant of £2m which is resulting in a spend in advance(ref xiii). The Bexhill to Hastings Link Road is projecting a total project forecast of £125.599m (ref xi); however thereis risk of further cost overruns and the position will be updated as more information becomes available.
Page 33

APPENDIX 5
Performance exceptions(Q1 – Red and Amber RAG rated targets, and amendments
Q2-4 – RAG status changed to Red, Amber, Green, and amendments)
Performance measure Outturn 15/16 Target 16/1716/17 RAG
Q2 16/17 outturn Note RefQ1 Q2 Q3 Q4
Priority – Driving economic growth
In partnership with Learndirectand other fundingorganisations provide onlinelearning (including skills for lifeand ICT courses) in libraries(subject to contract)
376 coursescompleted
250 coursescompleted(subject tocontractualreview, Q22016/17)
A G 126 i
Deliver pedestrianimprovements in TerminusRoad (Eastbourne) using‘Shared Space’ concepts tocoincide with opening of thenew Arndale Centre
Contractdocumentationprepared ready
for tenderprocess to
commence inspring 2016
ContinueConstruction
G A
Constructionprogrammed to start in
late Q4 2016/17 or earlyQ1 2017/18.
ii
Number of newapprenticeships with theCounty Council (ESCC andschools)
57
Amendmentrequested from:
56
to:
46
G AD27 (12 within the
Council, 9 with CostainCH2M, 6 in schools)
iii
Savings exceptions(Projected - Red = will not be delivered but may be mitigated; Amber = on track to deliver but not in
the year (& may be mitigated); Green = on track to deliver in the year)
Service description2016/17 (£'000) – Q2 Forecast
Noteref
Target Achieved Slipped UnachievedSavingsUse of the Parking Surplus to contribute towards thesupported bus network and concessionary fares budget
630 630 - -
Change to the management of the Corporate WasteReserve; efficiency improvements, with partners, of theservice; and maximising income generation opportunities
1,780 1780 - -
Restructure of Transport Hub teams 75 75 - -Efficiency savings in the Rights of Way and Countrysidesites service
50 50 - -
Development Control, Transport Development Control andEnvironment
20 20 - -
Libraries Transformation Programme - internal review of theLibrary and Information Service
425 425 - -
The Keep - improved staff utilisation across a range offunctions, increased income generation and reduction insinking fund
77 77 - -
Continued modernisation of the Trading Standards Service 60 60 - -Total Savings 3,117 3,117 0 0Variations to Planned SavingsNone - - - -Permanent Variations 0 0 0 0Total Permanent Savings & Variations 0 0 0 0None - - - -Temporary Variations 0 0 0 0Total Savings with Variations 3,117 3,117 0 0
Page 34

APPENDIX 5
Revenue budget
DivisionsPlanned (£000)
Q2 2016/17 (£000)Noteref
Projected outturn (Over) / under spend
Gross Income Net Gross Income Net Gross Income Net
Management andSupport
1,895 (153) 1,742 1,900 (185) 1,715 (5) 32 27 iv
Customer and LibraryServices
8,611 (2,411) 6,200 8,351 (2,151) 6,200 260 (260) -
Communities 3,772 (2,235) 1,537 3,550 (2,135) 1,415 222 (100) 122 v
Transport & OperationalServices
71,223 (36,325) 34,898 71,941 (36,918) 35,023 (718) 593 (125) vi
Highways 16,080 (1,135) 14,945 16,364 (1,419) 14,945 (284) 284 -
Economy 2,437 (1,745) 692 2,416 (1,759) 657 21 14 35 vii
Planning andEnvironment
2,885 (2,081) 804 2,831 (2,051) 780 54 (30) 24 viii
Total CET 106,903 (46,085) 60,818 107,353 (46,618) 60,735 (450) 533 83
Capital programme
Approved project
Total project –all years (£000)
2016/17 (£000)
Noteref
In year monitor Q2 (£000)Analysis of
variation (£000)
Budget Projected BudgetActualto date
Projected2016/17
Variation(over) /under
budget
(Over) /underspend
Slippageto future
year
Spendin
advance
The Keep 20,207 20,207 87 25 73 14 - 14 -
Rye Library 87 87 56 23 56 - - - -
Hastings Library 8,739 8,739 6,136 997 3,530 2,606 - 2,606 - ix
Newhaven Library 1,754 1,712 104 23 62 42 42 - -
Southover Grange(formerly The Maltings)
1,307 1,307 1,151 203 1,000 151 - 151 -
Library RefurbishmentProgramme
1,983 1,983 348 89 348 - - - -
Newhaven HouseholdWaste Recycling Site
2,041 2,038 4 - 1 3 3 - -
Travellers Site Bridies Tan 1,348 1,348 34 - 34 - - - -
Broadband 25,600 25,600 8,303 (4,278) 375 7,928 - 7,928 - x
Bexhill to Hastings LinkRoad
124,309 125,599 3,957 1,795 3,910 47 - 47 - xi
BHLR ComplimentaryMeasures
1,800 1,800 766 10 130 636 - 636 - xii
Reshaping Uckfield TownCentre
2,500 2,500 1,537 876 1,537 - - - -
Exceat BridgeMaintenance
500 500 467 4 67 400 - 400 -
Economic InterventionFund
7,945 7,945 1,403 809 1,686 (283) - - (283)
Catalysing Stalled Sites 916 916 316 21 316 - - - -
EDS Upgrading EmptyCommercial Properties
500 500 250 53 183 67 - 67 -
EDS Incubation Units 1,500 1,500 500 - 250 250 - 250 -
North Bexhill Access Road 16,600 16,600 6,190 897 8,190 (2,000) - - (2,000) xiii
Queensway GatewayRoad
6,000 6,000 4,581 74 4,381 200 - 200 -
Newhaven FloodDefences
1,500 1,500 800 - 800 - - - -
Sovereign Harbour/SiteInfrastructure
1,700 1,700 1,170 683 1,170 - - - -
Page 35

APPENDIX 5
Capital programme
Approved project
Total project –all years (£000)
2016/17 (£000)
Noteref
In year monitor Q2 (£000)Analysis of
variation (£000)
Budget Projected BudgetActualto date
Projected2016/17
Variation(over) /under
budget
(Over) /underspend
Slippageto future
year
Spendin
advance
LGF Business CaseDevelopment
196 196 196 9 196 - - - -
Swallow Business Park 1,400 1,400 895 550 895 - - - -
Newhaven Port AccessRoad
23,219 23,219 5,205 27 765 4,440 - 4,440 - xiv
Street Lighting Invest toSave
920 920 17 - 17 - - - -
Local SustainableTransport Fund - ESCoastal Towns
2,467 2,473 370 24 370 - - -
Local SustainableTransport Fund - Travelchoices for Lewes
1,196 1,196 2 2 2 - - - -
Eastbourne and HastingsLight Reduction
3,704 3,704 9 - 9 - - - -
Eastern DepotDevelopment
1,586 1,586 1,390 26 200 1,190 - 1,190 - xv
Newhaven Swing Bridge 1,548 1,548 35 1 35 - - - -
Waste LeachateProgramme
250 250 250 - 250 - - - -
Hastings and BexhillJunction Walking &Cycling Package
250 250 - - - - - - -
Eastbourne/SouthWealden Walking &Cycling Package
2,100 2,100 750 21 750 - - - -
Hastings and BexhillJunction ImprovementPackage
1,893 1,893 - - - - - - -
Hailsham/Polegate/Eastbourne SustainableTransport Corridor
2,600 2,600 - 84 250 (250) - - (250)
Integrated Transport - LTPplus Externally Funded
46,553 46,553 5,981 2,310 5,981 - - - -
Speed Management 2,948 2,948 122 4 122 - - - -
Terminus RoadImprovements
6,250 6,250 5,275 455 695 4,580 - 4,580 - xvi
Highway StructuralMaintenance
103,038 103,038 18,538 4,514 18,538 - - - -
Bridge AssessmentStrengthening
16,860 16,860 1,134 100 1,134 - - - -
Street Lighting - LifeExpired Equipment
7,902 7,902 867 30 867 - - - -
Rights of Way SurfaceRepairs and BridgeReplacement
4,617 4,617 437 304 465 (28) - - (28)
Total CET 460,333 461,584 79,633 10,765 59,640 19,993 45 22,509 (2,561)
Page 36

APPENDIX 6
Governance – Q2 2016/17
Summary of progress on Council Priorities, issues arising, and achievements
Reconciling Policy, Performance and Resources (RPPR) – An updated Medium Term Financial Plan (MTFP),which has been extended to 2020/21 to match the NHS 3+2 year model, was presented to Cabinet on 11 October2016. The updated plan highlighted the need to identify a further £6.5m of savings in 2017/18, bringing the total forthe year to £23.8m. On 18 October 2016 Cabinet agreed to accept the four year funding offer from the Government.The Government’s Autumn Statement, which was announced on 23 November 2016, and the local governmentsettlement announcement, which is expected in December, should provide further clarity of the Council’s futurefinancial outlook. The Annual Report, which highlights our progress against our priorities during 2015/16, waspublished on 29 September 2016. The Portfolio Plans for 2017/18 – 2019/20 are currently being drafted and will bereviewed Scrutiny Boards in December before publication at the end of March 2017.
Devolution – The Three Southern Counties (3SC) Leaders met in September and agreed to move to the moreformalised structure of a Leaders’ Board. The new Leaders’ Board agreed a joint response to Government on theretention of business rates to emphasise the opportunity to support wider devolution plans, and also to seekassurances that, as a minimum, the 3SC area would be no worse off.
Supporting democracy – During Q2 we supported 47 meetings including: one Council meeting; two Cabinetmeetings; 11 Lead Member meetings; 11 scrutiny committees and review boards; and 22 other committees andpanels. 70 school admission appeals were received and arranged, plus one school exclusion appeal hearing.
The Members’ ICT strategy and the ‘paperlight’ project have progressed during Q2. The Members’ ICT ReferenceGroup met in April and is continuing to oversee the practicalities of encouraging and supporting effective use of ICTby Members. The initial ICT Member support initiative in March was followed in Q2 with ongoing 1:1 coachingdesigned to enable Members to address individual technology issues. The result is that 17 Members are now triallingupdated ICT equipment in the form of ‘hybrid’ Windows 8 devices; with several others likely to trial this technologyover the coming months. 40 Members have confirmed that they are now aiming to be ‘paperlight’ at meetings usingeither ‘hybrid’ or iPad devices to access most papers.
In September 2016, Member Services received the final decision of the Local Government Boundary Commission forEngland on the review of electoral division boundaries for East Sussex. The team has distributed this information andis responding to a range of subsequent queries.
Preparations for the May 2017 county council elections have continued. Member Services has worked with theCouncil’s Communications team and the Local Government Association to develop a new website to explain whatbeing a councillor involves and coordinated a successful public pre-election information event held on 20 October2016; the event included a talking heads video featuring Members describing what is involved in being a councillor,followed by a Q&A session with a panel of five members. 30 members of the public attended the event and feedbackwas that they found it very useful. Member Services has also sent a survey to current councillors that begins theprocess of developing an effective induction programme for new county councillors from May 2017.
Legal Services – Orbis Public Law (OPL); which was launched on 4 April 2016, is our joint legal services partnershipwith Brighton and Hove City Council, and West Sussex and Surrey County Council’s; continues to progress witheffective working relationships established across the partners. A pathfinder project report, which was presented tothe OPL Exec Board on 14 October 2016, proposed a structure for the commercial law service from April 2017together with a series of actions required to align working practices in partners’ services. A project has also beenestablished to review court representation in child law proceedings across the four authorities with a view toincreasing in house representation and reducing expenditure on external barristers. Three of the four partners(including the Council’s Legal Services) have an identical case management system which helps in the transferring ofwork between partners. Preparations are in place for the fourth partner to have this system by the end of year.
We completed planning and highways agreements securing contributions of £195,000. We also collected debts duethe Council totalling £32,000 and agreed 18 Instalment plans with debtors. We also carried out a prosecution onbehalf of the Council for fraudulent use of a blue badge which resulted in a fine and costs being awarded.
The number of court hearings required ensure that members of the community who are mentally incapacitated areprotected continues to increase due to recent case law changes which have led to an increase in both welfare, andDeprivation of Liberty applications. In Q2 we made three further applications to the Court of Protection with a further13 cases waiting to be issued. We opened 21 new mental capacity pre-proceedings cases. We continued to adviseChildren’s Services in pre-proceedings cases to enable families to keep their children within the family. 31 new pre-proceedings cases were opened to Legal Services in Q2. Where it is not possible to resolve the matter and it isnecessary for care proceedings to be brought, we provide advice and representation to Children’s Services so thatvulnerable children are secured in a safe placement, whether with relations, in foster care, or by way of adoption.Recent changes to case law reducing the amount of time a child can be looked after by a local authority without aCare Order and a general increase in referrals mean 2015/16 saw an increase in care proceedings to 87, from 67
Page 37

APPENDIX 6
cases in 2014/15. The increases have been sustained in 2016/17 with a further 25 cases being issued during Q2. Theincrease in referrals has also been seen nationally. Despite the increasing workload, the average case duration duringQ2 was 26 weeks, matching government’s target.
Effective publicity and campaigns – As a result of an advertising campaign there were 12 enquiries from peopleinterested in providing supported lodgings to help young people live independently in Q2. Since 2015 this campaignhas saved the Council £189,000 by reducing spending on more expensive residential or agency care placements, aswell as providing more safe places for young people. We ran a digital marketing campaign in August to recruit newsocial workers, this campaign lead to 127 new ‘leads’, of people interested in social work in the county. This is thelatest step in a drive to recruit high-quality staff in a competitive marketplace.
Media work – There were 268 media stories relating to the Council in Q2 including publicity about funding for fuelpoverty, the upgrade of Hailsham town centre, improving exam results in East Sussex and celebration of OlderPeople’s Day. The team issued 47 press releases and handled 208 media calls during the quarter.
Web activity – The Council’s main website received 2.4 million page views during Q2 from 373,000 visitors. Themost visited areas were the library pages (especially the catalogue), jobs with the council and school term dates.
Third Sector support – The Voluntary and Community Sector (VCS) infrastructure service review has beencompleted and the recommendations are to go to the Lead Member for Community Services during Q3. The reviewwas able to identify health and wellbeing outcomes that can be included in the service delivery, while maintaining anoverall focus on the National Association for Voluntary and Community Action Quality Standards for InfrastructureService Delivery. The process for retendering the Healthwatch service and Independent Health ComplainantsAdvocacy Service has begun; the new contract will begin on the 1 April 2017.
World War 1 (WW1) commemorations – Our website (www.eastsussexww1.org.uk) hosts 180 stories and events,approximately 66% of which have been submitted or contributed to by the public. In Q2, 8,212 users viewed the site18,221 times; 115% more users and 60% more views than for the same period in 2015. Our WW1 Twitter profile nowhas 1,347 followers, who are regularly making contact to share their WW1 stories.
During Q2 we helped to organise a ceremony in Eastbourne to unveil a commemorative paving stone to honour WW1Victoria Cross recipient Nelson Carter, we also celebrated the WW1 project's second anniversary on 4 August. Duringthe second year of the project 25,212 users have viewed our website 56,076 times; and our story “The Day thatSussex Died”, which focuses on the Battle of the Boar's Head in June 1916, was viewed 5,403 times.
To mark our second anniversary, we also published digitised copies of the Sussex Daily News newspaper from 1914,1915, and 1916 We are publishing these digitised for newspapers each month of the war month by month alongsideour existing digitised newspapers. Since publishing the Sussex Daily News on 4 August 2016, the page has beenviewed 206 times. Images from the newspapers on our website have been used by a local artist and photographer tocreate a “Roll of Honour” for the Hastings and St Leonards areas. Kieron Pelling, who is a regular contributor to theproject with “Then and Now” images, has been using editions of the Hastings and St Leonards Pictorial Advertiser tocreate a photographic record of men from East Sussex who served and died in the war (www.ww1rollofhonour.co.uk).
On 8 July we participated in a WW1 event at The Keep in association with the First World War Co-ordinating Centrefor the South East “Gateways to the First World War” (http://www.gatewaysfww.org.uk/). This event was designed toshowcase to the public the resources available in East Sussex for research into the war. The project highlighted ourdigitised newspaper collection as well as explaining materials relating to military tribunals and conscription.
SE7 – In Q2, preparatory work started on the establishment of a Sub-National Transport Body (SNTB) for the SouthEast. If established, the Body will develop an overarching Transport Strategy, building on existing local transportstrategies, which will grant members of the Body greater and more direct influence over regional strategicinfrastructure priorities. The SE7 partnership has also provided a forum for the discussion of full Business RatesRetention, and a shared lobbying position for the South East has been developed, which emphasises that the newsystem should principally take into account the needs of an area.
Health and Wellbeing Board – On the 28 November 2016 the Board approved the new Health and WellbeingStrategy 2016-2019. As the East Sussex Better Together and Connecting 4 You Programmes continue to beestablished, subsequent action plans will be developed.
Revenue budget summary – At Q2 there is a forecast underspend of £86k; this is mostly due to staff vacancies. Thespend on Laptops for Members is lower than expected as hybrid machines are being reallocated. There has alsobeen some additional income from academies for school appeals.
Capital Programme Summary – The implementation of the committee management system (Modern.gov) and casemanagement system (Norwell) is complete with a £29k underspend. Any replacement laptops for Members areexpected to be funded from the revenue budget and the capital budget will slip to fund future replacement hardwareneeds.
Page 38

APPENDIX 6
Performance exceptions(Q1 – Red and Amber RAG rated targets, and amendments
Q2-4 – RAG status changed to Red, Amber, Green, and amendments)
Performance measure Outturn 15/16 Target 16/1716/17RAG Q2 16/17
outturnNoterefQ1 Q2 Q3 Q4
There are no Council Plan targets
Savings exceptions(Projected - Red = will not be delivered but may be mitigated; Amber = on track to deliver but not in
the year (& may be mitigated); Green = on track to deliver in the year)
Service description2016/17 (£'000) – Q2 Forecast
Noteref
Target Achieved Slipped UnachievedSavingsCommunication Service redesign and income generation 115 115 - -Legal Services income generation 25 25 - -Senior Management & Organisational Development 40 40 - -Total Savings 180 180 0 0Variations to Planned SavingsNone - - - -Permanent Variations 0 0 0 0Total Permanent Savings & Variations 0 0 0 0None - - - -Temporary Variations 0 0 0 0Total Savings with Variations 180 180 0 0
Revenue budget
DivisionsPlanned (£000)
Q2 2016/17 (£000)Noteref
Projected outturn (Over) / under spend
Gross Income Net Gross Income Net Gross Income Net
Corporate Governance 3,649 (69) 3,580 3,610 (91) 3,519 39 22 61
Corporate SupportServices
3,411 (573) 2,838 3,386 (573) 2,813 25 - 25
Senior management &Org Development
1,445 (364) 1,081 1,445 (364) 1,081 - - -
Total Governance 8,505 (1,006) 7,499 8,441 (1,028) 7,413 64 22 86
Capital programme
Approved project
Total project –all years (£000)
2016/17 (£000)
Noteref
In year monitor Q2 (£000)Analysis of
variation (£000)
Budget Projected BudgetActualto date
Projected2016/17
Variation(over) /underbudget
(Over) /underspend
Slippageto future
year
Spendin
advance
CaseManagement/CommitteeManagement System
115 86 32 3 3 29 29 - -
Laptops for Members 42 42 42 - - 42 - 42 -
Total Governance 157 128 74 3 3 71 29 42 0
Page 39

APPENDIX 7
Strategic Risk Register – Q2 2016/17
Ref Strategic Risks Risk Control / Response RAG
4
HEALTH
Failure to secure maximumvalue from partnership workingwith the NHS. If not achieved,there will be impact on socialcare, public health and healthoutcomes and increased socialcare cost pressures. This wouldadd pressures on the Council'sbudget and/or risks to otherCouncil objectives.
Implementation of East Sussex Better Together Programme by ESCCand Hastings and Rother CCG and Eastbourne, Hailsham and SeafordCCGs to transform health and social care in the county and deliver theBetter Care Fund plan to improve outcomes for East Sussex residents,with robust governance arrangements reporting to County Council andHealth and Wellbeing Board. Programme will develop the plan for aclinically and financially sustainable health and social care system inEast Sussex. There will also be targeted use of the Better Care Fund tobetter integrate health and social care and contribute to whole systemtransformation.
In High Weald Lewes Havens the Connecting 4 You Programme hasnow been established to improve health and social care outcomes forresidents. The Programme will have implications for managementcapacity and for the Medium Term Financial Plan. The RPPR processwill be used to manage this risk and associated implications.
The Sustainability and Transformation Plan for Sussex and East Surrey(STP) was submitted in June. Work to develop and deliver the plan isongoing. Nine working groups have been formed covering: Acuteprovision (including mental health); workforce; primary and communitycare provision; digital improvement, estates; provider productivityimprovement, communication and engagement and governance. Thenext submission is due mid-September.
R
7
SCHOOLS
Failure to manage the expectedsignificant reduction in resourcesfor school improvement from2017/18 and the potentialimpacts of changing governmentpolicy on education, leading toreduced outcomes for children,poor Ofsted reports andreputational damage
•Develop and implement a transition plan so the Standards and LearningEffectiveness Service and schools are prepared for the changes tofunding and education policy. This includes:
-Implementing a service restructure to remove direct delivery of schoolimprovement and further develop commissioning model of schoolimprovement
-Continue to build relationships with academies and sponsors, includingthe Diocese of Chichester, ensure a dialogue about school performance,including data sharing.
•Continue to work with academies and maintained schools through theEducation Improvement Partnerships to develop system leadership,school to school support and to broker partnerships.
• Continue to broker support to academies to address any performanceconcerns and investigate the feasibility of trading some LA schoolimprovement services with all schools on a full cost recovery basis.
•Where academies do not appear to be accessing appropriate support,bring this to the attention of the DfE, who may exercise their interventionpowers.
•Continue to build a relationship with the Regional SchoolsCommissioner to ensure the work of the RSC and the LA do notduplicate and that schools have the support they need.
R
8
CAPITAL PROGRAMME
Failure to deliver capitalprogramme outcomes on-timeand on-budget, impacting on theCouncil's ability to support localeconomic growth.
The Council has a five year capital programme in place which reflectsCouncil priorities. This is updated annually and monitored as part of theReconciling Policy, Performance and Resources (RPPR) process.
In April 2015, a high level Capital Programme Management Review wascommissioned with a recognition that we need to not only set firm targetsfor the next year of the programme, but set indicative targets for thefollowing years and start to focus on shaping the 2018-2023 capitalprogramme. The brief set out that there needs to be shift of focus fromcapital programme ‘monitoring’ to capital programme ‘management’ inorder to improve forecasting and scheme scheduling and planning.
R
Page 40

APPENDIX 7
Strategic Risk Register – Q2 2016/17
Ref Strategic Risks Risk Control / Response RAG
1
ROADS
Wet winter weather, over recentyears has caused significantdamage to many of the county’sroads, adding to the backlog ofmaintenance in the CountyCouncil’s Asset Plan, andincreasing the risk to theCouncil’s ability to stem the rateof deterioration and maintainroad condition.
The additional capital maintenance funding approved by Cabinet in 2013has enabled us to stabilise the deterioration in the carriageway networkand improve the condition of our principle road network.
The County Council’s asset management approach to highwaymaintenance is maintaining the overall condition of roads, despite recentwinter weather. The preventative approach to the maintenance of theCounty’s highway network is being further rolled out across all highwayasset types, including highway drainage.
The new highways contract, which commenced on the 1st May,introduced a more preventative approach to highway drainage with theintroduction of routine drainage ditch and grip* maintenance. We arealso continuing with our targeted approach to gully cleansing, anddeveloping a drainage strategy targeting flooding hotspots.
*A highway grip is a shallow ditch connecting the road edge to theroadside ditch. Its purpose is to drain rain water from the highway intothe roadside ditch.
A
5
RECONCILING POLICY,PERFORMANCE &RESOURCE
Failure to plan and implement astrategic corporate response toresource reductions,demographic change, andregional economic challenges inorder to ensure continueddelivery of services to the localcommunity.
We employ a robust Reconciling Policy, Performance and Resources(RPPR) process for business planning. We have adopted acommissioning approach which means evaluating need and consideringall methods of service delivery, which includes working with partnerorganisations to deliver services. The Council Plan sets out targets for a'One Council' approach to deliver our priorities and is monitoredquarterly. The plans take account of known risks and pressures,including demographic changes, to design mechanisms to deliver theCouncil’s priorities. The result of the EU referendum has introducedgreater uncertainty in the Government’s policy direction, legislativeprocess and spending plans. The RPPR process will be used to monitorthe situation and keep members informed of any changes which affectthe plans in order that mitigating action can be taken.
A
9
WORKFORCE
Stress and mental health arecurrently the top two reasons forsickness absence across theCouncil, potentially leading toreduced staff wellbeing, reducedservice resilience, inability todeliver efficient service and / orreputational issues.
A range of initiatives and interventions to support managers and staff inthis area are being taken forward. In particular, we have confirmed ourcommitment to the mental health ‘Time for Change’ pledge as well aslaunching our ‘5 weeks to wellbeing’ campaign.
In considering stress absences, new arrangements have beenimplemented whereby an OH nurse makes direct contact withemployees who are off sick with stress to offer support. In addition, amanager who has an employee off sick with stress receives targetedadvice and guidance on how to support and manage the absence. Moregenerally, the Lead clinical OH Physician has been commissioned todeliver a session for managers on supporting staff with mental healthand stress issues. In addition, a new course ‘Resilience throughMindfulness’ is now available as part of the corporate trainingprogramme to support staff increase their resilience.
A
10
RECRUITMENT
Inability to attract high calibrecandidates, leading to limitedrecruitment choices thereforelack of the expertise, capacity,leadership and/or innovationrequired to deliver services andservice transformation.
Work with departments is underway to understand key areas ofrecruitment difficulty. Strategies to address this will include refreshingand publicising more clearly the benefits of working in the public sectorand ESCC in particular, as well as understanding the different marketswe are competing in. To support this, different talent attractionapproaches will be developed ranging from apprentices and internsthrough to highly experienced individuals.
A
Page 41

APPENDIX 7
Strategic Risk Register – Q2 2016/17
Ref Strategic Risks Risk Control / Response RAG
6
LOCAL ECONOMIC GROWTH
Failure to deliver local economicgrowth, and failure to maximiseopportunities afforded byGovernment proposal to allocateLocal Growth Funding to SouthEast Local EnterprisePartnership, creating adversereputational and financialimpacts.
All projects that have secured capital funding from the South EastEngland Local Enterprise Partnership (SELEP) have either now beencompleted, or construction is underway. Following the March 2016 callfrom Government for LEPs to prepare a 3rd round of Local GrowthFunding, SELEP submitted its formal submission to Government at theend of July 2016. All of the projects that Team East Sussex consideredwere included, with a cumulative value of around £30m to deliver arange of infrastructure projects including a conferencing facility atDevonshire Park, Eastbourne and the first phase of the NewhavenEnterprise Zone. We expect to hear the outcome of the bids in theChancellor's Autumn Statement which is expected at the end ofNovember 2016.
In spite of the continued uncertainty around availability of EU funding inthe current programme period, work has continued on developingpartner bids across the SELEP. Bids to augment the Business EastSussex service, and to match local contributions in East Sussex for thedelivery of inward investment services have been developed, along witha number of others.
Whilst continuing to develop pipeline projects for subsequent rounds ofLocal Growth Funding via SELEP, in the longer term European fundingwill not be available, so we are increasingly looking towards the potentialoffered through the devolution of skills and infrastructure funding to the 3Southern Counties and the emerging Sub-National Transport Board, thelatter of which will enable the direct engagement with Highways Englandand Network Rail to influence their investment programmes.
A
2
ORDINARY RESIDENCE
Risk from other areas placingclients in receipt of social careservices in East Sussex, andtransferring to ESCC thecommissioning, caremanagement and fundingresponsibility for the individualas a result of a successfulOrdinary Residence claim.
Dedicated Ordinary Residence Panel set up. The Panel discusses andagrees strategic and legal responses to Ordinary Residence claims fromand to other Local Authorities, and directs reporting content. Panelmembers contact other Local Authorities directly where appropriate, andinstruct Legal Services representation (including Counsel, andapplications for Secretary of State determination) on behalf of ESCC.
Continued awareness raising for ASC operational staff (and particularlySocial Care Direct) in line with published guidance on OrdinaryResidence, resulting in earlier case referrals to Ordinary Residenceteam. Guidance for frontline staff was written and issued followed bypanel members visiting all ASC Operational teams to deliverpresentation and Q&A. OR Inbox established to provide advice to staffand monitor all known incoming/outgoing OR queries and claims.
Regular information gathering and reporting to DMT on all OrdinaryResidence case referrals and financial projections.
A
Page 42

Report to: Cabinet
Date of meeting:
13 December 2016
By: Director of Communities, Economy and Transport
Title: Shadow Sub-National Transport Body for the South East
Purpose: To provide an update on proposals regarding the establishment of a shadow Sub-National Transport Body for the South East
RECOMMENDATIONS: Cabinet is recommended to: (1) agree to establish and join a shadow Sub-National Transport Body (SNTB) for the South East,
known as Transport for the South East (TfSE); (2) delegate authority to the Leader to agree the shadow arrangements, including the shadow
constitution, terms of reference and membership, and to appoint the representative of the County Council on the shadow Body;
(3) receive a further report following an appropriate period of time reviewing the operation of the shadow arrangements and prior to entering into a formal Sub-National Transport Body; and
(4) provide investment of £20,000 to develop the constitutional arrangements and the Transport Strategy and to provide officer support to the shadow Body.
1 Background Information 1.1 The Cities and Local Government Devolution Act 2016 makes provision for the establishment and constitution of Sub-National Transport Bodies (SNTBs) for any area in England (outside of Greater London). 1.2 An SNTB can prepare a Transport Strategy for an area which would set out proposals for the promotion and encouragement of safe, sustainable, integrated, efficient and economic strategic transport facilities and services to and from the area of the SNTB. It would enable key partners to work in a more focused and prioritised way to improve the ability of our residents, businesses and visitors across the area to travel. 1.3 The establishment of an SNTB must cover the whole area of at least two relevant Authorities. Each of the following is considered a relevant authority for the purposes of the relevant legislation:
A Combined Authority;
An Independent Transport Authority;
A County Council; and
A Unitary Authority. 1.4 An SNTB is a body corporate, which will only be established by the Secretary of State if it is considered that:
its establishment would facilitate the development and implementation of transport strategies for the area; and
the objective of economic growth in the area would be furthered by the development and implementation of such strategies.
1.5 Development of the SNTB and the Three Southern Counties (3SC) devolution deal are progressing in parallel. The SNTB will be the mechanism to unlock further significant funding for strategic transport which would be in addition to the detail of a 3SC devolution deal. The SNTB remit includes influence over the strategic network (previously the responsibility of Highways England and Network Rail) whereas the 3SC will focus on improvements to the local network. The development of the SNTB, to be known as Transport for the South East (TfSE), and the 3SC devolution deal are aligned (TfSE will support delivery of some of the 3SC objectives), but they are not dependent on one another to be realised. The 3SC County Councils would, as Transport Authorities, become members of the SNTB and, subject to the
Page 43
Agenda Item 6

establishment of a 3SC Combined Authority (CA), the CA would be the method of representing the relevant Transport Authorities. 1.6 An SNTB, if established, will want to take into account the voice of business in developing its proposition. The Local Enterprise Partnerships (LEPs) are the main mechanism to do this. The arrangements in the Midlands and the North have included some representation from the LEPs. 2. Proposal for a Sub-National Transport Body for the South East 2.1 The South East Seven (SE7) Councils (East Sussex, West Sussex, Hampshire, Kent and Surrey County Councils, Brighton & Hove City Council and Medway Council) and the LEPs that represent the area have been in officer level discussion about the establishment of a TfSE. Discussions will commence with the Hampshire Unitary Councils and the Solent LEP about joining TfSE. 2.2 The proposed area would fulfil the Department for Transport’s requirements that SNTBs need to be large enough to allow the genuine strategic consideration and planning of transport infrastructure and do not create “white space” where Authorities are excluded from participation in sub-national arrangements. 2.3 The proposed TfSE would aid Authorities in securing influence over and to holding to account national and regional infrastructure providers, helping to ensure the infrastructure required to support continuing economic growth. TfSE would see Government, South East Transport Authorities and/or Combined Authorities and LEPs working together with Highways England, Network Rail and port, airport and bus operators. TfSE would require strategic transport providers to take account of its priorities. The new powers would enable all the key partners to work in a more focused and prioritised way to improve the ability of our residents, businesses and visitors across the area to travel. This will include easing congestion, improving key routes, resilience on our networks and opening up housing and growth opportunities. 2.4 TfSE would provide a mechanism for the area to speak with a strong, common voice on transport infrastructure and provide a single platform for strategic transport and infrastructure issues, giving partners greater, and potentially direct, influence over decisions that are currently made elsewhere. Its key outcome will be the development of a single, strategic transport infrastructure framework which would align the investment programmes and priorities from key agencies, such as Highways England and Network Rail, and also the LEPs. 2.5 TfSE presents the opportunity to support and deliver growth plans across the area through the development of a long-term strategic programme which identifies a comprehensive package of transport measures to make the South East more competitive. It would complement the work of the LEPs in the delivery of their Strategic Economic Plans and support the delivery of Local Plans. 3. Development of a Shadow Sub-National Transport Body for the South East 3.1 Prior to the establishment of TfSE, it would be helpful to establish the Body in shadow form to help develop a strong strategic partnership. Establishing TfSE in shadow form would demonstrate commitment from the constituent Authorities to working collaboratively and provide reassurance to Government about the strength of the partnership. It would also carry out two main roles during this period:
work on developing an overarching Transport Strategy for the area; and
develop responsibilities and accountabilities for TfSE, including governance and assurance arrangements.
3.2 If partners agree to establish TfSE in shadow form, it is proposed to establish an SNTB Leaders’ Board to determine and agree the constitutional arrangements ensuring the governance reflects the aspirations of the Local Authorities. Subject to discussions with partners in Hampshire, the SNTB Leaders’ Board would consist of the SE7 Councils, Portsmouth City Council, Southampton City Council, the Isle of Wight Council and the LEPs. The Board will agree the terms of reference, including governance and voting arrangements for consultation with wider partners.
Page 44

4. The Transport Strategy 4.1 The cornerstone of TfSE is the Transport Strategy. It will build upon existing Local Transport Plans and evidence already in place amongst the constituent Authorities, including the LEP’s Strategic Economic Plans and growth and infrastructure frameworks/studies being undertaken by a number of upper-tier Authorities. 4.2 The draft Transport Strategy would outline the ambition of TfSE and describe the vision for the South East in relation to the transport function of the area, including the effectiveness, efficiency and resilience of the existing network. It would include freight, ports, airports and other public transport modes. 4.3 The draft Transport Strategy, which will also outline the proposals to establish a full SNTB, would be subject to consultation, including where appropriate/applicable, engagement with Borough and District Councils. 5. Membership of the Shadow Sub-National Transport Body 5.1 The constituent Authorities of the shadow Body set out below will form the initial membership (subject to any future establishment of Combined Authorities):
Brighton & Hove City Council Kent County Council West Sussex County Council
East Sussex County Council Medway Council
Hampshire County Council Surrey County Council
5.2 Whilst these will be the initial member Authorities, it is desirable to broaden the membership to include all Transport/Highway Authorities in the area and we will therefore be seeking the agreement of the Isle of Wight, Portsmouth and Southampton Councils to become members. In addition, dialogue will be opened with the Berkshire Authorities to consider whether it is desirable for them to become members, particularly in light of the recent airport expansion decision. 5.3 It will also be essential to ensure that, as with the SNTB proposals elsewhere, business is suitably represented in the Leaders’ Board and we will work with the LEPs to determine how best that can be achieved. The report to Cabinet will recommend that authority is delegated to the Leader to determine the shadow arrangements which will include who the other members of the shadow Body should be. This will be agreed through a Leaders’ Board. As we progress towards a more formal Body and develop the necessary governance arrangements, we will also have to consider how we can take on board the voice of the Borough and District Council colleagues most effectively. 5.4 Transport for London (TfL) represents the most significant transport hub in the South and has significant economic impact resulting from their investment decisions. It is for this reason they will also be included as part of the membership of TfSE. However, in return, TfSE should make representation to become a member of the TfL Board. 5.5 Additional members of the shadow TfSE SNTB may be considered, as appropriate, on a case by case basis but, as a minimum, should include:
Department for Transport;
Highways England;
Network Rail; and
Airport, sea port, bus and train operating companies. 6. Resource Requirement 6.1 There is a resource requirement to establish TfSE and develop a draft Transport Strategy; set out and agree its responsibilities and accountabilities in consultation with members. 6.2 A resource will also be required to service TfSE; initially to develop the governance arrangements and later to support TfSE business. Resource will also be required to provide external professional advice and oversee the development of the draft Transport Strategy.
Page 45

6.3 It is estimated that appropriate support for the shadow SNTB and development of the overarching draft Transport Strategy would total £200,000 (£20,000 per Council). If approved by Cabinet, the East Sussex County Council contribution would be met from within existing budgets within Communities, Economy and Transport. 7. Stakeholder Engagement 7.1 Before progressing a proposal for an SNTB, the constituent Authorities must undertake a consultation on the boundary proposals and it is proposed that the shadow SNTB leads on this. 7.2 Public consultation is also required on the SNTB’s Transport Strategy prior to publication. 8. Timetable 8.1 It is anticipated that an SNTB could take up to two years before being confirmed by the Secretary of State. Subject to approval by constituent members, a potential timeline for developing TfSE and the Transport Strategy could be as follows:
2016/17
Discussions with DfT (ongoing);
Development and establishment of a shadow SNTB with partners; and
Development of Terms of Reference, governance arrangements and vision.
2017/18 Development of the Transport Strategy; and
Development of the formal proposal and consultation on the Strategy.
2018
Agreement to the proposal by Government;
Preparation of the Order establishing the SNTB; and
Parliamentary process and sign-off of the Order.
8.2 A shadow TfSE SNTB can run in parallel to the formal process of confirming an SNTB and establishment of the final Order. 9. Conclusion and Reason for Recommendation 9.1 The establishment of an SNTB and the development of a Transport Strategy would enable key partners to work in a more focussed and prioritised way to improve the ability of our residents, businesses and visitors across the area to travel. It would also aid authorities in securing influence over national and regional infrastructure providers, helping to ensure the infrastructure required to support continuing economic growth. 9.2 Cabinet is therefore recommended to agree to establish and join a shadow SNTB for the South East and to delegate authority to the Leader to agree the shadow arrangements including the shadow constitution, terms of reference and membership and to appoint the County Council’s representative on the shadow Body RUPERT CLUBB Director of Communities, Economy and Transport Contact Officer: Rupert Clubb Tel. No. 01273 482200 Email: [email protected] LOCAL MEMBERS All BACKGROUND DOCUMENTS None
Page 46

Report to: Cabinet
Date of meeting:
13 December 2016
By: Chief Operating Officer
Title: Expansion of Orbis partnership with reference to Brighton & Hove City Council
Purpose: To consider whether to expand the Orbis partnership to include Brighton & Hove City Council
RECOMMENDATIONS
Cabinet is recommended to:
1) approve, subject to the satisfactory completion of the assessments as set out in the report, to Brighton & Hove City Council (BHCC) joining Orbis as a founding partner and to BHCC joining the Orbis Joint Committee upon completion of the Inter Authority Agreement; and
2) delegate authority to the Chief Operating Officer, in consultation with the Lead Member for Resources, to:
a) determine whether the results of the assessment referred to above are satisfactory; and b) to take any actions necessary arising from or to give affect to the integration of BHCC in the
Orbis partnership including (but not limited to) agreeing the timings and terms of the integration, and the terms of the Inter-Authority Agreement (IAA) and any other Agreements the COO considers appropriate.
1 Background
1.1 Cabinet approved the Orbis three year Business Plan on 13 October 2015 that set out the roadmap to achieve integrated back office services with Surrey County Council. The business plan detailed the benefits of the partnership but also stated the ambition to grow and attract additional customers and potential partners.
1.2 Brighton & Hove City Council (BHCC) have been part of the initial and ongoing development of the Orbis Partnership and have always been offered the ability to be a founding partner along with East Sussex County Council (ESCC) and Surrey County Council (SCC). It was recognised that BHCC would not be able to progress initially at the same pace as ESCC and SCC and therefore Orbis have been supporting BHCC in assessing the fit of Orbis to BHCC vision and priorities
1.3 In December 2015, BHCC gained approval from their Policy, Resources and Growth Committee to join Orbis following a detailed options appraisal process. This decision was subject completion of a number of tests around savings and efficiencies that would be enabled in order to meet the BHCC medium term financial plans.
1.4 BHCC concluded these tests during the summer of 2016 and approval was gained at the Policy, Resources and Growth Committee on 13 October 2016 to proceed with their request for integration of BHCC services into the Orbis partnership.
1.5 The attraction of a new partner to Orbis in its first year of the Business Plan is both exciting and an endorsement of the partnership. Working in partnership provides further opportunities to deliver services in new and innovative ways to improve quality, resilience and to contribute to the financial challenges of each Sovereign Authority.
Page 47
Agenda Item 7

1.6 As a City Council and unitary authority, BHCC will enhance what Orbis can offer. They will bring more knowledge and expertise and provide further opportunities to share best practice across three Partners.
1.7 As well as working informally with BHCC with a view to BHCC joining the partnership, more formal arrangements already exist with BHCC through the Orbis Public Law partnership and the OPL Joint Committee of which BHCC are a full member.
2 Supporting information
2.1 Orbis set out its ambition to grow in the business plan stating the following: New partners have the ability to help shape and influence how services will be delivered in the future. They will have the opportunity to keep Orbis compelling, ensure it remains fit for purpose, ultimately benefitting from the established services and ways of operating. 2.2 Orbis is about creating a sustainable shared service delivered in the public sector with a strong public sector service ethos. It is strengthened through growing the business it delivers which enables greater collaborative buying power and streamlining of processes to provide better, more efficient services. Increasing Partners as well as customers provides for richer experience and knowledge. Opportunities
2.3 Additional partners will enhance the partnership and offer further opportunities in a number of key areas. For BHCC these opportunities have been identified as (but not limited to) the following:
The ability to retain services and funding within the public sector
Enhanced reputation for Orbis/sovereign partners
Greater economies of scale
Additional services not currently in the scope of Orbis (i.e. Revenues & Benefits)
Increased resilience through sharing and aligning resources
Opportunity to build a greater geographical presence which helps to support wider strategic aims such as collaboration and partnership working with Local Authorities and public and third sector bodies in the South East
The close proximity of Brighton to Lewes provides an opportunity to review the location of service delivery
Consolidation of IT systems leading to reduced cost of ownership and the ability to negotiate better deals
As a unitary authority BHCC has alternative approaches and expertise and will be a valuable addition to the partnership
A greater number of partners improves the ability for successful lobbying
The ability to share procurements/contracts to reduce costs Scale
2.4 Orbis currently has a net operating budget of circa £53m and approximately 1400 Staff. The addition of BHCC adds approximately another £20m to the net budget and increases the total staffing to just over 2000 FTE. Orbis was already the largest local government shared service in the UK with two partners, adding a third increases the scope and scale yet further. BHCC Joining Principles and Actions
2.5 BHCC has completed their assessment on whether it is advantageous for them to join the Orbis Partnership. Now Orbis will work with BHCC to complete the necessary assessments to better understand the implications of BHCC joining with a view to seeking to ensure that a number of key principles and requirements can be met. This work is best undertaken through working as though the extended partnership is in place.
Page 48

2.6 To complete this test and to ensure the process for BHCC joining the partnership is managed in the most effective way, a number of key principles and actions have been developed in conjunction with BHCC that will enable the test judgement to be made. These principles are detailed in appendix 1.
2.7 It is anticipated that the assessment will conclude that that the key principles and objectives will be met with BHCC joining. This expectation is based on the experience BHCC and Orbis have gained from our joint working over the last 18 months. However it is appropriate to complete this assessment. Once satisfactorily completed a new inter authority agreement will be signed. It is recommended that the consideration of the results of the assessment be delegated to the Chief Operating Officer in consultation with the Lead Member for Resources, likewise authority for agreeing the terms of the agreement (and any associated agreements) formalising the arrangements with BHCC. Service Integration
2.8 Orbis has an approach to delivering service integration. This approach is attached at Appendix 2. All services in Orbis and BHCC are as a minimum in the Co-ordination and Collaboration phase that is identified in Appendix 2. 2.9 The journey to fully integrating services (convergence phase in appendix 2) takes time. It is important to build relationships and ensure that different approaches, delivery models and sovereign requirements are all understood.
2.10 Each service within Orbis is currently undertaking an assessment of how BHCC will converge and therefore fully integrate into their model for how their service is organised and delivered. For some services the convergence phase will commence immediately as the opportunity already exists (e.g. Finance) whilst for other services more time is required on co-ordination and collaboration.
2.11 In the short term this may lead to some services being run in parallel under the appropriate Orbis Service Lead, whilst developing detailed plans for integration of the service at an agreed later date.
Governance (Member & Officer)
2.12 The Orbis partnership operates under a Joint Committee structure that was approved by Cabinet in February 2015. 2.13 The Joint Committee currently comprises 2 but can expand to up to six executive (Cabinet) Members, an equal number being appointed by the Leader of ESCC and the Leader of SCC from among their respective executive (Cabinet) Members. 2.14 The Joint Committee has delegated to it by each Council the authority to oversee discharge of the Services. 2.15 The purpose of the Councils of establishing the Joint Committee was to facilitate an effective joint approach between the Councils in delivering the Services. The Joint Committee will provide performance management for Orbis to ensure value for money assurance to the Councils. 2.17 BHCC appointed a Lead Member to observe the Joint Committee in April 2016; once the Inter Authority is signed BHCC will become a full member of the Orbis Joint Committee with voting rights. 2.18 Officer Governance is steered by the Inter Authority Agreement which specifies the appropriate structure for effective decision making and to provide appropriate oversight of operations. Appendix 3 shows the governance arrangements for Orbis.
2.19 A review of the governance will be undertaken to incorporate BHCC and to ensure arrangements are fit for purpose.
Page 49
Benefits
2.20 A review of the Orbis benefits and investment case will be required to assess the impact of BHCC joining the partnership; this work will be undertaken as part of developing the Inter Authority Agreement.
2.21 Brighton & Hove City Council set a savings target in excess of 30% for the services in scope of Orbis over the next 4 years (2016/17 to 2019/20). To put this in context all other BHCC services not in the scope of Orbis also have a target for cost reductions of 30% over the same period. See appendix 4 table 2 for details on proposed efficiencies for the services in scope for BHCC. 2.22 The savings targets for BHCC include managed on behalf of budgets (e.g. IT infrastructure) and are front loaded for 2016/17 and 2017/18, the current plan for integrating budgets with BHCC is April 2018. When these two factors are taken into consideration there is significant alignment of savings targets for Orbis and BHCC.
2.23 For reference, the Orbis Business plan detailed financial benefits of £8.3m that the partnership would deliver for East Sussex and Surrey Council’s over a three year period, more details of these savings can be found in appendix 4 table 1. 2.24 Subject to the results of the assessments referred to in para 2.5 and 2.6 above, officers are confident that the addition of BHCC into the partnership will not put current plans at risk; in fact a third partner actually creates additional opportunities to explore the potential for increased efficiencies 2.25 Part of the next phase of work with BHCC will be to develop a joint financial plan to explore and identify opportunities for further efficiencies, increased quality of services and resilience for the three sovereign partners. Risk Management and implications
2.26 A full assessment of the impact and associated risks of BHCC joining Orbis will be undertaken as part of the process to formally approve BHCC joining Orbis. 2.27 An initial risk assessment has been undertaken and a number of key risks have been identified, these can be found in Appendix 5.
Legal Implications
2.28 An Inter Authority Agreement (IAA) will be developed and agreed for three partners, the IAA will form the legal basis for the partnership and will ensure each sovereign authority is protected.
2.29 As with the existing IAA between ESCC and SCC, the IAA for three partners will include a number of key elements:
Governance
Services in scope
Budgets
Indemnities and Liabilities
Branding
Staff Management Protocol
Disputes
Termination
Consultation
2.30 The approach taken to develop the integrated service has been collaborative; co-designed with the Orbis Leadership Team and wider Orbis Leadership community together with staff and Unions. 2.31 The consultation has included:
Trade unions
Page 50

Orbis Staff
Orbis Leadership community
Chief Executives and extended Leadership of both authorities 2.32 Engagement with Trade Unions (TU) has remained strong and positive to date. Unions in BHCC have been included in joint TU meetings with regional leads and ESCC/SCC unions, these meetings are held on a regular basis to ensure an ongoing and open dialogue and the ability for any concerns or challenges to be raised. 3. Conclusion and reasons for recommendations
3.1 It is recommended that agreement be given to BHCC joining the Orbis partnership and Joint Committee, subject to the completion of the necessary assessments. Consideration of the assessments and the decision as to whether the results are satisfactory is delegated to the Chief Operating Officer in consultation with the Lead Member for Resources together with finalising the terms and timings of their inclusion. By proceeding to a more detailed planning and delivery phase it will enable a robust approach to be developed and provide the necessary powers of delegation to progress at the pace required. KEVIN FOSTER Chief Operating Officer Contact Officer: Kevin Foster Tel. No. 01273 481412 Email: [email protected]
LOCAL MEMBERS All BACKGROUND DOCUMENTS Orbis Cabinet Report and Business Plan – October 2015
Page 51

Appendix 1 – Partner Joining Principle Actions
a) Brighton & Hove City Council (BHCC) are a founding partner of Orbis which means they have the ability to;
Help shape the partnership
Inform the design of future service delivery in order to place customers at the heart of service design
Play an active role in service transformation to meet requirements of local authority clients
Benefit from co-developing the shape of services
b) BHCC joining Orbis will not slow down the delivery of the business plan or efficiencies for any partner, any proposed deviations will be
taken to the Orbis Joint Committee
c) A focused period of activity will take place October - December 2016 that will provide further clarification on timelines and plans for integrating BHCC into the partnership
d) Work to commence immediately with colleagues in BHCC to engage staff around what it means to be part of Orbis, this will include initiatives such as creating change champions and the opportunity to be involved in development programmes
e) A service by service assessment to be undertaken to identify timescales and processes for integrating teams
f) An Inter Authority Agreement to be created and signed by three partners by April 2017. This will form the legal basis and contract for the partnership
g) A founding partner enhances the Orbis brand and adds further credibility to attracting future potential partners and customers
h) Impact of key policies across the partners to be reviewed and understood, with a specific focus on:
Pay
Change/Restructure
i) Work towards integrated budgets from April 2018
Page 52
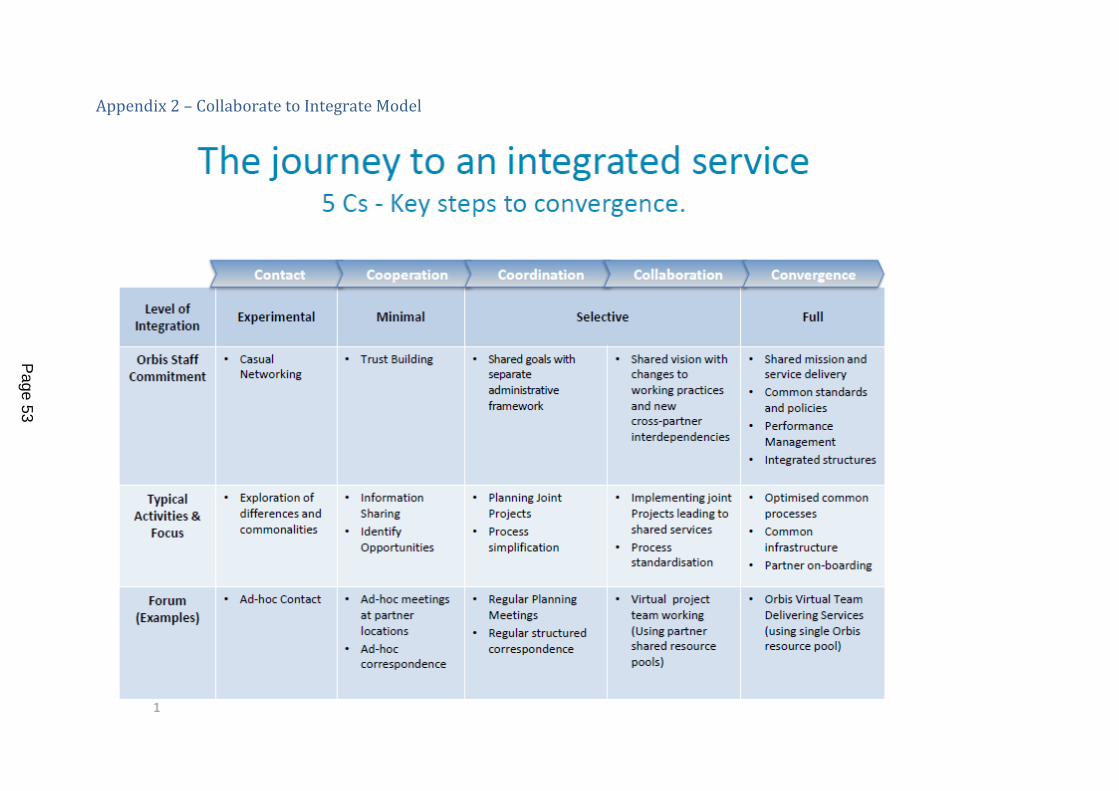
Appendix 2 – Collaborate to Integrate Model
Page 53

Appendix 3 – Orbis Governance Structure
Page 54

Appendix 4 – Cost Alignment
Table 1 –Orbis Business Plan Benefits (October 2015)
Table 1 Net Business Plan Savings
2016/17 2017/18 2018/19 Total
£000 £000 £000 £000
Operating Budget
Property -56 -540 -1,200 -1,796
ICT 145 -879 -1,118 -1,852
HR -85 -400 -625 -1,110
Finance -121 -525 -994 -1,640
Business Operations -581 -244 -125 -950
Procurement 10 -245 -15 -250
Total Net JOB Growth & Savings* -688 -2,833 -4,077 -7,598
Managed Budgets - IMT -280 -110 -110 -500
Pension Fund -182 0 0 -182
Total Business Plan Net Savings -1,150 -2,943 -4,187 -8,280
*JOB = Joint Operating Budget
Page 55

Table 2 details projected BHCC savings targets
* The gross budget for Property & Design is significantly greater than the net budget, so this distorts the savings % against the net budget. ~ Revenues & Benefits not included here as savings are currently under review and there is no comparator data.
TABLE 2 Projected Brighton & Hove Savings
Net
Budget
2016-17 Actual 2016-17 2017-18 2018-19 2019-20 Total over 4 years
£'000 £'000 % £'000 % £'000 % £'000 % £'000 %
Property &
Design * 3,689 789 21.4% 1,148 31.1% 409 11.1% 406 11.0% 2,752 74.6%
Audit 615 64 10.4% 57 9.3% 38 6.1% 21 3.3% 179 29.1%
Financial
Services ~ 4,017 322 8.0% 375 9.3% 248 6.2% 135 3.4% 1,080 26.9%
Procurement 514 69 13.4% 48 9.3% 32 6.1% 17 3.3% 165 32.2%
HR & OD 2,957 335 11.3% 278 9.4% 183 6.2% 99 3.4% 895 30.3%
ICT 7,049 434 6.2% 647 9.2% 428 6.1% 234 3.3% 1,742 24.7%
Total 18,840 2,013 10.7% 2,554 13.6% 1,337 7.1% 912 4.8% 6,815 36.2%
Page 56

Appendix 5 – Risks
Risk Description & Implication Mitigation
A third partner joining Orbis
delays or impacts the delivery
of savings or integration of
services
• The need to revise service
design and timelines to
accommodate requirements
of third partner
• New Partners have the
potential to impact on
Business-As-Usual operations
of Orbis through increased
scope of services, capacity
needs and political
requirements.
• Clear plans and timescales in place for integration
and savings
• A full risk/impact assessment to be undertaken and
action taken to avoid/minimise impact
• Revised benefits and invest case created for three
partners
Changes in the business
strategies of Orbis Founding
Partners affect the ability for
Orbis to deliver Services
effectively
• There is the possibility that if
Partnership Strategies of the
Founding Partners diverge,
significant changes to the
operating model of Orbis will
be required in order to avert
undermining operations of
Orbis.
• If Partnership Strategies are
aligned with other authorities,
choices in how Orbis
strategies are implemented
• A Joint Committee structure has been agreed, which
ensures that all Partners have oversight on the
running of Orbis.
• Orbis Leadership will be visible to the sovereign
authorities to present impact of sovereign decisions
on Orbis and to action those decisions.
• A clear defined exit strategy for Orbis partners will
be developed as part of the Inter-Authority
Agreement (IAA).
Page 57
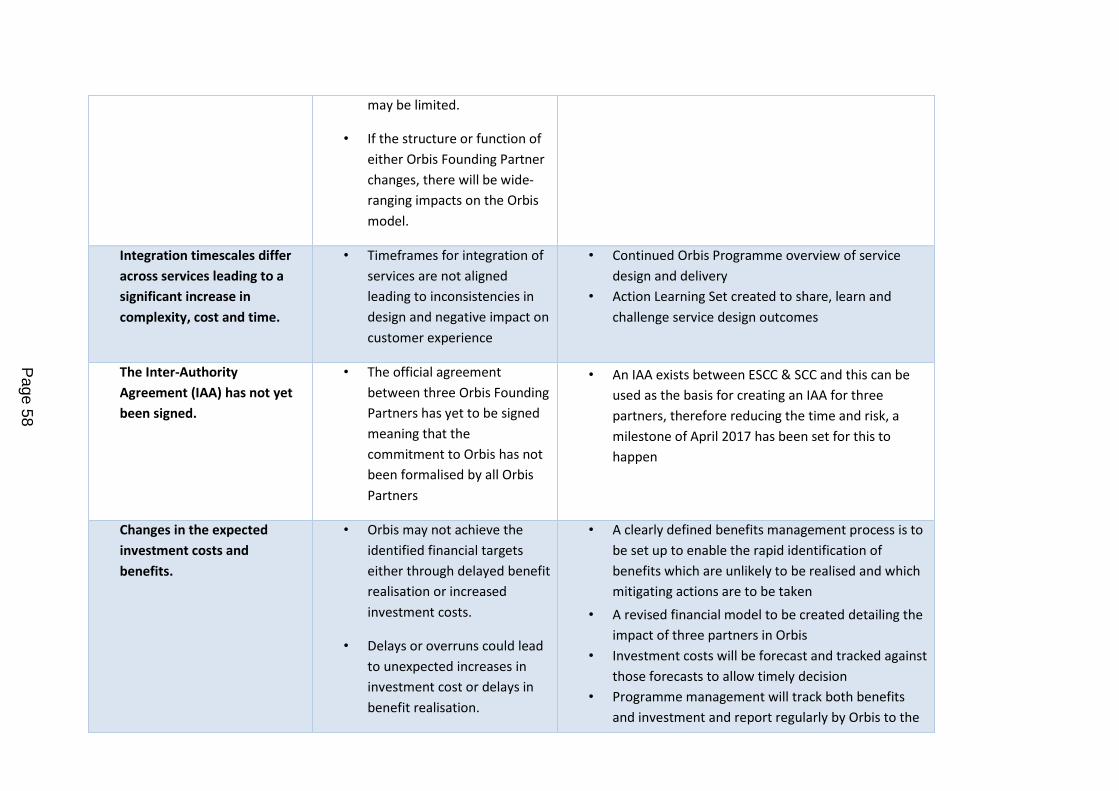
may be limited.
• If the structure or function of
either Orbis Founding Partner
changes, there will be wide-
ranging impacts on the Orbis
model.
Integration timescales differ
across services leading to a
significant increase in
complexity, cost and time.
• Timeframes for integration of
services are not aligned
leading to inconsistencies in
design and negative impact on
customer experience
• Continued Orbis Programme overview of service
design and delivery
• Action Learning Set created to share, learn and
challenge service design outcomes
The Inter-Authority
Agreement (IAA) has not yet
been signed.
• The official agreement
between three Orbis Founding
Partners has yet to be signed
meaning that the
commitment to Orbis has not
been formalised by all Orbis
Partners
• An IAA exists between ESCC & SCC and this can be
used as the basis for creating an IAA for three
partners, therefore reducing the time and risk, a
milestone of April 2017 has been set for this to
happen
Changes in the expected
investment costs and
benefits.
• Orbis may not achieve the
identified financial targets
either through delayed benefit
realisation or increased
investment costs.
• Delays or overruns could lead
to unexpected increases in
investment cost or delays in
benefit realisation.
• A clearly defined benefits management process is to
be set up to enable the rapid identification of
benefits which are unlikely to be realised and which
mitigating actions are to be taken
• A revised financial model to be created detailing the
impact of three partners in Orbis
• Investment costs will be forecast and tracked against
those forecasts to allow timely decision
• Programme management will track both benefits
and investment and report regularly by Orbis to the
Page 58

Joint Committee.
The implementation of the
integrated Orbis model will
involve a high degree of
change and has the potential
to impact Business-As-Usual
services.
• Changes will be identified
across all Business Service
functions; services will need
to continue to operate whilst
changes are being
implemented.
• There may be a ‘dip’ in service
performance whilst the
transition to the new
operating model is completed.
• A clearly defined implementation and change
management approach is required to support the
transition to the new way of operating.
• A robust communications strategy will help
articulate how service levels may change during the
transition period and support expectations
management.
Some benefits will have
significant reliance upon
technology solutions.
• Technology solutions will have
a high number of
dependencies and be time
consuming to implement.
• Failure to progress with the
technology needs can impact
the timing or realisation of
benefits and cause an increase
in investment cost due to
overruns.
• Integration of Target Operating Model and IT
implementation strategies enables the identification
of dependencies at Orbis level
• Application of common governance structures
provides visibility of IT progress across all current
programmes of work, including sovereign authority
change programmes, Orbis and any potential ERP
(SAP) replacement
Differing terms and conditions
can destabilise the working
environment.
• When staff from different
organisations come together,
differences in pay or terms
and conditions, such as
• Development of Pay and Reward Strategy across
three partners
• Clear communication of expectations for staff based
in various Orbis locations and the implications for
Page 59

holiday and pension
entitlements, can create a
disjointed work force
this
• Regular consultation and engagement with
recognised trade unions
Staff and stakeholders
resisting change.
• Current staff and stakeholders
may not appreciate the need
for change and attempt to
deter the change from
happening
• This will cause delays to the
realisation of benefits and
higher costs due to overrun
• Development of stakeholder map and identification
of risks
• Ensure clear communication of the benefits of Orbis
to staff and stakeholders
• Utilise a communications strategy to engage staff
and stakeholders in a positive manner and keep
them up to date on Orbis successes
Threat to Orbis’ reputation
from poor performance.
• If the quality of service
degrades either during or
after implementation then the
reputation of Orbis as well as
that of the sovereign
authorities will suffer
• Ensure effective programme management is in place
at each service line to track performance of services
before, during and after changes occur
Page 60

Report to: Cabinet
Date of meeting:
13 December 2016
Report by: Director of Children’s Services
Title: Annual Progress Report of Looked After Children’s Services 1 April 2015 – 31 March 2016
Purpose: To outline the performance of the Looked After Children’s Service between 1 April 2015 to 31 March 2016
RECOMMENDATION: The Cabinet is recommended to note the contents of the report 1. Background 1.1 The Annual Report is attached as appendix 1. At present the full comparative national data is still not available and so an update will be provided to Cabinet so that local performance can be assessed in that context. 1.2 The services for Looked After Children (LAC) are supported via core funding from the Children’s Services Authority budget, a small proportion of the Dedicated Schools Grant and the Pupil Premium for additional education support for children 2. Supporting information 2.1 The performance data shows that good performance was at least maintained in most areas during 2015/16. There were some improvements in adoption timeliness, and notably in care leaver performance in relation to suitable accommodation and education employment and training (EET). But there was a dip in performance for NI63 (3 or more placement moves), nonetheless it remains below the national rate for 2014/15. The service worked with more children during the course of 2015/2016, and the churn rate was higher than for the previous year (179 2014/15, 185 2015/16). However this did not impact on the overall rate of LAC which remained unchanged. Educational outcomes for LAC continued to improve, especially at KS4. 2.2 This report was presented to the Corporate Parenting Panel on the 14 October 2016. The Members noted the content and accepted the recommendations. Furthermore they commended the service for the consistently good service delivered. They noted that the LAC service performed consistently well during 2015/16, with a continued emphasis on the safe reduction of the number of LAC in the system and the delivery of efficiency savings following the end of both Thrive funding and of the Adoption Reform Grant. 2.3 There have been particular challenges this year as placement capacity reached saturation point in the South East. At times when no in-house placements were available, the placement team found the market unable to respond to the demand for placements of any kind, even in the independent sector. It will be imperative to continue to ensure that the right children are in the right placements for the right amount of time and that we secure the best outcomes possible within the available resources.
Page 61
Agenda Item 8
2
3. Recommendations and Reasons for them 3.1 Cabinet is recommended to note the contents of the report. Stuart Gallimore Director of Children’s Services Contact Officers: Sally Carnie Head of Looked After Children’s Services 01323 747197 Teresa Lavelle-Hill Head of Looked After Children’s Services 01323 747197 Local Members: All BACKGROUND DOCUMENTS: None List of Appendices Appendix 1 - LAC Annual Report 2015 – 2016 Listed within appendix 1 are the following annexes: Annex 1 - Annual Progress Report of East Sussex Fostering Service 1 April 2015 – 31 March 2016 Annex 2 – Annual Progress Report of East Sussex Adoption and Permanence Service 1 April 2015 – 31 March 2016 Annex 3 – Independent Reviewing Officer’s Annual Report 2015 – 2016 Annex 4 – The Virtual School Annual Report including the use of Pupil Premium 2015-2016 Annex 5 - Missing People Annual Report Annex 6 – LAC Mental Health Service Audit 2015 -16
Page 62

3
Appendix 1 1 Looked after Children Trend Data
1.1 On 31 March 2016 there were 544 Looked After Children (LAC) in ESCC; this represents a reduction of 4 children (0.7%) as compared to 2014/15 and a rate of 51.7 per 10,000 population. This is below the Income Deprivation Affecting Children Index (IDACI) expected rate (a measure in terms of population profiles and deprivation levels) of 56.6 and the 2015 England average of 60.
1.2 There is a strong link between rates of LAC and the rate of children subject to Child Protection (CP) Plans. The rate of children subject to CP plans has shown a marginal reduction from 44.5 per 10,000 in 2014-15 to 44.2 in 2015/16. This is still higher than the IDACI expected rate of 40.7. All IDACI data is based on national Children in Need (CIN) and LAC data for 2015, as the 2016 data is not yet available. 1.3 The LAC data only ever gives a snapshot of the children moving in and out of the system at a fixed date each month/year and considerable activity sits beneath it. The data is referred to as ‘churn’. This cohort of children will come in and out of the system within the year, or some may come in and stay whilst others leave. Behind this group sits the cohort of children who are stable for at least one year. It has been calculated that there is a churn figure of 185 for 2015/16 which, added to the total number of LAC, equates to the service working with 729 children. This shows that the service worked with more children overall during the course of 2015/2016, and that the churn rate was higher than for the previous year (179 2014/15, 185 2015/16). 1.4 There was a significant increase in admissions to care from 159 in 2014/15 to 190 during 2015/16, and there were some interesting changes to the trends for each age group. The number of 0 – 5 year olds admitted to care increased during this period from 77 in 2014/15 to 94 in 2015/16, but there was a reduction in admissions of 6 -12 year olds from 48 in 2014/15 to 43 in 2015/16, and an increase in admissions of children aged 13+ from 34 in 2014/15 to 53 in 2015/16. 1.5 At year end in 2015/16 there was an overall increase in the number of LAC discharged from care, 191 from 185 in 2014/15. The number of 0 - 12 year olds discharged from care has fallen slightly from 121 in 2014/15 to 117 in 2015/16. This was made up of 88 0-5years olds and 29 6-12 year olds. There was a further increase in the 13+ age group from 64 discharged in 2014/15 to 74 in 2015/16. 1.6 These data together show a picture of an overall increase in the numbers of LAC worked with during the course of the year. There was a high level of activity with the cohort of 0-5 year olds given the increased admissions and discharges. This is reflective of timely social work to protect children, with 56 children becoming subject to Adoption, Special Guardianship or Residence Orders and 32 returning to their birth family at discharge. The 5-12 year old cohort showed marginally fewer admissions to care, and significantly fewer discharges, producing a net increase over the course of the year. This is reflective of ESCC’s permanence policy in that when children become looked after they tend to remain in permanent placements. The 13+ cohort showed both higher numbers of admissions and discharges, and this relates primarily to relatively small increases of children in a range of categories: children remanded to care, unaccompanied asylum seeking children (UASC) and a number of complex, chaotic children often subject to CSE risks. The increased statutory activity both in relation to admission and discharge plans was particularly challenging given the reduced social work workforce. 1.7 In terms of UASC, at year end ESCC was caring for 17 children, mainly male and over 16. With an additional 11 having ongoing support needs as care leavers. These young people have usually arrived in a clandestine way via Newhaven or been
Page 63

4
found elsewhere in East Sussex. During 2016-17 we have also assumed responsibility for 4 children placed by Kent within East Sussex and for a further 5 placed with ESCC via the national dispersal scheme. A number of young people have disappeared from care placements before age assessments can be completed to determine whether they are indeed children.
1.8 The end of year snapshot data showing LAC placements were as follows (2015 figures in brackets):-
with foster carers 440 (433) of these: in house carers 313 (305) kinship carers 37 (34) agency carers 90 (94) placed for adoption 31 (43) in supported lodgings 7 (6) in ESCC children’s homes 18 (21) in agency children’s homes 26 (21) in agency special schools 1 (5) placed with own parents 16 (11) youth custody/secure unit 5 (5) Hospital/NHS establishment 0 (0)
2. Fostering
2.1 As at 31st March 2016 there were 440 LAC living with foster carers. Of these, 350 were living with ESCC approved foster carers and 90 with agency carers. This represented a decrease of 4% of LAC in agency placements compared to the previous year. In addition to the 350 LAC placed with in-house foster carers, 32 children were living with Special Guardians who were previously ESCC foster carers. In effect the service was supporting 400 children in family placements against 386 in 2014/15.
2.2 The number of foster carers approved in 2015/16 was 26 households offering 44 placements, a marked reduction from 2014/15 where 41 households were approved offering 62 placements. This downturn is reflective of a national trend across all fostering agencies be they Local Authority, Independent, or Voluntary sector. There were generally fewer households applying to become foster carers and those who were already approved were reporting that they were being asked to care for more traumatised children with increasingly complex behaviours. This in turn, resulted in carers feeling very stretched and exhausted. Fostering capacity reached saturation point in the South East and at times the placement team found the market unable to respond to the demand for fostering placements of any kind, even agency carers. During 2015/16 the in-house service suffered a loss of 24 foster carers largely for personal reasons and due to changes in circumstances. This represented 8% of the total in-house resource and although it was an increase from 2.3% in 2014/15, it continued to be below the national average of 12%. This trend will need to be carefully monitored, given the limited supply and reported exhaustion of carers. 2.3 Supported Lodgings carers provided a number of step-down placements for children from in-house residential and foster placements. There were 32 households providing 49 placements in 2015/16 for young people across the county. In addition, 16 new households were recruited, 9 were approved by year end, and a further 6 were still underway. Four of the supported lodgings providers were reapproved during the year with a dual registration (hybrid) this enabled them to offer more flexible care placements to younger more complex/challenging young people before they became 16.
Page 64

5
Please see Annex 1 for full Fostering Service Annual Report 2015-16. 3. Physical and Mental Health
3.1 As anticipated in the 2014/15 LAC Annual Report, the performance of initial health assessments during 2015/16 remained poor due to the significant disruption to the service provided by East Sussex Healthcare Trust (ESHT) during 2014 and the performance measure being based on a rolling year. The proportion of initial health assessments completed on time, fell again from 53% in 2014/15 to 49% in 2015/16. However, 62% were completed in 21-24 days and 75% in 25-30 days. As of November 2014, Kent Health Care Trust (KHCT) was commissioned to deliver a fully integrated offer encompassing: initial health assessments, the designated doctor role, adoption medicals and medical services to both the Adoption and Permanence, and Fostering Panels. Delivery of the health care plans continued to be commissioned through ESHT via the LAC nursing team. Despite the performance issues with timeliness there was very positive feedback regarding the quality of the written health assessments and of the overall medical advice. 3.2 The LAC Mental Health Service (LACMHS) received 70 new referrals during the year 2015/16, all of which were accepted and an initial consultation offered. A number of children were also seen urgently due to the severity of the symptoms they presented such as suicidal thoughts and/or serious self-harm, depression or psychotic symptoms. In addition, there was also a cohort of LAC in receipt of on-going therapeutic support such as individual therapy, dyadic therapy (child and carer together), systemic therapy and/or consultation to the foster carer and network. At one point there were 99 LAC in receipt of this service. LACMHS also provided:
Two Therapeutic Parenting Groups (working with the carers of 16 young people, their Social Workers and Supervising Social Workers)
Weekly consultation to Homefield, Broderick, Hazel Lodge residential children homes
Weekly consultation to the Care Leavers service
Monthly ‘drop in’ surgeries to the Fostering Service and each of the three LAC teams
Two Participation days for service users (children, young people and their carers)
Mental health services commissioned by NHS England to Landsdowne Secure Unit, including sessions of a child and adolescent psychiatrist, a clinical psychologist, and mental health nurse.
3.3 The work of LACMHS was highly regarded by carers, professional staff and children alike. However, the increasing complexity of the LAC cohort and the demand for intensive on-going support to LAC and their networks resulted in increased waiting times for access to on-going therapeutic interventions. During 2016/17 consideration should be given to extending this service. For a more detailed quantitative and qualitative analysis see Annex 6 LAC Mental Health Service Audit 2015 -16, LAC in Fostering and Residential.
Page 65

6
4. Adoption and Permanence 4.1
2011/12 2012/13 2013/14 2014/15 2015/16
1. Number of Children Adopted
16
44
57
43
45
2. Number of Adoption Matches (children)
41
53
50
56
32
3. Number of Permanent Fostering Matches (children)
26
10
10
7
10
4. Number of East Sussex Adoptive Matches (children)
28
44
40
33
26
5. Number of Consortium Adoptive Matches (children)
2
1
1
6
0
6. Number of Inter-Agency Matches (children): Permanence: Adoption:
10 11
2 8
4 9
3 17
2 6
7. Number of Prospective Adopters Approved (households) *
21
39
44
50
41
8. Number of Permanent Carers Approved (households)
7
4
8
4
2
9. Number of Children Approved for Adoption up to 31st March 2016
78
69
52
43
53
10. Number of children Approved for Permanence up to 31st March 2016
33
17
24
26
14
11. Number of Approved Adopters waiting to be Matched
12
16
17
20
22
12.Number of Disruptions presented to Panel: Permanence: Adoptions:
1 (during intros)
1
1
0
0 1
4.2 The number of children with a plan for adoption increased from 43 in 2014/15 to 53 in 2015/16. This scale of increase was not reflected nationally; indeed many Adoption Agencies reported that the number of approvals for adoption had significantly decreased in favour of Special Guardianship Orders. Locally however, the courts responded to a clear Government directive which suggested that adoption should continue to be promoted at the earliest opportunity as a realistic permanence option for young children. During 2015/16 28 children were matched with local adopters, with only 2 sibling pairs placed out of county giving a total of 32 children matched in the 12 month period. There was also a marked rise in the number of sibling groups with complex permanence plans, some of which involved adoption for
Page 66

7
the younger children and permanent foster placement for the older children. Furthermore, the Adoption Scorecard issued by the Department for Education (DfE) evidenced that ESCC placed children for adoption more speedily than the national average, achieving placement in 223 days. 4.3 During 2015/16 the agency received 287 enquiries about adopting with ESCC and 81 requests were received for registration of interest forms. The conversion rate from enquiry to registration was 28%, which is a drop compared to 34% in 2014/15, however this still compares well with the Coram BAAF suggested national figures of around 10%. There was also a decrease in the number of adopter households approved from 50 in 2014/15 to 41 in 2015/16. In line with the national picture, there was an increasing mismatch between adopters wishes compared with the profile of children needing placement. Many of the children identified with a plan for adoption had experienced domestic violence, trauma and loss, and were likely to have ongoing and complex therapeutic, post adoption support needs. During this period it was enormously beneficial to apply to the Adoption Support Fund with an identified therapeutic support package for adopters and their families. East Sussex made 64 applications to the fund and received payment of £219,965.80. During 2015/16 the Government announced a commitment to maintain this fund until the end of this parliament. 4.4 The individually commissioned therapeutic support was complemented by the AdCAMHS service which offered dedicated therapy and consultation to adopters and their children throughout 2015/16. There has been a significant increase in demand for this service and despite being commissioned to work with 40 families, at year end there were 68 cases open to the service. In addition, the excellent links with the Virtual School provided adoptive families with support for educational and school-based issues, in order to promote the educational achievements of adopted children within East Sussex. The extensive support offered within East Sussex, both pre and post adoption enabled a significant number of older children with more complex needs to be placed for adoption who would otherwise have remained in fostering placements. The service has continued to be ambitious for this cohort and robust in family finding. Please see attached Annex 2 for Adoption Service full Annual Report. 5. Residential Services 5.1 In October 2015 Lansdowne Secure Unit (LSU) was inspected and the home was judged to be “Good” overall. A further interim inspection during 2015/16 however was not carried out. It should be noted that the children placed in LSU continued to display violent and extreme self-harm and suicidal behaviours. This impacted significantly on the staff team in terms of increased levels of stress, absence and vacancy levels. During 2015/16 there was a significantly higher number of East Sussex LAC placed in LSU than in previous years. This was the result of a number of children in the group homes exhibiting high levels of risk taking behaviours particularly in relation to sexual exploitation, drug misuse, mental health issues and violence. 5.2 In April 2015, the DfE introduced revised Children Homes Regulations 2015 and new Quality Standards 2015. Simultaneously, Ofsted introduced a new framework for the inspection of children homes. From September 2015, 3 ESCC children’s homes received an overall rating of “Requires Improvement” by Ofsted. A robust residential improvement plan was put in place and this, together with a challenging dialogue with Ofsted, resulted in these 3 group homes receiving “Improved Effectiveness” in the following interim inspections. This was the highest rating possible in an interim inspection. During 2015/16, a high proportion of young people with extremely complex and challenging needs were placed in the 3 group homes. At times, these
Page 67

8
young people displayed risk taking behaviours which resulted in increased levels of physical and verbal abuse to both young people and staff. This is turn impacted on the service being able to maintain sufficient staffing levels in the homes due to either injury or stress. Vigorous efforts were made to recruit sufficient staff but it remained a challenge throughout the year. This was further compounded by Ofsted’s expectations that all temporary and agency staff were required to have a QCF Level 3 qualification prior to being deployed. Additional management capacity was agreed and recruited to by year end to try and manage the service more robustly. Staff and managers worked closely with other professionals including colleagues from CAMHS, U19 Substance Misuse, Youth Offending Team, Missing People, WISE (What is Sexual Exploitation?), and the Virtual School. 6. Care Leavers Service 6.1 At the end of 2015/16, the service was working with 226 care leavers; 70 16 - 17 year olds and 156 18 - 24 year olds. A significant proportion of this cohort presented highly complex behaviours with a range of challenging safeguarding issues. In addition, the service piloted a ‘through care’ model whereby those younger LAC with complex challenging behaviours were referred to the service at an earlier stage with the aim of establishing a relationship with a care leaving specialist, to help plan a more seamless transition into independence. There had been some success with this model at year end, with a number of children who responded very well to the different approach and more empowering ethos. However, it was not formally evaluated at that point. 6.2. The Care2Work strategic multi agency board has implemented a range of developments designed to improve the skills of care leavers and to ensure a successful transition into education and employment. The action plan was reviewed in 2015/16 and it was noted that there had been a significant impact on this cohort of young people. The programme for 2016/17 will aim to consolidate and embed the good practice already established. 6.3 As of 31st March 2016 of LAC who were in continuous care for at least 12 months before sitting their GCSE examinations 89% of 16 – 17 year olds (year 12) were in education, training and employment (EET); 78% of 17 - 18 year olds (year 13) were EET. This cohort included care leavers who had significant learning disabilities and who were managed within the Transition Service. Of all eligible care leavers, 22% (24/107) were at University. This performance showed improvement in every measure. 6.4 The number and range of accommodation options for care leavers remained static during 2015/16. Particular emphasis was placed on encouraging care leavers to remain with their foster carers in “Staying Put” arrangements either in foster care or in Supported Lodgings. Supporting People providers continued to offer a range of Foyer type accommodation across the county – Newhaven, Eastbourne, Hastings and Hailsham. In addition, the partnership between the Care Leavers Service and YMCA Eastbourne, continued to support a 3 bedroom flat which is staffed at evenings and weekends. However, providing sufficient accommodation for the most chaotic and challenging young people continued to be problematic and on the 30th March 2016 there were 5 care leavers living in Bed and Breakfast accommodation, 3 were aged 16 - 17, and 2 were over 18 years old. Clearly this type of accommodation is unsuitable for care leavers. It is only used in emergency situations where the young person has completely exhausted all alternative accommodation options. Any decision to place a young person in emergency accommodation must be authorised by an Assistant Director and accompanied with a clear risk assessment. A wrap around package of support is identified and regularly reviewed whilst suitable alternative accommodation is sought. Most young people are only in bed and breakfast for short periods.
Page 68

9
7. Performance 7.1 The 2015/16 national data has not yet been published by the DfE, therefore this section does not benchmark the performance of ESCC against other local authorities and statistical neighbours. However, these data do show that good performance was at least maintained in most areas during 2015/16. There were some improvements in adoption timeliness, and notably in care leaver performance in relation to suitable accommodation and EET. But there was a dip in performance for NI63 (3 or more placement moves), nonetheless it remains below the national rate for 2014/15. The evidence in section 1, which demonstrated increased numbers of LAC worked with during the year did not impact on the overall rate of LAC which remained unchanged. Educational outcomes for LAC continued to improve overall, especially at KS4. Good progress was supported by additional home tuition funded through Pupil Premium. For overall performance of LAC educational outcomes in 2014 please see The Virtual School Annual Report 16th October 2015 Annex 4 and Independent Reviewing Officer Annual Report in Annex 3. The indicator value has improved/increased with a and where it has dipped with a
Indicator Ref
Description 2015/16 Value
2014/15 Value
2014/15 Eng
2013/14 Value
2013/ 14 Eng
2012/13 Value
2012/13 Eng
NI 58 Emotional & Behavioural Health of children in care
13.4
15.4
13.9 15.1
13.9 14.3
14.0
Adoption Scorecard 1
Average time between a child entering care and moving in with its adoptive family, for children who have been adopted. (3 year average)
517 days
520 days
593 days
536 days
628 days
538 days
647 days
Adoption Scorecard 2
Average time between an LA receiving court authority to place a child and the LA deciding on a match with an adoptive family (3 year average)
223 days
190 days
223 days
199 days
217 days
168 days
210 days
Adoption Scorecard 3
% of children who wait less than 16 months between entering care & moving in with their adoptive family (3 year average)
59%
57%
47% 54%
51% 53%
49%
Page 69

10
Indicator Ref
Description 2015/16 Value
2014/15 Value
2014/15 Eng
2013/14 Value
2013/ 14 Eng
2012/13 Value
2012/13 Eng
NI62 Placements 1
Number of children looked after with 3 or more placements during the year
10.8%
9.7%
10.0% 8.9%
10.9% 12.4%
11.3%
NI63 Placements 2
% of LAC under 16 who've been lac for 2.5 years or more & in the same placement for 2 years or placed for adoption
64.0% ↔
64.0%
68.0% 57.4%
66.5% 57.5%
66.8%
Placements 3
% of LAC at 31st March placed outside LA boundary and more than 20 miles from where they used to live
9.4%
10.0%
12.5% 8.7%
12.2% 9.2%
12.2%
Leaving Care 2 * see note below
% of former relevant young people aged 17-21 who were in education, employment or training
62.4%
52.6%
47.8% 55.0% 45.0% n/a n/a
Leaving Care 3
% of former relevant young people aged 17-21 who were in suitable accommodation
81.7%
74.3%
80.7% 85.3% 77.6% n/a n/a
Thrive PI 9
Rate of Children looked after per 10,000 population aged under 18
51.7 ↔
51.7
60.0 54.5
60.0 57.3
59.8
PAF C19 Average of the % of children looked after who had been looked after continuously for at least 12 months who had an annual assessment and their teeth checked by a dentist during the previous 12
92.8%
92.6%
87.7% 93.5%
86.4% 89.9%
84.7%
Page 70

11
Indicator Ref
Description 2015/16 Value
2014/15 Value
2014/15 Eng
2013/14 Value
2013/ 14 Eng
2012/13 Value
2012/13 Eng
months.
PAF C81 Final warnings, reprimands and convictions of lac
3.8% ↔
3.8%
5.2% 1.8%
5.6% 5.7%
6.2%
* Leaving Care 2 Indicator – this is calculated using data collected at the time of each young person’s 17th, 18th, 19th, 20th or 21st birthday. 8. The Virtual School 8.1 The Virtual School for LAC maintained a core staffing establishment during 15/16, supporting the education of all East Sussex LAC, care leavers and adopted children wherever they were educated. The Pupil Premium enabled the school to enhance its provision to schools, carers, individual LAC and recruit a bank of specialist tutors. In addition, the Head of the Virtual School fostered excellent working relationships across the council and the local community which resulted in LAC being prioritised for a range of complementary services. For further information on the work of the Virtual School see The Virtual School Annual Report (Annex 4) 9. LAC who are Missing from Care and who are at risk of Children’s Sexual Exploitation (CSE) 9.1 Progress continued to be made both on a strategic and operational level for all children missing and at risk of CSE. The Multi Agency Children’s Sexual Exploitation (MACSE) Action Plan 2015/16 demonstrated significant progress throughout the year in relation to the four strands of Prevent, Prepare, Protect and Pursue, and was reported regularly to the LSCB. MACSE operational practice guidance was developed for all staff and managers and took account of learning from local practice, audit and national research. It covered:
Pathways for advice and referral
Assessing risk
Safety planning for children
Understanding barriers to disclosure for children vulnerable to or experiencing CSE
Identifying perpetrators
Proactive use of legislation
Additional vulnerabilities for Looked After Children
Services and ongoing support for victims and their families (including witness support)
9.2 The development of the MACSE response within the Multi Agency Screening Hub (MASH) provided a clear and consistent pathway for all CSE referrals. It was further strengthened by the introduction of increased management capacity to chair all CSE strategy discussions, including those for Looked After Children.
9.3 Locally the Return Home Interview (RHI) service was commissioned from the national charity, Missing People. In April 2016 this was extended to incorporate all the Sussex authorities via a three year contract. The commissioning process and contract management was led by ESCC. Missing People provide quarterly reports and the end of year report was scrutinised by the LSCB on the 28 April 2016. The
Page 71

12
primary focus was to capture all RHI data required for inspection and statutory returns. It is hoped that this will reduce the risks of our most vulnerable children by enabling strategies to be developed in a timely manner. 9.4 In 2015/16 there were 40 LAC with missing episodes, 16 of whom were missing more than once. There were also 18 LAC who were absent, not where they should be but we knew where they were, and 8 of these were absent more than once. In terms of periods of absence, there were 56 occasions when this cohort of LAC were missing for more than 24 hours, 39 times they were missing for more than 48 hours and 15 times they were missing for more than 5 days. They were all actively tracked by the Police and Children’s Services staff. Risk assessments were reviewed on these high profile young people and safety plans put in place. 9.5 Of the 40 LAC who went missing, 19 were female and 21 male, and 18 were aged 16 and above. The data suggested that out of the total missing LAC cohort, 31 episodes were recorded where risk of sexual exploitation was a significant factor. For further information on the data see Annex 5, the Missing People Annual Report. 10. Inspections 10.1 The inspection outcomes for the residential homes during 2015/16 were as follows:
Homefield: full inspection was judged as overall “Requires Improvement” 30/09/15. Interim inspection judged as “Improved Effectiveness” 27/01/16.
Brodrick: full inspection was judged as overall “Requires Improvement” 14/10/15. Interim Inspection was judged as “Improved Effectiveness” 01/03/16.
Hazel Lodge: full inspection was judged as overall “Requires Improvement” 09/09/15. Interim inspection judged as “Improved Effectiveness” 04/03/16.
The Bungalow: full inspection was judged as overall “good” 03/012/15. Interim inspection was judged as “Improved Effectiveness” 24/03/16.
Acorns: full inspection was judged as overall “good” 17/12/15. Interim inspection was judged as “Sustained Effectiveness” 23/03/16.
Lansdowne Secure Unit: full inspection was judged as overall “Good” 06/10/15.
11. Corporate Parenting Panel 11.1 The Corporate Parenting Panel met quarterly during 2015/16 to scrutinise the performance of all services in relation to LAC and Care Leavers, paying particular attention to outcomes. It also received presentations from the CICC, from the East Sussex Foster Care Association and from the Adopted Families Group. The reports outlined below were presented and considered April 2015:
Annual progress report of the East Sussex Fostering Service
Annual progress report of the East Sussex Adoption and Permanence Service
Looked After Children (LAC) Health Service Update
Looked After Children (LAC) Statistics
Children’s Home Regulations 1991, Regulation 33: Inspection reports for September, October and November 2014 for the following children’s homes:
- Acorns at Dorset Road - Brodrick House - Hazel Lodge - Homefield Cottage - Lansdowne Secure Unit
Page 72

13
- The Bungalow, Sorrel Drive 10 July 2015:
THRIVE – end of programme review
Independent Reviewing Officer (IRO) Annual Report 2014/15
Children’s Home Regulations 1991, Regulation 33: Inspection reports for march and April 2015 for the following children’s homes:
- Acorns at Dorset Road - Brodrick House - Hazel Lodge - Homefield Cottage - Lansdowne Secure Unit - The Bungalow, Sorrel Drive
Looked After Children (LAC) Statistics
Video presentation of the East Sussex County Council fostering recruitment advert
16 October 2015:
Children in Care Council – presentation
Children’s Home Regulations 1991, Regulation 33: Inspection reports for May, June and July 2015 for the following children’s homes:
- Acorns at Dorset Road - Brodrick House - Hazel Lodge - Homefield Cottage - Lansdowne Secure Unit - The Bungalow, Sorrel Drive
Looked After Children (LAC) Statistics
Unaccompanied Asylum Seeking and Trafficked Children and Families with No Recourse to Public Funds
Looked After Children Annual Report 2014-15
The Virtual School Annual Report including the use of Pupil Premium
East Sussex Foster Care Association Annual Report 29 January 2016:
Ofsted Inspection reports for the following
- Brodrick House
- Hazel Lodge
- Homefield Cottage
- Lansdowne Secure Unit
Children’s Home Regulations 1991, Regulation 33: Inspection reports for August, September, October and November 2015 for the following children’s homes:
- Acorns at Dorset Road - Brodrick House - Hazel Lodge - Homefield Cottage - Lansdowne Secure Unit - The Bungalow, Sorrel Drive
Looked After Children (LAC) Statistics
Adopted Families Group
Update for Unaccompanied Asylum seeking children
Page 73

14
12. Conclusion 12.1 Overall the LAC service has performed consistently well during 2015/16, with continued emphasis on the safe reduction of the number of LAC in the system and on the delivery of efficiency savings following the end of both Thrive funding and of the Adoption Reform Grant. This was achieved whilst good outcomes for LAC and Care Leavers were also maintained. 12.2 The challenge for 2016/17 will be to continue to ensure that the right children are in the right placements for the right amount of time and that we secure the best outcomes possible within the available resources.
Page 74

1
Annex 1
Annual Progress Report of East Sussex Fostering Service 1 April 2015– 31 March 2016 1. Safeguarding 1.1 This outcome is fundamental to the delivery of fostering services across East Sussex and is embedded in each of the core functions: recruitment and retention; assessment, supervision and review; foster carer training; the matching and placing of children and young people with foster carers. These areas are addressed in more detail below. 2. Recruitment and Retention of Carers 2.1 2015 – 2016 proved to be a challenging year for fostering recruitment. The experiences of our immediate neighbours and Fostering Services nationally have also reflected that the recruitment of foster carers has been particularly challenging. While there appears to be no consistent rationale for this, a contributing factor is thought to be public awareness of historical allegations, highlighted in high profile prosecutions of abuse. In addition, the success of ESCC recruitment of foster carers over the last 2 or 3 years has, to some extent, exhausted the existing recruitment pool. This is evidenced in the poor quantity and quality of agency carers available in the East Sussex region. The age range of approval has also narrowed over the past year, with households being approved for sibling groups within a restrictive age range. Once foster carers have gained some experience, supervising social workers work with foster cares to extend their age range as they become more confident and skilled in managing the complex needs of many of our looked after children (LAC). The number of foster carers transferring from agencies still remains healthy, although many have been persuaded to remain with their own agencies by being offered huge financial incentives. 2.2 As with last year, the recruitment and retention team have continued to achieve their timescale targets for assessments of 6 – 8 months (dependent on the complexity of the assessment). In order to achieve the expedient and efficient transfer of carers from other agencies the recruitment and assessment team has implemented a timely assessment tool, optimising the existing statutory information from foster carers’ previous agency. This has allowed ESCC to approve transferring carers within 3 months of their initial enquiry.
2.3 From 1 April 2015 – 31 March 2016, 428 new enquiries were received which led to 199 screening calls and 69 initial visits to prospective foster carers. The recruitment strategy focused for the first part of the year on prioritising the recruitment of carers for older children. This resulted in very few enquiries. The strategy was then reviewed to include all age ranges. This resulted in an increase of enquiries as evidenced in the upturn of approvals towards the end of the year. The recruitment for Children with Disabilities (CWD) remains marketed under the same fostering banner with imagery and copy relevant to CWD.
Page 75

2
2.4 The Children in Care Council (CICC) now play a full role in contributing to the assessment, holding informal interviews with all applicants going through ESCC’s foster carer approval process. 6 “Skills to Foster” pre-assessment preparation courses were held during 15-16 and 27 households have attended these courses.
2.5 26 households that offer 44 placements were approved in 2015-16. 6 of these households were transfers from independent fostering providers with 4 East Sussex looked after children already placed with these families. 2 LAC from other local authorities were also placed with these foster carers. This has brought significant income generation into the service. After the deduction of the East Sussex foster carer allowances paid to these foster carers, the transfer of these foster carers equates to a saving to ESCC of £288,305 per year in agency fees.
2.6 For 2015/16 the Fostering Service saw the loss of 24 carers which represented 8% of its total carer resource. Although this is an increase on last year’s retention of just below 3%, it continues to be well below the national average of 12% last recorded. A breakdown of reasons for carers leaving ESCC include: foster carers applying for special guardianship orders and adoption orders and changes in foster carers’ personal circumstances. Nearly one third of losses were due to carers deciding to retire from fostering. The Fostering Service has anticipated that there will be an increasing number of foster carers retiring given that the percentage of our foster carers over 50 years of age is high, and this is part of a wider demographic trend. The Department of Education’s Local Authority Fostering Service Benchmark Report (2014) cites: “According to the Fostering Network research, foster carers stay in their role for an average of seven and a half years. Many leave due to changes in personal circumstances or at a natural point for their time as foster carers to cease. This is often retirement age as foster carers on average are aged 50-55 years”. 2.7 The diagram below Illustrates the total number of carers recruited each month.
2.8 There were 14 fostering assessments still in progress at 31 March 2016. The recruitment and retention team is also following up enquiries from a further 3 fostering households currently approved by independent fostering agencies who are expressing an interest in transferring to ESCC.
2.9 The service continues to employ the marketing strategy of “continual presence”. This consists of wide-ranging extensive advertising throughout the year using a range of different mediums. As the Fostering Service marketing strategy for 2015-16 has been the most high profile to date, the service is confident via its data that when residents of East Sussex want to consider fostering, it is ESCC they approach first.
Page 76

3
Below are some examples of the mediums used to promote fostering recruitment this year:
Bus shelters
Local buses
Sovereign FM Radio, Arrow FM Radio and Heart FM
Local papers
Lamp post banners
‘Display vans’ in both Hastings and Eastbourne
‘Your County’ magazine
ESCC payslips 2.10 One of the new marketing initiatives in 2015/16 was the use of television advertising to produce a series of advertisements demographically targeted to recruit carers in the west and north east of the county. Although the take up was lower than predicted, the advertisement was developed so as to allow the service to retain the copyrights. The filming was re-edited to provide very effective social media clips that went across a range of popular social media sites including You-Tube and Facebook. Recruitment Events
Information evenings have been held monthly - 10 in Eastbourne, 1 in Hastings. The Operations Manager attended a special event with Home For Good, a charitable organisation helping to deal with the refugee crisis. Over 60 people attended and this generated 5 enquiries, one of which is currently progressing through to assessment.
Retention Events
In October 2015, the Fostering Service in conjunction with East Sussex Foster Carer Association (ESFCA), held a ‘Children Who Foster’ residential trip at PGL, Windmill Hill in celebration of Sons & Daughters week. In August 2015, a picnic was held at Knockhatch for all carers of ESCC children and staff. This continues to prove to be a successful way of raising our profile with agency carers.
In June 2015, an evening event was held at Bannatynes Spa Hotel, Hastings, to say ‘Thank You’ to our carers. This was attended by 130 carers and staff.
The Fostering Service continues to send newsletters to foster carers providing up to date information on the service and looked after children and to promote the service’s support groups and training events.
Advertising and Media Coverage
This year the Fostering Service originally focussed their recruitment strategy on “Could you foster a teenager”. It became apparent in the first part of the year that the take up for this age group was particularly challenging. The strategy was reviewed to refocus our target group to foster carers for all ages. The campaign of “Don’t keep them waiting” proved to be more successful.
Page 77

4
Marketing Partnerships
For the first time the Fostering Service was able to secure a marketing partnership with Amey, an ESCC commissioned company, with their countywide van fleet now sporting promotional fostering signage.
3 Foster Care Training 3. Foster Care Training 3.1 From 1st September 2015 to the 31st March 2016, 589 training places have been taken up by foster carers (last year’s equivalent was 554), predicting a slight increase for the overall academic year. Evaluation of the courses by participants shows 89 % to be excellent. 3.2 New courses introduced this year have included:
Missing and Child Sexual Exploitation.
Prevent Awareness.
Insiders Course, promoting foster carers’ resilience.
Fostering Changes, adolescence, addressing behaviour management strategies.
Understanding and Supporting Lesbian and Gay, Bisexual, Transgender and Unsure Children and Young People.
Legal High Drug Awareness, prior to the law change.
Neonatal Abstinence Syndrome.
Understanding Autism.
Promoting Positive Behaviours 5 day course, supporting foster carers by developing a Behaviour Support Plan.
Adolescent Support Discussion Groups, addressing many aspects regarding looking after teenagers.
Internet Security / Parental Controls and Filters Course.
Digital Photo Albums. 3.3 Continual Professional Development Opportunities are also available: 15 foster carers are undertaking a variety of qualifications. These include the level 3 Diploma, Children and Young People’s Workforce qualification, and the Level 3 Training, Assessment and Quality Assuring qualification in assessing occupational competence.
Page 78

5
3.4 In recognition of the varied expertise, knowledge and skill base of some of our foster carers, it is planned to bring courses in-house. This will do two things, it will enable us to use the existing expertise, knowledge and skills of East Sussex Carers in a training role, and secondly it will be more cost effective to upskill those that need further training. To ensure the quality of training, there is an agreed framework of requirements and support identified:
To have a minimum recognised occupational based qualification (Qualification and Credit Framework Level 3 Diploma Children and Young People Workforce).
To attend a Train the Trainers course.
To plan course content and delivery in conjunction with the foster carer training and development consultant.
Quality assurance activities to be undertaken.
To gain an education and training qualification at either level 3 or 4. 3.5 Planned courses for 2016/17 include developing:
Internet Safety Courses, addressing primary and secondary aged children, addressing the risks and management strategies.
Added concerns regarding the internet, CSE and Radicalisation, incorporating the Dark Web.
Fostering Changes, under 12’s course.
Caring for asylum seeking, refugee and unaccompanied children.
Supporting education and success, a practical approach for primary and secondary aged children.
Promoting children and young people’s health and healthy living.
Practical skills to manage challenging behaviours.
Discussion groups, identified subject area, supporting foster carers understanding. 3.6 As of July 2016, foster carers will be able to access the East Sussex Learning Portal, to be able to apply to the wide ranging training provided by Local Safeguarding Children’s Board and Children’s Services courses and to manage their own continuous professional development. 3.7 Men who Foster The introduction of the ‘Men who Foster’ group in 2014 continues to be successful, now attracting a consistent membership. The subjects addressed in 2015/16 included:
Addressing safe care issues.
What makes a positive male role model?
The difference between being a parent and a foster carer.
How does fostering impact on your relationships? 4. Foster carer support and supervision
4.1 The Fostering Service currently has 292 fostering households that provide a range of placements for children and young people including parent and baby placements. Supervision and contact plans are assessed on the complexity of the children placed, taking into account the need of the foster carers and of their family. The pressures and demands over the last year on foster carers and supervising social workers (SSW) have increased, but the quality of the support provided has remained at a high standard. 4.2 Support groups are available to provide foster carers with opportunities to meet with other carers, to increase support networks and to give the opportunity for shared learning. There are four localised groups in Uckfield, Rotherfield, Eastbourne and Newhaven. There are also four themed support groups: black and minority ethnic children and young people’s support group; a
Page 79

6
parent and child foster carers’ support group; a support group for carers of adolescents and a ‘men who foster’ support group. A “Buddy” system is also available when this is required. 4.3 Further support is provided for foster carers through the Fostering Advice line - an out of hours advice line service available to all foster carers and supported lodgings providers for 365 days per year. This service is staffed by a team of 7 workers from the Fostering Service, working on a rota basis, to provide support and advice to all foster carers. 4.4 There continues to be close working relationships with LAC teams, The Child and Adolescent Mental Health service, The Virtual School and Placement Support services(PSS); all of which are invaluable to supporting foster carers in sustaining placements and endeavouring to meet the children/young people’s needs.
5. Health
5.1 Meeting the health needs of LAC remains a priority for the Fostering Service. In 2015/16 foster carers continued to prioritise the health needs of their children, with SSWs monitoring and supporting foster carers to ensure timely health assessments are in place, via notifications and liaison with Kent Community Heath Care Trust, the designated nurse for LAC and the LAC nurses.
6. Placement Activity
6.1 On 31st March 2016 there were 498 children in foster care. 410 of these children were placed with in-house placements. This includes in-house “parent and child" placements, children subject to Special Guardianship Orders placed with foster carers and those children remaining in their “staying put" fostering placements through to independence. There were 88 fostered children placed with agency carers. 6.2 The number of East Sussex LAC placed in agency placements has decreased from 94 children (19%) in 2014/15 to 77 (15.5%) at the end of March 2016. Given the challenging matching considerations and complex needs of many of the young people for this reporting period, the Fostering Service would consider this a significant achievement. 6.3 18 young people (over 18 years of age) remain with their foster carers under the ‘Staying Put’ arrangements. There are also 32 children who are currently subject to Special Guardianship Orders placed with East Sussex foster carers. Fostering households also provide adoptive parents for 9 children, with one further foster carer currently undergoing an assessment to adopt a child in
Page 80
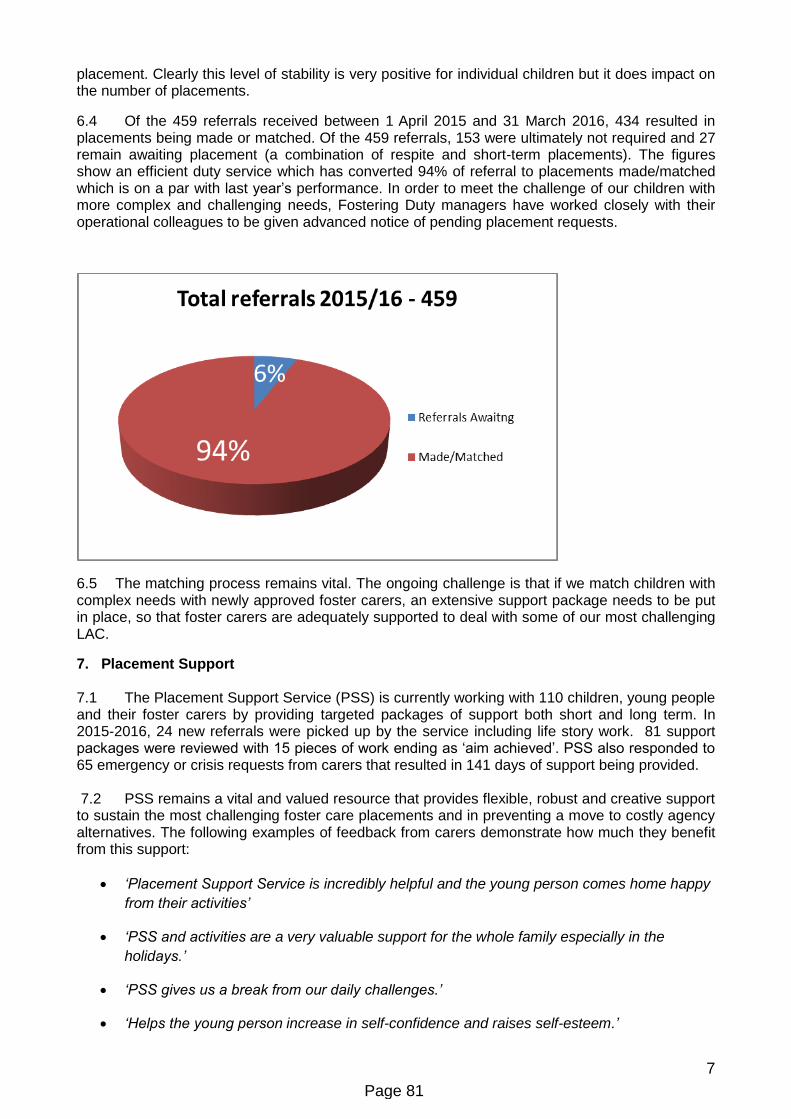
7
placement. Clearly this level of stability is very positive for individual children but it does impact on the number of placements.
6.4 Of the 459 referrals received between 1 April 2015 and 31 March 2016, 434 resulted in placements being made or matched. Of the 459 referrals, 153 were ultimately not required and 27 remain awaiting placement (a combination of respite and short-term placements). The figures show an efficient duty service which has converted 94% of referral to placements made/matched which is on a par with last year’s performance. In order to meet the challenge of our children with more complex and challenging needs, Fostering Duty managers have worked closely with their operational colleagues to be given advanced notice of pending placement requests.
6.5 The matching process remains vital. The ongoing challenge is that if we match children with complex needs with newly approved foster carers, an extensive support package needs to be put in place, so that foster carers are adequately supported to deal with some of our most challenging LAC.
7. Placement Support 7.1 The Placement Support Service (PSS) is currently working with 110 children, young people and their foster carers by providing targeted packages of support both short and long term. In 2015-2016, 24 new referrals were picked up by the service including life story work. 81 support packages were reviewed with 15 pieces of work ending as ‘aim achieved’. PSS also responded to 65 emergency or crisis requests from carers that resulted in 141 days of support being provided. 7.2 PSS remains a vital and valued resource that provides flexible, robust and creative support to sustain the most challenging foster care placements and in preventing a move to costly agency alternatives. The following examples of feedback from carers demonstrate how much they benefit from this support:
‘Placement Support Service is incredibly helpful and the young person comes home happy
from their activities’
‘PSS and activities are a very valuable support for the whole family especially in the
holidays.’
‘PSS gives us a break from our daily challenges.’
‘Helps the young person increase in self-confidence and raises self-esteem.’
Page 81

8
‘This has helped us get through some difficult times.’
7.3 The PSS continues its close partnership with the Looked After Children’s Mental Health Service (LACAMHS) by attending their monthly multiagency meeting.
7.4 During the reporting period the Virtual School commissioned PSS staff to support 11 children with complex needs who were temporarily without education for a total of 181 days. PSS continues to maintain the positive links developed with the Virtual School who are supportive of the activities PSS provide.
7.5 The PSS provides respite holiday and weekend group activities to some LAC aged 5 to 17 during school holidays. The activities provide enriching, fun and educative experiences for children who cannot access community resources. They aim to build confidence, raise self-esteem and to reduce the stigma that some young people feel by being in care. It is a cost effective way of providing support at the most stressful periods for foster carers.
7.6 The PSS has:
Provided 42 group activities as well as an additional 8 group Saturday activities. 10 to 15 young people attend each activity.
Offered 451 places to children and young people. 98% of children rate the activities as good to excellent.
Formed a positive relationship with Rhythmix, a voluntary organisation whose focus with children is music. These activities are provided free and are particularly successful for young people who find it difficult to engage in activities.
Continued to work with St Bedes who have provided free zoo days as well as free access to their sports facilities that have also been popular.
Negotiated free visits to the local Fire Station and to Raystede animal sanctuary. Children also regularly swim for free at Crowhurst Country Park.
8. User Participation 8.1 The Younger User group met six times during the year and following a review decided that a separate group was no longer needed. They felt that a better way of involving more junior aged children should be via SUSS IT (speak up sessions) that take place during the school holidays. This has worked well as an alternative and 29 issues for this younger group of LAC have been satisfactorily resolved. A recurring theme is a need to improving contact arrangements for children. 8.2 In April 2015 the Junior Action Day was held and 36 primary school aged children attended, the theme being Protective Behaviours. 8.3 The latest Children In Care Council (CICC) commenced on 28th September 2013 and goes from strength to strength. The CICC has decided to continue as an ongoing group in future and to replace members as necessary, rather than start afresh every three years. They have met as a group twelve times. Senior managers from the LAC service, other social work children’s teams, and NYAS have also attended. 8.4 The 2015 CICC Newsletter was produced and widely distributed to children in care and professionals, as were the Children’s Handbook, Pledge and CICC top tip playing cards.
Page 82

9
8.5 During 2015-2016 the CICC/CICC coordinator attended:
41 holiday activities to promote Speak up Sessions (SUSS IT). 53 issues raised by looked after children were resolved as a result.
23 local and national meetings, events and consultations that included: meeting with the Corporate Parenting Panel, the Children’s Minister, the Children’s Commissioner, the local judiciary, testing the MOMO app, and meeting with a wider Pan Sussex group.
Recruitment panels and events that included appointing the new Children’s Commissioner, foster carer recruitment via Sky, and three ESCC staff recruitment panels.
CICC has attended the following personal development and training events:
3 members completed Level 1 Leadership training.
8 Completed British Youth Council Democracy Champion training.
7 have completed l Food Hygiene training.
7 attended National Takeover Day.
14 children are currently working on their Bronze Arts Award.
1 completed Basic First Aid Training.
2 completed SPARK representative training, a voluntary organisation set up to train volunteers who wish to do youth work.
CICC members continue to volunteer both in the community and for ESCC. 9. Working in Partnership ESFCA 9.1 The Operations Manager of the Fostering Service continues to attend the monthly meetings of the East Sussex Foster Care Association (ESFCA) management group to report on developments in the Fostering Service and Children’s Services. This relationship is particularly significant at the moment as the association has, in the last 6 months, gone through a change of chair and trustees. The association is taking forward a new agenda for its members which includes them supporting the fostering services in its operational responsibilities, including informal support, advice and “buddying” of new carers. 9.2 The Operations Managers for Looked After Children and the Fostering Service with the Chair of the ESFCA continue to host monthly ‘surgeries’ for foster carers who can bring issues and problems directly to key managers. Virtual School 9.3 Partnership work with The Virtual School continues to be very significant in the support and promotion of children’s educational needs, both for their prospective and existing placements. Placement stability has a direct correlation with a young person’s school placement and if the school can remain consistent when a child becomes LAC, the likelihood of placement breakdown is significantly reduced. 10. The Supported Lodgings Team 10.1 Supported lodging providers continue to offer valuable placements for LAC, care leavers and homeless young people in the East Sussex area. Over the last year we have seen an increase in the high level of care needed for very complex young people coming into placement.
Page 83

10
Our providers have demonstrated their skills, flexibility and willingness to rise to the challenge of accommodating these older looked after children. 10.2 There are currently 32 supportive provider households providing a total of 49 placements across the county. Since April 2015, 16 supported lodgings assessments have been undertaken with 9 being approved and a further 6 assessments awaiting approval. 10.3 An objective over this past year has been to encourage supported lodging providers to consider becoming approved foster carers, therefore enhancing their potential to provide placements for younger LAC. This has been successful with 4 carers now holding dual registration as foster carers and supportive lodgings providers which enables them to provide care placements for our younger and more complex and challenging Looked After Children before they become 16 years old. 10.4 During the last year, supported lodging carers have provided a number of ‘step down’ placements for children from in-house residential placements as well as from both agency and in-house foster placements. Significantly, supported lodgings carers have provided 7 placements for LAC moving from expensive external residential provision at a saving of £544,195. 10.5 The Supported Lodgings Team recognise the increased pressure on the availability of supported lodgings beds. As a result the team is pushing forward with a recruitment campaign. The team regularly advertises in local newspapers and once a year in Your County magazine. This has proved to be very successful in generating new applicants and interest in the Service. 11. Summary
11.1 2015/16 has brought a number of challenges to the Fostering Service: financial constraints and the ever reducing pool of new foster carers to recruit from. Despite these challenges, the outcomes for the Fostering Service have remained strong. However, this has only been achieved by using extensive resources (more staff and management time, energy and commitment) to match our children and young people who demonstrate more risk taking behaviours and complex needs. As with last year’s success, this year has been built on a strong foundation of effective support to our foster carers. Agency foster carers who have transferred to ESCC have come to us because of our reputation of supporting our foster carers well. Recruitment of new carers has been challenging not only for ESCC but also for our neighbouring partners (and nationally). All our providers, including our preferred independent foster agencies continue to struggle to recruit any new foster carers. Therefore, our focus continues to be on attracting existing approved foster carers to our authority and on developing and retaining our existing foster carers. 11.2 Our referral profiles of children requiring placements have changed considerably over the last year, with carers being asked to take on more young people with challenging and complex needs. Therefore, it is inevitable that placement breakdowns are more likely to occur. Even so, our placement stability has only seen a small increase for children who experience 3 placements or more to just above 10%. This is comparable with the national average. 11.3 The Supported Lodgings Service has built on its success from last year, making bespoke and appropriate placements for young people whilst also making significant savings. The care packages provided by this service have been excellent, giving young people the opportunity to develop independence skills with the support and supervision of care providers. The complexity of placements being taken on by the Supported Lodgings Service has necessitated access to appropriate training and support for carers, the take up of which has increased considerably during this reporting period. 11.4 We have targeted recruitment and designed our income generation programme around the recruitment of all potential local carers. These carers would then be available, not only for children in East Sussex, but could also be ‘sold’ to our neighbouring authorities for their use. This would
Page 84

11
give neighbouring authorities the opportunity of having good quality placements supported by East Sussex Fostering Service at a cost that is less than that of an independent fostering agency. The Key Management Priorities for 2016-2017 include:
To continue active recruitment and provision of high quality training and support for our carers so that stability for children is prioritised.
To continue with an extensive and continuous recruitment strategy throughout the year to attract potential foster carers to come to East Sussex as the preferred fostering agency in this area. This will include targeted recruitment on the borders of East Sussex in order to recruit foster carers that potentially the Fostering Service could make available to our neighbouring authorities.
Adrian Sewell
Operation Manager Fostering Service
Page 85

This page is intentionally left blank

1
Adoption and Permanence Service Annual Report Annex 2 1. Supporting Information
2013/14 2014/15 2015/2016
1. Number of Children Adopted 57 43 45
2. Number of Adoption Matches (children) 50 56 32
3. Number of Permanent Fostering Matches (children)
10 7 10
4. Number of East Sussex Adoptive Matches (children)
40 33 26
5. Number of Consortium Adoptive Matches (children)
1 6 0
6. Number of Inter-Agency Matches (children): Permanence: Adoption:
4 9
3 17
2 6
7. Number of Prospective Adopters Approved (households) *
44 50 41
8. Number of Permanent Carers Approved (households)
8 4 2
9. Number of Children Approved for Adoption up to 31st March 2016 (including 2 re-approvals)
52 43 53
10. Number of children Approved for Permanence up to 31st March 2016
24 26 14
11. Number of Approved Adopters waiting to be Matched
17 20 22
12.Number of Disruptions presented to Panel: Permanence: Adoptions:
1
0
0 1
2. Recruitment Activity 2.1 The two stage recruitment process which is now fully embedded within East Sussex County Council’s (ESCC) Adoption Service, received very positive feedback from adopters during 15/16. Prospective adopters reported that they particularly appreciated the support they received during the process. Not only did ESCC’s reputation as a welcoming and helpful recruitment service lead to local enquirers choosing to adopt with ESCC, it also attracted significant numbers of adopters from outside East Sussex borders which have been pursued if the geography is helpful. During this period the service continued to offer a dedicated telephone number for enquiries, a specific adoption recruitment email address and an on-line enquiry form to ensure that all enquirers received a prompt and personal service. 2.2 The time taken to approve prospective adopters was maintained at an average of nine months, from registering their interest to approval at Adoption Panel. While the service continued to explore ways to reduce this timescale where possible, it was clear that adopters taking control of the timescales during Stage 1 led to delays at this point more frequently than might have been predicted. It had been anticipated that most adopters would want to progress to approval in the quickest time possible, but in reality more applicants chose to take more time to prepare themselves for adoption. However the time taken to assess applicants in Stage 2 remained on target.
Page 87

2
2.3 During 2015-16 the agency had 287 enquiries about adopting with ESCC. Following receipt of information packs, 81 requests were received for registration of interest forms. The conversion rate from enquiry to registration was 28%, which is a drop compared to 34% in 2014-15, however this still compares well with the Coram BAAF suggested national figures of around 10%. While difficult to be certain, it is suspected that the reduction was due to the decision to pause accepting applications from potential adopters to adopt babies. This decision was taken in order to prioritise applications from adopters wanting to adopt older children and sibling groups. In line with the national picture, there was an increasing mismatch between adopters wishes compared with the profile of children needing placement. Consequently there was a significant drop in new registrations from December to April 2016. Given the recent rise in numbers of children being referred for an adoption placement, as well as an encouraging increase in the number of adopters matched with children, ESCC have reviewed the decision to pause applications to adopt young single children. This appears to have resulted in an immediate increase in the rate of registrations of interest from enquirers. 2.4 Throughout 15/16 the Adoption Service continued to organise regular recruitment activities for prospective adopters; profiling the range of needs of each child waiting for a placement. Advertising and recruitment activity in 2015-16 included providing information about open events on the Government Gateway, First4Adoption, New Family Social and Coram BAAF websites as well as reviewing and updating information on the ESCC website, radio advertising, and bespoke advertising on ESCC payslips, at supermarket sites, and on buses travelling around the county. The Adoption Facebook page remained popular in reaching a range of prospective adopters, particularly as it was updated regularly with information regarding local adoption services, and key national developments. Monthly information drop-in events were also held in the evenings and at weekends. 2.5 The continued trend of ESCC receiving enquiries from applicants living outside ESCC borders resulted in the service generating increased levels of income from interagency fees. Four ESCC families were ‘purchased’ by other local authorities in 2015-16. In addition, there have been a further 6 matches identified with other local authority children that are at various stages of progress at time of writing. All will bring income to the service should children be placed ultimately. 2.6 All recruitment processes, including stage 1 meetings and preparation to adopt courses, were reviewed during the year in order to streamline practice. A post approval training course was piloted to give adopters a better understanding of the additional attachment needs of their adopted children with tailored support strategies available at the point of placement. There was very positive feedback from this pilot and consideration is being given to setting up two six week courses in 2016-17. 2.7 During 2015-16 a further 6 experienced adopters returned for assessment, and one set of foster carers applied to be assessed as adopters for children in their care. In addition, four families were recruited to offer fostering for adoption placements for four children. Three of these four children were placed on a fostering basis with adoptive families where their siblings had previously been placed. The fourth child was placed with a childless couple willing to take the risk of offering a foster placement prior to an adoption placement being made, and subject to the Court agreeing to the care plan for adoption for the child. He has since been adopted, thus ensuring he had the minimum number of moves possible during his time in our care.
Page 88

3
3. Children with a plan for Adoption. 3.1 The number of children with a plan for adoption increased from 43 14/15 to 53 in 15/16. This scale of increase was not reflected nationally; indeed many Adoption Agencies reported that the number of approvals for adoption had significantly decreased in favour of Special Guardianship Orders. Locally however, the courts responded to a clear Government directive which suggested that adoption should continue to be promoted as a realistic permanence option for young children at the earliest opportunity. During 15/16 28 children were matched with local adopters, with only 2 sibling pairs placed out of county giving a total of 32 children matched in the 12 month period. There was also a marked rise in the number of sibling groups with complex permanence plans, some of which involved adoption for the younger children and permanent foster placement for the older children. These arrangements were very challenging in terms of contact and involved detailed professional and co-ordinated working across children’s teams. 3.2 The family finding service was refined to more effectively co-ordinate and develop local in house provision, and explore placement options for children approved and waiting for both adoption and permanence. Improving communication between this service and the family support and looked after children’s teams and resulting in timely notification of children entering the system with a possible plan for adoption minimising any potential delays. One of the greatest challenges in the past year was the number of children who remained at home during care proceedings and the impact these arrangements had on permanence planning. 3.3 The specialist recruitment and family finding staff within the adoption service worked closely together during this period to identify the types of adopters needed to meet the needs of the children coming forward. It should be noted that there was a continued rise in the number of children identified with a plan for adoption who had experienced domestic violence, trauma and loss. Many of these children will have ongoing complex therapeutic post adoption support needs in the future. During this period it was enormously beneficial to apply to the Adoption Support Fund with an identified support package for adopters and their families at the earliest stage in placement. 3.4 In November 2015 ESCC participated in an adoption activity day with our former consortium partners. Whilst there was initial interest in a number of East Sussex children sadly it did not result in any matches. However, the children have been successfully matched since with both in house and inter agency adopters. 4. Staffing
4.1 There have been a number of staffing changes over the last 12 months with a number of
long standing members of the team moving on. A small number of these posts were
recruited to, but 5 staffing vacancies have been held in order to manage the very difficult
budget position the council found itself in during 15/16.
5. Permanence 5.1 The Adoption & Permanence Service continued to use targeted family finding for those children with a plan for permanent fostering; particularly those children with complex needs or who were part of a sibling group. The permanence tracking workshop met regularly during 15/16 to monitor closely the timescale of permanence plans and ensure suitable matches were progressed.
Page 89

4
5.2 The service had a number of in-house foster carers who were willing to put themselves forward to offer long term care to children already in placement with them, or for those for whom they have expressed a specific interest. This was particularly advantageous for those children who had been “claimed” by the foster carers, and for those children who had expressed a clear wish to remain in that placement. The number of children approved for permanence reduced from 26 in 14/15, to 14 in 15/16. At year end there were 12 children with a plan for permanence for whom the service was actively family finding, this included four sets of sibling pairs. 6. Adoption Support 6.1 Between April 2015 and March 2016 there were 36 requests from adopters for post adoption support assessments. Of these, 28 resulted in the provision of support. At year end, 141 families were in receipt of post adoption support packages. This represents a significant increase on last year.
6.2 The specially commissioned CAMHS service for adopted children and their families ‘AdCAMHS’ was funded by the Local Authority CAMHS grant throughout 15/16. The aim of the service was to offer post adoption support to families with dedicated therapy and consultation services. The service was commissioned to work with 40 families at any one time, however there are currently 68 cases open to the service. The service was designed to contribute to adoption stability, promote positive attachments within adoptive families and ultimately to prevent placement breakdown. There was clear evidence collected by the service which indicated that these interventions had had a very positive impact on placement stability.
6.3 The adoption service also commissioned individual therapists to provide specialist support to families in areas such as therapeutic life story work and ‘Theraplay’. Play, Drama and Music therapies were identified as effective tools in enabling children to communicate and express themselves more creatively. There were also a number of adoption cases where child to parent violence was identified as a key factor and a systemic family therapist was commissioned, with expertise in the ‘Non Violent Resistance’ (NVR) approach, to offer advice and interventions to families. These interventions were all funded by applications to the national Adoption Support Fund (ASF)
6.4 Excellent links were maintained with the Virtual School, who continued to fund two part time adoption support workers within the service. These roles provided adoptive families with support for educational and school-based issues, in order to promote the educational achievements of adopted children within East Sussex. The Virtual School also offered advice and guidance to schools in drawing down the Pupil Premium for adopted children. Training for schools on attachment and on the needs of adoptive children in an education setting, was identified as a key area of intervention.
6.5 Closer collaborative links between the Adoption Support Team and Locality Services, particularly with the Duty and Assessment, Family Support, Youth Support and Targeted Youth Support teams were forged, enabling a more seamless service to be provided to families when a family assessment was required. In complex adoption support cases, a team around the child, particularly though not exclusively in adolescence, is vital in managing risk and safeguarding issues as well as preventing some of our young people returning to care.
6.6 During the last 12 months, the Adoption Support Team facilitated a group for adopted children aged 10-12 years, and 2 groups for adoptive teenagers facilitated jointly with AdCAMHS. A further 12 week therapeutic parenting programme was successful in bringing adopters together to focus on adoption issues with the support of two child and adolescent
Page 90

5
psychotherapists, also under the umbrella of AdCAMHS. ESCC continued with its contract with Adoption UK to deliver support to adopters and funded four support groups at different locations across East Sussex. This contract was regularly monitored and reviewed by the adoption service and evaluated by service users.
6.7 The Adoption Service also maintained its close working relationship with the Adoptive Families Group (AFG), set up in January 2013. This is an independent adopter-led group which focuses on lobbying and raising the profile of the needs of adoptive families both locally and nationally. During this period AFG focused on education, the use of Pupil Premium and raising awareness of the Adoption Support Fund in relation to therapeutic support.
6.8 The Adoption Service has continued to commission the services of CMB Counselling (a small independent agency) to provide an intermediary service to adopted adults and their relatives, and the Adoption Support Team provided a service to adopted adults wishing to access their records. In March 2016, 45 families were in receipt of adult adoptees support packages (not one off advice).
6.9 The adoption service in 2015/2016 held two events for adoptive families. These were social events organised and supported by the service, and designed to enable adopters and their children to meet informally and have a fun day out. These events were well received and attended.
6.10 The same sex adopters group met on a regular basis with speakers in attendance from time to time.
6.11 The direct contact service supported 300 arrangements during 15/16, and a further 781 indirect contact agreements; both of which demonstrate a substantial increase on 14/15. This aspect of the service requires a high level of professional scrutiny as well as dedicated full-time administrative support.
6.12 In 15/16 the Adoption Service trained a caseworker to become a licensed practitioner in the use of ‘THRIVE’, funded through Pupil Premium. THRIVE is a systemic approach used in relation to the early identification of emotional developmental need in children. It has been used increasingly in schools to help children in their relationships with others and equips them to be open to learning. There were also several THRIVE workshops commissioned for adopters, funded via the Adoption Support Fund.
6.13 The Adoption Support Fund (ASF) was rolled out nationally in May 2015 (following the prototype phase which involved East Sussex). As part of its programme of adoption reform, the Government made a financial commitment to fund the ASF until the end of this parliament. This was an acknowledgement of the need to strengthen arrangements for adoption support. The ASF is available specifically for the provision of therapeutic support. Since the roll out of the fund, the scope has broadened for 16/17 with the eligibility to include children from the time of placement in their adoptive families, intercounty adoptions and Special Guardianship. Since the national roll out of the ASF, East Sussex made 64 applications to the fund and the total agreed is £219,965.80.
7. Adoption & Permanence Panel 7.1 There have been a number of changes to the membership of the Adoption and Permanence Panels during 15/16, but quoracy was maintained. Panel processes and venues were reviewed during this period in order that best value for money was achieved, and savings made. This resulted in a change to the venue, a reduction in the frequency of Panel meetings and all panel members now receive their papers electronically. A very
Page 91

6
successful Panel training event took place in September 2015 facilitated by Elaine Dibben from Coram BAAF. The topic of Adoption Matching was enthusiastically discussed. 7.2 Kent Health Care Trust (KHCT) were commissioned for 15/16 to deliver all medical advice to the Panels, and all initial health assessments and adoption medicals for Looked after Children. They encountered a number of personnel issues during this timeframe which resulted in the emergency appointment of a number of locum staff. At year end KHCT were in the process of recruiting to two permanent medical advisor posts specifically to work with ESCC children and the Adoption Panel. 8. Consortium & Regionalisation
8.1 For 12 years East Sussex was a member of the South East Regional Consortium together with Brighton and Hove, Bromley, Bexley, Kent and Medway. Brighton and Hove left the consortium in July 2014, and Kent’s position changed following the differently commissioned relationship with Coram. Medway, Bexley and Bromley forged links with Central London local authorities. In Jan 2015 ESCC joined the South Central Consortium in together with a number of South Eastern local authorities and PACT, a voluntary adoption agency. In April 2015 the government and DfE announced the introduction of Regional Adoption Agencies whereby existing consortium arrangements were reviewed. There was an expectation that all local authorities would join together in regions to submit a bid to become a new entity, and that it should include at least one voluntary agency. ESCC were instrumental in compiling a bid together with Brighton & Hove, Surrey and West Sussex. This was submitted in September 2015 but was not successful. However, the four local authorities have continued to work closely together, developed a senior management board and an operational group to drive forward this agenda under the banner of Adopt South East.
9. Management Priorities 2016/17
Using the expertise developed in ESCC’s outstanding Adoption Service to drive forward adoption recruitment, practice innovation and collaboration both locally and across the region, with a view to generating income or attracting grant funding.
Consolidate targeted recruitment of adopters for ESCC children, whilst maintaining a strategy of over recruitment in order to release additional resources/funds particularly in the Southern region.
Work together with other Local Authority partners in Surrey, Brighton & Hove and West Sussex to develop an effective region. Ensure regional developments bring added value to the service and greater local placement choice for children.
Update and revise policies and procedures in accordance with new regulations and strategy guidance.
Maintain and extend adoption support developments, including the revised CAMHS contract and close partnerships with the Virtual School. Ensure continued use of the Adoption Support Fund to full effect.
Ensure the contract with KHCT maintains a good standard of medical support across Adoption and Fostering Services.
Carole Sykes. Operations Manager, June 2106
Page 92

UNCLASSIFIED Version 2 - 21/06/16 1
Annex 3
The Contribution of Independent Reviewing Officers (IROs) to Quality Assuring and Improving Services for Looked After Children (CLA) This Annual IRO report provides quantitative and qualitative evidence relating to the IRO Services in East
Sussex as required by statutory guidance.
The IRO Annual Report must be presented to: Corporate Parenting Board and the Local Safeguarding Children Board.
1. Purpose of service and legal context
1.1 The IRO service is set within the framework of the updated IRO Handbook, linked to revised Care Planning Regulations and Guidance which were introduced in April 2011. The responsibility of the IRO has changed from the management of the Review process to a wider overview of the case including regular monitoring and follow-up between Reviews. The IRO has a key role in relation to the improvement of Care Planning for CLA and for challenging drift and delay. One of the key tasks for IROs is to build relationships with children, young people and the professional and family network to enhance effective planning for positive outcomes.
1.2 The National Children’s Bureau (NCB) research ‘The Role of the Independent Reviewing Officers in England’ (March 2014) provides a wealth of information and findings regarding the efficacy of IRO services. The foreword written by Mr Justice Peter Jackson; makes the following comment:
Independent Reviewing Officer (IRO) Annual Report April 2015 – March 2016
The Independent Reviewing Officer must be the visible embodiment of our commitment to meet our legal obligations to this special group of children. The health and effectiveness of the IRO service is a direct reflection of whether we are meeting that commitment, or whether we
are failing.
Page 93

UNCLASSIFIED Version 2 - 21/06/16 2
2. Overview and Update
Key messages Achievements for 15/16 included:
The delivery of outcome focussed care plans
Enhancing children and young people’s understanding of IROs and Child Protection Advisors (CPA) roles and responsibilities
Effective communication with operational teams
Increased quality assurance feedback activity for locality and children looked after teams
Continued challenge to the operational teams regarding care planning
Implementation of new legislation for permanence
2.1 The single child’s plan is now integrated into the whole system and is designed to be responsive and dynamic to the child’s changing needs and environment. Since last summer the new approach to child protection conferences has been piloted across the whole service using the headings below as the central focus for the conference.
2.2
What’s Working Well? (Strengths)
What are we worried about?
(Risks/Needs)
What will it look like if things improve
(Goal)
Who does what, by when?
2.3 Building on this with the implementation of the new social care information system, it is also now central to the processes involving children who are looked after. The purpose is to enhance collaboration with children, parents, carers and other professionals making the plans more accessible, relevant, specific, incremental and focussed on the identified outcome.
2.4 See below for brief example:
What's working well?
Strengths
What are we worried about?
Risks/Needs
What will it look like when things improve?
Goals
Who does what, by when?
Billy and Barney’s behaviour has been calmer since being placed in foster care. Billy and Barney appear to be responding to boundaries and nurturing consistent care. Barney is learning not to retaliate if
Billy and Barney have not shown any distress or emotional response after leaving their mothers care. How their experience of not having their needs for warmth, comfort, food, education and nurture met has affected them over time. How the changing moods and reactions to them from their parents has affected
Billy and Barney are able to show their feelings and vulnerability, trusting that they will be comforted and listened to. Billy and Barney begin to see their needs as important and expect them to be met consistently and warmly. Billy and Barney learn to make sense of their experiences and can take part in thinking about
1) K and SW will do some play activities with them to help them understand about foster care and their care plans. Starting within the week.
2) K will do activities with the boys to build their self-esteem and confidence and help them to understand what is and isn’t safe. Starting immediately.
3) SW and foster carers to consult with LAC/CAMHS to
Page 94

UNCLASSIFIED Version 2 - 21/06/16 3
Billy smacks him. them. Billy and Barney can be very physically aggressive towards each other. Billy and Barney crave adult attention and can be over familiar with people that they don't know making them vulnerable. Impact of losses they have experienced siblings, parents. Barney has asked mum where her baby is.
and talking about what the options are for their future and what they want to happen.
think about meeting the boys’ emotional needs and whether interventions like theraplay might be helpful for Billy and Barney.
2.4 IROs update the care plan during the review to reflect progress and decisions made at the review. To manage a particularly difficult review or to enhance participation IROs have used flipchart paper and held the review in the same way as a child protection conference to good effect. There is an evaluation exercise currently underway regarding the new conference model and the outcome will inform the ongoing development of the LAC review process. So far the feedback has been very positive but it is one part of continual improvement that will be reviewed, revised and enhanced over time.
2.5 Problem resolution and escalation
2.5.1 One of the pivotal roles of the IRO/CPA is to raise issues affecting a child’s care where, for example,
performance issues, care planning and resources are affecting the child or young person’s progress. IROs will always discuss issues with the social worker or their manager but if there is no resolution there is a formal process known as a Dispute Resolution Process whereby the issue can be escalated to the attention of senior managers and ultimately the Chief Executive and Cafcass for resolution.
2.5.2 In previous annual reports only those issues that go into a formal dispute were detailed. These are few and many more are resolved before getting to the formal process. Although we do not at the moment maintain separate records of these, over the last year there have been at least 30 children where issues have been raised by the IRO and these have been resolved without going into a formal dispute.
2.5.3 Although many and varied broadly the main themes were suitability of placements, drift in care
planning including planning for permanence, delay in revocation of Placement Orders, delay in issuing care proceedings, delay in completing risk assessment to inform planning, out of date recording and plans, encouraging broader look at care planning options (placement with parents for example) and encouraging timely decision making sure that children know about the things that are important to them such as school placements.
2.5.4 Some examples include 3 children who are placed together permanently have been asking to have this confirmed but there has been delay due to the social worker not having completed the necessary paperwork. The IRO advocated on behalf of the children and the matter was resolved. A young person’s placement had broken down and the IRO advocated for an assessment of the mother to be included in the care planning and this was resolved but will need on-going review. A further example
Page 95

UNCLASSIFIED Version 2 - 21/06/16 4
involves 2 siblings whose placement was breaking down and there were no placements available for the children to be placed together given their complex and challenging needs. Although understanding the difficulties the IRO was clear that she did not agree with this care plan. A placement was found for them together but the IRO was then once again on the brink of raising a formal dispute because there was no clear risk assessment and the placement was very near to their mother’s home. An urgent risk assessment was undertaken and the placement went ahead.
2.5.5 There is good communication between the IROs, Practice Managers and Social Workers and as well as raising issues, IROs acknowledge good practice. This is also often escalated to senior managers so that it is acknowledged across the service. Examples of these include praise for effective direct work with a child, speedy and timely decision making, managing changes for a child smoothly and passing on children’s feedback. An example of this is two young people who spoke about their foster carers in the review, one saying that the best thing about his foster home was “his opinion always counts” and the other child said “they are the most loving and caring people in the world”.
2.5.6 Over the last year there have been 2 formal challenges using the Dispute Resolution Procedures.
2.5.7 One involved a young person with very challenging behaviour whose placement ended suddenly due to the unexpected death of one of the carers. There was evidence that his placement was struggling to meet his complex needs and there was a delay in an assessment of this placement. Consequently a dispute was raised to challenge the delay in the assessment. This was escalated to senior managers. The assessment was completed and the young person’s placement was changed.
2.5.8 The other was where there was drift in care planning for a child who was voluntarily accommodated. The IRO initiated a dispute and raised this with senior managers. Proceedings were initiated and
there is now a clear plan for the child.
2.5.9 The dispute resolution process is currently under review to change the focus to ‘issues resolution’ whilst maintaining the focus on the professional challenge. This is due to go for wider consultation.
2.6 New legislation
2.6.1 Reflecting the views of children and young people who are securely settled in permanent placements the law changed this year to reduce the levels of Children’s Services intervention in their lives. Specifically this means potentially having one review meeting a year. Where cases are reviewed on an annual basis there will be a paper review that the IRO undertakes by consultation every 6 months. Also social work visits to CLA where annual reviews are agreed can reduce to a minimum of 6 monthly instead of 3 monthly.
2.6.2 These arrangements are agreed by IROs at a review having been authorised by CLA services and are specifically for children who have been in a permanent placement for 1 year. This is currently being trialled with an identified list of potential children and will be evaluated in the autumn.
Page 96

UNCLASSIFIED Version 2 - 21/06/16 5
2.7 Contact cards for children
2.7.1 The idea of having an introductions card with the contact details of the IRO and a brief explanation of their role for children and young people to have when they are first accommodated changed into a card with the contact details of the social worker as well as the IRO and this is currently being finalised by the Children in Care Council.
3 Quantitative information about the IRO/CPA service
1,229 CLA review meetings were held in the year up to 18th February, 2016 (Compared with 1688 in 12/13 and 1530 in 13/14 and 1232 in 14/15)
3.1 Although THRIVE programme is no longer in place the targets for the year remained.
As at 31st March 2015
Thrive target Actual figures
CP LAC 31st March 2016 CP LAC
502 522 Target 469 522
469 548 459 (18.2.16) 548 (18.2.16)
3.2 CLA numbers have been stable over the year ending last year on 548 and on the 18.2.16 they were also 548. However the trend of numbers reducing has continued and at the time of writing they are below 540 but they are still above the target set of 522.
3.3 There are minor differences in the profile of the children as at the 18.2.16.
31.3.15 18.2.16
41% female
59% male
15% BME
6% have a disability
42% female
58 % male
14% BME
7.5% involved with disability teams
3.4 A closer look at the figures indicates that there are marginally more children 52% who are 11 and
under and within this group 55% are male. Consequently the differential in this cohort is significantly lower than the 12 and over group with 62% male and a differential of 24%.
3.5 The analysis of our CLA population who are BME is complex and should also take into account areas
Page 97

UNCLASSIFIED Version 2 - 21/06/16 6
of deprivation. The numbers of children in East Sussex are relatively small but the highest cohort of CLA are white any other background (19 children). We know that in the community as a whole this is also the highest cohort and out of this group the majority are Polish (according to schools information so therefore only reflects school age children). However this does not appear to be reflected in the CLA group where there are 4 children of Polish heritage representing 21% of this group. Ofsted has recently published national information about the personal characteristics, including age, gender and ethnicity, of all children looked after on 31 March 2015 as well as details of the child’s placement, including the type of placement, and location.
3.6 In terms of pressures within East Sussex the numbers for children aged between 10 and 17 is the
same as the national picture of 60% and within that group the highest numbers of children who are looked after are aged between 15 and 17. Much can be written about the complexities of working with these young people but the review process provides a forum for the young person and agencies to come together to consider their needs and develop personal plans.
3.7 Another key finding of the Ofsted report was that CLA from Ethnic Minorities were more likely to be placed in an area with higher levels of crime. Areas with higher levels of crime had 38% of BME children living within them and 25% of White children. The opposite is true in ES but the numbers are so low that it is difficult to draw conclusions. As at 31st March 2015, 5.1% of CLA from Ethnic Minorities were placed in areas with the most crime (top 25%), compared to 12.4% of White British CLA. As at 31st March 2016, 7.7% of CLA from Ethnic Minorities were placed in areas with the most crime (top 25%), compared to 13.0% of White British CLA. There will be further analysis and consideration of the issues affecting CLA in East Sussex over the coming year.
4 Children’s Participation
4.1 Encouraging children and young people to take part in their reviews begins at an early age in recognition of the importance of this to his or her self-esteem and self-efficacy and the consequent impact on good outcomes. Ways of engaging children are many, varied and highly individual and we try to measure this in a number of ways.
4.2 Some national standard measures for children are reported quarterly to the Department of Education. Our target figure for children’s participation in their review for the year is 95%. This is consistently exceeded and this year was higher again than last year at 98.5% compared with 98.2% in 14/15, 95.4% in 13/14 and 96.9% in 12/13. (NB however our figures for this year only go up to the middle of February due to a reporting issue following the implementation of the new recording system in February 2016)
4.3 There was an increase in children and young people attending their reviews, over half, 51.8% compared with 49.1% in 14/15.
4.4 14 children did not participate at all in their reviews. The majority of these were children who were not of an age or understanding to contribute to the review or because it was so complex and there were so many other people speaking to them it was not appropriate to include them on that occasion. The remaining 4 were young people aged 16 & 17 who were either due to attend but did not do so on the day or who are clear that they did not want to attend.
Page 98

UNCLASSIFIED Version 2 - 21/06/16 7
5 What children and young people have been saying to their IRO/CPA
6. Qualitative information about the IRO service
6.1 Late reviews
6.2. Services for CLA are highly regulated with specific timescales for reviews. The unit work hard to achieve this so that children’s plans can be considered in a timely way. Over the last year we have developed new practice guidance for managing timescales when reviews are adjourned or held as a series of meetings. Due to the way these have previously been recorded, in the short term this resulted in a small increase in reviews regarded as late. Unfortunately due to reporting issues following the implementation of the new recording system we do not have absolutely accurate data but there were 6 late reviews reported which is the same figure as in the previous year.
6.3 The majority of these were due to meetings needing to be adjourned due to key people not being present or where the team was not notified of a placement within timescales. One was a couple of days late because it was out of area, the young person had a number of other meetings and key professionals who were important to the child and to care planning were only able to make it on that day.
A young care leaver who is now 22 got in touch with his IRO (who had not seen him for 4 years) asking to meet for coffee, so he could let him know “how well he was doing”. They arranged to meet at the local Costa Coffee shop (other coffee shops are available) and he was very proud to tell him that he was now living independently in his own flat and was working as a care assistant in a residential unit for adults with learning difficulties. He said he wasn’t sure if he would have been able to achieve all this without the consistent support and encouragement that the IRO had given him during LAC Reviews whilst he was being looked after and he had remembered what the IRO had told him about believing in himself and always doing his best. He felt the IRO had been the most consistent person in his life (apart from his foster carers) for the five years he was looked after until he was eighteen.
A girl wrote to her IRO thanking her for asking her
questions (consultation for Lac review) as sometimes they
make her feel safe. A young person thanked their IRO for suggesting life story work as it had been very helpful. A young person rang their IRO to ask who their social worker was because they were now in the leaving care team. Another rang to ask the IRO to help them with a complaint which they duly did and the outcome was positive.
A young person thanked their IRO for suggesting life story work as it had been very helpful.
A young person rang their IRO to ask who their social worker was because they had been transferred to another team and didn’t
know who they were. Another rang to ask the IRO to
help them with a complaint which they duly did and the outcome was
positive.
Page 99

UNCLASSIFIED Version 2 - 21/06/16 8
6.4 Permanence Outcomes
6.4.1 A central function of the IRO role is to ensure timely planning for outcomes for permanence for children and to challenge any drift. IROs liaise closely with Children’s Guardians when there are care proceedings and contribute their views to the final care plan.
6.4.2. A permanence plan should be discussed and agreed at the second review. Looking at children under
12 only, 12% did not have a permanence plan agreed by the 2nd review. This amounted to 10 children and most were situations where there was new information or a new event to consider thus causing reasonable delay but no significant drift. However for 3 children the issue of permanency was not addressed as robustly by the IRO and there was some drift but this has now been addressed.
6.5 Children who put themselves at risk
6.5.1 As part of monitoring services for children who are at risk from, for example, child sexual exploitation, IRO/CPAs record whether a child is identified as at risk and whether agencies are working together effectively to reduce that risk. IROs assessed 124 children and young people as being at high risk. For 7 of these young people the IROs did not judge that agencies were working together sufficiently to address the risks. IRO/CPAs follow this up on an individual basis with the relevant teams.
6.5.2 Four of these children were part of the group mentioned earlier of children where issues were
resolved without recourse to formal dispute procedures. One young woman is vulnerable to child sexual exploitation and has recently been placed in a secure unit. Another was a young man who was putting himself at physical risk at work.
6.5.3 The final one of these 7 is a young man who is experiencing considerable delay in the resolution of a
criminal investigation involving an alleged sexual assault. This has been going on for over 6 months and it is preventing effective planning for him. IROs have raised the issue of children and young people waiting for the resolution of police proceedings with senior managers because it has such a significant impact on young people and their ability to progress in their lives including with education, placements and becoming independent.
7. Professional Profile of the IRO and CPA Service
7.1 The IRO service sits within the Performance and Planning Directorate of Children’s Services and is managed by the Head of Safeguarding, Douglas Sinclair, and two operations managers, Sue McGlynn and Alex Sutton who have the leads for the IRO and Child Protection Adviser (CPA) role in Child Protection and LAC respectively. When the unit was created, chairing Child Protection Conferences (CPC) and LAC reviews were separate specialisms. These two roles are further separated by the different legislation and regulatory protocols underpinning them. Although in the main the roles are no longer separated the names have stuck and chairs have been referred to within this report as IRO/CPA.
7.2 The IRO/CPA team is currently made up of 9.6 fte staff at Practice Manager level (LMG2). This equates to 10 IRO/CPAs, 8 working full time and 2 part time. In order to manage the day to day
Page 100

UNCLASSIFIED Version 2 - 21/06/16 9
demands of the service across the year the Unit has at times required the services of two part time independent consultants.
7.3 This reduction in numbers for children subject to Child Protection plans has had a significant impact on IRO/CPA’s caseloads and with the advent of the new caseload weighting system IRO/CPA’s are seeing their workloads reducing and the average of 90 cases was sustained throughout the year, although this number is still above the national recommendations of the IRO Handbook of between 50 and 70 cases.
7.4 IRO/CPAs undertake a number of different activities:
6.6 IRO/CPAs chair CP Conferences as well as CLA reviews
3 IROs chair CLA reviews
IRO/CPAs also see and quality assure all referrals for a conference on a duty basis
1 IRO has specialist lead for children with disabilities
2 IRO/CPAs lead LSCB training
1 IRO/CPA is part of the Young People’s Participation Group
1 IRO/CPA chairs PREVENT meetings
2 IRO/CPAs led the implementation of the new Conference Model.
7.5 Amanda Glover, Local Authority Designated Officer (LADO), is also part of the unit and has responsibility for managing allegations against people who work, care or volunteer with children. Operations Managers Sue McGlynn and Alex Sutton act as LADO when Amanda is on leave.
8. Conclusion and actions for the year ahead
8.1 An inescapable pressure over the past year has been the impact of the financial savings that need to
be made by the council. Promoting stability for children and young people whose lives have been characterised by instability and abuse so that they can be safe, flourish and realise their potential is a complex challenge to the skills and resources of the service as a whole. During this time of financial pressure, delivering any changes safely for children and young people will draw on the need for teamwork between children, social workers, IRO/CPAs and colleagues in health and education. The effectiveness of this relies on the continuation of good communication and IRO/CPAs raising issues, where necessary, in a timely way. The IRO/CPAs are ideally placed to have eyes over the wider system and to identify any emerging concerns at an early stage to assist in keeping children safe.
Key messages
Improvement activities for the year ahead:
Half day workshops and audits focussed on Mental Health; Care Leavers; diversity needs; sibling contact
Improved quality of outcome focussed care plans
Review progress of implementation of new procedures for Annual reviews
Develop new Dispute Resolution procedure
Consideration to how the IRO role may function within proposed innovations bid to central government in developing our work with adolescents
Page 101

This page is intentionally left blank

Annex 4
1. Summary of Virtual School Developments and Achievements 1.1 The Virtual School (VS) consists of a team who work with Designated Teachers, Social Workers and Foster Carers to support the education of all East Sussex County Council (ESCC) Looked After Children (LAC) and formerly LAC wherever they are educated. 1.2 The VS is led by a Virtual Headteacher and a Head of School, the core team consists of 10 members of staff (7.5 FTE) plus a number of claims only staff, mainly Tutors and Teaching Assistants who work directly with children funded through Pupil Premium ( PP). In addition there are 2 posts funded by PP that extend the remit of the VS to support adopted children and Care Leavers. The whole team consists of 3 Teachers, 2 Education Support Workers, 5 Caseworkers and 2 Administrators. The team was based in Hailsham Community College until April 2016 but is now based at Dunbar Drive in Hailsham although most of the team have adopted an agile approach and therefore work from a variety of bases. 1.3 The core services provided by the VS include monitoring and evaluating the attendance and progress of all ESCC LAC, to provide a named Caseworker for every East Sussex school and for any school outside of East Sussex that has an ESCC LAC on their roll. The VS provides advice, training and support for all those who are involved in a LACs education and will challenge any professional that makes decisions that may impede a child’s educational progress. In addition to these core functions the VS manages the LAC PP which enables significant additional support for learning. 1.4 The VS organises a number of residential and day courses for LAC including a 3 day Year 6 transition residential, a 2 day Year 11 revision residential, spring school in the Easter holidays for Years 7,8 and 9 and weekly summer holiday activities for Early Years children. These residential activities provide the children and young people with specific skills and experiences, and at the same time ensure that VS staff build relationships with the young people that they support. 1.5 The Annual Children in Care Awards evening celebrated the many outstanding achievements this year. Just like the Oscars we invited nominations and all nominees and their carers were invited. Award categories were for Educational Achievement (Attainment and Progress), Making a Positive Contribution and Gifted and Talented. Award winners included two Year 11 students with a Statement of Special Educational Needs (SEN) who achieved 5+ A*-C including English and Maths (including one who achieved an A in Maths). Care Leavers too received awards including one now at University having achieved excellent BTEC and Apprenticeship experience and another, also at University following excellent A level results. Enormous thanks should be extended to Bede’s, a partner boarding school, who hosted and fully funded the event including a sit down dinner and entertainment. We continue to work in close partnership with Bede’s who provide boarding places for a number of our children and allow us to use their facilities during the school holidays. 1.6 ESCC VS continues to be seen as a model of good practice nationally and we await with interest a DfE report into the effectiveness of VSs which we have contributed to. We also continue to work more closely with Ofsted and are keen to support the inspection process through, for example, providing inspectors with the corporate parents view of how schools support LAC to achieve their potential. 2. Virtual School priorities for the school year 15/16 2.1 To expand and increase the quality of the tutor programme and to recruit more skilled staff to provide direct support for children and schools
A significant programme is in place of directly appointing, training and managing a team of
Specialist Teachers. Currently 17 Tutors and 4 Support Staff are employed directly on a claims
only basis. The cost of this programme since September 2014 has been approximately
£155,000. 260 young people have benefited from this programme which contributes significantly
Page 103

2
towards academic progress, particularly in English and Maths and also improves attitudes to
learning. All LAC are offered, and are encouraged to take up 1:1 tuition.
The use of specialist staff to work with the most challenging young people to prevent permanent
exclusion and reduce the likelihood of fixed term exclusions has also been expanded. Although
the impact on overall exclusion levels and persistent absence has yet to be seen in the overall
data, some very powerful individual case studies can illustrate its effectiveness on an individual
basis.
2.2 To improve the skills and support for Designated Teachers and other school staff:
The VS continues to support schools access to the Thrive programme, a therapeutic programme
used in schools. 21 primary schools, 12 secondary schools and 2 special schools have staff who
have undertaken the programme. In East Sussex there are now 50 Thrive practitioners across
schools and Children’s Service teams, 11 in ESBAS, 1 in adoption support, 1 in placement
support and 1 in Lansdowne Secure Unit. The Thrive programme helps to develop a common
approach and a common language in supporting all vulnerable children to access learning in
schools
Attachment training for school staff has been delivered in 70 schools over the last 4 years. 110
Early Years Practitioners have received attachment training. Over 120 foster carers have
attended training by the VS in looking at ways to support the education of the children and young
people they care for. Training specifically tailored to the needs of Designated Teachers continues
to be offered although the uptake is low. The offer of coaching and support to Designated
Teachers and key adults has been available but again the uptake remains low
2.3 To increase the capacity of the VS through working with and through other Children’s Services teams
There has been a very significant improvement with inter-team working with teams across
Children’s Services that work with, or make decisions that may impact on, LAC. There are now
named designated officers, who understand the nature of the care system and share a common
understanding of their duties as corporate parents. There are named officers in ESBAS
(Behaviour Support Service), ISEND (Inclusion, SEN and Disability), School Admissions,
Transport and the Speech and Language team.
A significant priority for the VS two years ago was to recruit an Educational Psychologist (EP) to work 50% of the time within the VS and 50% of the time with EP Team. This has so far proved elusive. Currently the VS is able to access 50 hours of EP time and, whilst this is extremely helpful, there are limitations on how this time is used.
2.4 To expand work experience placements and apprenticeship programme for Care Leavers and the provision of engagement projects..
There have been 12 work experience placements provided to Care Leavers by ESCC since
September 2014. This includes 1 FT internship for one of our undergraduates. There is a service
level agreement and additional funding available for the Youth Employability Service (YES) to
ensure that there are 2 identified YES Advisors who work with Year 11 and the Care Leavers
team. Care Leavers are now part of ESCC Employability Strategy. An accredited course for
independent living skills has been commissioned. A VS Case Worker has been appointed to
work alongside the Care Leavers team to provide and commission engagement and enrichment
projects for young people and help focus work on improving educational and training outcomes.
Page 104
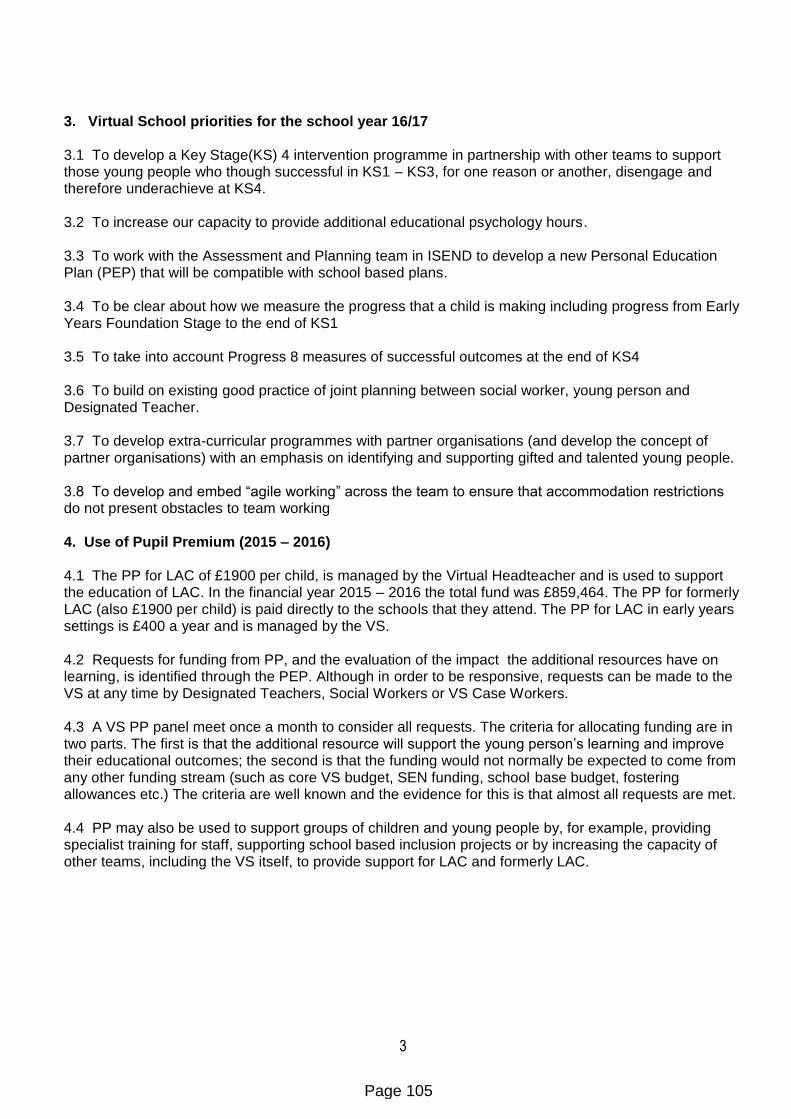
3
3. Virtual School priorities for the school year 16/17 3.1 To develop a Key Stage(KS) 4 intervention programme in partnership with other teams to support those young people who though successful in KS1 – KS3, for one reason or another, disengage and therefore underachieve at KS4. 3.2 To increase our capacity to provide additional educational psychology hours. 3.3 To work with the Assessment and Planning team in ISEND to develop a new Personal Education Plan (PEP) that will be compatible with school based plans. 3.4 To be clear about how we measure the progress that a child is making including progress from Early Years Foundation Stage to the end of KS1 3.5 To take into account Progress 8 measures of successful outcomes at the end of KS4 3.6 To build on existing good practice of joint planning between social worker, young person and Designated Teacher. 3.7 To develop extra-curricular programmes with partner organisations (and develop the concept of partner organisations) with an emphasis on identifying and supporting gifted and talented young people. 3.8 To develop and embed “agile working” across the team to ensure that accommodation restrictions do not present obstacles to team working 4. Use of Pupil Premium (2015 – 2016) 4.1 The PP for LAC of £1900 per child, is managed by the Virtual Headteacher and is used to support the education of LAC. In the financial year 2015 – 2016 the total fund was £859,464. The PP for formerly LAC (also £1900 per child) is paid directly to the schools that they attend. The PP for LAC in early years settings is £400 a year and is managed by the VS. 4.2 Requests for funding from PP, and the evaluation of the impact the additional resources have on learning, is identified through the PEP. Although in order to be responsive, requests can be made to the VS at any time by Designated Teachers, Social Workers or VS Case Workers. 4.3 A VS PP panel meet once a month to consider all requests. The criteria for allocating funding are in two parts. The first is that the additional resource will support the young person’s learning and improve their educational outcomes; the second is that the funding would not normally be expected to come from any other funding stream (such as core VS budget, SEN funding, school base budget, fostering allowances etc.) The criteria are well known and the evidence for this is that almost all requests are met. 4.4 PP may also be used to support groups of children and young people by, for example, providing specialist training for staff, supporting school based inclusion projects or by increasing the capacity of other teams, including the VS itself, to provide support for LAC and formerly LAC.
Page 105

4
Table 1 – Breakdown of Expenditure
Budget Heading Allocated %
Budget Examples of Types of Expenditure
Alternative Provision £56,730 7% Includes accessing courses through third party providers such as DV8, Challenger Troop, Act on It and costs associated with work experience and other off- site provision.
Assessment £5,500 1% Speech and Language Therapists, EP’s
Books £25,226 3% All children in primary school and those children who opt in in secondary school receive termly parcels of books and educational resources that we commission from “Bags of Books” in Lewes.
ESBAS £39,440 5% Ensuring that every LAC has access to ESCC behaviour and attendance support when needed.
ESMS £11,121 1% Ensuring that every LAC has access to the ESCC Music Service.
Extending Remit £92,891 11% Additional staffing to extend the remit of the VS to support all those children and young people who were formerly LAC(adopted children, those on Special Guardianship Orders and Care Leavers in full time education)
Extra Curricular £12,692 1% Music lessons (other than those provided by ESMS) and support for Sport and Drama.
IT Equipment £19,557 2% Laptops, tablets and associated hardware and software including apps.
Resources £8,658 1% A range of items such as magnetic letters, calm boxes, phonic resources etc.
School Based Inclusion Projects
£45,432 5% Where schools with large numbers of LAC have developed inclusion projects that will benefit LAC and other vulnerable learners and have requested part funding
Schools Visits £6,639 1% Usually a maximum of one third of the cost of a school visit is supported (the rest coming from the foster carer’s allowance)
TA/INA Support £56,744 7% Funding for schools to increase Teaching Assistant provision to support individual pupils
Therapy and Support £77,007 9% Fegans, Counselling, Sand play and Thrive sessions
Training £43,826 5% Mainly Thrive training. 18 schools have received support to enable a member of staff to become Thrive trained
Maintaining School Places
£205,835 24% The cost of transporting children who have had to move home either because they have just come into care or where there has been a change of placement.
Tuition £152,166 18% The provision of 1:1 tuition in a range of subjects but predominantly English and Maths
Page 106

5
Table 2 - Categories of Recipients
LAC £737,493 86%
Care Leavers £64,372 7%
Adopted £8,1871 1%
All Groups £49,411 6%
Total £859,464
Table 3 – By Type of School
No. of requests2
No. of children
Nursery £1,318 6 29
Primary £222,578 557 166
Secondary £202,833 452 155
Special £53,212 112 63
Projects3 £357,903 40 328
College £10,965 35 82
University £10,655 4 24
Total £859,464 847
5. Educational Outcomes (end of school year 2015) 5.1 For the last six years LAC in East Sussex have performed well at school when compared to LAC in other local authority areas. Since 2014 the proportion of local LAC with SEN has been greater than the proportion nationally with SEN and this has had an impact on reported comparative outcomes, particularly at KS4. Across all key stages in 2014/15 East Sussex LAC generally outperformed the national outcomes when broken down by SEN groups (those without SEN, those with SEN support and those with Statements of SEN or with Education, Health and Care Plans (EHCP). 5.2 The good educational outcomes for ESCC LAC are achieved as a result of a number of factors: a high proportion of “attachment friendly” schools, the collaborative relationship between social care and educational services, targeted and imaginative use of PP together with a strong sense of corporate parenting responsibilities.
5.3 In KS1 there were 13 children who had been in continuous care for the 12 months ending on 31st March 2015 who undertook KS assessments at the end of Year 2 last summer. 9 children have SEN (69% of the cohort). All the children attend East Sussex schools.
1 Pupil Premium for Adopted Children is paid directly to Schools. This sum relates to funding that has come from the LAC
Pupil Premium .
2 The number of requests refers to the number of separate requests for funding in the year.
3 Projects includes all uses of Pupil Premium that benefit a number of different children for example school based projects,
staff development and building additional capacity.
Page 107

6
KS1
All Pupils LAC (East Sussex)
All (East Sussex)
LAC (England) ALL (England)
% achieving L2+
Reading 69% 91% 71% 90%
Writing 54% 88% 63% 88%
Maths 69% 94% 73% 93%
L2+ Reading LAC (East Sussex)
ALL (East Sussex) LAC (England)
ALL (England)
NO SEN 4/4 100% 96% NA 96%
Statement or EHC Plan 1/4 25% 24% NA 27%
SEN without Statements 4/5 80% 47% NA 60%
L2+ Writing LAC (East Sussex)
ALL (East Sussex) LAC (England)
ALL (England)
NO SEN 4/4 100% 94% NA 95%
Statement or EHC Plan 0/4 0% 19% NA 21%
SEN without Statements 3/5 60% 29% NA 51%
L2+ Maths LAC (East Sussex)
ALL (East Sussex) LAC (England)
ALL (England)
NO SEN 4/4 100% 98% NA 89%
Statement or EHC Plan 1/4 25% 26% NA 29%
SEN without Statements 4/5 80% 50% NA 67%
5.4 Of the four children who failed to achieve level 2 in Reading and Maths, one was working towards national curriculum levels in all three subjects and three achieved level 1 in all three areas. Only one child achieved a level 2 in Reading and Maths but not in Writing. The four children who do not have SEN all achieved level 2s and in most cases achieved higher level 2s (2As and 2Bs). Two children (both with SEN) achieved a level 3, one in Reading and one in Maths. 5.5 In KS2 there were 30 children who had been in continuous care for the 12 months ending on 31st March 2015 who undertook KS assessments at the end of Year 6 last summer. 21 children have SEN (70% of the cohort) and 12 of these (30%) have Statements of SEN or EHCPs. This is higher than national proportions at KS2 where the percentages are 65% and 24% respectively. Of the 30 children, 24 are educated in maintained schools or academies within East Sussex and 6 are educated outside of East Sussex. In total 5 (17%) are educated in special schools.
Page 108

7
L4+ Reading LAC (East Sussex) ALL (East Sussex) LAC (England) Non LAC (England)
NO SEN 9/9 100% 95% 94% 95%
Statement or EHC Plan 4/12 33.3% 39% 33% 30%
SEN without Statements 8/9 88.9% 72% 70% 69%
L4+ Writing LAC (East Sussex) ALL (East Sussex) LAC (England) Non LAC (England)
NO SEN 9/9 100% 96% 92% 95%
Statement or EHC Plan 3/12 25% 26% 20% 21%
SEN without Statements 8/9 88.9% 65% 54% 57%
Level 4+ Maths LAC (East Sussex) ALL (East Sussex) LAC (England) Non LAC (England)
NO SEN 9/9 100% 94% 89% 94%
Statement or EHC Plan 3/12 25% 28% 26% 26%
SEN without Statements 8/9 89% 64% 61% 64%
KS2All Pupils
% achieving L4+ EP L4+ EP L4+ EP L4+
Reading 72% 82% 90% 91% 71% 82% 89%
Writing 71% 79% 89% 96% 61% 84% 87%
Maths 69% 80% 86% 89% 64% 77% 87%
By SEN group
Expected Progress Reading LAC (East Sussex) ALL (East Sussex) LAC (England) Non LAC (England)
NO SEN 9/9 100% n/a 95% 94%
ALL SEN 14/19 74% n/a 73% 78%
Statement or EHC Plan 5/10 50% n/a 53% 49%
SEN without Statements 9/9 100% n/a 85% 83%
Expected Progress Writing LAC (East Sussex) ALL (East Sussex) LAC (England) Non LAC (England)
NO SEN 9/9 100% n/a 96% 97%
ALL SEN 14/20 70% n/a 76% 81%
Statement or EHC Plan 5/11 45% n/a 54% 53% \
SEN without Statements 9/9 100% n/a 88% 86%
Expected Progress Maths LAC (East Sussex) ALL (East Sussex) LAC (England) Non LAC (England)
NO SEN 9/9 100% n/a 92% 93%
ALL SEN 15/21 71% n/a 68% 74%
Statement or EHC Plan 6/12 50% n/a 49% 47%
SEN without Statements 9/9 100% n/a 80% 79%
Whole cohort of 30 - progress cohorts less than this as some data not counted
LAC (England) ALL (England)LAC (East Sussex) All (East Sussex)
5.6 With the exception of progress in Writing, ESCC’s LAC outperformed national cohorts in all measures despite having a higher than average number of children with SEN. All nine children (100%) without SEN achieved at least a level 4 in Reading, Writing and Maths, this compares to just 82% of LAC without SEN across the country as a whole. 43% of our children with SEN achieved level 4 in Reading, Writing and Maths compared to just 33% LAC nationally and 39% of non LAC. In terms of the progress children made all SEN groups outperformed national LAC outcomes in Mathematics and other than those with Statements of SEN or EHCPs, they also outperformed national LAC outcomes in Reading and Writing. 5.7 In KS4 there were 45 children who had been in continuous care for the 12 months ending on 31st March 2015 who finished Year 11 last summer. 40 children have SEN (89% of the cohort) and 26 of these (58%) have Statements of SEN or EHCPs. This is higher than national figures in England generally at KS 4 where the percentages are 55% and 23% respectively. Educationally, this is our most challenging cohort by far. Of the 45 children 33 are educated in East Sussex maintained schools or academies and 12 are educated outside of East Sussex (6 of these in special schools) In total 15 (33%) are educated in special schools.
Page 109

8
(RAG applies to comparison with national LAC outcomes)
All Pupils All (East Sussex) LAC (England) England all 2015
% achieving Cohort % % %
5+ A*-C Including En and Ma 45 8.9% 56.3% 13.8% 57.3%
Expected Progress English 35 31.4% 72.5% 34.5% 71.3%
Expected Progress Maths 36 30.6% 68.8% 26.3% 67.0%
By SEN group
5+ A*-C inc EN and MA LAC (East Sussex) ALL (East Sussex) LAC (England) Non LAC (England)
NO SEN 0/5 '0% 64% 31.70% 64.20%
ALL SEN 4/40 10% 14.80% 8.20% 19.10%
Statement or EHC Plan 2/26 8% 9.90% 2.80% 8.80%
SEN without Statements 2/14 14% 16.70% 12.50% 22.10%
Expected Progress English LAC (East Sussex) ALL (East Sussex) LAC (England) Non LAC (England)
NO SEN 2/4 50% n/a 54.80% 75.30%
ALL SEN 10/31 32% n/a 30.80% 46.50%
Statement or EHC Plan 4/19 21% n/a 17.70% 29.30%
SEN without Statements 6/12 50% n/a 41.80% 51.50%
Expected Progress Maths LAC (East Sussex) ALL (East Sussex) LAC (England) Non LAC (England)
NO SEN 2/4 50% n/a 48.50% 72.50%
ALL SEN 7/32 22% n/a 21.60% 36%
Statement or EHC Plan 2/19 11% n/a 11.70% 21.40%
SEN without Statements 5/13 38% n/a 29.80% 40.20%
whole cohort of 45 - progress cohorts are less than this as some data not counted.
LAC (East Sussex)
5.8 Given the exceptional nature of this cohort these outcomes should be considered as a positive achievement given the proportionally high level of SEN. If indeed the data is analysed against SEN groups and comparisons are made with LAC and non LAC children the picture looks very different. The only group to underachieve were the group of 5 children who did not have identified SEN. Had two of these children gained a grade C rather than a grade D at GCSE English or Maths then East Sussex would have outperformed national outcomes within every group identified above.
Page 110

East Sussex Return Home Interview and Advocacy ServiceDelivered by Missing People
Annual Report: July 2015 to 31st March 2016
211 RHIs done
All targets met or
exceeded!
374 CYP offered a service
18 parents given extra
support
Safety plans, including for suicidal CYP
and exploited CYP
Presentations to social workers,
schools and colleges
33 schools and
colleges informed
of our services
100% of parents &
carers offered 24/7
support
96% of CYP gave
permission to share
everything they told us
100% CYP offered
24/7 support
9 local volunteers recruited
32 CYP received ongoing support
67% CYP reached within 72 hours
56% take up of RHIs
Page 111

1
Contents
1. Executive summary 2
2. Project infrastructure and planning: progress to date 3
2.1. Staffing 3
2.2. Volunteers 3
3. Project delivery: progress to date 3
3.1. The independent voice 3-4
3.2. Referrals 4
3.3. Delivery 5-6
3.4. Time taken (within 24 hours) 6
3.5. Weekend team 6
3.6. Risk indicators identified 7
3.7. Safeguarding 7-8
4. Added value 8
4.1. 1-1 support – referrals 8
4.2. 1-1 support – delivery/case studies 9-10
4.3. Family support 11
4.4. Uptake of the 24 hour helpline 11
4.5. Publicising the project in East Sussex 12
7. Future of the project 12
8. Appendix 1 13
Page 112

2
1. Executive Summary The charity Missing People is the UK’s only charity dedicated solely to missing children and their parents & carers nationally. We are specialists with over 20 years’ experience in supporting this highly vulnerable group. 24 hours a day, 365 days of the year, we work across the UK to reconnect missing children with a safe place and to provide a space for them to explore their options and problems without judgement. We are commissioned by East Sussex County Council to provide a Return Home Interview Service and a 1-1 Support to children and young people across East Sussex between July 2015 and 31st March 2016. Return Home Interviews (RHIs) are being offered to children and young people under the age of 18 who have been missing. RHIs aim to find out why young people went missing, what happened while they were away, and what support they need to be safe and prevent them going missing again. Missing People took part in the Railway Children’s research report into the Social Return of Investment for return home interviews. The cost finding was that £1 invested in RHIs and follow-up support achieves a social value of between £3 and £7, with a best estimate of £5.27. The report showed that of the young people receiving a RHI, 73% of their parents or carers said they had reduced stress. Positive outcomes for stakeholders were; safeguarding, achieving shared objectives, costs savings when missing episodes reduced and provided with police intelligence. The 1-1 Support is offered to young people identified as vulnerable due to their missing experiences and provides one to one tailored support to help reduce their risk of harm. East Sussex County Council recently led the jointly commissioned Pan Sussex Missing Children’s Service. We were successful in winning this three year contract and are delighted to continue working in partnership with East Sussex County Council to improve outcomes for vulnerable children, ensure independence and enhance all partners’ ability to safeguard and reduce risk to missing children. This report sets out delivery and impact between July 2015 and 31st March 2016 and demonstrates how embedded our service is in management of risk to missing & exploited children.
Page 113

3
“I think having a volunteer come to see me is great because they aren’t being paid to be there…they must really want to be there”
Young person (15)
2. Project infrastructure and planning: progress to date 2.1. Staffing
2.2. Volunteers
Our two fully trained volunteers began delivering RHIs in December 2015 and helped meet and greet Pan Sussex candidates for the second round interviews at our Head Office. We recruited seven new volunteers in December giving us a volunteer team of nine. They began their induction in January 2016, due to the tender process we have delayed the full training until our Pan Sussex staff are in place. Our volunteer team will conduct RHIs and support the administration of the project alongside the staff team. We plan to recruit more volunteers across Sussex and Surrey over the next three months. All our volunteers will have an enhanced DBS check and 35 hours of training and induction in readiness for their roles.
3. Project Delivery: Progress to Date
3.1. The independent voice
In East Sussex we are pleased to be working in partnership with children’s services and understand that there are occasions when another professional such as the social worker will be the most appropriate person to offer that young person a RHI.
Research tells us that missing and runaway children respond positively when a truly independent and neutral person offers them a Return Home Interview1. In this context, many children define ‘independence’ as someone who works outside of the statutory sector and who has no ‘official’ powers or involvement in their care. For example, some young runaways ‘feel more secure [talking to other services], because they need to have your permission to tell anyone, unless they think you’re at risk’2.
1 Here to Listen – Children’s Society 2013
2 Smeaton, E. (2013) Running from hate to what you think is love: The relationship between running away and child sexual
exploitation London: Barnardo’s and Paradigm Research
Director of Development & Partenrships
Karen Robinson
(Oversight)
Local Services & Development Manager
Erica Thornton
(Management)
Senior Service Coordinator
Shaun Polley
(Delivery)
RHI Coordinator
Anna Young
(Delivery)
Volunteers
(Delivery)
Page 114

4
“I think it is important that we have been able to develop good working relationships with the Missing People team within the MASH as we have continued to liaise , assess and monitor the CSE risks to young people in East Sussex, my responsibility being the Hastings and Rother area, this then provides us with clear opportunities to make clear decisions and respond within the 72 hour timescales within our child protection guidelines”
Paula Black, MASH Manager
Our team have worked with Social Workers in East Sussex who share this experience, and often encourage our staff to approach the young person in the hope that this independence encourages disclosure. We have also conducted joint visits with Social Worker as a means of facilitating positive interaction either way.
Most importantly, we like to promote choice, and when a young person has a professional they would prefer to see – like a Social Worker or police officer - we encourage this to happen and lend our support as needed.
3.2. Referrals 484 missing episodes have been referred out of 521 missing between July 2015 and 31st March 2016, an average of 12 per week. East Sussex County Council commissioned Missing People to offer RHIs for 425 missing episodes in this time; therefore we have met and exceeded the requirements of the contract. The referral procedure changed in the last quarter when we began receiving electronic notifications from COMPACT. This mechanism changed to help us save the administrative burden for the Police team and enabling us to reach young people soon after they return from being missing. Sometimes young people choose to be seen by a Children’s Services worker because of their pre-existing relationship. On other occasions police or social workers feel it would not be appropriate for us to conduct the RHI if, for example, the young person is under the age of eight.
As soon as we are aware that a young person has returned from being missing the team attempt to make contact with a young person up to three times to offer them an RHI. The interviews are designed to gather information on why a young person was missing, what happened while missing and to assess their support needs so that relevant services and support can be put in place to prevent future harm and future missing incidents.
“My experience of Missing People has been very positive. They are skilled in working alongside young people and advocating their views and experiences whilst having an holistic view of their situations and the risks present”
Sharna Cass, MASH Manager
Page 115

5
3.3. Delivery Since July 2015 we were able to reach and offer a service to 77% of all missing episodes. 56% of young people offered an RHI received an interview with 61% being the highest take-up rate in Q3.
Highlights for the year to date:
• We have achieved 56% uptake of young people agreeing to a Return Home Interview
• We have reached 77% of individuals referred to the service
We have offered a service to 93% (n484) of all missing children incidents in East Sussex. While 12% (n113) of those referred were unreachable, we have written to these young people to let them and their parents & carers know we are here 24/7 in case they decide they would like to access our support. Of the children we offered a service to, we managed to reach 77% (n374) and verbally offer the service. Of these;
• 55% (n211) of episodes young people agreed to a Return Home Interview
• 31% (n119) of episodes young people declined a Return Home Interview
• 11% (n44) of episodes parents or carers declined a Return Home Interview for their child
Page 116

6
In October 2015 we began collecting data for time taken, individuals, legal status, schools and risk indicators which is displayed in more detail in various charts and graphs in this report. Tables containing detailed breakdowns of the number of return home interviews completed by age, sex, legal status, LAC status, school are contained in Appendix 1 (page 12).
3.4. Time taken (72 hours)
Highlight for January to March 2016:
• 67% of episodes - young people were contacted within 72 hours of referral
• 55% of RHIs were delivered within 72 hours of referral
• 85% of RHIs were delivered within 5 consecutive days of referral
In October 2015 we began recording the time it takes to make contact with a young person from after they return from a missing episode. We continued to monitor the time it took to contact from the time we received the notification from police because it wasn’t until 8th December that we began to receive notifications directly from COMPACT. Missing People are now able to attempt contact with from soon after the time of return.
The data below shows how successful we have been in making contact with young people soon after they return from a missing episode. The number of episodes relates to the number of times we were able to capture this information. You will see from the chart below that we conducted
Table relates to data collected between Jan 2016 and March 2016
3.5. Weekend team After successfully winning the contract to deliver RHIs across Sussex and Surrey we were able to recruit two Telephone RHI Coordinators who are based at our head office in London. They work weeked shifts, taking new referrals from Police and making contact with all young people and their families. This ensures that we deliver a seven day a week service and better safeguards those young people going missing over the weekend. This will also increase capacity to reach the 72 hour deadline.
23%
44%
67%
94%
14%
33%
55%
85%
Within 24 hours Within 48 hours Within 72 hours Within 120 hours
Per
cen
tage
Young person contacted (of 124 episodes) RHI conducted (of 58 episodes)
Page 117

7
96% of children gave us permission to share every word they told us during the RHI!
3.6. Risk Indicators Identified Since October 2015 (approx. 110 RHIs) we have recorded any of the OCC’s list of risk indicators identified during an RHI. We anticipate this analysis will develop as we move into a Pan Sussex level of delivery. The chart below relates to risk indicators idenitifed during each missing episode.
3.7. Safeguarding
Understanding why young people run away is essential to assessing risk and planning for the future safeguarding of that child. We find out why children ran away by working in a child-led way so that the child feels safe to talk to us. We have over 20 years’ experience of working in this empowering way, gaining the trust of children by employing and training non-judgemental and highly skilled people
who will support them to open up and accept help. As a result, 96% of children give us permission to share every word they told us with statutory partners. If we had a concern that a child was at risk of significant serious harm, we would breach confidentiality if we were unsuccessful in getting their consent and work together with you to keep them safe from harm. We ensure that every child we meet is 100% clear on what will happen with the personal information they have shared, who will see it and what will happen next. We pride ourselves on the care we take to do this and children tell us it makes them feel safe in our hands. We feel that it helps them tell us more which allows us to work with them to address any harm they may have suffered or be exposed to.
0 20 40 60 80 100 120
Low Self Esteem
Alcohol use
Living in care
Drug issues
Absent from School
History of Abuse
Chaotic/Dysfunctional Family
Depression
Self Harm
Offending
Other Mental Health Issue
Sexually exploited friend
Intellectual Disability/Impairment
Suicidal
STIs/Pregnancy
Accepting gifts from unknown sources
Change in Appearance
Sexual Vulnerability/bullying
Homeless
Physical Injuries
Estranged from family
LGBT/Sexual Orientation Issues
Domestic Abuse
Living in Hostel/B&B
Page 118

8
“I can talk openly because I know what’s
going to happen next. They never hide things
from me” Young person (14)
When conducting RHIs we received information from young people on 15 occasions that we assessed as being a significant safeguarding concern, subsequently sharing with Children’s Services and/or Sussex Police and completing a Statement of Referral for each.
4. Added Value 4.1. 1-1 Support Service: referrals Missing People’s 1-1 support is designed to give practical and emotional support to young people who have been missing and where the risk of harm increases due to their pattern of absconding. They may need support with issues such as self-esteem, safe relationships, bullying and safety planning. For the length of the contract we have provided 32 young people with 1-1 support which surpasses our contracted targeted of 25 young people provided with 1:1 support. Aims of 1-1 support;
• identify goals with every young person we support and plan an intervention which helps achieve these goals
• see each child weekly for a minimum of six weeks and a maximum of nine months
• identify the push and pull factors causing their missing episodes and develop plans to address these
• Support young people to understand and be resilient to (for e.g.) safe relationships, family breakdown, living in care, exploitation, bullying, self-esteem etc.
• Speak up for young people who need assistance articulating their needs to parents, carers, social workers and other professionals.
Page 119

9
4.2. 1-1 Support Service: delivery/case studies3 Amy (not real name), female, age 11
We first met with Amy for a return home interview in December 2015. Amy was a victim of
domestic violence when she was younger and had difficulty control ling her emotions, as a result
she was frequently running away when
she felt stressed or overwhelmed. Amy
was particularly vulnerable as she
seemed to have limited understanding
of the risks posed to her whilst she was
missing. Amy had also not engaged in
education at mainstream school for
three months. We were able to offer
listening support not only to Amy but
also to her mother who was having a
difficult time managing Amy’s
behaviour. This support took place at
the initial return home interview and at
a follow up session in December.
We were able to help ensure Amy had a smooth transition to a more suitable school by providing
weekly 1-1 support sessions to her at her new school over a period of 10 weeks. These support
sessions gave Amy the chance to express her emotions and explore what “safety” means. Amy has
completed a safety plan which helps her to identify who safe adults are (police/teachers/Mum) and
what she can do if she feels like running away (calling the Runaway Helpline/talking to Mum).
Amy told us recently that she enjoyed her support sessions with Missing People as she thinks that
tasks are fun but they also make her think about how to stay safe. Amy said she feels she can trust
her Missing People support worker. We have been able to provide Amy with a consistent and
reliable source of support through a difficult time for her and her family. We were also able to
facilitate a handover to a long term support service for Amy to ensure that her emotional and
education needs are met.
Since commencing support with Missing People Amy has not been reported missing again and said
that if she feels she wants to run away in the future she has a better understanding of safety and
how to manage her emotions.
3 Missing People always use composite case studies with the specific intention of avoiding anyone recognising
themselves or their own clients. In this report, the composites are made up of East Sussex children.
Page 120

10
Chloe (not real name), female, age 13
We first met Chloe for a return home interview in October. Chloe was running away because she was having problems at home (arguing with her parents) and she had also formed a new friendship group who were drinking and using cannabis.
Chloe said that during the initial meeting she felt able to talk openly and honestly about her feelings towards her family and her new friends because we explained we would only share information if there were risks involved. Chloe also disclosed her history of mental health problems and how she felt this was still a problem but she had no support in place to help manage it. Following the RHI we were able to refer Chloe for long term mental health support
and offer her 1:1 support sessions whilst she was held on their waiting list. During this time we facilitated meetings between Chloe and her family to help foster a more positive relationship between them which also helped Chloe open up to her family about her mental health. Throughout our time working with Chloe we were able to build a positive and trusting relationship, having frank and honest discussions about the risks associated with alcohol and drug use. We were able to address all the issues that Chloe raised at her initial return home interview and explore any further issues she was facing. Chloe said Missing People helped her to open up to her family and be more honest with them. Chloe’s mother said our involvement with the family has been positive and helped her to get appropriate help for Chloe. She also felt that whilst on the waiting list with mental health services it was important for Chloe and the family to have a consistent and reliable worker to contact.
4.3. Family support
We offer Missing People’s Family Support service to all parents and carers we have met and spoken with as a result of our RHI and 1-1 Support Service. To date, we have met and spoken with around half of the young people’s parents and carers when we have undertaken a RHI or delivered our 1-1 support, and offered our family support services, which include practical and emotional support and a bespoke counselling service. To date 18 family members have received face to face support and advice from the local team and many more are accessing help from our 24/7 Family Support workers. This includes advising parents on how to keep their children safe, how to report them missing and the 24/7 emotional support available from the charity.
“You’ve been the only consistent face that she’s seen since the start of all this, it’s been good to have someone who she feels comfortable talking to. Whilst things still aren’t great at home at least she knows you’ve been there”
Mother of young person
Page 121

11
4.4. Uptake of 24 hour helpline
We know that the helpline service has been well received by young people we have worked with in East Sussex and that a good proportion of children and parents we meet go on to use our 24/7 services. We are offering our 24/7 free confidential helpline to all children, young people and parents we provide support to in East Sussex. Our helpline is confidential and callers can remain anonymous, so we will not always know whether they have accessed this service. Anecdotally, we believe that children and parents have used these services approximately 204 times between July 2015 and March 2016.
We also know that we speak to between 15-20% of children in East Sussex who have received a TextSafe® while they are missing. A TextSafe® is a supportive message that can be sent to a missing child’s phone so they can reach the Runaway Helpline for free and confidential support. It lets the child or adult know how to reach help via phone, text and email 24 hours a day. Currently, Sussex police uses TextSafe® around 20-30 times per month and some of these uses will be for East Sussex children.
We are working with Sussex police to help them increase uptake of this service which is proven to
safeguard and reconnect missing children. Furthermore, we know that when we have had contact with a child while they are missing it also makes the offer of an RHI upon their return more likely to be accepted.
Furthermore, we know that when we have had contact with a child while they are missing it also makes the offer of an RHI upon their return more likely to be accepted.
4 Estimated number based on feedback from young people, parents and Missing People staff
Page 122
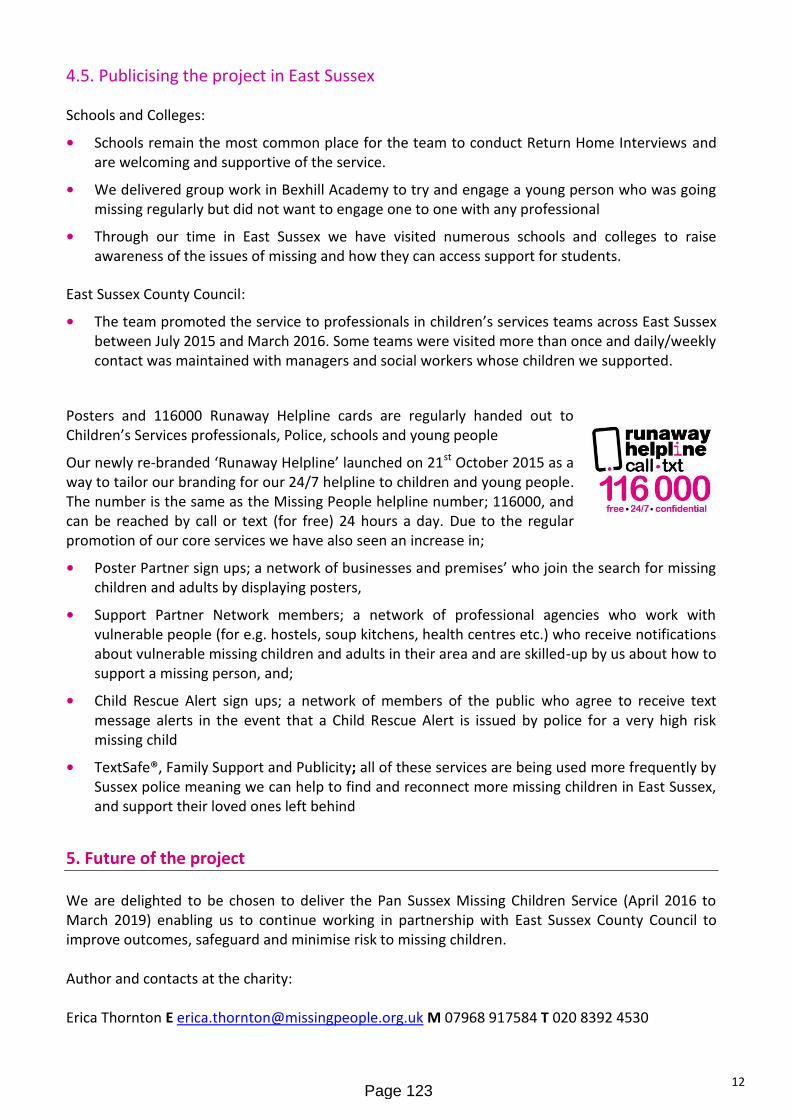
12
4.5. Publicising the project in East Sussex
Schools and Colleges:
• Schools remain the most common place for the team to conduct Return Home Interviews and are welcoming and supportive of the service.
• We delivered group work in Bexhill Academy to try and engage a young person who was going missing regularly but did not want to engage one to one with any professional
• Through our time in East Sussex we have visited numerous schools and colleges to raise awareness of the issues of missing and how they can access support for students.
East Sussex County Council:
• The team promoted the service to professionals in children’s services teams across East Sussex between July 2015 and March 2016. Some teams were visited more than once and daily/weekly contact was maintained with managers and social workers whose children we supported.
Posters and 116000 Runaway Helpline cards are regularly handed out to Children’s Services professionals, Police, schools and young people
Our newly re-branded ‘Runaway Helpline’ launched on 21st October 2015 as a way to tailor our branding for our 24/7 helpline to children and young people. The number is the same as the Missing People helpline number; 116000, and can be reached by call or text (for free) 24 hours a day. Due to the regular promotion of our core services we have also seen an increase in;
• Poster Partner sign ups; a network of businesses and premises’ who join the search for missing children and adults by displaying posters,
• Support Partner Network members; a network of professional agencies who work with vulnerable people (for e.g. hostels, soup kitchens, health centres etc.) who receive notifications about vulnerable missing children and adults in their area and are skilled-up by us about how to support a missing person, and;
• Child Rescue Alert sign ups; a network of members of the public who agree to receive text message alerts in the event that a Child Rescue Alert is issued by police for a very high risk missing child
• TextSafe®, Family Support and Publicity; all of these services are being used more frequently by Sussex police meaning we can help to find and reconnect more missing children in East Sussex, and support their loved ones left behind
5. Future of the project We are delighted to be chosen to deliver the Pan Sussex Missing Children Service (April 2016 to March 2019) enabling us to continue working in partnership with East Sussex County Council to improve outcomes, safeguard and minimise risk to missing children. Author and contacts at the charity: Erica Thornton E [email protected] M 07968 917584 T 020 8392 4530
Page 123

13
Appendix 1 – Data recorded from July 2015 to March 2016
Year (July ’15 - March ‘16) Q4 (Jan - Mar) Q 3 (Oct - Dec ) Q 2 (July - Sep)
Total number of
Episodes Individuals Q3&4 only
Episodes Individuals
Episodes Individuals Episodes
Missing 521 178 n/k 179 104 164
Referred5 % of missing
484 93%
161 90%
77
168 94%
99 95%
155 93%
Reached6 % of referred7
375 77%
124 77%
55 71%
118 84%
70 84%
132 85%
Completed % of reached
211 56%
59 48%
22 40%
72 61%
40 57%
80 61%
Young Person Declined % of reached
119 32%
49 40%
22 40%
35 30%
18 26%
35 27%
Parent/carer declined % of reached
44 12%
16 13%
11 20%
11 9%
8 11%
17 13%
Unreachable % of referred
58 12%
27 30%
12 16%
21 13%
12 12%
10 8%
Social Worker dealing8 % of referred
14 3%
3 2%
3 4%
11 7%
6 6%
0 0%
Other professional doing RHI % of referred
37 8%
7 4%
7 9%
17 10%
10 10%
13 8%
Outstanding % of referred
0
0
0 1 0.6%
1 1%
0 0%
5 6% of missing not referred because Police assess it is not appropriate or another professional is permanently assigned to be dealing with all RHIs
6 Total = Referred – (Unreachable + Social Worker dealing + Other professional dealing + outstanding) – see chart on Page8 for time taken
7 Total = Referred – (Social Worker dealing + Other professional dealing)
8 Referred to MASH due to high no. of referrals or SW deemed most appropriate to deal
Page 124

14
Number of completed; by location
Year to date Q4 Q3 Q2
Episodes Individuals Q3&4 only
Episodes Individuals Episodes Individuals Episodes
Hastings & Rother 102 (48%) 31 (53%) 9 (41%) 30 (42%) 18 (45%) 41 (51%)
Lewes & Wealden 73 (35%) 15 (25%) 9 (41%) 20 (28%) 11 (27.5%) 38 (48%)
Eastbourne 36 (17%) 13 (22%) 4 (18%) 22 (30%) 11 (27.5%) 1 (1%)
Number of completed; by age
Year to date Q4 Q4 Q3 Q2
Episodes Episodes Episodes Episodes Individuals Episodes
11 3 (1%) 1 (1%) 1 0 (0%) 0 (0%) 2 (2%)
12 6 (3%) 0 0 2 (3%) 2 (5%) 4 (5%)
13 15 (7%) 5 (8%) 2 3 (4%) 2 (5%) 8 (10%)
14 84 (40%) 30 (51%) 6 34 (47%) 20 (50%) 20 (25%)
15 49 (23%) 7 (12%) 6 19 (26%) 10 (25%) 23 (29%)
16 37 (18%) 8 (14%) 3 10 (14%) 5 (13%) 19 (24%)
17 16 (8%) 8 (14%) 2 4 (6%) 1 (2%) 4 (5%)
Number of completed; by gender
Year to date Q4 Q3 Q2
Episodes Individuals Q3&4 only
Episodes Individuals Episodes Individuals Episodes
Male 41 (19%) 11 (19%) 5 (23%) 17 (24%) 13 (32%) 13 (16%)
Female 170 (71%) 48 (71%) 17 (77%) 55 (76%) 27 (68%) 67 (84%)
Number of completed; by legal status
Year to date Q4 Q3 Q2
Episodes (Total LAC
not all broken
Individuals Q3&4 only
Episodes Individuals Episodes Individuals Episodes
Page 125

15
down)
Total LAC(Q2 not all broken down) 136 (64%) 26 (44%) 10 46 (64%) 24 (60%) 64 (80%)
East Sussex LAC (not all broken down)
44 (22%) 14 (24%) 7 18 (25%) 8 (20%) 12 (15%)
Other LA LAC (not all broken down)
50 (24%) 12 (20%) 3 28 (39%) 16 (40%) 10 (12%)
Child In Need 11 (5%) 10 (17%) 4 0 (0%) 0 (0%) 1 (1%)
Early Help 22 (10%) 3 (5%) 2 17 (24%) 9 (22%) 2 (3%)
Not open to any agency 11 (5%) 4 (7%) 2 4 (5%) 4 (10%) 3 (4%)
Not yet known 3 (1%) 0 0 2 (3%) 1 (3%) 1 (1%)
Not recorded 70 (33%) 16 (27%) 4 3 (4%) 2 (5%) 51 (64%)
Number of completed LAC; by LAC status
Year to date Q4 Q3 Q2
Episodes Individuals Q3&4 only
Episodes Individuals Episodes Individuals Episodes
IH Foster 21 (15%) 1 (4%) 1 11 (24%) 8 (33%) 9 (14%)
IH Residential 32 (24%) 7 (27%) 3 5 (11%) 5 (21%) 20 (31%)
Private Foster 15 (11%) 3 (11%) 2 3 (6%) 2 (8%) 9 (14%)
Private Residential 38 (28%) 8 (31%) 2 16 (35%) 7 (30%) 14 (22%)
Supported Lodgings 8 (6%) 0 0 7 (15%) 1 (4%) 1 (2%)
Not recorded 22 (16%) 7 (27%) 2 4 (9%) 1 (4%) 11 (17%)
Number of completed; by school attended
Year to date Q4 Q3 Q2
Episodes Q3 only
Individuals Q3&4 only
Episodes Individuals Episodes Individuals Episodes
Beacon Community College 4 3 1 1 1 n/a
Bexhill High School 21 17 1 4 3 n/a
Cuckmere School 1 0 0 1 1 n/a
Page 126

16
Eastbourne Academy 2 0 0 2 1 n/a
FLESS 1 0 0 1 1 n/a
Hailsham Community College 1 0 0 1 1 n/a
Hastings Academy 1 0 0 1 1 n/a
Hastings College 1 0 0 1 1 n/a
Heathfield Community College 1 0 0 1 1 n/a
Helenswood Academy 5 2 2 3 1 n/a
Peacehaven Community School 12 9 4 3 1 n/a
Robertsbridge CC 5 1 1 4 1 n/a
Seaford Head School 1 1 1 1 1 n/a
Seahaven Academy 1 0 0 1 1 n/a
St Richard's Catholic College 1 1 1 1 1 n/a
Willingdon Community School 1 0 0 1 1 n/a
ARK William Parker Academy 0 0 0 0 0 n/a
Chailey School 0 0 0 0 0 n/a
Claverham Community College 0 0 0 0 0 n/a
Gildredge House 0 0 0 0 0 n/a
Priory School 0 0 0 0 0 n/a
Ratton School 0 0 0 0 0 n/a
Ringmer Community College 0 0 0 0 0 n/a
Rye College 0 0 0 0 0 n/a
Rye Studio School 0 0 0 0 0 n/a
The Bishop Bell CofE School 1 1 1 0 0 n/a
The Causeway School 1 1 1 0 0 n/a
The Cavendish School 0 0 0 0 0 n/a
The Eastbourne Academy 0 0 0 0 0 n/a
The Hastings Academy 0 0 0 0 0 n/a
The St Leonards Academy 0 0 0 0 0 n/a
Uckfield CTC 0 0 0 0 0 n/a
Page 127

17
Uplands Community College 0 0 0 0 0 n/a
Page 128

1
East Sussex CAMHS Looked After Children’s Mental Heath Service (LACMHS)
AUDIT 2015 – 2016
LAC in Fostering and Residential (not SECURE provision1)
The Looked After Children’s Mental Health Service (LACMHS) is a multidisciplinary child & adolescent mental health service managed by Sussex Partnership Foundation Trust (SPFT) and co-located with Children’s Services. It provides a specialist service for children and young people who are in the care of East Sussex Local Authority and for whom the plan is permanence2. The LACMHS has the following remit - to contribute to placement stability by supporting the mental health, emotional and behavioural needs of the looked after child and promoting positive attachments with their new carers.
DATA SUMMARY – Year 2015-2016 The LAC Mental Health Service (LACMHS) received 70 NEW referrals during the year 15/16, all of which were accepted and an initial consultation offered. A number of children were also seen urgently due to the severity of the symptoms they presented such as suicidal thoughts and/or serious self-harm, depression or psychotic symptoms. IN ADDITION there was also a cohort of ESCS LAC in receipt of on-going therapeutic support e.g. individual therapy, dyadic therapy (child and carer together), systemic therapy and/or on-going consultation to the foster carer and network. Over the year 15/16 this ranged between 67 (3rd quarter) and 99 (2nd quarter) LAC. LACMHS also provided: *Two Therapeutic Parenting Groups (working with the carers of 16 young people, their Social Workers and Supervising Social Workers) *Weekly consultation to Homefield Broderick residential homes *Weekly consultation to the Care Leavers service *Monthly ‘drop in’ surgeries to the Fostering and each of the three LAC teams *Two Participation days for service users (children, young people and their carers)
1 LACMHS provision to Lansdowne Secure Residential Unit provision has been funded
separately by NHS England since April 2014 when commissioning arrangements transferred. 2 For children/young persons involved in court proceedings there has been a Final Hearing
and a Full Care Order granted (with a Care Plan for Permanence either through Fostering or Adoption*). For children/young persons NOT involved in court proceedings the LAC Review Decisions from the IRO (Independent Reviewing Officer) confirm that the child/young person will remain looked after and that there is no plan to rehabilitate the child/young person with their birth family. This does NOT mean: The child/young person must be in their permanent placement.
Page 129
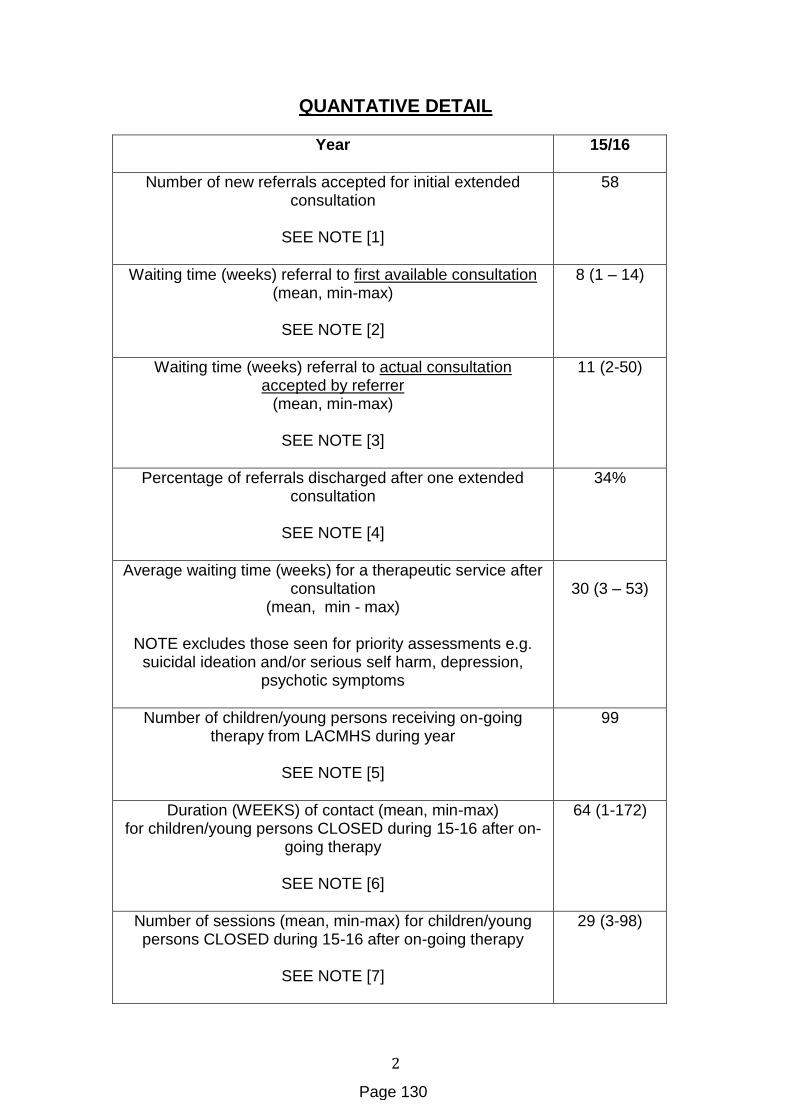
2
QUANTATIVE DETAIL
Year
15/16
Number of new referrals accepted for initial extended consultation
SEE NOTE [1]
58
Waiting time (weeks) referral to first available consultation (mean, min-max)
SEE NOTE [2]
8 (1 – 14)
Waiting time (weeks) referral to actual consultation accepted by referrer
(mean, min-max)
SEE NOTE [3]
11 (2-50)
Percentage of referrals discharged after one extended consultation
SEE NOTE [4]
34%
Average waiting time (weeks) for a therapeutic service after consultation
(mean, min - max)
NOTE excludes those seen for priority assessments e.g. suicidal ideation and/or serious self harm, depression,
psychotic symptoms
30 (3 – 53)
Number of children/young persons receiving on-going therapy from LACMHS during year
SEE NOTE [5]
99
Duration (WEEKS) of contact (mean, min-max) for children/young persons CLOSED during 15-16 after on-
going therapy
SEE NOTE [6]
64 (1-172)
Number of sessions (mean, min-max) for children/young persons CLOSED during 15-16 after on-going therapy
SEE NOTE [7]
29 (3-98)
Page 130

3
Notes to accompany Table 1 [1] All new referrals to LACMHS receive an extended network consultation of 2 hours duration with two members of LACMHS that is attended by the child’s social worker, the foster carer’s supervising social worker and the foster carer. Prior to the consultation the LACMHS clinicians read relevant documents such as the child’s care plan, chronology etc. the aim of which is to ensure that the time is spent focused on the concerns presented. A written report is provided within 24 hours of the consultation outlining the concerns and recommendations made by LACMHS. [2] All non-urgent new referrals receive within 1 week of receipt of referral a phone call from a LACMHS clinician to make an assessment of risk and to determine whether the young person needs to be assessed before the network consultation. Urgent referrals are responded to on the day.
[3] The maximum figure quoted (50) was due to a delay at the request of the referrer, which reflected continuing changes in the young person’s network and an appropriate request to wait before continuing with the consultation. [4] This is a relatively stable figure for LACMHS with a percentage of approximately 1/3 of referrals being discharged after the initial extended consultation, across many years. [5] The range of on-going therapeutic work includes a variety of therapeutic approaches to assessment (e.g. Narrative Story Stem assessments, state of mind assessments, sibling attachment assessments, psychometric tests and neuropsychological assessments) and treatment (e.g. trauma work using EMDR (Eye Movement Desensitization and Reprocessing), intensive psychotherapy, play therapy and CBT (Cognitive Behavioural Therapy) consultation and systemic therapy. All of the work is essentially multi-systemic, that is in collaboration with the wider network supporting the child/young person. [6] The maximum figure quoted (172 weeks which is also the same case as the maximum 98 sessions quoted in the next box) was a case that could not be closed any earlier due to the level of trauma and risk the young woman presented. The intervention was a mix of network and child-carer work at different times and on closing thee was a significant improvement in the young person’s emotional regulation and capacity for seeking help appropriately and a significant reduction in self harming and aggressive/threatening behaviour to others. Had the case been closed prematurely it would have contributed to multiple referrals at times of crisis which were avoided by keeping the case open to us and varying the intensity of intervention across this period as dictated by need and concern expressed. [7] Although provided for interest, this figure must be interpreted with CAUTION as it is by no means an accurate reflection of the hours attached to each case. For example a Narrative Story Stem assessment is typically
Page 131

4
recorded as 2 sessions but takes approximately 13 hours. Likewise a neuropsychological (cognitive) assessment is typically recorded as 2 or 3 direct contacts but takes approximately 10 hours. In addition most cases require additional support outside of the direct appointment with phone calls for some in-between sessions and liaison with the wider network supporting the child/young person ensuring that a joined up approach to the child/young person’s needs is aimed for.
QUALITATIVE DETAIL
Service user feedback (on both the quality of delivery and outcome on referred problems) received for LACMHS is consistently positive with the only criticism of the service being the delay for an on-going service. Examples of feedback received during the year 2015-2016 from young people, their carers and social workers:
“It has looked at the needs of the whole family and not just the needs of the child as although the child’s needs are our main focus it has strengthened our ability to uphold that.”
“Helped us to understand how M perceives her world and history and enabling us to better meet her individual needs. Specific and expert input.”
“I feel that not only our child’s needs have been appropriately identified and worked with but the input we have received has significantly contributed to the on-going formulation of a well functioning family unit.”
“The appointments have always been positive and constructive. The care has been genuine and wonderful results have been achieved.”
“My child and I have been able to build an excellent relationship with our therapist. She has listened, given sound advice and help and always responded to any concerns/questions in a positive and helpful manner.”
“LACMHS have provided both our child and us with excellent information, guidance and support which has enabled us to continue to effectively manage our child’s diverse and changing needs. Without support from LACMHS, SW and SSW and the Virtual School this would not have been possible.”
“Being able to speak to the clinician and getting an understanding of underlying problems.”
“Very kind staff and people who listen”.
“All the professional advice given to me really helps and makes me think about the other ways of dealing with situations”.
“Very helpful staff”.
Page 132

5
“Our clinician is very professional and the children look forward to
seeing him”
“Overall a really helpful service”
“Being able to express myself and show myself what characteristics I have was really good”.
“The care was really good because my psychologist gave me some strategies/techniques to help me to calm down and to help me to control my anger. The strategies/techniques have really helped me a lot.”
“The service I received went well and everything was absolutely perfect, helpful, advisable and good. There was nothing I disliked”.
“They listened to the problems and tailored the sessions to the
problem”.
“Felt we were listened to and all questions answered”.
“Good team work”
“Everyone that has been involved with the young person is very approachable and friendly”.
“I was kept up to date with what was going on”.
“Clinician was very friendly and helpful.”
Examples of feedback received from foster carers who attended the Therapeutic Parenting Group during the year 2015-2016:
“The Therapeutic Parenting Group training has been invaluable, an absolute game changer. We have learnt so much about brain based parenting, had practical guidance and support and an arena to specially focus on our child’s needs. The information, support and helpful suggestions offered within theses sessions offered by both facilitators has been provided at a good and steady pace. The new techniques reviewed at each session has facilitated a deeper understanding and awareness of not only what brain based parenting is, but how to use it to meaningful effect. All of the topics covered have been so beneficial we will be continuing to study in more depth when the course is over”
“Found the trainers and their warm and compassionate approach, whilst also professional, helped provide a foundation to the group being a positive and supportive one – where it was a safe place to be. I found I looked forward to attending and it provided a positive therapeutic time for me. It also gave me time to stop and think. I think it is a shame this course is not more readily available to more foster carers and supervising social workers”.
Page 133
6
“I thoroughly enjoyed the course. I feel I am better equipped to
continue my role as a foster carer and have learned such a lot (about myself as well). Taking away a folder of useful literature to be able to refer to was useful”.
“All information throughout the course has been of value”
“Learning new skills has really helped us all live in a calmer household”
In addition feedback from foster carers at an Education Committee inquiring into the Mental Health of LAC (3rd March 2016 on BBC Parliament):
"Really helpful in East Sussex. Very good. Only thing- discharge, the problem hasn't gone away, need CAMHS again if having flashbacks or something. The SW got (YP name) back in to CAMHS again in two weeks. It's been very good".
"I found service in East Sussex fantastic, really really good. Since moving to different part of the country, I've had no service for them at all around here".
CONCLUSION
LACMHS continues to work in close collaboration with its partner agencies to provide a respected service to ESCS LAC for whom the care plan is permanent accommodation out of their birth family. The response to new referrals is prompt (e.g. a risk assessment being provided within one week) and initial advice in an extended consultation thorough and inclusive of multiple perspectives with excellent communication across multiple teams and agencies. On-going therapeutic work is highly regarded. However the prevailing issue for LACMHS over the last few years has been the increasing complexity of the LAC cohort and the demand for intensive on-going support to the child/young person and their networks. The impact on service delivery has meant that the waiting time for on-going therapeutic interventions has increased. A proposal for a Service Redesign to address some of this delay has been written for discussion with our partner agencies and commissioner. Rachel Swann Principal Clinical Psychologist Looked After Children’s Mental Health Service June 2016
Page 134

Report to:
Cabinet
Date: 13 December 2016
By: Chief Operating Officer
Title of report: Annual Audit Letter and fee update 2015/16
Purpose of report: To seek Cabinet’s approval of the Annual Audit Letter and fee update for 2015/16.
RECOMMENDATION – The Cabinet is recommended to approve the Annual Audit Letter and the fee update for 2015/16.
1. Background
1.1 The external audit fees for 2015/16 was £110,175 (County Council of £83,572 and the Pension Fund of £26,603) for the core audit in line with the planned fee. The auditors charged £3,713 for the provision of tax advisory services during 2015/16. The costs of these additional services were funded funded from existing budgets.
1.2 KPMG also performs additional audit-related services for the certification of the Teachers Pension Authority return which is outside of Public Sector Audit Appointment’s certification regime. This certification work is still ongoing, and the final fee will be confirmed at the end of the audit.
2. Supporting Information
2.1 The Annual Audit Letter (AAL) attached as Appendix A summarises the key issues arising from the work carried out by the Council’s external auditor (KPMG) during the year. This report contains no new findings or recommendations, but reflects the key issues already reported in the Annual Governance Report.
2.2 KPMG previously issued an unqualified opinion on the Authority’s financial statements on 21 July 2016. This means that KPMG believe the financial statements give a true and fair view of the financial position of the Authority and of its expenditure and income for the year. The financial statements also include those of the pension fund.
2.3 The AAL has been circulated to all Councillors and published on the Council’s website. The AAL was presented to the Audit, Best Value & Community Services Scrutiny Committee on 8 November 2016 and any comments from the Committee will be provided to the Cabinet orally at its meeting on 13 December 2016.
2.4 The Council would like to extend its thanks to KPMG for their professionalism during this audit.
3. Conclusion and reasons for recommendations
3.1 The Cabinet is recommended to approve the Annual Audit Letter and the fee update for 2015/16.
KEVIN FOSTER Chief Operating Officer Contact Officers: Ola Owolabi, Head of Accounts and Pensions Tel: 01273 482017 Email: [email protected] LOCAL MEMBERS
All
BACKGROUND DOCUMENTS
Page 135
Agenda Item 9

1. Independent Auditor’s (KPMG) Annual Governance Report on ESCC Accounts and Value for Money conclusion report
2. Independent Auditor’s (KPMG) Annual Governance Report on Pension Fund Accounts
Page 136

Annual Audit Letter 2015/16
East Sussex County Council
October 2016
Page 137

2
Document Classification: KPMG Confidential
© 2016 KPMG LLP, a UK limited liability partnership and a member firm of the KPMG network of independent member firms affiliated with KPMG International Cooperative (“KPMG International”), a
Swiss entity. All rights reserved.
The contacts at KPMG
in connection with this
report are:
Phil Johnstone
Director
KPMG LLP (UK)
Tel: +44 20 76941907
Scott Walker
Manager
KPMG LLP (UK)
Tel: +44 12 93652167
This report is addressed to the Authority and has been prepared for the sole use of the Authority. We take no responsibility to any member of staff acting in their individual
capacities, or to third parties. Public Sector Audit Appointments issued a document entitled Statement of Responsibilities of Auditors and Audited Bodies summarising where
the responsibilities of auditors begin and end and what is expected from audited bodies. We draw your attention to this document which is available on Public Sector Audit
Appointment’s website (www.psaa.co.uk).
External auditors do not act as a substitute for the audited body’s own responsibility for putting in place proper arrangements to ensure that public business is conducted in
accordance with the law and proper standards, and that public money is safeguarded and properly accounted for, and used economically, efficiently and effectively.
We are committed to providing you with a high quality service. If you have any concerns or are dissatisfied with any part of KPMG’s work, in the first instance you should
contact Phil Johnstone, the engagement lead to the Authority, who will try to resolve your complaint. If you are dissatisfied with your response please contact the national lead
partner for all of KPMG’s work under our contract with Public Sector Audit Appointments Limited, Andrew Sayers ([email protected]). After this, if you are still
dissatisfied with how your complaint has been handled you can access PSAA’s complaints procedure by emailing [email protected], by telephoning 020 7072
7445 or by writing to Public Sector Audit Appointments Limited, 3rd Floor, Local Government House, Smith Square, London, SW1P 3HZ.
Contents
Page
Report sections
— Headlines 3
Appendices
1. Summary of reports issues
2. Audit fees
5
6
Page 138

3
Document Classification: KPMG Confidential
© 2016 KPMG LLP, a UK limited liability partnership and a member firm of the KPMG network of independent member firms affiliated with KPMG International Cooperative (“KPMG International”), a
Swiss entity. All rights reserved.
This Annual Audit Letter
summarises the outcome
from our audit work at East
Sussex County Council in
relation to their 2015/16 audit
year.
Although it is addressed to
Members of the Authority, it
is also intended to
communicate these key
messages to key external
stakeholders, including
members of the public, and
will be placed on the
Authority’s website.
HeadlinesSection one
VFM conclusion We issued an unqualified conclusion on the Authority’s arrangements to secure value for money (VFM conclusion) for 2015/16
on 21 July 2016. This means we are satisfied that during the year that Authority had proper arrangements for informed decision
making, sustainable resource deployment and working with partners and third parties.
To arrive at our conclusion we looked at the Authority’s arrangements to make informed decision making, sustainable resource
deployment and working with partners and third parties.
VFM risk areas We undertook a risk assessment as part of our VFM audit work to identify the key areas impacting on our VFM conclusion and
considered the arrangements you have put in place to mitigate these risks.
Our risk assessment identified the following VFM risks:
— Bexhill - Hastings Link Road
— Better Care Fund
There are no matters of any significance arising as result of our audit work in these VFM risk areas.
We have concluded that the Authority has made proper arrangements to secure economy, efficiency and effectiveness in its use
of resources.
Audit opinion We issued an unqualified opinion on the Authority’s financial statements on 21 July 2016. This means that we believe the
financial statements give a true and fair view of the financial position of the Authority and of its expenditure and income for the
year. The financial statements also include those of the pension fund.
Financial
statements audit
We identified an audit difference which relates to a reclassification of fixed assets. We also identified an error in the Lease’s note.
Both of these were corrected by management and neither of which had an impact on the Comprehensive Income and
Expenditure Statement (CIES) or Reserves.
We did not identify any uncorrected audit differences.
We have not identified any control findings or other recommendations in the course of our audit.
As part of our audit work we followed up on the Authority’s progress against previous audit recommendations. We are pleased to
report that the Authority has taken appropriate action to address the issues that we have previously highlighted through high
priority recommendations.
Annual
Governance
Statement
We reviewed your Annual Governance Statement and concluded that it was consistent with our understanding.
Page 139

4
Document Classification: KPMG Confidential
© 2016 KPMG LLP, a UK limited liability partnership and a member firm of the KPMG network of independent member firms affiliated with KPMG International Cooperative (“KPMG International”), a
Swiss entity. All rights reserved.
This Annual Audit Letter
summarises the outcome
from our audit work at East
Sussex County Council in
relation to their 2015/16 audit
year.
Although it is addressed to
Members of the Authority, it
is also intended to
communicate these key
messages to key external
stakeholders, including
members of the public, and
will be placed on the
Authority’s website.
Headlines (cont.)Section one
Pension fund
audit
There were no significant issues arising from our audit of the pension fund and we issued an unqualified opinion on the pension
fund financial statements as part of our audit report.
Whole of
Government
Accounts
We reviewed the consolidation pack which the Authority prepared to support the production of Whole of Government Accounts
by HM Treasury. We reported that the Authority’s pack was consistent with the audited financial statements.
Certificate We have received an objection to the Authority’s financial statements which we are currently considering. This means that we
are not yet able to issue our certificate.
Audit fee Our fee for 2015/16 was £83,572 for the Council, excluding VAT. This is a reduction in audit fee, compared to 2014/15, of
£27,857 (25%). Further detail is contained in Appendix 3.
Page 140

5
Document Classification: KPMG Confidential
© 2016 KPMG LLP, a UK limited liability partnership and a member firm of the KPMG network of independent member firms affiliated with KPMG International Cooperative (“KPMG International”), a
Swiss entity. All rights reserved.
This appendix summarises
the reports we issued since
our last Annual Audit Letter.
Appendix 1: Summary of reports issuedAppendices
2016
January
February
March
April
May
June
July
August
September
October
November
The External Audit Plan set out our approach to the audit of the
Authority’s financial statements and to work to support the VFM
conclusion.
External Audit Plan (March 2016)
The Audit Fee Letter set out the proposed audit work and draft fee
for the 2016/17 financial year.
Audit Fee Letter (April 2016)
The Auditor’s Report included our audit opinion on the financial
statements including the pension fund accounts along with our VFM
conclusion.
Auditor’s Report (July 2016)
The Report to Those Charged with Governance summarised the
results of our audit work for 2015/16 including key issues and
recommendations raised as a result of our observations. We issued
a separate report for the audit of the pension fund.
We also provided the mandatory declarations required under
auditing standards as part of this report.
Reports to Those Charged with Governance (July 2016)
This Annual Audit Letter provides a summary of the results of our
audit for 2015/16.
Annual Audit Letter (September 2016)
Page 141

6
Document Classification: KPMG Confidential
© 2016 KPMG LLP, a UK limited liability partnership and a member firm of the KPMG network of independent member firms affiliated with KPMG International Cooperative (“KPMG International”), a
Swiss entity. All rights reserved.
This appendix provides
information on our final fees
for the 2015/16 audit.
To ensure transparency about the extent of our fee relationship with
the Authority we have summarised below the outturn against the
2015/16 planned audit fee.
External audit
Our final fee for the 2015/16 audit of the Authority was £83,572,
which is in line with the planned fee
Our final fee for the 2015/16 audit of the Pension Fund was in line
with the planned fee of £26,603.
Our fees are still subject to final determination by Public Sector Audit
Appointments.
Other services
We also perform additional audit-related services for the certification
of the Teachers Pension Authority return which is outside of Public
Sector Audit Appointment’s certification regime. This certification
work is still ongoing. The final fee will be confirmed through our
reporting on the outcome of that work in September 2016.
We also charged £3,713 for tax advice. This work was not related to
our responsibilities under the Code of Audit Practice.
Appendix 2: Audit feesAppendices
Page 142

Document Classification: KPMG Confidential
The KPMG name and logo are registered trademarks or trademarks of KPMG International.
The information contained herein is of a general nature and is not intended to address the circumstances of any particular individual or entity.
Although we endeavour to provide accurate and timely information, there can be no guarantee that such information is accurate as of the date it is
received or that it will continue to be accurate in the future. No one should act on such information without appropriate professional advice after a
thorough examination of the particular situation.
© 2016 KPMG LLP, a UK limited liability partnership and a member firm of the KPMG network of independent member firms affiliated with KPMG
International Cooperative (“KPMG International”), a Swiss entity. All rights reserved.
KPMG LLP is multi-disciplinary practice authorised and regulated by the Solicitors Regulation Authority. For full details of our professional
regulation please refer to ‘Regulatory Information’ at www.kpmg.com/uk
kpmg.com/appkpmg.com/socialmedia
Page 143

This page is intentionally left blank