(Public Pack)Agenda Document for North East of Scotland ...
324
Councillor Peter Argyle, Chair, Dr Margaret Bochel and Councillor Sandra Macdonald Vice Chairs, Councillor David Aitchison, Colin Allanach, Stephen Archer, Gale Beattie, Councillor Philip Bell, Councillor John Cox, Mr Gerry Donald, Mr George Mair, Councillor Alex Nicoll, Councillor Colin Pike, Mr Ian Ross and Councillor Jennifer Stewart Aberdeen City Council Substitute Members:- Councillors Ross Grant, Brett Hunt, Michael Hutchison and Ian Yuill. Aberdeenshire Council Substitute Members:- Councillors George Carr, Martin Ford, Ian Mollison and Gillian Owen Please note that a substitute member may only participate in the meeting when a substantive member is absent. Should you require further information regarding the Agenda, please contact Rab Dickson 01224 346680 NORTH EAST OF SCOTLAND TRANSPORT PARTNERSHIP Meeting of Board (Committee Room 2, Woodhill House, Aberdeen) WEDNESDAY, 19 JUNE 2019 at 2.00 pm. AGENDA 1a Declarations of Interest 1b Minute of Board Meeting, 17 April 2019 (Pages 3 - 10) 1c Non Councillor Members (Pages 11 - 14) 2 Presentations - Not taken up 3 Strategy 3a Director's Report (Pages 15 - 24) 3b Regional Transport Strategy Progress and Update (Pages 25 - 30) 3c Annual Monitoring Report (Pages 31 - 94) 3d Annual Nestrans Performance Indicators (Pages 95 - 100) 3e Cumulative Transport Appraisal (Pages 101 - 106) 4 Projects Public Document Pack
-
Upload
khangminh22 -
Category
Documents
-
view
0 -
download
0
Transcript of (Public Pack)Agenda Document for North East of Scotland ...
Councillor Peter Argyle, Chair, Dr Margaret Bochel and Councillor Sandra Macdonald Vice Chairs, Councillor David Aitchison, Colin Allanach, Stephen Archer, Gale Beattie, Councillor Philip Bell, Councillor John Cox, Mr Gerry Donald, Mr George Mair, Councillor Alex Nicoll, Councillor Colin Pike, Mr Ian Ross and Councillor Jennifer Stewart
Aberdeen City Council Substitute Members:- Councillors Ross Grant, Brett Hunt, Michael Hutchison and Ian Yuill.
Aberdeenshire Council Substitute Members:- Councillors George Carr, Martin Ford, Ian Mollison and Gillian Owen
Please note that a substitute member may only participate in the meeting when a substantive member is absent.
Should you require further information regarding the Agenda, please contact Rab Dickson 01224 346680
NORTH EAST OF SCOTLAND TRANSPORT PARTNERSHIP
Meeting of Board(Committee Room 2, Woodhill House, Aberdeen)
WEDNESDAY, 19 JUNE 2019 at 2.00 pm.
AGENDA1a Declarations of Interest
1b Minute of Board Meeting, 17 April 2019 (Pages 3 - 10)
1c Non Councillor Members (Pages 11 - 14)
2 Presentations - Not taken up
3 Strategy
3a Director's Report (Pages 15 - 24)
3b Regional Transport Strategy Progress and Update (Pages 25 - 30)
3c Annual Monitoring Report (Pages 31 - 94)
3d Annual Nestrans Performance Indicators (Pages 95 - 100)
3e Cumulative Transport Appraisal (Pages 101 - 106)
4 Projects
Public Document Pack
4a Fraserburgh and Peterhead to Aberdeen Strategic Transport Study - Further Rail Work (Pages 107 - 110)
4b A96 Dualling (Pages 111 - 114)
4c Roads Hierarchy Study (Pages 115 - 130)
4d Cross City Connections (Pages 131 - 134)
5 Action Plans
5a Bus Action Plan (State of Network) (Pages 135 - 192)
6 General
6a Progress Report (Pages 193 - 230)
6b Publications and Consultations (Pages 231 - 238)
7 Budget Matters
7a Annual Audit Plan 2018-2019 (Pages 239 - 252)
7b Unaudited Annual Accounts for 2018/19 (Pages 253 - 306)
7c 2019/20 Budget Matters (Pages 307 - 312)
8 Information Bulletin (Pages 313 - 318)
9 Conferences and Presentations (Pages 319 - 320)
10 Pending Business and Reports for Future Meetings (Pages 321 - 322)
CONFIDENTIAL
11 Staffing Matters (Pages 323 - 326)
Should you require any further information about this agenda, please contact Mark Masson, email [email protected], or telephone 01224 522989
NORTH EAST OF SCOTLAND TRANSPORT PARTNERSHIP
Minute of Meeting of the North East Scotland Transport Partnership Board
Aberdeen, Wednesday, 17 April 2019
Present: Councillor Peter Argyle (Chairperson); Dr Maggie Bochel (Vice Chair); Councillors Philip Bell, Alex Nicoll and Ross Grant (as substitute for Councillor Macdonald, Vice Chair); Councillors David Aitchison, John Cox and Colin Pike and Mr George Mair and Mr Ian Ross.
In Attendance: Alex Hynes (ScotRail/Network Rail Alliance) and Ewan Tait (ScotRail); Councillor Ian Mollison (Aberdeenshire Council); Jenny Anderson, Louise Calder, Kirsty Chalmers, Rab Dickson and Kelly Wiltshire (Nestrans); Gale Beattie, Elena Carlisle and Mark Masson (Aberdeen City Council); and Paul Finch, Ruth Taylor and Ewan Wallace (Aberdeenshire Council).
Apologies: Councillor Sandra Macdonald, Councillor Jennifer Stewart, Mr Gerry Donald, Mr Stephen Archer and Derrick Murray.
Please note that if any changes are made to this minute at the point of approval, these will be outlined in the subsequent minute and this document will not be retrospectively altered.
DECLARATIONS OF INTEREST
1. There were no declarations of interest intimated.
MINUTE OF BOARD MEETING OF 13 FEBRUARY 2019
2. The Board had before it the minute of its previous meeting of 13 February 2019, for approval.
With reference to article 7(ii) of the minute, Rab Dickson advised that following receipt of the draft report from Consultants, a report in relation to the Fraserburgh and Peterhead to Aberdeen - Strategic Rail Study would now be submitted to the Board meeting in June 2019.
The Board resolved:-(i) to approve the minute as a correct record; and(ii) to note the information provided.
Page 3
Agenda Item 1b
2
NORTH EAST OF SCOTLAND TRANSPORT PARTNERSHIP17 April 2019
PRESENTATION BY ALEX HYNES, MANAGING DIRECTOR SCOTRAIL/NETWORK RAIL ALLIANCE
3. The Committee received a presentation from Alex Hynes, Managing Director ScotRail/Network Rail Alliance.
Mr Hynes made reference to current train service performance and acknowledged the public’s frustration in terms of the number of delays and train cancellations, but intimated that they were working hard to improve the situation in the coming weeks and months.
He advised that additional funding (£18M) had been invested in operational issues to quickly address the situation, which included the recruitment of 55 new train drivers and the introduction of three additional trains to mitigate the impact on customers in terms of the delays and cancellations and to ensure that similar problems would not occur in future.
Mr Hynes provided information on future timetabling, train stock and station improvements and the following was noted:-
First phase of additional services delivered in December 2018; Improved cross rail services and reduced journey times between Aberdeen and
the central belt to be delivered from May 2020 using all 26 new and refurbished high-speed trains;
£16M for Aberdeen Railway Station improvements, including new roof, improved customer access, ticketing and waiting facilities, cycle and taxi accessibility, replacement flooring and increased retail options;
£330M for the upgrade of the route between Aberdeen and Inverness will provide a better commuter service;
Aberdeen to Inverness route will operate a new improved timetable with regular services to increase seating at peak times;
15-week closure of railway line to install 16 miles of new track between Dyce and Inverurie commences next week;
Construction of Kintore Station will be completed in May 2020; and Consultation to take place in relation to new timetable which will be introduced in
December 2019.
Mr Hynes responded to a number of questions from members of the Board.
The Board resolved:-to thank Mr Hynes for attending the meeting today.
DIRECTOR'S REPORT
4. The Board had before it a report which provided an update on liaison activity with other RTP’s, the Scottish Government and other organisations.
The report recommended:-
Page 4
3
NORTH EAST OF SCOTLAND TRANSPORT PARTNERSHIP17 April 2019
that the Board note the progress on liaison arrangements with other RTP’s, the Scottish Government and others and the arrangements for future meetings.
Rab Dickson highlighted amongst other items, the following areas for members’ attention:-
Strategic Transport Appraisal Members’ workshop, Aberdeen, 8 February 2019; Business Alliance Board, Aberdeen, 28 February 2019; Visit from the Active Nation Commissioner, Aberdeen, 26 March 2019; and Aberdeen to Central Belt Reference Group, Dundee, 1 April 2019.
The Board resolved:-to approve the recommendation.
REGIONAL TRANSPORT STRATEGY PROGRESS AND UPDATE
5. The Board had before it a report which updated members in relation to the development of the next Regional Transport Strategy (RTS) and recommended future actions.
The report recommended:-that the Board –(a) note the progress being made in regard to the development of the RTS to 2040;
and(b) authorise officers to develop discussion papers for the purpose of engaging with
stakeholders and the public through the website.
The Board resolved:-(i) to approve the recommendations; and(ii) to circulate discussion papers to Board members prior to publishing them on the
website.
RAIL UPDATE
6. The Board had before it a report which provided information on the progress of a number of matters in relation to railways in the north east of Scotland.
The report recommended:-that the Board –(a) note the content of this report, including progress made regarding the new station
at Kintore and the upgrade of Aberdeen-Inverurie;(b) note the efforts to publicise and engage with passengers regarding the potential
disruptions due to the works scheduled for this summer;(c) instruct officers to continue dialogue with Transport Scotland and ScotRail in
regard to timetable changes with a view to encouraging adjustments which will mitigate some of the perceived loss of service; and
Page 5
4
NORTH EAST OF SCOTLAND TRANSPORT PARTNERSHIP17 April 2019
(d) instruct officers to develop a bid to the Local Rail Development Fund to undertake an assessment into the potential for new stations between Aberdeen and Laurencekirk.
Rab Dickson highlighted the following items for members’ attention:- work had commenced on the construction of Kintore Station, which was
anticipated to be completed in 12 months; the Aberdeen to Inverness upgrade would entail a period of blockade over the
summer with replacement buses operating; timetable and performance considerations due to ScotRail’s proposals for
‘Revolution in Rail’ and difficulties in delivery of new rolling stock and the knock-on effect in terms of driver training;
Insch accessibility study – AECOM appointed to undertake study which will include consultation with residents, local MP’s, MSP’s, Councillors, access and disability groups and the local Community Council;
Department of Transport announced additional £300M of funding to improve access to stations across the UK, with six selected in Scotland;
Local Rail Development Fund – assessment of potential for new railway stations to the south of Aberdeen was agreed to be taken forward by Nestrans previously, applications for funding support require to be submitted to Transport Scotland by 28 June 2019.
The Board resolved:-(i) to approve the recommendations; and(ii) to welcome the news of the commencement of works at Kintore Station.
PROGRESS REPORT
7. The Board had before it a progress report which outlined the status of variousactivities in support of the Regional Transport Strategy.
The Board resolved:-to note the content of the progress report.
PUBLICATIONS AND CONSULTATIONS
8. The Board had before it a report which provided information on the recent publications and consultation papers of interest and sought to agree a response where appropriate.
The report recommended:-that the Board –(a) approve the proposed response in Appendix A as Nestrans’ representation on
Aberdeen City Council’s Local Development Plan 2019 Main Issues Report;
Page 6
5
NORTH EAST OF SCOTLAND TRANSPORT PARTNERSHIP17 April 2019
(b) approve the proposed response in Appendix B as Nestrans’ response to the Infrastructure Commission’s Call for Evidence; and
(c) note the publication of the Transport (Scotland) Bill Stage 1.
The Board resolved:-(i) to approve the recommendations; and(ii) to note that similar themed responses would be submitted from local authorities
and the Aberdeen City Region Deal Joint Committee in relation to the Infrastructure Commission’s Call for Evidence.
2018/19 BUDGET MATTERS
9. The Board had before it a report which provided an update on the Partnership’s 2018/19 budget monitoring and forecast out-turn position and sought consideration of any budget or monitoring issues that may arise.
The report recommended:-that the Board –(a) note the monitoring position and forecast presented in Appendix 1;(b) approve the virements set out in Appendix 2;(c) note the award of additional funding under the Active Travel Grant;(d) approve the request for delay in drawdown presented in Appendix 3; and(e) note the Strategic Transport Fund position.
Ruth Taylor provided an overview of the issues contained within the report.
The Board resolved:-to approve the recommendations.
2019/20 BUDGET PROPOSALS
10. The Board had before it a report which outlined the funding allocations to Nestrans and which sought approval of the revised 2019/20 budget proposals.
The report recommended:-That the Board – (a) note the funding awards to Nestrans that have been confirmed for 2019/20; (b) approve the 2019/20 Budgets of £1,068,016 and £5,679,544 as detailed in
Appendices 1 and 2, subject to any appropriate adjustments being made following the Board’s consideration;
(c) note the potential for additional funding for cycle schemes through the RTP Active Travel grant; and
(d) note the list of projects that are no longer being progressed detailed in Appendix 2.
Ruth Taylor provided an overview of the issues contained within the report.Page 7
6
NORTH EAST OF SCOTLAND TRANSPORT PARTNERSHIP17 April 2019
The Board resolved:-to approve the recommendations.
FINANCIAL REGULATIONS
11. The Board had before it a report which sought approval of the Partnership’s revised Financial Regulations.
The report recommended:-that the Board approve the Partnership’s revised Financial Regulations as set out in the report and Appendix 1.
Ruth Taylor advised that some minor amendments were required to the regulations which were circulated as part of the agenda.
Maggie Bochel intimated that the regulations (Appendix 1) also need to be amended in terms of the two Vice Chair positions on the Board.
The Board resolved:-to approve the recommendation, subject to the minor amendments outlined at the meeting.
TREASURY MANAGEMENT STRATEGY STATEMENT 2019/20
12. The Board had before it a report which sought approval of the proposed Treasury Management Strategy Statement for 2019/20.
The report recommended:-that the Board approve the revised Treasury Management Strategy as outlined in Appendix A to B of the report.
The Board resolved:-to approve the recommendation.
INFORMATION BULLETIN
13. The Board had before it a report which provided information and updates on a number of matters not requiring a decision.
The report recommended:-that the Board note the contents of the report.
Rab Dickson highlighted the following items for members’ information:- Cycling City Tour Series – 16 May 2019;
Page 8
7
NORTH EAST OF SCOTLAND TRANSPORT PARTNERSHIP17 April 2019
Clean Air Day – 19 June 2019; Bus Passenger Satisfaction Survey – 89% of users were satisfied with their
journey; Scottish Youth Parliament Public Transport Campaign – 10 recommendations
including reducing fares, accessibility and bus standards; and Report on Impact of Festive Traffic Restrictions in Madrid – revealed increase in
spending within Madrid (central area).
The Board resolved:-to approve the recommendation.
CONFERENCES AND PRESENTATIONS
14. The Board had before it a list of recent and forthcoming conferences of interest to Nestrans.
The Board resolved:-To note the content of the list.
PENDING BUSINESS AND REPORTS FOR FUTURE MEETINGS
15. The Board had before it a report which (1) provided information on the progress on pending business and major reports scheduled for forthcoming Board meetings; and (2) provided the opportunity for the Board to add to or amend the schedule.
The report recommended:-that the Board note the report on pending business and agree the provisional scheduling of major reports to future Board meetings.
The Board resolved:-to approve the recommendation.- COUNCILLOR PETER ARGYLE, Chairperson.
Page 9
8
NORTH EAST OF SCOTLAND TRANSPORT PARTNERSHIP17 April 2019
Page 10
11 Director Powers 1
1c Non-Councillor Members
Purpose of Report
The purpose of this report is to inform the Board about the process to appoint a replacement non-Councillor Board member and to seek authorisation to extend the appointment of the other non-Councillor Board members.
Background
Members will be aware that Nestrans’ establishment and Standing Orders allow for three or four non-Councillor members to sit on the Board as full members, in addition to four Councillors from each of Aberdeen City Council and Aberdeenshire Council. At the Board Meeting of 7 November 2018, following the resignation of Eddie Anderson, it was agreed that applicants for a fourth non-Councillor member should be sought. The position was advertised in the Press & Journal on Friday 1st March and supported by online advertising and social media contacts, including Hijobs, an online recruitment website. There is also a requirement to consider the extension of the period of appointment of the other three non-Councillor Board members, all of whom were appointed for a period up to April 2019.
Discussion
For the additional position on the Board, three candidates were shortlisted and invited to attend for interview on 1st May 2019. A minute of the Appointments Sub-Committee is attached as Appendix 1 to this report. The Appointments Sub-Committee agreed to recommend to the Cabinet Secretary that Mr Colin Allanach be appointed to the Board for a period through to October 2024, representing the midway point between the next Local Authority elections. Mr Allanach is a Chartered Mechanical Engineer with a Masters in Business Administration. He has been involved in helping to develop cycling schemes in the north east and was instrumental in the recent establishment of a Grampian Cycling Partnership, which seeks to aggregate the views of cyclists and work in collaboration with delivery agencies to improve cycling opportunities and safety across the region. Confirmation has now been received that the Cabinet Secretary has given his approval and Mr Allanach has therefore been contacted and invited to sit on the Board. The three existing non-Councillor Board members have reached the end of their period of appointment. The period of their tenure is a matter for the Nestrans Board, but Scottish Government advice is that if that period be extended, Nestrans should submit a performance report and inform Ministers of that decision. Dr Margaret Bochel was appointed to the Board in November 2016, after a period as Board Advisor when employed by Aberdeen City Council. In the period since appointment, she has attended eleven meetings of twelve Board meetings since the last local authority elections.
NORTH EAST SCOTLAND TRANSPORT PARTNERSHIP – 19 June 2019
Page 11
Agenda Item 1c
11 Director Powers 2
She was appointed as Vice Chair in November 2016 in her role as Vice Chair, Dr Bochel has represented Nestrans at various meetings and is the Board’s representative on the Aberdeen International Airport Consultative Committee. Mr Gerry Donald has been a Nestrans Board member since December 2013 and provides an expertise and experience from his background as Head of Physical Planning at NHS Grampian. Gerry Chairs Nestrans/NHS Grampian’s Health & Transport Action Plan Steering Group which was developed in support of the Regional Transport Strategy and has attended six of twelve Board meetings in the period since the last local authority elections. Mr Iain Ross was appointed to the Nestrans Board in February 2018 and has attended four of seven Board meetings in that period. Dr Bochel, Mr Donald and Mr Ross have all been contacted and have confirmed that they are content to continue to act as non-Councillor members on the Board.
Recommendation
It is recommended that the Board:
1. Approve the appointment of Mr Colin Allanach as a non-Councillor member on the Board through to October 2024;
2. Endorse the extension of the appointments of Dr Margaret Bochel, Mr Gerry Donald and Mr Iain Ross for the period to October 2024.
RD/6 June 2019
Page 12
11 Director Powers 3
1c APPENDIX 1
NORTH EAST SCOTLAND TRANSPORT PARTNERSHIP APPOINTMENT COMMITTEE
Minute of Meeting
Nestrans Office, 27-29 King Street, Aberdeen
1 May 2019 Present: Councillor Peter Argyle (Chairperson); Councillor Sandra
Macdonald (Vice Chairperson) and Dr Maggie Bochel (Vice Chairperson)
In Attendance: Rab Dickson, Nestrans Director (Acting) and Derek Jamieson,
Clerk - Part of the meeting
DATA PROTECTED INFORMATION In accordance with the Data Protection Act 1988 (Principle 1), the press and public were excluded from the meeting during the informal interview process.
APPOINTMENT OF EXTERNAL MEMBER TO THE NESTRANS BOARD 1. Reference was made to Article 1 of the NESTRANS Board meeting of 7 November 2018 which intimated the resignation of a non-councillor member of the Board. Consequently, the Board resolved:- “(iii) to agree that arrangements to establish a Nestrans Appointment Committee to act with powers, as agreed for previous appointments, to recruit a replacement external member to the Board, subject to Ministerial approval of the preferred candidate, would be undertaken in due course”
Subsequent to a period of advertising, applications were received prior to the closing date of Friday 5th April 2019. The applications were reviewed by the Committee who undertook to interview applicants for the vacant position of an external non-councillor member to the Nestrans’ Board.
Page 13
11 Director Powers 4
The Committee interviewed each applicant and at the conclusion of the interviews discussed each applicant in turn. The Committee also heard from the Director (Acting). The Committee resolved: (i) to offer the current vacant position of external non councillor member of the
Nestrans Board to Mr Colin Allanach, subject to the consent of Scottish Ministers; and
(ii) to instruct the Director (Acting) to undertake the necessary arrangements to receive the consent from the Scottish Ministers.
- COUNCILLOR PETER ARGYLE, Chairperson.
Page 14
NORTH EAST SCOTLAND TRANSPORT PARTNERSHIP – 19 June 2019
Strategy - 3a Director’s report on liaison between RTPs, and with the
Scottish Government and Others
Purpose of Report
The purpose of this report is to update the Board on liaison with other RTPs, with the Scottish Government and other organisations.
Background
This report details meetings with other RTPs across Scotland, Transport Scotland and other national transport bodies highlighting issues of interest across Scotland. It also notes the minutes from Steering Group meetings covering both the Health and Transport Action Plan (HTAP) and the Bus Alliance (previously LABOF).
Recent Developments
The last full Board meeting was held on Wednesday 17 April 2019. The following meetings took place after the issue of papers for the last Board meeting, but are reported here for Members’ information.
❖ Aberdeen & Grampian Chamber of Commerce Rail Summit, 9 April 2019
Aberdeen and Grampian Chamber of Commerce had called a meeting with Bill Reeve, Director of Rail at Transport Scotland. The meeting was attended by Rab Dickson and colleagues from both Aberdeen City Council and Aberdeenshire Council as well as representatives from Network Rail, ScotRail and LNER in addition to Chamber members representing business interests across the north east.
Mr Reeve provided an update on performance issues, rolling stock and rail investment in ongoing upgrades. In respect of proposed upgrade of Aberdeen-Central Belt, he emphasised the role of Revolution in Rail which will separate local from inter-city services and the focus on 7 Cities to be operated by High Speed Trains. Ongoing work to improve Stonehaven-Aberdeen signalling and crossing opportunities at Craiginches will enhance resilience and reduce running times. £270million which is committed to renewals and opportunities will be sought to maximise the benefits of this investment in incremental steps.
Meetings of relevance held since the last Board meeting include:
❖ Nestrans Appointments Committee, Aberdeen, 1 May 2019
The Appointments Committee met at the Nestrans office for the purpose of considering applications for the post of non-Councillor Board member. A note of the meeting and recommendation will be considered at Item 1c on this agenda.
❖ RTP Lead Officers, Perth, 8 May 2019
Nicky Laird attended this meeting representing Nestrans. The meeting received a presentation from Liftshare on new opportunities available with their platform and also
Page 15
Agenda Item 3a
welcomed representatives from Sustrans, Paths for All and Cycling Scotland to discuss updates, funding opportunities and relationships between local authorities, RTPs and the third sector. Other agenda items included:
• An update on the National Transport Strategy and STPR;
• East Coast Mainline Authorities (ECMA);
• West Coast Rail 250;
• An update on developments from the CoSLA Environment & Economy Committee;
• The Williams Rail Review;
• Scotland’s Low Emission Zones; and
• Institution of Civil Engineers – State of the Nation Housing Roundtable.
Following the meeting, representatives from the Infrastructure Commission joined the Lead Officers to discuss the joint RTP response to the Infrastructure Commission consultation.
❖ SCOTS Summer Business Meeting, Pitlochry, 16 and 17 May 2019
Rab Dickson attended the Society of Chief Officers in Transportation in Scotland (SCOTS) Annual Business Meeting. The Society brings together all of Scotland’s local authority Chief Officers in Transport and all seven Regional Transport Partnerships. The agenda included an update on the Northern Collaboration Group, a Business Plan for the coming year and updates on both Scottish Roads Maintenance and Condition Survey and on the Roads Asset Management Project. The AGM is run concurrently with an Annual Seminar. This year’s guest speakers included Alison Irvine, Transport Scotland’s Director of Transport Strategy and Analysis. Further topics included:
• Nicola Graham, Aberdeenshire’s Head of ICT talking on future technological
advances;
• the future of bridge engineering;
• innovation in travel; and
• Edinburgh’s new active travel-friendly street design guidance.
❖ A96 Dualling, Aberdeen, 29 May 2019
Officers from Nestrans and both local Councils met with Transport Scotland and their consultants Amey Arup to discuss progress with the proposed dualling of the A96 between east of Huntly and Aberdeen. A fuller report is attached as item 4b on this agenda.
❖ STPR2 Regional Grouping, Aberdeen, 29 May 2019
Transport Scotland have announced that they intend to produce a second Strategic Transport Projects Review (STPR). To help in addressing issues throughout the various parts of Scotland, they have announced an intention to initiate meetings of Regional Groupings and consulted local authorities and RTPs on appropriate representation at officer level. Nestrans and our two constituent local authorities were of the view that the existing arrangements were appropriate in terms of boundaries and that the existing Transport Working Group with Transport Scotland, which considers transport developments for the City Region Deal was apt. This group, with the addition of Economic Development officers from both
Page 16
Aberdeen City Council and Aberdeenshire have therefore been tasked with consideration of STPR2 in a north east context. The first meeting of the group was held on 29th May and had representatives from Transport Scotland and their consultants, Jacobs and Aecom, as well as Nestrans and the two Councils, including transport, economic development and planning colleagues. The meeting discussed:
• National Transport Strategy/STPR2 background; • STPR2 commission Pre-Appraisal update and links to Aberdeen City Region Deal;
• Potential timescales; and
• General Discussion.
❖ Bus Alliance Board, Aberdeen, 30 May 2019
The latest meeting of the Bus Alliance Board was held at Woodhill House and was chaired by George Mair. A draft minute of the meeting is attached as Appendix 1 to this report for members’ information and a full Update Report is included as Item 5a on the agenda.
❖ RTP Chairs meeting, Dundee, 6 June 2019
Rab Dickson and Nicky Laird attended this meeting along with the Chair, Councillor Argyle. The meeting received presentations from Transport Scotland on NTS and their consultants, Jacobs on STPR2 development. It was confirmed that the draft NTS is scheduled to go to public consultation for a 12-week period from end July to late October. Other agenda items included:
• National Transport Strategy & STPR:
o NTS Review Board;
o NTS Roles & Responsibilities;
o Transport Bill;
o Planning Bill;
o Hitrans Provocation Piece;
• Consultation Responses:
o Infrastructure Commission;
o Williams Rail Review;
• RTP Chairs Work Programme:
o Future invitees to Chairs meetings;
• Stakeholder & Modal Updates:
o East Coast Mainline Authorities;
o West Coast Rail;
o Low Emissions Zones;
o Scottish Islands Passport Update
• Holyrood Magazine Article; and
• Communication with Partners & Stakeholders:
o Place Principle Conference.
Page 17
❖ Aberdeen International Airport Consultative Committee, Aberdeen, 7 June 2019
Dr Maggie Bochel represents Nestrans on the Airport Consultative Committee. However, the meeting, which had been scheduled for 7 June, was postponed until 28 June and a number of matters were dealt with via email. Of interest, a letter has been prepared for circulation in response to the UK Government’s consultation on the Future of Aviation and circulated to local MPs and MSPs. The response emphasises the importance of flights from Aberdeen due to distance from key markets and queries the continuing public subsidy and exemption from Air Passenger Duties at Inverness and Dundee, even for services in competition such as Inverness-Heathrow and Amsterdam and Dundee-Stansted. The response also supports the proposal for a Passenger Charter to be developed and supports proposals to enhance services available for passengers with special assistance needs. The Consultative Committee has also responded to the newly formed Independent Commission on Civil Aviation Noise, seeking greater involvement with the Commission.
❖ Regional Economic Strategy Workshop, Woodhill House, Tuesday 11 June 2019
The meeting of the RES Working Group considered the key changes, drivers and trends that are emerging in the local economy. Outcomes will be reported to the Economic Forum later in the year.
❖ Rail Quarterly Update Meeting with Transport Scotland, Aberdeen, 12 June 2019
Nestrans and Council colleagues meet with Transport Scotland, ScotRail and Network Rail on a regular basis to ensure partners are up to speed with developments in terms of rail. The meeting on 12 June was held at Nestrans office and included discussion on:
• Overall Network o Update on ScotRail performance in north east (ScotRail)
o Update on Rolling Stock roll out / Training (ScotRail)
o Update on Bi-Mode LNERs / Caledonian Sleepers (TS)
• North of Aberdeen
o A2I works (NR)
o Kintore (Aberdeenshire/NR)
o Insch (Nestrans)
o Level of Service at regional stations e.g. Inverurie (Ab’shire)
o FPASTS update (Nestrans)
• Aberdeen Station
o Progress on upgrade (ScotRail)
• South of Aberdeen
o Aberdeen to Central Belt (TS)
o Seven cities (NR)
o Timetable development – Issues at Stonehaven and Laurencekirk (ScotRail)
o LRDF bid – South of Aberdeen Stations (Nestrans)
• Freight improvements at Craiginches (NR)
• Signalling Improvements South of Aberdeen (NR)
Page 18
• Clarity on NE priorities (responding to Bill Reeve comments)
o RTS process, STA process (Nestrans)
• Surveys linked to ASAM
o Autumn survey programme on rail network (Ab’shire)
Future Programme of Meetings
The following meetings are scheduled between now and the next full meeting of Board in September:
❖ City Region Deal Transport Working Group Meeting, Aberdeen, 18 June 2019
❖ Road Casualty Reduction Partnership Meeting, Elgin, 26 June 2019
❖ Aberdeen Prospers Meeting, Bridge of Don, 26 June 2019
❖ Aberdeen International Airport Consultative Committee, Aberdeen, 28 June 2019
Dr Maggie Bochel represents Nestrans on the Airport Consultative Committee. This meeting was deferred from 7 June, due to potential industrial action at the airport on that date.
❖ Health & Transport Action Plan Steering Group Meeting, Aberdeen, 10 July 2019
❖ RTP Lead Officers Group Meeting, Perth, 7 August 2019
❖ Bus Alliance Board Meeting, Aberdeen, 29 August 2019
❖ RTP Chairs Meeting, Glasgow, 4 September 2019
❖ Civitas Portis Annual Partners Meeting, Klaipeda, 4-6 September 2019
Recommendation
The Board is recommended to note progress on liaison arrangements with other RTPs, the Scottish Government and others and arrangements for future meetings.
RD/ 6 June 2019
Page 19

This page is intentionally left blank
Page 20
1
3a APPENDIX 1
North East of Scotland Bus Alliance
Minute of Meeting of the Bus Alliance Board
Room E2, Woodhill House, Thursday 30th May 2019 Present In Attendance
George Mair, Chair (GAM) Rab Dickson, Nestrans (RD) David Phillips, First (DP) Greig Mackay, Bus Users Scotland (GM) Ewan Wallace, Aberdeenshire Council (EW) Ian Bell, Stagecoach (IB) Gale Beattie, Aberdeen City Council (GB) Kirsty Chalmers, Nestrans (KC)
Apologies Douglas Bain, Bains Coaches David Liston, Stagecoach Andrew Jarvis, First Bus Jock Petrie, MW Nicoll Elaine Milne, Deveron Coaches Nicola Laird, Nestrans (NL)
Item Action
1 Welcome & Apologies
GM welcomed all and noted apologies.
2 Minute of the Bus Alliance Board 28 February 2019
The minute of the meeting on 28th February 2019 was agreed. RD noted that the rail blockade is currently going ahead and appears to be going well and no issues reported to date. From what he has seen it appears to be well staffed with a good supply of buses waiting at stations.
3 State of the Network Report
General comments on the report:
• Table 3.18 update from 2016 data.
• Some general typo / referencing errors.
• First ticket machine data – DP reported that First are doing an update to the report that provided journey time data just now and then will update it again in about 3 months when AWPR has settled in.
• ACC will be doing some traffic counts to assess impact of AWPR.
• Quotes in the P&J last week about 50% reduction of traffic. RD has asked Transport Scotland to share the source of this data.
• Table 3.4 – RD recognised there has been significant decline in bus use but reported that rail figures have seen a greater decrease. The rail industry is optimistic that this decline is just
Page 21
2
short term. It was however noted that decline in bus passenger numbers has been over a much longer period of time.
• The report mentions City Region Deal Funding – GM asked if there is any bus specific allocation within this fund? RD reported that the biggest portion of transport money from the City Region Deal has been for the Strategic Transport Appraisal. This will likely be focussed on infrastructure schemes and feed into the national Scottish Transport Projects Review (STPR2). GB noted that the Aberdeen Harbour work mentions public transport but nothing specific for buses.
• EW noted there is a lot of appraisal work going on and there will be pressure to commit to delivery now.
• RD reported that it is Nestrans’ intention to report the State of the Network Report to its Board on 19th June.
• GB reported that ACC will be reporting the Roads Hierarchy, SUMP and Car Parking Study to Committee in June. If approved, ACC will be taking forward a car parking strategy. She requested that in the recommendations of the report the wording be changed to Car Parking Strategy, rather than the car parking review, to reflect the recommendations of the City Council committee report.
• GB stated that the next step following on from the State of the Network report would be to see a list of actions.
• EW noted that interchange opportunities in communities across Aberdeenshire is something that Aberdeenshire Council have been trying to tackle. Showing that issues are the same in some of the towns would add strength to the regional aspects of the report.
• Thanks were noted to the team who pulled the State of the Network report together.
Action: Put a note round the Bus Alliance group to give a deadline for agreeing whether they are happy for the report to be put to Nestrans Board in June. Final opportunity to agree and finalise. Action: Executive to progress working up an action plan. There was a general discussion about how we raise the profile of the work that has been done and the issues that it raises at a national level. It was felt that there is a need to push the Scottish Government on what is it they are going to do for buses. It was agreed that this is where we need to go next, beyond the big ticket infrastructure. GM noted that nationally he is starting to get some real traction with Scottish Ministers on getting bus on the same level as rail and how we get investment going in to bus. The message is that we don’t need subsidy if we have the right infrastructure. Now may be the right time to push this up the national agenda. RD noted that the Scottish Government talks a lot about £80m for active travel and there really isn’t the same type of fund for bus travel. £5m has been added to Bus Investment Fund but this is not felt to be significant. EW noted that the key time for discussions with Government is October to feed into budget discussions.
KC KC KC
Page 22
3
RD noted that the Glasgow Connectivity Commission raises issues of equity and where money is being spent. Rail and road tend to be used by people on higher incomes while bus can often be the only option for those on lower incomes but rail and road is where the vast majority of the money is being spent. Action: It was agreed that there is a need to raise bus issues up the national agenda and that this should be reflected in the Nestrans Board report. Action: It was agreed that a representative from Transport Scotland should be invited to the next Board meeting. Pete Grant, Interim Head of Bus and Concessionary Fares Policy, had previously been invited but was unable to attend the May meeting and therefore this invitation has been extended to the August meeting of the Bus Alliance Board. Action: It was agreed that bus issues should be put on the SCOTS transportation agenda to start trying to push at a national level. KC sits on that group.
KC/NL NL KC
4 Update from Aberdeen City Council
An update report from ACC was provided on Low Emission Zones, A96 Collective Travel and Locking in the Benefits. GB reported that work was ongoing to take forward further modelling. Funding from Transport Scotland has been received to do some of this work. Operators reported no real commercial incentive to upgrade fleet through retrofit schemes for a LEZ. Roads Hierarchy Report, Car Parking Study and SUMP are all being reported to Committee next week. Papers for this meeting are now publicly available. GB reported that a lot of internal work to inform Councillors and highlight the key message, “to, not through the city centre” has been done. This has involved briefing sessions and presentations with Members and press briefings. Motorcycles in bus lanes – committee have approved retention of the status quo. Both bus companies were involved in consultation on this report. Broad Street – the bus priority has been approved to stay in but with the addition of a pedestrian crossing at the Schoolhill end of the road. GB reported that the behaviour of bus drivers from both companies driving through at an appropriate speed definitely made a difference in terms of getting support for retaining it. Hydrogen Buses – EW reported that at a recent SCOTS conference a representative from Transport Systems Catapult said they and Department for Transport were very interested to hear about the work with Hydrogen Buses in Aberdeen. EW will pass on relevant contact details if they would like to get in touch.
Page 23
4
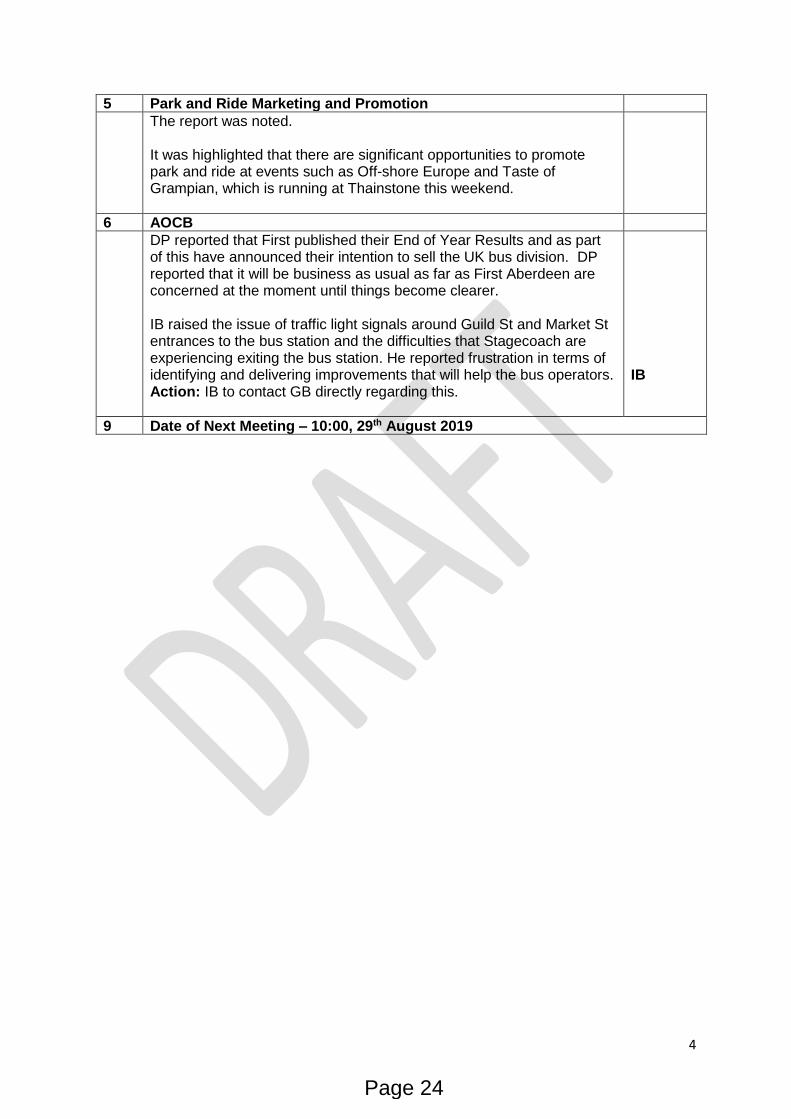
5 Park and Ride Marketing and Promotion
The report was noted. It was highlighted that there are significant opportunities to promote park and ride at events such as Off-shore Europe and Taste of Grampian, which is running at Thainstone this weekend.
6 AOCB
DP reported that First published their End of Year Results and as part of this have announced their intention to sell the UK bus division. DP reported that it will be business as usual as far as First Aberdeen are concerned at the moment until things become clearer. IB raised the issue of traffic light signals around Guild St and Market St entrances to the bus station and the difficulties that Stagecoach are experiencing exiting the bus station. He reported frustration in terms of identifying and delivering improvements that will help the bus operators. Action: IB to contact GB directly regarding this.
IB
9 Date of Next Meeting – 10:00, 29th August 2019
Page 24
NORTH EAST SCOTLAND TRANSPORT PARTNERSHIP – 19 June 2019
3b Regional Transport Strategy Progress and Update
Purpose of Report
The purpose of this report is to update members on the recent meeting of the North East Transport Consultative Forum, the timescales for development of the Regional Transport Strategy (RTS) and progress in the Strategic Environmental Assessment (SEA) of the RTS.
Background
Nestrans’ current Regional Transport Strategy was approved by Ministers in 2008 and was refreshed in 2014. Members have previously agreed to review the Strategy with an intention to produce a third strategy (RTS 2040) by the end of 2019.
A workshop was held with Members following the Board meeting on 17th April 2019 at which was discussed the vision, objectives and key themes of the future RTS under four overarching pillars.
North East Transport Consultative Forum
A meeting of the North East Transport Consultative Forum (NETCF) was held on the evening of Thursday 30th May 2019 at Woodhill House. The Forum consists of a wide range of interested stakeholders representing a balanced cross-section of economic, environmental and community interests, along with transport operators and interest groups. The event consisted of presentations on the progress of the RTS to date and key issues relating to each of the four pillars of the RTS. The presentation slides are available on the Regional Transport Strategy Nestrans 2040 website (www.nestrans2040.org.uk) and the key points raised in the discussion note of the meeting, which was attended by 25 members of the Forum, is attached as Appendix A to this report.
National Transport Strategy and Regional Transport Strategy timeline
The Scottish Government has announced its intention to publish a Draft National Transport Strategy for consultation by the end of July 2019. It is expected that this consultation will last for a period of around 12 weeks, following which it is the Scottish Government’s intention to produce a final strategy by the end of 2019. Nestrans Board had previously agreed that the Regional Transport Strategy should follow on from the NTS so that we can ensure that the RTS reflects the objectives, policies and actions of the NTS. It was Nestrans’ initial intention to produce an RTS by the end of this calendar year. However, to avoid confusion, consultation fatigue and ensure we are able to reflect the details of the
Page 25
Agenda Item 3b
final NTS, it is recommended that the Board agree to targeting a draft RTS by the end of 2019, following the publication of a finalised National Transport Strategy so that consultation on the draft can take place in early 2020.
Strategic Environmental Assessment
Nestrans submitted a Scoping Report on the Regional Transport Strategy and Strategic Transport Assessment to the SEA gateway on 29 March 2019. We have now received comments back from the three statutory consultees, SEPA, SNH and Historic Environment Scotland. These comments will be incorporated into the Environment Report, which once completed will become part of the wider Regional Transport Strategy consultation and an appendix to the strategy. The Environment Report will set out how the Regional Transport Strategy will provide high level protection to the environment and promote an evidenced-based outline of how it will mitigate any potential issues where applicable.
Recommendations
It is recommended that the Board:
1. Note the contents of the report; and
2. Agree the amended timescales for production of the RTS.
KC/KW 6 June 2019
Page 26
3b Appendix A
Minute of the fifteenth meeting of the
North East Transport Consultative Forum
Woodhill House, Aberdeen
Thursday 30th May 2019 5:30-8pm
The meeting was attended by 25 of the Forum’s members. The purpose of the meeting was to update members on the progress towards developing the next Regional Transport Strategy to 2040 and to stimulate discussion on the policies and outcomes that the strategy should be aiming to deliver.
Cllr Peter Argyle, Chair of the Nestrans Board, introduced the meeting and Rab Dickson, Acting Director, gave a presentation on the progress to date, including:
• The agreed vision and objectives of the strategy;
• The four pillars of the strategy, which are:
o Helping the north east economy prosper;
o Improving health and wellbeing across the north east;
o Taking action to reduce impact on climate change and protect the natural and built environment of the north east; and
o Promoting equality across the north east.
• Consultation and engagement undertaken to date, including development of the Nestrans2040 website (www.nestrans2040.org.uk) and the availability of discussion papers;
• Details of further research and impact assessments being undertaken; and
• Next steps.
Kirsty Chalmers, Nestrans’ Transport Executive (Strategy & Delivery) gave a presentation on the key issues relevant to the RTS under the headings of each of the four pillars and provided some key statistics and trends relating to each in order to inform the discussions in the second half of the meeting.
The presentations are available on the Nestrans website at: https://www.nestrans2040.org.uk/uncategorized/north-east-transport-consultative-forum-presentation/
Discussion
Participants were then split into four groups and each group was allocated one of the four pillars and asked to brainstorm onto a flipchart the actions that the RTS should consider, relevant to that pillar. After a set period of time the flip charts were rotated to the next group who reviewed the points that had already been listed and added any that they felt were missing. The process was repeated until all four groups had had an opportunity to add actions to each pillar. The final session then asked each group to prioritise the five or six actions they would take forward under the pillar they were discussing.
The discussions in each group were facilitated by a member of the Nestrans team who provided a brief summary of their group’s agreed priorities in a plenary feedback session at
Page 27
the end. There were also opportunities for questions and a wider group discussion following the presentations.
A summary of the key priorities raised by the groups in relation to each pillar is provided below.
The date for the next meeting of the North East Consultative Forum will be advised in due course.
Pillar 1: Helping the north east economy prosper - Priorities
• Aberdeen to Central belt rail journey time improvement
• Aberdeen international airport hub connections
• Reduce congestion on network by mode shift and use of AWPR/strategic links, i.e. bus priority
• Making buses more attractive by making driving into city centre less attractive. More patronage allows greater routes/frequencies
• Good surface access to Aberdeen South Harbour (cruise passengers/freight)
• Realising City Centre masterplan
• Freight facilities need considered.
Pillar 2: Improving health and wellbeing across the north east - Priorities
• Introduction of comprehensive LEZ and supporting measures
• Behaviour change – increase efforts through education (e.g. workplaces and school
engagement)
• Increased opportunities for low carbon fuels
• Importance of planning for active travel in new developments
• Better integration to end isolation
• Increasing active travel (promotion, encouragement and access to active travel)
• Increased promotion /encouragement/access to active travel
• Physical and mental health – at core of all we do
• Increased decarbonisation of all transport modes (including public transport)
Pillar 3 – Taking action to reduce impact on climate change and protect the natural and built environment of the north east - Priorities
• LEZ that targets the most polluting vehicles
• Electric vehicle infrastructure – network of charging points
• Adaptation measures – maintenance, setting ambitious standards
• Priority lanes for multiple use vehicles – bus/HGV
• Culture change with a target on young people to move away from car ownership,
influence behaviour from a young age, marketing/promotion
• Forward thinking/innovative in terms of piloting/testing technologies
• Active travel infrastructure
Pillar 4 – Promoting equality across the north east - Priorities
• Engagement with the people you are trying to help and find out what are the problems
and possible solutions
Page 28
• Know your customer/travellers – start considering them as customers
• Market research/evidence
• As well as educating – Awareness raising. Interesting stories
• Focus on youth
• Inequalities in road safety. Young road users
• Diversity
• Examples from ‘real world’ social deprivation etc
• Communication/marketing is key
Page 29

This page is intentionally left blank
Page 30
3d Monitoring Report
NORTH EAST SCOTLAND TRANSPORT PARTNERSHIP – 19 June 2019
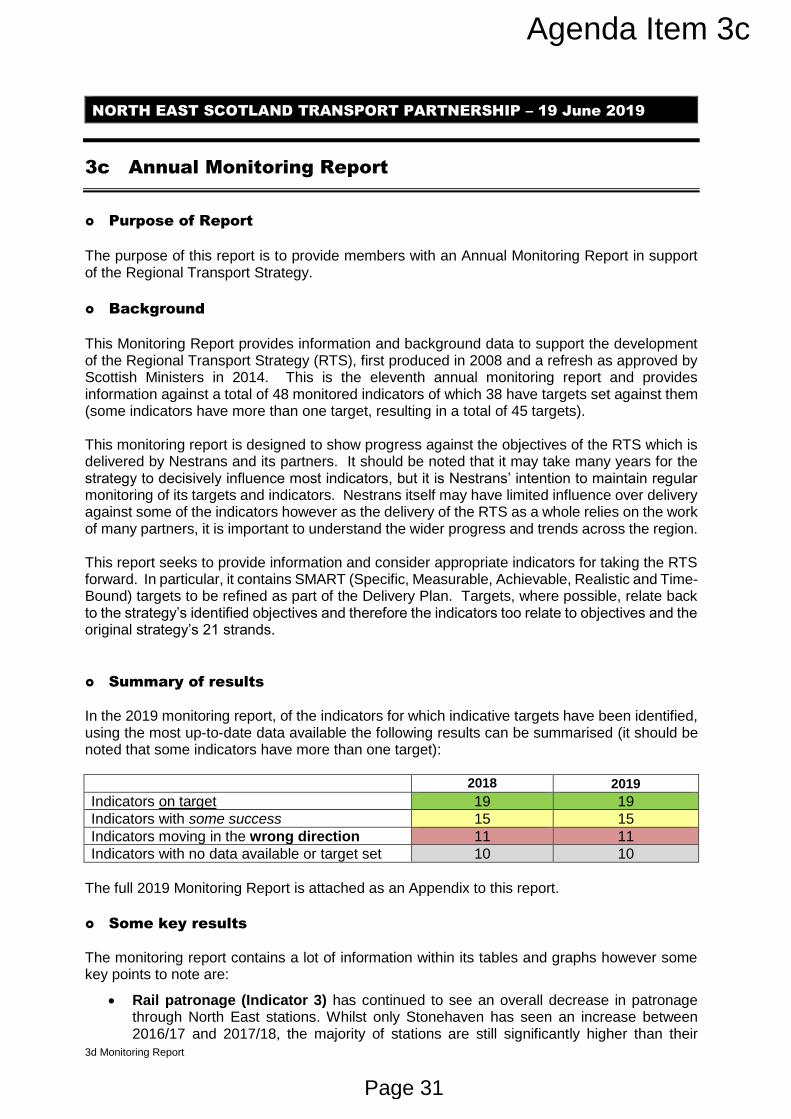
3c Annual Monitoring Report
Purpose of Report
The purpose of this report is to provide members with an Annual Monitoring Report in support of the Regional Transport Strategy.
Background
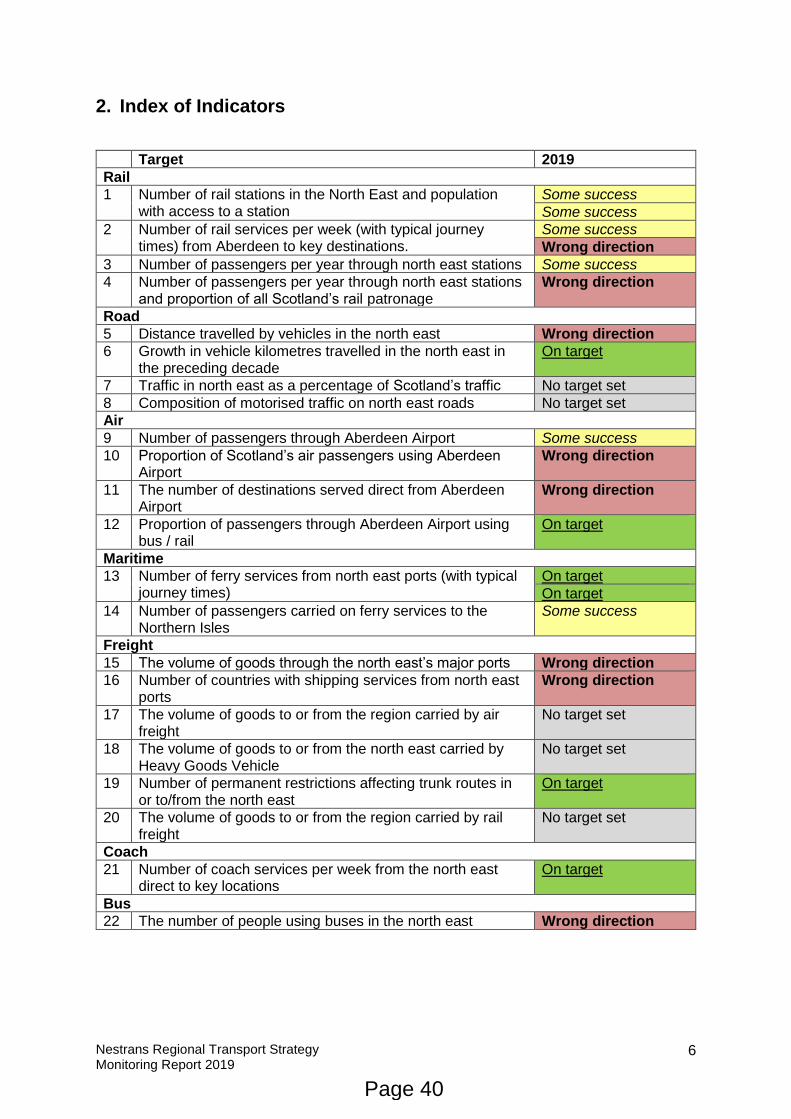
This Monitoring Report provides information and background data to support the development of the Regional Transport Strategy (RTS), first produced in 2008 and a refresh as approved by Scottish Ministers in 2014. This is the eleventh annual monitoring report and provides information against a total of 48 monitored indicators of which 38 have targets set against them (some indicators have more than one target, resulting in a total of 45 targets). This monitoring report is designed to show progress against the objectives of the RTS which is delivered by Nestrans and its partners. It should be noted that it may take many years for the strategy to decisively influence most indicators, but it is Nestrans’ intention to maintain regular monitoring of its targets and indicators. Nestrans itself may have limited influence over delivery against some of the indicators however as the delivery of the RTS as a whole relies on the work of many partners, it is important to understand the wider progress and trends across the region. This report seeks to provide information and consider appropriate indicators for taking the RTS forward. In particular, it contains SMART (Specific, Measurable, Achievable, Realistic and Time-Bound) targets to be refined as part of the Delivery Plan. Targets, where possible, relate back to the strategy’s identified objectives and therefore the indicators too relate to objectives and the original strategy’s 21 strands.
Summary of results
In the 2019 monitoring report, of the indicators for which indicative targets have been identified, using the most up-to-date data available the following results can be summarised (it should be noted that some indicators have more than one target):
2018 2019
Indicators on target 19 19
Indicators with some success 15 15
Indicators moving in the wrong direction 11 11
Indicators with no data available or target set 10 10
The full 2019 Monitoring Report is attached as an Appendix to this report.
Some key results
The monitoring report contains a lot of information within its tables and graphs however some key points to note are:
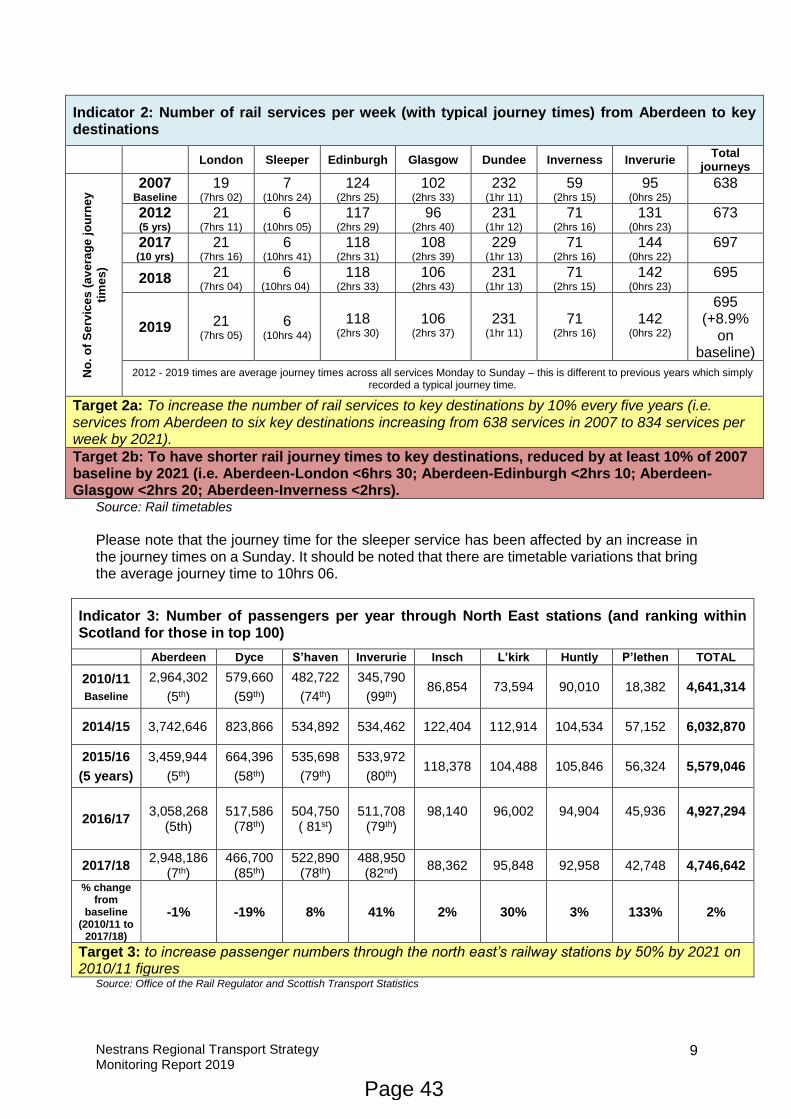
• Rail patronage (Indicator 3) has continued to see an overall decrease in patronage through North East stations. Whilst only Stonehaven has seen an increase between 2016/17 and 2017/18, the majority of stations are still significantly higher than their
Page 31
Agenda Item 3c
3d Monitoring Report
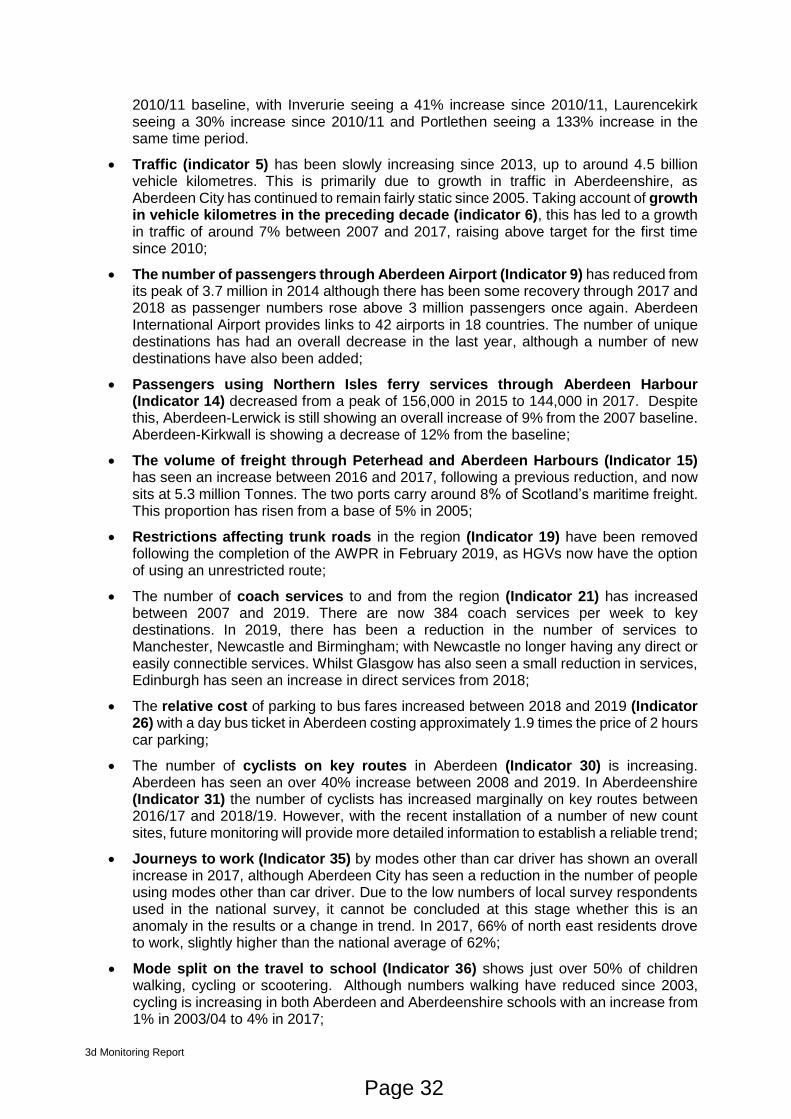
2010/11 baseline, with Inverurie seeing a 41% increase since 2010/11, Laurencekirk seeing a 30% increase since 2010/11 and Portlethen seeing a 133% increase in the same time period.
• Traffic (indicator 5) has been slowly increasing since 2013, up to around 4.5 billion vehicle kilometres. This is primarily due to growth in traffic in Aberdeenshire, as Aberdeen City has continued to remain fairly static since 2005. Taking account of growth in vehicle kilometres in the preceding decade (indicator 6), this has led to a growth in traffic of around 7% between 2007 and 2017, raising above target for the first time since 2010;
• The number of passengers through Aberdeen Airport (Indicator 9) has reduced from its peak of 3.7 million in 2014 although there has been some recovery through 2017 and 2018 as passenger numbers rose above 3 million passengers once again. Aberdeen International Airport provides links to 42 airports in 18 countries. The number of unique destinations has had an overall decrease in the last year, although a number of new destinations have also been added;
• Passengers using Northern Isles ferry services through Aberdeen Harbour (Indicator 14) decreased from a peak of 156,000 in 2015 to 144,000 in 2017. Despite this, Aberdeen-Lerwick is still showing an overall increase of 9% from the 2007 baseline. Aberdeen-Kirkwall is showing a decrease of 12% from the baseline;
• The volume of freight through Peterhead and Aberdeen Harbours (Indicator 15) has seen an increase between 2016 and 2017, following a previous reduction, and now sits at 5.3 million Tonnes. The two ports carry around 8% of Scotland’s maritime freight. This proportion has risen from a base of 5% in 2005;
• Restrictions affecting trunk roads in the region (Indicator 19) have been removed following the completion of the AWPR in February 2019, as HGVs now have the option of using an unrestricted route;
• The number of coach services to and from the region (Indicator 21) has increased between 2007 and 2019. There are now 384 coach services per week to key destinations. In 2019, there has been a reduction in the number of services to Manchester, Newcastle and Birmingham; with Newcastle no longer having any direct or easily connectible services. Whilst Glasgow has also seen a small reduction in services, Edinburgh has seen an increase in direct services from 2018;
• The relative cost of parking to bus fares increased between 2018 and 2019 (Indicator 26) with a day bus ticket in Aberdeen costing approximately 1.9 times the price of 2 hours car parking;
• The number of cyclists on key routes in Aberdeen (Indicator 30) is increasing. Aberdeen has seen an over 40% increase between 2008 and 2019. In Aberdeenshire (Indicator 31) the number of cyclists has increased marginally on key routes between 2016/17 and 2018/19. However, with the recent installation of a number of new count sites, future monitoring will provide more detailed information to establish a reliable trend;
• Journeys to work (Indicator 35) by modes other than car driver has shown an overall increase in 2017, although Aberdeen City has seen a reduction in the number of people using modes other than car driver. Due to the low numbers of local survey respondents used in the national survey, it cannot be concluded at this stage whether this is an anomaly in the results or a change in trend. In 2017, 66% of north east residents drove to work, slightly higher than the national average of 62%;
• Mode split on the travel to school (Indicator 36) shows just over 50% of children walking, cycling or scootering. Although numbers walking have reduced since 2003, cycling is increasing in both Aberdeen and Aberdeenshire schools with an increase from 1% in 2003/04 to 4% in 2017;
Page 32
3d Monitoring Report
• The numbers participating in carshare schemes (Indicator 37) and the car club (Indicator 38) are increasing, with over 3,400 registered car sharers and over 1,900 car club registrations, both at their highest ever levels;
• Congestion (Indicator 39) shows that 17% of journeys in the north east are affected by delays, and journey times (Indicator 40) also show a decrease, although the differential between public transport and car journey times is increasing;
• Number of injuries in road traffic collisions in the north east (Indicator 42) has seen a further reduction with total number of casualties in 2017 62% lower than in 2005, and the lowest ever recorded. This is particularly due to a steady decrease in slight accidents since 2013;
• Number of fatalities in road traffic collisions in the north east (Indicator 43) has seen an overall reduction and the five-year average for 2013-17 is continuing to be at the lowest level recorded, with a 42% reduction on the baseline;
• Per capita Carbon Dioxide emissions from transport (Indicator 44) have seen a 12% reduction across the north east between 2005 and 2016;
• The number of Electric Vehicle charging points (Indicator 45a) and the number of Electric Cars (Indicator 45b) have seen significant growth, with 85 chargers and approaching 900 vehicles across the north east;
• Indicators 46 and 47 relate to air quality and show reducing average concentrations of nitrogen dioxide and particulates. 2017 levels of Nitrogen Dioxide in Union Street and Wellington Road show improvements, with all monitored locations either achieving or close to achieving European-defined maximum levels. All locations are within target of the European-defined maximum level for particulates in 2017.
Recommendation
It is recommended that the Board:
1. Note the contents of this report and the trends emerging against many of the RTS
targets;
2. Approve the Nestrans Monitoring report 2019, which will be uploaded to the Nestrans’ website; and
3. Instruct officers to develop a suite of suitable indicators and targets to reflect the
developing Regional Transport Strategy to 2040 and report these to a future Board meeting.
NL/7 June 2019
Page 33

This page is intentionally left blank
Page 34

Regional Transport Strategy Monitoring Report June 2019
Page 35

Page 36
Nestrans Regional Transport Strategy Monitoring Report 2019
3
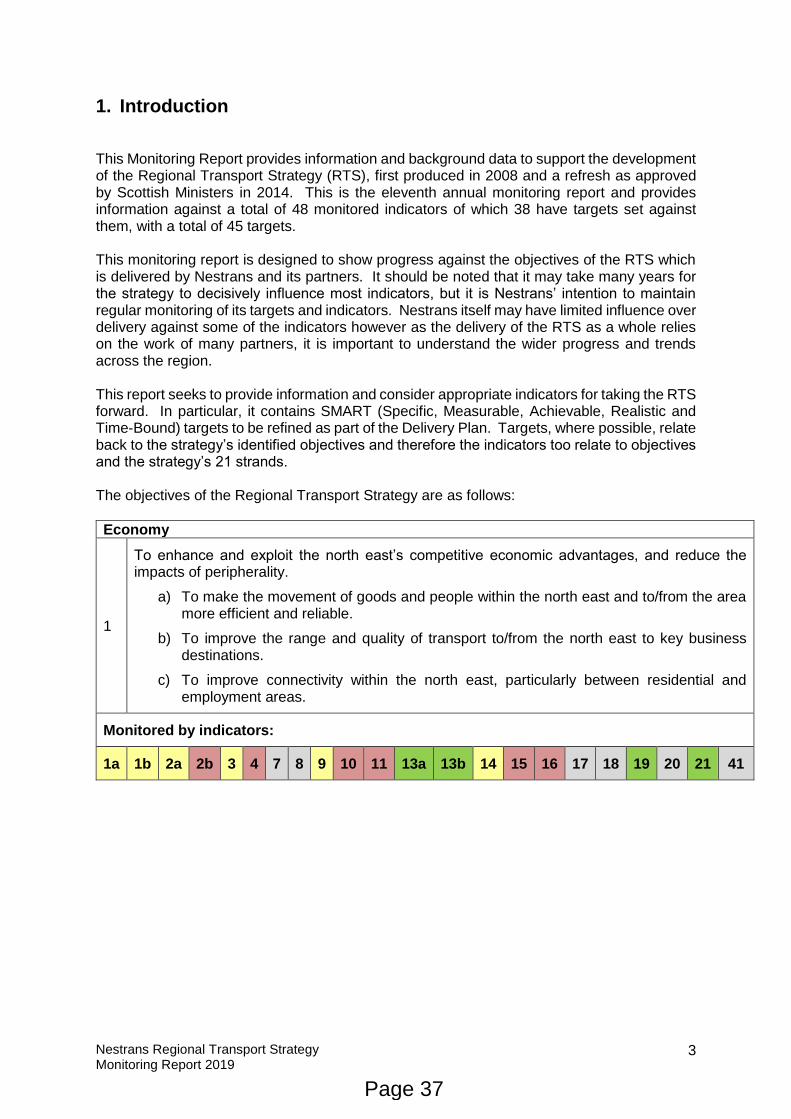
1. Introduction This Monitoring Report provides information and background data to support the development of the Regional Transport Strategy (RTS), first produced in 2008 and a refresh as approved by Scottish Ministers in 2014. This is the eleventh annual monitoring report and provides information against a total of 48 monitored indicators of which 38 have targets set against them, with a total of 45 targets. This monitoring report is designed to show progress against the objectives of the RTS which is delivered by Nestrans and its partners. It should be noted that it may take many years for the strategy to decisively influence most indicators, but it is Nestrans’ intention to maintain regular monitoring of its targets and indicators. Nestrans itself may have limited influence over delivery against some of the indicators however as the delivery of the RTS as a whole relies on the work of many partners, it is important to understand the wider progress and trends across the region. This report seeks to provide information and consider appropriate indicators for taking the RTS forward. In particular, it contains SMART (Specific, Measurable, Achievable, Realistic and Time-Bound) targets to be refined as part of the Delivery Plan. Targets, where possible, relate back to the strategy’s identified objectives and therefore the indicators too relate to objectives and the strategy’s 21 strands. The objectives of the Regional Transport Strategy are as follows:
Economy
1
To enhance and exploit the north east’s competitive economic advantages, and reduce the impacts of peripherality.
a) To make the movement of goods and people within the north east and to/from the area more efficient and reliable.
b) To improve the range and quality of transport to/from the north east to key business destinations.
c) To improve connectivity within the north east, particularly between residential and employment areas.
Monitored by indicators:
1a 1b 2a 2b 3 4 7 8 9 10 11 13a 13b 14 15 16 17 18 19 20 21 41
Page 37
Nestrans Regional Transport Strategy Monitoring Report 2019
4
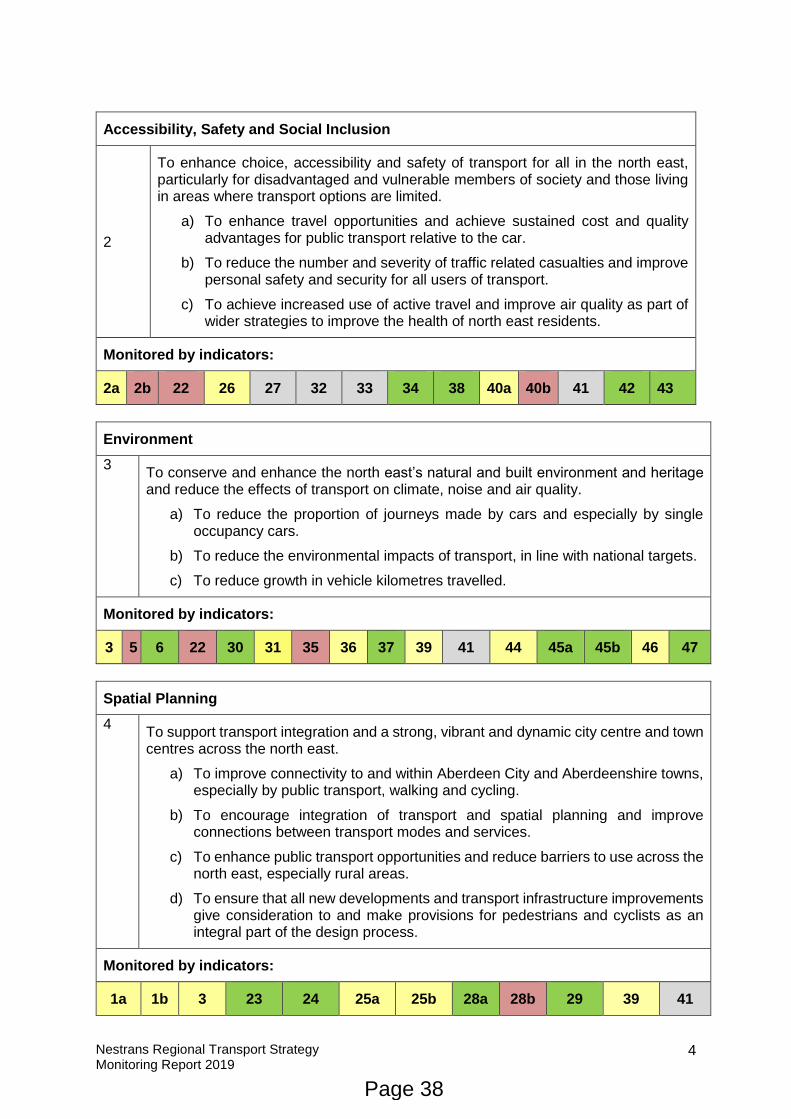
Accessibility, Safety and Social Inclusion
2
To enhance choice, accessibility and safety of transport for all in the north east, particularly for disadvantaged and vulnerable members of society and those living in areas where transport options are limited.
a) To enhance travel opportunities and achieve sustained cost and quality advantages for public transport relative to the car.
b) To reduce the number and severity of traffic related casualties and improve personal safety and security for all users of transport.
c) To achieve increased use of active travel and improve air quality as part of wider strategies to improve the health of north east residents.
Monitored by indicators:
2a 2b 22 26 27 32 33 34 38 40a 40b 41 42 43
Environment
3 To conserve and enhance the north east’s natural and built environment and heritage and reduce the effects of transport on climate, noise and air quality.
a) To reduce the proportion of journeys made by cars and especially by single occupancy cars.
b) To reduce the environmental impacts of transport, in line with national targets.
c) To reduce growth in vehicle kilometres travelled.
Monitored by indicators:
3 5 6 22 30 31 35 36 37 39 41 44 45a 45b 46 47
Spatial Planning
4 To support transport integration and a strong, vibrant and dynamic city centre and town centres across the north east.
a) To improve connectivity to and within Aberdeen City and Aberdeenshire towns, especially by public transport, walking and cycling.
b) To encourage integration of transport and spatial planning and improve connections between transport modes and services.
c) To enhance public transport opportunities and reduce barriers to use across the north east, especially rural areas.
d) To ensure that all new developments and transport infrastructure improvements give consideration to and make provisions for pedestrians and cyclists as an integral part of the design process.
Monitored by indicators:
1a 1b 3 23 24 25a 25b 28a 28b 29 39 41
Page 38
Nestrans Regional Transport Strategy Monitoring Report 2019
5
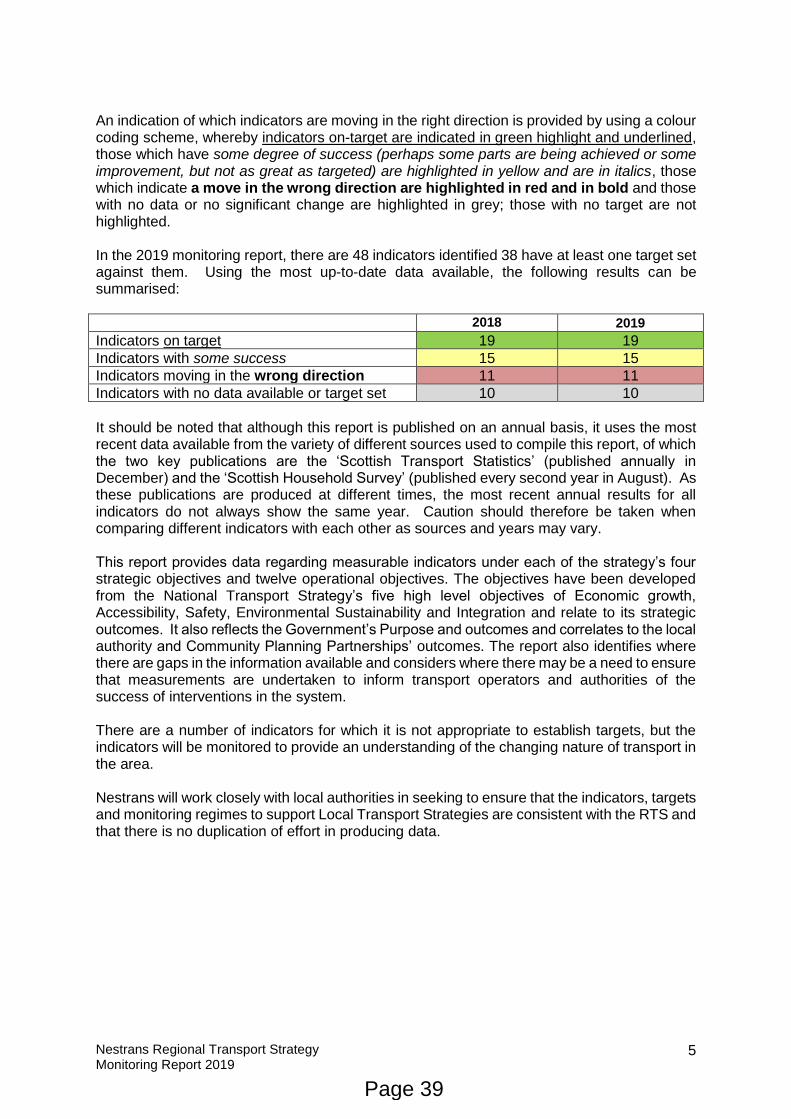
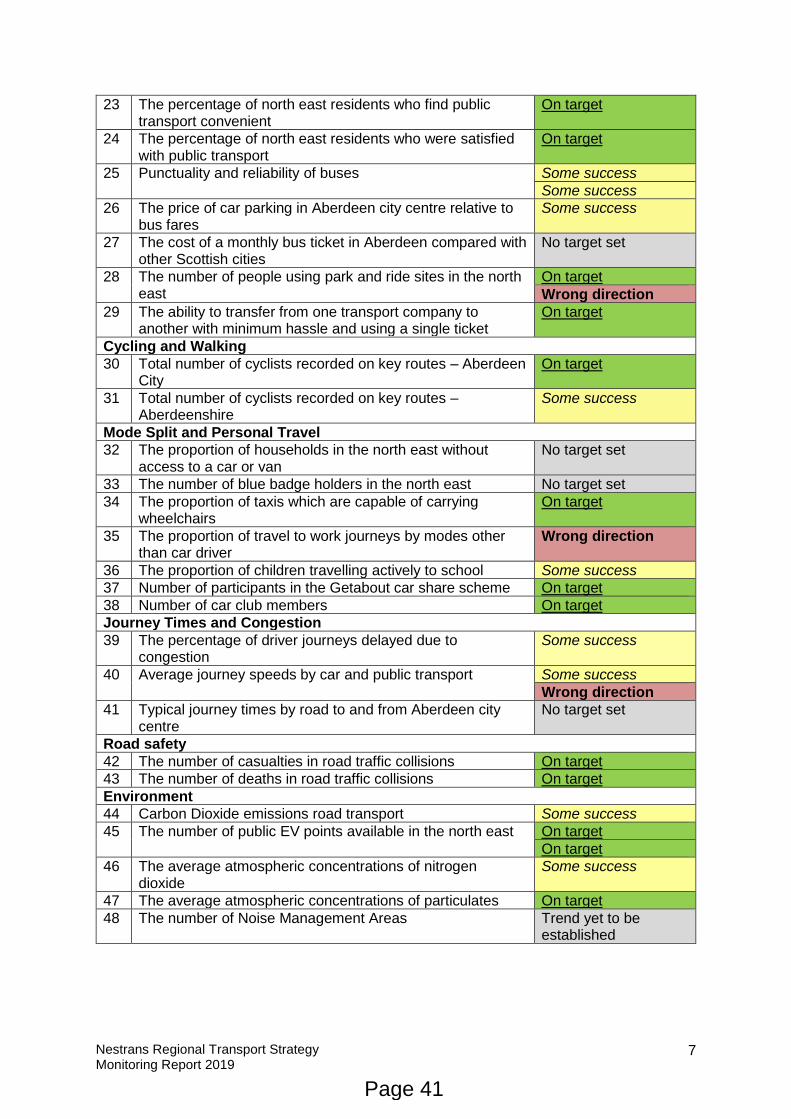
An indication of which indicators are moving in the right direction is provided by using a colour coding scheme, whereby indicators on-target are indicated in green highlight and underlined, those which have some degree of success (perhaps some parts are being achieved or some improvement, but not as great as targeted) are highlighted in yellow and are in italics, those which indicate a move in the wrong direction are highlighted in red and in bold and those with no data or no significant change are highlighted in grey; those with no target are not highlighted. In the 2019 monitoring report, there are 48 indicators identified 38 have at least one target set against them. Using the most up-to-date data available, the following results can be summarised:
2018 2019
Indicators on target 19 19
Indicators with some success 15 15
Indicators moving in the wrong direction 11 11
Indicators with no data available or target set 10 10
It should be noted that although this report is published on an annual basis, it uses the most recent data available from the variety of different sources used to compile this report, of which the two key publications are the ‘Scottish Transport Statistics’ (published annually in December) and the ‘Scottish Household Survey’ (published every second year in August). As these publications are produced at different times, the most recent annual results for all indicators do not always show the same year. Caution should therefore be taken when comparing different indicators with each other as sources and years may vary. This report provides data regarding measurable indicators under each of the strategy’s four strategic objectives and twelve operational objectives. The objectives have been developed from the National Transport Strategy’s five high level objectives of Economic growth, Accessibility, Safety, Environmental Sustainability and Integration and relate to its strategic outcomes. It also reflects the Government’s Purpose and outcomes and correlates to the local authority and Community Planning Partnerships’ outcomes. The report also identifies where there are gaps in the information available and considers where there may be a need to ensure that measurements are undertaken to inform transport operators and authorities of the success of interventions in the system. There are a number of indicators for which it is not appropriate to establish targets, but the indicators will be monitored to provide an understanding of the changing nature of transport in the area. Nestrans will work closely with local authorities in seeking to ensure that the indicators, targets and monitoring regimes to support Local Transport Strategies are consistent with the RTS and that there is no duplication of effort in producing data.
Page 39
Nestrans Regional Transport Strategy Monitoring Report 2019
6
2. Index of Indicators
Target 2019
Rail
1 Number of rail stations in the North East and population with access to a station
Some success
Some success
2 Number of rail services per week (with typical journey times) from Aberdeen to key destinations.
Some success
Wrong direction
3 Number of passengers per year through north east stations Some success
4 Number of passengers per year through north east stations and proportion of all Scotland’s rail patronage
Wrong direction
Road
5 Distance travelled by vehicles in the north east Wrong direction
6 Growth in vehicle kilometres travelled in the north east in the preceding decade
On target
7 Traffic in north east as a percentage of Scotland’s traffic No target set
8 Composition of motorised traffic on north east roads No target set
Air
9 Number of passengers through Aberdeen Airport Some success
10 Proportion of Scotland’s air passengers using Aberdeen Airport
Wrong direction
11 The number of destinations served direct from Aberdeen Airport
Wrong direction
12 Proportion of passengers through Aberdeen Airport using bus / rail
On target
Maritime
13 Number of ferry services from north east ports (with typical journey times)
On target
On target
14 Number of passengers carried on ferry services to the Northern Isles
Some success
Freight
15 The volume of goods through the north east’s major ports Wrong direction
16 Number of countries with shipping services from north east ports
Wrong direction
17 The volume of goods to or from the region carried by air freight
No target set
18 The volume of goods to or from the north east carried by Heavy Goods Vehicle
No target set
19 Number of permanent restrictions affecting trunk routes in or to/from the north east
On target
20 The volume of goods to or from the region carried by rail freight
No target set
Coach
21 Number of coach services per week from the north east direct to key locations
On target
Bus
22 The number of people using buses in the north east Wrong direction
Page 40
Nestrans Regional Transport Strategy Monitoring Report 2019
7
23 The percentage of north east residents who find public transport convenient
On target
24 The percentage of north east residents who were satisfied with public transport
On target
25 Punctuality and reliability of buses Some success
Some success
26 The price of car parking in Aberdeen city centre relative to bus fares
Some success
27 The cost of a monthly bus ticket in Aberdeen compared with other Scottish cities
No target set
28 The number of people using park and ride sites in the north east
On target
Wrong direction
29 The ability to transfer from one transport company to another with minimum hassle and using a single ticket
On target
Cycling and Walking
30 Total number of cyclists recorded on key routes – Aberdeen City
On target
31 Total number of cyclists recorded on key routes – Aberdeenshire
Some success
Mode Split and Personal Travel
32 The proportion of households in the north east without access to a car or van
No target set
33 The number of blue badge holders in the north east No target set
34 The proportion of taxis which are capable of carrying wheelchairs
On target
35 The proportion of travel to work journeys by modes other than car driver
Wrong direction
36 The proportion of children travelling actively to school Some success
37 Number of participants in the Getabout car share scheme On target
38 Number of car club members On target
Journey Times and Congestion
39 The percentage of driver journeys delayed due to congestion
Some success
40 Average journey speeds by car and public transport Some success
Wrong direction
41 Typical journey times by road to and from Aberdeen city centre
No target set
Road safety
42 The number of casualties in road traffic collisions On target
43 The number of deaths in road traffic collisions On target
Environment
44 Carbon Dioxide emissions road transport Some success
45 The number of public EV points available in the north east On target
On target
46 The average atmospheric concentrations of nitrogen dioxide
Some success
47 The average atmospheric concentrations of particulates On target
48 The number of Noise Management Areas Trend yet to be established
Page 41
Nestrans Regional Transport Strategy Monitoring Report 2019
8
3. Population
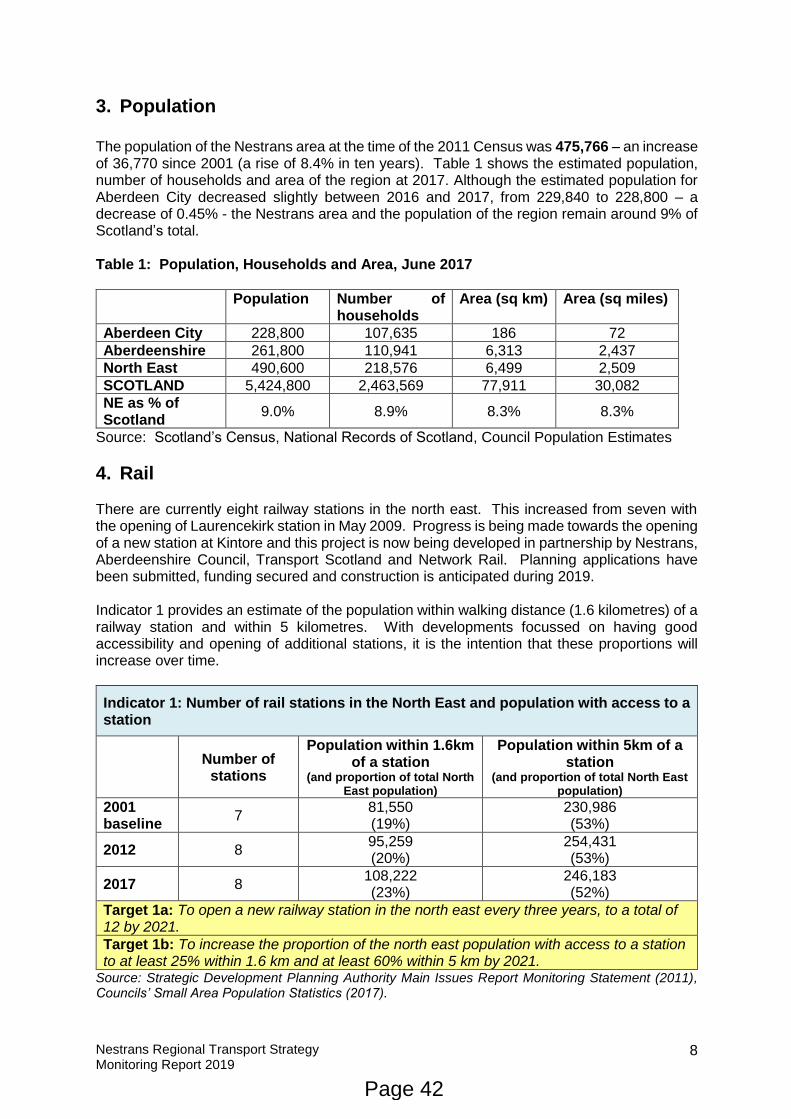
The population of the Nestrans area at the time of the 2011 Census was 475,766 – an increase of 36,770 since 2001 (a rise of 8.4% in ten years). Table 1 shows the estimated population, number of households and area of the region at 2017. Although the estimated population for Aberdeen City decreased slightly between 2016 and 2017, from 229,840 to 228,800 – a decrease of 0.45% - the Nestrans area and the population of the region remain around 9% of Scotland’s total. Table 1: Population, Households and Area, June 2017
Population Number of households
Area (sq km) Area (sq miles)
Aberdeen City 228,800 107,635 186 72
Aberdeenshire 261,800 110,941 6,313 2,437
North East 490,600 218,576 6,499 2,509
SCOTLAND 5,424,800 2,463,569 77,911 30,082
NE as % of Scotland
9.0% 8.9% 8.3% 8.3%
Source: Scotland’s Census, National Records of Scotland, Council Population Estimates
4. Rail There are currently eight railway stations in the north east. This increased from seven with the opening of Laurencekirk station in May 2009. Progress is being made towards the opening of a new station at Kintore and this project is now being developed in partnership by Nestrans, Aberdeenshire Council, Transport Scotland and Network Rail. Planning applications have been submitted, funding secured and construction is anticipated during 2019. Indicator 1 provides an estimate of the population within walking distance (1.6 kilometres) of a railway station and within 5 kilometres. With developments focussed on having good accessibility and opening of additional stations, it is the intention that these proportions will increase over time.
Indicator 1: Number of rail stations in the North East and population with access to a station
Number of
stations
Population within 1.6km of a station
(and proportion of total North East population)
Population within 5km of a station
(and proportion of total North East population)
2001 baseline
7 81,550 (19%)
230,986 (53%)
2012 8 95,259 (20%)
254,431 (53%)
2017 8 108,222 (23%)
246,183 (52%)
Target 1a: To open a new railway station in the north east every three years, to a total of 12 by 2021.
Target 1b: To increase the proportion of the north east population with access to a station to at least 25% within 1.6 km and at least 60% within 5 km by 2021.
Source: Strategic Development Planning Authority Main Issues Report Monitoring Statement (2011), Councils’ Small Area Population Statistics (2017).
Page 42
Nestrans Regional Transport Strategy Monitoring Report 2019
9
Indicator 2: Number of rail services per week (with typical journey times) from Aberdeen to key destinations
London Sleeper Edinburgh Glasgow Dundee Inverness Inverurie Total
journeys
No
. o
f S
erv
ice
s (
av
era
ge
jo
urn
ey
tim
es
)
2007 Baseline
19 (7hrs 02)
7 (10hrs 24)
124 (2hrs 25)
102 (2hrs 33)
232 (1hr 11)
59 (2hrs 15)
95 (0hrs 25)
638
2012 (5 yrs)
21 (7hrs 11)
6 (10hrs 05)
117 (2hrs 29)
96 (2hrs 40)
231 (1hr 12)
71 (2hrs 16)
131 (0hrs 23)
673
2017 (10 yrs)
21 (7hrs 16)
6 (10hrs 41)
118 (2hrs 31)
108 (2hrs 39)
229 (1hr 13)
71 (2hrs 16)
144 (0hrs 22)
697
2018 21 (7hrs 04)
6 (10hrs 04)
118 (2hrs 33)
106 (2hrs 43)
231 (1hr 13)
71 (2hrs 15)
142 (0hrs 23)
695
2019 21 (7hrs 05)
6 (10hrs 44)
118
(2hrs 30)
106
(2hrs 37)
231
(1hr 11)
71
(2hrs 16)
142
(0hrs 22)
695 (+8.9%
on baseline)
2012 - 2019 times are average journey times across all services Monday to Sunday – this is different to previous years which simply recorded a typical journey time.
Target 2a: To increase the number of rail services to key destinations by 10% every five years (i.e. services from Aberdeen to six key destinations increasing from 638 services in 2007 to 834 services per week by 2021).
Target 2b: To have shorter rail journey times to key destinations, reduced by at least 10% of 2007 baseline by 2021 (i.e. Aberdeen-London <6hrs 30; Aberdeen-Edinburgh <2hrs 10; Aberdeen-Glasgow <2hrs 20; Aberdeen-Inverness <2hrs).
Source: Rail timetables
Please note that the journey time for the sleeper service has been affected by an increase in the journey times on a Sunday. It should be noted that there are timetable variations that bring the average journey time to 10hrs 06.
Indicator 3: Number of passengers per year through North East stations (and ranking within Scotland for those in top 100)
Aberdeen Dyce S’haven Inverurie Insch L’kirk Huntly P’lethen TOTAL
2010/11
Baseline
2,964,302
(5th)
579,660
(59th)
482,722
(74th)
345,790
(99th) 86,854 73,594 90,010 18,382 4,641,314
2014/15 3,742,646 823,866 534,892 534,462 122,404 112,914 104,534 57,152 6,032,870
2015/16
(5 years)
3,459,944
(5th)
664,396
(58th)
535,698
(79th)
533,972
(80th) 118,378 104,488 105,846 56,324 5,579,046
2016/17 3,058,268
(5th)
517,586
(78th)
504,750 ( 81st)
511,708
(79th)
98,140
96,002
94,904
45,936
4,927,294
2017/18 2,948,186
(7th) 466,700
(85th) 522,890
(78th) 488,950
(82nd) 88,362 95,848 92,958 42,748 4,746,642
% change from
baseline (2010/11 to
2017/18)
-1% -19% 8% 41% 2% 30% 3% 133% 2%
Target 3: to increase passenger numbers through the north east’s railway stations by 50% by 2021 on 2010/11 figures
Source: Office of the Rail Regulator and Scottish Transport Statistics
Page 43
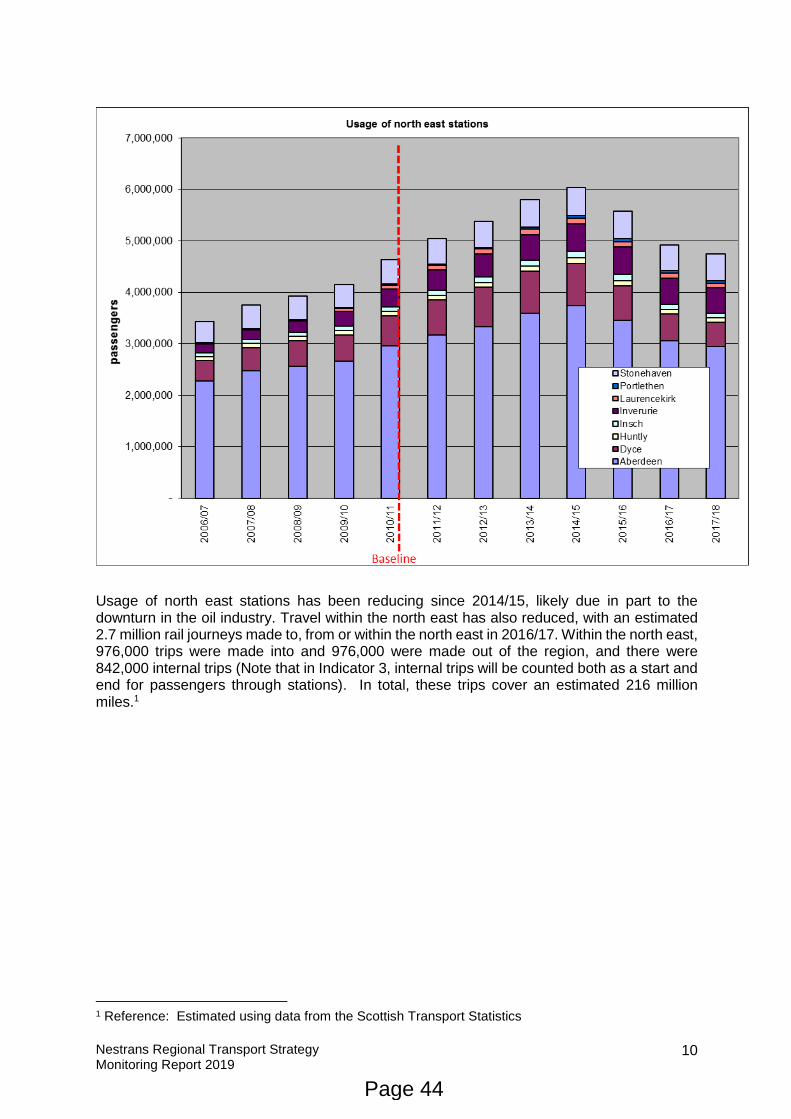
Nestrans Regional Transport Strategy Monitoring Report 2019
10
Usage of north east stations has been reducing since 2014/15, likely due in part to the downturn in the oil industry. Travel within the north east has also reduced, with an estimated 2.7 million rail journeys made to, from or within the north east in 2016/17. Within the north east, 976,000 trips were made into and 976,000 were made out of the region, and there were 842,000 internal trips (Note that in Indicator 3, internal trips will be counted both as a start and end for passengers through stations). In total, these trips cover an estimated 216 million miles.1
1 Reference: Estimated using data from the Scottish Transport Statistics
Page 44
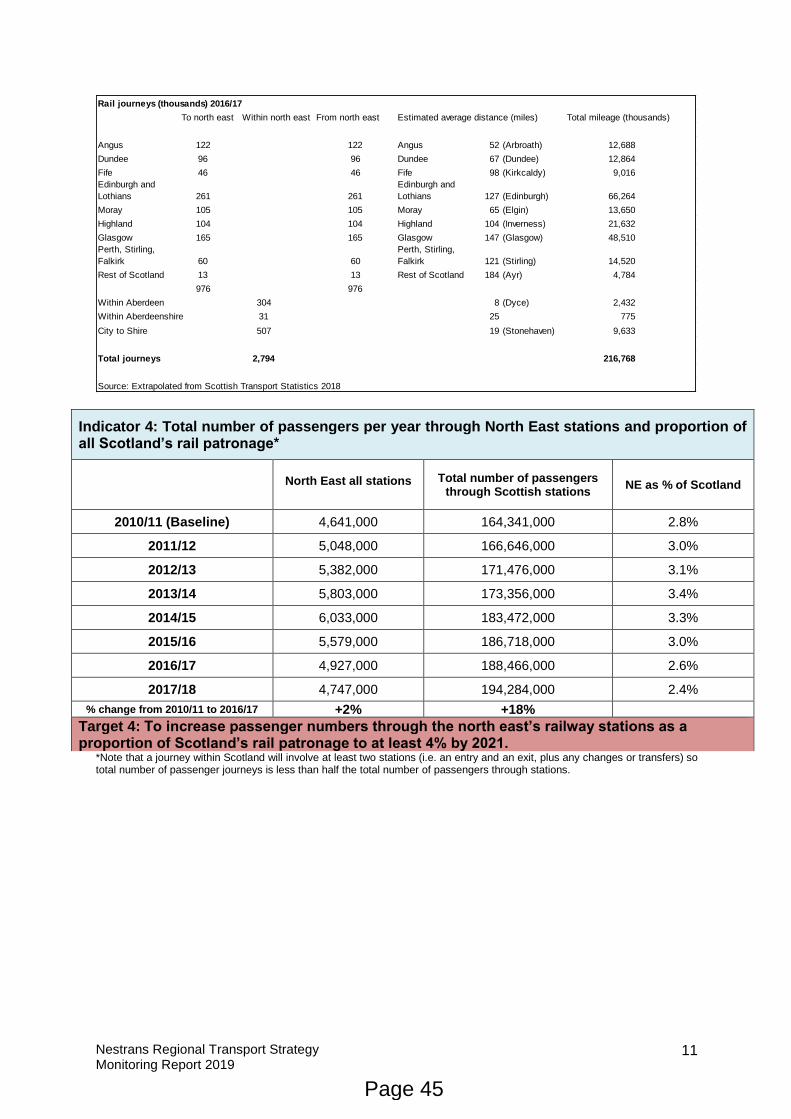
Nestrans Regional Transport Strategy Monitoring Report 2019
11
Indicator 4: Total number of passengers per year through North East stations and proportion of all Scotland’s rail patronage*
North East all stations
Total number of passengers through Scottish stations
NE as % of Scotland
2010/11 (Baseline) 4,641,000 164,341,000 2.8%
2011/12 5,048,000 166,646,000 3.0%
2012/13 5,382,000 171,476,000 3.1%
2013/14 5,803,000 173,356,000 3.4%
2014/15 6,033,000 183,472,000 3.3%
2015/16 5,579,000 186,718,000 3.0%
2016/17 4,927,000 188,466,000 2.6%
2017/18 4,747,000 194,284,000 2.4%
% change from 2010/11 to 2016/17 +2% +18%
Target 4: To increase passenger numbers through the north east’s railway stations as a proportion of Scotland’s rail patronage to at least 4% by 2021.
*Note that a journey within Scotland will involve at least two stations (i.e. an entry and an exit, plus any changes or transfers) so total number of passenger journeys is less than half the total number of passengers through stations.
Rail journeys (thousands) 2016/17
To north east Within north east From north east Estimated average distance (miles) Total mileage (thousands)
Angus 122 122 Angus 52 (Arbroath) 12,688
Dundee 96 96 Dundee 67 (Dundee) 12,864
Fife 46 46 Fife 98 (Kirkcaldy) 9,016
Edinburgh and
Lothians 261 261
Edinburgh and
Lothians 127 (Edinburgh) 66,264
Moray 105 105 Moray 65 (Elgin) 13,650
Highland 104 104 Highland 104 (Inverness) 21,632
Glasgow 165 165 Glasgow 147 (Glasgow) 48,510
Perth, Stirling,
Falkirk 60 60
Perth, Stirling,
Falkirk 121 (Stirling) 14,520
Rest of Scotland 13 13 Rest of Scotland 184 (Ayr) 4,784
976 976
Within Aberdeen 304 8 (Dyce) 2,432
Within Aberdeenshire 31 25 775
City to Shire 507 19 (Stonehaven) 9,633
Total journeys 2,794 216,768
Source: Extrapolated from Scottish Transport Statistics 2018
Page 45
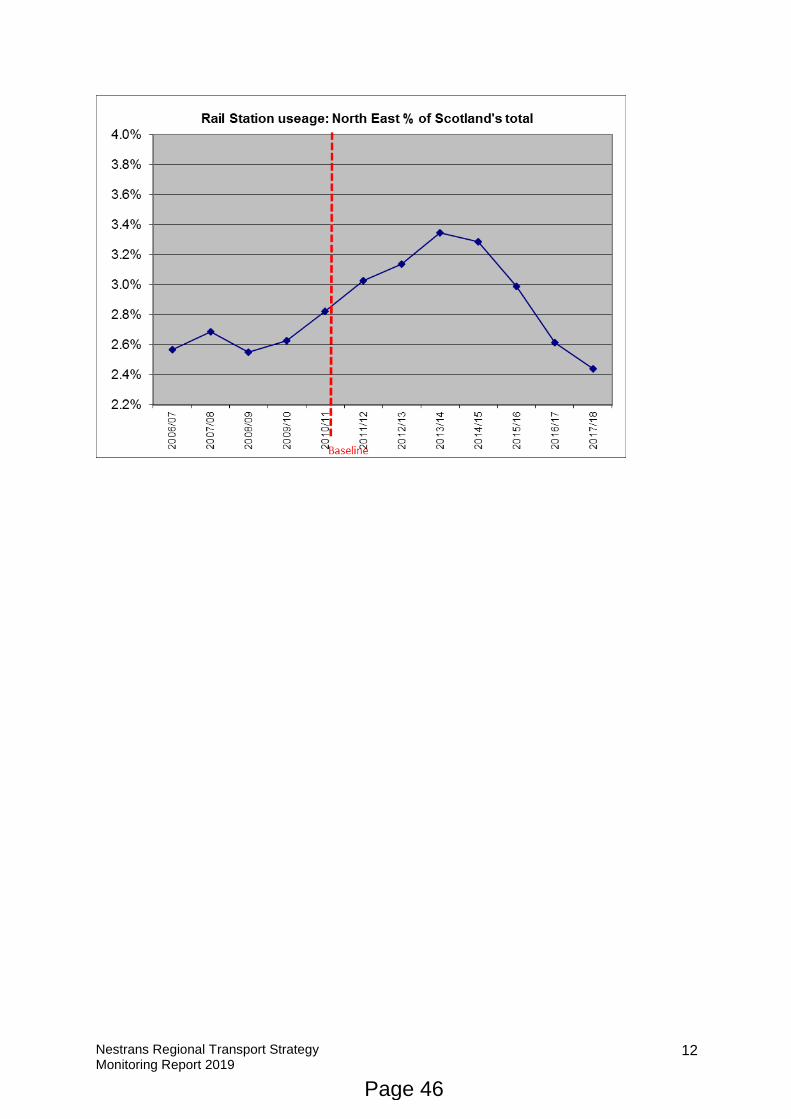
Nestrans Regional Transport Strategy Monitoring Report 2019
12
Page 46
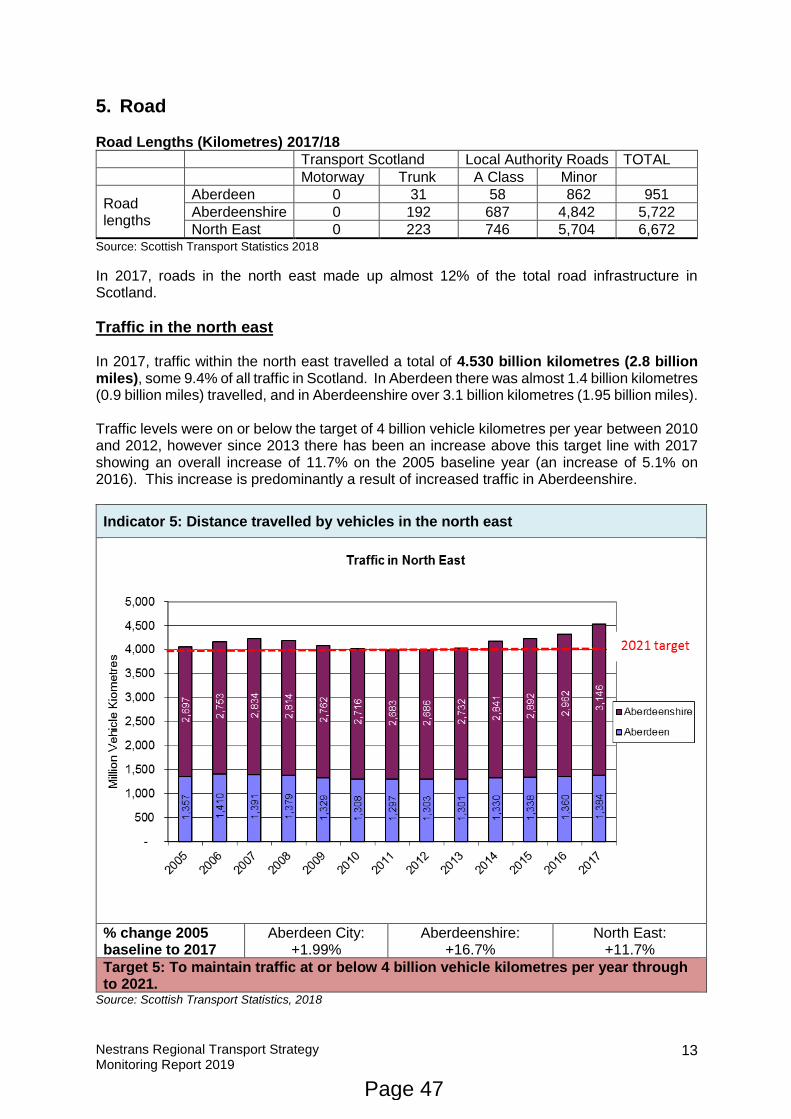
Nestrans Regional Transport Strategy Monitoring Report 2019
13
5. Road Road Lengths (Kilometres) 2017/18
Transport Scotland Local Authority Roads TOTAL
Motorway Trunk A Class Minor
Road lengths
Aberdeen 0 31 58 862 951
Aberdeenshire 0 192 687 4,842 5,722
North East 0 223 746 5,704 6,672 Source: Scottish Transport Statistics 2018
In 2017, roads in the north east made up almost 12% of the total road infrastructure in Scotland.
Traffic in the north east In 2017, traffic within the north east travelled a total of 4.530 billion kilometres (2.8 billion miles), some 9.4% of all traffic in Scotland. In Aberdeen there was almost 1.4 billion kilometres (0.9 billion miles) travelled, and in Aberdeenshire over 3.1 billion kilometres (1.95 billion miles). Traffic levels were on or below the target of 4 billion vehicle kilometres per year between 2010 and 2012, however since 2013 there has been an increase above this target line with 2017 showing an overall increase of 11.7% on the 2005 baseline year (an increase of 5.1% on 2016). This increase is predominantly a result of increased traffic in Aberdeenshire.
Indicator 5: Distance travelled by vehicles in the north east
% change 2005 baseline to 2017
Aberdeen City: +1.99%
Aberdeenshire: +16.7%
North East: +11.7%
Target 5: To maintain traffic at or below 4 billion vehicle kilometres per year through to 2021.
Source: Scottish Transport Statistics, 2018
Page 47
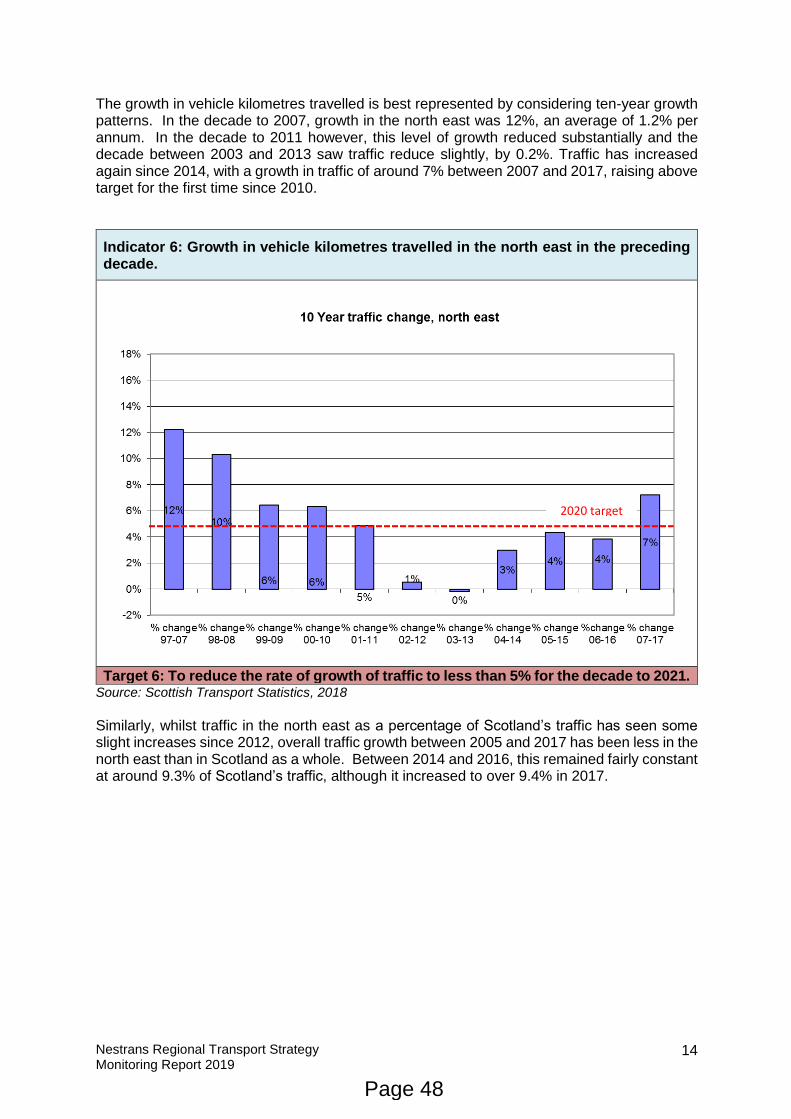
Nestrans Regional Transport Strategy Monitoring Report 2019
14
The growth in vehicle kilometres travelled is best represented by considering ten-year growth patterns. In the decade to 2007, growth in the north east was 12%, an average of 1.2% per annum. In the decade to 2011 however, this level of growth reduced substantially and the decade between 2003 and 2013 saw traffic reduce slightly, by 0.2%. Traffic has increased again since 2014, with a growth in traffic of around 7% between 2007 and 2017, raising above target for the first time since 2010.
Indicator 6: Growth in vehicle kilometres travelled in the north east in the preceding decade.
Target 6: To reduce the rate of growth of traffic to less than 5% for the decade to 2021. Source: Scottish Transport Statistics, 2018
Similarly, whilst traffic in the north east as a percentage of Scotland’s traffic has seen some slight increases since 2012, overall traffic growth between 2005 and 2017 has been less in the north east than in Scotland as a whole. Between 2014 and 2016, this remained fairly constant at around 9.3% of Scotland’s traffic, although it increased to over 9.4% in 2017.
2020 target
Page 48
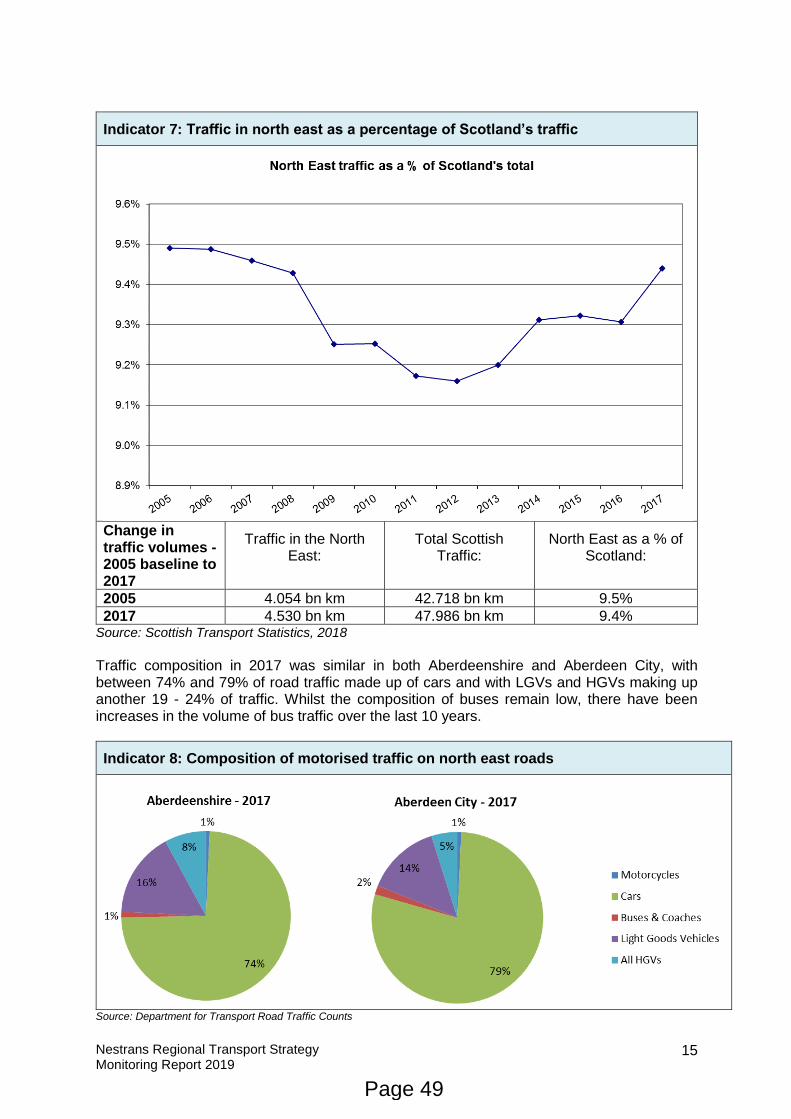
Nestrans Regional Transport Strategy Monitoring Report 2019
15
Indicator 7: Traffic in north east as a percentage of Scotland’s traffic
Change in traffic volumes - 2005 baseline to 2017
Traffic in the North East:
Total Scottish Traffic:
North East as a % of Scotland:
2005 4.054 bn km 42.718 bn km 9.5%
2017 4.530 bn km 47.986 bn km 9.4% Source: Scottish Transport Statistics, 2018
Traffic composition in 2017 was similar in both Aberdeenshire and Aberdeen City, with between 74% and 79% of road traffic made up of cars and with LGVs and HGVs making up another 19 - 24% of traffic. Whilst the composition of buses remain low, there have been increases in the volume of bus traffic over the last 10 years.
Indicator 8: Composition of motorised traffic on north east roads
Source: Department for Transport Road Traffic Counts
Page 49
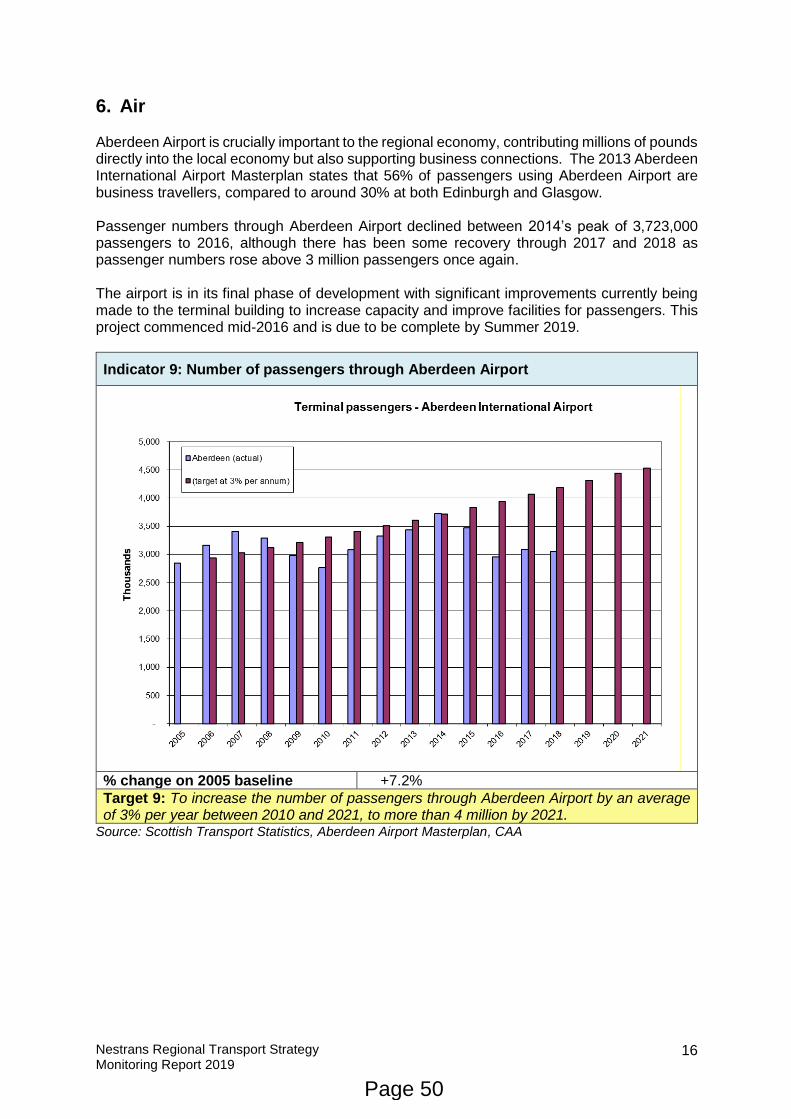
Nestrans Regional Transport Strategy Monitoring Report 2019
16
6. Air Aberdeen Airport is crucially important to the regional economy, contributing millions of pounds directly into the local economy but also supporting business connections. The 2013 Aberdeen International Airport Masterplan states that 56% of passengers using Aberdeen Airport are business travellers, compared to around 30% at both Edinburgh and Glasgow. Passenger numbers through Aberdeen Airport declined between 2014’s peak of 3,723,000 passengers to 2016, although there has been some recovery through 2017 and 2018 as passenger numbers rose above 3 million passengers once again. The airport is in its final phase of development with significant improvements currently being made to the terminal building to increase capacity and improve facilities for passengers. This project commenced mid-2016 and is due to be complete by Summer 2019.
Indicator 9: Number of passengers through Aberdeen Airport
% change on 2005 baseline +7.2%
Target 9: To increase the number of passengers through Aberdeen Airport by an average of 3% per year between 2010 and 2021, to more than 4 million by 2021.
Source: Scottish Transport Statistics, Aberdeen Airport Masterplan, CAA
Page 50
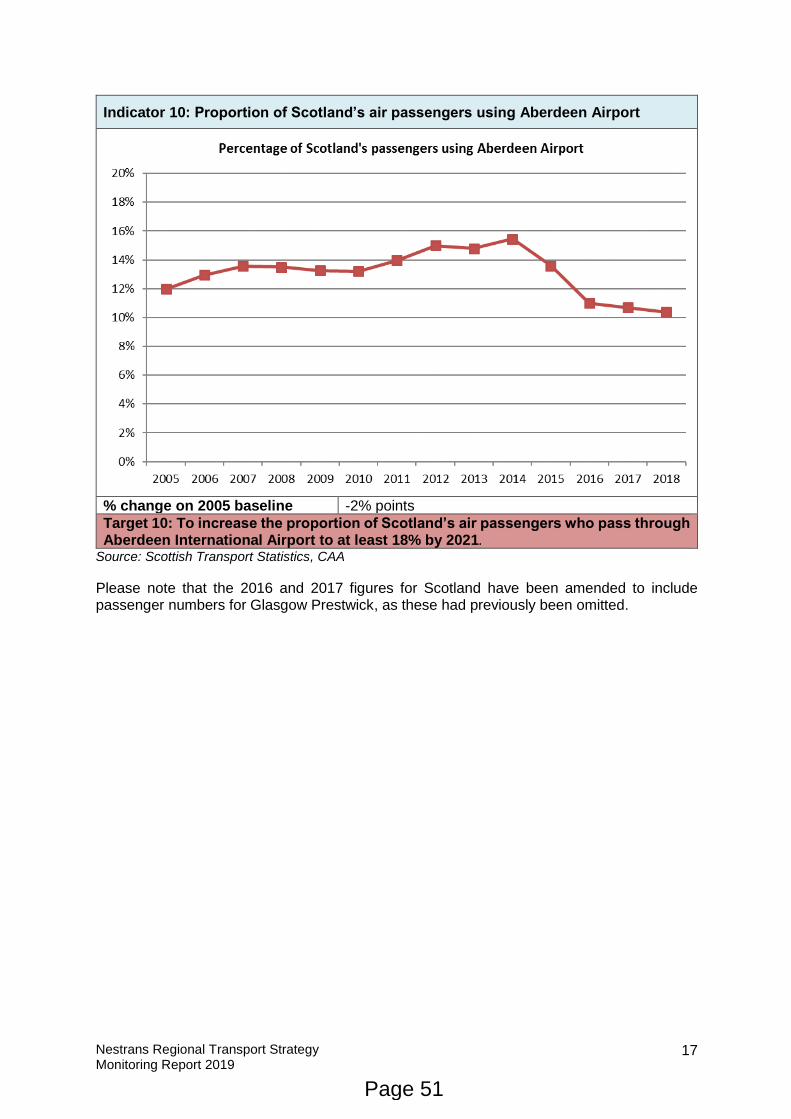
Nestrans Regional Transport Strategy Monitoring Report 2019
17
Indicator 10: Proportion of Scotland’s air passengers using Aberdeen Airport
% change on 2005 baseline -2% points
Target 10: To increase the proportion of Scotland’s air passengers who pass through Aberdeen International Airport to at least 18% by 2021.
Source: Scottish Transport Statistics, CAA
Please note that the 2016 and 2017 figures for Scotland have been amended to include passenger numbers for Glasgow Prestwick, as these had previously been omitted.
Page 51
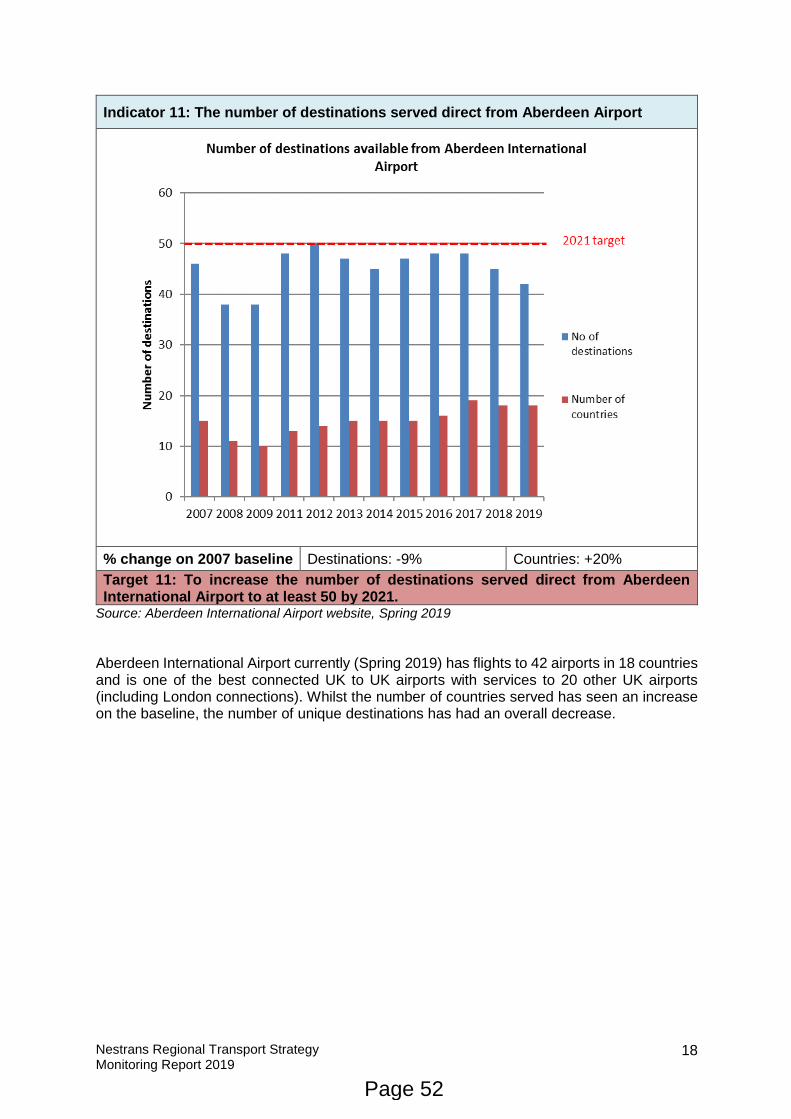
Nestrans Regional Transport Strategy Monitoring Report 2019
18
Indicator 11: The number of destinations served direct from Aberdeen Airport
% change on 2007 baseline Destinations: -9% Countries: +20%
Target 11: To increase the number of destinations served direct from Aberdeen International Airport to at least 50 by 2021.
Source: Aberdeen International Airport website, Spring 2019
Aberdeen International Airport currently (Spring 2019) has flights to 42 airports in 18 countries and is one of the best connected UK to UK airports with services to 20 other UK airports (including London connections). Whilst the number of countries served has seen an increase on the baseline, the number of unique destinations has had an overall decrease.
Page 52
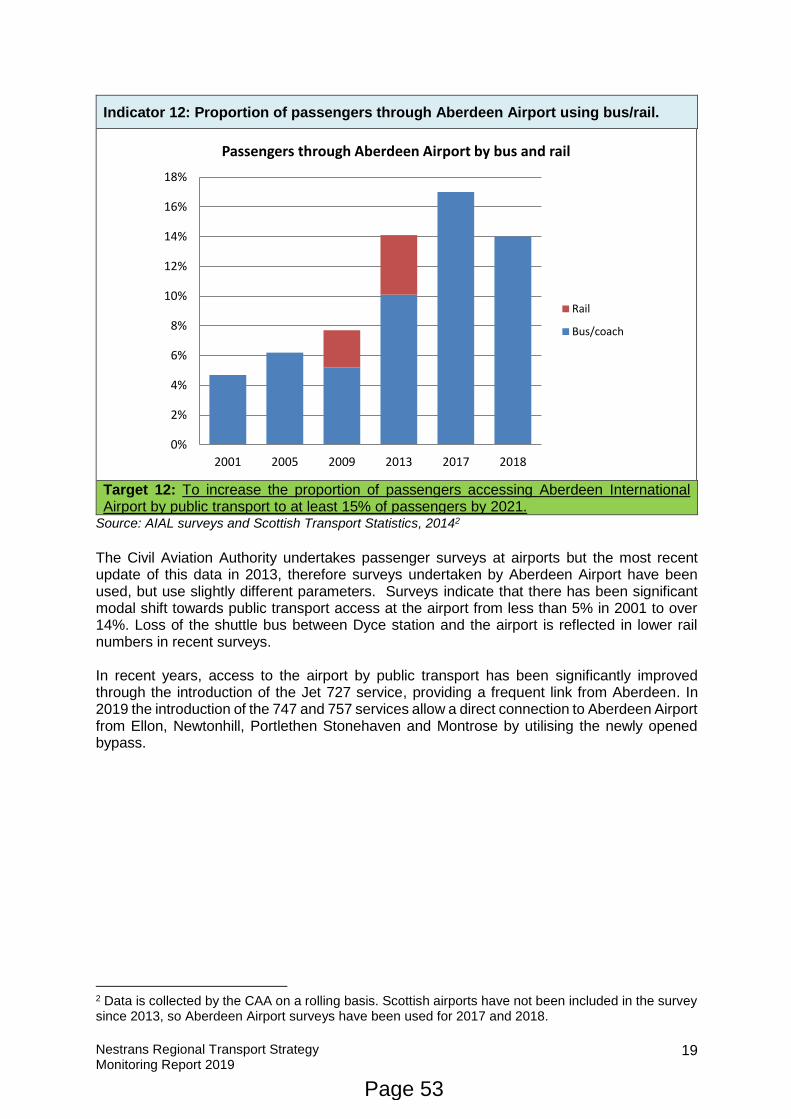
Nestrans Regional Transport Strategy Monitoring Report 2019
19
Indicator 12: Proportion of passengers through Aberdeen Airport using bus/rail.
Target 12: To increase the proportion of passengers accessing Aberdeen International Airport by public transport to at least 15% of passengers by 2021.
Source: AIAL surveys and Scottish Transport Statistics, 20142
The Civil Aviation Authority undertakes passenger surveys at airports but the most recent update of this data in 2013, therefore surveys undertaken by Aberdeen Airport have been used, but use slightly different parameters. Surveys indicate that there has been significant modal shift towards public transport access at the airport from less than 5% in 2001 to over 14%. Loss of the shuttle bus between Dyce station and the airport is reflected in lower rail numbers in recent surveys. In recent years, access to the airport by public transport has been significantly improved through the introduction of the Jet 727 service, providing a frequent link from Aberdeen. In 2019 the introduction of the 747 and 757 services allow a direct connection to Aberdeen Airport from Ellon, Newtonhill, Portlethen Stonehaven and Montrose by utilising the newly opened bypass.
2 Data is collected by the CAA on a rolling basis. Scottish airports have not been included in the survey since 2013, so Aberdeen Airport surveys have been used for 2017 and 2018.
0%
2%
4%
6%
8%
10%
12%
14%
16%
18%
2001 2005 2009 2013 2017 2018
Passengers through Aberdeen Airport by bus and rail
Rail
Bus/coach
Page 53
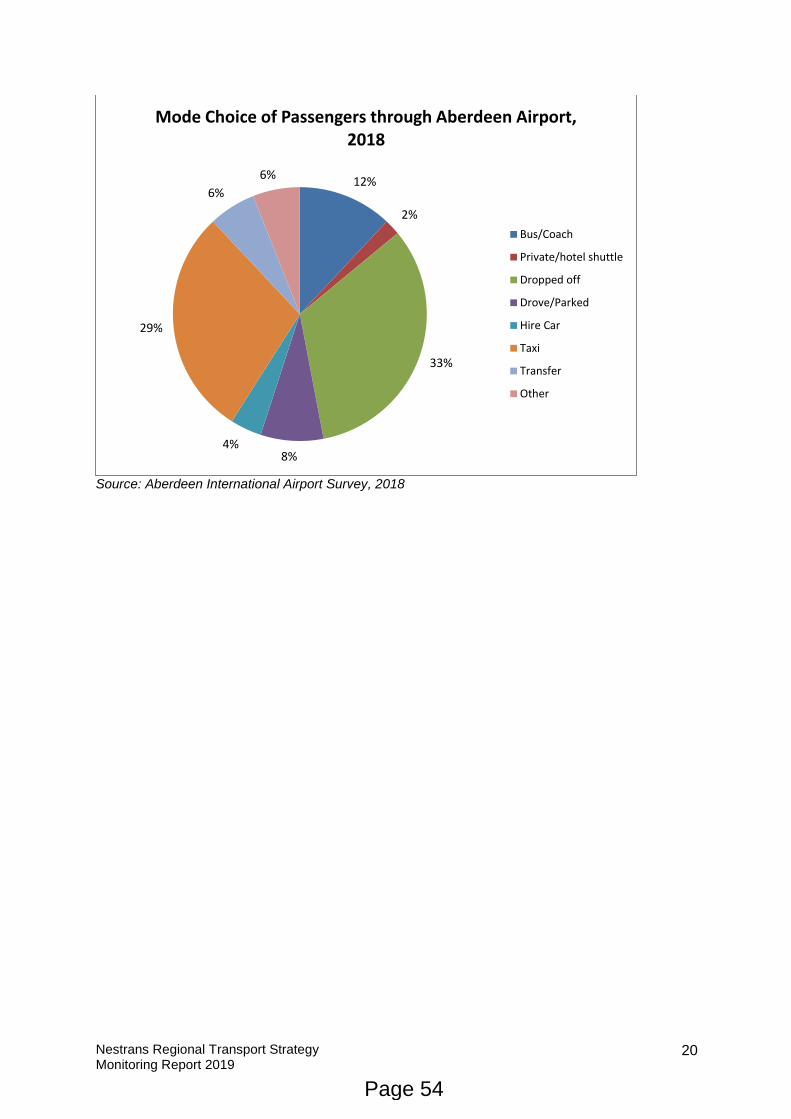
Nestrans Regional Transport Strategy Monitoring Report 2019
20
Source: Aberdeen International Airport Survey, 2018
12%
2%
33%
8%4%
29%
6%
6%
Mode Choice of Passengers through Aberdeen Airport, 2018
Bus/Coach
Private/hotel shuttle
Dropped off
Drove/Parked
Hire Car
Taxi
Transfer
Other
Page 54
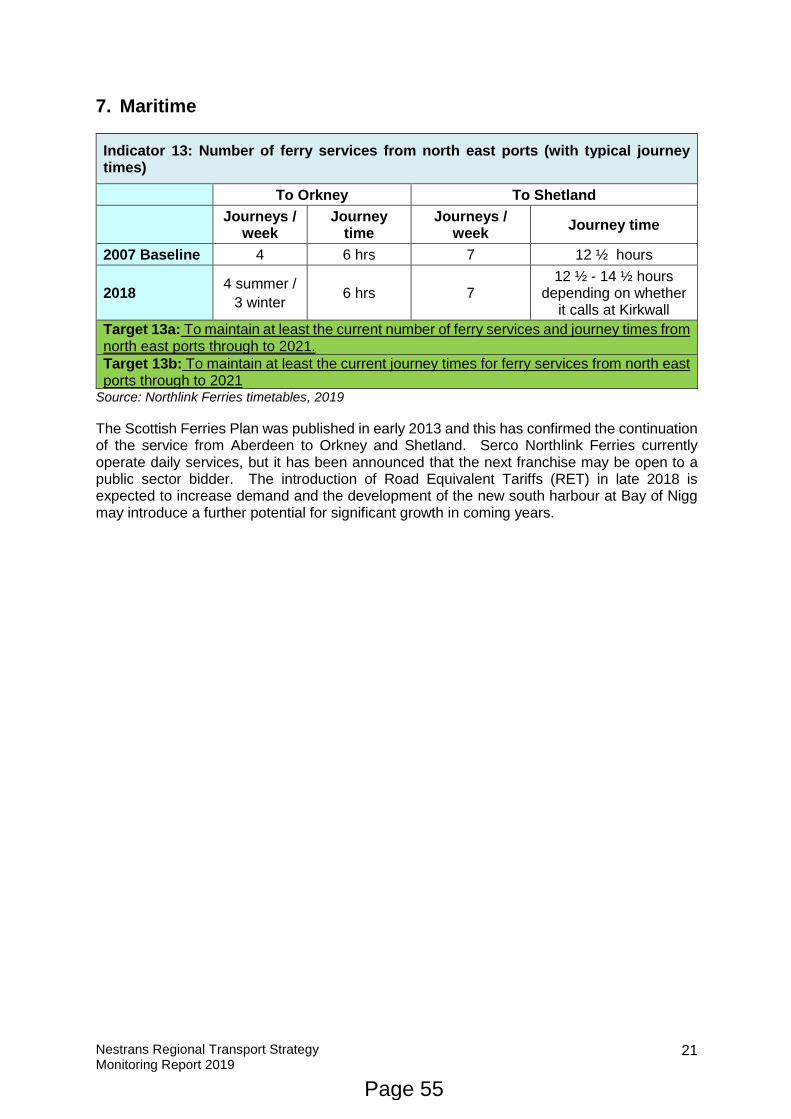
Nestrans Regional Transport Strategy Monitoring Report 2019
21
7. Maritime
Indicator 13: Number of ferry services from north east ports (with typical journey times)
To Orkney To Shetland
Journeys / week
Journey time
Journeys / week
Journey time
2007 Baseline 4 6 hrs 7 12 ½ hours
2018 4 summer /
3 winter 6 hrs 7
12 ½ - 14 ½ hours depending on whether
it calls at Kirkwall
Target 13a: To maintain at least the current number of ferry services and journey times from north east ports through to 2021.
Target 13b: To maintain at least the current journey times for ferry services from north east ports through to 2021
Source: Northlink Ferries timetables, 2019
The Scottish Ferries Plan was published in early 2013 and this has confirmed the continuation of the service from Aberdeen to Orkney and Shetland. Serco Northlink Ferries currently operate daily services, but it has been announced that the next franchise may be open to a public sector bidder. The introduction of Road Equivalent Tariffs (RET) in late 2018 is expected to increase demand and the development of the new south harbour at Bay of Nigg may introduce a further potential for significant growth in coming years.
Page 55
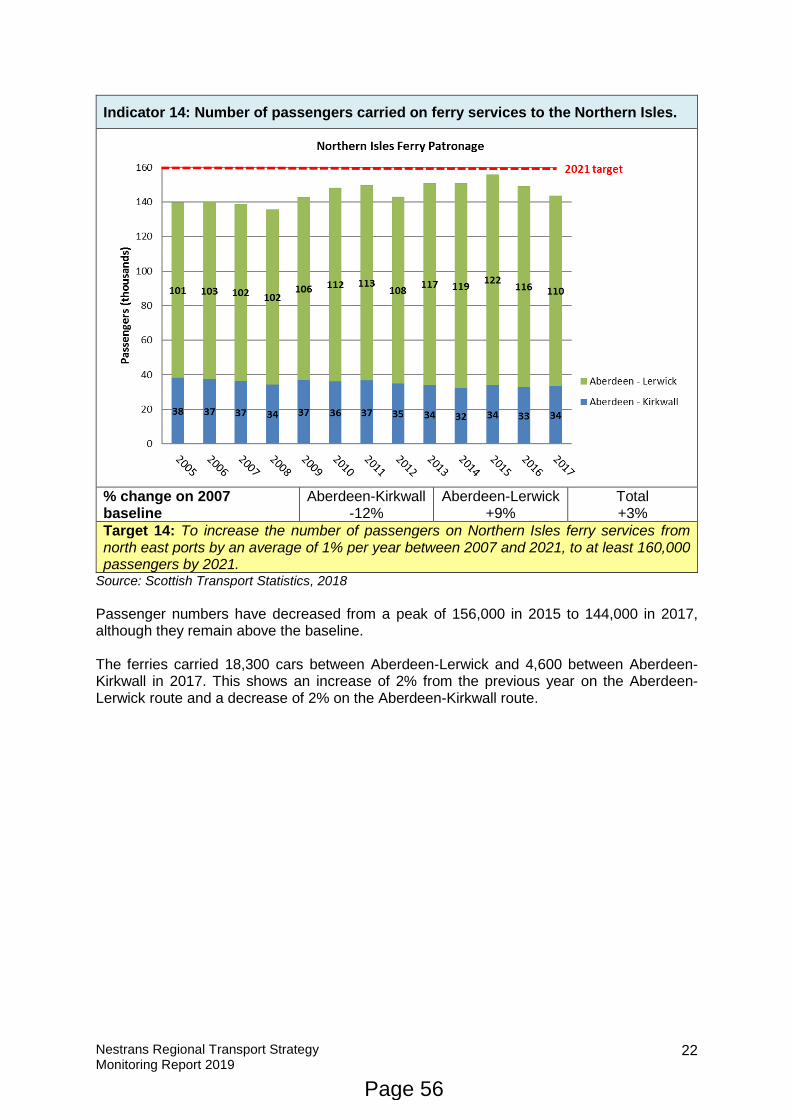
Nestrans Regional Transport Strategy Monitoring Report 2019
22
Indicator 14: Number of passengers carried on ferry services to the Northern Isles.
% change on 2007 baseline
Aberdeen-Kirkwall -12%
Aberdeen-Lerwick +9%
Total +3%
Target 14: To increase the number of passengers on Northern Isles ferry services from north east ports by an average of 1% per year between 2007 and 2021, to at least 160,000 passengers by 2021.
Source: Scottish Transport Statistics, 2018
Passenger numbers have decreased from a peak of 156,000 in 2015 to 144,000 in 2017, although they remain above the baseline. The ferries carried 18,300 cars between Aberdeen-Lerwick and 4,600 between Aberdeen-Kirkwall in 2017. This shows an increase of 2% from the previous year on the Aberdeen-Lerwick route and a decrease of 2% on the Aberdeen-Kirkwall route.
Page 56
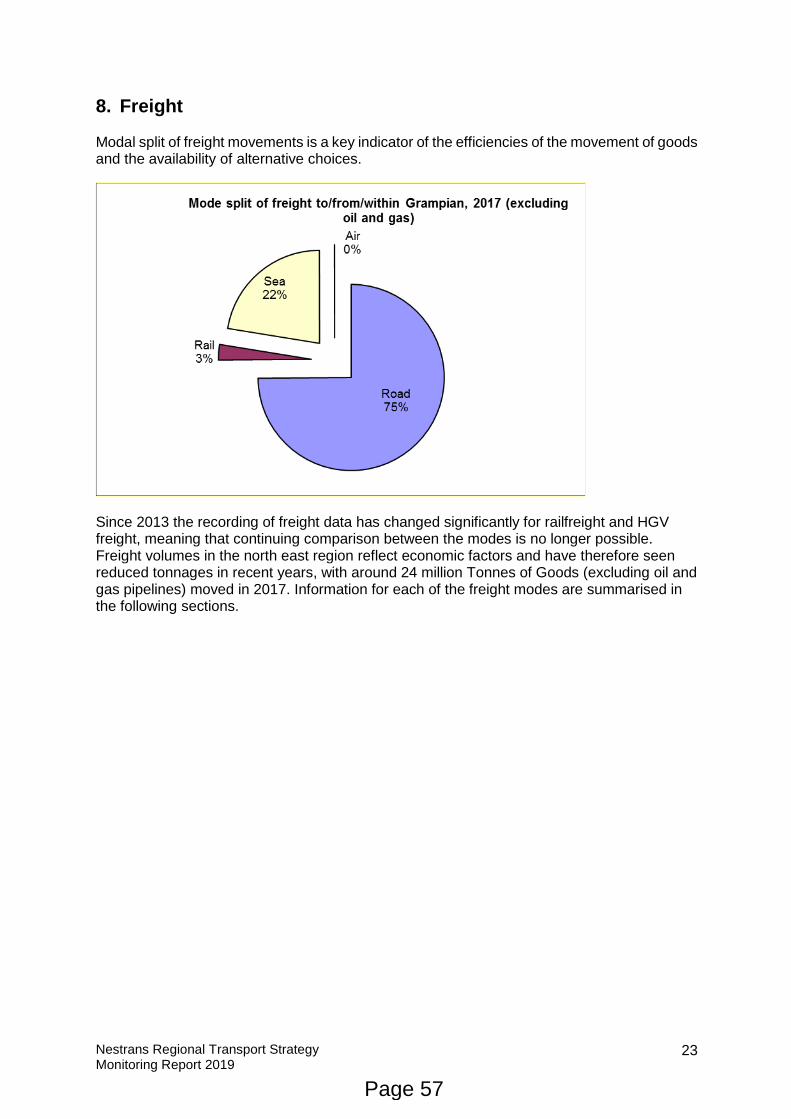
Nestrans Regional Transport Strategy Monitoring Report 2019
23
8. Freight Modal split of freight movements is a key indicator of the efficiencies of the movement of goods and the availability of alternative choices.
Since 2013 the recording of freight data has changed significantly for railfreight and HGV freight, meaning that continuing comparison between the modes is no longer possible. Freight volumes in the north east region reflect economic factors and have therefore seen reduced tonnages in recent years, with around 24 million Tonnes of Goods (excluding oil and gas pipelines) moved in 2017. Information for each of the freight modes are summarised in the following sections.
Page 57
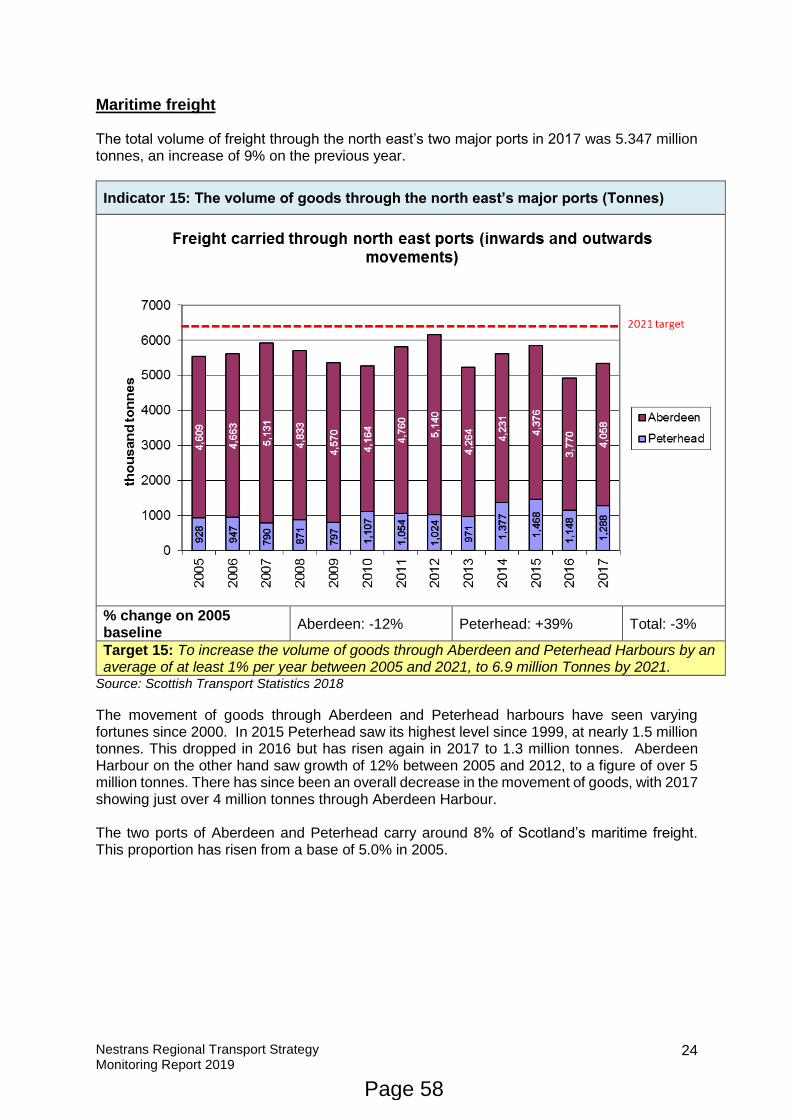
Nestrans Regional Transport Strategy Monitoring Report 2019
24
Maritime freight The total volume of freight through the north east’s two major ports in 2017 was 5.347 million tonnes, an increase of 9% on the previous year.
Indicator 15: The volume of goods through the north east’s major ports (Tonnes)
% change on 2005 baseline
Aberdeen: -12% Peterhead: +39% Total: -3%
Target 15: To increase the volume of goods through Aberdeen and Peterhead Harbours by an average of at least 1% per year between 2005 and 2021, to 6.9 million Tonnes by 2021.
Source: Scottish Transport Statistics 2018
The movement of goods through Aberdeen and Peterhead harbours have seen varying fortunes since 2000. In 2015 Peterhead saw its highest level since 1999, at nearly 1.5 million tonnes. This dropped in 2016 but has risen again in 2017 to 1.3 million tonnes. Aberdeen Harbour on the other hand saw growth of 12% between 2005 and 2012, to a figure of over 5 million tonnes. There has since been an overall decrease in the movement of goods, with 2017 showing just over 4 million tonnes through Aberdeen Harbour. The two ports of Aberdeen and Peterhead carry around 8% of Scotland’s maritime freight. This proportion has risen from a base of 5.0% in 2005.
Page 58
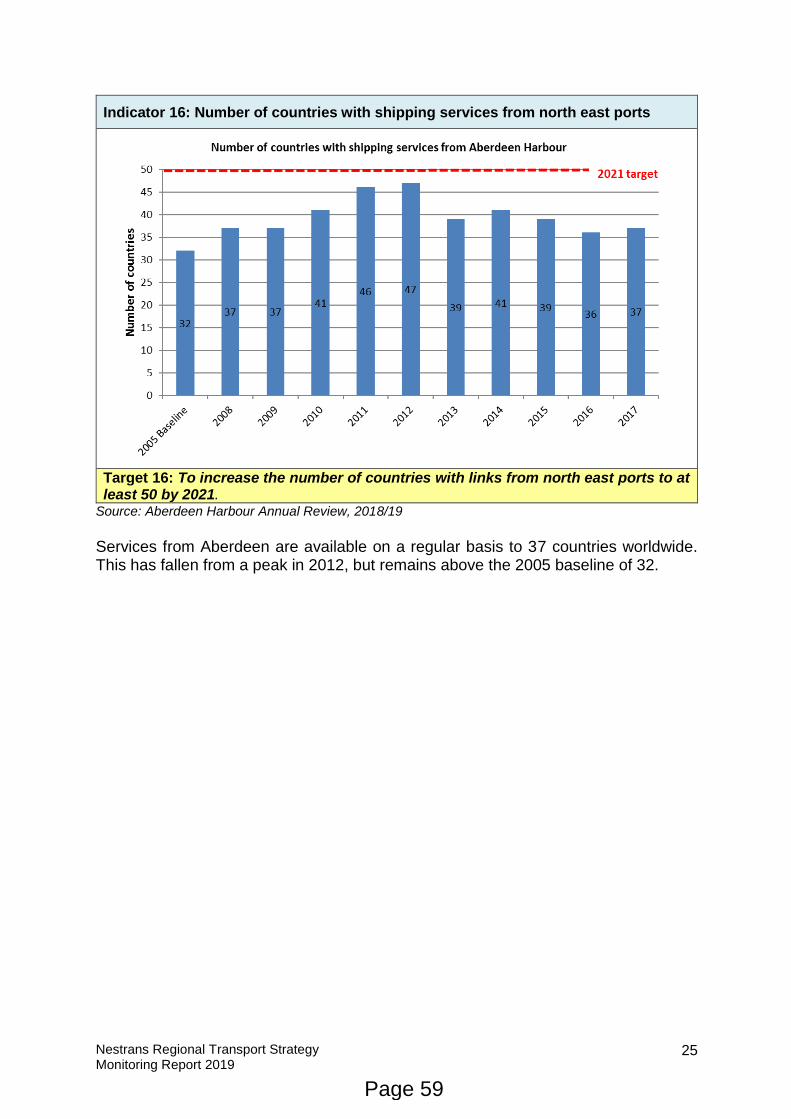
Nestrans Regional Transport Strategy Monitoring Report 2019
25
Indicator 16: Number of countries with shipping services from north east ports
Target 16: To increase the number of countries with links from north east ports to at least 50 by 2021.
Source: Aberdeen Harbour Annual Review, 2018/19
Services from Aberdeen are available on a regular basis to 37 countries worldwide. This has fallen from a peak in 2012, but remains above the 2005 baseline of 32.
Page 59
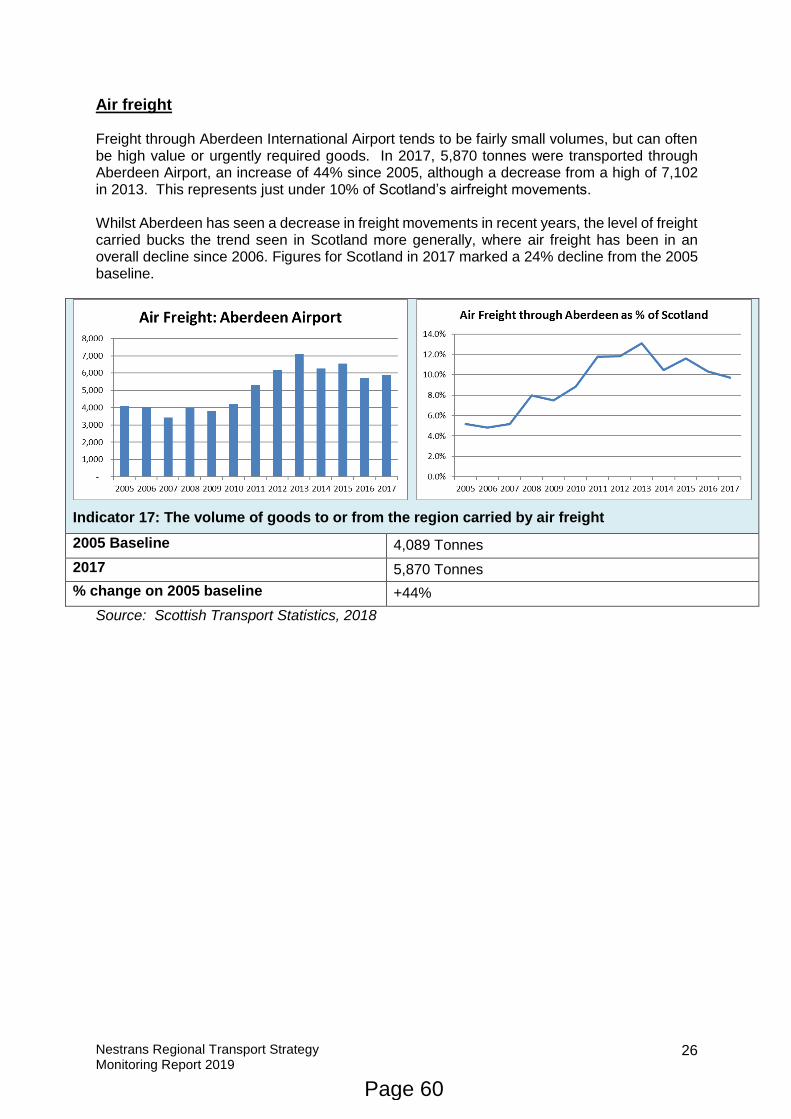
Nestrans Regional Transport Strategy Monitoring Report 2019
26
Air freight Freight through Aberdeen International Airport tends to be fairly small volumes, but can often be high value or urgently required goods. In 2017, 5,870 tonnes were transported through Aberdeen Airport, an increase of 44% since 2005, although a decrease from a high of 7,102 in 2013. This represents just under 10% of Scotland’s airfreight movements. Whilst Aberdeen has seen a decrease in freight movements in recent years, the level of freight carried bucks the trend seen in Scotland more generally, where air freight has been in an overall decline since 2006. Figures for Scotland in 2017 marked a 24% decline from the 2005 baseline.
Indicator 17: The volume of goods to or from the region carried by air freight
2005 Baseline 4,089 Tonnes
2017 5,870 Tonnes
% change on 2005 baseline +44%
Source: Scottish Transport Statistics, 2018
Page 60
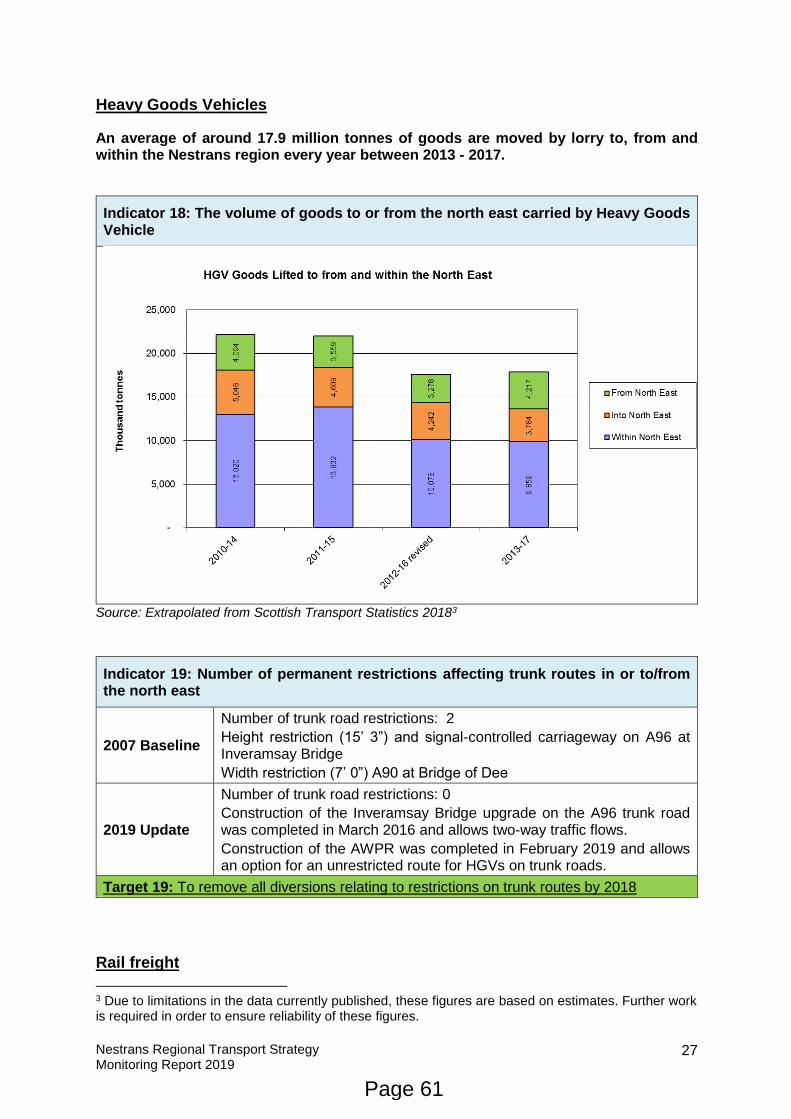
Nestrans Regional Transport Strategy Monitoring Report 2019
27
Heavy Goods Vehicles
An average of around 17.9 million tonnes of goods are moved by lorry to, from and within the Nestrans region every year between 2013 - 2017.
Indicator 18: The volume of goods to or from the north east carried by Heavy Goods Vehicle
Source: Extrapolated from Scottish Transport Statistics 20183
Indicator 19: Number of permanent restrictions affecting trunk routes in or to/from the north east
2007 Baseline
Number of trunk road restrictions: 2
Height restriction (15’ 3”) and signal-controlled carriageway on A96 at Inveramsay Bridge
Width restriction (7’ 0”) A90 at Bridge of Dee
2019 Update
Number of trunk road restrictions: 0
Construction of the Inveramsay Bridge upgrade on the A96 trunk road was completed in March 2016 and allows two-way traffic flows.
Construction of the AWPR was completed in February 2019 and allows an option for an unrestricted route for HGVs on trunk roads.
Target 19: To remove all diversions relating to restrictions on trunk routes by 2018
Rail freight
3 Due to limitations in the data currently published, these figures are based on estimates. Further work is required in order to ensure reliability of these figures.
Page 61
Nestrans Regional Transport Strategy Monitoring Report 2019
28
In 2007, Network Rail implemented a gauge enhancement between Mossend in Lanarkshire and Aberdeen/Elgin to remove one of the constraints restricting rail freight development to and from the north east. Terminal developments constructed at Raiths Farm, Craiginches and Waterloo Quay have combined to offer an enhanced rail freight product in the north east. Since 2013 data from rail freight has not been easily accessible in a comparable form. However recent correspondence in 2017 supplied the following information showing that whilst general rail freight is dropping in volume, the demands for materials required by large construction contracts such as the AWPR and the new harbour has increased the volume of materials carried to the north east. There are currently three active carriers of rail freight that serve Aberdeen. Freightliner Heavy Haul operated in Aberdeen until January 2016 when its contract was taken over by Colas Rail. Using information provided in 2017, an estimated tonnage per month to/from the north east has been calculated. This is a rough figure and is currently in the process of being better defined for future monitoring. Following from this estimation, it has been calculated that 2017 may have seen rail freight in the region of 640,000 tonnes overall.
Indicator 20: The volume of goods to or from the region carried by rail freight (2017)
Name of Company Direct Rail Services Ltd
Colas Rail DB Cargo
Details of Contents Supermarket grocery containers
Powdered cement Calcium carbonate and clay slurry
Route Mossend to Aberdeen
Dunbar to Aberdeen Mossend to Aberdeen
Frequency 7 days per week 6/7 trains per week on average
Once per week on Fridays
Estimated tonnage per month TO North East
20,304 30,000 n/a
Estimated tonnage per month FROM North East
2,030 n/a 1,296
Source: Operator correspondence
Page 62
Nestrans Regional Transport Strategy Monitoring Report 2019
29
9. Coach Many strategic passenger journeys to, from and within the north east are made by long-distance coach. Several operators are currently running services to or from Aberdeen, including the Megabus/Citylink/Parks of Hamilton consortium and National Express. Maintaining and improving the choice of a coach option for travel will be important in ensuring that the connectivity of the region is maintained.
Indicator 21: Number of coach services per week from the north east direct to key locations
Baseline 2007: Direct services per week to:
Edinburgh - 0
Glasgow – 111 (3hrs 15)
Inverness 86 (3hrs 51)
London – 14 (12hrs)
Manchester – 7 (8hrs 20)
Newcastle – 0
Birmingham - 0
Total Services per week: 218
2012 (5 years from baseline): Total Services per week: 275
2014 Total services per week: 448
2016 Total services per week: 541
2017 (10 years from baseline): Total services per week: 533
2018: Total services per week: 464
2019: Coaches per week Edinburgh – 111 (Citylink, Megabus & Parks of Hamilton) Glasgow – 130 (Citylink, Megabus & Parks of Hamilton) Inverness – 71 (Megabus & Stagecoach Service 10) London – 39 (Megabus and National Express) Manchester – 19 (Megabus) Newcastle – 0 (Megabus requires a 25 min change) Birmingham – 14 (National Express & Megabus) Total services per week: 384 % change since 2007 baseline: +76%
Target 21: To increase the number of bus and coach services to key destinations by 10% every five years (i.e. services from Aberdeen to seven key destinations increasing from 218 services in 2007 to 285 services per week by 2021).
Source: Operator timetables Although there has been a recent reduction in the number of long-distance coach services, the number of services per week is still currently above target, with the majority of the identified key destinations having increases since the Baseline. It should be noted that much of the reduction in service numbers in 2019 will be, in part, due to a correction in the assessment of Inverness services (as this previously included services that connected in Perth). It should be noted that, as of 2019, there has been a reduction in the number of direct and connecting services to Manchester, Newcastle and Birmingham; with Newcastle no longer offering any direct or easily connectible services (down from 14 in 2018). Whilst Glasgow has also seen a small reduction in services, Edinburgh has seen an increase in direct services from 2018.
10. Bus
Page 63
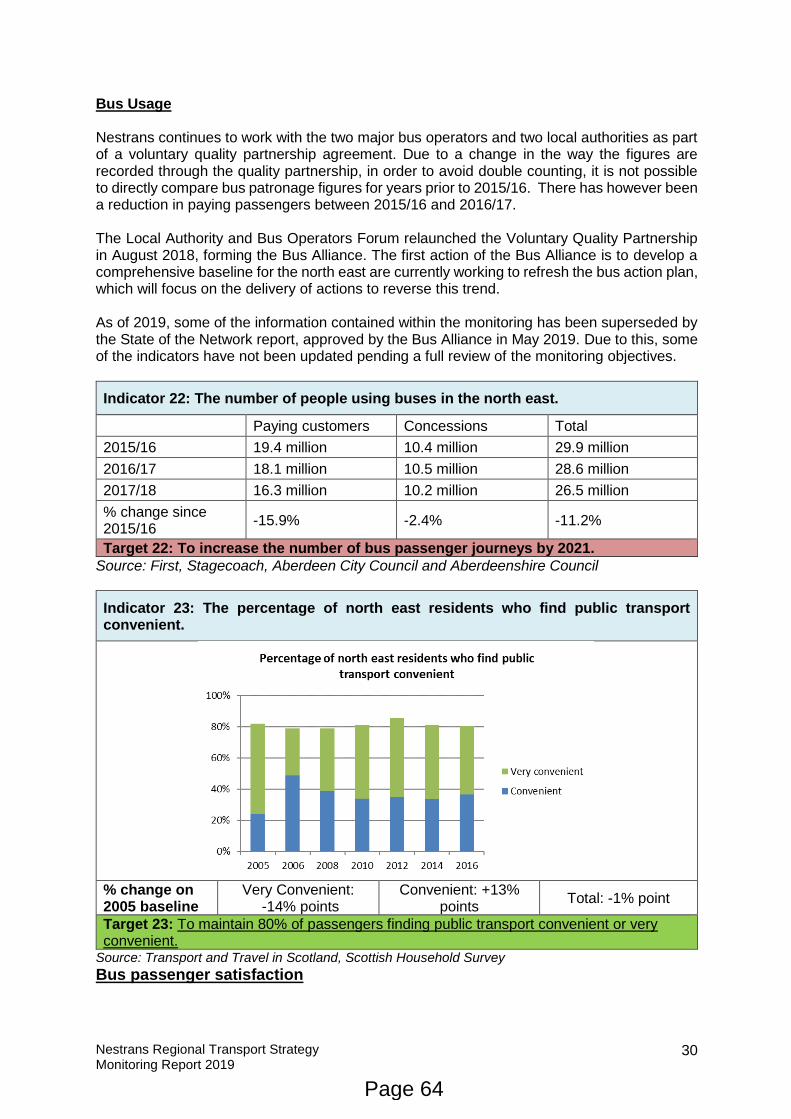
Nestrans Regional Transport Strategy Monitoring Report 2019
30
Bus Usage Nestrans continues to work with the two major bus operators and two local authorities as part of a voluntary quality partnership agreement. Due to a change in the way the figures are recorded through the quality partnership, in order to avoid double counting, it is not possible to directly compare bus patronage figures for years prior to 2015/16. There has however been a reduction in paying passengers between 2015/16 and 2016/17. The Local Authority and Bus Operators Forum relaunched the Voluntary Quality Partnership in August 2018, forming the Bus Alliance. The first action of the Bus Alliance is to develop a comprehensive baseline for the north east are currently working to refresh the bus action plan, which will focus on the delivery of actions to reverse this trend. As of 2019, some of the information contained within the monitoring has been superseded by the State of the Network report, approved by the Bus Alliance in May 2019. Due to this, some of the indicators have not been updated pending a full review of the monitoring objectives.
Indicator 22: The number of people using buses in the north east.
Paying customers Concessions Total
2015/16 19.4 million 10.4 million 29.9 million
2016/17 18.1 million 10.5 million 28.6 million
2017/18 16.3 million 10.2 million 26.5 million
% change since 2015/16
-15.9% -2.4% -11.2%
Target 22: To increase the number of bus passenger journeys by 2021.
Source: First, Stagecoach, Aberdeen City Council and Aberdeenshire Council
Indicator 23: The percentage of north east residents who find public transport convenient.
% change on 2005 baseline
Very Convenient: -14% points
Convenient: +13% points
Total: -1% point
Target 23: To maintain 80% of passengers finding public transport convenient or very convenient.
Source: Transport and Travel in Scotland, Scottish Household Survey
Bus passenger satisfaction
Page 64
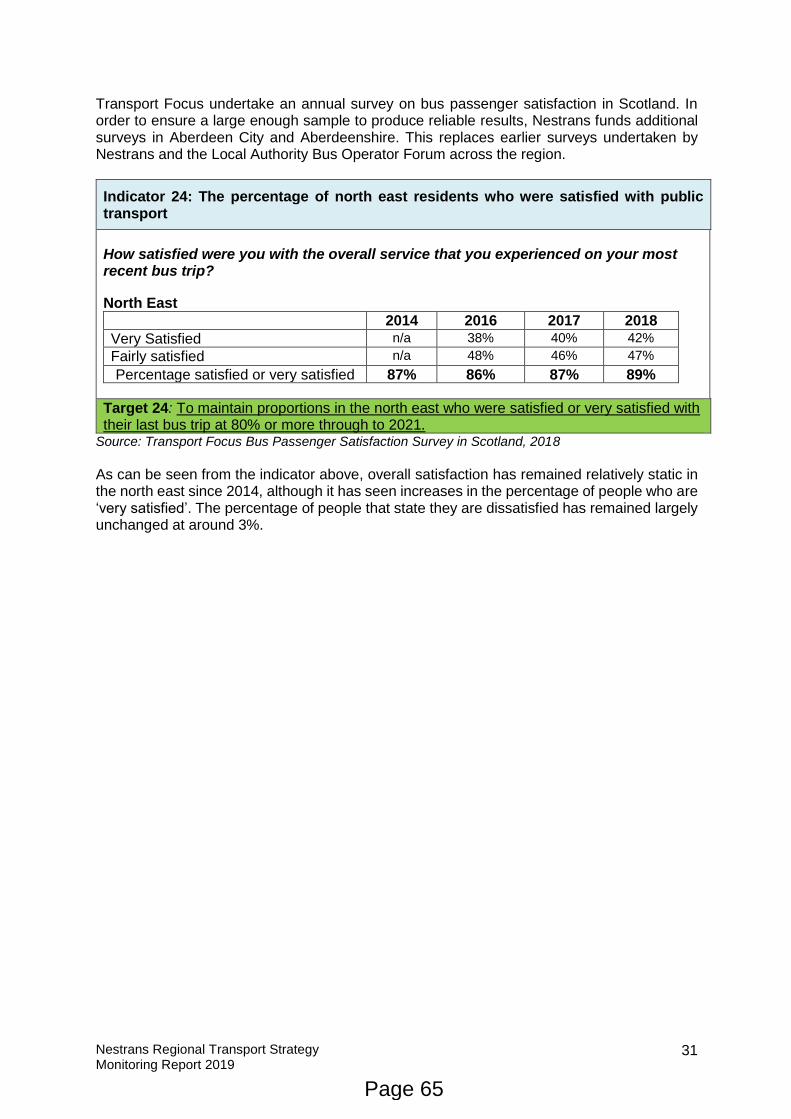
Nestrans Regional Transport Strategy Monitoring Report 2019
31
Transport Focus undertake an annual survey on bus passenger satisfaction in Scotland. In order to ensure a large enough sample to produce reliable results, Nestrans funds additional surveys in Aberdeen City and Aberdeenshire. This replaces earlier surveys undertaken by Nestrans and the Local Authority Bus Operator Forum across the region.
Indicator 24: The percentage of north east residents who were satisfied with public transport
How satisfied were you with the overall service that you experienced on your most recent bus trip?
North East
2014 2016 2017 2018
Very Satisfied n/a 38% 40% 42%
Fairly satisfied n/a 48% 46% 47%
Percentage satisfied or very satisfied 87% 86% 87% 89%
Target 24: To maintain proportions in the north east who were satisfied or very satisfied with their last bus trip at 80% or more through to 2021.
Source: Transport Focus Bus Passenger Satisfaction Survey in Scotland, 2018
As can be seen from the indicator above, overall satisfaction has remained relatively static in the north east since 2014, although it has seen increases in the percentage of people who are ‘very satisfied’. The percentage of people that state they are dissatisfied has remained largely unchanged at around 3%.
Page 65
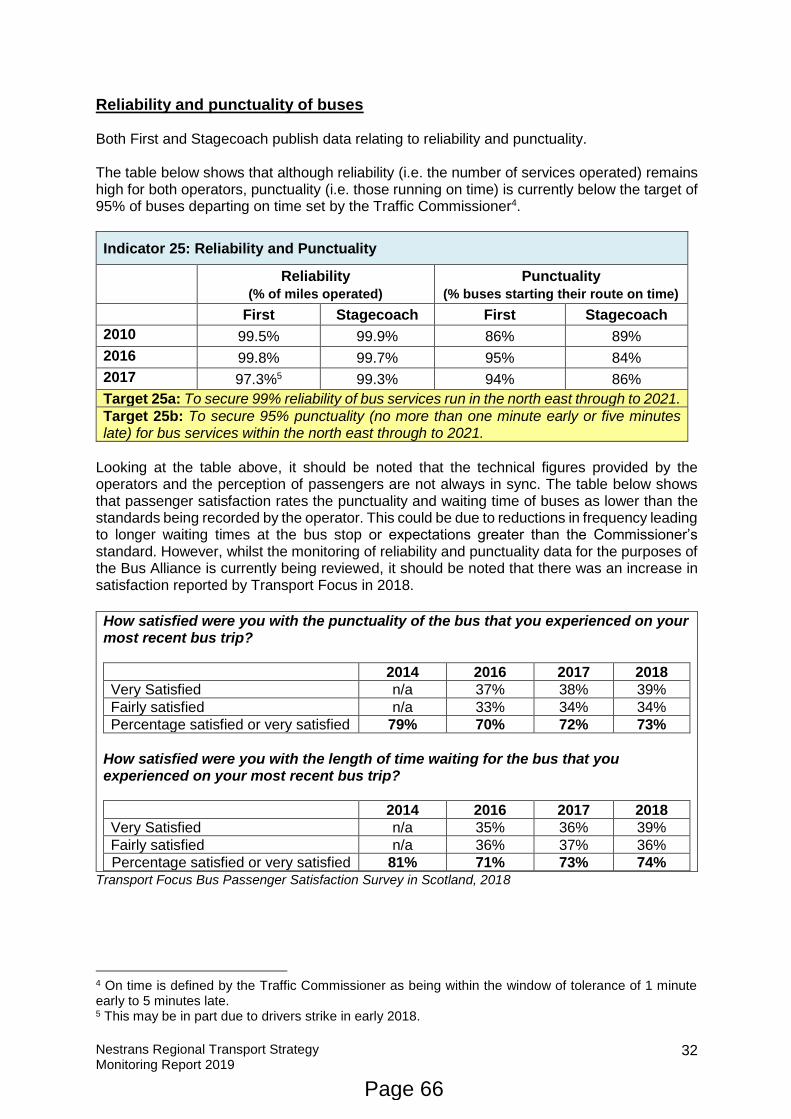
Nestrans Regional Transport Strategy Monitoring Report 2019
32
Reliability and punctuality of buses Both First and Stagecoach publish data relating to reliability and punctuality. The table below shows that although reliability (i.e. the number of services operated) remains high for both operators, punctuality (i.e. those running on time) is currently below the target of 95% of buses departing on time set by the Traffic Commissioner4.
Indicator 25: Reliability and Punctuality
Reliability
(% of miles operated)
Punctuality
(% buses starting their route on time)
First Stagecoach First Stagecoach
2010 99.5% 99.9% 86% 89%
2016 99.8% 99.7% 95% 84%
2017 97.3%5 99.3% 94% 86%
Target 25a: To secure 99% reliability of bus services run in the north east through to 2021.
Target 25b: To secure 95% punctuality (no more than one minute early or five minutes late) for bus services within the north east through to 2021.
Looking at the table above, it should be noted that the technical figures provided by the operators and the perception of passengers are not always in sync. The table below shows that passenger satisfaction rates the punctuality and waiting time of buses as lower than the standards being recorded by the operator. This could be due to reductions in frequency leading to longer waiting times at the bus stop or expectations greater than the Commissioner’s standard. However, whilst the monitoring of reliability and punctuality data for the purposes of the Bus Alliance is currently being reviewed, it should be noted that there was an increase in satisfaction reported by Transport Focus in 2018.
How satisfied were you with the punctuality of the bus that you experienced on your most recent bus trip?
2014 2016 2017 2018
Very Satisfied n/a 37% 38% 39%
Fairly satisfied n/a 33% 34% 34%
Percentage satisfied or very satisfied 79% 70% 72% 73%
How satisfied were you with the length of time waiting for the bus that you experienced on your most recent bus trip?
2014 2016 2017 2018
Very Satisfied n/a 35% 36% 39%
Fairly satisfied n/a 36% 37% 36%
Percentage satisfied or very satisfied 81% 71% 73% 74%
Transport Focus Bus Passenger Satisfaction Survey in Scotland, 2018
4 On time is defined by the Traffic Commissioner as being within the window of tolerance of 1 minute early to 5 minutes late. 5 This may be in part due to drivers strike in early 2018.
Page 66

Nestrans Regional Transport Strategy Monitoring Report 2019
33
Cost of bus services As a key determinant of mode choice, this report monitors the respective prices of City Centre parking and of average daily bus fares. Indicator 26 shows that whilst daily bus fares have become more competitive, reducing by 14% since 2012, car parking charges have been static. Although the relative cost of bus:parking reduced between 2007 and 2015, increases in on-bus fares in 2019 have increased the ratio to 1.9. It should be noted that a cheaper bus fare for First Bus is available if purchased through the m-ticket app. However, this does not reduce the overall ratio between bus fares and car parking.
Indicator 26: To monitor the price of car parking in Aberdeen City Centre relative to bus fares, by comparing a ratio of 2hrs off-street parking in a Council multi-storey car park: cost of peak daily ticket on city buses.
% change in cost on 2007 base
Cost of 2 hrs parking: +83% Cost of bus day ticket: +18%
Target 26: To reduce the differential between the cost of parking and bus travel to a factor of no more than 1.5 by 2021.
Source: Aberdeen City Council, Stagecoach, First Aberdeen & Grasshopper
Page 67
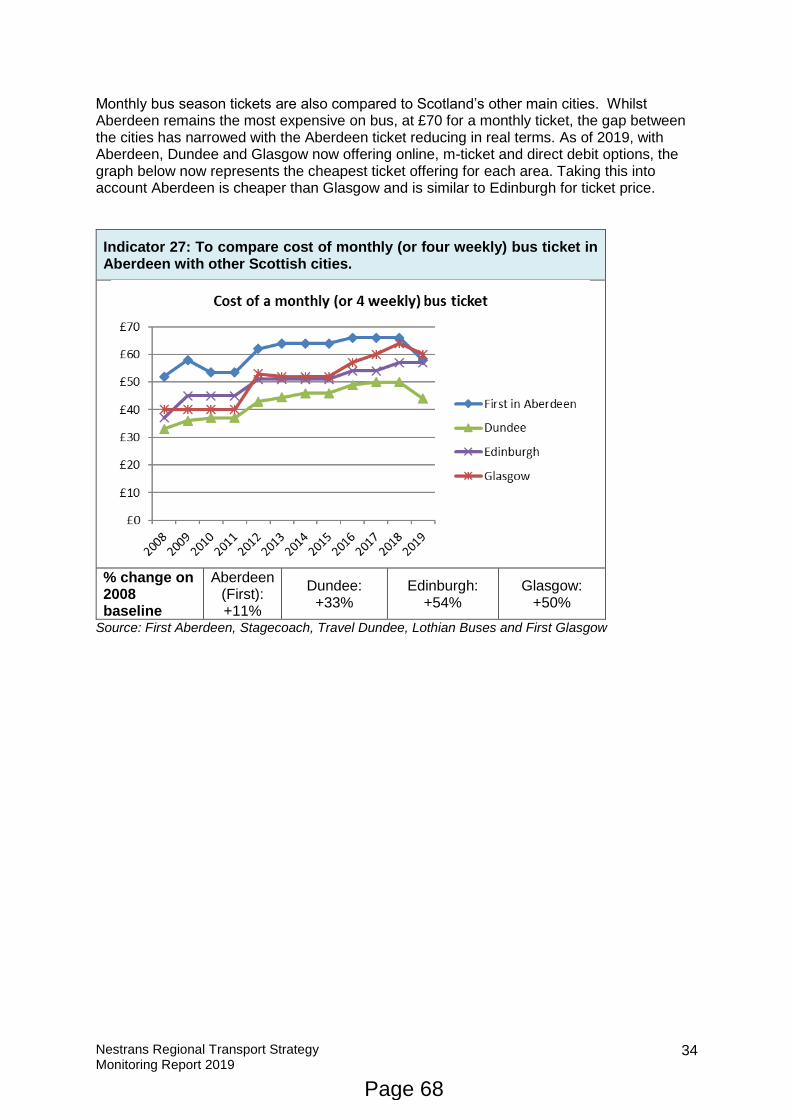
Nestrans Regional Transport Strategy Monitoring Report 2019
34
Monthly bus season tickets are also compared to Scotland’s other main cities. Whilst Aberdeen remains the most expensive on bus, at £70 for a monthly ticket, the gap between the cities has narrowed with the Aberdeen ticket reducing in real terms. As of 2019, with Aberdeen, Dundee and Glasgow now offering online, m-ticket and direct debit options, the graph below now represents the cheapest ticket offering for each area. Taking this into account Aberdeen is cheaper than Glasgow and is similar to Edinburgh for ticket price.
Indicator 27: To compare cost of monthly (or four weekly) bus ticket in Aberdeen with other Scottish cities.
% change on 2008 baseline
Aberdeen (First): +11%
Dundee: +33%
Edinburgh: +54%
Glasgow: +50%
Source: First Aberdeen, Stagecoach, Travel Dundee, Lothian Buses and First Glasgow
Page 68
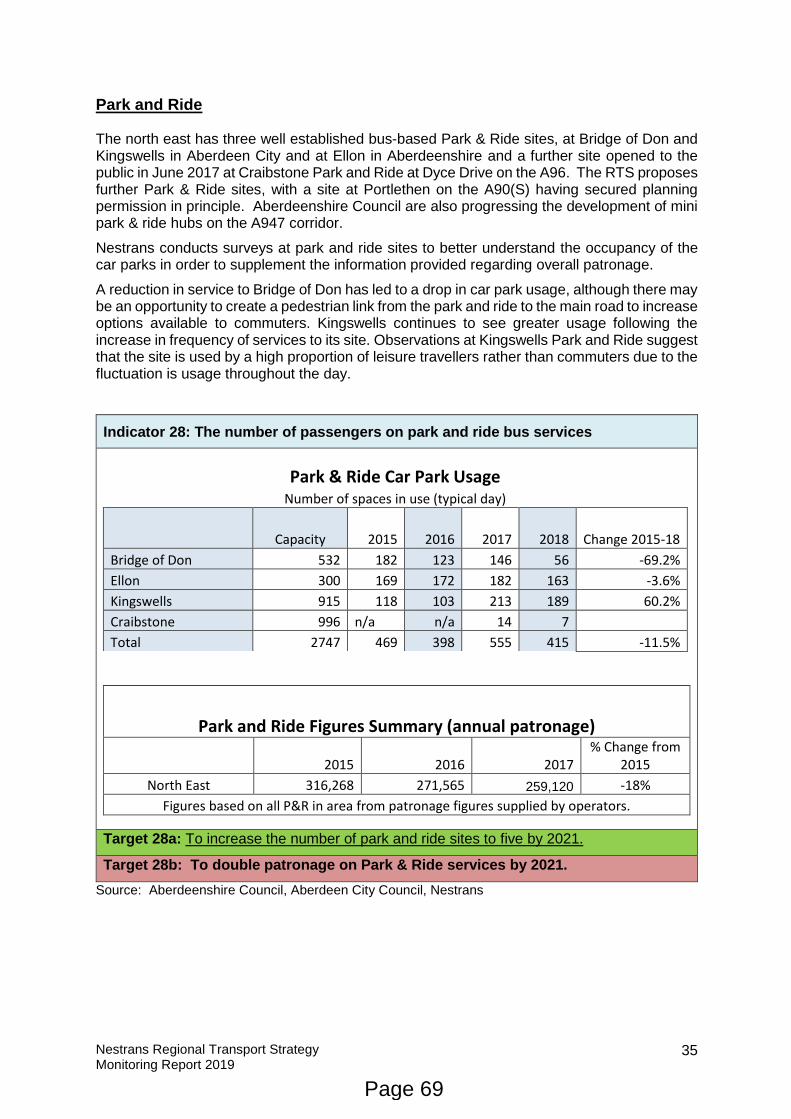
Nestrans Regional Transport Strategy Monitoring Report 2019
35
Park and Ride The north east has three well established bus-based Park & Ride sites, at Bridge of Don and Kingswells in Aberdeen City and at Ellon in Aberdeenshire and a further site opened to the public in June 2017 at Craibstone Park and Ride at Dyce Drive on the A96. The RTS proposes further Park & Ride sites, with a site at Portlethen on the A90(S) having secured planning permission in principle. Aberdeenshire Council are also progressing the development of mini park & ride hubs on the A947 corridor.
Nestrans conducts surveys at park and ride sites to better understand the occupancy of the car parks in order to supplement the information provided regarding overall patronage.
A reduction in service to Bridge of Don has led to a drop in car park usage, although there may be an opportunity to create a pedestrian link from the park and ride to the main road to increase options available to commuters. Kingswells continues to see greater usage following the increase in frequency of services to its site. Observations at Kingswells Park and Ride suggest that the site is used by a high proportion of leisure travellers rather than commuters due to the fluctuation is usage throughout the day.
Indicator 28: The number of passengers on park and ride bus services
Park & Ride Car Park Usage Number of spaces in use (typical day)
Capacity 2015 2016 2017 2018 Change 2015-18
Bridge of Don 532 182 123 146 56 -69.2%
Ellon 300 169 172 182 163 -3.6%
Kingswells 915 118 103 213 189 60.2%
Craibstone 996 n/a n/a 14 7
Total 2747 469 398 555 415 -11.5%
Park and Ride Figures Summary (annual patronage)
2015 2016 2017 % Change from
2015
North East 316,268 271,565 259,120 -18%
Figures based on all P&R in area from patronage figures supplied by operators.
Target 28a: To increase the number of park and ride sites to five by 2021.
Target 28b: To double patronage on Park & Ride services by 2021.
Source: Aberdeenshire Council, Aberdeen City Council, Nestrans
Page 69
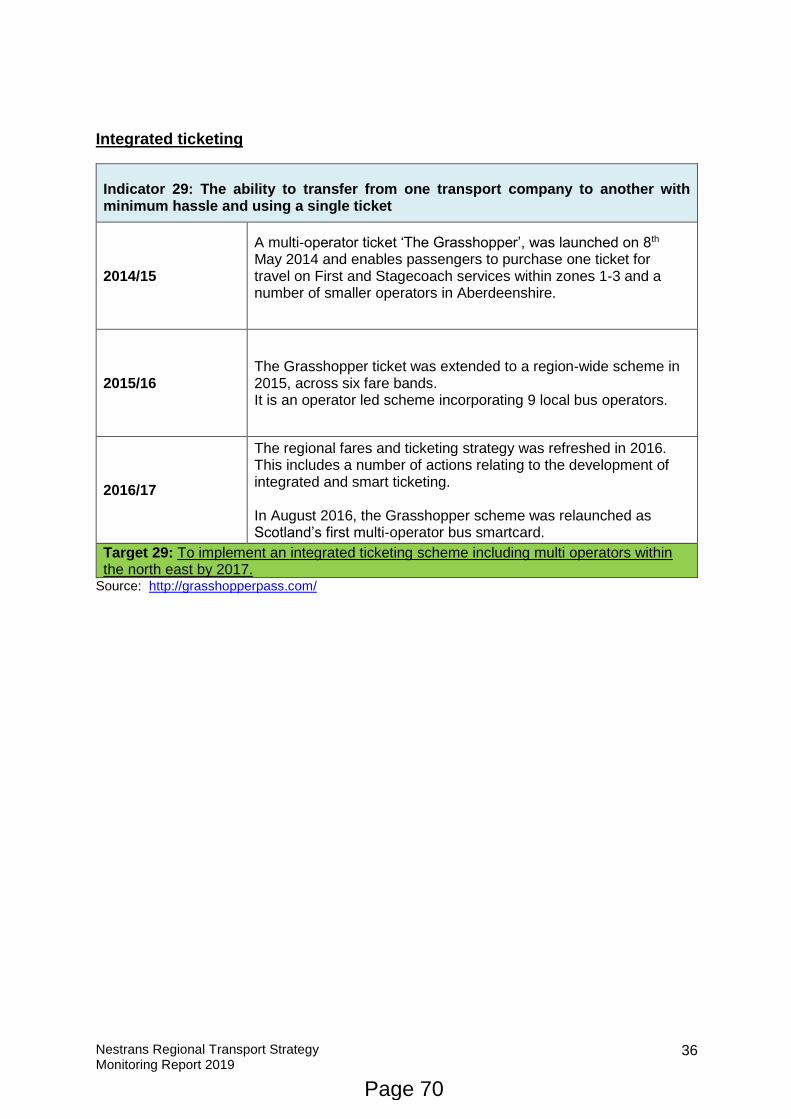
Nestrans Regional Transport Strategy Monitoring Report 2019
36
Integrated ticketing
Indicator 29: The ability to transfer from one transport company to another with minimum hassle and using a single ticket
2014/15
A multi-operator ticket ‘The Grasshopper’, was launched on 8th May 2014 and enables passengers to purchase one ticket for travel on First and Stagecoach services within zones 1-3 and a number of smaller operators in Aberdeenshire.
2015/16 The Grasshopper ticket was extended to a region-wide scheme in 2015, across six fare bands. It is an operator led scheme incorporating 9 local bus operators.
2016/17
The regional fares and ticketing strategy was refreshed in 2016. This includes a number of actions relating to the development of integrated and smart ticketing. In August 2016, the Grasshopper scheme was relaunched as Scotland’s first multi-operator bus smartcard.
Target 29: To implement an integrated ticketing scheme including multi operators within the north east by 2017.
Source: http://grasshopperpass.com/
Page 70
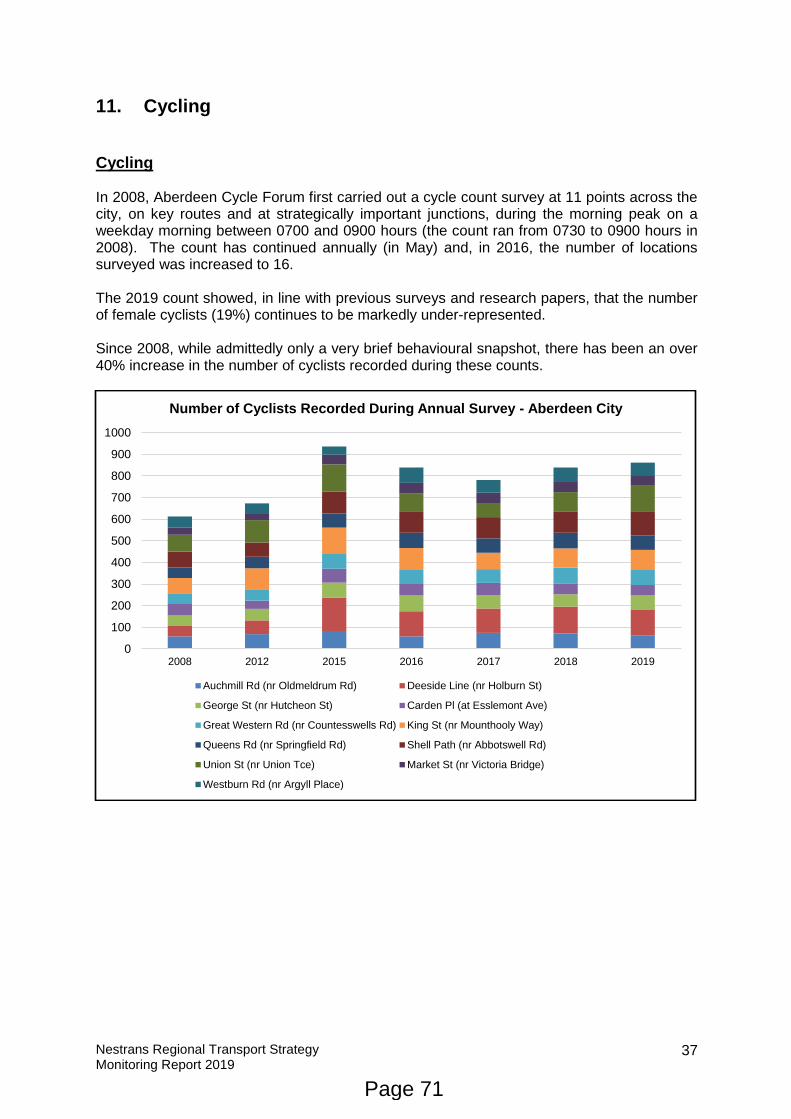
Nestrans Regional Transport Strategy Monitoring Report 2019
37
11. Cycling
Cycling In 2008, Aberdeen Cycle Forum first carried out a cycle count survey at 11 points across the city, on key routes and at strategically important junctions, during the morning peak on a weekday morning between 0700 and 0900 hours (the count ran from 0730 to 0900 hours in 2008). The count has continued annually (in May) and, in 2016, the number of locations surveyed was increased to 16. The 2019 count showed, in line with previous surveys and research papers, that the number of female cyclists (19%) continues to be markedly under-represented. Since 2008, while admittedly only a very brief behavioural snapshot, there has been an over 40% increase in the number of cyclists recorded during these counts.
0
100
200
300
400
500
600
700
800
900
1000
2008 2012 2015 2016 2017 2018 2019
Number of Cyclists Recorded During Annual Survey - Aberdeen City
Auchmill Rd (nr Oldmeldrum Rd) Deeside Line (nr Holburn St)
George St (nr Hutcheon St) Carden Pl (at Esslemont Ave)
Great Western Rd (nr Countesswells Rd) King St (nr Mounthooly Way)
Queens Rd (nr Springfield Rd) Shell Path (nr Abbotswell Rd)
Union St (nr Union Tce) Market St (nr Victoria Bridge)
Westburn Rd (nr Argyll Place)
Page 71
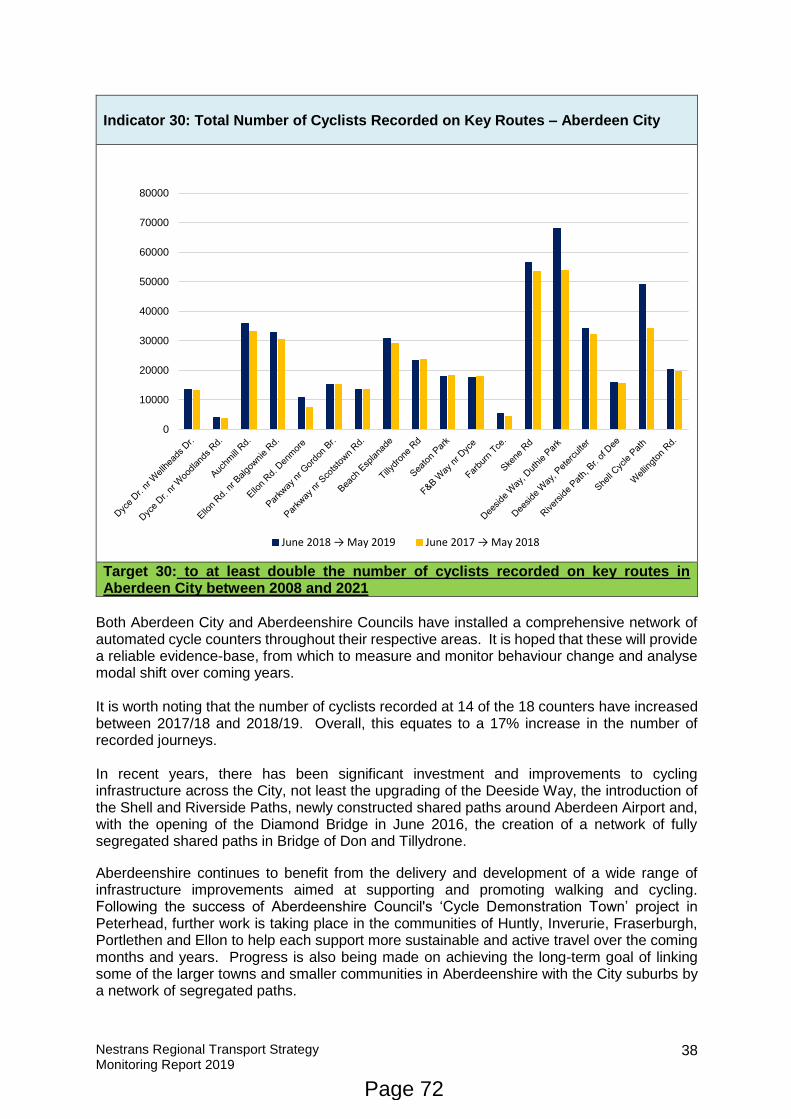
Nestrans Regional Transport Strategy Monitoring Report 2019
38
Indicator 30: Total Number of Cyclists Recorded on Key Routes – Aberdeen City
Target 30: to at least double the number of cyclists recorded on key routes in Aberdeen City between 2008 and 2021
Both Aberdeen City and Aberdeenshire Councils have installed a comprehensive network of automated cycle counters throughout their respective areas. It is hoped that these will provide a reliable evidence-base, from which to measure and monitor behaviour change and analyse modal shift over coming years. It is worth noting that the number of cyclists recorded at 14 of the 18 counters have increased between 2017/18 and 2018/19. Overall, this equates to a 17% increase in the number of recorded journeys. In recent years, there has been significant investment and improvements to cycling infrastructure across the City, not least the upgrading of the Deeside Way, the introduction of the Shell and Riverside Paths, newly constructed shared paths around Aberdeen Airport and, with the opening of the Diamond Bridge in June 2016, the creation of a network of fully segregated shared paths in Bridge of Don and Tillydrone.
Aberdeenshire continues to benefit from the delivery and development of a wide range of infrastructure improvements aimed at supporting and promoting walking and cycling. Following the success of Aberdeenshire Council's ‘Cycle Demonstration Town’ project in Peterhead, further work is taking place in the communities of Huntly, Inverurie, Fraserburgh, Portlethen and Ellon to help each support more sustainable and active travel over the coming months and years. Progress is also being made on achieving the long-term goal of linking some of the larger towns and smaller communities in Aberdeenshire with the City suburbs by a network of segregated paths.
0
10000
20000
30000
40000
50000
60000
70000
80000
June 2018 → May 2019 June 2017 → May 2018
Page 72
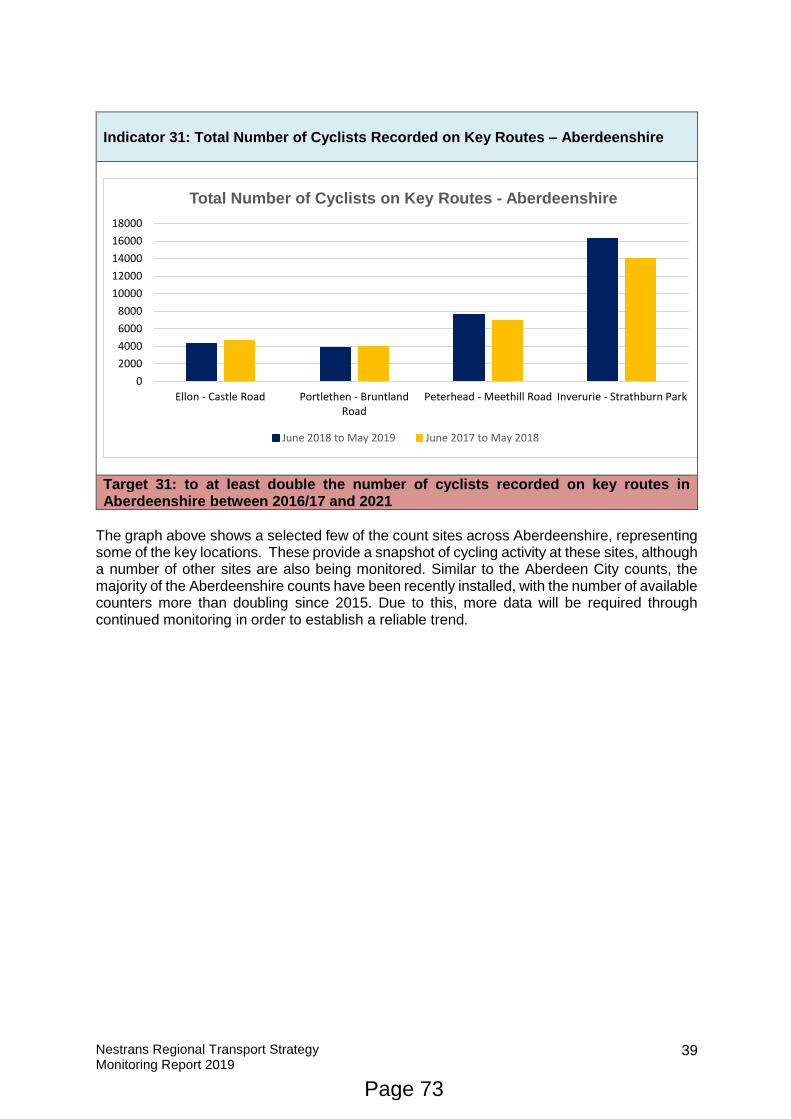
Nestrans Regional Transport Strategy Monitoring Report 2019
39
Indicator 31: Total Number of Cyclists Recorded on Key Routes – Aberdeenshire
Target 31: to at least double the number of cyclists recorded on key routes in Aberdeenshire between 2016/17 and 2021
The graph above shows a selected few of the count sites across Aberdeenshire, representing some of the key locations. These provide a snapshot of cycling activity at these sites, although a number of other sites are also being monitored. Similar to the Aberdeen City counts, the majority of the Aberdeenshire counts have been recently installed, with the number of available counters more than doubling since 2015. Due to this, more data will be required through continued monitoring in order to establish a reliable trend.
0
2000
4000
6000
8000
10000
12000
14000
16000
18000
Ellon - Castle Road Portlethen - BruntlandRoad
Peterhead - Meethill Road Inverurie - Strathburn Park
Total Number of Cyclists on Key Routes - Aberdeenshire
June 2018 to May 2019 June 2017 to May 2018
Page 73
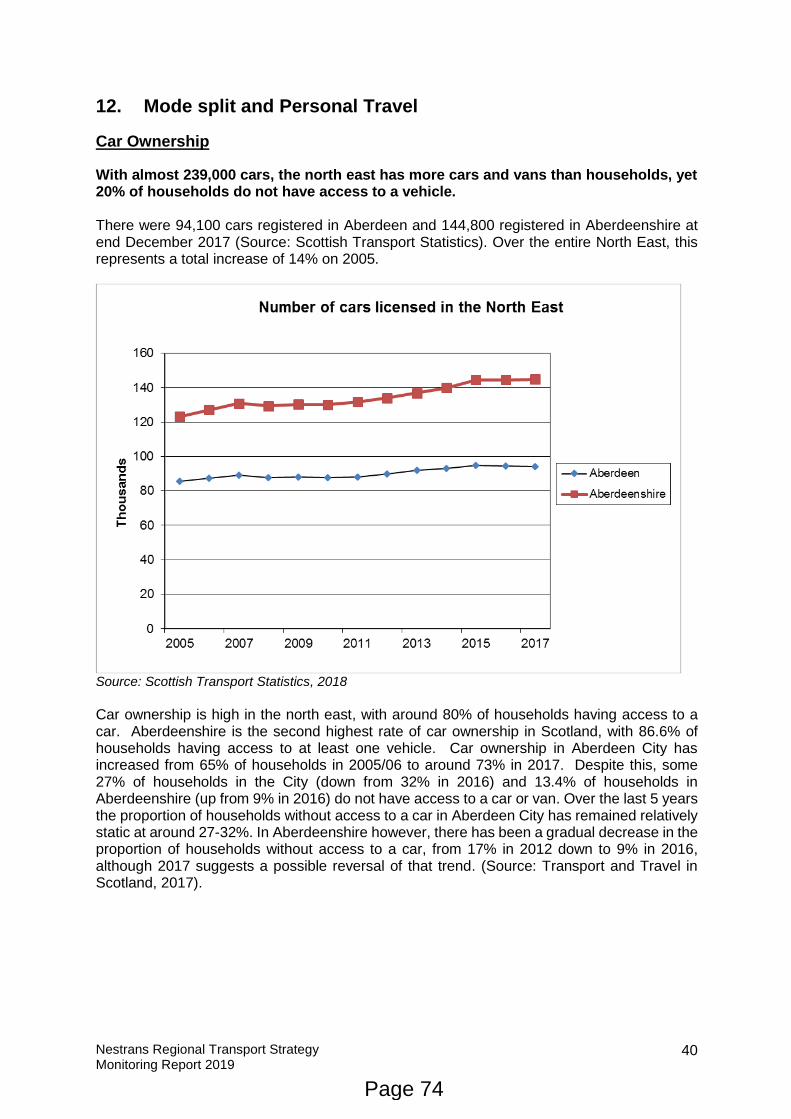
Nestrans Regional Transport Strategy Monitoring Report 2019
40
12. Mode split and Personal Travel
Car Ownership
With almost 239,000 cars, the north east has more cars and vans than households, yet 20% of households do not have access to a vehicle. There were 94,100 cars registered in Aberdeen and 144,800 registered in Aberdeenshire at end December 2017 (Source: Scottish Transport Statistics). Over the entire North East, this represents a total increase of 14% on 2005.
Source: Scottish Transport Statistics, 2018
Car ownership is high in the north east, with around 80% of households having access to a car. Aberdeenshire is the second highest rate of car ownership in Scotland, with 86.6% of households having access to at least one vehicle. Car ownership in Aberdeen City has increased from 65% of households in 2005/06 to around 73% in 2017. Despite this, some 27% of households in the City (down from 32% in 2016) and 13.4% of households in Aberdeenshire (up from 9% in 2016) do not have access to a car or van. Over the last 5 years the proportion of households without access to a car in Aberdeen City has remained relatively static at around 27-32%. In Aberdeenshire however, there has been a gradual decrease in the proportion of households without access to a car, from 17% in 2012 down to 9% in 2016, although 2017 suggests a possible reversal of that trend. (Source: Transport and Travel in Scotland, 2017).
Page 74
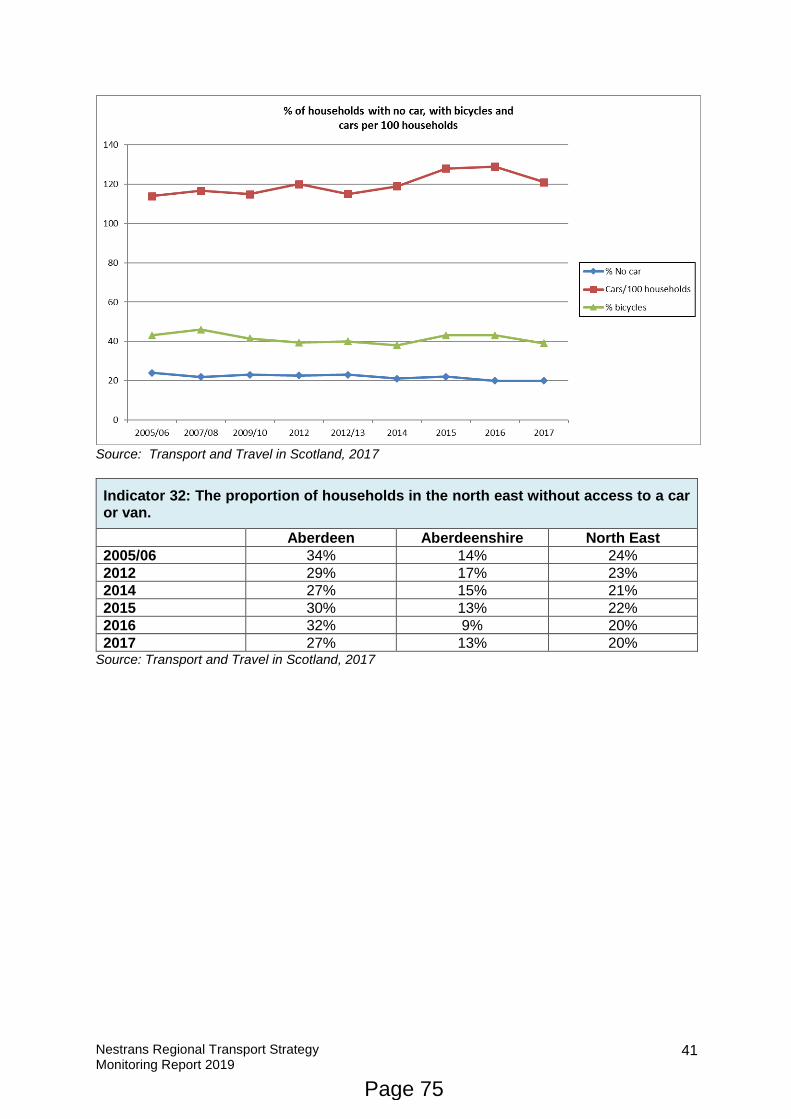
Nestrans Regional Transport Strategy Monitoring Report 2019
41
Source: Transport and Travel in Scotland, 2017
Indicator 32: The proportion of households in the north east without access to a car or van.
Aberdeen Aberdeenshire North East
2005/06 34% 14% 24%
2012 29% 17% 23%
2014 27% 15% 21%
2015 30% 13% 22%
2016 32% 9% 20%
2017 27% 13% 20% Source: Transport and Travel in Scotland, 2017
Page 75
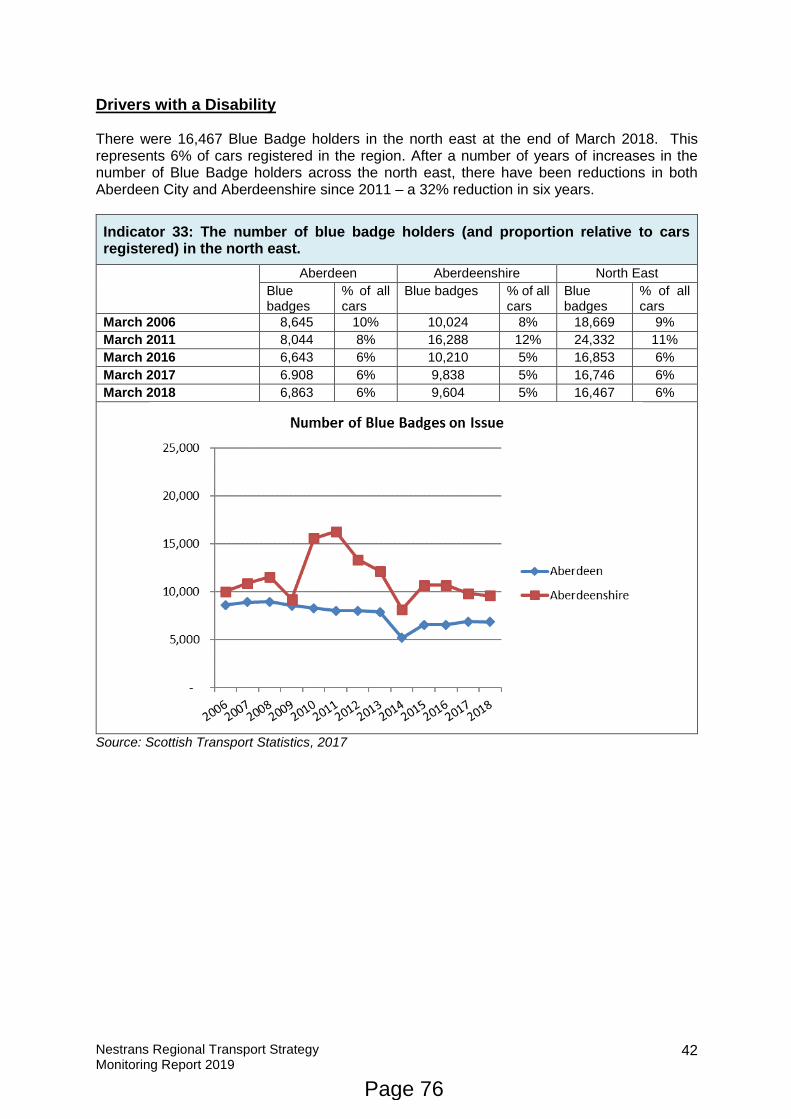
Nestrans Regional Transport Strategy Monitoring Report 2019
42
Drivers with a Disability There were 16,467 Blue Badge holders in the north east at the end of March 2018. This represents 6% of cars registered in the region. After a number of years of increases in the number of Blue Badge holders across the north east, there have been reductions in both Aberdeen City and Aberdeenshire since 2011 – a 32% reduction in six years.
Indicator 33: The number of blue badge holders (and proportion relative to cars registered) in the north east.
Aberdeen Aberdeenshire North East Blue badges
% of all cars
Blue badges % of all cars
Blue badges
% of all cars
March 2006 8,645 10% 10,024 8% 18,669 9%
March 2011 8,044 8% 16,288 12% 24,332 11%
March 2016 6,643 6% 10,210 5% 16,853 6%
March 2017 6.908 6% 9,838 5% 16,746 6%
March 2018 6,863 6% 9,604 5% 16,467 6%
Source: Scottish Transport Statistics, 2017
Page 76
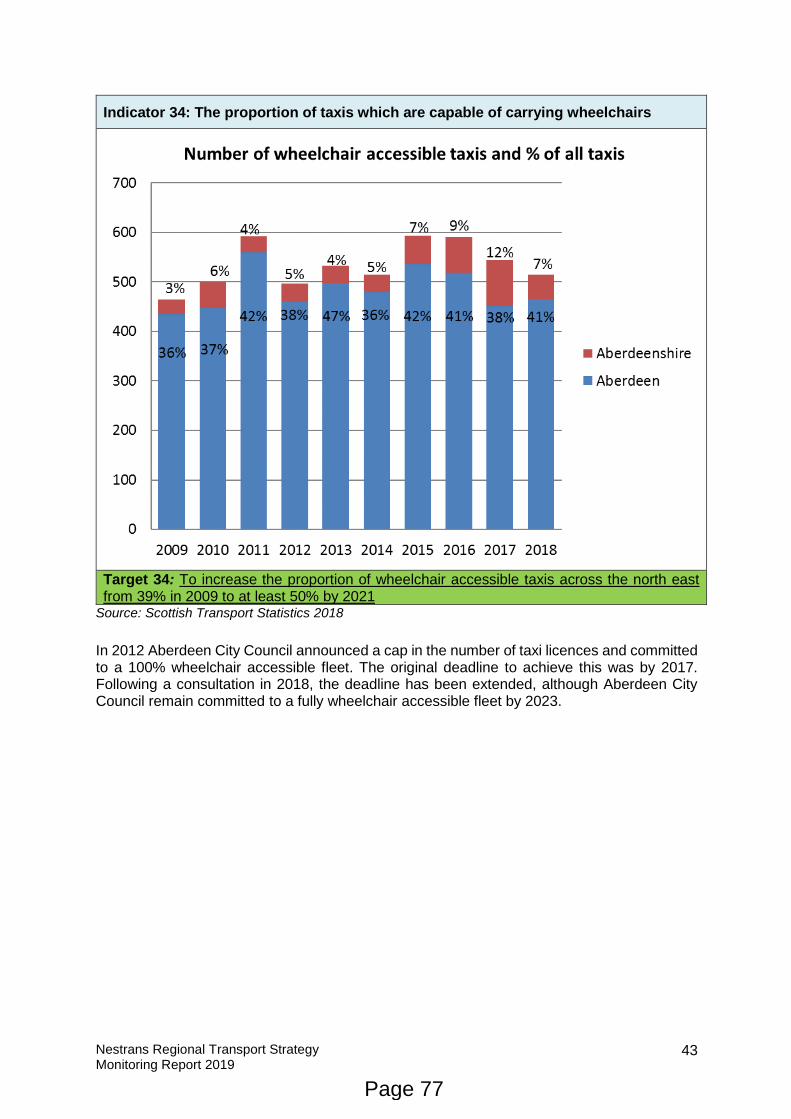
Nestrans Regional Transport Strategy Monitoring Report 2019
43
Indicator 34: The proportion of taxis which are capable of carrying wheelchairs
Target 34: To increase the proportion of wheelchair accessible taxis across the north east from 39% in 2009 to at least 50% by 2021
Source: Scottish Transport Statistics 2018
In 2012 Aberdeen City Council announced a cap in the number of taxi licences and committed to a 100% wheelchair accessible fleet. The original deadline to achieve this was by 2017. Following a consultation in 2018, the deadline has been extended, although Aberdeen City Council remain committed to a fully wheelchair accessible fleet by 2023.
Page 77
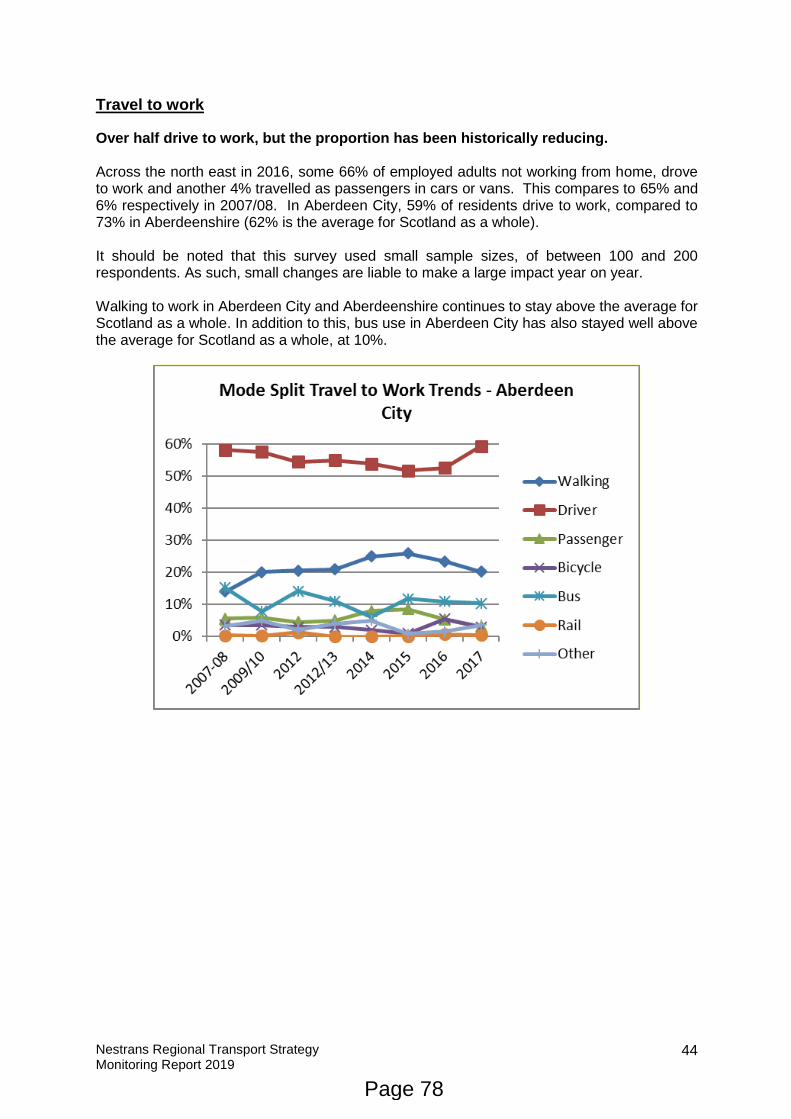
Nestrans Regional Transport Strategy Monitoring Report 2019
44
Travel to work
Over half drive to work, but the proportion has been historically reducing. Across the north east in 2016, some 66% of employed adults not working from home, drove to work and another 4% travelled as passengers in cars or vans. This compares to 65% and 6% respectively in 2007/08. In Aberdeen City, 59% of residents drive to work, compared to 73% in Aberdeenshire (62% is the average for Scotland as a whole). It should be noted that this survey used small sample sizes, of between 100 and 200 respondents. As such, small changes are liable to make a large impact year on year. Walking to work in Aberdeen City and Aberdeenshire continues to stay above the average for Scotland as a whole. In addition to this, bus use in Aberdeen City has also stayed well above the average for Scotland as a whole, at 10%.
Page 78
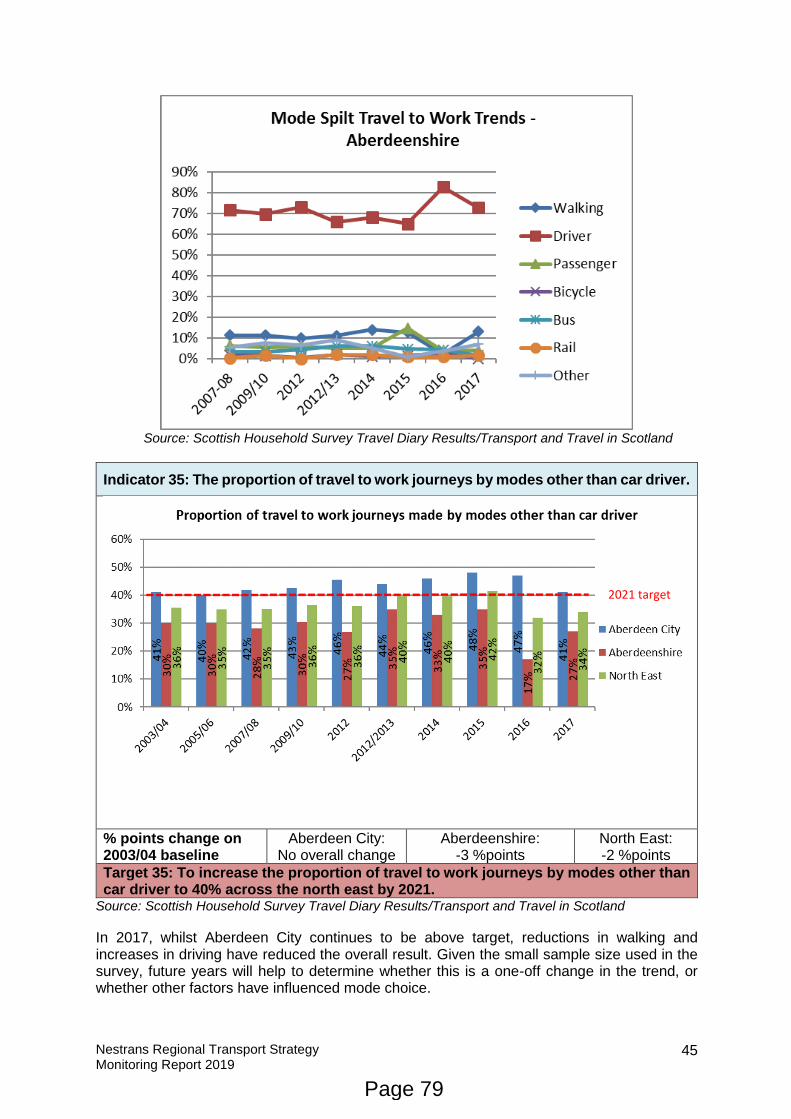
Nestrans Regional Transport Strategy Monitoring Report 2019
45
Source: Scottish Household Survey Travel Diary Results/Transport and Travel in Scotland
Indicator 35: The proportion of travel to work journeys by modes other than car driver.
% points change on 2003/04 baseline
Aberdeen City: No overall change
Aberdeenshire: -3 %points
North East: -2 %points
Target 35: To increase the proportion of travel to work journeys by modes other than car driver to 40% across the north east by 2021.
Source: Scottish Household Survey Travel Diary Results/Transport and Travel in Scotland
In 2017, whilst Aberdeen City continues to be above target, reductions in walking and increases in driving have reduced the overall result. Given the small sample size used in the survey, future years will help to determine whether this is a one-off change in the trend, or whether other factors have influenced mode choice.
2021 target
Page 79
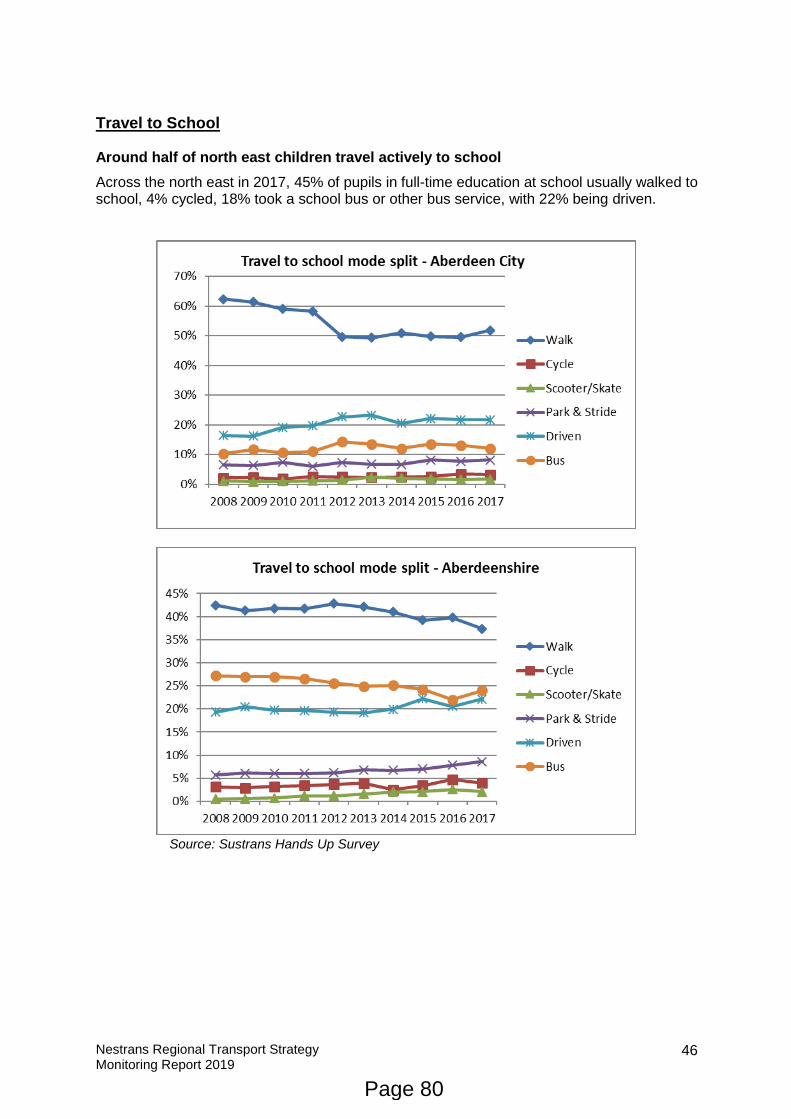
Nestrans Regional Transport Strategy Monitoring Report 2019
46
Travel to School Around half of north east children travel actively to school
Across the north east in 2017, 45% of pupils in full-time education at school usually walked to school, 4% cycled, 18% took a school bus or other bus service, with 22% being driven.
Source: Sustrans Hands Up Survey
Page 80
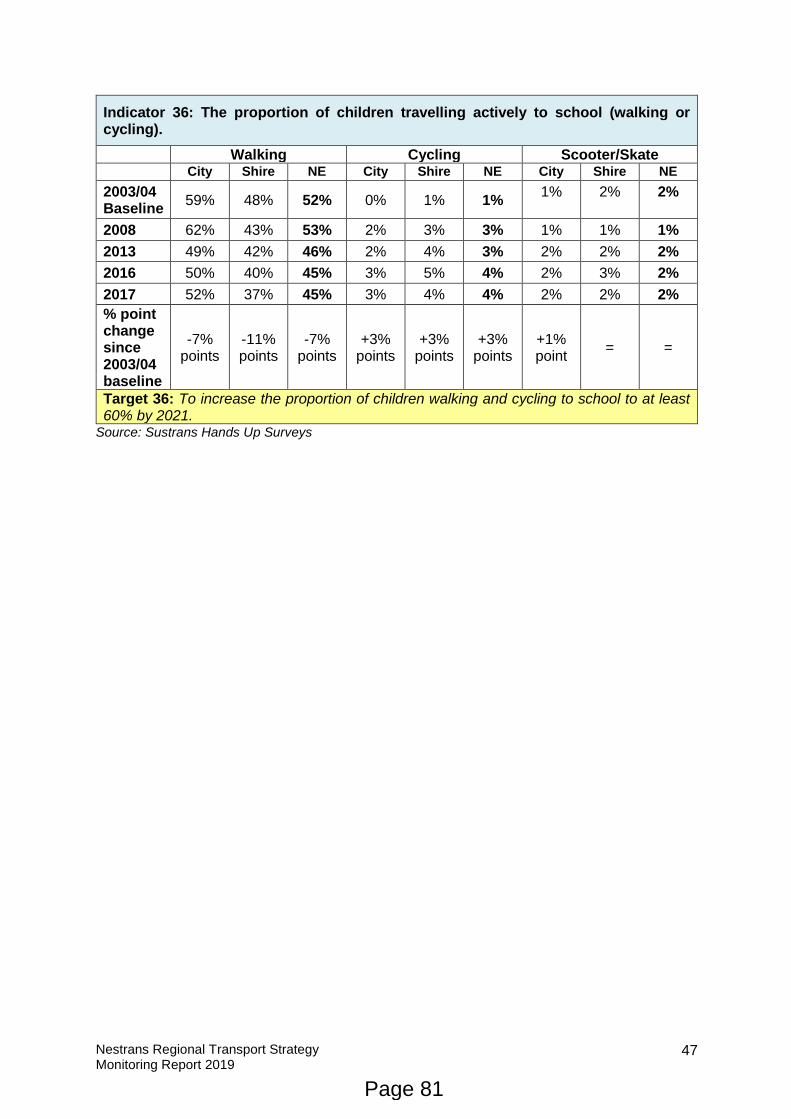
Nestrans Regional Transport Strategy Monitoring Report 2019
47
Indicator 36: The proportion of children travelling actively to school (walking or cycling).
Walking Cycling Scooter/Skate
City Shire NE City Shire NE City Shire NE
2003/04 Baseline
59% 48% 52% 0% 1% 1% 1% 2% 2%
2008 62% 43% 53% 2% 3% 3% 1% 1% 1%
2013 49% 42% 46% 2% 4% 3% 2% 2% 2%
2016 50% 40% 45% 3% 5% 4% 2% 3% 2%
2017 52% 37% 45% 3% 4% 4% 2% 2% 2%
% point change since 2003/04 baseline
-7% points
-11% points
-7% points
+3% points
+3% points
+3% points
+1% point
= =
Target 36: To increase the proportion of children walking and cycling to school to at least 60% by 2021.
Source: Sustrans Hands Up Surveys
Page 81
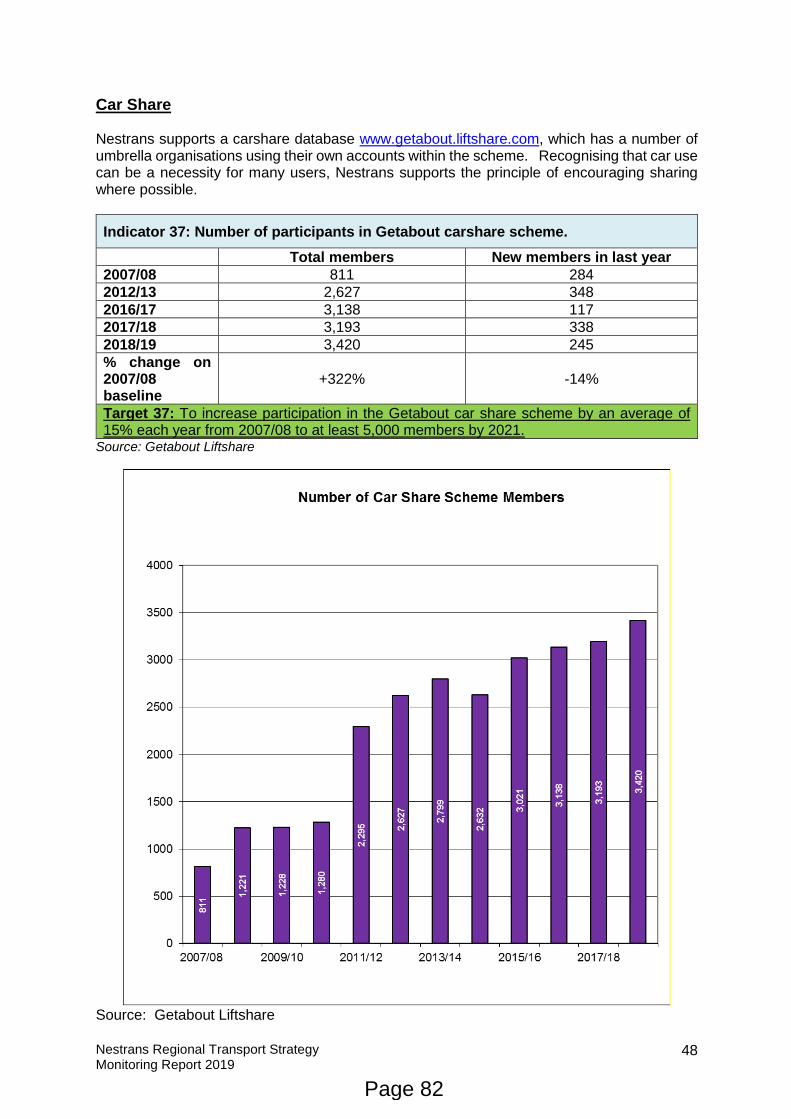
Nestrans Regional Transport Strategy Monitoring Report 2019
48
Car Share Nestrans supports a carshare database www.getabout.liftshare.com, which has a number of umbrella organisations using their own accounts within the scheme. Recognising that car use can be a necessity for many users, Nestrans supports the principle of encouraging sharing where possible.
Indicator 37: Number of participants in Getabout carshare scheme.
Total members New members in last year
2007/08 811 284
2012/13 2,627 348
2016/17 3,138 117
2017/18 3,193 338
2018/19 3,420 245
% change on 2007/08 baseline
+322% -14%
Target 37: To increase participation in the Getabout car share scheme by an average of 15% each year from 2007/08 to at least 5,000 members by 2021.
Source: Getabout Liftshare
Source: Getabout Liftshare
Page 82

Nestrans Regional Transport Strategy Monitoring Report 2019
49
Car Club The number of cars in the Aberdeen car club scheme has increased slightly in the last year, although no longer includes a wheelchair accessible vehicle. A car club scheme was also launched in Huntly in September 2015 and currently has two hybrid vehicles in its fleet. The scheme currently has 23 members and 38 designated drivers.
Indicator 38: Number of car club members
Number of cars in the fleet
Number of electric or
alternatively fuelled
vehicles in fleet
Number of
hybrid vehicles in fleet
Wheelchair accessible
vehicles
Number of members
(organisations & individuals)
Number of drivers registered
% utilisation
of the vehicles
2012/13 12 0 n/a 0 104 395 20%
2013/14 26 9 n/a 1 222 642 20%
2015/16 40 21 5 2 561 1,277 23%
2016/17 44 (plus 3 vans)
27 5 2 677 1,524 16%
2017/18 40 (plus 3 vans)
28 5 1 887 1,800 18%
2018/19 44 cars (plus 4 vans)
26 10 0 1,023 1,989 17%
Target 38: To increase the number of drivers registered in north east car clubs by an average of 20% each year from 2012/13 to over 2,000 by 2021.
Source: Co-Wheels Car Club
Page 83
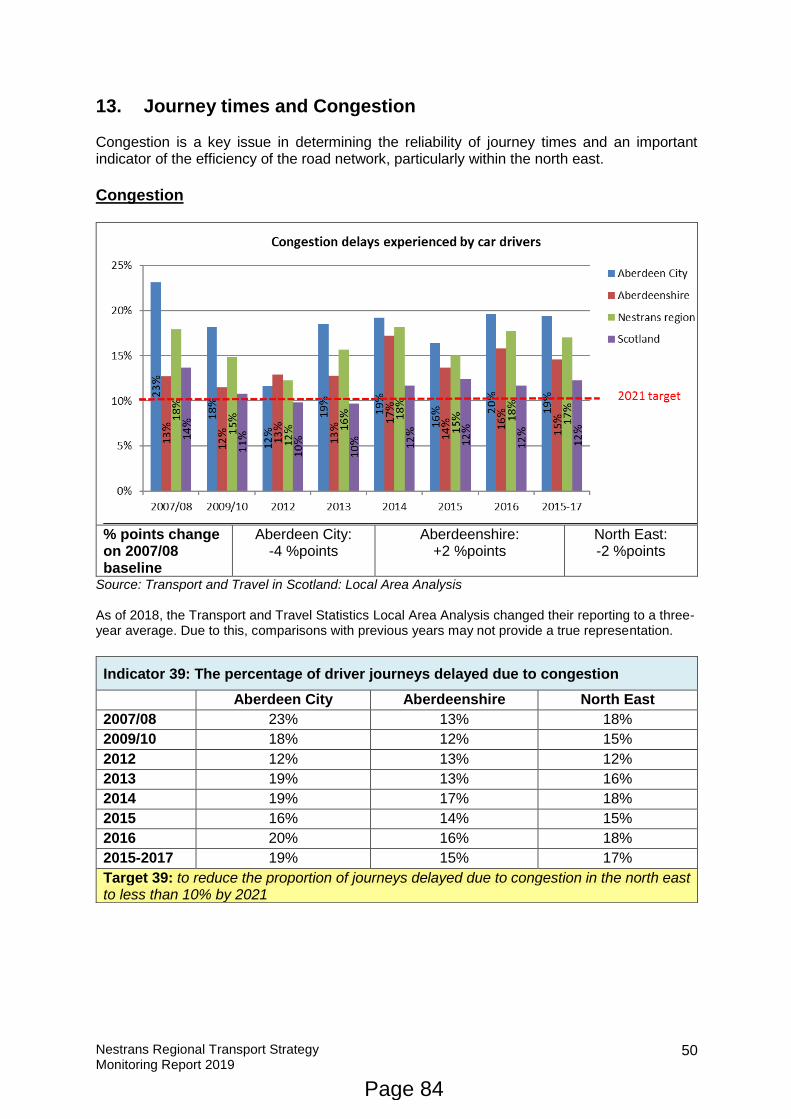
Nestrans Regional Transport Strategy Monitoring Report 2019
50
13. Journey times and Congestion Congestion is a key issue in determining the reliability of journey times and an important indicator of the efficiency of the road network, particularly within the north east.
Congestion
% points change on 2007/08 baseline
Aberdeen City: -4 %points
Aberdeenshire: +2 %points
North East: -2 %points
Source: Transport and Travel in Scotland: Local Area Analysis As of 2018, the Transport and Travel Statistics Local Area Analysis changed their reporting to a three-year average. Due to this, comparisons with previous years may not provide a true representation.
Indicator 39: The percentage of driver journeys delayed due to congestion
Aberdeen City Aberdeenshire North East
2007/08 23% 13% 18%
2009/10 18% 12% 15%
2012 12% 13% 12%
2013 19% 13% 16%
2014 19% 17% 18%
2015 16% 14% 15%
2016 20% 16% 18%
2015-2017 19% 15% 17%
Target 39: to reduce the proportion of journeys delayed due to congestion in the north east to less than 10% by 2021
Page 84
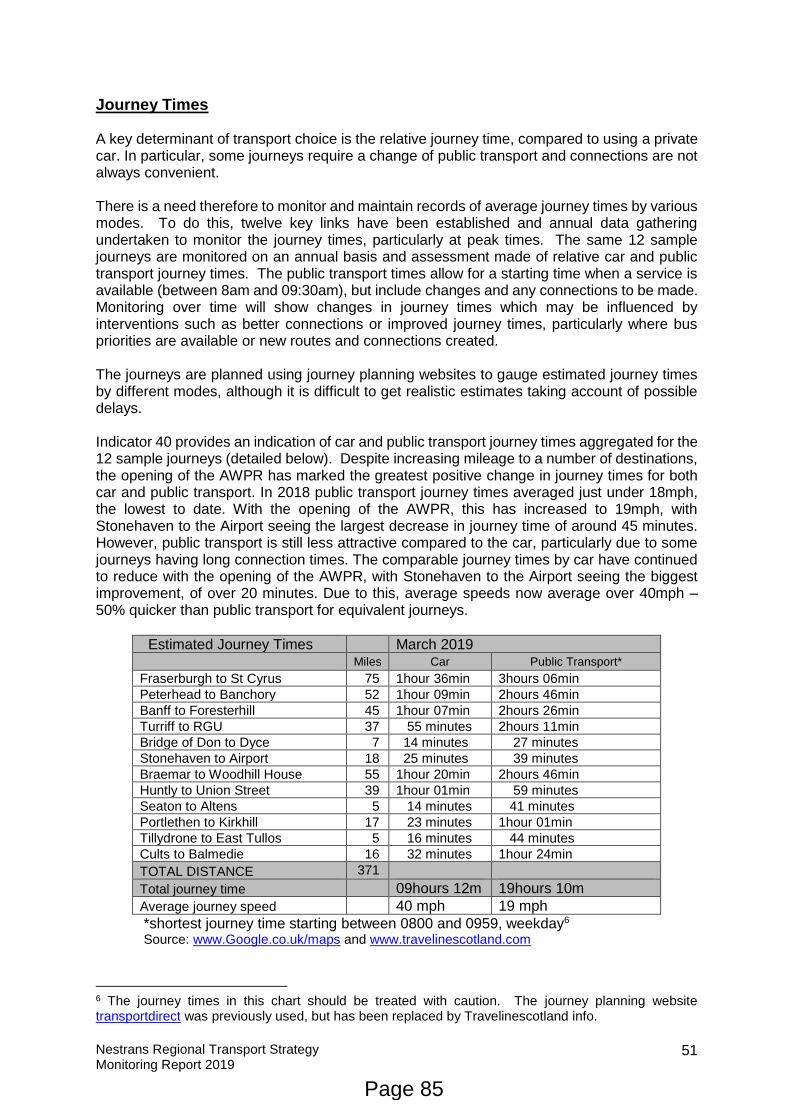
Nestrans Regional Transport Strategy Monitoring Report 2019
51
Journey Times A key determinant of transport choice is the relative journey time, compared to using a private car. In particular, some journeys require a change of public transport and connections are not always convenient. There is a need therefore to monitor and maintain records of average journey times by various modes. To do this, twelve key links have been established and annual data gathering undertaken to monitor the journey times, particularly at peak times. The same 12 sample journeys are monitored on an annual basis and assessment made of relative car and public transport journey times. The public transport times allow for a starting time when a service is available (between 8am and 09:30am), but include changes and any connections to be made. Monitoring over time will show changes in journey times which may be influenced by interventions such as better connections or improved journey times, particularly where bus priorities are available or new routes and connections created. The journeys are planned using journey planning websites to gauge estimated journey times by different modes, although it is difficult to get realistic estimates taking account of possible delays. Indicator 40 provides an indication of car and public transport journey times aggregated for the 12 sample journeys (detailed below). Despite increasing mileage to a number of destinations, the opening of the AWPR has marked the greatest positive change in journey times for both car and public transport. In 2018 public transport journey times averaged just under 18mph, the lowest to date. With the opening of the AWPR, this has increased to 19mph, with Stonehaven to the Airport seeing the largest decrease in journey time of around 45 minutes. However, public transport is still less attractive compared to the car, particularly due to some journeys having long connection times. The comparable journey times by car have continued to reduce with the opening of the AWPR, with Stonehaven to the Airport seeing the biggest improvement, of over 20 minutes. Due to this, average speeds now average over 40mph – 50% quicker than public transport for equivalent journeys.
Estimated Journey Times March 2019
Miles Car Public Transport*
Fraserburgh to St Cyrus 75 1hour 36min 3hours 06min
Peterhead to Banchory 52 1hour 09min 2hours 46min
Banff to Foresterhill 45 1hour 07min 2hours 26min
Turriff to RGU 37 55 minutes 2hours 11min
Bridge of Don to Dyce 7 14 minutes 27 minutes
Stonehaven to Airport 18 25 minutes 39 minutes
Braemar to Woodhill House 55 1hour 20min 2hours 46min
Huntly to Union Street 39 1hour 01min 59 minutes
Seaton to Altens 5 14 minutes 41 minutes
Portlethen to Kirkhill 17 23 minutes 1hour 01min
Tillydrone to East Tullos 5 16 minutes 44 minutes
Cults to Balmedie 16 32 minutes 1hour 24min
TOTAL DISTANCE 371
Total journey time 09hours 12m 19hours 10m
Average journey speed 40 mph 19 mph
*shortest journey time starting between 0800 and 0959, weekday6 Source: www.Google.co.uk/maps and www.travelinescotland.com
6 The journey times in this chart should be treated with caution. The journey planning website transportdirect was previously used, but has been replaced by Travelinescotland info.
Page 85
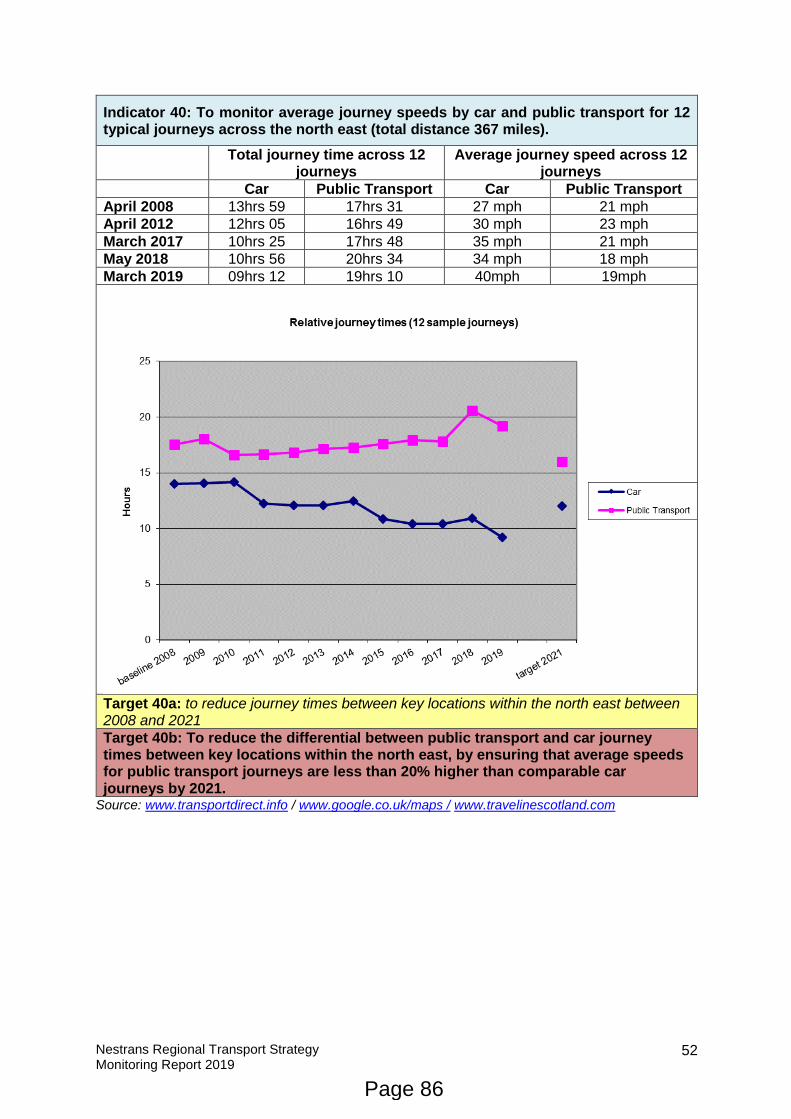
Nestrans Regional Transport Strategy Monitoring Report 2019
52
Indicator 40: To monitor average journey speeds by car and public transport for 12 typical journeys across the north east (total distance 367 miles).
Total journey time across 12 journeys
Average journey speed across 12 journeys
Car Public Transport Car Public Transport
April 2008 13hrs 59 17hrs 31 27 mph 21 mph
April 2012 12hrs 05 16hrs 49 30 mph 23 mph
March 2017 10hrs 25 17hrs 48 35 mph 21 mph
May 2018 10hrs 56 20hrs 34 34 mph 18 mph
March 2019 09hrs 12 19hrs 10 40mph 19mph
Target 40a: to reduce journey times between key locations within the north east between 2008 and 2021
Target 40b: To reduce the differential between public transport and car journey times between key locations within the north east, by ensuring that average speeds for public transport journeys are less than 20% higher than comparable car journeys by 2021.
Source: www.transportdirect.info / www.google.co.uk/maps / www.travelinescotland.com
Page 86
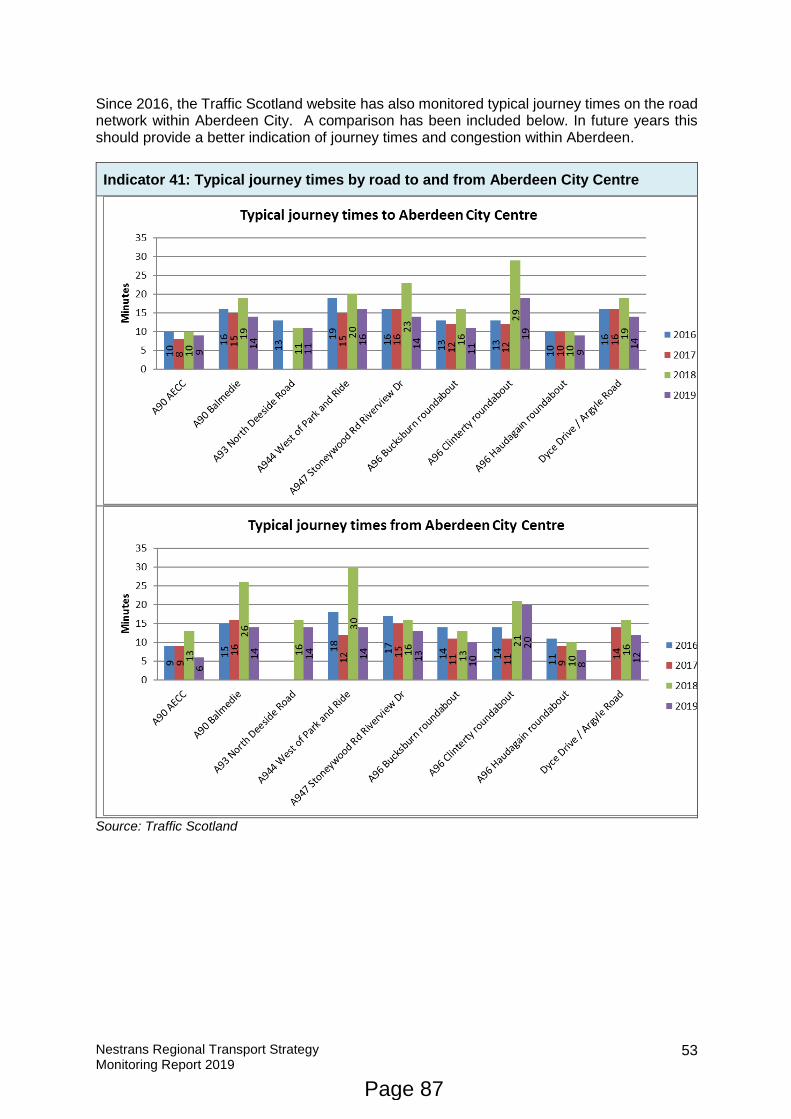
Nestrans Regional Transport Strategy Monitoring Report 2019
53
Since 2016, the Traffic Scotland website has also monitored typical journey times on the road network within Aberdeen City. A comparison has been included below. In future years this should provide a better indication of journey times and congestion within Aberdeen.
Indicator 41: Typical journey times by road to and from Aberdeen City Centre
Source: Traffic Scotland
Page 87
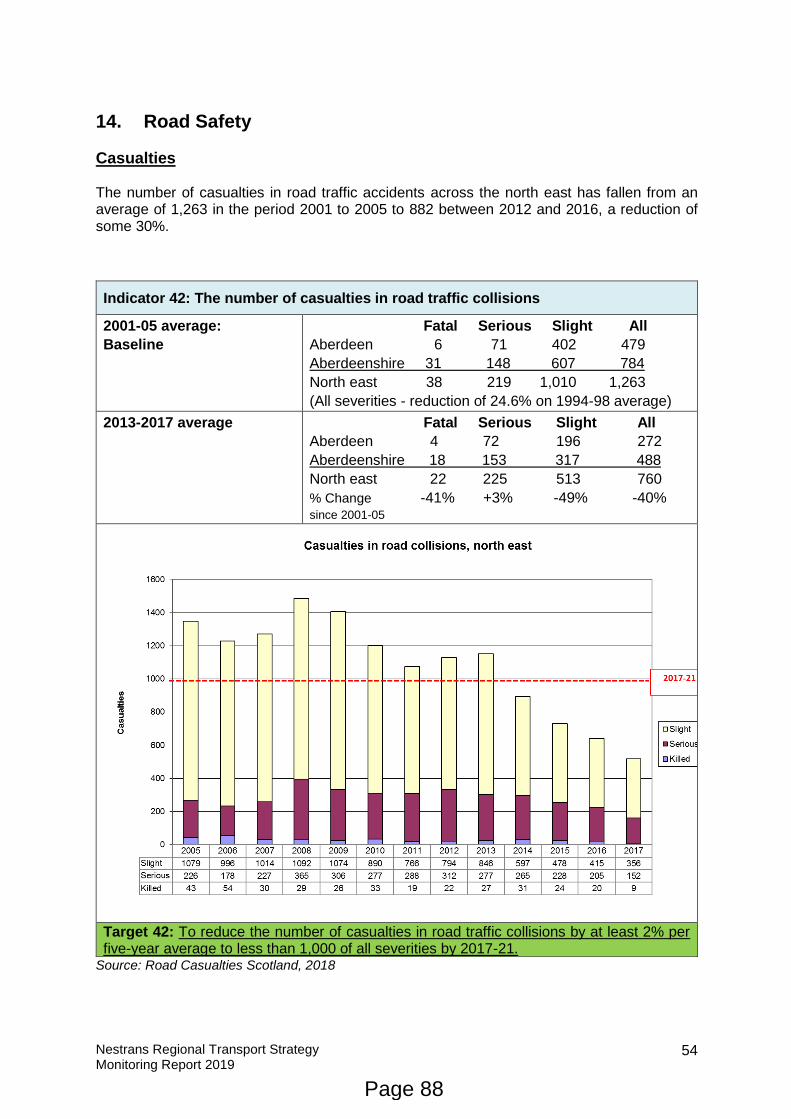
Nestrans Regional Transport Strategy Monitoring Report 2019
54
14. Road Safety
Casualties The number of casualties in road traffic accidents across the north east has fallen from an average of 1,263 in the period 2001 to 2005 to 882 between 2012 and 2016, a reduction of some 30%.
Source: Road Casualties Scotland, 2018
Indicator 42: The number of casualties in road traffic collisions
2001-05 average:
Baseline
Fatal Serious Slight All
Aberdeen 6 71 402 479
Aberdeenshire 31 148 607 784
North east 38 219 1,010 1,263
(All severities - reduction of 24.6% on 1994-98 average)
2013-2017 average Fatal Serious Slight All
Aberdeen 4 72 196 272
Aberdeenshire 18 153 317 488
North east 22 225 513 760
% Change -41% +3% -49% -40% since 2001-05
Target 42: To reduce the number of casualties in road traffic collisions by at least 2% per five-year average to less than 1,000 of all severities by 2017-21.
Page 88
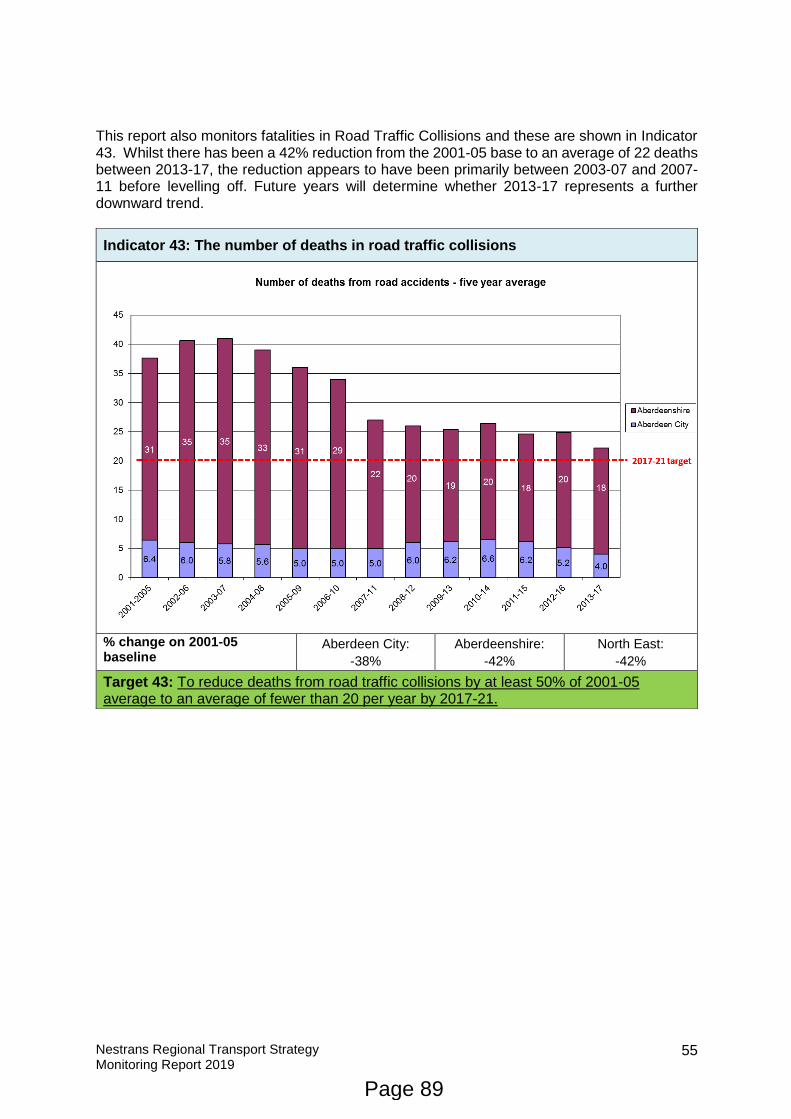
Nestrans Regional Transport Strategy Monitoring Report 2019
55
This report also monitors fatalities in Road Traffic Collisions and these are shown in Indicator 43. Whilst there has been a 42% reduction from the 2001-05 base to an average of 22 deaths between 2013-17, the reduction appears to have been primarily between 2003-07 and 2007-11 before levelling off. Future years will determine whether 2013-17 represents a further downward trend.
Indicator 43: The number of deaths in road traffic collisions
% change on 2001-05 baseline
Aberdeen City:
-38%
Aberdeenshire:
-42%
North East:
-42%
Target 43: To reduce deaths from road traffic collisions by at least 50% of 2001-05 average to an average of fewer than 20 per year by 2017-21.
Page 89
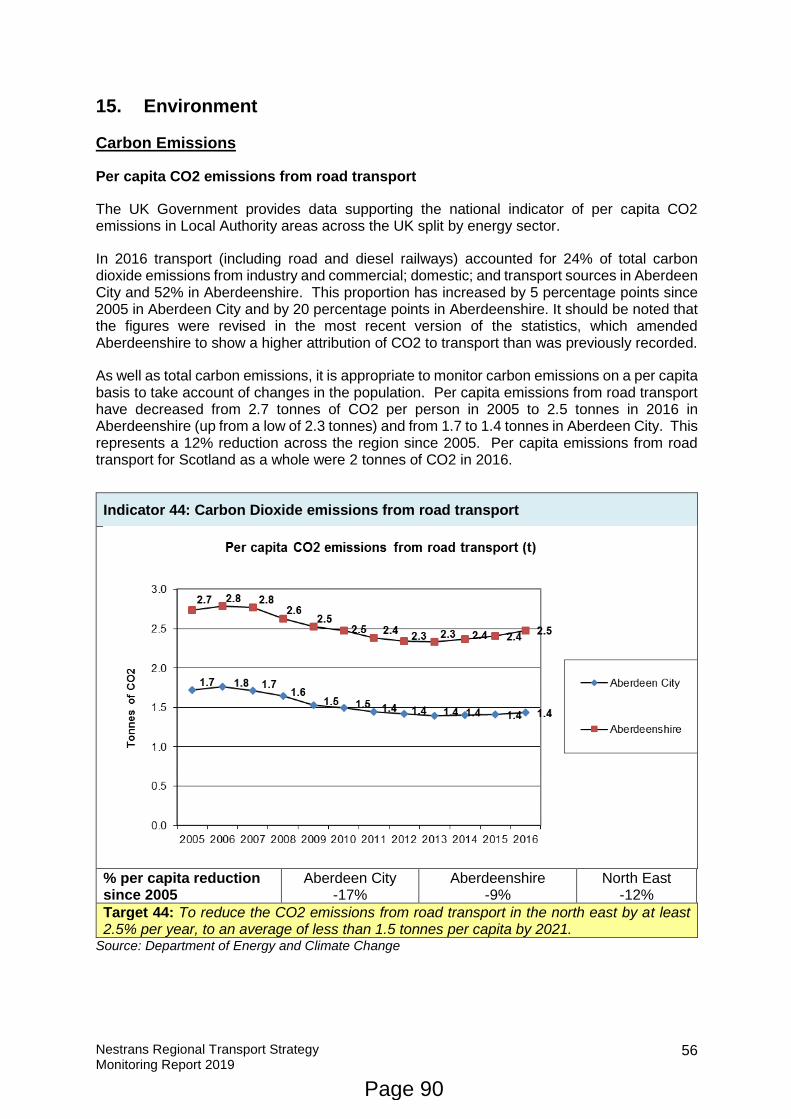
Nestrans Regional Transport Strategy Monitoring Report 2019
56
15. Environment
Carbon Emissions
Per capita CO2 emissions from road transport
The UK Government provides data supporting the national indicator of per capita CO2 emissions in Local Authority areas across the UK split by energy sector.
In 2016 transport (including road and diesel railways) accounted for 24% of total carbon dioxide emissions from industry and commercial; domestic; and transport sources in Aberdeen City and 52% in Aberdeenshire. This proportion has increased by 5 percentage points since 2005 in Aberdeen City and by 20 percentage points in Aberdeenshire. It should be noted that the figures were revised in the most recent version of the statistics, which amended Aberdeenshire to show a higher attribution of CO2 to transport than was previously recorded.
As well as total carbon emissions, it is appropriate to monitor carbon emissions on a per capita basis to take account of changes in the population. Per capita emissions from road transport have decreased from 2.7 tonnes of CO2 per person in 2005 to 2.5 tonnes in 2016 in Aberdeenshire (up from a low of 2.3 tonnes) and from 1.7 to 1.4 tonnes in Aberdeen City. This represents a 12% reduction across the region since 2005. Per capita emissions from road transport for Scotland as a whole were 2 tonnes of CO2 in 2016.
Indicator 44: Carbon Dioxide emissions from road transport
% per capita reduction since 2005
Aberdeen City -17%
Aberdeenshire -9%
North East -12%
Target 44: To reduce the CO2 emissions from road transport in the north east by at least 2.5% per year, to an average of less than 1.5 tonnes per capita by 2021.
Source: Department of Energy and Climate Change
Page 90
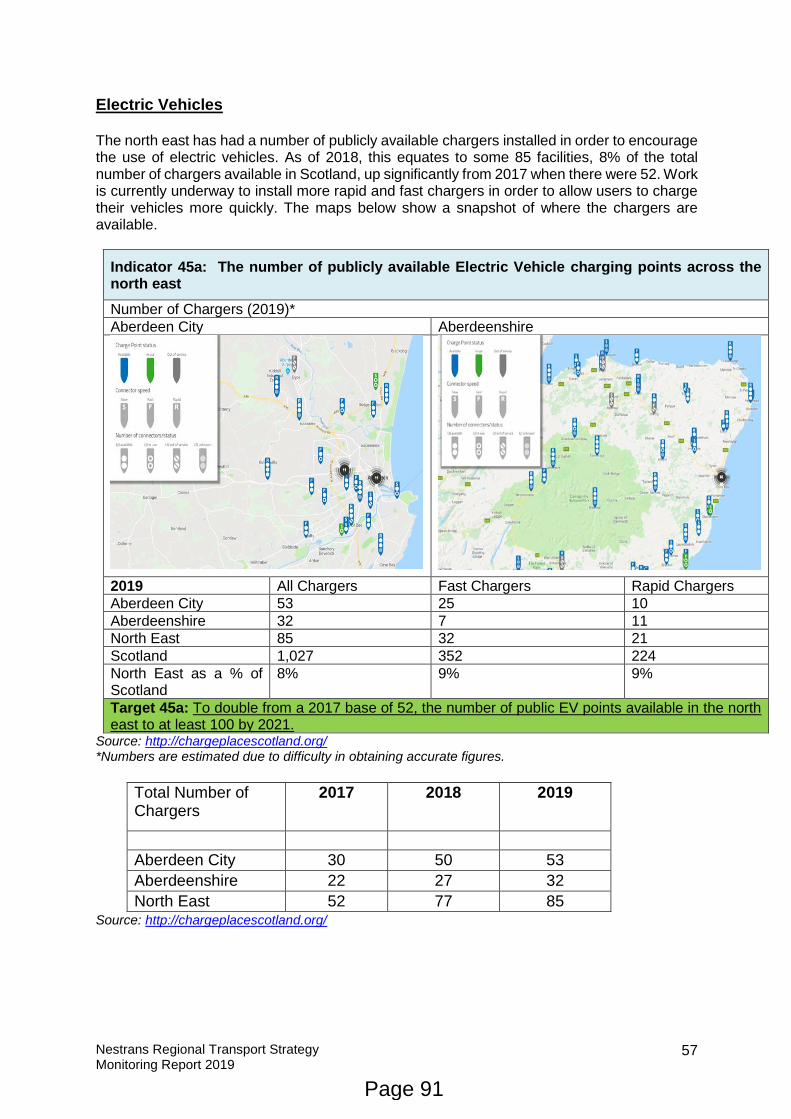
Nestrans Regional Transport Strategy Monitoring Report 2019
57
Electric Vehicles The north east has had a number of publicly available chargers installed in order to encourage the use of electric vehicles. As of 2018, this equates to some 85 facilities, 8% of the total number of chargers available in Scotland, up significantly from 2017 when there were 52. Work is currently underway to install more rapid and fast chargers in order to allow users to charge their vehicles more quickly. The maps below show a snapshot of where the chargers are available.
Indicator 45a: The number of publicly available Electric Vehicle charging points across the north east
Number of Chargers (2019)*
Aberdeen City Aberdeenshire
2019 All Chargers Fast Chargers Rapid Chargers
Aberdeen City 53 25 10
Aberdeenshire 32 7 11
North East 85 32 21
Scotland 1,027 352 224
North East as a % of Scotland
8% 9% 9%
Target 45a: To double from a 2017 base of 52, the number of public EV points available in the north east to at least 100 by 2021.
Source: http://chargeplacescotland.org/ *Numbers are estimated due to difficulty in obtaining accurate figures.
Total Number of Chargers
2017 2018 2019
Aberdeen City 30 50 53
Aberdeenshire 22 27 32
North East 52 77 85 Source: http://chargeplacescotland.org/
Page 91
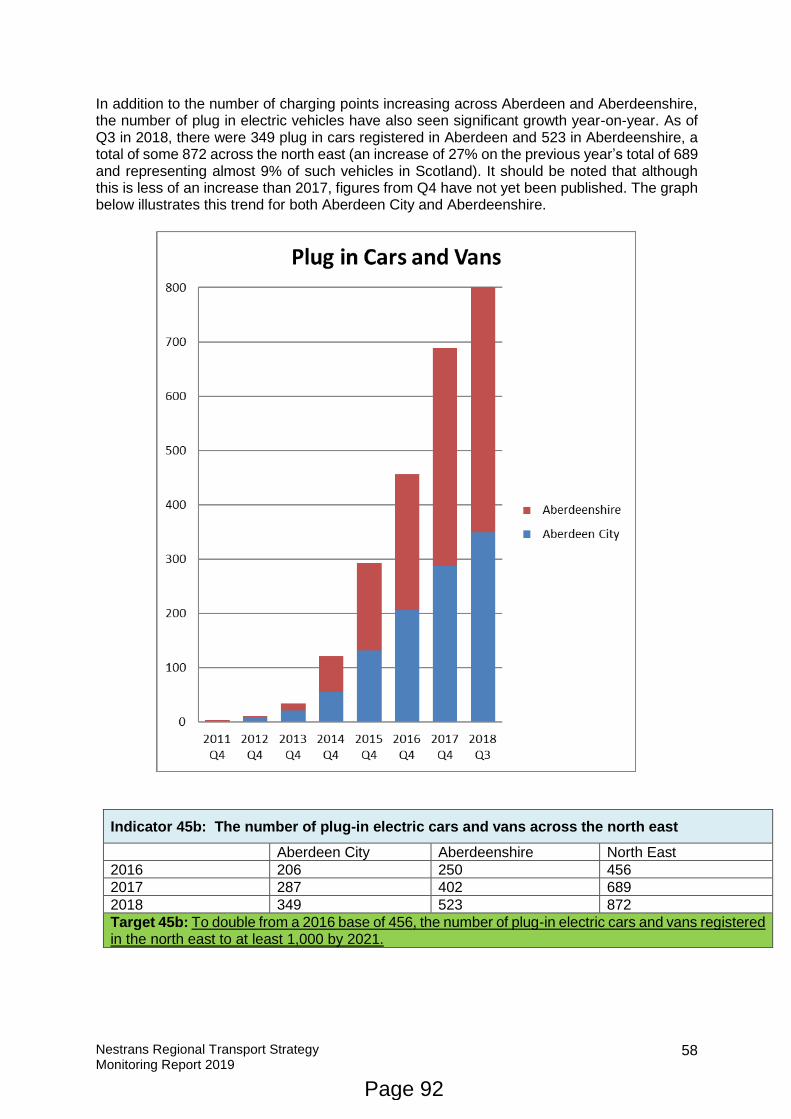
Nestrans Regional Transport Strategy Monitoring Report 2019
58
In addition to the number of charging points increasing across Aberdeen and Aberdeenshire, the number of plug in electric vehicles have also seen significant growth year-on-year. As of Q3 in 2018, there were 349 plug in cars registered in Aberdeen and 523 in Aberdeenshire, a total of some 872 across the north east (an increase of 27% on the previous year’s total of 689 and representing almost 9% of such vehicles in Scotland). It should be noted that although this is less of an increase than 2017, figures from Q4 have not yet been published. The graph below illustrates this trend for both Aberdeen City and Aberdeenshire.
Indicator 45b: The number of plug-in electric cars and vans across the north east
Aberdeen City Aberdeenshire North East
2016 206 250 456
2017 287 402 689
2018 349 523 872
Target 45b: To double from a 2016 base of 456, the number of plug-in electric cars and vans registered in the north east to at least 1,000 by 2021.
Page 92

Nestrans Regional Transport Strategy Monitoring Report 2019
59
Air Quality
Three Air Quality Management Areas have been identified in Aberdeen: the City Centre; Anderson Drive; and Wellington Road. These areas have been identified for projected exceedances in permitted levels of both Nitrogen Dioxide (NO2) and Particulates (PM10) and the City Council has produced a plan of action for reducing emissions to within European-defined maximum levels in these areas. Monitoring stations are in place at six locations and provide data on the current situation as well as annual average concentrations of pollutants. Indicator 46 shows that, as of 2017, Union Street is the only monitoring site that currently exceed the annual mean objective, although it has been steadily decreasing in mean concentrations of Nitrogen Dioxide since 2012. Market Street has also continued its downward trend for Nitrogen Dioxide emissions.
Indicator 46: The average atmospheric concentration of nitrogen dioxide
Target 46: To reduce the levels of identified pollutants and meet national and European legislation on pollutants (enabling the removal of AQMA status at all sites in the north east - in Aberdeen City Centre, Wellington Road and Anderson Drive)
Source: www.scottishairquality.co.uk and Aberdeen City Council 2018 Air Quality Annual Progress Report
Page 93
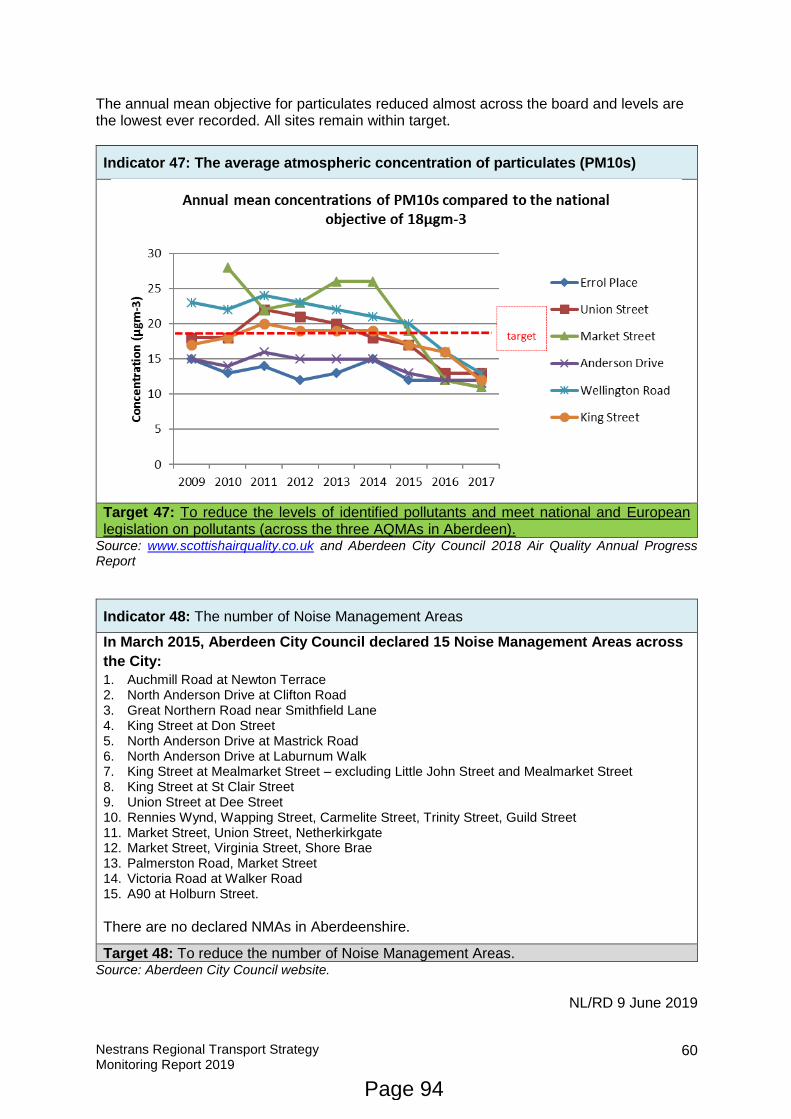
Nestrans Regional Transport Strategy Monitoring Report 2019
60
The annual mean objective for particulates reduced almost across the board and levels are the lowest ever recorded. All sites remain within target.
Indicator 47: The average atmospheric concentration of particulates (PM10s)
Target 47: To reduce the levels of identified pollutants and meet national and European legislation on pollutants (across the three AQMAs in Aberdeen).
Source: www.scottishairquality.co.uk and Aberdeen City Council 2018 Air Quality Annual Progress Report
Indicator 48: The number of Noise Management Areas
In March 2015, Aberdeen City Council declared 15 Noise Management Areas across
the City:
1. Auchmill Road at Newton Terrace 2. North Anderson Drive at Clifton Road 3. Great Northern Road near Smithfield Lane 4. King Street at Don Street 5. North Anderson Drive at Mastrick Road 6. North Anderson Drive at Laburnum Walk 7. King Street at Mealmarket Street – excluding Little John Street and Mealmarket Street 8. King Street at St Clair Street 9. Union Street at Dee Street 10. Rennies Wynd, Wapping Street, Carmelite Street, Trinity Street, Guild Street 11. Market Street, Union Street, Netherkirkgate 12. Market Street, Virginia Street, Shore Brae 13. Palmerston Road, Market Street 14. Victoria Road at Walker Road 15. A90 at Holburn Street.
There are no declared NMAs in Aberdeenshire.
Target 48: To reduce the number of Noise Management Areas. Source: Aberdeen City Council website.
NL/RD 9 June 2019
Page 94
NORTH EAST SCOTLAND TRANSPORT PARTNERSHIP – 19 June 2019
3d Annual Performance Indicators
Purpose of Report
The purpose of this report is to provide members with an Annual Report outlining Nestrans’ performance against a number of agreed indicators.
Background
As a Regional Transport Partnership, Nestrans has always attempted to be open and transparent regarding its own performance, particularly in relation to travel and transport. Annual Performance Indicators are reported to Board and the information contributes towards the partnership’s reporting as part of Climate Change mitigation, which is now a requirement on statutory public bodies.
Nestrans’ Key performance Indicators
Nestrans reports its performance against a number of agreed indicators on an annual basis,
which are provided in graphic form as Appendix A to this report.
Performance Indicators from April 2018 to March 2019 indicate:
1. Of 416 approved Business journeys, covering some 22,558 miles, over 77% of miles
travelled were undertaken by bus or rail. Just 6% of business mileage was by car
driver.
2. Nestrans’ Staff mode of travel to work indicates a good split between walking,
cycling, public transport and driving with a majority of travel by sustainable modes:
18% active travel, 34% public transport.
3. The Nestrans website had approximately 11,432 individual visits during the period
April 2018 to March 2019. This has increased and is now the highest level recorded.
Other media access (e.g. Twitter, Getabout Facebook page) have seen continued
use. From the figures obtained, the Nestrans Web site remains the preferred option
for obtaining up to date information, with 14,754 pages viewed over the year.
Recommendation
It is recommended that the Board:
a) Note the contents of this report.
RD/TH 23rd May 2019
Page 95
Agenda Item 3d

This page is intentionally left blank
Page 96
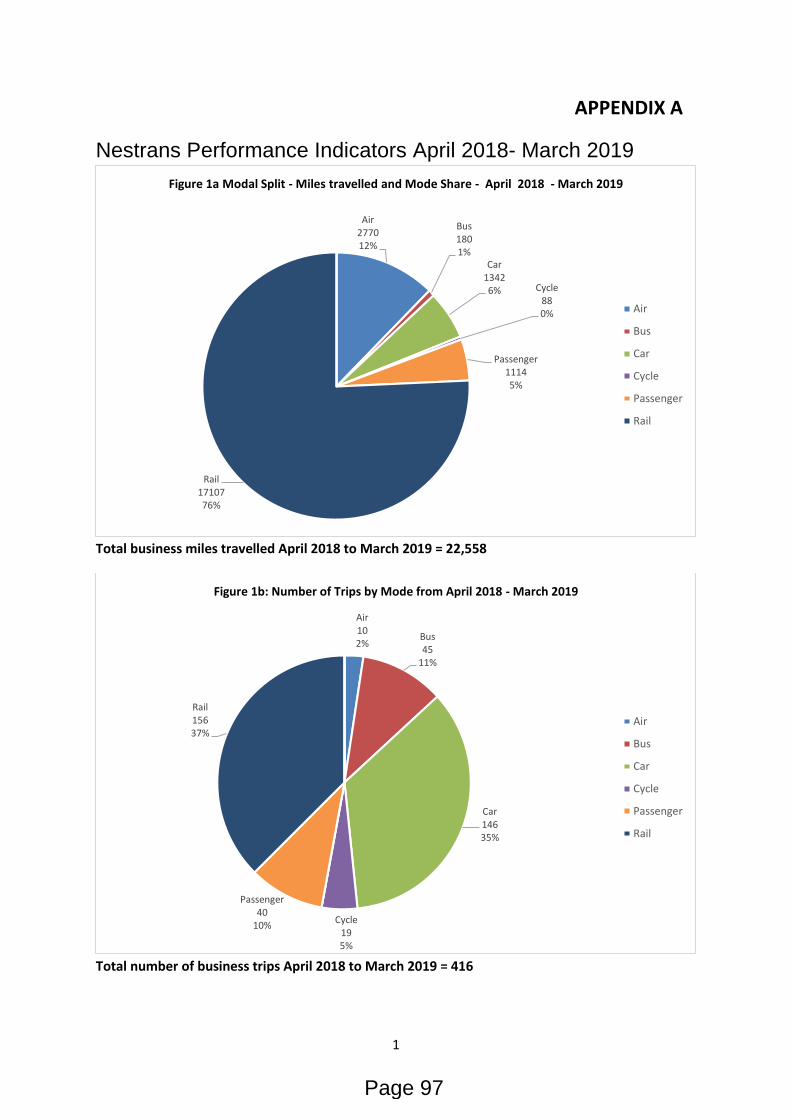
1
APPENDIX A
Nestrans Performance Indicators April 2018- March 2019
Total business miles travelled April 2018 to March 2019 = 22,558
Total number of business trips April 2018 to March 2019 = 416
Air277012%
Bus1801%
Car13426% Cycle
880%
Passenger11145%
Rail1710776%
Figure 1a Modal Split - Miles travelled and Mode Share - April 2018 - March 2019
Air
Bus
Car
Cycle
Passenger
Rail
Air102%
Bus45
11%
Car14635%
Cycle195%
Passenger40
10%
Rail15637%
Figure 1b: Number of Trips by Mode from April 2018 - March 2019
Air
Bus
Car
Cycle
Passenger
Rail
Page 97
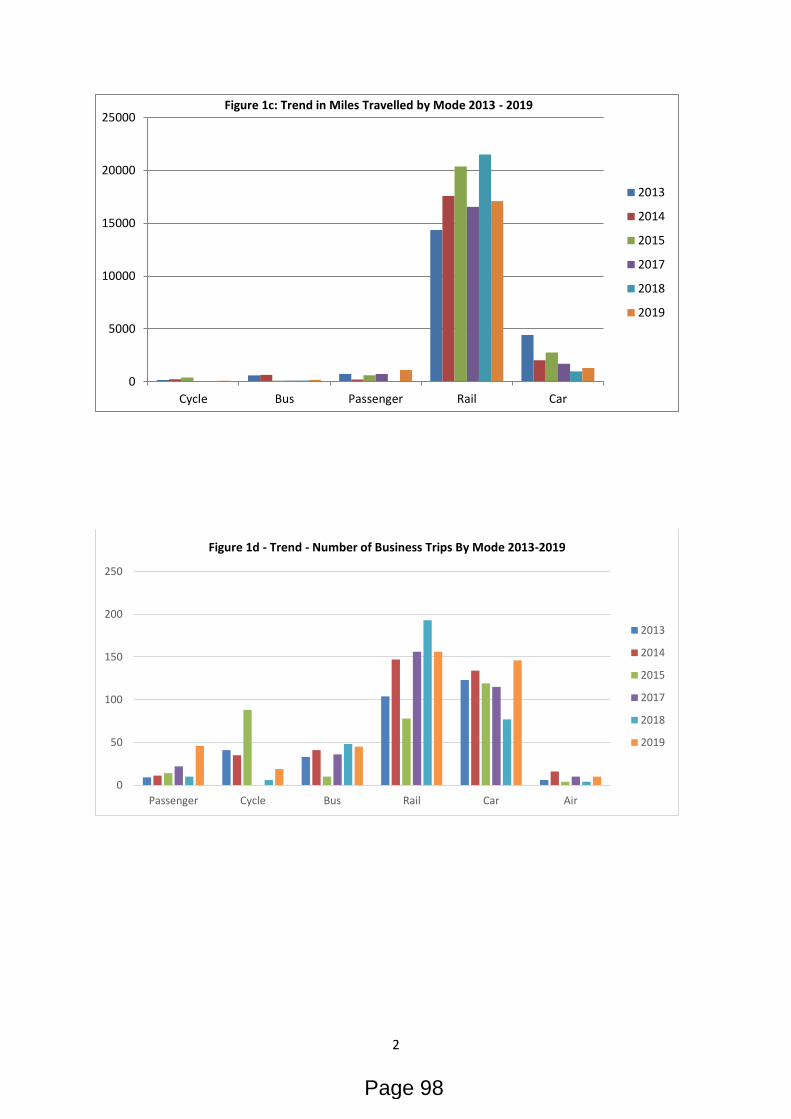
2
0
5000
10000
15000
20000
25000
Cycle Bus Passenger Rail Car
Figure 1c: Trend in Miles Travelled by Mode 2013 - 2019
2013
2014
2015
2017
2018
2019
0
50
100
150
200
250
Passenger Cycle Bus Rail Car Air
Figure 1d - Trend - Number of Business Trips By Mode 2013-2019
2013
2014
2015
2017
2018
2019
Page 98
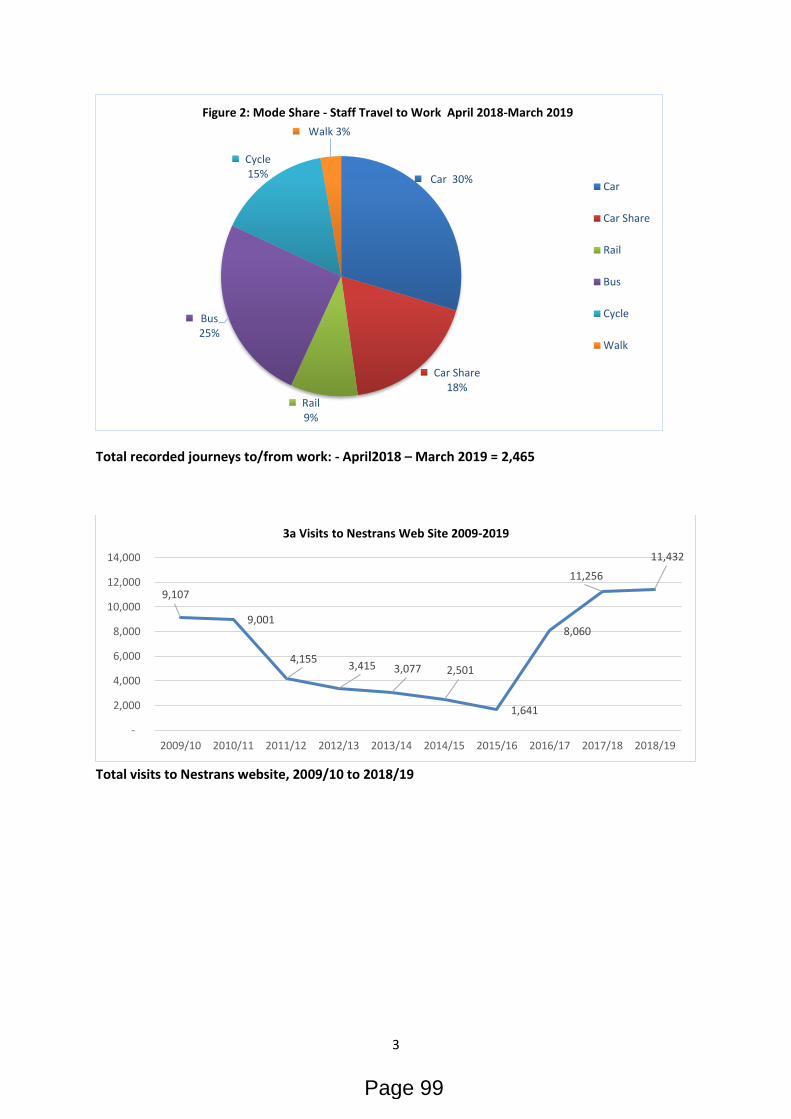
3
Total recorded journeys to/from work: - April2018 – March 2019 = 2,465
Total visits to Nestrans website, 2009/10 to 2018/19
Car 30%
Car Share18%
Rail9%
Bus25%
Cycle15%
Walk 3%
Figure 2: Mode Share - Staff Travel to Work April 2018-March 2019
Car
Car Share
Rail
Bus
Cycle
Walk
9,107
9,001
4,155 3,415 3,077 2,501
1,641
8,060
11,256
11,432
-
2,000
4,000
6,000
8,000
10,000
12,000
14,000
2009/10 2010/11 2011/12 2012/13 2013/14 2014/15 2015/16 2016/17 2017/18 2018/19
3a Visits to Nestrans Web Site 2009-2019
Page 99

4
Total website and social media use April 2018- March 2019 = 13,511
Total pages viewed on website 2018/19 = 14,754
11432
788 688 603
0
2000
4000
6000
8000
10000
12000
14000
Nestrans Website Nestrans Twitter Followers Getabout TwitterFollowers
Getabout Facebook PageFollowers
3b Visits to Nestrans Website & other Media April 2018 - March 2019
5147
25151322
1062
908
905
844
740
679632
3c Most visited pages on Nestrans Web site
home page
projects/AWPR
Board meetings
contact nestrans
about nestrans
regional transport stratgey
other projects
Aberdeen/Inverness Project
News
about nestrans organisation
Page 100
NORTH EAST SCOTLAND TRANSPORT PARTNERSHIP – 19 June 2019
3e Cumulative Transport Appraisal
Purpose of Report
The purpose of this report is to advise the Board of the results of the Cumulative Transport Appraisal (CTA) Option Testing Report and approve it for publication.
Background
In September 2017, Nestrans, in partnership with the Strategic Development Planning Authority (SDPA), Aberdeen City Council and Aberdeenshire Council, commissioned Systra to undertake a transport appraisal of the then emerging Proposed Strategic Development Plan (SDP) for Aberdeen City and Aberdeenshire. The study used the recently upgraded strategic multi-modal Aberdeen Sub Area Model (ASAM14) to consider the cumulative strategic transport impacts associated with the scale and distribution of all the development proposals on the network as a whole.
The CTA study considered the scale and location of new development, planned transport infrastructure, future network impacts on the main transport modes, and identified a list of interventions with the potential to mitigate predicted impacts. The study outcomes are described in the ‘Cumulative Transport Appraisal Final Report’, August 2018.
The full study and Executive Summary can be found on the SDPA website and formed supporting documents for the Proposed Plan that was consulted upon between 8 October and 17 December 2018 and then submitted to the Scottish Ministers for Examination in Public on 22 April 2019. The residential and employment development allocations applied and reported within the August 2018 CTA reporting were based on development allocations assumed at the start of 2018, which were subsequently updated, prior to the agreement of the Proposed Plan in March 2019.
Supplementary appraisal has now been undertaken to consider amendments to the level of development content contained in the final Proposed SDP and to understand how a range of transport intervention proposals would mitigate predicted impacts to facilitate the delivery of the Proposed Plan. The full supplementary appraisal and appendix A with the traffic congestion hotspot mapping can be viewed on the Nestrans Member’s site and will be published on the Nestrans website once approved for publication by the Board.
Appraisal Methodology
The study was undertaken in line with DPMTAG and STAG guidance, which provide an objective-led approach to ensure transport objectives and intervention options are considered that address the specific problems, opportunities, issues and constraints (POIC) identified within the study area.
The study considered relevant POICs relating to the Proposed SDP transport impacts through appraising transport and land use modelling scenarios and reviewing policy documents. This evidence-base established a number of Transport Planning Objectives, and subsequently three Packages of transport intervention options were produced, with the aim of meeting these objectives and addressing the problems faced. The Packages were appraised using a number of modelled scenarios.
Page 101
Agenda Item 3e
The Aberdeen Sub Area Model 2014 (ASAM14) was utilised to prepare scenarios to represent committed transport infrastructure and services (such as the AWPR and Kintore rail station), and the scale and distribution of development allocations across Aberdeen City and Aberdeenshire.
Test Scenarios The key scenarios developed to demonstrate and compare both transport and development orientated impacts included:
• Do Minimum - representing SDP Effective Land Supply and Demand to 2030/32 with ‘Do Minimum’ Schemes – demonstrating the impact of planned development build out and population and employment growth, set against the benefits of committed transport investments, such as the AWPR/A90 Balmedie to Tipperty, Haudagain Link Road, Kintore station and new rail revolution services;
• Reference Case - based on the Do Minimum and with 2010 CTA Schemes – demonstrating the benefits of additional transport interventions proposed as part of the earlier 2010 CTA study (such as a new river crossing at the Bridge of Don and cross city bus services);
• Test Case Proposed SDP Development - based on the Reference Case with additional SDP development proposals to 2035/37 (updated to reflect final development allocations); and
• Package Tests - Packages of transport investment options aimed at mitigating impacts.
Development Allocations
The SDPA provided new and more detailed development information based on the emerging preferred options within the Local Development Plan Main Issues Reports of Aberdeen City and Aberdeenshire Councils to represent the amendments associated with the final Proposed Plan, which were not represented in the 2018 CTA. This approach has provided a more detailed set of development inputs within the transport modelling, where sites were represented in the approximate location where specific development is being planned, rather than distributed (on average) across wider areas.
The Proposed Aberdeen City & Shire SDP now includes a housing allowance of 8,335 units, in addition to the effective housing land supply of 37,000 units (represented within the Reference Case scenario). The Proposed SDP figures therefore represent an additional 2,800 housing units to the initial allowances appraised and reported in August 2018.
The updated assessment of the latest development allocations proposed for Aberdeen City and Aberdeenshire demonstrated a slightly greater impact across the region when compared with the earlier appraisal reported in the 2018 CTA. The traffic analysis demonstrated that the more significant housing allocations contained within the final Proposed Plan would generate higher traffic flows and generally amplify congestion impacts across the region. The distribution of impacts was shown to be generally similar to those reported earlier through the 2018 CTA. Therefore, the predicted impacts and general conclusions associated with the delivery of the SDP remain consistent in terms of the identified problems, opportunities, issues and constraints, and subsequent objective setting and transport option generation as reported in August 2018.
Page 102
Objectives The set of objectives previously defined in the 2018 CTA study and still appropriate for this further appraisal are as follows:
• Improve the efficiency and reliability of the transport network in the study area;
• To achieve a reduction in journey times for all modes, to key destinations within the study area;
• To increase the proportion of travel undertaken by sustainable transport modes within the study area;
• Reduce the negative environmental impact of transport within the study area; and
• Reduce the rates and severity of traffic accidents within the study area.
Transport Option Packages The following three transport option Packages were generated in response to these objectives, with each containing various infrastructure schemes and policy proposals to mitigate predicted impacts.
• Package 1: Road junction improvements, traffic signals, bus priority measures, active travel initiatives and the A96 Dualling East of Huntly to Aberdeen scheme;
• Package 2: As Package 1, and also including new rail stations and rail service connections at Bucksburn, Cove and Newtonhill; and
• Package 3: As Package 2, and also including additional junction upgrades, traffic signals, carriageway improvements and new link roads.
The impact of these Packages were assessed against the SDP ‘Test Case’ scenario, which represents the impact of the build out of additional development proposals, and the ‘Reference Case’ scenario, which reflects the delivery of the effective land supply only. The overall aim of the Packages was to improve network performance and reduce impacts down to, or below levels seen in the Reference Case - therefore fully mitigating the impact of development proposals (nil detriment).
Appraisal Outcomes
Package 1 Package 1 demonstrates strong benefits for areas within Aberdeenshire, with the A96 corridor in particular seeing substantial congestion relief and travel time savings. Congestion benefits are also predicted along the A90 North and A90 South corridors, with the majority of Aberdeenshire problem areas being mitigated down to nil-detriment impact.
Congestion relief is also generated in many peripheral areas of the city, particularly at the AWPR Cleanhill and A944 interchanges. However, several pinch-point locations are shown to remain under pressure at peak times, including the A96 / Airport, and A947 Parkhill areas.
Within central areas of Aberdeen, Package 1 is less effective, with no significant reduction in traffic delays, and many areas remaining congested (for example residual impacts continue at intersections along the Anderson Drive corridor, such as at the A93 Great Western Road and around the Bridge of Dee). Some relief is though provided along the Wellington Road corridor.
Public transport time savings are brought about through bus priority measures, and some minor mode shift impacts towards higher public transport use are seen. Relevant policy measures are also considered to facilitate more short distance trips to be made by active modes.
Page 103
In relation to the TPOs, Package 1 provides moderate positive impact to the efficiency and reliability objective, both regionally and locally. A minor positive impact is seen for the reduction in journey times to key destinations objective, again both regionally and locally. For the increase in proportion of sustainable modes, Package 1 shows a minor positive impact at a regional level, and for the local objective related to reducing overcrowding at rail station car parks, but a neutral impact on the local objective for improving the competitiveness of public transport to car. A minor positive impact is also achieved for reducing the rates and severity of traffic accidents overall.
Package 1 was also considered against STAG criteria. It scored a moderate positive benefit for economy, through achieving travel time user benefits for both road and public transport overall, and in particular by facilitating access to key SDP development growth and investment areas.
Environmental impacts were considered as a minor negative overall, as although there are benefits in some areas through more efficient flow of traffic (reducing emissions and improving local air quality), the modelling indicates higher traffic volumes overall, likely increasing global emissions. There would also likely be impacts associated with construction and land environment from major infrastructure projects such as the A96 Dualling.
A minor positive impact is likely to be seen for safety, integration, and accessibility and social inclusion criteria, due to improved infrastructure provision, enhanced modal connectivity, and enhanced local accessibility for areas of deprivation. A high-level assessment of deliverability in terms of feasibility and affordability found Package 1 to be moderately positive - reflecting the level of benefits achieved, relatively small-scale nature of proposals and the Government commitment for the A96 scheme.
Package 2 Although Package 2 does not demonstrate region-wide or significant traffic-congestion benefits (over and above those shown for Package 1), the new rail stations do produce some significant time savings and accessibility benefits for the new local rail catchment areas.
As such, in relation to the TPOs the appraisal scoring is largely in line with Package 1, but with the local objective for journey times moved from a minor positive to a moderate positive impact due to localised public transport journey time improvements at the new rail stations.
For the STAG criteria, Integration, Accessibility and Social Inclusion receive a moderate positive impact (compared to minor in Package 1). This reflects the enhancements to park and ride and localised rail accessibility improvements. Deliverability, however, is reduced to a minor positive scoring due to the increased cost and more challenging feasibility of rail station options, and combining new stops into the existing timetable without significant disruption.
Package 3 Package 3 provides further benefits for the Ellon area, and for the periphery of Aberdeen at the A96 and A947 AWPR intersections. However, these local benefits are generally masked when considered at the regional level due to some impedance of high traffic volume routes (caused by the aim to reduce delays and improve access from connecting roads through signal control). Subsequently, local disbenefits increase at some problem areas, such as the Bridge of Dee. The benefits that are observed appear greater within the evening peak, with less relief identified during the morning peak period.
In relation to the TPOs, the scoring of this package is generally in line with Package 2. Although there are greater benefits seen in some areas, the limited scale of these and disbenefits forecast for other corridors mean that benefits are not sufficient to affect the
Page 104
overall scoring of the Package. This is also true of the STAG criteria assessment and deliverability scoring. As a result, Package 3 tends to demonstrate less value overall, compared to the earlier Packages
Conclusions
Overall, all Packages generate benefits compared to the Test Case scenario, with many areas seeing congestion reduce down to Reference Case levels and therefore achieving no net detriment to the road network. Several congestion pinch points do though remain, particularly within central Aberdeen, with further mitigation required to mitigate all predicted development impacts. There is also some evidence of secondary impacts being generated, as proposals improve local traffic operation, increasing the throughput of vehicles and knock-on impacts further downstream.
Although there are some benefits identified for public transport use, further intervention would be required to increase public transport competitiveness, particularly for movements where rail services do not provide a viable option.
It should be noted that the potential interventions identified above have not been fully considered in terms of detailed engineering design and the access arrangements from development to the local road network. Environmental assessments detailing the potential constraints associated with each intervention have also not been considered through this piece of work. Further work would be required to better understand the feasibility of design and impact of the options identified through this study.
Next steps
The CTA option testing has demonstrated that measures can be identified and implemented to help mitigate the main predicted congestion hot spots that have been predicted to arise. These congestion benefits will vary by location and depend heavily on the feasibility of interventions and as such, the conceptual proposals tested through this study would need to be developed further within the context of the Scottish Transport Appraisal guidance. This would include establishing the full value for money associated with the different interventions identified. Following the quashing of the Supplementary Guidance relating to the Strategic Transport Fund there is no longer a mechanism of seeking developer contributions to fund the identified measures. However the findings of the CTA option appraisal help to identify the “worst case” transport impacts associated with the Proposed Plan, understand the value of potential mitigation options, and ultimately support the delivery of the Aberdeen City and Shire SDP and help ensure the transport implications of the emerging Local Development Plans are fully considered. The potential mitigation options identified within this supplementary appraisal should be considered alongside the options being developed through the Strategic Transport Appraisal being funded by the City Region Deal and feed into the Strategic Transport Projects Review (STPR2) where appropriate. The outcomes should also help inform the development of the next Regional Transport Strategy, which will set future regional transport policy and may therefore influence the predicted outcomes.
Recommendations
The Board is recommended to:
1. Note the findings of this work; and
2. Approve the final report for publication on the Nestrans website.
JA/ 6 Apr 2019
Page 105

This page is intentionally left blank
Page 106
4a FPASTS Rail Page 1
NORTH EAST SCOTLAND TRANSPORT PARTNERSHIP – 19 June 2019
4a Fraserburgh and Peterhead to Aberdeen Strategic
Transport Study: Further Rail Study
Purpose of Report
The purpose of this report is to update members in regard to progress on the Fraserburgh and Peterhead to Aberdeen Strategic Transport Study (FPASTS), particularly to receive the results of the further study which has been considered in aspects of rail development.
Background
Members will recall that Nestrans has been leading an all-modes study on strategic transport issues on the corridor between Fraserburgh and Peterhead to Ellon and Aberdeen. Results of an initial STAG 1 study were presented to Board at its meeting on 30 September 2016 and the board agreed that further detail was required on some aspects of the study. Two further, more detailed pieces of work were therefore commissioned: • A Feasibility study looking at the costs, benefits and likely patronage for a reopened rail service between Aberdeen, Dyce and Ellon; and • A more detailed appraisal of prospective road upgrades on the A90 and A952, providing indicative schemes, costs and benefits. Two consultancies were let - Aecom worked on the rail study and Systra developed the road options, and reported to Nestrans and partners (Aberdeenshire Council, Aberdeen City Council and Transport Scotland, with help from Network Rail and ScotRail in regard to the rail study) in the form of a briefing for members, MPs and MSPs on 3 November 2017. On the same date, reports for both pieces of work were presented to the Nestrans Board and a recommendation to seek input from both Councils was approved. At its meeting on 14 February 2018, the Board heard feedback from the local authorities and agreed to seek further clarification on the rail elements, to gain a better understanding of potential and likely impact on other rail aspirations. A report to the September 2018 Board indicated that Aecom consultants had undertaken further work and produced two technical documents in relation to Sensitivity Testing around the rail option to Ellon and an Engineering Review of potential station sites between Aberdeen and Dyce. The Sensitivity Testing had demonstrated that although adjusting factors and assumptions could improve the business case, but that even with all Sensitivity Tests applied, the cumulative benefits do not exceed the costs. They also concluded that with the upgrade works currently ongoing between Aberdeen and Inverurie, there was capacity for further rail projects or additional stations. Since September, the consultants have been progressing options for new stations in the area and detailing the prospects for a potential rail spur to The Event Complex Aberdeen (TECA) and Aberdeen Airport. This work is now complete and summarised below.
Page 107
Agenda Item 4a
4a FPASTS Rail Page 2
Complementary Rail Schemes
The consultants were initially tasked with high level investigation of possible other rail schemes, and whether these are likely to provide synergies with the proposal or could potentially undermine the possibility of a new route to Ellon. It should be noted that the Revolution in Rail proposals are taken as a baseline case, assuming an hourly service in each direction between Inverurie and Montrose, in addition to existing Aberdeen-Inverness services, which is scheduled to operate from December 2019. The potential for an hourly frequency service Aberdeen-Inverness is a Transport Scotland proposal, but no timescale has been agreed.
Rail Spur to TECA and Aberdeen Airport
Aspirations have been mooted for a new rail spur to serve Aberdeen International Airport and the new Events Complex. As reported to the September Board, although the Masterplan which enabled the construction of the new Exhibition Centre identifies land by safeguarding an area to provide a connection to the Arena and onward to the airport, a minimum radius of 400metres would be necessary for rail curvature which would impact on several residential properties, could necessitate operational restrictions on the main line and would only allow for trains to access the rail connection from the south. The consultants conclude that “it is unlikely that an Airport connecting line in the corridor as identified from current plans would be suitable.” The consultants were asked to provide further information, such as high-level cost estimates for a spur and any physical restrictions such as gradients to give a fuller picture. They have also been asked to consider whether an alternative of developing a new station on the main line close to the Exhibition Centre site would be a better proposition. A cost estimate of just over £100million has been produced excluding land purchase costs but including Optimism Bias at 64%, allowing for two new stations and connection to the Aberdeen-Inverness line both north and south. Due to embankments, bridging over a number of roads and the possible requirement to relocate International Avenue, the impact is considered to be significant and it is recommended that a better option would be to consider the potential for a new station on the main line, close to TECA and the option of connecting buses or other opportunities for linking to the airport.
Potential for new stations
The consultants were also asked to consider the potential for additional stations between Aberdeen and Dyce. As previously reported, five potential compliant sites have been identified – three in the Woodside area, one at Bankhead and one at Stoneywood. An initial assessment has indicated that sites S1 close to Don Street and S4, within walking distance of TECA, are worthy of taking forward for operational assessment. The consultants’ report is available on the members’ section of the Nestrans’ website and contains initial consideration regarding site accessibility and planning review. However, it is recommended that further work is done in relation to the prospects for a cross-rail service, initially by assessing potential station sites south of Aberdeen and then to ascertain the optimum number of stations to operate an effective local rail service, balancing running times with connectivity. The first element of this (to consider station sites) will be the subject of a
Page 108
4a FPASTS Rail Page 3
bid to Transport Scotland’s Local Rail Development Fund, as previously agreed by the Nestrans Board at its meeting in April.
Recommendations
It is recommended that the Board:
1. note the contents of this report and the outcomes of the report regarding the further rail studies in support of the FPASTS study;
2. agree to the publication of the consultants’ reports to go onto the Nestrans’ website; and
3. progress the options for further stations in the context of a potential cross-Aberdeen
rail service, including consideration of new stations south of the City.
RD/11 June 2019
Page 109

This page is intentionally left blank
Page 110
4b A96 Dualling Page 1
NORTH EAST SCOTLAND TRANSPORT PARTNERSHIP – 19 June 2019
4b A96 dualling
Purpose of Report
The purpose of this report is to update members in regard to the Scottish Government’s proposals to dual the A96 between Inverness and the AWPR to the west of Aberdeen.
Background
The Scottish Government has committed to dualling the A96 from Aberdeen to Inverness by 2030. The route has been divided into sections with each section assigned a project manager and project team and each are progressing at different rates with routes to the west being the most advanced at this stage. Route assessment and design follows the planning and assessment stages and standards set out in the Department for Transport’s Design Manual for Roads and Bridges (DMRB) for Trunk Roads. The East of Huntly to Aberdeen section is currently at design Stage 2. AmeyArup, a joint venture company, are taking forward the design of the East of Huntly section and held a Route Options Exhibition in October 2018. This identified the routes which were being taken forward for detailed assessment and the routes and alignments which had been considered but ruled out. Those rejected included the routes most closely affecting Bennachie and the alignment following the A947 south of Oldmeldrum-Newmachar (referred to as Option Q). The ‘Online at Inverurie’ – OLI - option had also been previously ruled out, broadly this is the option of following closely the alignment of the existing A96 or dualling the existing Inverurie by-pass. This is due to the challenges of delivering an online dualling without significantly adversely affecting neighbouring communities and properties, since grade-separated junctions will be a requirement of the scheme and the attendant challenges of maintaining or enabling side road access to existing properties. Further information on the assessment of the on-line option in relation to Inverurie was published on the Transport Scotland website in April and is available to download from: https://www.transport.gov.scot/media/44577/online-at-inverurie-dualling-feasibility-and-appraisal-east-of-huntly-to-aberdeen-a96-dualling.pdf
The route options previously identified included several options of routes to the north and south of Inverurie, several options for crossing the River Don and three route options between Inverurie and Huntly. Some of the options presented would have a greater degree of impact on existing communities and properties than others. AmeyArup and Transport Scotland committed to come back in spring of this year with a reduced number of options to give greater clarity to communities and individuals. The 2018 public exhibition and online consultation generated a significant level of correspondence which was in excess of that anticipated and to a much greater degree than has been found on other sections of the route or other similar projects. As such, official responses to those responding to the route options exhibition were only received in mid-May.
Page 111
Agenda Item 4b
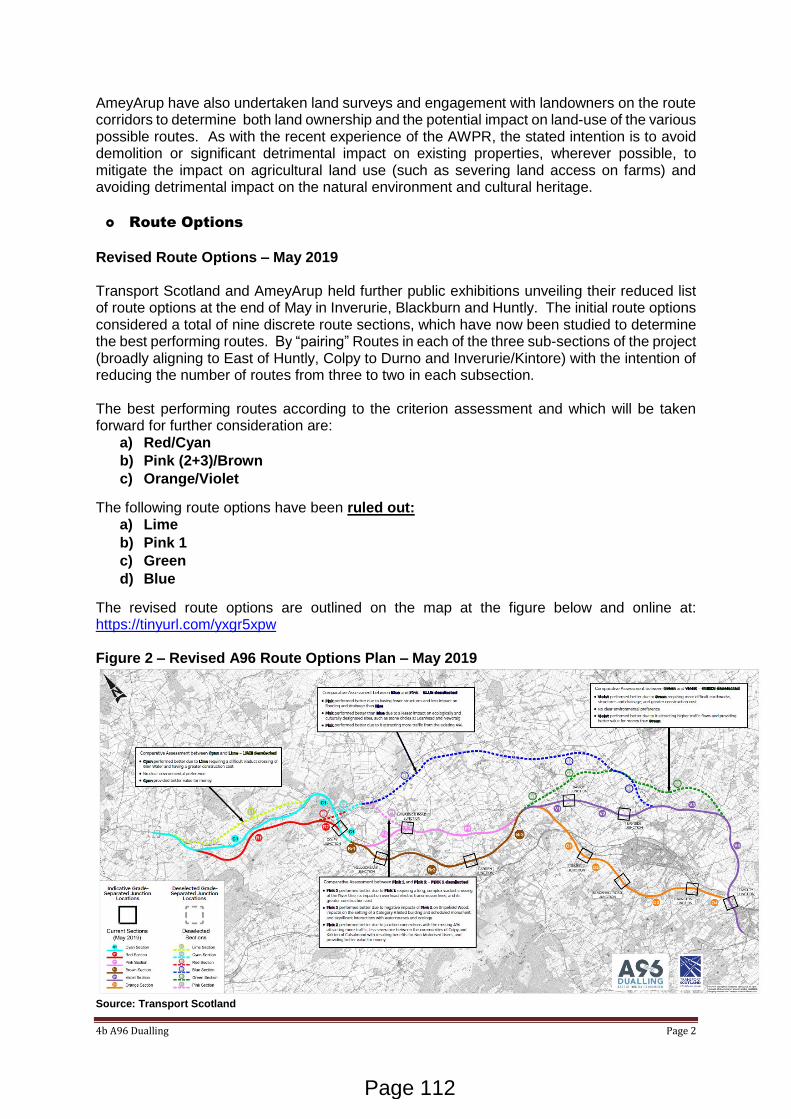
4b A96 Dualling Page 2
AmeyArup have also undertaken land surveys and engagement with landowners on the route corridors to determine both land ownership and the potential impact on land-use of the various possible routes. As with the recent experience of the AWPR, the stated intention is to avoid demolition or significant detrimental impact on existing properties, wherever possible, to mitigate the impact on agricultural land use (such as severing land access on farms) and avoiding detrimental impact on the natural environment and cultural heritage.
Route Options
Revised Route Options – May 2019 Transport Scotland and AmeyArup held further public exhibitions unveiling their reduced list of route options at the end of May in Inverurie, Blackburn and Huntly. The initial route options considered a total of nine discrete route sections, which have now been studied to determine the best performing routes. By “pairing” Routes in each of the three sub-sections of the project (broadly aligning to East of Huntly, Colpy to Durno and Inverurie/Kintore) with the intention of reducing the number of routes from three to two in each subsection. The best performing routes according to the criterion assessment and which will be taken forward for further consideration are:
a) Red/Cyan
b) Pink (2+3)/Brown
c) Orange/Violet
The following route options have been ruled out: a) Lime
b) Pink 1
c) Green
d) Blue
The revised route options are outlined on the map at the figure below and online at: https://tinyurl.com/yxgr5xpw Figure 2 – Revised A96 Route Options Plan – May 2019
Source: Transport Scotland
Page 112
4b A96 Dualling Page 3
Broadly the most northernly routes have been excluded – Lime, Blue and Green – with retention of two options around Inverurie – one by-passing the town to the north, one to the south; two options north and south of Old Rayne and two routes which go either side of the Hill of Skares at Colpy and broadly converge just east of Huntly. In addition to reducing the number of route options, further adjustment to the alignments and potential junction locations have been undertaken on the remaining routes to mitigate further the impact on existing properties or planned development and environmental, or culturally sensitive areas such as the identified Sites of Special Scientific Interest (SSSI) and Local Nature Conservation Sites (LNCS) and Listed Buildings or Designed Landscapes. There are no ‘new’ alignments – and route options ruled out at earlier stages have not been reconsidered so Option Q (the A947 option) and the Bennachie option are not back on the table and neither has the Online option of dualling on the route alignment of existing A96 Inverurie By-pass been considered further, despite significant public comment. Information displayed at the public exhibition and available on the Transport Scotland project webpages outlines the implications and detrimental impact of the online route at Inverurie which would mean carriageway elevations to such a degree that the road height would be at the level of the existing roofline of some houses on the Inverurie by-pass. In respect of the junction and route upgrades to the existing A96 south of Inverurie, Transport Scotland have confirmed that although work is progressing on this aspect of the programme they are not bringing forward proposals at this time for the route upgrades south of Kintore. Officers are continuing to press Transport Scotland to bring forward this work due to the public interest and implications for development along the A96 corridor to Dyce.
Next Steps
The remaining route options will now be subject to further detailed assessment on their deliverability and cost-benefit under the headings of Engineering, Environment and Transportation as set out in the DMRB with the stated intention to publish a final preferred route in December 2019. Officers have broadly welcomed the reduction in proposed route alignments which give some of the potentially affected communities greater clarity and are in agreement that the routes going forward for assessment are the most appropriate. Notwithstanding that, officers are not recommending any single route and are sensitive to the impacts and negative consequences of each of the routes on particular areas. Officers will continue to engage with Transport Scotland and AmeyArup in their assessments of the remaining route options, providing observations and information including data, where requested, in order to inform the final preferred route. Responses have been invited to the published list of revised route options and given the deadline for comments is during the summer recess, it may be appropriate to leave for local authorities to make any formal response required.
Recommendations
It is recommended that the Board:
1. note the contents of this report and the progress towards dualling of the A96 East of Huntly section.
RMcgregor/RD/9 June 2019
Page 113

This page is intentionally left blank
Page 114
4c Roads Hierarchy Study.docx 1
NORTH EAST SCOTLAND TRANSPORT PARTNERSHIP – 19 June 2019
4c Roads Hierarchy Study
Purpose of Report
The purpose of this report is to present the findings of the investigations into options to update the roads hierarchy within the boundary of the Aberdeen Western Peripheral Route (AWPR) along with varying levels of intervention to support a new hierarchy.
Background
The roads hierarchy for Aberdeen was last reviewed in the 1990s. Nestrans and Aberdeen City Council, in partnership with Aberdeenshire Council and the Strategic Development Planning Authority commissioned Aecom in July 2018 to investigate options to update the roads hierarchy to take advantage of current investment in road and rail infrastructure and to help facilitate the City Centre Masterplan (CCMP) by providing a network that makes best use of the AWPR and reflects the role of the city centre as a destination rather than a through route for traffic. Aberdeen City Council had considered reports in 2016 and 2017 where approval was granted to develop a new roads hierarchy in Aberdeen to reflect the changes being brought forward in the North East. The following principles were agreed:
• All through and peripheral traffic should be directed to the AWPR;
• Traffic in Aberdeen with a destination away from Aberdeen should be directed to the AWPR at the earliest opportunity;
• The city centre should be considered as a destination rather than a through route for vehicular traffic and crossing the city centre by car should be discouraged. While most areas of the city centre will remain accessible to vehicles, accessing and exiting the city centre should, as far as possible, be by the same route, with car parking signage reflecting this. Crossing the city centre by active travel and public transport will be significantly improved by implementing CCMP proposals; and
• The benefits of the AWPR must be ‘locked in’ to prioritise the movement of active and sustainable travel through the re-allocation of carriageway space and other prioritisation and traffic management measures.
An online survey was undertaken in spring 2017 to ask people for their opinion on how everyone will move around the city’s roads, cycle routes and pavement networks before and after the AWPR opens. The survey concluded that, from a wide range of views, there was strong support for an improved environment for pedestrians and cyclists in Aberdeen city centre.
Consultancy Study
The Nestrans Board approved funding within the 2018/19 budget for the roads hierarchy study and Aecom were appointed following competitive tender in summer 2018. A substantial report and appendices were completed in April 2019 and the Executive Summary is provided in Appendix A. The study comprised of various tasks as follows:
• Review of previous work and current strategies and policies
Page 115
Agenda Item 4c
4c Roads Hierarchy Study.docx 2
• Review of national guidance and emerging legislation associated with road
reclassification
• Development of problems, opportunities, issues and constraints
• Agreement of objectives for the study
• Consideration of committed and potential transport projects (including the City Centre
Masterplan (CCMP))
• Consideration of predicted traffic flows with the AWPR open and with CCMP projects
in place
• Current physical attributes of the network
• Assessment of route purpose and principle destinations
• Assessment of Place Quality
• Identification of “anomaly” routes that are thought to be potentially over classified, or
performing at a higher function than is presently recognised in the current hierarchy
• Option development for priority radials; secondary radials; secondary orbitals; local
roads and C class roads under consideration
• Options for change to the reclassification – either in relation to the routing, the start
and end points of the route or the roads hierarchy status (priority, secondary, local) of
the route
• Option sifting against the study objectives and established roads hierarchy principles
• Whole network validation – considering suitability of place for the roads hierarchy
options, alignment with the signing framework from the AWPR and impact for active
travel, public transport, freight and general traffic
• Option Packaging – giving consideration to increasing levels of intervention to support
that new roads hierarchy
• Appraisal of potential intervention packages, namely Do Minimum; City Hierarchy;
Road Space Reallocation and Access Only
The appraisal of the option packages was undertaken against the agreed objectives and against the implementability criteria of technical feasibility and public acceptability. The results of this appraisal indicated that there are benefits with all option packages, however it is considered that the benefits of the Do-Minimum package are more limited compared with the others. It is considered that the other packages all go a significant way to realising the aims of the Roads Hierarchy Study, however there are opportunities and risks associated with the higher intervention scenarios that would require to be explored in more detail as proposals are developed. It is recognised that this will not be simple, and a balance must be found between supporting a healthy, active and vibrant high-quality place environment and the needs of people and goods to access principal destinations and other local destinations, whilst implementing interventions according to a new roads hierarchy. Engagement to date however has indicated support for revising the current roads network to lock in the benefits of the AWPR and rail improvements and to facilitate delivery of the CCMP.
The full study report and appendices are available on the Members only section of the Nestrans website and will be published on the Nestrans website on approval.
Discussion
Aberdeen City Council as relevant roads authority will have to decide whether to implement changes to the existing roads classification system and the degree of any levels of supporting interventions to be implemented and the sequential and incremental manner this may be done. The North East Roads Hierarchy Study however provides a comprehensive evidence base for making these decisions and was reported to the City Growth and Resources Committee on 6
Page 116
4c Roads Hierarchy Study.docx 3
June 2019 along with the findings of the Strategic Car Parking Review that was previously commissioned by the Council and a draft Sustainable Urban Mobility Plan (SUMP) that Council officers have prepared. The Committee was asked to implement a revised roads hierarchy in a sequential and incremental manner based on the findings of the roads hierarchy study and encompassing:
• Formal reclassification of the urban road network
• Changes to road signage and junction improvements to reinforce the hierarchy
• The development of improvements to primary and secondary corridors to achieve a
more efficient movement of people and goods, with an emphasis on measures that
prioritise those walking, cycling and using public transport
The above recommendations were all agreed. The Committee also agreed to note the findings of the Strategic Car Parking Review and to develop a draft Car Parking Strategy to be reported back in summer 2020 and to proceed with public and stakeholder consultation on the draft SUMP before reporting back with a finalised SUMP in November 2019 and to consider the outcomes of these studies within future years’ budget setting processes.
Next Steps
A sum of £50,000 has been approved within the Nestrans 2019/20 Strategic Investment Programme to undertake further work on Roads Hierarchy and is likely to involve development of priority elements agreed by Aberdeen City Council for delivery in 2019/20. Should the delay in draw down from 2018/19 as proposed in the 7b Unaudited Annual Accounts for 2018/19 report and virement within the 7c 2019/20 Budget Matters report both be approved then this would increase the available budget to £86,737. Beyond the road reclassification, it is envisaged that delivery of a revised roads hierarchy will involve the following steps in a sequential and incremental manner:
• Changes to road signage to reflect recommended routes;
• Junction alterations to reinforce the hierarchy and afford priority to priority routes over other routes, and secondary routes over local routes (eg changing traffic signal timings on Anderson Drive to prioritise east-west movements over previous strategic north-south movements that are now catered for by the AWPR);
• In-depth appraisals, on a prioritised basis, of primary and secondary corridors to identify supporting interventions to reinforce the hierarchy, with an emphasis on measures to prioritise those walking, cycling and using public transport and taking account of previous and ongoing work undertaken in relation to each corridor, including the Locking in the Benefits of the AWPR report; and
• Traffic management interventions on local routes (such as road narrowings, speed limit changes, prohibited movements and traffic calming) within the city centre and zonal neighbourhoods to protect those areas where through-traffic is no longer desirable.
Agreement on, and incremental movements towards, a revised hierarchy will dictate future priorities for Aberdeen City Council’s various transport teams and inform future iterations of regional and local transport strategies and plans, including maintenance and asset management plans.
Recommendations
The Board is recommended to:
1. Note the findings of the North East Roads Hierarchy Study; and
2. Agree that the full study report and appendices be published on the Nestrans website.
JA 10 June 2019
Page 117

This page is intentionally left blank
Page 118

North East Scotland Roads Hierarchy Study Project number: 60583665
Prepared for: Nestrans and Aberdeen City Council AECOM
Executive Summary
IntroductionAberdeen City Council (ACC), along with Nestrans, Aberdeenshire Council and the Strategic DevelopmentPlanning Authority (SDPA), as regional partners, wish to take advantage of the current investment in transportinfrastructure (road and rail) in the City Region to facilitate the implementation of the City Centre Masterplan’s(CCMP’s) aim of creating a vibrant city centre with an environment that encourages visits to and lengthens staysin the city centre and to lock-in the benefits of this investment for the whole city.
The partners are seeking to update the city’s roads hierarchy to provide a system that reflects the new role of thecity centre (as a destination) and makes the most effective use of the Aberdeen Western Peripheral Route (AWPR)for distributing traffic around the city to the most appropriate radial route to reduce the extent of cross-city trafficmovements.
AECOM was commissioned by Nestrans and ACC in summer 2018 to develop options for this updated roadshierarchy and to identify possible levels of intervention that could be implemented to support the delivery of theupdated hierarchy.
The two key outcomes to be delivered as part of the work were:
· Development of roads hierarchy options to deliver a new roads hierarchy; and
· Identification of intervention levels to support that new roads hierarchy.
The initial focus was to set a newproposed roads hierarchythrough the undertaking of anumber of tasks. These tasksultimately provided anunderstanding of routes in thestudy area and allowed for theidentification of the mostappropriate routes for carryingtraffic across the city. Onceoptions for the updated roadshierarchy had been developed,intervention levels could then beconsidered which were designedto support use of the new roadshierarchy, encouragingappropriate use of roads in thestudy area according to theirproposed new classification i.e.use of priority routes for cross-city traffic movements wherepossible and use of local roadsfor localised trips only.
The study area for the RoadsHierarchy Study is bounded bythe Charleston to Blackdogsection of the AWPR. In the citycentre, the study adopted theCCMP boundary as its focus.
The Roads Hierarchy Study hasbeen undertaken between July2018 and April 2019.
Figure 1: Roads Hierarchy Study Area
Page 119
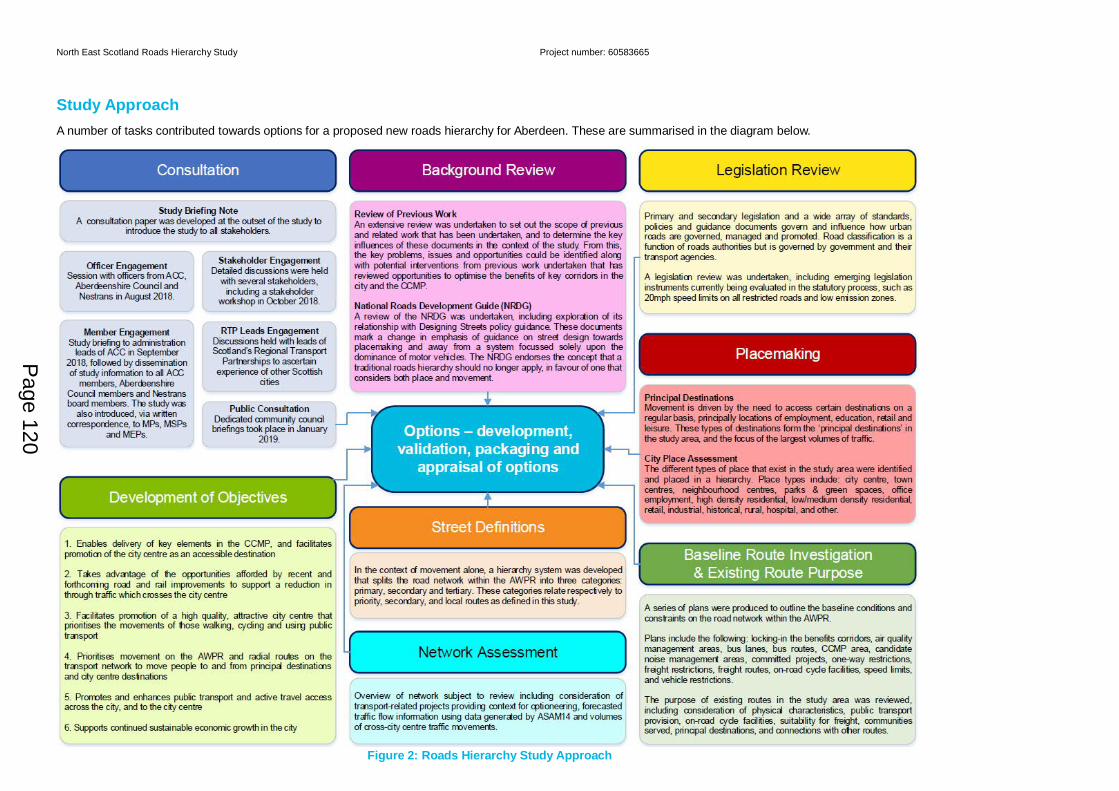
North East Scotland Roads Hierarchy Study Project number: 60583665
Prepared for: Nestrans and Aberdeen City Council AECOM
Study ApproachA number of tasks contributed towards options for a proposed new roads hierarchy for Aberdeen. These are summarised in the diagram below.
Figure 2: Roads Hierarchy Study Approach
Page 120
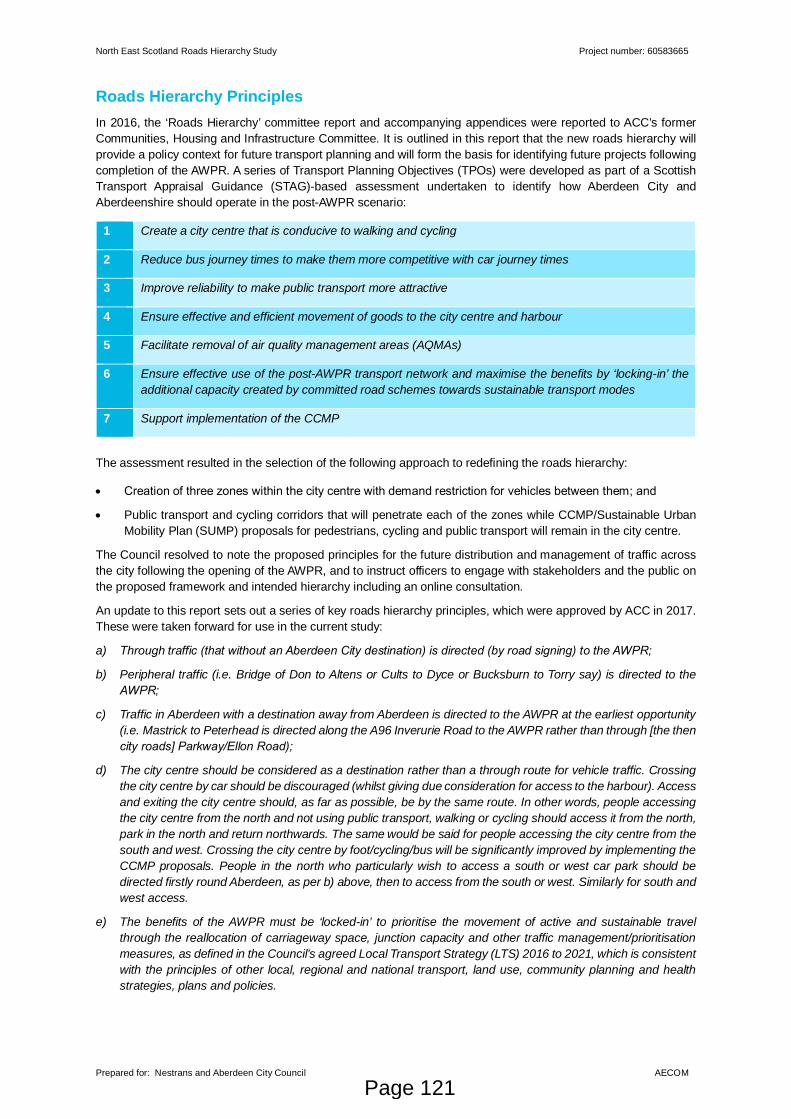
North East Scotland Roads Hierarchy Study Project number: 60583665
Prepared for: Nestrans and Aberdeen City Council AECOM
Roads Hierarchy PrinciplesIn 2016, the ‘Roads Hierarchy’ committee report and accompanying appendices were reported to ACC’s formerCommunities, Housing and Infrastructure Committee. It is outlined in this report that the new roads hierarchy willprovide a policy context for future transport planning and will form the basis for identifying future projects followingcompletion of the AWPR. A series of Transport Planning Objectives (TPOs) were developed as part of a ScottishTransport Appraisal Guidance (STAG)-based assessment undertaken to identify how Aberdeen City andAberdeenshire should operate in the post-AWPR scenario:
1 Create a city centre that is conducive to walking and cycling
2 Reduce bus journey times to make them more competitive with car journey times
3 Improve reliability to make public transport more attractive
4 Ensure effective and efficient movement of goods to the city centre and harbour
5 Facilitate removal of air quality management areas (AQMAs)
6 Ensure effective use of the post-AWPR transport network and maximise the benefits by ‘locking-in’ theadditional capacity created by committed road schemes towards sustainable transport modes
7 Support implementation of the CCMP
The assessment resulted in the selection of the following approach to redefining the roads hierarchy:
· Creation of three zones within the city centre with demand restriction for vehicles between them; and
· Public transport and cycling corridors that will penetrate each of the zones while CCMP/Sustainable UrbanMobility Plan (SUMP) proposals for pedestrians, cycling and public transport will remain in the city centre.
The Council resolved to note the proposed principles for the future distribution and management of traffic acrossthe city following the opening of the AWPR, and to instruct officers to engage with stakeholders and the public onthe proposed framework and intended hierarchy including an online consultation.
An update to this report sets out a series of key roads hierarchy principles, which were approved by ACC in 2017.These were taken forward for use in the current study:
a) Through traffic (that without an Aberdeen City destination) is directed (by road signing) to the AWPR;
b) Peripheral traffic (i.e. Bridge of Don to Altens or Cults to Dyce or Bucksburn to Torry say) is directed to theAWPR;
c) Traffic in Aberdeen with a destination away from Aberdeen is directed to the AWPR at the earliest opportunity(i.e. Mastrick to Peterhead is directed along the A96 Inverurie Road to the AWPR rather than through [the thencity roads] Parkway/Ellon Road);
d) The city centre should be considered as a destination rather than a through route for vehicle traffic. Crossingthe city centre by car should be discouraged (whilst giving due consideration for access to the harbour). Accessand exiting the city centre should, as far as possible, be by the same route. In other words, people accessingthe city centre from the north and not using public transport, walking or cycling should access it from the north,park in the north and return northwards. The same would be said for people accessing the city centre from thesouth and west. Crossing the city centre by foot/cycling/bus will be significantly improved by implementing theCCMP proposals. People in the north who particularly wish to access a south or west car park should bedirected firstly round Aberdeen, as per b) above, then to access from the south or west. Similarly for south andwest access.
e) The benefits of the AWPR must be ‘locked-in’ to prioritise the movement of active and sustainable travelthrough the reallocation of carriageway space, junction capacity and other traffic management/prioritisationmeasures, as defined in the Council’s agreed Local Transport Strategy (LTS) 2016 to 2021, which is consistentwith the principles of other local, regional and national transport, land use, community planning and healthstrategies, plans and policies.
Page 121
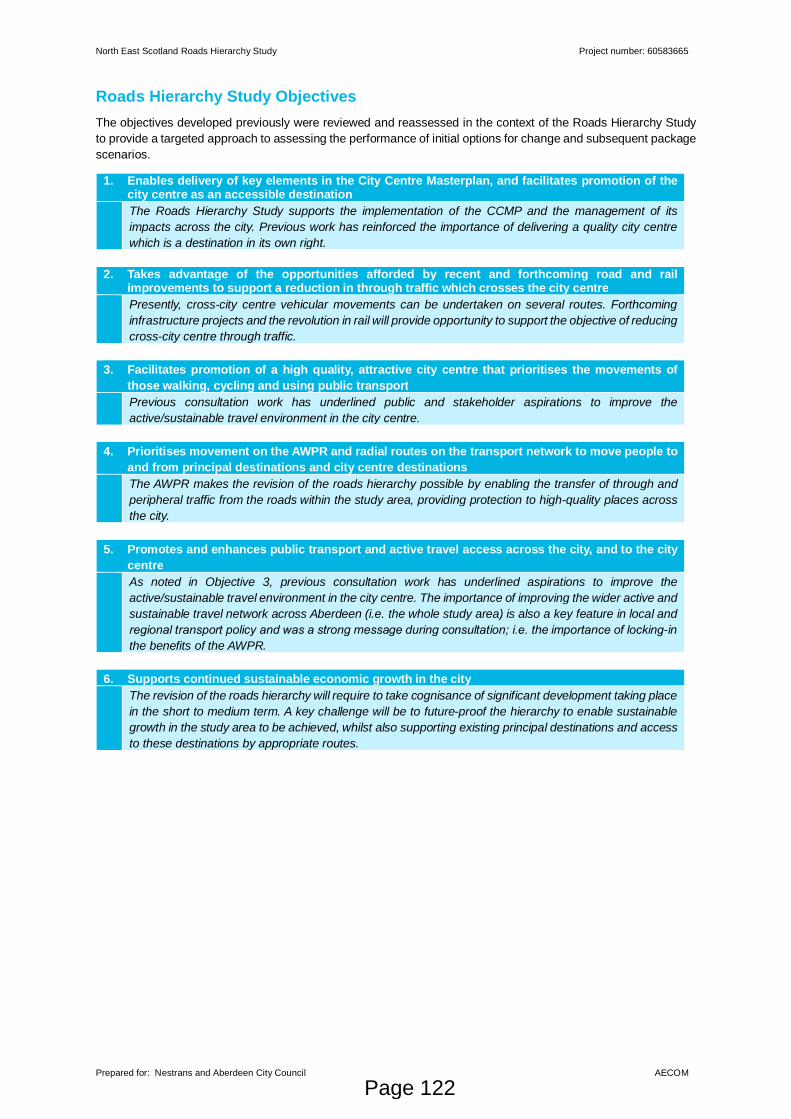
North East Scotland Roads Hierarchy Study Project number: 60583665
Prepared for: Nestrans and Aberdeen City Council AECOM
Roads Hierarchy Study ObjectivesThe objectives developed previously were reviewed and reassessed in the context of the Roads Hierarchy Studyto provide a targeted approach to assessing the performance of initial options for change and subsequent packagescenarios.
1. Enables delivery of key elements in the City Centre Masterplan, and facilitates promotion of thecity centre as an accessible destinationThe Roads Hierarchy Study supports the implementation of the CCMP and the management of itsimpacts across the city. Previous work has reinforced the importance of delivering a quality city centrewhich is a destination in its own right.
2. Takes advantage of the opportunities afforded by recent and forthcoming road and railimprovements to support a reduction in through traffic which crosses the city centrePresently, cross-city centre vehicular movements can be undertaken on several routes. Forthcominginfrastructure projects and the revolution in rail will provide opportunity to support the objective of reducingcross-city centre through traffic.
3. Facilitates promotion of a high quality, attractive city centre that prioritises the movements ofthose walking, cycling and using public transportPrevious consultation work has underlined public and stakeholder aspirations to improve theactive/sustainable travel environment in the city centre.
4. Prioritises movement on the AWPR and radial routes on the transport network to move people toand from principal destinations and city centre destinationsThe AWPR makes the revision of the roads hierarchy possible by enabling the transfer of through andperipheral traffic from the roads within the study area, providing protection to high-quality places acrossthe city.
5. Promotes and enhances public transport and active travel access across the city, and to the citycentreAs noted in Objective 3, previous consultation work has underlined aspirations to improve theactive/sustainable travel environment in the city centre. The importance of improving the wider active andsustainable travel network across Aberdeen (i.e. the whole study area) is also a key feature in local andregional transport policy and was a strong message during consultation; i.e. the importance of locking-inthe benefits of the AWPR.
6. Supports continued sustainable economic growth in the cityThe revision of the roads hierarchy will require to take cognisance of significant development taking placein the short to medium term. A key challenge will be to future-proof the hierarchy to enable sustainablegrowth in the study area to be achieved, whilst also supporting existing principal destinations and accessto these destinations by appropriate routes.
Page 122
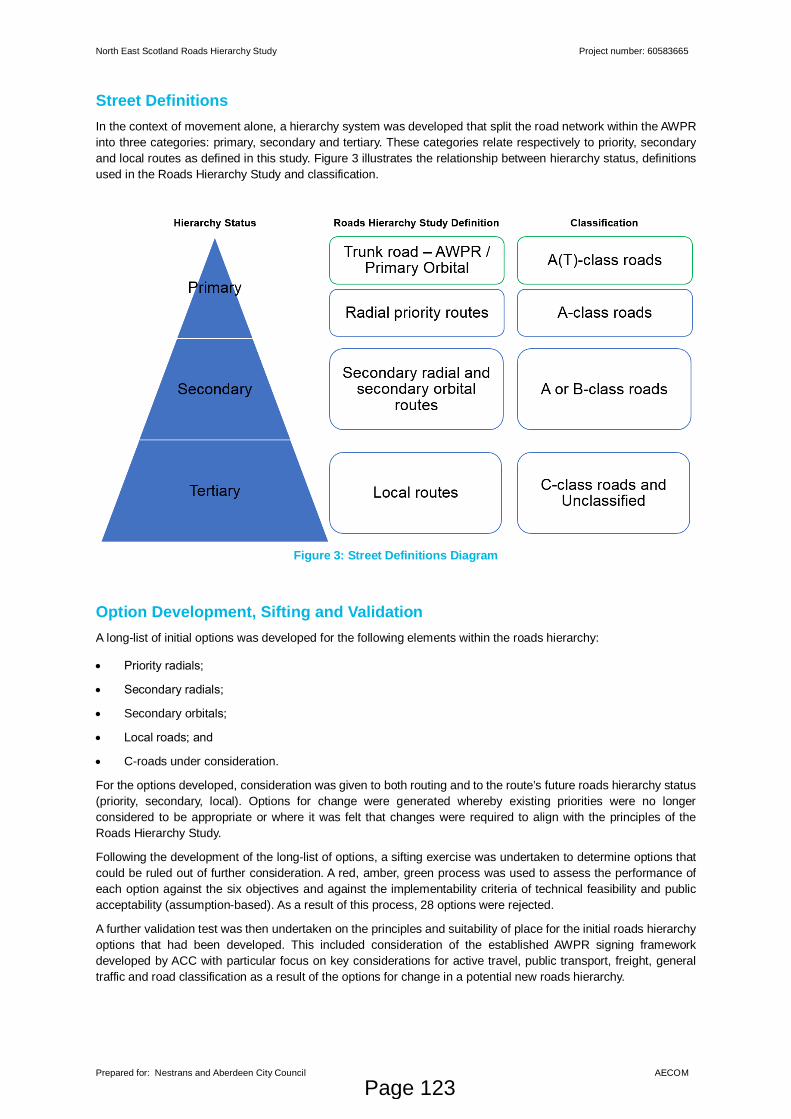
North East Scotland Roads Hierarchy Study Project number: 60583665
Prepared for: Nestrans and Aberdeen City Council AECOM
Street DefinitionsIn the context of movement alone, a hierarchy system was developed that split the road network within the AWPRinto three categories: primary, secondary and tertiary. These categories relate respectively to priority, secondaryand local routes as defined in this study. Figure 3 illustrates the relationship between hierarchy status, definitionsused in the Roads Hierarchy Study and classification.
Figure 3: Street Definitions Diagram
Option Development, Sifting and ValidationA long-list of initial options was developed for the following elements within the roads hierarchy:
· Priority radials;
· Secondary radials;
· Secondary orbitals;
· Local roads; and
· C-roads under consideration.
For the options developed, consideration was given to both routing and to the route’s future roads hierarchy status(priority, secondary, local). Options for change were generated whereby existing priorities were no longerconsidered to be appropriate or where it was felt that changes were required to align with the principles of theRoads Hierarchy Study.
Following the development of the long-list of options, a sifting exercise was undertaken to determine options thatcould be ruled out of further consideration. A red, amber, green process was used to assess the performance ofeach option against the six objectives and against the implementability criteria of technical feasibility and publicacceptability (assumption-based). As a result of this process, 28 options were rejected.
A further validation test was then undertaken on the principles and suitability of place for the initial roads hierarchyoptions that had been developed. This included consideration of the established AWPR signing frameworkdeveloped by ACC with particular focus on key considerations for active travel, public transport, freight, generaltraffic and road classification as a result of the options for change in a potential new roads hierarchy.
Page 123
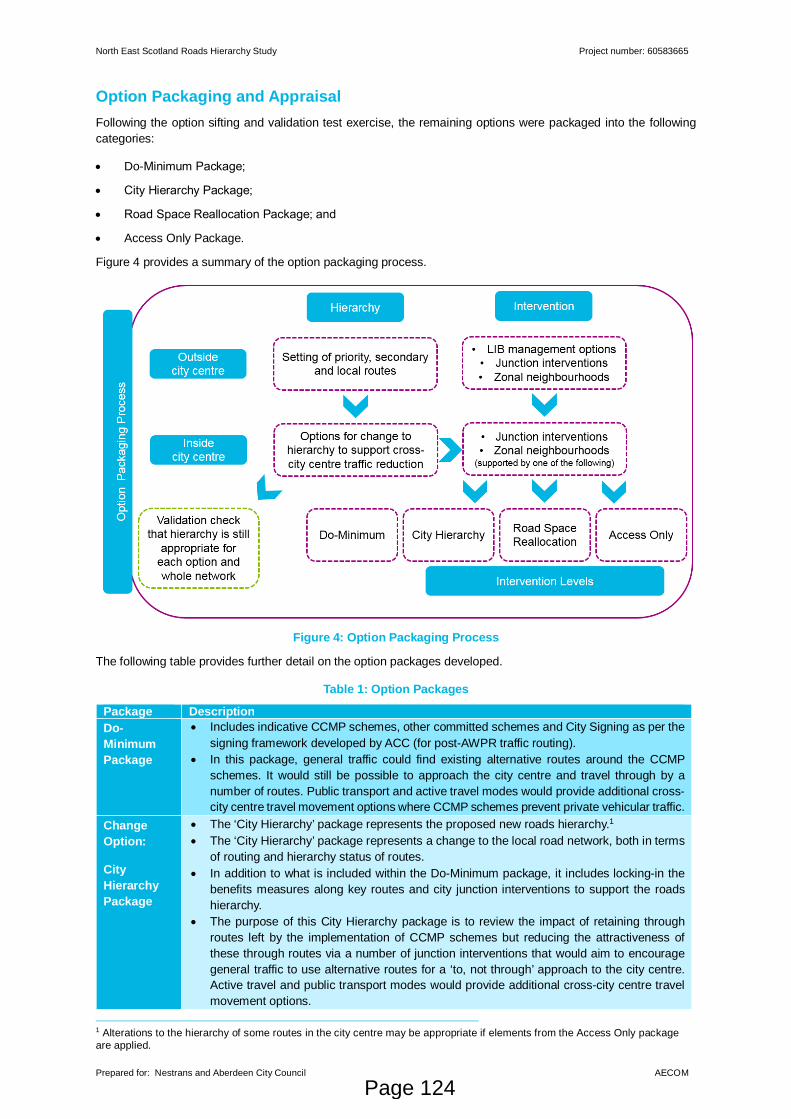
North East Scotland Roads Hierarchy Study Project number: 60583665
Prepared for: Nestrans and Aberdeen City Council AECOM
Option Packaging and AppraisalFollowing the option sifting and validation test exercise, the remaining options were packaged into the followingcategories:
· Do-Minimum Package;
· City Hierarchy Package;
· Road Space Reallocation Package; and
· Access Only Package.
Figure 4 provides a summary of the option packaging process.
Figure 4: Option Packaging Process
The following table provides further detail on the option packages developed.
Table 1: Option Packages
Package DescriptionDo-MinimumPackage
· Includes indicative CCMP schemes, other committed schemes and City Signing as per thesigning framework developed by ACC (for post-AWPR traffic routing).
· In this package, general traffic could find existing alternative routes around the CCMPschemes. It would still be possible to approach the city centre and travel through by anumber of routes. Public transport and active travel modes would provide additional cross-city centre travel movement options where CCMP schemes prevent private vehicular traffic.
ChangeOption:
CityHierarchyPackage
· The ‘City Hierarchy’ package represents the proposed new roads hierarchy.1
· The ‘City Hierarchy’ package represents a change to the local road network, both in termsof routing and hierarchy status of routes.
· In addition to what is included within the Do-Minimum package, it includes locking-in thebenefits measures along key routes and city junction interventions to support the roadshierarchy.
· The purpose of this City Hierarchy package is to review the impact of retaining throughroutes left by the implementation of CCMP schemes but reducing the attractiveness ofthese through routes via a number of junction interventions that would aim to encouragegeneral traffic to use alternative routes for a ‘to, not through’ approach to the city centre.Active travel and public transport modes would provide additional cross-city centre travelmovement options.
1 Alterations to the hierarchy of some routes in the city centre may be appropriate if elements from the Access Only packageare applied.
Page 124
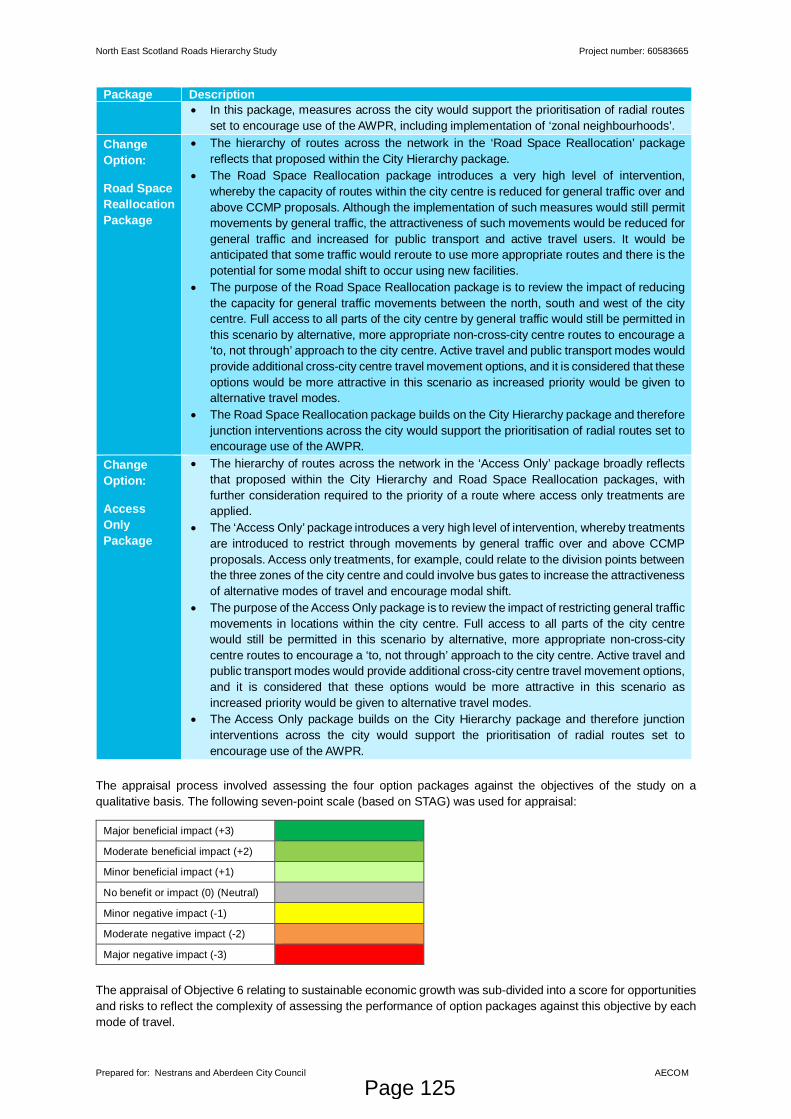
North East Scotland Roads Hierarchy Study Project number: 60583665
Prepared for: Nestrans and Aberdeen City Council AECOM
Package Description· In this package, measures across the city would support the prioritisation of radial routes
set to encourage use of the AWPR, including implementation of ‘zonal neighbourhoods’.ChangeOption:
Road SpaceReallocationPackage
· The hierarchy of routes across the network in the ‘Road Space Reallocation’ packagereflects that proposed within the City Hierarchy package.
· The Road Space Reallocation package introduces a very high level of intervention,whereby the capacity of routes within the city centre is reduced for general traffic over andabove CCMP proposals. Although the implementation of such measures would still permitmovements by general traffic, the attractiveness of such movements would be reduced forgeneral traffic and increased for public transport and active travel users. It would beanticipated that some traffic would reroute to use more appropriate routes and there is thepotential for some modal shift to occur using new facilities.
· The purpose of the Road Space Reallocation package is to review the impact of reducingthe capacity for general traffic movements between the north, south and west of the citycentre. Full access to all parts of the city centre by general traffic would still be permitted inthis scenario by alternative, more appropriate non-cross-city centre routes to encourage a‘to, not through’ approach to the city centre. Active travel and public transport modes wouldprovide additional cross-city centre travel movement options, and it is considered that theseoptions would be more attractive in this scenario as increased priority would be given toalternative travel modes.
· The Road Space Reallocation package builds on the City Hierarchy package and thereforejunction interventions across the city would support the prioritisation of radial routes set toencourage use of the AWPR.
ChangeOption:
AccessOnlyPackage
· The hierarchy of routes across the network in the ‘Access Only’ package broadly reflectsthat proposed within the City Hierarchy and Road Space Reallocation packages, withfurther consideration required to the priority of a route where access only treatments areapplied.
· The ‘Access Only’ package introduces a very high level of intervention, whereby treatmentsare introduced to restrict through movements by general traffic over and above CCMPproposals. Access only treatments, for example, could relate to the division points betweenthe three zones of the city centre and could involve bus gates to increase the attractivenessof alternative modes of travel and encourage modal shift.
· The purpose of the Access Only package is to review the impact of restricting general trafficmovements in locations within the city centre. Full access to all parts of the city centrewould still be permitted in this scenario by alternative, more appropriate non-cross-citycentre routes to encourage a ‘to, not through’ approach to the city centre. Active travel andpublic transport modes would provide additional cross-city centre travel movement options,and it is considered that these options would be more attractive in this scenario asincreased priority would be given to alternative travel modes.
· The Access Only package builds on the City Hierarchy package and therefore junctioninterventions across the city would support the prioritisation of radial routes set toencourage use of the AWPR.
The appraisal process involved assessing the four option packages against the objectives of the study on aqualitative basis. The following seven-point scale (based on STAG) was used for appraisal:
Major beneficial impact (+3)
Moderate beneficial impact (+2)
Minor beneficial impact (+1)
No benefit or impact (0) (Neutral)
Minor negative impact (-1)
Moderate negative impact (-2)
Major negative impact (-3)
The appraisal of Objective 6 relating to sustainable economic growth was sub-divided into a score for opportunitiesand risks to reflect the complexity of assessing the performance of option packages against this objective by eachmode of travel.
Page 125
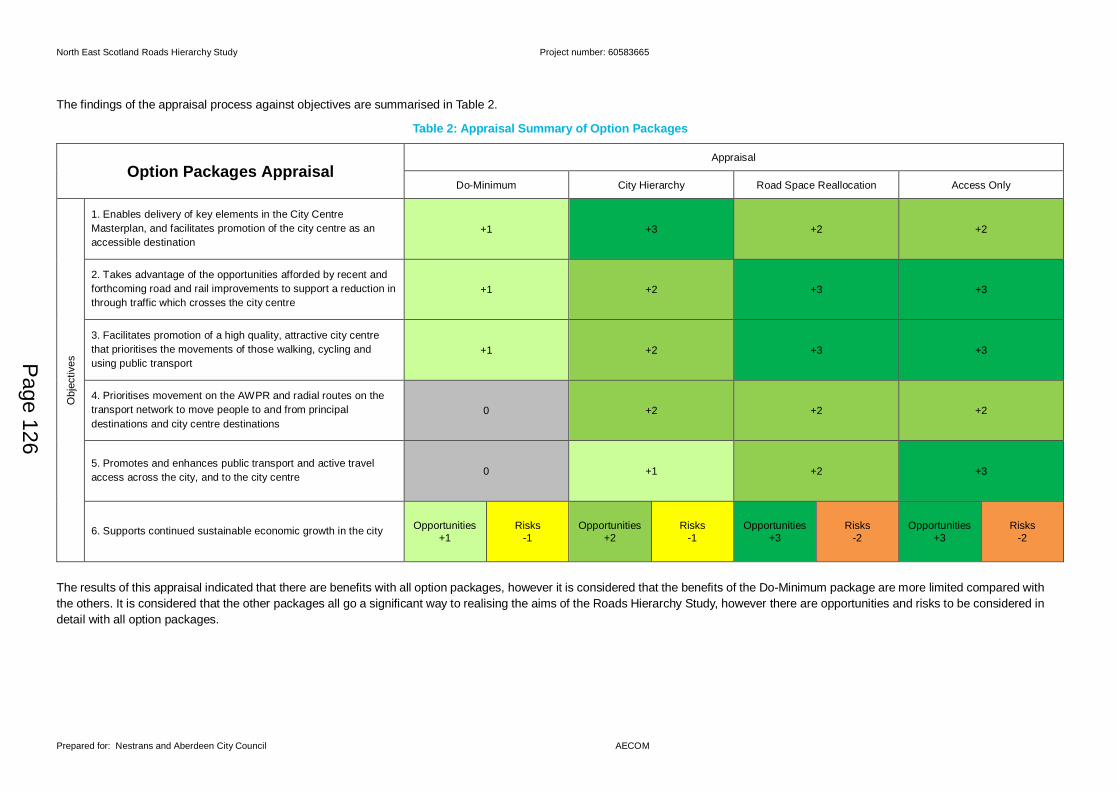
North East Scotland Roads Hierarchy Study Project number: 60583665
Prepared for: Nestrans and Aberdeen City Council AECOM
The findings of the appraisal process against objectives are summarised in Table 2.
Table 2: Appraisal Summary of Option Packages
Option Packages AppraisalAppraisal
Do-Minimum City Hierarchy Road Space Reallocation Access Only
Obj
ectiv
es
1. Enables delivery of key elements in the City CentreMasterplan, and facilitates promotion of the city centre as anaccessible destination
+1 +3 +2 +2
2. Takes advantage of the opportunities afforded by recent andforthcoming road and rail improvements to support a reduction inthrough traffic which crosses the city centre
+1 +2 +3 +3
3. Facilitates promotion of a high quality, attractive city centrethat prioritises the movements of those walking, cycling andusing public transport
+1 +2 +3 +3
4. Prioritises movement on the AWPR and radial routes on thetransport network to move people to and from principaldestinations and city centre destinations
0 +2 +2 +2
5. Promotes and enhances public transport and active travelaccess across the city, and to the city centre 0 +1 +2 +3
6. Supports continued sustainable economic growth in the city Opportunities+1
Risks-1
Opportunities+2
Risks-1
Opportunities+3
Risks-2
Opportunities+3
Risks-2
The results of this appraisal indicated that there are benefits with all option packages, however it is considered that the benefits of the Do-Minimum package are more limited compared withthe others. It is considered that the other packages all go a significant way to realising the aims of the Roads Hierarchy Study, however there are opportunities and risks to be considered indetail with all option packages.
Page 126
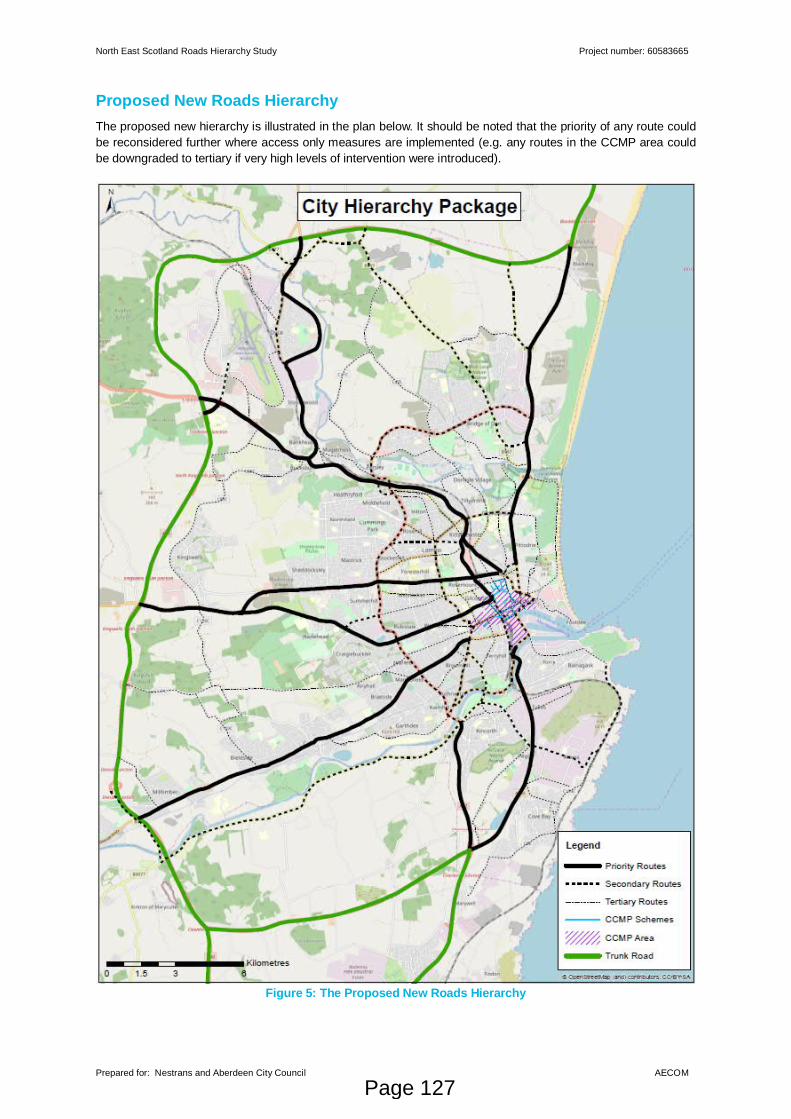
North East Scotland Roads Hierarchy Study Project number: 60583665
Prepared for: Nestrans and Aberdeen City Council AECOM
Proposed New Roads HierarchyThe proposed new hierarchy is illustrated in the plan below. It should be noted that the priority of any route couldbe reconsidered further where access only measures are implemented (e.g. any routes in the CCMP area couldbe downgraded to tertiary if very high levels of intervention were introduced).
Figure 5: The Proposed New Roads Hierarchy
Page 127
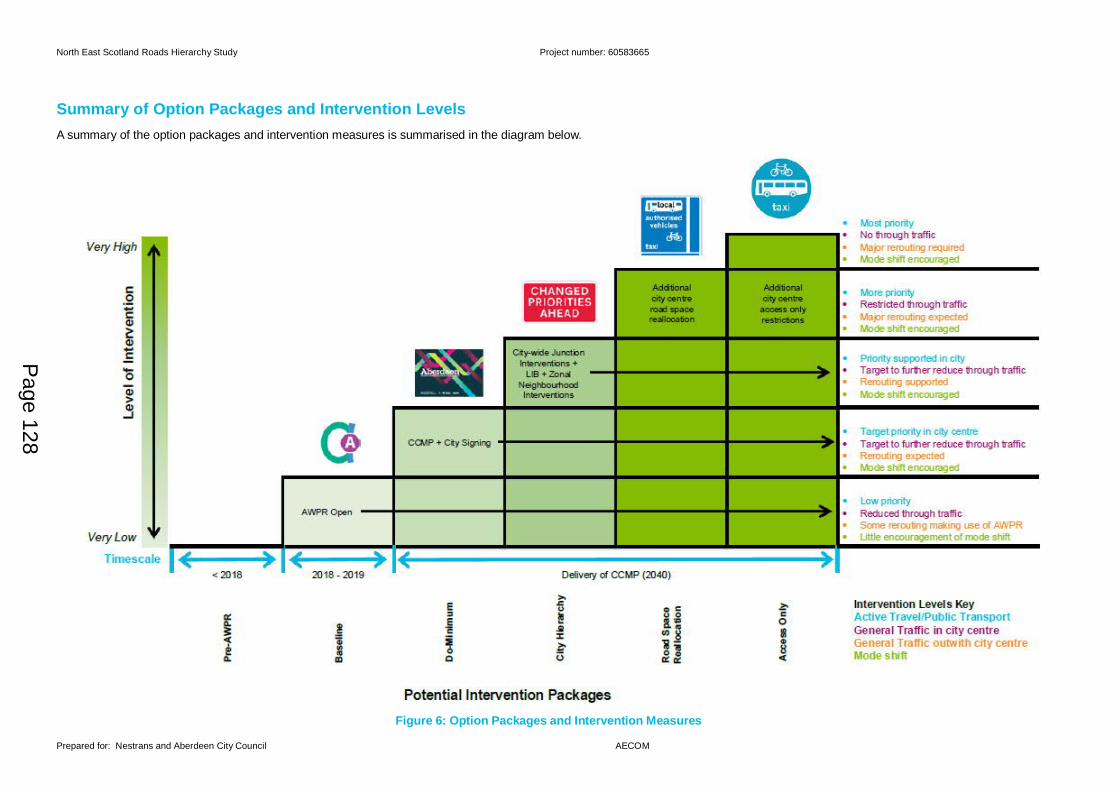
North East Scotland Roads Hierarchy Study Project number: 60583665
Prepared for: Nestrans and Aberdeen City Council AECOM
Summary of Option Packages and Intervention LevelsA summary of the option packages and intervention measures is summarised in the diagram below.
Figure 6: Option Packages and Intervention Measures
Page 128
North East Scotland Roads Hierarchy Study Project number: 60583665
Prepared for: Nestrans and Aberdeen City Council AECOM
Key Outcomes
The Roads Hierarchy Study has:
· Interpreted the ACC principles of a roads hierarchy devised in 2016 and assessed where there is a need fora change of prioritisation of roads inside the AWPR boundary;
· Considered a number of city-wide and additional city centre levels of intervention to promote mode shift andfacilitate use of appropriate routes to support continued sustainable economic growth and delivery of theCCMP.
Detailed and difficult decisions on individual elements within the road network and interventions now need to bemade across the city. It is recognised that this will not be easy, and a balance must be found between supportinga healthy, active and vibrant high-quality place environment and the needs of people and goods to access principaldestinations and other local destinations.
Based on community and stakeholder feedback, the Roads Hierarchy Study has presented a number ofapproaches that could be developed over time, incrementally supporting previous interventions taken forward byACC, Nestrans and partners.
A number of previous risks associated with bringing forward the CCMP have now been mitigated, such as theimplementation of major infrastructure and transport improvements, including the AWPR and rail improvements.Quantification of the impacts of these improvements can now commence and this will help to provide the rationalefor those involved in decision-making.
Page 129

This page is intentionally left blank
Page 130
NORTH EAST SCOTLAND TRANSPORT PARTNERSHIP – 19 June 2019
4d Cross-City Connections
Purpose of Report
The purpose of this report is to present the findings of a report considered by Aberdeen City
Council into the various public transport and active travel options in and around the City.
Background
On 6th June 2019, Aberdeen City Council City Growth and Resources Committee noted the
findings and outcomes of the Cross-City Transport Connections Scottish Transport Appraisal
Guidance (STAG) Part 2 Report and approved the identified Public Transport options and all
the Active Travel options for further development work subject to future funding being identified
to progress these proposals. The committee also agreed that council officers should continue
work to secure external funding to allow the continued development of the agreed schemes.
In 2013, Aberdeen City Council published its Strategic Infrastructure Plan (SIP). This focussed
on the delivery of the Strategic and Local Development Plans and identifies five key
infrastructure goals around housing supply, digital connectivity, skills and labour, transport and
providing a better image for Aberdeen.
In relation to transport, the SIP identifies a new project: Cross City Transport Connections and
states that: “We will carry out a feasibility study and start to investigate ways to maximise
connectivity between new developments arising from the Local Development Plan, including
continuing discussions with Nestrans and Transport Scotland in relation to planning and
funding.”
The Cross-City Transport Connections study is focussed on considering transport connections
between new areas of development (both housing and employment) on the periphery of
Aberdeen, and in areas of Aberdeenshire close to the Aberdeen City boundary, with the aim
of providing viable, attractive and direct linkages, as an alternative to the private car.
Using STAG methodologies, the study considers the most efficient and effective network of
connections between these areas, based on alternative modes of sustainable transport. Key
issues are determining patterns of demand, technical and operational feasibility of alternative
modes, and commercial viability.
o Options for Appraisal
Work undertaken to develop both public transport and active travel options generated 22
public transport options and 38 active travel options.
The economic appraisal considered the active travel routes as part of either an ‘orbital’ or
‘radial’ network linking active travel connections. The orbital network connected the
development sites between Blackdog, Dyce, Kingswells and Countesswells. The radial
network connected Chapelton of Elsick with Loirston and the city centre.
Page 131
Agenda Item 4d
The economic assessment of these highlighted that the orbital network of routes generated
economic benefits under all the scenarios tested. The radial network however, only provided
economic benefits under one of the nine scenarios tested. Given this, the recommendation
would be to explore the development of routes forming the orbital network before development
of the radial network.
In particular, Options which connect Grandhome with Davidson Mills/Stoneywood and
onwards to Dyce, provide a very high level of benefit under all the criteria considered. These
require the implementation of a new bridge over the River Don to directly connect between
the Grandhome and Davidson Mills/Stoneywood sites. These should be explored as a
standalone active travel option (with the new bridge as a foot and cycle bridge only) and also
in tandem with the public transport option (Option E1) which is also recommended for further
consideration and includes the new bridge – in this case the bridge would be a public transport
only link with active travel provision.
o Next Steps
It is recommended that three of the original 22 public transport options are worthy of further
consideration, namely;
Option C1 - Craibstone Park & Ride, Newhills, Kingswells Park & Ride, Countesswells.
Option C2 - Craibstone Park & Ride, Kingswells Park & Ride, Countesswells. These options
provide economic benefits if 10% modal shift from car to bus can be achieved and do not
require any new infrastructure which removes significant financial and construction feasibility
risk. Given the linkages between Park & Ride sites, these provide good integration between
travel modes.
Option E1 – Murcar, Dubford, Grandhome, Stoneywood, Craibstone Park & Ride, Dyce Rail
Station, Newhills, Kingswells Park & Ride, Countesswells, Friarsfield, City Centre, Murcar.
All the active travel routes appraised were deemed worthy of further consideration, but it is
recommended that the routes in the orbital network (those connecting the development sites
between Blackdog, Dyce, Kingswells and Countesswells) be explored before development of
the radial network (connecting Chapelton of Elsick with Loirston and the city centre).
The option connecting Grandhome with Davidson Mills/Stoneywood and onwards to Dyce,
provides a very high level of benefit under all the criteria considered. This option includes the
required implementation of a new bridge over the River Don to directly connect between the
Grandhome and Davidson mills/Stoneywood sites. It was felt that this option should be
explored as a stand-alone active travel option (with the new bridge as a foot and cycle bridge
only) and also in tandem with the public transport option (Option E1 above) which is also
recommended for further consideration and includes the new bridge – in this case the bridge
would be a public transport only link with active travel provision.
Page 132
Recommendations
The Board is recommended to:
1. Note the findings of the Cross-City Connections Report; and
2. Agree that the full study report and appendices be published on the Nestrans website.
JB/10 June 2019
Page 133

This page is intentionally left blank
Page 134
NORTH EAST SCOTLAND TRANSPORT PARTNERSHIP – 19 June 2019
5a Bus Action Plan Update
Purpose of Report
The purpose of this report is to update the Board on the work of the North East Bus Alliance and to present the findings of the recent work to assess the State of the bus Network in Aberdeen and Aberdeenshire.
Background
The North East Bus Alliance was formed in 2018 and is made up of representatives from Nestrans, Aberdeen City Council, Aberdeenshire Council, First in Aberdeen, Stagecoach, Bains Coaches and Passenger Focus. The Bus Alliance Board is Chaired by George Mair. Following its inception, the Bus Alliance Board agreed that one of the first actions to be progressed should be an assessment of the current state of the bus network in the north east. At its meeting on 30th May 2019, the Bus Alliance reviewed the draft State of the Bus Network report and agreed that this should be finalised and reported to the Nestrans Board. The minute of the Bus Alliance Board meeting is provided in item 3a of the Nestrans Board agenda, Director’s Report.
Assessing the State of the Bus Network in Aberdeen City and
Aberdeenshire
The State of the Bus Network report covers a wide range of issues related to the provision of bus services in the north east. It provides a baseline from which progress can be monitored on an annual basis. The key purpose of the report is to assist in identifying areas for action going forward. The full report is provided as Appendix A to this report however in summary, the key problems and issues identified as a result of this work are:
• Network coverage and the challenges faced by local authorities to ensure good access to public transport, particularly for those without access to a car. An innovative way of meeting the transport needs of rural communities needs to be considered but there are also issues within urban areas in terms of network coverage. Rural accessibility is something being considered as part of the development of the next Regional Transport Strategy and by Aberdeenshire Council when undertaking the current review of their supported bus network and there is scope for this to feed into future discussions.
• Access to key employment destinations outwith Aberdeen city centre by bus. A significant proportion of the region’s workforce work in areas outside the city centre which are more difficult to serve by bus. Edge of town and out-of-town locations also tend to have a plentiful supply of free parking which can undermine the viability of scheduled bus services.
• Unreliability of bus journey times. Although in many cases, punctuality (the measure monitored and enforced by the Traffic Commissioner) has improved, this has
Page 135
Agenda Item 5a
often been at the expense of journey times which have been lengthened to ensure compliance with the worst-case scenario.
• Comparable journey times of bus and car. Limited and/or fragmented bus priority means that journey times by bus have been deteriorating and are often not competitive to travelling by private car.
• Comparable cost of bus and car. The availability of free and cheap parking means that the cost of bus travel is perceived as more expensive than travelling by car as people tend not to take account of costs associated with purchasing and running a car. This comparison is especially true for families or people travelling in groups where the cost of travelling by car can be significantly cheaper than by bus.
• The public bodies in the region have invested significantly in park and ride facilities which are under-utilised. A lack of bus priority on the routes serving the park and ride, relatively low levels of service frequency, a lack of consistency in information, branding and promotion as well as availability of free and cheap parking, all mean that park and ride is not the high quality, attractive option that it should be.
• The quality of the fleet particularly in terms of emissions levels, means that buses are currently significant contributors to air quality problems, particularly in the city centre.
3.1. There are however a number of successes that can be built on:
• Relatively high levels of passenger satisfaction from those people who are using the bus. The challenge is to attract non-bus users. Low levels of satisfaction are recorded with value for money, but when compared to other cities in Scotland, fares in Aberdeen are more comparable than they have been in previous years.
• The partnership approach to the provision of at-stop timetable information has seen significant improvements in the availability and consistency of the information that is provided. There is potential to now look at how we can improve and enhance the information that is provided.
• GrassHOPPER. In a relatively short space of time we have gone from having no multi-operator ticket to smart multi-operator ticketing. This ticketing arrangement can be expanded with further products, additional sales platforms and further promotion.
• Contactless and smart ticketing on buses. Huge advances have been made in relation to cashless ticketing, including upgrade of all ticket machines on buses to be able to accept smartcards and the ability to purchase tickets via apps. There is scope to develop this further with smart ticketing products that will provide passengers with the best fare for their journey through fare-capping, further multi-modal and multi-operator tickets and moving towards booking and payment for whole journey regardless of provider via one app (mobility as a service concept).
Funding One of the key challenges to delivering a high quality, attractive bus network is funding. The role of the bus in the region’s transport network should not be underestimated. The vast majority of public transport trips undertaken in the region are by bus. Although rail has a significant role to play, currently only 1 to 2% of journeys to work are undertaken by rail across the region. Bus operators currently receive some financial support through the Bus Services Operators Grant, a discretionary grant from Transport Scotland that subsidises bus services. Transport
Page 136
Scotland also provide funding periodically through the Green Bus Fund which provides funding to operators to support the purchase of low emission buses. The local authorities subsidise socially necessary non-commercial services / journeys but with limited budgets and strict regulations and competition and state aid rules, the options for expanding the network of subsidised services is restricted. The new Transport (Scotland) Bill may change this somewhat as it looks to make provisions for new policy tools for local transport authorities to operate bus services in their area, however funding will be a key factor in whether this is taken up.
Next Steps
Based on the findings of the State of the Bus Network Report, the Bus Alliance Board agreed to progress to developing a prioritised programme of bus priority and associated infrastructure measures for the region, considering priority corridors and congestion hotspots and use this to source and target funding to benefit bus users. It was also agreed that the Bus Alliance should work to raise, at a national level, the challenges that the north east faces in terms of its bus network and the difference in the level of financial support nationally for bus users compared to other modes such as rail and active travel.
Recommendations
The Board is recommended to:
1. Note the findings of the State of the Bus Network Report; and
2. Note the continuing work and next steps identified by the North East Bus Alliance Group.
KC 6 June 2019
Page 137

This page is intentionally left blank
Page 138
Assessing the State of the Bus Network in Aberdeen and Aberdeenshire Creating a successful bus system to ensure a sustainable and vibrant region
North East Bus Alliance June 2019
Page 139
1
Contents 1. Introduction .................................................................................................................................... 2
2. What has already been achieved ................................................................................................... 5
3. The Current Status of Bus Transport in North East Scotland ....................................................... 6
State of the Network Map ................................................................................................................. 6
Bus operators ..................................................................................................................................... 6
The Network ....................................................................................................................................... 7
Public Transport Accessibility ............................................................................................................ 8
Patronage & Mode Share ................................................................................................................. 10
Journey Times ................................................................................................................................... 12
Performance ..................................................................................................................................... 14
Identified Issues on the Network .................................................................................................... 18
Passenger Satisfaction ..................................................................................................................... 22
Fares & Ticketing .............................................................................................................................. 26
Bus Priority Measures ...................................................................................................................... 32
Park & Ride ....................................................................................................................................... 34
Information Provision ...................................................................................................................... 40
The Bus Fleet .................................................................................................................................... 42
Bus stop infrastructure..................................................................................................................... 45
Interchange and Connections with other Modes............................................................................ 45
4. The Future Without Intervention ................................................................................................ 46
5. Conclusions ................................................................................................................................... 48
6. Appendix A ................................................................................................................................... 50
Page 140
2
1. Introduction
1.1. North East Scotland, covering the areas of Aberdeen and Aberdeenshire, is one of the most prosperous regions in the UK. It is Scotland's third largest City Region and is home to nearly half a million people (around 9% of Scotland’s population).
1.2. Aberdeen has high levels of employment but is a city of contrast, with nine of Aberdeen City’s 283 data zones amongst the most deprived of all Scottish data zones, and 13 data zones in the most deprived of all Scottish data zones in the Access to Services domain. The 22 Aberdeen City data zones in the most deprived 20% have a population of 18,055, accounting for 7.9% of the City’s total population.1
1.3. Conversely, Aberdeenshire is one of five Council areas in Scotland with the ‘most data zones without deprivation’, with only six of Aberdeenshire’s 340 data zones in the 20% overall most deprived zones in Scotland and three in the 15% overall most deprived zones in Scotland. However, Aberdeenshire has 149 (44%) data zones ranked within the 20% most deprived in Scotland for service access. 117,906 of Aberdeenshire’s residents, or 45.3%, live in a geographically deprived area. Fifty-eight of Aberdeenshire’s data zones are in the 5% most deprived areas for access to services, which includes 16.0% of the Shire’s population.2
1.4. The population of the region has seen significant growth in the last decade with a 7% rise between 2007 and 2017 (+11% between 1997 and 2017).
1.5. Car ownership is high with around 80% of households having access to a car. Aberdeenshire has the second highest rate of car ownership in Scotland, with 87% of households having access to at least one vehicle. Car ownership in Aberdeen City has increased from 65% of households in 2005/06 to around 73% in 2017. Despite this, some 27% of households in the City and 13% of households in Aberdeenshire do not have access to a car or van. Over the last 5 years the proportion of households without access to a car in Aberdeen City has remained relatively static at around 27-32%. In Aberdeenshire however, there has been a gradual decrease in the proportion of households without access to a car, from 17% in 2012 down to 9% in 2016, although 2017 suggests a possible reversal of that trend3.
1.6. Bus passenger numbers have been on a downward trend for several decades, a trend that is mirrored not just across Scotland, but across the rest of the UK (with some exceptions, such as London).
1.7. Between 2011/12 and 2015/16, across Scotland, there was a reduction in annual bus patronage of 27million trips. Although the north east has not seen the steepest declines across the country it faces the same challenges as elsewhere. A recent study by KPMG4, commissioned by the Confederation of Passenger Transport (CPT) identified five broad areas that are influencing decisions to travel by bus. These are outlined below and an estimate of their impact illustrated in the graph:
• Socio-demographics: population numbers have increased, especially in major urban areas – increasing the number of potential bus passengers. The population is getting older. Household sizes are falling. More young people are in education or training and
1 Source: Deprivation in Aberdeen City: An Analysis of the Scottish Index of Multiple Deprivation 2016, Aberdeen City Council 2 Source: Scottish Index of Multiple Deprivation 2016, Aberdeenshire Council 3 Source: Transport and Travel in Scotland, 2017 4 Source: https://digitalpublications.parliament.scot/ResearchBriefings/Report/2018/9/3/Transport--Scotland--Bill--Buses#Key-
trends-in-bus-usage-and-costs
Page 141
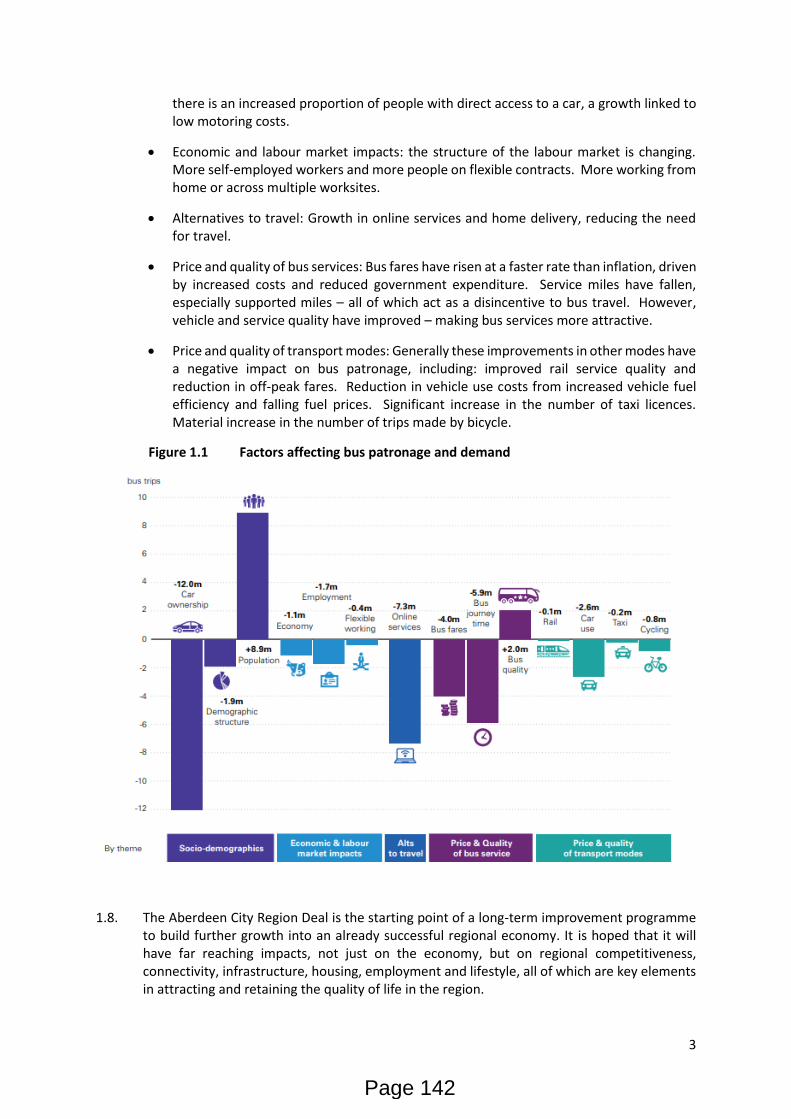
3
there is an increased proportion of people with direct access to a car, a growth linked to low motoring costs.
• Economic and labour market impacts: the structure of the labour market is changing. More self-employed workers and more people on flexible contracts. More working from home or across multiple worksites.
• Alternatives to travel: Growth in online services and home delivery, reducing the need for travel.
• Price and quality of bus services: Bus fares have risen at a faster rate than inflation, driven by increased costs and reduced government expenditure. Service miles have fallen, especially supported miles – all of which act as a disincentive to bus travel. However, vehicle and service quality have improved – making bus services more attractive.
• Price and quality of transport modes: Generally these improvements in other modes have a negative impact on bus patronage, including: improved rail service quality and reduction in off-peak fares. Reduction in vehicle use costs from increased vehicle fuel efficiency and falling fuel prices. Significant increase in the number of taxi licences. Material increase in the number of trips made by bicycle.
Figure 1.1 Factors affecting bus patronage and demand
1.8. The Aberdeen City Region Deal is the starting point of a long-term improvement programme to build further growth into an already successful regional economy. It is hoped that it will have far reaching impacts, not just on the economy, but on regional competitiveness, connectivity, infrastructure, housing, employment and lifestyle, all of which are key elements in attracting and retaining the quality of life in the region.
Page 142
4
1.9. Similarly, the Aberdeen City Centre Masterplan aims to reassert the city centre “as the confident hub of a prosperous and liveable metropolitan city region […] a dramatic reorganisation of roads will have reduced the current dominance of the car in the city centre and empowered residents and visitors to make sustainable travel choices.”
1.10. Within the vision, bus use is central to ensuring that sustainable travel choices can be made. With the current long-term decline of bus patronage both locally and nationally, a conscious effort needs to be made to arrest this decline before growth can be considered. This will require action from all involved in order to ensure a successful and profitable city region in the future.
1.11. A focus on town and city centres needs to be balanced with the needs of ensuring accessibility across the region, recognising the role of public transport in providing lifeline services to communities and access to jobs, education and services.
1.12. Aberdeen City Council, Aberdeenshire Council, First in Aberdeen and Stagecoach Bluebird have been involved in a Quality Partnership for public transport since April 1998. Nestrans, the Regional Transport Partnership for the North East, joined the Quality Partnership in 2007 and a further update to the agreement was signed by all five partners in 2010.
1.13. The focus of this partnership was to increase bus patronage, improve accessibility of services, ensure reliability and punctuality, improve vehicle standards and increase and improve on the quality of bus infrastructure and information provision.
1.14. Recent trends demonstrate the need for more to be done to challenge the dominance of the private car and increase the attractiveness of bus travel.
1.15. In light of this, partners agreed that a new approach was needed and statutory quality partnerships (or potential Bus Service Improvement Partnerships, following the Transport (Scotland) Bill) have been identified as the best framework to allow partners to commit to the necessary improvements in bus services.
1.16. The Bus Alliance Agreement was signed by all partners in August 2018 and the newly formed Board agreed that the first order of business was to develop a ‘state of the network’ report. This report will provide the baseline from which to identify priorities and develop corridor specific action plans to achieve the objectives set out in the Bus Alliance Quality Partnership Agreement.
Page 143
5
2. What has already been achieved
2.1. Since the Quality Partnership Agreement of 2010, a lot has been achieved in the north east. Bus operators have made significant investment in the vehicle fleet, installed new electronic ticket machines, made website and app developments, introduced contactless payment methods and invested in new fuel technologies. Integrated smart ticketing has been introduced in the form of the GrassHOPPER multi-operator ticket. This is accepted by nine operators in Aberdeen and Aberdeenshire and, since 2016, is available as a smartcard.
2.2. The introduction of real time passenger information across Aberdeenshire in 2015 and the subsequent extension across the region along with the upgrade of at-stop screens has ensured comprehensive information on-line and at main bus stops. Partnership working has enabled improvements to information and investment from industry and public sector partners in the Hydrogen bus project has seen the introduction of Europe’s largest fleet of ten hydrogen fuelled buses and a refuelling station at Kittybrewster.
2.3. The local authorities provide revenue support for socially-necessary but not commercially-viable bus services across the region, although these budgets are increasingly under pressure within a period of constrained finance available.
2.4. These investments and improvements, along with major infrastructure projects that have been completed in the region within the last five years, have led to a number of successes, including First in Aberdeen’s Platinum service 19 winning Best Bus Service at the 2014 Scottish Transport Awards and Stagecoach’s JET 727 Airport service winning the same award in both 2011 and 2017. The opening of the Diamond Bridge across the River Don allowed for the re-routeing of the First Bus service 18 with improved running times and reliability. In conjunction with a bus gate at Bedford Road, this allows passengers to travel much faster to Danestone and Dyce than was possible previously and has allowed for a service to connect Stoneywood to Aberdeen city centre (as well as direct connections to two large retail parks) and has since seen patronage growth.
2.5. The completion of the new road alignment at Inveramsay Bridge on the A96, dualling the A90 between Balmedie-Tipperty and opening of the Aberdeen Western Peripheral Route (AWPR) have also resulted in significant improvements to journey times and reliability for all traffic, including buses.
2.6. There has been investment in increasing the capacity of the bus turning circle at the NHS Grampian’s Foresterhill Health Campus and also the construction of a new bus turning circle to improve bus access to Dyce railway station. There has also been significant investment in Park and Ride facilities in recent years, with new facilities at Craibstone, an extension to the Ellon site, a mini-hub at Fyvie and improved bus access into the Kingswells site.
2.7. Whilst progress has been made towards improvements in infrastructure and vehicle stock, bus journey times continue to increase and bus patronage continues to decrease. Bus is not seen as a competitive or attractive alternative to the private car.
Page 144
6
3. The Current Status of Bus Transport in North East Scotland
State of the Network Map
3.1. The sections below are a summary of the information available in the accompanying State of the Network Map.
Part 1: Services & Stops
Part 2: Air Quality, Journey Times & Priority
3.2. This map, in two parts, includes information on all of the routes and services operated, bus stop infrastructure, and journey times. It is intended to be a working document and will be updated on an annual basis to reflect and analyse changes in the north east of Scotland.
3.3. This update will take place in May each year to take account of spring timetable changes.
Bus operators
3.4. There are five operators in North East Scotland running commercial services. These are First Bus, Stagecoach, Bains Coaches, MW Nicoll Coach Hire and Deveron Coaches. In addition, there are also a number of smaller operators who operate services under contract to the local authorities.
3.5. Aberdeen City has two main operators, with First Bus, who are based in Aberdeen, operating the majority of routes in the local authority area.
3.6. Stagecoach operate both in Aberdeen City and Aberdeenshire, trading as Stagecoach North Scotland, Stagecoach East Scotland and Stagecoach Bluebird. Stagecoach operate a number of intercity services, in addition to local services in Aberdeenshire and some Aberdeen City routes.
3.7. Bains Coaches operate primarily in Aberdeenshire, with services also running into Aberdeen City. Bains currently run five services, with one service operating wholly in Aberdeen City.
3.8. MW Nicoll operate in the south of Aberdeenshire and in Angus. They run two services in Aberdeenshire.
3.9. Deveron Coaches operate primarily in Aberdeenshire with three services.
3.10. Table 3.1 below lists all of the operators with services in Aberdeen and Aberdeenshire, including cross border services and operators of supported and commercial local bus services.
Page 145
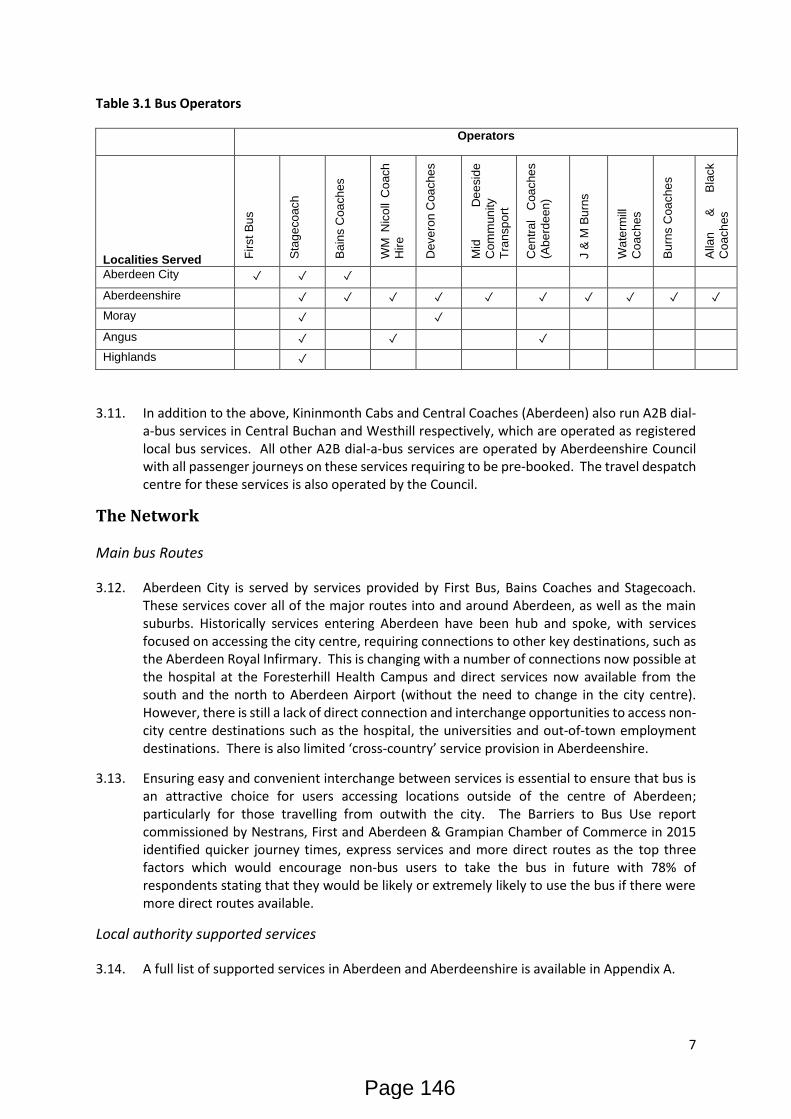
7
Table 3.1 Bus Operators
Operators
Localities Served Fir
st
Bu
s
Sta
ge
co
ach
Ba
ins C
oa
ch
es
WM
Nic
oll
Co
ach
Hir
e
De
ve
ron
Coa
che
s
Mid
D
ee
sid
e
Co
mm
un
ity
Tra
nsp
ort
Ce
ntr
al
Coa
che
s
(Ab
erd
een
)
J &
M B
urn
s
Wa
term
ill
Co
ach
es
Bu
rns C
oa
che
s
Alla
n
&
Bla
ck
Co
ach
es
Aberdeen City ✓ ✓ ✓
Aberdeenshire ✓ ✓ ✓ ✓ ✓ ✓ ✓ ✓ ✓ ✓
Moray ✓ ✓
Angus ✓ ✓ ✓
Highlands ✓
3.11. In addition to the above, Kininmonth Cabs and Central Coaches (Aberdeen) also run A2B dial-a-bus services in Central Buchan and Westhill respectively, which are operated as registered local bus services. All other A2B dial-a-bus services are operated by Aberdeenshire Council with all passenger journeys on these services requiring to be pre-booked. The travel despatch centre for these services is also operated by the Council.
The Network
Main bus Routes
3.12. Aberdeen City is served by services provided by First Bus, Bains Coaches and Stagecoach. These services cover all of the major routes into and around Aberdeen, as well as the main suburbs. Historically services entering Aberdeen have been hub and spoke, with services focused on accessing the city centre, requiring connections to other key destinations, such as the Aberdeen Royal Infirmary. This is changing with a number of connections now possible at the hospital at the Foresterhill Health Campus and direct services now available from the south and the north to Aberdeen Airport (without the need to change in the city centre). However, there is still a lack of direct connection and interchange opportunities to access non-city centre destinations such as the hospital, the universities and out-of-town employment destinations. There is also limited ‘cross-country’ service provision in Aberdeenshire.
3.13. Ensuring easy and convenient interchange between services is essential to ensure that bus is an attractive choice for users accessing locations outside of the centre of Aberdeen; particularly for those travelling from outwith the city. The Barriers to Bus Use report commissioned by Nestrans, First and Aberdeen & Grampian Chamber of Commerce in 2015 identified quicker journey times, express services and more direct routes as the top three factors which would encourage non-bus users to take the bus in future with 78% of respondents stating that they would be likely or extremely likely to use the bus if there were more direct routes available.
Local authority supported services
3.14. A full list of supported services in Aberdeen and Aberdeenshire is available in Appendix A.
Page 146
8
3.15. In Aberdeen, there are seven services that are either partly or completely supported by the local authority, including those accessing Lochside Academy, Kingswells and the Crematorium. In Aberdeenshire subsidy is essential to ensuring that bus services are available for those in rural communities, with 28% of bus kilometres in Aberdeenshire supported in 2017 compared with 20% across Scotland as a whole.
3.16. Of particular note in Aberdeen City, services to Kingswells village currently require local authority support. Without this subsidy, there would be no direct link between Kingswells and Aberdeen, except from the park and ride.
3.17. In Aberdeenshire, many services are either wholly or partially supported with, in 2017, 28% of bus kilometres in Aberdeenshire supported by the Council. Examples of such provision include: the Aberdeen – Tarves/Methlick service; the Inverurie Town service; the majority of journeys between Ballater and Braemar; early morning journeys between Stonehaven and Aberdeen; and, evening and Sunday journeys between Maud/Stuartfield and Peterhead. A full list of Aberdeenshire Council supported services is provided in Appendix A.
3.18. Financially supporting services constitutes a significant ongoing revenue cost to Local Authorities, particularly Aberdeenshire Council which provides an extensive supported network. In 2018/19 Aberdeenshire Council spent £2,873,731 on fixed route supported local bus services whilst Aberdeen City Council spent £542,182. Recent budget revisions have led to reductions in supported service provision with ‘knock-on’ effects to the viability of the commercial bus network A comprehensive review of the Aberdeenshire Council supported bus network is scheduled to be undertaken by May 2020.
Public Transport Accessibility
3.19. The Strategic Transport Appraisal Pre-Appraisal Report carried out by Jacobs used TRACC5 accessibility software to measure the levels of accessibility in the Aberdeen City Region to key employment locations and services by public transport6. TRACC measures the level of accessibility from a set of origins to a destination using all modes of public transport, walking and cycling. Although this covers all modes, the analysis looked at accessibility within a one-hour journey time of 13 key destinations and although rail travel will form part of this, the majority of journeys considered in this analysis will have been by bus and therefore it is relevant to reference it in this report.
3.20. The diagram below is an extract from the Pre-Appraisal report and shows public transport accessibility to 13 key destinations in both Aberdeenshire and Aberdeen City.
5 Transport ACCessibility Software 6 Source: Strategic Transport Appraisal, Pre-Appraisal Report, Jacobs 2018
Page 147
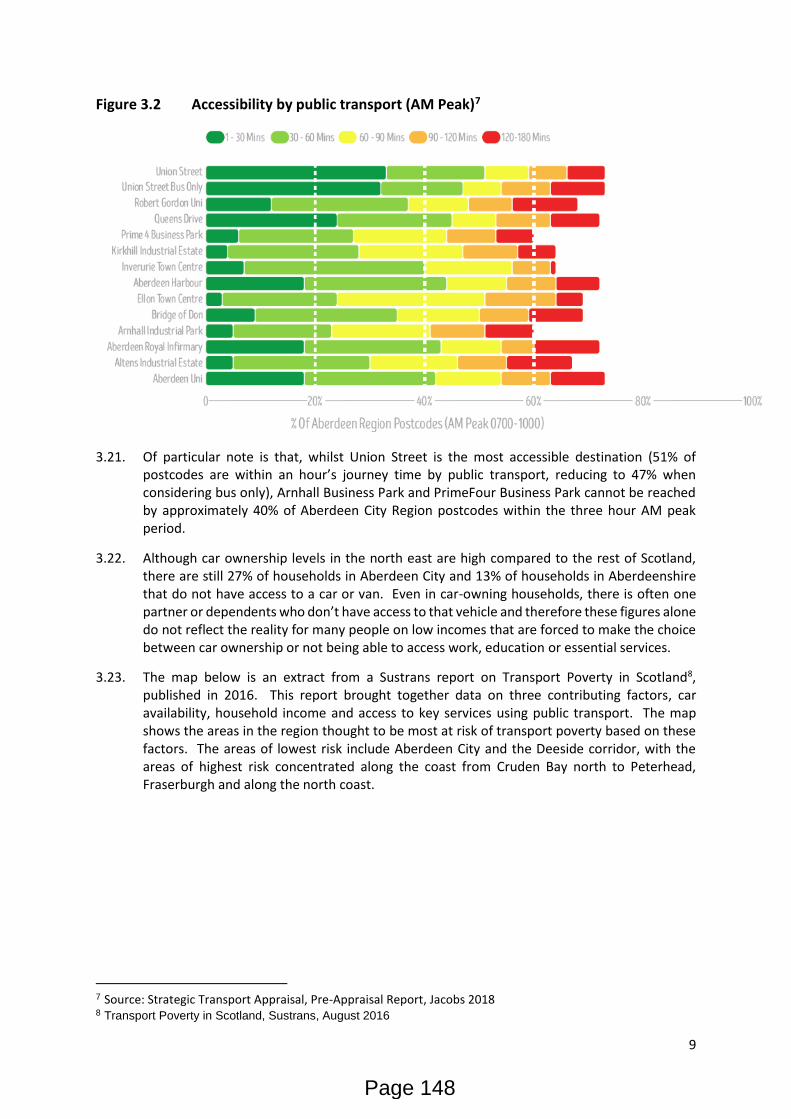
9
Figure 3.2 Accessibility by public transport (AM Peak)7
3.21. Of particular note is that, whilst Union Street is the most accessible destination (51% of postcodes are within an hour’s journey time by public transport, reducing to 47% when considering bus only), Arnhall Business Park and PrimeFour Business Park cannot be reached by approximately 40% of Aberdeen City Region postcodes within the three hour AM peak period.
3.22. Although car ownership levels in the north east are high compared to the rest of Scotland, there are still 27% of households in Aberdeen City and 13% of households in Aberdeenshire that do not have access to a car or van. Even in car-owning households, there is often one partner or dependents who don’t have access to that vehicle and therefore these figures alone do not reflect the reality for many people on low incomes that are forced to make the choice between car ownership or not being able to access work, education or essential services.
3.23. The map below is an extract from a Sustrans report on Transport Poverty in Scotland8, published in 2016. This report brought together data on three contributing factors, car availability, household income and access to key services using public transport. The map shows the areas in the region thought to be most at risk of transport poverty based on these factors. The areas of lowest risk include Aberdeen City and the Deeside corridor, with the areas of highest risk concentrated along the coast from Cruden Bay north to Peterhead, Fraserburgh and along the north coast.
7 Source: Strategic Transport Appraisal, Pre-Appraisal Report, Jacobs 2018 8 Transport Poverty in Scotland, Sustrans, August 2016
Page 148
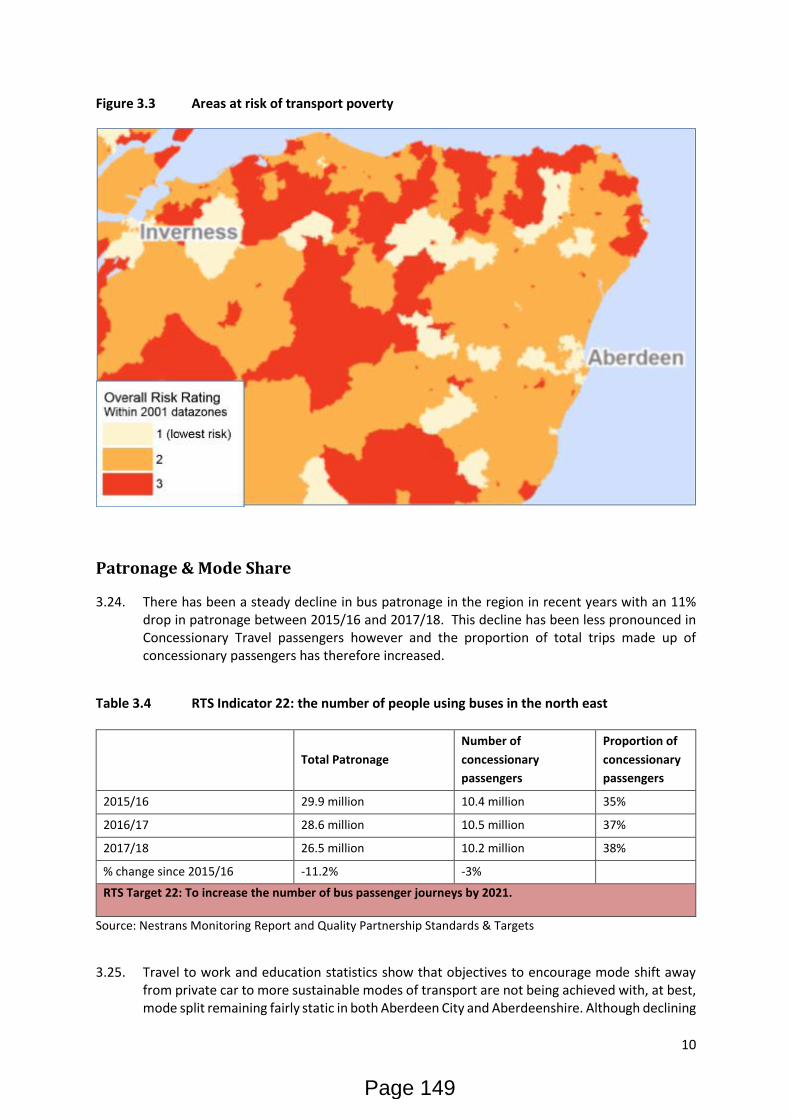
10
Figure 3.3 Areas at risk of transport poverty
Patronage & Mode Share
3.24. There has been a steady decline in bus patronage in the region in recent years with an 11% drop in patronage between 2015/16 and 2017/18. This decline has been less pronounced in Concessionary Travel passengers however and the proportion of total trips made up of concessionary passengers has therefore increased.
Table 3.4 RTS Indicator 22: the number of people using buses in the north east
Total Patronage
Number of
concessionary
passengers
Proportion of
concessionary
passengers
2015/16 29.9 million 10.4 million 35%
2016/17 28.6 million 10.5 million 37%
2017/18 26.5 million 10.2 million 38%
% change since 2015/16 -11.2% -3%
RTS Target 22: To increase the number of bus passenger journeys by 2021.
Source: Nestrans Monitoring Report and Quality Partnership Standards & Targets
3.25. Travel to work and education statistics show that objectives to encourage mode shift away from private car to more sustainable modes of transport are not being achieved with, at best, mode split remaining fairly static in both Aberdeen City and Aberdeenshire. Although declining
Page 149
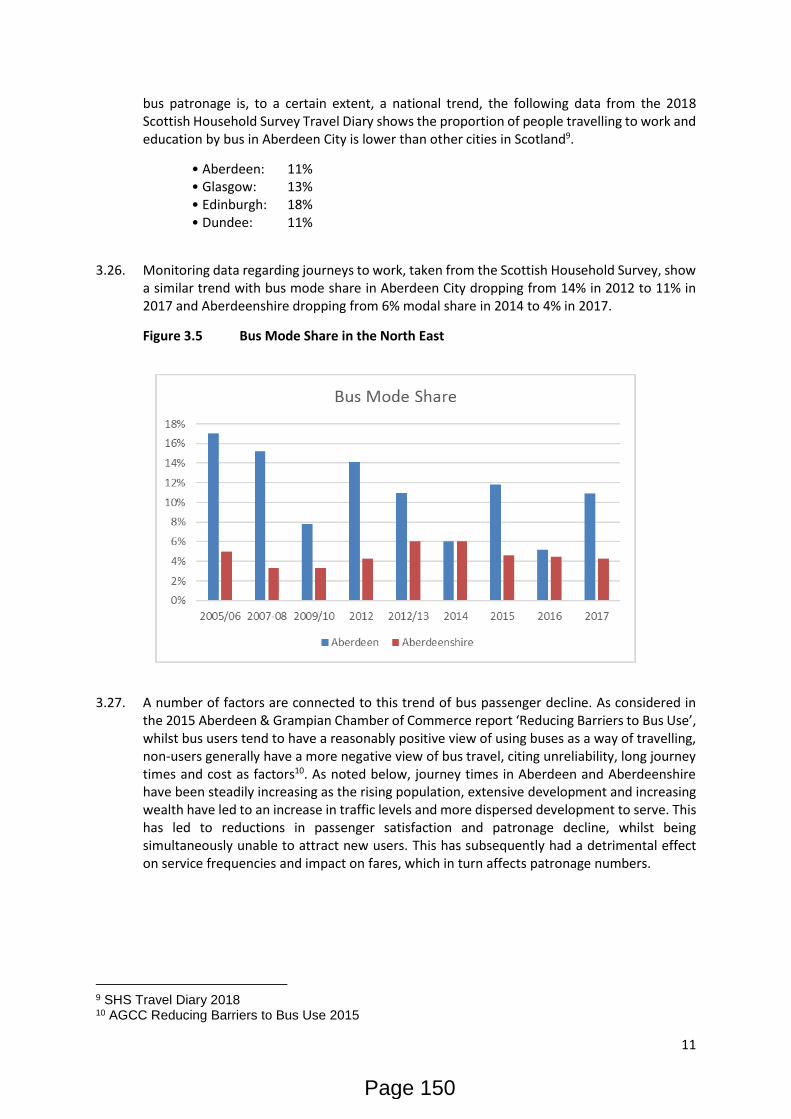
11
bus patronage is, to a certain extent, a national trend, the following data from the 2018 Scottish Household Survey Travel Diary shows the proportion of people travelling to work and education by bus in Aberdeen City is lower than other cities in Scotland9.
• Aberdeen: 11% • Glasgow: 13% • Edinburgh: 18% • Dundee: 11%
3.26. Monitoring data regarding journeys to work, taken from the Scottish Household Survey, show a similar trend with bus mode share in Aberdeen City dropping from 14% in 2012 to 11% in 2017 and Aberdeenshire dropping from 6% modal share in 2014 to 4% in 2017.
Figure 3.5 Bus Mode Share in the North East
3.27. A number of factors are connected to this trend of bus passenger decline. As considered in the 2015 Aberdeen & Grampian Chamber of Commerce report ‘Reducing Barriers to Bus Use’, whilst bus users tend to have a reasonably positive view of using buses as a way of travelling, non-users generally have a more negative view of bus travel, citing unreliability, long journey times and cost as factors10. As noted below, journey times in Aberdeen and Aberdeenshire have been steadily increasing as the rising population, extensive development and increasing wealth have led to an increase in traffic levels and more dispersed development to serve. This has led to reductions in passenger satisfaction and patronage decline, whilst being simultaneously unable to attract new users. This has subsequently had a detrimental effect on service frequencies and impact on fares, which in turn affects patronage numbers.
9 SHS Travel Diary 2018 10 AGCC Reducing Barriers to Bus Use 2015
Page 150
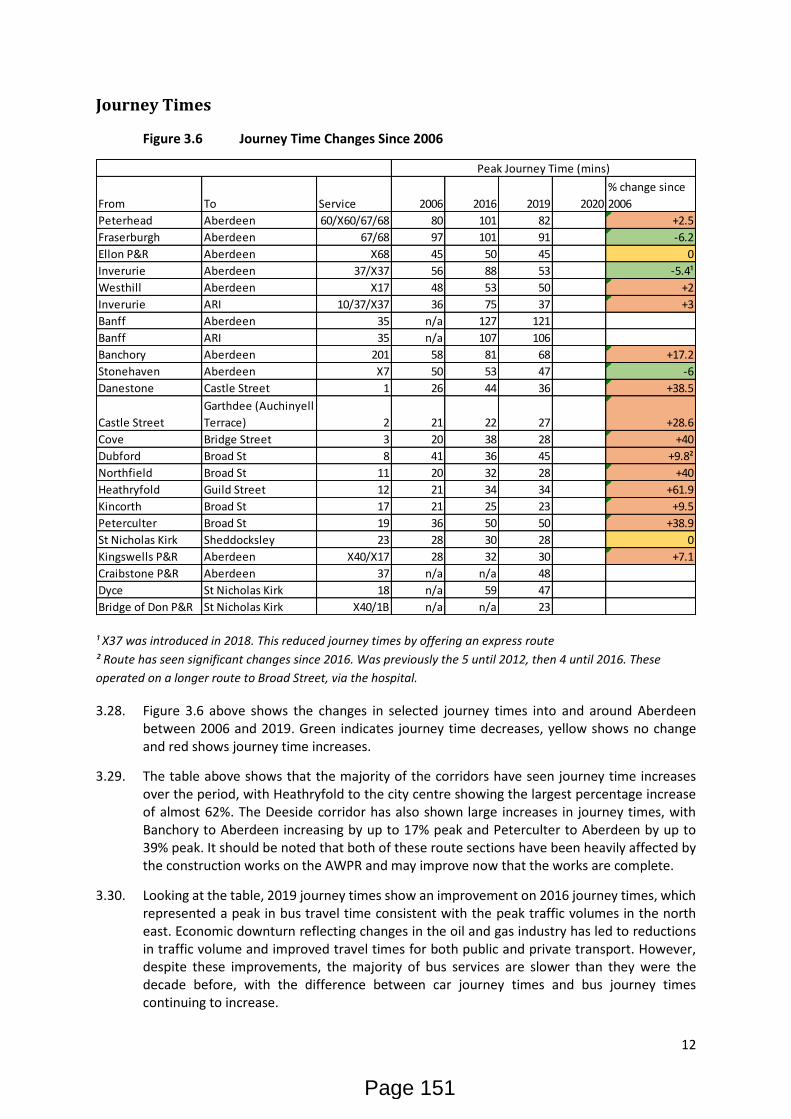
12
Journey Times
Figure 3.6 Journey Time Changes Since 2006
¹ X37 was introduced in 2018. This reduced journey times by offering an express route
² Route has seen significant changes since 2016. Was previously the 5 until 2012, then 4 until 2016. These
operated on a longer route to Broad Street, via the hospital.
3.28. Figure 3.6 above shows the changes in selected journey times into and around Aberdeen between 2006 and 2019. Green indicates journey time decreases, yellow shows no change and red shows journey time increases.
3.29. The table above shows that the majority of the corridors have seen journey time increases over the period, with Heathryfold to the city centre showing the largest percentage increase of almost 62%. The Deeside corridor has also shown large increases in journey times, with Banchory to Aberdeen increasing by up to 17% peak and Peterculter to Aberdeen by up to 39% peak. It should be noted that both of these route sections have been heavily affected by the construction works on the AWPR and may improve now that the works are complete.
3.30. Looking at the table, 2019 journey times show an improvement on 2016 journey times, which represented a peak in bus travel time consistent with the peak traffic volumes in the north east. Economic downturn reflecting changes in the oil and gas industry has led to reductions in traffic volume and improved travel times for both public and private transport. However, despite these improvements, the majority of bus services are slower than they were the decade before, with the difference between car journey times and bus journey times continuing to increase.
From To Service 2006 2016 2019 2020
% change since
2006
Peterhead Aberdeen 60/X60/67/68 80 101 82 +2.5
Fraserburgh Aberdeen 67/68 97 101 91 -6.2
Ellon P&R Aberdeen X68 45 50 45 0
Inverurie Aberdeen 37/X37 56 88 53 -5.4¹
Westhill Aberdeen X17 48 53 50 +2
Inverurie ARI 10/37/X37 36 75 37 +3
Banff Aberdeen 35 n/a 127 121
Banff ARI 35 n/a 107 106
Banchory Aberdeen 201 58 81 68 +17.2
Stonehaven Aberdeen X7 50 53 47 -6
Danestone Castle Street 1 26 44 36 +38.5
Castle Street
Garthdee (Auchinyell
Terrace) 2 21 22 27 +28.6
Cove Bridge Street 3 20 38 28 +40
Dubford Broad St 8 41 36 45 +9.8²
Northfield Broad St 11 20 32 28 +40
Heathryfold Guild Street 12 21 34 34 +61.9
Kincorth Broad St 17 21 25 23 +9.5
Peterculter Broad St 19 36 50 50 +38.9
St Nicholas Kirk Sheddocksley 23 28 30 28 0
Kingswells P&R Aberdeen X40/X17 28 32 30 +7.1
Craibstone P&R Aberdeen 37 n/a n/a 48
Dyce St Nicholas Kirk 18 n/a 59 47
Bridge of Don P&R St Nicholas Kirk X40/1B n/a n/a 23
Peak Journey Time (mins)
Page 151
13
3.31. Congestion has been a longstanding challenge for Aberdeen. There has however been considerable progress in recent years in delivering a range of infrastructure improvements, including the AWPR, Balmedie-Tipperty dualling and a third crossing over the River Don which are seeing considerable improvements in journey times on many routes. The full impacts of these improvements on bus journey times remains to be seen as it will take time for any journey time changes to be reflected within timetables, however there is a considerable opportunity to ‘lock in the benefits’ for sustainable modes, including buses, within the city and this is an opportunity that must be maximised if we are to reverse the trend of increasing journey times which has been seen over recent years.
3.32. Congestion and unpredictability on the road network have a direct impact on bus journey times. Not only do bus operators need to timetable services to account for increasing delays on the network, the unpredictability of delays and the stringent targets set by the Traffic Commissioner for punctuality and reliability has meant bus operators timetabling services to account for the worst-case journey times scenarios. Passengers therefore often find themselves on a stationary bus waiting at bus stops because the service is timetabled to account for the worst-case traffic conditions. This is incredibly frustrating for passengers and does not provide a competitive alternative to travel by private car.
Page 152
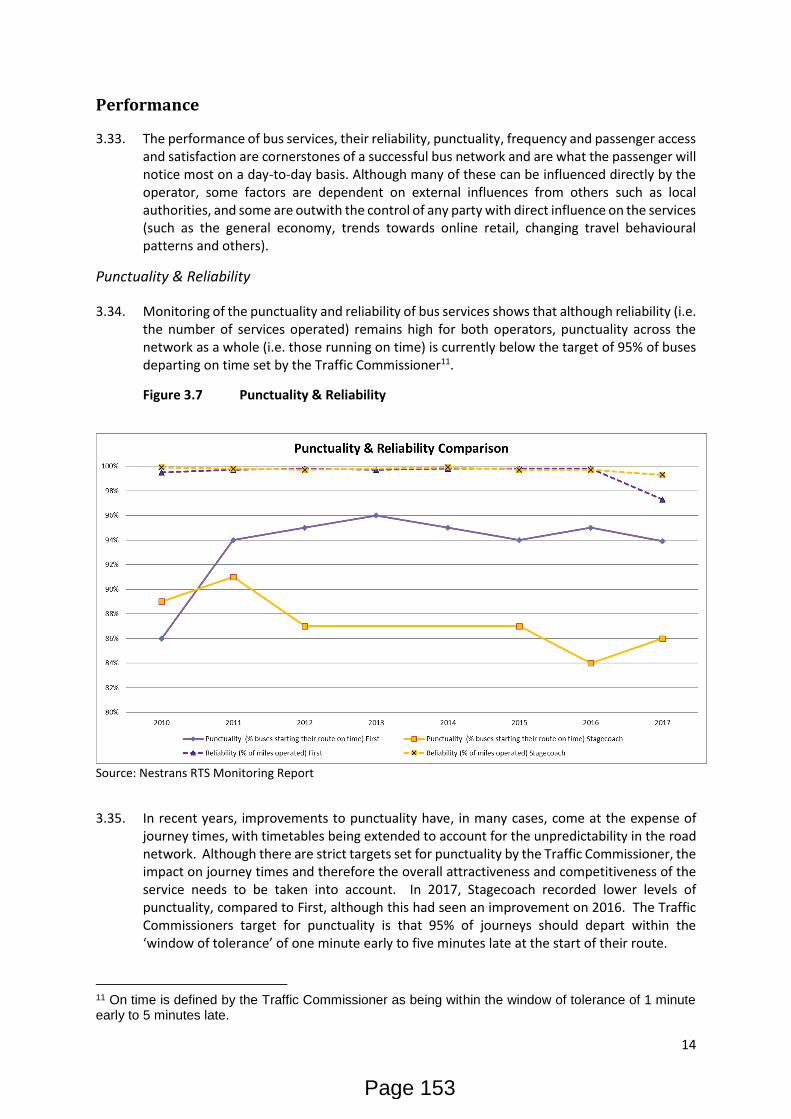
14
Performance
3.33. The performance of bus services, their reliability, punctuality, frequency and passenger access and satisfaction are cornerstones of a successful bus network and are what the passenger will notice most on a day-to-day basis. Although many of these can be influenced directly by the operator, some factors are dependent on external influences from others such as local authorities, and some are outwith the control of any party with direct influence on the services (such as the general economy, trends towards online retail, changing travel behavioural patterns and others).
Punctuality & Reliability
3.34. Monitoring of the punctuality and reliability of bus services shows that although reliability (i.e. the number of services operated) remains high for both operators, punctuality across the network as a whole (i.e. those running on time) is currently below the target of 95% of buses departing on time set by the Traffic Commissioner11.
Figure 3.7 Punctuality & Reliability
Source: Nestrans RTS Monitoring Report
3.35. In recent years, improvements to punctuality have, in many cases, come at the expense of journey times, with timetables being extended to account for the unpredictability in the road network. Although there are strict targets set for punctuality by the Traffic Commissioner, the impact on journey times and therefore the overall attractiveness and competitiveness of the service needs to be taken into account. In 2017, Stagecoach recorded lower levels of punctuality, compared to First, although this had seen an improvement on 2016. The Traffic Commissioners target for punctuality is that 95% of journeys should depart within the ‘window of tolerance’ of one minute early to five minutes late at the start of their route.
11 On time is defined by the Traffic Commissioner as being within the window of tolerance of 1 minute early to 5 minutes late.
Page 153

15
Congestion and network hotspots
3.36. First now gather near real time data on ticketing information at every bus stop for every trip; arrival time, departure time and dwell time at every bus stop for every trip; and digitised schedule information. Using this data they have commissioned work to look at the areas of their network that suffer most from delay and the sections of route where the greatest number of passengers are affected by congestion. This information can be used to help target priority areas for network improvements.
3.37. Figures 3.9 and 3.10 below give examples of the outputs that can be created using this information. It is intended that this information can be interrogated in more detail at an individual corridor level.
3.38. In summary however, the key areas of delay which affect the most passengers are identified by First Bus as a result of this analysis are:
1) Castle Street to Mealmarket Street 2) St Nicholas Kirk to Adelphi 3) Nellfield Place to Great Southern Road 4) Mealmarket Street to Castle Street 5) Langstane Kirk to Holburn Junction 6) Springhill Road to Rousay Drive 7) Holburn Junction to Nellfield Place 8) Nelfield Place to Broomhill Road 9) Hammerfield Avenue to Newlands Crescent 10) School Road to Regent Walk
3.39. Stagecoach have indicated that journey time variability information can be provided to identify areas with the highest variability between peak and off-peak flows on the Stagecoach network. This is a larger exercise however and will be fed into corridor specific analysis. The following table examples of journey time reliability on the Stagecoach network
Table 3.8 Journey time variability on selected Stagecoach services
Service Route Off-peak journey time
(minutes)
Peak Journey time (minutes)
Difference off-peak to peak
(minutes)
37 Inverurie to Aberdeen 69 87 +18
201 Culter to Aberdeen 37 47 +10
7 Portlethen to Aberdeen 25 45 +20
Page 154
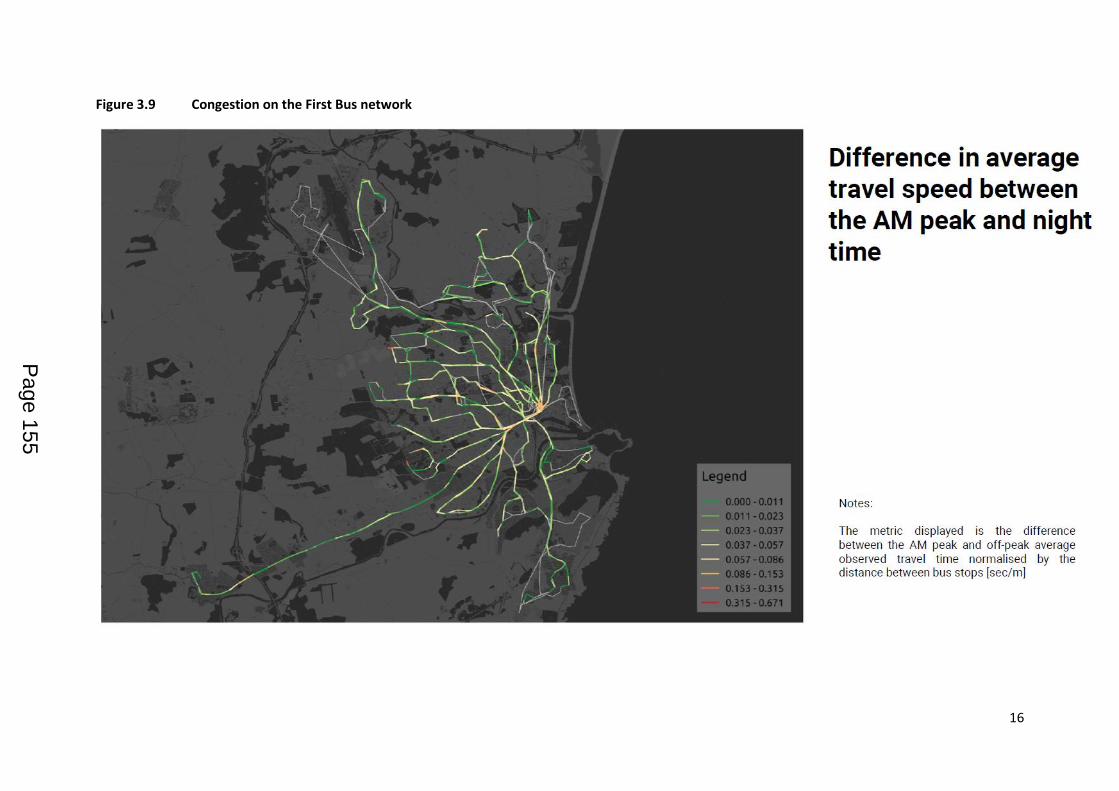
16
Figure 3.9 Congestion on the First Bus network
Page 155
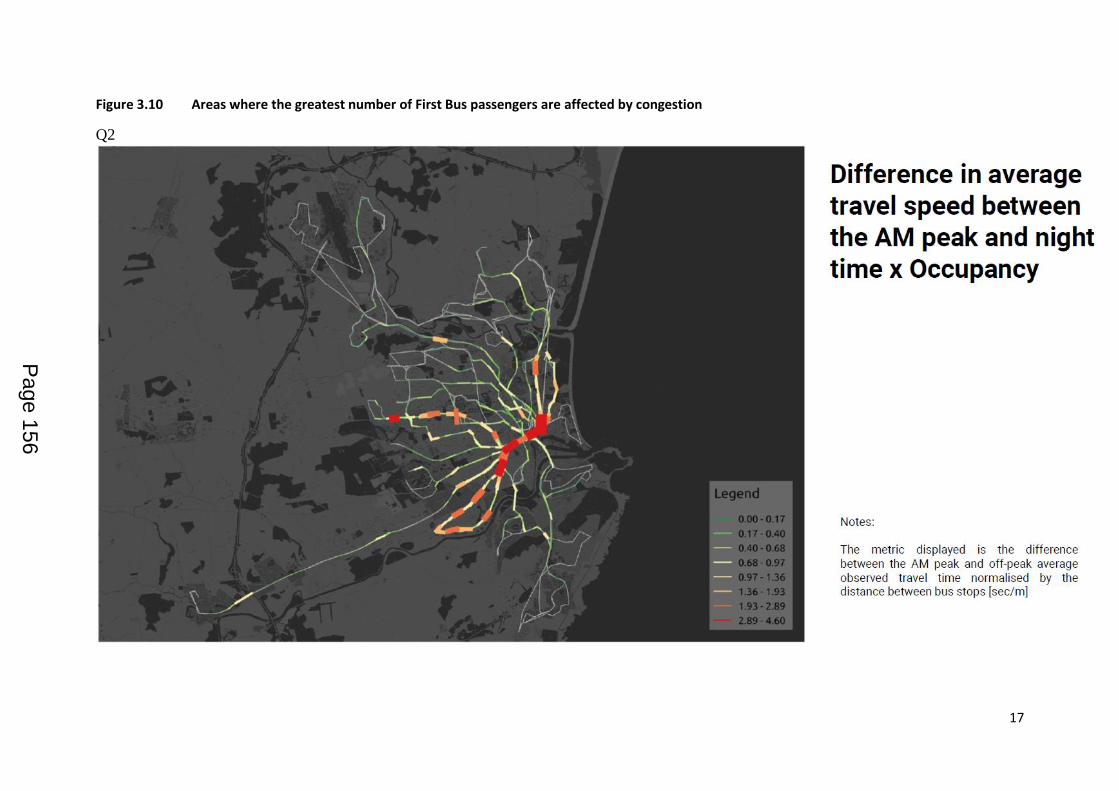
17
Figure 3.10 Areas where the greatest number of First Bus passengers are affected by congestion
Q2
Page 156
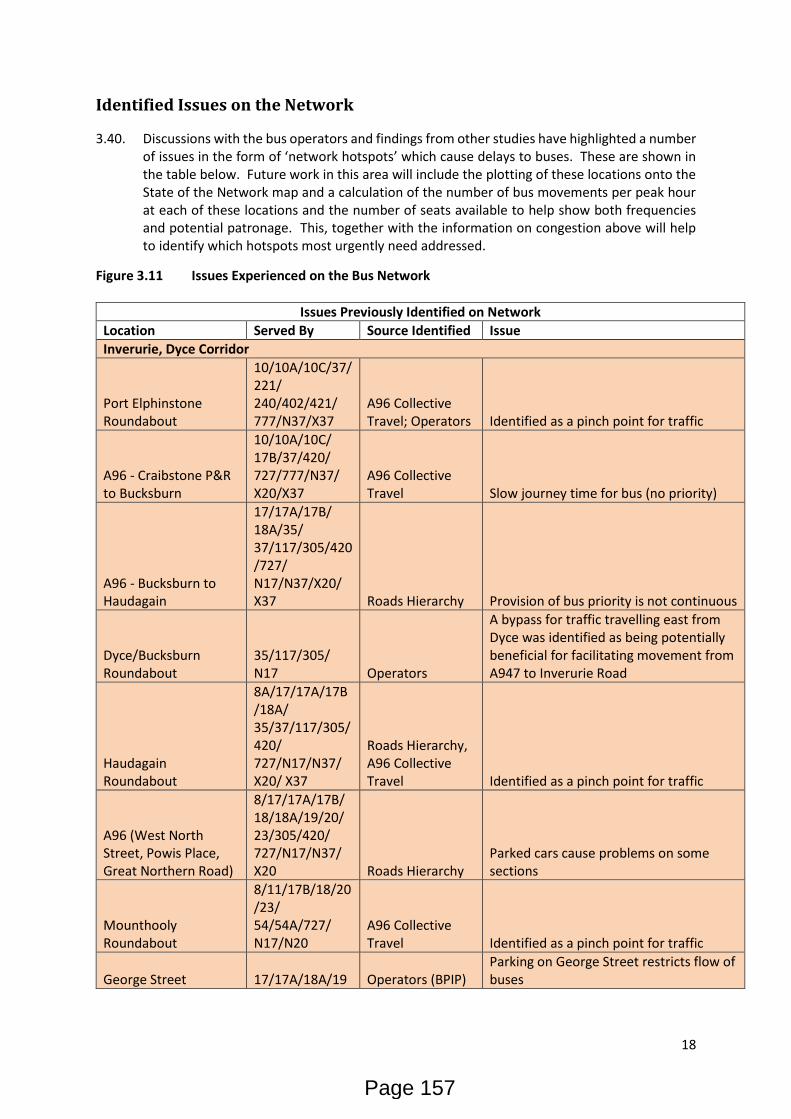
18
Identified Issues on the Network
3.40. Discussions with the bus operators and findings from other studies have highlighted a number of issues in the form of ‘network hotspots’ which cause delays to buses. These are shown in the table below. Future work in this area will include the plotting of these locations onto the State of the Network map and a calculation of the number of bus movements per peak hour at each of these locations and the number of seats available to help show both frequencies and potential patronage. This, together with the information on congestion above will help to identify which hotspots most urgently need addressed.
Figure 3.11 Issues Experienced on the Bus Network
Issues Previously Identified on Network
Location Served By Source Identified Issue
Inverurie, Dyce Corridor
Port Elphinstone Roundabout
10/10A/10C/37/221/ 240/402/421/ 777/N37/X37
A96 Collective Travel; Operators Identified as a pinch point for traffic
A96 - Craibstone P&R to Bucksburn
10/10A/10C/ 17B/37/420/ 727/777/N37/ X20/X37
A96 Collective Travel Slow journey time for bus (no priority)
A96 - Bucksburn to Haudagain
17/17A/17B/ 18A/35/ 37/117/305/420/727/ N17/N37/X20/ X37 Roads Hierarchy Provision of bus priority is not continuous
Dyce/Bucksburn Roundabout
35/117/305/ N17 Operators
A bypass for traffic travelling east from Dyce was identified as being potentially beneficial for facilitating movement from A947 to Inverurie Road
Haudagain Roundabout
8A/17/17A/17B/18A/ 35/37/117/305/420/ 727/N17/N37/ X20/ X37
Roads Hierarchy, A96 Collective Travel Identified as a pinch point for traffic
A96 (West North Street, Powis Place, Great Northern Road)
8/17/17A/17B/ 18/18A/19/20/ 23/305/420/ 727/N17/N37/ X20 Roads Hierarchy
Parked cars cause problems on some sections
Mounthooly Roundabout
8/11/17B/18/20/23/ 54/54A/727/ N17/N20
A96 Collective Travel Identified as a pinch point for traffic
George Street 17/17A/18A/19 Operators (BPIP) Parking on George Street restricts flow of buses
Page 157
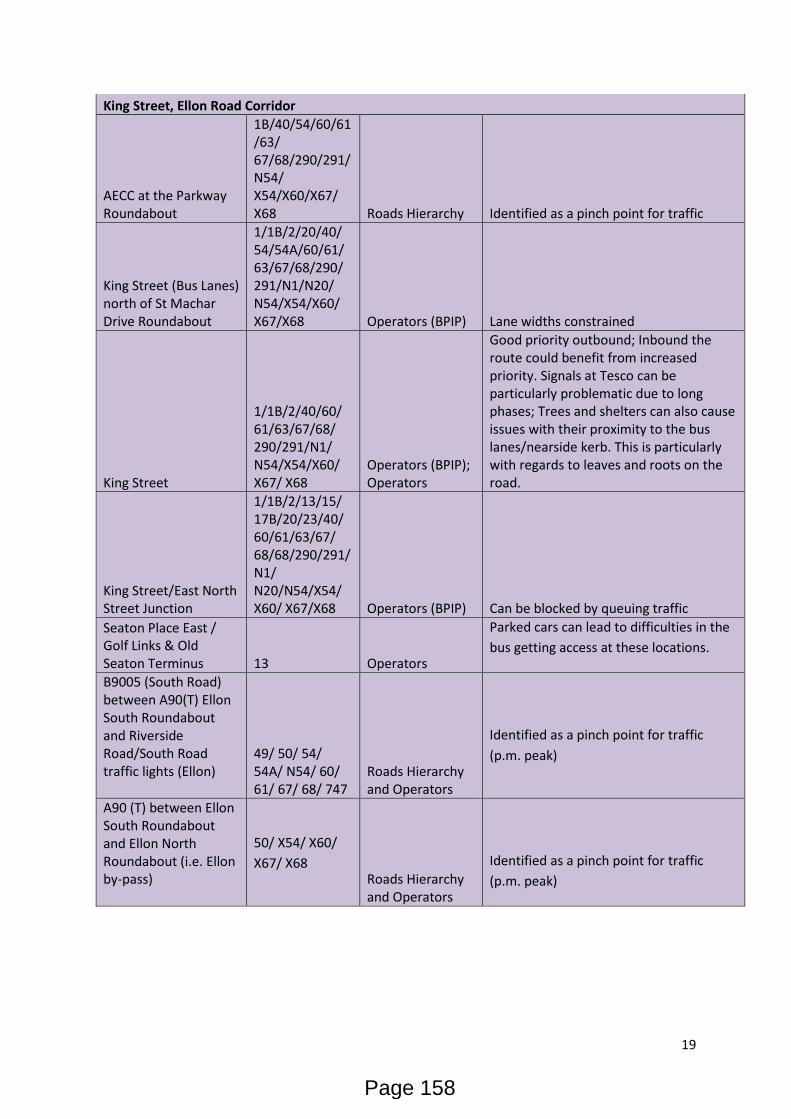
19
King Street, Ellon Road Corridor
AECC at the Parkway Roundabout
1B/40/54/60/61/63/ 67/68/290/291/N54/ X54/X60/X67/ X68 Roads Hierarchy Identified as a pinch point for traffic
King Street (Bus Lanes) north of St Machar Drive Roundabout
1/1B/2/20/40/ 54/54A/60/61/ 63/67/68/290/ 291/N1/N20/ N54/X54/X60/ X67/X68 Operators (BPIP) Lane widths constrained
King Street
1/1B/2/40/60/ 61/63/67/68/ 290/291/N1/ N54/X54/X60/ X67/ X68
Operators (BPIP); Operators
Good priority outbound; Inbound the route could benefit from increased priority. Signals at Tesco can be particularly problematic due to long phases; Trees and shelters can also cause issues with their proximity to the bus lanes/nearside kerb. This is particularly with regards to leaves and roots on the road.
King Street/East North Street Junction
1/1B/2/13/15/ 17B/20/23/40/ 60/61/63/67/ 68/68/290/291/N1/ N20/N54/X54/ X60/ X67/X68 Operators (BPIP) Can be blocked by queuing traffic
Seaton Place East / Golf Links & Old Seaton Terminus 13 Operators
Parked cars can lead to difficulties in the
bus getting access at these locations.
B9005 (South Road) between A90(T) Ellon South Roundabout and Riverside Road/South Road traffic lights (Ellon)
49/ 50/ 54/ 54A/ N54/ 60/ 61/ 67/ 68/ 747
Roads Hierarchy and Operators
Identified as a pinch point for traffic
(p.m. peak)
A90 (T) between Ellon South Roundabout and Ellon North Roundabout (i.e. Ellon by-pass)
50/ X54/ X60/
X67/ X68
Roads Hierarchy and Operators
Identified as a pinch point for traffic
(p.m. peak)
Page 158
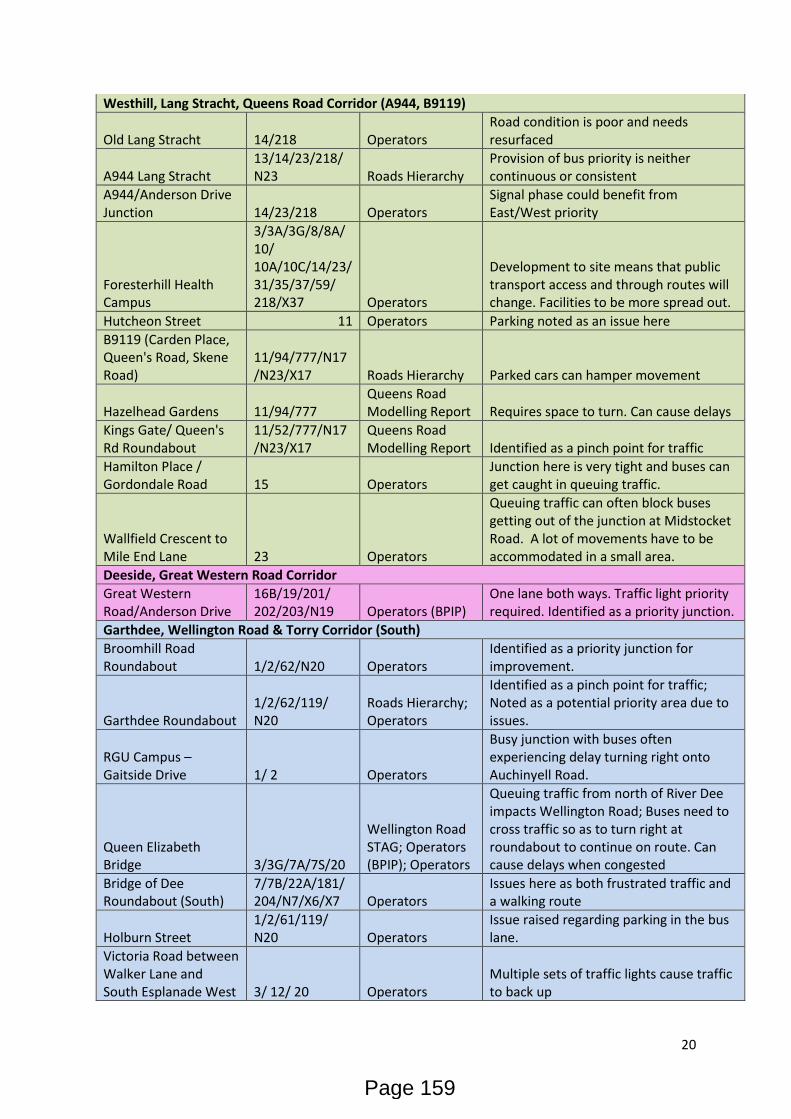
20
Westhill, Lang Stracht, Queens Road Corridor (A944, B9119)
Old Lang Stracht 14/218 Operators Road condition is poor and needs resurfaced
A944 Lang Stracht 13/14/23/218/N23 Roads Hierarchy
Provision of bus priority is neither continuous or consistent
A944/Anderson Drive Junction 14/23/218 Operators
Signal phase could benefit from East/West priority
Foresterhill Health Campus
3/3A/3G/8/8A/10/ 10A/10C/14/23/31/35/37/59/ 218/X37 Operators
Development to site means that public transport access and through routes will change. Facilities to be more spread out.
Hutcheon Street 11 Operators Parking noted as an issue here
B9119 (Carden Place, Queen's Road, Skene Road)
11/94/777/N17/N23/X17 Roads Hierarchy Parked cars can hamper movement
Hazelhead Gardens 11/94/777 Queens Road Modelling Report Requires space to turn. Can cause delays
Kings Gate/ Queen's Rd Roundabout
11/52/777/N17/N23/X17
Queens Road Modelling Report Identified as a pinch point for traffic
Hamilton Place / Gordondale Road 15 Operators
Junction here is very tight and buses can get caught in queuing traffic.
Wallfield Crescent to Mile End Lane 23 Operators
Queuing traffic can often block buses getting out of the junction at Midstocket Road. A lot of movements have to be accommodated in a small area.
Deeside, Great Western Road Corridor
Great Western Road/Anderson Drive
16B/19/201/ 202/203/N19 Operators (BPIP)
One lane both ways. Traffic light priority required. Identified as a priority junction.
Garthdee, Wellington Road & Torry Corridor (South)
Broomhill Road Roundabout 1/2/62/N20 Operators
Identified as a priority junction for improvement.
Garthdee Roundabout 1/2/62/119/ N20
Roads Hierarchy; Operators
Identified as a pinch point for traffic; Noted as a potential priority area due to issues.
RGU Campus – Gaitside Drive 1/ 2 Operators
Busy junction with buses often experiencing delay turning right onto Auchinyell Road.
Queen Elizabeth Bridge 3/3G/7A/7S/20
Wellington Road STAG; Operators (BPIP); Operators
Queuing traffic from north of River Dee impacts Wellington Road; Buses need to cross traffic so as to turn right at roundabout to continue on route. Can cause delays when congested
Bridge of Dee Roundabout (South)
7/7B/22A/181/ 204/N7/X6/X7 Operators
Issues here as both frustrated traffic and a walking route
Holburn Street 1/2/61/119/ N20 Operators
Issue raised regarding parking in the bus lane.
Victoria Road between Walker Lane and South Esplanade West 3/ 12/ 20 Operators
Multiple sets of traffic lights cause traffic to back up
Page 159
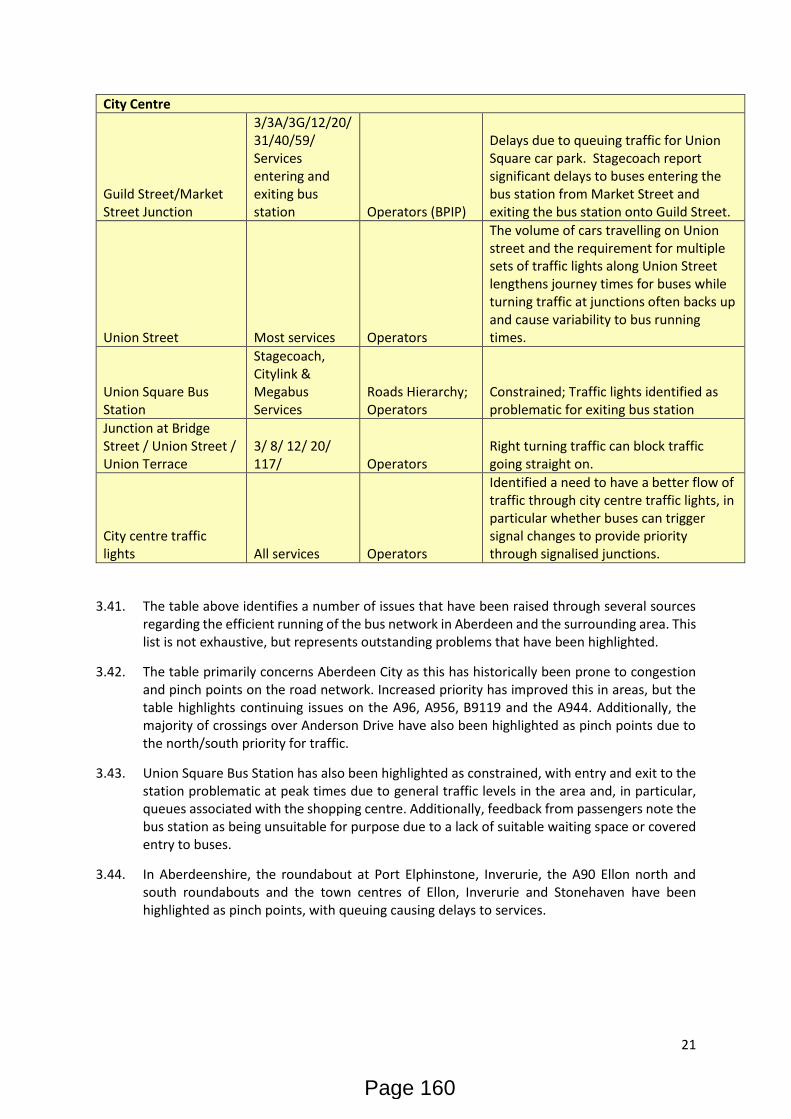
21
City Centre
Guild Street/Market Street Junction
3/3A/3G/12/20/31/40/59/ Services entering and exiting bus station Operators (BPIP)
Delays due to queuing traffic for Union Square car park. Stagecoach report significant delays to buses entering the bus station from Market Street and exiting the bus station onto Guild Street.
Union Street Most services Operators
The volume of cars travelling on Union street and the requirement for multiple sets of traffic lights along Union Street lengthens journey times for buses while turning traffic at junctions often backs up and cause variability to bus running times.
Union Square Bus Station
Stagecoach, Citylink & Megabus Services
Roads Hierarchy; Operators
Constrained; Traffic lights identified as problematic for exiting bus station
Junction at Bridge Street / Union Street / Union Terrace
3/ 8/ 12/ 20/ 117/ Operators
Right turning traffic can block traffic going straight on.
City centre traffic lights All services Operators
Identified a need to have a better flow of traffic through city centre traffic lights, in particular whether buses can trigger signal changes to provide priority through signalised junctions.
3.41. The table above identifies a number of issues that have been raised through several sources regarding the efficient running of the bus network in Aberdeen and the surrounding area. This list is not exhaustive, but represents outstanding problems that have been highlighted.
3.42. The table primarily concerns Aberdeen City as this has historically been prone to congestion and pinch points on the road network. Increased priority has improved this in areas, but the table highlights continuing issues on the A96, A956, B9119 and the A944. Additionally, the majority of crossings over Anderson Drive have also been highlighted as pinch points due to the north/south priority for traffic.
3.43. Union Square Bus Station has also been highlighted as constrained, with entry and exit to the station problematic at peak times due to general traffic levels in the area and, in particular, queues associated with the shopping centre. Additionally, feedback from passengers note the bus station as being unsuitable for purpose due to a lack of suitable waiting space or covered entry to buses.
3.44. In Aberdeenshire, the roundabout at Port Elphinstone, Inverurie, the A90 Ellon north and south roundabouts and the town centres of Ellon, Inverurie and Stonehaven have been highlighted as pinch points, with queuing causing delays to services.
Page 160
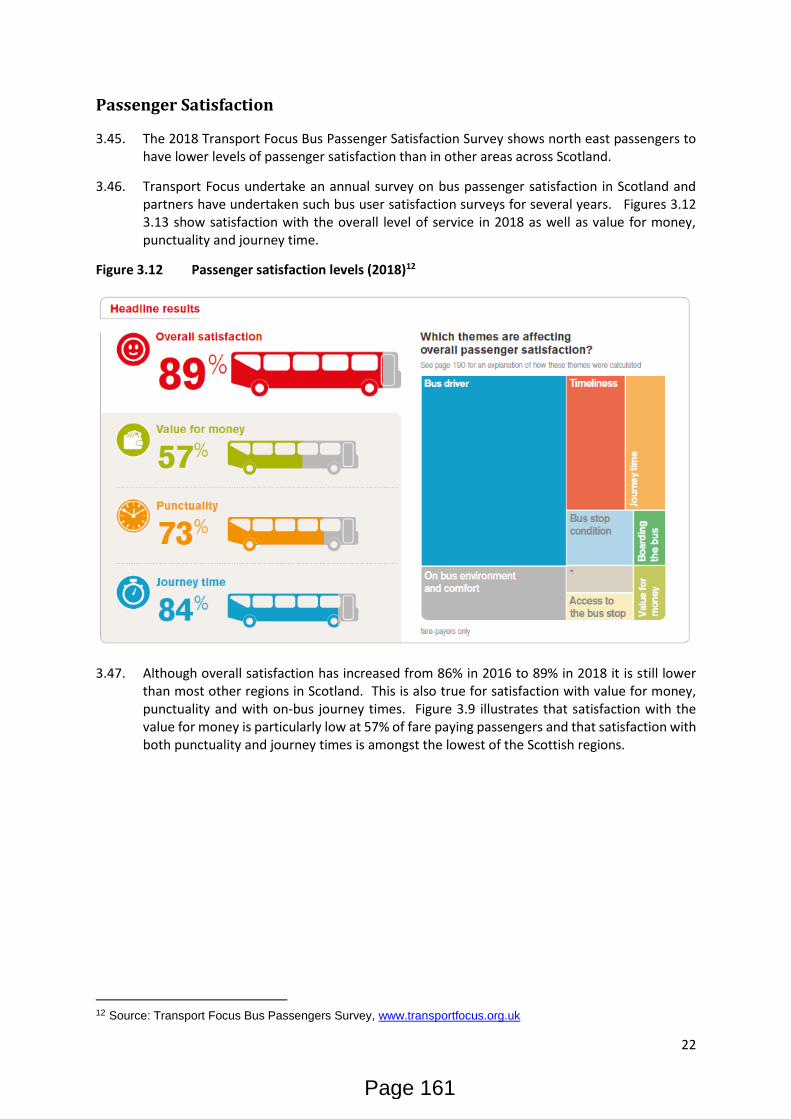
22
Passenger Satisfaction
3.45. The 2018 Transport Focus Bus Passenger Satisfaction Survey shows north east passengers to have lower levels of passenger satisfaction than in other areas across Scotland.
3.46. Transport Focus undertake an annual survey on bus passenger satisfaction in Scotland and partners have undertaken such bus user satisfaction surveys for several years. Figures 3.12 3.13 show satisfaction with the overall level of service in 2018 as well as value for money, punctuality and journey time.
Figure 3.12 Passenger satisfaction levels (2018)12
3.47. Although overall satisfaction has increased from 86% in 2016 to 89% in 2018 it is still lower than most other regions in Scotland. This is also true for satisfaction with value for money, punctuality and with on-bus journey times. Figure 3.9 illustrates that satisfaction with the value for money is particularly low at 57% of fare paying passengers and that satisfaction with both punctuality and journey times is amongst the lowest of the Scottish regions.
12 Source: Transport Focus Bus Passengers Survey, www.transportfocus.org.uk
Page 161
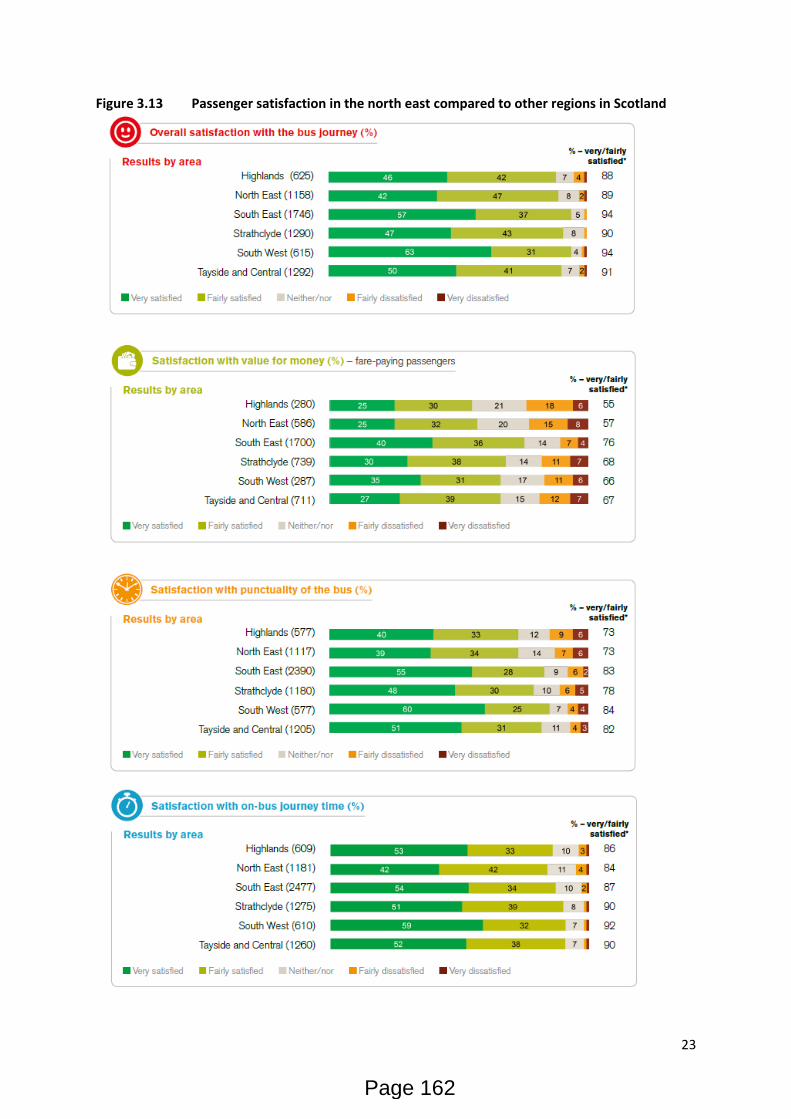
23
Figure 3.13 Passenger satisfaction in the north east compared to other regions in Scotland
Page 162
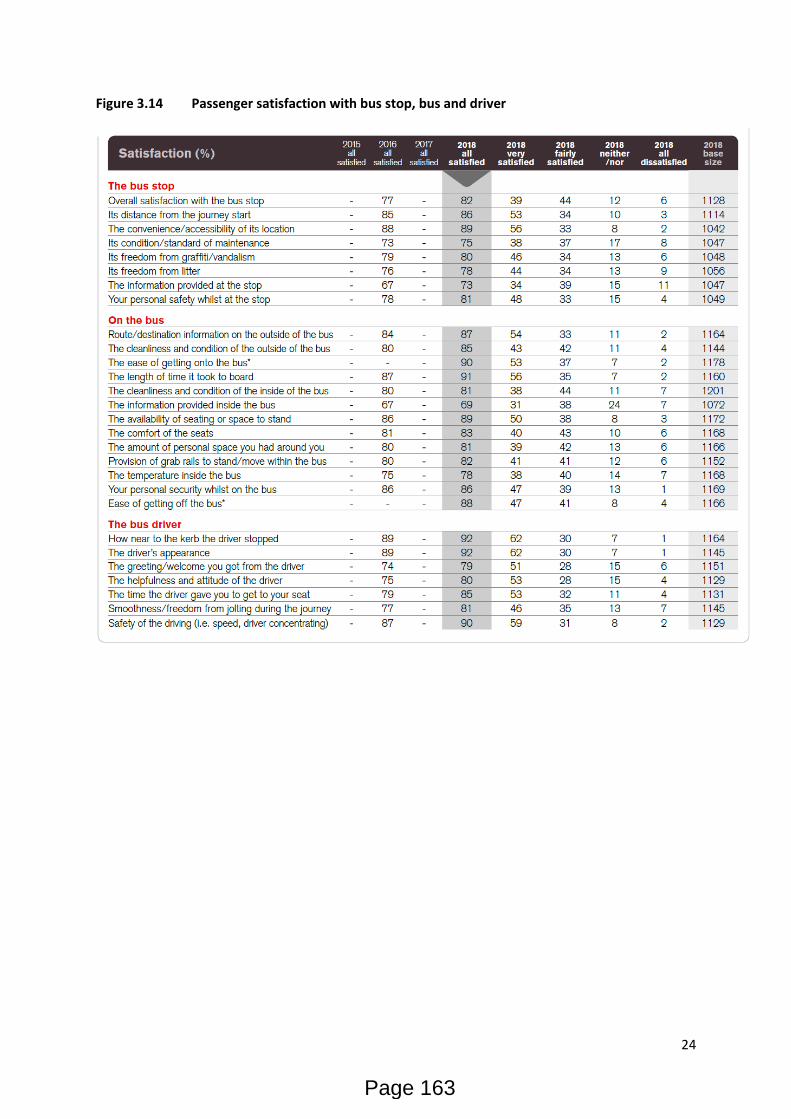
24
Figure 3.14 Passenger satisfaction with bus stop, bus and driver
Page 163
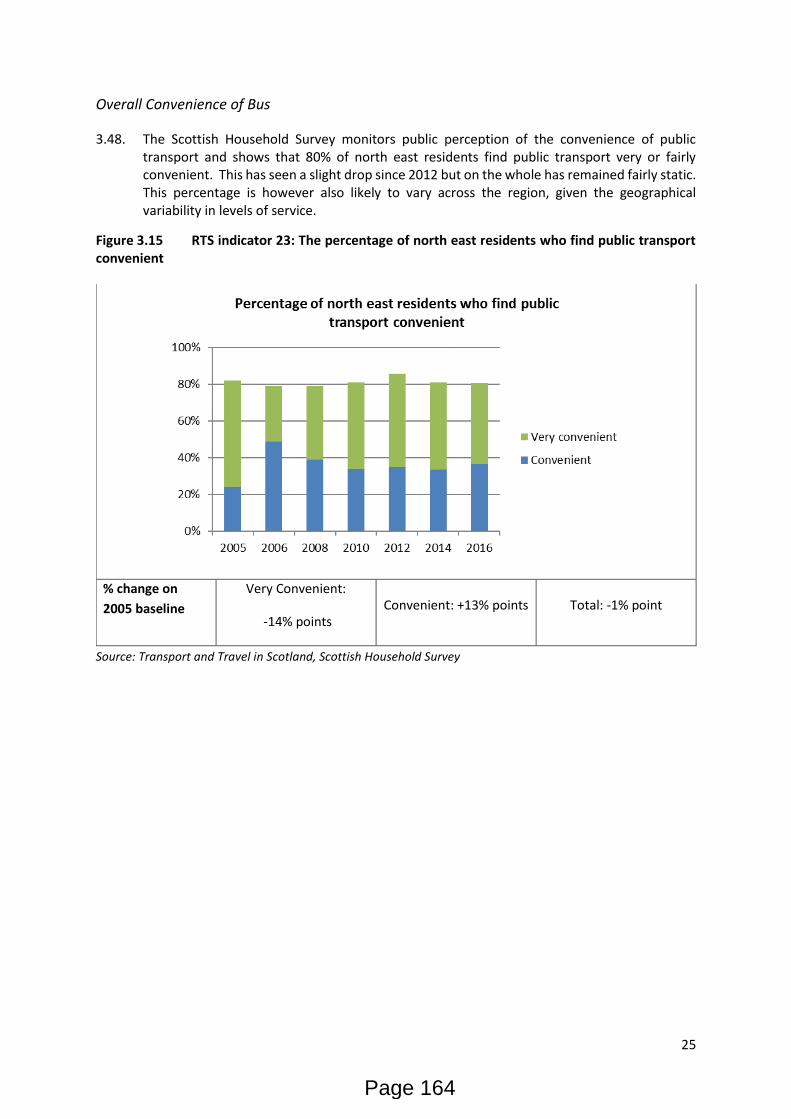
25
Overall Convenience of Bus
3.48. The Scottish Household Survey monitors public perception of the convenience of public transport and shows that 80% of north east residents find public transport very or fairly convenient. This has seen a slight drop since 2012 but on the whole has remained fairly static. This percentage is however also likely to vary across the region, given the geographical variability in levels of service.
Figure 3.15 RTS indicator 23: The percentage of north east residents who find public transport convenient
Source: Transport and Travel in Scotland, Scottish Household Survey
Indicator 23: The percentage of north east residents who find public transport convenient.
% change on
2005 baseline
Very Convenient:
-14% points Convenient: +13% points Total: -1% point
Page 164
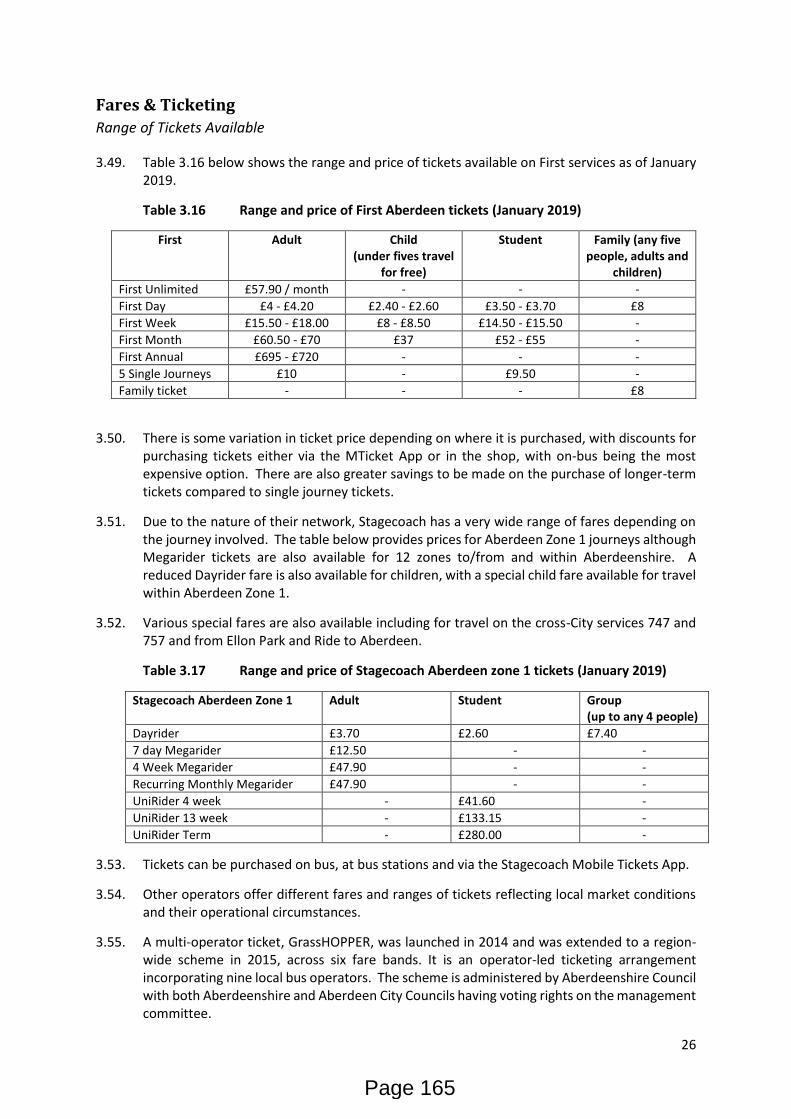
26
Fares & Ticketing
Range of Tickets Available
3.49. Table 3.16 below shows the range and price of tickets available on First services as of January 2019.
Table 3.16 Range and price of First Aberdeen tickets (January 2019)
First Adult Child (under fives travel
for free)
Student Family (any five people, adults and
children)
First Unlimited £57.90 / month - - -
First Day £4 - £4.20 £2.40 - £2.60 £3.50 - £3.70 £8
First Week £15.50 - £18.00 £8 - £8.50 £14.50 - £15.50 -
First Month £60.50 - £70 £37 £52 - £55 -
First Annual £695 - £720 - - -
5 Single Journeys £10 - £9.50 -
Family ticket - - - £8
3.50. There is some variation in ticket price depending on where it is purchased, with discounts for purchasing tickets either via the MTicket App or in the shop, with on-bus being the most expensive option. There are also greater savings to be made on the purchase of longer-term tickets compared to single journey tickets.
3.51. Due to the nature of their network, Stagecoach has a very wide range of fares depending on the journey involved. The table below provides prices for Aberdeen Zone 1 journeys although Megarider tickets are also available for 12 zones to/from and within Aberdeenshire. A reduced Dayrider fare is also available for children, with a special child fare available for travel within Aberdeen Zone 1.
3.52. Various special fares are also available including for travel on the cross-City services 747 and 757 and from Ellon Park and Ride to Aberdeen.
Table 3.17 Range and price of Stagecoach Aberdeen zone 1 tickets (January 2019)
Stagecoach Aberdeen Zone 1 Adult Student Group (up to any 4 people)
Dayrider £3.70 £2.60 £7.40
7 day Megarider £12.50 - -
4 Week Megarider £47.90 - -
Recurring Monthly Megarider £47.90 - -
UniRider 4 week - £41.60 -
UniRider 13 week - £133.15 -
UniRider Term - £280.00 -
3.53. Tickets can be purchased on bus, at bus stations and via the Stagecoach Mobile Tickets App.
3.54. Other operators offer different fares and ranges of tickets reflecting local market conditions and their operational circumstances.
3.55. A multi-operator ticket, GrassHOPPER, was launched in 2014 and was extended to a region-wide scheme in 2015, across six fare bands. It is an operator-led ticketing arrangement incorporating nine local bus operators. The scheme is administered by Aberdeenshire Council with both Aberdeenshire and Aberdeen City Councils having voting rights on the management committee.
Page 165
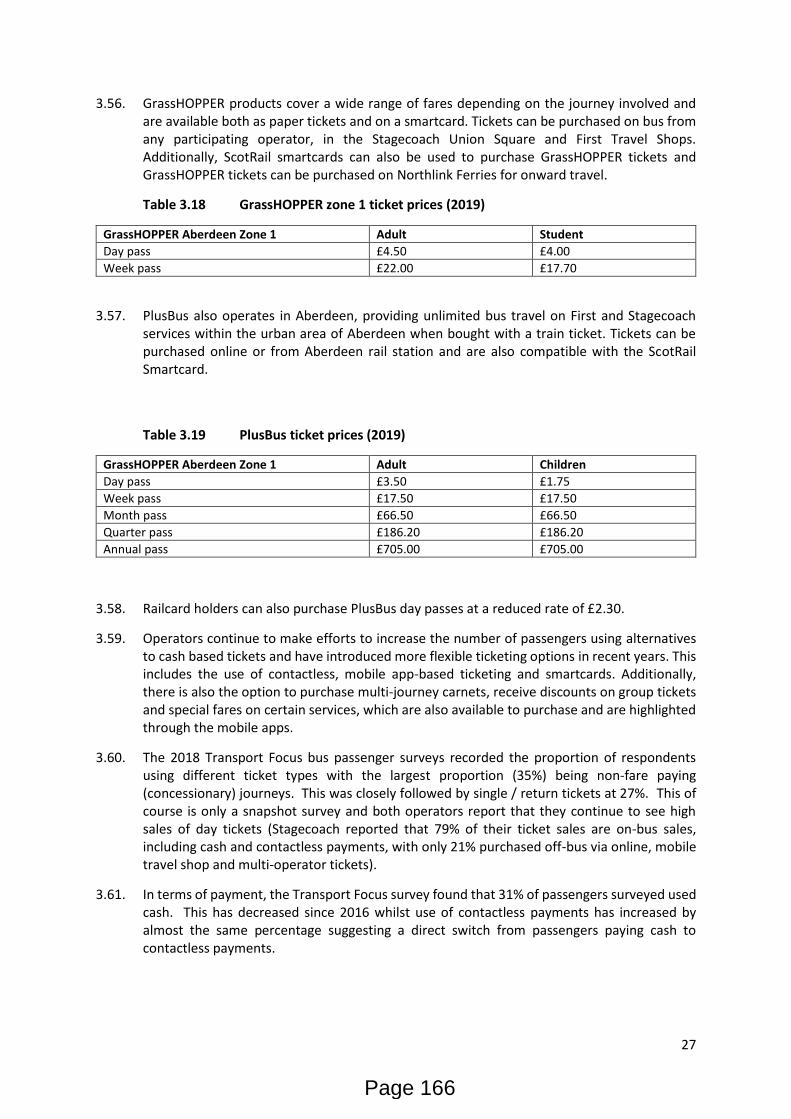
27
3.56. GrassHOPPER products cover a wide range of fares depending on the journey involved and are available both as paper tickets and on a smartcard. Tickets can be purchased on bus from any participating operator, in the Stagecoach Union Square and First Travel Shops. Additionally, ScotRail smartcards can also be used to purchase GrassHOPPER tickets and GrassHOPPER tickets can be purchased on Northlink Ferries for onward travel.
Table 3.18 GrassHOPPER zone 1 ticket prices (2019)
GrassHOPPER Aberdeen Zone 1 Adult Student
Day pass £4.50 £4.00
Week pass £22.00 £17.70
3.57. PlusBus also operates in Aberdeen, providing unlimited bus travel on First and Stagecoach services within the urban area of Aberdeen when bought with a train ticket. Tickets can be purchased online or from Aberdeen rail station and are also compatible with the ScotRail Smartcard.
Table 3.19 PlusBus ticket prices (2019)
GrassHOPPER Aberdeen Zone 1 Adult Children
Day pass £3.50 £1.75
Week pass £17.50 £17.50
Month pass £66.50 £66.50
Quarter pass £186.20 £186.20
Annual pass £705.00 £705.00
3.58. Railcard holders can also purchase PlusBus day passes at a reduced rate of £2.30.
3.59. Operators continue to make efforts to increase the number of passengers using alternatives to cash based tickets and have introduced more flexible ticketing options in recent years. This includes the use of contactless, mobile app-based ticketing and smartcards. Additionally, there is also the option to purchase multi-journey carnets, receive discounts on group tickets and special fares on certain services, which are also available to purchase and are highlighted through the mobile apps.
3.60. The 2018 Transport Focus bus passenger surveys recorded the proportion of respondents using different ticket types with the largest proportion (35%) being non-fare paying (concessionary) journeys. This was closely followed by single / return tickets at 27%. This of course is only a snapshot survey and both operators report that they continue to see high sales of day tickets (Stagecoach reported that 79% of their ticket sales are on-bus sales, including cash and contactless payments, with only 21% purchased off-bus via online, mobile travel shop and multi-operator tickets).
3.61. In terms of payment, the Transport Focus survey found that 31% of passengers surveyed used cash. This has decreased since 2016 whilst use of contactless payments has increased by almost the same percentage suggesting a direct switch from passengers paying cash to contactless payments.
Page 166
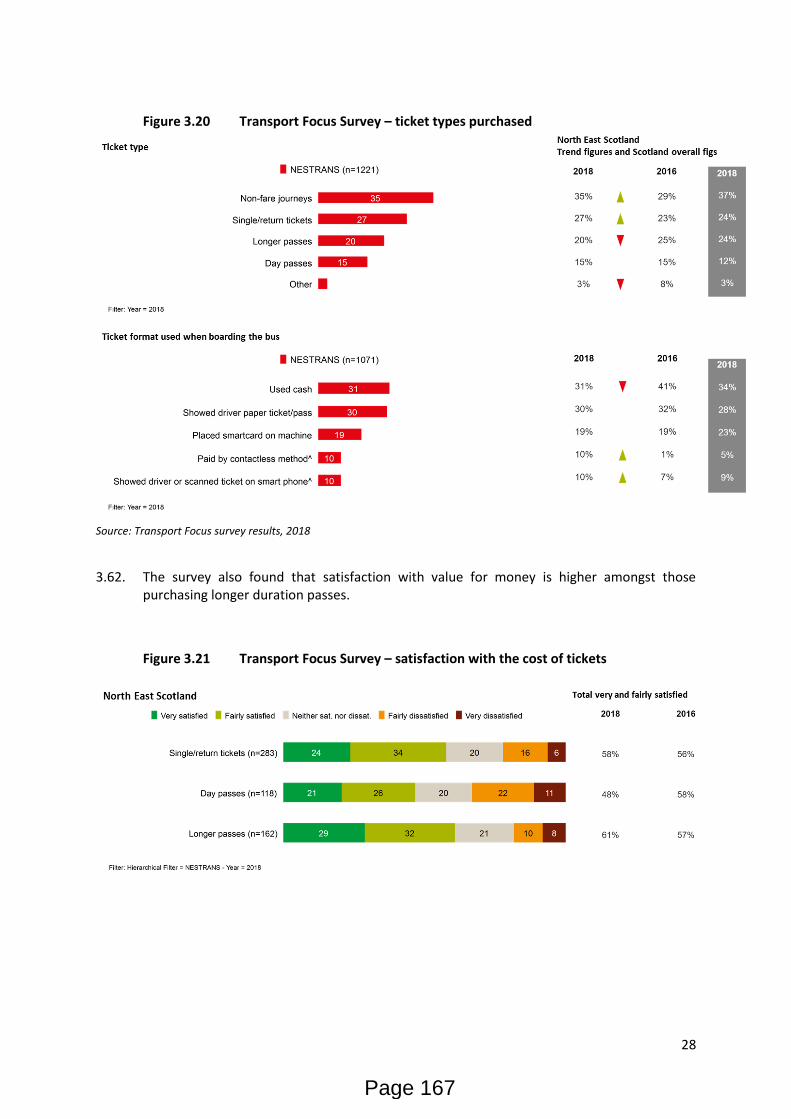
28
Figure 3.20 Transport Focus Survey – ticket types purchased
Source: Transport Focus survey results, 2018
3.62. The survey also found that satisfaction with value for money is higher amongst those purchasing longer duration passes.
Figure 3.21 Transport Focus Survey – satisfaction with the cost of tickets
Page 167
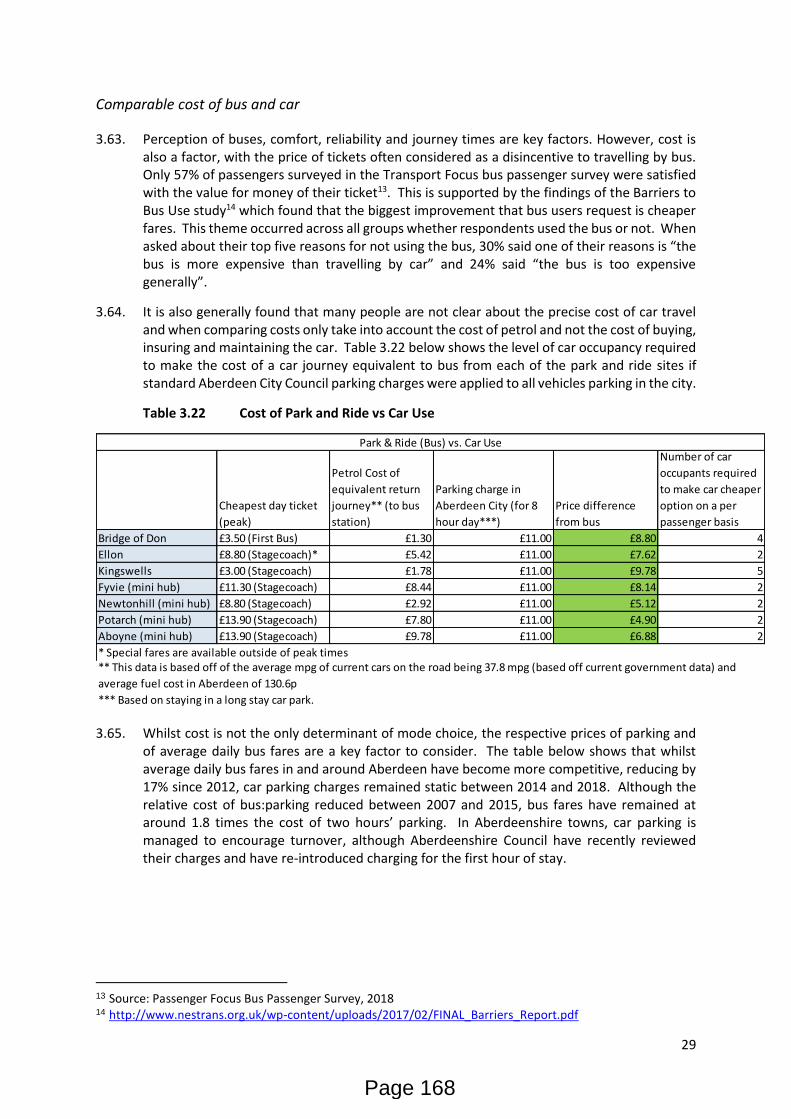
29
Comparable cost of bus and car
3.63. Perception of buses, comfort, reliability and journey times are key factors. However, cost is also a factor, with the price of tickets often considered as a disincentive to travelling by bus. Only 57% of passengers surveyed in the Transport Focus bus passenger survey were satisfied with the value for money of their ticket13. This is supported by the findings of the Barriers to Bus Use study14 which found that the biggest improvement that bus users request is cheaper fares. This theme occurred across all groups whether respondents used the bus or not. When asked about their top five reasons for not using the bus, 30% said one of their reasons is “the bus is more expensive than travelling by car” and 24% said “the bus is too expensive generally”.
3.64. It is also generally found that many people are not clear about the precise cost of car travel and when comparing costs only take into account the cost of petrol and not the cost of buying, insuring and maintaining the car. Table 3.22 below shows the level of car occupancy required to make the cost of a car journey equivalent to bus from each of the park and ride sites if standard Aberdeen City Council parking charges were applied to all vehicles parking in the city.
Table 3.22 Cost of Park and Ride vs Car Use
3.65. Whilst cost is not the only determinant of mode choice, the respective prices of parking and of average daily bus fares are a key factor to consider. The table below shows that whilst average daily bus fares in and around Aberdeen have become more competitive, reducing by 17% since 2012, car parking charges remained static between 2014 and 2018. Although the relative cost of bus:parking reduced between 2007 and 2015, bus fares have remained at around 1.8 times the cost of two hours’ parking. In Aberdeenshire towns, car parking is managed to encourage turnover, although Aberdeenshire Council have recently reviewed their charges and have re-introduced charging for the first hour of stay.
13 Source: Passenger Focus Bus Passenger Survey, 2018 14 http://www.nestrans.org.uk/wp-content/uploads/2017/02/FINAL_Barriers_Report.pdf
Cheapest day ticket
(peak)
Petrol Cost of
equivalent return
journey** (to bus
station)
Parking charge in
Aberdeen City (for 8
hour day***)
Price difference
from bus
Number of car
occupants required
to make car cheaper
option on a per
passenger basis
Bridge of Don £3.50 (First Bus) £1.30 £11.00 £8.80 4
Ellon £8.80 (Stagecoach)* £5.42 £11.00 £7.62 2
Kingswells £3.00 (Stagecoach) £1.78 £11.00 £9.78 5
Fyvie (mini hub) £11.30 (Stagecoach) £8.44 £11.00 £8.14 2
Newtonhill (mini hub) £8.80 (Stagecoach) £2.92 £11.00 £5.12 2
Potarch (mini hub) £13.90 (Stagecoach) £7.80 £11.00 £4.90 2
Aboyne (mini hub) £13.90 (Stagecoach) £9.78 £11.00 £6.88 2
* Special fares are available outside of peak times
*** Based on staying in a long stay car park.
Park & Ride (Bus) vs. Car Use
** This data is based off of the average mpg of current cars on the road being 37.8 mpg (based off current government data) and
average fuel cost in Aberdeen of 130.6p
Page 168
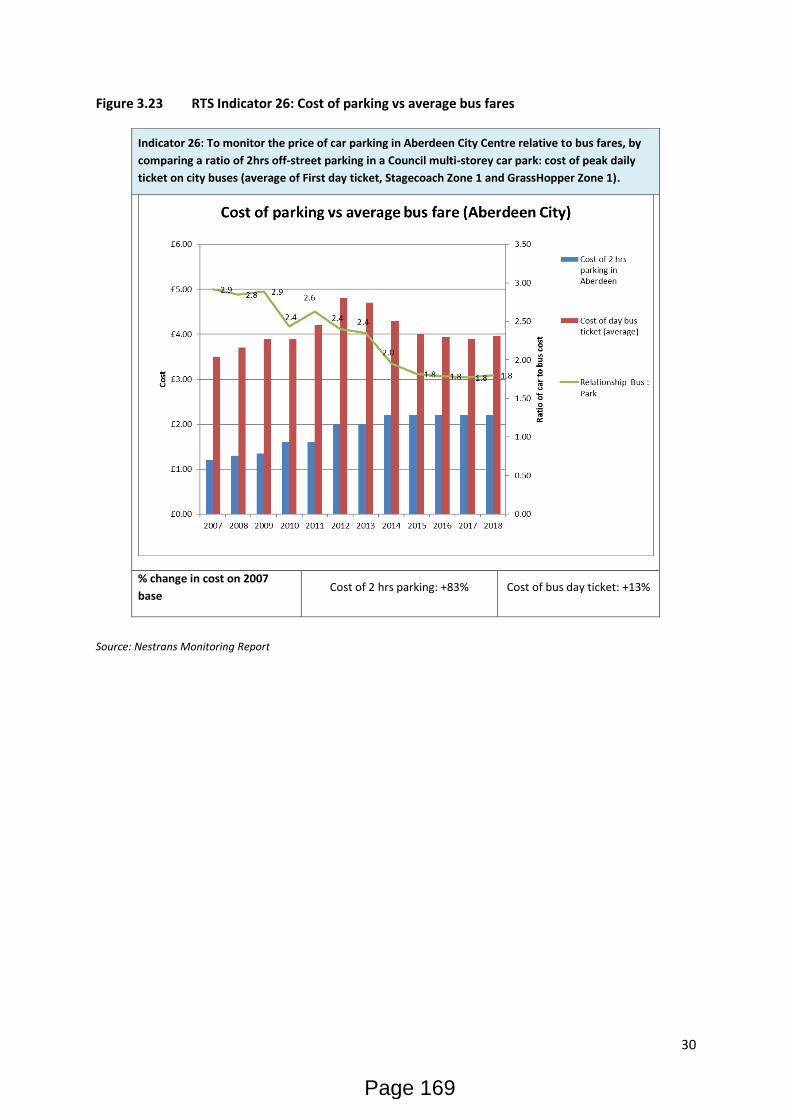
30
Figure 3.23 RTS Indicator 26: Cost of parking vs average bus fares
Source: Nestrans Monitoring Report
Indicator 26: To monitor the price of car parking in Aberdeen City Centre relative to bus fares, by
comparing a ratio of 2hrs off-street parking in a Council multi-storey car park: cost of peak daily
ticket on city buses (average of First day ticket, Stagecoach Zone 1 and GrassHopper Zone 1).
% change in cost on 2007
base Cost of 2 hrs parking: +83% Cost of bus day ticket: +13%
Page 169
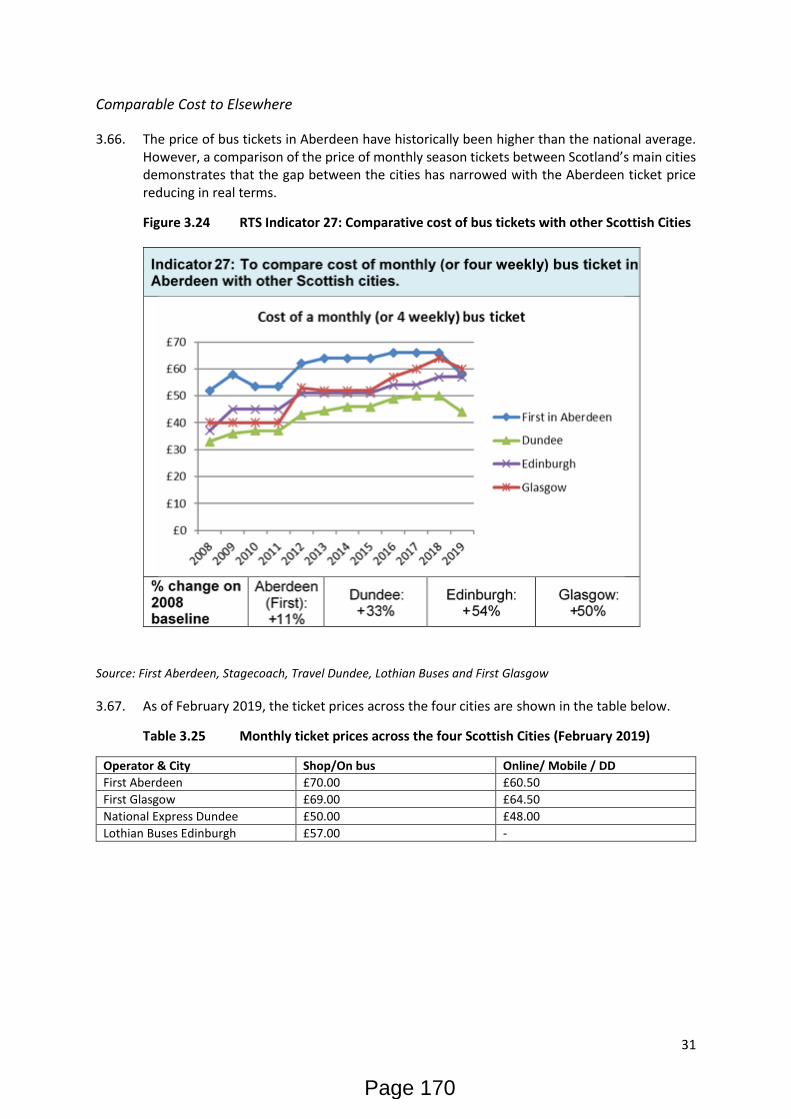
31
Comparable Cost to Elsewhere
3.66. The price of bus tickets in Aberdeen have historically been higher than the national average. However, a comparison of the price of monthly season tickets between Scotland’s main cities demonstrates that the gap between the cities has narrowed with the Aberdeen ticket price reducing in real terms.
Figure 3.24 RTS Indicator 27: Comparative cost of bus tickets with other Scottish Cities
Source: First Aberdeen, Stagecoach, Travel Dundee, Lothian Buses and First Glasgow
3.67. As of February 2019, the ticket prices across the four cities are shown in the table below.
Table 3.25 Monthly ticket prices across the four Scottish Cities (February 2019)
Operator & City Shop/On bus Online/ Mobile / DD
First Aberdeen £70.00 £60.50
First Glasgow £69.00 £64.50
National Express Dundee £50.00 £48.00
Lothian Buses Edinburgh £57.00 -
Page 170

32
Bus Priority Measures
Location
3.68. There are bus lanes on a number of the main routes into Aberdeen. The only vehicles allowed to use a bus lane when it is in operation are buses, taxis, private hire vehicles and bicycles. The map below shows the location of the existing bus lanes in the city. There are also bus gates at:
• Broad Street (local buses only);
• Bedford Road;
• Shielhill Avenue (Dubford) (also open to taxis); and
• Lang Stracht.
Hours of Operation
3.69. Referring to the map below in Figure 3.26, the operational hours of the bus lanes are as follows:
• Auchmill Road, eastbound approach to Haudagain roundabout; Ellon Road at Bridge of
Don; College Bounds between University Road and Meston Walk and Menzies Road– 24
hours 7 days a week (red)
• Great Northern Road westbound approach to Haudagain roundabout – 0730-0930 and
1500-1830, Monday – Saturday (brown)
• Union Street both directions – 0800-0930, 1230-1430 and 1630-1830, Monday-Saturday
(orange)
• Holburn Street northbound approach to Union Grove and southbound approach to
Garthdee roundabout – 0800 – 0930 and 1600 – 1800, Monday to Saturday (blue)
• All other bus lanes – 0730-0930 and 1630-1830, Monday to Saturday (purple).
3.70. The bus gates are operational 24 hours a day, seven days a week and appear as yellow circles on the map.
Enforcement
3.71. Bus lane enforcement is carried out by Aberdeen City Council and has been in place since early 2015. Fines are set at £60, reduced to £30 if paid within a time limit. The income generated from this enforcement is ring fenced by the Council for local transport strategy measures.
Page 171
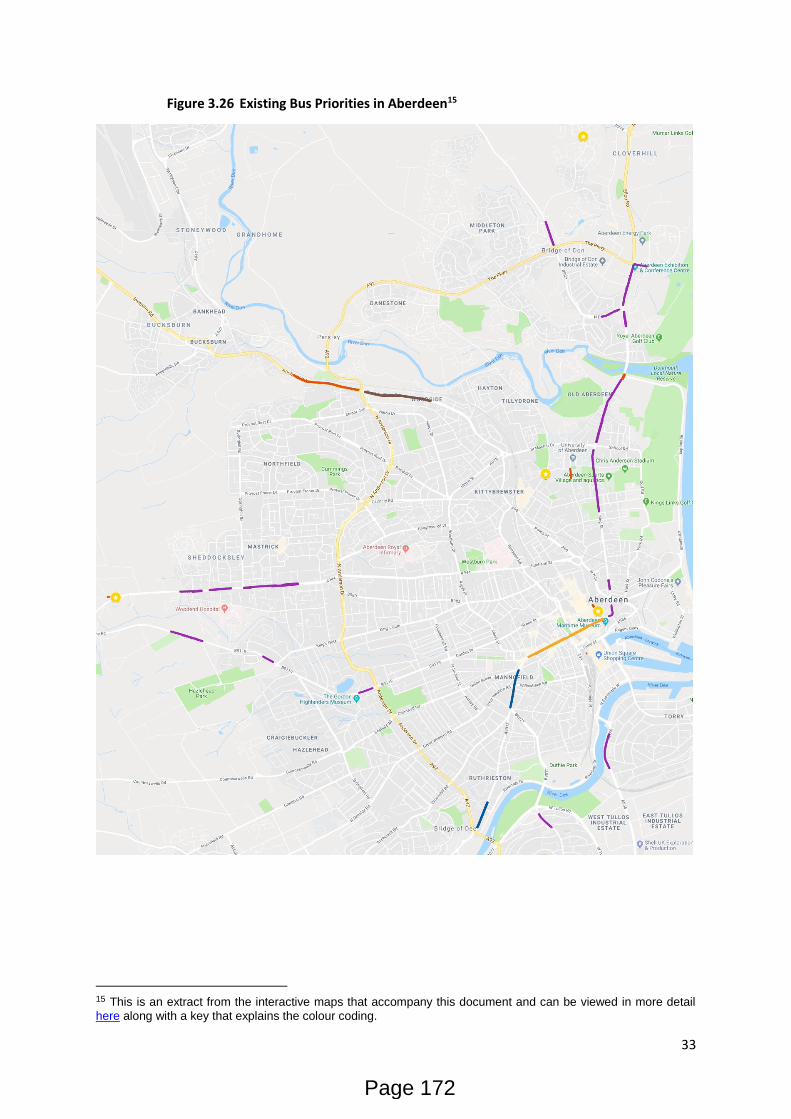
33
Figure 3.26 Existing Bus Priorities in Aberdeen15
15 This is an extract from the interactive maps that accompany this document and can be viewed in more detail
here along with a key that explains the colour coding.
Page 172
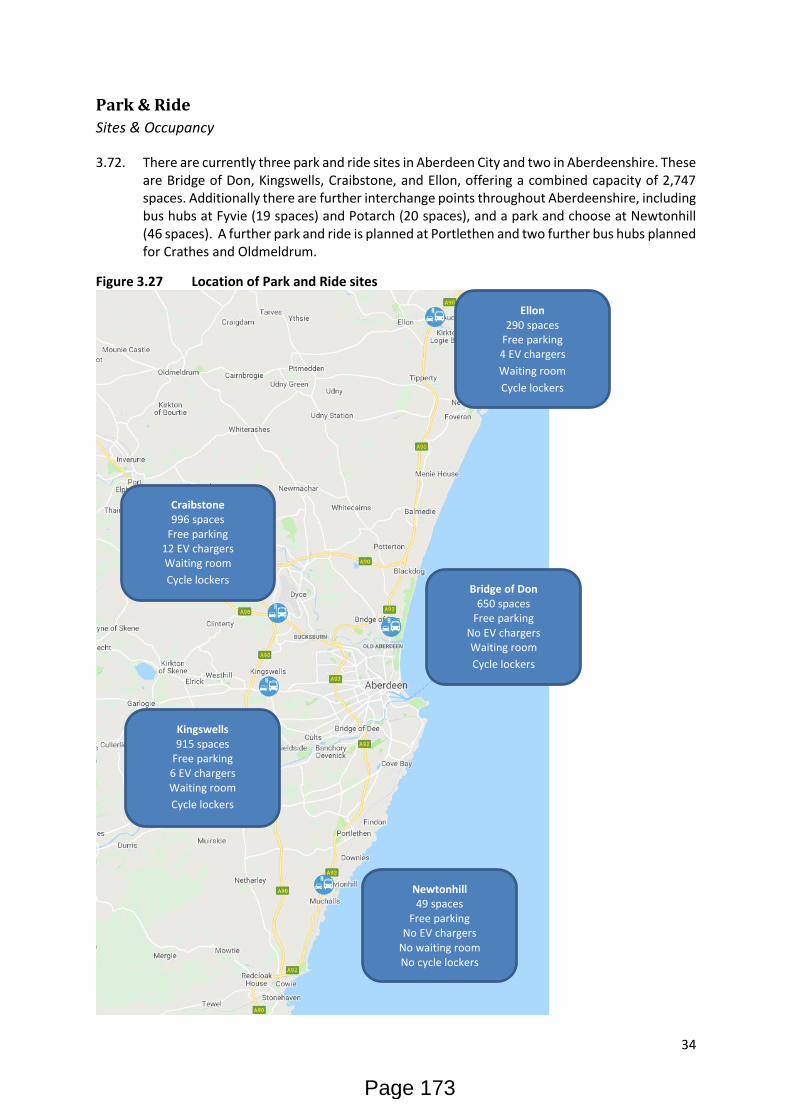
34
Park & Ride
Sites & Occupancy
3.72. There are currently three park and ride sites in Aberdeen City and two in Aberdeenshire. These are Bridge of Don, Kingswells, Craibstone, and Ellon, offering a combined capacity of 2,747 spaces. Additionally there are further interchange points throughout Aberdeenshire, including bus hubs at Fyvie (19 spaces) and Potarch (20 spaces), and a park and choose at Newtonhill (46 spaces). A further park and ride is planned at Portlethen and two further bus hubs planned for Crathes and Oldmeldrum.
Figure 3.27 Location of Park and Ride sites
Ellon 290 spaces
Free parking 4 EV chargers
Waiting room
Cycle lockers
Craibstone 996 spaces
Free parking 12 EV chargers Waiting room
Cycle lockers
Kingswells 915 spaces
Free parking 6 EV chargers Waiting room
Cycle lockers
Bridge of Don 650 spaces
Free parking No EV chargers Waiting room
Cycle lockers
Newtonhill 49 spaces
Free parking No EV chargers
No waiting room No cycle lockers
Page 173
35
3.73. The primary destination of the main park and ride sites is Aberdeen city centre. However, Ellon park and ride is also served by the Ellon Town Service and has links to Peterhead, Fraserburgh, Aberdeen Airport, Kingswells, Stonehaven, Montrose, Portlethen, Newtonhill and other locations on the A90 corridor.
3.74. Craibstone Park and Ride offers regular connections to Aberdeen, Inverurie, Ellon, Stonehaven, Portlethen and Montrose, as well as other locations on the A96 corridor. It also connects to Kingswells park and ride and Newtonhill park and choose.
3.75. Kingswells Park and Ride provides direct connections to Aberdeen Airport, Ellon, Stonehaven, Newtonhill, Portlethen, Montrose, Westhill and Aberdeen.
3.76. Bridge of Don Park and Ride offers direct connections to Aberdeen via Aberdeen University and services passing the site along the A90 (although not entering the site) serve Ellon, Peterhead, Fraserburgh and other locations on the A90 corridor.
3.77. With the opening of Craibstone Park and Ride in January 2017, three major routes into Aberdeen now have the capability to deliver a strong Park and Ride service. Whilst Kingswells has seen recent growth with the addition of Stagecoach’s X17 service to the site, the Craibstone and Bridge of Don sites have been facing challenges in attracting significant levels of patronage. Ellon park and ride has seen consistent growth for many years after opening, with patronage stabilising in recent years.
3.78. The launch of Stagecoach’s 747 and 757 service in February 2019 has connected the majority of the park and ride sites via the AWPR. This has increased the direct connections available at Kingswells, Craibstone, Ellon and Newtonhill park and ride sites.
3.79. Occupancy of each of the main park and ride sites and the results of this are shown in the table below.
Table 3.28 Park and ride car park occupancy
Site Capacity Occupancy
2015 2016 2017 2018 2016-18
Bridge of Don 650 182 123 146 56 -54%
Ellon16 290 - 240 244 238 -1%
Kingswells 915 118 103 213 189 89%
Craibstone 996 - - 14 7 -
Total 2,737 - 466 617 490 5%
Source: Nestrans Monitoring Report and Aberdeenshire Council
3.80. Given the opportunity that park & ride provides in helping to encourage behaviour change away from car use and supports the vision of a cleaner, healthier and more attractive city centre, careful consideration is required in order to maximise the benefits that a strong P&R network could bring. The potential benefits of park and ride usage are illustrated in table 3.29 below, showing the estimated mileage and carbon savings from cars counted in the park and ride during annual surveys. This assumes the park and ride occupancy is consistent with average occupancy and is calculated on return travel 6 days a week over a year.
16 Data for Ellon is monitored and provided by Aberdeenshire Council and shows the average peak occupancy of
the car park. The remaining sites are monitored by Nestrans on an annual basis through an on-site survey and count of the vehicles present on that day.
Page 174
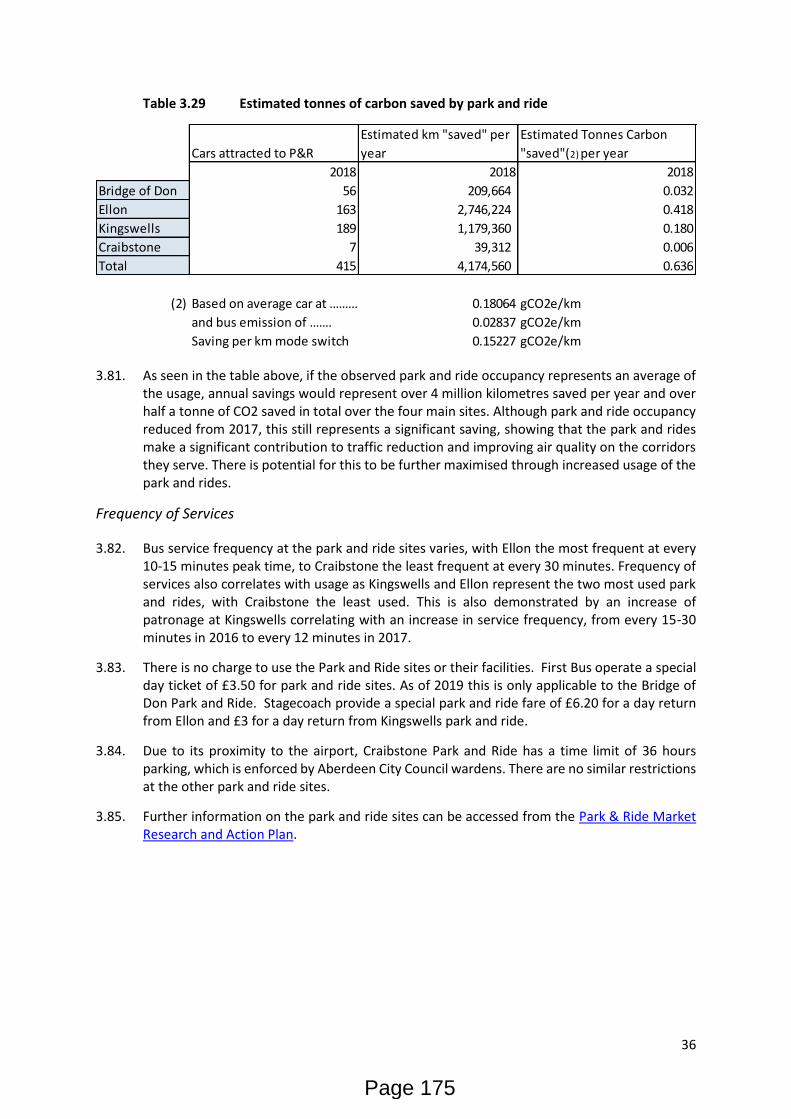
36
Table 3.29 Estimated tonnes of carbon saved by park and ride
3.81. As seen in the table above, if the observed park and ride occupancy represents an average of the usage, annual savings would represent over 4 million kilometres saved per year and over half a tonne of CO2 saved in total over the four main sites. Although park and ride occupancy reduced from 2017, this still represents a significant saving, showing that the park and rides make a significant contribution to traffic reduction and improving air quality on the corridors they serve. There is potential for this to be further maximised through increased usage of the park and rides.
Frequency of Services
3.82. Bus service frequency at the park and ride sites varies, with Ellon the most frequent at every 10-15 minutes peak time, to Craibstone the least frequent at every 30 minutes. Frequency of services also correlates with usage as Kingswells and Ellon represent the two most used park and rides, with Craibstone the least used. This is also demonstrated by an increase of patronage at Kingswells correlating with an increase in service frequency, from every 15-30 minutes in 2016 to every 12 minutes in 2017.
3.83. There is no charge to use the Park and Ride sites or their facilities. First Bus operate a special day ticket of £3.50 for park and ride sites. As of 2019 this is only applicable to the Bridge of Don Park and Ride. Stagecoach provide a special park and ride fare of £6.20 for a day return from Ellon and £3 for a day return from Kingswells park and ride.
3.84. Due to its proximity to the airport, Craibstone Park and Ride has a time limit of 36 hours parking, which is enforced by Aberdeen City Council wardens. There are no similar restrictions at the other park and ride sites.
3.85. Further information on the park and ride sites can be accessed from the Park & Ride Market Research and Action Plan.
Cars attracted to P&R
Estimated km "saved" per
year
Estimated Tonnes Carbon
"saved"(2) per year
2018 2018 2018
Bridge of Don 56 209,664 0.032
Ellon 163 2,746,224 0.418
Kingswells 189 1,179,360 0.180
Craibstone 7 39,312 0.006
Total 415 4,174,560 0.636
(2) Based on average car at ………. 0.18064 gCO2e/km
and bus emission of ……. 0.02837 gCO2e/km
Saving per km mode switch 0.15227 gCO2e/km
Page 175
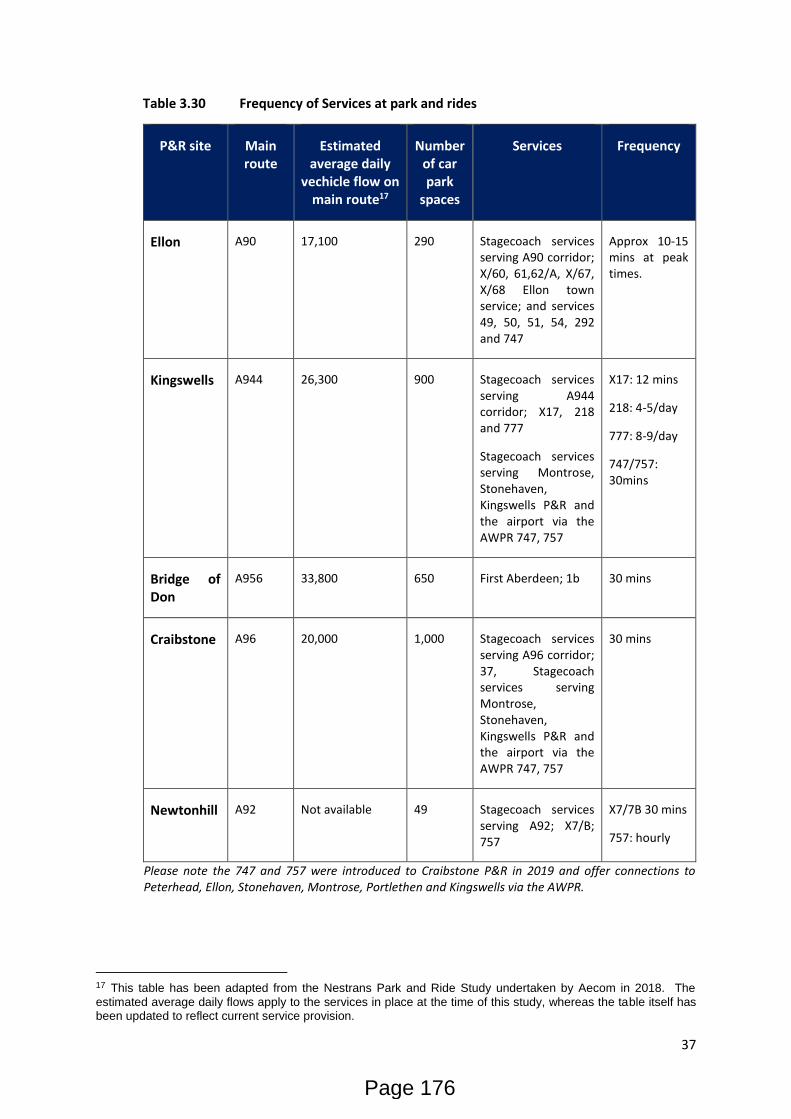
37
Table 3.30 Frequency of Services at park and rides
P&R site Main route
Estimated average daily
vechicle flow on main route17
Number of car park
spaces
Services Frequency
Ellon A90 17,100 290 Stagecoach services serving A90 corridor; X/60, 61,62/A, X/67, X/68 Ellon town service; and services 49, 50, 51, 54, 292 and 747
Approx 10-15 mins at peak times.
Kingswells A944 26,300 900 Stagecoach services serving A944 corridor; X17, 218 and 777
Stagecoach services serving Montrose, Stonehaven, Kingswells P&R and the airport via the AWPR 747, 757
X17: 12 mins
218: 4-5/day
777: 8-9/day
747/757: 30mins
Bridge of Don
A956 33,800 650 First Aberdeen; 1b 30 mins
Craibstone A96 20,000 1,000 Stagecoach services serving A96 corridor; 37, Stagecoach services serving Montrose, Stonehaven, Kingswells P&R and the airport via the AWPR 747, 757
30 mins
Newtonhill A92 Not available 49 Stagecoach services serving A92; X7/B; 757
X7/7B 30 mins
757: hourly
Please note the 747 and 757 were introduced to Craibstone P&R in 2019 and offer connections to Peterhead, Ellon, Stonehaven, Montrose, Portlethen and Kingswells via the AWPR.
17 This table has been adapted from the Nestrans Park and Ride Study undertaken by Aecom in 2018. The
estimated average daily flows apply to the services in place at the time of this study, whereas the table itself has been updated to reflect current service provision.
Page 176
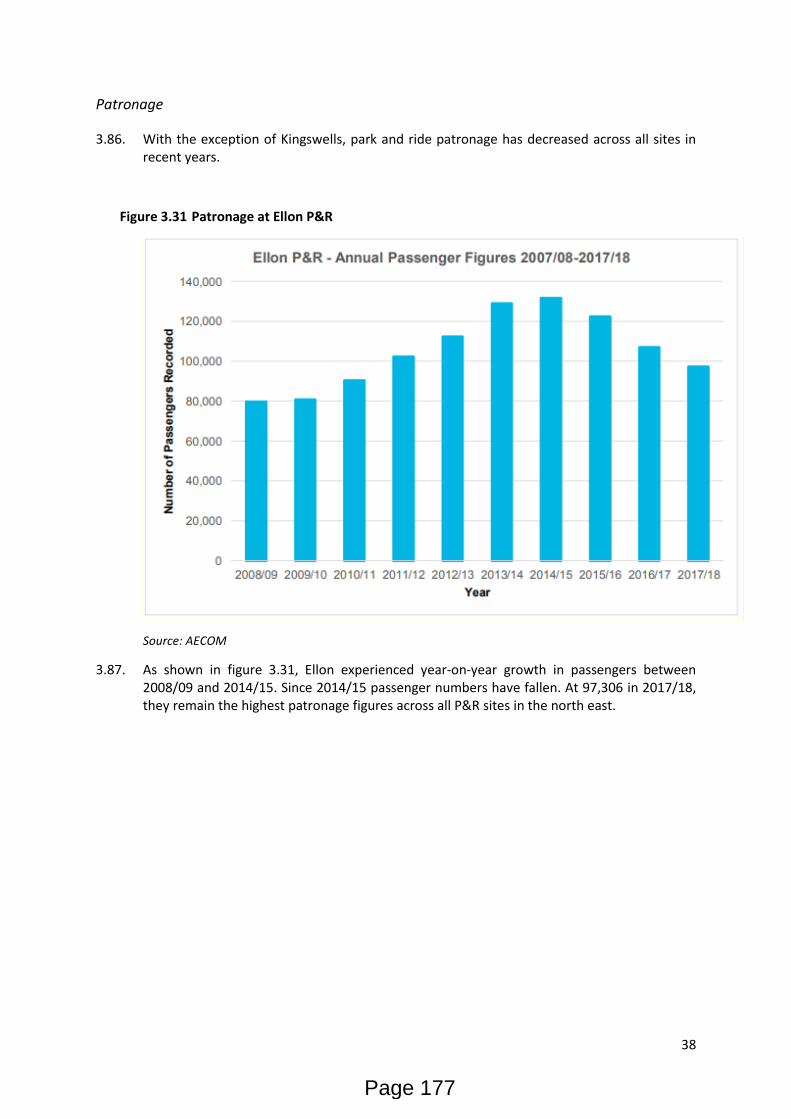
38
Patronage
3.86. With the exception of Kingswells, park and ride patronage has decreased across all sites in recent years.
Figure 3.31 Patronage at Ellon P&R
Source: AECOM
3.87. As shown in figure 3.31, Ellon experienced year-on-year growth in passengers between 2008/09 and 2014/15. Since 2014/15 passenger numbers have fallen. At 97,306 in 2017/18, they remain the highest patronage figures across all P&R sites in the north east.
Page 177
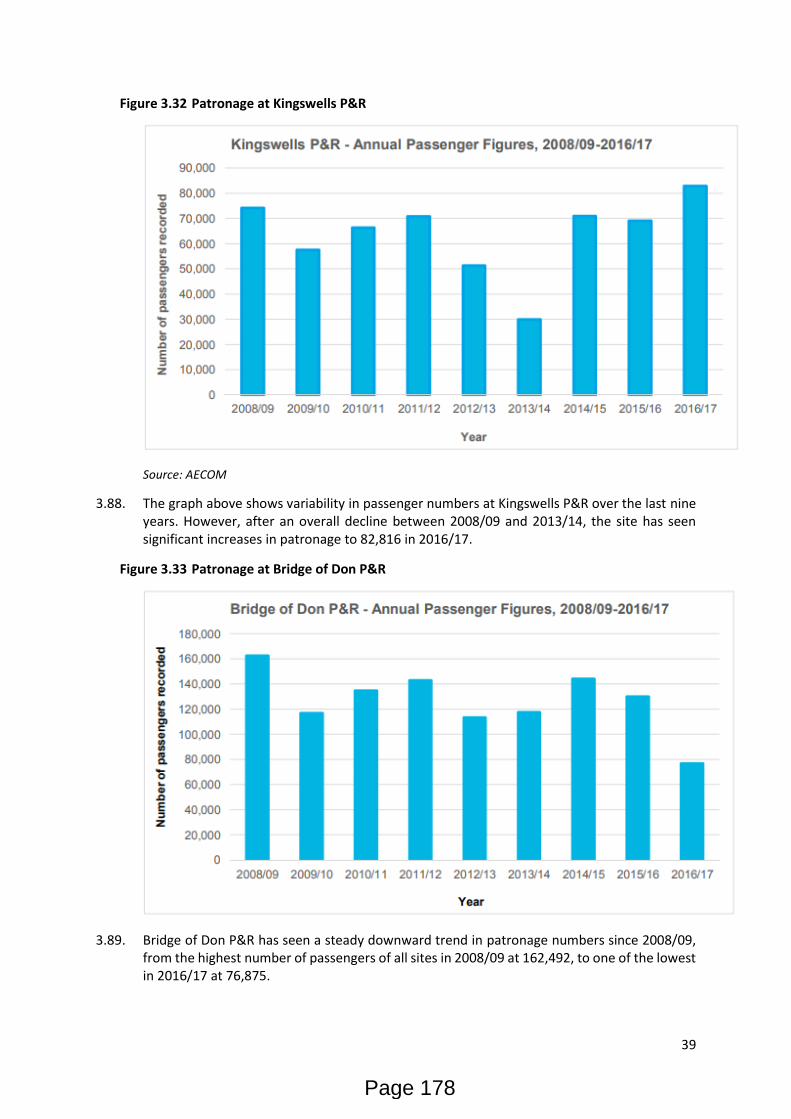
39
Figure 3.32 Patronage at Kingswells P&R
Source: AECOM
3.88. The graph above shows variability in passenger numbers at Kingswells P&R over the last nine years. However, after an overall decline between 2008/09 and 2013/14, the site has seen significant increases in patronage to 82,816 in 2016/17.
Figure 3.33 Patronage at Bridge of Don P&R
3.89. Bridge of Don P&R has seen a steady downward trend in patronage numbers since 2008/09, from the highest number of passengers of all sites in 2008/09 at 162,492, to one of the lowest in 2016/17 at 76,875.
Page 178
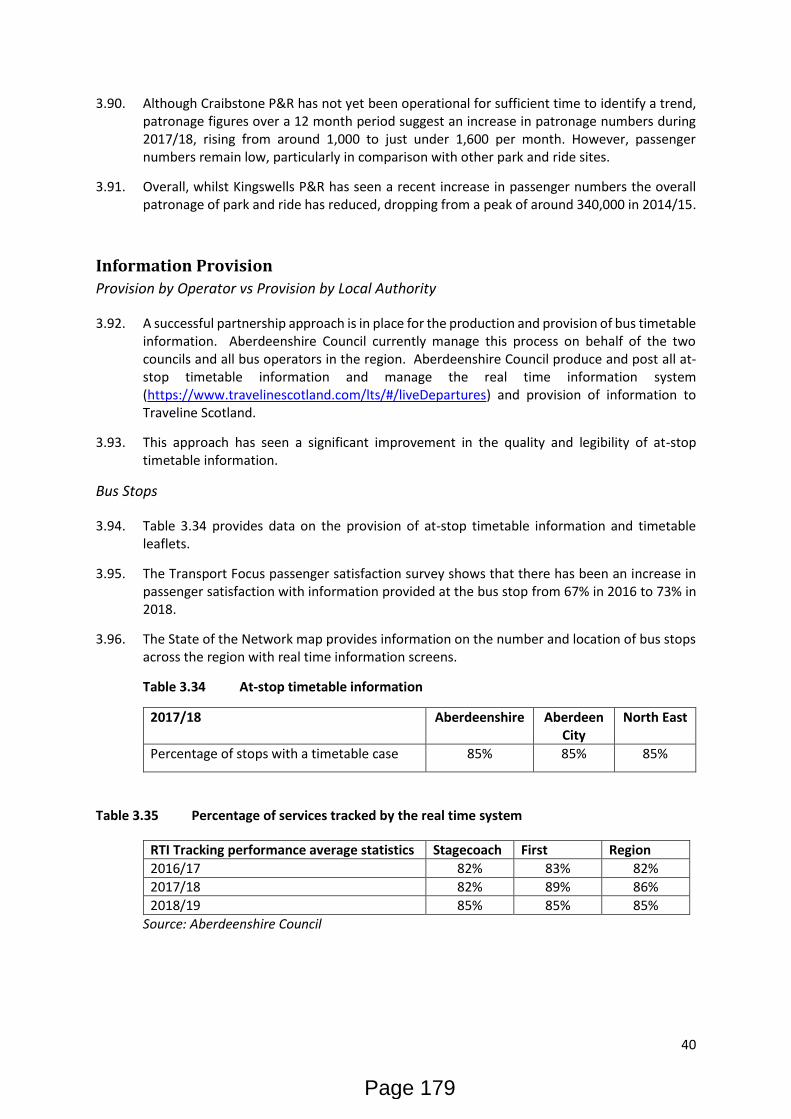
40
3.90. Although Craibstone P&R has not yet been operational for sufficient time to identify a trend, patronage figures over a 12 month period suggest an increase in patronage numbers during 2017/18, rising from around 1,000 to just under 1,600 per month. However, passenger numbers remain low, particularly in comparison with other park and ride sites.
3.91. Overall, whilst Kingswells P&R has seen a recent increase in passenger numbers the overall patronage of park and ride has reduced, dropping from a peak of around 340,000 in 2014/15.
Information Provision
Provision by Operator vs Provision by Local Authority
3.92. A successful partnership approach is in place for the production and provision of bus timetable information. Aberdeenshire Council currently manage this process on behalf of the two councils and all bus operators in the region. Aberdeenshire Council produce and post all at-stop timetable information and manage the real time information system (https://www.travelinescotland.com/lts/#/liveDepartures) and provision of information to Traveline Scotland.
3.93. This approach has seen a significant improvement in the quality and legibility of at-stop timetable information.
Bus Stops
3.94. Table 3.34 provides data on the provision of at-stop timetable information and timetable leaflets.
3.95. The Transport Focus passenger satisfaction survey shows that there has been an increase in passenger satisfaction with information provided at the bus stop from 67% in 2016 to 73% in 2018.
3.96. The State of the Network map provides information on the number and location of bus stops across the region with real time information screens.
Table 3.34 At-stop timetable information
2017/18 Aberdeenshire Aberdeen City
North East
Percentage of stops with a timetable case 85% 85% 85%
Table 3.35 Percentage of services tracked by the real time system
RTI Tracking performance average statistics Stagecoach First Region
2016/17 82% 83% 82%
2017/18 82% 89% 86%
2018/19 85% 85% 85%
Source: Aberdeenshire Council
Page 179
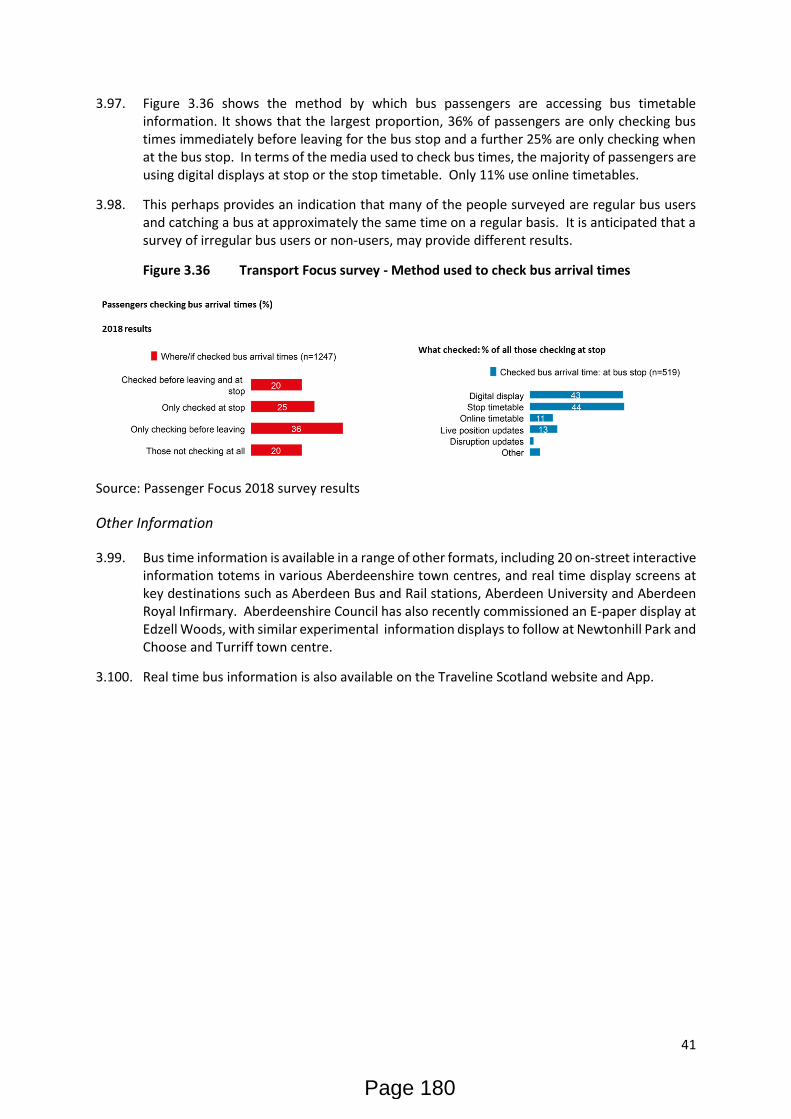
41
3.97. Figure 3.36 shows the method by which bus passengers are accessing bus timetable information. It shows that the largest proportion, 36% of passengers are only checking bus times immediately before leaving for the bus stop and a further 25% are only checking when at the bus stop. In terms of the media used to check bus times, the majority of passengers are using digital displays at stop or the stop timetable. Only 11% use online timetables.
3.98. This perhaps provides an indication that many of the people surveyed are regular bus users and catching a bus at approximately the same time on a regular basis. It is anticipated that a survey of irregular bus users or non-users, may provide different results.
Figure 3.36 Transport Focus survey - Method used to check bus arrival times
Source: Passenger Focus 2018 survey results
Other Information
3.99. Bus time information is available in a range of other formats, including 20 on-street interactive information totems in various Aberdeenshire town centres, and real time display screens at key destinations such as Aberdeen Bus and Rail stations, Aberdeen University and Aberdeen Royal Infirmary. Aberdeenshire Council has also recently commissioned an E-paper display at Edzell Woods, with similar experimental information displays to follow at Newtonhill Park and Choose and Turriff town centre.
3.100. Real time bus information is also available on the Traveline Scotland website and App.
Page 180
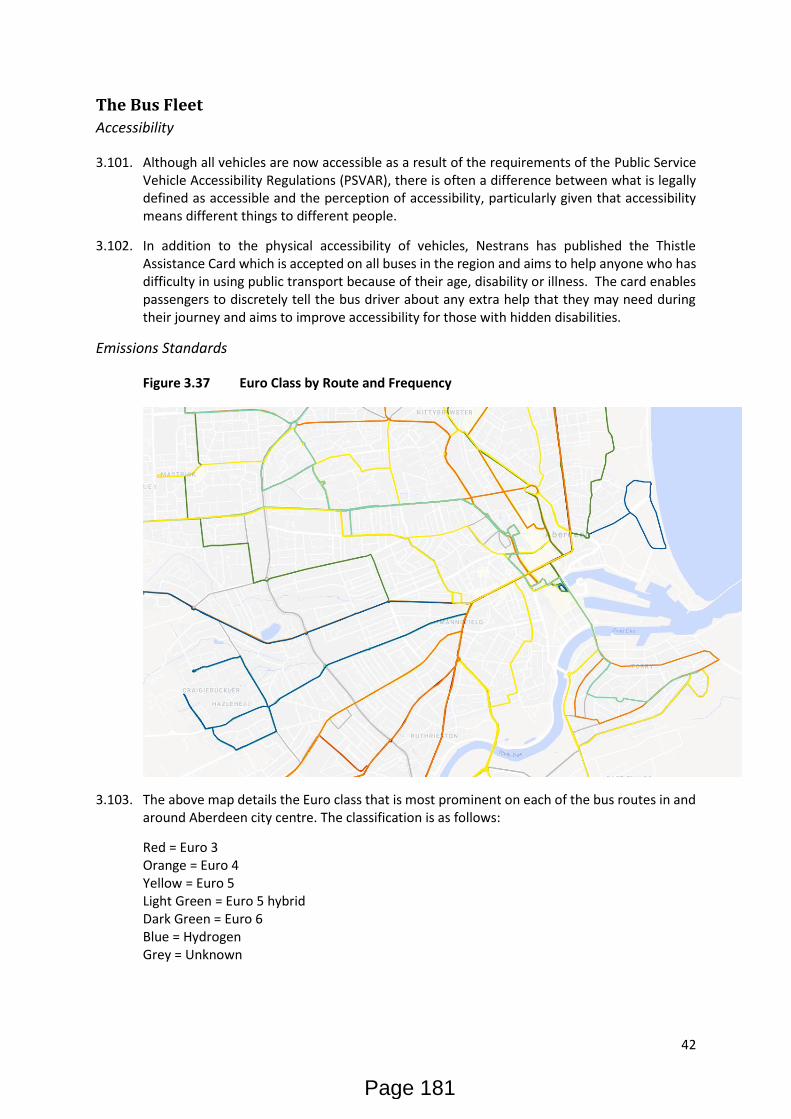
42
The Bus Fleet
Accessibility
3.101. Although all vehicles are now accessible as a result of the requirements of the Public Service Vehicle Accessibility Regulations (PSVAR), there is often a difference between what is legally defined as accessible and the perception of accessibility, particularly given that accessibility means different things to different people.
3.102. In addition to the physical accessibility of vehicles, Nestrans has published the Thistle Assistance Card which is accepted on all buses in the region and aims to help anyone who has difficulty in using public transport because of their age, disability or illness. The card enables passengers to discretely tell the bus driver about any extra help that they may need during their journey and aims to improve accessibility for those with hidden disabilities.
Emissions Standards
Figure 3.37 Euro Class by Route and Frequency
3.103. The above map details the Euro class that is most prominent on each of the bus routes in and around Aberdeen city centre. The classification is as follows:
Red = Euro 3 Orange = Euro 4 Yellow = Euro 5 Light Green = Euro 5 hybrid Dark Green = Euro 6 Blue = Hydrogen Grey = Unknown
Page 181
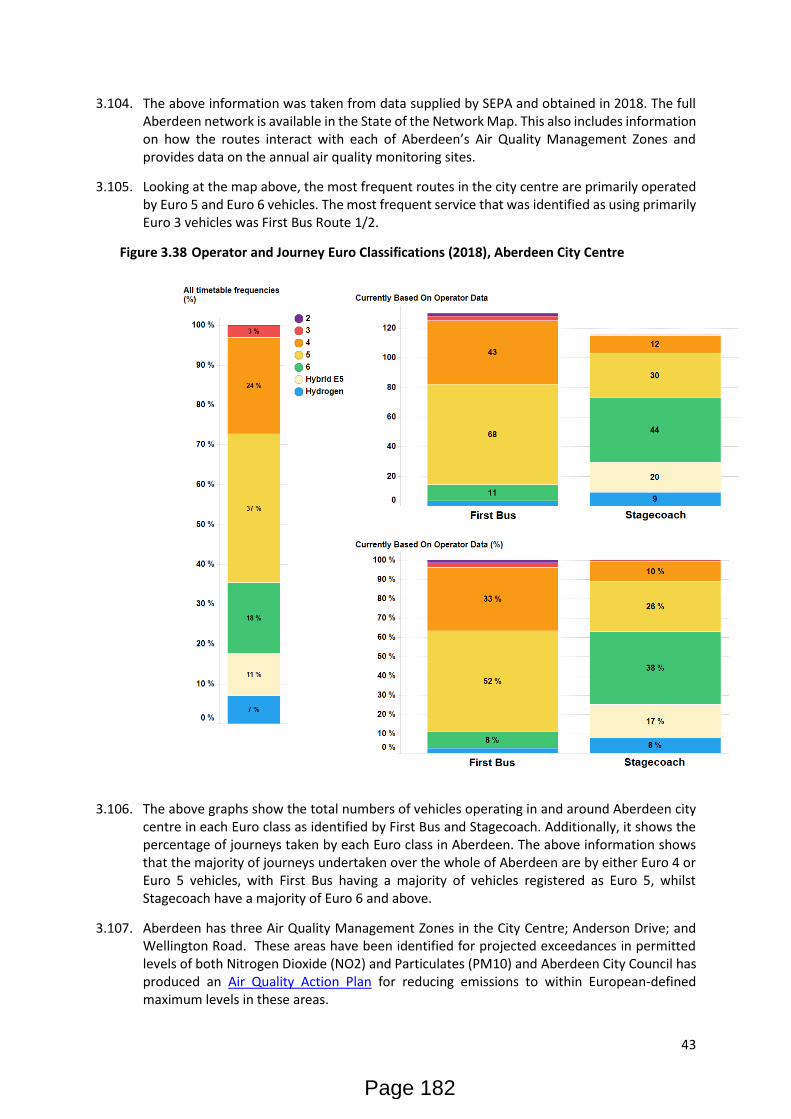
43
3.104. The above information was taken from data supplied by SEPA and obtained in 2018. The full Aberdeen network is available in the State of the Network Map. This also includes information on how the routes interact with each of Aberdeen’s Air Quality Management Zones and provides data on the annual air quality monitoring sites.
3.105. Looking at the map above, the most frequent routes in the city centre are primarily operated by Euro 5 and Euro 6 vehicles. The most frequent service that was identified as using primarily Euro 3 vehicles was First Bus Route 1/2.
Figure 3.38 Operator and Journey Euro Classifications (2018), Aberdeen City Centre
3.106. The above graphs show the total numbers of vehicles operating in and around Aberdeen city centre in each Euro class as identified by First Bus and Stagecoach. Additionally, it shows the percentage of journeys taken by each Euro class in Aberdeen. The above information shows that the majority of journeys undertaken over the whole of Aberdeen are by either Euro 4 or Euro 5 vehicles, with First Bus having a majority of vehicles registered as Euro 5, whilst Stagecoach have a majority of Euro 6 and above.
3.107. Aberdeen has three Air Quality Management Zones in the City Centre; Anderson Drive; and Wellington Road. These areas have been identified for projected exceedances in permitted levels of both Nitrogen Dioxide (NO2) and Particulates (PM10) and Aberdeen City Council has produced an Air Quality Action Plan for reducing emissions to within European-defined maximum levels in these areas.
Page 182
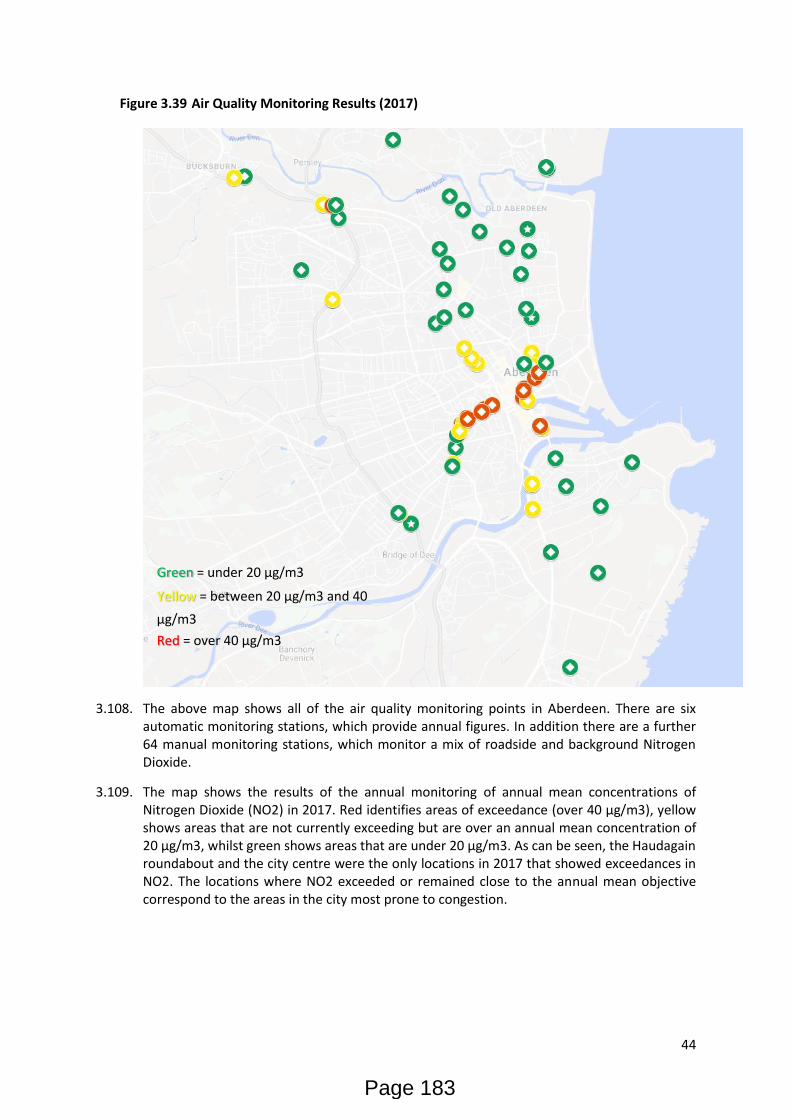
44
Figure 3.39 Air Quality Monitoring Results (2017)
3.108. The above map shows all of the air quality monitoring points in Aberdeen. There are six automatic monitoring stations, which provide annual figures. In addition there are a further 64 manual monitoring stations, which monitor a mix of roadside and background Nitrogen Dioxide.
3.109. The map shows the results of the annual monitoring of annual mean concentrations of Nitrogen Dioxide (NO2) in 2017. Red identifies areas of exceedance (over 40 µg/m3), yellow shows areas that are not currently exceeding but are over an annual mean concentration of 20 µg/m3, whilst green shows areas that are under 20 µg/m3. As can be seen, the Haudagain roundabout and the city centre were the only locations in 2017 that showed exceedances in NO2. The locations where NO2 exceeded or remained close to the annual mean objective correspond to the areas in the city most prone to congestion.
Green = under 20 µg/m3
Yellow = between 20 µg/m3 and 40
µg/m3
Red = over 40 µg/m3
Page 183
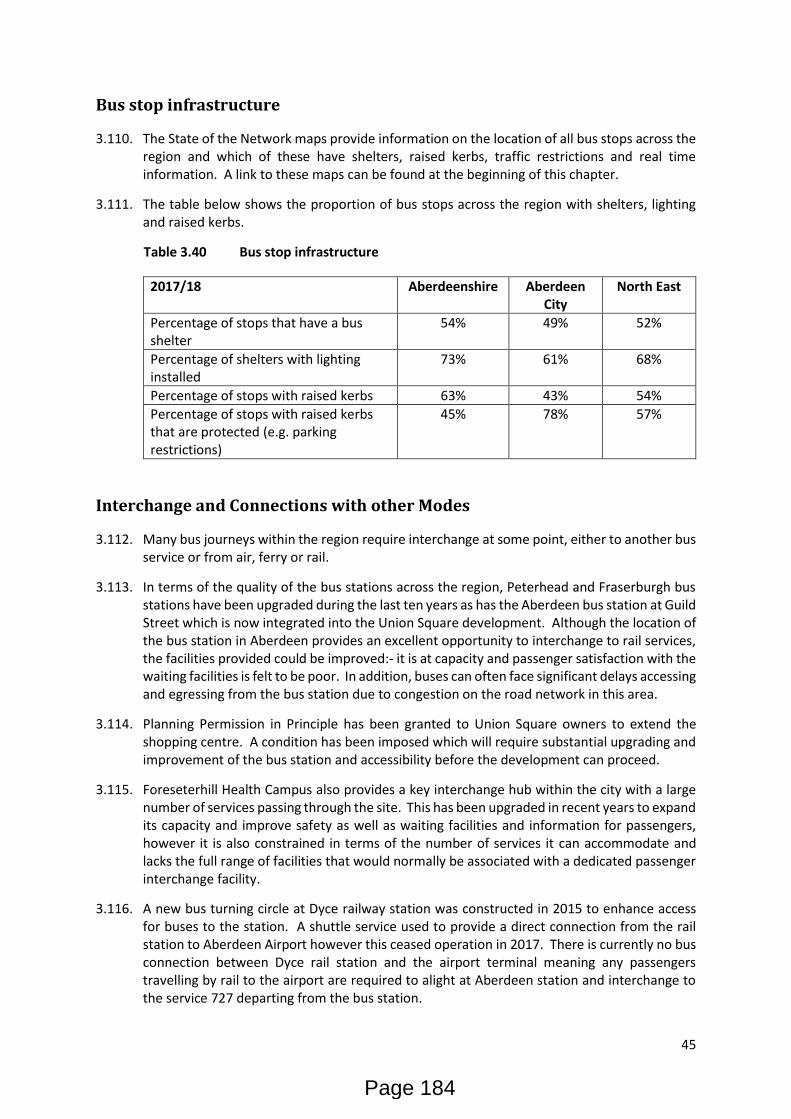
45
Bus stop infrastructure
3.110. The State of the Network maps provide information on the location of all bus stops across the region and which of these have shelters, raised kerbs, traffic restrictions and real time information. A link to these maps can be found at the beginning of this chapter.
3.111. The table below shows the proportion of bus stops across the region with shelters, lighting and raised kerbs.
Table 3.40 Bus stop infrastructure
2017/18 Aberdeenshire Aberdeen City
North East
Percentage of stops that have a bus shelter
54% 49% 52%
Percentage of shelters with lighting installed
73% 61% 68%
Percentage of stops with raised kerbs 63% 43% 54%
Percentage of stops with raised kerbs that are protected (e.g. parking restrictions)
45% 78% 57%
Interchange and Connections with other Modes
3.112. Many bus journeys within the region require interchange at some point, either to another bus service or from air, ferry or rail.
3.113. In terms of the quality of the bus stations across the region, Peterhead and Fraserburgh bus stations have been upgraded during the last ten years as has the Aberdeen bus station at Guild Street which is now integrated into the Union Square development. Although the location of the bus station in Aberdeen provides an excellent opportunity to interchange to rail services, the facilities provided could be improved:- it is at capacity and passenger satisfaction with the waiting facilities is felt to be poor. In addition, buses can often face significant delays accessing and egressing from the bus station due to congestion on the road network in this area.
3.114. Planning Permission in Principle has been granted to Union Square owners to extend the shopping centre. A condition has been imposed which will require substantial upgrading and improvement of the bus station and accessibility before the development can proceed.
3.115. Foreseterhill Health Campus also provides a key interchange hub within the city with a large number of services passing through the site. This has been upgraded in recent years to expand its capacity and improve safety as well as waiting facilities and information for passengers, however it is also constrained in terms of the number of services it can accommodate and lacks the full range of facilities that would normally be associated with a dedicated passenger interchange facility.
3.116. A new bus turning circle at Dyce railway station was constructed in 2015 to enhance access for buses to the station. A shuttle service used to provide a direct connection from the rail station to Aberdeen Airport however this ceased operation in 2017. There is currently no bus connection between Dyce rail station and the airport terminal meaning any passengers travelling by rail to the airport are required to alight at Aberdeen station and interchange to the service 727 departing from the bus station.
Page 184
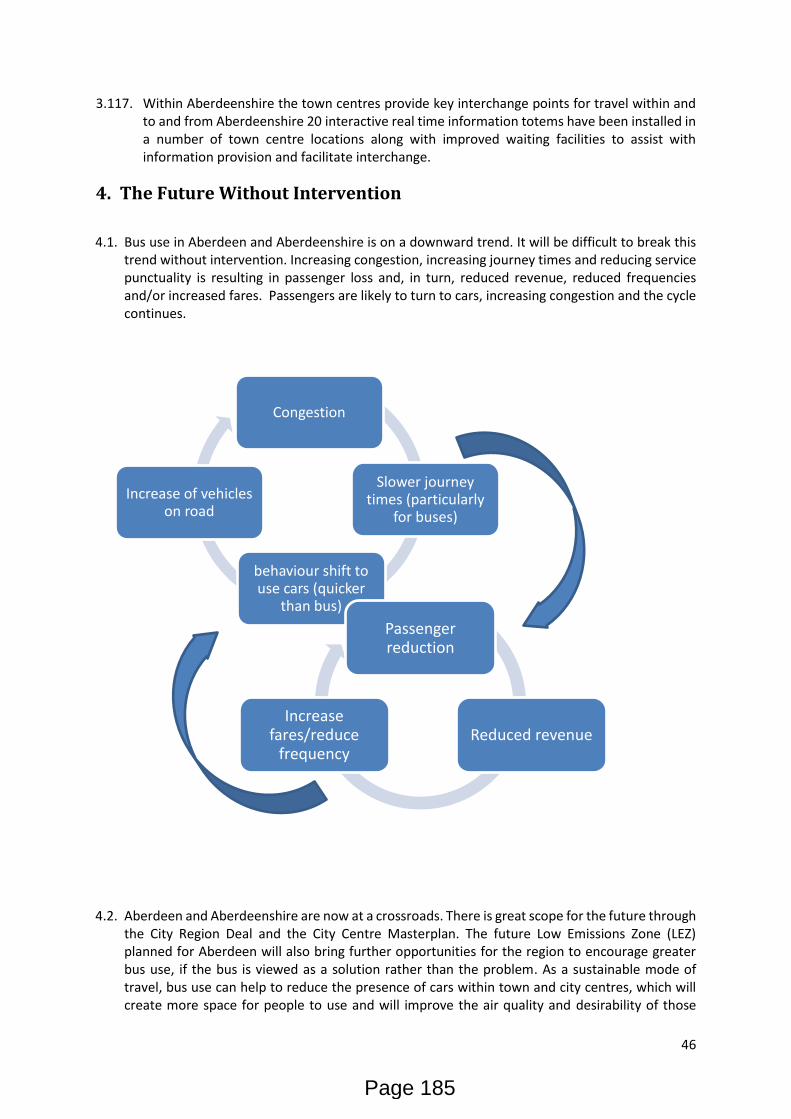
46
3.117. Within Aberdeenshire the town centres provide key interchange points for travel within and to and from Aberdeenshire 20 interactive real time information totems have been installed in a number of town centre locations along with improved waiting facilities to assist with information provision and facilitate interchange.
4. The Future Without Intervention
4.1. Bus use in Aberdeen and Aberdeenshire is on a downward trend. It will be difficult to break this
trend without intervention. Increasing congestion, increasing journey times and reducing service punctuality is resulting in passenger loss and, in turn, reduced revenue, reduced frequencies and/or increased fares. Passengers are likely to turn to cars, increasing congestion and the cycle continues.
4.2. Aberdeen and Aberdeenshire are now at a crossroads. There is great scope for the future through the City Region Deal and the City Centre Masterplan. The future Low Emissions Zone (LEZ) planned for Aberdeen will also bring further opportunities for the region to encourage greater bus use, if the bus is viewed as a solution rather than the problem. As a sustainable mode of travel, bus use can help to reduce the presence of cars within town and city centres, which will create more space for people to use and will improve the air quality and desirability of those
Congestion
Slower journey times (particularly
for buses)
behaviour shift to use cars (quicker
than bus)
Increase of vehicles on road
Passenger reduction
Reduced revenueIncrease
fares/reduce frequency
Page 185
47
places. The public wants pleasant walkable neighbourhoods and an efficient and effective bus network can help make that happen.
4.3. However, to do so there needs to be a will by all stakeholders and at all levels to make this happen. The report Improving Air Quality in Towns and Cities18 recognises that bus use is integral to any outcome that aims to improve the quality of towns and successfully implement a LEZ. If buses are not recognised as integral to the solution, the downward spiral caused by congestion will continue and will negatively affect those without access to a car.
4.4. The Regional Transport Strategy and supporting documents will seek to ensure that transport options are available, that developing the economy is not solely dependent on private cars and that objectives covering accessibility, fairness and environmental improvements are met. To achieve this, the bus will need to be a key element of a balanced strategy and an important factor in ensuring the vision is delivered.
18 Improving Air Quality in Towns and Cities, Professor David Begg 2017
Page 186
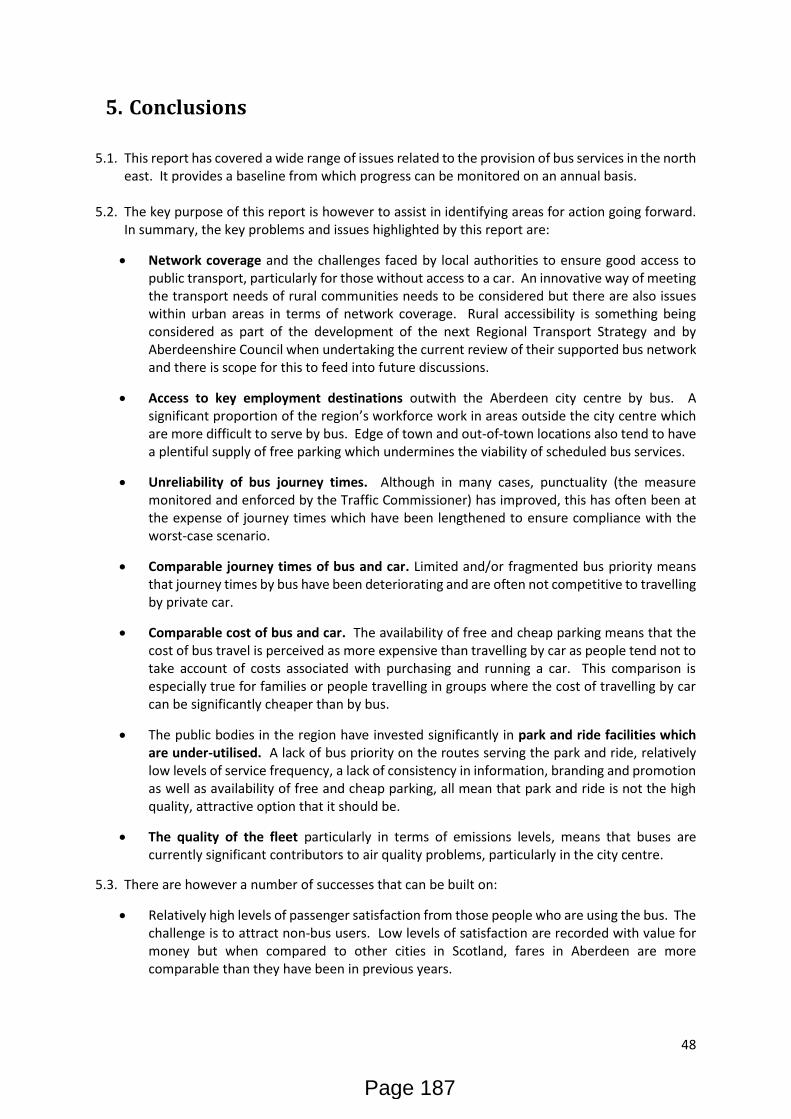
48
5. Conclusions
5.1. This report has covered a wide range of issues related to the provision of bus services in the north east. It provides a baseline from which progress can be monitored on an annual basis.
5.2. The key purpose of this report is however to assist in identifying areas for action going forward. In summary, the key problems and issues highlighted by this report are:
• Network coverage and the challenges faced by local authorities to ensure good access to public transport, particularly for those without access to a car. An innovative way of meeting the transport needs of rural communities needs to be considered but there are also issues within urban areas in terms of network coverage. Rural accessibility is something being considered as part of the development of the next Regional Transport Strategy and by Aberdeenshire Council when undertaking the current review of their supported bus network and there is scope for this to feed into future discussions.
• Access to key employment destinations outwith the Aberdeen city centre by bus. A significant proportion of the region’s workforce work in areas outside the city centre which are more difficult to serve by bus. Edge of town and out-of-town locations also tend to have a plentiful supply of free parking which undermines the viability of scheduled bus services.
• Unreliability of bus journey times. Although in many cases, punctuality (the measure monitored and enforced by the Traffic Commissioner) has improved, this has often been at the expense of journey times which have been lengthened to ensure compliance with the worst-case scenario.
• Comparable journey times of bus and car. Limited and/or fragmented bus priority means that journey times by bus have been deteriorating and are often not competitive to travelling by private car.
• Comparable cost of bus and car. The availability of free and cheap parking means that the cost of bus travel is perceived as more expensive than travelling by car as people tend not to take account of costs associated with purchasing and running a car. This comparison is especially true for families or people travelling in groups where the cost of travelling by car can be significantly cheaper than by bus.
• The public bodies in the region have invested significantly in park and ride facilities which are under-utilised. A lack of bus priority on the routes serving the park and ride, relatively low levels of service frequency, a lack of consistency in information, branding and promotion as well as availability of free and cheap parking, all mean that park and ride is not the high quality, attractive option that it should be.
• The quality of the fleet particularly in terms of emissions levels, means that buses are currently significant contributors to air quality problems, particularly in the city centre.
5.3. There are however a number of successes that can be built on:
• Relatively high levels of passenger satisfaction from those people who are using the bus. The challenge is to attract non-bus users. Low levels of satisfaction are recorded with value for money but when compared to other cities in Scotland, fares in Aberdeen are more comparable than they have been in previous years.
Page 187
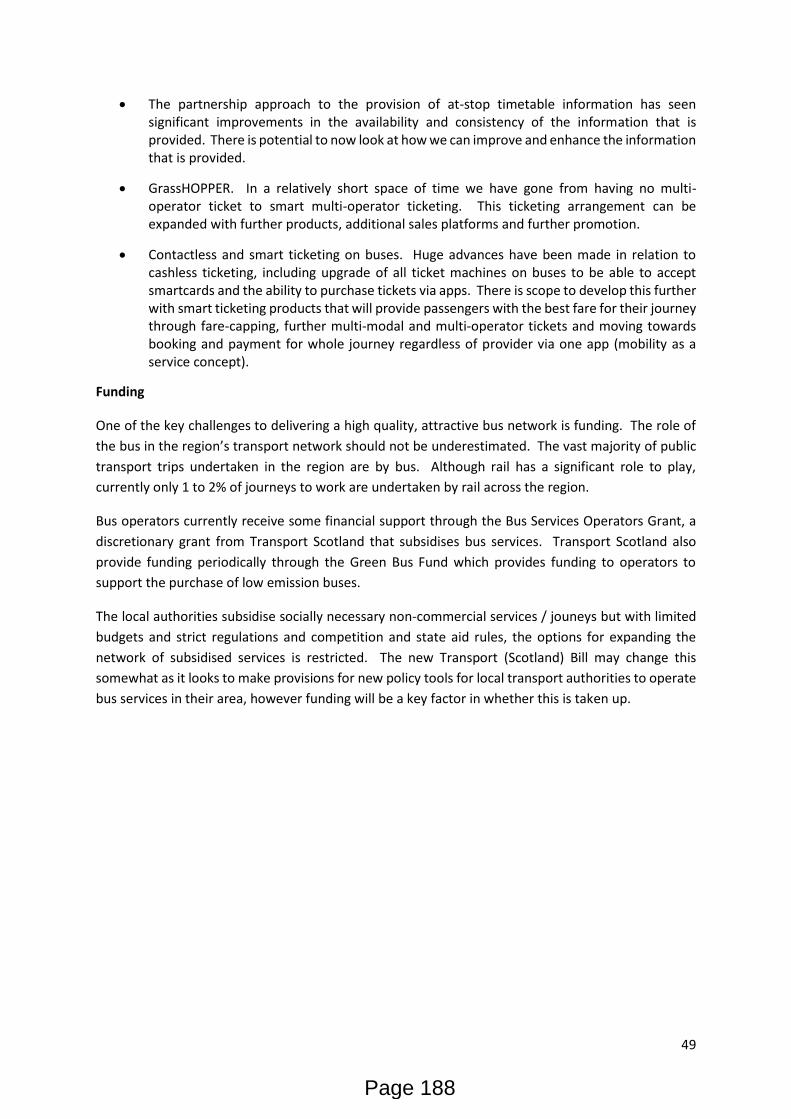
49
• The partnership approach to the provision of at-stop timetable information has seen significant improvements in the availability and consistency of the information that is provided. There is potential to now look at how we can improve and enhance the information that is provided.
• GrassHOPPER. In a relatively short space of time we have gone from having no multi-operator ticket to smart multi-operator ticketing. This ticketing arrangement can be expanded with further products, additional sales platforms and further promotion.
• Contactless and smart ticketing on buses. Huge advances have been made in relation to cashless ticketing, including upgrade of all ticket machines on buses to be able to accept smartcards and the ability to purchase tickets via apps. There is scope to develop this further with smart ticketing products that will provide passengers with the best fare for their journey through fare-capping, further multi-modal and multi-operator tickets and moving towards booking and payment for whole journey regardless of provider via one app (mobility as a service concept).
Funding
One of the key challenges to delivering a high quality, attractive bus network is funding. The role of
the bus in the region’s transport network should not be underestimated. The vast majority of public
transport trips undertaken in the region are by bus. Although rail has a significant role to play,
currently only 1 to 2% of journeys to work are undertaken by rail across the region.
Bus operators currently receive some financial support through the Bus Services Operators Grant, a
discretionary grant from Transport Scotland that subsidises bus services. Transport Scotland also
provide funding periodically through the Green Bus Fund which provides funding to operators to
support the purchase of low emission buses.
The local authorities subsidise socially necessary non-commercial services / jouneys but with limited
budgets and strict regulations and competition and state aid rules, the options for expanding the
network of subsidised services is restricted. The new Transport (Scotland) Bill may change this
somewhat as it looks to make provisions for new policy tools for local transport authorities to operate
bus services in their area, however funding will be a key factor in whether this is taken up.
Page 188
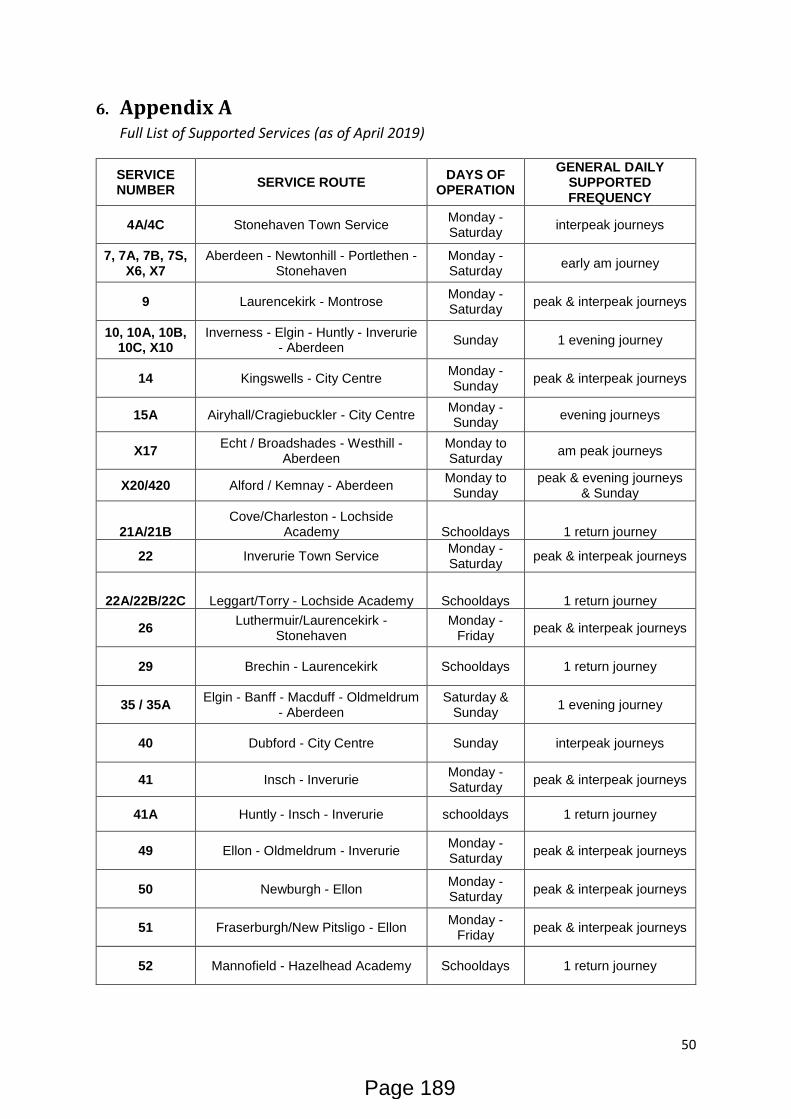
50
6. Appendix A
Full List of Supported Services (as of April 2019)
SERVICE NUMBER
SERVICE ROUTE DAYS OF
OPERATION
GENERAL DAILY SUPPORTED FREQUENCY
4A/4C Stonehaven Town Service Monday - Saturday
interpeak journeys
7, 7A, 7B, 7S, X6, X7
Aberdeen - Newtonhill - Portlethen - Stonehaven
Monday - Saturday
early am journey
9 Laurencekirk - Montrose Monday - Saturday
peak & interpeak journeys
10, 10A, 10B, 10C, X10
Inverness - Elgin - Huntly - Inverurie - Aberdeen
Sunday 1 evening journey
14 Kingswells - City Centre Monday - Sunday
peak & interpeak journeys
15A Airyhall/Cragiebuckler - City Centre Monday - Sunday
evening journeys
X17 Echt / Broadshades - Westhill -
Aberdeen Monday to Saturday
am peak journeys
X20/420 Alford / Kemnay - Aberdeen Monday to
Sunday peak & evening journeys
& Sunday
21A/21B Cove/Charleston - Lochside
Academy Schooldays 1 return journey
22 Inverurie Town Service Monday - Saturday
peak & interpeak journeys
22A/22B/22C Leggart/Torry - Lochside Academy Schooldays 1 return journey
26 Luthermuir/Laurencekirk -
Stonehaven Monday -
Friday peak & interpeak journeys
29 Brechin - Laurencekirk Schooldays 1 return journey
35 / 35A Elgin - Banff - Macduff - Oldmeldrum
- Aberdeen Saturday &
Sunday 1 evening journey
40 Dubford - City Centre Sunday interpeak journeys
41 Insch - Inverurie Monday - Saturday
peak & interpeak journeys
41A Huntly - Insch - Inverurie schooldays 1 return journey
49 Ellon - Oldmeldrum - Inverurie Monday - Saturday
peak & interpeak journeys
50 Newburgh - Ellon Monday - Saturday
peak & interpeak journeys
51 Fraserburgh/New Pitsligo - Ellon Monday -
Friday peak & interpeak journeys
52 Mannofield - Hazelhead Academy Schooldays 1 return journey
Page 189
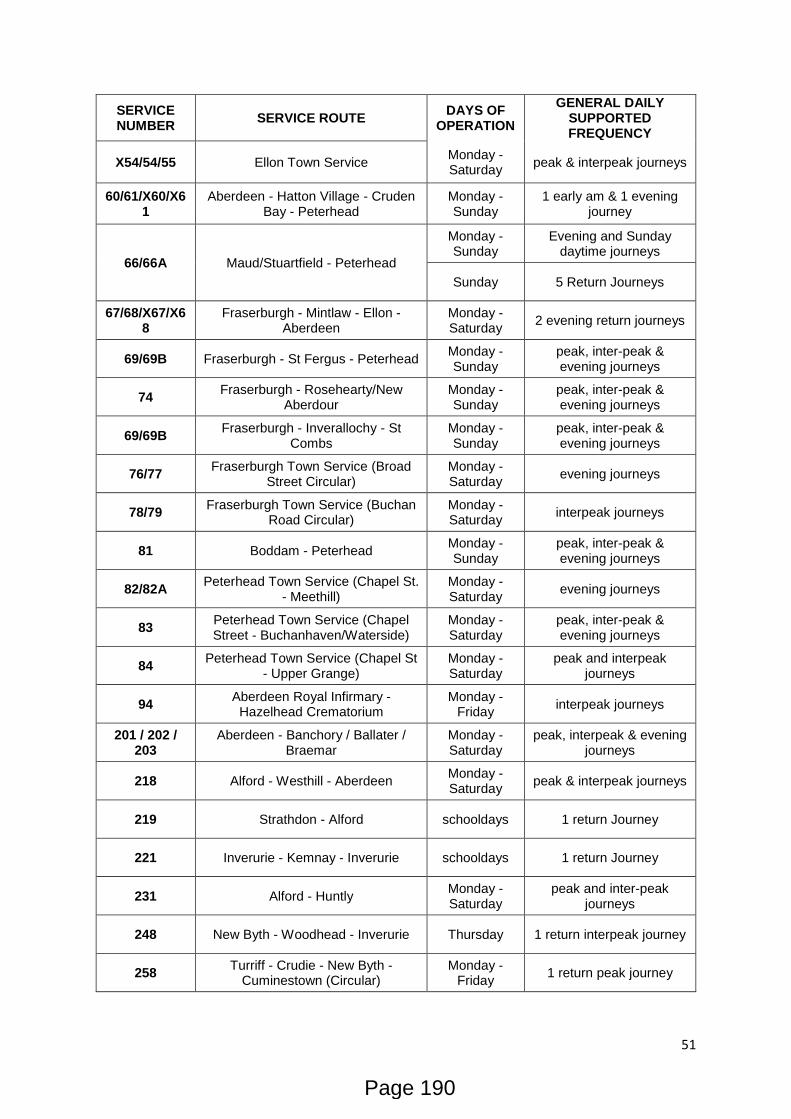
51
SERVICE NUMBER
SERVICE ROUTE DAYS OF
OPERATION
GENERAL DAILY SUPPORTED FREQUENCY
X54/54/55 Ellon Town Service Monday - Saturday
peak & interpeak journeys
60/61/X60/X61
Aberdeen - Hatton Village - Cruden Bay - Peterhead
Monday - Sunday
1 early am & 1 evening journey
66/66A Maud/Stuartfield - Peterhead
Monday - Sunday
Evening and Sunday daytime journeys
Sunday 5 Return Journeys
67/68/X67/X68
Fraserburgh - Mintlaw - Ellon - Aberdeen
Monday - Saturday
2 evening return journeys
69/69B Fraserburgh - St Fergus - Peterhead Monday - Sunday
peak, inter-peak & evening journeys
74 Fraserburgh - Rosehearty/New
Aberdour Monday - Sunday
peak, inter-peak & evening journeys
69/69B Fraserburgh - Inverallochy - St
Combs Monday - Sunday
peak, inter-peak & evening journeys
76/77 Fraserburgh Town Service (Broad
Street Circular) Monday - Saturday
evening journeys
78/79 Fraserburgh Town Service (Buchan
Road Circular) Monday - Saturday
interpeak journeys
81 Boddam - Peterhead Monday - Sunday
peak, inter-peak & evening journeys
82/82A Peterhead Town Service (Chapel St.
- Meethill) Monday - Saturday
evening journeys
83 Peterhead Town Service (Chapel Street - Buchanhaven/Waterside)
Monday - Saturday
peak, inter-peak & evening journeys
84 Peterhead Town Service (Chapel St
- Upper Grange) Monday - Saturday
peak and interpeak journeys
94 Aberdeen Royal Infirmary - Hazelhead Crematorium
Monday - Friday
interpeak journeys
201 / 202 / 203
Aberdeen - Banchory / Ballater / Braemar
Monday - Saturday
peak, interpeak & evening journeys
218 Alford - Westhill - Aberdeen Monday - Saturday
peak & interpeak journeys
219 Strathdon - Alford schooldays 1 return Journey
221 Inverurie - Kemnay - Inverurie schooldays 1 return Journey
231 Alford - Huntly Monday - Saturday
peak and inter-peak journeys
248 New Byth - Woodhead - Inverurie Thursday 1 return interpeak journey
258 Turriff - Crudie - New Byth -
Cuminestown (Circular) Monday -
Friday 1 return peak journey
Page 190
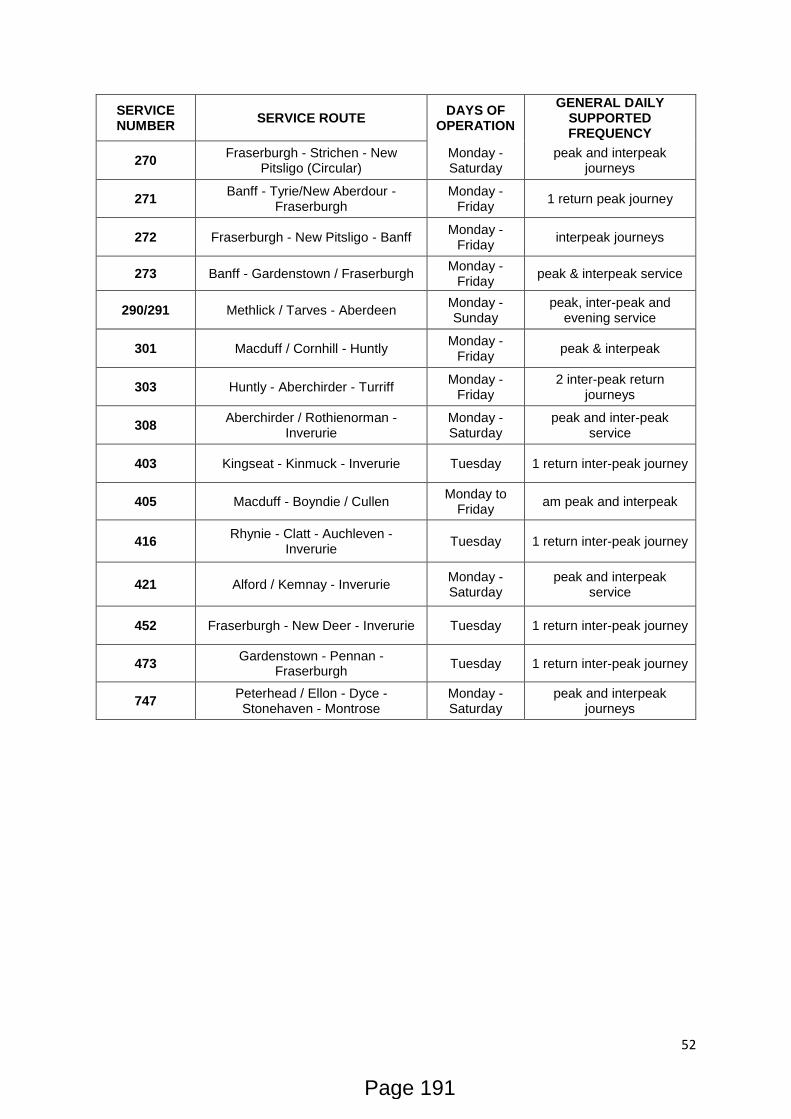
52
SERVICE NUMBER
SERVICE ROUTE DAYS OF
OPERATION
GENERAL DAILY SUPPORTED FREQUENCY
270 Fraserburgh - Strichen - New
Pitsligo (Circular) Monday - Saturday
peak and interpeak journeys
271 Banff - Tyrie/New Aberdour -
Fraserburgh Monday -
Friday 1 return peak journey
272 Fraserburgh - New Pitsligo - Banff Monday -
Friday interpeak journeys
273 Banff - Gardenstown / Fraserburgh Monday -
Friday peak & interpeak service
290/291 Methlick / Tarves - Aberdeen Monday - Sunday
peak, inter-peak and evening service
301 Macduff / Cornhill - Huntly Monday -
Friday peak & interpeak
303 Huntly - Aberchirder - Turriff Monday -
Friday 2 inter-peak return
journeys
308 Aberchirder / Rothienorman -
Inverurie Monday - Saturday
peak and inter-peak service
403 Kingseat - Kinmuck - Inverurie Tuesday 1 return inter-peak journey
405 Macduff - Boyndie / Cullen Monday to
Friday am peak and interpeak
416 Rhynie - Clatt - Auchleven -
Inverurie Tuesday 1 return inter-peak journey
421 Alford / Kemnay - Inverurie Monday - Saturday
peak and interpeak service
452 Fraserburgh - New Deer - Inverurie Tuesday 1 return inter-peak journey
473 Gardenstown - Pennan -
Fraserburgh Tuesday 1 return inter-peak journey
747 Peterhead / Ellon - Dyce - Stonehaven - Montrose
Monday - Saturday
peak and interpeak journeys
Page 191

This page is intentionally left blank
Page 192
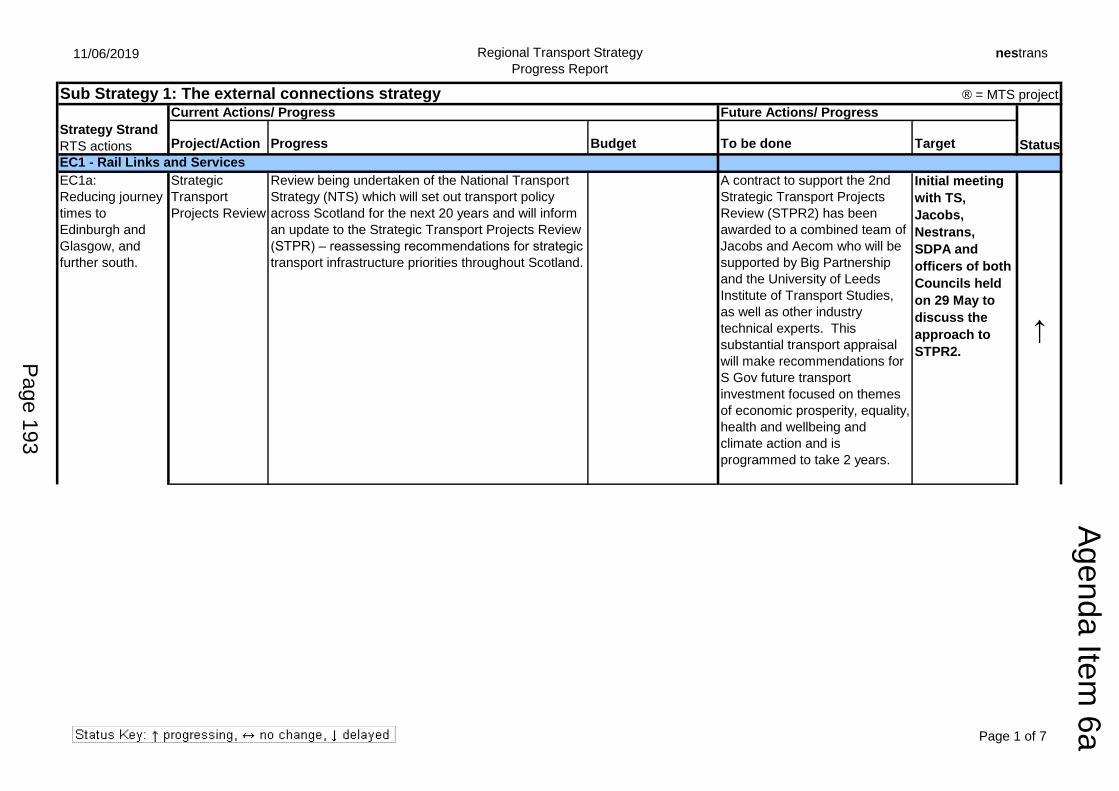
11/06/2019 Regional Transport Strategy
Progress Report
nestrans
Sub Strategy 1: The external connections strategy ® = MTS project
Current Actions/ Progress Future Actions/ Progress
Project/Action Progress Budget To be done Target Status
EC1 - Rail Links and Services
Strategic
Transport
Projects Review
Review being undertaken of the National Transport
Strategy (NTS) which will set out transport policy
across Scotland for the next 20 years and will inform
an update to the Strategic Transport Projects Review
(STPR) – reassessing recommendations for strategic
transport infrastructure priorities throughout Scotland.
A contract to support the 2nd
Strategic Transport Projects
Review (STPR2) has been
awarded to a combined team of
Jacobs and Aecom who will be
supported by Big Partnership
and the University of Leeds
Institute of Transport Studies,
as well as other industry
technical experts. This
substantial transport appraisal
will make recommendations for
S Gov future transport
investment focused on themes
of economic prosperity, equality,
health and wellbeing and
climate action and is
programmed to take 2 years.
Initial meeting
with TS,
Jacobs,
Nestrans,
SDPA and
officers of both
Councils held
on 29 May to
discuss the
approach to
STPR2.
↑
Strategy Strand
RTS actions
EC1a:
Reducing journey
times to
Edinburgh and
Glasgow, and
further south.
Page 1 of 7
Page 193
Agenda Item
6a
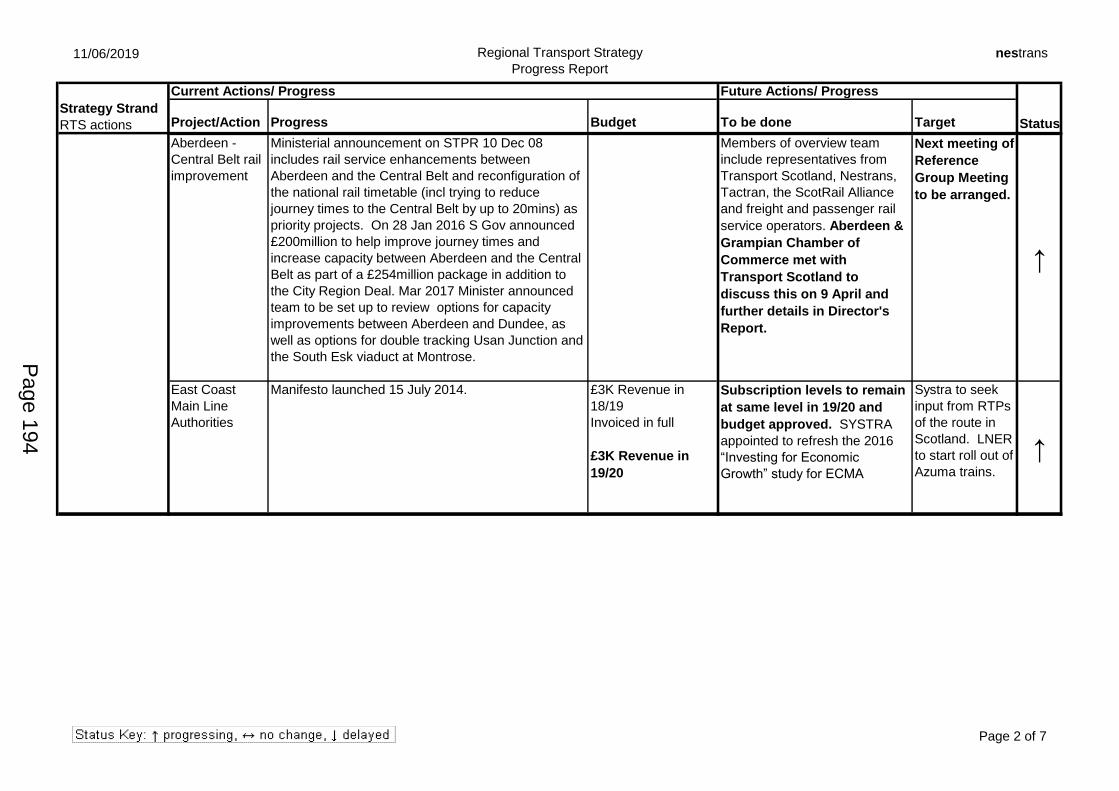
11/06/2019 Regional Transport Strategy
Progress Report
nestrans
Current Actions/ Progress Future Actions/ Progress
Project/Action Progress Budget To be done Target StatusStrategy Strand
RTS actions
Aberdeen -
Central Belt rail
improvement
Ministerial announcement on STPR 10 Dec 08
includes rail service enhancements between
Aberdeen and the Central Belt and reconfiguration of
the national rail timetable (incl trying to reduce
journey times to the Central Belt by up to 20mins) as
priority projects. On 28 Jan 2016 S Gov announced
£200million to help improve journey times and
increase capacity between Aberdeen and the Central
Belt as part of a £254million package in addition to
the City Region Deal. Mar 2017 Minister announced
team to be set up to review options for capacity
improvements between Aberdeen and Dundee, as
well as options for double tracking Usan Junction and
the South Esk viaduct at Montrose.
Members of overview team
include representatives from
Transport Scotland, Nestrans,
Tactran, the ScotRail Alliance
and freight and passenger rail
service operators. Aberdeen &
Grampian Chamber of
Commerce met with
Transport Scotland to
discuss this on 9 April and
further details in Director's
Report.
Next meeting of
Reference
Group Meeting
to be arranged.
↑
East Coast
Main Line
Authorities
Manifesto launched 15 July 2014. £3K Revenue in
18/19
Invoiced in full
£3K Revenue in
19/20
Subscription levels to remain
at same level in 19/20 and
budget approved. SYSTRA
appointed to refresh the 2016
“Investing for Economic
Growth” study for ECMA
Systra to seek
input from RTPs
of the route in
Scotland. LNER
to start roll out of
Azuma trains.
↑
EC1c: High Speed Transport Sec approved plans for HSR route High Speed Rail Stakeholders ↑
EC1a:
Reducing journey
times to
Edinburgh and
Glasgow, and
further south.
Page 2 of 7
Page 194
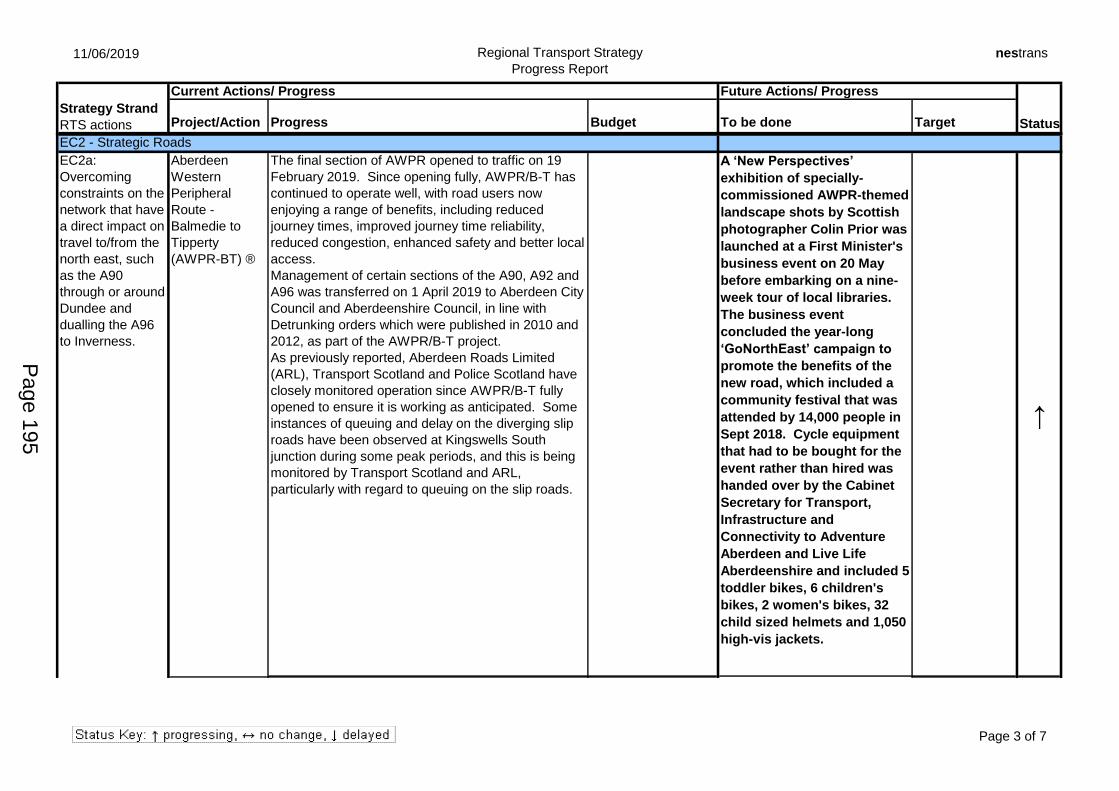
11/06/2019 Regional Transport Strategy
Progress Report
nestrans
Current Actions/ Progress Future Actions/ Progress
Project/Action Progress Budget To be done Target StatusStrategy Strand
RTS actions
EC2 - Strategic Roads
Aberdeen
Western
Peripheral
Route -
Balmedie to
Tipperty
(AWPR-BT) ®
The final section of AWPR opened to traffic on 19
February 2019. Since opening fully, AWPR/B-T has
continued to operate well, with road users now
enjoying a range of benefits, including reduced
journey times, improved journey time reliability,
reduced congestion, enhanced safety and better local
access.
Management of certain sections of the A90, A92 and
A96 was transferred on 1 April 2019 to Aberdeen City
Council and Aberdeenshire Council, in line with
Detrunking orders which were published in 2010 and
2012, as part of the AWPR/B-T project.
As previously reported, Aberdeen Roads Limited
(ARL), Transport Scotland and Police Scotland have
closely monitored operation since AWPR/B-T fully
opened to ensure it is working as anticipated. Some
instances of queuing and delay on the diverging slip
roads have been observed at Kingswells South
junction during some peak periods, and this is being
monitored by Transport Scotland and ARL,
particularly with regard to queuing on the slip roads.
A ‘New Perspectives’
exhibition of specially-
commissioned AWPR-themed
landscape shots by Scottish
photographer Colin Prior was
launched at a First Minister's
business event on 20 May
before embarking on a nine-
week tour of local libraries.
The business event
concluded the year-long
‘GoNorthEast’ campaign to
promote the benefits of the
new road, which included a
community festival that was
attended by 14,000 people in
Sept 2018. Cycle equipment
that had to be bought for the
event rather than hired was
handed over by the Cabinet
Secretary for Transport,
Infrastructure and
Connectivity to Adventure
Aberdeen and Live Life
Aberdeenshire and included 5
toddler bikes, 6 children's
bikes, 2 women's bikes, 32
child sized helmets and 1,050
high-vis jackets.
↑
A92 Signage The A90 between Stonehaven and Blackdog became Traffic management will be
EC2a:
Overcoming
constraints on the
network that have
a direct impact on
travel to/from the
north east, such
as the A90
through or around
Dundee and
dualling the A96
to Inverness.
EC2a (contd)
EC2a (contd)
Page 3 of 7
Page 195
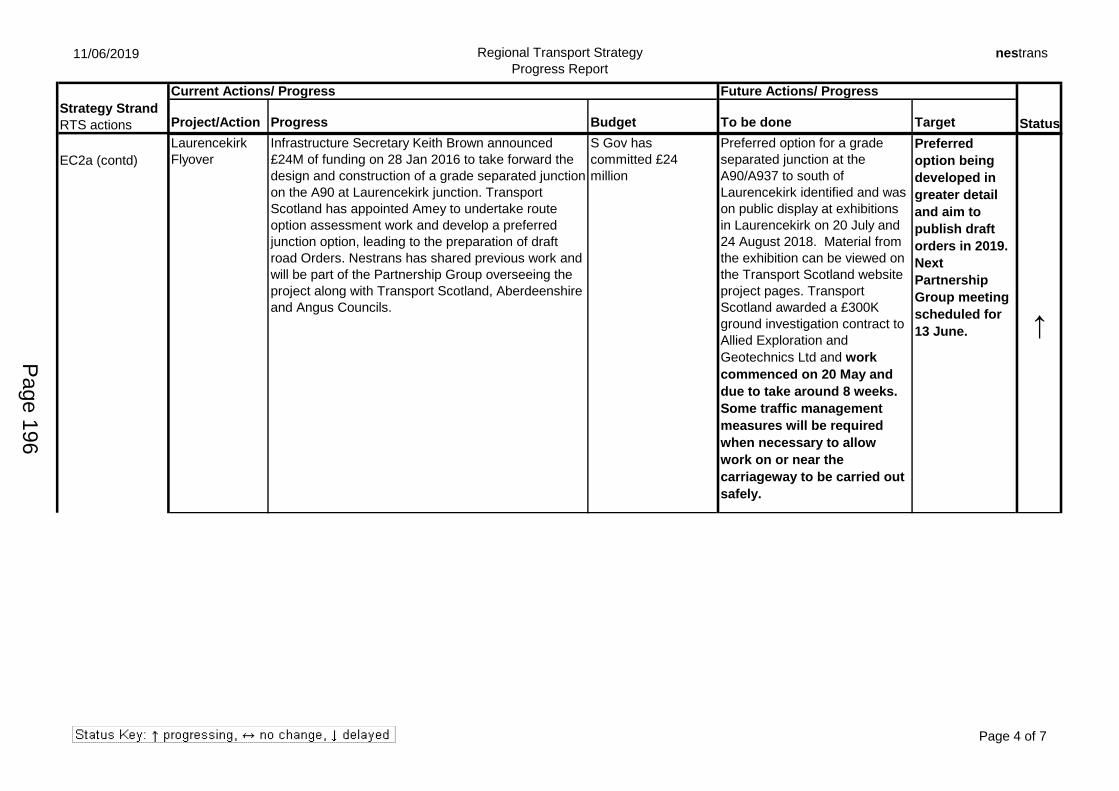
11/06/2019 Regional Transport Strategy
Progress Report
nestrans
Current Actions/ Progress Future Actions/ Progress
Project/Action Progress Budget To be done Target StatusStrategy Strand
RTS actions
Laurencekirk
Flyover
Infrastructure Secretary Keith Brown announced
£24M of funding on 28 Jan 2016 to take forward the
design and construction of a grade separated junction
on the A90 at Laurencekirk junction. Transport
Scotland has appointed Amey to undertake route
option assessment work and develop a preferred
junction option, leading to the preparation of draft
road Orders. Nestrans has shared previous work and
will be part of the Partnership Group overseeing the
project along with Transport Scotland, Aberdeenshire
and Angus Councils.
S Gov has
committed £24
million
Preferred option for a grade
separated junction at the
A90/A937 to south of
Laurencekirk identified and was
on public display at exhibitions
in Laurencekirk on 20 July and
24 August 2018. Material from
the exhibition can be viewed on
the Transport Scotland website
project pages. Transport
Scotland awarded a £300K
ground investigation contract to
Allied Exploration and
Geotechnics Ltd and work
commenced on 20 May and
due to take around 8 weeks.
Some traffic management
measures will be required
when necessary to allow
work on or near the
carriageway to be carried out
safely.
Preferred
option being
developed in
greater detail
and aim to
publish draft
orders in 2019.
Next
Partnership
Group meeting
scheduled for
13 June. ↑
EC2a:
Overcoming
constraints on the
network that have
a direct impact on
travel to/from the
north east, such
as the A90
through or around
Dundee and
dualling the A96
to Inverness.
EC2a (contd)
EC2a (contd)
Page 4 of 7
Page 196
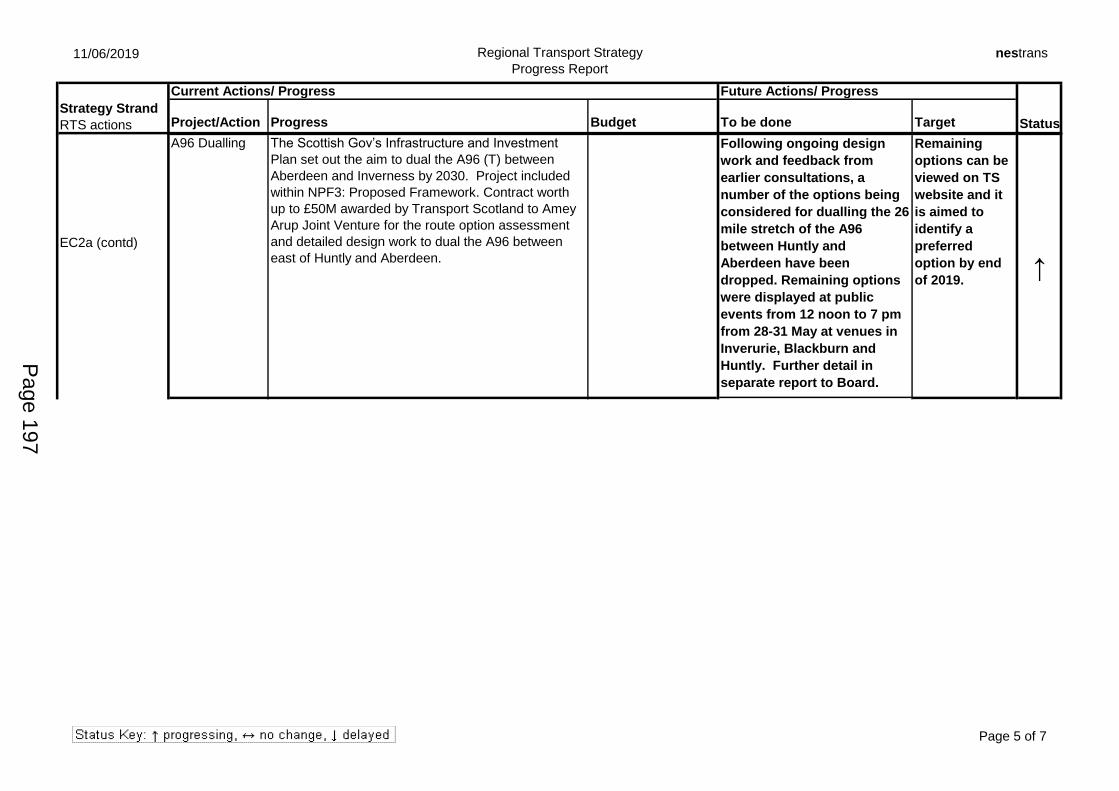
11/06/2019 Regional Transport Strategy
Progress Report
nestrans
Current Actions/ Progress Future Actions/ Progress
Project/Action Progress Budget To be done Target StatusStrategy Strand
RTS actions
A96 Dualling The Scottish Gov’s Infrastructure and Investment
Plan set out the aim to dual the A96 (T) between
Aberdeen and Inverness by 2030. Project included
within NPF3: Proposed Framework. Contract worth
up to £50M awarded by Transport Scotland to Amey
Arup Joint Venture for the route option assessment
and detailed design work to dual the A96 between
east of Huntly and Aberdeen.
Following ongoing design
work and feedback from
earlier consultations, a
number of the options being
considered for dualling the 26
mile stretch of the A96
between Huntly and
Aberdeen have been
dropped. Remaining options
were displayed at public
events from 12 noon to 7 pm
from 28-31 May at venues in
Inverurie, Blackburn and
Huntly. Further detail in
separate report to Board.
Remaining
options can be
viewed on TS
website and it
is aimed to
identify a
preferred
option by end
of 2019.↑
Movement STPR will identify shortfalls in the strategic networks
Anything from Tay City Deal
↔
EC2a:
Overcoming
constraints on the
network that have
a direct impact on
travel to/from the
north east, such
as the A90
through or around
Dundee and
dualling the A96
to Inverness.
EC2a (contd)
EC2a (contd)
Page 5 of 7
Page 197
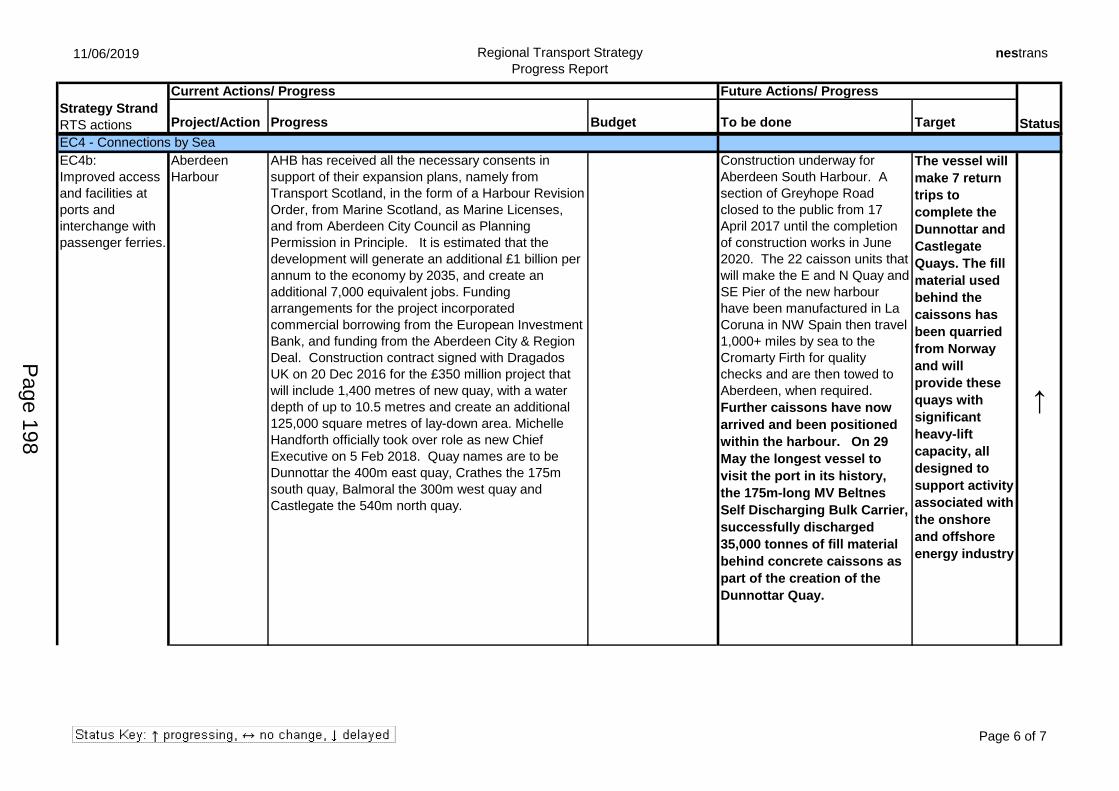
11/06/2019 Regional Transport Strategy
Progress Report
nestrans
Current Actions/ Progress Future Actions/ Progress
Project/Action Progress Budget To be done Target StatusStrategy Strand
RTS actions
EC4 - Connections by Sea
Aberdeen
Harbour
AHB has received all the necessary consents in
support of their expansion plans, namely from
Transport Scotland, in the form of a Harbour Revision
Order, from Marine Scotland, as Marine Licenses,
and from Aberdeen City Council as Planning
Permission in Principle. It is estimated that the
development will generate an additional £1 billion per
annum to the economy by 2035, and create an
additional 7,000 equivalent jobs. Funding
arrangements for the project incorporated
commercial borrowing from the European Investment
Bank, and funding from the Aberdeen City & Region
Deal. Construction contract signed with Dragados
UK on 20 Dec 2016 for the £350 million project that
will include 1,400 metres of new quay, with a water
depth of up to 10.5 metres and create an additional
125,000 square metres of lay-down area. Michelle
Handforth officially took over role as new Chief
Executive on 5 Feb 2018. Quay names are to be
Dunnottar the 400m east quay, Crathes the 175m
south quay, Balmoral the 300m west quay and
Castlegate the 540m north quay.
Construction underway for
Aberdeen South Harbour. A
section of Greyhope Road
closed to the public from 17
April 2017 until the completion
of construction works in June
2020. The 22 caisson units that
will make the E and N Quay and
SE Pier of the new harbour
have been manufactured in La
Coruna in NW Spain then travel
1,000+ miles by sea to the
Cromarty Firth for quality
checks and are then towed to
Aberdeen, when required.
Further caissons have now
arrived and been positioned
within the harbour. On 29
May the longest vessel to
visit the port in its history,
the 175m-long MV Beltnes
Self Discharging Bulk Carrier,
successfully discharged
35,000 tonnes of fill material
behind concrete caissons as
part of the creation of the
Dunnottar Quay.
The vessel will
make 7 return
trips to
complete the
Dunnottar and
Castlegate
Quays. The fill
material used
behind the
caissons has
been quarried
from Norway
and will
provide these
quays with
significant
heavy-lift
capacity, all
designed to
support activity
associated with
the onshore
and offshore
energy industry
↑
EC4b:
Improved access
and facilities at
ports and
interchange with
passenger ferries.
Page 6 of 7
Page 198
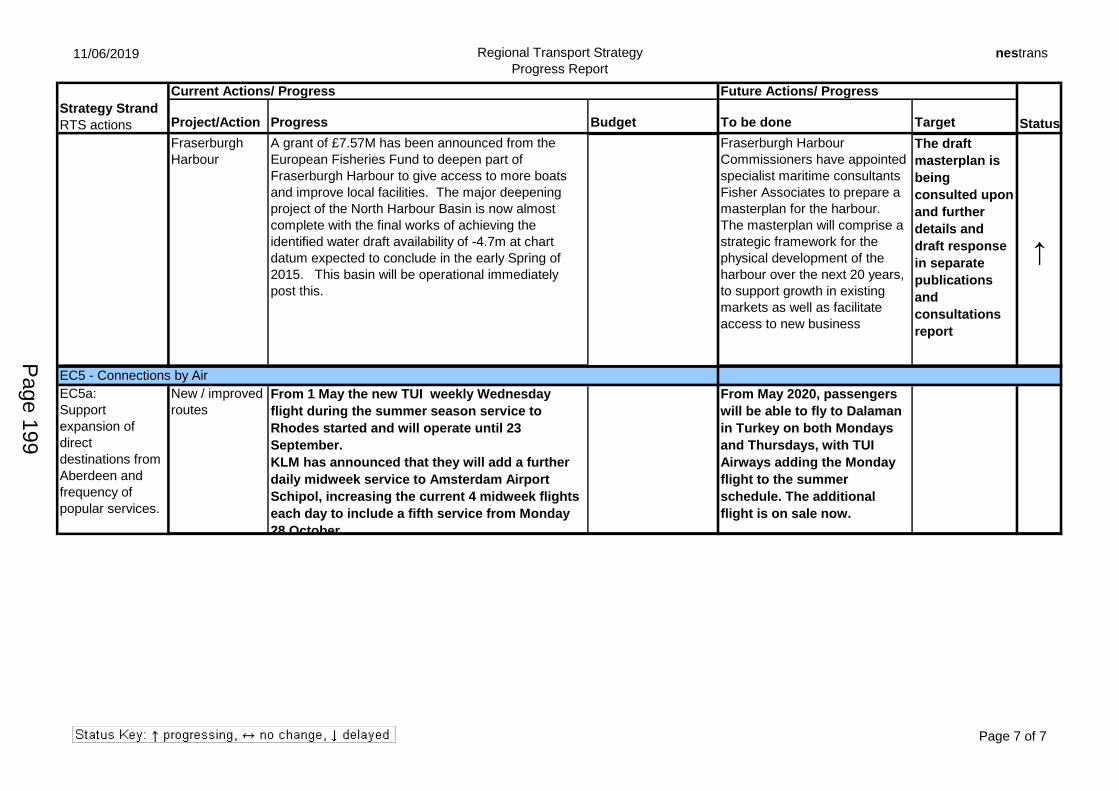
11/06/2019 Regional Transport Strategy
Progress Report
nestrans
Current Actions/ Progress Future Actions/ Progress
Project/Action Progress Budget To be done Target StatusStrategy Strand
RTS actions
Fraserburgh
Harbour
A grant of £7.57M has been announced from the
European Fisheries Fund to deepen part of
Fraserburgh Harbour to give access to more boats
and improve local facilities. The major deepening
project of the North Harbour Basin is now almost
complete with the final works of achieving the
identified water draft availability of -4.7m at chart
datum expected to conclude in the early Spring of
2015. This basin will be operational immediately
post this.
Fraserburgh Harbour
Commissioners have appointed
specialist maritime consultants
Fisher Associates to prepare a
masterplan for the harbour.
The masterplan will comprise a
strategic framework for the
physical development of the
harbour over the next 20 years,
to support growth in existing
markets as well as facilitate
access to new business
The draft
masterplan is
being
consulted upon
and further
details and
draft response
in separate
publications
and
consultations
report
↑
Northern Isles Following a hearing at the Court of Session, Serco The Invitation to Tender for the Submission of ↑EC5 - Connections by Air
New / improved
routes
From 1 May the new TUI weekly Wednesday
flight during the summer season service to
Rhodes started and will operate until 23
September.
KLM has announced that they will add a further
daily midweek service to Amsterdam Airport
Schipol, increasing the current 4 midweek flights
each day to include a fifth service from Monday
28 October.
From May 2020, passengers
will be able to fly to Dalaman
in Turkey on both Mondays
and Thursdays, with TUI
Airways adding the Monday
flight to the summer
schedule. The additional
flight is on sale now.
Peripheral Aviation Campaign being undertaken to protect The Airports Commission ↑
EC5a:
Support
expansion of
direct
destinations from
Aberdeen and
frequency of
popular services.
EC4b:
Improved access
and facilities at
ports and
interchange with
passenger ferries.
Page 7 of 7
Page 199

This page is intentionally left blank
Page 200
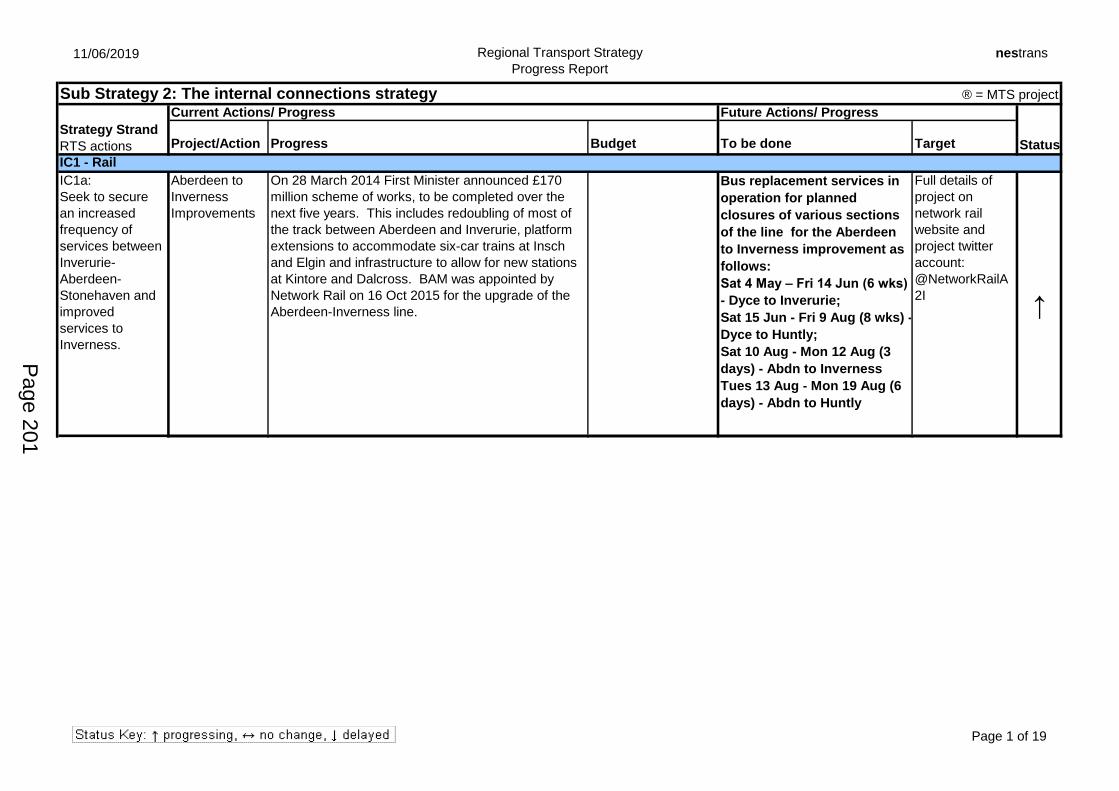
11/06/2019 Regional Transport Strategy
Progress Report
nestrans
Sub Strategy 2: The internal connections strategy ® = MTS project
Current Actions/ Progress Future Actions/ Progress
Project/Action Progress Budget To be done Target Status
IC1 - Rail
Aberdeen to
Inverness
Improvements
On 28 March 2014 First Minister announced £170
million scheme of works, to be completed over the
next five years. This includes redoubling of most of
the track between Aberdeen and Inverurie, platform
extensions to accommodate six-car trains at Insch
and Elgin and infrastructure to allow for new stations
at Kintore and Dalcross. BAM was appointed by
Network Rail on 16 Oct 2015 for the upgrade of the
Aberdeen-Inverness line.
Bus replacement services in
operation for planned
closures of various sections
of the line for the Aberdeen
to Inverness improvement as
follows:
Sat 4 May – Fri 14 Jun (6 wks)
- Dyce to Inverurie;
Sat 15 Jun - Fri 9 Aug (8 wks) -
Dyce to Huntly;
Sat 10 Aug - Mon 12 Aug (3
days) - Abdn to Inverness
Tues 13 Aug - Mon 19 Aug (6
days) - Abdn to Huntly
Full details of
project on
network rail
website and
project twitter
account:
@NetworkRailA
2I↑
Laurencekirk Final invoice for car park received by Nestrans and Invoiced 2009-2011 Evaluation of Laurencekirk Rail ↑
Strategy Strand
RTS actions
IC1a:
Seek to secure
an increased
frequency of
services between
Inverurie-
Aberdeen-
Stonehaven and
improved
services to
Inverness.
IC1b:
Proposed new
station at Kintore
and further
development of
the rail system to
be set out in the
Rail Action Plan,
including
improvements to
the accessibility
of existing
stations
Page 1 of 19
Page 201
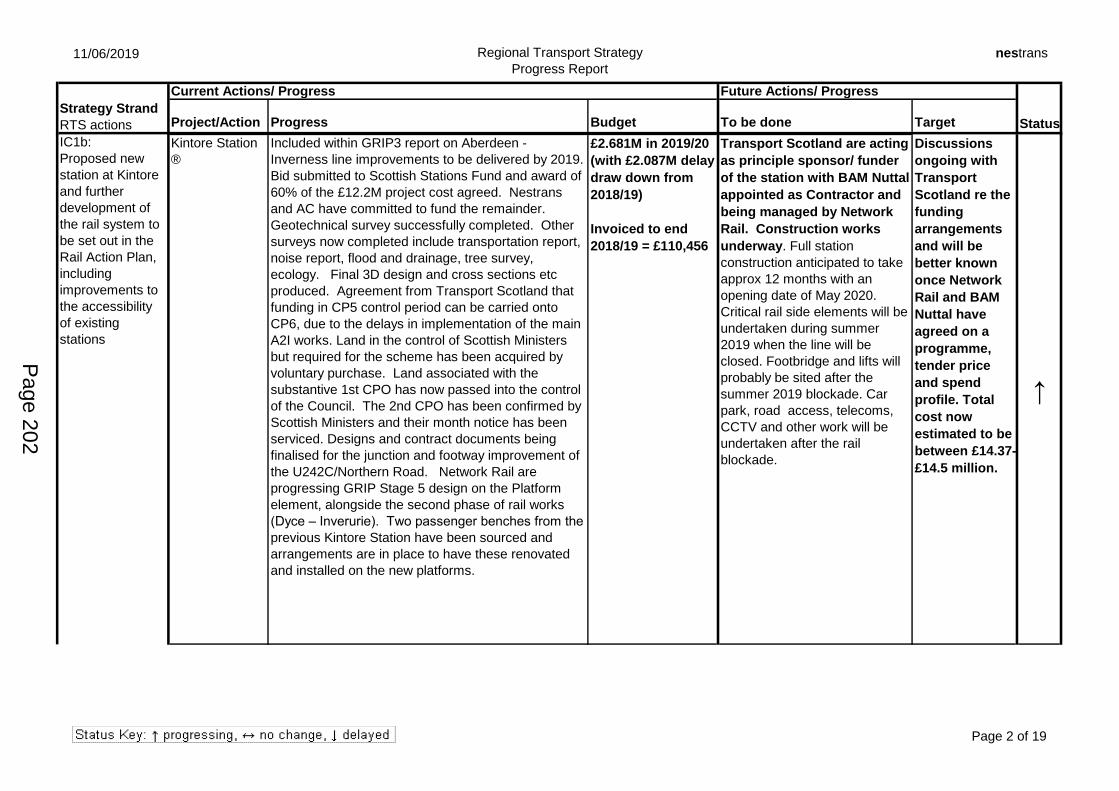
11/06/2019 Regional Transport Strategy
Progress Report
nestrans
Current Actions/ Progress Future Actions/ Progress
Project/Action Progress Budget To be done Target StatusStrategy Strand
RTS actions
Kintore Station
®
Included within GRIP3 report on Aberdeen -
Inverness line improvements to be delivered by 2019.
Bid submitted to Scottish Stations Fund and award of
60% of the £12.2M project cost agreed. Nestrans
and AC have committed to fund the remainder.
Geotechnical survey successfully completed. Other
surveys now completed include transportation report,
noise report, flood and drainage, tree survey,
ecology. Final 3D design and cross sections etc
produced. Agreement from Transport Scotland that
funding in CP5 control period can be carried onto
CP6, due to the delays in implementation of the main
A2I works. Land in the control of Scottish Ministers
but required for the scheme has been acquired by
voluntary purchase. Land associated with the
substantive 1st CPO has now passed into the control
of the Council. The 2nd CPO has been confirmed by
Scottish Ministers and their month notice has been
serviced. Designs and contract documents being
finalised for the junction and footway improvement of
the U242C/Northern Road. Network Rail are
progressing GRIP Stage 5 design on the Platform
element, alongside the second phase of rail works
(Dyce – Inverurie). Two passenger benches from the
previous Kintore Station have been sourced and
arrangements are in place to have these renovated
and installed on the new platforms.
£2.681M in 2019/20
(with £2.087M delay
draw down from
2018/19)
Invoiced to end
2018/19 = £110,456
Transport Scotland are acting
as principle sponsor/ funder
of the station with BAM Nuttal
appointed as Contractor and
being managed by Network
Rail. Construction works
underway. Full station
construction anticipated to take
approx 12 months with an
opening date of May 2020.
Critical rail side elements will be
undertaken during summer
2019 when the line will be
closed. Footbridge and lifts will
probably be sited after the
summer 2019 blockade. Car
park, road access, telecoms,
CCTV and other work will be
undertaken after the rail
blockade.
Discussions
ongoing with
Transport
Scotland re the
funding
arrangements
and will be
better known
once Network
Rail and BAM
Nuttal have
agreed on a
programme,
tender price
and spend
profile. Total
cost now
estimated to be
between £14.37-
£14.5 million.
↑
IC1b:
Proposed new
station at Kintore
and further
development of
the rail system to
be set out in the
Rail Action Plan,
including
improvements to
the accessibility
of existing
stations
Page 2 of 19
Page 202
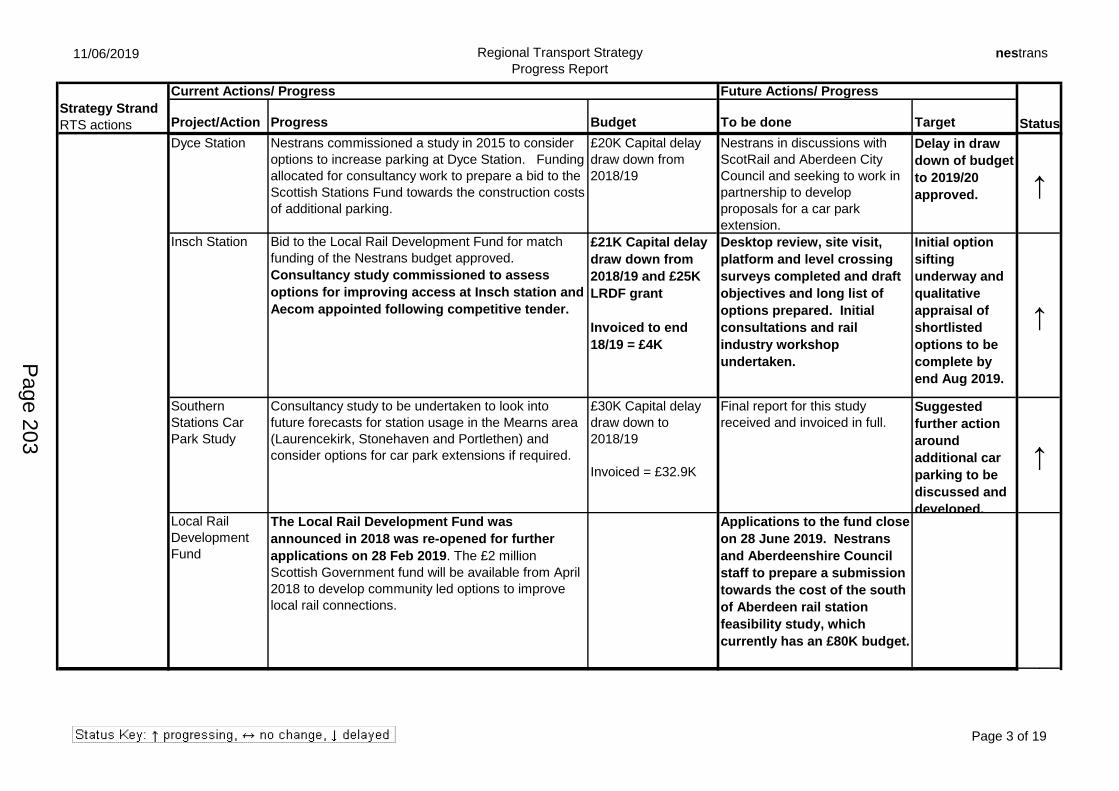
11/06/2019 Regional Transport Strategy
Progress Report
nestrans
Current Actions/ Progress Future Actions/ Progress
Project/Action Progress Budget To be done Target StatusStrategy Strand
RTS actions
Dyce Station Nestrans commissioned a study in 2015 to consider
options to increase parking at Dyce Station. Funding
allocated for consultancy work to prepare a bid to the
Scottish Stations Fund towards the construction costs
of additional parking.
£20K Capital delay
draw down from
2018/19
Nestrans in discussions with
ScotRail and Aberdeen City
Council and seeking to work in
partnership to develop
proposals for a car park
extension.
Delay in draw
down of budget
to 2019/20
approved. ↑
Insch Station Bid to the Local Rail Development Fund for match
funding of the Nestrans budget approved.
Consultancy study commissioned to assess
options for improving access at Insch station and
Aecom appointed following competitive tender.
£21K Capital delay
draw down from
2018/19 and £25K
LRDF grant
Invoiced to end
18/19 = £4K
Desktop review, site visit,
platform and level crossing
surveys completed and draft
objectives and long list of
options prepared. Initial
consultations and rail
industry workshop
undertaken.
Initial option
sifting
underway and
qualitative
appraisal of
shortlisted
options to be
complete by
end Aug 2019.
↑
Southern
Stations Car
Park Study
Consultancy study to be undertaken to look into
future forecasts for station usage in the Mearns area
(Laurencekirk, Stonehaven and Portlethen) and
consider options for car park extensions if required.
£30K Capital delay
draw down to
2018/19
Invoiced = £32.9K
Final report for this study
received and invoiced in full.
Suggested
further action
around
additional car
parking to be
discussed and
developed.
↑
Local Rail
Development
Fund
The Local Rail Development Fund was
announced in 2018 was re-opened for further
applications on 28 Feb 2019. The £2 million
Scottish Government fund will be available from April
2018 to develop community led options to improve
local rail connections.
Applications to the fund close
on 28 June 2019. Nestrans
and Aberdeenshire Council
staff to prepare a submission
towards the cost of the south
of Aberdeen rail station
feasibility study, which
currently has an £80K budget.
IC1c: North east rail Rail forum established and inaugural meeting held on Abellio Seminar took place in ↑
IC1b:
Proposed new
station at Kintore
and further
development of
the rail system to
be set out in the
Rail Action Plan,
including
improvements to
the accessibility
of existing
stations
Page 3 of 19
Page 203
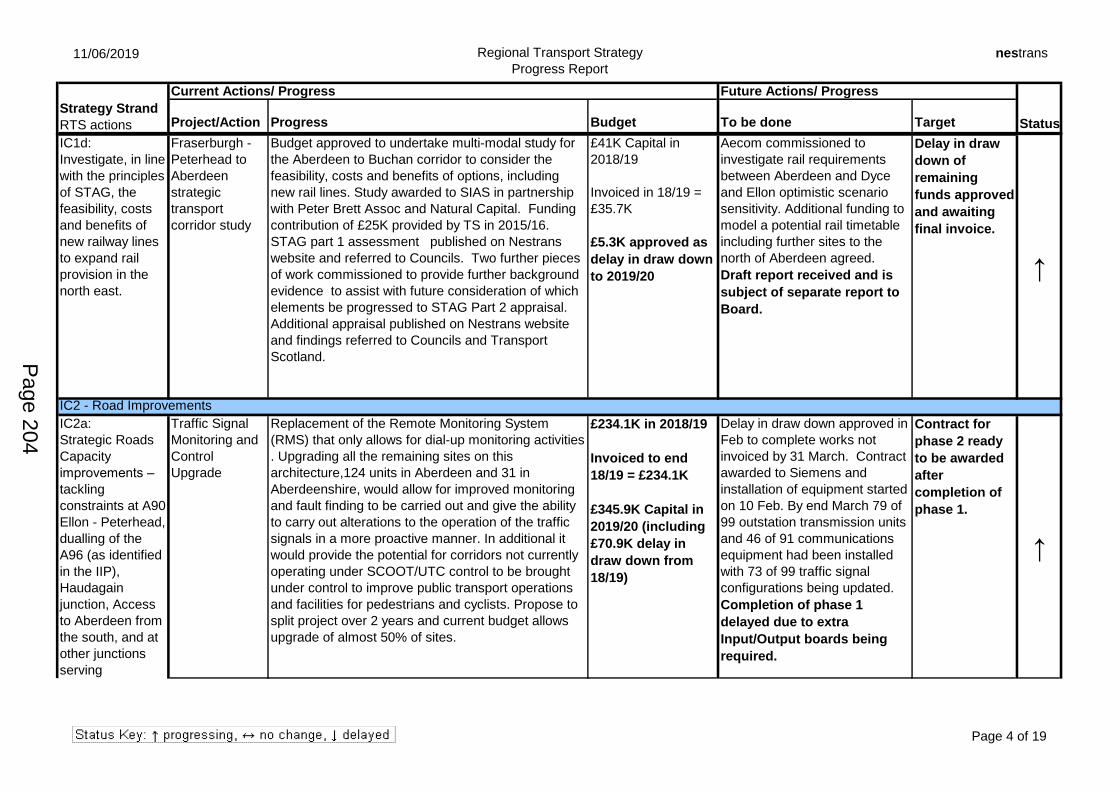
11/06/2019 Regional Transport Strategy
Progress Report
nestrans
Current Actions/ Progress Future Actions/ Progress
Project/Action Progress Budget To be done Target StatusStrategy Strand
RTS actions
IC1d:
Investigate, in line
with the principles
of STAG, the
feasibility, costs
and benefits of
new railway lines
to expand rail
provision in the
north east.
Fraserburgh -
Peterhead to
Aberdeen
strategic
transport
corridor study
Budget approved to undertake multi-modal study for
the Aberdeen to Buchan corridor to consider the
feasibility, costs and benefits of options, including
new rail lines. Study awarded to SIAS in partnership
with Peter Brett Assoc and Natural Capital. Funding
contribution of £25K provided by TS in 2015/16.
STAG part 1 assessment published on Nestrans
website and referred to Councils. Two further pieces
of work commissioned to provide further background
evidence to assist with future consideration of which
elements be progressed to STAG Part 2 appraisal.
Additional appraisal published on Nestrans website
and findings referred to Councils and Transport
Scotland.
£41K Capital in
2018/19
Invoiced in 18/19 =
£35.7K
£5.3K approved as
delay in draw down
to 2019/20
Aecom commissioned to
investigate rail requirements
between Aberdeen and Dyce
and Ellon optimistic scenario
sensitivity. Additional funding to
model a potential rail timetable
including further sites to the
north of Aberdeen agreed.
Draft report received and is
subject of separate report to
Board.
Delay in draw
down of
remaining
funds approved
and awaiting
final invoice.
↑
IC2 - Road Improvements
Traffic Signal
Monitoring and
Control
Upgrade
Replacement of the Remote Monitoring System
(RMS) that only allows for dial-up monitoring activities
. Upgrading all the remaining sites on this
architecture,124 units in Aberdeen and 31 in
Aberdeenshire, would allow for improved monitoring
and fault finding to be carried out and give the ability
to carry out alterations to the operation of the traffic
signals in a more proactive manner. In additional it
would provide the potential for corridors not currently
operating under SCOOT/UTC control to be brought
under control to improve public transport operations
and facilities for pedestrians and cyclists. Propose to
split project over 2 years and current budget allows
upgrade of almost 50% of sites.
£234.1K in 2018/19
Invoiced to end
18/19 = £234.1K
£345.9K Capital in
2019/20 (including
£70.9K delay in
draw down from
18/19)
Delay in draw down approved in
Feb to complete works not
invoiced by 31 March. Contract
awarded to Siemens and
installation of equipment started
on 10 Feb. By end March 79 of
99 outstation transmission units
and 46 of 91 communications
equipment had been installed
with 73 of 99 traffic signal
configurations being updated.
Completion of phase 1
delayed due to extra
Input/Output boards being
required.
Contract for
phase 2 ready
to be awarded
after
completion of
phase 1.
↑
IC2a:
Strategic Roads
Capacity
improvements –
tackling
constraints at A90
Ellon - Peterhead,
dualling of the
A96 (as identified
in the IIP),
Haudagain
junction, Access
to Aberdeen from
the south, and at
other junctions
serving
Aberdeenshire
towns.
Page 4 of 19
Page 204
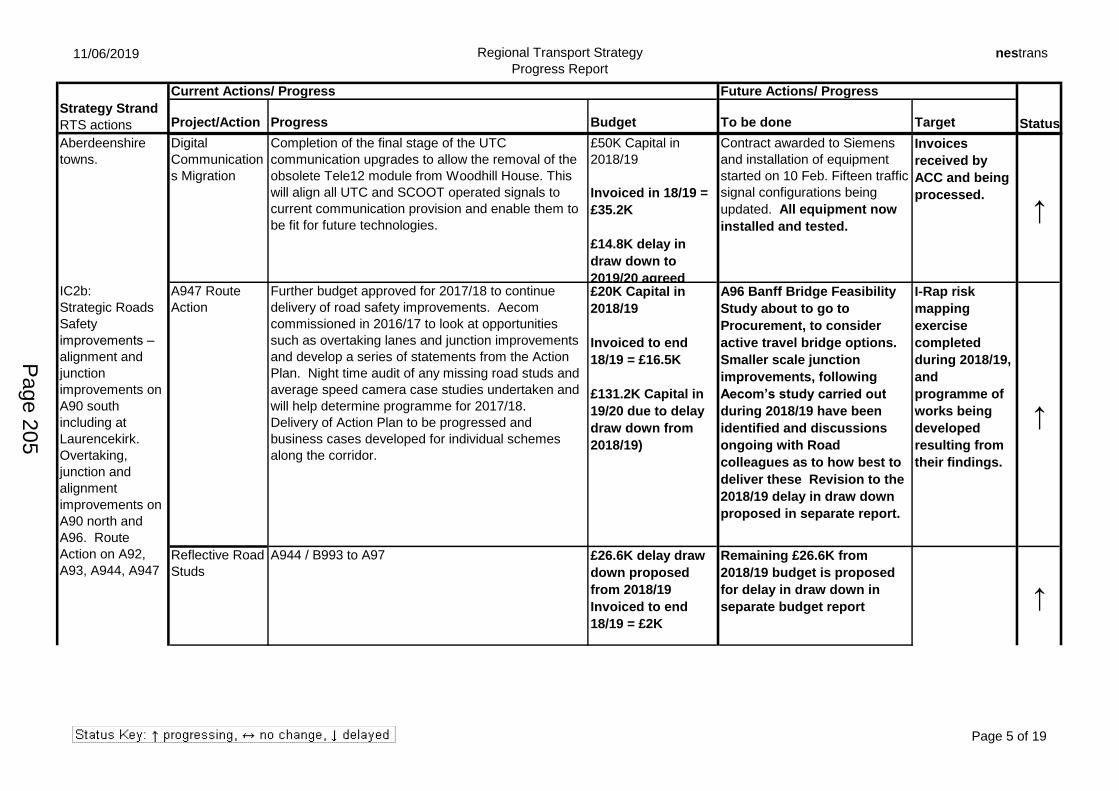
11/06/2019 Regional Transport Strategy
Progress Report
nestrans
Current Actions/ Progress Future Actions/ Progress
Project/Action Progress Budget To be done Target StatusStrategy Strand
RTS actions
Digital
Communication
s Migration
Completion of the final stage of the UTC
communication upgrades to allow the removal of the
obsolete Tele12 module from Woodhill House. This
will align all UTC and SCOOT operated signals to
current communication provision and enable them to
be fit for future technologies.
£50K Capital in
2018/19
Invoiced in 18/19 =
£35.2K
£14.8K delay in
draw down to
2019/20 agreed
Contract awarded to Siemens
and installation of equipment
started on 10 Feb. Fifteen traffic
signal configurations being
updated. All equipment now
installed and tested.
Invoices
received by
ACC and being
processed.
↑
A947 Route
Action
Further budget approved for 2017/18 to continue
delivery of road safety improvements. Aecom
commissioned in 2016/17 to look at opportunities
such as overtaking lanes and junction improvements
and develop a series of statements from the Action
Plan. Night time audit of any missing road studs and
average speed camera case studies undertaken and
will help determine programme for 2017/18.
Delivery of Action Plan to be progressed and
business cases developed for individual schemes
along the corridor.
£20K Capital in
2018/19
Invoiced to end
18/19 = £16.5K
£131.2K Capital in
19/20 due to delay
draw down from
2018/19)
A96 Banff Bridge Feasibility
Study about to go to
Procurement, to consider
active travel bridge options.
Smaller scale junction
improvements, following
Aecom’s study carried out
during 2018/19 have been
identified and discussions
ongoing with Road
colleagues as to how best to
deliver these Revision to the
2018/19 delay in draw down
proposed in separate report.
I-Rap risk
mapping
exercise
completed
during 2018/19,
and
programme of
works being
developed
resulting from
their findings.
↑
Reflective Road
Studs
A944 / B993 to A97 £26.6K delay draw
down proposed
from 2018/19
Invoiced to end
18/19 = £2K
Remaining £26.6K from
2018/19 budget is proposed
for delay in draw down in
separate budget report ↑
IC2b:
Strategic Roads
Safety
improvements –
alignment and
junction
improvements on
A90 south
including at
Laurencekirk.
Overtaking,
junction and
alignment
improvements on
A90 north and
A96. Route
Action on A92,
A93, A944, A947
IC2b (contd)
IC2a:
Strategic Roads
Capacity
improvements –
tackling
constraints at A90
Ellon - Peterhead,
dualling of the
A96 (as identified
in the IIP),
Haudagain
junction, Access
to Aberdeen from
the south, and at
other junctions
serving
Aberdeenshire
towns.
Page 5 of 19
Page 205
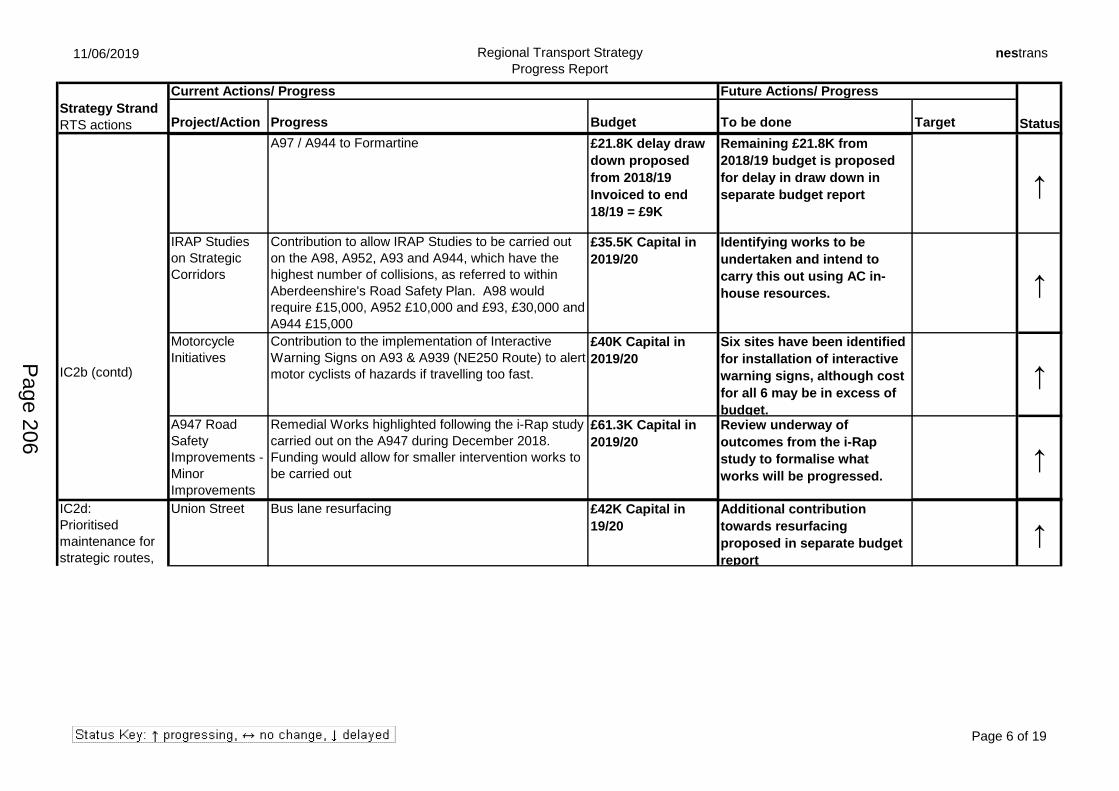
11/06/2019 Regional Transport Strategy
Progress Report
nestrans
Current Actions/ Progress Future Actions/ Progress
Project/Action Progress Budget To be done Target StatusStrategy Strand
RTS actions
A97 / A944 to Formartine £21.8K delay draw
down proposed
from 2018/19
Invoiced to end
18/19 = £9K
Remaining £21.8K from
2018/19 budget is proposed
for delay in draw down in
separate budget report ↑
IRAP Studies
on Strategic
Corridors
Contribution to allow IRAP Studies to be carried out
on the A98, A952, A93 and A944, which have the
highest number of collisions, as referred to within
Aberdeenshire's Road Safety Plan. A98 would
require £15,000, A952 £10,000 and £93, £30,000 and
A944 £15,000
£35.5K Capital in
2019/20
Identifying works to be
undertaken and intend to
carry this out using AC in-
house resources. ↑
Motorcycle
Initiatives
Contribution to the implementation of Interactive
Warning Signs on A93 & A939 (NE250 Route) to alert
motor cyclists of hazards if travelling too fast.
£40K Capital in
2019/20
Six sites have been identified
for installation of interactive
warning signs, although cost
for all 6 may be in excess of
budget.
↑
A947 Road
Safety
Improvements -
Minor
Improvements
Remedial Works highlighted following the i-Rap study
carried out on the A947 during December 2018.
Funding would allow for smaller intervention works to
be carried out
£61.3K Capital in
2019/20
Review underway of
outcomes from the i-Rap
study to formalise what
works will be progressed.↑
Car share lanes Final report received and placed on website and sent Awaiting comments from ↑Union Street Bus lane resurfacing £42K Capital in
19/20
Additional contribution
towards resurfacing
proposed in separate budget
report
↑IC2d:
Prioritised
maintenance for
strategic routes,
with particular
benefits for public
transport and
sustainable
modes.
IC2b:
Strategic Roads
Safety
improvements –
alignment and
junction
improvements on
A90 south
including at
Laurencekirk.
Overtaking,
junction and
alignment
improvements on
A90 north and
A96. Route
Action on A92,
A93, A944, A947
IC2b (contd)
Page 6 of 19
Page 206
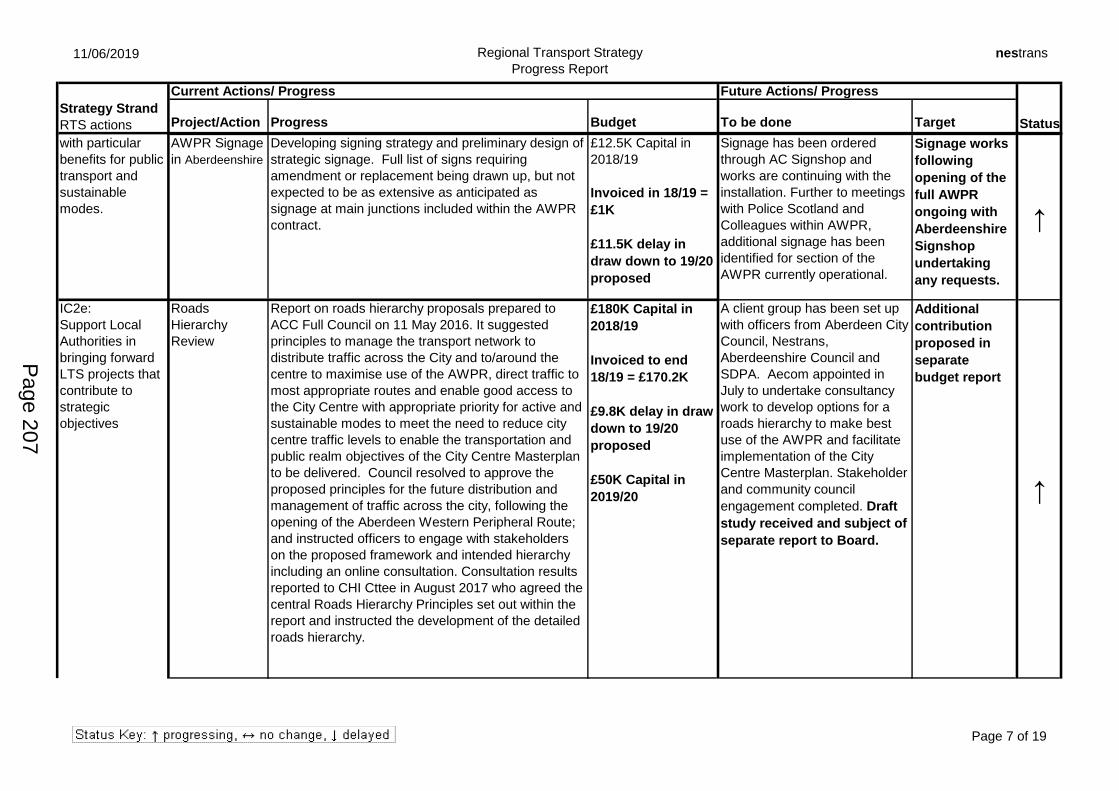
11/06/2019 Regional Transport Strategy
Progress Report
nestrans
Current Actions/ Progress Future Actions/ Progress
Project/Action Progress Budget To be done Target StatusStrategy Strand
RTS actions
AWPR Signage
in Aberdeenshire
Developing signing strategy and preliminary design of
strategic signage. Full list of signs requiring
amendment or replacement being drawn up, but not
expected to be as extensive as anticipated as
signage at main junctions included within the AWPR
contract.
£12.5K Capital in
2018/19
Invoiced in 18/19 =
£1K
£11.5K delay in
draw down to 19/20
proposed
Signage has been ordered
through AC Signshop and
works are continuing with the
installation. Further to meetings
with Police Scotland and
Colleagues within AWPR,
additional signage has been
identified for section of the
AWPR currently operational.
Signage works
following
opening of the
full AWPR
ongoing with
Aberdeenshire
Signshop
undertaking
any requests.
↑
Roads
Hierarchy
Review
Report on roads hierarchy proposals prepared to
ACC Full Council on 11 May 2016. It suggested
principles to manage the transport network to
distribute traffic across the City and to/around the
centre to maximise use of the AWPR, direct traffic to
most appropriate routes and enable good access to
the City Centre with appropriate priority for active and
sustainable modes to meet the need to reduce city
centre traffic levels to enable the transportation and
public realm objectives of the City Centre Masterplan
to be delivered. Council resolved to approve the
proposed principles for the future distribution and
management of traffic across the city, following the
opening of the Aberdeen Western Peripheral Route;
and instructed officers to engage with stakeholders
on the proposed framework and intended hierarchy
including an online consultation. Consultation results
reported to CHI Cttee in August 2017 who agreed the
central Roads Hierarchy Principles set out within the
report and instructed the development of the detailed
roads hierarchy.
£180K Capital in
2018/19
Invoiced to end
18/19 = £170.2K
£9.8K delay in draw
down to 19/20
proposed
£50K Capital in
2019/20
A client group has been set up
with officers from Aberdeen City
Council, Nestrans,
Aberdeenshire Council and
SDPA. Aecom appointed in
July to undertake consultancy
work to develop options for a
roads hierarchy to make best
use of the AWPR and facilitate
implementation of the City
Centre Masterplan. Stakeholder
and community council
engagement completed. Draft
study received and subject of
separate report to Board.
Additional
contribution
proposed in
separate
budget report
↑
IC2d:
Prioritised
maintenance for
strategic routes,
with particular
benefits for public
transport and
sustainable
modes.
IC2e:
Support Local
Authorities in
bringing forward
LTS projects that
contribute to
strategic
objectives
IC2e (contd)
Page 7 of 19
Page 207
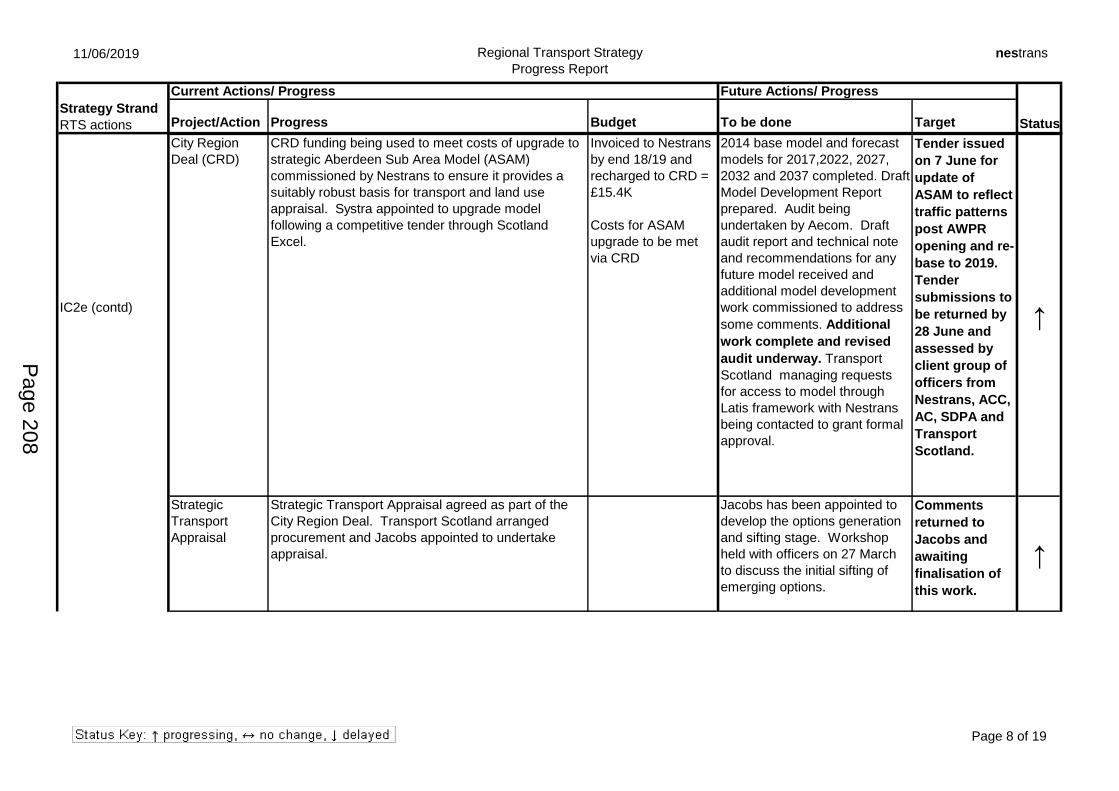
11/06/2019 Regional Transport Strategy
Progress Report
nestrans
Current Actions/ Progress Future Actions/ Progress
Project/Action Progress Budget To be done Target StatusStrategy Strand
RTS actions
City Region
Deal (CRD)
CRD funding being used to meet costs of upgrade to
strategic Aberdeen Sub Area Model (ASAM)
commissioned by Nestrans to ensure it provides a
suitably robust basis for transport and land use
appraisal. Systra appointed to upgrade model
following a competitive tender through Scotland
Excel.
Invoiced to Nestrans
by end 18/19 and
recharged to CRD =
£15.4K
Costs for ASAM
upgrade to be met
via CRD
2014 base model and forecast
models for 2017,2022, 2027,
2032 and 2037 completed. Draft
Model Development Report
prepared. Audit being
undertaken by Aecom. Draft
audit report and technical note
and recommendations for any
future model received and
additional model development
work commissioned to address
some comments. Additional
work complete and revised
audit underway. Transport
Scotland managing requests
for access to model through
Latis framework with Nestrans
being contacted to grant formal
approval.
Tender issued
on 7 June for
update of
ASAM to reflect
traffic patterns
post AWPR
opening and re-
base to 2019.
Tender
submissions to
be returned by
28 June and
assessed by
client group of
officers from
Nestrans, ACC,
AC, SDPA and
Transport
Scotland.
↑
Strategic
Transport
Appraisal
Strategic Transport Appraisal agreed as part of the
City Region Deal. Transport Scotland arranged
procurement and Jacobs appointed to undertake
appraisal.
Jacobs has been appointed to
develop the options generation
and sifting stage. Workshop
held with officers on 27 March
to discuss the initial sifting of
emerging options.
Comments
returned to
Jacobs and
awaiting
finalisation of
this work.
↑
IC2e:
Support Local
Authorities in
bringing forward
LTS projects that
contribute to
strategic
objectives
IC2e (contd)
Page 8 of 19
Page 208
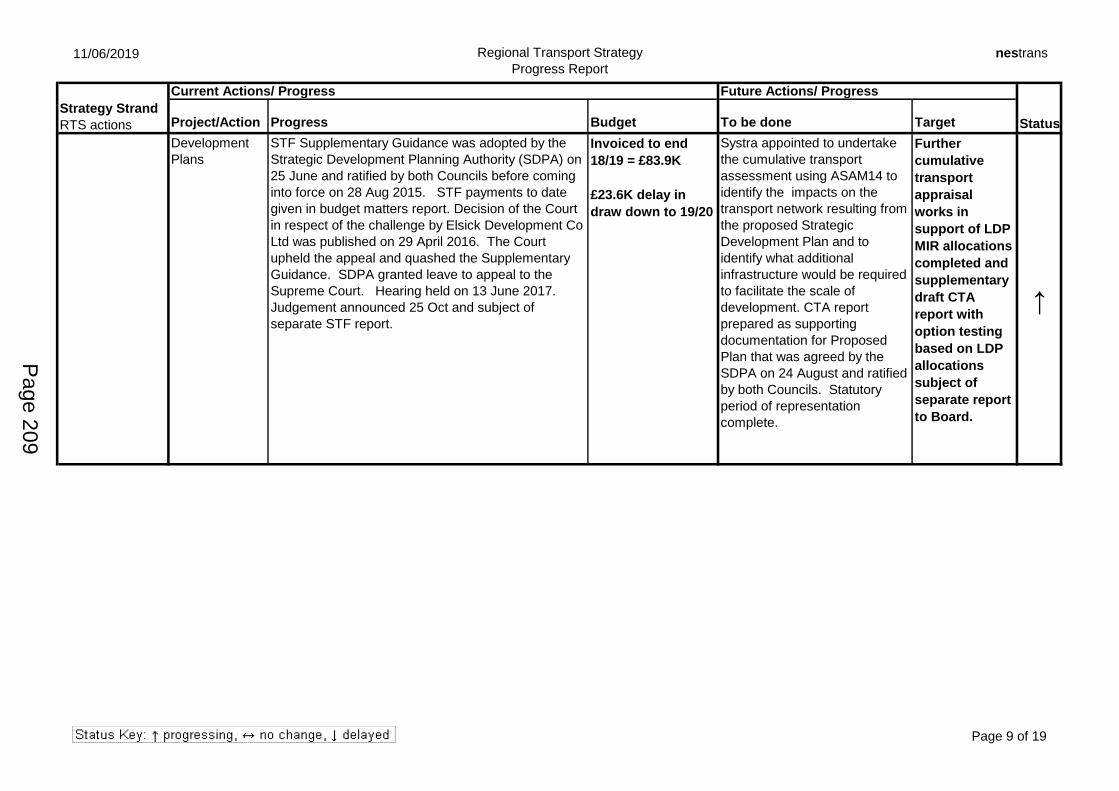
11/06/2019 Regional Transport Strategy
Progress Report
nestrans
Current Actions/ Progress Future Actions/ Progress
Project/Action Progress Budget To be done Target StatusStrategy Strand
RTS actions
Development
Plans
STF Supplementary Guidance was adopted by the
Strategic Development Planning Authority (SDPA) on
25 June and ratified by both Councils before coming
into force on 28 Aug 2015. STF payments to date
given in budget matters report. Decision of the Court
in respect of the challenge by Elsick Development Co
Ltd was published on 29 April 2016. The Court
upheld the appeal and quashed the Supplementary
Guidance. SDPA granted leave to appeal to the
Supreme Court. Hearing held on 13 June 2017.
Judgement announced 25 Oct and subject of
separate STF report.
Invoiced to end
18/19 = £83.9K
£23.6K delay in
draw down to 19/20
Systra appointed to undertake
the cumulative transport
assessment using ASAM14 to
identify the impacts on the
transport network resulting from
the proposed Strategic
Development Plan and to
identify what additional
infrastructure would be required
to facilitate the scale of
development. CTA report
prepared as supporting
documentation for Proposed
Plan that was agreed by the
SDPA on 24 August and ratified
by both Councils. Statutory
period of representation
complete.
Further
cumulative
transport
appraisal
works in
support of LDP
MIR allocations
completed and
supplementary
draft CTA
report with
option testing
based on LDP
allocations
subject of
separate report
to Board.
↑
IC2e:
Support Local
Authorities in
bringing forward
LTS projects that
contribute to
strategic
objectives
IC2e (contd)
Page 9 of 19
Page 209
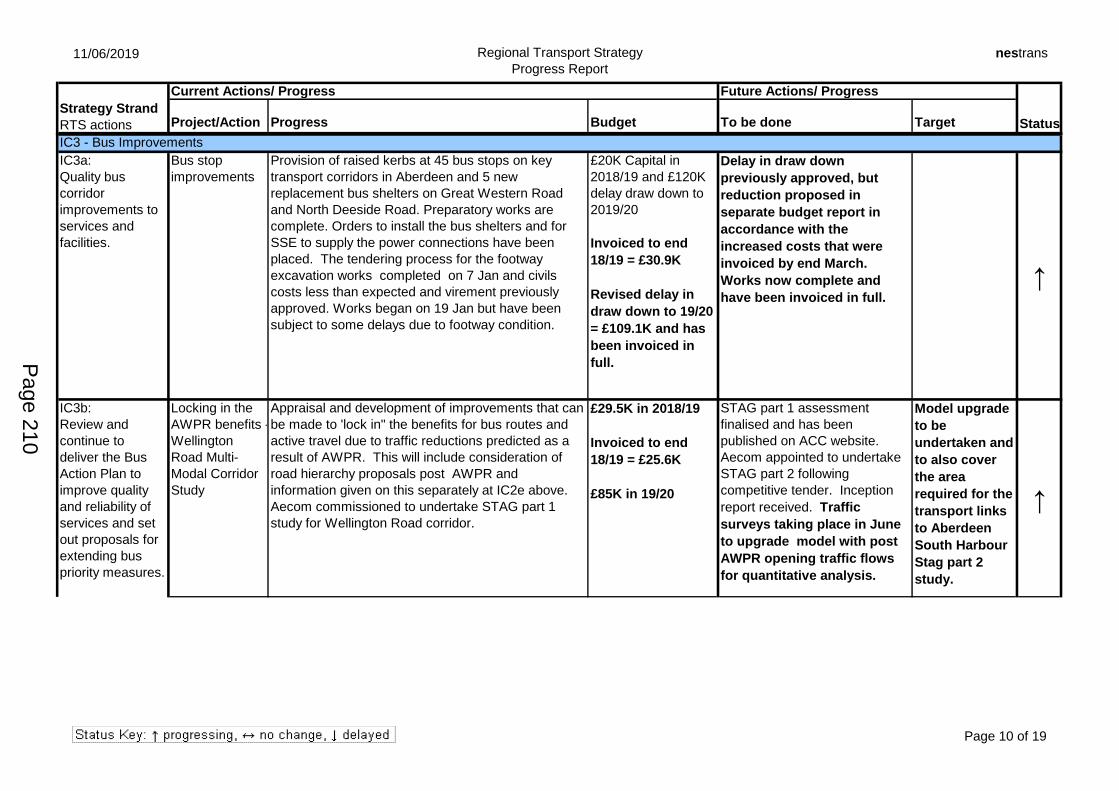
11/06/2019 Regional Transport Strategy
Progress Report
nestrans
Current Actions/ Progress Future Actions/ Progress
Project/Action Progress Budget To be done Target StatusStrategy Strand
RTS actions
IC3 - Bus Improvements
Bus stop
improvements
Provision of raised kerbs at 45 bus stops on key
transport corridors in Aberdeen and 5 new
replacement bus shelters on Great Western Road
and North Deeside Road. Preparatory works are
complete. Orders to install the bus shelters and for
SSE to supply the power connections have been
placed. The tendering process for the footway
excavation works completed on 7 Jan and civils
costs less than expected and virement previously
approved. Works began on 19 Jan but have been
subject to some delays due to footway condition.
£20K Capital in
2018/19 and £120K
delay draw down to
2019/20
Invoiced to end
18/19 = £30.9K
Revised delay in
draw down to 19/20
= £109.1K and has
been invoiced in
full.
Delay in draw down
previously approved, but
reduction proposed in
separate budget report in
accordance with the
increased costs that were
invoiced by end March.
Works now complete and
have been invoiced in full.
↑
Locking in the
AWPR benefits -
Wellington
Road Multi-
Modal Corridor
Study
Appraisal and development of improvements that can
be made to 'lock in" the benefits for bus routes and
active travel due to traffic reductions predicted as a
result of AWPR. This will include consideration of
road hierarchy proposals post AWPR and
information given on this separately at IC2e above.
Aecom commissioned to undertake STAG part 1
study for Wellington Road corridor.
£29.5K in 2018/19
Invoiced to end
18/19 = £25.6K
£85K in 19/20
STAG part 1 assessment
finalised and has been
published on ACC website.
Aecom appointed to undertake
STAG part 2 following
competitive tender. Inception
report received. Traffic
surveys taking place in June
to upgrade model with post
AWPR opening traffic flows
for quantitative analysis.
Model upgrade
to be
undertaken and
to also cover
the area
required for the
transport links
to Aberdeen
South Harbour
Stag part 2
study.
↑
IC3a:
Quality bus
corridor
improvements to
services and
facilities.
IC3b:
Review and
continue to
deliver the Bus
Action Plan to
improve quality
and reliability of
services and set
out proposals for
extending bus
priority measures.
Page 10 of 19
Page 210
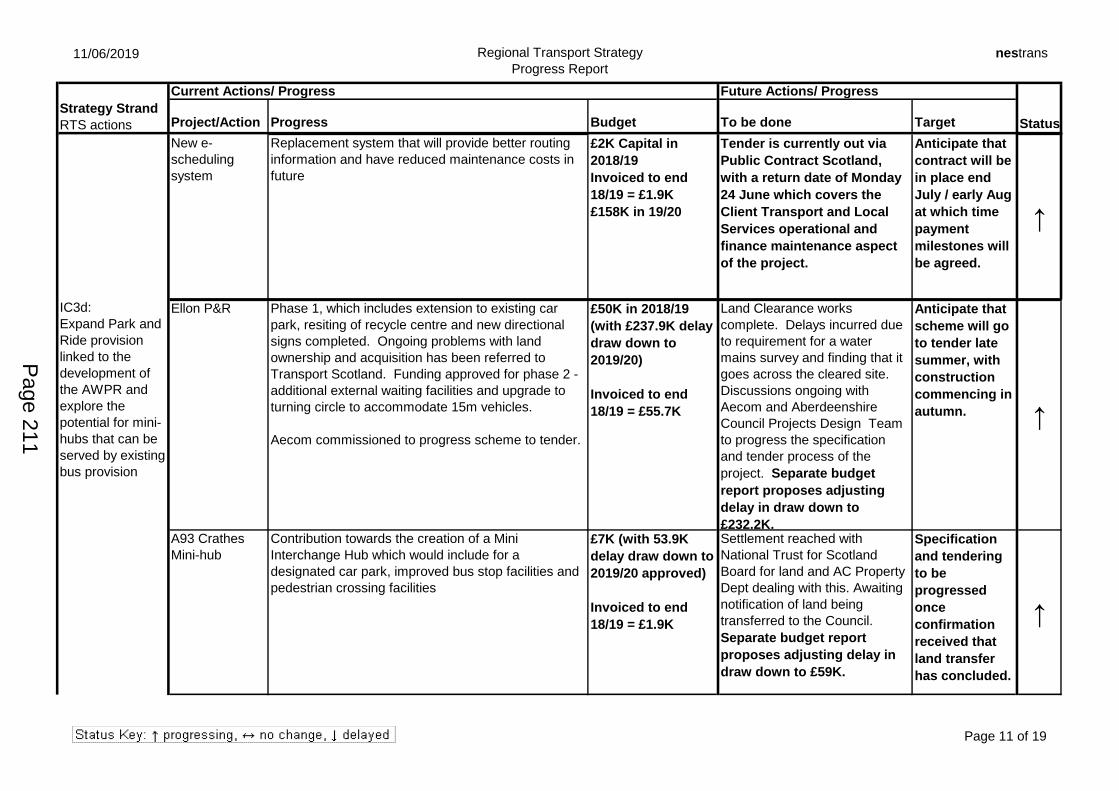
11/06/2019 Regional Transport Strategy
Progress Report
nestrans
Current Actions/ Progress Future Actions/ Progress
Project/Action Progress Budget To be done Target StatusStrategy Strand
RTS actions
New e-
scheduling
system
Replacement system that will provide better routing
information and have reduced maintenance costs in
future
£2K Capital in
2018/19
Invoiced to end
18/19 = £1.9K
£158K in 19/20
Tender is currently out via
Public Contract Scotland,
with a return date of Monday
24 June which covers the
Client Transport and Local
Services operational and
finance maintenance aspect
of the project.
Anticipate that
contract will be
in place end
July / early Aug
at which time
payment
milestones will
be agreed.
↑
A944 Grant of £112,500 awarded through S Gov Bus £33K Capital in Kingswells P&C entrance was ↑Ellon P&R Phase 1, which includes extension to existing car
park, resiting of recycle centre and new directional
signs completed. Ongoing problems with land
ownership and acquisition has been referred to
Transport Scotland. Funding approved for phase 2 -
additional external waiting facilities and upgrade to
turning circle to accommodate 15m vehicles.
Aecom commissioned to progress scheme to tender.
£50K in 2018/19
(with £237.9K delay
draw down to
2019/20)
Invoiced to end
18/19 = £55.7K
Land Clearance works
complete. Delays incurred due
to requirement for a water
mains survey and finding that it
goes across the cleared site.
Discussions ongoing with
Aecom and Aberdeenshire
Council Projects Design Team
to progress the specification
and tender process of the
project. Separate budget
report proposes adjusting
delay in draw down to
£232.2K.
Anticipate that
scheme will go
to tender late
summer, with
construction
commencing in
autumn. ↑
A93 Crathes
Mini-hub
Contribution towards the creation of a Mini
Interchange Hub which would include for a
designated car park, improved bus stop facilities and
pedestrian crossing facilities
£7K (with 53.9K
delay draw down to
2019/20 approved)
Invoiced to end
18/19 = £1.9K
Settlement reached with
National Trust for Scotland
Board for land and AC Property
Dept dealing with this. Awaiting
notification of land being
transferred to the Council.
Separate budget report
proposes adjusting delay in
draw down to £59K.
Specification
and tendering
to be
progressed
once
confirmation
received that
land transfer
has concluded.
↑
IC3d:
Expand Park and
Ride provision
linked to the
development of
the AWPR and
explore the
potential for mini-
hubs that can be
served by existing
bus provision
IC3d (contd)
IC3b:
Review and
continue to
deliver the Bus
Action Plan to
improve quality
and reliability of
services and set
out proposals for
extending bus
priority measures.
Page 11 of 19
Page 211
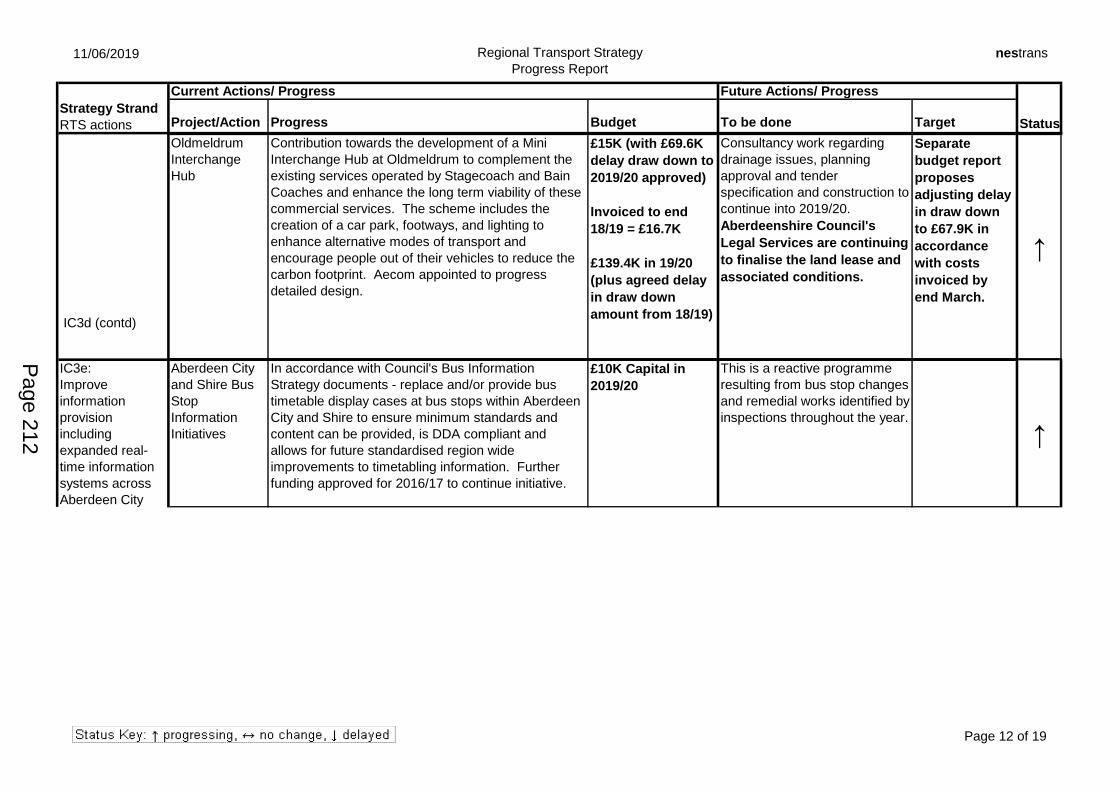
11/06/2019 Regional Transport Strategy
Progress Report
nestrans
Current Actions/ Progress Future Actions/ Progress
Project/Action Progress Budget To be done Target StatusStrategy Strand
RTS actions
Oldmeldrum
Interchange
Hub
Contribution towards the development of a Mini
Interchange Hub at Oldmeldrum to complement the
existing services operated by Stagecoach and Bain
Coaches and enhance the long term viability of these
commercial services. The scheme includes the
creation of a car park, footways, and lighting to
enhance alternative modes of transport and
encourage people out of their vehicles to reduce the
carbon footprint. Aecom appointed to progress
detailed design.
£15K (with £69.6K
delay draw down to
2019/20 approved)
Invoiced to end
18/19 = £16.7K
£139.4K in 19/20
(plus agreed delay
in draw down
amount from 18/19)
Consultancy work regarding
drainage issues, planning
approval and tender
specification and construction to
continue into 2019/20.
Aberdeenshire Council's
Legal Services are continuing
to finalise the land lease and
associated conditions.
Separate
budget report
proposes
adjusting delay
in draw down
to £67.9K in
accordance
with costs
invoiced by
end March.
↑
P&R operation Brief developed with LABOF partners to gain a better Research being Aecom appointed and market Action Plan to be ↑Aberdeen City
and Shire Bus
Stop
Information
Initiatives
In accordance with Council's Bus Information
Strategy documents - replace and/or provide bus
timetable display cases at bus stops within Aberdeen
City and Shire to ensure minimum standards and
content can be provided, is DDA compliant and
allows for future standardised region wide
improvements to timetabling information. Further
funding approved for 2016/17 to continue initiative.
£10K Capital in
2019/20
This is a reactive programme
resulting from bus stop changes
and remedial works identified by
inspections throughout the year.
↑
IC3e:
Improve
information
provision
including
expanded real-
time information
systems across
Aberdeen City
and Shire.
IC3d:
Expand Park and
Ride provision
linked to the
development of
the AWPR and
explore the
potential for mini-
hubs that can be
served by existing
bus provision
IC3d (contd)
Page 12 of 19
Page 212
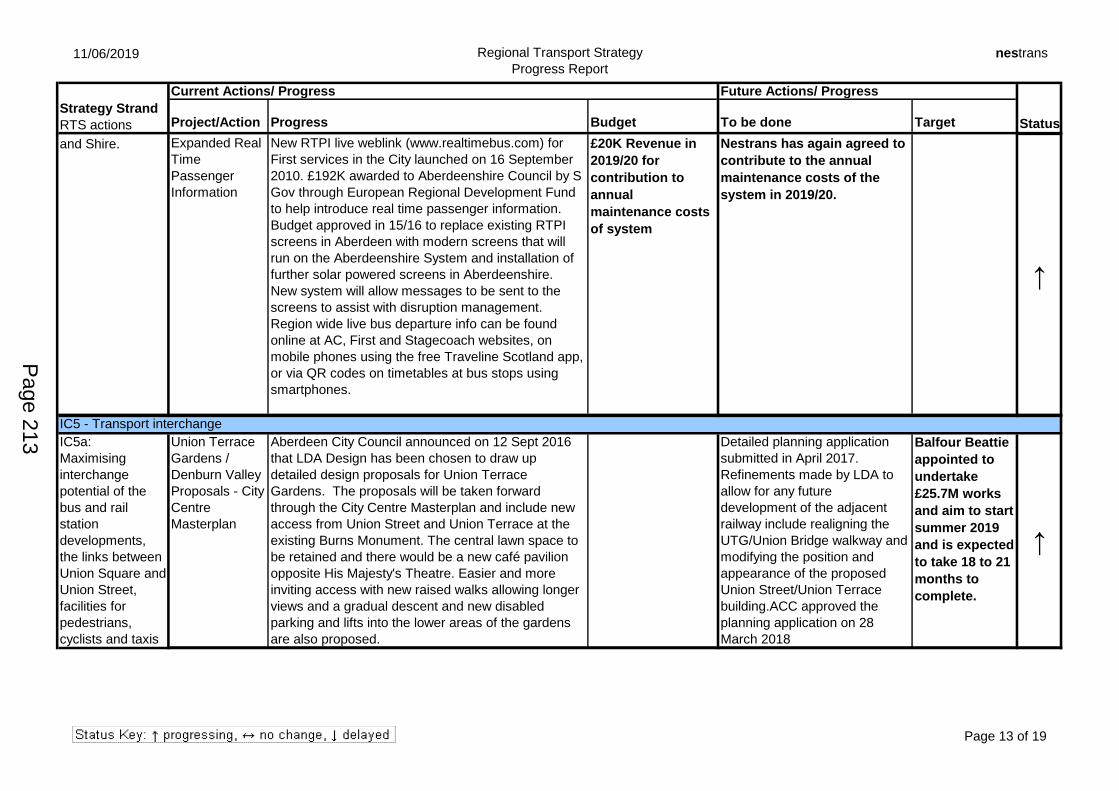
11/06/2019 Regional Transport Strategy
Progress Report
nestrans
Current Actions/ Progress Future Actions/ Progress
Project/Action Progress Budget To be done Target StatusStrategy Strand
RTS actions
Expanded Real
Time
Passenger
Information
New RTPI live weblink (www.realtimebus.com) for
First services in the City launched on 16 September
2010. £192K awarded to Aberdeenshire Council by S
Gov through European Regional Development Fund
to help introduce real time passenger information.
Budget approved in 15/16 to replace existing RTPI
screens in Aberdeen with modern screens that will
run on the Aberdeenshire System and installation of
further solar powered screens in Aberdeenshire.
New system will allow messages to be sent to the
screens to assist with disruption management.
Region wide live bus departure info can be found
online at AC, First and Stagecoach websites, on
mobile phones using the free Traveline Scotland app,
or via QR codes on timetables at bus stops using
smartphones.
£20K Revenue in
2019/20 for
contribution to
annual
maintenance costs
of system
Nestrans has again agreed to
contribute to the annual
maintenance costs of the
system in 2019/20.
↑
IC3f: See IC3c. To be investigated and IC5 - Transport interchange
Union Terrace
Gardens /
Denburn Valley
Proposals - City
Centre
Masterplan
Aberdeen City Council announced on 12 Sept 2016
that LDA Design has been chosen to draw up
detailed design proposals for Union Terrace
Gardens. The proposals will be taken forward
through the City Centre Masterplan and include new
access from Union Street and Union Terrace at the
existing Burns Monument. The central lawn space to
be retained and there would be a new café pavilion
opposite His Majesty's Theatre. Easier and more
inviting access with new raised walks allowing longer
views and a gradual descent and new disabled
parking and lifts into the lower areas of the gardens
are also proposed.
Detailed planning application
submitted in April 2017.
Refinements made by LDA to
allow for any future
development of the adjacent
railway include realigning the
UTG/Union Bridge walkway and
modifying the position and
appearance of the proposed
Union Street/Union Terrace
building.ACC approved the
planning application on 28
March 2018
Balfour Beattie
appointed to
undertake
£25.7M works
and aim to start
summer 2019
and is expected
to take 18 to 21
months to
complete.
↑
Peterhead ® Completed. Opened July 07.
IC3e:
Improve
information
provision
including
expanded real-
time information
systems across
Aberdeen City
and Shire.
IC5a:
Maximising
interchange
potential of the
bus and rail
station
developments,
the links between
Union Square and
Union Street,
facilities for
pedestrians,
cyclists and taxis
Page 13 of 19
Page 213
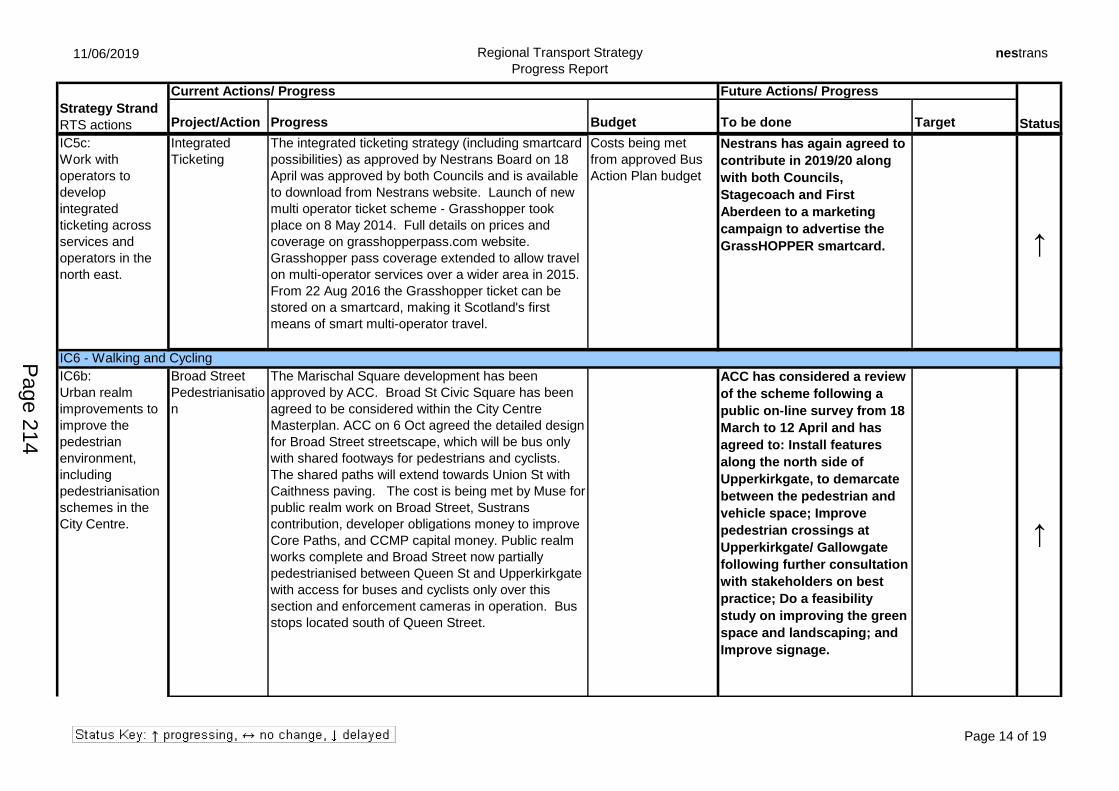
11/06/2019 Regional Transport Strategy
Progress Report
nestrans
Current Actions/ Progress Future Actions/ Progress
Project/Action Progress Budget To be done Target StatusStrategy Strand
RTS actions
Integrated
Ticketing
The integrated ticketing strategy (including smartcard
possibilities) as approved by Nestrans Board on 18
April was approved by both Councils and is available
to download from Nestrans website. Launch of new
multi operator ticket scheme - Grasshopper took
place on 8 May 2014. Full details on prices and
coverage on grasshopperpass.com website.
Grasshopper pass coverage extended to allow travel
on multi-operator services over a wider area in 2015.
From 22 Aug 2016 the Grasshopper ticket can be
stored on a smartcard, making it Scotland's first
means of smart multi-operator travel.
Costs being met
from approved Bus
Action Plan budget
Nestrans has again agreed to
contribute in 2019/20 along
with both Councils,
Stagecoach and First
Aberdeen to a marketing
campaign to advertise the
GrassHOPPER smartcard. ↑
Scotland wide A consultation on smart ticketing was opened on 13 On 9 March 2018 Transport The results of ↑IC6 - Walking and Cycling
Broad Street
Pedestrianisatio
n
The Marischal Square development has been
approved by ACC. Broad St Civic Square has been
agreed to be considered within the City Centre
Masterplan. ACC on 6 Oct agreed the detailed design
for Broad Street streetscape, which will be bus only
with shared footways for pedestrians and cyclists.
The shared paths will extend towards Union St with
Caithness paving. The cost is being met by Muse for
public realm work on Broad Street, Sustrans
contribution, developer obligations money to improve
Core Paths, and CCMP capital money. Public realm
works complete and Broad Street now partially
pedestrianised between Queen St and Upperkirkgate
with access for buses and cyclists only over this
section and enforcement cameras in operation. Bus
stops located south of Queen Street.
ACC has considered a review
of the scheme following a
public on-line survey from 18
March to 12 April and has
agreed to: Install features
along the north side of
Upperkirkgate, to demarcate
between the pedestrian and
vehicle space; Improve
pedestrian crossings at
Upperkirkgate/ Gallowgate
following further consultation
with stakeholders on best
practice; Do a feasibility
study on improving the green
space and landscaping; and
Improve signage.
↑
IC5c:
Work with
operators to
develop
integrated
ticketing across
services and
operators in the
north east.
IC6b:
Urban realm
improvements to
improve the
pedestrian
environment,
including
pedestrianisation
schemes in the
City Centre.
Page 14 of 19
Page 214
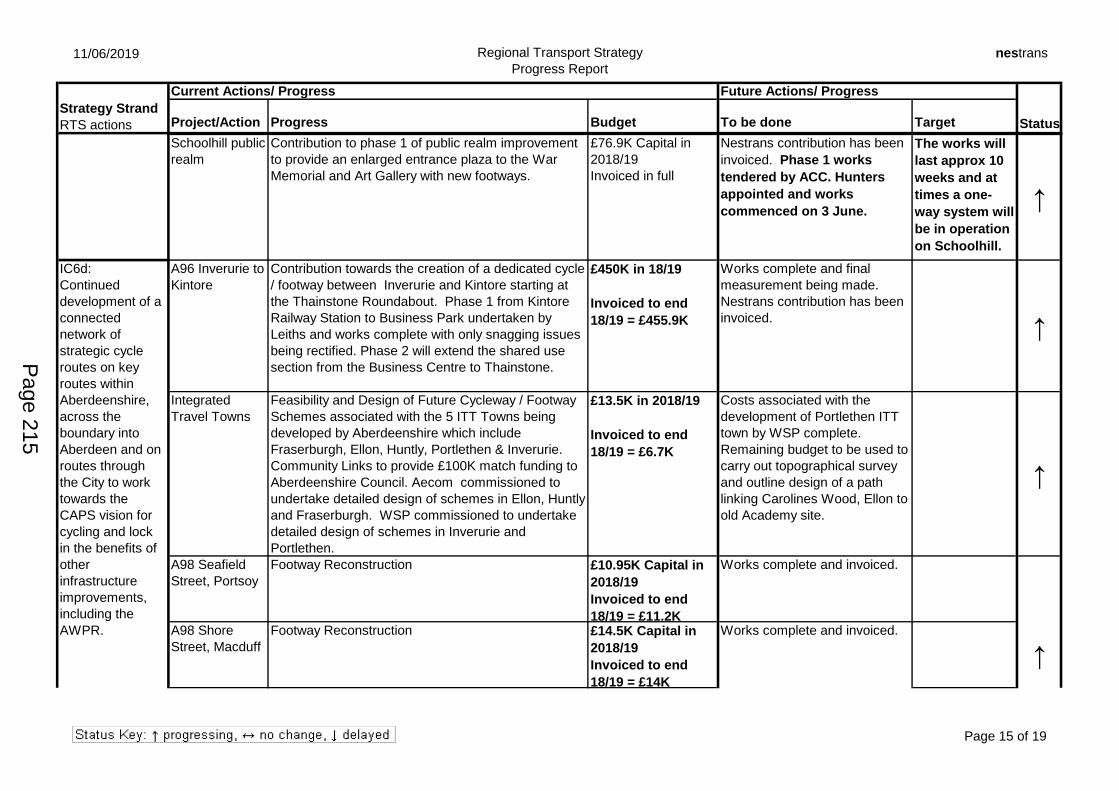
11/06/2019 Regional Transport Strategy
Progress Report
nestrans
Current Actions/ Progress Future Actions/ Progress
Project/Action Progress Budget To be done Target StatusStrategy Strand
RTS actions
Schoolhill public
realm
Contribution to phase 1 of public realm improvement
to provide an enlarged entrance plaza to the War
Memorial and Art Gallery with new footways.
£76.9K Capital in
2018/19
Invoiced in full
Nestrans contribution has been
invoiced. Phase 1 works
tendered by ACC. Hunters
appointed and works
commenced on 3 June.
The works will
last approx 10
weeks and at
times a one-
way system will
be in operation
on Schoolhill.
↑
A96 Inverurie to
Kintore
Contribution towards the creation of a dedicated cycle
/ footway between Inverurie and Kintore starting at
the Thainstone Roundabout. Phase 1 from Kintore
Railway Station to Business Park undertaken by
Leiths and works complete with only snagging issues
being rectified. Phase 2 will extend the shared use
section from the Business Centre to Thainstone.
£450K in 18/19
Invoiced to end
18/19 = £455.9K
Works complete and final
measurement being made.
Nestrans contribution has been
invoiced. ↑
Integrated
Travel Towns
Feasibility and Design of Future Cycleway / Footway
Schemes associated with the 5 ITT Towns being
developed by Aberdeenshire which include
Fraserburgh, Ellon, Huntly, Portlethen & Inverurie.
Community Links to provide £100K match funding to
Aberdeenshire Council. Aecom commissioned to
undertake detailed design of schemes in Ellon, Huntly
and Fraserburgh. WSP commissioned to undertake
detailed design of schemes in Inverurie and
Portlethen.
£13.5K in 2018/19
Invoiced to end
18/19 = £6.7K
Costs associated with the
development of Portlethen ITT
town by WSP complete.
Remaining budget to be used to
carry out topographical survey
and outline design of a path
linking Carolines Wood, Ellon to
old Academy site.
↑
A98 Seafield
Street, Portsoy
Footway Reconstruction £10.95K Capital in
2018/19
Invoiced to end
18/19 = £11.2K
Works complete and invoiced.
A98 Shore
Street, Macduff
Footway Reconstruction £14.5K Capital in
2018/19
Invoiced to end
18/19 = £14K
Works complete and invoiced.
IC6b:
Urban realm
improvements to
improve the
pedestrian
environment,
including
pedestrianisation
schemes in the
City Centre.
IC6d:
Continued
development of a
connected
network of
strategic cycle
routes on key
routes within
Aberdeenshire,
across the
boundary into
Aberdeen and on
routes through
the City to work
towards the
CAPS vision for
cycling and lock
in the benefits of
other
infrastructure
improvements,
including the
AWPR.
IC6d (contd)
IC6d (contd)
↑
Page 15 of 19
Page 215
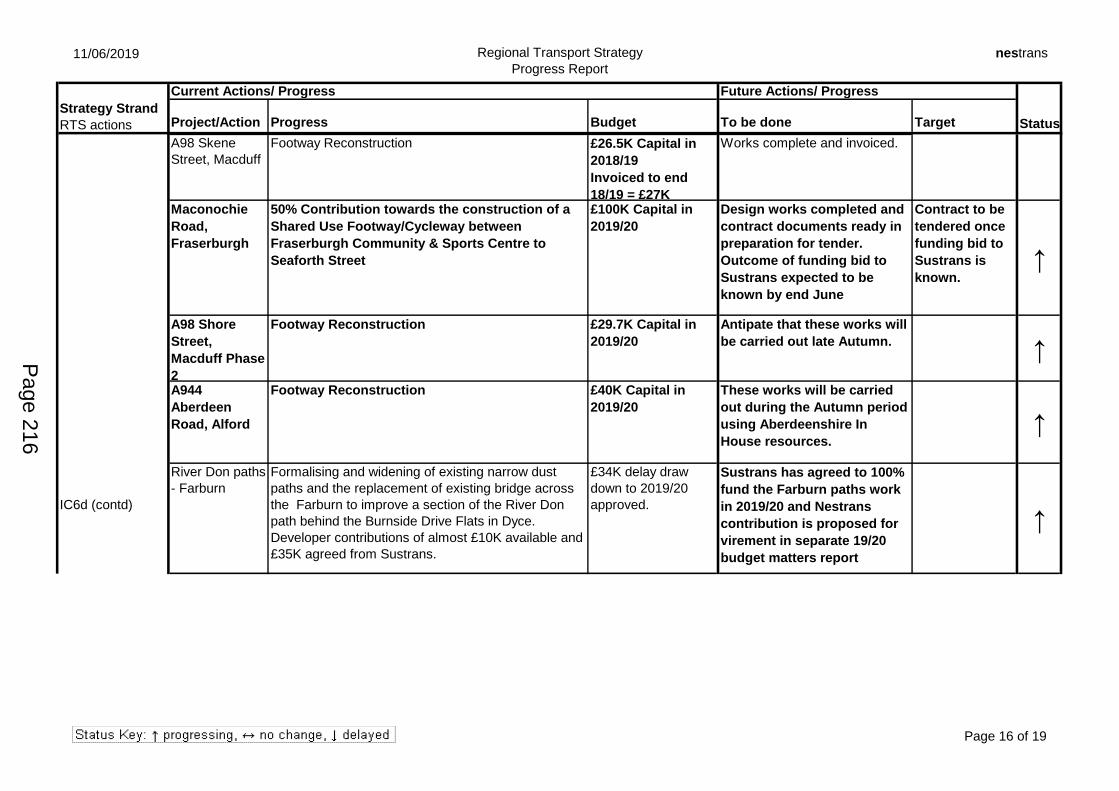
11/06/2019 Regional Transport Strategy
Progress Report
nestrans
Current Actions/ Progress Future Actions/ Progress
Project/Action Progress Budget To be done Target StatusStrategy Strand
RTS actions
A98 Skene
Street, Macduff
Footway Reconstruction £26.5K Capital in
2018/19
Invoiced to end
18/19 = £27K
Works complete and invoiced.
Maconochie
Road,
Fraserburgh
50% Contribution towards the construction of a
Shared Use Footway/Cycleway between
Fraserburgh Community & Sports Centre to
Seaforth Street
£100K Capital in
2019/20
Design works completed and
contract documents ready in
preparation for tender.
Outcome of funding bid to
Sustrans expected to be
known by end June
Contract to be
tendered once
funding bid to
Sustrans is
known.↑
A98 Shore
Street,
Macduff Phase
2
Footway Reconstruction £29.7K Capital in
2019/20
Antipate that these works will
be carried out late Autumn. ↑
A944
Aberdeen
Road, Alford
Footway Reconstruction £40K Capital in
2019/20
These works will be carried
out during the Autumn period
using Aberdeenshire In
House resources.↑
River Don paths
- Farburn
Formalising and widening of existing narrow dust
paths and the replacement of existing bridge across
the Farburn to improve a section of the River Don
path behind the Burnside Drive Flats in Dyce.
Developer contributions of almost £10K available and
£35K agreed from Sustrans.
£34K delay draw
down to 2019/20
approved.
Sustrans has agreed to 100%
fund the Farburn paths work
in 2019/20 and Nestrans
contribution is proposed for
virement in separate 19/20
budget matters report
↑
IC6d:
Continued
development of a
connected
network of
strategic cycle
routes on key
routes within
Aberdeenshire,
across the
boundary into
Aberdeen and on
routes through
the City to work
towards the
CAPS vision for
cycling and lock
in the benefits of
other
infrastructure
improvements,
including the
AWPR.
IC6d (contd)
IC6d (contd)
↑
Page 16 of 19
Page 216
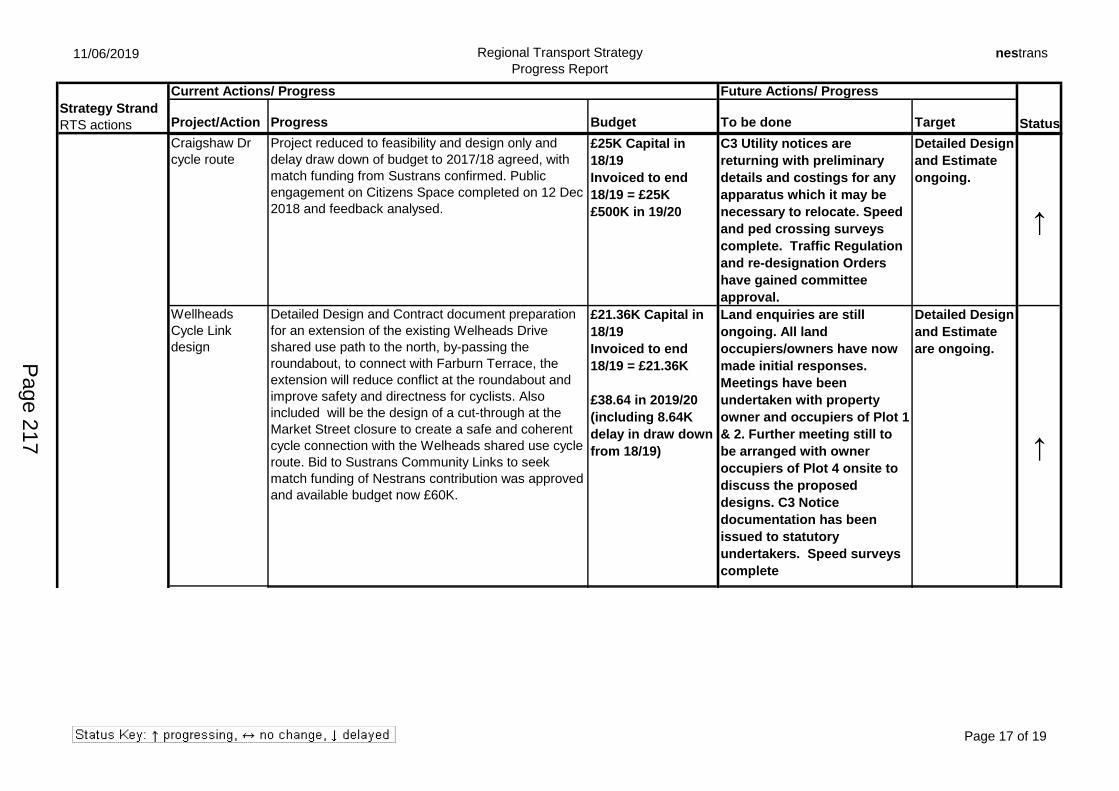
11/06/2019 Regional Transport Strategy
Progress Report
nestrans
Current Actions/ Progress Future Actions/ Progress
Project/Action Progress Budget To be done Target StatusStrategy Strand
RTS actions
Craigshaw Dr
cycle route
Project reduced to feasibility and design only and
delay draw down of budget to 2017/18 agreed, with
match funding from Sustrans confirmed. Public
engagement on Citizens Space completed on 12 Dec
2018 and feedback analysed.
£25K Capital in
18/19
Invoiced to end
18/19 = £25K
£500K in 19/20
C3 Utility notices are
returning with preliminary
details and costings for any
apparatus which it may be
necessary to relocate. Speed
and ped crossing surveys
complete. Traffic Regulation
and re-designation Orders
have gained committee
approval.
Detailed Design
and Estimate
ongoing.
↑
Wellheads
Cycle Link
design
Detailed Design and Contract document preparation
for an extension of the existing Welheads Drive
shared use path to the north, by-passing the
roundabout, to connect with Farburn Terrace, the
extension will reduce conflict at the roundabout and
improve safety and directness for cyclists. Also
included will be the design of a cut-through at the
Market Street closure to create a safe and coherent
cycle connection with the Welheads shared use cycle
route. Bid to Sustrans Community Links to seek
match funding of Nestrans contribution was approved
and available budget now £60K.
£21.36K Capital in
18/19
Invoiced to end
18/19 = £21.36K
£38.64 in 2019/20
(including 8.64K
delay in draw down
from 18/19)
Land enquiries are still
ongoing. All land
occupiers/owners have now
made initial responses.
Meetings have been
undertaken with property
owner and occupiers of Plot 1
& 2. Further meeting still to
be arranged with owner
occupiers of Plot 4 onsite to
discuss the proposed
designs. C3 Notice
documentation has been
issued to statutory
undertakers. Speed surveys
complete
Detailed Design
and Estimate
are ongoing.
↑
A90(T) Parkway Extend the cycle route on the Parkway from £9K Capital in 18/19 ACC Estates still seeking to Land purchase ↔
IC6d:
Continued
development of a
connected
network of
strategic cycle
routes on key
routes within
Aberdeenshire,
across the
boundary into
Aberdeen and on
routes through
the City to work
towards the
CAPS vision for
cycling and lock
in the benefits of
other
infrastructure
improvements,
including the
AWPR.
IC6d (contd)
IC6d (contd)
Page 17 of 19
Page 217
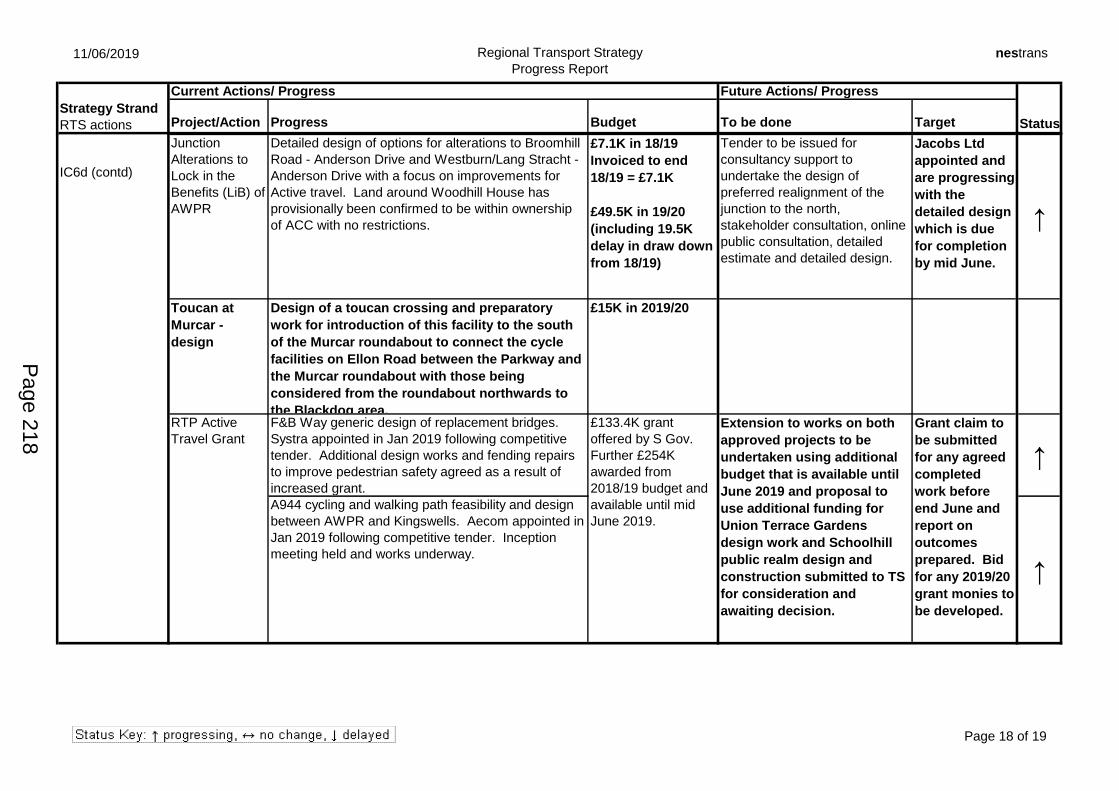
11/06/2019 Regional Transport Strategy
Progress Report
nestrans
Current Actions/ Progress Future Actions/ Progress
Project/Action Progress Budget To be done Target StatusStrategy Strand
RTS actions
Junction
Alterations to
Lock in the
Benefits (LiB) of
AWPR
Detailed design of options for alterations to Broomhill
Road - Anderson Drive and Westburn/Lang Stracht -
Anderson Drive with a focus on improvements for
Active travel. Land around Woodhill House has
provisionally been confirmed to be within ownership
of ACC with no restrictions.
£7.1K in 18/19
Invoiced to end
18/19 = £7.1K
£49.5K in 19/20
(including 19.5K
delay in draw down
from 18/19)
Tender to be issued for
consultancy support to
undertake the design of
preferred realignment of the
junction to the north,
stakeholder consultation, online
public consultation, detailed
estimate and detailed design.
Jacobs Ltd
appointed and
are progressing
with the
detailed design
which is due
for completion
by mid June.
↑
Toucan at
Murcar -
design
Design of a toucan crossing and preparatory
work for introduction of this facility to the south
of the Murcar roundabout to connect the cycle
facilities on Ellon Road between the Parkway and
the Murcar roundabout with those being
considered from the roundabout northwards to
the Blackdog area.
£15K in 2019/20
F&B Way generic design of replacement bridges.
Systra appointed in Jan 2019 following competitive
tender. Additional design works and fending repairs
to improve pedestrian safety agreed as a result of
increased grant.
↑
A944 cycling and walking path feasibility and design
between AWPR and Kingswells. Aecom appointed in
Jan 2019 following competitive tender. Inception
meeting held and works underway.
↑
IC6d:
Continued
development of a
connected
network of
strategic cycle
routes on key
routes within
Aberdeenshire,
across the
boundary into
Aberdeen and on
routes through
the City to work
towards the
CAPS vision for
cycling and lock
in the benefits of
other
infrastructure
improvements,
including the
AWPR.
IC6d (contd)
IC6d (contd)
RTP Active
Travel Grant
£133.4K grant
offered by S Gov.
Further £254K
awarded from
2018/19 budget and
available until mid
June 2019.
Grant claim to
be submitted
for any agreed
completed
work before
end June and
report on
outcomes
prepared. Bid
for any 2019/20
grant monies to
be developed.
Extension to works on both
approved projects to be
undertaken using additional
budget that is available until
June 2019 and proposal to
use additional funding for
Union Terrace Gardens
design work and Schoolhill
public realm design and
construction submitted to TS
for consideration and
awaiting decision.
Page 18 of 19
Page 218
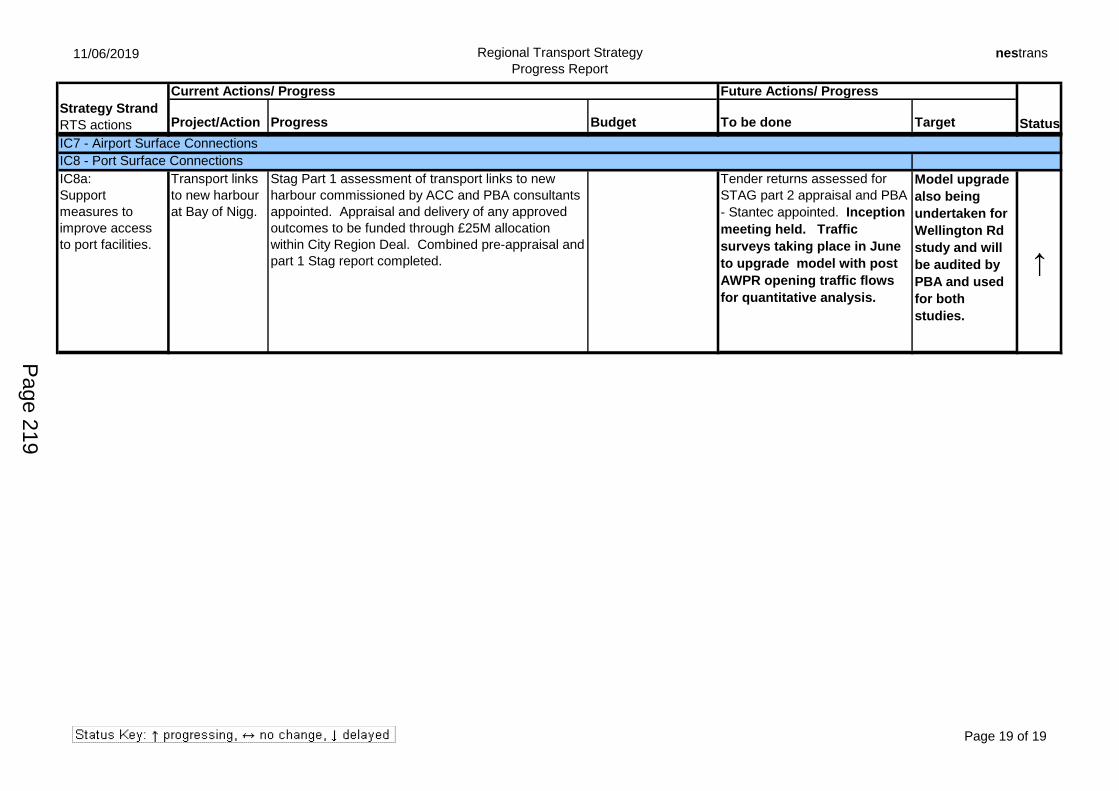
11/06/2019 Regional Transport Strategy
Progress Report
nestrans
Current Actions/ Progress Future Actions/ Progress
Project/Action Progress Budget To be done Target StatusStrategy Strand
RTS actions
IC7 - Airport Surface Connections
IC8 - Port Surface Connections
Transport links
to new harbour
at Bay of Nigg.
Stag Part 1 assessment of transport links to new
harbour commissioned by ACC and PBA consultants
appointed. Appraisal and delivery of any approved
outcomes to be funded through £25M allocation
within City Region Deal. Combined pre-appraisal and
part 1 Stag report completed.
Tender returns assessed for
STAG part 2 appraisal and PBA
- Stantec appointed. Inception
meeting held. Traffic
surveys taking place in June
to upgrade model with post
AWPR opening traffic flows
for quantitative analysis.
Model upgrade
also being
undertaken for
Wellington Rd
study and will
be audited by
PBA and used
for both
studies.
↑
Local Transport Projects to be developed where possible from LTS. ↑
IC8a:
Support
measures to
improve access
to port facilities.
Page 19 of 19
Page 219

This page is intentionally left blank
Page 220
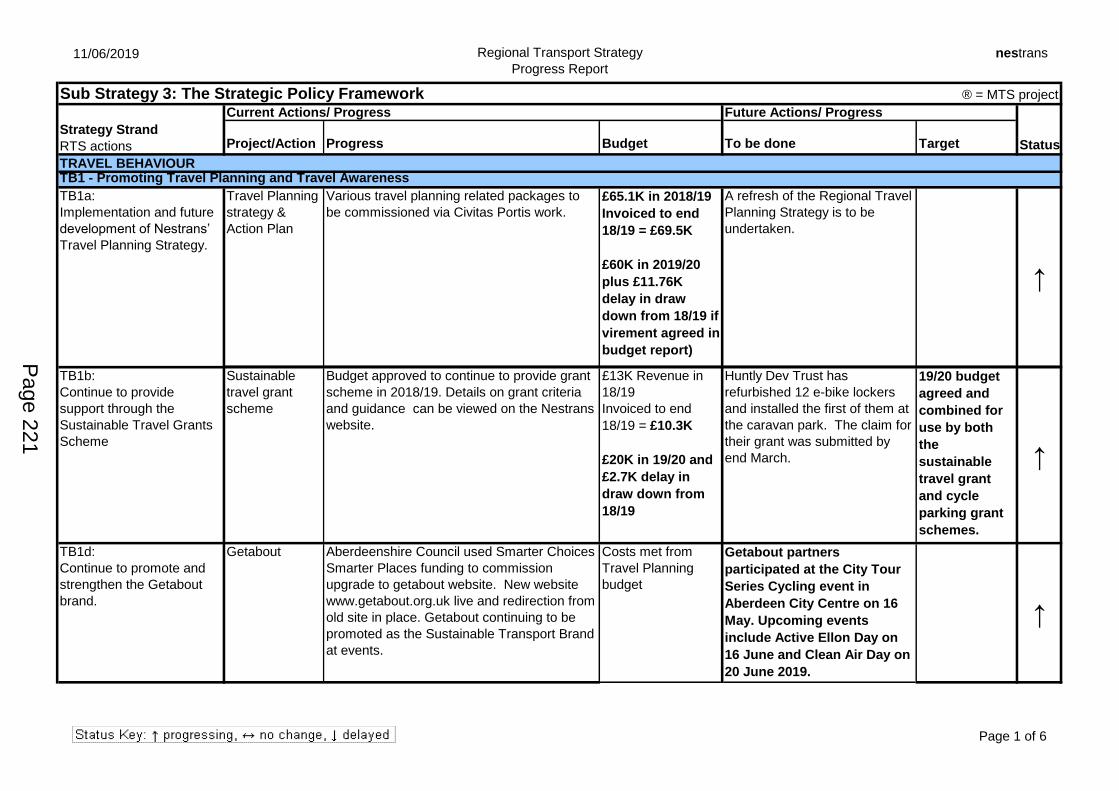
11/06/2019 Regional Transport Strategy
Progress Report
nestrans
Sub Strategy 3: The Strategic Policy Framework ® = MTS project
Current Actions/ Progress Future Actions/ Progress
Project/Action Progress Budget To be done Target Status
TRAVEL BEHAVIOURTB1 - Promoting Travel Planning and Travel Awareness
Travel Planning
strategy &
Action Plan
Various travel planning related packages to
be commissioned via Civitas Portis work.
£65.1K in 2018/19
Invoiced to end
18/19 = £69.5K
£60K in 2019/20
plus £11.76K
delay in draw
down from 18/19 if
virement agreed in
budget report)
A refresh of the Regional Travel
Planning Strategy is to be
undertaken.
↑
H&T Action See IC4aTB1b:
Continue to provide
support through the
Sustainable Travel Grants
Scheme
Sustainable
travel grant
scheme
Budget approved to continue to provide grant
scheme in 2018/19. Details on grant criteria
and guidance can be viewed on the Nestrans
website.
£13K Revenue in
18/19
Invoiced to end
18/19 = £10.3K
£20K in 19/20 and
£2.7K delay in
draw down from
18/19
Huntly Dev Trust has
refurbished 12 e-bike lockers
and installed the first of them at
the caravan park. The claim for
their grant was submitted by
end March.
19/20 budget
agreed and
combined for
use by both
the
sustainable
travel grant
and cycle
parking grant
schemes.
↑
TB1d:
Continue to promote and
strengthen the Getabout
brand.
Getabout Aberdeenshire Council used Smarter Choices
Smarter Places funding to commission
upgrade to getabout website. New website
www.getabout.org.uk live and redirection from
old site in place. Getabout continuing to be
promoted as the Sustainable Transport Brand
at events.
Costs met from
Travel Planning
budget
Getabout partners
participated at the City Tour
Series Cycling event in
Aberdeen City Centre on 16
May. Upcoming events
include Active Ellon Day on
16 June and Clean Air Day on
20 June 2019.
↑
Strategy Strand
RTS actions
TB1a:
Implementation and future
development of Nestrans’
Travel Planning Strategy.
Page 1 of 6
Page 221
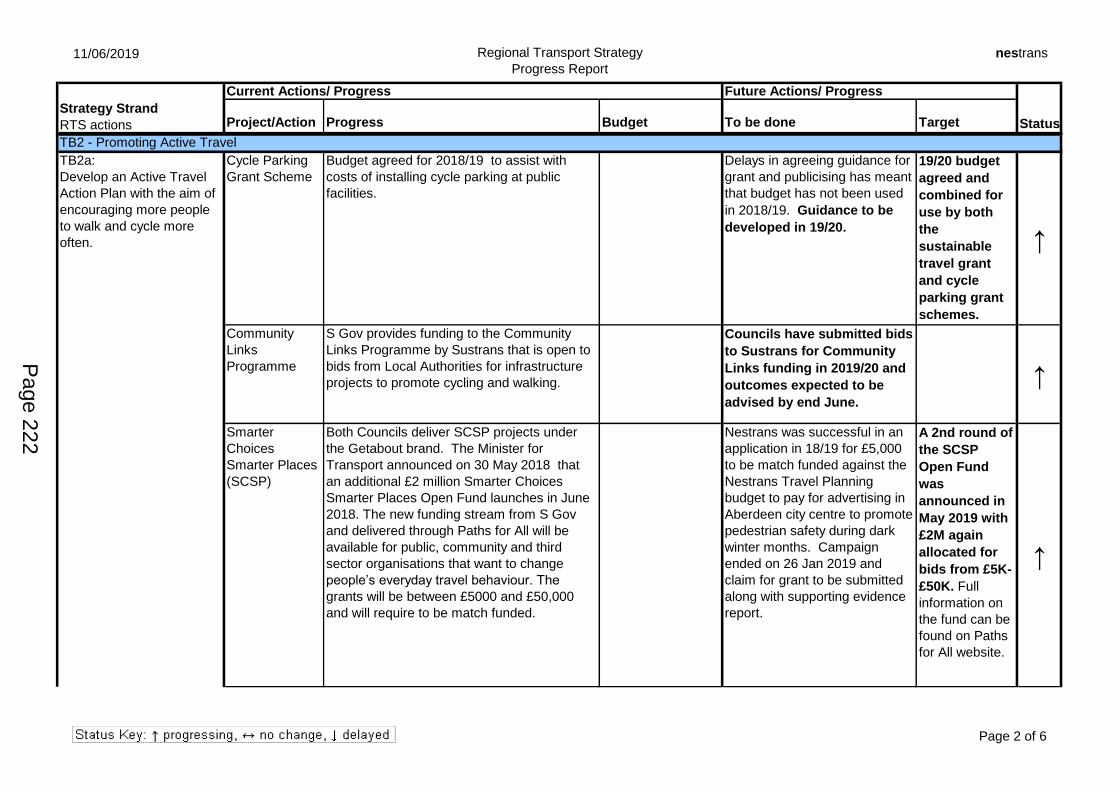
11/06/2019 Regional Transport Strategy
Progress Report
nestrans
Current Actions/ Progress Future Actions/ Progress
Project/Action Progress Budget To be done Target StatusStrategy Strand
RTS actions
TB2 - Promoting Active Travel
Cycle Parking
Grant Scheme
Budget agreed for 2018/19 to assist with
costs of installing cycle parking at public
facilities.
Delays in agreeing guidance for
grant and publicising has meant
that budget has not been used
in 2018/19. Guidance to be
developed in 19/20.
19/20 budget
agreed and
combined for
use by both
the
sustainable
travel grant
and cycle
parking grant
schemes.
↑
Community
Links
Programme
S Gov provides funding to the Community
Links Programme by Sustrans that is open to
bids from Local Authorities for infrastructure
projects to promote cycling and walking.
Councils have submitted bids
to Sustrans for Community
Links funding in 2019/20 and
outcomes expected to be
advised by end June.
↑
Smarter
Choices
Smarter Places
(SCSP)
Both Councils deliver SCSP projects under
the Getabout brand. The Minister for
Transport announced on 30 May 2018 that
an additional £2 million Smarter Choices
Smarter Places Open Fund launches in June
2018. The new funding stream from S Gov
and delivered through Paths for All will be
available for public, community and third
sector organisations that want to change
people’s everyday travel behaviour. The
grants will be between £5000 and £50,000
and will require to be match funded.
Nestrans was successful in an
application in 18/19 for £5,000
to be match funded against the
Nestrans Travel Planning
budget to pay for advertising in
Aberdeen city centre to promote
pedestrian safety during dark
winter months. Campaign
ended on 26 Jan 2019 and
claim for grant to be submitted
along with supporting evidence
report.
A 2nd round of
the SCSP
Open Fund
was
announced in
May 2019 with
£2M again
allocated for
bids from £5K-
£50K. Full
information on
the fund can be
found on Paths
for All website.
↑
TB2a:
Develop an Active Travel
Action Plan with the aim of
encouraging more people
to walk and cycle more
often.
Page 2 of 6
Page 222
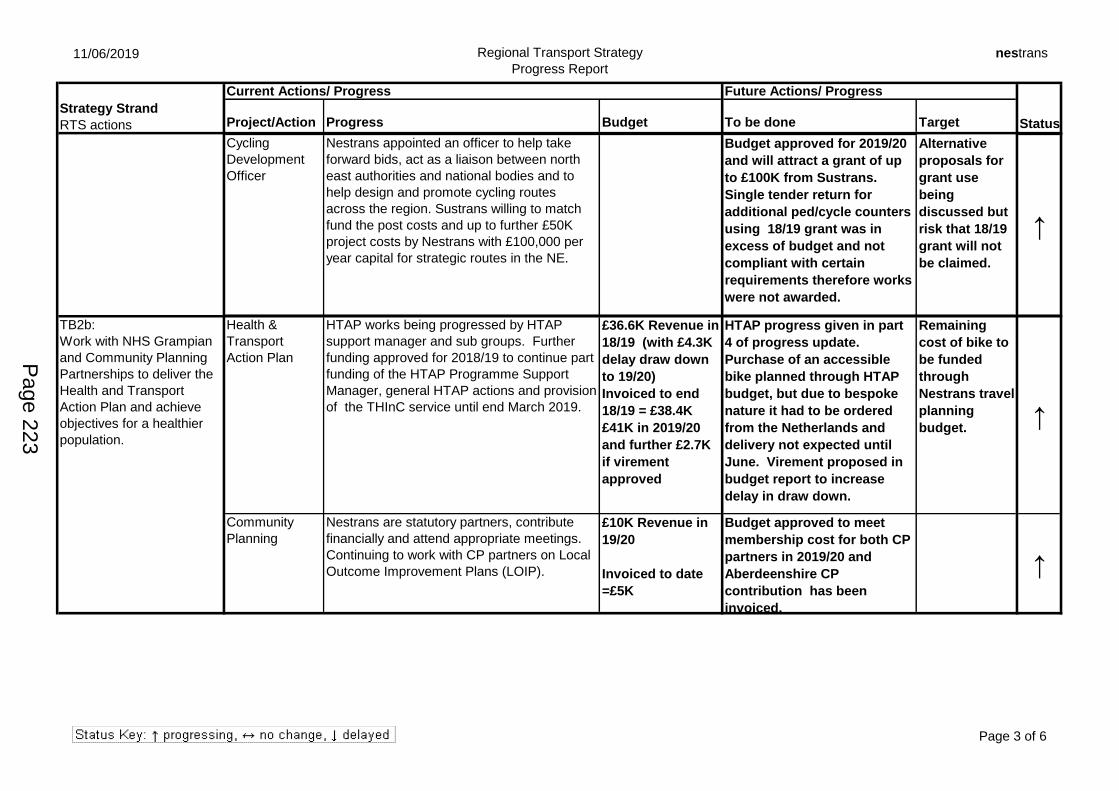
11/06/2019 Regional Transport Strategy
Progress Report
nestrans
Current Actions/ Progress Future Actions/ Progress
Project/Action Progress Budget To be done Target StatusStrategy Strand
RTS actions
Cycling
Development
Officer
Nestrans appointed an officer to help take
forward bids, act as a liaison between north
east authorities and national bodies and to
help design and promote cycling routes
across the region. Sustrans willing to match
fund the post costs and up to further £50K
project costs by Nestrans with £100,000 per
year capital for strategic routes in the NE.
Budget approved for 2019/20
and will attract a grant of up
to £100K from Sustrans.
Single tender return for
additional ped/cycle counters
using 18/19 grant was in
excess of budget and not
compliant with certain
requirements therefore works
were not awarded.
Alternative
proposals for
grant use
being
discussed but
risk that 18/19
grant will not
be claimed.
↑
Cycle Range of bikes purchased and delivered for Funding to be Cycling Roadshow was used at ↑Health &
Transport
Action Plan
HTAP works being progressed by HTAP
support manager and sub groups. Further
funding approved for 2018/19 to continue part
funding of the HTAP Programme Support
Manager, general HTAP actions and provision
of the THInC service until end March 2019.
£36.6K Revenue in
18/19 (with £4.3K
delay draw down
to 19/20)
Invoiced to end
18/19 = £38.4K
£41K in 2019/20
and further £2.7K
if virement
approved
HTAP progress given in part
4 of progress update.
Purchase of an accessible
bike planned through HTAP
budget, but due to bespoke
nature it had to be ordered
from the Netherlands and
delivery not expected until
June. Virement proposed in
budget report to increase
delay in draw down.
Remaining
cost of bike to
be funded
through
Nestrans travel
planning
budget.↑
Community
Planning
Nestrans are statutory partners, contribute
financially and attend appropriate meetings.
Continuing to work with CP partners on Local
Outcome Improvement Plans (LOIP).
£10K Revenue in
19/20
Invoiced to date
=£5K
Budget approved to meet
membership cost for both CP
partners in 2019/20 and
Aberdeenshire CP
contribution has been
invoiced.
↑
TB2b:
Work with NHS Grampian
and Community Planning
Partnerships to deliver the
Health and Transport
Action Plan and achieve
objectives for a healthier
population.
TB2a:
Develop an Active Travel
Action Plan with the aim of
encouraging more people
to walk and cycle more
often.
Page 3 of 6
Page 223
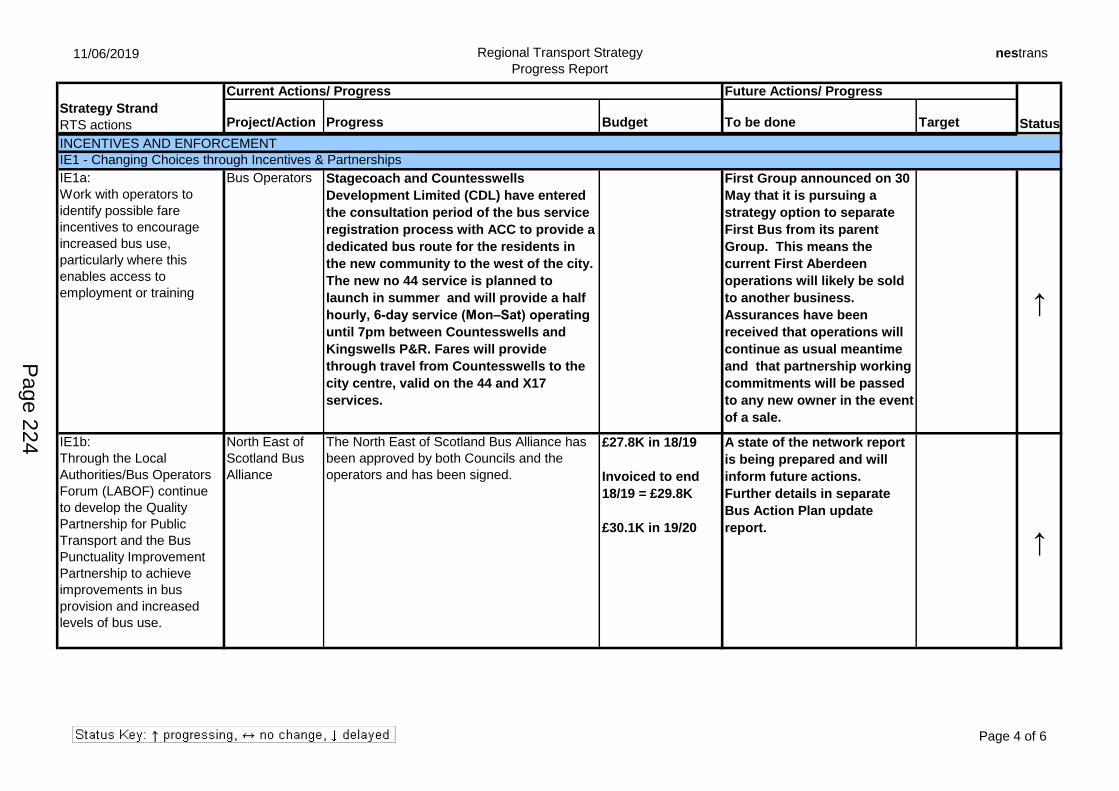
11/06/2019 Regional Transport Strategy
Progress Report
nestrans
Current Actions/ Progress Future Actions/ Progress
Project/Action Progress Budget To be done Target StatusStrategy Strand
RTS actions
INCENTIVES AND ENFORCEMENT
IE1 - Changing Choices through Incentives & Partnerships
Bus Operators Stagecoach and Countesswells
Development Limited (CDL) have entered
the consultation period of the bus service
registration process with ACC to provide a
dedicated bus route for the residents in
the new community to the west of the city.
The new no 44 service is planned to
launch in summer and will provide a half
hourly, 6-day service (Mon–Sat) operating
until 7pm between Countesswells and
Kingswells P&R. Fares will provide
through travel from Countesswells to the
city centre, valid on the 44 and X17
services.
First Group announced on 30
May that it is pursuing a
strategy option to separate
First Bus from its parent
Group. This means the
current First Aberdeen
operations will likely be sold
to another business.
Assurances have been
received that operations will
continue as usual meantime
and that partnership working
commitments will be passed
to any new owner in the event
of a sale.
↑
IE1b:
Through the Local
Authorities/Bus Operators
Forum (LABOF) continue
to develop the Quality
Partnership for Public
Transport and the Bus
Punctuality Improvement
Partnership to achieve
improvements in bus
provision and increased
levels of bus use.
North East of
Scotland Bus
Alliance
The North East of Scotland Bus Alliance has
been approved by both Councils and the
operators and has been signed.
£27.8K in 18/19
Invoiced to end
18/19 = £29.8K
£30.1K in 19/20
A state of the network report
is being prepared and will
inform future actions.
Further details in separate
Bus Action Plan update
report.
↑
IE1a:
Work with operators to
identify possible fare
incentives to encourage
increased bus use,
particularly where this
enables access to
employment or training
Page 4 of 6
Page 224
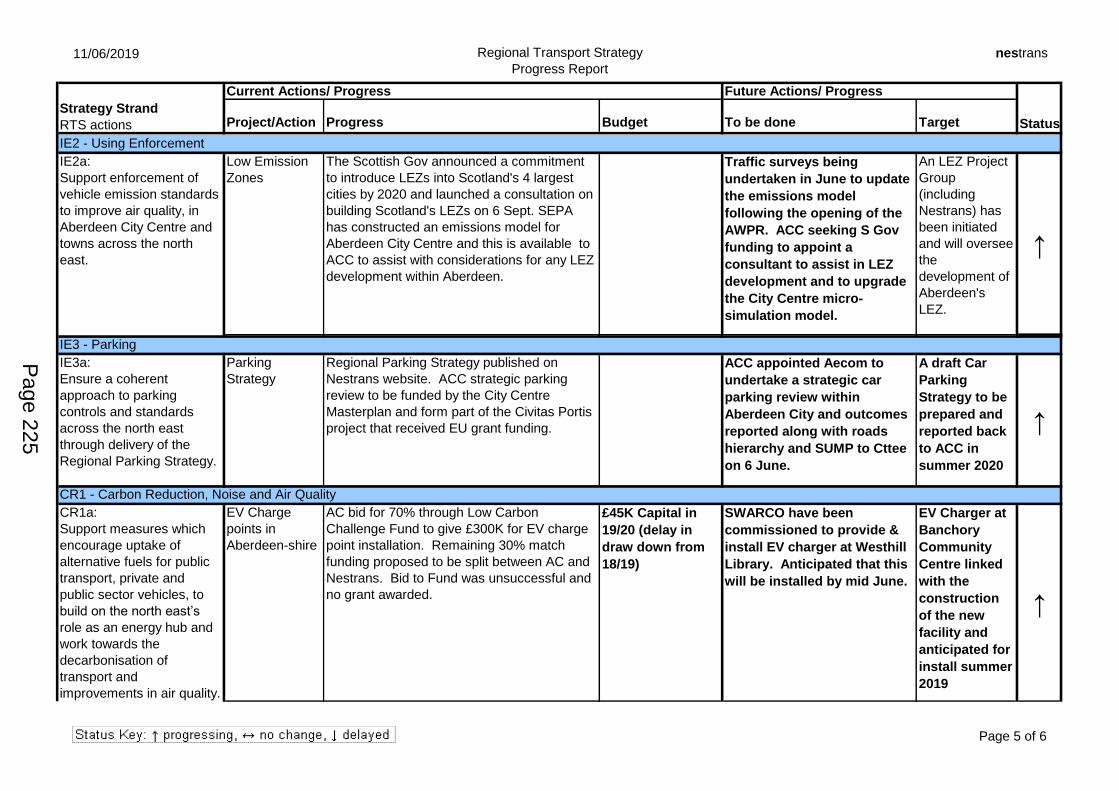
11/06/2019 Regional Transport Strategy
Progress Report
nestrans
Current Actions/ Progress Future Actions/ Progress
Project/Action Progress Budget To be done Target StatusStrategy Strand
RTS actions
IE2 - Using Enforcement
Low Emission
Zones
The Scottish Gov announced a commitment
to introduce LEZs into Scotland's 4 largest
cities by 2020 and launched a consultation on
building Scotland's LEZs on 6 Sept. SEPA
has constructed an emissions model for
Aberdeen City Centre and this is available to
ACC to assist with considerations for any LEZ
development within Aberdeen.
Traffic surveys being
undertaken in June to update
the emissions model
following the opening of the
AWPR. ACC seeking S Gov
funding to appoint a
consultant to assist in LEZ
development and to upgrade
the City Centre micro-
simulation model.
An LEZ Project
Group
(including
Nestrans) has
been initiated
and will oversee
the
development of
Aberdeen's
LEZ.
↑
IE2b: Casualty Reduction Partnership group report ↑IE2d: Bus Lane Nestrans funded new camera system and £200K Capital and Aberdeen City Council IE3 - Parking
IE3a:
Ensure a coherent
approach to parking
controls and standards
across the north east
through delivery of the
Regional Parking Strategy.
Parking
Strategy
Regional Parking Strategy published on
Nestrans website. ACC strategic parking
review to be funded by the City Centre
Masterplan and form part of the Civitas Portis
project that received EU grant funding.
ACC appointed Aecom to
undertake a strategic car
parking review within
Aberdeen City and outcomes
reported along with roads
hierarchy and SUMP to Cttee
on 6 June.
A draft Car
Parking
Strategy to be
prepared and
reported back
to ACC in
summer 2020
↑
CR1 - Carbon Reduction, Noise and Air Quality
EV Charge
points in
Aberdeen-shire
AC bid for 70% through Low Carbon
Challenge Fund to give £300K for EV charge
point installation. Remaining 30% match
funding proposed to be split between AC and
Nestrans. Bid to Fund was unsuccessful and
no grant awarded.
£45K Capital in
19/20 (delay in
draw down from
18/19)
SWARCO have been
commissioned to provide &
install EV charger at Westhill
Library. Anticipated that this
will be installed by mid June.
EV Charger at
Banchory
Community
Centre linked
with the
construction
of the new
facility and
anticipated for
install summer
2019
↑
CR1a:
Support measures which
encourage uptake of
alternative fuels for public
transport, private and
public sector vehicles, to
build on the north east’s
role as an energy hub and
work towards the
decarbonisation of
transport and
improvements in air quality.
IE2a:
Support enforcement of
vehicle emission standards
to improve air quality, in
Aberdeen City Centre and
towns across the north
east.
Page 5 of 6
Page 225
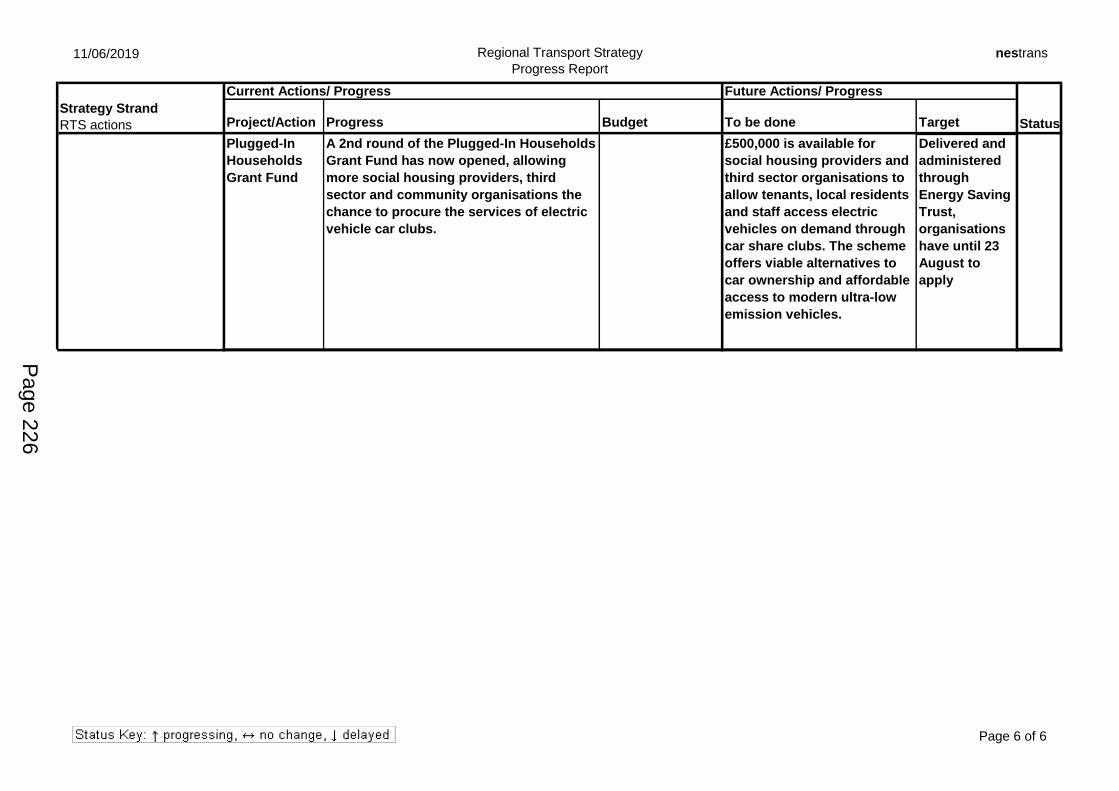
11/06/2019 Regional Transport Strategy
Progress Report
nestrans
Current Actions/ Progress Future Actions/ Progress
Project/Action Progress Budget To be done Target StatusStrategy Strand
RTS actions
Plugged-In
Households
Grant Fund
A 2nd round of the Plugged-In Households
Grant Fund has now opened, allowing
more social housing providers, third
sector and community organisations the
chance to procure the services of electric
vehicle car clubs.
£500,000 is available for
social housing providers and
third sector organisations to
allow tenants, local residents
and staff access electric
vehicles on demand through
car share clubs. The scheme
offers viable alternatives to
car ownership and affordable
access to modern ultra-low
emission vehicles.
Delivered and
administered
through
Energy Saving
Trust,
organisations
have until 23
August to
apply
AWPR AWPR GoNorthEast campaign was launched The free Community Weekend Anyone not ↑
CR1a:
Support measures which
encourage uptake of
alternative fuels for public
transport, private and
public sector vehicles, to
build on the north east’s
role as an energy hub and
work towards the
decarbonisation of
transport and
improvements in air quality.
Page 6 of 6
Page 226
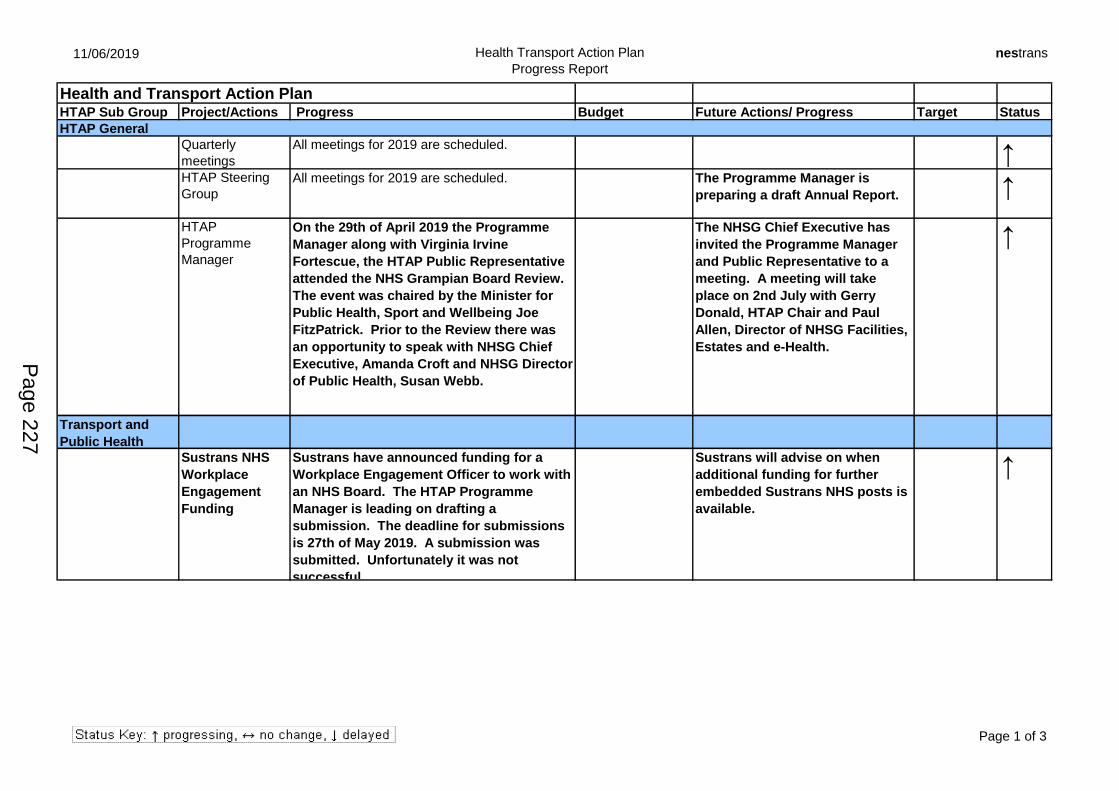
11/06/2019 Health Transport Action Plan
Progress Report
nestrans
Health and Transport Action PlanHTAP Sub Group Project/Actions Progress Budget Future Actions/ Progress Target Status
Quarterly
meetings
All meetings for 2019 are scheduled. ↑HTAP Steering
Group
All meetings for 2019 are scheduled. The Programme Manager is
preparing a draft Annual Report. ↑
HTAP
Programme
Manager
On the 29th of April 2019 the Programme
Manager along with Virginia Irvine
Fortescue, the HTAP Public Representative
attended the NHS Grampian Board Review.
The event was chaired by the Minister for
Public Health, Sport and Wellbeing Joe
FitzPatrick. Prior to the Review there was
an opportunity to speak with NHSG Chief
Executive, Amanda Croft and NHSG Director
of Public Health, Susan Webb.
The NHSG Chief Executive has
invited the Programme Manager
and Public Representative to a
meeting. A meeting will take
place on 2nd July with Gerry
Donald, HTAP Chair and Paul
Allen, Director of NHSG Facilities,
Estates and e-Health.
↑
Transport and
Public Health
Sustrans NHS
Workplace
Engagement
Funding
Sustrans have announced funding for a
Workplace Engagement Officer to work with
an NHS Board. The HTAP Programme
Manager is leading on drafting a
submission. The deadline for submissions
is 27th of May 2019. A submission was
submitted. Unfortunately it was not
successful.
Sustrans will advise on when
additional funding for further
embedded Sustrans NHS posts is
available.
↑
HTAP General
Page 1 of 3
Page 227
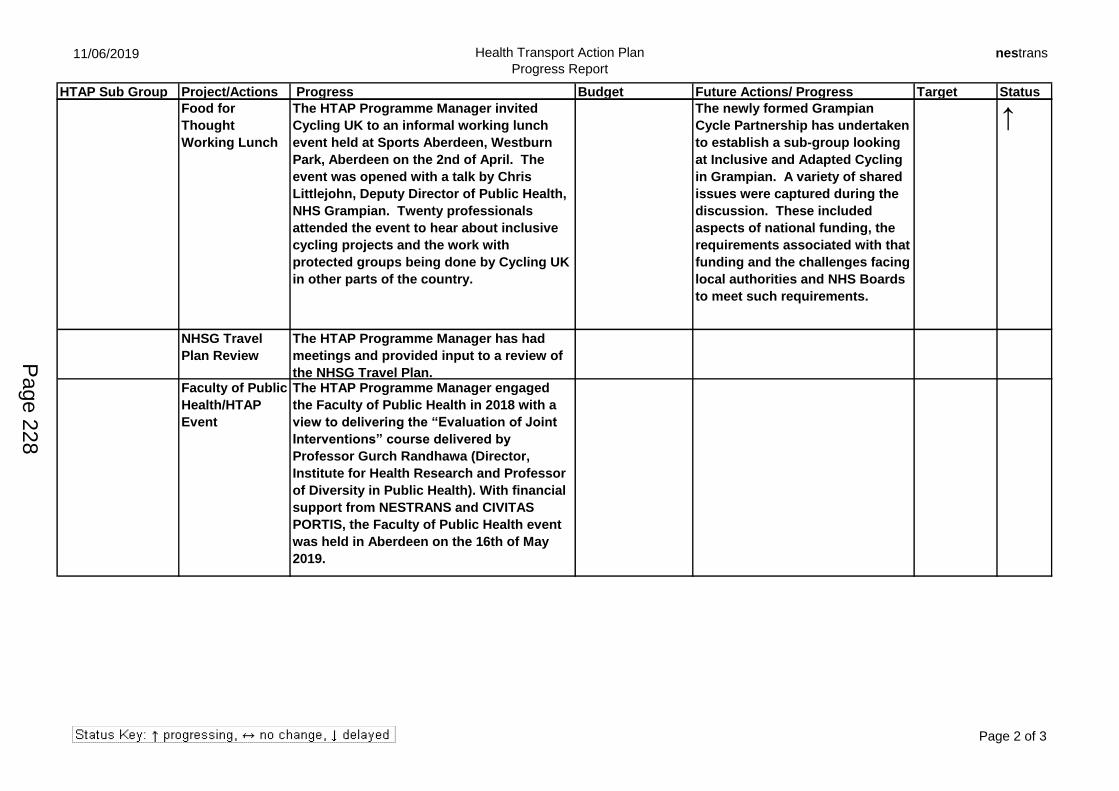
11/06/2019 Health Transport Action Plan
Progress Report
nestrans
HTAP Sub Group Project/Actions Progress Budget Future Actions/ Progress Target Status
Food for
Thought
Working Lunch
The HTAP Programme Manager invited
Cycling UK to an informal working lunch
event held at Sports Aberdeen, Westburn
Park, Aberdeen on the 2nd of April. The
event was opened with a talk by Chris
Littlejohn, Deputy Director of Public Health,
NHS Grampian. Twenty professionals
attended the event to hear about inclusive
cycling projects and the work with
protected groups being done by Cycling UK
in other parts of the country.
The newly formed Grampian
Cycle Partnership has undertaken
to establish a sub-group looking
at Inclusive and Adapted Cycling
in Grampian. A variety of shared
issues were captured during the
discussion. These included
aspects of national funding, the
requirements associated with that
funding and the challenges facing
local authorities and NHS Boards
to meet such requirements.
↑
NHSG Travel
Plan Review
The HTAP Programme Manager has had
meetings and provided input to a review of
the NHSG Travel Plan. Faculty of Public
Health/HTAP
Event
The HTAP Programme Manager engaged
the Faculty of Public Health in 2018 with a
view to delivering the “Evaluation of Joint
Interventions” course delivered by
Professor Gurch Randhawa (Director,
Institute for Health Research and Professor
of Diversity in Public Health). With financial
support from NESTRANS and CIVITAS
PORTIS, the Faculty of Public Health event
was held in Aberdeen on the 16th of May
2019.
Page 2 of 3
Page 228
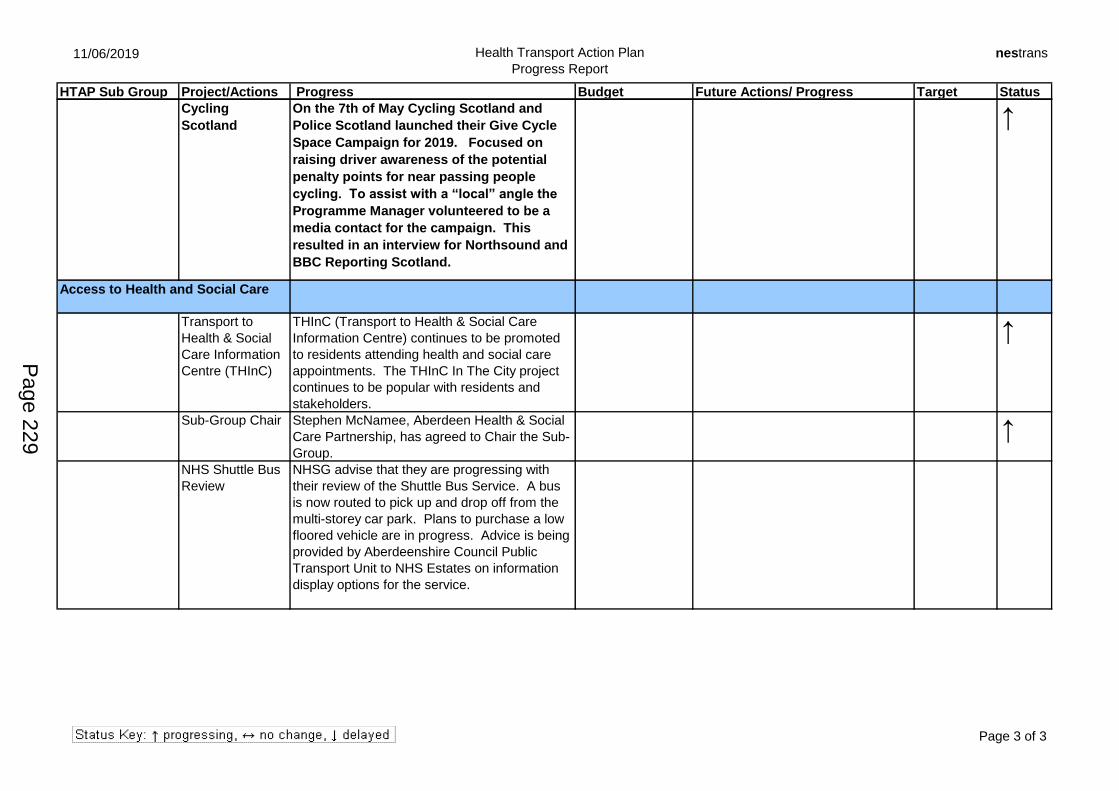
11/06/2019 Health Transport Action Plan
Progress Report
nestrans
HTAP Sub Group Project/Actions Progress Budget Future Actions/ Progress Target Status
Cycling
Scotland
On the 7th of May Cycling Scotland and
Police Scotland launched their Give Cycle
Space Campaign for 2019. Focused on
raising driver awareness of the potential
penalty points for near passing people
cycling. To assist with a “local” angle the
Programme Manager volunteered to be a
media contact for the campaign. This
resulted in an interview for Northsound and
BBC Reporting Scotland.
↑
Access to Health and Social Care
Transport to
Health & Social
Care Information
Centre (THInC)
THInC (Transport to Health & Social Care
Information Centre) continues to be promoted
to residents attending health and social care
appointments. The THInC In The City project
continues to be popular with residents and
stakeholders.
↑
Sub-Group Chair Stephen McNamee, Aberdeen Health & Social
Care Partnership, has agreed to Chair the Sub-
Group.
↑
NHS Shuttle Bus
Review
NHSG advise that they are progressing with
their review of the Shuttle Bus Service. A bus
is now routed to pick up and drop off from the
multi-storey car park. Plans to purchase a low
floored vehicle are in progress. Advice is being
provided by Aberdeenshire Council Public
Transport Unit to NHS Estates on information
display options for the service.
Page 3 of 3
Page 229

This page is intentionally left blank
Page 230
NORTH EAST SCOTLAND TRANSPORT PARTNERSHIP – 19 June 2019
6b Publications and Consultations
Purpose of Report
The purpose of this report is to inform members of recent publications and consultation papers of interest and to agree a response where appropriate.
Consultations
❖ Draft Masterplan for Fraserburgh Harbour A Draft Masterplan for Fraserburgh Harbour has been published for consultation, setting a vision and strategic framework for the development of infrastructure at Fraserburgh Harbour over the next 20 years. The Masterplan sets out the key drivers and business needs for expansion. These are identified as:
• The existing harbour is underutilised due to wave climate and geometry of the infrastructure;
• Water depth is a barrier to sustaining and growing the fishing industry in Fraserburgh;
• Without investment in new infrastructure, Fraserburgh will struggle not only to attract more business but to safeguard what it already has;
• Dry dock and shiplift facilities are operating at near capacity: investing in ship repair facilities will secure and grow Fraserburgh’s position as a hub for boat repair / maintenance.
The masterplan proposals comprise a range of infrastructure and facility enhancements to address these constraints and in summary are:
• New South Harbour and breakwater extension;
• New dry dock facility;
• Enhanced shiplift facility;
• Widened entrance to Balaclava Harbour;
• Improved access to Faithlie Harbour;
• Additional pontoons and a drying out berth; and
• Harbour estate development. These are shown on the plan in Appendix A. A community consultation event was held on 15 May 2019 to view the plans and meet with the masterplan team. This was attended by Rab Dickson and Kirsty Chalmers from Nestrans. The full masterplan document is available for consultation until 14 June at https://www.fraserburgh-harbour.co.uk/images/Draft_Masterplan_for_Fraserburgh_Harbour.pdf A draft response is provided in Appendix B, which has been submitted by the deadline of 14 June, but any additional comments or amendments can be forwarded following the Board meeting.
Page 231
Agenda Item 6b
6b Publications and Consultations
❖ NHS Grampian Consultation - A healthier and more active future for the North East of Scotland
NHS Grampian has produced a new strategy focused on implementing the Scottish Diet, Activity and Healthy Weight strategies, for the North East of Scotland 2019-2022. Reflecting the Scottish Government’s National Strategy for a Healthier Future, the strategy focuses on four key areas, one of which is “A Physically Active Population”. Nestrans is recognised as a partner agency for delivery and works closely with NHS Grampian, particularly through the joint working on Health & Transport Action Plan and the Getabout campaign to encourage sustainable travel. A copy of the consultation can be viewed at: https://www.hi-netgrampian.org/wp-
content/uploads/2019/03/activestrategy.pdf . Responses are required by 28 June 2019 via
an online survey, available at: http://www.imagineahealthyfuture.co.uk/.
It is recommended that Nestrans respond to the strategy, including the following contributions: Q2 – What are your views on the strategy? Nestrans fully supports the strategy, in particular the physical activity and active travel aspects which complement and enhance our work and our joint working with the Grampian Health and Transport Action Plan. As an organisation we are trying to promote a modal shift in travel and transport and work collaboratively with NHSG and local authorities through the Getabout campaign to encourage a shift from using private cars to more sustainable methods, including walking and cycling where possible for shorter journeys, for example journeys of up to 2 miles walking and 5 miles cycling. In particular for active travel to become part of individuals’ day to day lives and not just a leisure activity, whilst also supporting walking and cycling for leisure. As an employer we will endeavour to ensure that parts of the strategy that we can support and influence will be implemented and further promoted. For example: breastfeeding support for mothers returning from maternity leave and ensuring that when refreshments are provided at meetings and events, we will ensure that there are also healthy options available such as fruit and water. Q3 – Is there anything else you would like to see in the strategy? There is an opportunity to develop further the concept of Social prescribing – including signposting individuals to local groups to help with active travel, health walks etc Q4 – Within your organisation are there any initiatives or examples of good practice that you would like to highlight? Nestrans can offer support to organisations to promote Active Travel and have a Sustainable Travel Grant scheme that can help organisations to implement projects to help improve active and sustainable travel. https://www.nestrans.org.uk/about-nestrans/organisation/documents-sustainable-travel-grants/
Page 232

6b Publications and Consultations
Aberdeen Adapts – building resilience and adapting to our changing
climate consultation
The Aberdeen Adapts Framework is currently out for consultation. Nestrans has been involved in developing parts of this piece of work as part of our Climate Change work. There are five priority areas:
• Priority 1: Protecting buildings and infrastructure: This area and in particular goal 2 is perhaps the most relevant to Nestrans’ day to day work,
“Goal 2: Responsive transport and infrastructure: How will we adapt? Widening travel modes and options. Establishing flexible transport networks, linking different modes of transport and increasing travel options to assist travel during severe weather. To be resilient and responsive to climate change, co-operation is crucial. Through smarter travel and remote working, Making use of technology to support travel planning, providing the means to better inform people’s journeys during severe weather and to make home and remote working easier. With resilient design and upgrade. By planning ahead, adaptation can be designed into new and upgraded transport infrastructure, to reduce the risk of damage and disruption. In doing so, support Local Transport Strategy aims for a resilient transport network. Through greater understanding on how to adapt the existing travel infrastructure in Aberdeen and the most effective measures for the city. From specification that are robust to future rain and heat levels. To water management solutions, such as SUDs and swales to reduce the risk of flooding, degraded surfaces and pollutants. Through the use of porous surfaces, where practical, to soak up rainfall, helping to keep active travel routes accessible during heavy rainfall. Through regular inspection and monitoring for early identification of any issues that can limit damage to travel infrastructure. Giving attention to the risk of landslip where there are steep gradients on road and rail verges.”
• Priority 2: Safeguarding our natural environment
• Priority 3: Strong, healthy society and economy
• Priority 4: Building Understanding
• Priority 5: Collaborative working The full draft document is available to view at the below link: https://consultation.aberdeencity.gov.uk/communities-housing-and-infrastructure/aberdeen-adapts-climate-adaptation-framework/supporting_documents/Aberdeen%20Adapts%20for%20consultation.pdf Below are the consultation questions and our draft response: Q1. Do you agree or disagree with the 5 adaptation priorities for Aberdeen Adapts?
A. Agree
Q2. Do you agree or disagree with the Aberdeen Adapts goals and key actions for protecting buildings and infrastructure?
A. Agree. Refer to Local and Regional Transport Strategies in final version, not just local transport strategy.
Q3. Do you agree or disagree with the Aberdeen Adapts goals and key actions for safeguarding the natural environment?
A. Agree
Page 233
6b Publications and Consultations
Q4. Do you agree or disagree with the Aberdeen Adapts goals and key actions for a healthy society and strong economy?
A. Agree
Q5. Do you agree or disagree with the Aberdeen Adapts goals and key actions under building understanding?
A. Agree
Q6. Do you agree or disagree with the Aberdeen Adapts goals and key actions for collaborative working?
A. Agree.
Q7. If you have any additional comments about the Aberdeen Adapts Framework please add these in the text box below.
A. No further comments.
Q8. What are your views on the predicted environmental effects, set out in the Environmental Report for Aberdeen Adapts?
A. They seem acceptable, reasonable and proportionate.
Q9. What are your views on the proposal for mitigation and monitoring in the Environmental Report for Aberdeen Adapts?
A. They seem acceptable, reasonable and proportionate.
Aberdeen City Council – Sustainable Urban Mobility Plan (SUMP)
A SUMP is a long-term transport strategy for a defined urban area which identifies measures that will be implemented by the local authority and partners to enable and encourage residents and visitors to travel on foot, bike, public transport or other low-emission forms of transport, thus aligning with the adopted City Centre Masterplan (CCMP) and emerging Roads Hierarchy review. The draft SUMP:
• Acts as a framework for future city centre transport projects, identifying a range of
small-scale projects that can be delivered relatively easily with significant benefits,
and larger-scale projects for further investigation and appraisal over the lifetime of
the CCMP;
• Complements and expands upon the CCMP, articulating in more detail how certain
elements of the sustainable transport vision could be delivered, particularly projects
IN01 Walkable Aberdeen, IN03 Cycle Highways and IN06 Bus Priority Infrastructure;
• Considers how certain city centre elements of a revised roads hierarchy could be
delivered, identifying proposals for increased priority for sustainable modes on some
streets and opportunities for making some minor streets access only for general
traffic in accordance with agreed roads hierarchy principles;
• Supports the ongoing City Region Deal project to identify and appraise external
transport connections to Aberdeen South Harbour; and
• Includes consideration of improved cycle facilities on Union Street which was the
subject of a petition to ACC’s Petitions Committee on 14th March 2018.
Consultation on the draft SUMP launched on the 10th June and will close on Friday 26th July. The draft documents and survey questionnaire can be found at:
Page 234
6b Publications and Consultations
https://consultation.aberdeencity.gov.uk/planning/sump/. As there was insufficient time for officers to prepare a response in time for this Board meeting and no other meetings within the consultation timeframe, it is suggested that a response is prepared and submitted after consultation with the Chair and Vice Chairs.
National Islands Plan
The Scottish Government has published a National Islands Plan and is consulting on an Islands communities impact assessment guidance. The main improving outcomes contained within the Plan are:
a) increasing population levels; b) improving and promoting:
i) sustainable economic development; ii) environmental wellbeing; (iii) health and wellbeing, and (iv) community empowerment;
c) improving transport services; d) improving digital connectivity; e) reducing fuel poverty; f) ensuring effective management of the Scottish Crown Estate (that is, the
property, rights and interests to which section 90B(5) of the Scotland Act 1998 applies); and
g) enhancing biosecurity (including protecting islands from the impact of invasive non-native species).
The full document can be viewed at: https://www.gov.scot/publications/national-islands-plan-islands-communities-impact-assessment-guidance-consultation/pages/5/ Although there are no inhabited islands within the Nestrans area, the Islands Plan is brought to members’ attention for awareness. Implications for Nestrans are likely to be restricted to the Northern Isles ferry connections.
Recommendations
It is recommended that the Board:
1. Approve the attached Appendix B as Nestrans’ response to the Fraserburgh Harbour Masterplan;
2. Approve the above comments as Nestrans’ response to NHS Grampian’s consultation on a healthier and more active future for the North East of Scotland;
3. Approve the above comments as Nestrans’ response to the consultation on
Aberdeen Adapts;
4. Instruct officers to submit a Nestrans response to the consultation on Aberdeen City Council’s Sustainable Urban Mobility Plan, following approval by Chair and Vice Chairs; and
5. Note the publication of the Scottish Government’s National Islands Plan. KC/KW/RD/10 June 2019
Page 235
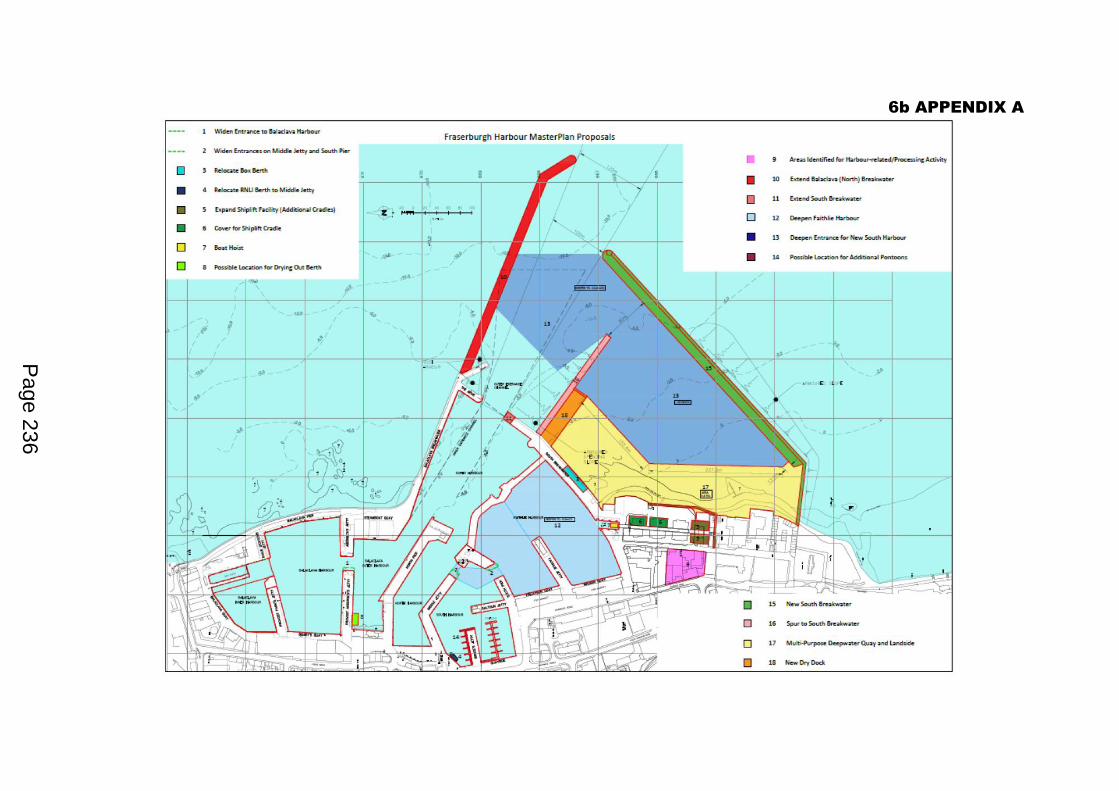
6b APPENDIX A
Page 236
6b APPENDIX B
Nestrans’ Draft Response to consultation on the Draft Fraserburgh Harbour Masterplan Thank you very much for the opportunity to comment on the Draft Fraserburgh Harbour Masterplan. We attended the consultation event in Fraserburgh on 15th May which was a very useful and informative event. Nestrans is currently in the process of developing our next Regional Transport Strategy (RTS) to 2040 and therefore the timing of these proposals fits very well with the development of our next strategy. Our current RTS supports the development of the region’s harbours and recognises their importance and potential for goods movements, ferries, cruise ships and supporting the fishing and off-shore energy industries. We will therefore be able to use the information from this Masterplan, once it is finalised, to feed into the development of our next strategy. Nestrans welcomes the development of the Masterplan for the Harbour and the objectives it sets out to support development of a diverse business base, with the fishing industry at its heart; provide a safe environment for all harbour users; and contribute to the socio-economic prosperity of Fraserburgh and the wider region. We have no specific comments to make on the nature of the infrastructure proposals for the harbour contained within the Masterplan. We would however welcome further consideration of the likely impacts on the region’s transport network. Plans for expansion will have significant implications for the region’s transport network particularly in the immediate vicinity of the harbour but also on the strategic road network and links to Aberdeen and further south. We support the continued investment in developing this facility to meet the future needs of the region and will work with Fraserburgh Harbour to ensure the transport needs and implications of such developments are fully considered. We currently work in partnership with the freight industry to deliver improvements for freight across the north east and would welcome the opportunity to work with Fraserburgh Harbour as part of this. Finally, given the transport implications of the proposals and the links to the current and forthcoming Regional Transport Strategy, we would welcome the inclusion of Nestrans in the list of key stakeholders for this project.
Page 237

This page is intentionally left blank
Page 238
NORTH EAST TRANSPORT PARTNERSHIP – 19 June 2019
7a 2018/19 Annual Audit Plan
Purpose of Report
To inform the Board of the 2018/19 Annual Audit Plan provided by Audit Scotland which sets out the audit work to be undertaken to provide an opinion on the Partnership’s financial statements.
Background
Local Authorities and similar bodies are required to ensure that they demonstrate proper stewardship of their financial affairs. Auditors are appointed for a five year period and the current appointment commenced in 2016/17. The auditor for the Partnership is Audit Scotland and the engagement lead is Anne MacDonald.
2018/19 Annual Audit Plan
An annual audit plan has been submitted which has been prepared in accordance with Audit Scotland’s Code of Audit Practice. As well as responsibilities relating to the audit of the financial statements, the plan sets out the wider scope requirements in respect of public sector audit. With regard to the Partnership’s wider scope, the auditor will focus on governance and transparency arrangements and financial sustainability. A copy of this plan which has been reviewed by finance officers is shown in Appendix 1 and provides an overview of the planned scope and timing of the audit.
Recommendations
It is recommended that the Board:
1. Note the audit plan provided by Audit Scotland
Alan Wood Treasurer 3 June 2019
Page 239
Agenda Item 7a

This page is intentionally left blank
Page 240
APPENDIX 1
North East of Scotland Transport Partnership Annual Audit Plan 2018/19
Prepared for North East of Scotland Transport Partnership
March 2019
Page 241
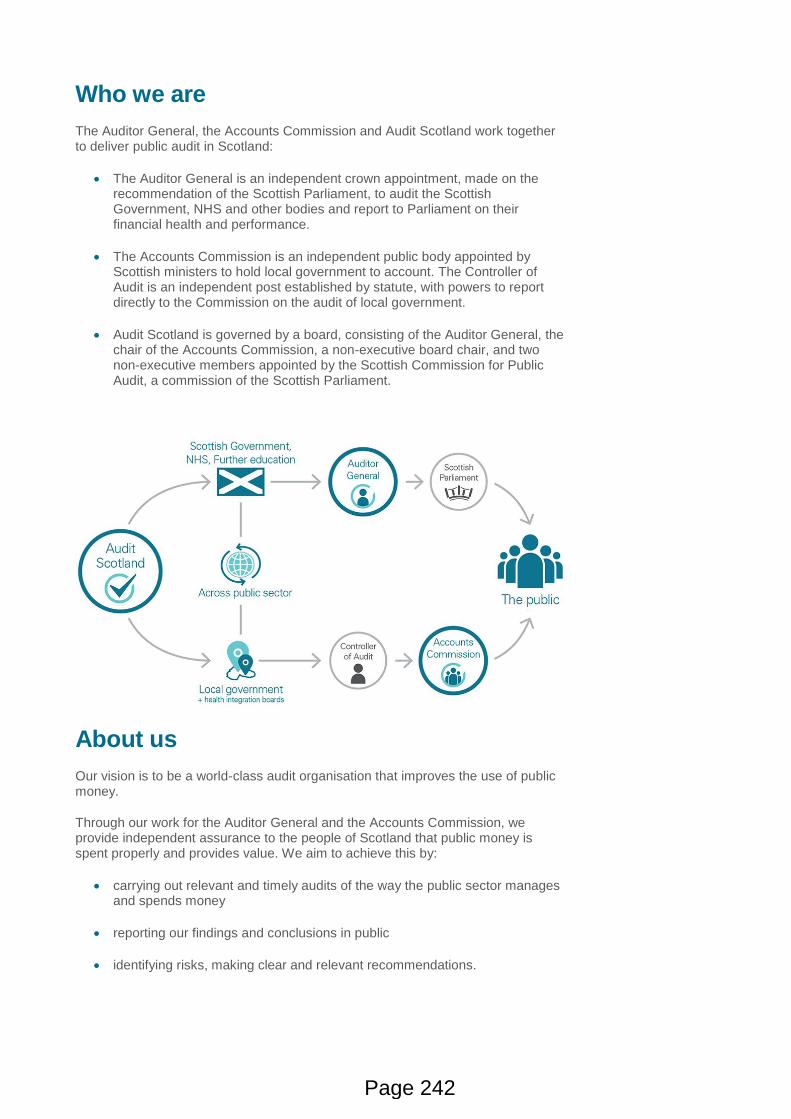
Who we are
The Auditor General, the Accounts Commission and Audit Scotland work together to deliver public audit in Scotland:
• The Auditor General is an independent crown appointment, made on the recommendation of the Scottish Parliament, to audit the Scottish Government, NHS and other bodies and report to Parliament on their financial health and performance.
• The Accounts Commission is an independent public body appointed by Scottish ministers to hold local government to account. The Controller of Audit is an independent post established by statute, with powers to report directly to the Commission on the audit of local government.
• Audit Scotland is governed by a board, consisting of the Auditor General, the chair of the Accounts Commission, a non-executive board chair, and two non-executive members appointed by the Scottish Commission for Public Audit, a commission of the Scottish Parliament.
About us
Our vision is to be a world-class audit organisation that improves the use of public money.
Through our work for the Auditor General and the Accounts Commission, we provide independent assurance to the people of Scotland that public money is spent properly and provides value. We aim to achieve this by:
• carrying out relevant and timely audits of the way the public sector manages and spends money
• reporting our findings and conclusions in public
• identifying risks, making clear and relevant recommendations.
Page 242
North East of Scotland Transport Partnership Annual Audit Plan 2018/19 | 3
Contents
Risks and planned work 4
Audit scope and timing 7
Page 243
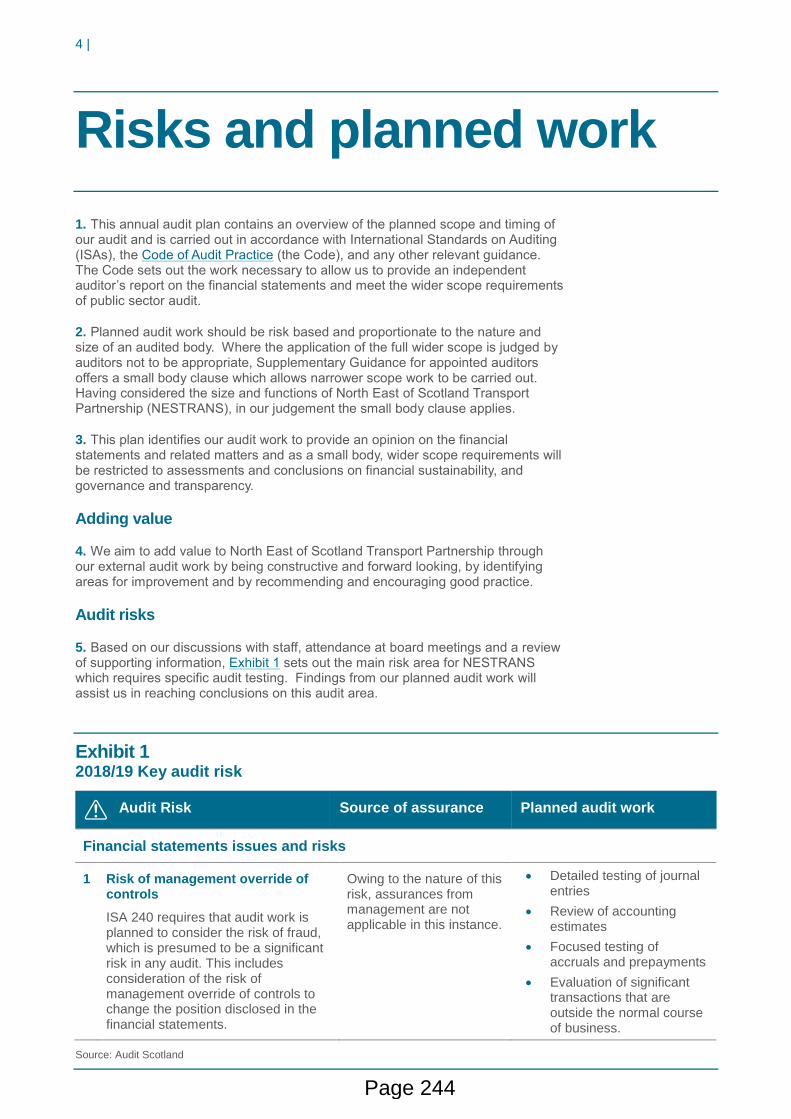
4 |
Risks and planned work
1. This annual audit plan contains an overview of the planned scope and timing of our audit and is carried out in accordance with International Standards on Auditing (ISAs), the Code of Audit Practice (the Code), and any other relevant guidance. The Code sets out the work necessary to allow us to provide an independent auditor’s report on the financial statements and meet the wider scope requirements of public sector audit.
2. Planned audit work should be risk based and proportionate to the nature and size of an audited body. Where the application of the full wider scope is judged by auditors not to be appropriate, Supplementary Guidance for appointed auditors offers a small body clause which allows narrower scope work to be carried out. Having considered the size and functions of North East of Scotland Transport Partnership (NESTRANS), in our judgement the small body clause applies.
3. This plan identifies our audit work to provide an opinion on the financial statements and related matters and as a small body, wider scope requirements will be restricted to assessments and conclusions on financial sustainability, and governance and transparency.
Adding value
4. We aim to add value to North East of Scotland Transport Partnership through our external audit work by being constructive and forward looking, by identifying areas for improvement and by recommending and encouraging good practice.
Audit risks
5. Based on our discussions with staff, attendance at board meetings and a review of supporting information, Exhibit 1 sets out the main risk area for NESTRANS which requires specific audit testing. Findings from our planned audit work will assist us in reaching conclusions on this audit area.
Exhibit 1 2018/19 Key audit risk
Audit Risk Source of assurance Planned audit work
Financial statements issues and risks
1 Risk of management override of controls
ISA 240 requires that audit work is planned to consider the risk of fraud, which is presumed to be a significant risk in any audit. This includes consideration of the risk of management override of controls to change the position disclosed in the financial statements.
Owing to the nature of this risk, assurances from management are not applicable in this instance.
• Detailed testing of journal entries
• Review of accounting estimates
• Focused testing of accruals and prepayments
• Evaluation of significant transactions that are outside the normal course of business.
Source: Audit Scotland
Page 244
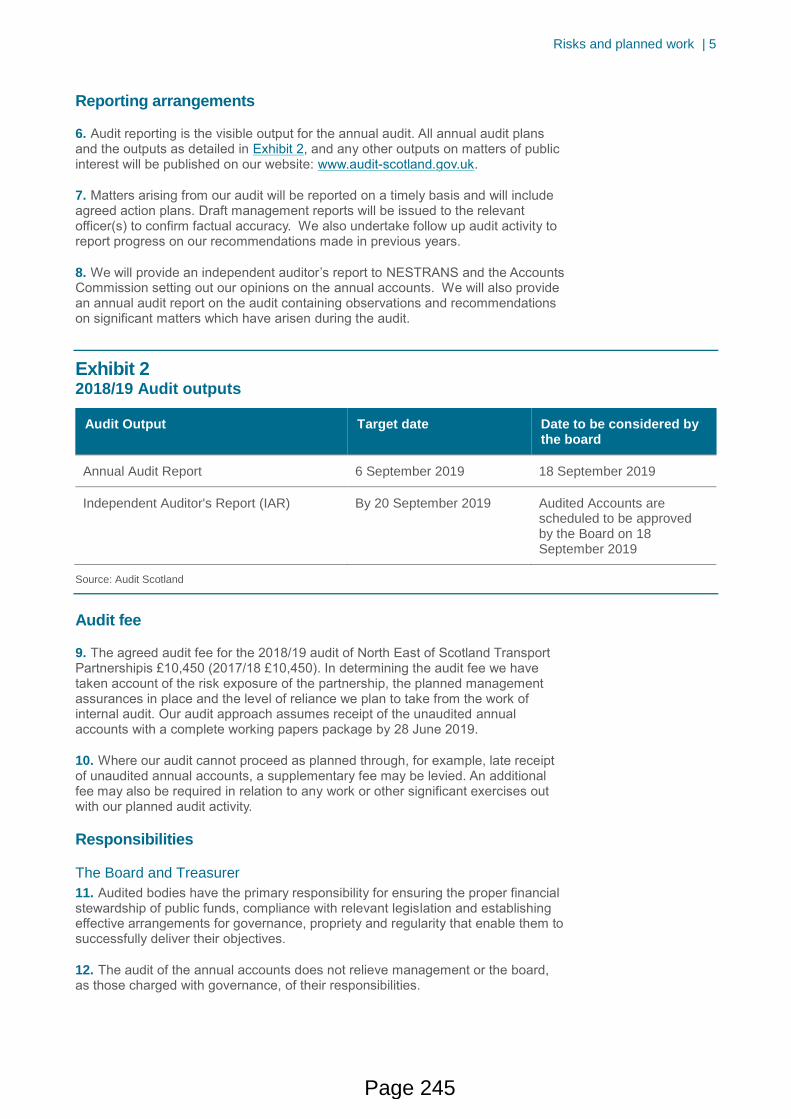
Risks and planned work | 5
Reporting arrangements
6. Audit reporting is the visible output for the annual audit. All annual audit plans and the outputs as detailed in Exhibit 2, and any other outputs on matters of public interest will be published on our website: www.audit-scotland.gov.uk.
7. Matters arising from our audit will be reported on a timely basis and will include agreed action plans. Draft management reports will be issued to the relevant officer(s) to confirm factual accuracy. We also undertake follow up audit activity to report progress on our recommendations made in previous years.
8. We will provide an independent auditor’s report to NESTRANS and the Accounts Commission setting out our opinions on the annual accounts. We will also provide an annual audit report on the audit containing observations and recommendations on significant matters which have arisen during the audit.
Exhibit 2 2018/19 Audit outputs
Audit Output Target date Date to be considered by the board
Annual Audit Report 6 September 2019 18 September 2019
Independent Auditor's Report (IAR) By 20 September 2019 Audited Accounts are scheduled to be approved by the Board on 18 September 2019
Source: Audit Scotland
Audit fee
9. The agreed audit fee for the 2018/19 audit of North East of Scotland Transport Partnershipis £10,450 (2017/18 £10,450). In determining the audit fee we have taken account of the risk exposure of the partnership, the planned management assurances in place and the level of reliance we plan to take from the work of internal audit. Our audit approach assumes receipt of the unaudited annual accounts with a complete working papers package by 28 June 2019.
10. Where our audit cannot proceed as planned through, for example, late receipt of unaudited annual accounts, a supplementary fee may be levied. An additional fee may also be required in relation to any work or other significant exercises out with our planned audit activity.
Responsibilities
The Board and Treasurer
11. Audited bodies have the primary responsibility for ensuring the proper financial stewardship of public funds, compliance with relevant legislation and establishing effective arrangements for governance, propriety and regularity that enable them to successfully deliver their objectives.
12. The audit of the annual accounts does not relieve management or the board, as those charged with governance, of their responsibilities.
Page 245
6 |
13. The Local Authority Accounts (Scotland) Regulations 2014 requires the board to scrutinise and approve the accounts in a two stage process:
• by 31 August, the board should consider the unaudited accounts
• no later than 30 September, the board should aim to consider the audited accounts and approve them for signature. Regulations require signature by the Chair, Director and Treasurer.
Appointed auditor
14. Our responsibilities as independent auditors are established by the Local Government (Scotland) Act 1973 Act, the Code of Audit Practice (including supplementary guidance) and are guided by the Financial Reporting Council’s Ethical Standard.
15. Auditors in the public sector give an independent opinion on the financial statements and other information within the annual accounts. We also review and report on the arrangements within the audited body to manage its performance, regularity and use of resources. In doing this, we aim to support improvement and accountability.
16. Auditors in the public sector give an independent opinion on the financial statements and other information within the annual accounts. In line with Supplementary Guidance for appointed auditors, we also review and report on the governance arrangements within the audited body and the transparency of financial and performance reporting including the body’s financial sustainability in the longer term. In doing this, we aim to support improvement and accountability.
Page 246
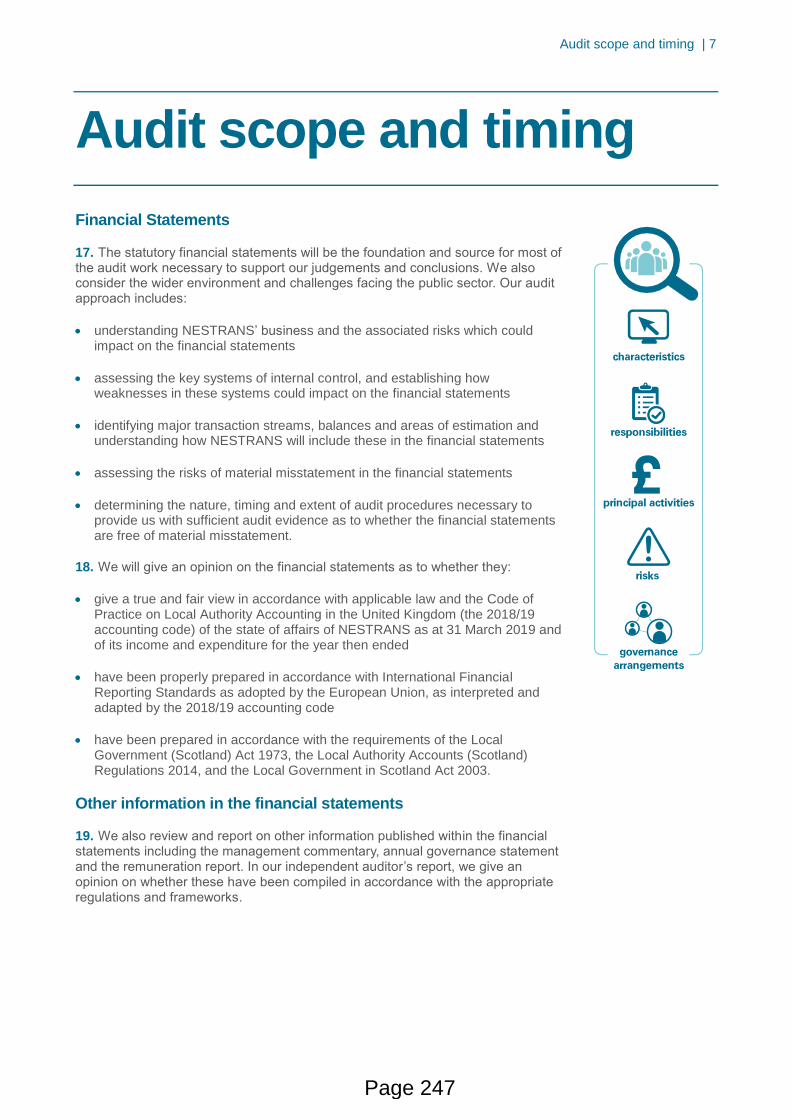
Audit scope and timing | 7
Audit scope and timing
Financial Statements
17. The statutory financial statements will be the foundation and source for most of the audit work necessary to support our judgements and conclusions. We also consider the wider environment and challenges facing the public sector. Our audit approach includes:
• understanding NESTRANS’ business and the associated risks which could impact on the financial statements
• assessing the key systems of internal control, and establishing how weaknesses in these systems could impact on the financial statements
• identifying major transaction streams, balances and areas of estimation and understanding how NESTRANS will include these in the financial statements
• assessing the risks of material misstatement in the financial statements
• determining the nature, timing and extent of audit procedures necessary to provide us with sufficient audit evidence as to whether the financial statements are free of material misstatement.
18. We will give an opinion on the financial statements as to whether they:
• give a true and fair view in accordance with applicable law and the Code of Practice on Local Authority Accounting in the United Kingdom (the 2018/19 accounting code) of the state of affairs of NESTRANS as at 31 March 2019 and of its income and expenditure for the year then ended
• have been properly prepared in accordance with International Financial Reporting Standards as adopted by the European Union, as interpreted and adapted by the 2018/19 accounting code
• have been prepared in accordance with the requirements of the Local Government (Scotland) Act 1973, the Local Authority Accounts (Scotland) Regulations 2014, and the Local Government in Scotland Act 2003.
Other information in the financial statements
19. We also review and report on other information published within the financial statements including the management commentary, annual governance statement and the remuneration report. In our independent auditor’s report, we give an opinion on whether these have been compiled in accordance with the appropriate regulations and frameworks.
Page 247
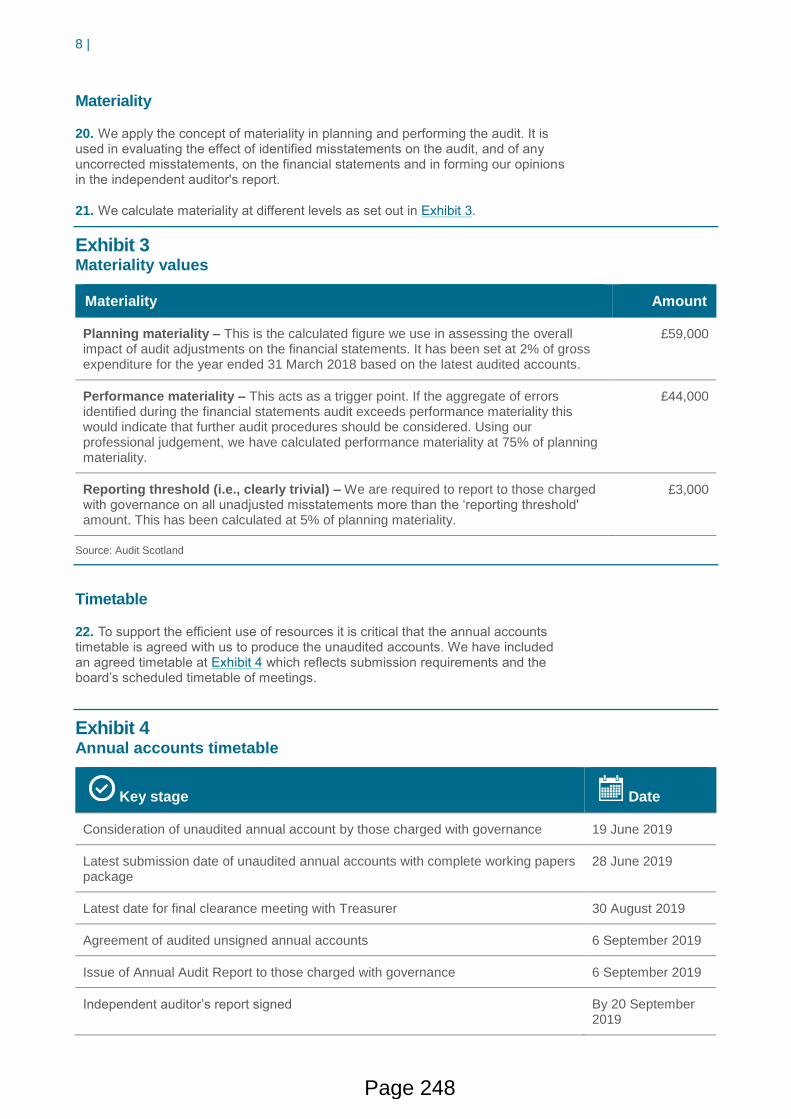
8 |
Materiality
20. We apply the concept of materiality in planning and performing the audit. It is used in evaluating the effect of identified misstatements on the audit, and of any uncorrected misstatements, on the financial statements and in forming our opinions in the independent auditor's report.
21. We calculate materiality at different levels as set out in Exhibit 3.
Exhibit 3 Materiality values
Materiality Amount
Planning materiality – This is the calculated figure we use in assessing the overall impact of audit adjustments on the financial statements. It has been set at 2% of gross expenditure for the year ended 31 March 2018 based on the latest audited accounts.
£59,000
Performance materiality – This acts as a trigger point. If the aggregate of errors identified during the financial statements audit exceeds performance materiality this would indicate that further audit procedures should be considered. Using our professional judgement, we have calculated performance materiality at 75% of planning materiality.
£44,000
Reporting threshold (i.e., clearly trivial) – We are required to report to those charged with governance on all unadjusted misstatements more than the ‘reporting threshold' amount. This has been calculated at 5% of planning materiality.
£3,000
Source: Audit Scotland
Timetable
22. To support the efficient use of resources it is critical that the annual accounts timetable is agreed with us to produce the unaudited accounts. We have included an agreed timetable at Exhibit 4 which reflects submission requirements and the board’s scheduled timetable of meetings.
Exhibit 4 Annual accounts timetable
Key stage Date
Consideration of unaudited annual account by those charged with governance 19 June 2019
Latest submission date of unaudited annual accounts with complete working papers package
28 June 2019
Latest date for final clearance meeting with Treasurer 30 August 2019
Agreement of audited unsigned annual accounts 6 September 2019
Issue of Annual Audit Report to those charged with governance 6 September 2019
Independent auditor’s report signed By 20 September 2019
Page 248
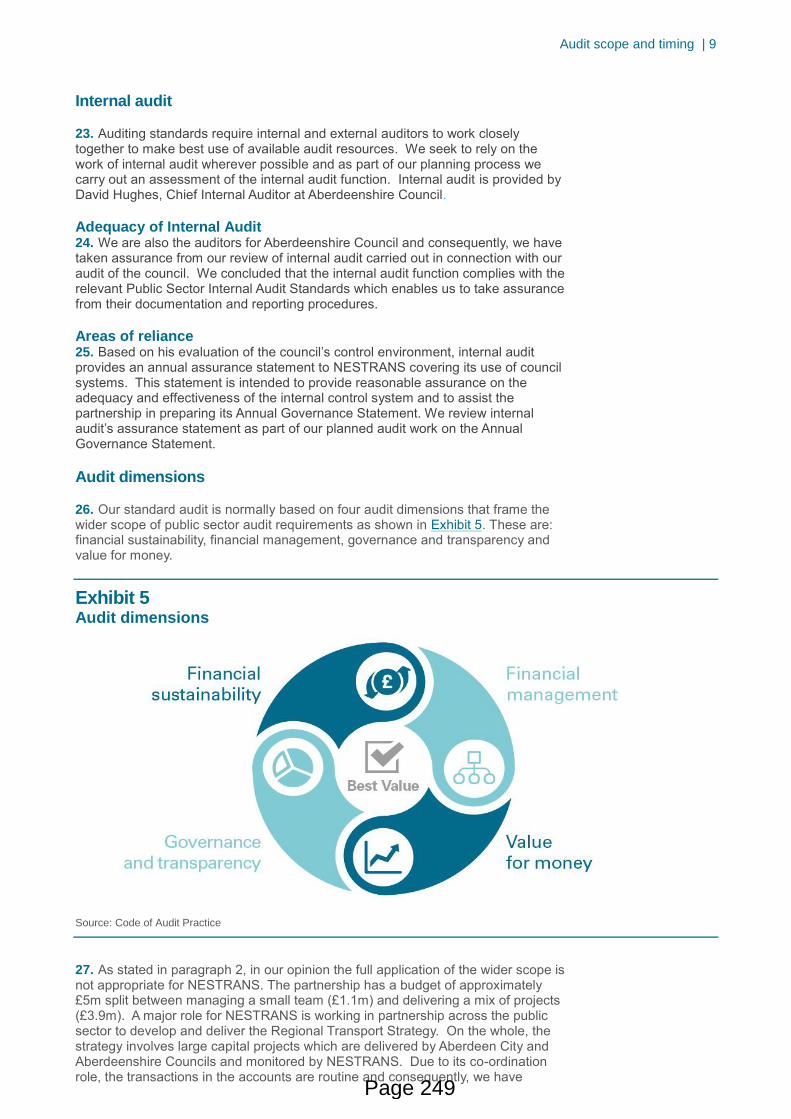
Audit scope and timing | 9
Internal audit
23. Auditing standards require internal and external auditors to work closely together to make best use of available audit resources. We seek to rely on the work of internal audit wherever possible and as part of our planning process we carry out an assessment of the internal audit function. Internal audit is provided by David Hughes, Chief Internal Auditor at Aberdeenshire Council.
Adequacy of Internal Audit 24. We are also the auditors for Aberdeenshire Council and consequently, we have taken assurance from our review of internal audit carried out in connection with our audit of the council. We concluded that the internal audit function complies with the relevant Public Sector Internal Audit Standards which enables us to take assurance from their documentation and reporting procedures.
Areas of reliance 25. Based on his evaluation of the council’s control environment, internal audit provides an annual assurance statement to NESTRANS covering its use of council systems. This statement is intended to provide reasonable assurance on the adequacy and effectiveness of the internal control system and to assist the partnership in preparing its Annual Governance Statement. We review internal audit’s assurance statement as part of our planned audit work on the Annual Governance Statement.
Audit dimensions
26. Our standard audit is normally based on four audit dimensions that frame the wider scope of public sector audit requirements as shown in Exhibit 5. These are: financial sustainability, financial management, governance and transparency and value for money.
Exhibit 5 Audit dimensions
Source: Code of Audit Practice
27. As stated in paragraph 2, in our opinion the full application of the wider scope is not appropriate for NESTRANS. The partnership has a budget of approximately £5m split between managing a small team (£1.1m) and delivering a mix of projects (£3.9m). A major role for NESTRANS is working in partnership across the public sector to develop and deliver the Regional Transport Strategy. On the whole, the strategy involves large capital projects which are delivered by Aberdeen City and Aberdeenshire Councils and monitored by NESTRANS. Due to its co-ordination role, the transactions in the accounts are routine and consequently, we have
Page 249
10 |
concluded that the small body clause is appropriate. However, as a minimum, the Code requires annual audit work on financial sustainability and the appropriateness of the disclosures in the governance statement. As a result, our wider dimension work will be restricted to financial sustainability and governance and transparency arrangements as set out in paragraphs 28 and 29.
Financial sustainability 28. As auditors, we consider the appropriateness of the use of the going concern basis of accounting as part of the annual audit. We will also comment on the body’s financial sustainability in the longer term. We define this as medium term (two to five years) and longer term (longer than five years) sustainability. We will carry out work and conclude on:
• the effectiveness of financial planning in identifying and addressing risks to financial sustainability in the short, medium and long term
• the appropriateness and effectiveness of arrangements in place to address any identified funding gaps.
Governance and transparency 29. Governance and transparency is concerned with the effectiveness of scrutiny and governance arrangements, leadership and decision-making and transparent reporting of financial and performance information. We will review, conclude and report on whether:
• NESTRANS can demonstrate that the governance arrangements in place are appropriate and operating effectively
• there is effective scrutiny, challenge and transparency on decision-making and finance and performance reports
• there is quality and timely financial and performance reporting
• there are robust arrangements in place to support the annual governance statement.
Independence and objectivity
30. Auditors appointed by the Accounts Commission must comply with the Code of Audit Practice and relevant supporting guidance. When auditing the financial statements, auditors must also comply with professional standards issued by the Financial Reporting Council and those of the professional accountancy bodies. These standards impose stringent rules to ensure the independence and objectivity of auditors. Audit Scotland has robust arrangements in place to ensure compliance with these standards including an annual “fit and proper” declaration for all members of staff. The arrangements are overseen by the Director of Audit Services, who serves as Audit Scotland’s Ethics Partner.
31. The engagement lead (i.e. appointed auditor) for NESTRANS is Anne MacDonald, Senior Audit Manager. Auditing and ethical standards require the appointed auditor to communicate any relationships that may affect the independence and objectivity of audit staff. We are not aware of any such relationships pertaining to the audit of NESTRANS.
Page 250
Audit scope and timing | 11
Quality control
32. International Standard on Quality Control (UK and Ireland) 1 (ISQC1) requires that a system of quality control is established, as part of financial audit procedures, to provide reasonable assurance that professional standards and regulatory and legal requirements are being complied with and that the independent auditor’s report or opinion is appropriate in the circumstances.
33. The foundation of our quality framework is our Audit Guide, which incorporates the application of professional auditing, quality and ethical standards and the Code of Audit Practice (and supporting guidance) issued by Audit Scotland and approved by the Accounts Commission. To ensure that we achieve the required quality standards Audit Scotland conducts peer reviews and internal quality reviews. Additionally, the Institute of Chartered Accountants of Scotland (ICAS) have been commissioned to carry out external quality reviews.
34. As part of our commitment to quality and continuous improvement, Audit Scotland will periodically seek your views on the quality of our service provision. We welcome feedback at any time and this may be directed to the engagement lead.
Page 251
12 |
North East of Scotland Transport Partnership Annual Audit Plan 2018/19
If you require this publication in an alternative format and/or language, please contact us to discuss your needs: 0131 625 1500 or [email protected]
For the latest news, reports and updates, follow us on:
Audit Scotland, The Annexe, Woodhill House, Westburn Road, Aberdeen AB16 5GB T: 0131 625 1500 E: [email protected] www.audit-scotland.gov.uk
AS.2.0
Page 252
NORTH EAST TRANSPORT PARTNERSHIP – 19 JUNE 2019
7b Unaudited Annual Accounts for 2018/19
Purpose of Report
The Board is required to consider the unaudited annual accounts for 2018/19 and approve the final delay in drawdown.
Background
The Partnership prepares annual accounts to demonstrate the proper stewardship of its activities and management of its financial affairs.
Annual Accounts 2018/19
The unaudited annual accounts for 2018/19 are attached as Appendix 1 to this report. The Board will note the accounts are prepared in accordance with the Code of Practice for Local Authority Accounting in the United Kingdom 2018/19 (the Code) and presented in a format that follows International Financial Reporting Standards. The accounts are a complex document and Appendix 2 provides the standard budget monitoring statement for the year to 31 March 2019 to allow the Board to better relate the Partnership’s budget performance to the changes made in preparing the presentation of the accounts. Appendix 2 shows a deficit of £37,206, this is because under accounting principles, adjustments have to be made for the pension fund. The amount of superannuation that Nestrans have put into the fund is stripped out and replaced with the current service cost as valued by the actuaries of the pension fund.
The unaudited annual accounts comprise a number of statements and the attention of the Board is drawn to the following areas in particular:
Page 2-9 Management Commentary Page 10-11 Governance Statement Page 17 Movements in Reserves Statement Page 18 Comprehensive Income & Expenditure Statement
Page 19 Balance Sheet showing the unaudited financial position as at 31 March 2019.
Other prescribed financial statements are included as required along with notes to support the core accounts where these are considered appropriate. The Governance Statement, pages 10 and 11, of the unaudited accounts, provides reasonable assurance that the general management structure, framework of financial regulation and internal control, level and quality of financial management information and level and method of accountability are adequate and effective.
Page 253
Agenda Item 7b
The value of contributions remaining under the Strategic Transport Fund, plus interest accrued, at 31 March 2019 is £505,861.89. This sum is included in the Balance Sheet on page 19 and included in Note 12 on page 30 of the accounts. The Board are asked to consider the Management Commentary and Governance Statement sections of the draft accounts which includes a short description of the financial performance of the Partnership over the period. This is supported in more detail by the Budget Monitoring Statement attached as Appendix 2 and Note 15 on pages 35 and 36 of the draft accounts provides more detail on the performance of the Partnership.
Virements and Delay in Drawdown 2018/19
Requests for final virements and delays in drawdown for 2018/19 to be carried forward into 2019/20 are set out in Appendix 3 and Appendix 4. An amount of £3,471,210 has already been previously approved by the Board. The final adjustments requested to these figures are required for those projects whose expenditure at year end differed to the original amounts approved as delay in drawdown, either due to progress being slightly better or slower than expected.
Recommendations
It is recommended that the Board:
a) Considers the Unaudited Annual Accounts for 2018/19 and approves their issue to the external Auditor and the Controller of Audit as per Appendix 1
b) Approves the final virements as per Appendix 3
c) Approves the final delay in drawdown for 2018/19 as per Appendix 4.
Alan Wood Treasurer 11 June 2019
Page 254
Page 255
Page 256
Page 257
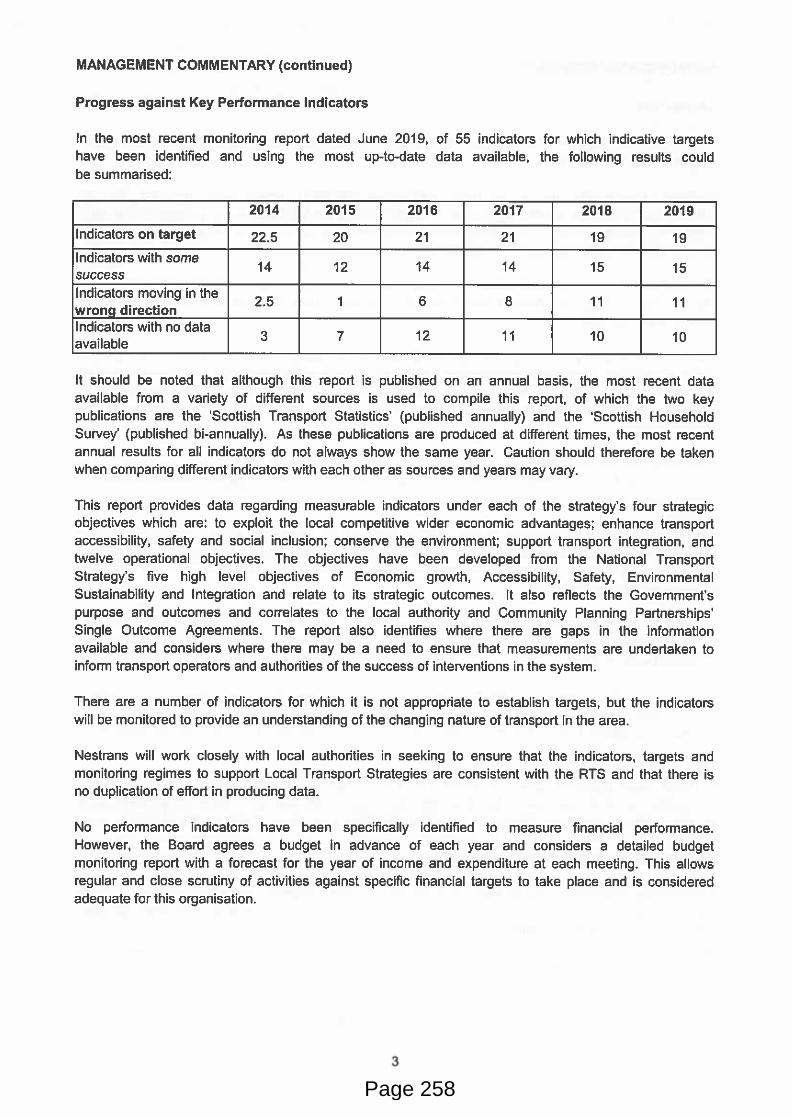
Page 258
Page 259
Page 260
Page 261
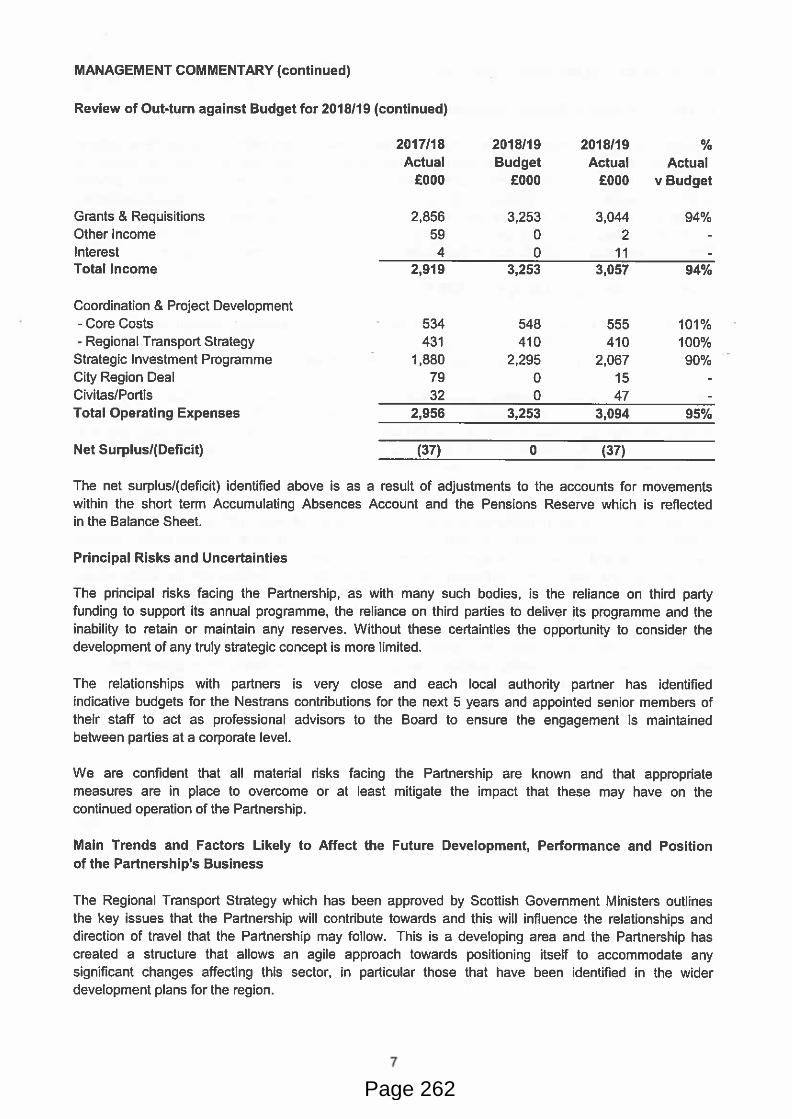
Page 262
Page 263
Page 264
Page 265
Page 266
Page 267
Page 268
Page 269

Page 270
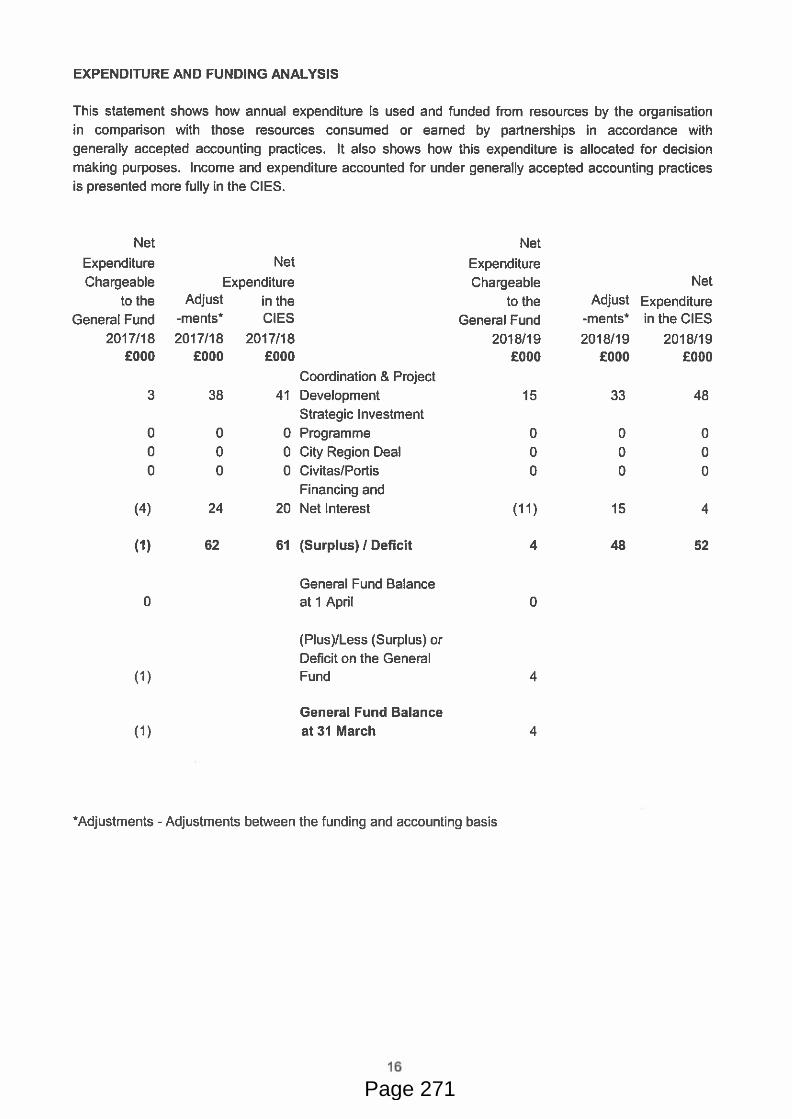
Page 271
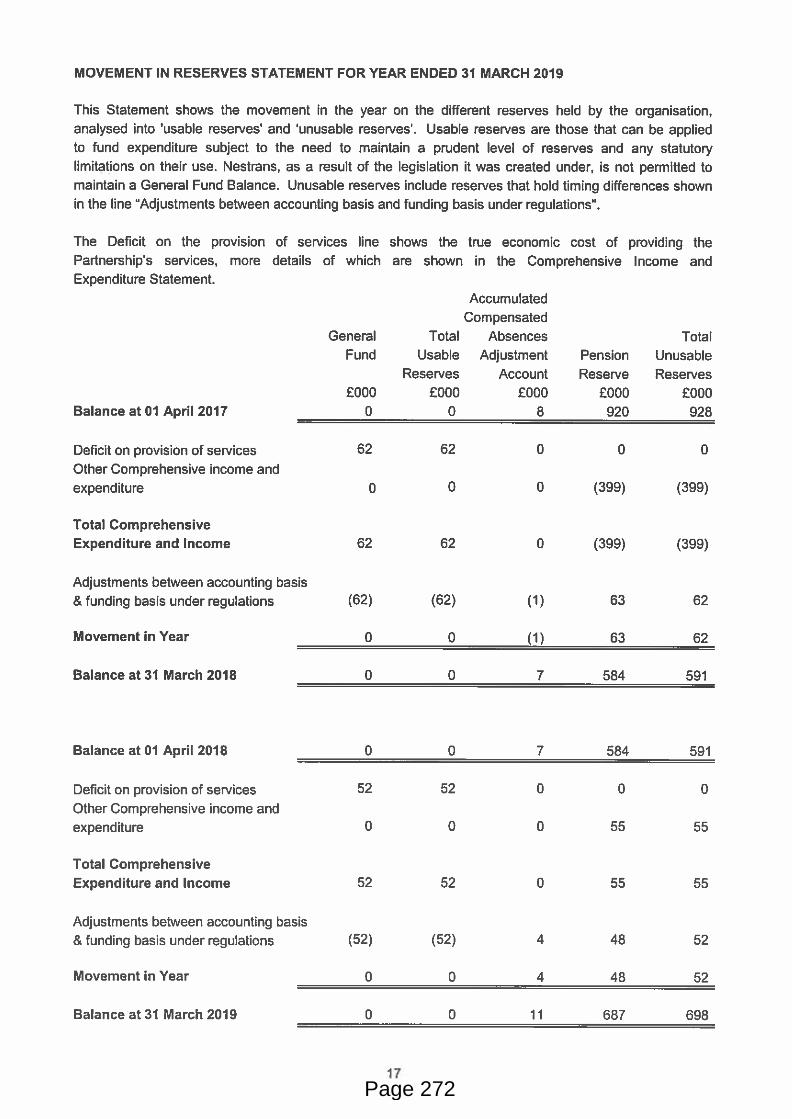
Page 272
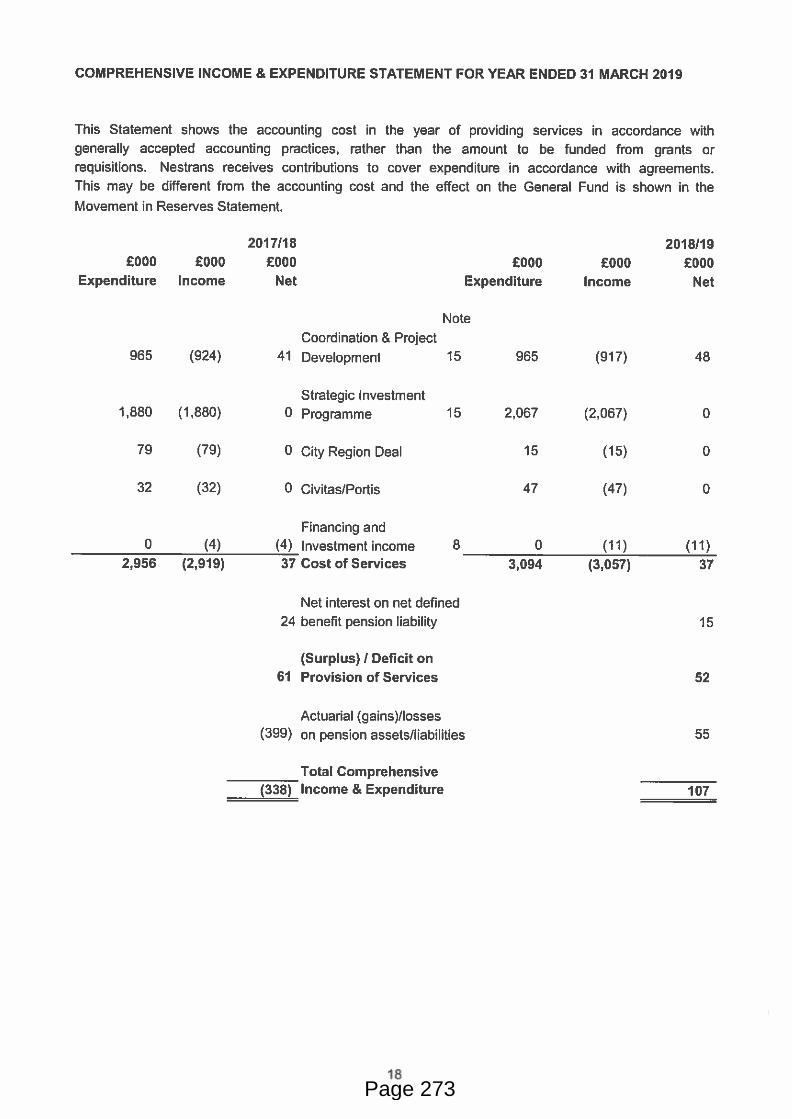
Page 273
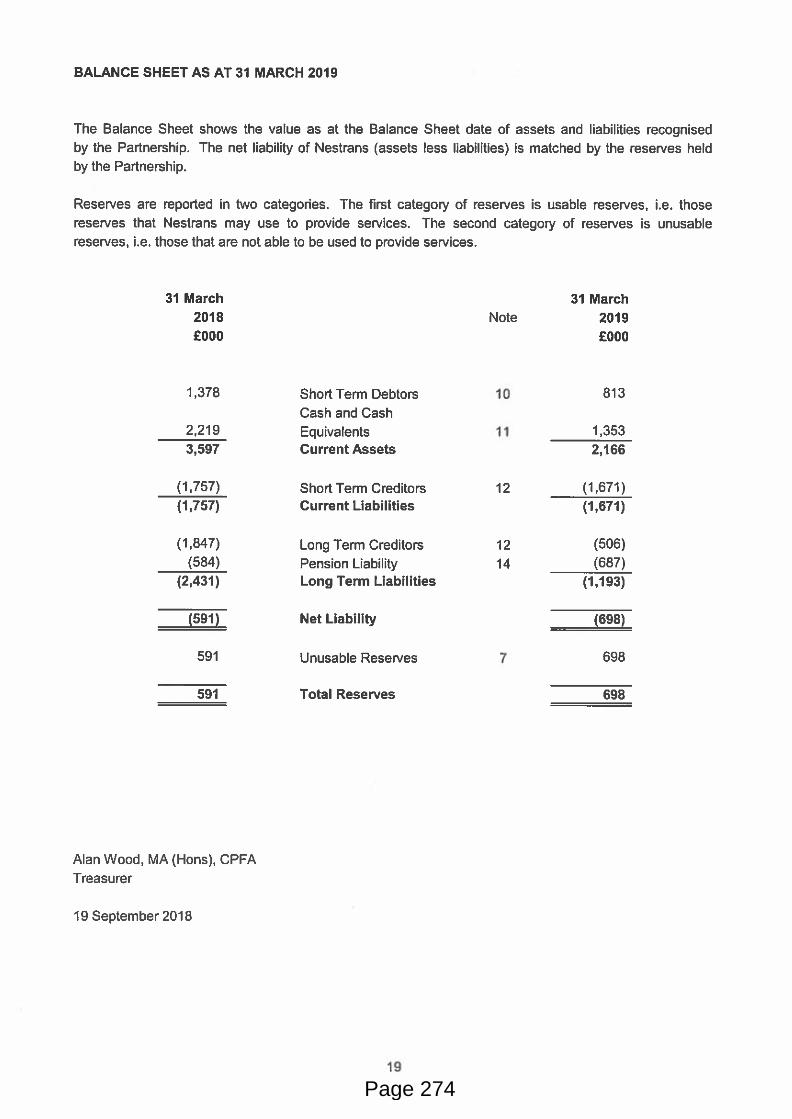
Page 274
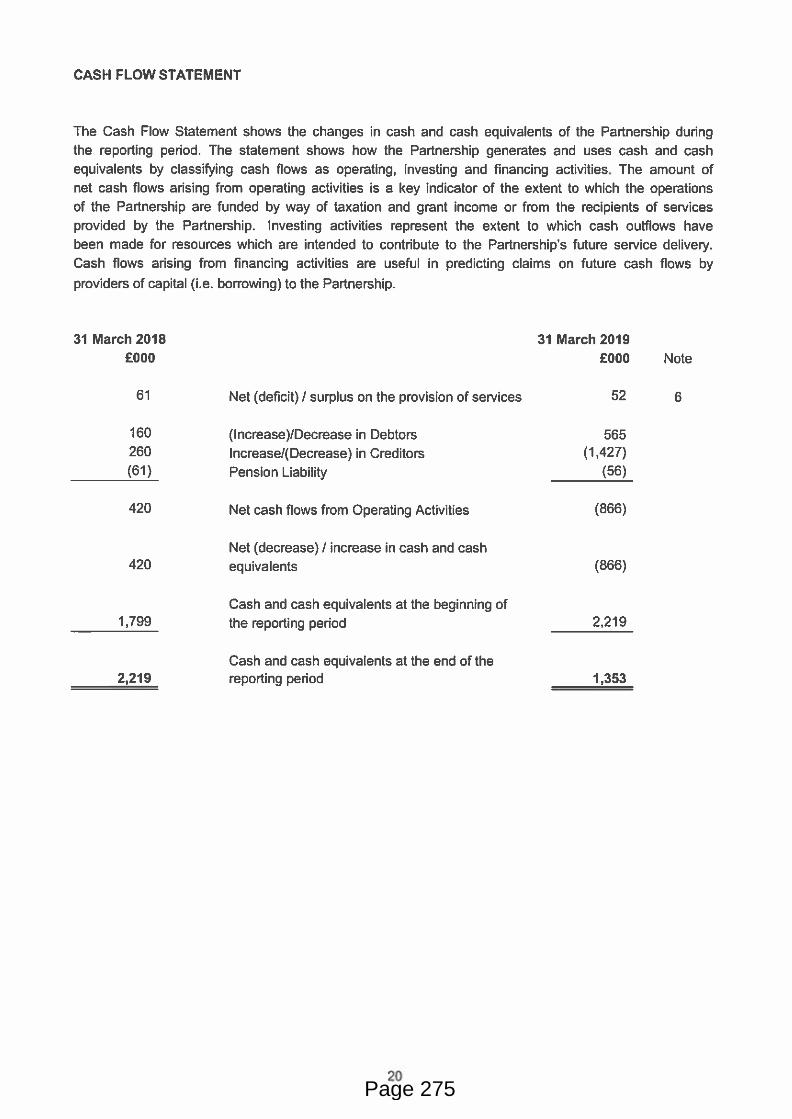
Page 275
Page 276
Page 277
Page 278
Page 279
Page 280
Page 281
Page 282
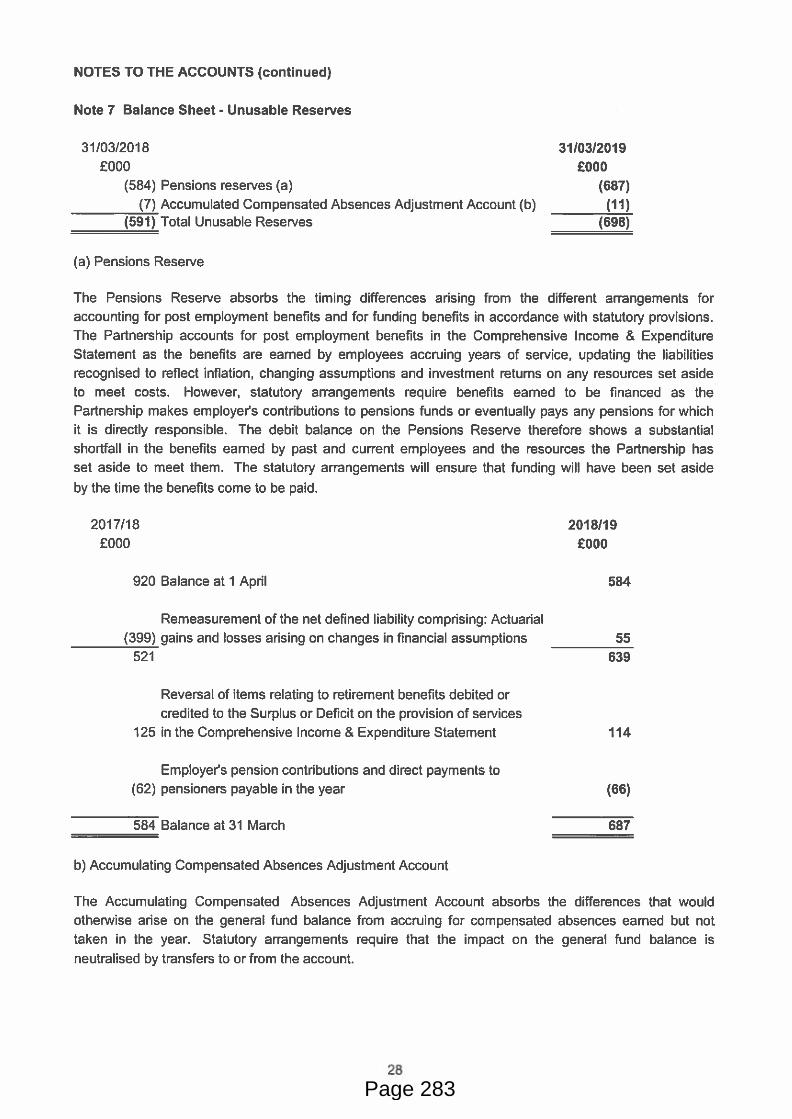
Page 283
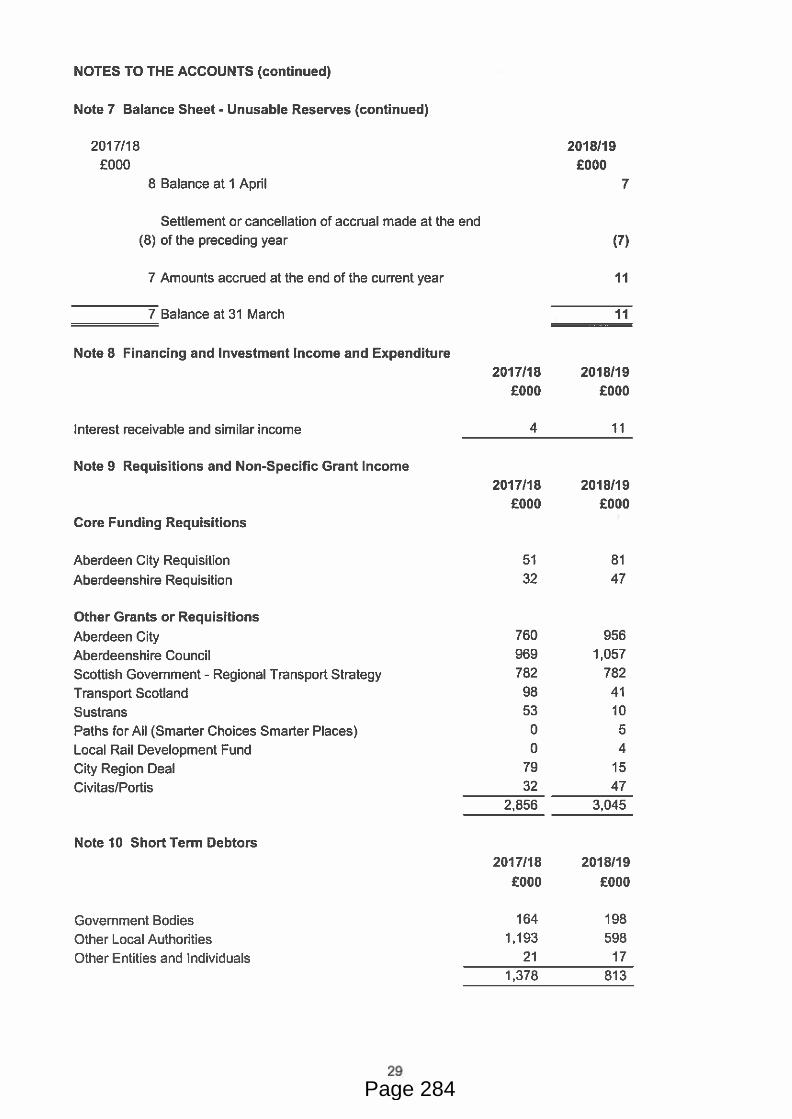
Page 284
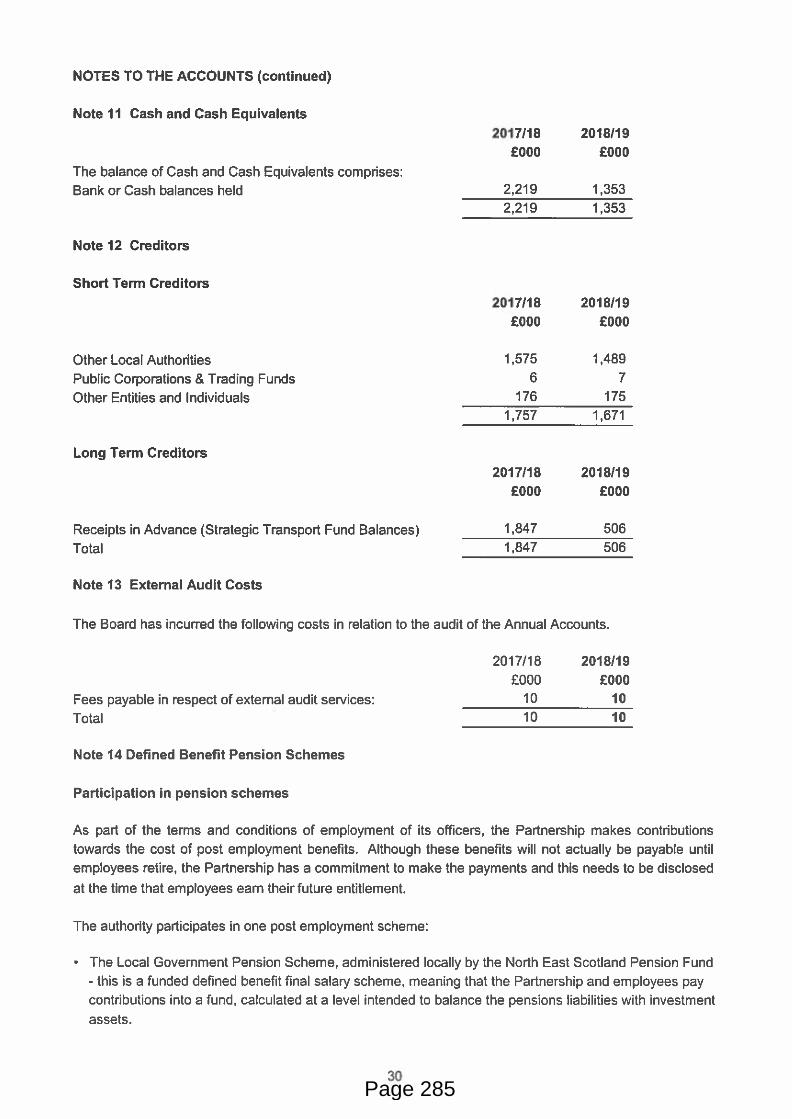
Page 285
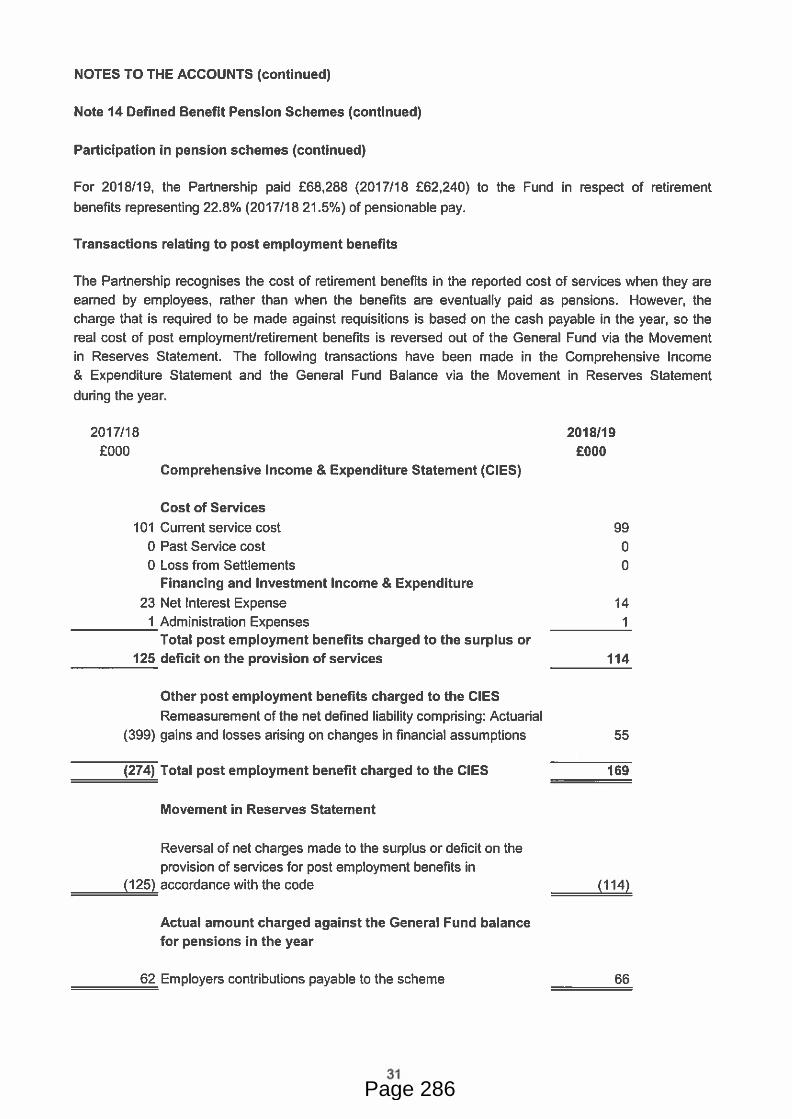
Page 286

Page 287
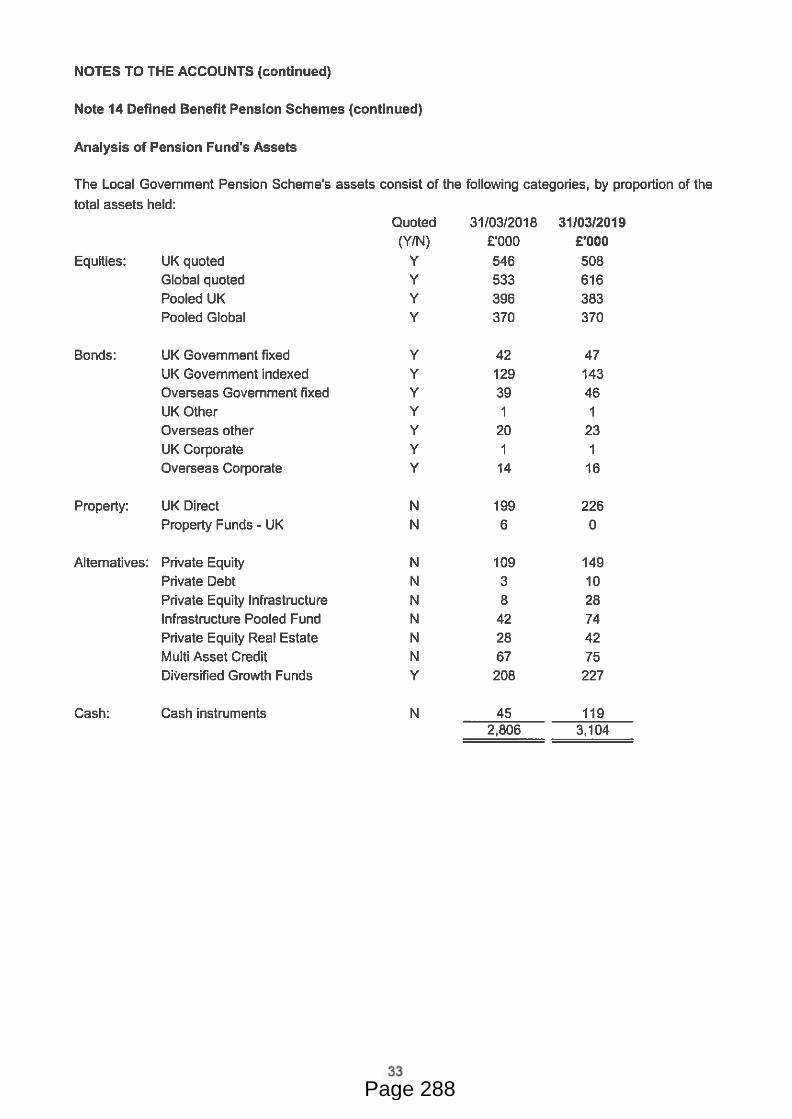
Page 288
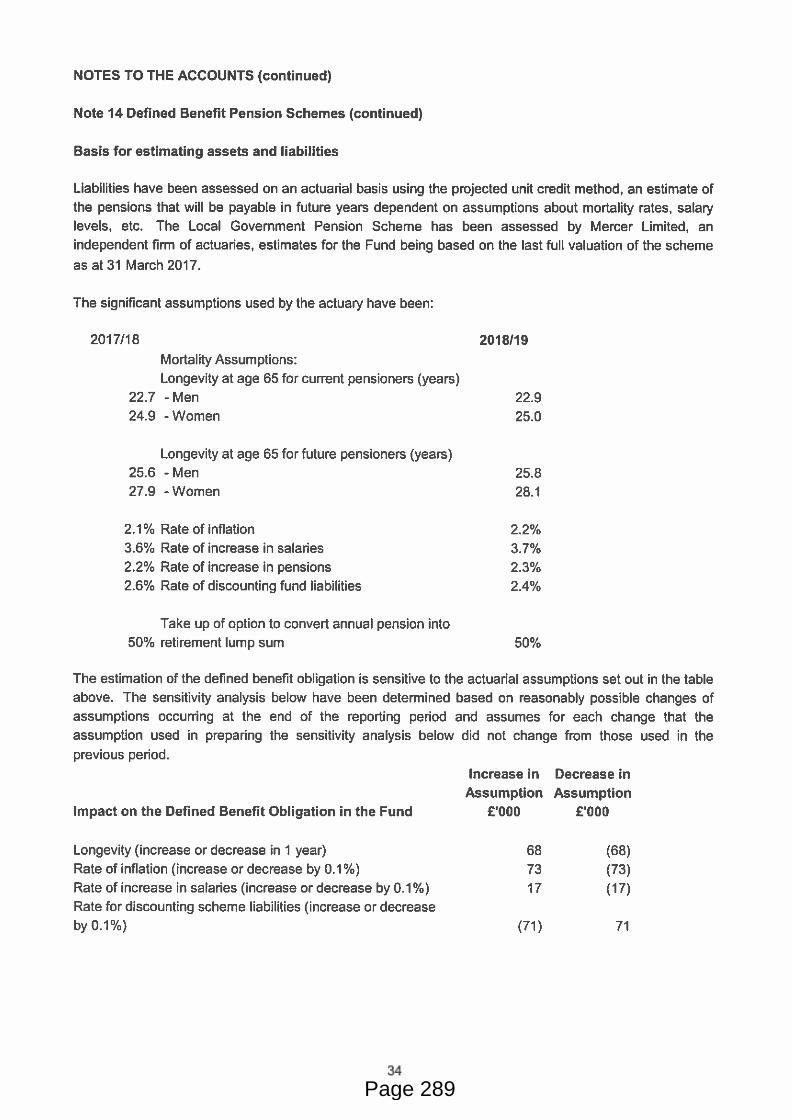
Page 289
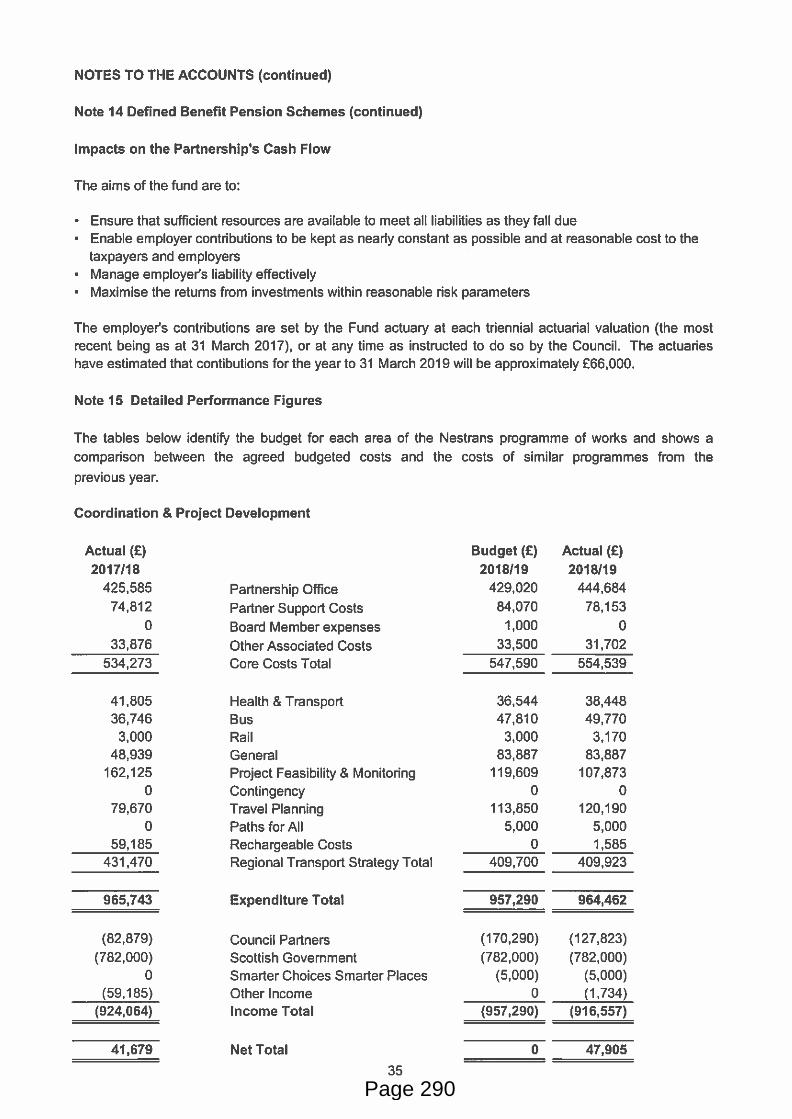
Page 290
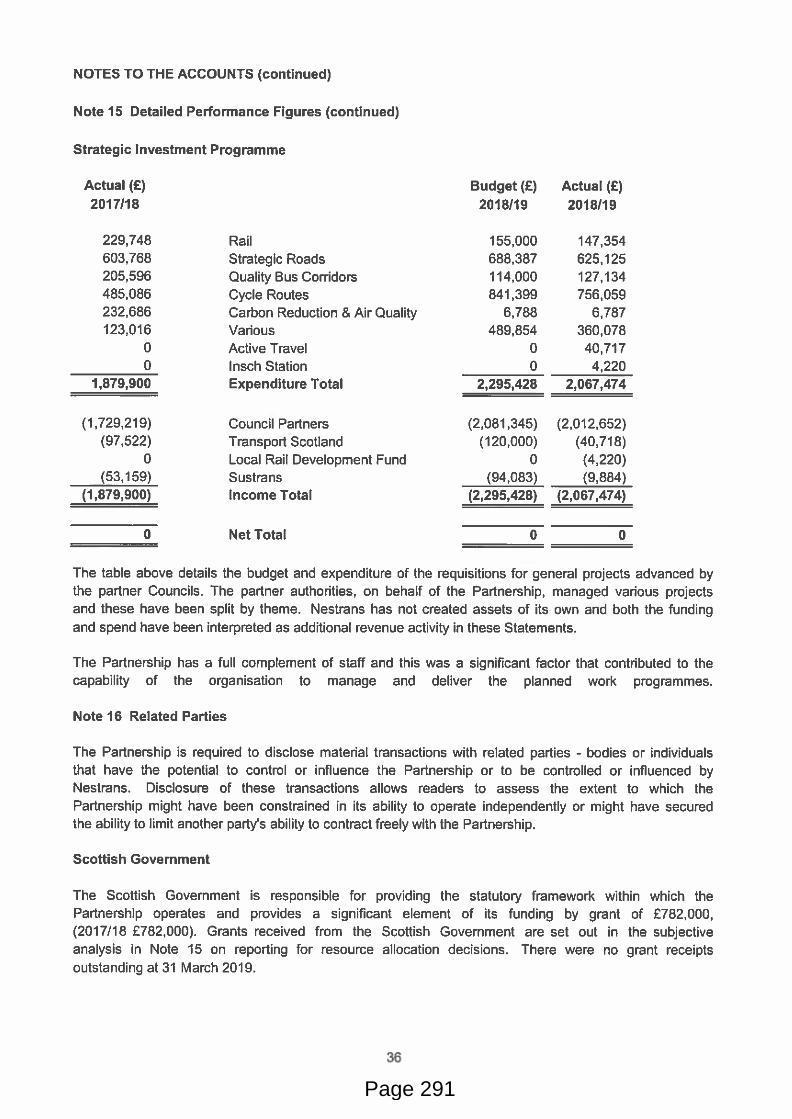
Page 291
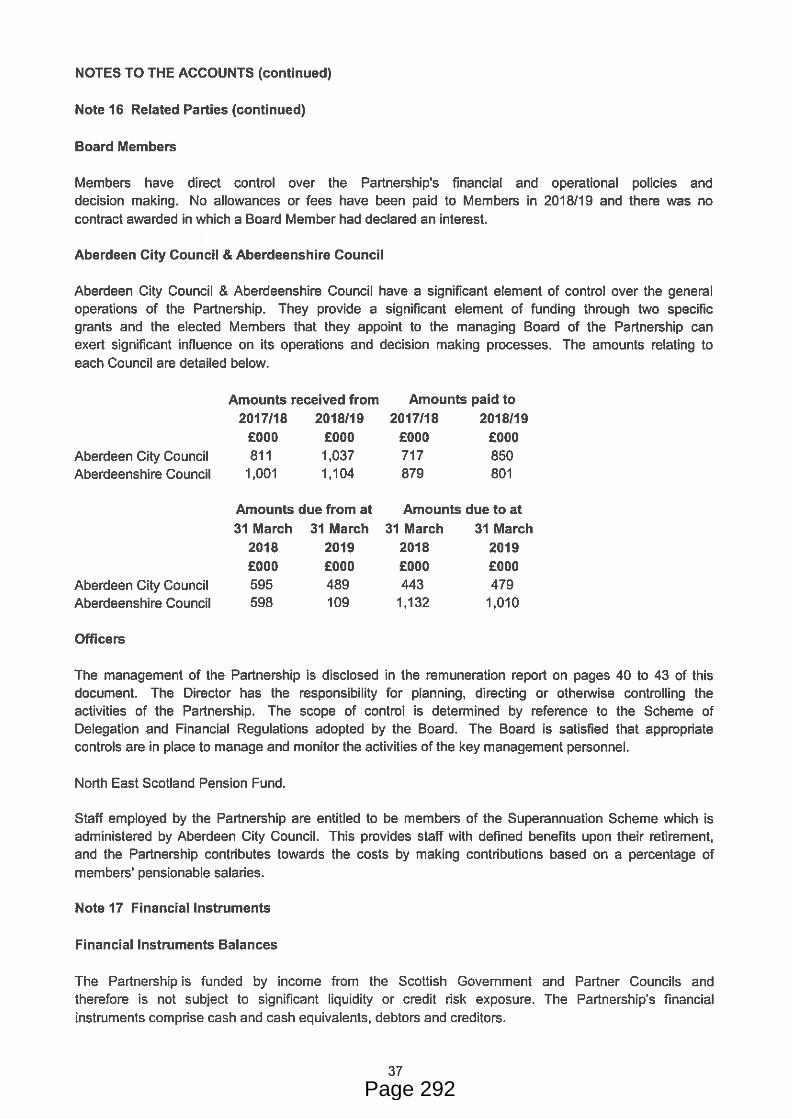
Page 292

Page 293
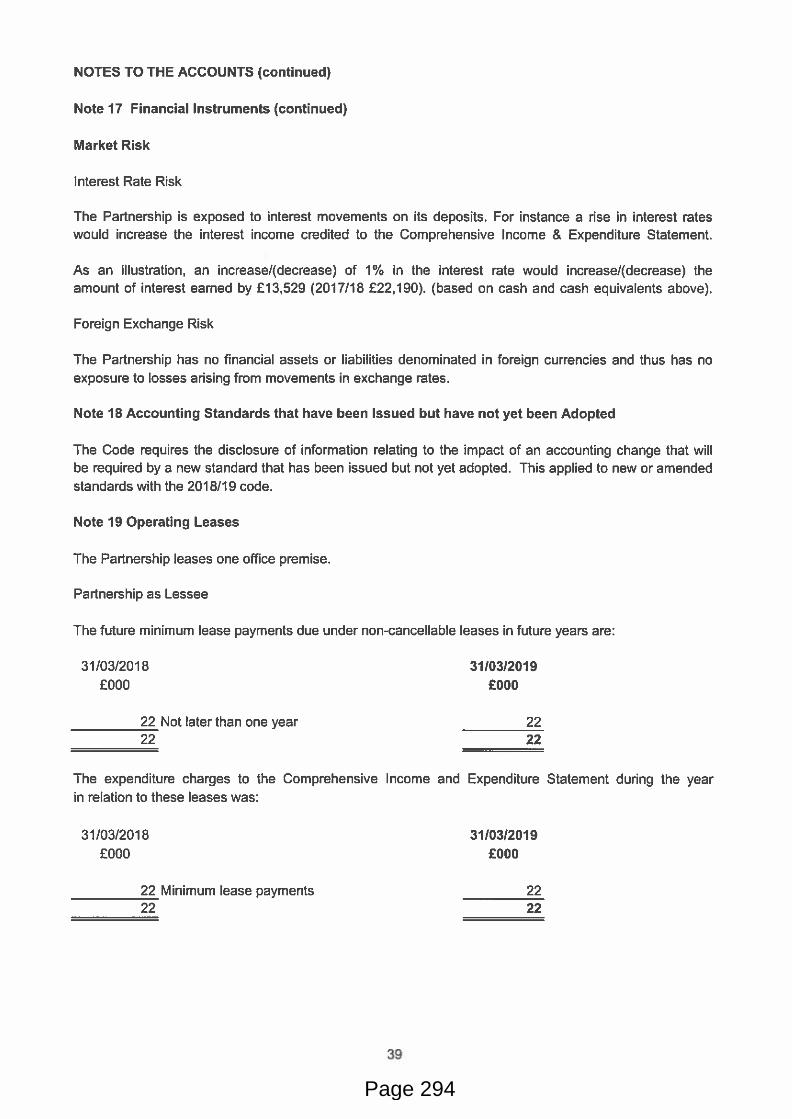
Page 294
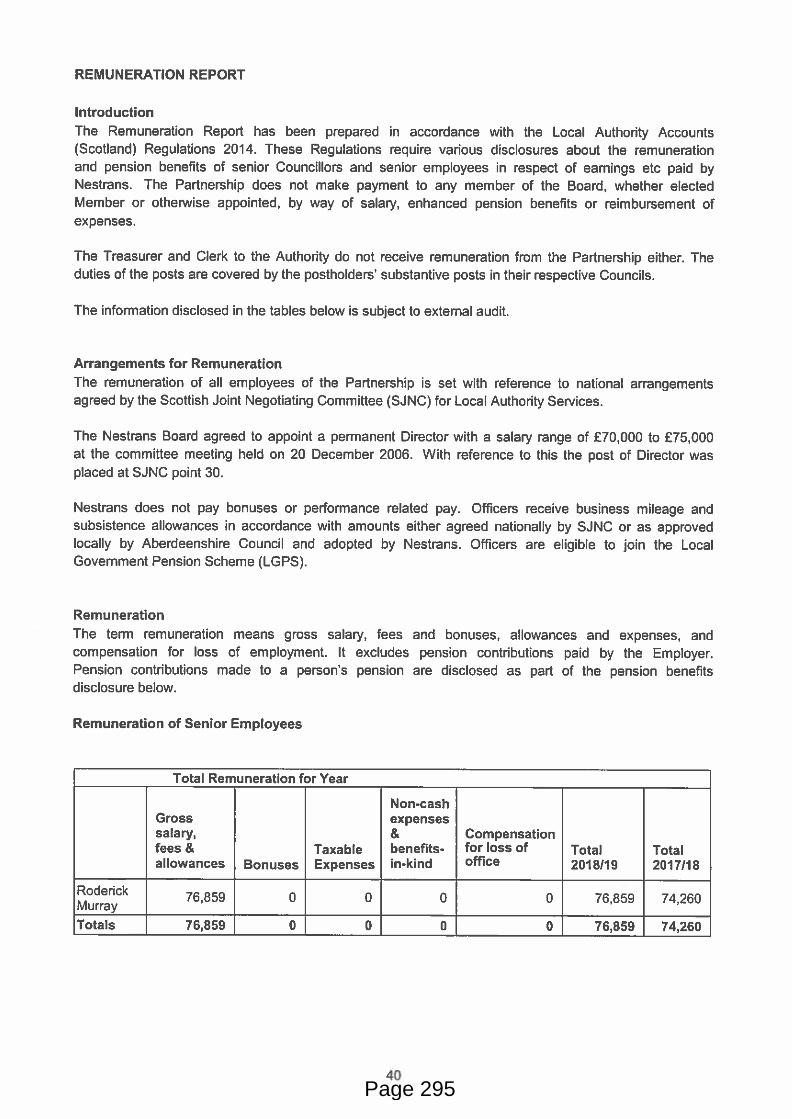
Page 295
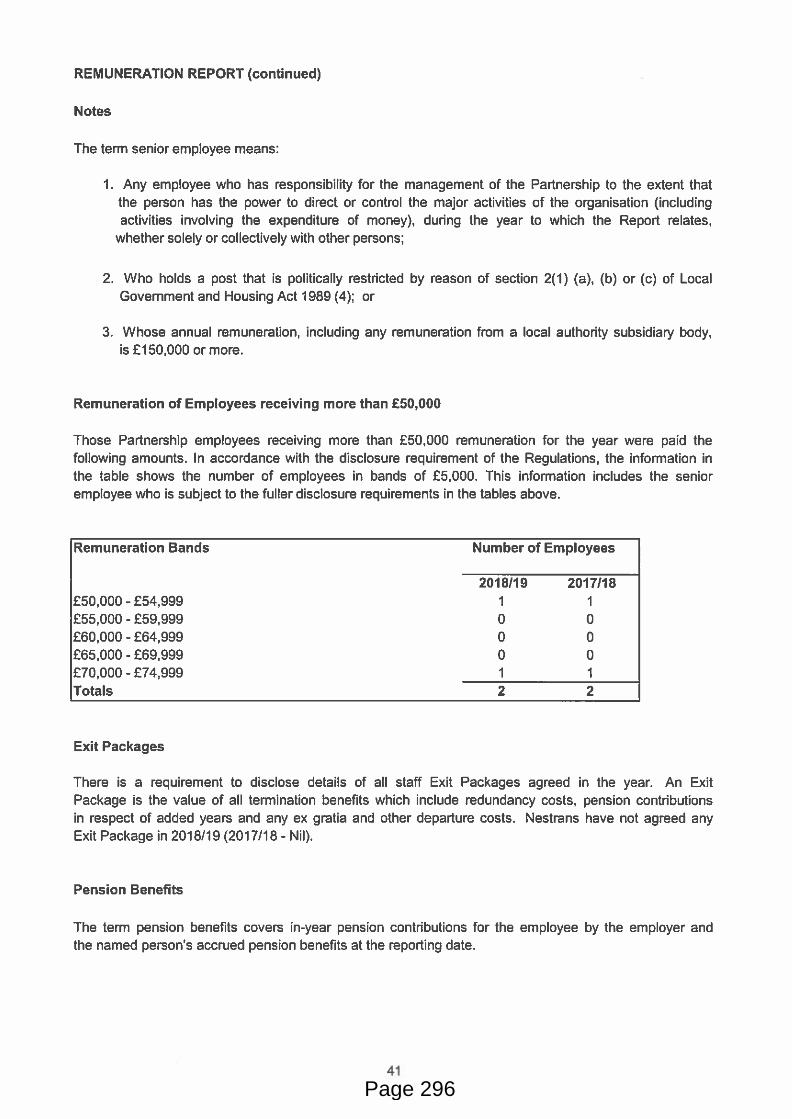
Page 296
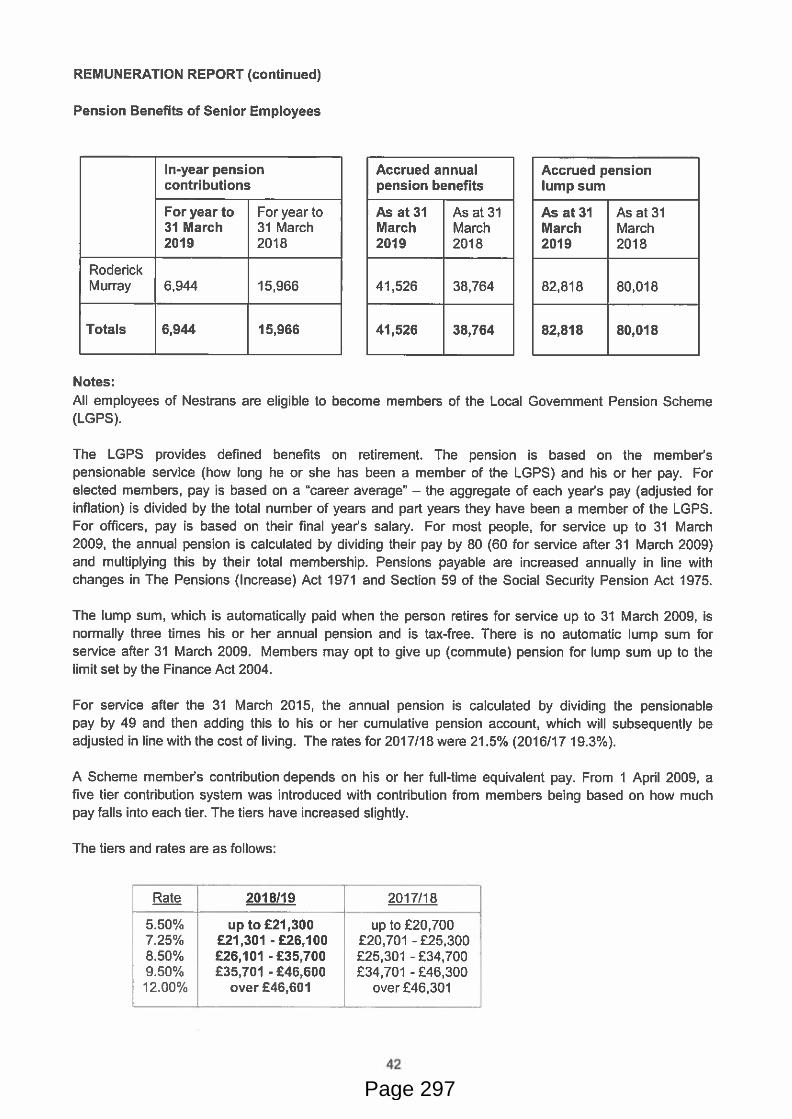
Page 297
Page 298
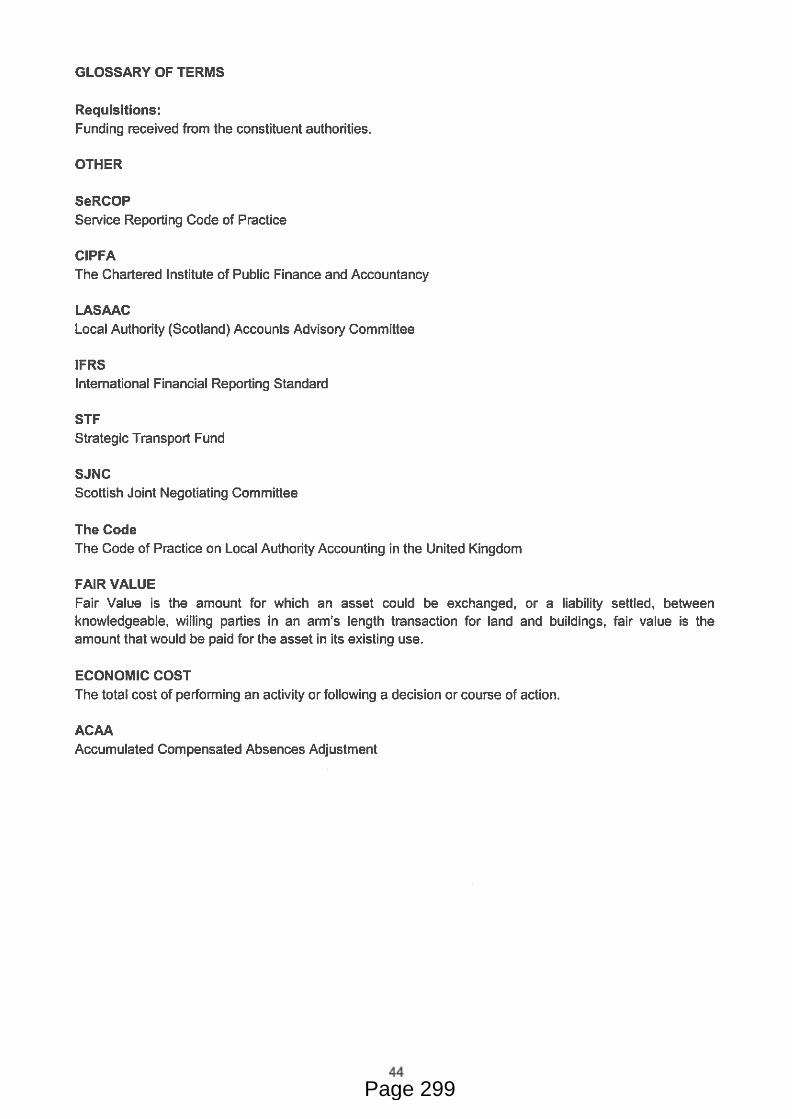
Page 299

Page 300
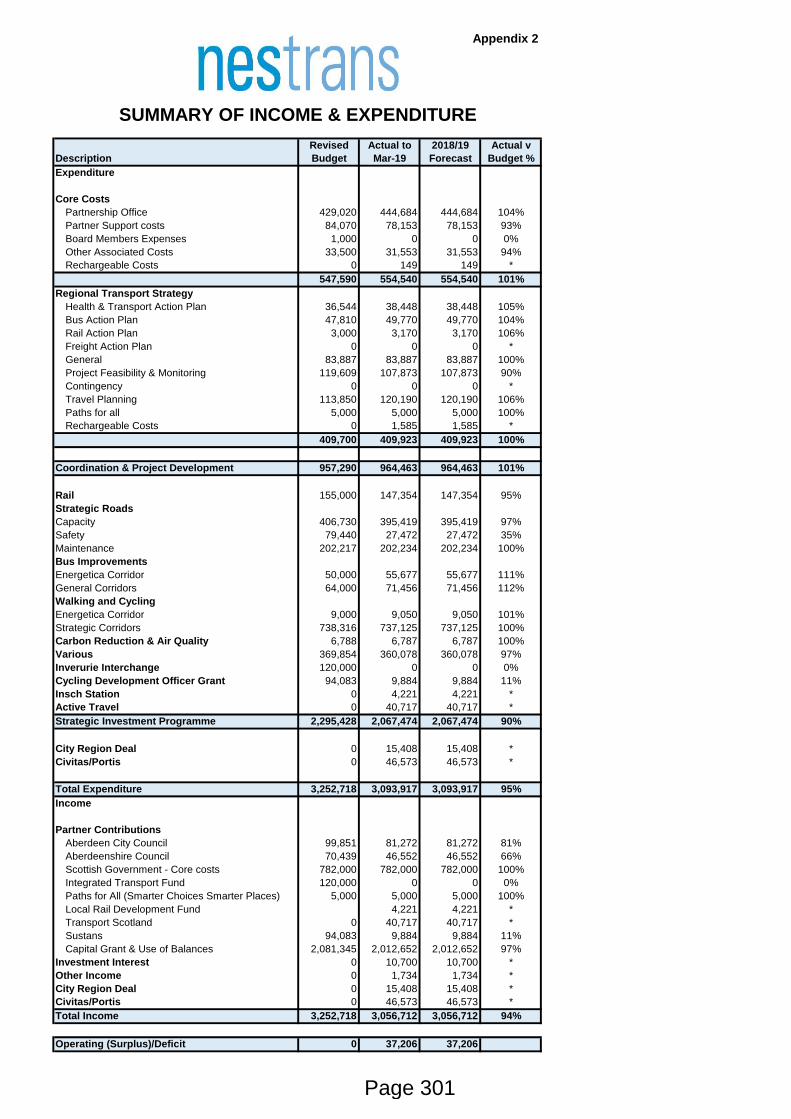
Appendix 2
Revised Actual to 2018/19 Actual v
Description Budget Mar-19 Forecast Budget %
Expenditure
Core Costs
Partnership Office 429,020 444,684 444,684 104%
Partner Support costs 84,070 78,153 78,153 93%
Board Members Expenses 1,000 0 0 0%
Other Associated Costs 33,500 31,553 31,553 94%
Rechargeable Costs 0 149 149 *
547,590 554,540 554,540 101%
Regional Transport Strategy
Health & Transport Action Plan 36,544 38,448 38,448 105%
Bus Action Plan 47,810 49,770 49,770 104%
Rail Action Plan 3,000 3,170 3,170 106%
Freight Action Plan 0 0 0 *
General 83,887 83,887 83,887 100%
Project Feasibility & Monitoring 119,609 107,873 107,873 90%
Contingency 0 0 0 *
Travel Planning 113,850 120,190 120,190 106%
Paths for all 5,000 5,000 5,000 100%
Rechargeable Costs 0 1,585 1,585 *
409,700 409,923 409,923 100%
Coordination & Project Development 957,290 964,463 964,463 101%
Rail 155,000 147,354 147,354 95%
Strategic Roads
Capacity 406,730 395,419 395,419 97%
Safety 79,440 27,472 27,472 35%
Maintenance 202,217 202,234 202,234 100%
Bus Improvements
Energetica Corridor 50,000 55,677 55,677 111%
General Corridors 64,000 71,456 71,456 112%
Walking and Cycling
Energetica Corridor 9,000 9,050 9,050 101%
Strategic Corridors 738,316 737,125 737,125 100%
Carbon Reduction & Air Quality 6,788 6,787 6,787 100%
Various 369,854 360,078 360,078 97%
Inverurie Interchange 120,000 0 0 0%
Cycling Development Officer Grant 94,083 9,884 9,884 11%
Insch Station 0 4,221 4,221 *
Active Travel 0 40,717 40,717 *
Strategic Investment Programme 2,295,428 2,067,474 2,067,474 90%
City Region Deal 0 15,408 15,408 *
Civitas/Portis 0 46,573 46,573 *
Total Expenditure 3,252,718 3,093,917 3,093,917 95%
Income
Partner Contributions
Aberdeen City Council 99,851 81,272 81,272 81%
Aberdeenshire Council 70,439 46,552 46,552 66%
Scottish Government - Core costs 782,000 782,000 782,000 100%
Integrated Transport Fund 120,000 0 0 0%
Paths for All (Smarter Choices Smarter Places) 5,000 5,000 5,000 100%
Local Rail Development Fund 4,221 4,221 *
Transport Scotland 0 40,717 40,717 *
Sustans 94,083 9,884 9,884 11%
Capital Grant & Use of Balances 2,081,345 2,012,652 2,012,652 97%
Investment Interest 0 10,700 10,700 *
Other Income 0 1,734 1,734 *
City Region Deal 0 15,408 15,408 *
Civitas/Portis 0 46,573 46,573 *
Total Income 3,252,718 3,056,712 3,056,712 94%
Operating (Surplus)/Deficit 0 37,206 37,206
SUMMARY OF INCOME & EXPENDITURE
Page 301

This page is intentionally left blank
Page 302

Appendix 3
Nestrans 2018/19
Proposed Virements as at 11 June 2019
Budget Head Project Current
Budget
Proposed
Virement
Revised
Budget
Comments
Health and Transport
Action Plan
Health & Transport
Actions
5,944 3,309 9,253 Additional budget would allow greater
contribution to cost of accessible bike
to be met through the H&T budget
Project Feasibility
and Monitoring
Cross City Connections -
Stag Part 2
90,064 (7,835) 82,229 Final consultancy and staff costs for
Stag Part 2 less than had been
estimated
Travel Planning Travel Planning 65,000 4,526 69,526 Additional budget towards costs of
extra Thistle Card production and
Nestrans contribution to the
Travelknowhow App
Total 0
Coordination & Project Development
Page 303

This page is intentionally left blank
Page 304
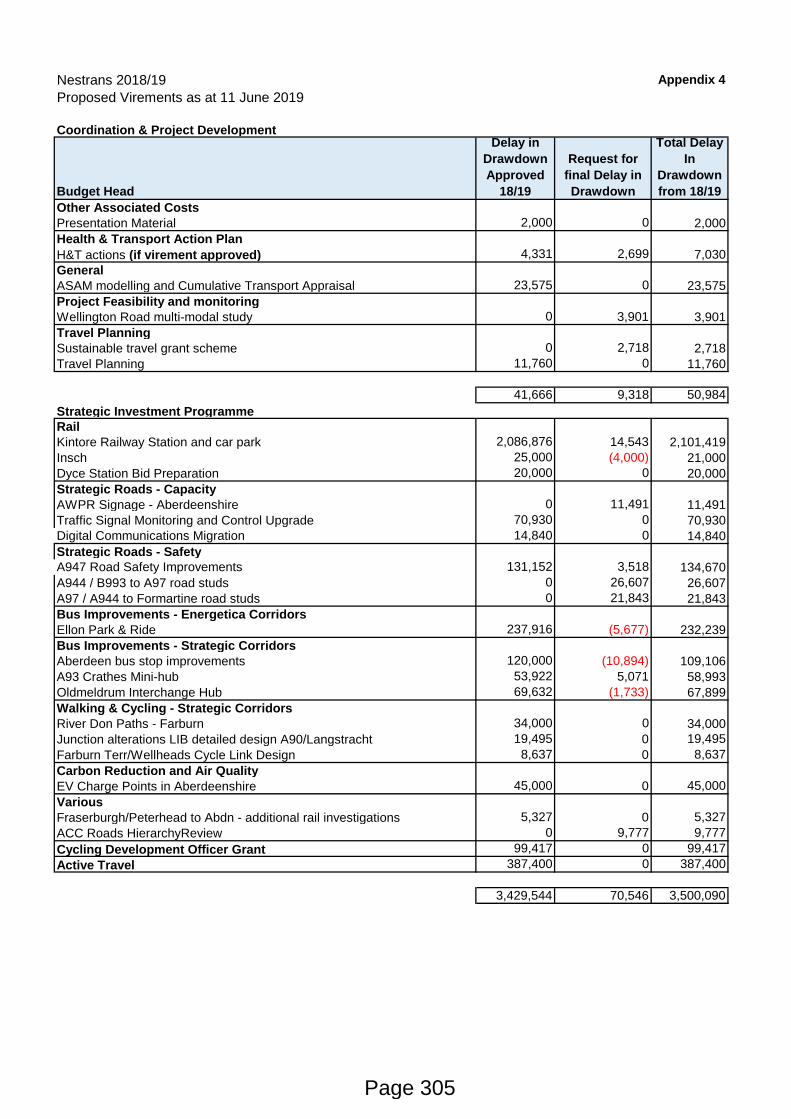
Nestrans 2018/19 Appendix 4
Proposed Virements as at 11 June 2019
Coordination & Project Development
Budget Head
Delay in
Drawdown
Approved
18/19
Request for
final Delay in
Drawdown
Total Delay
In
Drawdown
from 18/19
Other Associated Costs
Presentation Material 2,000 0 2,000
Health & Transport Action Plan
H&T actions (if virement approved) 4,331 2,699 7,030
General
ASAM modelling and Cumulative Transport Appraisal 23,575 0 23,575
Project Feasibility and monitoring
Wellington Road multi-modal study 0 3,901 3,901
Travel Planning
Sustainable travel grant scheme 0 2,718 2,718
Travel Planning 11,760 0 11,760
41,666 9,318 50,984
Strategic Investment Programme
Rail
Kintore Railway Station and car park 2,086,876 14,543 2,101,419
Insch 25,000 (4,000) 21,000
Dyce Station Bid Preparation 20,000 0 20,000
Strategic Roads - Capacity
AWPR Signage - Aberdeenshire 0 11,491 11,491
Traffic Signal Monitoring and Control Upgrade 70,930 0 70,930
Digital Communications Migration 14,840 0 14,840
Strategic Roads - Safety
A947 Road Safety Improvements 131,152 3,518 134,670
A944 / B993 to A97 road studs 0 26,607 26,607
A97 / A944 to Formartine road studs 0 21,843 21,843
Bus Improvements - Energetica Corridors
Ellon Park & Ride 237,916 (5,677) 232,239
Bus Improvements - Strategic Corridors
Aberdeen bus stop improvements 120,000 (10,894) 109,106
A93 Crathes Mini-hub 53,922 5,071 58,993
Oldmeldrum Interchange Hub 69,632 (1,733) 67,899
Walking & Cycling - Strategic Corridors
River Don Paths - Farburn 34,000 0 34,000
Junction alterations LIB detailed design A90/Langstracht 19,495 0 19,495
Farburn Terr/Wellheads Cycle Link Design 8,637 0 8,637
Carbon Reduction and Air Quality
EV Charge Points in Aberdeenshire 45,000 0 45,000
Various
Fraserburgh/Peterhead to Abdn - additional rail investigations 5,327 0 5,327
ACC Roads HierarchyReview 0 9,777 9,777
Cycling Development Officer Grant 99,417 0 99,417
Active Travel 387,400 0 387,400
3,429,544 70,546 3,500,090
Page 305

This page is intentionally left blank
Page 306
NORTH EAST TRANSPORT PARTNERSHIP – 19 JUNE 2019
7c 2019/20 Budget Matters
Purpose of Report
To provide the Board with an update on the Partnership’s 2019/20 monitoring and forecast outturn position and to consider any budget or monitoring issues that may arise.
Background
The Board has requested that a general budget report be submitted to each meeting, monitoring expenditure, identifying any potential budget issues, and reporting on any particular expenditure requests. The reports are prepared jointly by the Nestrans office and Finance officers from Aberdeenshire Council.
Current Revenue & Capital Budget
Appendix 1 to this report sets out a summary budget monitoring statement of expenditure to 31 May 2019. This shows expenditure of £97,294. It is early in the financial year and whilst little by way of expenditure has taken place, work programmes are progressing and the forecast for the year remains at the budgeted level. Aberdeen City have been successful in gaining 100% funding from Sustrans towards their project River Don Paths – Farburn, therefore Appendix 2 sets out a small virement allocating the original budget for this project to another two projects to increase their funding and the amount of work that can be carried out.
Strategic Transport Fund
The legal challenge successfully quashed The Strategic Transport Fund (STF). The opening balance for 2019/20 is £505,862. No repayments have been made so far in 2019/20. There are 17 developments remaining to be claimed.
Recommendation
It is recommended that the Board:
1. Note the monitoring position and forecast presented in Appendix 1. 2. Approves the virements presented in Appendix 2.
Alan Wood Treasurer 11 June 2019
Page 307
Agenda Item 7c

This page is intentionally left blank
Page 308
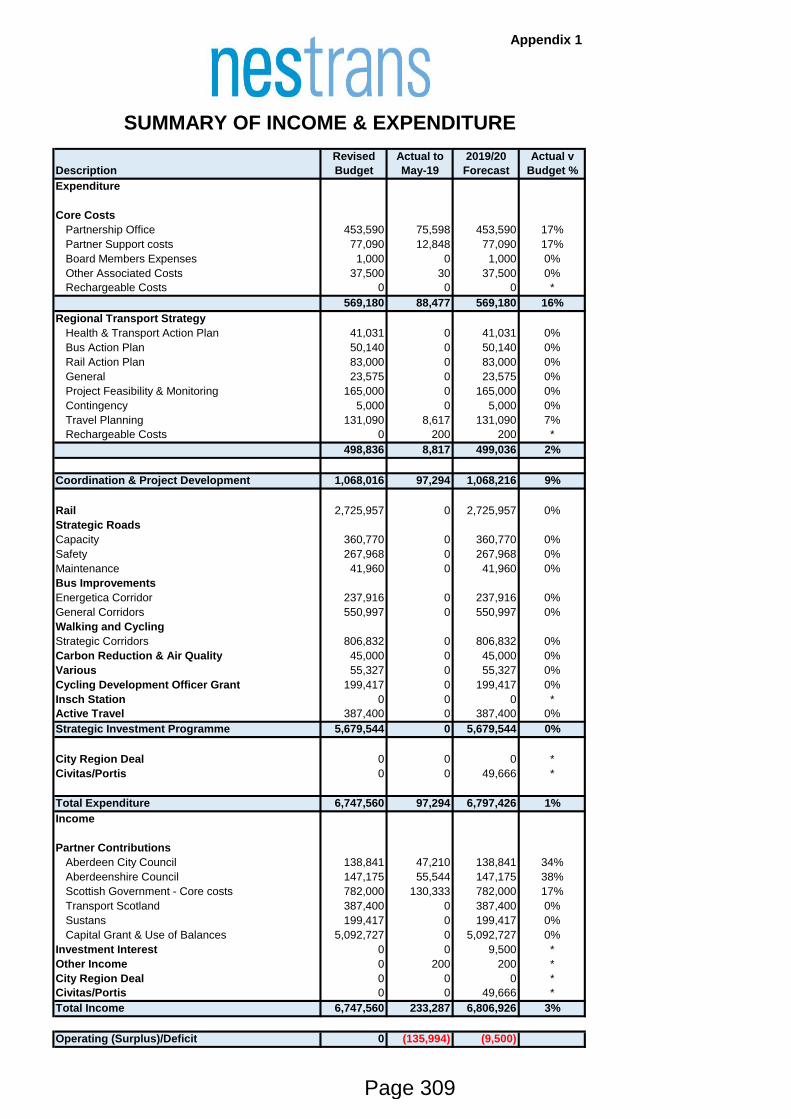
Appendix 1
Revised Actual to 2019/20 Actual v
Description Budget May-19 Forecast Budget %
Expenditure
Core Costs
Partnership Office 453,590 75,598 453,590 17%
Partner Support costs 77,090 12,848 77,090 17%
Board Members Expenses 1,000 0 1,000 0%
Other Associated Costs 37,500 30 37,500 0%
Rechargeable Costs 0 0 0 *
569,180 88,477 569,180 16%
Regional Transport Strategy
Health & Transport Action Plan 41,031 0 41,031 0%
Bus Action Plan 50,140 0 50,140 0%
Rail Action Plan 83,000 0 83,000 0%
General 23,575 0 23,575 0%
Project Feasibility & Monitoring 165,000 0 165,000 0%
Contingency 5,000 0 5,000 0%
Travel Planning 131,090 8,617 131,090 7%
Rechargeable Costs 0 200 200 *
498,836 8,817 499,036 2%
Coordination & Project Development 1,068,016 97,294 1,068,216 9%
Rail 2,725,957 0 2,725,957 0%
Strategic Roads
Capacity 360,770 0 360,770 0%
Safety 267,968 0 267,968 0%
Maintenance 41,960 0 41,960 0%
Bus Improvements
Energetica Corridor 237,916 0 237,916 0%
General Corridors 550,997 0 550,997 0%
Walking and Cycling
Strategic Corridors 806,832 0 806,832 0%
Carbon Reduction & Air Quality 45,000 0 45,000 0%
Various 55,327 0 55,327 0%
Cycling Development Officer Grant 199,417 0 199,417 0%
Insch Station 0 0 0 *
Active Travel 387,400 0 387,400 0%
Strategic Investment Programme 5,679,544 0 5,679,544 0%
City Region Deal 0 0 0 *
Civitas/Portis 0 0 49,666 *
Total Expenditure 6,747,560 97,294 6,797,426 1%
Income
Partner Contributions
Aberdeen City Council 138,841 47,210 138,841 34%
Aberdeenshire Council 147,175 55,544 147,175 38%
Scottish Government - Core costs 782,000 130,333 782,000 17%
Transport Scotland 387,400 0 387,400 0%
Sustans 199,417 0 199,417 0%
Capital Grant & Use of Balances 5,092,727 0 5,092,727 0%
Investment Interest 0 0 9,500 *
Other Income 0 200 200 *
City Region Deal 0 0 0 *
Civitas/Portis 0 0 49,666 *
Total Income 6,747,560 233,287 6,806,926 3%
Operating (Surplus)/Deficit 0 (135,994) (9,500)
SUMMARY OF INCOME & EXPENDITURE
Page 309

This page is intentionally left blank
Page 310
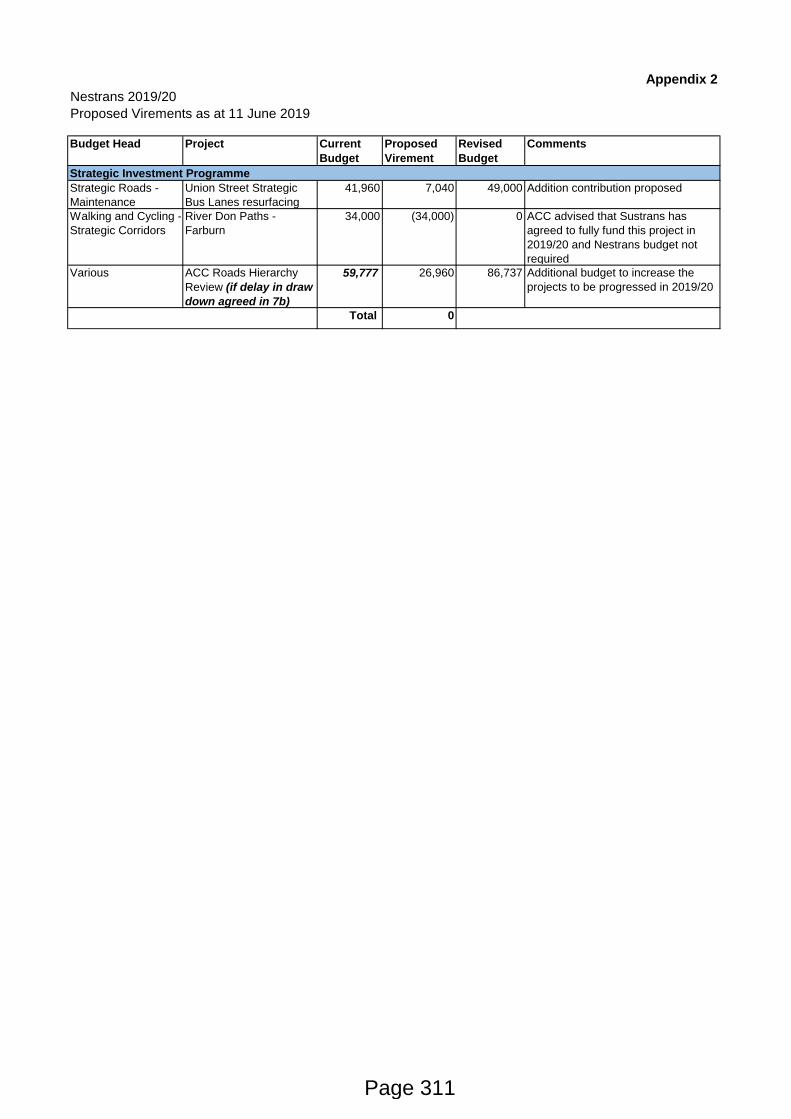
Appendix 2
Nestrans 2019/20
Proposed Virements as at 11 June 2019
Budget Head Project Current
Budget
Proposed
Virement
Revised
Budget
Comments
Strategic Roads -
Maintenance
Union Street Strategic
Bus Lanes resurfacing
41,960 7,040 49,000 Addition contribution proposed
Walking and Cycling -
Strategic Corridors
River Don Paths -
Farburn
34,000 (34,000) 0 ACC advised that Sustrans has
agreed to fully fund this project in
2019/20 and Nestrans budget not
required
Various ACC Roads Hierarchy
Review (if delay in draw
down agreed in 7b)
59,777 26,960 86,737 Additional budget to increase the
projects to be progressed in 2019/20
Total 0
Strategic Investment Programme
Page 311

This page is intentionally left blank
Page 312
8 Information Bulletin Page 1
NORTH EAST SCOTLAND TRANSPORT PARTNERSHIP – 19 June 2019
8 Information Bulletin
Purpose of Report The purpose of this report is to provide information and updates for the Board on a number of matters not requiring decision.
Climate Change Bill The UK Committee on Climate Change (CCC) published its advice on Scottish, Welsh and UK targets in light of the Paris Agreement and the Intergovernmental Panel on Climate Change (IPCC) Special Report on 2nd May 2019. The report may be found on the CCC’s website at: https://www.theccc.org.uk/publication/net-zero-the-uks-contribution-to-stopping-global-warming/ The CCC has recommended that Scotland should now set a target for net-zero emissions of all greenhouse gases by 2045, provided that UK-wide ambition is also raised to net-zero by 2050. The Scottish Government has lodged amendments to the Climate Change Bill. These amendments would, if agreed to by the Scottish Parliament, implement the CCC’s advice by setting a target date of 2045 for net-zero emissions of all greenhouse gases and increasing the levels of the 2030 and 2040 targets to 70% and 90% reductions respectively.
Getabout update The Getabout partnership is celebrating its 10th anniversary this year. The Getabout partnership had a presence at the City Tour Series Cycling event in Aberdeen City Centre on 16th April 2019. Upcoming events include Active Ellon Day on 16th of June and Clean Air Day on 20th of June 2019. Planning has begun for In Town Without My Car Day on Sunday 15th of September.
Railway Station Travel Plans ScotRail and their consultants recently undertook a series of local workshops to develop station travel plans at key stations across Scotland. In the north east, Inverurie, Dyce and Stonehaven had workshops and travel plans have now been developed. A Nestrans representative attended all the local workshops. Below are links to the plans: Inverurie: https://www.scotrail.co.uk/sites/default/files/assets/download_ct/inverurie_station_travel_plan.pdf Dyce; https://www.scotrail.co.uk/sites/default/files/assets/download_ct/dyce_station_travel_plan.pdf
Page 313
Agenda Item 8
8 Information Bulletin Page 2
Stonehaven; https://www.scotrail.co.uk/sites/default/files/assets/download_ct/stonehaven_station_travel_plan.pdf The plans outline key issues and opportunities, particularly around accessibility of the stations and parking. Nestrans along with other partners, will continue to work in partnership, to develop and implement, where possible, these actions, using the travel plans as an evidence base for potential future projects.
Grampian Cycle Partnership Since the last Board meeting, there have been further committee meetings held in Stonehaven and Elgin and a working group formed in relation to the many concerns on the A944 path between the city and Westhill. On 25th May, in response to concerns about potential conflict among users of the Deeside Way shared path, GCP, along with representatives from the local Community Council, the British Horse Society, City Council Countryside Rangers and Police Scotland, held a drop-in on the former railway line near Cults. Passers-by were asked a short series of questions about what they thought of the path and those who use it. Several Getabout bells were handed out (and fitted) to bikes. The main findings from the survey were that most path users felt it was safe and should be left alone. Many did report near-misses and concerns of cyclists travelling too closely/quickly. It is planned to repeat this exercise on a weekday soon, near the Duthie Park entrance.
AWPR Launch Event – Bikes On 20th May, the Cabinet Secretary for Transport, Infrastructure and Connectivity, Michael Matheson handed over a wealth of nearly new cycling equipment used during the AWPR GoNorthEast Roads Festival in September 2018 to local organisations Adventure Aberdeen and Live Life Aberdeenshire. The equipment will now be put to good use in local schools and included 13 bikes (five toddler bikes, six children’s bikes and two women’s bikes), 32 children’s-sized helmets and 1,050 high-vis jackets, had been purchased to allow people of all ages to cycle a section of the road without having to bring their own bikes and equipment.
o Hands Up Scotland Survey 2018 The Annual Survey is funded by Transport Scotland to provide an accurate and up-to-date picture of how pupils travel to school and published by Sustrans. https://www.sustrans.org.uk/scotland/hands-up-scotland-survey Travel modes are categorised as follows; Active travel (walking, cycling, scootering, skating), Public sustainable travel (bus), Multi-mode travel (park and stride: driven part of the way and walk the rest) and private motorised travel (driven (car) and taxi). Nationally, there has been a slight decline in pupils walking to school (from 45% in 2010 to 42% in 2018), while the numbers reportedly cycling continue to increase (from 2.8% in 2010 to 3.8% in 2018). The proportion of pupils being driven to school nationally was 23.1%, the highest on record. However, bus travel to school is at its lowest recorded level (from 18.2% in 2010 to 16.2% in 2018). Locally, the numbers walking to school in Aberdeen city have decreased noticeably (from 62.4% in 2008 to 49.2% in 2018) and in Aberdeenshire (from 42.5% in 2008 to 38.5% in 2018).
Page 314
https://www.scotrail.co.uk/sites/default/files/assets/download_ct/stonehaven_station_travel_plan.pdf
8 Information Bulletin Page 3
However, the numbers cycling to school in both local authorities continue to increase markedly, in Aberdeen city from 2.1% in 2008 to 3.1% in 2018 and in Aberdeenshire from 3.1% in 2008 to 4.8% in 2018. In relation to the numbers who reported being driven to school, Aberdeen city has increased substantially (from 16.5% in 2008 to 21.8% in 2018). Aberdeenshire has seen a more modest rise (from 19.3% in 2008 to 21% in 2018). Bus travel to school in Aberdeen city has increased slightly (from 10.3% in 2008 to 12.5% in 2018) and fell more severely in Aberdeenshire (from 27.2% in 2008 to 23.5% in 2018).
Press and Communications
A summary of Press Enquiries, Media Releases and coverage relevant to Nestrans is attached as Appendix A to this report.
Recommendation
It is recommended that the Board note the contents of this report.
JB/KW/LC/10 June 2019
Page 315
8 Information Bulletin Page 4
Appendix A
Nestrans Communications Report
2nd April – 3rd June 2019
Nestrans Media Queries
Date Media Query Response
22 April 2019
STV Is Cllr Argyle available for a TV interview following Board meeting with Alex Hynes
Cllr Argyle was happy to provide the interview.
Nestrans and partner Press Releases
Date Details
1st May 2019
Bikers’ views to be sought as part of research into impact and effectiveness of road safety initiatives
8th May 2019
Three quarters of people in Scotland don’t know you can get three points for close passing someone cycling
15th May 2019
Can you help influence the long term vision for transport in the North East?
Nestrans News Coverage
Date Media Headline Details
11 April 2019
Aberdeen Business News
Transport sector network chair appointed
David Phillips, operations director at First Aberdeen, has been appointed chair of the Aberdeen & Grampian Chamber of Commerce transport sector network
18 April 2019 Evening Express
ScotRail boss responds to north-east communities’ concerns
The boss of ScotRail has said they will look into issue of some north-east communities feeling cut off since the changes to train timetables last year.
19 April 2019 Evening Express
Apologetic rail boss promises improvements by next month
19 April 2019 Courier
ScotRail boss claims major cancellations and delays in north-east will be over by the end of May
A rail boss has pledged that major disruption to train services in the north-east will be over by the end of next month.
Page 316
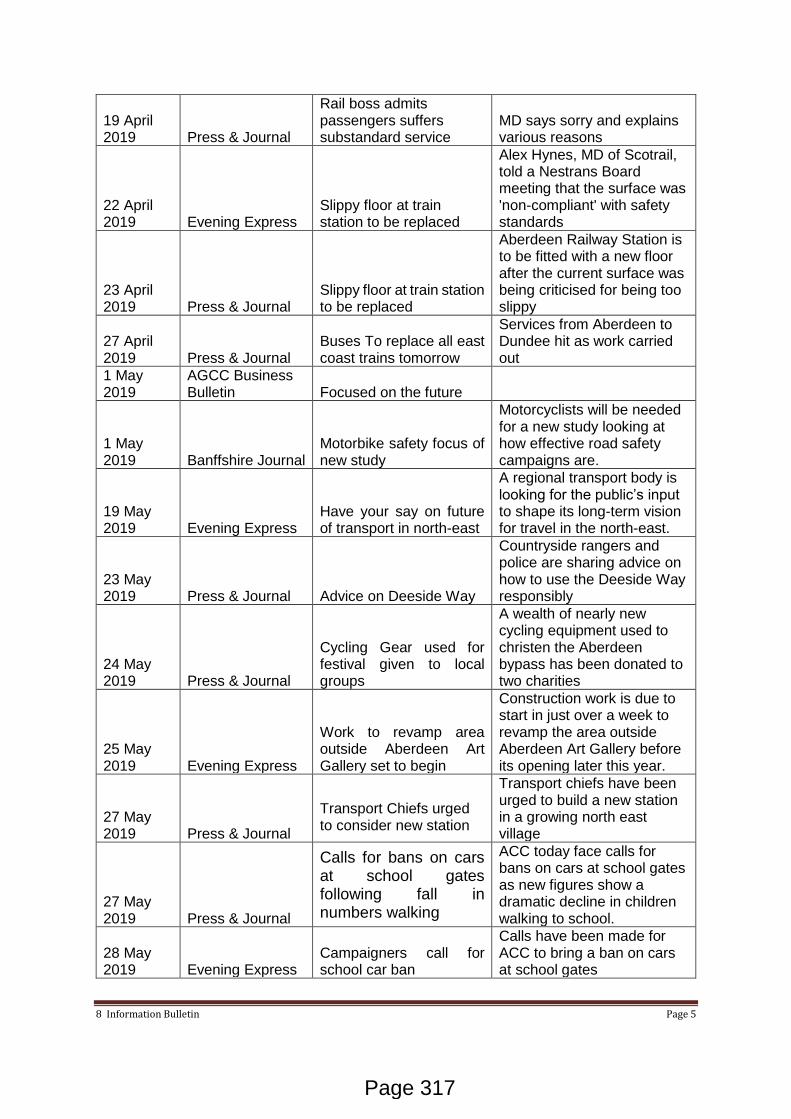
8 Information Bulletin Page 5
19 April 2019 Press & Journal
Rail boss admits passengers suffers substandard service
MD says sorry and explains various reasons
22 April 2019 Evening Express
Slippy floor at train station to be replaced
Alex Hynes, MD of Scotrail, told a Nestrans Board meeting that the surface was 'non-compliant' with safety standards
23 April 2019 Press & Journal
Slippy floor at train station to be replaced
Aberdeen Railway Station is to be fitted with a new floor after the current surface was being criticised for being too slippy
27 April 2019 Press & Journal
Buses To replace all east coast trains tomorrow
Services from Aberdeen to Dundee hit as work carried out
1 May 2019
AGCC Business Bulletin Focused on the future
1 May 2019 Banffshire Journal
Motorbike safety focus of new study
Motorcyclists will be needed for a new study looking at how effective road safety campaigns are.
19 May 2019 Evening Express
Have your say on future of transport in north-east
A regional transport body is looking for the public’s input to shape its long-term vision for travel in the north-east.
23 May 2019 Press & Journal
Advice on Deeside Way
Countryside rangers and police are sharing advice on how to use the Deeside Way responsibly
24 May 2019 Press & Journal
Cycling Gear used for festival given to local groups
A wealth of nearly new cycling equipment used to christen the Aberdeen bypass has been donated to two charities
25 May 2019 Evening Express
Work to revamp area outside Aberdeen Art Gallery set to begin
Construction work is due to start in just over a week to revamp the area outside Aberdeen Art Gallery before its opening later this year.
27 May 2019 Press & Journal
Transport Chiefs urged to consider new station
Transport chiefs have been urged to build a new station in a growing north east village
27 May 2019 Press & Journal
Calls for bans on cars at school gates following fall in numbers walking
ACC today face calls for bans on cars at school gates as new figures show a dramatic decline in children walking to school.
28 May 2019 Evening Express
Campaigners call for school car ban
Calls have been made for ACC to bring a ban on cars at school gates
Page 317
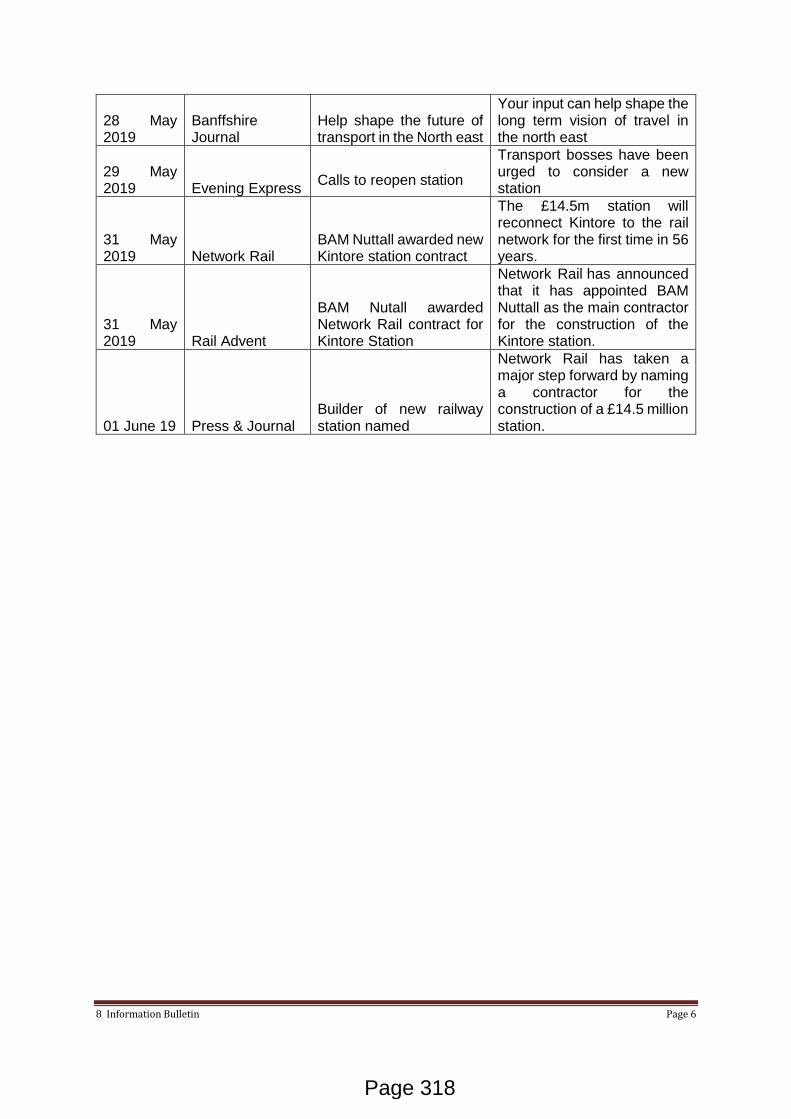
8 Information Bulletin Page 6
28 May 2019
Banffshire Journal
Help shape the future of transport in the North east
Your input can help shape the long term vision of travel in the north east
29 May 2019 Evening Express
Calls to reopen station
Transport bosses have been urged to consider a new station
31 May 2019 Network Rail
BAM Nuttall awarded new Kintore station contract
The £14.5m station will reconnect Kintore to the rail network for the first time in 56 years.
31 May 2019 Rail Advent
BAM Nutall awarded Network Rail contract for Kintore Station
Network Rail has announced that it has appointed BAM Nuttall as the main contractor for the construction of the Kintore station.
01 June 19 Press & Journal Builder of new railway station named
Network Rail has taken a major step forward by naming a contractor for the construction of a £14.5 million station.
Page 318
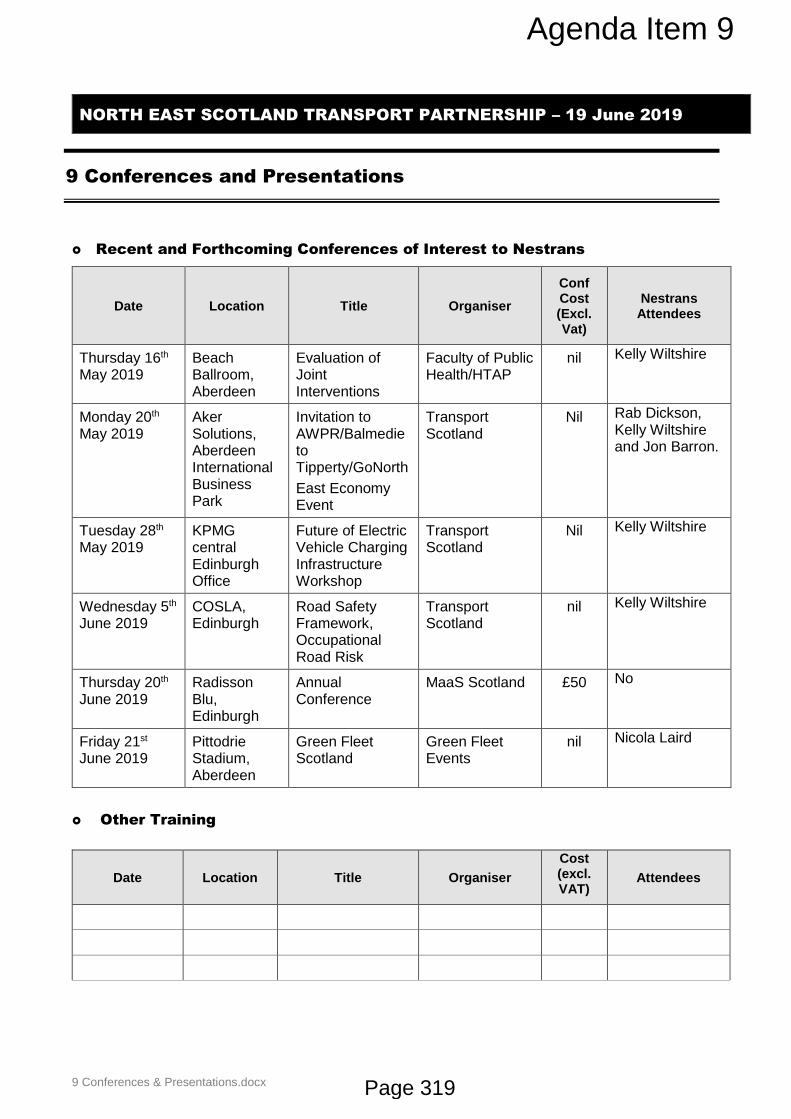
9 Conferences & Presentations.docx
NORTH EAST SCOTLAND TRANSPORT PARTNERSHIP – 19 June 2019
9 Conferences and Presentations
Recent and Forthcoming Conferences of Interest to Nestrans
Date Location Title Organiser
Conf Cost (Excl. Vat)
Nestrans Attendees
Thursday 16th May 2019
Beach Ballroom, Aberdeen
Evaluation of Joint Interventions
Faculty of Public Health/HTAP
nil Kelly Wiltshire
Monday 20th May 2019
Aker Solutions, Aberdeen International Business Park
Invitation to AWPR/Balmedie to Tipperty/GoNorth
East Economy Event
Transport Scotland
Nil Rab Dickson, Kelly Wiltshire and Jon Barron.
Tuesday 28th May 2019
KPMG central Edinburgh Office
Future of Electric Vehicle Charging Infrastructure Workshop
Transport Scotland
Nil Kelly Wiltshire
Wednesday 5th June 2019
COSLA, Edinburgh
Road Safety Framework, Occupational Road Risk
Transport Scotland
nil Kelly Wiltshire
Thursday 20th June 2019
Radisson Blu, Edinburgh
Annual Conference
MaaS Scotland £50 No
Friday 21st June 2019
Pittodrie Stadium, Aberdeen
Green Fleet Scotland
Green Fleet Events
nil Nicola Laird
Other Training
Date Location Title Organiser
Cost (excl. VAT)
Attendees
Page 319
Agenda Item 9
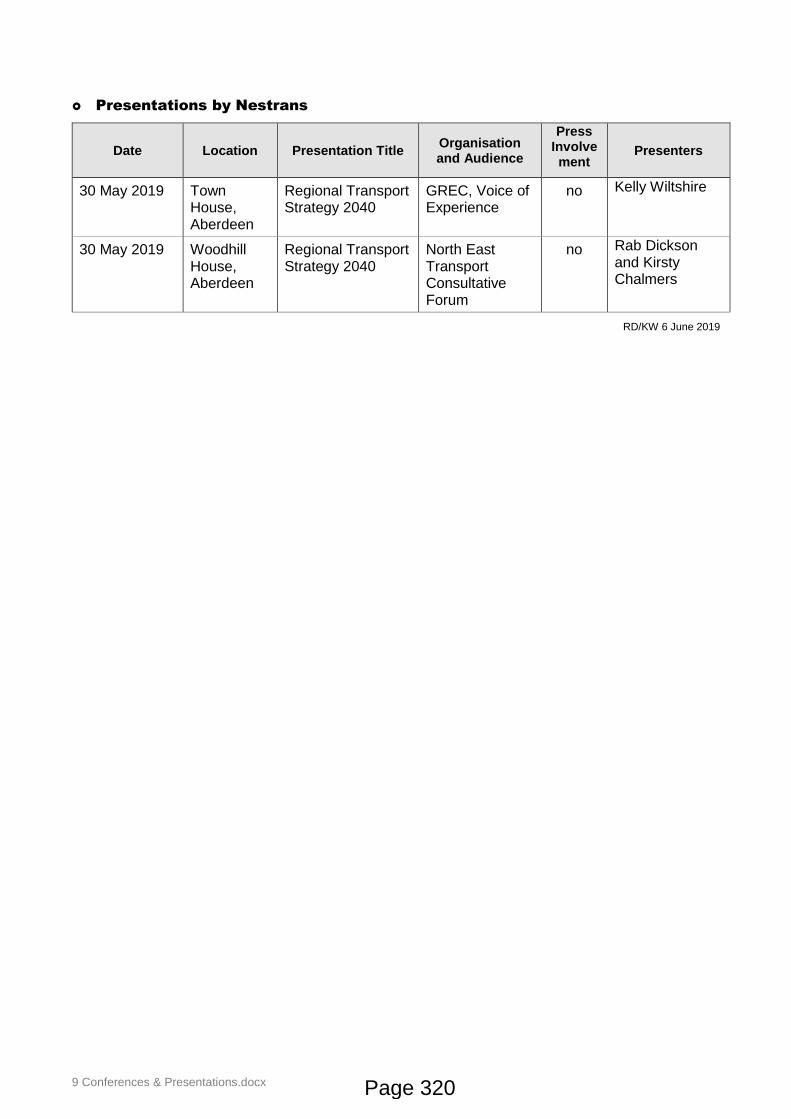
9 Conferences & Presentations.docx
Presentations by Nestrans
Date Location Presentation Title Organisation and Audience
Press Involvement
Presenters
30 May 2019 Town House, Aberdeen
Regional Transport Strategy 2040
GREC, Voice of Experience
no Kelly Wiltshire
30 May 2019 Woodhill House, Aberdeen
Regional Transport Strategy 2040
North East Transport Consultative Forum
no Rab Dickson and Kirsty Chalmers
RD/KW 6 June 2019
Page 320
10 Pending Business.doc
NORTH EAST SCOTLAND TRANSPORT PARTNERSHIP – 19 June 2019
10 Pending Business and Reports for Future Meetings
Purpose of Report
The purpose of this report is to advise of progress on pending business requested by the Board and major reports scheduled for forthcoming Board meetings, and to provide the opportunity for the Board to add to or amend this scheduling.
Background
It has been agreed that this be a standing item on the Board's agenda, listing progress on major areas of work which are not yet in final form to report to the Board with reasons for any delays explained, together with a provisional list of major reports for future Board meetings.
Pending Business
Reports highlighted previously as pending or which the Board has requested reports on, which are included in this agenda are:
o Regional Transport Strategy Update - Item 3b; o Fraserburgh & Peterhead to Aberdeen Strategic Transport Study – additional rail
considerations – Item 4a; o Road Hierarchy Study – Item 4c.
Major Reports for Future Meetings
It is intended to bring reports on the following items to future meetings of the Board:
o National Transport Strategy progress (August); o NTS Roles and Responsibilities (August); o Regional Transport Strategy further workshop (August); o Strategic Transport Appraisal progress (autumn); o City Centre Masterplan progress (autumn).
Recommendation
It is recommended that the Board note the report on pending business and agree the provisional scheduling of major reports to future Board meetings.
RD/7 June 2019
Page 321
Agenda Item 10

This page is intentionally left blank
Page 322

Document is Restricted
Page 323
Agenda Item 11

This page is intentionally left blank