
Triggering by Paf-acether and adrenaline of cyclo-oxygenase-independent platelet aggregation
Upload
khangminh22Category
view
1download
0
PRSP and PAF Harmonisation in Tanzania
Revised version, October 2004
Fact-finding mission report
Marko Nokkala Lapinkatu 24
11120 Riihimäki Finland
1
Acronyms HIPC Heavily Indebted Poorest Countries MDG Millenium Development Goals MOF Ministry of Finance NAO National Auditing Office NBS National Bureau of Statistics ODA Official Development Assistance PAF Performance Assessment Framework PER Public Expenditure Review PMMP Poverty Monitoring Master Plan PMS Poverty Monitoring System PO-RALG President's Office - Regional Administration and Local Government PPA Participatory Poverty Assessment PRSC Poverty Reduction Support Credit PRBS Poverty Reduction Budget Support PRS(P) Poverty Reduction Strategy (Paper) RD Routine Data REPOA Research on Poverty Alleviation TSED Tanzania Socio-Economic Database VPO Vice President’s Office WB World Bank
2
Table of contents
0 EXECUTIVE SUMMARY.............................................................................................. 3
1 INTRODUCTION AND BACKGROUND.................................................................... 5
2 PRSP MONITORING AND INDICATORS ................................................................. 7
3 PAF MONITORING AND INDICATORS ................................................................... 9 3.1 BACKGROUND ............................................................................................................. 9 3.2 PAF ACTIONS ............................................................................................................ 10
4 HARMONISATION OF THE MONITORING FRAMEWORK............................. 11
5 SUMMARY OF FINDINGS ......................................................................................... 13
6 NEXT STEPS.................................................................................................................. 14
REFERENCES....................................................................................................................... 16 DOCUMENTS CONSULTED ...................................................................................................... 16 PEOPLE MET .......................................................................................................................... 17
ANNEX 1 – PRSP INDICATORS ........................................................................................ 18
ANNEX 2 THE PERFORMANCE ASSESSMENT FRAMEWORK .............................. 21
ANNEX 3 - TERMS OF REFERENCE FOR A CONSULTANCY ASSIGNMENT ON A FACT FINDING MISSION ...................................ERROR! BOOKMARK NOT DEFINED.
3
0 Executive Summary United Republic of Tanzania has been one of the first countries to implement a full PRSP. In addition, Tanzania has been active in developing a national poverty monitoring system, PMS to monitor the impact of PRSP. In this study, possibilities to further harmonise the poverty monitoring efforts, from expenditures to the final outcomes of PRSP policies, are studied. This is an area where certain donors have been particularly active over the past few years, yet there are currently three separate monitoring schemes to cover various aspects of the poverty targeted expenditures. Public Expenditure Review deals with the expenditures. Ministry of Finance is responsible for producing the national budget and the analytical work that is evolving around the expenditures side of the PRSP. The capacity of MOF is not convincingly strong at the moment and no doubt the sharpness of analysis will improve as the capacity is built. PAF is a system created to monitor activities (actions) that are related to PRBS/PRSC process. The indicators within PAF can be described as process indicators, which are a checklist for correct policy measures taken to steer the PRSP implementation. PMS, in its turn, monitors the policy outcomes, using a set of 60 indicators to assess the impact on poverty reduction. These three monitoring systems do not intersect significantly at the moment. Early discussions have taken place on the possibilities to harmonise the monitoring of PRSP, but no real plan has emerged as of yet. However, based on some sketches of monitoring arrangements presented in this paper, following recommendations are given:
• PRSP as a process, not as a list of separate actions and programs, should be analysed. This approach, with focus on the monitoring indicators, supported by a series of surveys and analytical research work, would change the current practice of simply focusing on the outcomes and emphasise the intervention. (“Then we can ask if the policies are right.”)
• Current PMS indicators need more revisions. This is because they inadequately
measure the poverty dimension of the expenditures, rather they can be understood as measurement of activity, not its poverty impact. This, in fact, makes some of the indicators “actions monitoring” rather than “outcomes monitoring” already. (“Then we would know what we are measuring.”)
• Tanzania should consider improving a national auditing system to monitor and track
public expenditures (as such a system already exists, even if the functioning and capacity is limited). This separate and independent authority could not only assess the amount spent on each PRSP priority sector or cross cutting theme (as part of the national budgeting monitoring, which should be the overall focus of such an authority), but in addition review the quality of the expenditure, i.e., how well the expenditure meets the expectations and targets set. At the moment, particularly in the context of the PMS indicators there is a clear bias towards observed improvements in indicators with quantity aspect attached, but at the expense of indicators measuring the quality changes. Partly this results from the selection of indicators, which highlights the easy to measure quantity changes, for instance such as enrolment rates or dropouts in education, rather than teacher-student ratios or nutritional intake or availability of

4
teaching materials, which would be more relevant measures to address the quality of education system. (“Then we could be sure right things are happening within PRSP.”)
5
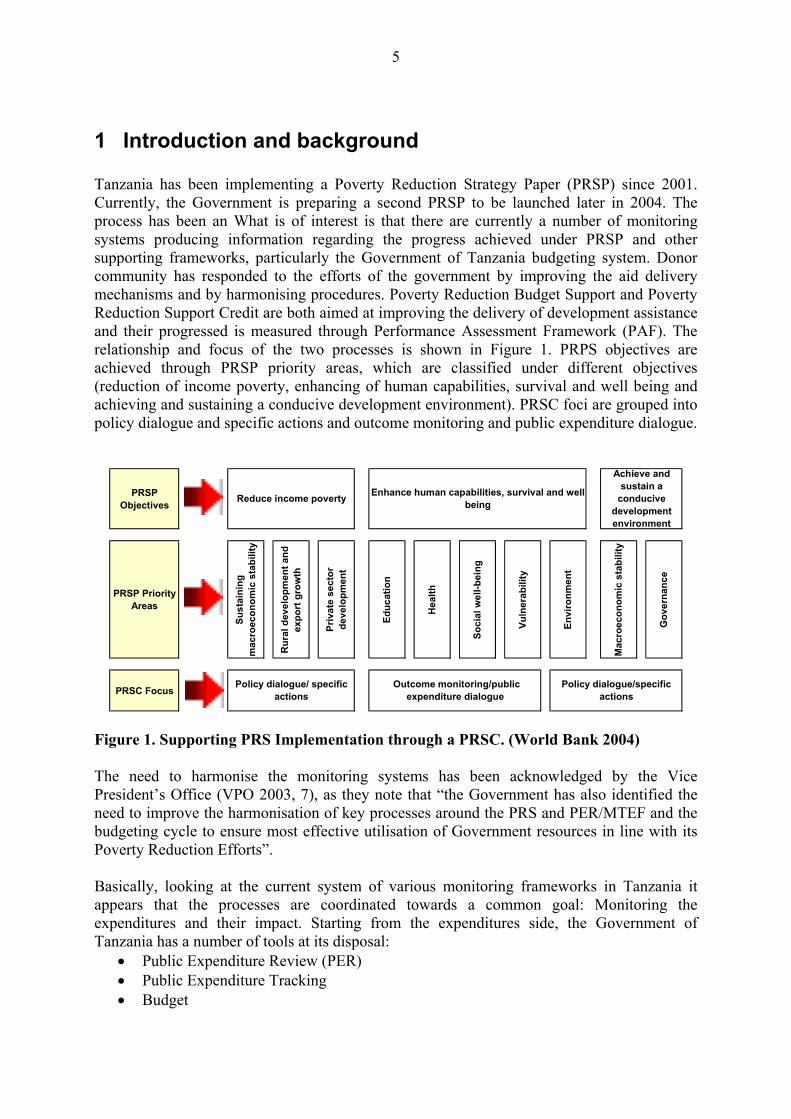
1 Introduction and background Tanzania has been implementing a Poverty Reduction Strategy Paper (PRSP) since 2001. Currently, the Government is preparing a second PRSP to be launched later in 2004. The process has been an What is of interest is that there are currently a number of monitoring systems producing information regarding the progress achieved under PRSP and other supporting frameworks, particularly the Government of Tanzania budgeting system. Donor community has responded to the efforts of the government by improving the aid delivery mechanisms and by harmonising procedures. Poverty Reduction Budget Support and Poverty Reduction Support Credit are both aimed at improving the delivery of development assistance and their progressed is measured through Performance Assessment Framework (PAF). The relationship and focus of the two processes is shown in Figure 1. PRPS objectives are achieved through PRSP priority areas, which are classified under different objectives (reduction of income poverty, enhancing of human capabilities, survival and well being and achieving and sustaining a conducive development environment). PRSC foci are grouped into policy dialogue and specific actions and outcome monitoring and public expenditure dialogue.
PRSP Objectives
PRSP Priority Areas
Sust
aini
ng
mac
roec
onom
ic s
tabi
lity
Rur
al d
evel
opm
ent a
nd
expo
rt g
row
th
Priv
ate
sect
or
deve
lopm
ent
Educ
atio
n
Hea
lth
Soci
al w
ell-b
eing
Vuln
erab
ility
Envi
ronm
ent
Mac
roec
onom
ic s
tabi
lity
Gov
erna
nce
PRSC Focus
Reduce income poverty Enhance human capabilities, survival and well being
Achieve and sustain a
conducive development environment
Policy dialogue/ specific actions
Outcome monitoring/public expenditure dialogue
Policy dialogue/specific actions
Figure 1. Supporting PRS Implementation through a PRSC. (World Bank 2004) The need to harmonise the monitoring systems has been acknowledged by the Vice President’s Office (VPO 2003, 7), as they note that “the Government has also identified the need to improve the harmonisation of key processes around the PRS and PER/MTEF and the budgeting cycle to ensure most effective utilisation of Government resources in line with its Poverty Reduction Efforts”. Basically, looking at the current system of various monitoring frameworks in Tanzania it appears that the processes are coordinated towards a common goal: Monitoring the expenditures and their impact. Starting from the expenditures side, the Government of Tanzania has a number of tools at its disposal:
• Public Expenditure Review (PER) • Public Expenditure Tracking • Budget
6
• Medium-Term Expenditure Framework • Poverty Reduction Strategy Paper
The purpose of the expenditures monitoring is to maintain a balanced budget and to ensure that budgetary allocations are as planned. This work is the responsibility of the Ministry of Finance, but it will have important implications to PRSP monitoring, because it sets the resource envelope for PRSP and sector priorities. Second part of the process is the actions and process monitoring, which is carried out using the Performance Assessment Framework (PAF) as a tool of analyses. PAF is a tool, which can be described as an effort to enhance the poverty reducing policy framework. Within the PRSP, a separate monitoring system was specified in the Poverty Monitoring Master Plan (PMMP). Soon after the completion of PRSP process the Government of Tanzania launched the PMMP in December 2001. The idea was to come up with a mechanism to support the poverty monitoring and the evaluation of outcomes of different strategies. Prior to PMS, the data collection was on ad hoc basis and led to duplication of efforts in some cases and to missing data in even more cases. There had been poor communication between data producers and users, and some long delays in the analysis of existing data. Even more so, data and information are used ineffectively in the policy making within the government. PMS indicators have been revised, from the originally specified set of 37 indicators to 60, as the original indicators did not sufficiently address the multiple dimensions of poverty. As the donor community is aiming for a greater harmonised system of monitoring the progress under various initiatives, this report seeks to answer the following questions:
1) What are the possibilities to harmonise the PRSP and PRBS/PRSC indicators and monitoring frameworks;
2) What could the new set of indicators and the monitoring system look like; and 3) What are the next actions to be taken to take the process further?
One of the main purposes of this report is to generate the Finnish Ministry for Foreign Affairs information regarding the processes. However, it is also essential that discussion is directed to research into topics that are relevant for the donor community. This report is based on the findings of a fact-finding mission that took place in March 2004 as well as review of the relevant literature and documents and earlier discussions with various parties involved in the PRPS and PAF processes This report is organised as follows. Chapter 2 gives an overview of the PRSP and PMS indicators, with some considerations of how informative they are. This chapter is based on earlier mission report (Nokkala 2003), but with focus on aspects of the PMS indicators relevant to PAF process. In Chapter 3 we look at the current set of PAF performance indicators and what information they provide for the PAF assessment. In Chapter 4 we analyse the possibilities to combine the two sets of indicators based on the PRSP process. Chapter 5 presents conclusions and recommendations for further actions to harmonise the two sets of indicators.
7
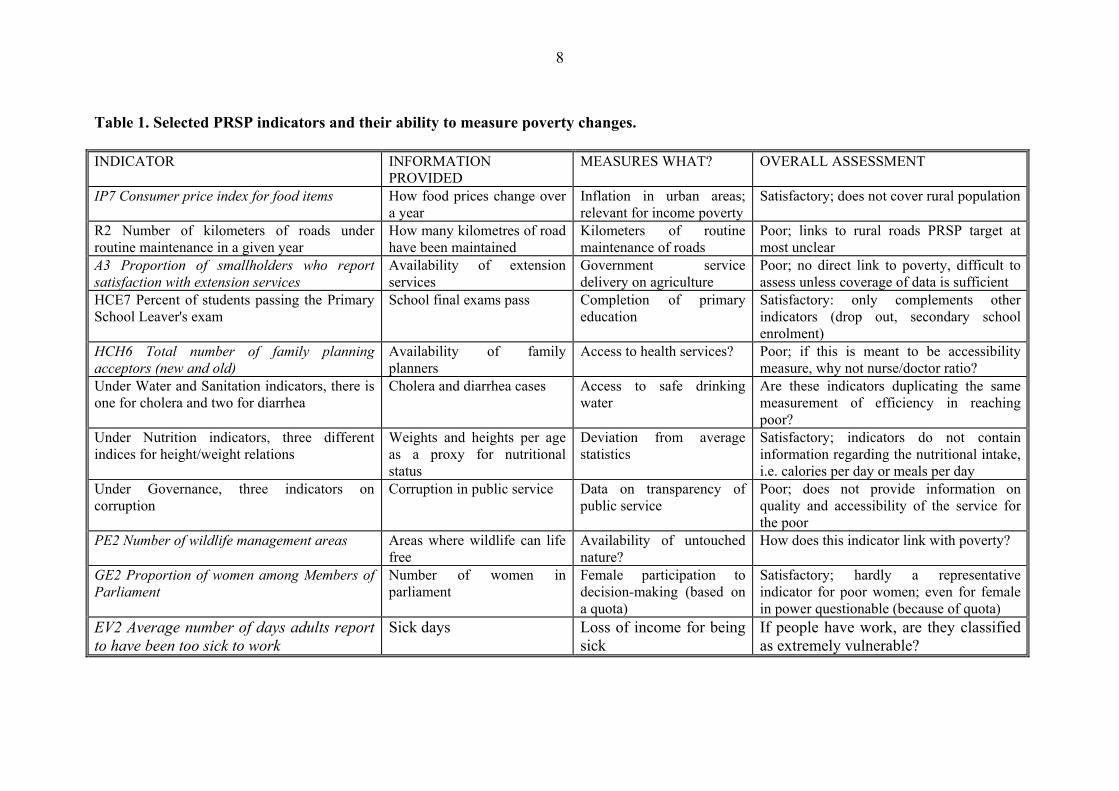
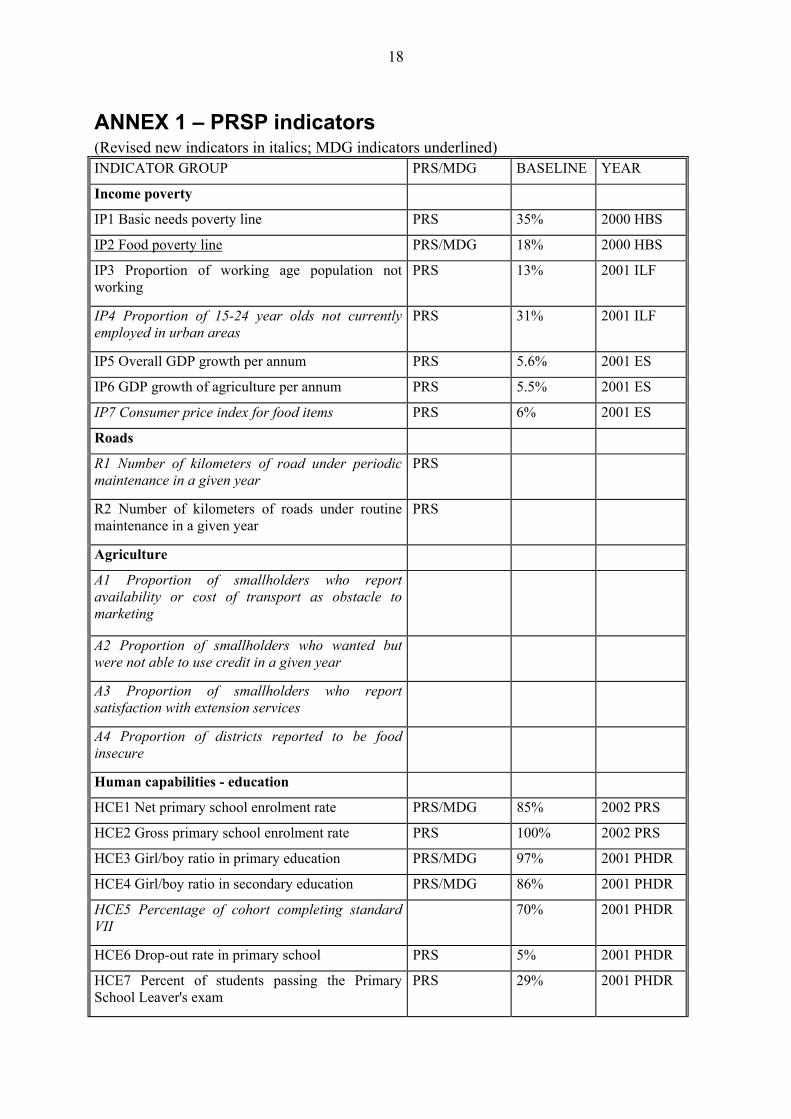
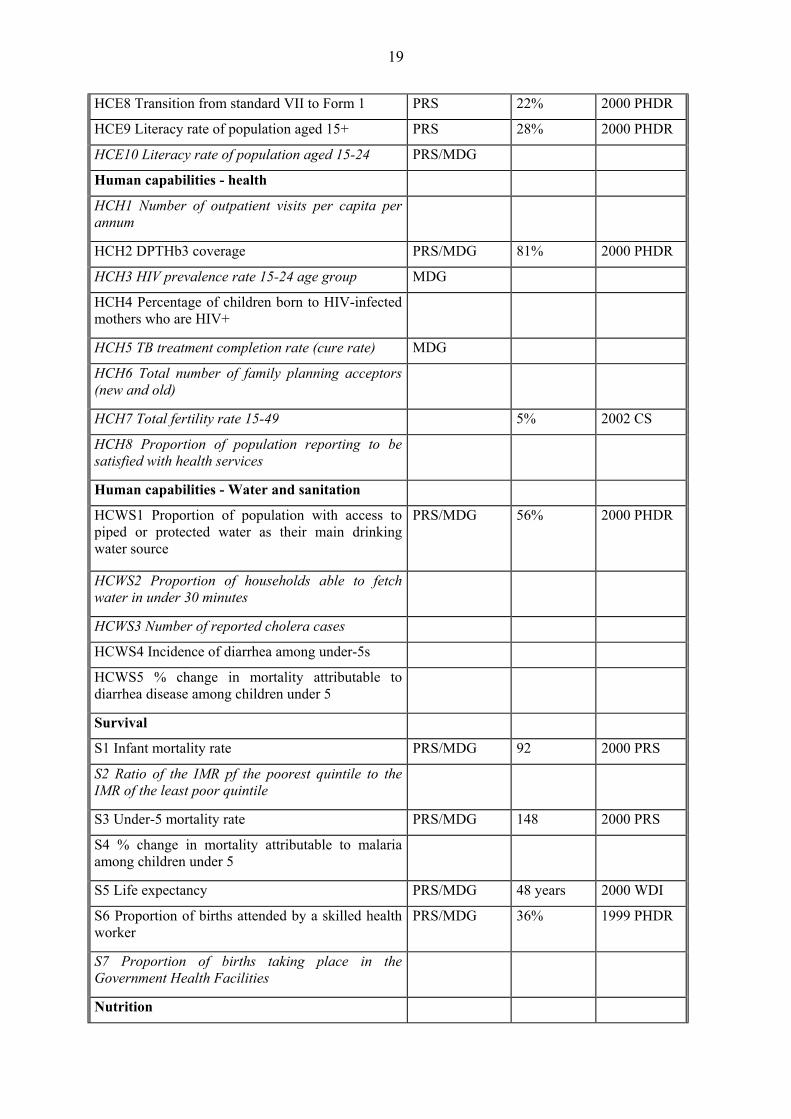
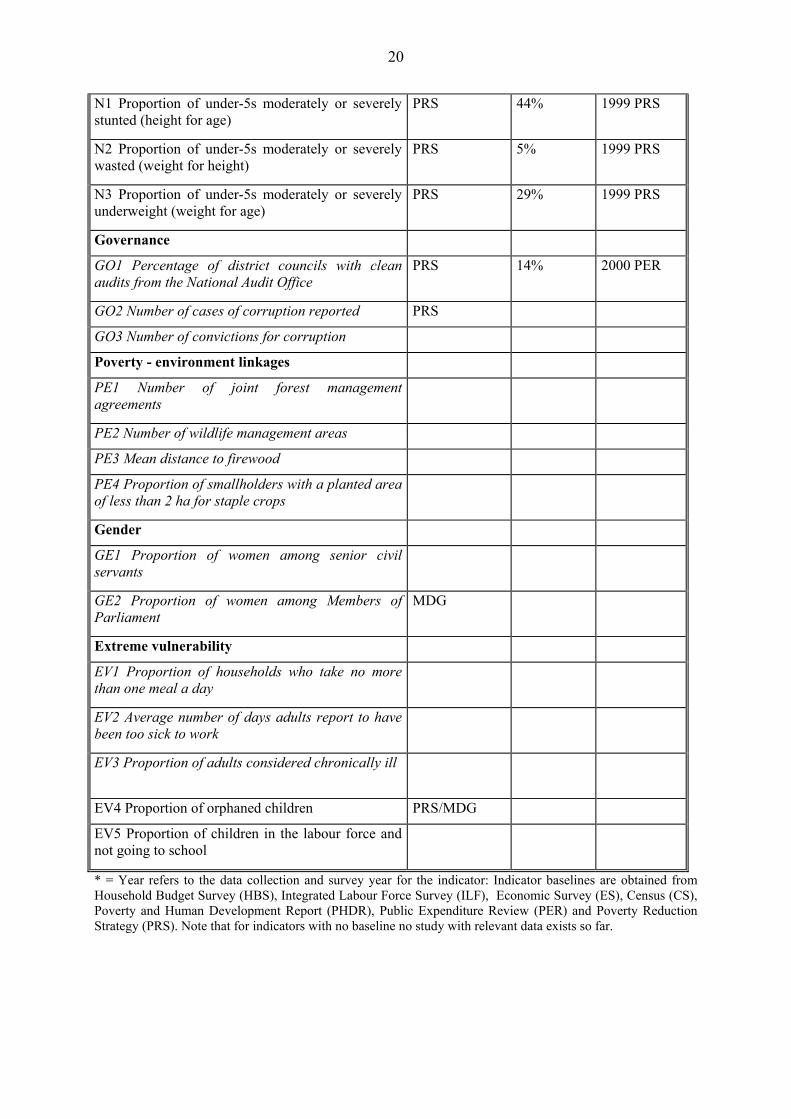
2 PRSP Monitoring and Indicators Tanzania has individually chosen to deviate from the list of Millenium Development Goals (MDG) and to create its own national list of monitoring indicators under the Poverty Monitoring System. To some extent this shift has been a logical course of action, resulting from the country’s own long-term development targets and the difference in medium term needs for development in Tanzania as opposed to the long term targets of MDGs, but this has not been without its problems. First of all, this makes comparisons of poverty situation in Tanzania with respect to other countries difficult. Second, the list of MDG indicators appears to a one well structured; Tanzania has struggled with its PMS indicators and is still in the process of formulating the already revised list of indicators, now in terms of environmental indicators. PRSP indicators have been subject to revision, because they have not been comprehensive enough from the beginning in terms of their coverage. Currently the environmental indicators are under a review with some UNDP led consultancy expected to take place later this year. Annex 1 contains a full list of PRSP indicators. How well are PMS indicators suited for the purposes of poverty monitoring? As discussed, the list has been developed and processed quite substantially, but it leaves some major issues uncovered. Some of the indicators also have questionable contribution to their main task, i.e., the measurement of poverty changes. Some critically selected examples of indicators and what they measure are provided in Table 1. Table 1 first presents the indicator, then the information it contains and what it is supposed to measure. This is followed by an assessment of how well it describes the phenomena it is supposed to measure. In Table one indicator from each group of indicators is chosen for analysis or in some cases multiple, when the indicators seem to measure same problem. As shown in Table 1, there are a number of indicators, which poorly make a link between the indicator and reduction in poverty. Some of the indicators seem remotely attached to PRSP in the first place, as making the link between PRSP expenditure and the indicator seems a difficult task. This being said, majority of the PRSP indicators are clearly poverty related and measure the PRSP expenditure as well. However, from the point of view of shifting towards process and outcomes indicators all in one monitoring system it is necessary to understand what can and what cannot be achieved with the use of current PMS indicators. There are areas such as agriculture and environment, where new indicators are likely to emerge shortly, as there is related work going on in these areas.
8
Table 1. Selected PRSP indicators and their ability to measure poverty changes. INDICATOR INFORMATION
PROVIDED MEASURES WHAT? OVERALL ASSESSMENT
IP7 Consumer price index for food items How food prices change over a year
Inflation in urban areas; relevant for income poverty
Satisfactory; does not cover rural population
R2 Number of kilometers of roads under routine maintenance in a given year
How many kilometres of road have been maintained
Kilometers of routine maintenance of roads
Poor; links to rural roads PRSP target at most unclear
A3 Proportion of smallholders who report satisfaction with extension services
Availability of extension services
Government service delivery on agriculture
Poor; no direct link to poverty, difficult to assess unless coverage of data is sufficient
HCE7 Percent of students passing the Primary School Leaver's exam
School final exams pass Completion of primary education
Satisfactory: only complements other indicators (drop out, secondary school enrolment)
HCH6 Total number of family planning acceptors (new and old)
Availability of family planners
Access to health services? Poor; if this is meant to be accessibility measure, why not nurse/doctor ratio?
Under Water and Sanitation indicators, there is one for cholera and two for diarrhea
Cholera and diarrhea cases Access to safe drinking water
Are these indicators duplicating the same measurement of efficiency in reaching poor?
Under Nutrition indicators, three different indices for height/weight relations
Weights and heights per age as a proxy for nutritional status
Deviation from average statistics
Satisfactory; indicators do not contain information regarding the nutritional intake, i.e. calories per day or meals per day
Under Governance, three indicators on corruption
Corruption in public service Data on transparency of public service
Poor; does not provide information on quality and accessibility of the service for the poor
PE2 Number of wildlife management areas Areas where wildlife can life free
Availability of untouched nature?
How does this indicator link with poverty?
GE2 Proportion of women among Members of Parliament
Number of women in parliament
Female participation to decision-making (based on a quota)
Satisfactory; hardly a representative indicator for poor women; even for female in power questionable (because of quota)
EV2 Average number of days adults report to have been too sick to work
Sick days Loss of income for being sick
If people have work, are they classified as extremely vulnerable?
9
As can be seen, some of the indicators cannot really be considered effective in measuring the impact of PRSP on poverty, but they resemble more traditional indicators used to analyse investments. This means that the focus is on quantifiable impacts of the expenditures rather than on quality improvements1. Of particular concern is the rural roads initiative, currently measured by two indicators, neither of which produces a link between the investment and poverty reduction. At best these indicators could be classified as process indicators, stating what proportion of expected road maintenance and construction work has taken place under a given period of surveillance. What could be done is to move the current indicators, both focusing on the kilometres of road produced, to actions monitoring and to utilise alternative indicators for output monitoring. For instance, access to markets could be measured using a gravity model of Tanzania (a demographic map combined with existing road and rail network), with which the relative distance of people and market places could be mapped, as well as time distance between rural and urban areas. Such measure would be a more illustrative one of the relative position of the poor with respect to work and trade opportunities. At the moment, the PRSP indicators on rural roads do not give any information on the poverty impact of rural roads initiative under PRSP. Clearly, the current PMS can be hardly covering the poverty reduction outcomes of PRSP policies due to the unclear measurement of developments by the set of indicators. It is beyond the scope and resources of this mission to revise the PMS indicators, but some suggestions emerge from the look into the process of combining actions with outcomes. These questions will be revisited in Chapter 4.
3 PAF Monitoring and Indicators
3.1 Background The Government of Tanzania (GOT) has been working to improve donor coordination under the Tanzania Assistance Strategy (TAS) process, whereby GOT and development partners committed to improve aid effectiveness by ensuring reduced transaction costs of aid delivery. In addition, GOT and donors agreed under the TAS framework to move to systems and procedures that enhance accountability and transparency in the budget and financial management system. The Poverty Reduction Budget Support (PRBS) was initiated to provide direct budget support to the Government’s effort to reduce poverty. The PRBS was joined in 2002 by a new World Bank credit, the Poverty Reduction Support Credit (PRSC). (United Republic of Tanzania 2003b) 1 This view may be challenged with the fact that improvements in indicators such as enrolment ratios or number of students completing primary school etc. in fact relate to the fact that the quality of education has improved. However, these indicators can only indirectly address the quality improvements in education, as the main reasons for improved indicators tend to be elsewhere. Massive investments in physical infrastructure in primary education have contributed to an increase in access to education, higher enrolment leads to higher completion of schooling etc. These changes may attribute to improved motivation and physical condition of teachers as well, but these links will be difficult to verify.
10
The main aim of the PRBS/PRSC has been to coordinate development assistance from donors supporting the poverty reduction strategy of the Government of the United Republic of Tanzania through direct budget support. According to the World Bank (2004), the PRBS is an integral part of the Government of Tanzania’s budgeting and priority setting process. There is some controversy related to the formulation of the PAF from this perspective, as it appears to be still a process very much driven by donors, regarding the content and timing of activities. Still, as an expressed wish the Government and the donors would like to see a further development of the PRBS into an even more general framework for such support and dialogue. To some extent this could be interpreted as one way of consolidating various assistance efforts (including project and programme assistance), in addition to most of the direct support that is already disbursed within PRBS/PRSC framework. The PRBS/PRSC is open for contribution and participation by all donors and financial institutions that are providing or considering providing budgetary support. The intention is to manage all existing and future budgetary support from bilateral and multilateral donors through the PRBS facility in order to reduce transaction costs and to harmonize performance benchmarks and dialogue within the poverty reduction process. Both Government and donors are of the opinion that all existing and future direct budgetary support interventions should harmonised into one common framework. This opinion is of importance, as it emphasises the need to shift from individual actions by donors (which are already becoming a smaller number as more donors agree on direct budget support) to common financial system. Once this has been achieved, monitoring the process should be harmonised too to reduce the need to produce separate reports for various actors. This is consuming key local capacity to the extent that normal administrative duties can suffer from various overlapping processes occupying the key staff.
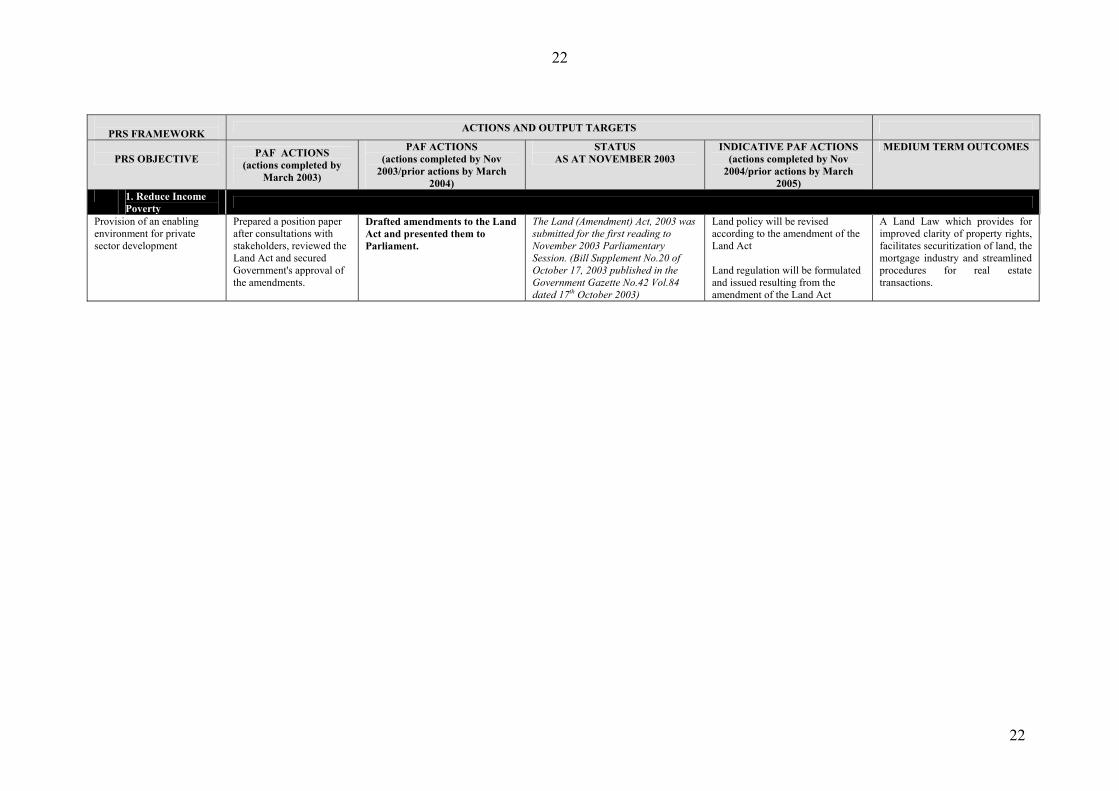
3.2 PAF actions Performance Assessment Framework is different from the PRSP indicators and monitoring system. The most recent PAF matrix is presented in Annex 2. The PAF is structured around PRSP objectives, under which there is a list of completed PAF actions, indicative and tentative PAF actions and assessment of medium term outcomes of the actions. As explained in the introduction, PAF actions focus on enabling the policy environment for PRSP activities. This means that rather than focusing on the outcomes (as the PMS) or the inputs (as the PER) PAF actions focus on improving legislative frameworks and policy documents. One is tempted to conclude that PAF is “much talk, little action” from the looks of it2, as even the outcomes of actions are measured as “enabling, increased, improved, more efficient, enhanced, simplified” etc. procedures, without specified target levels, at least not in the PAF matrix. Within the PRSC2 concept note by the World Bank (2003), there is a list entitled “proposed indicator list for PRS/PRBS/PRSC performance assessment”. Incidentally, this list appears to correspond to PMS list of indicators, presented in Annex 1. This means that the PRBS and
2 The very purpose of the PAF is to focus on policy/legislative environment and not monitoring poverty reduction outcomes. However, because the follow-up mechanisms of these actions are not very effective, assessing the impact of these changes on PRSP implementation is not straight-forward.
11
PRSC outcomes are monitored with PRSP monitoring system, which raises the question of why cannot other parts of the PRSP monitoring be used in the similar way? Perhaps the main issue with respect to harmonisation of monitoring procedures is to what extent a system such as PAF could be modified to still be a performance assessment tool but more firmly linking the actual inputs to actual outcomes. This question is explored in more detail in the following chapter.
4 Harmonisation of the monitoring framework It is necessary to look at the possibilities to use PRSP indicators to also assess the PRBS/PRSC monitoring needs. So far, little effort has taken place to integrate the two systems, despite the evident advantages of such integrated measure: timeliness, comprehensiveness and management issues among others. The exercise presented in this chapter starts from the assumption that the PRSP indicators serve as the starting point for a harmonised system, as they are also closely linked to other substantial goals and targets such as Vision 2020 and Millenium Development Goals (MDG). Discussions that evolves around the possibilities to harmonise the monitoring frameworks can be summarised in a simplistic form with focus on Routine Data collection. Problems associated with RD have been documented in numerous recent papers (Nokkala 2003, PO-RALG and VPO 2004, United Republic of Tanzania). Routine Data refers to data gathered by authorities for administrative purposes, which can be used for other purposes, such as to support the PMS. Why has routine data collection process been a failure within PMS? There are a number of possible reasons for this (PO-RALG and VPO 2004):
• Data collected are unreliable • Different data collection methods in different sectors • Data collectors have no incentives to ensure data quality • No systematic data collection method/Parallel systems of data collection • No identified responsibility for data verification • Timeliness of data system is poor • Lack of technology, particularly at lower levels • Lack on interest in using data • Resource constraints
Given the list of problems, it is clear that no short-term solution to problems with RD exists. This may act as a justification for keeping the PAF process running to monitor PRSP actions. However, the advantages that could be gained by improved RD system are too numerous to be disposed off due to problems in the data collection. Thus, it would be perhaps more sustainable in the long run to consider allocating current PAF resources to improving RD collection and processing. However, one thing should be kept in mind: PAF and RD operate in opposite directions. This means that whilst PAF focuses on the policy level changes RD produces grass root level data of policy changes. Monitoring changes in the policy framework through RD is not necessarily controversial, as this would show the impacts of the changes in policy framework. Perhaps an example of the new integrated monitoring system can best illustrate the possibilities that the combination of routine administrative data and selected indicators can
12
offer. Education, for instance, is a sector, which combines qualitative and quantitative targets, particularly if and when aid effectiveness is considered3. In education, starting from the PER point of view, expenditures can be broken down by budget lines and further decomposed to development and recurrent expenditures. Development expenditures are used to construct physical infrastructure (schools, classrooms etc.), whereas recurrent expenditures cover salaries and maintenance, e.g., operating costs. These expenditures can be tracked at least to school level, if each school has a separate account and bookkeeping. At this point, however, the discussion severely moves to the area of “if”. Expenditures that have been disbursed by the MOF should be tracked to individual schools, where they should be decomposed at least to operating and investment budget. Setting up a system like this is not a problem in theory, but for whatever reason this flow of information does not exist. Focusing on the outcomes side, there are some key areas where routine data can provide all the information needed. School enrolment rates, net and gross, should be a standard information gathered by each school (after all, in principal schools should have incentives to know who goes there and who does not). School reports, in the beginning of the year and at the end of the year should record this information, as well as numbers of graduates and teachers and the salaries paid to them and results of the graduate exams. All this information, to be submitted timely and compiled at the district level, should be forwarded to Ministry of Education and, after consistency checks, further to MOF and VPO. This information would be used to:
• Explain the Ministry of Education expenditures in the year • Provide MOF detailed expenditure data, if necessary at district or even school level • Monitor key PRSP indicators (enrolment, literacy rate etc.); and • To plan the upcoming year’s resource envelope (information on average salaries,
increases in enrolments, changes in investment levels etc.) As can be seen, the responsibility for gathering the information in this system is on the institution responsible for the actual expenditure. This is logical as they are also in the position to best account for the expenditures. However, as demanding even simple accounting skills from a school is stretching the local capacity, the arrangement could be perhaps most efficient if certain amount of schools were pooled together and accounting work was carried out by a qualified accountant, independent or within the Ministry of Education organisation. This example has made a link between expenditures, processes and outcomes, but deviates from the PAF actions monitoring in the sense that it moves towards practical operationalization of the PRSP expenditure, away from the policy context. It can be questioned at which level the actions should be monitored, but in the end it comes to the level of individual unit of expenditure how the money available is spent. Perhaps, when the policy level framework has reached a satisfactory level the actions monitoring should move to follow the PRSP expenditure. Consider another example, from the rural roads. The government is using a lot of labour-based construction in the roads sector, to link growth, PRSP priority sector and employment generation together. Rural roads expenditures are Ministry of Works or PO-RALG expenditures under PRSP on roads construction, particularly in the rural context. This 3 Aid effectiveness here refers to the improved impact of development assistance, in terms of translating 1 USD of ODA into growth and poverty reduction. Recent trend has been that less aid has been available but it has been used more effectively. There is no question that this consideration should not be a priority in targeting pro-poor expenditures in Tanzania by allocating scarce funding to where it can produce the biggest impact.
13
expenditure should focus on two components, again recurrent (salaries and maintenance) and investment components. In the context of rural roads, maintenance expenditure, when sufficient, is the status quo of the sector. The investment part will then show the improvement in access of the poor to markets, but without sufficient maintenance the overall condition of the road network cannot improve. Once used in projects4, the investments translate into kilometres of roads constructed and into employment effects. To document the poverty impact, the project needs to do the following: produce employment data sheets, with staff and salaries paid documented, as well as progress reports on the work. This information, together with a gravity map of the road network, should be used to assess the macrolevel impact of the road construction, through the accessibility changes. This is because a measure is needed to translate the roads constructed into poverty impact5. Other ways of studying the poverty impact include household budget surveys in the areas where roads are constructed and benefit-incidence studies. However, these are more time-consuming and costly measures, so relying on data produced by the project together with a measure of accessibility should be sufficient. These two examples, from different PRSP priorities, have in a way of presenting stylised facts sketched two approached to produce PRSP monitoring information. As the examples show, no real magic is required to translate standard reporting into concrete monitoring process. In fact, with the work that is taking place to support PO-RALG (for instance by JICA), availability of computer services at PO-RALG offices should make it possible to compile data and send it to the higher levels of administration.
5 Summary of findings It is clear that for the time being efforts to harmonise the monitoring of actions (processes) and outcomes (PRSP indicators) will be limited by the principal question of are we able to generate reliable information in sufficient amounts and with reasonable intervals using other monitoring and data collection mechanisms? At this point, the answer will remain no, for various reasons:
1. Within donor community there are concerns regarding the execution of policies and programs. These concerns are somewhat reflected in the PAF, which appears like a count of donor promoted efforts, a form of track record. Whilst PAF is a process owned by the Government of Tanzania, the contents seem to reflect actions that a lot of other actors feel should be done in order to improve PRSP implementation. This is not necessary a bad thing, but this back casting exercise is somewhat duplicating other efforts, such as PER and PRSP progress reports. On the other hand, this also means that the possibilities to utilise PAF as a forward-oriented process monitoring system
4 Under rural roads expenditure, dividing the expenditure into individual projects makes sense. This because allocation of funds should be done in a way that most effectively ensures road construction, which is usually through focusing on a particular investment (e.g., a project) at a time instead of flat rate allocation of funds to all the districts. However, the expenditures should be based on national strategy. 5 There is no empirical evidence that a road constructed automatically generates growth and translates into poverty reduction. This is because the location of the road and the ways in which it connects a point to other parts of network are the determinants of the economic impact of the road.
14
are limited because as such it contains material covering past actions, which makes the system appear heavy and somewhat bureaucratic.
2. At the moment no other system, including the PMS, is able to provide us information
regarding the processes. In an ideal situation one could utilise administrative data to produce information of the processes, but unfortunately at the moment this kind of data is not available. One would be tempted to say that routine data collection under PRSP could be streamlined to produce the required monitoring, but given the documented problems with routine data this is hardly a possible outcome in the near future. However, as the examples in Chapter 4 have shown, there is a clear opening for the routine data to step up and become a part of the PRSP monitoring, which would make the link between expenditures and outcomes.
3. Shift from PAF actions monitoring to mainstreamed process monitoring within PMS
will be a crucial process for two reasons. First, if the transition fails, there are problems arising from lack of information and unavailability of reliable data. Second, the whole purpose of the move to harmonise practices and systems would fail, which would be even more severe from the point of view of architecture and design of the PMS system. It should be also emphasised that most likely the outcome or creating a new system would not resemble the current PMS, since the process monitoring would require other tools than simply a set of output indicators, which would emphasise the role of improved surveys and analytical work.
4. The relationship between PMS and MDG indicators remains unsatisfactory, because
the PMS indicators as they currently are do not adequately address the poverty impact of PRSP policies When the indicators are revised there may be a need to revisit the MDG list of indicators too, particularly in the areas where PMS indicators fail to probably account for poverty impacts of policies.
However, there is no reason to believe that in the future Tanzania could not have an integrated system to combine data from various sources to produce PRSP monitoring and evaluation data. In the next section, some suggestions for next actions are given in order to further improve the framework for improved poverty monitoring.
6 Next steps Despite the fact that some donors seem to hesitate to move away from the PAF as a separate instrument of process monitoring, there is clearly understanding that this will take place some day, if not in the immediate future. An action plan for the next activities could look as follows:
• Within like-minded donor community, discuss the requirements for monitoring (baseline; consisting of agreed data to cover the starting point, monitoring; to ensure that process indicators in the future could be produced within PRPS and PMS, and forecasting; what are the expected outcomes of the expenditures based on the resource envelope) the PRSP and public expenditure. Based on these discussions, produce a timetable and process chart for actions. The process is and must be government led, but it should be understood that the pressure created by donor community to monitor
15
the budget support is going to drive or at least steer the process. In this respect, demands arising from the donor community will feed into the work of the government.
• Government institutions responsible for various parts of the monitoring work should
be actively engaged in designing the new framework of indicators and in producing the information required for monitoring purposes. This is something that is not new, but it should be stressed that some of the key institutions involved in the processes lack the capacity to actively participate into developing the new system. Current problems with limited capacity should be taken seriously, including the VPO, Ministry of Finance and other relevant institutions.
• More thorough and broad based research into the design of the monitoring framework
for PRSP2, particularly to indicators and sources of information to be utilised is required. What is needed is work on understanding the growth-poverty linkages and how the outcomes in terms of poverty reduction are shown. For instance, some indicators currently have very little, if anything to do with addressing changes in poverty, yet they are indicators within the PMS. This development work could be most effective, when it would be carried out as a joint effort of donor community and the responsible bodies of the United Republic of Tanzania. The example of the framework, which was presented in Chapter 4 could be used as a framework, or more sophisticated approaches could be developed.
• We are far from the situation, where Tanzanian authorities could produce data, which
could be used to both process and outcome monitoring. Examples of such systems exist in developed countries, where government has set up autonomous monitoring units. In Tanzania, developing an institution like National Audit Office to carry out these duties in a comprehensive manner could be a solution to this problem. NAO lacks at the moment the capacity to function as a major internal auditing unit, whose purpose is to critically analyse the functioning of government bodies, regarding their expenditures, organisational development and outputs. Is Tanzania ready for such an internal auditing unit?
This list of steps to be taken is not a comprehensive one, as the current processes are changing towards a greater degree of harmonisation. Other strategies than those presented in this paper could be pursued as well, but this paper has started from the most elementary, yet efficient package of actions to achieve the target of harmonised monitoring. In every case, to work such a system will require a substantial dialogue and clarification of responsibilities between key actors, the VPO, MOF and line ministries. This also reflects the importance of understanding the linkages between PRSP expenditures, growth and poverty reduction. At the moment, such information is centered around few individuals, most at the VPO, so a broad consultation with other stakeholders will be needed to motivate other institutions to contribute to PRSP monitoring.
16
References
Documents consulted Cooksey, B. and M. Mamdani (2004). Research on Poverty Alleviation. Summary of
conclusions from recent research and synthesis of key issues on poverty in Tanzania. Ministry of Finance (2003). The Performance Assessment Framework for PRBS/PRSC.
Annual PAF Review, November 2003. Nokkala, M. (2003). Tanzania Poverty Reduction Strategy (PRS) process and Poverty
Monitoring System (PMS). Fact Finding Mission Report. Dar Es Salaam, October 20-28, 2003 Final Report, November 17, 2003.
President’s Office Regional Administration and Local Government and Vice President’s
Office (2004). Strategy for the Rationalization of Routine Data Systems for Poverty Monitoring. Paper prepared by the Routine Data Technical Working Group of the Poverty Monitoring System of Tanzania.
United Republic of Tanzania (2000). Tanzania PRSP 2000/01. United Republic of Tanzania (2001a). Poverty Monitoring Masterplan. Dar Es Salaam,
December 2001. United Republic of Tanzania (2002a). Measuring Poverty Reduction. Understanding
Tanzania’s Poverty Monitoring System. Poverty Eradication Division, Vice President’s Office. August 2002.
United Republic of Tanzania (2003a). Poverty Reduction Strategy. The Second Progress
Report 2001/02. Dar Es Salaam, March 2003. United Republic of Tanzania (2003b). Tanzania. Joint PRBS and PRSC Review. Review
Report. Final Draft 20.12.03. United Republic of Tanzania (2004). Plan for the Review of the Poverty Monitoring System.
Dar es Salaam, April 2004. Vice President’s Office (VPO) (2003). Proposed Action Plan for the Poverty Reduction
Strategy Review. Draft 1 for Consultation with Stakeholders. 7th October 2003. World Bank (2003a). Tanzania: Poverty Reduction Strategy Paper Progress Report and Joint
IDA-IMF Staff Assessment of the PRSP. Report No. 25859. Poverty and Reduction and Economic Management 2. Africa Region. Washington, D.C.
World Bank (2003b). Tanzania: Poverty Reduction Support Credit and Grant Program
Document. Report No. 25807-TZ. Poverty and Reduction and Economic Management 2. Africa Region. Washington, D.C.

17
World Bank (2004). Program document for a proposed credit in the amount of SDR [xx]
million (USD $ 150 equivalent) to the United Republic of Tanzania for a Poverty Reduction Support Credit. Draft. Washington, D.C.
People met Embassy of Denmark Ms. Jytte Laursen, Economist, April 1 Vice President’s Office (VPO) Mr David Howlett, Environmental Advisor (UNDP), March 30 Embassy of Finland Mr Martti Eirola, Embassy of Finland, various meetings Ms Sari Jormanainen, Embassy of Finland, various meetings World Bank Mr. Robert Utz, Team leader of the PRSC team, March 30 Unfortunately for the purpose of this report Mr Gerard Howe of DfID was unreachable during the mission. It is regretted his valuable views have not been available to supplement the findings presented in this paper. A set of key questions was emailed to Mr Howe on April 2, but he has not responded as of yet.
18
ANNEX 1 – PRSP indicators (Revised new indicators in italics; MDG indicators underlined) INDICATOR GROUP PRS/MDG BASELINE YEAR
Income poverty
IP1 Basic needs poverty line PRS 35% 2000 HBS
IP2 Food poverty line PRS/MDG 18% 2000 HBS
IP3 Proportion of working age population not working
PRS 13% 2001 ILF
IP4 Proportion of 15-24 year olds not currently employed in urban areas
PRS 31% 2001 ILF
IP5 Overall GDP growth per annum PRS 5.6% 2001 ES
IP6 GDP growth of agriculture per annum PRS 5.5% 2001 ES
IP7 Consumer price index for food items PRS 6% 2001 ES
Roads
R1 Number of kilometers of road under periodic maintenance in a given year
PRS
R2 Number of kilometers of roads under routine maintenance in a given year
PRS
Agriculture
A1 Proportion of smallholders who report availability or cost of transport as obstacle to marketing
A2 Proportion of smallholders who wanted but were not able to use credit in a given year
A3 Proportion of smallholders who report satisfaction with extension services
A4 Proportion of districts reported to be food insecure
Human capabilities - education
HCE1 Net primary school enrolment rate PRS/MDG 85% 2002 PRS
HCE2 Gross primary school enrolment rate PRS 100% 2002 PRS
HCE3 Girl/boy ratio in primary education PRS/MDG 97% 2001 PHDR
HCE4 Girl/boy ratio in secondary education PRS/MDG 86% 2001 PHDR
HCE5 Percentage of cohort completing standard VII
70% 2001 PHDR
HCE6 Drop-out rate in primary school PRS 5% 2001 PHDR
HCE7 Percent of students passing the Primary School Leaver's exam
PRS 29% 2001 PHDR
19
HCE8 Transition from standard VII to Form 1 PRS 22% 2000 PHDR
HCE9 Literacy rate of population aged 15+ PRS 28% 2000 PHDR
HCE10 Literacy rate of population aged 15-24 PRS/MDG
Human capabilities - health
HCH1 Number of outpatient visits per capita per annum
HCH2 DPTHb3 coverage PRS/MDG 81% 2000 PHDR
HCH3 HIV prevalence rate 15-24 age group MDG
HCH4 Percentage of children born to HIV-infected mothers who are HIV+
HCH5 TB treatment completion rate (cure rate) MDG
HCH6 Total number of family planning acceptors (new and old)
HCH7 Total fertility rate 15-49 5% 2002 CS
HCH8 Proportion of population reporting to be satisfied with health services
Human capabilities - Water and sanitation
HCWS1 Proportion of population with access to piped or protected water as their main drinking water source
PRS/MDG 56% 2000 PHDR
HCWS2 Proportion of households able to fetch water in under 30 minutes
HCWS3 Number of reported cholera cases
HCWS4 Incidence of diarrhea among under-5s
HCWS5 % change in mortality attributable to diarrhea disease among children under 5
Survival
S1 Infant mortality rate PRS/MDG 92 2000 PRS
S2 Ratio of the IMR pf the poorest quintile to the IMR of the least poor quintile
S3 Under-5 mortality rate PRS/MDG 148 2000 PRS
S4 % change in mortality attributable to malaria among children under 5
S5 Life expectancy PRS/MDG 48 years 2000 WDI
S6 Proportion of births attended by a skilled health worker
PRS/MDG 36% 1999 PHDR
S7 Proportion of births taking place in the Government Health Facilities
Nutrition
20
N1 Proportion of under-5s moderately or severely stunted (height for age)
PRS 44% 1999 PRS
N2 Proportion of under-5s moderately or severely wasted (weight for height)
PRS 5% 1999 PRS
N3 Proportion of under-5s moderately or severely underweight (weight for age)
PRS 29% 1999 PRS
Governance
GO1 Percentage of district councils with clean audits from the National Audit Office
PRS 14% 2000 PER
GO2 Number of cases of corruption reported PRS
GO3 Number of convictions for corruption
Poverty - environment linkages
PE1 Number of joint forest management agreements
PE2 Number of wildlife management areas
PE3 Mean distance to firewood
PE4 Proportion of smallholders with a planted area of less than 2 ha for staple crops
Gender
GE1 Proportion of women among senior civil servants
GE2 Proportion of women among Members of Parliament
MDG
Extreme vulnerability
EV1 Proportion of households who take no more than one meal a day
EV2 Average number of days adults report to have been too sick to work
EV3 Proportion of adults considered chronically ill
EV4 Proportion of orphaned children PRS/MDG
EV5 Proportion of children in the labour force and not going to school
* = Year refers to the data collection and survey year for the indicator: Indicator baselines are obtained from Household Budget Survey (HBS), Integrated Labour Force Survey (ILF), Economic Survey (ES), Census (CS), Poverty and Human Development Report (PHDR), Public Expenditure Review (PER) and Poverty Reduction Strategy (PRS). Note that for indicators with no baseline no study with relevant data exists so far.
21
21
Annex 2 The Performance Assessment Framework
TANZANIA
ANNUAL PAF REVIEW NOVEMBER 2003
4th December 2003 Ministry of Finance Dar Es Salaam
Notes: For the first annual cycle, all actions in the context of the Performance Assessment Framework (PAF) for PRBS/PRSC 1, including the Prior Actions (in bold) for PRSC 1 were to be completed no later than March 2003.
The Prior Actions for PRSC 2 (in bold) and the indicative Prior Actions (Triggers) identified For PRSC 3, will have to be fully accomplished/completed by March 2004 and March 2005, respectively, in order for successful negotiations and subsequent presentation of the relevant PRSC operation to the World Bank’s Board of Directors. All other Actions, would have had to be completed by no later than November, 2003 (PRBS/PRSC 2) and November, 2004 (PRBS/PRSC 3).
Substantive progress on the full set of actions is recognized as vital for continuation of the overall program of support to Tanzania. A broad-based review of the PAF Actions will be conducted in November of each year.
22
22
PRS FRAMEWORK ACTIONS AND OUTPUT TARGETS
PRS OBJECTIVE PAF ACTIONS
(actions completed by March 2003)
PAF ACTIONS (actions completed by Nov
2003/prior actions by March 2004)
STATUS AS AT NOVEMBER 2003
INDICATIVE PAF ACTIONS (actions completed by Nov
2004/prior actions by March 2005)
MEDIUM TERM OUTCOMES
1. Reduce Income Poverty
Provision of an enabling environment for private sector development
Prepared a position paper after consultations with stakeholders, reviewed the Land Act and secured Government's approval of the amendments.
Drafted amendments to the Land Act and presented them to Parliament.
The Land (Amendment) Act, 2003 was submitted for the first reading to November 2003 Parliamentary Session. (Bill Supplement No.20 of October 17, 2003 published in the Government Gazette No.42 Vol.84 dated 17th October 2003)
Land policy will be revised according to the amendment of the Land Act Land regulation will be formulated and issued resulting from the amendment of the Land Act
A Land Law which provides for improved clarity of property rights, facilitates securitization of land, the mortgage industry and streamlined procedures for real estate transactions.
23
23
PRS FRAMEWORK ACTIONS AND OUTPUT TARGETS
PRS OBJECTIVE PAF ACTIONS
(actions completed by March 2003)
PAF ACTIONS (actions completed by Nov
2003/prior actions by March 2004)
STATUS AS AT NOVEMBER 2003
INDICATIVE PAF ACTIONS (actions completed by Nov
2004/prior actions by March 2005)
MEDIUM TERM OUTCOMES
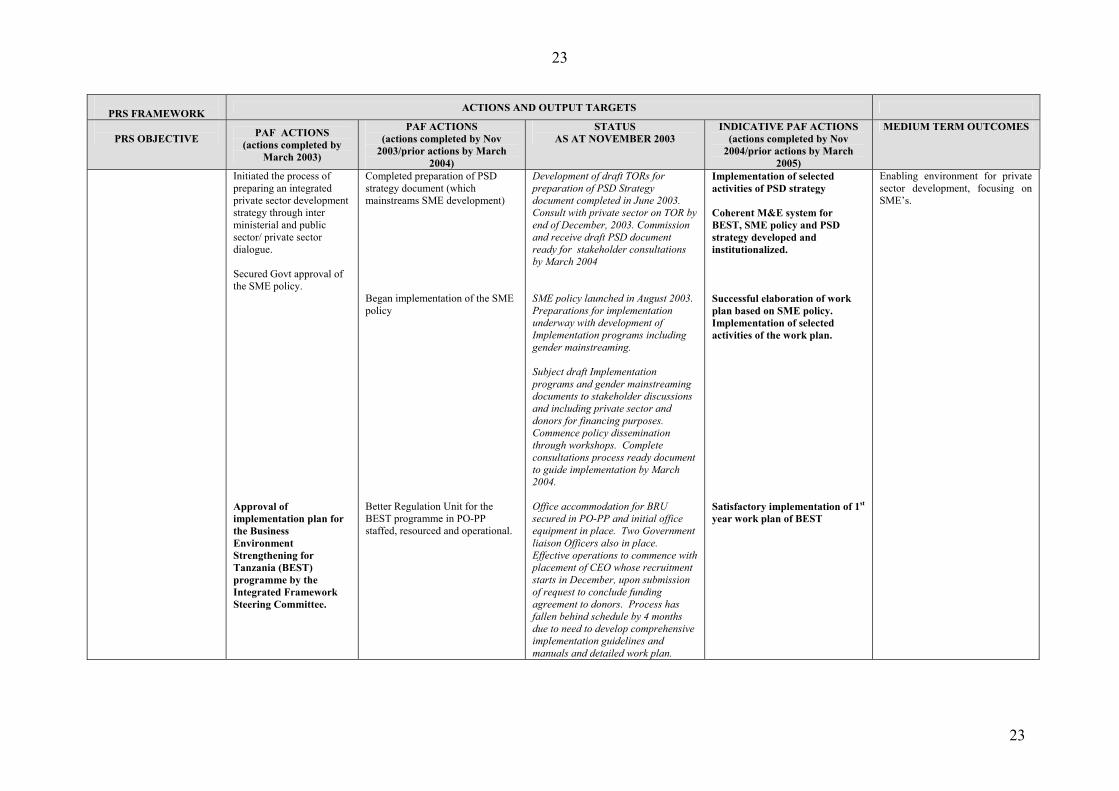
Initiated the process of preparing an integrated private sector development strategy through inter ministerial and public sector/ private sector dialogue. Secured Govt approval of the SME policy. Approval of implementation plan for the Business Environment Strengthening for Tanzania (BEST) programme by the Integrated Framework Steering Committee.
Completed preparation of PSD strategy document (which mainstreams SME development) Began implementation of the SME policy Better Regulation Unit for the BEST programme in PO-PP staffed, resourced and operational.
Development of draft TORs for preparation of PSD Strategy document completed in June 2003. Consult with private sector on TOR by end of December, 2003. Commission and receive draft PSD document ready for stakeholder consultations by March 2004 SME policy launched in August 2003. Preparations for implementation underway with development of Implementation programs including gender mainstreaming. Subject draft Implementation programs and gender mainstreaming documents to stakeholder discussions and including private sector and donors for financing purposes. Commence policy dissemination through workshops. Complete consultations process ready document to guide implementation by March 2004. Office accommodation for BRU secured in PO-PP and initial office equipment in place. Two Government liaison Officers also in place. Effective operations to commence with placement of CEO whose recruitment starts in December, upon submission of request to conclude funding agreement to donors. Process has fallen behind schedule by 4 months due to need to develop comprehensive implementation guidelines and manuals and detailed work plan.
Implementation of selected activities of PSD strategy Coherent M&E system for BEST, SME policy and PSD strategy developed and institutionalized. Successful elaboration of work plan based on SME policy. Implementation of selected activities of the work plan. Satisfactory implementation of 1st year work plan of BEST
Enabling environment for private sector development, focusing on SME’s.
24
24
PRS FRAMEWORK ACTIONS AND OUTPUT TARGETS
PRS OBJECTIVE PAF ACTIONS
(actions completed by March 2003)
PAF ACTIONS (actions completed by Nov
2003/prior actions by March 2004)
STATUS AS AT NOVEMBER 2003
INDICATIVE PAF ACTIONS (actions completed by Nov
2004/prior actions by March 2005)
MEDIUM TERM OUTCOMES
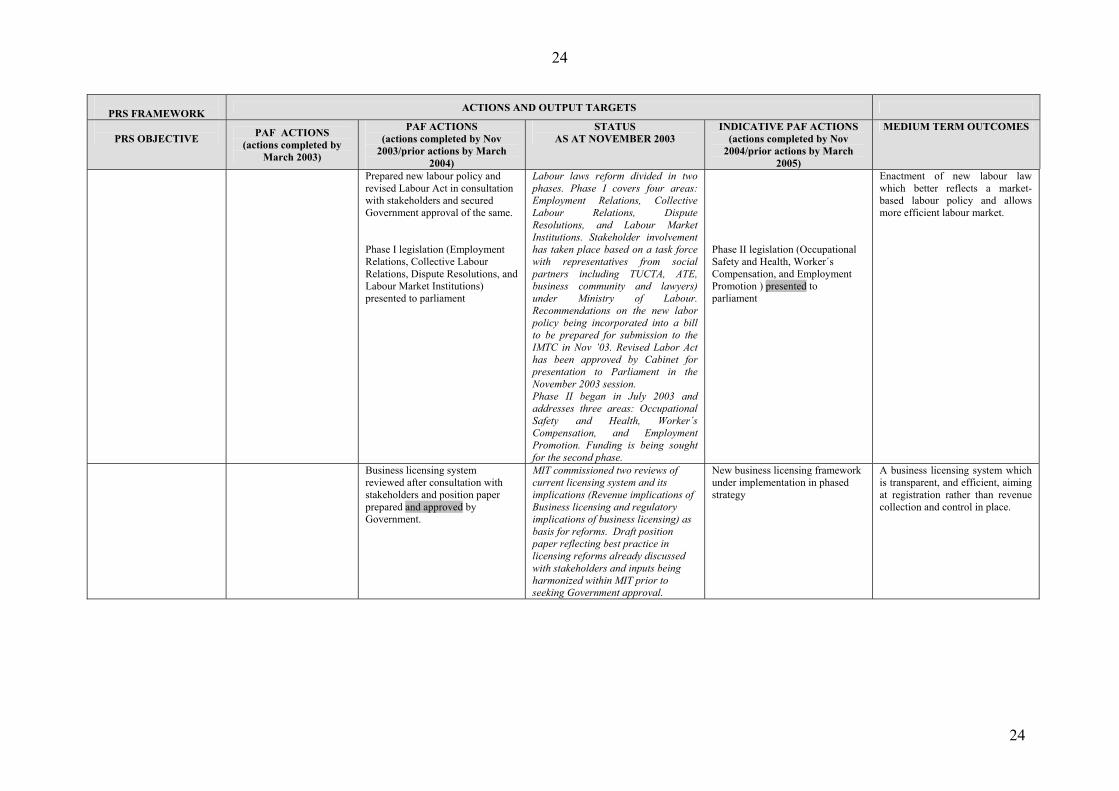
Prepared new labour policy and revised Labour Act in consultation with stakeholders and secured Government approval of the same. Phase I legislation (Employment Relations, Collective Labour Relations, Dispute Resolutions, and Labour Market Institutions) presented to parliament
Labour laws reform divided in two phases. Phase I covers four areas: Employment Relations, Collective Labour Relations, Dispute Resolutions, and Labour Market Institutions. Stakeholder involvement has taken place based on a task force with representatives from social partners including TUCTA, ATE, business community and lawyers) under Ministry of Labour. Recommendations on the new labor policy being incorporated into a bill to be prepared for submission to the IMTC in Nov ’03. Revised Labor Act has been approved by Cabinet for presentation to Parliament in the November 2003 session. Phase II began in July 2003 and addresses three areas: Occupational Safety and Health, Worker´s Compensation, and Employment Promotion. Funding is being sought for the second phase.
Phase II legislation (Occupational Safety and Health, Worker´s Compensation, and Employment Promotion ) presented to parliament
Enactment of new labour law which better reflects a market-based labour policy and allows more efficient labour market.
Business licensing system reviewed after consultation with stakeholders and position paper prepared and approved by Government.
MIT commissioned two reviews of current licensing system and its implications (Revenue implications of Business licensing and regulatory implications of business licensing) as basis for reforms. Draft position paper reflecting best practice in licensing reforms already discussed with stakeholders and inputs being harmonized within MIT prior to seeking Government approval.
New business licensing framework under implementation in phased strategy
A business licensing system which is transparent, and efficient, aiming at registration rather than revenue collection and control in place.
25
25
PRS FRAMEWORK ACTIONS AND OUTPUT TARGETS
PRS OBJECTIVE PAF ACTIONS
(actions completed by March 2003)
PAF ACTIONS (actions completed by Nov
2003/prior actions by March 2004)
STATUS AS AT NOVEMBER 2003
INDICATIVE PAF ACTIONS (actions completed by Nov
2004/prior actions by March 2005)
MEDIUM TERM OUTCOMES
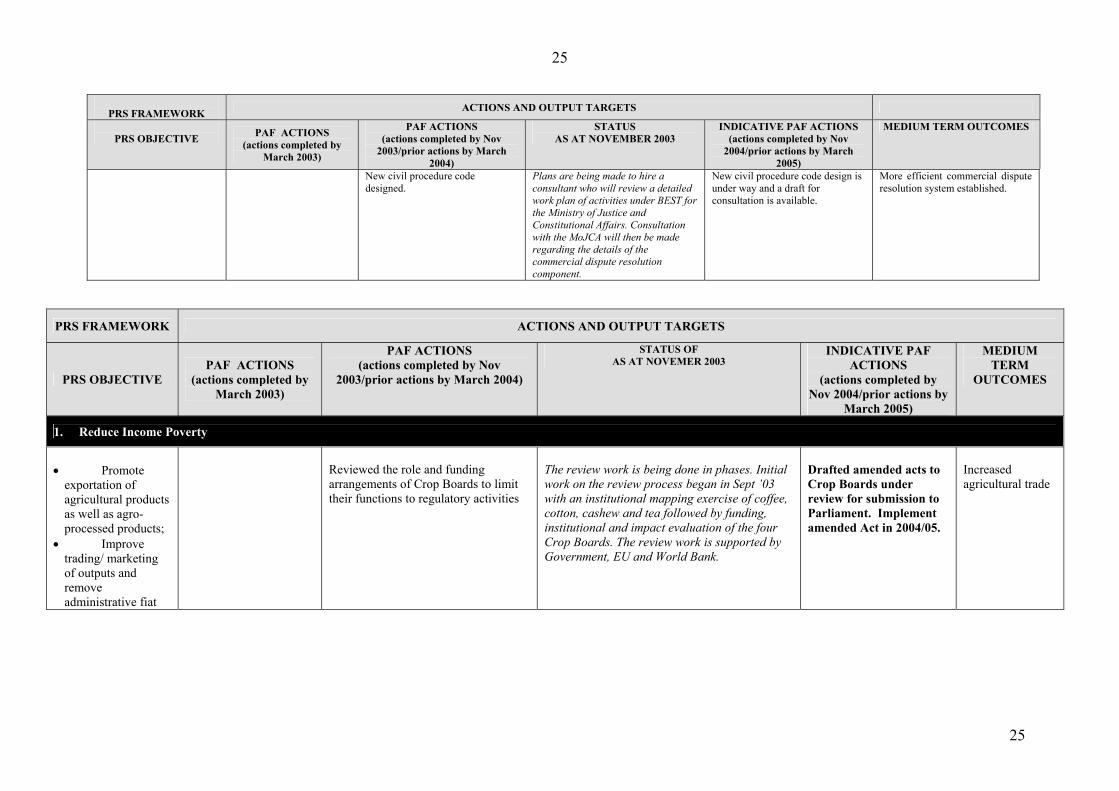
New civil procedure code designed.
Plans are being made to hire a consultant who will review a detailed work plan of activities under BEST for the Ministry of Justice and Constitutional Affairs. Consultation with the MoJCA will then be made regarding the details of the commercial dispute resolution component.
New civil procedure code design is under way and a draft for consultation is available.
More efficient commercial dispute resolution system established.
PRS FRAMEWORK ACTIONS AND OUTPUT TARGETS
PRS OBJECTIVE PAF ACTIONS
(actions completed by March 2003)
PAF ACTIONS (actions completed by Nov
2003/prior actions by March 2004)
STATUS OF AS AT NOVEMER 2003
INDICATIVE PAF ACTIONS
(actions completed by Nov 2004/prior actions by
March 2005)
MEDIUM TERM
OUTCOMES
1. Reduce Income Poverty
• Promote
exportation of agricultural products as well as agro-processed products;
• Improve trading/ marketing of outputs and remove administrative fiat
Reviewed the role and funding arrangements of Crop Boards to limit their functions to regulatory activities
The review work is being done in phases. Initial work on the review process began in Sept ’03 with an institutional mapping exercise of coffee, cotton, cashew and tea followed by funding, institutional and impact evaluation of the four Crop Boards. The review work is supported by Government, EU and World Bank.
Drafted amended acts to Crop Boards under review for submission to Parliament. Implement amended Act in 2004/05.
Increased agricultural trade
26
26
PRS FRAMEWORK ACTIONS AND OUTPUT TARGETS
PRS OBJECTIVE PAF ACTIONS
(actions completed by March 2003)
PAF ACTIONS (actions completed by Nov
2003/prior actions by March 2004)
STATUS OF AS AT NOVEMER 2003
INDICATIVE PAF ACTIONS
(actions completed by Nov 2004/prior actions by
March 2005)
MEDIUM TERM
OUTCOMES
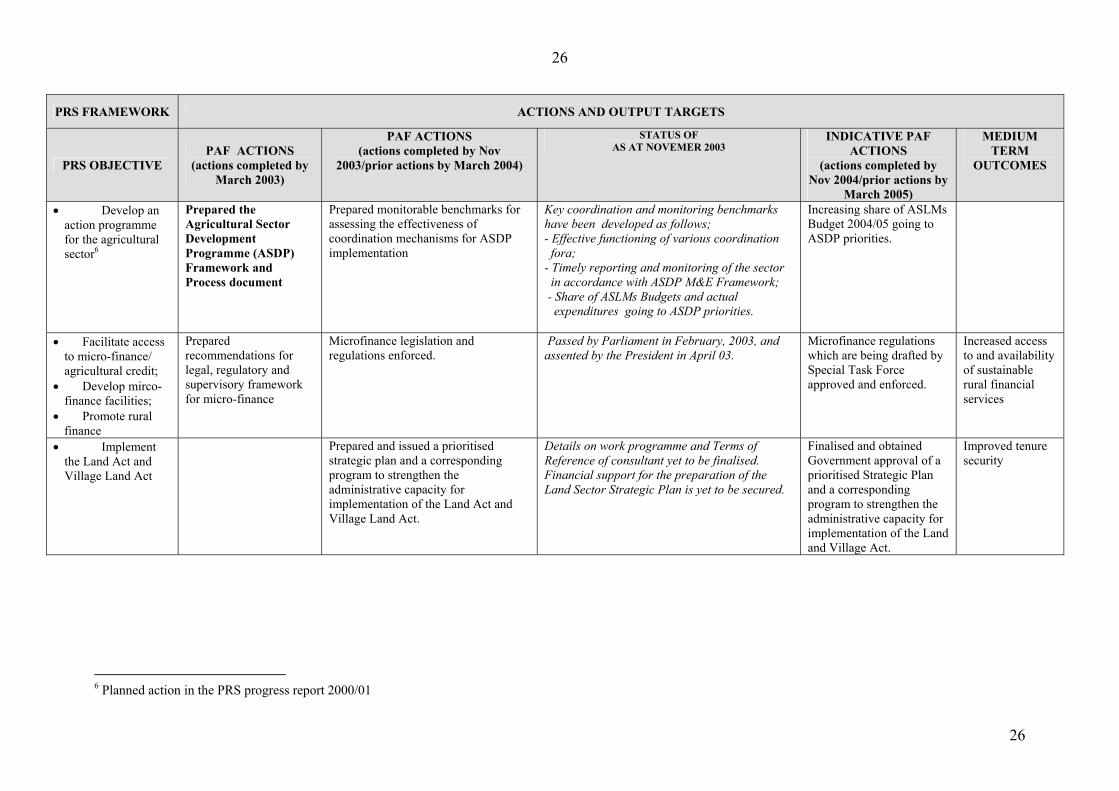
• Develop an action programme for the agricultural sector6
Prepared the Agricultural Sector Development Programme (ASDP) Framework and Process document
Prepared monitorable benchmarks for assessing the effectiveness of coordination mechanisms for ASDP implementation
Key coordination and monitoring benchmarks have been developed as follows; - Effective functioning of various coordination fora;
- Timely reporting and monitoring of the sector in accordance with ASDP M&E Framework;
- Share of ASLMs Budgets and actual expenditures going to ASDP priorities.
Increasing share of ASLMs Budget 2004/05 going to ASDP priorities.
• Facilitate access to micro-finance/ agricultural credit;
• Develop mirco-finance facilities;
• Promote rural finance
Prepared recommendations for legal, regulatory and supervisory framework for micro-finance
Microfinance legislation and regulations enforced.
Passed by Parliament in February, 2003, and assented by the President in April 03.
Microfinance regulations which are being drafted by Special Task Force approved and enforced.
Increased access to and availability of sustainable rural financial services
• Implement the Land Act and Village Land Act
Prepared and issued a prioritised strategic plan and a corresponding program to strengthen the administrative capacity for implementation of the Land Act and Village Land Act.
Details on work programme and Terms of Reference of consultant yet to be finalised. Financial support for the preparation of the Land Sector Strategic Plan is yet to be secured.
Finalised and obtained Government approval of a prioritised Strategic Plan and a corresponding program to strengthen the administrative capacity for implementation of the Land and Village Act.
Improved tenure security
6 Planned action in the PRS progress report 2000/01
27
27
PRS FRAMEWORK ACTIONS AND OUTPUT TARGETS
PRS OBJECTIVE PAF ACTIONS
(actions completed by March 2003)
PAF ACTIONS (actions completed by Nov
2003/prior actions by March 2004)
STATUS OF AS AT NOVEMER 2003
INDICATIVE PAF ACTIONS
(actions completed by Nov 2004/prior actions by
March 2005)
MEDIUM TERM
OUTCOMES
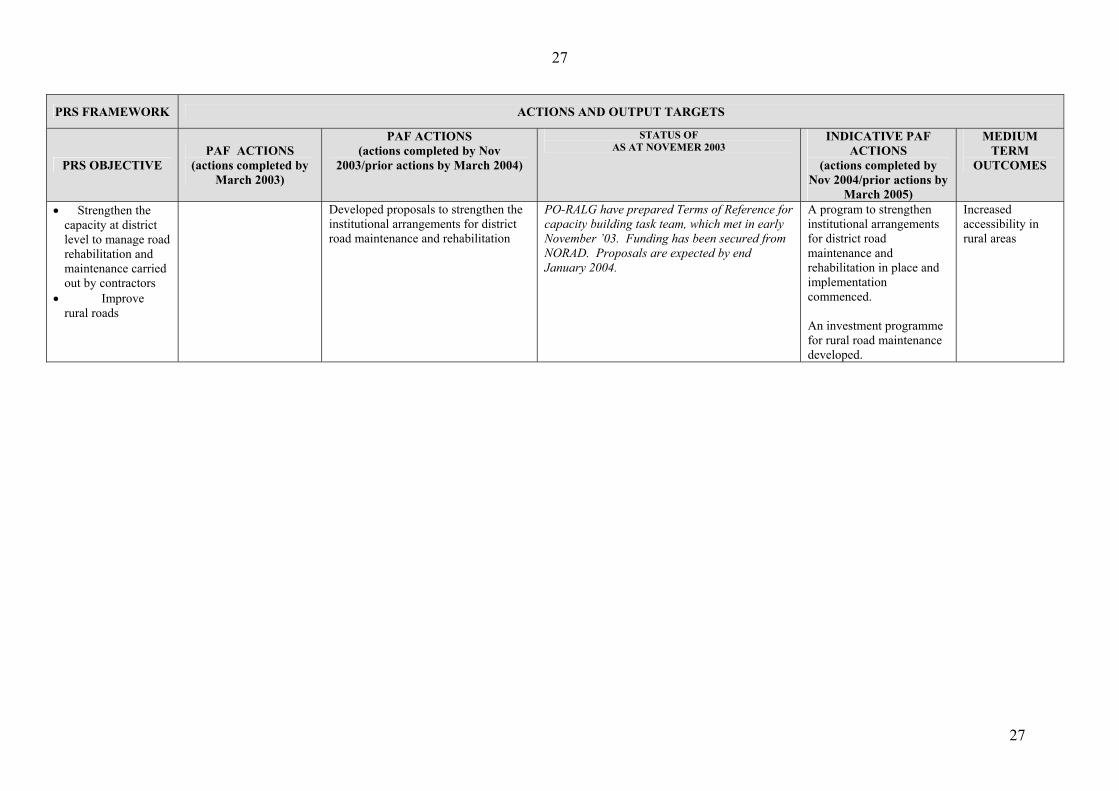
• Strengthen the capacity at district level to manage road rehabilitation and maintenance carried out by contractors
• Improve rural roads
Developed proposals to strengthen the institutional arrangements for district road maintenance and rehabilitation
PO-RALG have prepared Terms of Reference for capacity building task team, which met in early November ’03. Funding has been secured from NORAD. Proposals are expected by end January 2004.
A program to strengthen institutional arrangements for district road maintenance and rehabilitation in place and implementation commenced. An investment programme for rural road maintenance developed.
Increased accessibility in rural areas
28
28
PRS FRAMEWORK ACTIONS AND OUTPUT TARGETS
PRS OBJECTIVE PAF ACTIONS
(actions completed by March 2003)
PAF ACTIONS (actions completed by Nov
2003/prior actions by March 2004)
STATUS AS AT NOVEMBER 2003
INDICATIVE PAF ACTIONS (actions completed by Nov
2004/prior actions by March 2005)
MEDIUM TERM OUTCOMES
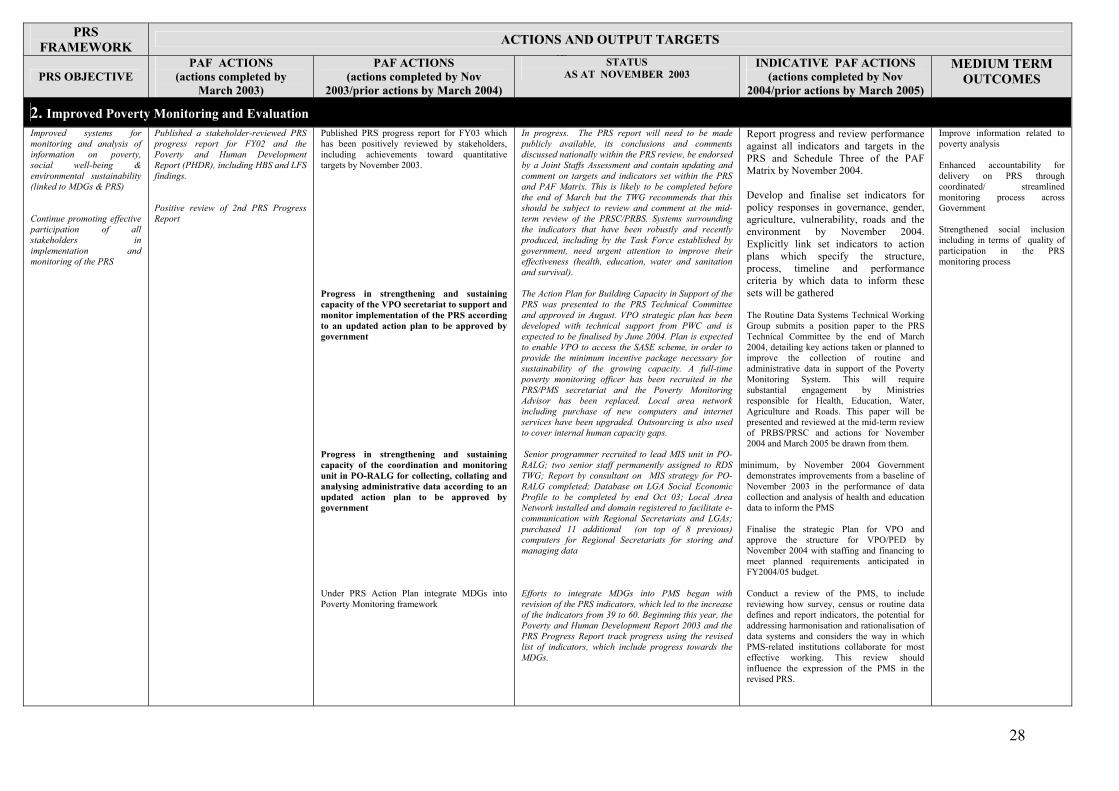
2. Improved Poverty Monitoring and Evaluation Improved systems for monitoring and analysis of information on poverty, social well-being & environmental sustainability (linked to MDGs & PRS) Continue promoting effective participation of all stakeholders in implementation and monitoring of the PRS
Published a stakeholder-reviewed PRS progress report for FY02 and the Poverty and Human Development Report (PHDR), including HBS and LFS findings. Positive review of 2nd PRS Progress Report
Published PRS progress report for FY03 which has been positively reviewed by stakeholders, including achievements toward quantitative targets by November 2003. Progress in strengthening and sustaining capacity of the VPO secretariat to support and monitor implementation of the PRS according to an updated action plan to be approved by government Progress in strengthening and sustaining capacity of the coordination and monitoring unit in PO-RALG for collecting, collating and analysing administrative data according to an updated action plan to be approved by government Under PRS Action Plan integrate MDGs into Poverty Monitoring framework
In progress. The PRS report will need to be made publicly available, its conclusions and comments discussed nationally within the PRS review, be endorsed by a Joint Staffs Assessment and contain updating and comment on targets and indicators set within the PRS and PAF Matrix. This is likely to be completed before the end of March but the TWG recommends that this should be subject to review and comment at the mid-term review of the PRSC/PRBS. Systems surrounding the indicators that have been robustly and recently produced, including by the Task Force established by government, need urgent attention to improve their effectiveness (health, education, water and sanitation and survival). The Action Plan for Building Capacity in Support of the PRS was presented to the PRS Technical Committee and approved in August. VPO strategic plan has been developed with technical support from PWC and is expected to be finalised by June 2004. Plan is expected to enable VPO to access the SASE scheme, in order to provide the minimum incentive package necessary for sustainability of the growing capacity. A full-time poverty monitoring officer has been recruited in the PRS/PMS secretariat and the Poverty Monitoring Advisor has been replaced. Local area network including purchase of new computers and internet services have been upgraded. Outsourcing is also used to cover internal human capacity gaps. Senior programmer recruited to lead MIS unit in PO-RALG; two senior staff permanently assigned to RDS TWG; Report by consultant on MIS strategy for PO-RALG completed; Database on LGA Social Economic Profile to be completed by end Oct 03; Local Area Network installed and domain registered to facilitate e-communication with Regional Secretariats and LGAs; purchased 11 additional (on top of 8 previous) computers for Regional Secretariats for storing and managing data Efforts to integrate MDGs into PMS began with revision of the PRS indicators, which led to the increase of the indicators from 39 to 60. Beginning this year, the Poverty and Human Development Report 2003 and the PRS Progress Report track progress using the revised list of indicators, which include progress towards the MDGs.
Report progress and review performance against all indicators and targets in the PRS and Schedule Three of the PAF Matrix by November 2004. Develop and finalise set indicators for policy responses in governance, gender, agriculture, vulnerability, roads and the environment by November 2004. Explicitly link set indicators to action plans which specify the structure, process, timeline and performance criteria by which data to inform these sets will be gathered The Routine Data Systems Technical Working Group submits a position paper to the PRS Technical Committee by the end of March 2004, detailing key actions taken or planned to improve the collection of routine and administrative data in support of the Poverty Monitoring System. This will require substantial engagement by Ministries responsible for Health, Education, Water, Agriculture and Roads. This paper will be presented and reviewed at the mid-term review of PRBS/PRSC and actions for November 2004 and March 2005 be drawn from them.
minimum, by November 2004 Government demonstrates improvements from a baseline of November 2003 in the performance of data collection and analysis of health and education data to inform the PMS Finalise the strategic Plan for VPO and approve the structure for VPO/PED by November 2004 with staffing and financing to meet planned requirements anticipated in FY2004/05 budget. Conduct a review of the PMS, to include reviewing how survey, census or routine data defines and report indicators, the potential for addressing harmonisation and rationalisation of data systems and considers the way in which PMS-related institutions collaborate for most effective working. This review should influence the expression of the PMS in the revised PRS.
Improve information related to poverty analysis Enhanced accountability for delivery on PRS through coordinated/ streamlined monitoring process across Government Strengthened social inclusion including in terms of quality of participation in the PRS monitoring process

29
29
30
30
PRS FRAMEWORK ACTIONS AND OUTPUT TARGETS
PRS OBJECTIVE
PAF ACTIONS (actions completed by
March 2003)
PAF ACTIONS (actions completed by Nov 2003/prior
actions by March 2004)
STATUS OF AS AT NOVEMBER 2003
INDICATIVE PAF ACTIONS (actions completed by Nov
2004/prior actions by March 2005)
MEDIUM TERM
OUTCOMES
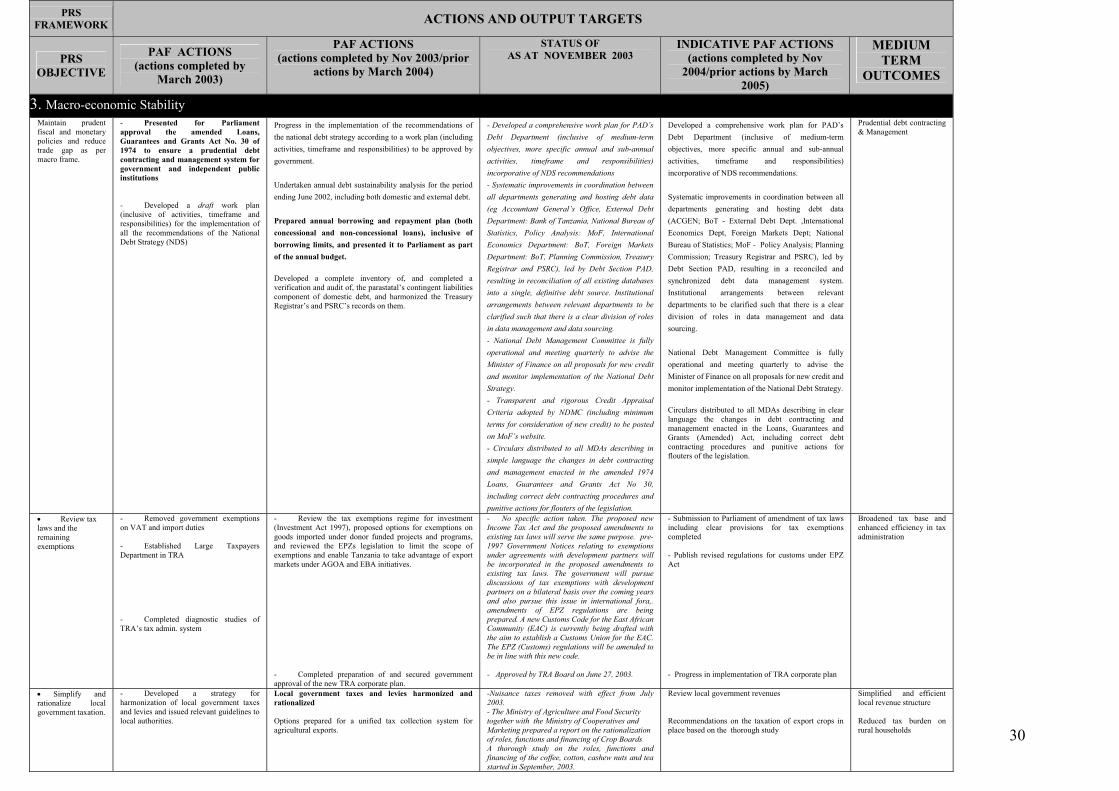
3. Macro-economic Stability Maintain prudent fiscal and monetary policies and reduce trade gap as per macro frame.
- Presented for Parliament approval the amended Loans, Guarantees and Grants Act No. 30 of 1974 to ensure a prudential debt contracting and management system for government and independent public institutions - Developed a draft work plan (inclusive of activities, timeframe and responsibilities) for the implementation of all the recommendations of the National Debt Strategy (NDS)
Progress in the implementation of the recommendations of the national debt strategy according to a work plan (including activities, timeframe and responsibilities) to be approved by government. Undertaken annual debt sustainability analysis for the period ending June 2002, including both domestic and external debt. Prepared annual borrowing and repayment plan (both concessional and non-concessional loans), inclusive of borrowing limits, and presented it to Parliament as part of the annual budget. Developed a complete inventory of, and completed a verification and audit of, the parastatal’s contingent liabilities component of domestic debt, and harmonized the Treasury Registrar’s and PSRC’s records on them.
- Developed a comprehensive work plan for PAD’s Debt Department (inclusive of medium-term objectives, more specific annual and sub-annual activities, timeframe and responsibilities) incorporative of NDS recommendations - Systematic improvements in coordination between all departments generating and hosting debt data (eg Accountant General’s Office, External Debt Department: Bank of Tanzania, National Bureau of Statistics, Policy Analysis: MoF, International Economics Department: BoT, Foreign Markets Department: BoT, Planning Commission, Treasury Registrar and PSRC), led by Debt Section PAD, resulting in reconciliation of all existing databases into a single, definitive debt source. Institutional arrangements between relevant departments to be clarified such that there is a clear division of roles in data management and data sourcing. - National Debt Management Committee is fully operational and meeting quarterly to advise the Minister of Finance on all proposals for new credit and monitor implementation of the National Debt Strategy. - Transparent and rigorous Credit Appraisal Criteria adopted by NDMC (including minimum terms for consideration of new credit) to be posted on MoF’s website. - Circulars distributed to all MDAs describing in simple language the changes in debt contracting and management enacted in the amended 1974 Loans, Guarantees and Grants Act No 30, including correct debt contracting procedures and punitive actions for flouters of the legislation.
Developed a comprehensive work plan for PAD’s Debt Department (inclusive of medium-term objectives, more specific annual and sub-annual activities, timeframe and responsibilities) incorporative of NDS recommendations. Systematic improvements in coordination between all departments generating and hosting debt data (ACGEN; BoT - External Debt Dept. ,International Economics Dept, Foreign Markets Dept; National Bureau of Statistics; MoF - Policy Analysis; Planning Commission; Treasury Registrar and PSRC), led by Debt Section PAD, resulting in a reconciled and synchronized debt data management system. Institutional arrangements between relevant departments to be clarified such that there is a clear division of roles in data management and data sourcing. National Debt Management Committee is fully operational and meeting quarterly to advise the Minister of Finance on all proposals for new credit and monitor implementation of the National Debt Strategy. Circulars distributed to all MDAs describing in clear language the changes in debt contracting and management enacted in the Loans, Guarantees and Grants (Amended) Act, including correct debt contracting procedures and punitive actions for flouters of the legislation.
Prudential debt contracting & Management
• Review tax laws and the remaining exemptions
- Removed government exemptions on VAT and import duties - Established Large Taxpayers Department in TRA - Completed diagnostic studies of TRA’s tax admin. system
- Review the tax exemptions regime for investment (Investment Act 1997), proposed options for exemptions on goods imported under donor funded projects and programs, and reviewed the EPZs legislation to limit the scope of exemptions and enable Tanzania to take advantage of export markets under AGOA and EBA initiatives. - Completed preparation of and secured government approval of the new TRA corporate plan.
- No specific action taken. The proposed new Income Tax Act and the proposed amendments to existing tax laws will serve the same purpose. pre-1997 Government Notices relating to exemptions under agreements with development partners will be incorporated in the proposed amendments to existing tax laws. The government will pursue discussions of tax exemptions with development partners on a bilateral basis over the coming years and also pursue this issue in international fora,. amendments of EPZ regulations are being prepared. A new Customs Code for the East African Community (EAC) is currently being drafted with the aim to establish a Customs Union for the EAC. The EPZ (Customs) regulations will be amended to be in line with this new code. - Approved by TRA Board on June 27, 2003.
- Submission to Parliament of amendment of tax laws including clear provisions for tax exemptions completed - Publish revised regulations for customs under EPZ Act - Progress in implementation of TRA corporate plan
Broadened tax base and enhanced efficiency in tax administration
• Simplify and rationalize local government taxation.
- Developed a strategy for harmonization of local government taxes and levies and issued relevant guidelines to local authorities.
Local government taxes and levies harmonized and rationalized Options prepared for a unified tax collection system for agricultural exports.
-Nuisance taxes removed with effect from July 2003. - The Ministry of Agriculture and Food Security together with the Ministry of Cooperatives and Marketing prepared a report on the rationalization of roles, functions and financing of Crop Boards A thorough study on the roles, functions and financing of the coffee, cotton, cashew nuts and tea started in September, 2003.
Review local government revenues Recommendations on the taxation of export crops in place based on the thorough study
Simplified and efficient local revenue structure Reduced tax burden on rural households
31
31
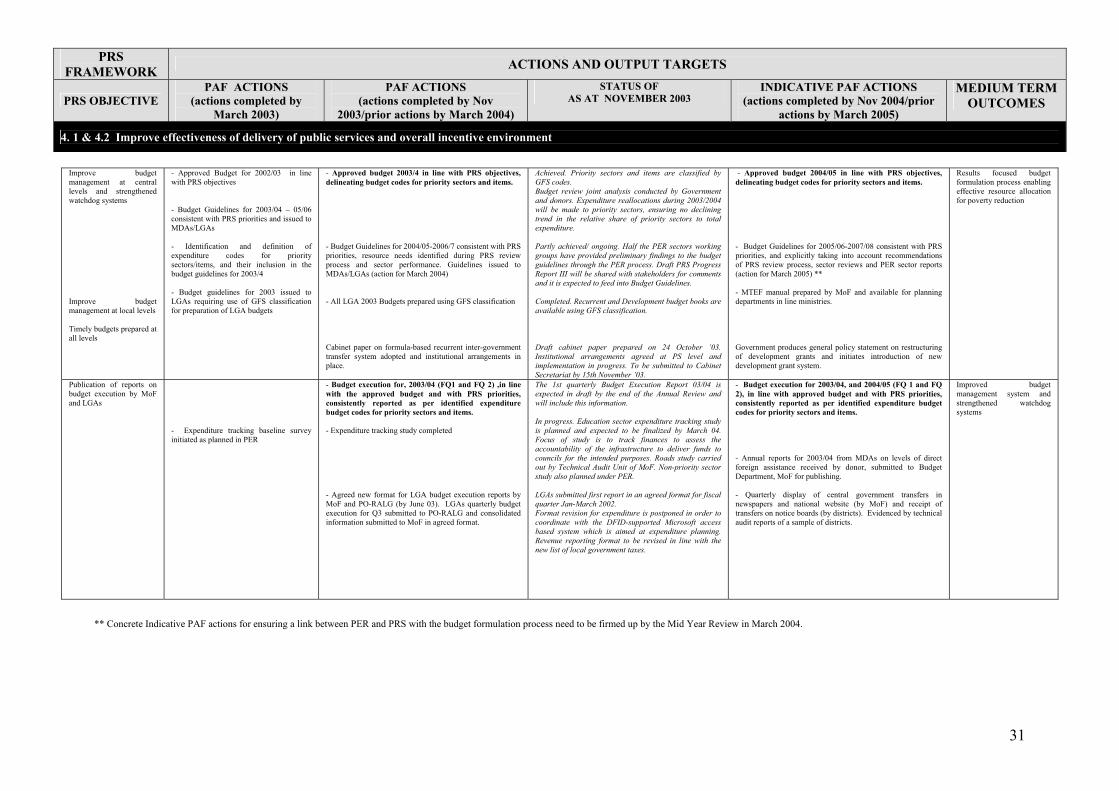
** Concrete Indicative PAF actions for ensuring a link between PER and PRS with the budget formulation process need to be firmed up by the Mid Year Review in March 2004.
Improve budget management at central levels and strengthened watchdog systems Improve budget management at local levels Timely budgets prepared at all levels
- Approved Budget for 2002/03 in line with PRS objectives - Budget Guidelines for 2003/04 – 05/06 consistent with PRS priorities and issued to MDAs/LGAs - Identification and definition of expenditure codes for priority sectors/items, and their inclusion in the budget guidelines for 2003/4 - Budget guidelines for 2003 issued to LGAs requiring use of GFS classification for preparation of LGA budgets
- Approved budget 2003/4 in line with PRS objectives, delineating budget codes for priority sectors and items. - Budget Guidelines for 2004/05-2006/7 consistent with PRS priorities, resource needs identified during PRS review process and sector performance. Guidelines issued to MDAs/LGAs (action for March 2004) - All LGA 2003 Budgets prepared using GFS classification Cabinet paper on formula-based recurrent inter-government transfer system adopted and institutional arrangements in place.
Achieved. Priority sectors and items are classified by GFS codes. Budget review joint analysis conducted by Government and donors. Expenditure reallocations during 2003/2004 will be made to priority sectors, ensuring no declining trend in the relative share of priority sectors to total expenditure. Partly achieved/ ongoing. Half the PER sectors working groups have provided preliminary findings to the budget guidelines through the PER process. Draft PRS Progress Report III will be shared with stakeholders for comments and it is expected to feed into Budget Guidelines. Completed. Recurrent and Development budget books are available using GFS classification. Draft cabinet paper prepared on 24 October ’03. Institutional arrangements agreed at PS level and implementation in progress. To be submitted to Cabinet Secretariat by 15th November ’03.
- Approved budget 2004/05 in line with PRS objectives, delineating budget codes for priority sectors and items. - Budget Guidelines for 2005/06-2007/08 consistent with PRS priorities, and explicitly taking into account recommendations of PRS review process, sector reviews and PER sector reports (action for March 2005) ** - MTEF manual prepared by MoF and available for planning departments in line ministries. Government produces general policy statement on restructuring of development grants and initiates introduction of new development grant system.
Results focused budget formulation process enabling effective resource allocation for poverty reduction
Publication of reports on budget execution by MoF and LGAs
- Expenditure tracking baseline survey initiated as planned in PER
- Budget execution for, 2003/04 (FQ1 and FQ 2) ,in line with the approved budget and with PRS priorities, consistently reported as per identified expenditure budget codes for priority sectors and items. - Expenditure tracking study completed - Agreed new format for LGA budget execution reports by MoF and PO-RALG (by June 03). LGAs quarterly budget execution for Q3 submitted to PO-RALG and consolidated information submitted to MoF in agreed format.
The 1st quarterly Budget Execution Report 03/04 is expected in draft by the end of the Annual Review and will include this information. In progress. Education sector expenditure tracking study is planned and expected to be finalized by March 04. Focus of study is to track finances to assess the accountability of the infrastructure to deliver funds to councils for the intended purposes. Roads study carried out by Technical Audit Unit of MoF. Non-priority sector study also planned under PER. LGAs submitted first report in an agreed format for fiscal quarter Jan-March 2002. Format revision for expenditure is postponed in order to coordinate with the DFID-supported Microsoft access based system which is aimed at expenditure planning. Revenue reporting format to be revised in line with the new list of local government taxes.
- Budget execution for 2003/04, and 2004/05 (FQ 1 and FQ 2), in line with approved budget and with PRS priorities, consistently reported as per identified expenditure budget codes for priority sectors and items. - Annual reports for 2003/04 from MDAs on levels of direct foreign assistance received by donor, submitted to Budget Department, MoF for publishing. - Quarterly display of central government transfers in newspapers and national website (by MoF) and receipt of transfers on notice boards (by districts). Evidenced by technical audit reports of a sample of districts.
Improved budget management system and strengthened watchdog systems
PRS FRAMEWORK ACTIONS AND OUTPUT TARGETS
PRS OBJECTIVE PAF ACTIONS
(actions completed by March 2003)
PAF ACTIONS (actions completed by Nov
2003/prior actions by March 2004)
STATUS OF AS AT NOVEMBER 2003
INDICATIVE PAF ACTIONS (actions completed by Nov 2004/prior
actions by March 2005)
MEDIUM TERM OUTCOMES
4. 1 & 4.2 Improve effectiveness of delivery of public services and overall incentive environment
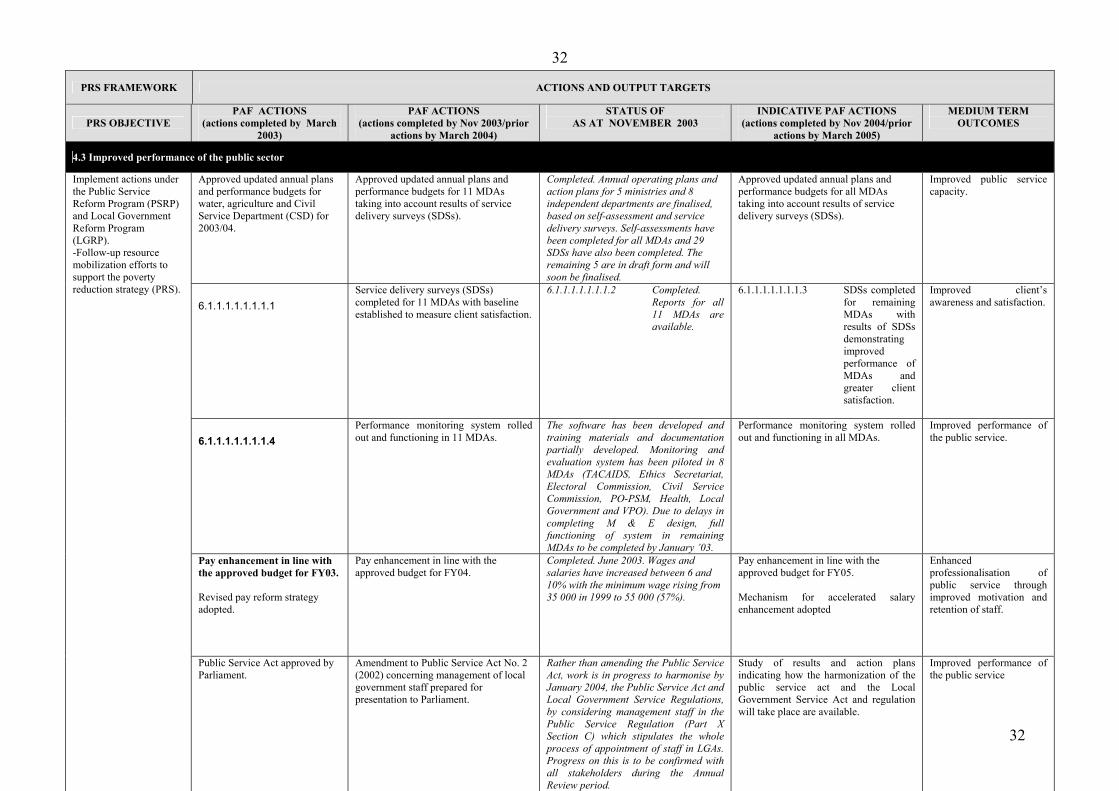
32
32
PRS FRAMEWORK ACTIONS AND OUTPUT TARGETS
PRS OBJECTIVE PAF ACTIONS
(actions completed by March 2003)
PAF ACTIONS (actions completed by Nov 2003/prior
actions by March 2004)
STATUS OF AS AT NOVEMBER 2003
INDICATIVE PAF ACTIONS (actions completed by Nov 2004/prior
actions by March 2005)
MEDIUM TERM OUTCOMES
4.3 Improved performance of the public sector
Approved updated annual plans and performance budgets for water, agriculture and Civil Service Department (CSD) for 2003/04.
Approved updated annual plans and performance budgets for 11 MDAs taking into account results of service delivery surveys (SDSs).
Completed. Annual operating plans and action plans for 5 ministries and 8 independent departments are finalised, based on self-assessment and service delivery surveys. Self-assessments have been completed for all MDAs and 29 SDSs have also been completed. The remaining 5 are in draft form and will soon be finalised.
Approved updated annual plans and performance budgets for all MDAs taking into account results of service delivery surveys (SDSs).
Improved public service capacity.
6.1.1.1.1.1.1.1.1 Service delivery surveys (SDSs) completed for 11 MDAs with baseline established to measure client satisfaction.
6.1.1.1.1.1.1.1.2 Completed. Reports for all 11 MDAs are available.
6.1.1.1.1.1.1.1.3 SDSs completed for remaining MDAs with results of SDSs demonstrating improved performance of MDAs and greater client satisfaction.
Improved client’s awareness and satisfaction.
6.1.1.1.1.1.1.1.4 Performance monitoring system rolled out and functioning in 11 MDAs.
The software has been developed and training materials and documentation partially developed. Monitoring and evaluation system has been piloted in 8 MDAs (TACAIDS, Ethics Secretariat, Electoral Commission, Civil Service Commission, PO-PSM, Health, Local Government and VPO). Due to delays in completing M & E design, full functioning of system in remaining MDAs to be completed by January ’03.
Performance monitoring system rolled out and functioning in all MDAs.
Improved performance of the public service.
Pay enhancement in line with the approved budget for FY03. Revised pay reform strategy adopted.
Pay enhancement in line with the approved budget for FY04.
Completed. June 2003. Wages and salaries have increased between 6 and 10% with the minimum wage rising from 35 000 in 1999 to 55 000 (57%).
Pay enhancement in line with the approved budget for FY05. Mechanism for accelerated salary enhancement adopted
Enhanced professionalisation of public service through improved motivation and retention of staff.
Implement actions under the Public Service Reform Program (PSRP) and Local Government Reform Program (LGRP). -Follow-up resource mobilization efforts to support the poverty reduction strategy (PRS).
Public Service Act approved by Parliament.
Amendment to Public Service Act No. 2 (2002) concerning management of local government staff prepared for presentation to Parliament.
Rather than amending the Public Service Act, work is in progress to harmonise by January 2004, the Public Service Act and Local Government Service Regulations, by considering management staff in the Public Service Regulation (Part X Section C) which stipulates the whole process of appointment of staff in LGAs. Progress on this is to be confirmed with all stakeholders during the Annual Review period.
Study of results and action plans indicating how the harmonization of the public service act and the Local Government Service Act and regulation will take place are available.
Improved performance of the public service
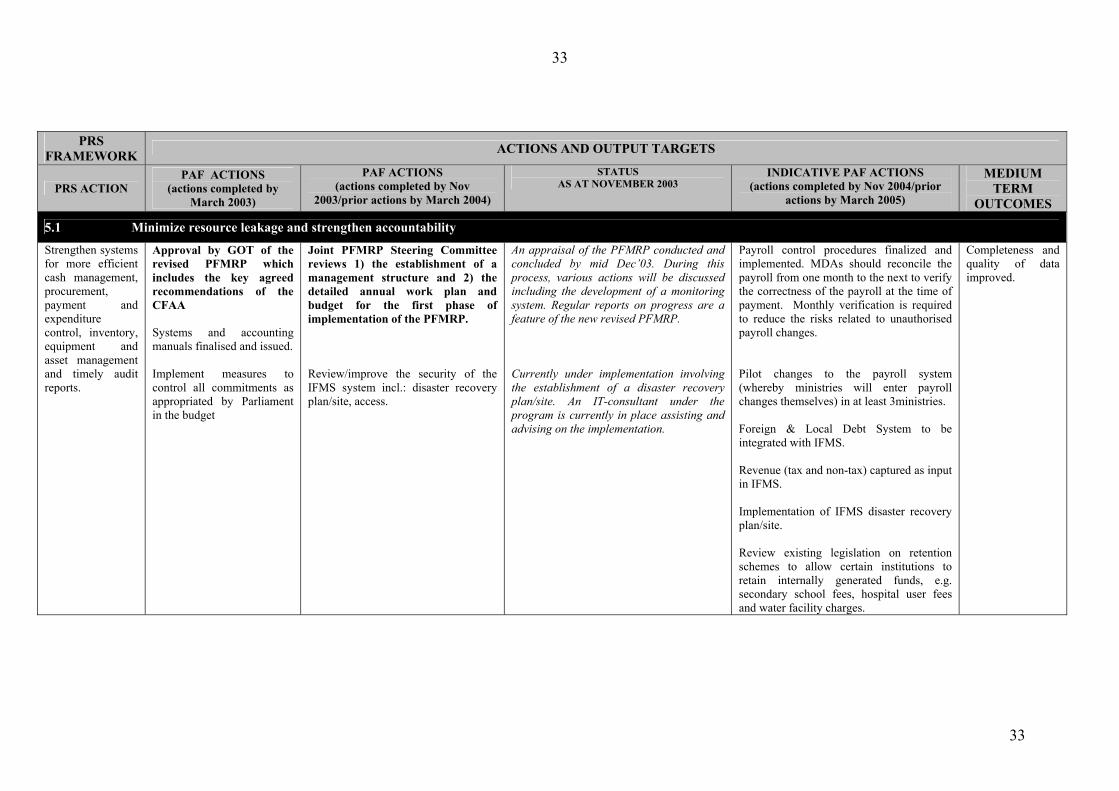
33
33
PRS FRAMEWORK ACTIONS AND OUTPUT TARGETS
PRS ACTION PAF ACTIONS
(actions completed by March 2003)
PAF ACTIONS (actions completed by Nov
2003/prior actions by March 2004)
STATUS AS AT NOVEMBER 2003
INDICATIVE PAF ACTIONS (actions completed by Nov 2004/prior
actions by March 2005)
MEDIUM TERM
OUTCOMES
5.1 Minimize resource leakage and strengthen accountability
Strengthen systems for more efficient cash management, procurement, payment and expenditure control, inventory, equipment and asset management and timely audit reports.
Approval by GOT of the revised PFMRP which includes the key agreed recommendations of the CFAA Systems and accounting manuals finalised and issued. Implement measures to control all commitments as appropriated by Parliament in the budget
Joint PFMRP Steering Committee reviews 1) the establishment of a management structure and 2) the detailed annual work plan and budget for the first phase of implementation of the PFMRP. Review/improve the security of the IFMS system incl.: disaster recovery plan/site, access.
An appraisal of the PFMRP conducted and concluded by mid Dec’03. During this process, various actions will be discussed including the development of a monitoring system. Regular reports on progress are a feature of the new revised PFMRP. Currently under implementation involving the establishment of a disaster recovery plan/site. An IT-consultant under the program is currently in place assisting and advising on the implementation.
Payroll control procedures finalized and implemented. MDAs should reconcile the payroll from one month to the next to verify the correctness of the payroll at the time of payment. Monthly verification is required to reduce the risks related to unauthorised payroll changes. Pilot changes to the payroll system (whereby ministries will enter payroll changes themselves) in at least 3ministries. Foreign & Local Debt System to be integrated with IFMS. Revenue (tax and non-tax) captured as input in IFMS. Implementation of IFMS disaster recovery plan/site. Review existing legislation on retention schemes to allow certain institutions to retain internally generated funds, e.g. secondary school fees, hospital user fees and water facility charges.
Completeness and quality of data improved.
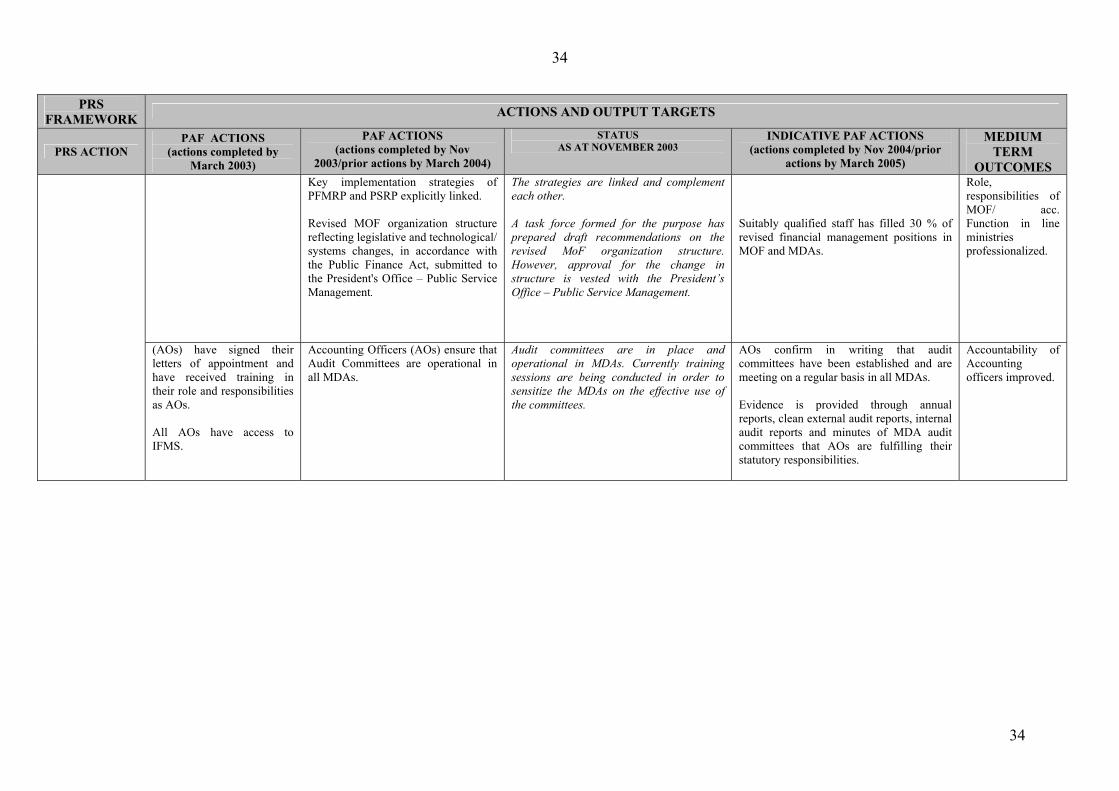
34
34
PRS FRAMEWORK ACTIONS AND OUTPUT TARGETS
PRS ACTION PAF ACTIONS
(actions completed by March 2003)
PAF ACTIONS (actions completed by Nov
2003/prior actions by March 2004)
STATUS AS AT NOVEMBER 2003
INDICATIVE PAF ACTIONS (actions completed by Nov 2004/prior
actions by March 2005)
MEDIUM TERM
OUTCOMES Key implementation strategies of
PFMRP and PSRP explicitly linked. Revised MOF organization structure reflecting legislative and technological/ systems changes, in accordance with the Public Finance Act, submitted to the President's Office – Public Service Management.
The strategies are linked and complement each other. A task force formed for the purpose has prepared draft recommendations on the revised MoF organization structure. However, approval for the change in structure is vested with the President’s Office – Public Service Management.
Suitably qualified staff has filled 30 % of revised financial management positions in MOF and MDAs.
Role, responsibilities of MOF/ acc. Function in line ministries professionalized.
(AOs) have signed their letters of appointment and have received training in their role and responsibilities as AOs. All AOs have access to IFMS.
Accounting Officers (AOs) ensure that Audit Committees are operational in all MDAs.
Audit committees are in place and operational in MDAs. Currently training sessions are being conducted in order to sensitize the MDAs on the effective use of the committees.
AOs confirm in writing that audit committees have been established and are meeting on a regular basis in all MDAs. Evidence is provided through annual reports, clean external audit reports, internal audit reports and minutes of MDA audit committees that AOs are fulfilling their statutory responsibilities.
Accountability of Accounting officers improved.
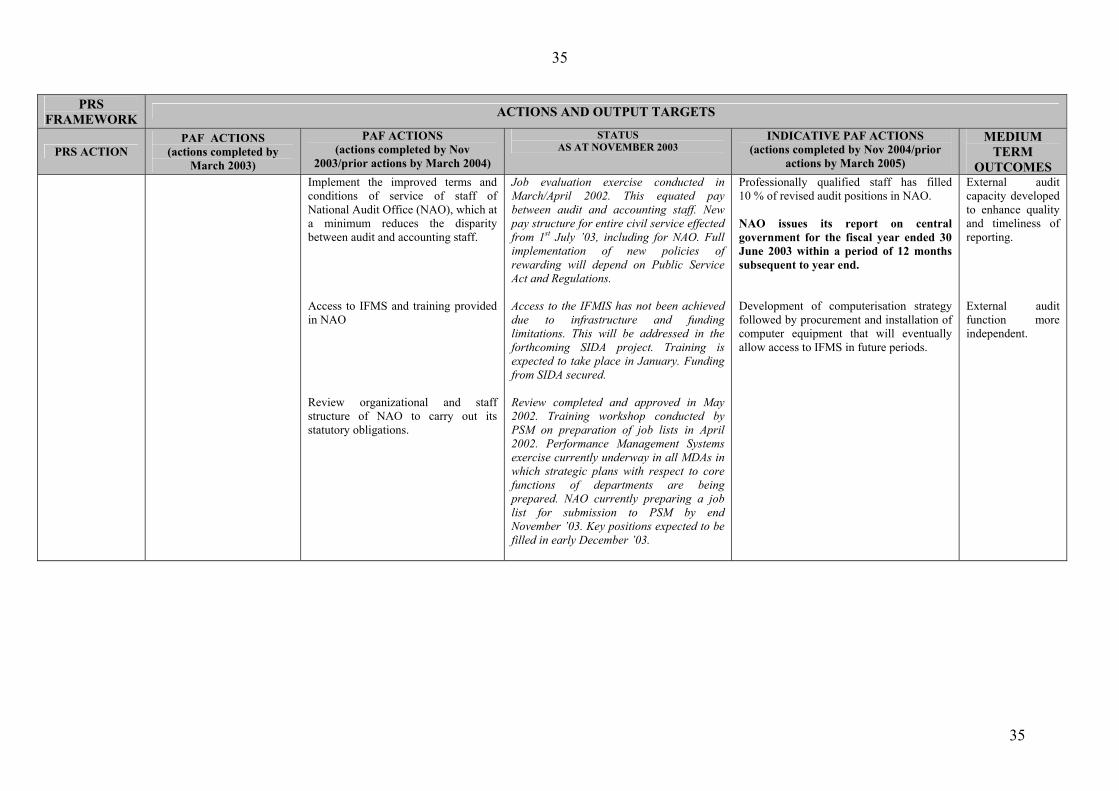
35
35
PRS FRAMEWORK ACTIONS AND OUTPUT TARGETS
PRS ACTION PAF ACTIONS
(actions completed by March 2003)
PAF ACTIONS (actions completed by Nov
2003/prior actions by March 2004)
STATUS AS AT NOVEMBER 2003
INDICATIVE PAF ACTIONS (actions completed by Nov 2004/prior
actions by March 2005)
MEDIUM TERM
OUTCOMES Implement the improved terms and
conditions of service of staff of National Audit Office (NAO), which at a minimum reduces the disparity between audit and accounting staff. Access to IFMS and training provided in NAO Review organizational and staff structure of NAO to carry out its statutory obligations.
Job evaluation exercise conducted in March/April 2002. This equated pay between audit and accounting staff. New pay structure for entire civil service effected from 1st July ’03, including for NAO. Full implementation of new policies of rewarding will depend on Public Service Act and Regulations. Access to the IFMIS has not been achieved due to infrastructure and funding limitations. This will be addressed in the forthcoming SIDA project. Training is expected to take place in January. Funding from SIDA secured. Review completed and approved in May 2002. Training workshop conducted by PSM on preparation of job lists in April 2002. Performance Management Systems exercise currently underway in all MDAs in which strategic plans with respect to core functions of departments are being prepared. NAO currently preparing a job list for submission to PSM by end November ’03. Key positions expected to be filled in early December ’03.
Professionally qualified staff has filled 10 % of revised audit positions in NAO. NAO issues its report on central government for the fiscal year ended 30 June 2003 within a period of 12 months subsequent to year end. Development of computerisation strategy followed by procurement and installation of computer equipment that will eventually allow access to IFMS in future periods.
External audit capacity developed to enhance quality and timeliness of reporting. External audit function more independent.
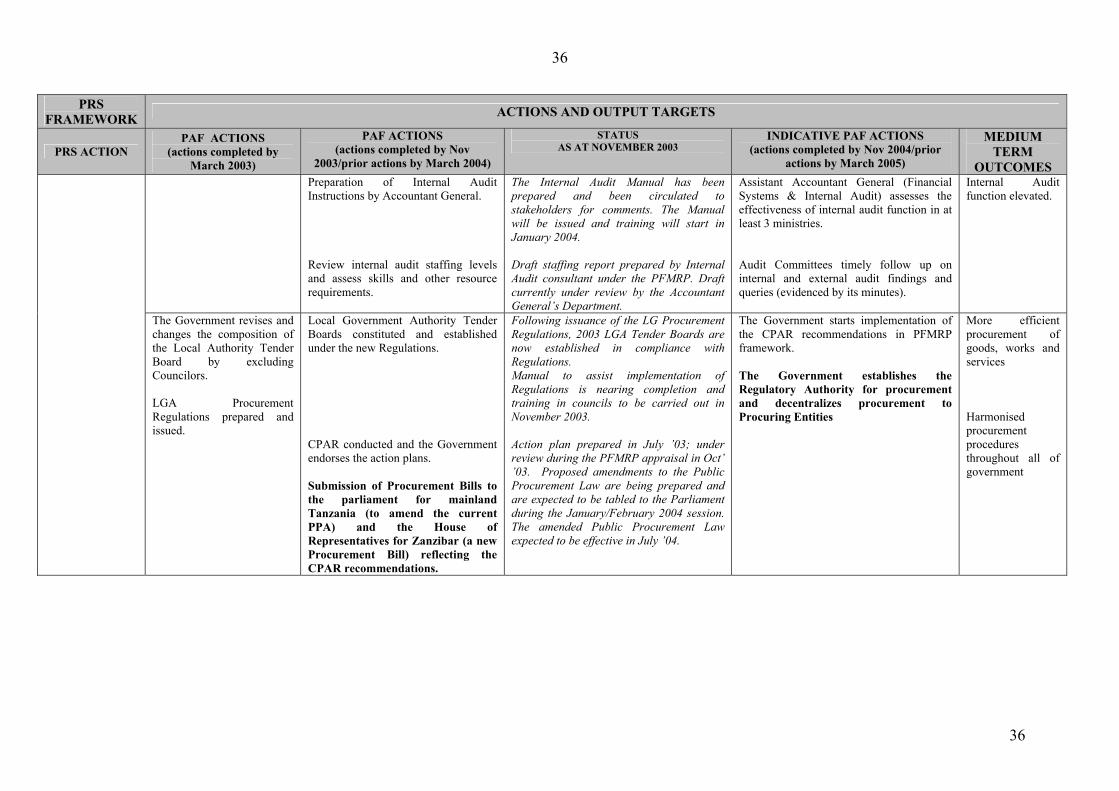
36
36
PRS FRAMEWORK ACTIONS AND OUTPUT TARGETS
PRS ACTION PAF ACTIONS
(actions completed by March 2003)
PAF ACTIONS (actions completed by Nov
2003/prior actions by March 2004)
STATUS AS AT NOVEMBER 2003
INDICATIVE PAF ACTIONS (actions completed by Nov 2004/prior
actions by March 2005)
MEDIUM TERM
OUTCOMES Preparation of Internal Audit
Instructions by Accountant General. Review internal audit staffing levels and assess skills and other resource requirements.
The Internal Audit Manual has been prepared and been circulated to stakeholders for comments. The Manual will be issued and training will start in January 2004. Draft staffing report prepared by Internal Audit consultant under the PFMRP. Draft currently under review by the Accountant General’s Department.
Assistant Accountant General (Financial Systems & Internal Audit) assesses the effectiveness of internal audit function in at least 3 ministries. Audit Committees timely follow up on internal and external audit findings and queries (evidenced by its minutes).
Internal Audit function elevated.
The Government revises and changes the composition of the Local Authority Tender Board by excluding Councilors. LGA Procurement Regulations prepared and issued.
Local Government Authority Tender Boards constituted and established under the new Regulations. CPAR conducted and the Government endorses the action plans. Submission of Procurement Bills to the parliament for mainland Tanzania (to amend the current PPA) and the House of Representatives for Zanzibar (a new Procurement Bill) reflecting the CPAR recommendations.
Following issuance of the LG Procurement Regulations, 2003 LGA Tender Boards are now established in compliance with Regulations. Manual to assist implementation of Regulations is nearing completion and training in councils to be carried out in November 2003. Action plan prepared in July ’03; under review during the PFMRP appraisal in Oct’ ’03. Proposed amendments to the Public Procurement Law are being prepared and are expected to be tabled to the Parliament during the January/February 2004 session. The amended Public Procurement Law expected to be effective in July ’04.
The Government starts implementation of the CPAR recommendations in PFMRP framework. The Government establishes the Regulatory Authority for procurement and decentralizes procurement to Procuring Entities
More efficient procurement of goods, works and services Harmonised procurement procedures throughout all of government
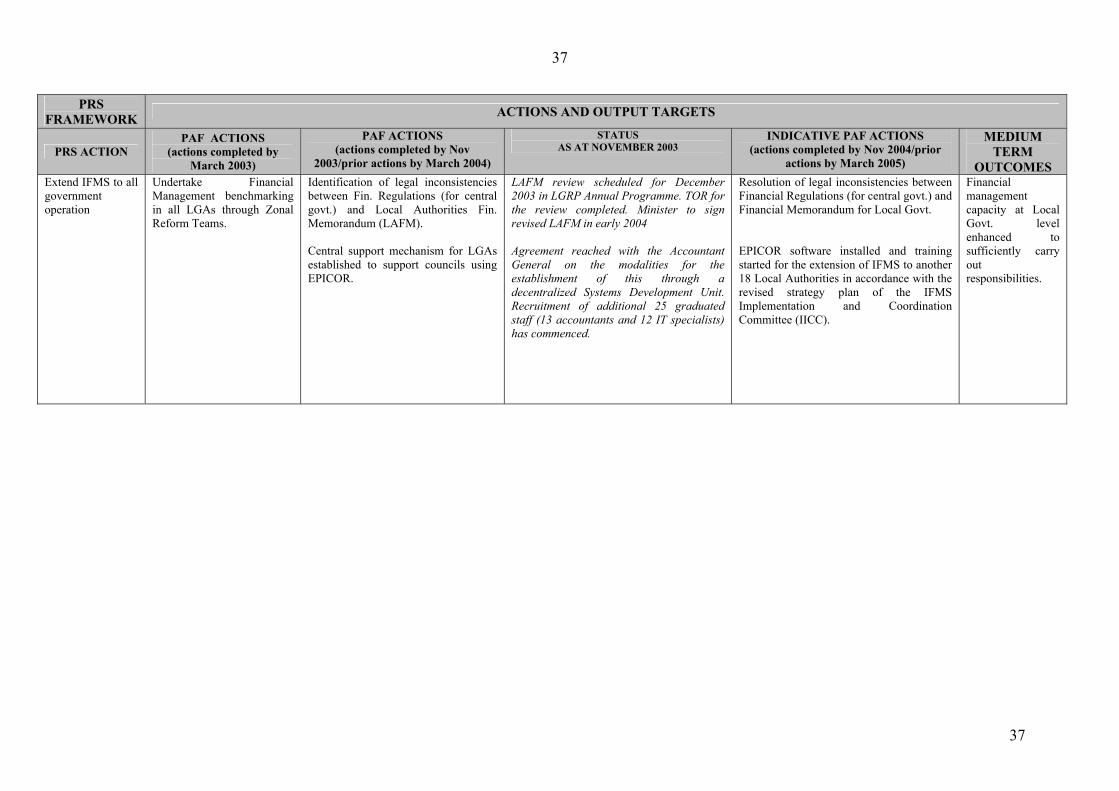
37
37
PRS FRAMEWORK ACTIONS AND OUTPUT TARGETS
PRS ACTION PAF ACTIONS
(actions completed by March 2003)
PAF ACTIONS (actions completed by Nov
2003/prior actions by March 2004)
STATUS AS AT NOVEMBER 2003
INDICATIVE PAF ACTIONS (actions completed by Nov 2004/prior
actions by March 2005)
MEDIUM TERM
OUTCOMES Extend IFMS to all government operation
Undertake Financial Management benchmarking in all LGAs through Zonal Reform Teams.
Identification of legal inconsistencies between Fin. Regulations (for central govt.) and Local Authorities Fin. Memorandum (LAFM). Central support mechanism for LGAs established to support councils using EPICOR.
LAFM review scheduled for December 2003 in LGRP Annual Programme. TOR for the review completed. Minister to sign revised LAFM in early 2004 Agreement reached with the Accountant General on the modalities for the establishment of this through a decentralized Systems Development Unit. Recruitment of additional 25 graduated staff (13 accountants and 12 IT specialists) has commenced.
Resolution of legal inconsistencies between Financial Regulations (for central govt.) and Financial Memorandum for Local Govt. EPICOR software installed and training started for the extension of IFMS to another 18 Local Authorities in accordance with the revised strategy plan of the IFMS Implementation and Coordination Committee (IICC).
Financial management capacity at Local Govt. level enhanced to sufficiently carry out responsibilities.
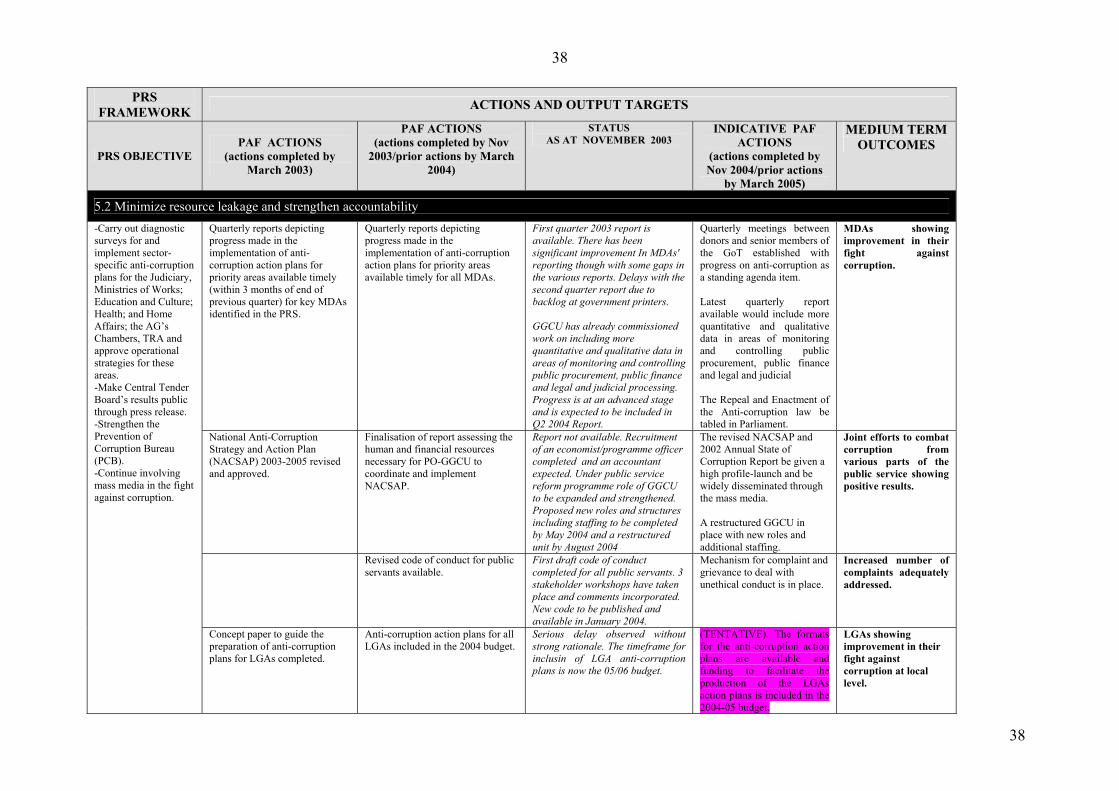
38
38
PRS FRAMEWORK ACTIONS AND OUTPUT TARGETS
PRS OBJECTIVE PAF ACTIONS
(actions completed by March 2003)
PAF ACTIONS (actions completed by Nov
2003/prior actions by March 2004)
STATUS AS AT NOVEMBER 2003
INDICATIVE PAF ACTIONS
(actions completed by Nov 2004/prior actions
by March 2005)
MEDIUM TERM OUTCOMES
5.2 Minimize resource leakage and strengthen accountability Quarterly reports depicting progress made in the implementation of anti-corruption action plans for priority areas available timely (within 3 months of end of previous quarter) for key MDAs identified in the PRS.
Quarterly reports depicting progress made in the implementation of anti-corruption action plans for priority areas available timely for all MDAs.
First quarter 2003 report is available. There has been significant improvement In MDAs' reporting though with some gaps in the various reports. Delays with the second quarter report due to backlog at government printers. GGCU has already commissioned work on including more quantitative and qualitative data in areas of monitoring and controlling public procurement, public finance and legal and judicial processing. Progress is at an advanced stage and is expected to be included in Q2 2004 Report.
Quarterly meetings between donors and senior members of the GoT established with progress on anti-corruption as a standing agenda item. Latest quarterly report available would include more quantitative and qualitative data in areas of monitoring and controlling public procurement, public finance and legal and judicial The Repeal and Enactment of the Anti-corruption law be tabled in Parliament.
MDAs showing improvement in their fight against corruption.
National Anti-Corruption Strategy and Action Plan (NACSAP) 2003-2005 revised and approved.
Finalisation of report assessing the human and financial resources necessary for PO-GGCU to coordinate and implement NACSAP.
Report not available. Recruitment of an economist/programme officer completed and an accountant expected. Under public service reform programme role of GGCU to be expanded and strengthened. Proposed new roles and structures including staffing to be completed by May 2004 and a restructured unit by August 2004
The revised NACSAP and 2002 Annual State of Corruption Report be given a high profile-launch and be widely disseminated through the mass media. A restructured GGCU in place with new roles and additional staffing.
Joint efforts to combat corruption from various parts of the public service showing positive results.
Revised code of conduct for public servants available.
First draft code of conduct completed for all public servants. 3 stakeholder workshops have taken place and comments incorporated. New code to be published and available in January 2004.
Mechanism for complaint and grievance to deal with unethical conduct is in place.
Increased number of complaints adequately addressed.
-Carry out diagnostic surveys for and implement sector-specific anti-corruption plans for the Judiciary, Ministries of Works; Education and Culture; Health; and Home Affairs; the AG’s Chambers, TRA and approve operational strategies for these areas. -Make Central Tender Board’s results public through press release. -Strengthen the Prevention of Corruption Bureau (PCB). -Continue involving mass media in the fight against corruption.
Concept paper to guide the preparation of anti-corruption plans for LGAs completed.
Anti-corruption action plans for all LGAs included in the 2004 budget.
Serious delay observed without strong rationale. The timeframe for inclusin of LGA anti-corruption plans is now the 05/06 budget.
(TENTATIVE). The formats for the anti-corruption action plans are available and funding to facilitate the production of the LGAs action plans is included in the 2004-05 budget.
LGAs showing improvement in their fight against corruption at local level.
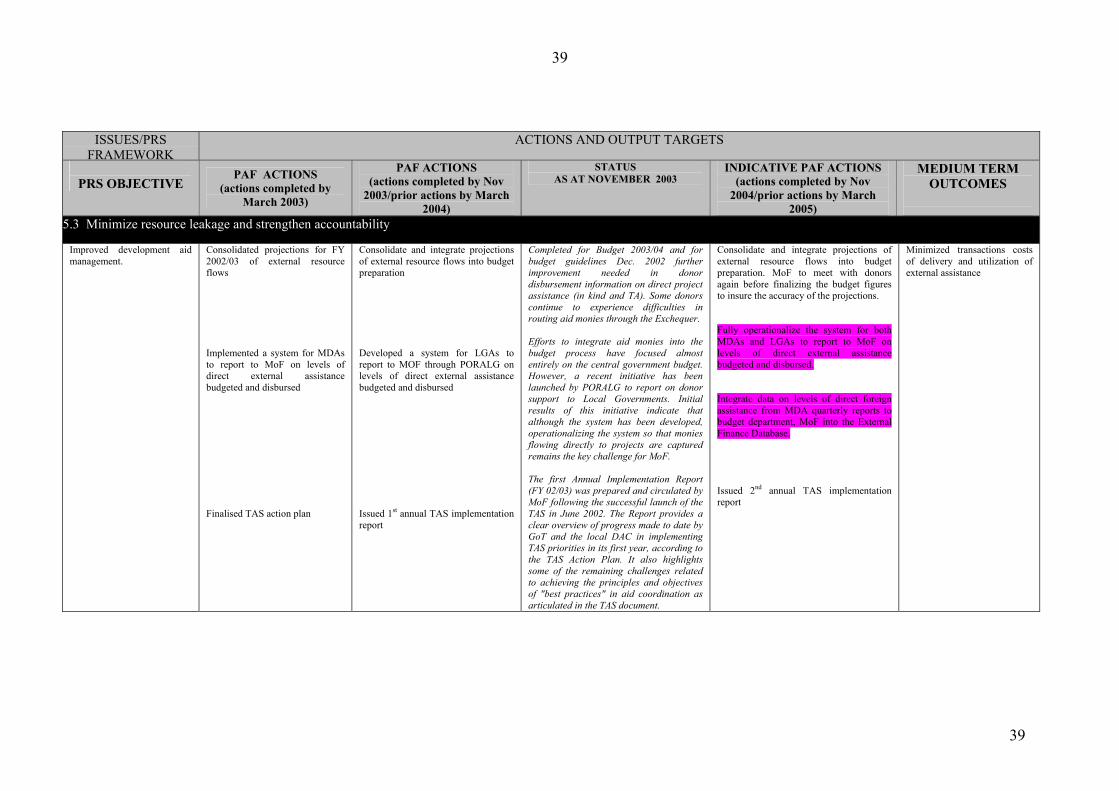
39
39
ISSUES/PRS
FRAMEWORKACTIONS AND OUTPUT TARGETS
PRS OBJECTIVE
PAF ACTIONS (actions completed by
March 2003)
PAF ACTIONS (actions completed by Nov
2003/prior actions by March 2004)
STATUS AS AT NOVEMBER 2003
INDICATIVE PAF ACTIONS (actions completed by Nov
2004/prior actions by March 2005)
MEDIUM TERM OUTCOMES
5.3 Minimize resource leakage and strengthen accountability
Improved development aid management.
Consolidated projections for FY 2002/03 of external resource flows Implemented a system for MDAs to report to MoF on levels of direct external assistance budgeted and disbursed Finalised TAS action plan
Consolidate and integrate projections of external resource flows into budget preparation Developed a system for LGAs to report to MOF through PORALG on levels of direct external assistance budgeted and disbursed Issued 1st annual TAS implementation report
Completed for Budget 2003/04 and for budget guidelines Dec. 2002 further improvement needed in donor disbursement information on direct project assistance (in kind and TA). Some donors continue to experience difficulties in routing aid monies through the Exchequer. Efforts to integrate aid monies into the budget process have focused almost entirely on the central government budget. However, a recent initiative has been launched by PORALG to report on donor support to Local Governments. Initial results of this initiative indicate that although the system has been developed, operationalizing the system so that monies flowing directly to projects are captured remains the key challenge for MoF. The first Annual Implementation Report (FY 02/03) was prepared and circulated by MoF following the successful launch of the TAS in June 2002. The Report provides a clear overview of progress made to date by GoT and the local DAC in implementing TAS priorities in its first year, according to the TAS Action Plan. It also highlights some of the remaining challenges related to achieving the principles and objectives of "best practices" in aid coordination as articulated in the TAS document.
Consolidate and integrate projections of external resource flows into budget preparation. MoF to meet with donors again before finalizing the budget figures to insure the accuracy of the projections. Fully operationalize the system for both MDAs and LGAs to report to MoF on levels of direct external assistance budgeted and disbursed. Integrate data on levels of direct foreign assistance from MDA quarterly reports to budget department, MoF into the External Finance Database. Issued 2nd annual TAS implementation report
Minimized transactions costs of delivery and utilization of external assistance
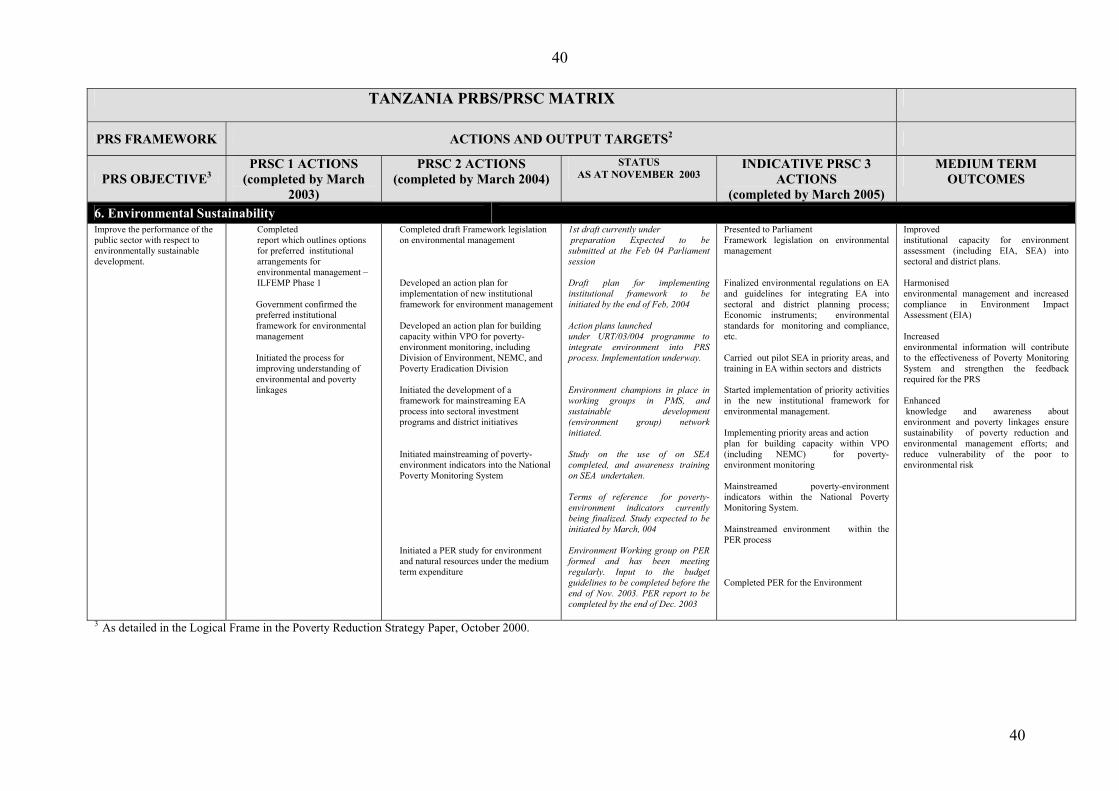
40
40
3 As detailed in the Logical Frame in the Poverty Reduction Strategy Paper, October 2000.
TANZANIA PRBS/PRSC MATRIX
PRS FRAMEWORK ACTIONS AND OUTPUT TARGETS2
PRS OBJECTIVE3 PRSC 1 ACTIONS
(completed by March 2003)
PRSC 2 ACTIONS (completed by March 2004)
STATUS AS AT NOVEMBER 2003
INDICATIVE PRSC 3 ACTIONS
(completed by March 2005)
MEDIUM TERM OUTCOMES
6. Environmental Sustainability Improve the performance of the public sector with respect to environmentally sustainable development.
Completed report which outlines options for preferred institutional arrangements for environmental management – ILFEMP Phase 1 Government confirmed the preferred institutional framework for environmental management Initiated the process for improving understanding of environmental and poverty linkages
Completed draft Framework legislation on environmental management Developed an action plan for implementation of new institutional framework for environment management
Developed an action plan for building capacity within VPO for poverty-environment monitoring, including Division of Environment, NEMC, and Poverty Eradication Division
Initiated the development of a framework for mainstreaming EA process into sectoral investment programs and district initiatives
Initiated mainstreaming of poverty-environment indicators into the National Poverty Monitoring System
Initiated a PER study for environment and natural resources under the medium term expenditure
1st draft currently under preparation Expected to be submitted at the Feb 04 Parliament session Draft plan for implementing institutional framework to be initiated by the end of Feb, 2004 Action plans launched under URT/03/004 programme to integrate environment into PRS process. Implementation underway. Environment champions in place in working groups in PMS, and sustainable development (environment group) network initiated. Study on the use of on SEA completed, and awareness training on SEA undertaken. Terms of reference for poverty- environment indicators currently being finalized. Study expected to be initiated by March, 004 Environment Working group on PER formed and has been meeting regularly. Input to the budget guidelines to be completed before the end of Nov. 2003. PER report to be completed by the end of Dec. 2003
Presented to Parliament Framework legislation on environmental management Finalized environmental regulations on EA and guidelines for integrating EA into sectoral and district planning process; Economic instruments; environmental standards for monitoring and compliance, etc. Carried out pilot SEA in priority areas, and training in EA within sectors and districts Started implementation of priority activities in the new institutional framework for environmental management. Implementing priority areas and action plan for building capacity within VPO (including NEMC) for poverty-environment monitoring Mainstreamed poverty-environment indicators within the National Poverty Monitoring System. Mainstreamed environment within the PER process Completed PER for the Environment
Improved institutional capacity for environment assessment (including EIA, SEA) into sectoral and district plans. Harmonised environmental management and increased compliance in Environment Impact Assessment (EIA) Increased environmental information will contribute to the effectiveness of Poverty Monitoring System and strengthen the feedback required for the PRS Enhanced knowledge and awareness about environment and poverty linkages ensure sustainability of poverty reduction and environmental management efforts; and reduce vulnerability of the poor to environmental risk
Copyright © 2022 FDOKUMEN