Proton spectroscopy of human stroke: Assessment of transverse relaxation times and partial volume...
9
Pergamon l Original Contribution Magnetic Resonance Imaging, Vol. 12, No. 8, pp. 1227-1235, 1994 Copyright 0 1994 Elsevier Science Ltd Printed in the USA. All rights reserved 0730-725X/94 $6.00 + .oO 0730-725X(94)00062-X PROTON SPECTROSCOPY OF HUMAN STROKE: ASSESSMENT OF TRANSVERSE RELAXATION TIMES AND PARTIAL VOLUME EFFECTS IN SINGLE VOLUME STEAM MRS ANDREW M. BLAMIRE,* GLENN D. GRAHAM,? DOUGLAS L. ROTHMAN,$ AND JAMES W. PRICHARD~ Departments of *Molecular Biophysics and Biochemistry, TNeurology, and $Medicine, Yale University, New Haven, CT 06510, USA Proton T2 relaxation times were measured in 13 stroke patients and 13 aged-matched normal subjects at 2.1 T. Spectra were acquired from an ~-CC volume using the STEAM sequence with echo times (TE) of 30.4 ms and 270.0 ms and repetition time of 2.8 s. Transverse relaxation times were estimated using two-point calculations. Percentage volume of infarct in the STEAM voxel was measured on spin-echo MRI encompassing the infarct and correlated with the peak amplitude of N-acetylated compounds (NA). T2 values of NA, creatine, and choline res- onances showed no significant difference between patients and controls. T2 for lactate in patients was 780 f 257 ms, respectively (mean f SE, n = 7). In stroke patients, high inverse correlation was found between the absolute NA signal and partial volume of normal brain contributing to each spectrum (p < .OOl, r = 0.97). Together with un- changed T2, this suggests that NAA largely disappears from infarcted tissue within 24 hr postinfarct. Keywords: Stroke; Magnetic resonance: Proton spectroscopy; Partial volume: Transverse relaxation time; Lactate; N-Acetyl-aspartate. INTRODUCTION The proton spectrum of normal human brain contains five well-resolved peaks which have been assigned to creatine/phosphocreatine, choline-containing com- pounds, IV-acetylated (NA) compounds, principally N- acetyl-aspartate (NAA), inositols, and lactate.‘,’ Other partially resolved peaks are also visible, arising from glutamate, glutamine, and aspartate. However, these signals are present at relatively low intensity and de- cay rapidly due to J-modulation.3 Signals from these metabolites have been shown to vary in multiple scle- rosis,4-6 tumors,7T8 and stroke.9-‘3 The lactate and NA peaks have been studied exten- sively because of their potential use in clinical diagno- sis. N-acetyl-aspartate is the largest contributor to the NA peak in the spectrum of normal brain; although its metabolic role remains to be determined, it is thought to be contained principally within neurons. Consequently, reduction of the NA peak in spectra from abnormal brain regions is often interpreted as evidence of neu- ronal loss. Lactate is present in normal brain at rela- tively low concentration (< 1 mM) making its resonance difficult to detect, but it becomes prominent in several pathologic states. Anaerobic glycolysis occurring dur- ing ischemia or infarction leads to increased local con- centration of lactate, which has been measured by proton spectroscopy.9-‘2 Two important aspects of the interpretation of the NA and lactate peaks in disease states have received lit- tle attention. These are: (1) the transverse relaxation time (T2) of the lactate peak, and (2) the role of par- tial volume effects on the apparent concentration of NA. Localized proton spectra have until recently gen- erally been observed with an echo time of 135 or 270 ms to allow refocussing of the J-modulation of the lactate protons. Hence the concentration of lactate cannot be accurately estimated without knowledge of its relax- ation time. Changes in peak amplitude in serial stud- ies11~*3-‘6 could be due to changes in relaxation time as RECEIVED 12/17/93; ACCEPTED 6/14/94. ment of Neurology, Yale University School of Medicine, 333 Address correspondence to James W. Prichard, Depart- Cedar Street, New Haven, CT, 06510. 1227
Transcript of Proton spectroscopy of human stroke: Assessment of transverse relaxation times and partial volume...

Pergamon
l Original Contribution
Magnetic Resonance Imaging, Vol. 12, No. 8, pp. 1227-1235, 1994 Copyright 0 1994 Elsevier Science Ltd Printed in the USA. All rights reserved
0730-725X/94 $6.00 + .oO
0730-725X(94)00062-X
PROTON SPECTROSCOPY OF HUMAN STROKE: ASSESSMENT OF TRANSVERSE RELAXATION TIMES AND
PARTIAL VOLUME EFFECTS IN SINGLE VOLUME STEAM MRS
ANDREW M. BLAMIRE,* GLENN D. GRAHAM,?
DOUGLAS L. ROTHMAN,$ AND JAMES W. PRICHARD~
Departments of *Molecular Biophysics and Biochemistry, TNeurology, and $Medicine, Yale University, New Haven, CT 06510, USA
Proton T2 relaxation times were measured in 13 stroke patients and 13 aged-matched normal subjects at 2.1 T. Spectra were acquired from an ~-CC volume using the STEAM sequence with echo times (TE) of 30.4 ms and 270.0 ms and repetition time of 2.8 s. Transverse relaxation times were estimated using two-point calculations. Percentage volume of infarct in the STEAM voxel was measured on spin-echo MRI encompassing the infarct and correlated with the peak amplitude of N-acetylated compounds (NA). T2 values of NA, creatine, and choline res- onances showed no significant difference between patients and controls. T2 for lactate in patients was 780 f 257 ms, respectively (mean f SE, n = 7). In stroke patients, high inverse correlation was found between the absolute NA signal and partial volume of normal brain contributing to each spectrum (p < .OOl, r = 0.97). Together with un- changed T2, this suggests that NAA largely disappears from infarcted tissue within 24 hr postinfarct.
Keywords: Stroke; Magnetic resonance: Proton spectroscopy; Partial volume: Transverse relaxation time; Lactate; N-Acetyl-aspartate.
INTRODUCTION
The proton spectrum of normal human brain contains five well-resolved peaks which have been assigned to creatine/phosphocreatine, choline-containing com- pounds, IV-acetylated (NA) compounds, principally N- acetyl-aspartate (NAA), inositols, and lactate.‘,’ Other partially resolved peaks are also visible, arising from glutamate, glutamine, and aspartate. However, these signals are present at relatively low intensity and de- cay rapidly due to J-modulation.3 Signals from these metabolites have been shown to vary in multiple scle- rosis,4-6 tumors,7T8 and stroke.9-‘3
The lactate and NA peaks have been studied exten- sively because of their potential use in clinical diagno- sis. N-acetyl-aspartate is the largest contributor to the NA peak in the spectrum of normal brain; although its metabolic role remains to be determined, it is thought to be contained principally within neurons. Consequently, reduction of the NA peak in spectra from abnormal
brain regions is often interpreted as evidence of neu- ronal loss. Lactate is present in normal brain at rela- tively low concentration (< 1 mM) making its resonance difficult to detect, but it becomes prominent in several pathologic states. Anaerobic glycolysis occurring dur- ing ischemia or infarction leads to increased local con- centration of lactate, which has been measured by proton spectroscopy.9-‘2
Two important aspects of the interpretation of the NA and lactate peaks in disease states have received lit- tle attention. These are: (1) the transverse relaxation time (T2) of the lactate peak, and (2) the role of par- tial volume effects on the apparent concentration of NA. Localized proton spectra have until recently gen- erally been observed with an echo time of 135 or 270 ms to allow refocussing of the J-modulation of the lactate protons. Hence the concentration of lactate cannot be accurately estimated without knowledge of its relax- ation time. Changes in peak amplitude in serial stud- ies11~*3-‘6 could be due to changes in relaxation time as
RECEIVED 12/17/93; ACCEPTED 6/14/94. ment of Neurology, Yale University School of Medicine, 333 Address correspondence to James W. Prichard, Depart- Cedar Street, New Haven, CT, 06510.
1227

1228 Magnetic Resonance Imaging 0 Volume 12, Number 8, 1994
well as changes in concentration. Several studies have measured relaxation times of normal human brain,17-21 and the values for creatine, choline, and NA are well characterized. However, measurement of the relaxation times of lactate have previously been reported in only two individual patients.18g20
Since lactate is not generally detected in normal brain, lactate signals observed in pathologic states must therefore come principally from the abnormal tissue. The NA peak is prominent throughout brain tissue and is easily observed. 22 Changes in these peaks from normal levels should reflect both changes in absolute concentration and partial volume effects to the extent that the spectroscopy volume differs from the infarct size.
We report here measurements of (1) proton trans- verse relaxation times in human infarction and in nor- mal subjects using STEAM spectroscopy, and, (2) accompanying partial volume effects,using spin-echo MR imaging.
METHODS
Patients were recruited from the Yale-New Haven Hospital Neurology service following admission for stroke and were inpatients at the time of the study. Pa- tients with brainstem, cerebellar or hemorrhagic strokes were excluded. Clinical data on the patients are given in Table 1, together with an estimate of the infarct vol- ume (see below). Age-matched control subjects were recruited from the local community by newspaper ad- vertisement and were screened to ensure they had no prior history of stroke or transient ischemic episodes.
The mean patient age was 70 yr, (range 50-90 yr, n = 13) and the mean age of controls was also 70 yr (range 58-78 yr, n = 13). Each subject was studied on a single occasion.
Spectra were acquired at 2.1 T using a Bruker Bio- spec I spectrometer (Bruker, Billerica, MA, USA) equipped with active shielded gradient coils (Oxford Magnet Technology, Oxford, UK). Subjects were po- sitioned in a padded head holder to limit movement during the study. A low-pass linear birdcage resonator was used for radiofrequency transmission and signal reception. Multislice spin-echo images (TE = 95 ms, TR = 2.05 s, slice thickness = 5 mm, in-plane resolu- tion = 1.5 mm2) were acquired in 8 contiguous axial planes to locate the stroke. A spectroscopy volume of dimensions 2 x 2 x 2 cm3 was selected using the STEAM sequence23 and was centered within the in- farct. Control subjects were paired with a patient of approximately the same age and the spectroscopy voxel placed to match the anatomical location studied in the patient. The selected volume was shimmed by hand using the water peak to a linewidth of less than 5 Hz using all first and some second order shims (xy, x2 - u2). Signal from the water peak was suppressed using both an adiabatic inversion pulse (Tm = 700 ms) prior to the STEAM localization and a frequency selective sine pulse and crusher gradients during the mixing pe- riod (TM). Spectra were acquired as free induction decays (FID) in blocks of 256 averages (512 points, 1250 Hz bandwidth). Slice selection frequencies were shifted by -250 Hz to lie between the lactate and NA peaks and thus minimize chemical shift offset of the volume for simultaneous measurement of these peaks.
Table 1. Stroke patient clinical details
Patient # Age Sex
1 85 F 2 68 F 3 57 M 4 50 F 5 90 M 6 72 F 7 76 F 8 73 F 9 64 F
10 52 F 11 76 F 12 59 M 13 88 F
Location
Left MCA Left subcortical Left IC/thalamus Right MCA Left IC Left MCA Left MCA Right MCA Right IC Right MCA Right par/occ Left MCA Left hemispheric
Age of infarct Infarct volume (Days) (cc)
1 >lOS 14 1.5 7 1.4 3 >12.4 5 4.1 5 6.7 1 >17.8 4 8.7 1 > 10.6 7 8.0 7 >153 2 8.8 1 > 16.4
MCA = Middle cerebral artery, par/occ = parietal/occipital, IC = internal capsule. The “>‘I sign in the last column indicates that the infarcted region extended outside of the imaged volume of brain and the volume given is therefore a minimum value.
Proton spectroscopy of human stroke 0 A.M. BLAMIRE ET AL. 1229
Two spectra were acquired using echo times of 30.4 ms and 270.0 ms. In both cases repetition time (TR) was 2.8 s and TM was 70 ms. The entire acquisition period lasted - 1.5 hr. All experiments were approved by the Yale University Human Investigation Committee.
Following each study a control spectrum was ac- quired with TE = 270 ms and TR = 5.8 s from a phan- tom containing 10 mM N-acetyl-aspartate (NAA), creatine, and lactate to assess system performance and hence allow direct comparison of data across subjects. In addition, spectra were acquired with TE = 30.4 ms and TR = 5.8 s from individual phantoms containing glutamate and glutamine, with creatine added as a phase reference in both cases. These were used in a peak over- lap correction procedure described below.
Data Processing All in vivo data were zero-filled, exponentially line-
broadened by 3 Hz and Fourier transformed. The spec- tra were phased and baseline corrected if necessary using a second order polynomial function to remove baseline roll from any residual water peak in the spec- tral range from 4.0 to 0.0 ppm.
The FIDs from the glutamate and glutamine phan- toms were zero-filled and three spectra generated with exponential line-broadening of 6,7, and 8 Hz, respec- tively. The resulting spectra were summed pairwise (i.e., 8 Hz - 8 Hz etc.) in a glutamate:glutamine ratio of 2: 1. The concentration ratio of these metabolites has been measured in extract and in vivo to be in the range 1 .7-3.0.3 The linewidth of the creatine peak in the in vivo short TE spectrum was measured and the match- ing glutamate/glutamine phantom was selected. The in vivo spectrum (TE = 30.4 ms) was corrected for over- lap of the glutamate and glutamine resonances with the NA peak at 2.02 ppm by scaling the phantom reso- nances between 2.3 and 2.5 ppm to the in vivo data and subtracting. Overlap of the creatine and choline peaks was also addressed by subtracting the phantom scaled at the creatine peak. No corrections were made to the TE = 270 ms spectra. A similar method has recently been used to fit the entire normal proton spectrum.24 Data from the two spectra were used to calculate the transverse relaxation time 7” of each peak. Peak am- plitudes were used for the calculations as the linewidths were found to be equal across parameter sets and sub- jects. No correction was made for J-modulation of the lactate peak at the short echo time, because phantom studies indicated that the error would be small. Mea- surement of the relaxation times of the lactate peak were not made in the spectra of normal control sub- jects since the sensitivity of the acquisition relative to the low resting concentration did not allow visualiza- tion of the lactate peak in these spectra. Relaxation times in normals and patients were compared by t-test.
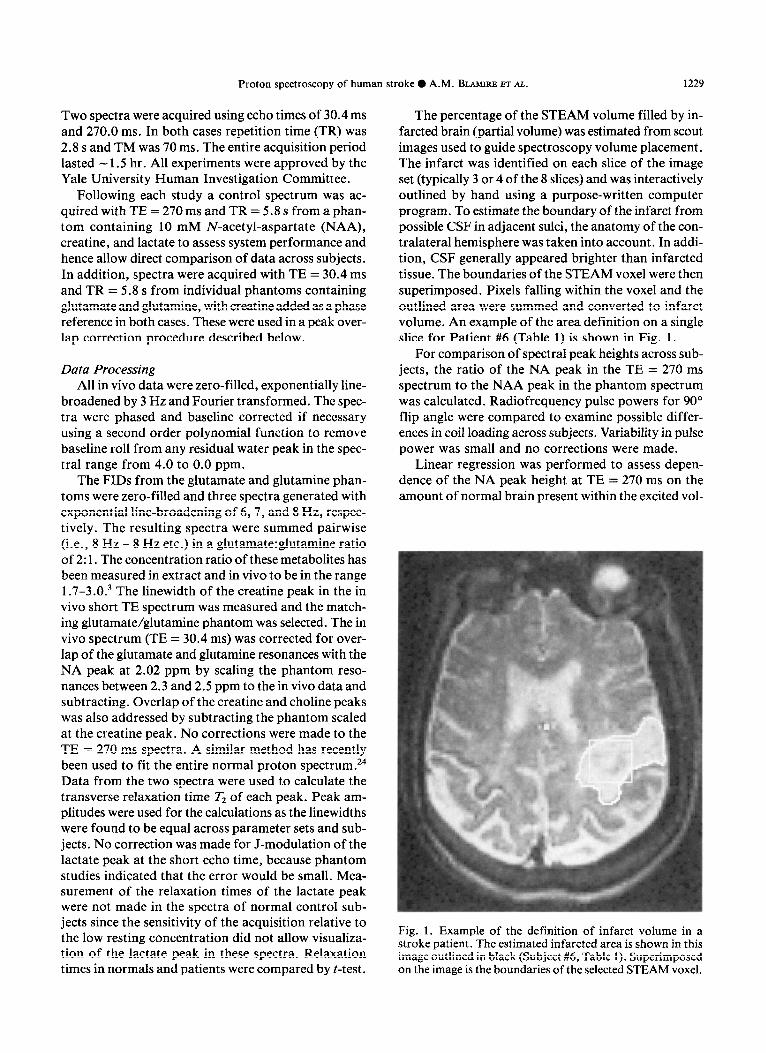
The percentage of the STEAM volume filled by in- farcted brain (partial volume) was estimated from scout images used to guide spectroscopy volume placement. The infarct was identified on each slice of the image set (typically 3 or 4 of the 8 slices) and was interactively outlined by hand using a purpose-written computer program. To estimate the boundary of the infarct from possible CSF in adjacent sulci, the anatomy of the con- tralateral hemisphere was taken into account. In addi- tion, CSF generally appeared brighter than infarcted tissue. The boundaries of the STEAM voxel were then superimposed. Pixels falling within the voxel and the outlined area were summed and converted to infarct volume. An example of the area definition on a single slice for Patient #6 (Table 1) is shown in Fig. 1.
For comparison of spectral peak heights across sub- jects, the ratio of the NA peak in the TE = 270 ms spectrum to the NAA peak in the phantom spectrum was calculated. Radiofrequency pulse powers for 90” flip angle were compared to examine possible differ- ences in coil loading across subjects. Variability in pulse power was small and no corrections were made.
Linear regression was performed to assess depen- dence of the NA peak height at TE = 270 ms on the amount of normal brain present within the excited vol-
Fig. 1. Example of the definition of infarct volume in a stroke patient. The estimated infarcted area is shown in this image outlined in black (Subject #6, Table 1). Superimposed on the image is the boundaries of the selected STEAM voxel.
1230 Magnetic Resonance Imaging 0 Volume 12, Number 8, 1994
ume. Reproducibility of the volume measurements was assessed by repeated assessment of volume in two data sets.
Validation of the STEAM Method for Transverse Relaxation Time Calculation
To validate the use of the two-point calculation of T2 with the STEAM sequence, multiple point phantom experiments were performed. The T2 time of the NAA peak was measured in the phantom described above using nonlocalized and STEAM localized acquisitions.
Nonlocalizedphantom study: Spectra were acquired from a sample of the phantom solution in a 2-cm di- ameter microsphere placed in a small Helmholz coil. Signals were acquired as FIDs using a hard 90” pulse and semi-selective refocussing pulse (1:2:2: 1) optimized at the NAA peak. Additional water suppression was performed using an adiabatic inversion prior to the hard pulse. Echo times of 10, 67, 135, 270, 405, and 540 ms were used.
STEAMlocalizedphantom study: Spectra were ac- quired using the same sequence and coil as in the in vivo study. Echo times of 67,135,270,405, and 540 ms were used. Peak heights in both data sets were measured and T, calculated by linear regression on a log-linear plot.
RESULTS
Measurement of Phantom T2 Using the STEAM Method
The calculated values of T2 for the nonlocalized and STEAM localized measurements were 995 ms (R = 0.98, p < .OOl) and 970 ms (R = 0.99, p < .OOOl), re- spectively. Calculation of T2 in the STEAM localized case using two points as in vivo gave a value of 965 mS (TE = 67 and 540 ms, which are similar fractions of the calculated T2 as the echo times used for the in vivo measurement). In this case of monoexponential decay, the two point measurement therefore had an error of cl% relative to a 5-point regression.
Normal subjects A typical raw spectrum acquired from the left inter-
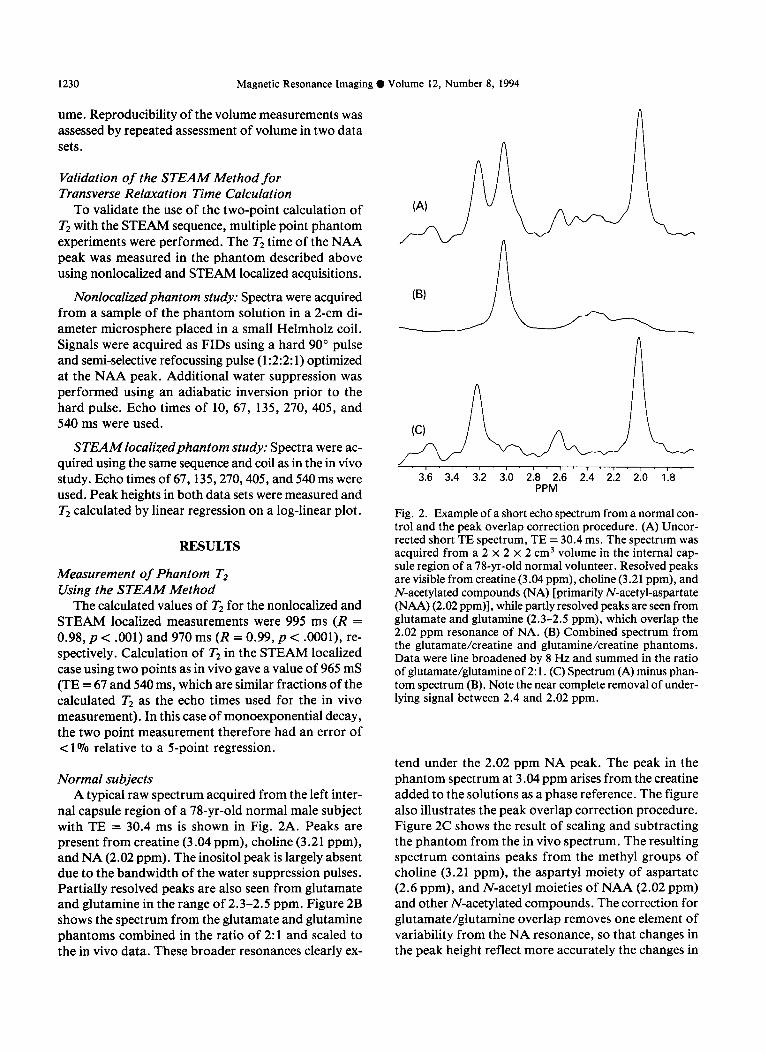
nal capsule region of a 7%yr-old normal male subject with TE = 30.4 ms is shown in Fig. 2A. Peaks are present from creatine (3.04 ppm), choline (3.21 ppm), and NA (2.02 ppm). The inositol peak is largely absent due to the bandwidth of the water suppression pulses. Partially resolved peaks are also seen from glutamate and glutamine in the range of 2.3-2.5 ppm. Figure 2B shows the spectrum from the glutamate and glutamine phantoms combined in the ratio of 2: 1 and scaled to the in vivo data. These broader resonances clearly ex-
, I I, I, I, I, I , ., , ., ,
3.6 3.4 3.2 3.0 2.8 2.6 2.4 2.2 2.0 1.8 PPM
Fig. 2. Example of a short echo spectrum from a normal con- trol and the peak overlap correction procedure. (A) Uncor- rected short TE spectrum, TE = 30.4 ms. The spectrum was acquired from a 2 x 2 x 2 cm3 volume in the internal cap- sule region of a 78-yr-old normal volunteer. Resolved peaks are visible from creatine (3.04 ppm), choline (3.21 ppm), and N-acetylated compounds (NA) [primarily N-acetyl-aspartate (NAA) (2.02 ppm)], while partly resolved peaks are seen from glutamate and glutamine (2.3-2.5 ppm), which overlap the 2.02 ppm resonance of NA. (B) Combined spectrum from the glutamate/creatine and glutamine/creatine phantoms. Data were line broadened by 8 Hz and summed in the ratio of glutamate/glutamine of 2: 1. (C) Spectrum (A) minus phan- tom spectrum (B). Note the near complete removal of under- lying signal between 2.4 and 2.02 ppm.
tend under the 2.02 ppm NA peak. The peak in the phantom spectrum at 3.04 ppm arises from the creatine added to the solutions as a phase reference. The figure also illustrates the peak overlap correction procedure. Figure 2C shows the result of scaling and subtracting the phantom from the in vivo spectrum. The resulting spectrum contains peaks from the methyl groups of choline (3.21 ppm), the aspartyl moiety of aspartate (2.6 ppm), and N-acetyl moieties of NAA (2.02 ppm) and other N-acetylated compounds. The correction for glutamate/glutamine overlap removes one element of variability from the NA resonance, so that changes in the peak height reflect more accurately the changes in

Proton spectroscopy of human stroke 0 A.M. BLAMIRE ET AL. 1231
Table 2. Calculated values of T2 in stroke patients and aged matched normal volunteers
Metabolite Stroke patients Aged matched normals t P
Choline 357 + 45 296 f 31 1.189 .25 Creatine 236 + 40 214 f 26 0.501 .62 NAA 259 + 28 339 f 40 1.305 .21 Lactate 780 k 257 - - -
Values are in mS and are mean 2 standard error (SE). No account was taken of possible differences in re- laxation time with anatomy. The selected volumes in the normal controls were placed to match that in a patient of similar age. Tz values are means from 7 patients and 13 normal controls. Student’s t-test was applied to examine differences between the patient and normal subjects. t statistic = f; significance level of f value (two-tailed) = p.
N-acetyl groups. The mean calculated values of T2 are given in Table 2.
Stroke Patients The patient spectra varied considerably among sub-
jects, particularly at short TE (30.4 ms). Variability in- cluded a large reduction in the choline, creatine, and NA resonances relative to the normal subjects (deter- mined by scaling all spectra to their control phantom) and an increase in the lactate peak at 1.33 ppm. Other
resonances attributed to lipids or proteins also appeared at 1.5 ppm and 0.9 ppm in some patients. Illustrative spectra from one patient are shown in Fig. 3 for both acquisitions. At TE = 30.4 ms (Fig. 3A) the lactate peak is clearly visible showing the distinctive 7.8 Hz splitting. A resonance is also present at 0.9 ppm. At TE = 270 ms (Fig. 3B) the peak at 0.9 ppm has essentially disap- peared, presumably due to short T2. The long echo time spectrum contains only the four main resonances.
The presence of additional peaks at 0.9 and 1.5 ppm
(A) TE = 30.4 ms, TR = 2.8 s, TM = 70 ms
(B) TE = 270.0 ms, TR = 2.8 s, TM = 70 ms
I ’ 1 m I - I ’ I * I’ I ‘I’ I m I’ I ’ I. I ’ I * 1 ’ 1 ’ 1 ’ 1 ’ 1 3.6 3.6 3.4 3.2 3.0 2.6 2.6 2.4 2.2 2.0 1.6 1.6 1.4 1.2 1.0 .6 .6 .4
PPN
Fig. 3. Example spectra from a stroke patient. Spectra from Patient #5 (Table l), a 90-yr-old male subject with a left internal capsule stroke. The patient was studied 5 days after onset of symptoms. The partial volume was measured as 26% infarcted tissue within the STEAM voxel. Lactate is present at 1.33 ppm and a further resonance at 0.9 ppm is also seen at the short echo time. (A) Short echo spectrum, TE = 30.4 ms. (B) Long echo spectrum, TE = 270.0 ms.
1232 Magnetic Resonance Imaging 0 Volume 12, Number 8, 1994
precluded measurement of the lactate TX relaxation time in 3 of the 13 patients due to overlap with the lac- tate resonance. In a further 3 patients, T2 could not be calculated because the metabolite concentrations were depressed below the noise level. The remaining 7 pa- tients gave good spectra showing lactate fully resolved from all other peaks. The mean values of T2 for the four peaks in the patient spectra are also given in Ta- ble 2.
A t-test comparison of the data for normals and pa- tients showed no significant differences in T2 for cre- atine, choline or NA. Comparison of the lactate peak was not performed since it was not observed in the spec- tra of control subjects.
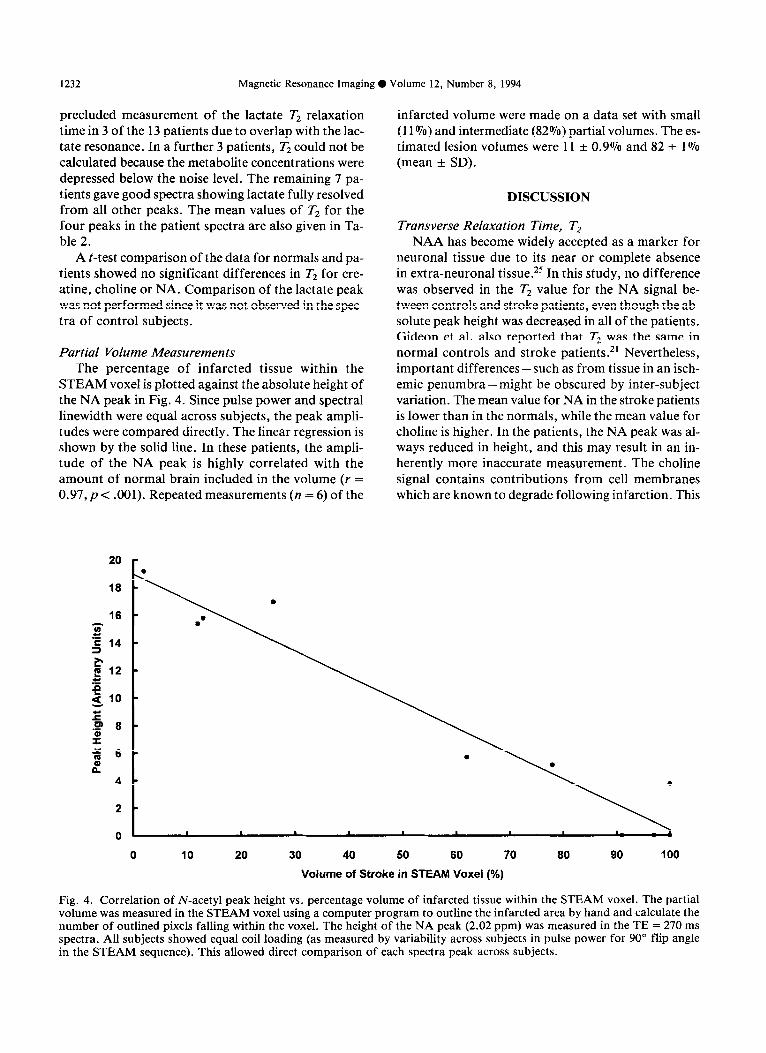
Partial Volume Measurements The percentage of infarcted tissue within the
STEAM voxel is plotted against the absolute height of the NA peak in Fig. 4. Since pulse power and spectral linewidth were equal across subjects, the peak ampli- tudes were compared directly. The linear regression is shown by the solid line. In these patients, the ampli- tude of the NA peak is highly correlated with the amount of normal brain included in the volume (r = 0.97,~ < .OOl). Repeated measurements (n = 6) of the
20 r
18
E 12 .t:
g 10
E .P 8 $
infarcted volume were made on a data set with small (11rJ70) and intermediate (82%) partial volumes. The es- timated lesion volumes were 11 + 0.9% and 82 t 1% (mean + SD).
DISCUSSION
Transverse Relaxation Time, T2 NAA has become widely accepted as a marker for
neuronal tissue due to its near or complete absence in extra-neuronal tissue. 25 In this study, no difference was observed in the T2 value for the NA signal be- tween controls and stroke patients, even though the ab- solute peak height was decreased in all of the patients. Gideon et al. also reported that T2 was the same in normal controls and stroke patients.*’ Nevertheless, important differences-such as from tissue in an isch- emit penumbra-might be obscured by inter-subject variation. The mean value for NA in the stroke patients is lower than in the normals, while the mean value for choline is higher. In the patients, the NA peak was al- ways reduced in height, and this may result in an in- herently more inaccurate measurement. The choline signal contains contributions from cell membranes which are known to degrade following infarction. This
0 10 20 30 40 50 60 70 80 90 100
Volume of Stroke in STEAM Voxei (%)
Fig. 4. Correlation of N-acetyl peak height vs. percentage volume of infarcted tissue within the STEAM voxel. The partial volume was measured in the STEAM voxel using a computer program to outline the infarcted area by hand and calculate the number of outlined pixels falling within the voxel. The height of the NA peak (2.02 ppm) was measured in the TE = 270 ms spectra. All subjects showed equal coil loading (as measured by variability across subjects in pulse power for 90” flip angle in the STEAM sequence). This allowed direct comparison of each spectra peak across subjects.
Proton spectroscopy of human stroke 0 A.M. BLAMIRE ET AL. 1233
may lead to an increase in the mobility of the tri-methyl- amine groups and hence an increased T2. In addition, partial volume effects may further obscure small dif- ferences, as discussed below.
Short T2 species or J-coupled resonances which de- cay rapidly, such as those from glutamate and gluta- mine, are absent from long echo time spectra, but at short echo times the contribution made to the major peaks by these unresolved resonances cannot be ig- nored. Subtraction of suitably line-broadened and scaled phantom spectra from the in vivo spectra pro- vided a simple and robust method to correct for over- lap of glutamate/glutamine and NA. This method relies on the assumed ratio of glutamate and glutamine. Vi- sual inspection of the subtracted spectra was the only criterion used in deciding if the ratio and scaling fac- tor were correct. Future development of this method is required to make it still more robust.24 Ideally, spec- tral editing methods should be used to isolate the ex- act contribution from each species and therefore assure precise spectral subtraction. Alternative methods using curve fitting require knowledge of the modulation pat- terns and are difficult to formulate for J-coupled spe- cies. Nonidealities in lineshape due to residual eddy currents or B0 shifts from gradient switching are dif- ficult to include in curve fitting methods, but are au- tomatically compensated in this subtraction method, since they are present in both the phantom and the in vivo spectra.
Using this subtraction method, we obtained a value for the T2 of NA (339 t- 40 ms) that is slightly higher than other values in the literature (260-300 ms).1g-21 This is probably due to the correction for gluta- matejglutamine overlap, since without this correction the apparent peak height at 2.02 ppm is increased by approximately lo-20% at the short echo time, leading to a faster apparent decay rate. This method was also applied to the patient data under the assumption that the relative (but not absolute) concentrations of glu- tamate and glutamine remain unchanged following stroke. Garcia et al., in a study of Rhesus monkeys fol- lowing unilateral MCA occlusion, reported increased levels of both glutamate and glutamine relative to the contralateral hemisphere, but the glutamate:glutamine ratio was unchanged.26
Previous studies have not examined the relaxation properties of lactate in any sizeable patient population. Sappey-Marinier et al.*’ reported a value for T2 of 225 ms in one patient, whereas Frahm et al.r8 reported a single value of 1200 ms. The mean value in this study has a large variance with values in individual subjects ranging from 186 to 2110 ms. This scatter may be ex- plained by the heterogeneity of the cerebral infarcts studied with respect to anatomical location, amount of
cerebral edema and presence of macrophages.*’ Dif- ferences in the state of immobilization of the molecules or metal ion complexation of the lactate ion will also influence the measured relaxation times. However, no correlation was found between infarct age and relax- ation time (r = 0.34, p = .45). Measurement of the re- laxation properties of water in brain lesions also show large variability. Measurements of the T2 of brain edema in experimental lesions in animals and also in human pathology have demonstrated increases of - 100070, which correlate well with the increase in wa- ter content of the tissue. 28 This suggests an increase in the amount of free water. If this component is in the same compartment as the measured metabolites, a sim- ilar increase in metabolite T2s might be expected. Sig- nificant changes in the T2 values for creatine, choline, and NA were not observed. This suggests that their lo- cal environment has not been significantly affected by the infarction, adding weight to the argument that the signals originate from normal tissue. Lactate, however, showed a wide range of T2 values across subjects. Lac- tate which arises from agonal metabolism immediately after infarction would dissipate by diffusion and tis- sue repair processes. Continuous lactate production due to incomplete infarction or white cell infiltration27 may also contribute to elevated lactate. Therefore, the possibility of lactate signals from compartments with different T2 values does exist.
Variation in the absolute amount of lactate-and hence in the signal-to-noise ratio of the spectral peak - will affect the error of individual measurements. De- spite the large variance, the mean lactate T2 was longer than the other metabolites, suggesting that the large lactate peak detected at TE = 270 ms partly reflects changes in relaxation as well as increases in lactate con- centration. The wide scatter in observed values in stroke impedes efforts at exact quantitation based on precal- culated mean relaxation values. Thus, patient specific determination of relaxation times may be required for precise lactate quantitation.
Previous studies 18-21 have used more than two points to calculate relaxation times. Notably, Narayana et all9 obtained spectra at five echo times to calculate T2 val- ues for creatine, choline and NA in normal subjects. Comparison of the T2 values obtained here with the values of Narayana et al. shows agreement within 10%. The two point method used here assumes that decay is monoexponential. Overlap of the NA peak and other resonances may violate this assumption, but the cor- rection process for overlap with the glutamate and glutamine peaks should have removed the largest con- founding component. Improved accuracy would cer- tainly result from using more points in the fitting procedure, however patient studies are constrained by
1234 Magnetic Resonance Imaging 0 Volume 12, Number 8, 1994
subject compliance, and our unsedated patients were unable to tolerate scanning periods longer than those used here. Also, the useable echo times for Tz mea- surement of lactate are restricted by the STEAM se- quence to a short echo and multiples of 270 ms for refocussing of J-modulation. A TE of 540 ms is not likely to yield sufficient signal to be useful.
Partial Volume Correlation Partial volume measurements were made using all
slices of the spin-echo images in which infarcted tissue was visible (typically 3 or 4 slices). The contributing fac- tors to the accuracy of the measurement depend on the actual infarct volume. A partial volume of 1% is equiv- alent to seven pixels in the MR image. The accuracy with which the volume is delineated from normal tis- sue or CSF can therefore have a significant affect on the estimated value. The main source of error is likely to be inclusion of pixels at the periphery of the infarct which are in fact within normal brain. Considering first the error as a fraction of the measured volume itself, for a small infarct, the ratio of the number of pixels defining the lesion boundary to the number of pixels within the lesion (i.e., perimeter to area) is high. Thus incorrect identification of the boundary will have a sig- nificant effect on the volume estimate. For larger le- sions, the same ratio is smaller and the relative effect of incorrectly identified pixels is reduced. However, when considering the error as a fraction of the total pos- sible infarct volume in the voxel, the effect is reversed. Small lesions contain only a small number of total pix- els, therefore the total number of incorrectly identified pixels will be less than for large lesions. In the case of very large lesions (e.g., Patient #l 1, Table 1) it was un- necessary actually to define the boundaries of the in- farct, since the voxel clearly resides entirely within the lesion (partial volume = 100%). Multiple measure- ments of partial volume on two data sets (with small and intermediate partial volumes) resulted in standard deviations of - 1% of the total possible STEAM voxel for both sets. A further source of error in the calcula- tion is the conversion of rectangular voxels into a vol- ume. It was assumed that each voxel contained either fully normal or fully infarcted tissue. No attempt was made to correct for this limitation.
As described, the accuracy of the volume measure- ment is dependent on correctly identifying the infarct. High image intensity does not necessarily indicate in- farction but may represent edema without infarction. Also, signal from CSF in sulci bordering the infarct may be difficult to differentiate from the infarct itself. Clearly including such regions in the measurement will tend to overestimate the infarct volume, but this would weaken the correlation.
When taken in conjunction with the observation that the T2 of the NA peak appears unchanged, the corre- lation suggests that the NA signal arises primarily from normal brain tissue. This supports the theory that NAA is a neuronal marker and that processes which destroy neurons will cause a reduction in the observed NA sig- nal in ‘H spectra. We have previously reported that the NA signal measured by l-dimensional spectroscopic imaging declined over several months following infarc- tion.11,15 If the NA signal does indeed originate from normal neurons, stroke-related neuronal loss must have continued throughout this period.
In summary, the relaxation properties of lactate ap- pear to be widely variable in human brain infarcts. This is not surprising, given the heterogeneity of infarcts and regions of brain involved. The lactate signal probably originates from several different compartments, so that the assumption of mono-exponential signal decay may not be valid. The STEAM technique limits the useable echo times for observation of lactate to short times, 270 ms and possibly 540 ms (depending on system per- formance). Characterization of lactate Tz is thus biased towards the compartments with highest concentration and longest Tz. It is therefore likely that long echo time measurements of lactate cannot be quantitated with any great accuracy. The possibility of partial vol- ume errors must be considered when serial measure- ments are made to follow metabolite changes over time, especially if a single volume is used. Slight changes in voxel position may lead to spurious changes in signal due to variable partial volume effects. Also, swelling of tissue due to edema may cause transient changes in partial volume effects, even with precise voxel place- ment. Spectroscopic imaging with a short echo time may therefore be the most useful clinical measurement, since partial volume effects will be reduced by the small voxel size and relaxation effects on peak amplitude are minimized, allowing more accurate quantitation.
Acknowledgments-This work was supported by a grant from the National Institute of Health #NS21708 and a National Stroke Asso-
ciation fellowship to AMB.
REFERENCES
Prichard, J.W.; Shulman, R.G. NMR spectroscopy of brain metabolism in vivo. Annu. Rev. Neurosci. 9:61- 85; 1986. Frahm, J.; Bruhn, H.; Gyngell, M.L.; Merboldt, K.D.; Hanicke, W.; Sauter, R. Localized high-resolution pro- ton NMR spectroscopy using stimulated echoes: Initial applications to human brain in vivo. Magn. Reson. Med. 9:79-93; 1989. Rothman, D.L.; Hanstock, C.C.; Petroff, O.A.C.; Novotny, E.J.; Prichard, J.W.; Shulman, R.G. Local-
Proton spectroscopy of human stroke 0 A.M. BLAMIRE ET AL. 1235
ized ‘H NMR spectra of glutamate in human brain. Magn. Reson. Med. 25:94-106; 1992.
4. Wolinsky, J.S.; Narayana, P.A.; Fenstermacher, M.J. Proton magnetic resonance spectroscopy in multiple scle- rosis. Neurology 40:1764-1769; 1990.
5. Larsson, K.B.W.; Christiansen, P.; Jensen, M.; Frederik- sen, J.; Heltberg, A.; Olsen, J.; Henriksen, 0. Localized in vivo proton spectroscopy in the brain of patients with multiple sclerosis. Magn. Reson. Med. 22:23-31; 1991.
6. Matthews, P.M.; Francis, G.; Antel, J.; Arnold, D.L. Proton magnetic resonance spectroscopy for metabolic characterization of plaques in multiple sclerosis. Neurol- ogy 41:1251-1256; 1991.
7. Segebarth, C.M.; Baleriaux, D.F.; Luyten, P.R.; den Hollander, J.A. Detection of metabolic heterogeneity of human intracranial tumors in vivo by ‘H NMR spectro- scopic imaging. Magn. Reson. Med. 13:62-76; 1990.
8. Gill, S.S.; Thomas, D.G.T.; Van Bruggen, N.; Gadian, D.G.; Peden, C.J.; Bell, J.D.; Cox, I.J.; Menon, D.K.; Iles, R.A.; Bryant, D.J.; Coutts, G.A. Proton MR spec- troscopy of intracranial tumours: In vivo and in vitro studies. J. Comput. Assist. Tomogr. 14:497-504; 1990.
9. Berkelbach van der Sprenkel, J.W.; Luyten, P.R.; van Rijen, P.C. ; Tulleken, C . A.F. ; den Hollander , J. A. Ce- rebral lactate detected by regional proton magnetic res- onance spectroscopy in a patient with cerebral infarction. Stroke 19:1556-1560; 1988.
10. Bruhn, H.; Frahm, J.; Gyngell, M.L.; Merboldt, K.D.; Hanicke, W.; Sauter, R. Cerebral metabolism in man af- ter acute stroke: New observations using localized pro- ton NMR spectroscopy. Magn. Reson. Med. 9:126-131; 1991.
11. Graham, G.D.; Blamire, A.M.; Howseman, A.M.; Rothman, D.L.; Fayad, P.B.; Brass, L.M.; Petroff, O.A.C.; Shulman, R.G.; Prichard, J.W. Proton mag- netic resonance spectroscopy of cerebral lactate and other metabolites in stroke patients. Stroke 23:333-340; 1992.
12. Felber, S.R.; Aichner, ET.; Sauter, R.; Gerstenbrand, F. Combined magnetic resonance imaging and proton magnetic resonance spectroscopy of patients with acute stroke. Stroke 23: 1106-l 110; 1992.
13. Fenstermacher, M.J.; Narayana, P.A. Serial proton mag- netic resonance spectroscopy of ischemic brain injury in humans. Invest. Radiol. 25:1034-1039; 1990.
14. Ford, CC.; Griffey, R.H.; Matwiyoff, N.A.; Rosen- berg, G.A. Multivoxel ‘H-MRS of stroke. Neurology 42:1408-1412; 1992.
15. Graham, G.D.; Blamire, A.M.; Rothman, D.L.; Brass, L.M.; Fayad, P.B.; Petroff, O.A.C.; Prichard, J.W. Early temporal variation of cerebral metabolites after hu- man stroke: A proton magnetic resonance spectroscopy study. Stroke 24:1891-1896; 1993.
16. Gideon, P.; Henriksen, 0.; Speriing, B.; Christiansen, P.; Olsen, T.S.; Jorgensen, H.S.; Arlien-Soborg, P. Early
time course of N-acetylaspartate, creatine and phospho- creatine, and compounds containing choline in the brain after acute stroke. Stroke 23:1566-1572; 1992.
17. Hanstock,C.C.;Rothman,D.L.;Prichard, J.W.; Jue,T.; Shulman, R.G. Spatially localized *H NMR spectra of metabolites in the human brain. Proc. Natl. Acad. Sci. USA 85:1821-1825; 1988.
18. Frahm, J.; Bruhn, H.; Gyngell, M.L.; Merboldt, K.D.; Hanicke, W.; Sauter, R. Localized proton NMR spec- troscopy in different regions of the human brain in vivo. Relaxation times and concentrations of cerebral metab- olites. Magn. Reson. Med. 11:47-63; 1989.
19. Narayana, P.A.; Johnston, D.; Flamig, D.P. In vivo pro- ton magnetic resonance spectroscopy studies of human brain. Magn. Reson. Imaging 9:303-308; 1991.
20. Sappey-Marinier, D.; Calabrese, G.; Hetherington, H.P.;Fisher,S.N.G.;Deicken,R.;VanDyke,C.;Fein, G.; Weiner, M.W. Proton magnetic resonance spectros- copy of human brain: Applications to normal white mat- ter, chronic infarction and MRI white matter signal hyperintensities. Magn. Reson. Med. 26:313-327; 1992.
21. Gideon, P.; Henriksen, 0. In vivo relaxation of N-acetyl- aspartate, creatine plus phosphocreatine, and choline containing compounds during the time course of brain infarction: A proton MRS study. Magn. Reson. Imag- ing 10:983-988; 1992.
22. Hetherington, H.P.; Pan, J. W.; Mason, G.F.; Ponder, S.L.; Tweig, D.B.; Vaughan, J.T.; Pohost, G.M. High resolution ‘H spectroscopic imaging of human brain at high field: Quantitative evaluation of gray and white mat- ter metabolite differences. In: Book of abstracts: Twelfth Annual Meeting of the Society of Magnetic Resonance in Medicine. Berkeley, CA:SMRM; 1993: 127.
23. Frahm, J.; Merboldt, K.D.; Hanicke, W. Localized pro- ton spectroscopy using stimulated echoes. J. Magn. Reson. 72:502-508; 1987.
24. Provencher, S.W. Estimation of metabolite concentra- tions from localized in vivo proton NMR spectra. Magn. Reson. Med. 30:672-679; 1993.
25. Nadler, J.V.; Cooper, J.R. N-Acetyl-L-aspartic acid con- tent of human neural tumours and bovine peripheral ner- vous tissues. J. Neurochem. 19:313-319; 1972.
26. Garcia, J.H.; Lossinsky, A.S.; Kauffman, EC.; Con- ger, K.A. Neuronal ischemic injury: Light microscopy, ultrastructure and biochemistry. Acta Neuropathol. (Berl) 43:85-95; 1978.
27. Petroff, O.A.C.; Graham, G.D.; Blamire, A.M.; Al- Rayess, M.; Rothman, D.L.; Fayad, P.B.; Brass, L.M.; Shulman, R.G.; Prichard, J.W. Spectroscopic imaging of stroke in humans: Histopathology correlates of spec- tral changes. Neurology 42:1349-1354; 1992.
28. Fu., Y.; Tanaka., K.; Nishimura, S. Evaluation of brain edema using magnetic resonance proton relaxation times. Adv. Neurol. 52:165-176; 1990.