Proteome-wide survey of phosphorylation patterns affected by nuclear DNA polymorphisms in...
19
Riaño-Pachón et al. BMC Genomics 2010, 11:411 http://www.biomedcentral.com/1471-2164/11/411 Open Access RESEARCH ARTICLE © 2010 Riaño-Pachón et al; licensee BioMed Central Ltd. This is an Open Access article distributed under the terms of the Creative Com- mons Attribution License (http://creativecommons.org/licenses/by/2.0), which permits unrestricted use, distribution, and reproduc- tion in any medium, provided the original work is properly cited. Research article Proteome-wide survey of phosphorylation patterns affected by nuclear DNA polymorphisms in Arabidopsis thaliana Diego Mauricio Riaño-Pachón †1,2 , Sabrina Kleessen †1 , Jost Neigenfind 1 , Pawel Durek 1,4 , Elke Weber 1,5 , Wolfgang R Engelsberger 1 , Dirk Walther 1 , Joachim Selbig 2 , Waltraud X Schulze 1 and Birgit Kersten* 1,3 Abstract Background: Protein phosphorylation is an important post-translational modification influencing many aspects of dynamic cellular behavior. Site-specific phosphorylation of amino acid residues serine, threonine, and tyrosine can have profound effects on protein structure, activity, stability, and interaction with other biomolecules. Phosphorylation sites can be affected in diverse ways in members of any species, one such way is through single nucleotide polymorphisms (SNPs). The availability of large numbers of experimentally identified phosphorylation sites, and of natural variation datasets in Arabidopsis thaliana prompted us to analyze the effect of non-synonymous SNPs (nsSNPs) onto phosphorylation sites. Results: From the analyses of 7,178 experimentally identified phosphorylation sites we found that: (i) Proteins with multiple phosphorylation sites occur more often than expected by chance. (ii) Phosphorylation hotspots show a preference to be located outside conserved domains. (iii) nsSNPs affected experimental phosphorylation sites as much as the corresponding non-phosphorylated amino acid residues. (iv) Losses of experimental phosphorylation sites by nsSNPs were identified in 86 A. thaliana proteins, among them receptor proteins were overrepresented. These results were confirmed by similar analyses of predicted phosphorylation sites in A. thaliana. In addition, predicted threonine phosphorylation sites showed a significant enrichment of nsSNPs towards asparagines and a significant depletion of the synonymous substitution. Proteins in which predicted phosphorylation sites were affected by nsSNPs (loss and gain), were determined to be mainly receptor proteins, stress response proteins and proteins involved in nucleotide and protein binding. Proteins involved in metabolism, catalytic activity and biosynthesis were less affected. Conclusions: We analyzed more than 7,100 experimentally identified phosphorylation sites in almost 4,300 protein- coding loci in silico, thus constituting the largest phosphoproteomics dataset for A. thaliana available to date. Our findings suggest a relatively high variability in the presence or absence of phosphorylation sites between different natural accessions in receptor and other proteins involved in signal transduction. Elucidating the effect of phosphorylation sites affected by nsSNPs on adaptive responses represents an exciting research goal for the future. Background Protein phosphorylation is one of the most important and best characterized post-translational modification (PTM) among the hundreds so far described [1-3]. Reversible site-specific phosphorylation of serine (S), threonine (T), or tyrosine (Y) by concerted actions of kinases and phosphatases plays a central role in virtually all cellular processes [4], especially in cell signaling of prokaryotes and eukaryotes, including plants [5,6]. Phos- phorylation of a protein can occur at multiple sites and can be catalyzed by different kinases, often in crosstalk with other types of PTM [1,7,8]. Phosphorylation/ dephosphorylation of specific amino acids in proteins can * Correspondence: [email protected] 1 Max Planck Institute of Molecular Plant Physiology, Am Mühlenberg 1, 14476 Potsdam-Golm, Germany † Contributed equally Full list of author information is available at the end of the article
-
Upload
independent -
Category
Documents
-
view
4 -
download
0
Transcript of Proteome-wide survey of phosphorylation patterns affected by nuclear DNA polymorphisms in...

Riaño-Pachón et al. BMC Genomics 2010, 11:411http://www.biomedcentral.com/1471-2164/11/411
Open AccessR E S E A R C H A R T I C L E
Research articleProteome-wide survey of phosphorylation patterns affected by nuclear DNA polymorphisms in Arabidopsis thalianaDiego Mauricio Riaño-Pachón†1,2, Sabrina Kleessen†1, Jost Neigenfind1, Pawel Durek1,4, Elke Weber1,5, Wolfgang R Engelsberger1, Dirk Walther1, Joachim Selbig2, Waltraud X Schulze1 and Birgit Kersten*1,3
AbstractBackground: Protein phosphorylation is an important post-translational modification influencing many aspects of dynamic cellular behavior. Site-specific phosphorylation of amino acid residues serine, threonine, and tyrosine can have profound effects on protein structure, activity, stability, and interaction with other biomolecules. Phosphorylation sites can be affected in diverse ways in members of any species, one such way is through single nucleotide polymorphisms (SNPs). The availability of large numbers of experimentally identified phosphorylation sites, and of natural variation datasets in Arabidopsis thaliana prompted us to analyze the effect of non-synonymous SNPs (nsSNPs) onto phosphorylation sites.
Results: From the analyses of 7,178 experimentally identified phosphorylation sites we found that: (i) Proteins with multiple phosphorylation sites occur more often than expected by chance. (ii) Phosphorylation hotspots show a preference to be located outside conserved domains. (iii) nsSNPs affected experimental phosphorylation sites as much as the corresponding non-phosphorylated amino acid residues. (iv) Losses of experimental phosphorylation sites by nsSNPs were identified in 86 A. thaliana proteins, among them receptor proteins were overrepresented.
These results were confirmed by similar analyses of predicted phosphorylation sites in A. thaliana. In addition, predicted threonine phosphorylation sites showed a significant enrichment of nsSNPs towards asparagines and a significant depletion of the synonymous substitution. Proteins in which predicted phosphorylation sites were affected by nsSNPs (loss and gain), were determined to be mainly receptor proteins, stress response proteins and proteins involved in nucleotide and protein binding. Proteins involved in metabolism, catalytic activity and biosynthesis were less affected.
Conclusions: We analyzed more than 7,100 experimentally identified phosphorylation sites in almost 4,300 protein-coding loci in silico, thus constituting the largest phosphoproteomics dataset for A. thaliana available to date. Our findings suggest a relatively high variability in the presence or absence of phosphorylation sites between different natural accessions in receptor and other proteins involved in signal transduction. Elucidating the effect of phosphorylation sites affected by nsSNPs on adaptive responses represents an exciting research goal for the future.
BackgroundProtein phosphorylation is one of the most importantand best characterized post-translational modification(PTM) among the hundreds so far described [1-3].
Reversible site-specific phosphorylation of serine (S),threonine (T), or tyrosine (Y) by concerted actions ofkinases and phosphatases plays a central role in virtuallyall cellular processes [4], especially in cell signaling ofprokaryotes and eukaryotes, including plants [5,6]. Phos-phorylation of a protein can occur at multiple sites andcan be catalyzed by different kinases, often in crosstalkwith other types of PTM [1,7,8]. Phosphorylation/dephosphorylation of specific amino acids in proteins can
* Correspondence: [email protected] Max Planck Institute of Molecular Plant Physiology, Am Mühlenberg 1, 14476 Potsdam-Golm, Germany† Contributed equallyFull list of author information is available at the end of the article
© 2010 Riaño-Pachón et al; licensee BioMed Central Ltd. This is an Open Access article distributed under the terms of the Creative Com-mons Attribution License (http://creativecommons.org/licenses/by/2.0), which permits unrestricted use, distribution, and reproduc-tion in any medium, provided the original work is properly cited.

Riaño-Pachón et al. BMC Genomics 2010, 11:411http://www.biomedcentral.com/1471-2164/11/411
Page 2 of 19
have profound effects on protein structure, activity, sta-bility, subcellular localization and interaction with otherbiomolecules [4], and it can create binding sites for spe-cific modular domains [9]. Interestingly, in the floweringplant Arabidopsis thaliana, the percentage of genes pre-dicted to encode protein kinases (3% of the predictedproteome) is about twice as high as in mammals [10,11].Protein phosphorylation events have been found to beconnected with the plant's response to diverse intrinsicand extrinsic factors, such as light, invasion of pathogens,hormones, temperature stress, and nutrient starvation[6,12,13].
Recent progress in mass spectrometry (MS)-basedtechnologies and phosphopeptide enrichment methodshave allowed to map in vivo phosphorylation sites for awide variety of organisms in a high throughput manner[12-14]. This progress has prompted the creation of dedi-cated web-resources in the plant field, such as PhosPhAt[15] and P3DB [16]. The availability of experimentallyverified A. thaliana phosphorylation sites now enables insilico analyses of different phosphorylation site patternson a proteome-wide scale. Recently, the conservation ofprotein phosphorylation sites within selected gene fami-lies could be shown in different plant species [7,17]. Innon-plant species, where the databases of phosphoryla-tion sites are much more comprehensive than in A. thali-ana, the in silico analysis of phosphoproteomic data hasalready produced interesting insights into evolutionaryfeatures of protein phosphorylation [18-21].
A loss of a single phosphorylation site by a non-synony-mous (ns) single nucleotide polymorphism (SNP) thatmutates the amino acids S, T, or Y at a phosphorylationsite into any other amino acid can have profound effectson the molecular properties of the corresponding pro-tein. In particular, the disruption of phosphorylation sitesby such non-synonymous mutations can be associatedwith human diseases such as cancer. For example, thephosphorylation of T286 in wildtype cyclin D1 by thekinase GSK3B initiates its nuclear export and subsequentdegradation in the cytoplasm [22]. The authors suggestedthat the loss of this phosphorylation site by a somaticmutation is involved in causing nuclear accumulation ofcyclin D1 in esophageal cancer and a generally increasedoncogenic potential.
In A. thaliana, genomic DNA polymorphisms havebeen studied extensively during the last few years, ini-tially using gene expression microarrays in order to iden-tify single-feature polymorphisms (SFPs) [23]. EspeciallySNPs, in several inbreed accessions can be applied tostudy the effects of these polymorphisms on othergenome-wide features, such as phosphorylation sites.
Given the importance of protein phosphorylation, wewere interested to study how phosphorylation sites andtheir patterns are affected by natural variation, namely
nsSNPs in A. thaliana. In this study we analyzed the dis-tribution of all phosphorylation sites taken from therecent version of PhosPhAt (version 3.0) [15] in the pro-teome of A. thaliana and we related their position to nsS-NPs thus identifying losses of phosphorylation sites. Forthat purpose, we made use of A. thaliana SNPs identifiedrecently by applying re-sequencing arrays [24,25] and byre-sequencing with ultra-deep sequencing technologiessuch as Illumina/Solexa [26]. Our aim was to analyze howthe A. thaliana phosphorylation sites and their patternsare influenced by these nsSNPs.
Because the current dataset of experimental phospho-rylation sites in A. thaliana is far away from covering theentire proteome, the results obtained from the experi-mental phosphorylation site dataset were contrasted withresults produced by similar analyses of predicted phos-phorylation sites in A. thaliana to attain more globalhypotheses on protein phosphorylation patterns and theinfluence of nsSNPs on them.
ResultsDescription of the phosphorylation site sets used in this studyExperimental phosphorylation sites from different phos-phoproteomic studies in A. thaliana [27-39] were takenfrom PhosPhAt (version 3.0) [15] comprising a total of7,178 unambiguously identified phosphopeptides map-ping to 4,252 protein-coding loci. The proportional fre-quency of phosphorylated S, T, Y residues (pS, pT, pY) inthis experimental set was similar to distributionsreported previously, with 70.7% of pS, 20.7% pT, and 8.6%pY [34].
We were able to confirm that the majority of phospho-rylation sites (71%) occur outside conserved proteindomains, as noted previously [34]. Specifically, pS and pToccurred within domains in only 22.4% and 36.8% of thecases. However, phosphorylated tyrosines were locatedinside protein domains in 49.8% of the cases. Similarbehavior was observed for the set of predicted phospho-sites (data not shown).
The set of predicted phosphorylation sites used in thisstudy was also taken from PhosPhAt (version 3.0) [15]. Itcomprised 75,296 high-confidence phosphopeptides(score ≥1; see Methods), identified in 21,711 protein-cod-ing loci. The relative frequency of phosphorylated S, T, Yresidues in this set of predicted phosphorylation sites was37.0% pS, 42.5% pT and 20.5% pY.
Based on our sets of experimentally identified as well ashigh-confidence predicted phosphorylation sites (score≥1), we looked for under- and overrepresented plant GOSlim terms among different sets of phosphoproteins: i) allproteins containing at least one pS; ii) all proteins con-taining at least one pT; iii) all proteins containing at leastone pY; iv) all proteins containing at least one pS or at

Riaño-Pachón et al. BMC Genomics 2010, 11:411http://www.biomedcentral.com/1471-2164/11/411
Page 3 of 19
least one pT (p[ST]); v) all proteins containing at least onephosphorylated residue (p[STY]) (Additional file 1 forexperimental phosphorylation sites; Additional file 2 forpredicted phosphorylation sites). A comparison of theGO annotation of the p[STY]-protein sets based onexperimental and predicted sites is shown in the Figureincluded in Additional file 3. In both, experimental andpredicted datasets, the terms "catalytic activity", "kinaseactivity", "transferase activity", and "protein modificationprocess" were overrepresented among proteins contain-ing p[STY] sites. Also, several stress-related terms werefound overrepresented in both. In experimental as well aspredicted p[STY]-protein sets, proteins with function in"translation", "RNA binding", "biosynthetic process" weredetermined as underrepresented. However, the plant GOSlim terms "transcription factor activity" and "transcrip-tion regulator activity" were found overrepresentedamong the predicted p[STY]-protein set, while underrep-resented in the experimental set.
For both, experimental and predicted phosphorylationsites, we then computed the agreement of GO Slim termsbetween protein sets representing different sites or com-bination of sites. We evaluated the significance (correctedp-value, FDR ≤5E-2) of the correlation between the fol-lowing pairs of datasets: pS-pT, pS-pY, pS-p[ST], pS-p[STY], pT-pY, pT-p[ST], pT-p[STY], pY-p[ST], pY-p[STY]. For each dataset in the pair we registeredwhether a given GO Slim term was present or absent, andthen compared the obtained binary series using the Pear-son's correlation coefficient. None of the compared pro-files were correlated in the experimental dataset, but inthe dataset of predicted phosphoproteins we found amoderate correlation of overrepresented plant GO Slimterm profiles between pS-p[ST] and pY-pT, with correla-tion coefficients of 0.39 and 0.38, respectively.
Distribution of phosphorylation sites across proteinsMost of the A. thaliana phosphoproteins contained onlya few experimental phosphorylation sites, whereas a fewproteins were phosphorylation hubs with a large numberof phosphorylation sites. Noticeably, there is a long tail ofthe distribution of the number of phosphosites per pro-tein, i.e., the proportion of proteins with a large numberof phosphorylation sites is higher than expected bychance alone. This is especially evident for the predictedphosphosites. Additionally, proteins with a single phos-phorylation site appear more often than expected, forboth the experimental sites and the predicted sites, high-lighting the physiological importance of phosphorylation(Figure 1; Additional file 4). Proteins with a large numberof phosphorylation sites are of special interest as poten-tial sites of integration (hubs) in regulatory pathways.
Table 1 lists the 31 proteins with nine or more experi-mentally determined phosphorylation sites. One third of
these proteins are involved in metabolic processes associ-ated with nucleic acids (Gene Ontology term GO: 6139;from the biological process ontology), especially withRNA splicing (nine out of the ten proteins). Three out ofthose nine proteins were also identified to includehotspots of experimental phosphorylation sites for a win-dow size of 10 amino acids (see below and Table 2),namely the following proteins: AT5G52040.1,AT5G64200.1, AT3G55460.1. The protein with the mostphosphorylation sites was ATRSP41, an arginine/serine-rich splicing factor 41 (AT5G52040.1) which had 22experimentally verified phosphorylation sites. In ahuman study, the serine/arginine repetitive matrix pro-tein 2 (SRRM2) with even 142 pS sites holds the top of thelist of human proteins with the highest number of pS sites[18]. With progressing identification of A. thaliana phos-phorylation sites in future studies and under variousenvironmental conditions, we expect that also some A.thaliana proteins might be detected to bear even morephosphorylation sites than the 22 sites found inATRSP41.
Phosphorylation hotspots within proteinsFor proteins with many experimentally identified phos-phorylation sites, we analyzed the location of those siteswithin the protein, to identify potential hotspots of phos-phorylation.
Based on the experimental sites, we determined severalhotspot-containing proteins using window sizes of 5, 10,15, and 20 amino acids (Additional file 5). We thenapplied the phosphorylation hotspot analysis to the pre-dicted phosphorylation site dataset to get a more globalview on potential phosphorylation hotspots in the A.thaliana proteome. For predicted sites as well, we wereable to determine several phosphorylation hotspots inproteins for window sizes of 10, 20, 30 and 40 amino acidresidues (Additional file 6 and 7).
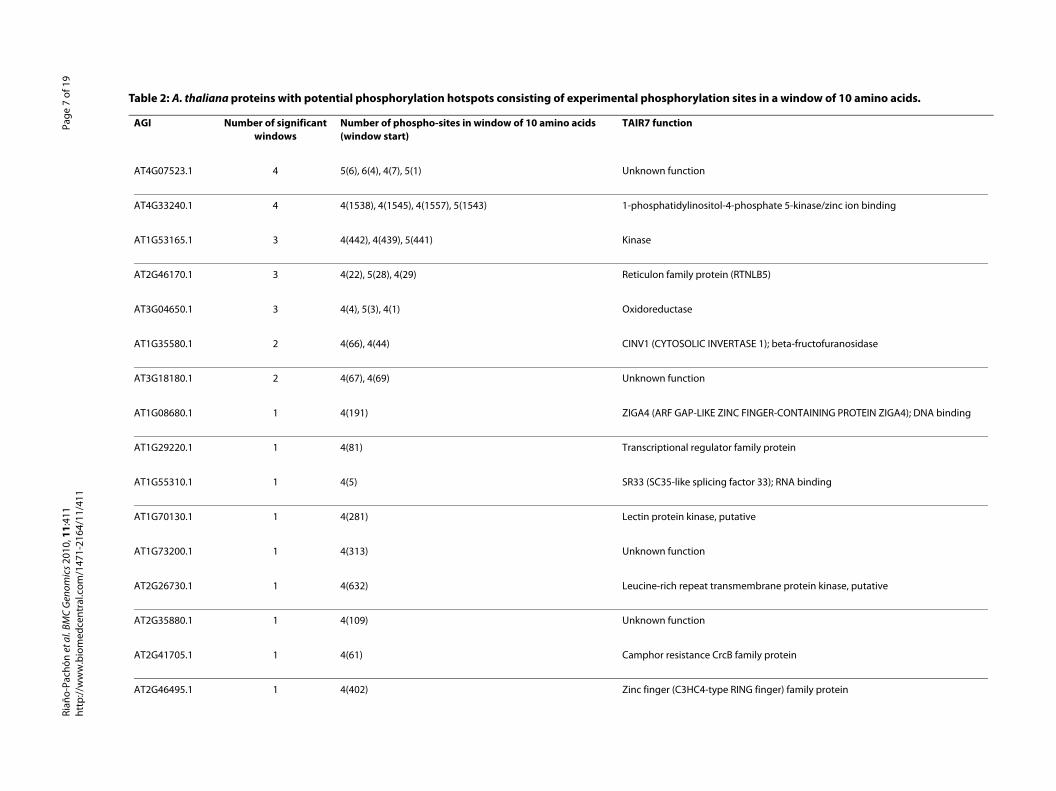
Using experimental phosphorylation sites, and for awindow size of ten amino acids, 43 potential phosphory-lation hotspots in 29 different proteins were identified(Table 2). Figure 2 shows three hotspots with the highestnumber of experimental phosphorylation sites (six or fivepS sites) in a window of 10 amino acids. These hotspotswere identified in a protein of unknown function(AT4G07523.1), in a reticulon family protein(AT2G46170.1), and in a protein kinase (AT1G53165.1)based on TAIR7 annotation.
In general, phosphorylation hotspots were preferen-tially located outside conserved protein domains (p-value: 6.88E-4 for experimental phosphoprotein sets, forwindow size 10; p-value < 1.0E-7 for predicted phosphop-rotein sets for window sizes 20, 30, and 40).
To identify over- or underrepresented biological func-tions among the proteins containing at least one phos-

Riaño-Pachón et al. BMC Genomics 2010, 11:411http://www.biomedcentral.com/1471-2164/11/411
Page 4 of 19
phorylation hotspot that consists of experimentalphosphorylation sites, these proteins were tested againsta reference set which contained all proteins with at leastone experimental phosphorylation site. GO enrichmentanalyses revealed that the GO Slim term "nucleoplasm"(GO: 5654, from the cellular component ontology) wassignificantly overrepresented (p-value: 1.52E-3 for win-dow size 10). This was confirmed by the proteins withhotspots consisting of predicted phosphorylation sites (p-value: 4.60E-4 for window size 20). Interestingly, amongthe proteins with predicted phosphorylation hotspots,"catalytic activity" (GO: 3824) was significantly underrep-resented (p-value: 2.40E-3 for window size 40).
Effect of SNPs on proteinsThe mapping of SNPs onto coding sequences allowed usto evaluate their effects on the coded amino acids, andthus the expressed proteins. There were 12,285,899amino acid residues in the non-redundant set of the pro-tein models represented in the reference genome. In total,314,705 amino acids and 594 stop codons were affectedby SNPs (2.56% of all amino acid residues), either in asynonymous (160,634; 1.31%) or non-synonymous(155,311; 1.26%) way.
As expected, there is a moderate positive correlationbetween the proportion of synonymous substitutions(compared to all substitutions) for each amino acid and
the number of codons encoding the respective aminoacid (Pearson's correlation coefficient: 0.74; p-value: <<5E-2). In order to account for amino acid abundancesthroughout the proteome, we performed a 2-way contin-gency table analysis on the number of non-synonymoussubstitutions affecting each amino acid and the totalnumber of a given amino acid in the whole non-redun-dant proteome (Figure 3A, Additional file 8). The strongunderrepresentation of L, F, G, W and Y residues beingaffected by substitutions suggests a stronger global func-tional or structural constraint on these amino acids. MostSNPs caused synonymous substitutions (Figure 3B).
Interestingly, S and T, two phosphorylatable aminoacids, are more likely to be affected by nsSNPs thanexpected. By contrast, Y residues were 3 to 5 times lessfrequently affected by SNPs than S or T residues (data notshown).
Effects of SNPs on phosphorylation sitesWe tested whether there was any association betweensubstitutions caused by SNPs affecting experimentalphosphorylation sites compared to non-phosphorylation[STY] sites, but we did not observe any overall trend(Fisher's exact test p-value: >> 5E-2). We then looked atthe effect of each individual amino acid substitution (Fig-ure 4). We found that amino acid substitutions do rarelyoccur, when requiring two or three nucleotide substitu-
Figure 1 Frequency distribution of the count of the number of phosphorylation sites per protein. To compute the expected distribution of phosphorylation sites per protein (black circles) we assumed that that every possible STY-site becomes phosphorylated based on a constant proba-bility p, which is independent on the number of STY sites per protein and was obtained by dividing the total number of pSTY-sites by the total number of STY positions across all proteins in the data set, p = total number_pSTY/total number_STY. With p available, the expected number of phosphoryla-tion sites per protein was computed as E(pSTY)x = p x Number of_SYT in protein X. The observed distribution of phosphorylation sites per proteins appears as red circles (A: Experimental phosphorylation sites; B: high-confidence predicted phosphorylation sites).

horylation hotspots appear in italics. aProteins
IR7 function
ich splicing factor 41); RNA binding
ning protein 33); nucleic acid binding/nucleotide binding/
ich splicing factor 35, 35 kDa protein"); RNA binding
g
anosidase
ype family protein
TPase
nc ion binding
Riañ
o-Pa
chón
et a
l. BM
C G
enom
ics 2
010,
11:
411
http
://w
ww
.bio
med
cent
ral.c
om/1
471-
2164
/11/
411
Page
5 o
f 19
Table 1: Proteins with 9 or more experimentally identified phosphorylation sites in A. thaliana. Proteins with phospannotated with the GO term "nucleobase, nucleoside, nucleotide and nucleic acid metabolic process" (GO: 6139).
AGI Number of phosphorylation sites
Number of p(S);p(T);p(Y)
Protein length TA
AT5G52040.1a 22 (19;1;2) 357 ATRSP41 (Arabidopsis thaliana arginine/serine-r
AT2G29210.1a 16 (13;1;2) 879 Splicing factor PWI domain-containing protein
AT2G37340.1a 13 (13;0;0) 291 RSZ33 (Arginine/serine-rich Zinc knuckle-contaizinc ion binding
AT5G64200.1a 13 (13;0;0) 304 ATSC35 ("Arabidopsis thaliana arginine/serine-r
AT2G43680.1 13 (11;2;0) 669 IQD14; calmodulin binding
AT3G55460.1a 13 (11;0;2) 263 SCL30 (SC35-like splicing factor 30); RNA bindin
AT1G35580.1 12 (10;2;0) 552 CINV1 (CYTOSOLIC INVERTASE 1); beta-fructofur
AT3G25500.1 12 (12;0;0) 1052 AFH1 (FORMIN HOMOLOGY 1); actin binding
AT3G63400.1a 12 (11;1;0) 571 Peptidyl-prolyl cis-trans isomerase cyclophilin-t
AT5G47690.1 12 (10;2;0) 1606 Binding
AT3G23900.1 11 (11;0;0) 988 RNA recognition motif (RRM)-containing protein
AT2G18960.1 11 (5;4;2) 950 AHA1 (PLASMA MEMBRANE PROTON ATPASE); A
AT2G20960.1 11 (4;7;0) 749 pEARLI4
AT3G53500.1a 10 (9;0;1) 244 RSZ32; nucleic acid binding
AT4G33240.1 10 (8;2;0) 1758 1-phosphatidylinositol-4-phosphate 5-kinase/zi

ding
protein [Arabidopsis thaliana] (TAIR:AT2G29210.1)
ype family protein
59)
protein
D)
ing
TOR 31); RNA binding
horylation hotspots appear in italics. aProteins Continued)
Riañ
o-Pa
chón
et a
l. BM
C G
enom
ics 2
010,
11:
411
http
://w
ww
.bio
med
cent
ral.c
om/1
471-
2164
/11/
411
Page
6 o
f 19
AT5G01400.1a 10 (7;3;0) 1468 ESP4 (ENHANCED SILENCING PHENOTYPE 4); bin
AT1G31870.1 10 (10;0;0) 562 Similar to splicing factor PWI domain-containing
AT5G47430.1 10 (9;0;1) 893 Unknown function
AT4G32420.1 9 (8;0;1) 838 Peptidyl-prolyl cis-trans isomerase cyclophilin-t
AT5G10470.1 9 (9;0;0) 1274 Kinesin motor protein-related
AT4G02510.1 9 (8;1;0) 1504 TOC159 (translocon outer membrane complex 1
AT4G31160.1 9 (7;2;0) 1847 Transducin family protein/WD-40 repeat family
AT3G26935.1 9 (6;2;1) 444 Zinc finger (DHHC type) family protein
AT5G47910.1 9 (9;0;0) 922 RBOHD (RESPIRATORY BURST OXIDASE PROTEIN
AT5G61150.1 9 (9;0;0) 626 VIP4 (VERNALIZATION INDEPENDENCE 4)
AT5G43310.1 9 (5;4;0) 1238 COP1-interacting protein-related
AT5G40450.1 9 (8;1;0) 2890 Unknown function
AT3G13570.1a 9 (8;1;0) 263 SCL30a (SC35-like splicing factor 30a); RNA bind
AT3G61860.1a 9 (8;0;1) 265 ATRSP31 (ARGININE/SERINE-RICH SPLICING FAC
AT1G48920.1 9 (8;1;0) 558 Nucleolin, putative
AT1G19870.1 9 (9;0;0) 795 IQD32 (IQ-domain 32); calmodulin binding
Table 1: Proteins with 9 or more experimentally identified phosphorylation sites in A. thaliana. Proteins with phospannotated with the GO term "nucleobase, nucleoside, nucleotide and nucleic acid metabolic process" (GO: 6139). (
ites in a window of 10 amino acids.
hosphate 5-kinase/zinc ion binding
TNLB5)
ASE 1); beta-fructofuranosidase
FINGER-CONTAINING PROTEIN ZIGA4); DNA binding
amily protein
ctor 33); RNA binding
tive
embrane protein kinase, putative
amily protein
ING finger) family protein
Riañ
o-Pa
chón
et a
l. BM
C G
enom
ics 2
010,
11:
411
http
://w
ww
.bio
med
cent
ral.c
om/1
471-
2164
/11/
411
Page
7 o
f 19
Table 2: A. thaliana proteins with potential phosphorylation hotspots consisting of experimental phosphorylation s
AGI Number of significant windows
Number of phospho-sites in window of 10 amino acids (window start)
TAIR7 function
AT4G07523.1 4 5(6), 6(4), 4(7), 5(1) Unknown function
AT4G33240.1 4 4(1538), 4(1545), 4(1557), 5(1543) 1-phosphatidylinositol-4-p
AT1G53165.1 3 4(442), 4(439), 5(441) Kinase
AT2G46170.1 3 4(22), 5(28), 4(29) Reticulon family protein (R
AT3G04650.1 3 4(4), 5(3), 4(1) Oxidoreductase
AT1G35580.1 2 4(66), 4(44) CINV1 (CYTOSOLIC INVERT
AT3G18180.1 2 4(67), 4(69) Unknown function
AT1G08680.1 1 4(191) ZIGA4 (ARF GAP-LIKE ZINC
AT1G29220.1 1 4(81) Transcriptional regulator f
AT1G55310.1 1 4(5) SR33 (SC35-like splicing fa
AT1G70130.1 1 4(281) Lectin protein kinase, puta
AT1G73200.1 1 4(313) Unknown function
AT2G26730.1 1 4(632) Leucine-rich repeat transm
AT2G35880.1 1 4(109) Unknown function
AT2G41705.1 1 4(61) Camphor resistance CrcB f
AT2G46495.1 1 4(402) Zinc finger (C3HC4-type R

d
tein-related
H PROTEIN)
protein
factor 30); RNA binding
ion termination factor-related/mTERF-related
ich 22)
tein
ing
rotein
aliana arginine/serine-rich splicing factor 41); RNA binding
aliana arginine/serine-rich splicing factor 35, 35 kDa
sites in a window of 10 amino acids. (Continued)
Riaño-
Pach
ón e
t al.
BMC
Gen
omic
s 201
0, 1
1:41
1ht
tp://
ww
w.b
iom
edce
ntra
l.com
/147
1-21
64/1
1/41
1Pa
ge 8
of 1
9
AT3G27960.1 1 4(574) Kinesin light chain-relate
AT3G29310.1 1 4(325) Calmodulin-binding pro
AT3G29390.1 1 4(512) RIK (RS2-INTERACTING K
AT3G48530.1 1 4(14) CBS domain-containing
AT3G55460.1 1 4(176) SCL30 (SC35-like splicing
AT3G58940.1 1 4(113) F-box family protein
AT4G14605.1 1 4(290) Mitochondrial transcript
AT4G31580.1 1 4(170) SRZ-22 (serine/arginine-r
AT4G32250.1 1 4(22) Protein kinase family pro
AT5G02240.1 1 4(235) Catalytic/coenzyme bind
AT5G14890.1 1 4(60) NHL repeat-containing p
AT5G52040.1 1 4(342) ATRSP41 (Arabidopsis th
AT5G64200.1 1 4(274) ATSC35 ("Arabidopsis thprotein"); RNA binding
Table 2: A. thaliana proteins with potential phosphorylation hotspots consisting of experimental phosphorylation

Riaño-Pachón et al. BMC Genomics 2010, 11:411http://www.biomedcentral.com/1471-2164/11/411
Page 9 of 19
tions (simultaneous changes of 2 or 3 bases in the under-lying codon, i.e., substitution cost). The only observedcases were for S to D, S to K, T to Y, and Y to E, althougheven in these cases, the substitution only occurred innon-phosphorylated S, T or Y residues. We also foundthat in all cases substitutions were either more frequentin phosphorylated sites than in non-phosphorylated sitesor vice versa, never equally affecting both types of sites.
In case of the predicted phosphorylation sites, wefound for threonine a significant enrichment of non-syn-onymous substitutions in phosphorylated compared to
non-phosphorylated threonine residues (data notshown). Analyzing the effect of each individual substitu-tion in the predicted dataset, we observed several aminoacid substitutions with a substitution cost of two thatoccurred in phosphorylation sites (S to D, S to K, T to E,T to Q, T to V, Y to E, Y to L and Y to T; Additional file 9and 10). Regarding the enrichment and depletion of indi-vidual substitutions between phosphorylated and non-phosphorylated sites, we found that all substitutions wereas likely to occur in predicted phosphorylation sites as innon-phosphorylation sites, except for the substitution T
Figure 2 Phosphorylation hotspots in A. thaliana proteins. Hotspots in three A. thaliana proteins which were identified based on the analysis of experimental phosphorylation sites with a window size of 10 amino acids (Additional file 5). Hotspots are indicated by red boxes. A: AT4G07523.1 rep-resents a protein of unknown function (TAIR7). B: AT2G46170.1 is annotated as reticulon family protein (TAIR7). C: AT1G53165.1 was found to be a protein kinase (TAIR7). Amino acid residues S, T and Y are marked by green, blue and purple rectangles. Rectangles with a flag represent experimentally verified phosphorylation sites. Pfam identified protein domains are highlighted by yellow boxes.

Riaño-Pachón et al. BMC Genomics 2010, 11:411http://www.biomedcentral.com/1471-2164/11/411
Page 10 of 19
Figure 3 Amino acids in the reference genome affected by SNPs. A. Log2 odds ratio relating the number of non-synonymous substitutions per amino acid with its abundance in the whole non-redundant proteome. All ratios are significantly different from 1 after Benjamini-Hochberg [63], p-value correction (FDR ≤ 5E-2, see Additional file 8). B. Proportion of amino acids affected by SNPs (synonymous and non-synonymous substitutions).

Riaño-Pachón et al. BMC Genomics 2010, 11:411http://www.biomedcentral.com/1471-2164/11/411
Page 11 of 19
to N, which was more likely to occur in predicted phos-phorylation sites than in non-phosphorylation sites, andthe synonymous substitution T to T, which was morelikely in non-phosphorylation sites. In that respect, it isimportant to note that asparagine (N) has been shown tomimic a phosphorylated serine, in a mutant of the A.thaliana K+ channel AKT2 (AT4G22200.1). Asparagine isan uncharged amino acid, but it is larger than both S andT. Mimicking the phosphorylation site could arise due tosteric effects as suggested by Michard et al. [40]. Thus, asubstitution T to N might generate a constitutive phos-phorylation site.Losses of experimental phosphorylation sitesAmong the experimental phosphorylation sites, we iden-tified 86 sites (in 86 proteins) that were lost in at least oneof the A. thaliana accessions by an exchange of a phos-phorylation target amino acid S, T, or Y to any otheramino acid (Additional file 11). For four proteins(AT1G01550.1, AT1G44800.1, AT1G62330.1,AT5G38310.1) the phosphorylated S was substituted tomore than one other amino acid in the accessions ana-lyzed. For example a pS (position 341) of the nodulinMtN21 family protein (AT1G44800.1) was exchanged to
T in most of the accessions with the only exception ofBur-0, where an N was introduced by the nsSNP.
Interestingly, we found that among these 86 proteins,the GO Slim categories "receptor activity" was signifi-cantly overrepresented, but there were no underrepre-sented categories. Using a reference set comprising all A.thaliana proteins with at least one phosphorylation site,no over- or underrepresented categories could be identi-fied.
Remarkably, some losses of experimentally verifiedphosphorylation sites are located in phosphorylationhotspots. This concerns the following A. thaliana pro-teins: two proteins of unknown function (AT2G35880.1;pS at position 118 and AT3G18180.1; pS at position 67); acalmodulin-binding protein-related (AT3G29310.1; pS atposition 327), and the protein ESP4 (ENHANCEDSILENCING PHENOTYPE 4); binding (AT5G01400.1;pS at position 1364), based on TAIR7 annotation.Gains and losses of predicted phosphorylation sitesUsing the dataset of predicted high-confidence phospho-rylation sites for a more global analysis, we found 1,114proteins in which predicted phosphorylation sites couldpotentially be lost in at least one of the A. thaliana acces-sions studied (Additional file 12). In 1,103 cases, the SNP
Figure 4 Effect of SNPs, comparison between experimental phosphorylation sites and non-phosphorylation sites. We evaluated the enrich-ment and depletion of each substitution pair from an experimentally identified phosphorylation site to any other amino acid, by using 2-way contin-gency tables for each pair and evaluating the significance of an odds ratio different from 1 (corrected p-value, FDR ≤ 5E-2) with a Fisher's exact test. All ratios are statistically undistinguishable from 1 (Log Odds = 0). Only experimentally verified phosphoproteins were included in this analysis. Sub-stitution of amino acids in bold were never found, neither in phosphorylation sites nor in non-phosphorylation sites. Substitution amino acids in red were present among non-phosphorylation sites, but absent among phosphorylation sites. The substitution cost is the minimal number of DNA sub-stitutions that is required in order to change an amino acid into another (see Additional file 9).

Riaño-Pachón et al. BMC Genomics 2010, 11:411http://www.biomedcentral.com/1471-2164/11/411
Page 12 of 19
caused an amino acid substitution to an amino acid thatcannot be phosphorylated, while in the remaining 11 pro-teins, the score of the phosphorylation predictionchanged from a high-confidence positive score (score ≥1)to a value smaller than or equal to -1, regardless of thetype of putative phosphorylated amino acid at the givenposition in the neighborhood of the affected phosphory-lation site. A prediction value of score ≤ -1 is taken ashigh-confidence prediction of the amino acid not beingphosphorylated.
In contrast, we observed that 1,148 proteins gained apredicted phosphorylation site (Additional file 12). Themajority of gained phosphorylation sites (1,136) emergedby the change of a non-phosphorylatable amino acid toan S, T, or Y residue and a resulting prediction score ≥1 ofthe newly generated putative phosphorylation site. In theremaining 12 cases, the gain of the phosphorylation sitewas based on the score alone, the prediction scoreincreased from a negative score (score ≤ -1) to a scorehigher than or equal to 1 due to nsSNPs that resulted inamino acid exchanges in the neighborhood to S, T and Yresidues thus creating a new phosphorylation site targetmotif.
We found that the GO categories "receptor activity","binding" and "signal transducer activity" were signifi-cantly overrepresented in all three datasets regardless ofthe reference set used (see Methods; Additional file 13).Additionally, in proteins which gained a phosphorylationsite, and in all proteins with a gain or a loss, the category"response to stress" was overrepresented, regardless ofthe reference set used (Additional file 13). In the datasetincluding gain and loss of phosphorylation sites, the cate-gories "transporter activity", "catalytic activity", "meta-bolic process", "biosynthetic process" and "cell" wereunderrepresented using the set of predicted phosphopro-teins as reference set (Additional file 12). The figure inAdditional file 14 presents all over- and underrepresentedGO Slim categories in the protein set with losses andgains of predicted phosphorylation sites.
DiscussionWith regard to the isolation of phosphorylated proteinsfrom complex samples as well as their mass spectromet-ric and computational analysis the progress that has beenmade in A. thaliana is quite impressive. However, theconnection of protein phosphorylation with genetic vari-ation in natural occurring ecotypes at a proteome-widelevel in plant species has not been addressed so far. In thisstudy we made use of experimental and predicted phos-phorylation sites available in PhosPhAt [15] and mappedthe data onto the A. thaliana genome annotation. This iscurrently the largest phosphorylation site dataset in A.thaliana comprising 7,178 experimentally verified uniquephosphorylation sites assigned to 4,252 protein-coding
loci. The combined data set represents phosphorylationsites identified from different tissues/cell types represent-ing varied developmental stages and responses.
Since the assigned proteins cover only one-sixth of thepredicted A. thaliana protein-coding loci, we extendedour study by also including predicted phosphorylationsites to achieve better proteome coverage in our analyses,attaining a coverage of 80% of all protein-coding loci in A.thaliana.
The relative frequency of 70.7% pS, 20.7% pT, and 8.6%pY in our experimental set was similar to distributionsreported previously in A. thaliana ([34]; 85.0% pS, 10.7%pT, and 4.3% pY) and in humans [41,42]. In the predicteddataset, the fraction of tyrosine residues was much higher(25.0%) compared to the experimental set (8.6%). Thisdiscrepancy may result from a bias in the training set ofexperimental phosphopeptides that has been used for thephosphorylation site predictor or from a lack of accuracyof the predictor. In addition, we cannot exclude that theexperimentally identified phosphorylation sites may ingeneral be biased by experimental restrictions such asspecific phosphopeptide enrichment methods [43] or bya focus on specific stress conditions or subcellular com-partments. Thus, this distribution may still shift byincluding new phosphorylation sites from future studies.However, since in general experimental and predicteddata show similar distribution among and within the pro-teins, the inclusion of predicted data in the scope of thisstudy is justified.
Multisite phosphorylation in proteins has been dis-cussed as points of integration of different signal trans-duction pathways [1,44]. However, a major difficulty instudying multisite phosphorylation from a system's per-spective has been the uncertainty whether simultaneousor successive phosphorylation occurred at the differentsites on the same protein and whether the multiple siteswere phosphorylated by the same or different proteinkinases. Dependencies among phosphorylation sites in asingle protein can be intricate [45], and the position andthe number of phosphorylated residues can affect thebiological outcome [46].
In the experimental dataset, we observed that the iden-tified number of phosphorylation sites per protein waslargely in agreement with the expected values, except forlarge values of phosphorylation sites and a single phos-phorylation site. This observation was more noticeablefor the predicted dataset. This suggests that there are atleast three discrete regions in the distribution: i) a regionof overrepresentation of single phosphorylation sites, ii) aregion where the number of phosphorylation sites is pro-portional to the total number of S, T and Y; i.e., the moresites can be phosphorylated, the more will and propor-tionally, and, iii) a region where phosphorylation sitesappear more often than expected given the total number

Riaño-Pachón et al. BMC Genomics 2010, 11:411http://www.biomedcentral.com/1471-2164/11/411
Page 13 of 19
of S, T, Y. Similar behavior was previously suggested toresult from a rich-gets-richer process for the accumula-tion of phosphorylation sites [18], however the low cover-age of the experimental dataset in this study does notallow us to arrive at such a conclusion. Nevertheless, thedata in Figure 1, strongly suggests that once a single phos-phorylation event happened in a protein, further phos-phorylations will accumulate depending only on theabundance of phosphorylatable residues, until reaching athreshold whereafter further phosphorylations will hap-pen even more rapidly than dictated by the abundance ofphosphorylatable residues (longer tail).
Our finding that the phosphorylation hotspots occurpreferentially outside conserved domains suggests that,indeed, they may serve as sites of signal integration asthey are outside of regions such as catalytic domains orprotein-protein interaction domains. Multisite phospho-rylation occurring outside structured regions was shownfor single nuclear proteins in several studies. This is thecase for the human protein Ets-1. Multiple Ca2+-depen-dent phosphorylation sites in an unstructured flexibleregion of this transcription factor act additively to pro-duce graded DNA binding affinity [47]. Our result thatnucleus-related GO terms are overrepresented inhotspot-containing proteins is in line with studies thatindicate a central involvement of many nuclear proteinsas integration hubs for phosphorylation-dependent sig-naling [48].
In an MS-based phosphoproteomics study in A. thali-ana, it was suggested that the mRNA splicing machineryis a major target of protein phosphorylation [29]. Ourresults support this hypothesis. One third (10/31) of theproteins with nine or more experimentally determinedphosphorylation sites are involved in metabolic processesassociated with nucleic acids, especially with "RNA splic-ing" (Table 1).
Disease resistance genes, S-locus proteins and recep-tors had previously been shown to display a high variabil-ity between different wild varieties of A. thaliana [23]. Incombination with our findings this indicates that recep-tors belong to the more variable proteins in A. thalianaaccessions, and gains or losses of phosphorylation sites inrapidly evolving and variable regions of receptors couldfacilitate the evolution of kinase-signaling circuits [49].The importance of specific phosphorylation sites in A.thaliana receptor proteins for receptor dimer formationand activation of signaling events was concluded fromexperiments on the BRI1/BAK1 receptors [50]. Similarly,in different human receptor proteins the importance oftheir site-specific phosphorylations could be demon-strated, for example in receptor tyrosine kinases of theErbB family [51].
The potential contribution of the identified losses andgains of the phosphorylation sites by nsSNPs to adaptive
responses of the various natural accessions will be aninteresting field to be analyzed in future association stud-ies.
ConclusionsBy mapping nsSNPs onto phosphorylation sites, we iden-tified losses and gains of phosphorylation sites, which canbe important in adaptive responses of the natural acces-sions in their different environments. Especially receptorproteins were affected by losses of experimental phos-phorylation sites. Based on the observed gains and lossesof predicted phosphorylation sites it can be expected thatbeyond receptor proteins also other proteins involved insignaling and stress response are affected by changes,whereas proteins involved in metabolism, catalytic activ-ity and biosynthesis are less affected. These findings sug-gest a relatively high variability of signal transduction-related proteins and receptors and more conserved regu-lation in metabolism. Since receptors and signaling pro-cesses are primarily involved in recognition and responseto environmental cues, the overrepresentation of phos-phorylation sites (gain or loss) in these functional classesindeed supports the view of nsSNPs as evolutionarymeans of adaptation.
MethodsGenome annotation and identification of protein domainsThe A. thaliana Columbia-0 genome was sequenced inthe year 2000 [52]. In this study, we used the genomeannotation provided by The Arabidopsis InformationResource, release 7.0 (TAIR7) [53]. Protein domains wereidentified using the Pfam v23 library of Hidden MarkovModels [54]. 2,902 Pfam HMMs have significant hits in19,904 protein-coding loci (23,760 protein models) inTAIR7.
Phosphoproteomics datasetsExperimental phosphorylation sitesExperimental phosphorylation sites of different phospho-proteomic studies in A. thaliana [27-36] were taken fromPhosPhAt (version 3.0) [15]. The PhosPhAt database aimsto collect manually curated phosphorylation motifs fromA. thaliana. While PhosPhAt provides both, phosphory-lation sites with uncertain and exactly defined positionswithin the respective protein sequence, only the latterwere included in this study. The dataset comprised 7,178unambiguously identified phosphopeptides identified in4,252 protein-coding loci annotated in TAIR7 (with thefollowing counts per residue type: 5,078 S; 1,482 T; 618Y).Predicted phosphorylation sitesThe predictions of phosphorylation of S, T, and Y wereextracted from PhosPhAt. PhosPhAt uses a Support Vec-tor Machine (SVM) in order to reliably predict phospho-

Riaño-Pachón et al. BMC Genomics 2010, 11:411http://www.biomedcentral.com/1471-2164/11/411
Page 14 of 19
rylation sites in A. thaliana. The SVM has been trainedon experimentally verified phosphorylation sites from A.thaliana with the goal of specifically capturing the prop-erties of plant phosphorylation sites and was shown topredict plant phosphorylation sites with a considerablybetter performance than other available predictors usu-ally trained on non-plant species [15].
SNP datasetsThree datasets of SNPs, with polymorphisms detected inthe A. thaliana accessions listed in Additional file 15 wereused in this study. The first large scale SNP study waspublished in 2005. We refer to it here as theNordborg2005 dataset. 20,667 non-redundant SNPs wereidentified in this study in 96 accessions [25]. Clark et al.used re-sequencing arrays to identify 1,126,176 non-redundant SNPs in 20 accessions; 637,522 non-redundantSNPs belong to the high-confidence set and were kept forfurther analysis (Clark2007 in the following) [24,55].Ossowski et al. used ultra-deep sequencing and identified860,154 non-redundant SNPs in three accessions(Ossowski2008 in the following) [26,56]. SNP positionsdetermined in the datasets Nordborg2005, Clark2007 andOssowski2008 were combined into a non-redundantdataset that comprised 1,247,284 SNPs (Table 3). 25% ofthese SNP positions can be mapped onto codingsequences, and around 50% of those lead to an aminoacid substitution in at least one of the A. thaliana acces-sions studied (Table 3). The merged SNP dataset used inthis study, including SNPs mapping onto A. thalianacDNAs (TAIR7), is publicly available and downloadablevia The GABI Primary Database (GabiPD; http://www.gabipd.org/) [57]. Moreover, SNPs can be interac-tively visualized in the cDNA sequences in the A. thali-ana Gene GreenCards in GabiPD, where accession-related SNP configuration is provided.
Mapping SNP positions onto the TAIR7 genome release and annotationThe datasets Nordborg2005 and Clark2007 were origi-nally mapped onto previous versions of the A. thalianagenome sequence, thus the first step in the present studywas to bring all three datasets to refer to the same refer-ence coordinate system, i.e., TAIR7. We took the 30 base-pairs (bp) of right and left flanking sequences of each SNPposition, together with the SNP base, from the reportedA. thaliana genome versions. Using MEGABLAST (W =39, D = 3) [58,59] we mapped them onto the TAIR7genome sequence, allowing only 100% identical matches.None of the polymorphic positions were changedbetween the different releases of the A. thaliana genome.Subsequently, using the genome annotation provided byTAIR7, we determined which of these polymorphic posi-tions occurred inside processed mRNAs and protein cod-ing sequences. The latter is necessary to determine if theSNPs caused a synonymous or non-synonymous substi-tution, and allowed us to determine, which phosphoryla-tion site positions were affected by SNPs.
Evaluating enrichment of gene ontology terms in sets of proteinsThe gene ontology (GO) provides a set of controlled andstructured vocabularies, i.e., ontologies, in three domainsof molecular biology: cellular component, biological pro-cess and molecular function [60]. A large proportion of A.thaliana genes in TAIR7 have been annotated with atleast one GO term. In this study, we used a subset of theseGO terms, known as the plant GO Slim, which provides ahigh level view of the above mentioned ontologies. Over-and underrepresentation analysis of plant GO Slim termswas carried out using the plugin BiNGO v2.3 [61] for thesoftware package Cytoscape [62]. Statistically significantcategories, either over- or underrepresented, were
Table 3: Overview of the number of SNPs per dataset.
Dataset Number of non-redundant SNPs in this study
Number of non-redundant SNPs mapping onto cDNAs
Number of non-redundant SNPs mapping onto CDS
Number of non-redundant SNPs causing at least one non-synonymous substitution
Number of non-redundant SNPs always causing synonymous substitutions
Nordborg2005 20,667 9,251 8,023 4,047 3,975
Clark2007 637,522 263,718 227,497 109,709 117,788
Ossowski2008 860,154 220,984 174,559 84,400 90,159
TOTAL 1,247,284 382,770 315,039 156,034 159,004

Riaño-Pachón et al. BMC Genomics 2010, 11:411http://www.biomedcentral.com/1471-2164/11/411
Page 15 of 19
selected according to their corrected p-value (False Dis-covery Rate (FDR) ≤ 5E-2), using a hypergeometric test.
Effect of SNPs on phosphorylation sitesDifferences between the effects of SNPs on phosphorylation sites and non-phosphorylation sitesWe evaluated the differences between SNPs affectingphosphorylation- and non-phosphorylation sites by com-parison of their distributions. For each natural accessionfrom A. thaliana, we mapped all SNPs separately on therespective protein sequences.
Subsequently experimental sites were mapped onto theprotein sequences, in which at least one SNP was found.In a third step, the distribution of SNPs mapping to phos-phorylation sites and non-phosphorylation sites wasevaluated for protein sequences with at least one SNPmapping onto an experimental phosphorylation site. Foreach of the potentially phosphorylated amino acid S, Tand Y (phosphorylation sites and non-phosphorylationsites), we counted the number of synonymous and non-synonymous substitutions to all 20 amino acids and tostop-codons. We also counted the number of S, T, and Yphosphorylation sites and the total number of S, T, and Yin all proteins with at least one SNP mapping onto anexperimental phosphorylation site. Based on this infor-mation, we created 2 × 2 contingency tables for each sub-stitution pair and evaluated the significance (corrected p-value, FDR ≤ 5E-2) with a Fisher's exact test for each con-tingency table. Finally, we represented the enrichmentand depletion of substitutions between phosphorylationsites and non-phosphorylation sites as the odds ratiobetween their probabilities.
The same procedure was applied to the sets of pre-dicted phosphorylation sites.Losses of experimental phosphorylation sitesThe number of losses of experimental phosphorylationsites was computed by determining SNPs mapping toexperimental phosphorylation sites and resulting in anexchange to a non-phosphorylatable amino acid.Gains and losses of predicted phosphorylation sitesSNPs of predicted phosphorylation sites resulting inexchange of S, T or Y to a non-phosphorylatable aminoacid were defined as "loss", and SNPs leading to anexchange of a non-phosphorylatable amino acid with a S,T, Y predicted to be phosphorylated with high confidence(decision value ≥1) were defined as "gain". Additionally,we also determined gains and losses of phosphorylationsites by SNPs considering the sequential context between-6 and +6 amino acids around the central residue (S, T, orY). This sequential context can be affected by SNPs thuschanging the probability of phosphorylation of the cen-tral S, T or Y. We used only positions with highly confi-dent decision values ≥1 for phosphorylation sites and ≤ -1for non-phosphorylation sites in the TAIR7 protein
sequence considering the accession specific sequence.Thus, there are two types of gains/losses of predictedphosphorylation sites, (i) based on score, where the scoreof a phosphorylatable amino acid changes from ≥1 to ≤ -1(loss) or vice versa (gain) due to an amino acid substitu-tion within the phosphorylation site recognition motif,(ii) based on a change from one amino acid residue withhigh-confidence phosphorylation prediction score into anon-phosphorylatable amino acid (loss) or the creation ofa peptide with a confidence prediction score greater than1 (gain).
Three different datasets were used for an analysis ofover- and underrepresentation of plant GO Slim termsamong the proteins affected by gain or loss of phosphory-lation sites: the first dataset contained only proteins thatlost a predicted site; the second dataset consisted of pro-teins, which gained a predicted site; and the third datasetincluded proteins with both, gain and loss of predictedphosphorylation sites. These three datasets were com-pared against two reference sets, (i) a reference set thatcomprised all proteins containing a predicted phosphory-lation site (score ≥ 1) and (ii) a reference set that com-prised all A. thaliana proteins.
Identification of phosphorylation hotspotsHotspots were computed based on two datasets: (i)experimentally verified phosphorylation sites, (ii) pre-dicted phosphorylation sites. A hotspot was defined as awindow of a given length, which (i) contains a signifi-cantly increased number of phosphorylation sites (forexperimental sites) or (ii) has a significantly increasedwindows score (for predicted sites) compared to anempiric background distribution. Analyses were runusing the following window sizes: (i) windows of 5, 10, 15,20 amino acids length for experimental sites and (ii) win-dows of 10, 20, 30, 40 for predicted sites.
To generate background proteomes, proteins weresampled according to the length distribution and aminoacid composition of all proteins in the A. thaliana pro-teome. Resulting proteins were randomly phosphorylatedat S, T, and Y residues with probabilities as identifiedafter mapping all experimental phosphorylation sitesonto A. thaliana protein sequences in case of experimen-tal sites. For predicted sites, a score was randomlyassigned to the S, T, and Y residues by sampling a scorefrom the corresponding distribution of prediction scoresin the A. thaliana proteome. In this way, 10,000 back-ground proteomes of size of the experimental set weregenerated for the experimental sites, 1,000 backgroundproteomes of size of the A. thaliana proteome were gen-erated for the predicted sites.
To generate empiric background distributions, eachbackground proteome was analyzed by scanning eachprotein with a window of fixed size. Window scores were

Riaño-Pachón et al. BMC Genomics 2010, 11:411http://www.biomedcentral.com/1471-2164/11/411
Page 16 of 19
computed by using (i) the number of contained phospho-rylated amino acid residues for experimental sites, or (ii)the sum of all scores in a window for predicted sites. For agiven window size the empiric background distribution isformed by the distribution of window scores. Windowscontaining the same S, T, and Y residues of a protein werecounted only once.
The proteome of A. thaliana with mapped experimen-tal or predicted sites was scanned and window scoreswere determined accordingly. For predicted sites, onlywindows containing at least the expected number of S, T,and, Y sites based on the determined amino acid fre-quency in the A. thaliana proteome were taken intoaccount for further analysis (in contrast to the back-ground distribution).
The null-hypothesis of statistical testing of hotspotsstates: the score of a candidate window is derived fromthe described background distribution. The alternativehypothesis states: If the p-value of the score from a candi-date window is less than the significance level (5E-2),then it is assumed that the window results from anunknown hotspot distribution. The right tail of back-ground distribution is considered for testing. P-valueswere determined and Bonferroni corrected for multipletesting. Windows which had scores with corrected p-value less than 5E-2, were saved for further analysis.
Overlap of hotspots with protein domainsWe tested the hypothesis whether hotspots are uniformlydistributed across proteins, independently of proteindomains. For the statistical test, (i) the number ofhotspots overlapping with a protein domain was com-puted for the real data, (ii) the same number of hotspotsof a given size was sampled onto the proteins, (iii) thehotspots overlapping with domains were counted andsaved. This procedure was repeated for 10E7 times andthe number of overlaps of the real data was compared tothe empirically generated background distribution. Thenull-hypothesis was tested analogous as described in theprevious section.
Additional material
Additional file 1 This file contains seven worksheets with the list of over- and underrepresented plant GO Slim terms in the set of experi-mentally identified phosphoproteins, determined by BiNGO analysis. The worksheets S, T, Y, ST and STY contain the tables witht over- and under-represented GO Slim categories with the following columns: GO term; p-value; corrected p-value; x: number of genes in the query dataset annotated to a certain GO term; X: the total number of genes in the query dataset, genes without any annotation are discarded; n: number of genes in the ref-erence dataset annotated to a certain GO term; N: total number of genes in the reference dataset, genes without any annotation are discarded. The worksheets "underrepresented" and "overrepresented" include a presence-/absence comparison of the significant GO terms in the different datasets. Every pair of binary series was compared using the Pearson's correlation coefficient.
Additional file 2 This file contains seven worksheets with the list of over- and underrepresented plant GO Slim terms in the set of high-confidence predicted phosphorylation sites (score ≥ 1), determined by BiNGO analysis. The worksheets S, T, Y, ST and STY contain the tables witht over- and underrepresented GO Slim categories with the following columns: GO term; p-value; corrected p-value; x: number of genes in the query dataset annotated to a certain GO term; X: the total number of genes in the query dataset, genes without any annotation are discarded; n: num-ber of genes in the reference dataset annotated to a certain GO term; N: total number of genes in the reference dataset, genes without any annota-tion are discarded. The worksheets "underrepresented" and "overrepre-sented" include a presence-/absence comparison of the significant GO term in the different datasets. Every pair of binary series was compared using the Pearson's correlation coefficient.Additional file 3 Figure of under- and overrepresented plant GO Slim terms in the experimental (A) and predicted (B) p[STY] dataset. The BiNGO corrected p-values are given in logarithmic scale. Underrepresented categories are shown in red as negative values, and overrepresented terms are shown in blue as positive values. In cases where the corrected p-value was 0, the number 100 has been arbitrarily assigned as the value shown in the graphic.
Additional file 4 This file contains two worksheets: Experimental: With the number of S + T + Y and the number of observed experimen-tal phosphorylation sites per protein. Predicted: With the number of S + T + Y and the number of high-confidence (score ≥ 1) predicted phosphory-lation sites per protein. It was used to create Figure 1 in the main text.Additional file 5 This file contains all phosphorylation hotspots, which result from the hotspot analysis of all experimental phosphory-lation sites in A. thaliana protein sequences. The analysis was run for dif-ferent window sizes (5, 10, 15, 20 amino acids), available as different worksheets. AGI (TAIR7): A. thaliana gene identifier code according to TAIR 7.0; Number of phosphorylation sites: number of experimentally verified phosphorylation sites in the significant window; hotspot start (aa): start of the hotspot in the protein sequence in amino acids; winsize: size of the ana-lyzed window in amino acids; p-value: the Bonferroni-corrected p-value of the window derived from the background distribution. The significance level for the entire series of tests (α) was set to 5E-2.
Additional file 6 This file contains all phosphorylation hotspots, which result from the hotspot analysis of all predicted phosphoryla-tion sites in A. thaliana protein sequences. The analysis was run for dif-ferent window sizes (10, 20, 30, 40 amino acids), available as different worksheets. AGI (TAIR7): A. thaliana gene identifier code according to TAIR 7.0; position (aa): start position of significant window in protein sequence in amino acids (aa), winsize: size of the analyzed window in amino acids, #STY: number of S,T,Y in significant window; # sigwin: number of significant win-dows in the AGI; score sum: sum of all prediction scores (SVM decision val-ues) for phosphorylatable sites in the window; sequence: sequence of the significant window; aa(position):score: scored amino acids with related position and score are shown; function (TAIR7): gene function according TAIR7 annotation; function (MapMan): gene function according MapMan annotation.Additional file 7 This file contains all phosphorylation runs derived from the hotspot analysis based on prediction for the analyzed win-dow sizes (10, 20, 30, 40 amino acids), available as different work-sheets. Runs were generated by merging the identified hotspots to non-redundant contiguous sequences (runs). A run is defined as the amino acid sequence of a hotspot if there is no adjacent/overlapping other hotspot present. In cases of two or more overlapping/adjacent hotspots, a run is defined as the sequence representing the combination of those hotspots in the corresponding protein. Each run generated from hotspots is given with the corresponding AGI, start and stop position (in amino acids) as well as the run sequence.Additional file 8 This file contains a single worksheet with the data used to create Figure 3A.

Riaño-Pachón et al. BMC Genomics 2010, 11:411http://www.biomedcentral.com/1471-2164/11/411
Page 17 of 19
Authors' contributionsDMRP and SK carried out statistical analysis and improved and extended thedatabase schema to store and query SNP and phosphorylation site data. JN
carried out the phosphorylation site hotspot analysis. PD predicted phospho-rylation sites and participated in the analysis of the data. EW performed prelim-inary analyses and setup of the database to query SNP and phosphorylationsite data. WRE and WXS determined experimental phosphorylation sites. DW,JS, WXS and BK designed and coordinated the project. BK led the team. Allauthors participated in writing the manuscript, read and approved the finalmanuscript.
AcknowledgementsWe thank the German Ministry for Education and Research (BMBF) for funding this work in the scope of GABI-FUTURE (grant 0315046) and the Max Planck Society. Liam Childs and Ronan Sulpice are acknowledged for helpful discus-sions and Flavia Vischi Winck for critical reading of the manuscript.
Author Details1Max Planck Institute of Molecular Plant Physiology, Am Mühlenberg 1, 14476 Potsdam-Golm, Germany, 2Institute for Biochemistry and Biology, University of Potsdam, Karl-Liebknecht-Straße 24-25, Haus 20, 14476 Potsdam-Golm, Germany, 3Johann Heinrich von Thuenen-Institute, Federal Research Institute for Rural Areas, Forestry and Fisheries, Institute for Forest Genetics, Sieker Landstr. 2, 22927 Grosshansdorf, Germany, 4Institute of Pathology, Universitätsmedizin Charite, Chariteplatz 1, 10117 Berlin, Germany and 5Department of Computer Science, Humboldt University of Berlin, Rudower Chaussee 25, 12489 Berlin, Germany
References1. Hunter T: The age of crosstalk: phosphorylation, ubiquitination, and
beyond. Mol Cell 2007, 28(5):730-738.2. Olsen JV, Blagoev B, Gnad F, Macek B, Kumar C, Mortensen P, Mann M:
Global, in vivo, and site-specific phosphorylation dynamics in signaling networks. Cell 2006, 127(3):635-648.
3. Controlled vocabulary of posttranslational modifications [http://www.expasy.org/cgi-bin/ptmlist.pl]
4. Ptacek J, Snyder M: Charging it up: global analysis of protein phosphorylation. Trends Genet 2006, 22(10):545-554.
5. de la Fuente van Bentem S, Hirt H: Using phosphoproteomics to reveal signalling dynamics in plants. Trends Plant Sci 2007, 12(9):404-411.
6. Colcombet J, Hirt H: Arabidopsis MAPKs: a complex signalling network involved in multiple biological processes. Biochem J 2008, 413(2):217-226.
7. Maathuis FJ: Conservation of protein phosphorylation sites within gene families and across species. Plant signaling & behavior 2008, 3(11):1011-1013.
8. Sims RJ, Reinberg D: Is there a code embedded in proteins that is based on post-translational modifications? Nat Rev Mol Cell Biol 2008, 9(10):815-820.
9. Seet BT, Dikic I, Zhou MM, Pawson T: Reading protein modifications with interaction domains. Nat Rev Mol Cell Biol 2006, 7(7):473-483.
10. Wang D, Harper JF, Gribskov M: Systematic trans-genomic comparison of protein kinases between Arabidopsis and Saccharomyces cerevisiae. Plant Physiol 2003, 132(4):2152-2165.
11. Manning G, Whyte DB, Martinez R, Hunter T, Sudarsanam S: The protein kinase complement of the human genome. Science 2002, 298(5600):1912-1934.
12. Kersten B, Agrawal GK, Durek P, Neigenfind J, Schulze W, Walther D, Rakwal R: Plant phosphoproteomics: an update. Proteomics 2009, 9(4):964-988.
13. Peck SC: Phosphoproteomics in Arabidopsis: moving from empirical to predictive science. J Exp Bot 2006, 57(7):1523-1527.
14. Kersten B, Agrawal GK, Iwahashi H, Rakwal R: Plant phosphoproteomics: a long road ahead. Proteomics 2006, 6(20):5517-5528.
15. Durek P, Schmidt R, Heazlewood J, Jones A, MacLean D, Nagel A, Kersten B, Schulze W: PhosPhAt: The Arabidopsis thaliana phosphorylation site database. An update. Nucleic Acids Res 2010:D828-834.
16. Gao J, Agrawal GK, Thelen JJ, Xu D: P3DB: a plant protein phosphorylation database. Nucleic Acids Res 2009:D960-962.
17. Grimsrud PA, den Os D, Wenger CD, Swaney DL, Schwartz D, Sussman MR, Ane JM, Coon JJ: Large-scale phosphoprotein analysis in Medicago
Additional file 9 Analyses of enrichment and depletion of substitu-tions between phosphorylation sites and non-phosphorylation sites. This file contains two worksheets, 'Experimental phosphorylation sites' and 'Predicted phosphorylation sites', with the data used to create Figure 4 and the figure in the Additional file 10. P-values were adjusted following the procedure of Benjamini-Hochberg [63], significant ratios have an FDR ≤ 5E-2. The substitution cost is the minimum number of substitutions at the DNA level that are required to change one amino acid into another.Additional file 10 Effect of SNPs, comparison between predicted phosphorylation sites and non-phosphorylation sites. We evaluated the enrichment and depletion of each substitution pair (from a predicted phospho-residue to any amino acid, only predicted phosphoproteins were included in this analysis) by using 2 × 2 contingency tables for each substi-tution pair and evaluating the significance of an odds ratio different from 1 applying a Fisher's exact test. (P-values were adjusted following the proce-dure of Benjamini-Hochberg [63], significant ratios have an FDR ≤ 5E-2). A star on top of a bar indicates that the odds ratio is statistically significantly different from 1. Inf: Substitution occurred in phosphorylation sites and was absent in non-phosphorylation sites, which gives an odds ratio of infinity. Substitution amino acids in bold were never found, neither in phosphoryla-tion sites nor in non-phosphorylation sites. Substitution amino acids in red were present in non-phosphorylation sites, but absent in phosphorylation sites. The substitution cost is the minimal number of DNA substitutions that are required in order to change one amino acid into another (see Addi-tional file 9 for the dataset used to create this figure).Additional file 11 Losses of experimentally identified phosphoryla-tion sites. This file contains a single worksheet with the following columns: AGI: Arabidopsis Gene Identifier; Protein position: position in the protein sequence (TAIR7.0) where the affected a.a. is located; Status: Phosphory-lated a.a.; Accession(substitution): A. thaliana natural accession name and substituted a.a.; TAIR7 function.Additional file 12 This file contains two worksheets, "loss" and "gain" with the list of all phosphorylation sites which gained or lost a pre-dicted phosphorylation site. The table includes the status of the loss or the gain: "1" means score-based gain or loss and "2" means that the gain or loss was based on a change from an amino acid residue with a high-confi-dence phosphorylation prediction score into a non-phosphorylatable amino acid (loss) or the creation of a peptide with a confidence prediction score greater than 1 (gain). Further details can be found in "Methods".Additional file 13 Over- and underrepresented plant GO Slim catego-ries in sets of loss and gain of predicted phosphorylation sites. As ref-erence sets we used either all A. thaliana proteins or a set that comprised all proteins containing at least one high-confidence predicted phosphoryla-tion site (score ≥ 1). This file contains twelve worksheets, the first six repre-sent analysis results gained with the reference set comprising all proteins containing at least one predicted phosphorylation site, the other six have as reference set all A. thaliana proteins. For each over- and underrepre-sented GO Slim category the following columns are given: GO ID; p-value; corrected p-value; x: number of genes in the query dataset annotated to a certain GO term; X: the total number of genes in the query dataset, genes without any annotation are discarded; n: number of genes in the reference dataset annotated to a certain GO term; N: total number of genes in the ref-erence dataset, genes without any annotation are discarded.Additional file 14 Overrepresented (A) and underrepresented (B) GO Slim terms in proteins with predicted gain or loss phosphorylation sites (by nsSNP). The dataset was compared to a reference set that com-prised all proteins containing a high confidentially predicted phosphoryla-tion site (score ≥ 1). Enrichment analysis of plant GO Slim terms was carried out using the plugin BiNGO v2.3 [61] for the software package Cytoscape [62]. The size of a node is proportional to the number of genes annotated to that node. White nodes represent GO Slim terms that are not signifi-cantly over-/underrepresented. Coloured nodes go from yellow to dark orange, representing p-values from 5E-2 to 5E-7. (P-values were adjusted following the procedure of Benjamini-Hochberg [63]).Additional file 15 This file contains the list of A. thaliana accessions with SNP data that were used in this study.
Received: 9 April 2010 Accepted: 1 July 2010 Published: 1 July 2010This article is available from: http://www.biomedcentral.com/1471-2164/11/411© 2010 Riaño-Pachón et al; licensee BioMed Central Ltd. This is an Open Access article distributed under the terms of the Creative Commons Attribution License (http://creativecommons.org/licenses/by/2.0), which permits unrestricted use, distribution, and reproduction in any medium, provided the original work is properly cited.BMC Genomics 2010, 11:411

Riaño-Pachón et al. BMC Genomics 2010, 11:411http://www.biomedcentral.com/1471-2164/11/411
Page 18 of 19
truncatula roots provides insight into in vivo kinase activity in legumes. Plant Physiol 152(1):19-28.
18. Yachie N, Saito R, Sugahara J, Tomita M, Ishihama Y: In silico analysis of phosphoproteome data suggests a rich-get-richer process of phosphosite accumulation over evolution. Mol Cell Proteomics 2009, 8(5):1061-1071.
19. Malik R, Nigg EA, Korner R: Comparative conservation analysis of the human mitotic phosphoproteome. Bioinformatics 2008, 24(12):1426-1432.
20. Boekhorst J, van Breukelen B, Heck AJ, Snel B: Comparative phosphoproteomics reveals evolutionary and functional conservation of phosphorylation across eukaryotes. Genome Biol 2008, 9(10):R144.
21. Thomson M, Gunawardena J: Unlimited multistability in multisite phosphorylation systems. Nature 2009, 460(7252):274-277.
22. Benzeno S, Lu F, Guo M, Barbash O, Zhang F, Herman JG, Klein PS, Rustgi A, Diehl JA: Identification of mutations that disrupt phosphorylation-dependent nuclear export of cyclin D1. Oncogene 2006, 25(47):6291-6303.
23. Borevitz JO, Hazen SP, Michael TP, Morris GP, Baxter IR, Hu TT, Chen H, Werner JD, Nordborg M, Salt DE, Kay SA, Chory J, Weigel D, Jones JD, Ecker JR: Genome-wide patterns of single-feature polymorphism in Arabidopsis thaliana. Proc Natl Acad Sci USA 2007, 104(29):12057-12062.
24. Clark RM, Schweikert G, Toomajian C, Ossowski S, Zeller G, Shinn P, Warthmann N, Hu TT, Fu G, Hinds DA, Chen H, Frazer KA, Huson DH, Scholkopf B, Nordborg M, Ratsch G, Ecker JR, Weigel D: Common sequence polymorphisms shaping genetic diversity in Arabidopsis thaliana. Science 2007, 317(5836):338-342.
25. Nordborg M, Hu TT, Ishino Y, Jhaveri J, Toomajian C, Zheng H, Bakker E, Calabrese P, Gladstone J, Goyal R, Jakobsson M, Kim S, Morozov Y, Padhukasahasram B, Plagnol V, Rosenberg NA, Shah C, Wall JD, Wang J, Zhao K, Kalbfleisch T, Schulz V, Kreitman M, Bergelson J: The pattern of polymorphism in Arabidopsis thaliana. PLoS biology 2005, 3(7):e196.
26. Ossowski S, Schneeberger K, Clark RM, Lanz C, Warthmann N, Weigel D: Sequencing of natural strains of Arabidopsis thaliana with short reads. Genome Res 2008, 18(12):2024-2033.
27. Nuhse TS, Stensballe A, Jensen ON, Peck SC: Phosphoproteomics of the Arabidopsis plasma membrane and a new phosphorylation site database. Plant Cell 2004, 16(9):2394-2405.
28. Wolschin F, Weckwerth W: Combining metal oxide affinity chromatography (MOAC) and selective mass spectrometry for robust identification of in vivo protein phosphorylation sites. Plant Methods 2005, 1(1):9.
29. de la Fuente van Bentem S, Anrather D, Roitinger E, Djamei A, Hufnagl T, Barta A, Csaszar E, Dohnal I, Lecourieux D, Hirt H: Phosphoproteomics reveals extensive in vivo phosphorylation of Arabidopsis proteins involved in RNA metabolism. Nucleic Acids Res 2006, 34(11):3267-3278.
30. Niittyla T, Fuglsang AT, Palmgren MG, Frommer WB, Schulze WX: Temporal analysis of sucrose-induced phosphorylation changes in plasma membrane proteins of Arabidopsis. Mol Cell Proteomics 2007, 6(10):1711-1726.
31. Benschop JJ, Mohammed S, O'Flaherty M, Heck AJ, Slijper M, Menke FL: Quantitative phosphoproteomics of early elicitor signaling in Arabidopsis. Mol Cell Proteomics 2007, 6(7):1198-1214.
32. Carroll AJ, Heazlewood JL, Ito J, Millar AH: Analysis of the Arabidopsis cytosolic ribosome proteome provides detailed insights into its components and their post-translational modification. Mol Cell Proteomics 2008, 7(2):347-369.
33. Nuhse TS, Bottrill AR, Jones AM, Peck SC: Quantitative phosphoproteomic analysis of plasma membrane proteins reveals regulatory mechanisms of plant innate immune responses. Plant J 2007, 51(5):931-940.
34. Sugiyama N, Nakagami H, Mochida K, Daudi A, Tomita M, Shirasu K, Ishihama Y: Large-scale phosphorylation mapping reveals the extent of tyrosine phosphorylation in Arabidopsis. Mol Syst Biol 2008, 4:193.
35. de la Fuente van Bentem S, Anrather D, Dohnal I, Roitinger E, Csaszar E, Joore J, Buijnink J, Carreri A, Forzani C, Lorkovic ZJ, Barta A, Lecourieux D, Verhounig A, Jonak C, Hirt H: Site-specific phosphorylation profiling of Arabidopsis proteins by mass spectrometry and peptide chip analysis. J Proteome Res 2008, 7(6):2458-2470.
36. Whiteman SA, Serazetdinova L, Jones AM, Sanders D, Rathjen J, Peck SC, Maathuis FJ: Identification of novel proteins and phosphorylation sites
in a tonoplast enriched membrane fraction of Arabidopsis thaliana. Proteomics 2008, 8(17):3536-3547.
37. Jones AM, MacLean D, Studholme DJ, Serna-Sanz A, Andreasson E, Rathjen JP, Peck SC: Phosphoproteomic analysis of nuclei-enriched fractions from Arabidopsis thaliana. J Proteomics 2009, 72(3):439-451.
38. Li H, Wong WS, Zhu L, Guo HW, Ecker J, Li N: Phosphoproteomic analysis of ethylene-regulated protein phosphorylation in etiolated seedlings of Arabidopsis mutant ein2 using two-dimensional separations coupled with a hybrid quadrupole time-of-flight mass spectrometer. Proteomics 2009, 9(6):1646-1661.
39. Reiland S, Messerli G, Baerenfaller K, Gerrits B, Endler A, Grossmann J, Gruissem W, Baginsky S: Large-scale Arabidopsis phosphoproteome profiling reveals novel chloroplast kinase substrates and phosphorylation networks. Plant Physiol 2009, 150(2):889-903.
40. Michard E, Dreyer I, Lacombe B, Sentenac H, Thibaud JB: Inward rectification of the AKT2 channel abolished by voltage-dependent phosphorylation. Plant J 2005, 44(5):783-797.
41. Sugiyama N, Masuda T, Shinoda K, Nakamura A, Tomita M, Ishihama Y: Phosphopeptide enrichment by aliphatic hydroxy acid-modified metal oxide chromatography for nano-LC-MS/MS in proteomics applications. Mol Cell Proteomics 2007, 6(6):1103-1109.
42. Molina H, Horn DM, Tang N, Mathivanan S, Pandey A: Global proteomic profiling of phosphopeptides using electron transfer dissociation tandem mass spectrometry. Proc Natl Acad Sci USA 2007, 104(7):2199-2204.
43. Bodenmiller B, Mueller LN, Mueller M, Domon B, Aebersold R: Reproducible isolation of distinct, overlapping segments of the phosphoproteome. Nat Methods 2007, 4(3):231-237.
44. Cohen P: The regulation of protein function by multisite phosphorylation--a 25 year update. Trends in biochemical sciences 2000, 25(12):596-601.
45. Ferrarese A, Marin O, Bustos VH, Venerando A, Antonelli M, Allende JE, Pinna LA: Chemical dissection of the APC Repeat 3 multistep phosphorylation by the concerted action of protein kinases CK1 and GSK3. Biochemistry 2007, 46(42):11902-11910.
46. Park KS, Mohapatra DP, Misonou H, Trimmer JS: Graded regulation of the Kv2.1 potassium channel by variable phosphorylation. Science 2006, 313(5789):976-979.
47. Pufall MA, Lee GM, Nelson ML, Kang HS, Velyvis A, Kay LE, McIntosh LP, Graves BJ: Variable control of Ets-1 DNA binding by multiple phosphates in an unstructured region. Science 2005, 309(5731):142-145.
48. Kodiha M, Tran D, Morogan A, Qian C, Stochaj U: Dissecting the signaling events that impact classical nuclear import and target nuclear transport factors. PLoS ONE 2009, 4(12):e8420.
49. Holt LJ, Tuch BB, Villen J, Johnson AD, Gygi SP, Morgan DO: Global analysis of Cdk1 substrate phosphorylation sites provides insights into evolution. Science 2009, 325(5948):1682-1686.
50. Yun HS, Bae YH, Lee YJ, Chang SC, Kim SK, Li J, Nam KH: Analysis of phosphorylation of the BRI1/BAK1 complex in arabidopsis reveals amino acid residues critical for receptor formation and activation of BR signaling. Molecules and cells 2009, 27(2):183-190.
51. Riese DJ, Gallo RM, Settleman J: Mutational activation of ErbB family receptor tyrosine kinases: insights into mechanisms of signal transduction and tumorigenesis. Bioessays 2007, 29(6):558-565.
52. The Arabidopsis Genome Initiative: Analysis of the genome sequence of the flowering plant Arabidopsis thaliana. Nature 2000, 408(6814):796-815.
53. Swarbreck D, Wilks C, Lamesch P, Berardini TZ, Garcia-Hernandez M, Foerster H, Li D, Meyer T, Muller R, Ploetz L, Radenbaugh A, Singh S, Swing V, Tissier C, Zhang P, Huala E: The Arabidopsis Information Resource (TAIR): gene structure and function annotation. Nucleic Acids Res 2008:D1009-1014.
54. Finn RD, Mistry J, Tate J, Coggill P, Heger A, Pollington JE, Gavin OL, Gunasekaran P, Ceric G, Forslund K, Holm L, Sonnhammer EL, Eddy SR, Bateman A: The Pfam protein families database. Nucleic Acids Res 2010:D211-222.
55. Download site Clark et al. 2007 dataset [ftp://ftp.arabidopsis.org/home/tair/Sequences/Perlegen_Array_Resequencing_Data_2007]
56. Download site Ossowski et al. 2008 dataset [http://1001genomes.org/downloads/]

Riaño-Pachón et al. BMC Genomics 2010, 11:411http://www.biomedcentral.com/1471-2164/11/411
Page 19 of 19
57. Riaño-Pachón DM, Nagel A, Neigenfind J, Wagner R, Basekow R, Weber E, Mueller-Roeber B, Diehl S, Kersten B: GabiPD: the GABI primary database--a plant integrative 'omics' database. Nucleic Acids Res 2009:D954-959.
58. Altschul SF, Gish W, Miller W, Myers EW, Lipman DJ: Basic local alignment search tool. J Mol Biol 1990, 215(3):403-410.
59. Zhang Z, Schwartz S, Wagner L, Miller W: A greedy algorithm for aligning DNA sequences. J Comput Biol 2000, 7(1-2):203-214.
60. Ashburner M, Ball C, Blake J, Botstein D, Butler H, Cherry J, Davis A, Dolinski K, Dwight S, Eppig J, Harris M, Hill D, Issel-Tarver L, Kasarskis A, Lewis S, Matese J, Richardson J, Ringwald M, Rubin G, Sherlock G: Gene ontology: tool for the unification of biology. The Gene Ontology Consortium. Nat Genet 2000, 25(1):25-29.
61. Maere S, Heymans K, Kuiper M: BiNGO: a Cytoscape plugin to assess overrepresentation of gene ontology categories in biological networks. Bioinformatics 2005, 21(16):3448-3449.
62. Shannon P, Markiel A, Ozier O, Baliga NS, Wang JT, Ramage D, Amin N, Schwikowski B, Ideker T: Cytoscape: a software environment for integrated models of biomolecular interaction networks. Genome Res 2003, 13(11):2498-2504.
63. Benjamini YaYH: Controlling the False Discovery Rate - a Practical and Powerful Approach to Multiple Testing. J R Stat Soc Series B Stat Methodol 1995, 57(1):289-300.
doi: 10.1186/1471-2164-11-411Cite this article as: Riaño-Pachón et al., Proteome-wide survey of phospho-rylation patterns affected by nuclear DNA polymorphisms in Arabidopsis thaliana BMC Genomics 2010, 11:411