Protein restriction does not affect body temperature pattern in ...
7
—Original— Protein restriction does not affect body temperature pattern in female mice Goro A. KATO 1–3) , Hiroki SHICHIJO 2) , Toshihiro TAKAHASHI 4) , Akio SHINOHARA 2) , Tetsuo MORITA 4) , and Chihiro KOSHIMOTO 2) 1) Graduate School of Medicine and Veterinary Medicine, University of Miyazaki, 5200 Kihara, Kiyotake, Miyazaki, Miyazaki 889-1692, Japan 2) Division of Bio–resources, Department of Biotechnology, Frontier Science Research Center, University of Miyazaki, 5200 Kihara, Kiyotake, Miyazaki, Miyazaki 889-1692, Japan 3) Present address: Center of Biomedical Research, Research Center for Human Disease Modeling, Graduate School of Medical Sciences, University of Kyushu, 3-1-1 Maidashi, Fukuoka, Fukuoka 812-8582, Japan 4) Department of Animal and Grassland Sciences, Faculty of Agriculture, University of Miyazaki, 1-1 Gakuenkibanadai-Nishi, Miyazaki, Miyazaki 889-2192, Japan Abstract: Daily torpor is a physiological adaptation in mammals and birds characterized by a controlled reduction of metabolic rate and body temperature during the resting phase of circadian rhythms. In laboratory mice, daily torpor is induced by dietary caloric restriction. However, it is not known which nutrients are related to daily torpor expression. To determine whether dietary protein is a key factor in inducing daily torpor in mice, we fed mice a protein-restricted (PR) diet that included only one- quarter of the amount of protein but the same caloric level as a control (C) diet. We assigned six non-pregnant female ICR mice to each group and recorded their body weights and core body temperatures for 4 weeks. Body weights in the C group increased, but those in the PR group remained steady or decreased. Mice in both groups did not show daily torpor, but most mice in a food-restricted group (n=6) supplied with 80% of the calories given to the C group exhibited decreased body weights and frequently displayed daily torpor. This suggests that protein restriction is not a trigger of daily torpor; torpid animals can conserve their internal energy, but torpor may not play a significant role in conserving internal protein. Thus, opportunistic daily torpor in mice may function in energy conservation rather than protein saving. Key words: core body temperature, daily torpor, female mice, isocaloric, protein restriction Introduction Through long-standing multidisciplinary efforts by scientists, the nutrient requirements of laboratory ani- mals have been precisely determined (e.g. AIN-93 de- scribed by the National Research Council [19]). These guidelines enable us to investigate the various influ- ences of a lack of dietary nutrients on developmental, physiological, and behavioral traits. For example, a deficiency in dietary folic acid induces premature hear- ing loss [14], a deficiency in dietary zinc induces cutane- ous disorders and/or idiopathic dysgeusia [11], and a deficiency in dietary thiamine (vitamin B) induces Wer- nicke–Korsakoff syndrome and related neurological disorders, which lead to delirium tremens, poor eyelid function, and ataxia [31]. On the other hand, there are still unresolved issues concerning the influence of a lack of dietary nutrients on several adaptive animal behaviors. (Received 31 March 2017 / Accepted 18 May 2017 / Published online in J-STAGE 13 June 2017) Address corresponding: C. Koshimoto, 5200 Kihara, Kiyotake, Miyazaki, Miyazaki 889-1692, Japan Supplementary Figures: refer to J-STAGE: https://www.jstage.jst.go.jp/browse/expanim Exp. Anim. 66(4), 321–327, 2017 ©2017 Japanese Association for Laboratory Animal Science
-
Upload
khangminh22 -
Category
Documents
-
view
0 -
download
0
Transcript of Protein restriction does not affect body temperature pattern in ...

mdashOriginalmdash
Protein restriction does not affect body temperature pattern in female mice
Goro A KAto1ndash3) Hiroki SHicHijo2) toshihiro tAKAHASHi4) Akio SHinoHArA2) tetsuo MoritA4) and chihiro KoSHiMoto2)
1)Graduate School of Medicine and Veterinary Medicine University of Miyazaki 5200 Kihara Kiyotake Miyazaki Miyazaki 889-1692 Japan
2)Division of Biondashresources Department of Biotechnology Frontier Science Research Center University of Miyazaki 5200 Kihara Kiyotake Miyazaki Miyazaki 889-1692 Japan
3)Present address Center of Biomedical Research Research Center for Human Disease Modeling Graduate School of Medical Sciences University of Kyushu 3-1-1 Maidashi Fukuoka Fukuoka 812-8582 Japan
4)Department of Animal and Grassland Sciences Faculty of Agriculture University of Miyazaki 1-1 Gakuenkibanadai-Nishi Miyazaki Miyazaki 889-2192 Japan
Abstract Daily torpor is a physiological adaptation in mammals and birds characterized by a controlled reduction of metabolic rate and body temperature during the resting phase of circadian rhythms In laboratory mice daily torpor is induced by dietary caloric restriction However it is not known which nutrients are related to daily torpor expression To determine whether dietary protein is a key factor in inducing daily torpor in mice we fed mice a protein-restricted (PR) diet that included only one-quarter of the amount of protein but the same caloric level as a control (C) diet We assigned six non-pregnant female ICR mice to each group and recorded their body weights and core body temperatures for 4 weeks Body weights in the C group increased but those in the PR group remained steady or decreased Mice in both groups did not show daily torpor but most mice in a food-restricted group (n=6) supplied with 80 of the calories given to the C group exhibited decreased body weights and frequently displayed daily torpor This suggests that protein restriction is not a trigger of daily torpor torpid animals can conserve their internal energy but torpor may not play a significant role in conserving internal protein Thus opportunistic daily torpor in mice may function in energy conservation rather than protein savingKey words core body temperature daily torpor female mice isocaloric protein restriction
Introduction
Through long-standing multidisciplinary efforts by scientists the nutrient requirements of laboratory ani-mals have been precisely determined (eg AIN-93 de-scribed by the National Research Council [19]) These guidelines enable us to investigate the various influ-ences of a lack of dietary nutrients on developmental physiological and behavioral traits For example a
deficiency in dietary folic acid induces premature hear-ing loss [14] a deficiency in dietary zinc induces cutane-ous disorders andor idiopathic dysgeusia [11] and a deficiency in dietary thiamine (vitamin B) induces Wer-nickendashKorsakoff syndrome and related neurological disorders which lead to delirium tremens poor eyelid function and ataxia [31] On the other hand there are still unresolved issues concerning the influence of a lack of dietary nutrients on several adaptive animal behaviors
(Received 31 March 2017 Accepted 18 May 2017 Published online in J-STAGE 13 June 2017)Address corresponding C Koshimoto 5200 Kihara Kiyotake Miyazaki Miyazaki 889-1692 JapanSupplementary Figures refer to J-STAGE httpswwwjstagejstgojpbrowseexpanim
Exp Anim 66(4) 321ndash327 2017
copy2017 Japanese Association for Laboratory Animal Science
GA KAto ET AL322
Daily torpor is a physiological adaptation in mammals and birds that is induced by energy-limited situations such as starvation or cold [24] This adaptation is char-acterized by a controlled reduction of metabolic rate (MR) and body temperature (Tb) during the resting phase of the circadian rhythm [7] As the surface area-to-vol-ume ratio of small mammals is larger than that of large mammals small mammals have greater energy require-ments per body mass due to their greater heat loss [4] therefore small mammals have a more pronounced tendency for torpor than large ones [24] Some labora-tory rodents also express daily torpor (eg the white-footed mouse (Peromyscus leucopus) [18] and the house mouse (Mus musculus) [5 25])
Historically many studies have suggested that daily torpor may play an important role in energy conservation by lowering MR and Tb Additionally studies have at-tempted to determine the novel functions of daily torpor applicable to the extension of life [9 22 30] Daily tor-por is also regarded as a confounding factor in some energy constraint experimental procedures [13 20] because low MR and low Tb can modulate an animalrsquos physiological status such as physical activity blood properties and cell mitotic activity [9 25] Therefore knowledge of the details of the mechanism and functions of daily torpor in laboratory animals would be valuable
Laboratory mice express daily torpor in response to fasting and dietary caloric restriction [5 9 16] Addition-ally obvious strain- and individual-related variations in torpor expression have been observed [1 22] Further-more mice can regulate the depth of a torpid bout based on the level of dietary or caloric supplementation [16 26] This suggests that mice have a sensitive reaction to changes in energetic conditions this area of research usually focuses on integrated energy restriction events although dietary energy sources are multifactorial con-taining fats proteins and carbohydrates We examined whether a deficiency in specific energy sources (ie fat protein or carbohydrate) corresponds to the expression of daily torpor if so this might elucidate a novel func-tion of daily torpor andor a method for regulating torpor expression
Here we focused on deficiency in dietary protein in-take because protein is one of important nutrients in maintaining the energy balance of homeostasis and is a source of several enzymes Severe protein deficiency affects various endocrinological activities and in some cases leads to death from malnutrition [19] A deficien-
cy in dietary protein intake can be partially compen-sated for by the endogenous protein store (primarily in the liver) or muscular degradation [19] Recently Mitch-ell et al [16] reported that the C57BL6 strain of inbred male mice never expressed daily torpor following restric-tion of dietary protein intake (dietary protein-restricted levels 20 30 and 40 compared to control diet) but caloric-restricted groups (dietary caloric restriction levels 20 30 and 40 compared to control diet) expressed daily torpor (see also Materials and Methods) This result appears to indicate that caloric but not protein restriction is a principal trigger for the expression of daily torpor by starvation Although Mitchell et al [16] used male mice in their protein restriction experimenta-tion it is important for experimental zoology to know sexual difference under the similar conditions Even Sunagawa and takahashi showed recently that male mice can enter daily torpor in certain conditions [28] it has been generally believed that male rodents are less likely to enter daily torpor [23 29] mainly because of their high concentration of endogenous testosterone there-fore to determine the relationship between protein re-striction and the expression of daily torpor we need to consider the case in female mice In this study we sub-jected female laboratory mice to more severe restrictions in dietary protein intake than those of Mitchell et al [16] and determined the tb patterns especially with regard to the expression of daily torpor
Materials and Methods
Animals and housing conditionsFemales of the ICR strain of laboratory mice (n=18
9 weeks of age) were purchased from SLC Japan Bred Co Ltd (Shizuoka Japan) We selected this strain be-cause they express daily torpor in response to starvation and have a high body mass making it easier to implant a thermostat into the abdominal cavity [5 21] Mice were housed individually in plastic cages (W 225 times D 338 times H 140 mm CREA Japan Tokyo Japan) with wood shav-ings as bedding and allowed free access to a solid diet (Labo MR Stock Nosan Corporation Kanagawa Japan) and tap water until the experimental period (see below) the room environment was strictly controlled as follows room temperature throughout the experiment was main-tained at 24degc and the photoperiodic cycle was 12 h 12 h (light dark light turned on at 0800) All experi-mental procedures in this study were approved by the
PROTEIN NUTRITION AND TORPOR IN MICE 323
Animal Experiment Committee of the University of Miyazaki (Permission No 2005ndash053-10)
DietsThe compositions of our experimental diets are de-
scribed in Table 1 We prepared two types of powdered diet in accordance with AIN-93M a common purified diet for laboratory mice [19 21] The control diet (C diet) maintained the exact same composition as AIN-93M including 140 casein and 018 L-cystine as protein sources The protein-restricted diet (PR diet) partially replaced casein and L-cystine with cornstarch (carbohydrate) and included 35 casein and 0045 L-cystine the Pr diet had only a quarter of the protein amount relative to the c diet while maintaining the same caloric level as the c diet with respect to gross energy (GE) Mitchell et al [16] used four diets including 20 16 14 and 12 protein in each diet supplemented by increasing amounts of carbohydrate (see details in Mitchell et al [16]) The PR diet used in this study had a more severe level of dietary protein restriction (about 35 casein as a protein source) than those used in Mitchell et al [16] Each diet was mixed about once monthly in 10-kg batches and stored at 4degC until feeding
Core body temperature (Tb) measurementTo record core body temperature (Tb) and estimate the
expression of daily torpor we implanted a data logger (iButtons DS1922L Maxim Integrated CA USA) in the abdominal cavity of female mice under anesthesia (Sodium pentobarbital (54 mgkg) Somnopentyl Kyo-
ritsu Seiyaku Corporation Tokyo Japan) We allowed all mice at least 3 weeks of recovery under ad libitum feeding conditions and used their body mass as an indi-cator of recovery
Data loggers were coated with a thin layer of a paraf-finndashEvaflex mixture (EV220 Du PontndashMitsui Poly-chemical co Ltd tokyo japan) according to Masaki et al [15] to avoid damage by serous fluid These loggers were programmed to record temperature every 15 min at a 16-bit resolution (00625degC) which yielded 45 con-secutive days of data Logger weights were 356 plusmn 023 g This data logger is acceptable for implantation into the abdominal cavities of female mice weighing around 40 g (less than 10 of the body weight of female mice)
Experimental procedureWe transferred each mouse from its home cage to
another cage lined with steel wire mesh We supplied 100 gday of the C diet for 5 days to acclimate mice to a powdered diet then gradually reduced the diet supply by 10 g every 3 days When the diet supply reached 60 gday mice consumed all the supplied diet Hence we continued this supplementation for 5 more days but no loss of body weight was observed with this amount Therefore we determined the amount of the diet as 60 gday
At the end of this estimation trial we randomly as-signed all mice to either the control group (C group n=6) or the protein-restricted group (PR group n=6) We also established a food-restricted group (FR group n=6) which was used to determine the reaction of the expres-sion of daily torpor in the context of food restriction in the icr strain of mice the c and Pr groups were sup-plied 60 gday of the C and PR diet for 4 weeks respec-tively The FR group was supplied 80 of the amount of the C diet compared to the C group (48 gday) for 4 weeks We determined the expression of daily torpor in each mouse during this period Body weights were mea-sured every 2 days If weight loss reached 15 of the initial body weight we terminated the experiment for that mouse
Data handling and statistical analysisWe analyzed body weight data and Tb data throughout
the experimental period Changes in body weight from the start to the end of the experiment in each group were examined using the paired t-test comparisons of termi-nal body weight data among groups were estimated by
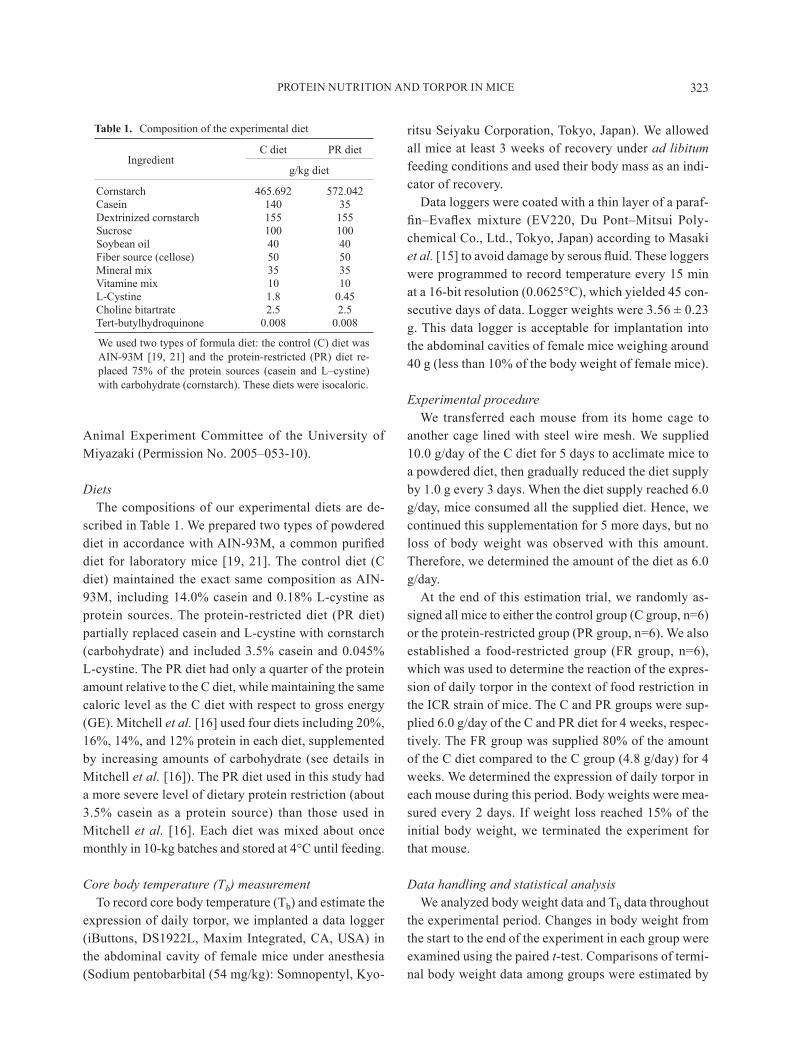
Table 1 Composition of the experimental diet
ingredientc diet Pr diet
gkg diet
cornstarch 465692 572042casein 140 35Dextrinized cornstarch 155 155Sucrose 100 100Soybean oil 40 40Fiber source (cellose) 50 50Mineral mix 35 35Vitamine mix 10 10L-cystine 18 045Choline bitartrate 25 25Tert-butylhydroquinone 0008 0008
We used two types of formula diet the control (C) diet was AIN-93M [19 21] and the protein-restricted (PR) diet re-placed 75 of the protein sources (casein and Lndashcystine) with carbohydrate (cornstarch) These diets were isocaloric
GA KAto ET AL324
the TukeyndashKramer HSD test We calculated three Tb parameters daily mean tb (Mean Tb) daily minimum tb (Min Tb) and daily maximum Tb (Max Tb) these tb parameters were also compared among groups using the TukeyndashKramer HSD test The expression of daily torpor was defined as Tblt31degC [5] and compared among all groups
Statistical analyses were performed using jMP 10 (JMP 10 Basic Analysis and Graphing SAS Institute 2012) A Plt005 was considered statistically significant and results were expressed as means plusmn SD
Results
Body weight and food consumptionFemale mice consumed most of the supplied diets (C
group 576 plusmn 036 g PR group 585 plusmn 018 g FR group 479 plusmn 008 g) Daily protein intake for each mouse was about 085 g for the C group 021 g for the PR group and 068 g for the FR group These results suggest that the c and Pr groups consumed the same amounts of calories but protein intake was reduced by 75 in the Pr group
Despite the initial body weights being approximately the same (4442 plusmn 168 g for the C group 4475 plusmn 151 g for the PR group and 4378 plusmn 217 g for the FR group) body weights after the experiment were 5000 plusmn 261 g for the C group 4377 plusmn 278 g for the PR group and 4042 plusmn 320 g for the FR group The C group had a significantly higher body weight than the PR and FR groups (Plt005) after the experimental period The C group gradually became heavier at 1125 relative to the initial body weight (Plt005) but the weights were 978 (P=029) and 923 (Plt005) for the PR and FR groups respectively (Fig 1)
Core Tb and torpor expressionFive of six mice in the FR group exhibited torpor
(Tblt31degC [5]) but no mice did in the C and PR groups (Table 2 Fig 2) Additionally we did not detect any significant differences in Tb parameters (Mean Tb Min tb and Max Tb) between the C and PR groups (P=09728 P=08956 and P=05478 respectively) The tb parameters for the FR group were significantly lower compared with those for the C and PR groups (Plt005) Female mice did not exhibit torpor under PR conditions but did under energy-deficient conditions
Daily tb patterns in both the C and PR groups were
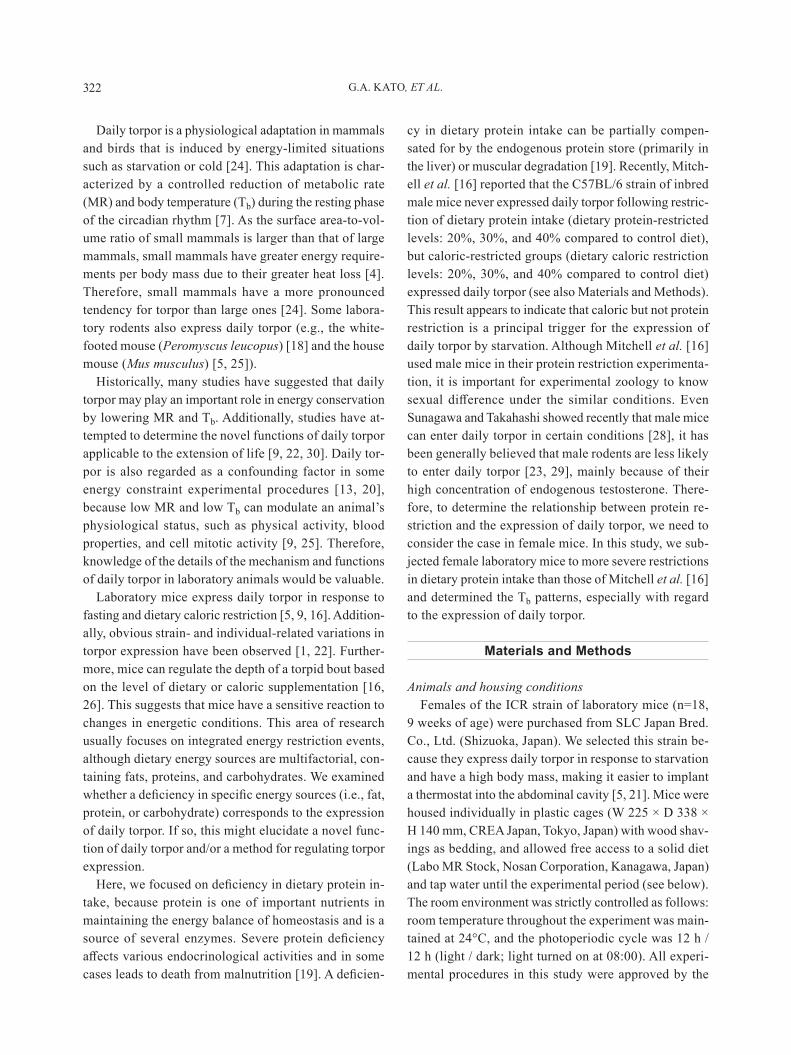
similar but the FR group was very different in this re-gard specifically mice in the FR group had low Tb (be-low 35degC) starting on the day of food restriction and this ratio gradually increased throughout the experiment (Fig 2 Supplementary Figs S1ndashS3)
Discussion
We subjected female ICR mice to severe protein re-striction (75 lower daily protein intake compared to normal conditions PR group) however they did not exhibit any Tb reductions during the resting phase in contrast in the food-restricted group (20 lower daily food intake compared to the control group FR group) five of six mice sporadically or frequently expressed daily torpor (Fig 2 Supplementary Figs S1ndashS3) Ad-ditionally the tb parameters (Mean Min and Max Tb) and daily tb patterns indicated a similar pattern in the control (C group) and PR groups (Table 2 Fig 2 Supple-mentary Figs S1ndashS3) Most mice consumed all their food and none of the mice in the c group decreased in
Fig 1 Body weight changes in control (C) protein-restricted (PR) and food-restricted (FR) groups during the experi-ment Body weights changed in the C (increased) and FR (decreased) groups but the PR group maintained body weight over the experimental period Error bars indicate mean plusmn SD
Table 2 Summary of tb parameters in the C PR and FR groups
tb parameters c group Pr group FR group
Mean tb (degC) 3719 plusmn 027 3720 plusmn 023 3528 plusmn 079Max Tb (degC) 3866 plusmn 023 3869 plusmn 027 3837 plusmn 033Min tb (degC) 3576 plusmn 041 3571 plusmn 043 3245 plusmn 157no of torpid mice 06 06 56
Note Plt005 Tukey-Kramer HSD test
PROTEIN NUTRITION AND TORPOR IN MICE 325
body weight (Fig 1) indicating that the amounts of calories for the C and PR groups were sufficient and they did not express daily torpor (Table 2) Therefore the results indicate that mice may preserve thermal ho-meostasis when caloric intake is sufficient even if protein intake is insufficient
Dietary protein restriction clearly influenced body weight gain in female mice They did not gain any body weight throughout the experimental period (Fig 1) im-plying that the mice in the PR group may have had a zero energy balance Generally PR animals partially com-pensate by using several amino acids for protein homeo-stasis and enhancing the degradation of skeletal muscle and hepatic protein stores [8 10 12] However degrada-tion of internal proteins is an insufficient explanation of why female mice maintained their body weight for so long under PR feeding (4 weeks in this experiment) We suspect that female mice may uptake fecal protein which is called ldquocoprophagyrdquo and which plays nutritionally
significant roles in providing microbial proteins to ani-mals via feces coprophagy is closely related to the cecum in terms of protein nutrition [27] Ebino et al [2] demonstrated that laboratory mice also engage in co-prophagy and that feces were a rich source of proteins and other nutrients such as vitamins therefore it is possible that the mice we tested did not express daily torpor following restriction of protein in their diet be-cause they increased the frequency of coprophagy tor-por in the garden dormouse Eliomys quercinus which does not have a cecum was induced by protein defi-ciency even though energy requirements were amply satisfied [17] indicating that they may not ingest micro-bial proteins by coprophagy This would suggest that our results are not generally applicable to all mammalian species Therefore we need to consider species differ-ences including feeding phenology and morphological digestive capacities to estimate the relationship between a deficiency of a specific energy source and daily torpor
Fig 2 representative daily tb patterns in control (C) protein-restricted (PR) and food-restricted (FR) groups during the experiment C and PR mice had similar daily Tb patterns there were few measurements of tblt35degC in the C and PR groups but the FR group frequently had a tblt35degC during this experiment The vertical line shows the percentage of Tb in each day of experiment C PR and FR labels indicate ldquogroup namerdquo of the mice Supplemen-tary Figs S1ndashS3 show individual daily Tb pattern data
GA KAto ET AL326
Five of six mice in the FR group exhibited daily torpor (Table 2) Their daily torpor patterns were frequent or sporadic with significant variation among individuals Additionally the FR group frequently had low Tb (below 35degC) during the restricted feeding period but the C and PR groups did not (Fig 2 Supplementary Figs S1ndashS3) We initially focused on the expression of daily torpor (Tblt31degC) however female mice showed a gradual adjustment to a nutrition-restricted situation this low tb but not daily torpor appeared to be accompanied by a small reduction in metabolic rate and may have con-tributed to energy conservation as an alternative to daily torpor Interestingly the large Japanese field mouse (Apodemus speciosus) may be cognizant of the magni-tude of a food cache and change torpor patterns [3] Moreover mice can regulate the depth of a bout depend-ing on dietary restriction [26] Hence flexible expression of daily torpor and a minor reduction of tb may be re-lated to a psychological recognition of food quantity and body condition by the mouse itself Therefore more attention should be given to the influences of the feeding process and appetite on the expression of daily torpor and gradual changes in tb
in this study we determined that dietary protein re-striction failed to induce daily torpor in female labora-tory mice Although we did not identify a novel nutri-tional function for daily torpor our research on daily torpor has only just begun In our future research we aim to determine the influence of deficiencies in other nutrients and feeding systems on the induction of daily torpor
Acknowledgments
This work was supported by the Ministry of Educa-tion Culture Sports Science and Technology (MEXT) of japan
References
1 Dikic D Heldmaier G and Meyer CW 2008 Induced torpor in different strains of laboratory mice pp 223ndash230 In Hypometabolism in Animals Hibernation Torpor and Cryobiology (Lovegrove BG and McKechnie AE eds) University of KwaZulundashNatal Pietermaritzburg KwaZulundashnatal South Africa
2 Ebino KY 1993 Studies on coprophagy in experimental animals Jikken Dobutsu 42 1ndash9 [Medline]
3 Eto T Hayashi R Okubo Y Kashimura A Koshimoto
C Sakamoto SH and Morita T 2015 Magnitude of food overabundance affects expression of daily torpor Physiol Behav 139 519ndash523 [Medline] [CrossRef]
4 Geiser F 2004 Metabolic rate and body temperature reduc-tion during hibernation and daily torpor Annu Rev Physiol 66 239ndash274 [Medline] [CrossRef]
5 Hudson JW and Scott IM 1979 Daily torpor in the labo-ratory mouse Mus musculus var albino Physiol Zool 52 205ndash218 [CrossRef]
6 Heldmaier G Klingenspor M Werneyer M Lampi BJ Brooks SP and Storey KB 1999 Metabolic adjustments during daily torpor in the Djungarian hamster Am J Physi-ol 276 E896ndashE906 [Medline]
7 Heldmaier G Ortmann S and Elvert R 2004 Natural hy-pometabolism during hibernation and daily torpor in mam-mals Respir Physiol Neurobiol 141 317ndash329 [Medline] [CrossRef]
8 Kalhan SC Uppal SO Moorman JL Bennett C Gruca LL Parimi PS Dasarathy S Serre D and Han-son RW 2011 Metabolic and genomic response to dietary isocaloric protein restriction in the rat J Biol Chem 286 5266ndash5277 [Medline] [CrossRef]
9 Koizumi A Tsukada M Wada Y Masuda H and Wein-druch R 1992 Mitotic activity in mice is suppressed by energy restriction-induced torpor J Nutr 122 1446ndash1453 [Medline]
10 Laeger T Reed SD Henagan TM Fernandez DH Taghavi M Addington A Muumlnzberg H Martin RJ Hutson SM and Morrison cD 2014 Leucine acts in the brain to suppress food intake but does not function as a physiological signal of low dietary protein Am J Physiol Regul Integr Comp Physiol 307 r310ndashr320 [Medline] [CrossRef]
11 Maret W and Sandstead HH 2006 Zinc requirements and the risks and benefits of zinc supplementation J Trace Elem Med Biol 20 3ndash18 [Medline] [CrossRef]
12 Martens EA and Westerterp-Plantenga MS 2014 Protein diets body weight loss and weight maintenance Curr Opin Clin Nutr Metab Care 17 75ndash79 [Medline]
13 Martin B Ji S Maudsley S and Mattson MP 2010 ldquoControlrdquo laboratory rodents are metabolically morbid why it matters Proc Natl Acad Sci USA 107 6127ndash6133 [Medline] [CrossRef]
14 Martiacutenez-Vega R Garrido F Partearroyo T Cediel R Zeisel SH Martiacutenez-Aacutelvarez C Varela-Moreiras G Varela-Nieto I and Pajares MA 2015 Folic acid defi-ciency induces premature hearing loss through mechanisms involving cochlear oxidative stress and impairment of ho-mocysteine metabolism FASEB J 29 418ndash432 [Medline] [CrossRef]
15 Masaki M Koshimoto C Tsuchiya K Nishiwaki A and Morita T 2005 Body temperature profiles of the Korean field mouse Apodemus peninsulae during winter aggrega-tion Mammal Study 30 33ndash40 [CrossRef]
16 Mitchell SE Delville C Konstantopedos P Derous D Green CL Chen L Han JDJ Wang Y Promislow DEL Douglas A Lusseau D and Speakman JR 2015 The effects of graded levels of calorie restriction III Impact
PROTEIN NUTRITION AND TORPOR IN MICE 327
of short term calorie and protein restriction on mean daily body temperature and torpor use in the C57BL6 mouse On-cotarget 6 18314ndash18337 [Medline] [CrossRef]
17 Montoya R Ambid L and Agid R 1979 Torpor induced at any season by suppression of food proteins in a hiberna-tor the garden dormouse (Eliomys quercinus L) Comp Bio-chem Physiol A Mol Integr Physiol 62 371ndash376 [Cross-Ref]
18 Morhardt JE and Hudson JW 1966 Daily torpor induced in white-footed mice (Peromyscus spp) by starvation Na-ture 212 1046ndash1047 [Medline] [CrossRef]
19 National Research Council (US) 1995 Subcommittee on Laboratory Animal Nutrition Nutrient requirements of labo-ratory animals Fourth Revised Edition National Academies Press (US) Washington DC
20 overton jM 2010 Phenotyping small animals as models for the human metabolic syndrome thermoneutrality mat-ters Int J Obes 34(Suppl 2) S53ndashS58 [Medline] [Cross-Ref]
21 Reeves PG Nielsen FH and Fahey GC Jr 1993 AIN-93 purified diets for laboratory rodents final report of the American institute of nutrition ad hoc writing committee on the reformulation of the AIN-76A rodent diet J Nutr 123 1939ndash1951 [Medline]
22 Rikke BA Yerg JE 3rd Battaglia ME Nagy TR Al-lison DB and Johnson TE 2003 Strain variation in the response of body temperature to dietary restriction Mech Ageing Dev 124 663ndash678 [Medline] [CrossRef]
23 Ruby NF Nelson RJ Licht P and Zucker I 1993 Pro-lactin and testosterone inhibit torpor in Siberian hamsters Am J Physiol 264 R123ndashR128 [Medline]
24 Ruf T and Geiser F 2015 Daily torpor and hibernation in
birds and mammals Biol Rev Camb Philos Soc 90 891ndash926 [Medline] [CrossRef]
25 Schubert KA Boerema AS Vaanholt LM de Boer SF Strijkstra AM and Daan S 2010 Daily torpor in mice high foraging costs trigger energy-saving hypother-mia Biol Lett 6 132ndash135 [Medline] [CrossRef]
26 Sekijima T Induced daily torpor in house mice 2000 Intro-duction of daily torpor in laboratory mice pp 234ndash253 In Hibernation in Mammals (Kawamichi T Kondo N and Morita T eds) University of Tokyo Press Tokyo (In Japa-nese)
27 Shichijo H Takahashi T Kondo Y Sakamoto SH and Morita T 2013 Nutritional significance of coprophagy in the rat-like hamster Tscherskia triton Mammalia 77 329ndash333 [CrossRef]
28 Sunagawa GA and Takahashi M 2016 Hypometabolism during daily torpor in mice is dominated by reduction in the sensitivity of the thermoregulatory system Sci Rep 6 37011 [Medline] [CrossRef]
29 Swoap SJ and Gutilla MJ 2009 Cardiovascular changes during daily torpor in the laboratory mouse Am J Physiol Regul Integr Comp Physiol 297 R769ndashR774 [Medline] [CrossRef]
30 Turbill C Smith S Deimel C and Ruf T 2012 Daily torpor is associated with telomere length change over winter in Djungarian hamsters Biol Lett 8 304ndash307 [Medline] [CrossRef]
31 Victor M Adams RD and Collins GH 1989 The Wer-nickendashKorsakoff Syndrome (WKS) pp 61ndash110 In the WernickendashKorsakoff Syndrome and Related Neurologic Disorders Due to Alcoholism and Malnutrition 2nd ed FA Davis Philadelphia USA
GA KAto ET AL322
Daily torpor is a physiological adaptation in mammals and birds that is induced by energy-limited situations such as starvation or cold [24] This adaptation is char-acterized by a controlled reduction of metabolic rate (MR) and body temperature (Tb) during the resting phase of the circadian rhythm [7] As the surface area-to-vol-ume ratio of small mammals is larger than that of large mammals small mammals have greater energy require-ments per body mass due to their greater heat loss [4] therefore small mammals have a more pronounced tendency for torpor than large ones [24] Some labora-tory rodents also express daily torpor (eg the white-footed mouse (Peromyscus leucopus) [18] and the house mouse (Mus musculus) [5 25])
Historically many studies have suggested that daily torpor may play an important role in energy conservation by lowering MR and Tb Additionally studies have at-tempted to determine the novel functions of daily torpor applicable to the extension of life [9 22 30] Daily tor-por is also regarded as a confounding factor in some energy constraint experimental procedures [13 20] because low MR and low Tb can modulate an animalrsquos physiological status such as physical activity blood properties and cell mitotic activity [9 25] Therefore knowledge of the details of the mechanism and functions of daily torpor in laboratory animals would be valuable
Laboratory mice express daily torpor in response to fasting and dietary caloric restriction [5 9 16] Addition-ally obvious strain- and individual-related variations in torpor expression have been observed [1 22] Further-more mice can regulate the depth of a torpid bout based on the level of dietary or caloric supplementation [16 26] This suggests that mice have a sensitive reaction to changes in energetic conditions this area of research usually focuses on integrated energy restriction events although dietary energy sources are multifactorial con-taining fats proteins and carbohydrates We examined whether a deficiency in specific energy sources (ie fat protein or carbohydrate) corresponds to the expression of daily torpor if so this might elucidate a novel func-tion of daily torpor andor a method for regulating torpor expression
Here we focused on deficiency in dietary protein in-take because protein is one of important nutrients in maintaining the energy balance of homeostasis and is a source of several enzymes Severe protein deficiency affects various endocrinological activities and in some cases leads to death from malnutrition [19] A deficien-
cy in dietary protein intake can be partially compen-sated for by the endogenous protein store (primarily in the liver) or muscular degradation [19] Recently Mitch-ell et al [16] reported that the C57BL6 strain of inbred male mice never expressed daily torpor following restric-tion of dietary protein intake (dietary protein-restricted levels 20 30 and 40 compared to control diet) but caloric-restricted groups (dietary caloric restriction levels 20 30 and 40 compared to control diet) expressed daily torpor (see also Materials and Methods) This result appears to indicate that caloric but not protein restriction is a principal trigger for the expression of daily torpor by starvation Although Mitchell et al [16] used male mice in their protein restriction experimenta-tion it is important for experimental zoology to know sexual difference under the similar conditions Even Sunagawa and takahashi showed recently that male mice can enter daily torpor in certain conditions [28] it has been generally believed that male rodents are less likely to enter daily torpor [23 29] mainly because of their high concentration of endogenous testosterone there-fore to determine the relationship between protein re-striction and the expression of daily torpor we need to consider the case in female mice In this study we sub-jected female laboratory mice to more severe restrictions in dietary protein intake than those of Mitchell et al [16] and determined the tb patterns especially with regard to the expression of daily torpor
Materials and Methods
Animals and housing conditionsFemales of the ICR strain of laboratory mice (n=18
9 weeks of age) were purchased from SLC Japan Bred Co Ltd (Shizuoka Japan) We selected this strain be-cause they express daily torpor in response to starvation and have a high body mass making it easier to implant a thermostat into the abdominal cavity [5 21] Mice were housed individually in plastic cages (W 225 times D 338 times H 140 mm CREA Japan Tokyo Japan) with wood shav-ings as bedding and allowed free access to a solid diet (Labo MR Stock Nosan Corporation Kanagawa Japan) and tap water until the experimental period (see below) the room environment was strictly controlled as follows room temperature throughout the experiment was main-tained at 24degc and the photoperiodic cycle was 12 h 12 h (light dark light turned on at 0800) All experi-mental procedures in this study were approved by the
PROTEIN NUTRITION AND TORPOR IN MICE 323
Animal Experiment Committee of the University of Miyazaki (Permission No 2005ndash053-10)
DietsThe compositions of our experimental diets are de-
scribed in Table 1 We prepared two types of powdered diet in accordance with AIN-93M a common purified diet for laboratory mice [19 21] The control diet (C diet) maintained the exact same composition as AIN-93M including 140 casein and 018 L-cystine as protein sources The protein-restricted diet (PR diet) partially replaced casein and L-cystine with cornstarch (carbohydrate) and included 35 casein and 0045 L-cystine the Pr diet had only a quarter of the protein amount relative to the c diet while maintaining the same caloric level as the c diet with respect to gross energy (GE) Mitchell et al [16] used four diets including 20 16 14 and 12 protein in each diet supplemented by increasing amounts of carbohydrate (see details in Mitchell et al [16]) The PR diet used in this study had a more severe level of dietary protein restriction (about 35 casein as a protein source) than those used in Mitchell et al [16] Each diet was mixed about once monthly in 10-kg batches and stored at 4degC until feeding
Core body temperature (Tb) measurementTo record core body temperature (Tb) and estimate the
expression of daily torpor we implanted a data logger (iButtons DS1922L Maxim Integrated CA USA) in the abdominal cavity of female mice under anesthesia (Sodium pentobarbital (54 mgkg) Somnopentyl Kyo-
ritsu Seiyaku Corporation Tokyo Japan) We allowed all mice at least 3 weeks of recovery under ad libitum feeding conditions and used their body mass as an indi-cator of recovery
Data loggers were coated with a thin layer of a paraf-finndashEvaflex mixture (EV220 Du PontndashMitsui Poly-chemical co Ltd tokyo japan) according to Masaki et al [15] to avoid damage by serous fluid These loggers were programmed to record temperature every 15 min at a 16-bit resolution (00625degC) which yielded 45 con-secutive days of data Logger weights were 356 plusmn 023 g This data logger is acceptable for implantation into the abdominal cavities of female mice weighing around 40 g (less than 10 of the body weight of female mice)
Experimental procedureWe transferred each mouse from its home cage to
another cage lined with steel wire mesh We supplied 100 gday of the C diet for 5 days to acclimate mice to a powdered diet then gradually reduced the diet supply by 10 g every 3 days When the diet supply reached 60 gday mice consumed all the supplied diet Hence we continued this supplementation for 5 more days but no loss of body weight was observed with this amount Therefore we determined the amount of the diet as 60 gday
At the end of this estimation trial we randomly as-signed all mice to either the control group (C group n=6) or the protein-restricted group (PR group n=6) We also established a food-restricted group (FR group n=6) which was used to determine the reaction of the expres-sion of daily torpor in the context of food restriction in the icr strain of mice the c and Pr groups were sup-plied 60 gday of the C and PR diet for 4 weeks respec-tively The FR group was supplied 80 of the amount of the C diet compared to the C group (48 gday) for 4 weeks We determined the expression of daily torpor in each mouse during this period Body weights were mea-sured every 2 days If weight loss reached 15 of the initial body weight we terminated the experiment for that mouse
Data handling and statistical analysisWe analyzed body weight data and Tb data throughout
the experimental period Changes in body weight from the start to the end of the experiment in each group were examined using the paired t-test comparisons of termi-nal body weight data among groups were estimated by
Table 1 Composition of the experimental diet
ingredientc diet Pr diet
gkg diet
cornstarch 465692 572042casein 140 35Dextrinized cornstarch 155 155Sucrose 100 100Soybean oil 40 40Fiber source (cellose) 50 50Mineral mix 35 35Vitamine mix 10 10L-cystine 18 045Choline bitartrate 25 25Tert-butylhydroquinone 0008 0008
We used two types of formula diet the control (C) diet was AIN-93M [19 21] and the protein-restricted (PR) diet re-placed 75 of the protein sources (casein and Lndashcystine) with carbohydrate (cornstarch) These diets were isocaloric
GA KAto ET AL324
the TukeyndashKramer HSD test We calculated three Tb parameters daily mean tb (Mean Tb) daily minimum tb (Min Tb) and daily maximum Tb (Max Tb) these tb parameters were also compared among groups using the TukeyndashKramer HSD test The expression of daily torpor was defined as Tblt31degC [5] and compared among all groups
Statistical analyses were performed using jMP 10 (JMP 10 Basic Analysis and Graphing SAS Institute 2012) A Plt005 was considered statistically significant and results were expressed as means plusmn SD
Results
Body weight and food consumptionFemale mice consumed most of the supplied diets (C
group 576 plusmn 036 g PR group 585 plusmn 018 g FR group 479 plusmn 008 g) Daily protein intake for each mouse was about 085 g for the C group 021 g for the PR group and 068 g for the FR group These results suggest that the c and Pr groups consumed the same amounts of calories but protein intake was reduced by 75 in the Pr group
Despite the initial body weights being approximately the same (4442 plusmn 168 g for the C group 4475 plusmn 151 g for the PR group and 4378 plusmn 217 g for the FR group) body weights after the experiment were 5000 plusmn 261 g for the C group 4377 plusmn 278 g for the PR group and 4042 plusmn 320 g for the FR group The C group had a significantly higher body weight than the PR and FR groups (Plt005) after the experimental period The C group gradually became heavier at 1125 relative to the initial body weight (Plt005) but the weights were 978 (P=029) and 923 (Plt005) for the PR and FR groups respectively (Fig 1)
Core Tb and torpor expressionFive of six mice in the FR group exhibited torpor
(Tblt31degC [5]) but no mice did in the C and PR groups (Table 2 Fig 2) Additionally we did not detect any significant differences in Tb parameters (Mean Tb Min tb and Max Tb) between the C and PR groups (P=09728 P=08956 and P=05478 respectively) The tb parameters for the FR group were significantly lower compared with those for the C and PR groups (Plt005) Female mice did not exhibit torpor under PR conditions but did under energy-deficient conditions
Daily tb patterns in both the C and PR groups were
similar but the FR group was very different in this re-gard specifically mice in the FR group had low Tb (be-low 35degC) starting on the day of food restriction and this ratio gradually increased throughout the experiment (Fig 2 Supplementary Figs S1ndashS3)
Discussion
We subjected female ICR mice to severe protein re-striction (75 lower daily protein intake compared to normal conditions PR group) however they did not exhibit any Tb reductions during the resting phase in contrast in the food-restricted group (20 lower daily food intake compared to the control group FR group) five of six mice sporadically or frequently expressed daily torpor (Fig 2 Supplementary Figs S1ndashS3) Ad-ditionally the tb parameters (Mean Min and Max Tb) and daily tb patterns indicated a similar pattern in the control (C group) and PR groups (Table 2 Fig 2 Supple-mentary Figs S1ndashS3) Most mice consumed all their food and none of the mice in the c group decreased in
Fig 1 Body weight changes in control (C) protein-restricted (PR) and food-restricted (FR) groups during the experi-ment Body weights changed in the C (increased) and FR (decreased) groups but the PR group maintained body weight over the experimental period Error bars indicate mean plusmn SD
Table 2 Summary of tb parameters in the C PR and FR groups
tb parameters c group Pr group FR group
Mean tb (degC) 3719 plusmn 027 3720 plusmn 023 3528 plusmn 079Max Tb (degC) 3866 plusmn 023 3869 plusmn 027 3837 plusmn 033Min tb (degC) 3576 plusmn 041 3571 plusmn 043 3245 plusmn 157no of torpid mice 06 06 56
Note Plt005 Tukey-Kramer HSD test
PROTEIN NUTRITION AND TORPOR IN MICE 325
body weight (Fig 1) indicating that the amounts of calories for the C and PR groups were sufficient and they did not express daily torpor (Table 2) Therefore the results indicate that mice may preserve thermal ho-meostasis when caloric intake is sufficient even if protein intake is insufficient
Dietary protein restriction clearly influenced body weight gain in female mice They did not gain any body weight throughout the experimental period (Fig 1) im-plying that the mice in the PR group may have had a zero energy balance Generally PR animals partially com-pensate by using several amino acids for protein homeo-stasis and enhancing the degradation of skeletal muscle and hepatic protein stores [8 10 12] However degrada-tion of internal proteins is an insufficient explanation of why female mice maintained their body weight for so long under PR feeding (4 weeks in this experiment) We suspect that female mice may uptake fecal protein which is called ldquocoprophagyrdquo and which plays nutritionally
significant roles in providing microbial proteins to ani-mals via feces coprophagy is closely related to the cecum in terms of protein nutrition [27] Ebino et al [2] demonstrated that laboratory mice also engage in co-prophagy and that feces were a rich source of proteins and other nutrients such as vitamins therefore it is possible that the mice we tested did not express daily torpor following restriction of protein in their diet be-cause they increased the frequency of coprophagy tor-por in the garden dormouse Eliomys quercinus which does not have a cecum was induced by protein defi-ciency even though energy requirements were amply satisfied [17] indicating that they may not ingest micro-bial proteins by coprophagy This would suggest that our results are not generally applicable to all mammalian species Therefore we need to consider species differ-ences including feeding phenology and morphological digestive capacities to estimate the relationship between a deficiency of a specific energy source and daily torpor
Fig 2 representative daily tb patterns in control (C) protein-restricted (PR) and food-restricted (FR) groups during the experiment C and PR mice had similar daily Tb patterns there were few measurements of tblt35degC in the C and PR groups but the FR group frequently had a tblt35degC during this experiment The vertical line shows the percentage of Tb in each day of experiment C PR and FR labels indicate ldquogroup namerdquo of the mice Supplemen-tary Figs S1ndashS3 show individual daily Tb pattern data
GA KAto ET AL326
Five of six mice in the FR group exhibited daily torpor (Table 2) Their daily torpor patterns were frequent or sporadic with significant variation among individuals Additionally the FR group frequently had low Tb (below 35degC) during the restricted feeding period but the C and PR groups did not (Fig 2 Supplementary Figs S1ndashS3) We initially focused on the expression of daily torpor (Tblt31degC) however female mice showed a gradual adjustment to a nutrition-restricted situation this low tb but not daily torpor appeared to be accompanied by a small reduction in metabolic rate and may have con-tributed to energy conservation as an alternative to daily torpor Interestingly the large Japanese field mouse (Apodemus speciosus) may be cognizant of the magni-tude of a food cache and change torpor patterns [3] Moreover mice can regulate the depth of a bout depend-ing on dietary restriction [26] Hence flexible expression of daily torpor and a minor reduction of tb may be re-lated to a psychological recognition of food quantity and body condition by the mouse itself Therefore more attention should be given to the influences of the feeding process and appetite on the expression of daily torpor and gradual changes in tb
in this study we determined that dietary protein re-striction failed to induce daily torpor in female labora-tory mice Although we did not identify a novel nutri-tional function for daily torpor our research on daily torpor has only just begun In our future research we aim to determine the influence of deficiencies in other nutrients and feeding systems on the induction of daily torpor
Acknowledgments
This work was supported by the Ministry of Educa-tion Culture Sports Science and Technology (MEXT) of japan
References
1 Dikic D Heldmaier G and Meyer CW 2008 Induced torpor in different strains of laboratory mice pp 223ndash230 In Hypometabolism in Animals Hibernation Torpor and Cryobiology (Lovegrove BG and McKechnie AE eds) University of KwaZulundashNatal Pietermaritzburg KwaZulundashnatal South Africa
2 Ebino KY 1993 Studies on coprophagy in experimental animals Jikken Dobutsu 42 1ndash9 [Medline]
3 Eto T Hayashi R Okubo Y Kashimura A Koshimoto
C Sakamoto SH and Morita T 2015 Magnitude of food overabundance affects expression of daily torpor Physiol Behav 139 519ndash523 [Medline] [CrossRef]
4 Geiser F 2004 Metabolic rate and body temperature reduc-tion during hibernation and daily torpor Annu Rev Physiol 66 239ndash274 [Medline] [CrossRef]
5 Hudson JW and Scott IM 1979 Daily torpor in the labo-ratory mouse Mus musculus var albino Physiol Zool 52 205ndash218 [CrossRef]
6 Heldmaier G Klingenspor M Werneyer M Lampi BJ Brooks SP and Storey KB 1999 Metabolic adjustments during daily torpor in the Djungarian hamster Am J Physi-ol 276 E896ndashE906 [Medline]
7 Heldmaier G Ortmann S and Elvert R 2004 Natural hy-pometabolism during hibernation and daily torpor in mam-mals Respir Physiol Neurobiol 141 317ndash329 [Medline] [CrossRef]
8 Kalhan SC Uppal SO Moorman JL Bennett C Gruca LL Parimi PS Dasarathy S Serre D and Han-son RW 2011 Metabolic and genomic response to dietary isocaloric protein restriction in the rat J Biol Chem 286 5266ndash5277 [Medline] [CrossRef]
9 Koizumi A Tsukada M Wada Y Masuda H and Wein-druch R 1992 Mitotic activity in mice is suppressed by energy restriction-induced torpor J Nutr 122 1446ndash1453 [Medline]
10 Laeger T Reed SD Henagan TM Fernandez DH Taghavi M Addington A Muumlnzberg H Martin RJ Hutson SM and Morrison cD 2014 Leucine acts in the brain to suppress food intake but does not function as a physiological signal of low dietary protein Am J Physiol Regul Integr Comp Physiol 307 r310ndashr320 [Medline] [CrossRef]
11 Maret W and Sandstead HH 2006 Zinc requirements and the risks and benefits of zinc supplementation J Trace Elem Med Biol 20 3ndash18 [Medline] [CrossRef]
12 Martens EA and Westerterp-Plantenga MS 2014 Protein diets body weight loss and weight maintenance Curr Opin Clin Nutr Metab Care 17 75ndash79 [Medline]
13 Martin B Ji S Maudsley S and Mattson MP 2010 ldquoControlrdquo laboratory rodents are metabolically morbid why it matters Proc Natl Acad Sci USA 107 6127ndash6133 [Medline] [CrossRef]
14 Martiacutenez-Vega R Garrido F Partearroyo T Cediel R Zeisel SH Martiacutenez-Aacutelvarez C Varela-Moreiras G Varela-Nieto I and Pajares MA 2015 Folic acid defi-ciency induces premature hearing loss through mechanisms involving cochlear oxidative stress and impairment of ho-mocysteine metabolism FASEB J 29 418ndash432 [Medline] [CrossRef]
15 Masaki M Koshimoto C Tsuchiya K Nishiwaki A and Morita T 2005 Body temperature profiles of the Korean field mouse Apodemus peninsulae during winter aggrega-tion Mammal Study 30 33ndash40 [CrossRef]
16 Mitchell SE Delville C Konstantopedos P Derous D Green CL Chen L Han JDJ Wang Y Promislow DEL Douglas A Lusseau D and Speakman JR 2015 The effects of graded levels of calorie restriction III Impact
PROTEIN NUTRITION AND TORPOR IN MICE 327
of short term calorie and protein restriction on mean daily body temperature and torpor use in the C57BL6 mouse On-cotarget 6 18314ndash18337 [Medline] [CrossRef]
17 Montoya R Ambid L and Agid R 1979 Torpor induced at any season by suppression of food proteins in a hiberna-tor the garden dormouse (Eliomys quercinus L) Comp Bio-chem Physiol A Mol Integr Physiol 62 371ndash376 [Cross-Ref]
18 Morhardt JE and Hudson JW 1966 Daily torpor induced in white-footed mice (Peromyscus spp) by starvation Na-ture 212 1046ndash1047 [Medline] [CrossRef]
19 National Research Council (US) 1995 Subcommittee on Laboratory Animal Nutrition Nutrient requirements of labo-ratory animals Fourth Revised Edition National Academies Press (US) Washington DC
20 overton jM 2010 Phenotyping small animals as models for the human metabolic syndrome thermoneutrality mat-ters Int J Obes 34(Suppl 2) S53ndashS58 [Medline] [Cross-Ref]
21 Reeves PG Nielsen FH and Fahey GC Jr 1993 AIN-93 purified diets for laboratory rodents final report of the American institute of nutrition ad hoc writing committee on the reformulation of the AIN-76A rodent diet J Nutr 123 1939ndash1951 [Medline]
22 Rikke BA Yerg JE 3rd Battaglia ME Nagy TR Al-lison DB and Johnson TE 2003 Strain variation in the response of body temperature to dietary restriction Mech Ageing Dev 124 663ndash678 [Medline] [CrossRef]
23 Ruby NF Nelson RJ Licht P and Zucker I 1993 Pro-lactin and testosterone inhibit torpor in Siberian hamsters Am J Physiol 264 R123ndashR128 [Medline]
24 Ruf T and Geiser F 2015 Daily torpor and hibernation in
birds and mammals Biol Rev Camb Philos Soc 90 891ndash926 [Medline] [CrossRef]
25 Schubert KA Boerema AS Vaanholt LM de Boer SF Strijkstra AM and Daan S 2010 Daily torpor in mice high foraging costs trigger energy-saving hypother-mia Biol Lett 6 132ndash135 [Medline] [CrossRef]
26 Sekijima T Induced daily torpor in house mice 2000 Intro-duction of daily torpor in laboratory mice pp 234ndash253 In Hibernation in Mammals (Kawamichi T Kondo N and Morita T eds) University of Tokyo Press Tokyo (In Japa-nese)
27 Shichijo H Takahashi T Kondo Y Sakamoto SH and Morita T 2013 Nutritional significance of coprophagy in the rat-like hamster Tscherskia triton Mammalia 77 329ndash333 [CrossRef]
28 Sunagawa GA and Takahashi M 2016 Hypometabolism during daily torpor in mice is dominated by reduction in the sensitivity of the thermoregulatory system Sci Rep 6 37011 [Medline] [CrossRef]
29 Swoap SJ and Gutilla MJ 2009 Cardiovascular changes during daily torpor in the laboratory mouse Am J Physiol Regul Integr Comp Physiol 297 R769ndashR774 [Medline] [CrossRef]
30 Turbill C Smith S Deimel C and Ruf T 2012 Daily torpor is associated with telomere length change over winter in Djungarian hamsters Biol Lett 8 304ndash307 [Medline] [CrossRef]
31 Victor M Adams RD and Collins GH 1989 The Wer-nickendashKorsakoff Syndrome (WKS) pp 61ndash110 In the WernickendashKorsakoff Syndrome and Related Neurologic Disorders Due to Alcoholism and Malnutrition 2nd ed FA Davis Philadelphia USA