Prospectus - Vroom, Inc.
226
Table of Contents Filed pursuant to Rule 424(b)(4) Registration No. 333-238482 21,250,000 Shares Vroom, Inc. Common Stock This is an initial public offering of shares of common stock of Vroom, Inc. We are offering 21,250,000 shares of our common stock. Prior to this offering, there has been no public market for our common stock. The initial public offering price of our common stock is $22.00 per share. The common stock will be listed on The Nasdaq Global Select Market under the symbol “VRM.” We will be treated as an “emerging growth company,” as defined in the Jumpstart Our Business Startups Act of 2012, for certain purposes until we complete this offering. As such, in this registration statement, we have taken advantage of certain reduced disclosure obligations that apply to emerging growth companies regarding selected financial data and executive compensation arrangements. See “Prospectus Summary—Implications of Being Treated As an Emerging Growth Company.” Investing in our common stock involves risks. See “ Risk Factors” beginning on page 17 to read about factors you should consider before buying shares of our common stock. Neither the Securities and Exchange Commission nor any other regulatory body has approved or disapproved of these securities or passed upon the accuracy or adequacy of this prospectus. Any representation to the contrary is a criminal offense. Per Share Total Initial public offering price $ 22.00 $ 467,500,000 Underwriting discount (1) $ 1.43 $ 30,387,500 Proceeds to us, before expenses $ 20.57 $ 437,112,500 (1) We have agreed to reimburse the underwriters for certain expenses in connection with this offering. See “Underwriting.” To the extent the underwriters sell more than 21,250,000 shares, the underwriters have an over-allotment option to purchase up to an additional 3,187,500 shares from us at the initial public offering price, less the underwriting discount. The underwriters expect to deliver the shares against payment in New York, New York on June 11, 2020. Goldman Sachs & Co. LLC BofA Securities Allen & Company LLC Wells Fargo Securities Stifel William Blair Baird JMP Securities Wedbush Securities Prospectus dated June 8, 2020.
-
Upload
khangminh22 -
Category
Documents
-
view
1 -
download
0
Transcript of Prospectus - Vroom, Inc.

Table of Contents
Filed pursuant to Rule 424(b)(4)Registration No. 333-238482
21,250,000 Shares
Vroom, Inc.
Common Stock
This is an initial public offering of shares of common stock of Vroom, Inc. We are offering 21,250,000 shares of our common stock.
Prior to this offering, there has been no public market for our common stock. The initial public offering price of our common stockis $22.00 per share. The common stock will be listed on The Nasdaq Global Select Market under the symbol “VRM.”
We will be treated as an “emerging growth company,” as defined in the Jumpstart Our Business Startups Act of 2012, for certainpurposes until we complete this offering. As such, in this registration statement, we have taken advantage of certain reduced disclosureobligations that apply to emerging growth companies regarding selected financial data and executive compensation arrangements. See“Prospectus Summary—Implications of Being Treated As an Emerging Growth Company.”
Investing in our common stock involves risks. See “Risk Factors” beginning on page 17 to read about factors you should considerbefore buying shares of our common stock.
Neither the Securities and Exchange Commission nor any other regulatory body has approved or disapproved of these
securities or passed upon the accuracy or adequacy of this prospectus. Any representation to the contrary is a criminaloffense.
Per Share Total Initial public offering price $ 22.00 $467,500,000 Underwriting discount(1) $ 1.43 $ 30,387,500 Proceeds to us, before expenses $ 20.57 $437,112,500 (1) We have agreed to reimburse the underwriters for certain expenses in connection with this offering. See “Underwriting.”
To the extent the underwriters sell more than 21,250,000 shares, the underwriters have an over-allotment option to purchase up toan additional 3,187,500 shares from us at the initial public offering price, less the underwriting discount.
The underwriters expect to deliver the shares against payment in New York, New York on June 11, 2020.
Goldman Sachs & Co. LLC
BofA Securities
Allen & Company LLC
Wells FargoSecurities
Stifel William Blair Baird JMP Securities Wedbush Securities
Prospectus dated June 8, 2020.

Table of Contents
OUR MISSION Help people find their drive

Table of Contents
Vroom a better way to buy and sell vehicles Vehicles available for sale Avg. monthly visitors 5,107 1.7x 2,963 947,014 2.3x 411,489 Q1 2019 Q1 2020 Q1 2019 Q1 2020 Note: For a description of how we define and calculate these metrics, please see “Management’s discussion and analysis of Financial condition and Results of Operations.” These figures do not necessarily correlate to revenue as some average monthly visitors do not generate revenue and vehicles available for sale have not yet generated revenue.

Table of Contents
ecommerce units sold Jan 2019 – Apr 2020 CAGR: 121% 998 937 1,252 ,1,174, 1,257 1,425 1,790 1,971 ,1,802 , 1,960 2,089 2,290 2,751 ,2,408 ,2,771, 2,880 Jan Feb Mar Apr May Jun Jul Aug Sep Oct Nov Dec Jan Feb Mar Apr 2019 2020 Note: For a description of how we define and calculate this metric, please see “Management’s discussion and Analysis of Financial condition and Results of Operations.” Massive market ripe for disruption $841b 40m 2019 Used Vehicle Sales Unit sold in 2019 0.9% ecommerce penetration 9% market share from top 100 dealers 50% peer to peer 41% Remaing Dealers 40m units Note: For a description of how we calculate these figures and detailed sources, please see “Prospectus Summary”, “Management’s Discussion and Analysis of Financial Condition and Results of Operation”, and “Business”.

Table of Contents
Ecommerce Personalized Intuitive Interface Nationwide Delivery vehicle operations Scalable Integrated Asset-light data science & experimentation Fine-tuned Supply Operating Leverage Drives Optimization scalable and flexible model Distributed Reconditioning & Nationwide Deliveries Current Vroom VRC Current Third-Party VRCs Deliveries per County in 2019 >250 150 – 250 100 – 150 50 – 100 1 – 50 Note: VRC Locations as of April 30, 2020.

Table of Contents
TABLE OF CONTENTS Page PROSPECTUS SUMMARY 1 THE OFFERING 13 RISK FACTORS 17 CAUTIONARY NOTE REGARDING FORWARD-LOOKING STATEMENTS 55 MARKET AND INDUSTRY DATA 56 USE OF PROCEEDS 57 CAPITALIZATION 58 DIVIDEND POLICY 59 DILUTION 60 SELECTED CONSOLIDATED FINANCIAL AND OTHER DATA 62 MANAGEMENT’S DISCUSSION AND ANALYSIS OF FINANCIAL CONDITION AND RESULTS OF OPERATIONS 64 BUSINESS 104 MANAGEMENT 128 EXECUTIVE COMPENSATION 134 CERTAIN RELATIONSHIPS AND RELATED PARTY TRANSACTIONS 147 PRINCIPAL STOCKHOLDERS 150 DESCRIPTION OF CAPITAL STOCK 152 SHARES ELIGIBLE FOR FUTURE SALE 159 MATERIAL U.S. FEDERAL INCOME TAX CONSEQUENCES TO NON-U.S. HOLDERS 162 UNDERWRITING 167 LEGAL MATTERS 174 EXPERTS 174 WHERE YOU CAN FIND MORE INFORMATION 174 INDEX TO CONSOLIDATED FINANCIAL STATEMENTS F-1
Through and including July 3, 2020 (the 25th day after the date of this prospectus), all dealers effecting transactions in these
securities, whether or not participating in this offering, may be required to deliver a prospectus. This is in addition to a dealer’sobligation to deliver a prospectus when acting as an underwriter and with respect to an unsold allotment or subscription.
We and the underwriters have not authorized anyone to provide any information or to make any representations other than thosecontained in this prospectus or in any related free writing prospectuses. We and the underwriters take no responsibility for, and can provideno assurance as to the reliability of, any other information that others may give you. This prospectus is an offer to sell only the shares offeredby this prospectus, and only under circumstances and in jurisdictions where it is lawful to do so. The information contained in this prospectusor in any applicable free writing prospectus is current only as of its date. Our business, financial condition, results of operations andprospects may have changed since that date.
For investors outside the United States: We have not, and the underwriters have not, done anything that would permit this offering orthe possession or distribution of this prospectus or any free writing prospectus in connection with this offering in any jurisdiction where actionfor that purpose is required, other than in the United States. Persons outside the United States who come into possession of this prospectusmust inform themselves about, and observe any restrictions relating to, the offering of the shares of common stock and the distribution of thisprospectus outside the United States. See “Underwriting.”
As used in this prospectus, unless the context otherwise requires, references to “we,” “us,” “our,” “our business,” the “company,”“Vroom” and similar references refer to Vroom, Inc. and, where appropriate, its consolidated subsidiaries.

Table of Contents
PROSPECTUS SUMMARY
This summary highlights selected information contained elsewhere in this prospectus. This summary does not contain all of theinformation that you should consider before deciding to invest in our common stock. You should read the entire prospectus carefully,including the ‘‘Risk Factors” and ‘‘Management’s Discussion and Analysis of Financial Condition and Results of Operations’’ sectionsand our consolidated financial statements and the related notes included elsewhere in this prospectus before making an investmentdecision.
Our Vision
Build the world’s premier platform to research, discover, buy and sell vehicles.
Our Company
Vroom is an innovative, end-to-end ecommerce platform that is transforming the used vehicle industry by offering a better way tobuy and a better way to sell used vehicles. We are deeply committed to creating an exceptional experience for our customers.
We are driving enduring change in the industry on a national scale. We take a vertically integrated, asset-light approach that isreinventing all phases of the vehicle buying and selling process, from discovery to delivery and everything in between. Our platformencompasses:
• Ecommerce: We offer an exceptional ecommerce experience for our customers. In contrast to legacy dealerships and thepeer-to-peer market, we provide consumers with a personalized and intuitive ecommerce interface to research and select fromthousands of fully reconditioned vehicles. Our platform is accessible at any time on any device and provides transparentpricing, real-time financing and nationwide contact-free delivery right to a buyer’s driveway. For consumers looking to sell ortrade in their vehicles, we provide attractive market-based pricing, real-time, guaranteed purchase offers and convenient,contact-free at-home vehicle pick-up.
• Vehicle Operations: Our scalable and vertically integrated operations underpin our business model. We strategically sourceinventory from auctions, consumers, rental car companies and dealers. We improve our ability to acquire high-demandvehicles through enhanced supply science across all our sourcing channels and we are expanding our national marketingefforts to drive consumer sourcing. In our reconditioning and logistics operations, we deploy an asset-light strategy thatoptimizes a combination of ownership and operation of assets by us with strategic third-party partnerships. This hybridapproach provides flexibility, agility and speed without taking on unnecessary risk and capital investment, and drives improvedunit economics and operating leverage.
• Data Science and Experimentation: Data science and experimentation are at the core of everything we do. We rely ondata science, machine learning and A/B and multivariate testing to continually drive optimization and operating leverage acrossour ecommerce and vehicle operations. We leverage data to increase the effectiveness of our national brand and performancemarketing, enhance the customer experience, analyze market dynamics at scale, calibrate our vehicle pricing and optimize ouroverall inventory sales velocity. On the operations side, data science and experimentation enables us to fine tune our supply,sourcing and logistics models and to streamline our reconditioning processes.
1

Table of Contents
The U.S. used automotive market is the largest consumer product category, generating approximately $841 billion from sales ofapproximately 40 million units in 2019.1 The industry is highly fragmented with over 42,000 dealers and millions of peer-to-peertransactions.2 It also is ripe for disruption as an industry that is notorious for consumer dissatisfaction and has one of the lowest levels ofecommerce penetration at only 0.9%.3 Industry reports estimate that ecommerce penetration will grow to as much as half of all usedvehicle sales by 2030. Our platform, coupled with our national presence and brand, provides a significant competitive advantage versuslocal dealerships and regional players that lack nationwide reach and scalable technology, operations and logistics. The traditional autodealers and peer-to-peer market do not and cannot offer consumers what we offer.
In December 2015, we acquired Houston-based Texas Direct Auto® (“TDA”), which included our proprietary vehiclereconditioning center (“Vroom VRC”), our sole physical retail location and our Sell Us Your Car® centers. From the launch of ourcombined operations in January 2016, our business has grown significantly as we have scaled our operations, developed ourecommerce platform and leveraged the network effects inherent in our model. Our ecommerce revenue grew at a 77.0% compoundannual growth rate (“CAGR”) from 2016 to 2019, including year-over-year growth of 95.3% from 2018 to 2019.
Ecommerce Revenue
For the year ended December 31, 2019, we generated $1.2 billion in total revenue, representing a 39.3% increase over $855.4million for the year ended December 31, 2018. For the three months ended March 31, 2020, we generated $375.8 million in totalrevenue, representing a 59.9% increase over $235.1 million for the three months ended March 31, 2019. Our business generated a netloss of $85.2 million, $143.0 million, $27.1 million and $41.1 million for the years ended December 31, 2018 and 2019 and for the threemonths ended March 31, 2019 and 2020, respectively. We intend to continue to invest in growth to scale our company responsibly anddrive towards profitability.
Our Industry and Market Opportunity
The U.S. used automotive industry is a massive market that is ripe for disruption due to its fragmentation, high level of consumerdissatisfaction, changing consumer buying patterns and lack of ecommerce and technology penetration.
• The U.S. Used Automotive Market is Massive. The U.S. used automotive market is the largest consumer product category,generating approximately $841 billion from sales of approximately 40 million units in 2019.
1 Used automotive industry market size is calculated from 2019 total units sold and 2019 average selling price according to Edmunds, Used Vehicle Report 2019,
April 2020 (“Edmunds 2019 Report”).2 Borrell Associates, 2020 Automotive Advertising Outlook, March 2020 (“Borrell Automotive Outlook”).3 Ecommerce penetration calculated from 2018 total units sold according to Edmunds, Used Vehicle Outlook 2019, March 2019 (“Edmunds 2019 Outlook”) and 2018
total ecommerce units sold according to Digital Commerce 360, 2019 Automotive Ecommerce Report, November 2019 (“Digital Commerce 360 Report”).
2

Table of Contents
Industry Market Size4
• The U.S. Used Automotive Market is Highly Fragmented. There are over 42,000 automotive dealers and millions of
peer-to-peer transactions across the country. Across all used vehicle sales in 2018, the largest U.S. used vehicle dealer had amarket-share of only 1.8%, with the top 100 used vehicle dealers collectively representing a market share of only 8.6%.5
• The Primary Competitors in the U.S. Used Automotive Market Rely on an Outdated Business Model. The traditionaldealership model involves limited selection, lack of transparency, high pressure sales tactics and inconvenient hours. Thepeer-to-peer market comes with its own set of challenges, entailing home visits by strangers, lack of secure payment methodsor identity checks, difficulty researching available vehicles and lack of verified vehicle condition. Presented with thesealternatives, the overwhelming majority of consumers are dissatisfied with the current automotive buying and sellingexperience. According to a 2019 Gallup survey, vehicle salespersons consistently rank as one of the least trusted professions,with only 9% of respondents reporting trust in that profession.6 Furthermore, in another survey, 81% of respondents reporteddissatisfaction in the car buying process.7
• Ecommerce Penetration in the U.S. Used Automotive Market is Just Beginning. The used automotive market has oneof the lowest ecommerce penetration levels, representing only a 0.9% share of all used automotive sales in 2018. Industryreports estimate that ecommerce penetration will grow to as much as half of all used vehicle sales by 2030, representingsignificant upside as compared to the ecommerce penetration of other consumer product categories. Furthermore, while it istoo soon to measure the long-term impact of the COVID-19 pandemic on consumer behavior, in a survey conducted after theonset of the COVID-19 pandemic, 61% of respondents were open to buying a vehicle online as compared to 32% prior to theCOVID-19 pandemic.8
4 See footnote 1 for used automotive industry market size calculation. Market size of remaining industries according to U.S. Census Monthly Retail Sales, 2019. New
auto market calculated from 2019 total units sold and average selling price according to Edmunds, Automotive Industry Trends, Jan. 2020.5 Market share calculated from 2018 units sold by largest and top 100 used vehicle retailers, respectively, according to Automotive News, April 2019 (“Automotive
News 2019”) and 2018 total units sold according to Edmunds 2019 Outlook.6 Gallup, Americans’ Ratings of the Honesty and Ethical Standards of Professions, 2019.7 Dealersocket Independent Dealership Action Report, 2016.8 CarGurus, U.S. COVID-19 Sentiment Study, April 2020.
3

Table of Contents
Ecommerce Penetration9
• Consumers Increasingly Desire Convenience and Customization through Ecommerce. The U.S. retail used automotive
market is experiencing shifting consumer buying patterns from in-store towards online purchases. In particular, mobilecommerce is poised for even faster growth than broader ecommerce.
• Used is the new “New.” Consumers are becoming increasingly willing to buy used goods. In 2019, 64% of vehicle shoppersconsidered buying a used vehicle before making a purchase decision, up from 61% in 2018.10 At the same time, the averageprice differential between new and three-year-old used vehicles grew from $11,000 in 2015 to nearly $14,000 per vehicle in2018.11 As a result, owning or leasing a new vehicle has become increasingly unaffordable.
• The U.S. Used Automotive Market is Growing and Resilient. American consumers continue to exhibit entrenched vehicleownership trends with approximately 284 million registered vehicles on the road in 2019, as compared to 279 million in 2018.12Further, approximately 91.5% of families in the United States had at least one vehicle in 2018.13 In addition to increasingconsumer demand, the used vehicle industry has shown resilience through recessionary markets and other challengingeconomic cycles. While the average new vehicle gross profit margin fell from 6.9% in 2007 to 6.7% in 2009, used vehicle grossprofit margins (including wholesale and retail) increased from 8.9% in 2007 to 9.4% in 2009.14 While it is too soon to know howthe used vehicle industry will perform once the COVID-19 pandemic has subsided, we believe the industry will continue toshow resilience and that our model is well suited to fulfill consumer demand for ecommerce vehicle transactions andconvenient, contact-free delivery.
In light of the fragmentation, consumer dissatisfaction and lack of ecommerce penetration of the used vehicle industry, there isroom for multiple participants to disrupt the traditional dealership model and peer-to-peer market by offering ecommerce solutions thatleverage technology and data analytics to achieve superior operational efficiency and exceptional customer experience.
9 See footnote 3 for used automotive ecommerce penetration. Ecommerce penetration for 2019 total retail units sold according to Digital Commerce 360 Report as of
February 2020.10 Cox Automotive, Car Buyer Journey 2019, June 2019 (“Cox 2019 Report”).11 Edmunds 2019 Outlook.12 Hedges and Company.13 U.S. Census Selected Housing Characteristics.14 Publicly available filings. Change in gross margin calculated based on selected auto dealer public company comparables’ change in average gross margin from
fiscal year 2007 to fiscal year 2009. Used vehicle metrics include wholesale and retail used vehicle sales.
4

Table of Contents
What We Do: Offer a Better Way
We are driving a better way to buy and a better way to sell used vehicles and bringing about enduring change in the industry. Ourplatform brings together all phases of the vehicle buying and selling process in a seamless, intuitive and convenient way. We create aclimate of trust and provide an exceptional experience with complete transparency by eliminating friction and sales pressure. Thetraditional auto dealers and peer-to-peer market do not and cannot offer consumers what we offer. We offer a better way.
A Better Way to Buy
For consumers looking to buy a used vehicle, we offer a value proposition that differs markedly from traditional auto dealers andthe peer-to-peer market. We are dedicated to helping customers evolve from wary shoppers to confident owners by streamlining theentire buying process, from discovery through financing to delivery, by offering the following:
• Enormous inventory selection
• High-quality, Vroom-reconditioned vehicles
• Comprehensive and transparent vehicle information
• Customized vehicle search and discovery
• Competitive, market-based pricing
• Exceptional customer support
• On-demand shopping and convenient, contact-free delivery
• Value-added products
• Vroom 7-Day Return Policy
A Better Way to Sell
We are revolutionizing the process for consumers to sell or trade-in their vehicles. Consumers typically encounter either low-ballprices from their local dealer or face the prospect of advertising and selling the vehicle themselves in a time-consuming process throughthe peer-to-peer market. In contrast, we offer consumers the following:
• Easy online process for submitting basic vehicle information
• On-demand appraisals
• A guaranteed, real-time price on every vehicle
• No high-pressure sales tactics
• Convenient, contact-free at-home vehicle pick-ups
• Hassle-free loan pay-offs
5

Table of Contents
Our Competitive Strengths • A Leading Ecommerce Platform for Used Vehicles. We offer an end-to-end, ecommerce platform to research, discover,
buy, sell, transport, recondition, price, finance, register and deliver vehicles nationwide.
• Asset-Light, Scalable Operations. Our focus on ecommerce allows us to grow without the need for capital investment inphysical retail locations. We employ a hybrid approach across our business combining ownership and operation of assets byus, with strategic third-party partnerships. Our strategy provides flexibility, agility and speed as we scale our business, withouttaking on the unnecessary risk and capital investment inherent in direct investment.
• Relentless Focus on Data Science. Data science is at the core of everything we do. Our proprietary technology, machinelearning and data analytics models continuously optimize our marketing investments and conversion funnel, fine-tune oursupply, sourcing and logistics models, calibrate our vehicle pricing, streamline our reconditioning processes and optimize ouroverall inventory sales velocity.
• Continuous Experimentation and Innovation at Scale. We strive to make key decisions based on data and testing. We
continuously experiment using A/B and multivariate testing methodologies to drive conversion, innovation and improved uniteconomics.
• National Market Penetration and Brand. Our national presence provides a significant competitive advantage versus local
dealerships and regional players that lack scalable technology, operations and logistics and are unable to take advantage ofthe efficiencies and lower costs of national brand advertising.
• Difficult to Replicate Business Model. Our platform overcomes the unique operational and technological challenges
associated with buying and selling used vehicles in an ecommerce channel. Any new entrant would require data-drivenautomotive expertise, ecommerce capabilities and scalable operations integrated in a single platform.
• Seasoned Leadership Team and an Exceptional Culture. Our leadership team is comprised of seasoned executives with
a demonstrated track record of scaling businesses and achieving profitable growth, while preserving a unique culture thatprioritizes commitment to our values.
Our Growth Strategies and Path to Profitability
The core elements of our platform—ecommerce, vehicle operations, and data science and experimentation—serve as thefoundation of our growth strategies and path to profitability.
Drive Growth
Our business has grown significantly as we have scaled our operations. Our growth is not attributable to a single innovation orbreakthrough, but to coalescence around multiple strategies that serve as points on our flywheel. The diversity and number of vehiclesin our inventory drive demand and support expanded national marketing to enable us to acquire new customers more cost effectively,allowing us to invest back into our platform to continue to improve the customer experience, all of which drives increased conversion.This flywheel revolves, builds momentum and ultimately propels our business forward as we seek to drive disciplined growth andoperating leverage.
6

Table of Contents
Growth Flywheel
• Grow and Optimize Vehicle Inventory. We use data analytics to inform our pricing and inventory selection, which enablesus to curate an optimal inventory that matches demand signals, driving higher conversion and sales. As we grow, we willcontinuously refine our inventory mix and expand our offerings across vehicle price points to serve a greater range ofcustomers and increase our demand and conversion opportunities.
• Expand Marketing and Maximize ROI. The strength of our brand and effectiveness of our advertising programs is critical toour ability to attract new customers cost effectively. Leveraging our advanced data analytics, we will continue to invest innational marketing campaigns and targeted performance marketing to identify, attract and convert new customers at lowercost. We also run sophisticated digital marketing across various vehicle listing sites, constantly monitoring performance andmaximizing ROI with limited reliance on any one platform. Additionally, to date we have used search aggregators and socialmedia platforms for advertising on a very limited basis, and we continuously seek new cost-efficient marketing opportunitiesand channels.
• Deliver Exceptional Customer Experience. We believe that customer experience is fundamental to the growth of ourbusiness. We will continue to invest in our platform to further streamline the transaction process for our customers. We will alsocontinue to invest in the development of our mobile experiences, including iOS and Android mobile applications, to strengthencustomer engagement. We believe these investments will lead to greater consumer traffic to our platform, higher levels ofcustomer satisfaction and increased conversion and sales.
• Increase Conversion. Sales conversion drives revenue growth and is an output of the acceleration of every point on thegrowth flywheel. We will continue to invest in our technology framework to optimize all aspects of our conversion funnel byconstantly A/B testing our web and mobile applications to ensure we are displaying the features and formats that are mostlikely to resonate with our customers and lead to increased sales.
7
Table of Contents
Drive Profitability
Our business model benefits from network effects and significant operating leverage as it scales. We believe that improvementsin our unit economics are the foundation to driving profitability and will be achieved by scaling and optimizing the following elements ofour platform:
• Optimize Vehicle Acquisition and Pricing. We strategically source inventory from auctions, consumers, rental carcompanies and dealers. We improve our ability to acquire the right vehicle at the right price through enhanced supply scienceacross all our sourcing channels and we are expanding our national marketing efforts to drive consumer sourcing. We alsointend to pursue third party inventory listings that will expand our sourcing channels through third party sellers while offering usattractive revenue models in an asset light, debt free structure.
• Increase Reconditioning Capacity. As we scale our business, we intend to invest in increased reconditioning capacity,employing our hybrid approach that combines the use of Vroom VRCs with geographically dispersed third-party VRCs to bestmeet our reconditioning needs. We are expanding our reconditioning capacity through third-party VRC locations and goingforward we expect to invest in additional proprietary reconditioning capacity to provide added scale with reduced lead-time andgreater flexibility.
• Expand Value-Added Products. Every vehicle sale creates potential for multiple additional revenue streams, including feesearned on third-party vehicle financing for customers and fees from the sale of other value-added products. We believe thereare substantial opportunities to increase attachment rates on existing value-added products through training, merchandisingand technology enhancements. We also see a significant opportunity to provide our customers with additional value-addedproducts, such as auto insurance, and complementary services such as entertainment and location based services.
• Strategically Develop Logistics Network. We primarily use third-party carriers for our inbound and outbound vehicletransport, and are in the process of developing strategic carrier arrangements with national haulers in order to optimize ourlogistics network. As part of our hybrid approach, we also intend to continually evaluate and strategically expand ourproprietary logistics operations and expect our enhanced logistics operations will drive lower inbound and outboundtransportation costs.
8

Table of Contents
Capitalize on New Product and Market Opportunities
• Expand our Platform to Additional Products and Markets. We have the potential to leverage our platform for expansion
into additional areas of technology-enabled commerce, such as adjacent transportation and vehicle markets, global geographicmarkets and B-to-B business models.
• Continue to Innovate on New Capabilities. We believe we are well-positioned to expand our capabilities to participateactively as the industry evolves, including in such areas as electrification and shared mobility.
Growth in Unit Sales and Unit Economic Progression
In 2019, following the successful completion of two test programs that indicated a strong potential for organic, national expansion,we made the strategic decision to begin to aggressively scale our business and accelerate our growth. We began national marketing inFebruary 2019 and simultaneously began to increase our inventory purchasing across multiple dispersed markets, we expanded shiftsand overtime at our Vroom VRC to more rapidly recondition units and we paid a premium to ship units more quickly nationwide. As aresult, we nearly doubled our inventory, doubled our reconditioning capacity and more than doubled our monthly sales in 2019.
The significant growth in consumer demand in 2019 exceeded the scale of our vehicle acquisition, logistics and reconditioninginfrastructure during that period. By consciously prioritizing growth during the first half of 2019, we put downward pressure on uniteconomics for the short term, which also coincided with a stronger cycle of price depreciation in the second half of 2019 as compared tothe prior year. This resulted in ecommerce GPPU declining from $1,806 and $1,892 in the first and second quarters of 2019,respectively, to $1,577 and $1,626 in third and fourth quarters of 2019, respectively.
In order to improve our unit economics, we used data to inform and optimize our operations across acquisitions, reconditioningand logistics. We also reexamined our reconditioning standards and defect disclosures, and we adopted refinements that enabled us toreduce costs without reducing customer satisfaction. In addition to the initiatives designed to improve our gross profit per ecommerceunit, we also entered into new arrangements with our third-party carriers that resulted in reduced outbound shipping costs, therebyreducing our selling, general and administrative expenses.
Impact of COVID-19
In March 2020, the World Health Organization declared a global pandemic related to the rapidly growing outbreak of a novelstrain of coronavirus known as COVID-19. The COVID-19 pandemic has impacted us in a number of ways, including an adverse impacton our ecommerce operations. We began to see this impact on our ecommerce operations during the last three weeks of our fiscalquarter ended March 31, 2020. Between March 11, 2020 and March 31, 2020, we experienced an approximate 15% decrease in totalecommerce revenue due to a decrease in consumer demand as compared to the 20 days prior to March 11, 2020. Commencing in lateMarch, we reduced vehicle prices in order to drive vehicle sales and quickly reduce the amount of inventory that was purchasedpre-COVID-19 and we paused all vehicle acquisitions other than trade-ins. As a result, we significantly reduced our total inventory levelsas well as our inventory floorplan utilization. Due to the inventory price reductions that began in late March, our demand returned topre-COVID-19 levels, and we experienced robust ecommerce vehicle sales; however, those sales were at a greatly reduced gross profitper unit. On April 20, 2020, we began to acquire new inventory from both auctions and consumers, with a primary focus on high-demandmodels that we believe will convert at target margins. We intend to strategically
9

Table of Contents
build our inventory levels in the near term to return to and ultimately exceed pre-COVID-19 levels.
In response to the COVID-19 disruptions, in addition to managing our inventory exposure, we have implemented a number ofmeasures to protect the health and safety of our workforce, proactively reduce operating costs, conserve liquidity and position Vroom toemerge from the current crisis in a healthy financial position. These measures include restrictions on non-essential business travel, theinstitution of work-from-home policies wherever feasible and the implementation of strategies for workplace safety at our facilities thatremain open. In addition, effective May 3, 2020, approximately one-third of our workforce was placed on furlough. However, since werestarted vehicle acquisitions and increased our Vroom VRC operations, as of May 31, 2020, approximately 60% of furloughedemployees have returned to work, primarily those employed in reconditioning, logistics and acquisitions positions. We have alsoinstituted an across-the-board salary reduction for our non-furloughed salaried employees. We also have taken measures to reduceoperating expenses by negotiating reductions and deferrals in payments to landlords, vehicle listing sites, service providers andcommercial vendors, as well as significantly reducing planned marketing expenditures by approximately $3.5 million through the end ofMay. Additionally, we adjusted our delivery protocols to provide contact-free delivery and pickup of vehicles.
As of April 30, 2020, we had $156.4 million in cash and cash equivalents and $280.8 million was available under our 2020 VehicleFloorplan Facility. See the section titled “Management’s Discussion and Analysis of Financial Condition and Results of Operations—Impact of COVID-19” for additional information regarding how COVID-19 has impacted our operations.
Risks Associated with Our Business
There are a number of risks that you should understand before making an investment decision regarding this offering. These risksare discussed more fully in the section entitled “Risk Factors” following this prospectus summary. If any of these risks actually occur, ourbusiness, financial condition and results of operations could be materially and adversely affected. In such case, the trading price of ourcommon stock would likely decline, and you may lose all or part of your investment. These risks include, but are not limited to:
• the impact of the novel coronavirus (COVID-19) pandemic;
• we have a history of losses and we may not achieve or maintain profitability in the future;
• as a result of the impact of the COVID-19 pandemic, in combination with our history of losses and negative cash flows from
operations and that we have not yet obtained additional capital in connection with this offering, our consolidated financialstatements contain a statement regarding a substantial doubt about our ability to continue as a going concern;
• we may not be able to generate sufficient revenue to generate positive cash flow on a sustained basis, and our revenue growthrate may decline;
• we have a limited operating history and are still building out our foundational systems;
• our recent, rapid growth may not be indicative of our future growth and, if we continue to grow rapidly, we may not be able tomanage our growth effectively;
• our business is subject to certain risks related to the operation of, and concentration of our revenues and gross profit fromTDA;
• we have entered into outsourcing arrangements with a third party related to our customer experience team, and any difficultiesexperienced in these arrangements could result in an interruption of our ability to sell our vehicles and value-added products;
10

Table of Contents
• we face a variety of risks associated with the operation of our VRCs by us and our third-party service providers, any of whichcould materially and adversely affect our business, financial condition and results of operations;
• we rely on third-party carriers to transport our vehicle inventory throughout the United States. Thus, we are subject to businessrisks and costs associated with such carriers and with the transportation industry, many of which are out of our control;
• the current geographic concentration where we provide reconditioning services and store inventory creates an exposure to
local and regional downturns or severe weather or catastrophic occurrences that may materially and adversely affect ourbusiness, financial condition and results of operations; and
• if we sustain cyber-attacks or other privacy or data security incidents that result in security breaches, we could suffer a loss ofsales and increased costs, exposure to significant liability, reputational harm and other negative consequences.
Before you invest in our common stock, you should carefully consider all the information in this prospectus, including matters setforth under the heading “Risk Factors.”
Implications of Being Treated As an Emerging Growth Company
We ceased to be an emerging growth company as of December 31, 2019, due to generating more than $1.07 billion in annualrevenue for the year ended December 31, 2019. However, because we ceased to be an emerging growth company after weconfidentially submitted our registration statement related to this offering to the SEC, we will be treated as an “emerging growthcompany,” as defined in the Jumpstart Our Business Startups Act of 2012 (the “JOBS Act”), for certain purposes until the earlier of thedate we complete this offering and December 31, 2020. As such, we are permitted to rely on exemptions from certain disclosure andother requirements that are applicable to other public companies that are not emerging growth companies. In particular, in thisprospectus, we have taken advantage of certain reduced disclosure obligations regarding the provision of selected financial data andexecutive compensation arrangements. We have also taken advantage of the extended transition period for complying with new orrevised accounting standards available to emerging growth companies. Accordingly, the information contained in this prospectus may bedifferent from the information you might receive from other public companies. For additional information and certain risks related to ourtreatment as an emerging growth company, see “Management’s Discussion and Analysis of Financial Condition and Results ofOperations—JOBS Act” and “Risk Factors—Risks Related to this Offering and Ownership of Our Common Stock—Although we ceasedto be an ‘emerging growth company,’ we can continue to take advantage of certain reduced disclosure requirements in this registrationstatement, which may make our common stock less attractive to investors.”
Corporate Information
We were incorporated in Delaware in 2012. Our principal executive offices are located at 1375 Broadway, 11th Floor, New York,New York 10018. Our telephone number is (631) 760-1215 and our website address is www.vroom.com. The information contained on,or that can be accessed through, our website is deemed not to be incorporated in this prospectus or to be part of this prospectus. Youshould not consider information contained on our website to be part of this prospectus in deciding whether to purchase shares of ourcommon stock.
This prospectus includes our trademarks and trade names, including but not limited to Vroom®, Vroom Get In™, TDA®,DealerLane®, Texas Direct® and Sell Us Your Car®, which are protected under
11

Table of Contents
applicable intellectual property laws and are our property. This prospectus also contains trademarks, trade names and service marks ofother companies, which are the property of their respective owners. Solely for convenience, trademarks, trade names and service marksreferred to in this prospectus may appear without the ®, ™ or SM symbols, but such references are not intended to indicate, in any way,that we will not assert, to the fullest extent permitted under applicable law, our rights or the right of the applicable licensor to thesetrademarks, trade names and service marks. We do not intend our use or display of other parties’ trademarks, trade names or servicemarks to imply, and such use or display should not be construed to imply, a relationship with, or endorsement or sponsorship of us by,these other parties.
12

Table of Contents
THE OFFERING Common stock offered by us 21,250,000 sharesUnderwriters’ over-allotment option to purchase additional shares of
common stock
The underwriters have a 30-day over-allotment option topurchase up to 3,187,500 additional shares of common stockfrom us as described under the heading “Underwriting.”
Common stock to be outstanding after thisoffering
115,237,090 shares (or 118,424,590 shares, if the underwritersexercise their over-allotment option in full).
Use of proceeds
We estimate that the net proceeds from the sale of shares of ourcommon stock in this offering will be approximately $431.5million (or approximately $497.2 million if the underwritersexercise their over-allotment option in full) after deducting theunderwriting discount and estimated offering expenses payableby us.
We intend to use the net proceeds from this offering for generalcorporate purposes, including advertising and marketing,technology development, working capital, operating expensesand capital expenditures. We may also use a portion of the netproceeds to acquire or invest in businesses, products, servicesor technologies; however, we do not have agreements orcommitments for any material acquisitions or investments at thistime. See the section titled “Use of Proceeds” for additionalinformation.
Dividend policy
We do not expect to pay any dividends on our common stock forthe foreseeable future. See “Dividend Policy.”
Listing
We have been approved to list our common stock on the TheNasdaq Global Select Market (“Nasdaq”) under the symbol“VRM.”
Risk factors
Investing in our common stock involves a high degree of risk.See “Risk Factors” and the other information included in thisprospectus for a discussion of factors you should carefullyconsider before investing in our common stock.
The number of shares of our common stock to be outstanding after this offering includes the number of shares of common stockoutstanding as of March 31, 2020, after giving effect to the assumed automatic conversion, as adjusted for the Forward Stock Split (asdefined below), of all
13

Table of Contents
outstanding shares of our preferred stock into 85,533,394 shares of common stock upon the closing of this offering (the “AutomaticConversion”). This number excludes:
• 3,019,108 shares of common stock reserved for future grant or issuance under our 2020 Incentive Award Plan (the “2020
Plan”), which shares will automatically increase each year, as more fully described in “Executive Compensation—EmployeeBenefit Plans”;
• the exercise of warrants to purchase 161,136 shares of common stock, which will result in the net issuance of 155,862 sharesof common stock in connection with this offering;
• 589,970 shares of common stock issuable upon the exercise of warrants outstanding as of March 31, 2020 with an exerciseprice of $8.53 per share;
• 6,198,676 shares of common stock issuable upon exercise of stock options outstanding as of March 31, 2020, having aweighted-average exercise price of $4.37 per share;
• 978,060 shares of common stock issuable upon settlement of restricted stock units outstanding as of March 31, 2020 having aweighted average grant date fair value of $7.80 per share;
• 1,463,346 shares of our common stock subject to restricted stock units granted after March 31, 2020;
• 3,249,382 shares of common stock issuable upon settlement of restricted stock awards outstanding as of March 31, 2020; and
• the issuance of 183,870 shares of common stock in connection with the entrance into the RA Agreement (as defined in“Business—Our Marketing”) occurring after March 31, 2020.
Unless otherwise indicated, all information contained in this prospectus assumes:
• the Automatic Conversion;
• a 2-for-1 forward common stock split to be effected prior to the closing of this offering (the “Forward Stock Split”);
• no exercise, settlement or termination of outstanding stock options, warrants or restricted stock units after March 31, 2020;
• the filing and effectiveness of our amended and restated certificate of incorporation and the adoption of our amended andrestated bylaws upon the closing of this offering;
• an initial public offering price of $22.00 per share of common stock; and
• no exercise of the underwriters’ option to purchase additional shares of our common stock from us in this offering to coverover-allotments.
14

Table of Contents
Summary Consolidated Financial and Other Data
The following tables summarize our consolidated financial and other data. We have derived our summary consolidated statements of operationsdata for the years ended December 31, 2018 and 2019 from our consolidated financial statements included elsewhere in this prospectus. The summaryconsolidated statements of operations data presented below for the three months ended March 31, 2020 and 2019 and the selected consolidatedbalance sheet data as of March 31, 2020 have been derived from our unaudited condensed consolidated financial statements included elsewhere inthis prospectus and have been prepared on a consistent basis as our audited consolidated financial statements. In the opinion of management, theunaudited data reflects all adjustments, consisting only of normal recurring adjustments, necessary for the fair statement of the financial information inthose statements. Our historical results are not necessarily indicative of the results that may be expected in the future. You should read the followingfinancial information together with the information under the sections titled “Capitalization,” “Selected Consolidated Financial and Other Data,”“Management’s Discussion and Analysis of Financial Condition and Results of Operations,” and our consolidated financial statements and related notesincluded elsewhere in this prospectus.
Year Ended
December 31, Three Months Ended
March 31, 2018 2019 2019 2020 (unaudited) (in thousands, except share and per share data) Total revenue $ 855,429 $ 1,191,821 $ 235,059 $ 375,772 Cost of sales 794,622 1,133,962 223,047 357,385
Total gross profit 60,807 57,859 12,012 18,387 Selling, general and administrative expenses 133,842 184,988 36,583 58,380 Depreciation and amortization 6,857 6,019 1,533 966
Loss from operations (79,892) (133,148) (26,104) (40,959) Interest expense 8,513 14,596 2,718 2,826 Interest income (3,135) (5,607) (1,849) (1,956) Other (income) expense, net (321) 673 63 (823)
Loss before provision for income taxes (84,949) (142,810) (27,036) (41,006) Provision for income taxes 229 168 103 53
Net loss $ (85,178) $ (142,978) $ (27,139) $ (41,059)
Accretion of redeemable convertible preferred stock (13,036) (132,750) (17,964) —
Net loss attributable to common stockholders $ (98,214) $ (275,728) $ (45,103) $ (41,059)
Net loss per share attributable to common stockholders, basic anddiluted(1) $ (23.00) $ (64.08) $ (10.51) $ (9.69)
Weighted-average number of shares outstanding used to computenet loss per share attributable to common stockholders, basicand diluted(1) 4,270,389 4,302,981 4,289,415 4,235,728
Pro forma net loss per share attributable to common stockholders,basic and diluted (unaudited)(1) $ (1.55) $ (0.44)
Pro forma weighted average shares used in computing pro formanet loss per share attributable to common stockholders, basic anddiluted (unaudited)(1) 92,174,590 94,004,850
15

Table of Contents
As of March 31, 2020
(unaudited)
Actual Pro Forma(2) Pro Forma As
Adjusted(3) (in thousands) Cash and cash equivalents $ 169,842 $ 169,842 $ 601,329 Total assets 547,083 547,083 978,570 Total liabilities 262,160 262,160 262,160 Total redeemable convertible preferred stock 901,046 — — Total stockholders’ (deficit) equity (616,123) 284,923 716,410 (1) See Note 17 to our consolidated financial statements included elsewhere in this prospectus for an explanation of the calculations of our net loss per share
attributable to common stockholders, basic and diluted, and unaudited pro forma net loss per share attributable to common stockholders, basic and diluted for theyear ended December 31, 2019 and for the three months ended March 31, 2020.
(2) The unaudited pro forma consolidated balance sheet data as of March 31, 2020 presents our consolidated balance sheet data to give effect to (i) the AutomaticConversion (ii) the Forward Stock Split and (iii) the filing and effectiveness of our amended and restated certificate of incorporation and the adoption of ouramended and restated bylaws upon the closing of this offering, in each case as if such event had occurred on March 31, 2020.
(3) The unaudited pro forma as adjusted consolidated balance sheet data reflects the items described in footnote (2) above and gives effect to our receipt of estimatednet proceeds from the sale of shares of common stock in this offering after deducting the underwriting discount and estimated offering expenses payable by us.
Year Ended
December 31, Three Months Ended
March 31, 2018 2019 2019 2020 Key Operating and Financial Metrics:(a) Ecommerce units sold 10,006 18,945 3,187 7,930
Vehicle Gross Profit per ecommerce unit $ 1,666 $ 1,109 $ 1,421 $ 845 Product Gross Profit per ecommerce unit 576 587 385 954
Total Gross Profit per ecommerce unit $ 2,242 $ 1,696 $ 1,806 $ 1,799
Average monthly unique visitors 291,772 653,216 411,489 947,014 Vehicles available for sale 3,421 4,956 2,963 5,107 Ecommerce average days to sale 59 68 64 68 (a) See “Management’s Discussion and Analysis of Financial Condition and Results of Operations—Key Operating and Financial Metrics” for information on how
we define these key operating and financial metrics.
16

Table of Contents
RISK FACTORS
This offering and an investment in our common stock involve a high degree of risk. You should carefully consider the risks describedbelow, together with the financial and other information contained in this prospectus, before you decide to purchase shares of our commonstock. If any of the following risks actually occurs, our business, financial condition and results of operations could be materially andadversely affected. As a result, the trading price of our common stock could decline and you could lose all or part of your investment in ourcommon stock.
Risks Related to Our Business
The novel coronavirus (COVID-19) pandemic has had and is expected to continue to have an adverse effect on our business,financial condition and results of operations.
In March 2020, the World Health Organization declared COVID-19 a global pandemic, and governmental authorities around the worldhave implemented measures to reduce the spread of COVID-19. These measures have adversely affected workforces, customers, supplychains, consumer sentiment, economies, and financial markets, and, along with decreased consumer spending, have led to an economicdownturn across many global economies.
The COVID-19 pandemic has rapidly escalated in the United States, creating significant uncertainty and economic disruption, andleading to record levels of unemployment nationally. Numerous state and local jurisdictions have imposed, and others in the future mayimpose, shelter-in-place orders, quarantines, shut-downs of non-essential businesses, and similar government orders and restrictions ontheir residents to control the spread of COVID-19. Such orders or restrictions have resulted in temporary facility closures (including certain ofour third-party VRCs), work stoppages, slowdowns and travel restrictions, among other effects, thereby adversely impacting our operations.In addition, we expect to be impacted by a downturn in the United States economy, which could have an adverse impact on discretionaryconsumer spending.
In response to the COVID-19 disruptions, we have implemented a number of measures designed to protect the health and safety ofour workforce, proactively reduce operating costs, conserve liquidity and position Vroom to emerge from the current crisis in a healthyfinancial position. These measures include restrictions on non-essential business travel, the institution of work-from-home policies whereverfeasible and the implementation of strategies for workplace safety at our facilities that remain open. We are following the guidance frompublic health officials and government agencies, including implementation of enhanced cleaning measures, social distancing guidelines andwearing of masks. In addition, effective May 3, 2020, approximately one-third of our workforce was placed on furlough. The majority ofemployees furloughed were in reconditioning, logistics, acquisitions and TDA sales, which were the positions most affected by the reductionin unit volume. However, since we restarted vehicle acquisitions and increased our Vroom VRC operations, as of May 31, 2020,approximately 60% of furloughed employees have returned to work, primarily those employed in reconditioning, logistics and acquisitionspositions. Additionally, we have instituted an across-the-board salary reduction for our non-furloughed salaried employees, with our CEOforgoing 30% of his salary, each member of our senior leadership team taking a 20% salary reduction, and the balance of the employeesexperiencing reductions of 5-15% based upon salary levels. We are also modifying our capital allocation plan for the remainder of 2020,including reducing our planned capital expenditures, strategically reducing exposure to inventory and floorplan liabilities and moderating ourmarketing expenditures. While our ecommerce platform continues to operate, we have experienced a decline in foot traffic in TDA in thesecond half of March as compared to the first half of March due to the COVID-19 disruptions, leading to lower TDA sales. We will continue toincur costs for our operations, and our revenues during this pandemic are difficult to predict with certainty. As a result of any of the abovedevelopments, our business, results of operations, cash flows or financial condition for the full fiscal year of 2020 have
17

Table of Contents
been and will be significantly affected by the COVID-19 disruptions and could continue to be adversely impacted in the future. There is noassurance the measures we have taken or may take in the future will be successful in managing the uncertainties caused by COVID-19.
The extent to which COVID-19 ultimately impacts our business, financial condition and results of operations will depend on futuredevelopments, which are highly uncertain and unpredictable, including new information which may emerge concerning the severity andduration of the COVID-19 outbreak and the effectiveness of actions taken to contain the COVID-19 outbreak or treat its impact, amongothers. Additionally, while the extent to which COVID-19 ultimately impacts the wholesale market will depend on a number of factors, thepotential impact of the influx of vehicles from rental car companies could cause downward pressure on the value of used vehicles, whichcould have an adverse impact on our ability to liquidate our inventory in a timely manner or at all. The COVID-19 outbreak is evolving andnew information emerges daily; accordingly, the ultimate consequences of the COVID-19 outbreak cannot be predicted with certainty.
In addition to the COVID-19 disruptions adversely impacting our business and financial results, they may also have the effect ofheightening many of the other risks described in “Risk Factors,” including risks relating to changes in consumer demand; our limitedoperating history; our ability to generate sufficient revenue to generate positive cash flow; the operation of, and concentration of our revenuesand gross profit from TDA; our relationships with third party customer experience teams; the operation of our VRCs by us and our third partyservice providers; the current geographic concentration of reconditioning services and store inventory; our level of indebtedness; ouragreement with a single lender to finance our vehicle inventory purchases and the expiration of such agreement; our access to desirablevehicle inventory; regulatory restrictions; and the shift by traditional dealers to online sales and deliveries.
We have a history of losses and we may not achieve or maintain profitability in the future.
We have not been profitable since our inception in 2012 and had an accumulated deficit of approximately $616.1 million as ofMarch 31, 2020. We incurred net losses of $143.0 million and $41.1 million for the year ended December 31, 2019 and the quarter endedMarch 31, 2020, respectively, as compared to $85.2 million and $27.1 million for the year ended December 31, 2018 and the quarter endedMarch 31, 2019, respectively. We may incur significant losses in the future for a number of reasons, including our inability to reduce costs,acquire and appropriately price vehicle inventory, attract customers or identify and respond to emerging trends in the used car industry;slowing demand for used vehicles and our related value-added products; weakness in the automotive retail industry generally; generaleconomic conditions; global pandemics; and increasing competition, as well as other risks described in this prospectus, and we mayencounter unforeseen expenses, difficulties, complications and delays in achieving profitability.
Additionally, we expect to continue to incur losses as we invest in and strive to grow our business. We expect our operating expensesto increase in the future as we increase our advertising and marketing efforts to build our brand, continue to invest in technologydevelopment and expand our operating infrastructure. In addition, as a public company, we will incur significant legal, accounting and otherexpenses that we did not incur as a private company. As a result of these increased expenditures, we will have to generate and sustainincreased revenue to offset our operating expenses and achieve and maintain profitability. In addition, if we reduce variable costs to respondto losses, this may limit our ability to acquire customers and grow our revenues. Our ecommerce gross profit per unit declined by $546, or24.4%, for the year ended December 31, 2019 compared to 2018, and by $7, or 0.4%, for the quarter ended March 31, 2020 compared tothe quarter ended March 31, 2019. To reduce our losses, we will need to increase our gross profit per unit by lowering our costs per unit by,among other things, increasing efficiencies in reconditioning and logistics, which we may be unable to do. Accordingly, we may not achieveor maintain profitability and we may continue to incur significant losses in the future.
18

Table of Contents
As a result of the impact of the COVID-19 pandemic, in combination with our history of losses and negative cash flows fromoperations and that we have not yet obtained additional capital in connection with this offering, our consolidated financialstatements contain a statement regarding a substantial doubt about our ability to continue as a going concern.
As a result of the factors described above under the risk factor titled “the novel coronavirus (COVID-19) pandemic has had and isexpected to continue to have an adverse effect on our business, financial condition and results of operations,” in combination with our historyof losses and negative cash flows from operations and that we have not yet obtained additional capital in connection with this offering, ourfinancial statements include a statement that there is a substantial doubt about our ability to continue as a going concern over the next twelvemonths and our independent registered public accounting firm has included an explanatory paragraph in their report on our consolidatedfinancial statements. Our ability to continue as a going concern is dependent upon us generating sufficient cash flow from operations andobtaining additional capital and financing, including the proceeds from this offering. If our ability to generate cash flow from operations isdelayed or reduced and we are unable to raise sufficient proceeds from this offering, we may be unable to continue in business.
We may not be able to generate sufficient revenue to generate positive cash flow on a sustained basis, and our revenue growthrate may decline.
We cannot assure you that we will generate sufficient revenue to offset the cost of maintaining our platform and maintaining andgrowing our business. Although our revenue grew from $855.4 million and $235.1 million for the year ended December 31, 2018 and thequarter ended March 31, 2019, respectively, to $1.2 billion and $375.8 million for the year ended December 31, 2019 and the quarter endedMarch 31, 2020, respectively, our revenue growth rate may decline in the future because of a variety of factors, including our inability toreduce costs, acquire and appropriately price vehicle inventory, attract customers or identify and respond to emerging trends in the used carindustry; slowing demand for used vehicles and our related value-added products; weakness in the automotive retail industry generally;general economic conditions; and increasing competition. We cannot assure you that our revenue will continue to grow or will not decline.You should not consider our historical revenue growth or operating expenses as indicative of our future performance. If our revenue growthrate declines or our operating expenses exceed our expectations, our business, financial condition and results of operations will be materiallyand adversely affected.
Further, going forward we expect to make significant investments to further develop and expand our business, and these investmentsmay not result in increased revenue or growth on a timely basis or at all. For example, we expect to continue to expend substantial financialand other resources on acquiring and retaining customers, development of our technology and data analytics capabilities, adding newfeatures and functionality to our website, mobile application development and expansion of our reconditioning and logistics network. Theseinvestments may not result in increased revenue or growth in our business. If we cannot successfully earn revenue at a rate that exceeds thecosts associated with our business, we will not be able to generate positive cash flow on a sustained basis and our revenue growth rate maydecline. Additionally, we base our expenses and investment plans on our estimates of revenue and gross profit. If our assumptions prove tobe wrong, we may spend more than we anticipate or may generate less revenue than anticipated. If we fail to continue to grow our revenue,our business, financial condition and results of operations could be materially and adversely affected.
We have a limited operating history and are still building out our foundational systems.
We commenced operations in 2012 and acquired TDA in 2015 and, as a result, have a limited operating history. Moreover, over thepast three years, we brought in a new senior leadership team
19

Table of Contents
that has refocused our strategy, accelerated our growth and committed us to pursue a path to profitability. To execute this strategy, we haveinvested, and continue to invest, in enhancing our foundational systems as we scale our business, including design and expansion of websitefunctionality and features, mobile application development, advancement and deployment of sophisticated data analytics, lean manufacturingtechnology and logistics network management, and work on all such foundational systems is ongoing. These types of activities subject us tovarious costs and risks, including increased capital expenditures, additional administration and operating expenses, potential disruption ofour internal control structure, acquisition and retention of sufficiently skilled personnel, demands on management time, the introduction oferrors or vulnerabilities and other risks and costs of delays or difficulties in transitioning to or integrating new systems into our foundationalsystems. There can be no assurance that we will succeed in successfully developing our capabilities in each of these areas, or that adesirable return on investment will be achieved on the investments made in these areas. A failure to successfully execute on thedevelopment of our foundational systems would adversely affect our business, financial condition and results of operations.
Our recent, rapid growth may not be indicative of our future growth and, if we continue to grow rapidly, we may not be able tomanage our growth effectively.
Our revenue grew from $855.4 million and $235.1 million for the year ended December 31, 2018 and the quarter ended March 31,2019, respectively, to $1.2 billion and $375.8 million for the year ended December 31, 2019 and the quarter ended March 31, 2020,respectively. We expect that, in the future, even if our revenue continues to increase, our rate of growth may decline. In any event, we will notbe able to grow as fast or at all if we do not:
• increase the number of unique visitors to our website, the number of qualified visitors to our website (i.e. those who have the intentand ability to transact), and the number of customers transacting on or through our platform;
• further enhance the quality of our vehicle offerings and value-added products, and introduce high quality new offerings and featureson our platform; or
• acquire sufficient high-quality inventory at an attractive cost to meet the increasing demand for our vehicles.
Our business has grown rapidly as new customers have purchased vehicles and value-added products from us. However, ourbusiness is relatively new and has operated at substantial scale for only a limited period of time. Given this limited history, it is difficult topredict whether we will be able to maintain or grow our business. Our historical revenue growth should not be considered indicative of ourfuture performance. We have encountered, and will continue to encounter, risks and difficulties frequently experienced by growing companiesin rapidly changing industries, including difficulties in our ability to achieve market acceptance of our platform and attract customers, as wellas increasing competition and increasing expenses as we continue to grow our business. We also expect that our business will evolve inways that may be difficult to predict. For example, over time our investments that are intended to drive new customer traffic to our websitemay be less productive than expected. In the event of this or any other adverse developments, our continued success will depend on ourability to successfully adjust our strategy to meet changing market dynamics. If we are unable to do so, our business, financial condition andresults of operations could be materially and adversely affected.
Our recent, rapid growth has placed and may continue to place significant demands on our management and our operational andfinancial resources. We have experienced significant growth in the number of customers on our platform as well as the amount of data thatwe analyze. We have hired and expect to continue hiring additional personnel to support our rapid growth. Our organizational structure isbecoming more complex as we add staff, and we will need to continue to improve our
20

Table of Contents
operational, financial and management controls as well as our reporting systems and procedures. This will require significant capitalexpenditures and the allocation of valuable management resources to grow and adapt in these areas without undermining our corporateculture of teamwork. If we cannot manage our growth effectively to maintain the quality and efficiency of our customers’ experience and/orthe quality of the vehicles we sell, our business, financial condition and results of operations could be materially and adversely affected.
Our business is subject to certain risks related to the operation of, and concentration of our revenues and gross profits from, TDA.
In 2018 and 2019 and the quarters ended March 31, 2019 and 2020, $379.7 million, $390.2 million, $93.1 million and $87.0 million,respectively, of our revenues were related to sales at TDA, representing approximately 44.4%, 32.8%, 39.6% and 23.2%, respectively, of ourtotal revenue for those periods. In 2018 and 2019 and the quarters ended March 31, 2019 and 2020, TDA gross profit was $35.1 million,$25.4 million, $6.1 million and $5.4 million, respectively. Vehicle sales at TDA could be adversely affected for a variety of reasons, includingsevere weather conditions or other catastrophic events in the Houston area that could damage our facilities and/or our inventory and keepcustomers from coming onsite, or economic downturns or other factors affecting the Houston area that could lead to reduced demand.Although revenues and gross profit from TDA are expected to decline as a percentage of total revenues over time as we scale ourecommerce business, a material decline in vehicle sales at TDA in the near term would adversely affect our results of operations. In addition,we acquired TDA in 2015, and, in connection with this acquisition, we could continue to be subject to risks and liabilities from the operation ofTDA under its prior ownership, and the indemnities that we negotiated as part of the transaction may not adequately protect us.
We have entered into outsourcing arrangements with a third party related to our customer experience team, and any difficultiesexperienced in these arrangements could result in an interruption of our ability to sell our vehicles and value-added products.
Currently, the substantial majority of inquiries, sales, purchases and financings of our vehicles in our ecommerce business areconducted through a third-party customer experience center located in Detroit, Michigan, and customers who wish to trade in a vehiclecurrently must interact with our customer experience team in order to complete their transaction. Thus, the customer experience center isfundamental to the success of our business. As a result, the success of our business and our customer experience is partially dependent ona third party over which we have limited control. If the third party’s systems and operations fail or if the third party is otherwise unable toperform its sales function, we may be unable to complete customer transactions, which would prevent us from selling vehicles and value-added products through our platform. In addition, if such third party is unable to perform to our standards or to provide the level of servicerequired or expected by our customers, or we are unable to renegotiate the agreement with the third party on attractive terms or at all, or ifwe are unable to contract with an alternative third-party provider, our business, financial condition and results of operations may be harmedand we may be forced to pursue alternatives to provide these services, which could result in delays, interruptions, additional expenses andloss of potential and existing customers and related revenues.
We face a variety of risks associated with the operation of our VRCs by us and our third-party service providers, any of whichcould materially and adversely affect our business, financial condition and results of operations.
We and third-party service providers operate our VRCs. If we are unable to maintain our relationship with our third-party serviceproviders, such service providers cease to provide the services we need, or such service providers are unable to effectively deliver ourservices to our standards on
21

Table of Contents
timelines and at the prices we have negotiated, and we are unable to contract with alternative vendors or replace such service providers witha Vroom VRC (which may require significant time and investment), we could experience delivery delays, a decrease in the quality of ourreconditioning services, delays in listing our inventory, additional expenses and loss of potential and existing customers and relatedrevenues, which may materially and adversely affect our business, financial condition and results of operations. These risks are exacerbatedby the fact that our third-party VRCs are primarily operated by one third-party provider.
Moreover, our future growth depends in part on scaling and expanding our reconditioning operations. We are expanding ourreconditioning capacity through third-party VRC locations and going forward we expect to continue to invest in additional proprietaryreconditioning capacity to provide added scale with reduced lead-time and greater flexibility. If for any reason we are unable to expand ourreconditioning operations as planned, this could lead to operational delays and a decrease in planned inventory. Any operational delays ordelays in our planned expansion could have a material adverse effect on our business, financial condition and results of operations.
Additionally, we and our third-party vendors are required to obtain approvals, permits and licenses from state regulators and localmunicipalities to operate our VRCs. We may face delays in obtaining the requisite approvals, permits, financing and licenses to operate ourVRCs or we may not be able to obtain them at all. If we encounter delays in obtaining or cannot obtain the requisite approvals, permits,financing and licenses to operate our VRCs in desirable locations, our business, financial condition and results of operations may bematerially and adversely affected.
We rely on third-party carriers to transport our vehicle inventory throughout the United States. Thus, we are subject to businessrisks and costs associated with such carriers and with the transportation industry, many of which are out of our control.
We rely on third-party carriers to transport vehicles from auctions or individual sellers to VRCs, and then from our VRCs to ourcustomers. As a result, we are exposed to risks associated with the transportation industry such as weather, traffic patterns, local and federalregulations, vehicular crashes, gasoline prices and lack of reliability of many independent carriers. Our third-party carriers’ failure tosuccessfully manage our logistics and fulfilment process could cause a disruption in our inventory supply chain and decrease our inventorysales velocity, which may materially and adversely affect our business, financial condition and results of operations. In addition, third-partycarriers who deliver vehicles to our customers could adversely affect the customer experience if they do not perform to our standards ofprofessionalism and courtesy, which could adversely impact our business, financial condition and results of operations.
The current geographic concentration where we provide reconditioning services and store inventory creates an exposure to localand regional downturns or severe weather or catastrophic occurrences that may materially and adversely affect our business,financial condition and results of operations.
We currently conduct our business through multiple VRCs, including our Vroom VRC located outside Houston, Texas where we hold amajority of our inventory. In addition, a majority of our third-party reconditioning services are conducted through a single provider, withfacilities located in California, Florida, Arizona and other states. Any unforeseen events or circumstances that negatively affect these areas,particularly our facilities near Houston, which have experienced flooding and other damage in recent years as a result of severe weatherconditions, including hurricanes, could materially and adversely affect our revenues and results of operations. Changes in demographics andpopulation or severe weather conditions and other catastrophic occurrences in areas in which we operate or from which we obtain inventorymay materially and adversely affect our results of operations. Such
22

Table of Contents
conditions may result in physical damage to our properties, loss of inventory and delays in the delivery of vehicles to our customers.
If we sustain cyber-attacks or other privacy or data security incidents that result in security breaches, we could suffer a loss ofsales and increased costs, exposure to significant liability, reputational harm and other negative consequences.
Our information technology may be subject to cyber-attacks, viruses, malicious software, break-ins, theft, computer hacking, phishing,employee error or malfeasance or other security breaches. Hackers and data thieves are increasingly sophisticated and operate large-scaleand complex automated attacks. Experienced computer programmers and hackers may be able to penetrate our security controls andmisappropriate or compromise sensitive personal, proprietary or confidential information, create system disruptions or cause shutdowns.They also may be able to develop and deploy malicious software programs that attack our systems or otherwise exploit any securityvulnerabilities. Our systems and the data stored on those systems also may be vulnerable to security incidents or security attacks, acts ofvandalism or theft, coordinated attacks by activist entities, misplaced or lost data, human errors, or other similar events that could negativelyaffect our systems and the data stored on or transmitted by those systems, including the data of our customers or business partners. Further,third parties, such as hosted solution providers, that provide services to us, also could be a source of security risks in the event of a failure oftheir own security systems and infrastructure. Our technology infrastructure may be subject to increased risk of slowdown or interruption as aresult of integration with third-party services, including cloud services, and/or failures by such third parties, which may be out of our control.
The costs to eliminate or address the foregoing security threats and vulnerabilities before or after a cyber-incident could be significant.Our remediation efforts may not be successful and could result in interruptions, delays or cessation of service and loss of existing or potentialsuppliers or players. As threats related to cyber-attacks develop and grow, we may also find it necessary to make further investments toprotect our data and infrastructure, which may impact our results of operations. Although we have insurance coverage for losses associatedwith cyber-attacks, as with all insurance policies, there are coverage exclusions and limitations, and our coverage may not be sufficient tocover all possible claims, and we may still suffer losses that could have a material adverse effect on our business (including reputationaldamage). We could also be negatively impacted by existing and proposed U.S. laws and regulations, and government policies and practicesrelated to cybersecurity, data privacy, data localization and data protection. In the event that we or our service providers are unable toprevent, detect, and remediate the foregoing security threats and vulnerabilities in a timely manner, our operations could be disrupted or wecould incur financial, legal or reputational losses arising from misappropriation, misuse, leakage, falsification or intentional or accidentalrelease or loss of information maintained in our information systems and networks, including personal information of our employees and ourcustomers. In addition, outside parties may attempt to fraudulently induce our employees or employees of our vendors to disclose sensitiveinformation in order to gain access to our data. The number and complexity of these threats continue to increase over time. Although wedevelop and maintain systems and controls designed to prevent these events from occurring, and we have a process to identify and mitigatethreats, the development and maintenance of these systems, controls, and processes require ongoing monitoring and updating astechnologies change and efforts to overcome security measures become more sophisticated. Despite our efforts, the possibility of theseevents occurring cannot be eliminated entirely.
We rely on third-party service providers to provide financing, as well as value-added products to our customers, and we cannotcontrol the quality or fulfillment of these products.
We rely on third-party lenders to finance our customers’ vehicle purchases. We also offer value-added products to our customersthrough third-party service providers, including extended warranty
23

Table of Contents
contracts, GAP protection and wheel and tire coverage. Because we utilize third-party service providers, we cannot control all of the factorsthat might affect the quality and fulfillment of these services and products, including (i) lack of day-to-day control over the activities of third-party service providers, (ii) that such service providers may not fulfill their obligations to us or our customers or may otherwise fail to meetexpectations and (iii) that such service providers may terminate their arrangements with us on limited or no notice or may change the termsof these arrangements in a manner unfavorable to us for reasons outside of our control. Such providers also are subject to state and federalregulations and any failure by such third-party service providers to comply with applicable legal requirements could cause us financial orreputational harm.
Our revenues and results of operations are partially dependent on the actions of these third parties. If one or more of these third-partyservice providers cease to provide these services or products to our customers, tighten their credit standards or otherwise provide services tofewer customers or are no longer able to provide them on competitive terms, it could have a material adverse effect on our business,revenues and results of operations. If we were unable to replace the current third-party providers upon the occurrence of one or more of theforegoing events, it could also have a material adverse effect on our business, revenues and results of operations. In addition, disagreementswith such third-party service providers could require or result in costly and time-consuming litigation or arbitration.
Moreover, we receive fees from these third-party service providers in connection with finance, service and protection productspurchased by our customers. A portion of the fees we receive on such products is subject to chargebacks in the event of early termination,default or prepayment of the contracts by end-customers, which could adversely affect our business, revenues and results of operations.
If the quality of our customer experience, our reputation or our brand were negatively affected, our business, sales and results ofoperations could be materially and adversely affected.
Our business model is primarily based on our ability to enable consumers to buy and sell used vehicles through our ecommerceplatform in a seamless, transparent and hassle-free transaction. If consumers fail to perceive us as a trusted brand with a strong reputationand high standards, or if an event occurs that damages our reputation, it could adversely affect customer demand and have a materialadverse effect on our business, revenues and results of operations. Even the perception of a decrease in the quality of our customerexperience or brand could impact results. Our high rate of growth makes maintaining the quality of our customer experience more difficult.
Complaints or negative publicity about our business practices, marketing and advertising campaigns, vehicle quality, compliance withapplicable laws and regulations, data privacy and security or other aspects of our business, especially on blogs and social media websites,could diminish consumer confidence in our platform and adversely affect our brand, irrespective of their validity. The growing use of socialmedia increases the speed with which information and opinions can be shared and thus the speed with which our reputation can bedamaged. If we fail to correct or mitigate misinformation or negative information about us, our platform, our vehicle inventory, our customerexperience, our brand or any aspect of our business, including information spread through social media or traditional media channels, it couldmaterially and adversely affect our business, financial condition and results of operations.
Our business is sensitive to changes in the prices of new and used vehicles.
Any significant changes in retail prices for new or used vehicles could have a material adverse effect on our business, financialcondition and results of operations. For example, if retail prices for
24

Table of Contents
used vehicles rise relative to retail prices for new vehicles, it could make buying a new vehicle more attractive to our customers than buying aused vehicle, which could have a material adverse effect on our business, financial condition and results of operations and could result inreduced vehicle sales and lower revenue. Additionally, manufacturer incentives, including financing, could contribute to narrowing the pricegap between new and used vehicles.
Used vehicle prices also may decline due to an increased number of new vehicle lease returns over the next several years. Inaddition, rental car company bankruptcies may cause a broader disruption in the used vehicle market and adversely impact used vehicleprices. While lower used vehicle prices reduce our cost of acquiring new inventory, lower prices could also lead to reductions in the value ofinventory we currently hold, which could have a negative impact on gross profit. Moreover, any significant changes in retail prices due toscarcity or competition for used vehicles could impact our ability to source desirable inventory for our customers, which could have a materialadverse effect on our results of operations and could result in fewer used-car sales and lower revenue. Furthermore, any significant changesin wholesale prices for used vehicles could have a negative impact on our results of operations by reducing wholesale margins.
Our business and inventory is dependent on our ability to correctly appraise and price vehicles we buy and sell.
When purchasing a vehicle from us, our customers sometimes trade in their current vehicle and apply the trade-in value towards theirpurchase. We also acquire vehicles from consumers independent of any purchase of a vehicle from us. We appraise and price vehicles webuy and sell using data science and proprietary algorithms based on a number of factors, including mechanical soundness, consumerdesirability, vehicle history, market prices and relative value as prospective inventory. If we are unable to correctly appraise and price both thevehicles we buy and the vehicles we sell, we may be unable to acquire or sell inventory at attractive prices or to manage inventory effectively,and accordingly our revenue, gross margins and results of operations would be affected, which could have a material adverse effect on ourbusiness, financial condition and results of operations.
Our business is dependent upon access to desirable vehicle inventory. Obstacles to acquiring attractive inventory, whetherbecause of supply, competition or other factors, may have a material adverse effect on our business, financial condition andresults of operations.
We acquire vehicles for sale from auctions, consumers, rental car companies and dealers. There can be no assurance that the supplyof desirable used vehicles will be sufficient to meet our needs. In addition, we purchase a significant amount of our inventory from one third-party auction source, which accounted for approximately 20% of our inventory sourcing in 2019. If this third party is unable to fulfill ourinventory needs or if we are unable to source desirable used vehicles from alternative third-party providers, we may lack sufficient inventoryand, as a result, may lose potential and existing customers and related revenues. Moreover, we sell vehicles acquired from customers thatdo not meet our retail standards to auctions, which may result in lower revenues and also could lead to reductions in our available inventory.
Additionally, we appraise thousands of consumer vehicles daily and evaluate potential purchases based on mechanical soundness,consumer desirability and relative value in relation to retail inventory or wholesale disposition. If we fail to adjust appraisal offers to stay in linewith broader market trade-in offer trends or fail to recognize those trends, it could adversely affect our ability to acquire inventory. Our abilityto source vehicles through our appraisal process also could be affected by competition, both from new and used vehicle dealers directly andthrough third-party websites driving appraisal traffic to those dealers. In addition, we remain dependent on third parties to sell us usedvehicles, and there can be no assurance of an adequate supply of desirable vehicles on terms that are attractive to us. A
25

Table of Contents
reduction in the availability of or access to sources of inventory for any reason could have a material adverse effect on our business, financialcondition and results of operations.
Our business is dependent upon our ability to expeditiously sell inventory. Failure to expeditiously sell our inventory could have amaterial adverse effect on our business, financial condition and results of operations.
Sourcing of our used vehicle inventory is based in large part on projected demand. If actual sales are materially less than ourforecasts, we would experience an over-supply of used vehicle inventory. An over-supply of used vehicle inventory will generally causedownward pressure on our vehicle sales prices and margins and decrease inventory sales velocity. Vehicles depreciate rapidly, so a failure toexpeditiously sell our inventory or to efficiently recondition and deliver vehicles to customers could hurt our gross profit per unit and materiallyand adversely affect our business, financial condition and results of operations. Historically, the rate at which customers return vehicles hasbeen relatively low. In 2019 and the first quarter of 2020, we had approximately 4.8% and 5.8%, respectively, in total vehicle returns andapproximately 3.7% and 4.5%, respectively, in vehicle returns net of vehicle swaps. However, there is no assurance these rates will remainsimilar to our historical levels. If we have higher than expected return rates, such inventory would continue to depreciate in value and ourrevenue, business, financial condition and results of operations could be materially and adversely affected.
Used vehicle inventory has typically represented a significant portion of our total assets. Having such a large portion of our totalassets in the form of used vehicle inventory for an extended period of time subjects us to write-downs and other risks that affect our results ofoperations. Accordingly, if we have excess inventory, if we are unable to ship and deliver vehicles efficiently or if our inventory sales velocitydecreases, we may be unable to liquidate such inventory at prices that would allow us to meet unit economics targets or to recover our costs,which could have a material adverse effect on our business, financial condition and results of operations.
Our ability to expand value-added product offerings and introduce additional products and services may be limited, which couldhave a material adverse effect on our business, financial condition and results of operations.
Currently, our third-party value-added products consist of finance and protection products, which includes third-party financing ofcustomers’ vehicle purchases, as well as other value-added products, such as extended warranty contracts, GAP protection and wheel andtire coverage. If we introduce new value-added products or expand existing offerings on our platform, such as insurance referral services,music services and vehicle diagnostic and tracking services, we may incur losses or otherwise fail to enter these markets successfully. Ourexpansion into these markets may place us in competitive and regulatory environments with which we are unfamiliar and involve variousrisks, including the need to invest significant resources to familiarize ourselves with such frameworks and the possibility that returns on suchinvestments may not be achieved for several years, if at all. In attempting to establish new offerings, we expect to incur significant expensesand face various other challenges, such as expanding our customer experience team and management personnel to cover these marketsand complying with complicated regulations that apply to these markets. In addition, we may not successfully demonstrate the value of thesevalue-added products to customers, and failure to do so would compromise our ability to successfully expand into these additional revenuestreams. Any of these risks, if realized, could materially and adversely affect our business, financial condition and results of operations.
26

Table of Contents
Failure to comply with federal, state and local laws and regulations relating to privacy, data protection and consumer protection, orthe expansion of current or the enactment of new laws or regulations relating to privacy, data protection and consumer protection,as well as our actual or perceived failure to protect such information could harm our reputation and could adversely affect ourbusiness, financial condition and results of operations.
We collect, store, process and use personal information and other customer data, and we rely in part on third parties that are notdirectly under our control, including our third-party customer experience team, to manage certain of these operations. For example, we relyon encryption, storage and processing technology developed by third parties to securely transmit, operate on and store such information.Due to the volume and sensitivity of the personal information and data we and these third parties manage and expect to manage in thefuture, as well as the nature of our customer base, the security features of our information systems are critical. We expend significantresources to protect against security breaches and may need to expend more resources in the event we need to address problems causedby potential breaches. Any failure or perceived failure to maintain the security of personal and other data that is provided to us by customersand vendors could harm our reputation and brand and expose us to a risk of loss or litigation and possible liability, any of which couldadversely affect our business, financial condition and results of operations. Additionally, concerns about our practices with regard to thecollection, use or disclosure of personal information or other privacy-related matters, even if unfounded, could harm our business, financialcondition and results of operations. We have in the past experienced security vulnerabilities, though such vulnerabilities have not had amaterial impact on our operations. While we have implemented security procedures and virus protection software, intrusion preventionsystems, access control and emergency recovery processes to mitigate such risks like these with respect to information systems that areunder our control, they are not fail-safe and may be subject to breaches. Further, we cannot ensure that third parties upon whom we rely forvarious services will maintain sufficient vigilance and controls over their systems. Our inability to use or access those information systems atcritical points in time, or unauthorized releases of personal or confidential information, could unfavorably impact the timely and efficientoperation of our business, including our results of operations, and our reputation, as well as our relationships with our employees or otherindividuals whose information may have been affected by such cybersecurity incidents.
There are numerous federal, state and local laws regarding privacy and the collection, processing, storing, sharing, disclosing, usingand protecting of personal information and other data, the scope of which are changing, subject to differing interpretations, and which may becostly to comply with, inconsistent between jurisdictions or conflicting with other rules. We are also subject to specific contractualrequirements contained in third-party agreements governing our use and protection of personal information and other data. We generallycomply with industry standards and are subject to the terms of our privacy policies and the privacy- and security-related obligations to thirdparties. We strive to comply with applicable laws, policies, legal obligations and industry codes of conduct relating to privacy and dataprotection, to the extent possible. However, it is possible that these obligations may be interpreted and applied in new ways or in a mannerthat is inconsistent from one jurisdiction to another and may conflict with other rules or our practices. Additionally, new regulations could beenacted with which we are not familiar. Any failure or perceived failure by us to comply with our privacy policies, our privacy-relatedobligations to customers or other third parties, or our privacy-related legal obligations or any compromise of security that results in theunauthorized release or transfer of sensitive information, which may include personally identifiable information or other customer data, mayresult in governmental enforcement actions, litigation or public statements against us by consumer advocacy groups or others and couldcause customers, vendors and receivable purchasers to lose trust in us, which could have a material adverse effect on our business,financial condition and results of operations. Additionally, if vendors, developers or other third parties that we work with violate applicablelaws or our policies, such violations may also put customers’, vendors’ or receivables-
27

Table of Contents
purchasers’ information at risk and could in turn harm our business, financial condition and results of operations.
We expect that new industry standards, laws and regulations will continue to be proposed regarding privacy, data protection andinformation security in many jurisdictions, including the California Consumer Privacy Act (the “CCPA”), which went into effect on January 1,2020. We cannot yet determine the impact of the CCPA or such future laws, regulations and standards may have on our business.Complying with these evolving obligations is costly. For instance, expanding definitions and interpretations of what constitutes “personal data”(or the equivalent) within the United States may increase our compliance costs and legal liability.
A significant data breach or any failure, or perceived failure, by us to comply with any federal, state or local privacy or consumerprotection-related laws, regulations or other principles or orders to which we may be subject or other legal obligations relating to privacy orconsumer protection could adversely affect our reputation, brand and business, and may result in claims, investigations, proceedings oractions against us by governmental entities or others or other penalties or liabilities or require us to change our operations and/or ceaseusing certain data sets. Depending on the nature of the information compromised, we may also have obligations to notify users, lawenforcement or payment companies about the incident and may need to provide some form of remedy, such as refunds, for the individualsaffected by the incident.
We operate in a highly regulated industry and are subject to a wide range of federal, state and local laws and regulations. Failure tocomply with these laws and regulations could have a material adverse effect on our business, financial condition and results ofoperations.
Our business is and will continue to be subject to extensive U.S. federal, state and local laws and regulations. The advertising, sale,purchase, financing and transportation of used vehicles are regulated by every state in which we operate and by the U.S. federalgovernment. We also are subject to state laws related to titling and registration and wholesale vehicle sales, and our sale of value-addedproducts is subject to state licensing requirements, as well as federal and state consumer protection laws. These laws can vary significantlyfrom state to state. In addition, we are subject to regulations and laws specifically governing the internet and ecommerce and the collection,storage and use of personal information and other customer data. We are also subject to federal and state consumer protection laws,including the Equal Credit Opportunity Act and prohibitions against unfair or deceptive acts or practices. The federal governmental agenciesthat regulate our business and have the authority to enforce such regulations and laws against us include the U.S. Federal TradeCommission (the “FTC”), the U.S. Department of Transportation, the U.S. Occupational Health and Safety Administration, the U.S.Department of Justice and the U.S. Federal Communications Commission. For example, the FTC has jurisdiction to investigate and enforceour compliance with certain consumer protection laws and has brought enforcement actions against auto dealers relating to a broad range ofpractices, including the sale and financing of value-added or add-on products. Additionally, we are subject to regulation by individual statedealer licensing authorities, state consumer protection agencies and state financial regulatory agencies. We also are subject to audit by suchstate regulatory authorities.
State dealer licensing authorities regulate the purchase and sale of used vehicles by dealers within their respective states. Theapplicability of these regulatory and legal compliance obligations to our ecommerce business is dependent on evolving interpretations ofthese laws and regulations and how our operations are, or are not, subject to them. We are licensed as a dealer in the State of Texas and allof our vehicle transactions are conducted under our Texas license. We believe that our activities in other states are not subject to theirvehicle dealer licensing laws. State regulators in such states could, however, seek to require us to maintain a used vehicle dealer license inorder to engage in activities in that state.
28

Table of Contents
Most states regulate retail installment sales, including setting a maximum interest rate, caps on certain fees or maximum amountsfinanced. In addition, certain states require that retail installment sellers file a notice of intent or have a sales finance license or an installmentsellers license in order to solicit or originate installment sales in that state. We have obtained a motor vehicle sales finance license in Texas,which is the state in which our vehicle sale transactions are conducted under our Texas dealer license. The financial regulatory agency inPennsylvania determined that we need to obtain an installment seller license in order to enter into retail installment sales with residents ofPennsylvania, and, as a result, we currently do not offer third-party financing to our customers in Pennsylvania. Accordingly, our customerslocated in Pennsylvania must obtain independent financing to the extent needed to fund any vehicle purchases on our platform.
Any failure to renew or maintain any of the foregoing licenses would materially and adversely affect our business, financial conditionand results of operations. Many aspects of our business are subject to regulatory regimes at the state and local level, and we may not haveall licenses required to conduct business in every jurisdiction in which we operate. Despite our belief that we are not subject to certainlicensing requirements of those state and local jurisdictions, regulators may seek to impose punitive fines for operating without a license ordemand we seek a license in those state and local jurisdictions, any of which may inhibit our ability to do business in those state and localjurisdictions, increase our operating expenses and adversely affect our business, financial condition and results of operations.
In addition to these laws and regulations that apply specifically to the sale and financing of used vehicles, our facilities and businessoperations are subject to laws and regulations relating to environmental protection, occupational health and safety, and other broadlyapplicable business regulations. We also are subject to laws and regulations involving taxes, tariffs, privacy and data security, anti-spam,pricing, content protection, electronic contracts and communications, mobile communications, consumer protection, information reportingrequirements, unencumbered internet access to our platform, the design and operation of websites and internet neutrality.
After the completion of this offering, we will also be subject to laws and regulations affecting public companies, including securitieslaws and exchange listing rules. The violation of any of these laws or regulations could result in administrative, civil or criminal penalties or ina cease-and-desist order against our business operations, any of which could damage our reputation and have a material adverse effect onour business, financial condition and results of operations. We have incurred and will continue to incur capital and operating expenses andother costs to comply with these laws and regulations.
The foregoing description of laws and regulations to which we are or may be subject is not exhaustive, and the regulatory frameworkgoverning our operations is subject to evolving interpretations and continuous change.
We may require additional debt and equity capital to pursue our business objectives and respond to business opportunities,challenges or unforeseen circumstances. If such capital is not available to us, our business, financial condition and results ofoperations may be materially and adversely affected.
We may require additional capital to pursue our business objectives and respond to business opportunities, challenges or unforeseencircumstances, including to increase our marketing expenditures to improve our brand awareness, build and maintain our inventory of usedvehicles, develop new products or services or further improve existing products and services, enhance our operating infrastructure andacquire complementary businesses and technologies. Accordingly, we may need to engage in equity or debt financings to secure additionalfunds. However, additional funds
29

Table of Contents
may not be available when we need them, on terms that are acceptable to us, or at all. Moreover, any debt financing that we secure in thefuture could involve restrictive covenants which may make it more difficult for us to obtain additional capital and to pursue businessopportunities. Volatility in the credit markets may also have an adverse effect on our ability to obtain debt financing. If we raise additionalfunds through further issuances of equity or convertible debt securities, our existing stockholders could suffer significant dilution, and anynew equity securities we issue could have rights, preferences and privileges superior to those of holders of our common stock. If we areunable to obtain adequate financing or financing on terms satisfactory to us when we require it, we may be forced to obtain financing onundesirable terms or our ability to continue to pursue our business objectives and to respond to business opportunities, challenges orunforeseen circumstances could be significantly limited, and our business, financial condition and results of operations could be materiallyand adversely affected.
If we fail to comply with the Telephone Consumer Protection Act, we may face significant damages, which could harm ourbusiness, financial condition and results of operations.
We utilize telephone calls as a means of responding to and marketing to customers interested in purchasing, trading in and/or sellingvehicles and value-added products, and intend to implement the use of texting as a means of communication with our customers. Wegenerate leads from our website and online advertising by prompting potential customers to provide their phone numbers so that we cancontact them in response to their interest in selling a vehicle, purchasing a vehicle, trading in a vehicle or obtaining financing terms. Wecurrently engage a third-party customer experience center to facilitate substantially all inquiries, sales, purchases and financings of ourvehicles through our platform.
The Telephone Consumer Protection Act (the “TCPA”), as interpreted and implemented by the Federal Communication Commission(the “FCC”) and U.S. courts, imposes significant restrictions on the use of telephone calls to residential and mobile telephone numbers as ameans of communication when prior consent of the person being contacted has not been obtained. Currently, our third-party customerexperience center utilizes automated telephone dialing systems to dial phone numbers of potential customers who have requested that wecontact them by providing their phone number to us through our website and through third-party aggregation websites. Our telephonemarketing activities, such as these, must comply with the TCPA, the Telephone Sales Rule (the “TSR”) and the FCC’s declaratory rulingissued on July 10, 2015 (the “July Declaratory Ruling”). The TCPA prohibits the use of automatic telephone dialing systems forcommunications with wireless phone numbers without express consent of the consumer, and the TSR established the Do Not Call Registry.Based on a recent decision from the United States Court of Appeals for the District of Columbia, issued on March 16, 2018 (the “ACARuling”) much of the July Declaratory Ruling has been vacated. Although it is possible that decisions of other appellate courts could furtherchange the standards of conduct applicable to the use of automated telephone dialing systems, at present obtaining appropriate consent forauto-dialed calls and properly managing revocations of consent comply with the standard of conduct announced in the ACA Ruling.Violations of the TCPA may be enforced by the FCC or by individuals through litigation, including class actions. Statutory penalties for TCPAviolations range from $500 to $1,500 per violation, which has been interpreted to mean per phone call.
In September 2016, an individual brought a putative class action against us under the TCPA alleging we violated the TCPA by sendinghim a single text message expressing interest in purchasing a vehicle he listed for sale online. The court granted summary judgment in ourfavor and, following the plaintiff’s appeal, the parties resolved the lawsuit. While we have implemented processes and procedures to complywith the TCPA, if we or the third parties on which we rely for data fail to adhere to or successfully implement appropriate processes andprocedures in response to existing or future regulations, it could result in legal and monetary liability, fines, penalties or damage to ourreputation in the marketplace, any of which could have a material adverse effect on our business, financial condition
30

Table of Contents
and results of operations. Additionally, any changes to the TCPA, its interpretation, or enforcement of it by the government or private partiesthat further restrict the way we contact and communicate with our potential customers or generate leads could adversely affect our ability toattract customers and could harm our business, financial condition and results of operations.
Government regulation of the internet and ecommerce is evolving, and unfavorable changes or failure by us to comply with theseregulations could substantially harm our business, financial condition and results of operations.
We are subject to general business regulations and laws, as well as regulations and laws specifically governing the internet andecommerce. Existing and future regulations and laws could impede the growth of the internet, ecommerce or mobile commerce. Theseregulations and laws may involve taxes, tariffs, privacy and data security, anti-spam, pricing, content protection, electronic contracts andcommunications, mobile communications, consumer protection, information reporting requirements, unencumbered internet access to ourplatform, the design and operation of websites and internet neutrality. It is not clear how existing laws governing issues such as propertyownership, sales and other taxes and consumer privacy apply to the internet as the vast majority of these laws were adopted prior to theadvent of the internet and do not contemplate or address the unique issues raised by the internet or ecommerce. It is possible that generalbusiness regulations and laws, or those specifically governing the internet or ecommerce, may be interpreted and applied in a manner that isinconsistent from one market segment to another and may conflict with other rules or our practices. For example, federal, state and localregulation regarding privacy, data protection and information security has become more significant, and proposed regulations such as theCCPA may increase our costs of compliance. We cannot be sure that our practices have complied, comply or will comply fully with all suchlaws and regulations. The enactment of new laws and regulations or the interpretation of existing laws and regulations in an unfavorable waymay affect the operation of our business, directly or indirectly, which could result in substantial regulatory compliance costs, civil or criminalpenalties, including fines, adverse publicity, decreased revenues and increased expenses.
We actively use anonymous online data for targeting ads online and if ad networks are compelled by regulatory bodies to limit use ofthis data, it could materially affect our ability to do effective performance modeling. Any failure, or perceived failure, by us to comply with anyof these laws or regulations could result in damage to our reputation, a loss in business and proceedings or actions against us bygovernmental entities or others. Any such proceeding or action could hurt our reputation, force us to spend significant amounts in defense ofthese proceedings, distract our management, increase our costs of doing business, decrease the use of our sites by customers and suppliersand result in the imposition of monetary liability. We also may be contractually liable to indemnify and hold harmless third parties from thecosts or consequences of non-compliance with any such laws or regulations. Adverse legal or regulatory developments could substantiallyharm our business, our ability to attract new customers may be adversely affected, and we may not be able to maintain or grow our revenueand expand our business as anticipated.
We are subject to risks related to online payment methods.
We accept payments for deposits on our vehicles through a variety of methods, including credit card and debit card. As we offer newpayment options to customers, we may be subject to additional regulations, compliance requirements and fraud. For certain paymentmethods, including credit and debit cards, we pay interchange and other fees, which may increase over time and raise our operating costs.We are also subject to payment card association operating rules and certification requirements, including the Payment Card Industry DataSecurity Standard and rules governing electronic funds transfers, which could change or be reinterpreted to make it difficult or impossible forus to comply. As our business changes, we also may be subject to different rules under existing standards, which may
31

Table of Contents
require new assessments that involve costs above what we currently pay for compliance. If we fail to comply with the rules or requirements ofany provider of a payment method we accept, if the volume of fraud in our transactions limits or terminates our rights to use paymentmethods we currently accept, or if a data breach occurs relating to our payment systems, we may, among other things, be subject to fines orhigher transaction fees and may lose, or face restrictions placed upon, our ability to accept credit card and debit card payments fromcustomers or facilitate other types of online payments. If any of these events were to occur, our business, financial condition and results ofoperations could be materially adversely affected.
We occasionally receive orders placed with fraudulent credit card data, including stolen credit card numbers, or from clients who haveclosed bank accounts or have insufficient funds in open bank accounts to satisfy payment obligations. We may suffer losses as a result oforders placed with fraudulent credit card data even if the associated financial institution approved payment of the orders. Under current creditcard practices, we may be liable for fraudulent credit card transactions. If we are unable to detect or control credit card or other fraud, ourliability for these transactions could harm our business, financial condition and results of operations.
If we do not adequately address our customers’ reliance on mobile device technology, our results of operations could be harmedand our growth could be negatively affected.
Vroom.com is a mobile website that consumers can access and utilize from their mobile devices. In addition, we have designed andlaunched mobile apps (iOS and android) to enhance customers’ mobile experience. In light of consumers’ shift to mobile technology, ourfuture success depends in part on our ability to provide enhanced functionality for customers who use mobile devices to shop for usedvehicles and increase the number of transactions with us that are completed by those users. In the year ended December 31, 2018,approximately 62% of unique visitors to our website were attributable to mobile devices and in the year ended December 31, 2019, this figuregrew to approximately 68%. The shift to mobile technology by our users may harm our business in the following ways:
• customers visiting our website from a mobile device may not accept mobile technology as a viable long-term platform to buy or sella vehicle. This may occur for a number of reasons, including our ability to provide the same level of website functionality to a mobiledevice that we provide on a desktop computer, the actual or perceived lack of security of information on a mobile device andpossible disruptions of service or connectivity;
• we may be unable to provide sufficient website functionality to mobile device users, which may cause customers using mobiledevices to believe that our competitors offer superior products and features;
• problems may arise in developing applications for alternative devices and platforms and the need to devote significant resources tothe creation, support and maintenance of such applications; or
• regulations related to consumer finance disclosures, including the Truth in Lending Act and the Fair Credit Reporting Act, may be
interpreted, in the context of mobile devices, in a manner which could expose us to legal liability in the event we are found to haveviolated applicable laws.
If we do not develop suitable functionality for users who visit our website using a mobile device, our business, financial condition andresults of operations could be harmed.
Our future growth and profitability relies heavily on the effectiveness and efficiency of our marketing and branding efforts, andthese efforts may not be successful.
Because we are a consumer brand, we rely heavily on marketing and advertising to increase brand visibility and attract potentialcustomers. Advertising expenditures are and will continue to be a
32

Table of Contents
significant component of our operating expenses, and there can be no assurance that we will achieve a meaningful ROI on suchexpenditures. We continue to evolve our marketing strategies, adjusting our messages, the amount we spend on advertising and where wespend it, and no assurance can be given that we will be successful in developing effective messages and in achieving efficiency in ourmarketing and advertising expenditures. As a result, our future growth and profitability will depend in part on:
• the effectiveness of our national television advertising campaigns;
• the effectiveness of our performance-based digital marketing efforts;
• the effectiveness and efficiency of our online advertising and search marketing programs in generating consumer awareness of,and sales on, our platform;
• our ability to prevent confusion among customers that can result from search engines that allow competitors to use or bid on ourtrademarks to direct customers to competitors’ websites;
• our ability to prevent internet publication of false or misleading information regarding our platform or our competitors’ offerings; and
• the effectiveness of our direct-to-consumer advertising to reduce our dependency on third-party aggregation websites.
We currently advertise through a blend of brand and direct advertising channels with the goal of increasing the strength, recognitionand trust in the Vroom brand and driving more unique visitors to our platform. Our marketing strategy includes national television campaigns,which we launched in February 2019, and performance marketing through digital platforms, including both auto-centric lead generationplatforms and broader consumer-facing platforms. We also strategically use targeted radio campaigns and billboards and other localadvertising in key markets, and we are expanding our national marketing efforts featuring Sell Us Your Car®. As such, a significantcomponent of our marketing spend involves the use of various marketing techniques, including programmatic ad-buying, interest targeting,retargeting and email nurturing. Future growth and profitability will depend in part on the cost and efficiency of our promotional advertisingand marketing programs and related expenditures, including our ability to create greater awareness of our platform and brand name, toappropriately plan for future expenditures and to drive the promotion of our platform.
Additionally, our business model relies on our ability to grow rapidly and to decrease incremental customer acquisition costs as wegrow. If we are unable to recover our marketing costs through increases in customer traffic and incremental sales, if our advertising partnersrefuse to work with us at competitive rates or at all, or if our broad marketing campaigns are not successful or are terminated, our growth maysuffer and our business, financial condition and results of operations could be materially and adversely affected.
We rely on internet search engines, vehicle listing sites and social networking sites to help drive traffic to our website, and if wefail to appear prominently in the search results or fail to drive traffic through paid advertising, our traffic would decline and ourbusiness, financial condition and results of operations could be materially and adversely affected.
We depend in part on internet search engines, such as Google, Bing and Yahoo!, vehicle listing sites and social networking sites suchas Facebook and Instagram to drive traffic to our website. Our ability to maintain and increase the number of visitors directed to our platformis not entirely within our control. Our competitors may increase their search engine marketing efforts and outbid us for placement on variousvehicle listing sites or for search terms on various search engines, resulting in their websites receiving a higher search result page rankingthan ours. Additionally, internet search engines could revise their methodologies in a way that would adversely affect our search result
33

Table of Contents
rankings. If internet search engines modify their search algorithms in ways that are detrimental to us, if vehicle listing sites refuse to displayany or all of our inventory in certain geographic locations, or if our competitors’ efforts are more successful than ours, overall growth in ourcustomer base could slow or our customer base could decline. Internet search engine providers could provide automotive dealer and pricinginformation directly in search results, align with our competitors or choose to develop competing services. Our platform has experiencedfluctuations in search result rankings in the past, and we anticipate similar fluctuations in the future. We could reach a point of inventorysaturation at third-party aggregation websites whereby we will exceed the maximum allowable inventory that will require us to spend greaterthan market rates to list our inventory. Any reduction in the number of users directed to our platform through internet search engines, vehiclelistings sites or social networking sites could harm our business, financial condition and results of operations.
Our business relies on email and other messaging services, and any restrictions on the sending of emails or messages or aninability to timely deliver such communications could materially and adversely affect our business, financial condition and resultsof operations.
Our business is dependent upon email and other messaging services for promoting our platform and vehicles available for purchase.Promotions offered through email and other messages sent by us are an important part of our marketing strategy. We provide emails tocustomers and other visitors informing them of the convenience and value of using our platform, as well as updates on new inventory andprice updates on listed inventory, and we believe these emails, coupled with our general marketing efforts, are an important part of ourcustomer experience and help generate revenue. If we are unable to successfully deliver emails or other messages to our subscribers, or ifsubscribers decline to open our emails or other messages, our revenues could be materially and adversely affected. Any changes in howwebmail applications organize and prioritize email may reduce the number of subscribers opening our emails. For example, Google’s Gmailservice has a feature that organizes incoming emails into categories (such as primary, social and promotions). Such categorization or similarinbox organizational features may result in our emails being delivered in a less prominent location in a subscriber’s inbox or viewed as“spam” by our subscribers and may reduce the likelihood of that subscriber opening our emails.
In addition, actions by third parties to block, impose restrictions on or charge for the delivery of emails or other messages could alsoadversely impact our business. From time to time, internet service providers or other third parties may block bulk email transmissions orotherwise experience technical difficulties that result in our inability to successfully deliver email or other messages to third parties. Changesin the laws or regulations that limit our ability to send such communications or impose additional requirements upon us in connection withsending such communications could also materially and adversely affect our business, financial condition and results of operations. Our useof email and other messaging services to send communications about our sites or other matters may also result in legal claims against us,which may cause us to incur increased expenses, and if successful might result in fines and orders with costly reporting and complianceobligations or might limit or prohibit our ability to send emails or other messages. We also rely on social networking messaging services tosend communications and to encourage customers to send communications. Changes to the terms of these social networking services tolimit promotional communications, any restrictions that would limit our ability or our customers’ ability to send communications through theirservices, disruptions or downtime experienced by these social networking services or decline in the use of or engagement with socialnetworking services by customers and potential customers could materially and adversely affect our business, financial condition and resultsof operations.
34

Table of Contents
We may experience seasonal and other fluctuations in our quarterly results of operations, which may not fully reflect theunderlying performance of our business.
We expect our quarterly results of operations, including our revenue, gross profit and cash flow to vary significantly in the future basedin part on, among other things, vehicle-buying patterns. Vehicle sales generally exhibit seasonality with an increase in sales early in the yearthat reaches its highest point late in the first quarter and early in the second quarter, which then levels off through the rest of the year with thelowest level of sales in the fourth quarter. This seasonality historically corresponds with the timing of income tax refunds, which can provide aprimary source of funds for customers’ payments on used vehicle purchases. Used vehicle prices also exhibit seasonality, with used vehiclesdepreciating at a faster rate in the last two quarters of each year and a slower rate in the first two quarters of each year.
Other factors that may cause our quarterly results to fluctuate include, without limitation:
• our ability to attract new customers;
• our ability to generate sales of value-added products;
• changes in the competitive dynamics of our industry;
• the regulatory environment;
• expenses associated with unforeseen quality issues;
• macroeconomic conditions;
• our ability to maintain sufficient inventory of desirable vehicles;
• seasonality of the automotive industry and third-party aggregation websites on which we rely;
• changes that impact disposable income, including changes that impact the timing or amount of income tax refunds; and
• litigation or other claims against us.
In addition, a significant portion of our expenses are fixed and do not vary proportionately with fluctuations in revenues. As a result ofthese seasonal fluctuations, our results in any quarter may not be indicative of the results we may achieve in any subsequent quarter or forthe full year, and period-to-period comparisons of our results of operations may not be meaningful.
We participate in a highly competitive industry, and pressure from existing and new companies may adversely affect our businessand results of operations.
Our current and future competitors may include:
• traditional new and used car dealerships;
• large, national car dealers, such as CarMax and AutoNation, which are expanding into online sales, including “omni-channel”offerings;
• used car dealers or marketplaces that currently have existing ecommerce businesses or online platforms, such as Carvana;
• the peer-to-peer market, utilizing sites such as Facebook, Craigslist.com, eBay Motors and Nextdoor.com; and
• sales by rental car companies directly to consumers of used vehicles which were previously utilized in rental fleets, such as HertzCar Sales and Enterprise Car Sales.
35

Table of Contents
Internet and online automotive sites could change their models to directly compete with us, such as Google, Amazon,AutoTrader.com, Edmunds.com, KBB.com, Autobytel.com, TrueCar.com, CarGurus and Cars.com. In addition, automobile manufacturerssuch as General Motors, Ford and Volkswagen could change their sales models to better compete with our model through technology andinfrastructure investments. While such enterprises may change their business models and endeavor to compete with us, the purchase andsale of used vehicles through ecommerce presents unique challenges.
Our competitors also compete in the online market through companies that provide listings, information, lead generation and carbuying services designed to reach customers and enable dealers to reach these customers and providers of offline, membership-based carbuying services such as the Costco Auto Program.
We also expect that new competitors will continue to enter the traditional and ecommerce automotive retail industry with competingbrands, business models and products and services, which could have an adverse effect on our revenue, business and financial results. Forexample, traditional car dealers could transition their selling efforts to the internet, allowing them to sell vehicles across state lines andcompete directly with our online offering and no-negotiating pricing model.
Our current and potential competitors may have significantly greater financial, technical, marketing and other resources than we have,and the ability to devote greater resources to the development, promotion and support of their businesses, platforms, and related productsand services. Additionally, they may have more extensive automotive industry relationships, longer operating histories and greater namerecognition than we have. As a result, these competitors may be able to respond more quickly to consumer needs with new technologies andto undertake more extensive marketing or promotional campaigns. If we are unable to compete with these companies, the demand for ourused vehicles and value-added products could substantially decline.
In addition, if one or more of our competitors were to merge or partner with another of our competitors, the change in the competitivelandscape could adversely affect our ability to compete effectively. We may not be able to compete successfully against current or futurecompetitors, and competitive pressures may harm our business, financial condition and results of operations. Furthermore, if our competitorsdevelop business models, products or services with similar or superior functionality to our platform, it may adversely affect our business.Additionally, our competitors could use their political influence and increase lobbying efforts to encourage new regulations or interpretationsof existing regulations that would prevent us from operating in certain markets.
Changes in the auto industry may threaten our business model if we are unable to adapt.
The market for used vehicles may be impacted by the significant, and likely accelerating, changes to the broader automotive industry,which may render our existing or future business model or our ability to sell vehicles, products and services less competitive, unmarketableor obsolete. For example, technology is currently being developed to produce automated, driverless vehicles that could reduce the demandfor, or replace, traditional vehicles, including the used vehicles that we acquire and sell. Additionally, ride-hailing and ride-sharing services arebecoming increasingly popular as a means of transportation and may decrease consumer demand for the used vehicles we sell, particularlyas urbanization increases. Furthermore, new technologies such as autonomous driving software have the potential to change the dynamicsof car ownership in the future. If we are unable to or otherwise fail to successfully adapt to such industry changes, our business, financialcondition and results of operations could be materially and adversely affected.
36

Table of Contents
Prospective purchasers of vehicles may choose not to shop online, which would prevent us from growing our business.
Our success will depend, in part, on our ability to attract additional customers who have historically purchased vehicles throughtraditional dealers. The online market for vehicles is significantly less developed than the online market for other goods and services such asbooks, music, travel and other consumer products. If this market does not gain widespread acceptance, our business may suffer.Furthermore, we may have to incur significantly higher and more sustained advertising and promotional expenditures or offer more incentivesthan we currently anticipate in order to attract additional consumers to our platform and convert them into purchasing customers. Specificfactors that could prevent consumers from purchasing vehicles through our ecommerce platform include:
• concerns about buying vehicles without face-to-face interaction with sales personnel and the ability to physically test-drive andexamine vehicles;
• preference for a more personal experience when purchasing vehicles;
• insufficient level of desirable inventory;
• pricing that does not meet consumer expectations;
• delayed deliveries;
• inconvenience with returning or exchanging vehicles purchased online;
• concerns about the security of online transactions and the privacy of personal information; and
• usability, functionality and features of our platform.
If the online market for vehicles does not continue to develop and grow, our business will not grow and our business, financialcondition and results of operations could be materially and adversely affected.
General business and economic conditions, and risks related to the larger automotive ecosystem, including consumer demand,could reduce our sales and profitability, which could have a material adverse effect on our business, financial condition andresults of operations.
Our business is affected by general business and economic conditions. The global economy often experiences periods of instability,and this volatility may result in reduced demand for our vehicles and value-added products, reduced spending on vehicles, inability ofcustomers to obtain credit to finance purchases of vehicles and decreased consumer confidence to make discretionary purchases.Consumer purchases of new and used vehicles generally decline during recessionary periods and other periods in which disposable incomeis adversely affected.
Purchases of new and used vehicles are typically discretionary for consumers and have been, and may continue to be, affected bynegative trends in the economy and other factors, including rising interest rates, the cost of energy and gasoline, the availability and cost ofconsumer credit, reductions in consumer confidence and fears of recession, stock market volatility, increased regulation and increasedunemployment. Increased environmental regulation has made, and may in the future make, used vehicles more expensive and less desirablefor consumers.
In addition, changing trends in consumer tastes, negative business and economic conditions and market volatility may make it difficultfor us to accurately forecast vehicle demand trends, which could cause us to increase our inventory carrying costs and could materially andadversely affect our business, financial condition and results of operations.
37

Table of Contents
Our business is sensitive to conditions affecting automotive manufacturers, including manufacturer recalls.
Adverse conditions affecting one or more automotive manufacturers could have a material adverse effect on our business, financialcondition and results of operations and could impact our supply of used vehicles. In addition, manufacturer recalls are a common occurrencethat have accelerated in frequency and scope in recent years. In the instance of an open recall, we may have to temporarily remove vehiclesfrom inventory and may be unable to liquidate such inventory in a timely manner or at all. Because we do not have manufacturerauthorization to complete recall-related repairs, some vehicles we sell may have unrepaired safety recalls. Such recalls, and our lack ofauthorization to make recall-related repairs or potential unavailability of parts needed to make such repairs, could (i) adversely affect usedvehicle sales or valuations, (ii) cause us to temporarily remove vehicles from inventory, (iii) cause us to sell any affected vehicles at a loss,(iv) force us to incur increased costs and (v) expose us to litigation and adverse publicity related to the sale of recalled vehicles, which couldhave a material adverse effect on our business, financial condition and results of operations.
Our business is subject to the risk of natural disasters, adverse weather events and other catastrophic events, and to interruptionby manmade problems such as terrorism.
Our business is vulnerable to damage or interruption from earthquakes, fires, floods, power losses, telecommunications failures,terrorist attacks, acts of war, global pandemics, human errors and similar events. The third-party systems and operations on which we relyare subject to similar risks. For example, a significant natural disaster, such as an earthquake, fire or flood, could have an adverse effect onour business, financial condition and operating results, and our insurance coverage may be insufficient to compensate us for losses that mayoccur. Acts of terrorism could also cause disruptions in our businesses, consumer demand or the economy as a whole. We may not havesufficient protection or recovery plans in some circumstances, such as if a natural disaster affects locations that store a significant amount ofour inventory vehicles. As we rely heavily on our computer and communications systems and the internet to conduct our business andprovide high-quality customer service, any disruptions could negatively affect our ability to run our business, which could have an adverseeffect on our business, financial condition, and operating results.
Our insurance may not provide adequate levels of coverage against claims.
We believe that we maintain insurance customary for businesses of our size and type. However, there are types of losses we mayincur that cannot be insured against or that we believe are not economically reasonable to insure. Moreover, any loss incurred could exceedpolicy limits and policy payments made to us may not be made on a timely basis. For example, insurance we maintain against liability claimsmay not continue to be available on terms acceptable to us and such coverage may not be adequate to cover the types of liabilities actuallyincurred. A successful claim brought against us, if not fully covered by available insurance coverage, could materially and adversely affectour business, financial condition and results of operations.
We may acquire other companies or technologies, which could divert our management’s attention, result in additional dilution toour stockholders and otherwise disrupt our operations and harm our results of operations.
Our success will depend, in part, on our ability to grow our business in response to the demands of consumers and other constituentswithin the automotive industry, as well as competitive pressures. Although we have no plans to do so currently, in some circumstances, wemay determine to grow our business through the acquisition of complementary businesses and technologies rather than through
38

Table of Contents
internal development. The identification of suitable acquisition candidates can be difficult, time-consuming and costly, and we may not beable to successfully complete identified acquisitions. The risks we face in connection with acquisitions include:
• diversion of management time and focus from operating our business to addressing acquisition integration challenges;
• coordination of technology, research and development and sales and marketing functions;
• transition of the acquired company’s users to our platform;
• retention of employees from the acquired company;
• cultural challenges associated with integrating employees from the acquired company into our organization;
• integration of the acquired company’s accounting, management information, human resources and other administrative systems;
• the need to implement or improve controls, policies and procedures at a business that, prior to the acquisition, may have lackedeffective controls, policies and procedures;
• potential write-offs of intangibles or other assets acquired in such transactions that may have an adverse effect our results ofoperations;
• liability for activities of the acquired company before the acquisition, including patent and trademark infringement claims, violationsof laws, commercial disputes, tax liabilities and other known and unknown liabilities; and
• litigation or other claims in connection with the acquired company, including claims from terminated employees, customers, formerstockholders or other third parties.
Our failure to address these risks or other problems encountered in connection with our past or future acquisitions and investmentscould cause us to fail to realize the anticipated benefits of these acquisitions or investments, cause us to incur unanticipated liabilities andotherwise harm our business. Future acquisitions also could result in dilutive issuances of our equity securities, the incurrence of debt,contingent liabilities or amortization expenses, any of which could harm our financial condition. Also, the anticipated benefits of anyacquisitions may not materialize. Any of these risks, if realized, could materially and adversely affect our business, financial condition andresults of operations.
We depend on key personnel to operate our business, and if we are unable to retain, attract and integrate qualified personnel, ourability to develop and successfully grow our business could be harmed.
We believe our success has depended, and continues to depend, on the efforts and talents of our executives and employees. Ourfuture success depends on our continuing ability to attract, develop, motivate and retain highly qualified and skilled employees. Qualifiedindividuals are in high demand, and we may incur significant costs to attract and retain them. In addition, the loss of any of our keyemployees or senior management, including our Chief Executive Officer, Paul J. Hennessy, could materially and adversely affect our ability toexecute our business plan and strategy, and we may not be able to find adequate replacements on a timely basis, or at all. Our executiveofficers and other employees are at-will employees, which means they may terminate their employment relationship with us at any time, andtheir knowledge of our business and industry would be extremely difficult to replace. We may not be able to retain the services of anymembers of our senior management or other key employees. If we do not succeed in attracting well-qualified employees or retaining andmotivating existing employees, our business, financial condition and results of operations could be materially and adversely affected.
39

Table of Contents
We rely on third-party technology and information systems to complete critical business functions. If that technology fails toadequately serve our needs, and we cannot find alternatives, it may negatively impact our business, financial condition and resultsof operations.
We rely on third-party technology for certain of our critical business functions, including customer identity verification for financing,transportation fleet telemetry, network infrastructure for hosting our website and inventory data, software libraries, development environmentsand tools, services to allow customers to digitally sign contracts and customer experience center management. Our business is dependenton the integrity, security and efficient operation of these systems and technologies. Our systems and operations or those of our third-partyvendors and partners could be exposed to damage or interruption from, among other things, fire, natural disaster, power loss,telecommunications failure, unauthorized entry, computer viruses, denial-of-service attacks, acts of terrorism, human error, vandalism orsabotage, financial insolvency, bankruptcy and similar events. The failure of these systems to perform as designed, the failure to maintain orupdate these systems as necessary, the vulnerability of these systems to security breaches or attacks or the inability to enhance ourinformation technology capabilities, and our inability to find suitable alternatives could disrupt our operations and have a material adverseeffect on our business, financial condition and results of operations.
Our platform utilizes open-source software, and any defects or security vulnerabilities in the open-source software couldnegatively affect our business.
Our platform employs open-source software, and we expect to use open-source software in the future. To the extent that our platformdepends upon the successful operation of open-source software, any undetected errors or defects in this open-source software could preventthe deployment or impair the functionality of our platform, delay the introduction of new solutions, result in a failure of our platform and injureour reputation. For example, undetected errors or defects in open-source software could render it vulnerable to breaches or security attacks,and, in conjunction, make our systems more vulnerable to data breaches.
In addition, the terms of various open-source licenses have not been interpreted by United States courts, and there is a risk that suchlicenses could be construed in a manner that imposes unanticipated conditions or restrictions on our ability to market our platform. Someopen-source licenses might require us to make our source code available at no cost or require us to make our source code publicly availablefor modifications or derivative works if our source code is based upon, incorporates, or was created using the open-source software tolicense such source code under the terms of the particular open-source license. While we try to insulate our proprietary code from the effectsof such open-source license provisions, we cannot guarantee we will be successful. In addition to risks related to open-source licenserequirements, usage of open-source software can lead to greater risks than use of third-party commercial software, as open-source licensorsgenerally do not provide warranties or controls on the origin of the software. Many of the risks associated with usage of open-source softwarecannot be eliminated and could materially and adversely affect our business, financial condition and results of operations.
Failure to adequately protect our intellectual property, technology and confidential information could harm our business, financialcondition and results of operations.
The protection of intellectual property, technology and confidential information is crucial to the success of our business. We rely on acombination of trademark, trade secret and copyright law, as well as contractual restrictions, to protect our intellectual property (including ourbrand, technology and confidential information). While it is our policy to protect and defend our rights to our intellectual property, we cannotpredict whether steps taken by us to protect our intellectual property will be
40

Table of Contents
adequate to prevent infringement, misappropriation, dilution or other violations of our intellectual property rights. We also cannot guaranteethat others will not independently develop technology that has the same or similar functionality as our technology. Unauthorized parties mayalso attempt to copy or obtain and use our technology to develop competing solutions, and policing unauthorized use of our technology andintellectual property rights may be difficult and may not be effective. Furthermore, we may face claims of infringement of third-partyintellectual property that could interfere with our ability to market, promote and sell our brands, products and services. Any litigation toenforce our intellectual property rights or defend ourselves against claims of infringement of third-party intellectual property rights could becostly, divert attention of management and may not ultimately be resolved in our favor. Moreover, if we are unable to successfully defendagainst claims that we have infringed the intellectual property rights of others, we may be prevented from using certain intellectual propertyand may be liable for damages, which in turn could materially adversely affect our business, financial condition or results of operations.
As part of our efforts to protect our intellectual property, technology and confidential information, we require certain of our employeesand consultants to enter into confidentiality and assignment of inventions agreements, and we also require certain third parties to enter intonondisclosure agreements. These agreements may not effectively grant all necessary rights to any inventions that may have been developedby our employees and consultants. In addition, these agreements may not effectively prevent unauthorized use or disclosure of ourconfidential information, intellectual property or technology and may not provide an adequate remedy in the event of unauthorized use ordisclosure of our confidential information, intellectual property or technology. Despite our efforts to protect our proprietary rights, unauthorizedparties may attempt to copy aspects of our website features, software and functionality or obtain and use information that we considerproprietary. Changes in the law or adverse court rulings may also negatively affect our ability to prevent others from using our technology.
We are currently the registrant of the vroom.com and texasdirectauto.com internet domain names and various other related domainnames. The regulation of domain names in the United States is subject to change. Regulatory bodies could establish additional top-leveldomains, appoint additional domain name registrars or modify the requirements for holding domain names. As a result, we may not be ableto acquire or maintain domain names that are important for our business.
In addition, we have certain trademarks that are important to our business, such as the Vroom® and Sell Us Your Car® trademarks. Ifwe fail to adequately protect or enforce our rights under these trademarks, we may lose the ability to use those trademarks or to preventothers from using them, which could adversely harm our reputation and our business, financial condition and results of operations. While weare actively seeking, and have secured registration of several of our trademarks in the U.S. and other jurisdictions, it is possible that othersmay assert senior rights to similar trademarks, in the U.S. and internationally, and seek to prevent our use and registration of our trademarksin certain jurisdictions. Our pending trademark or service mark applications may not result in such marks being registered.
While software can be protected under copyright law, we have chosen not to register any copyrights in these works, and instead,primarily rely on trade secret law to protect our proprietary software. In order to bring a copyright infringement lawsuit in the United States,the copyright must be registered. Accordingly, the remedies and damages available to us for unauthorized use of our software may belimited. Our trade secrets, know-how and other proprietary materials may be revealed to the public or our competitors or independentlydeveloped by our competitors and no longer provide protection for the related intellectual property. Furthermore, our trade secrets, know-howand other proprietary materials may be revealed to the public or our competitors or independently developed by our competitors and nolonger provide protection for the related intellectual property.
41

Table of Contents
We may be subject to claims asserting that our employees, consultants or advisors have wrongfully used or disclosed allegedtrade secrets of their current or former employers or claims asserting ownership of what we regard as our own intellectualproperty.
Although we try to ensure that our employees, consultants and advisors do not use the proprietary information or know-how of othersin their work for us, we may be subject to claims that we or these individuals have used or disclosed intellectual property, including tradesecrets or other proprietary information, of any such individual’s current or former employer. Litigation may be necessary to defend againstthese claims. If we fail in defending any such claims, in addition to paying monetary damages, we may lose valuable intellectual propertyrights or personnel. Even if we are successful in defending against such claims, litigation could result in substantial costs and be a distractionto management.
In addition, while it is our policy to require our employees and contractors who may be involved in the creation or development ofintellectual property on our behalf to execute agreements assigning such intellectual property to us, we may be unsuccessful in having allsuch employees and contractors execute such an agreement. The assignment of intellectual property may not be self-executing or theassignment agreement may be breached, and we may be forced to bring claims against third parties or defend claims that they may bringagainst us to determine the ownership of what we regard as our intellectual property.
A significant disruption in service on our platform could damage our reputation and result in a loss of customers, which couldharm our brand or our business, financial condition and results of operations.
Our brand, reputation and ability to attract customers depend on the reliable performance of our platform and the supporting systems,technology and infrastructure. We may experience significant interruptions to our systems in the future. Interruptions in these systems,whether due to system failures, programming or configuration errors, computer viruses or physical or electronic break-ins, could affect theavailability of our inventory on our platform and prevent or inhibit the ability of customers to access our platform. Problems with the reliabilityor security of our systems could harm our reputation, result in a loss of customers and result in additional costs.
Our data center is located at a facility in Houston, Texas, which connects all of our offices and our Vroom VRC. Our data center isvulnerable to damage or interruption from fire, flood, power loss, telecommunications failure, terrorist attacks, acts of war, electronic andphysical break-ins, computer viruses, earthquakes and similar events. The occurrence of any of these events could render communicationsbetween Vroom offices inoperable and impact our ability to list and sell vehicles through our platform.
Problems faced by our third-party web-hosting providers, including AWS and Google Cloud, could inhibit the functionality of ourplatform. For example, our third-party web-hosting providers could close their facilities without adequate notice or suffer interruptions inservice caused by cyber-attacks, natural disasters or other phenomena. Disruption of their services could cause our website to be inoperableand could have a material adverse effect on our business, financial condition and results of operations. Any financial difficulties, up to andincluding bankruptcy, faced by our third-party web-hosting providers or any of the service providers with whom they contract may havenegative effects on our business, the nature and extent of which are difficult to predict. In addition, if our third-party web-hosting providers areunable to keep up with our growing capacity needs, our business, financial condition and results of operations could be harmed.
Any errors, defects, disruptions, or other performance or reliability problems with our platform could interrupt our customers’ access toour inventory and our access to data that drives our inventory
42

Table of Contents
purchase operations, which could harm our reputation or our business, financial condition and results of operations.
We are, and may in the future be, subject to legal proceedings in the ordinary course of our business. If the outcomes of theseproceedings are adverse to us, it could have a material adverse effect on our business, financial condition and results ofoperations.
We are subject to various litigation matters from time to time, the outcome of which could have a material adverse effect on ourbusiness, financial condition and results of operations. Claims arising out of actual or alleged violations of law could be asserted against usby individuals, either individually or through class actions, by governmental entities in civil or criminal investigations and proceedings or byother entities. These claims could be asserted under a variety of laws, including but not limited to consumer finance laws, consumerprotection laws, intellectual property laws, privacy laws, labor and employment laws, securities laws and employee benefit laws. Theseactions could expose us to adverse publicity and to substantial monetary damages and legal defense costs, injunctive relief and criminal andcivil fines and penalties, including but not limited to suspension or revocation of licenses to conduct business. See “Business—LegalProceedings.”
We may be limited in our ability to utilize, or may not be able to utilize, net operating loss carryforwards to reduce our future taxliability.
As of December 31, 2019 we had U.S. federal net operating loss (“NOL”) carryforwards of $312.8 million, the utilization of which maybe limited annually due to certain change in ownership provisions of Section 382 of the Internal Revenue Code of 1986, as amended (the“Code”). Our U.S. federal NOL carryforwards will begin to expire in 2034. Please refer to Note 15 to our consolidated financial statementsappearing elsewhere in this prospectus for a further discussion of the carryforward of our NOLs. As of December 31, 2019, we maintain a fullvaluation allowance of $75.0 million for our net deferred tax assets.
An “ownership change” (generally defined as greater than 50-percentage-point cumulative changes in the equity ownership of certainstockholders over a rolling three-year period) under Section 382 of the Code may limit our ability to utilize fully our pre-change NOLcarryforwards to reduce our taxable income in periods following the ownership change. In general, an ownership change would limit ourability to utilize U.S. federal NOL carryforwards to an amount equal to the aggregate value of our equity at the time of the ownership changemultiplied by a specified tax-exempt interest rate, subject to increase by certain built-in gains. Similar provisions of state tax law may alsoapply to our state NOL carryforwards. We believe we have undergone an ownership change for purposes of Section 382 of the Code in eachof 2013, 2014 and 2015, which substantially limits our ability to use U.S. federal NOL carryforwards generated prior to each such ownershipchange. In addition, future changes in our stock ownership, some of which may be beyond our control, could result in additional ownershipchanges under Section 382 of the Code.
We may need to recognize impairment charges related to goodwill, identified intangible assets and fixed assets.
We are required to test goodwill and any other intangible asset with an indefinite life for possible impairment on the same date eachyear and on an interim basis if there are indicators of a possible impairment. There is significant judgment required in the analysis of apotential impairment of goodwill, identified intangible assets and other long-lived assets. If, as a result of a general economic slowdown ordeterioration in one or more of the markets in which we operate or in our financial performance or future outlook, or if the estimated fair valueof our long-lived assets decreases, we may determine that one or more of our long-lived assets is impaired. An impairment charge would bedetermined based on
43

Table of Contents
the estimated fair value of the assets and any such impairment charge could have a material adverse effect on our business, financialcondition and results of operations.
Tax matters could impact our results of operations and financial condition.
We are subject to U.S. federal income tax, as well as income tax in certain states. Our provision for income taxes and cash tax liabilityin the future could be adversely affected by numerous factors including, changes in tax laws, regulations, accounting principles orinterpretations thereof, which could materially and adversely impact our cash flows and our business, financial condition and results ofoperations in future periods. Increases in our effective tax rate could also materially affect our net results. The Tax Cuts and Jobs Act (the“TCJA”), which was enacted in 2017, significantly reformed the Code. The TCJA, among other things, contained significant changes tocorporate taxation, including a reduction of the corporate tax rate from a top marginal rate of 35% to a flat rate of 21%, limitations on thededuction for NOL carryforwards and the elimination of NOL carrybacks, in each case, for losses generated after December 31, 2017(though any such NOLs may be carried forward indefinitely), and limitations on deductions for interest expense. The consolidated financialstatements contained herein reflect the effects of the TCJA based on current guidance. However, there remain uncertainties and ambiguitiesin the application of certain provisions of the TCJA, and, as a result, we made certain judgments and assumptions in the interpretationthereof. The U.S. Treasury Department and the Internal Revenue Service (the “IRS”), may issue further guidance on how the provisions ofthe TCJA will be applied or otherwise administered that differs from our current interpretation. In addition, the TCJA could be subject topotential amendments and technical corrections, any of which could materially lessen or increase certain adverse impacts of the legislationon us. Further, we are subject to the examination of our income and other tax returns by the IRS and state and local tax authorities, whichcould have an impact on our business, financial condition and results of operations.
Our level of indebtedness could have a material adverse effect on our ability to generate sufficient cash to fulfil our obligationsunder such indebtedness, to react to changes in our business and to incur additional indebtedness to fund future needs.
As of March 31, 2020, we had outstanding $165.2 million aggregate principal amount of borrowings under our 2020 Vehicle FloorplanFacility (as defined in “Management’s Discussion and Analysis of Financial Condition and Results of Operations—Liquidity and CapitalResources—Vehicle Financing”). Our interest expense was $2.8 million for the quarter ended March 31, 2020.
If our cash flows and capital resources are insufficient to fund our debt service obligations, we may be forced to reduce or delayinvestments and capital expenditures, or to sell assets, seek additional capital or restructure or refinance our indebtedness. Our ability torestructure or refinance our current or future debt will depend on the condition of the capital markets and our financial condition at such time.Any refinancing of our debt could be at higher interest rates and may require us to comply with more onerous covenants, which could furtherrestrict our business operations. The terms of existing or future debt instruments may restrict us from adopting some of these alternatives.Any failure to make payments of interest and principal on our outstanding indebtedness on a timely basis or failure to comply with certainrestrictions in our debt instruments would result in a default under our debt instruments. In the event of a default under any of our current orfuture debt instruments, the lenders could elect to declare all amounts outstanding under such debt instruments to be due and payable.Furthermore, our 2020 Vehicle Floorplan Facility, which replaced our prior Vehicle Floorplan Facility, restricts our ability to dispose of assetsand/or use the proceeds from the disposition. We may not be able to consummate any such dispositions or to obtain the proceeds that wecould realize from them and these proceeds may not be adequate to meet any debt service obligations then due.
In addition, our indebtedness under our 2020 Vehicle Floorplan Facility bears interest at variable rates. Because we have variable ratedebt, fluctuations in interest rates may affect our cash flows or
44

Table of Contents
business, financial condition and results of operations. We may attempt to minimize interest rate risk and lower our overall borrowing coststhrough the utilization of derivative financial instruments, primarily interest rate swaps.
We currently rely on an agreement with a single lender to finance our vehicle inventory purchases under our 2020 VehicleFloorplan Facility. If our relationship with this lender were to terminate, and we fail to acquire alternative sources of funding tofinance our vehicle inventory purchases, we may be unable to maintain sufficient inventory, which would adversely affect ourbusiness, financial condition and results of operations.
We rely on a revolving credit agreement with a single lender to finance our vehicle inventory purchases under our 2020 VehicleFloorplan Facility. Outstanding borrowings are due as financed vehicles are sold, and the 2020 Vehicle Floorplan Facility is secured by ourvehicle inventory and certain other assets. If we are unable to maintain our 2020 Vehicle Floorplan Facility, which expires in March 2021absent renewal, on favorable terms or at all, or if the agreement is terminated or expires and is not renewed with our existing third-partylender or we are unable to find a satisfactory replacement, our inventory supply may decline, resulting in fewer vehicles available for sale onour website. Moreover, new funding arrangements may be at higher interest rates or subject to other less favorable terms. These financingrisks, in addition to potential rising interest rates and changes in market conditions, if realized, could negatively impact our business, financialcondition and results of operations. See “Management’s Discussion and Analysis of Financial Condition and Results of Operations—Liquidityand Capital Resources—Vehicle Financing.”
Risks Related to this Offering and Ownership of Our Common Stock
Our management team will have immediate and broad discretion over the use of the net proceeds from this offering and may notuse them effectively.
We currently intend to use the net proceeds from this offering for general corporate purposes, including advertising and marketing,technology development, working capital, operating expenses and capital expenditures. We also may use the net proceeds to potentiallyacquire or invest in businesses, products, services or technologies; however, we do not have agreements or commitments for any materialacquisitions or investments at this time. See “Use of Proceeds.” Our management will have broad discretion in the application of the netproceeds. Our stockholders may not agree with the manner in which our management chooses to allocate the net proceeds from thisoffering. The failure by our management to apply these funds effectively could have a material adverse effect on our business, financialcondition and results of operation. Pending their use, we may invest the net proceeds from this offering in a manner that does not produceincome. The decisions made by our management may not result in positive returns on your investment and you will not have an opportunityto evaluate the economic, financial or other information upon which our management bases its decisions.
Our common stock price may be volatile or may decline regardless of our operating performance, and you may not be able toresell your shares at or above the initial public offering price.
Prior to this offering, there has not been a public trading market for shares of our common stock. It is possible that after this offeringan active trading market will not develop or continue or, if developed, that any market will be sustained, which could make it difficult for you tosell your shares of common stock at an attractive price or at all. The initial public offering price of our common stock will be determined bynegotiations between us and the representatives of the underwriters based upon a number of factors and may not be indicative of prices thatwill prevail in the open market following the
45

Table of Contents
consummation of this offering. See “Underwriting.” Consequently, you may not be able to sell our shares of common stock at prices equal toor greater than the price you paid in this offering.
Many factors, some of which are outside our control, may cause the market price of our common stock to fluctuate significantly,including those described elsewhere in this “Risk Factors” section and this prospectus, as well as the following:
• our operating and financial performance and prospects;
• our quarterly or annual earnings or those of other companies in our industry compared to market expectations;
• conditions that impact demand for our offerings and platform, including demand in the automotive industry generally and theperformance of the third parties through whom we conduct significant parts of our business;
• future announcements concerning our business or our competitors’ businesses;
• the public’s reaction to our press releases, other public announcements and filings with the SEC;
• the market’s reaction to our reduced disclosure and other requirements as a result of being treated as an “emerging growthcompany” under the JOBS Act;
• coverage by or changes in financial estimates by securities analysts or failure to meet their expectations;
• market and industry perception of our success, or lack thereof, in pursuing our growth strategy;
• strategic actions by us or our competitors, such as acquisitions or restructurings;
• changes in laws or regulations which adversely affect our industry or us;
• changes in accounting standards, policies, guidance, interpretations or principles;
• changes in senior management or key personnel;
• issuances, exchanges or sales, or expected issuances, exchanges or sales of our capital stock;
• changes in our dividend policy;
• adverse resolution of new or pending litigation or other claims against us; and
• changes in general market, economic and political conditions in the United States and global economies or financial markets,including those resulting from natural disasters, terrorist attacks, global pandemics, acts of war and responses to such events.
As a result, volatility in the market price of our common stock may prevent investors from being able to sell their common stock at orabove the initial public offering price or at all. These broad market and industry factors may materially reduce the market price of our commonstock, regardless of our operating performance. In addition, price volatility may be greater if the public float and trading volume of ourcommon stock is low. As a result, you may suffer a loss on your investment.
We do not intend to pay dividends on our common stock for the foreseeable future.
We currently intend to retain all available funds and any future earnings to fund the development and growth of our business. As aresult, we do not anticipate declaring or paying any cash dividends on our common stock in the foreseeable future. Any decision to declareand pay dividends in the future will be made at the discretion of our board of directors and will depend on, among other things, our businessprospects, results of operations, financial condition, cash requirements and availability,
46

Table of Contents
industry trends and other factors that our board of directors may deem relevant. Any such decision also will be subject to compliance withcontractual restrictions and covenants in the agreements governing our current indebtedness. In addition, we may incur additionalindebtedness, the terms of which may further restrict or prevent us from paying dividends on our common stock. As a result, you may have tosell some or all of your common stock after price appreciation in order to generate cash flow from your investment, which you may not beable to do. Our inability or decision not to pay dividends could also adversely affect the market price of our common stock.
We may issue shares of preferred stock in the future, which could make it difficult for another company to acquire us or couldotherwise adversely affect holders of our common stock, which could depress the price of our common stock.
Our amended and restated certificate of incorporation will authorize us to issue one or more series of preferred stock. Our board ofdirectors will have the authority to determine the preferences, limitations and relative rights of the shares of preferred stock and to fix thenumber of shares constituting any series and the designation of such series, without any further vote or action by our stockholders. Ourpreferred stock could be issued with voting, liquidation, dividend and other rights superior to the rights of our common stock. The potentialissuance of preferred stock may delay or prevent a change in control of us, discouraging bids for our common stock at a premium to themarket price, and materially and adversely affect the market price and the voting and other rights of the holders of our common stock.
The issuance by us of additional shares of common stock or convertible securities may dilute your ownership of us and couldadversely affect our stock price.
In connection with this offering, we intend to file a registration statement with the SEC on Form S-8 providing for the registration ofshares of our common stock issued or reserved for issuance under the 2020 Plan and 2014 Plan. Subject to the satisfaction of vestingconditions and the expiration of lockup agreements, shares registered under the registration statement on Form S-8 will be available forresale immediately in the public market without restriction. From time to time in the future, we may also issue additional shares of ourcommon stock or securities convertible into common stock pursuant to a variety of transactions, including acquisitions. The issuance by us ofadditional shares of our common stock or securities convertible into our common stock would dilute your ownership of us and the sale of asignificant amount of such shares in the public market could adversely affect prevailing market prices of our common stock.
Future sales, or the perception of future sales, by us or our existing stockholders in the public market following this offering couldcause the market price for our common stock to decline.
The sale of substantial amounts of shares of our common stock in the public market, or the perception that such sales could occur,could harm the prevailing market price of shares of our common stock. These sales, or the possibility that these sales may occur, also mightmake it more difficult for us to sell equity securities in the future at a time and at a price that we deem appropriate. Upon completion of thisoffering, we will have a total of 112,737,090 shares of our common stock outstanding (or 115,549,590 shares if the underwriters exercisetheir over-allotment option in full).
All of the shares of common stock sold in this offering will be freely tradable without restriction or further registration under theSecurities Act, except that any shares held by our affiliates, as that term is defined under Rule 144 of the Securities Act (“Rule 144”), may besold only in compliance with the limitations described in “Shares Eligible for Future Sale.” The remaining outstanding shares of commonstock held by our existing owners after this offering will be subject to certain restrictions on resale. We, our executive officers, directors andthe holders of substantially all of our outstanding stock have signed lock-up agreements with the underwriters that will, subject to certaincustomary exceptions,
47

Table of Contents
restrict the sale of the shares of our common stock and certain other securities held by them for 180 days following the date of thisprospectus. Goldman Sachs & Co. LLC may, in their sole discretion and at any time without notice, release all or any portion of the shares orsecurities subject to any such lock-up agreements. See “Underwriting” for a description of these lock-up agreements.
As restrictions on resale end, the market price of our shares of common stock could drop significantly if the holders of such restrictedshares sell them or are perceived by the market as intending to sell them. These factors could also make it more difficult for us to raiseadditional funds through future offerings of our shares of common stock or other securities.
Upon the expiration of the lock-up agreements described above, all such shares will be eligible for resale in the public market, subject,in the case of shares held by our affiliates, to volume, manner of sale and other limitations described in “Shares Eligible for Future Sale.”
Although we ceased to be an “emerging growth company,” we can continue to take advantage of certain reduced disclosurerequirements in this registration statement, which may make our common stock less attractive to investors.
We ceased to be an emerging growth company as defined in the JOBS Act on December 31, 2019, because our annual revenue forthe fiscal year ended December 31, 2019 exceeded $1.07 billion. However, because we ceased to be an emerging growth company after weconfidentially submitted our registration statement related to this offering to the SEC, we will be treated as an emerging growth company forcertain purposes until the earlier of the date on which we complete this offering and December 31, 2020. As such, we intend to takeadvantage of certain exemptions from various reporting requirements that are applicable to other public companies, including reduceddisclosure obligations regarding the provision of selected financial data and executive compensation arrangements. We cannot predict ifinvestors will find our common stock less attractive because we have relied on these exemptions. If some investors find our common stockless attractive, there may be less demand for our common stock and the price that some investors are willing to pay for our common stockmay decrease.
The obligations associated with being a public company require significant resources and management attention, and we have andwill continue to incur increased costs as a result of becoming a public company.
After completion of this offering, as a public company, we will face increased legal, accounting, administrative and other costs andexpenses that we did not incur as a private company and which have not been reflected in our historical consolidated financial statementsincluded elsewhere in this prospectus. We have already started to incur, and expect to continue to incur, significant costs related to operatingas a public company. Upon the completion of this offering, we will be subject to the Exchange Act, the rules and regulations implemented bythe SEC, the Sarbanes-Oxley Act, the Wall Street Reform and Consumer Protection Act of 2020 (the “Dodd-Frank Act”), the Public CompanyAccounting Oversight Board (“PCAOB”) and the rules and standards of the exchange upon which our securities are listed, each of whichimposes additional reporting and other obligations on public companies. As a public company, we will be required to, among others:
• prepare, file and distribute annual, quarterly and current reports with respect to our business and financial condition;
• prepare, file and distribute proxy statements and other stockholder communications;
• expand the roles and duties of our Board and committees thereof and management;
48

Table of Contents
• hire additional financial and accounting personnel and other experienced accounting and finance staff with the expertise to addresscomplex accounting matters applicable to public companies;
• institute more comprehensive financial reporting and disclosure compliance procedures;
• involve and retain to a greater degree outside counsel and accountants to assist us with the activities listed above;
• enhance our investor relations function;
• establish new internal policies, including those relating to trading in our securities and disclosure controls and procedures;
• comply with our exchange’s listing standards; and
• comply with the Sarbanes-Oxley Act.
These rules and regulations and changes in laws, regulations and standards relating to corporate governance and public disclosure,which have created uncertainty for public companies, have and will continue to increase our legal and financial compliance costs and makesome activities more time consuming and costly. These laws, regulations and standards are subject to varying interpretations, in many casesdue to their lack of specificity, and, as a result, their application in practice may evolve over time as new guidance is provided by regulatoryand governing bodies. This could result in continuing uncertainty regarding compliance matters and higher costs necessitated by ongoingrevisions to disclosure and governance practices. Our investment in compliance with existing and evolving regulatory requirements has andwill continue to result in increased administrative expenses and a diversion of management’s time and attention from revenue-generatingactivities to compliance activities, which could have a material adverse effect on our business, financial condition and results of operations.
In addition, the need to establish the corporate infrastructure demanded of a public company may also divert management’s attentionfrom implementing our business strategy, which could prevent us from improving our business, financial condition and results of operations. Ifwe do not continue to develop and implement the right processes and tools to manage our changing enterprise and maintain our culture, ourability to compete successfully and achieve our business objectives could be impaired, which could negatively impact our business, financialcondition and results of operations. In addition, we cannot predict or estimate the amount of additional costs we may incur to comply withthese requirements. We anticipate that these costs will materially increase our general and administrative expenses.
We also expect that being a public company and complying with applicable rules and regulations will make it more difficult and moreexpensive for us to obtain director and officer liability insurance, and we may be required to accept reduced policy limits and coverage orincur substantially higher costs to obtain the same or similar coverage. As a result, it may be more difficult for us to attract and retain qualifiedpeople to serve on our board of directors, our board committees or as executive officers.
As a public reporting company, we will be subject to rules and regulations established from time to time by the SEC and Nasdaqregarding our internal control over financial reporting. If we fail to establish and maintain effective internal control over financialreporting and disclosure controls and procedures, we may not be able to accurately report our financial results, or report them in atimely manner.
Upon consummation of this offering, we will become a public reporting company subject to the rules and regulations established fromtime to time by the SEC and Nasdaq. These rules and
49

Table of Contents
regulations will require, among other things, that we establish and periodically evaluate procedures with respect to our internal control overfinancial reporting. Reporting obligations as a public company are likely to place a considerable strain on our financial and managementsystems, processes and controls, as well as on our personnel.
In addition, as a public company, we will be required to document and test our internal control over financial reporting pursuant toSection 404 of the Sarbanes-Oxley Act so that our management can certify as to the effectiveness of our internal control over financialreporting. Section 404(a) of the Sarbanes-Oxley Act (“Section 404(a)”) requires that, beginning with our second annual report following ourinitial public offering, management assess and report annually on the effectiveness of our internal control over financial reporting and identifyany material weaknesses in our internal control over financial reporting. Although Section 404(b) requires our independent registered publicaccounting firm to issue an annual report that addresses the effectiveness of our internal control over financial reporting, we have opted torely on the exemptions provided in the JOBS Act, and consequently will not be required to comply with SEC rules that implementSection 404(b) until such time as we are no longer treated as an “emerging growth company.” We expect our first Section 404(a) assessmentwill take place for our annual report for the year ending December 31, 2021. We also expect to comply with Section 404(b) at this time.
If our senior management is unable to conclude that we have effective internal control over financial reporting, or to certify theeffectiveness of such controls, and our independent registered public accounting firm cannot render an unqualified opinion on management’sassessment and the effectiveness of our internal control over financial reporting at such time as it is required to do so, and materialweaknesses in our internal control over financial reporting are identified, we could be subject to regulatory scrutiny, a loss of public andinvestor confidence, and to litigation from investors and stockholders, which could have a material adverse effect on our business and ourstock price. In addition, if we do not maintain adequate financial and management personnel, processes and controls, we may not be able tomanage our business effectively or accurately report our financial performance on a timely basis, which could cause a decline in our commonstock price and adversely affect our business, financial condition and results of operations. Failure to comply with the Sarbanes-Oxley Actcould potentially subject us to sanctions or investigations by the SEC, the exchange upon which our securities are listed or other regulatoryauthorities, which would require additional financial and management resources.
We have identified material weaknesses in our internal control over financial reporting. If our remediation of such materialweaknesses is not effective, or if we experience additional material weaknesses or otherwise fail to design and maintain effectiveinternal control over financial reporting, our ability to timely and accurately report our financial condition and results of operationsor comply with applicable laws and regulations could be impaired, which may adversely affect investor confidence in us and, as aresult, the value of our common stock.
As a public company, we will be required to maintain internal control over financial reporting and to evaluate and determine theeffectiveness of our internal control over financial reporting. Beginning with our second annual report on Form 10-K following this offering, wewill be required to provide a management report on internal control over financial reporting, as well as an attestation of our independentregistered public accounting firm.
In connection with the preparation of our consolidated financial statements for the year ended December 31, 2018, we identifiedmaterial weaknesses in our internal control over financial reporting. A material weakness is a deficiency, or combination of deficiencies, ininternal control over financial reporting such that there is a reasonable possibility that a material misstatement of our annual or interimconsolidated financial statements will not be prevented or detected on a timely basis.
50

Table of Contents
We did not design or maintain an effective control environment commensurate with our financial reporting requirements. Specifically,we lacked a sufficient complement of personnel with (i) an appropriate level of accounting knowledge, training and experience toappropriately analyze, record and disclose accounting matters timely and accurately, and (ii) an appropriate level of knowledge andexperience to establish effective information technology processes and controls. This material weakness contributed to the following materialweaknesses:
• we did not design and maintain adequate controls over the preparation and review of certain account reconciliations and journalentries. Specifically, we did not design and maintain controls to ensure (i) the appropriate segregation of duties in the preparationand review of account reconciliations and journal entries and (ii) account reconciliations and journal entries were reviewed at theappropriate level of precision.
• we did not design and maintain effective controls over certain information technology general controls for information systems andapplications that are relevant to the preparation of the consolidated financial statements. Specifically, we did not design andmaintain sufficient user and privileged access controls to ensure appropriate segregation of duties and adequate restricted useraccess to financial applications; program change management controls to ensure that IT program and data changes affectingfinancial IT applications and underlying accounting records are identified, tested, authorized and implemented appropriately; orcomputer operations controls as well as testing and approval controls for program development.
The control deficiencies described above did not result in a misstatement to our annual consolidated financial statements. However,each of the material weaknesses described above, if not remediated, could result in a misstatement of one or more account balances ordisclosures that would result in a material misstatement to the annual or interim consolidated financial statements that would not beprevented or detected, and, accordingly, we determined that these control deficiencies constitute material weaknesses.
We have concluded that these material weaknesses arose because, as a private company, we did not have the necessary businessprocesses, systems, personnel and related internal controls. In the year ended December 31, 2019, we undertook measures to addressmaterial weaknesses in our internal controls. In particular, we (i) hired additional finance and accounting personnel with expertise inpreparation of financial statements and account reconciliations; (ii) further developed and documented our accounting policies; and (iii) hireda director responsible for implementation of information technology general controls. In addition, we will continue to take steps to remediatethese material weaknesses, including:
• continuing to hire, additional qualified accounting, financial reporting and information technology personnel with public companyexperience;
• providing additional training for our personnel on internal control over financial reporting;
• implementing new financial systems and processes;
• implementing additional review controls and processes and requiring timely account reconciliation and analyses;
• implementing processes and controls to better identify and manage segregation of duties; and
• engaging an external advisor to assist with evaluating and documenting the design and operating effectiveness of internal controlsand assisting with the remediation of deficiencies, as necessary.
We cannot assure you that the measures we have taken to date, and that we are continuing to implement, will be sufficient toremediate the material weaknesses we have identified or to avoid the
51

Table of Contents
identification of additional material weaknesses in the future. If the steps we take do not remediate the material weaknesses in a timelymanner, there could continue to be a reasonable possibility that these control deficiencies or others could result in a material misstatement ofour annual or interim consolidated financial statements that would not be prevented or detected on a timely basis.
The process of designing and implementing internal control over financial reporting required to comply with the disclosure andattestation requirements of Section 404 of the Sarbanes-Oxley Act will be time consuming and costly. If during the evaluation and testingprocess we identify additional material weaknesses in our internal control over financial reporting or determine that existing materialweaknesses have not been remediated, our management will be unable to assert that our internal control over financial reporting is effective.Even if our management concludes that our internal control over financial reporting is effective, our independent registered public accountingfirm may conclude that there are material weaknesses with respect to our internal control over financial reporting. If we are unable to assertthat our internal control over financial reporting is effective, or when required in the future, if our independent registered public accountingfirm is unable to express an unqualified opinion as to the effectiveness of our internal control over financial reporting, investors may loseconfidence in the accuracy and completeness of our financial reports, the market price of our common stock could be adversely affected andwe could become subject to litigation or investigations by the stock exchange on which our securities are listed, the SEC, or other regulatoryauthorities, which could require additional financial and management resources.
Anti-takeover provisions in our governing documents and under Delaware law could make an acquisition of our company moredifficult, limit attempts by our stockholders to replace or remove our current management, and depress the market price of ourcommon stock.
Our amended and restated certificate of incorporation, amended and restated bylaws and Delaware law contain or will containprovisions that could have the effect of rendering more difficult, delaying or preventing an acquisition deemed undesirable by our board ofdirectors. Among others, our amended and restated certificate of incorporation and amended and restated bylaws will include the followingprovisions:
• limitations on convening special stockholder meetings, which could make it difficult for our stockholders to adopt desiredgovernance changes;
• advance notice procedures, which apply for stockholders to nominate candidates for election as directors or to bring matters beforean annual meeting of stockholders;
• a prohibition on stockholder action by written consent, which means that our stockholders will only be able to take action at ameeting of stockholders;
• a forum selection clause, which means certain litigation against us can only be brought in Delaware;
• no authorization of cumulative voting, which limits the ability of minority stockholders to elect director candidates;
• certain amendments to our certificate of incorporation will require the approval of two-thirds of the then outstanding voting power ofour capital stock;
• our bylaws will provide that the affirmative vote of two-thirds of the then-outstanding voting power of our capital stock, voting as asingle class, is required for stockholders to amend or adopt any provision of our bylaws; and
• the authorization of undesignated or “blank check” preferred stock, the terms of which may be established and shares of which maybe issued without further action by our stockholders.
52

Table of Contents
These provisions, alone or together, could delay or prevent hostile takeovers and changes in control or changes in our management.As a Delaware corporation, we are also subject to provisions of Delaware law, including Section 203 of the Delaware General CorporationLaw (the “DGCL”), which prevents interested stockholders, such as certain stockholders holding more than 15% of our outstanding commonstock from engaging in certain business combinations unless (i) prior to the time such stockholder became an interested stockholder, theboard approved the transaction that resulted in such stockholder becoming an interested stockholder, (ii) upon consummation of thetransaction that resulted in such stockholder becoming an interested stockholder, the interested stockholder owned 85% of the commonstock or (iii) following board approval, the business combination receives the approval of the holders of at least two-thirds of our outstandingcommon stock not held by such interested stockholder.
Any provision of our amended and restated certificate of incorporation, amended and restated bylaws or Delaware law that has theeffect of delaying, preventing or deterring a change in control could limit the opportunity for our stockholders to receive a premium for theirshares of our common stock and could also affect the price that some investors are willing to pay for our common stock.
Our amended and restated certificate of incorporation will provide that the Court of Chancery of the State of Delaware will be thesole and exclusive forum for substantially all disputes between us and our stockholders, and federal district courts will be the soleand exclusive forum for Securities Act claims, which could limit our stockholders’ ability to obtain a favorable judicial forum fordisputes with us or our directors, officers or employees.
Our amended and restated certificate of incorporation will provide that, unless we consent to the selection of an alternative forum, theCourt of Chancery of the State of Delaware is the sole and exclusive forum for: (a) any derivative action or proceeding brought on our behalf;(b) any action asserting a claim of breach of fiduciary duty owed by any of our directors, officers or other employees to us or to ourstockholders; (c) any action asserting a claim arising pursuant to the DGCL, our amended and restated certificate of incorporation oramended bylaws, or as to which the DGCL confers exclusive jurisdiction on the Court of Chancery of the State of Delaware; or (d) any actionasserting a claim governed by the internal affairs doctrine; provided that the exclusive forum provisions will not apply to suits brought toenforce any liability or duty created by Exchange Act or to any claim for which the federal courts have exclusive jurisdiction. Our amendedand restated certificate of incorporation will further provide that, unless we consent in writing to the selection of an alternative forum, thefederal district courts are the sole and exclusive forum for the resolution of any complaint asserting a cause of action arising under theSecurities Act, subject to a final adjudication in the State of Delaware of the enforceability of such exclusive forum provision. The choice offorum provisions may limit a stockholder’s ability to bring a claim in a judicial forum that it finds favorable for disputes with us or our directors,officers or other employees, which may discourage such lawsuits against us and our directors, officers and other employees. Alternatively, ifa court were to find the choice of forum provisions contained in our amended and restated certificate of incorporation to be inapplicable orunenforceable in an action, we may incur additional costs associated with resolving such action in other jurisdictions, which could harm ourbusiness, financial condition and results of operations.
An active trading market for our common stock may never develop or be sustained.
Although the shares of our common stock will be authorized for trading on Nasdaq, an active trading market for our common stockmay not develop on that exchange or elsewhere or, if developed, that market may not be sustained. If an active trading market for ourcommon stock does not develop or is not maintained, the liquidity of our common stock, your ability to sell your shares of our common stockwhen desired and the prices that you may obtain for your shares of common stock will be adversely affected.
53

Table of Contents
If securities analysts do not publish research or reports about our company, or if they issue unfavorable commentary about us orour industry or downgrade our common stock, the price of our common stock could decline.
The trading market for our common stock will depend in part on the research and reports that third-party securities analysts publishabout our company and our industry. We may be unable to attract research coverage and if one or more analysts cease coverage of ourcompany, we could lose visibility in the market. In addition, one or more of these analysts could downgrade our common stock or issue othernegative commentary about our company or our industry. As a result of one or more of these factors, the trading price of our common stockcould decline.
If our operating and financial performance in any given period does not meet the guidance that we provide to the public, the marketprice of our common stock may decline.
We may, but are not obligated to, provide public guidance on our expected operating and financial results for future periods. Any suchguidance will be comprised of forward-looking statements subject to the risks and uncertainties described in this prospectus and in our otherpublic filings and public statements. Our actual results may not always be in line with or exceed any guidance we have provided, especially intimes of economic uncertainty. If, in the future, our operating or financial results for a particular period do not meet any guidance we provideor the expectations of investment analysts, or if we reduce our guidance for future periods, the market price of our common stock maydecline. Even if we do issue public guidance, there can be no assurance that we will continue to do so in the future.
Investors in this offering will experience immediate and substantial dilution of $16.47 per share.
Purchasers of our common stock in this offering will experience immediate and substantial dilution of $16.47 per share in the asadjusted net tangible book value per share of common stock from the initial public offering price, and our as adjusted net tangible book valueas of March 31, 2020 after giving effect to this offering would be $5.53 per share. This dilution is due in large part to earlier investors havingpaid substantially less than the initial public offering price when they purchased their shares. See “Dilution.”
54

Table of Contents
CAUTIONARY NOTE REGARDING FORWARD-LOOKING STATEMENTS
This prospectus contains forward-looking statements. All statements other than statements of historical facts contained in thisprospectus may be forward-looking statements. Statements regarding our future results of operations and financial position, businessstrategy and plans and objectives of management for future operations, including, among others, statements regarding the offering, liquidity,growth and profitability strategies and factors and trends affecting our business are forward-looking statements. In some cases, you canidentify forward-looking statements by terms such as “may,” “will,” “should,” “expects,” “plans,” “anticipates,” “could,” “intends,” “targets,”“projects,” “contemplates,” “believes,” “estimates,” “predicts,” “potential” or “continue” or the negative of these terms or other similarexpressions.
The forward-looking statements in this prospectus are only predictions. We have based these forward-looking statements largely onour current expectations and projections about future events and financial trends that we believe may affect our business, financial conditionand results of operations. Forward-looking statements involve known and unknown risks, uncertainties and other important factors that maycause our actual results, performance or achievements to be materially different from any future results, performance or achievementsexpressed or implied by the forward-looking statements. We believe that these factors include, but are not limited to, the factors set forthunder “Risk Factors.” Because forward-looking statements are inherently subject to risks and uncertainties, some of which cannot bepredicted or quantified, such as the developing situation related to, and uncertainty caused by, the COVID-19 pandemic, you should not relyon these forward-looking statements as predictions of future events. The events and circumstances reflected in our forward-lookingstatements may not be achieved or occur and actual results could differ materially from those projected in the forward-looking statements.
In addition, statements that “we believe” and similar statements reflect our beliefs and opinions on the relevant subject. Thesestatements are based upon information available to us as of the date of this prospectus, and while we believe such information forms areasonable basis for such statements, such information may be limited or incomplete, and our statements should not be read to indicate thatwe have conducted an exhaustive inquiry into, or review of, all potentially available relevant information. These statements are inherentlyuncertain and investors are cautioned not to unduly rely upon these statements.
You should read this prospectus and the documents that we reference in this prospectus and have filed as exhibits to the registrationstatement of which this prospectus forms a part with the understanding that our actual future results, levels of activity, performance andachievements may be materially different from what we expect. We qualify all of our forward-looking statements by these cautionarystatements.
These forward-looking statements speak only as of the date of this prospectus. Except as required by applicable law, we do not planto publicly update or revise any forward-looking statements contained in this prospectus after we distribute this prospectus, whether as aresult of any new information, future events or otherwise.
55

Table of Contents
MARKET AND INDUSTRY DATA
This prospectus includes estimates regarding market and industry data. Unless otherwise indicated, information concerning ourindustry and the markets in which we operate, including our general expectations, market position, market opportunity and market size, arebased on our management’s knowledge and experience in the markets in which we operate, together with currently available informationobtained from various sources, including publicly available information, industry reports and publications, surveys, our customers, trade andbusiness organizations and other contacts in the markets in which we operate. Certain information is based on management estimates,which have been derived from third-party sources, as well as data from our internal research, and are based on certain assumptions that webelieve to be reasonable.
In presenting this information, we have made certain assumptions that we believe to be reasonable based on such data and othersimilar sources and on our knowledge of, and our experience to date in, the markets in which we operate. While we believe the estimatedmarket and industry data included in this prospectus are generally reliable, such information, which is derived in part from management’sestimates and beliefs, is inherently uncertain and imprecise, and you are cautioned not to give undue weight to such estimates. Market andindustry data are subject to change and may be limited by the availability of raw data, the voluntary nature of the data gathering process andother limitations inherent in any statistical survey of such data. In addition, projections, assumptions and estimates of the future performanceof the markets in which we operate are necessarily subject to uncertainty and risk due to a variety of factors, including those described in“Risk Factors” and “Cautionary Note Regarding Forward-Looking Statements.” These and other factors could cause results to differmaterially from those expressed in the estimates made by third parties and by us. Accordingly, you are cautioned not to place undue relianceon such market and industry data or any other such estimates. The content of, or accessibility through, the sources and websites identifiedherein, except to the extent specifically set forth in this prospectus, does not constitute a part of this prospectus and are not incorporatedherein and any websites are an inactive textual reference only.
“Net Promoter Score,” or “NPS,” refers to our net promoter score, which can range from a low of negative 100 to a high of positive100, that we use to gauge customer satisfaction. NPS benchmarks can vary significantly by industry, but a score greater than zerorepresents a company having more promoters than detractors. Our methodology of calculating NPS reflects responses from customers whopurchase or sell vehicles and products from us and choose to respond to a survey question upon completion of their purchase or sale. Inparticular, it reflects responses given between March 1, 2020 and March 31, 2020, and reflects a sample size of 1,409 responses over thatperiod. NPS gives no weight to customers who decline to answer the survey question.
Certain monetary amounts, percentages and other figures included in this prospectus have been subject to rounding adjustments.Certain other amounts that appear in this prospectus may not sum due to rounding.
56

Table of Contents
USE OF PROCEEDS
We estimate that the net proceeds from the sale of shares of our common stock in this offering will be approximately $431.5 million (orapproximately $497.2 million if the underwriters exercise their over-allotment option to purchase additional shares of our common stock infull), after deducting the underwriting discount and estimated offering expenses payable by us.
We intend to use the net proceeds from this offering for general corporate purposes, including advertising and marketing, technologydevelopment, working capital, operating expenses and capital expenditures. We may also use a portion of the net proceeds to acquire orinvest in businesses, products, services or technologies; however, we do not have any agreements or commitments for any materialacquisitions or investments at this time.
57

Table of Contents
CAPITALIZATION
The following table sets forth our cash and cash equivalents and capitalization as of March 31, 2020, as follows:
• on an actual basis;
• on a pro forma basis to give effect to (i) the Automatic Conversion, (ii) the Forward Stock Split and (iii) the filing and effectiveness of
our amended and restated certificate of incorporation and the adoption of our amended and restated bylaws upon the closing of thisoffering, in each case as if such event had occurred on March 31, 2020; and
• on a pro forma as adjusted basis to give effect to the adjustments described in the preceding clause and to reflect the issuance and
sale of common stock in this offering, after deducting the underwriting discount and estimated offering expenses payable by us, andthe application of the net proceeds therefrom as described under “Use of Proceeds.”
You should read this information in conjunction with our consolidated financial statements and the related notes included elsewhere inthis prospectus and the “Selected Consolidated Financial and Other Data” and “Management’s Discussion and Analysis of FinancialCondition and Results of Operations” section and other financial information contained in this prospectus.
As of March 31, 2020
(unaudited)
(in thousands, except share and per share data) Actual Pro forma Pro forma as
adjusted Cash and cash equivalents $ 169,842 $ 169,842 $ 601,329
Indebtedness: Vehicle Floorplan Facility1 $ 165,166 $ 165,166 $ 165,166 Long-term debt 282 282 282 Redeemable convertible preferred stock, $0.001 par value; 43,061,682 shares authorized,
actual; 42,766,697 shares issued and outstanding, actual; no shares authorized, proforma; no shares issued and outstanding, pro forma; no shares authorized, pro forma asadjusted; no shares issued and outstanding, pro forma as adjusted 901,046 — —
Total equity: Stockholders’ equity: Common Stock, $0.001 par value; 56,721,927 shares authorized, actual; 4,226,848 shares
issued and outstanding, actual; 500,000,000 shares authorized, pro forma; 93,987,090shares issued and outstanding, pro forma; 500,000,000 shares authorized, pro forma asadjusted; 115,237,090 shares issued and outstanding, pro forma as adjusted 4 94 115
Preferred stock, $0.001 par value; no shares authorized, issued or outstanding, actual;10,000,000 shares authorized and no shares issued or outstanding, pro forma and proforma as adjusted — — —
Additional paid-in capital — 900,956 1,332,422 Accumulated deficit (616,127) (616,127) (616,127)
Total stockholders’ (deficit) equity (616,123) 284,923 716,410
Total capitalization $ 450,371 $ 450,371 $ 881,858
1 In March 2020, we entered into a new 2020 Vehicle Floorplan Facility that provides a committed credit line of up to $450.0 million. Approximately $141.3 million was
available under the 2020 Vehicle Floorplan Facility as of March 31, 2020.
58

Table of Contents
DIVIDEND POLICY
We have never declared or paid any cash dividends on our capital stock. We currently intend to retain all available funds and anyfuture earnings to fund the development and growth of our business, and therefore we do not anticipate declaring or paying any cashdividends on our common stock in the foreseeable future. Any future determination as to the declaration and payment of dividends, if any, willbe at the discretion of our board of directors, subject to applicable laws, and will depend on a number of factors, including our businessprospects, results of operations, financial condition, cash requirements and availability, debt repayment obligations, capital expenditureneeds, contractual restrictions, covenants in the agreements governing our current and future indebtedness, industry trends, the provisions ofDelaware law affecting the payment of dividends and distributions to stockholders and any other factors or considerations our board ofdirectors may regard as relevant.
Our ability to pay dividends may also be restricted by the terms of any credit agreement or any future debt or preferred equitysecurities of us or our subsidiaries. Accordingly, you may need to sell your shares of our common stock to realize a return on yourinvestment, and you may not be able to sell your shares at or above the price you paid for them. See “Risk Factors—Risks Relating to thisOffering and Ownership of Our Common Stock—We do not intend to pay dividends on our common stock for the foreseeable future.”
59

Table of Contents
DILUTION
If you invest in our common stock in this offering, your ownership interest will be immediately diluted to the extent of the differencebetween the initial public offering price per share and the pro forma as adjusted net tangible book value per share of our common stock afterthis offering.
Our pro forma net tangible book value as of March 31, 2020 was $206.3 million, or $2.20 per share. Pro forma net tangible book valueper share is determined by subtracting our total liabilities from the total book value of our tangible assets and dividing the difference by thenumber of shares of common stock deemed to be outstanding, after giving effect to (i) the Automatic Conversion, (ii) the Forward Stock Splitand (iii) the filing and effectiveness of our amended and restated certificate of incorporation and the adoption of our amended and restatedbylaws upon the closing of this offering, in each case as if such event had occurred on March 31, 2020.
After giving effect to receipt of the net proceeds from our issuance and sale of 21,250,000 shares of common stock in this offering andafter deducting the underwriting discount and estimated offering expenses payable by us, our pro forma as adjusted net tangible book valueas of March 31, 2020 would have been approximately $637.8 million, or $5.53 per share of common stock. This amount represents animmediate increase in pro forma as adjusted net tangible book value of $3.33 per share to our existing stockholders and an immediatedilution in pro forma as adjusted net tangible book value of approximately $16.47 per share to new investors purchasing shares of ourcommon stock in this offering. We determine dilution by subtracting the pro forma as adjusted net tangible book value per share after thisoffering from the estimated offering price that a new investor will pay for a share of common stock. The following table illustrates this dilution: Initial public offering price per share $22.00
Pro forma net tangible book value per share as of March 31, 2020 before this offering $2.20 Increase in pro forma as adjusted net tangible book value per share attributable to investors in this offering $3.33
Pro forma as adjusted net tangible book value per share after this offering $ 5.53
Dilution in pro forma as adjusted net tangible book value per share to new common stock investors in this offering $16.47
If the underwriters exercise their over-allotment option in full, the pro forma as adjusted net tangible book value after the offeringwould be $5.94 per share, the increase in pro forma as adjusted net tangible book value per share to existing stockholders would be $3.74per share and the dilution in pro forma as adjusted net tangible book value to new investors would be $16.06 per share, after deducting theunderwriting discount and the estimated offering expenses payable by us.
60

Table of Contents
The following table summarizes, as of March 31, 2020, after giving effect to this offering, the number of shares of common stockpurchasable from us, the total consideration payable, or to be paid, to us and the average price per share payable, or to be paid, by existingstockholders and by the new investors. The calculation below is based on the initial public offering price of $22.00 per share before deductingthe underwriting discount and estimated offering expenses payable by us. Shares Purchased Total Consideration
Average Price
per Share Number Percent Amount Percent (in millions) Existing stockholders 93,987,090 81.6% $ 731.2 61.0% $ 7.78 New investors 21,250,000 18.4 467.5 39.0 22.00
Total 115,237,090 100.0% $ 1,198.7 100.0%
Except as otherwise indicated, the discussion and the tables above assume no exercise of the underwriters’ over-allotment option topurchase additional shares of common stock. The number of shares of our common stock outstanding after this offering as shown in thetables above is based on the number of shares outstanding as of March 31, 2020, after giving effect to (i) the Automatic Conversion (ii) theForward Stock Split and (iii) the filing and effectiveness of our amended and restated certificate of incorporation and the adoption of ouramended and restated bylaws upon the closing of this offering, in each case as if such event had occurred on March 31, 2020, and excludesthe following:
• 3,019,108 shares of common stock reserved for future grant or issuance under our 2020 Plan;
• the exercise of warrants to purchase 161,136 shares of common stock, which will result in the net issuance of 155,862 shares ofcommon stock in connection with this offering;
• 589,970 shares of common stock issuable upon the exercise of warrants outstanding as of March 31, 2020 with an exercise priceof $8.53 per share;
• 6,198,676 shares of common stock issuable upon the exercise of options outstanding as of March 31, 2020, having a weightedaverage exercise price of $4.37 per share;
• 978,060 shares of common stock issuable upon settlement of restricted stock units outstanding as of March 31, 2020, having aweighted average grant date fair value of $7.80 per share;
• 1,463,346 shares of our common stock subject to restricted stock units granted after March 31, 2020;
• 3,249,382 shares of common stock issuable upon settlement of restricted stock awards outstanding as of March 31, 2020; and
• the issuance of 183,870 shares of common stock in connection with the entrance into the RA Agreement (as defined in “Business—Our Marketing”) occurring after March 31, 2020.
To the extent any of these outstanding options are exercised or restricted stock units are settled, there will be further dilution to newinvestors.
If the underwriters exercise their over-allotment option to purchase additional shares of common stock from us in full:
• the percentage of shares of our common stock held by the existing stockholders will decrease to approximately 79.4% of the totalnumber of shares of our common stock outstanding after this offering; and
• the number of shares held by new investors will increase to approximately 20.6% of the total number of shares of our commonstock outstanding after this offering.
61

Table of Contents
SELECTED CONSOLIDATED FINANCIAL AND OTHER DATA
The following tables present our selected consolidated financial and other data. We have derived the selected consolidatedstatements of operations data for the years ended December 31, 2018 and 2019 and the consolidated balance sheet data as ofDecember 31, 2018 and 2019 from our consolidated financial statements included elsewhere in this prospectus. The selected statements ofoperations data presented below for the three months ended March 31, 2020 and 2019 and the selected consolidated balance sheet data asof March 31, 2020 have been derived from our unaudited condensed consolidated financial statements included elsewhere in this prospectusand have been prepared on a consistent basis as our audited consolidated financial statements. In the opinion of management, theunaudited data reflects all adjustments, consisting only of normal recurring adjustments, necessary for the fair statement of the financialinformation in those statements. Our historical results are not necessarily indicative of the results that may be expected in the future. Youshould read the following selected consolidated financial and other data together with the information under the sections titled “Use ofProceeds,” “Capitalization,” “Management’s Discussion and Analysis of Financial Condition and Results of Operations,” and our consolidatedfinancial statements and related notes included elsewhere in this prospectus.
Year Ended
December 31, Three Months
Ended March 31 2018 2019 2019 2020 (unaudited) (in thousands, except share and per share data) Total revenue $ 855,429 $ 1,191,821 $ 235,059 $ 375,772 Cost of sales 794,622 1,133,962 223,047 357,385
Total gross profit 60,807 57,859 12,012 18,387 Selling, general and administrative expenses 133,842 184,988 36,583 58,380 Depreciation and amortization 6,857 6,019 1,533 966
Loss from operations (79,892) (133,148) (26,104) (40,959) Interest expense 8,513 14,596 2,718 2,826 Interest income (3,135) (5,607) (1,849) (1,956) Other (income) expense, net (321) 673 63 (823)
Loss before provision for income taxes (84,949) (142,810) (27,036) (41,006) Provision for income taxes 229 168 103 53
Net loss $ (85,178) $ (142,978) $ (27,139) $ (41,059)
Accretion of redeemable convertible preferred stock (13,036) (132,750) (17,964) —
Net loss attributable to common stockholders $ (98,214) $ (275,728) $ (45,103) $ (41,059)
Net loss per share attributable to common stockholders, basic anddiluted(1) $ (23.00) $ (64.08) $ (10.51) $ (9.69)
Weighted-average number of shares outstanding used to compute netloss per share attributable to common stockholders, basic anddiluted(1) 4,270,389 4,302,981 4,289,415 4,235,728
Pro forma net loss per share attributable to common stockholders,basic and diluted (unaudited)(1) $ (1.55) $ (0.44)
Pro forma weighted average shares used in computing pro forma netloss per share attributable to common stockholders, basic anddiluted (unaudited)(1) 92,174,590 94,004,850
62

Table of Contents
As of
December 31, As of
March 31, 2018 2019 2020 (in thousands) (unaudited) Cash and cash equivalents $ 161,656 $ 217,734 $ 169,842 Total assets 392,844 563,387 547,083 Long-term debt 24,431 316 282 Total liabilities 170,610 262,907 262,160 Total redeemable convertible preferred stock 519,100 874,332 901,046 Total stockholders’ deficit (296,866) (573,852) (616,123)
As of March 31, 2020
(unaudited)
Actual Pro Forma(2) Pro Forma As
Adjusted(3) (in thousands) Cash and cash equivalents $ 169,842 $ 169,842 $ 601,329 Total assets 547,083 547,083 978,570 Total liabilities 262,160 262,160 262,160 Total redeemable convertible preferred stock 901,046 — — Total stockholders’ (deficit) equity (616,123) 284,923 716,410 (1) See Note 17 to our consolidated financial statements included elsewhere in this prospectus for an explanation of the calculations of our net loss per share attributable to
common stockholders, basic and diluted, and unaudited pro forma net loss per share attributable to common stockholders, basic and diluted for the year endedDecember 31, 2019 and the three months ended March 31, 2020.
(2) The unaudited pro forma consolidated balance sheet data as of March 31, 2020 presents our consolidated balance sheet data to give effect to (i) the AutomaticConversion, (ii) the Forward Stock Split and (iii) the filing and effectiveness of our amended and restated certificate of incorporation and the adoption of our amended andrestated bylaws upon the closing of this offering, in each case as if such event had occurred on March 31, 2020.
(3) The unaudited pro forma as adjusted consolidated balance sheet data reflects the items described in footnote (2) above and gives effect to our receipt of estimated netproceeds from the sale of shares of common stock that we are offering by this prospectus, after deducting the underwriting discounts and estimated offering expensespayable by us.
Year Ended
December 31, Three Months Ended
March 31, 2018 2019 2019 2020 Key Operating and Financial Metrics:(a) Ecommerce units sold 10,006 18,945 3,187 7,930
Vehicle Gross Profit per ecommerce unit $ 1,666 $ 1,109 $ 1,421 $ 845 Product Gross Profit per ecommerce unit 576 587 385 954
Total Gross Profit per ecommerce unit $ 2,242 $ 1,696 $ 1,806 $ 1,799
Average monthly unique visitors 291,772 653,216 411,489 947,014 Vehicles available for sale 3,421 4,956 2,963 5,107 Ecommerce average days to sale 59 68 64 68 (a) See “Management’s Discussion and Analysis of Financial Condition and Results of Operations—Key Operating and Financial Metrics” for information on how we define
these key operating and financial metrics.
63

Table of Contents
MANAGEMENT’S DISCUSSION AND ANALYSIS OF FINANCIAL CONDITION AND RESULTS OF OPERATIONS
The following discussion and analysis of our financial condition and results of operations should be read in conjunction with thesections titled “Selected Consolidated Financial and Other Data” and our financial statements and related notes and other informationincluded elsewhere in this prospectus. This discussion contains forward-looking statements that involve risks and uncertainties. Our actualresults could differ materially from such forward-looking statements. Factors that could cause or contribute to those differences include, butare not limited to, those identified below and those discussed in the sections titled “Risk Factors” and “Cautionary Note RegardingForward-Looking Statements” included elsewhere in this prospectus. Additionally, our historical results are not necessarily indicative of theresults that may be expected for any period in the future.
Overview
Vroom is an innovative, end-to-end ecommerce platform that is transforming the used vehicle industry by offering a better way to buyand a better way to sell used vehicles. We are deeply committed to creating an exceptional experience for our customers.
We are driving enduring change in the industry on a national scale. We take a vertically integrated, asset-light approach that isreinventing all phases of the vehicle buying and selling process, from discovery to delivery and everything in between. Our platformencompasses:
• Ecommerce: We offer an exceptional ecommerce experience for our customers. In contrast to legacy dealerships and thepeer-to-peer market, we provide consumers with a personalized and intuitive ecommerce interface to research and select fromthousands of fully reconditioned vehicles. Our platform is accessible at any time on any device and provides transparent pricing,real-time financing and nationwide contact-free delivery right to a buyer’s driveway. For consumers looking to sell or trade in theirvehicles, we provide attractive market-based pricing, real-time, guaranteed purchase offers and convenient, contact-free at-homevehicle pick-up.
• Vehicle Operations: Our scalable and vertically integrated operations underpin our business model. We strategically sourceinventory from auctions, consumers, rental car companies and dealers. We improve our ability to acquire high-demand vehiclesthrough enhanced supply science across all our sourcing channels and we are expanding our national marketing efforts to driveconsumer sourcing. In our reconditioning and logistics operations, we deploy an asset-light strategy that optimizes a combination ofownership and operation of assets by us with strategic third-party partnerships. This hybrid approach provides flexibility, agility andspeed without taking on unnecessary risk and capital investment, and drives improved unit economics and operating leverage.
• Data Science and Experimentation: Data science and experimentation are at the core of everything we do. We rely on datascience, machine learning and A/B and multivariate testing to continually drive optimization and operating leverage across ourecommerce and vehicle operations. We leverage data to increase the effectiveness of our national brand and performancemarketing, enhance the customer experience, analyze market dynamics at scale, calibrate our vehicle pricing and optimize ouroverall inventory sales velocity. On the operations side, data science and experimentation enables us to fine tune our supply,sourcing and logistics models and to streamline our reconditioning processes.
The U.S. used automotive market is the largest consumer product category, generating approximately $841 billion from sales ofapproximately 40 million units in 2019. The industry is highly fragmented with over 42,000 dealers and millions of peer-to-peer transactions. Italso is ripe for
64

Table of Contents
disruption as an industry that is notorious for consumer dissatisfaction and has one of the lowest levels of ecommerce penetration at only0.9%. Industry reports estimate that ecommerce penetration will grow to as much as half of all used vehicle sales by 2030. Our platform,coupled with our national presence and brand, provides a significant competitive advantage versus local dealerships and regional playersthat lack nationwide reach and scalable technology, operations and logistics. The traditional auto dealers and peer-to-peer market do not andcannot offer consumers what we offer.
In December 2015, we acquired Houston-based Texas Direct Auto, or TDA, which included our proprietary vehicle reconditioningcenter or Vroom VRC, our sole physical retail location and our Sell Us Your Car® centers. From the launch of our combined operations inJanuary 2016, our business has grown significantly as we have scaled our operations, developed our ecommerce platform and leveraged thenetwork effects inherent in our model. Our ecommerce revenue grew at a 77.0% compound annual growth rate, or CAGR, from 2016 to2019, including year-over-year growth of 95.3% from 2018 to 2019.
Ecommerce Revenue
For the year ended December 31, 2019, we generated $1.2 billion in total revenue, representing a 39.3% increase over $855.4 millionfor the year ended December 31, 2018. For the three months ended March 31, 2020, we generated $375.8 million in total revenue,representing a 59.9% increase over $235.1 million for the three months ended March 31, 2019. Our business generated a net loss of$85.2 million, $143.0 million, $27.1 million and $41.1 million for the years ended December 31, 2018 and 2019, and for the three monthsended March 31, 2019 and 2020, respectively. We intend to continue to invest in growth to scale our company responsibly and drive towardsprofitability.
Our Model
We generate revenue through the sale of used vehicles and value-added products. We sell vehicles directly to consumers primarilythrough our Ecommerce segment. As the largest segment in our business, Ecommerce revenue grew 95.3% from 2018 to 2019 and 159.5%from the three months ended March 31, 2019 to the three months ended March 31, 2020, and we expect Ecommerce to continue to outgrowour other segments as it is the core focus of our growth strategy.
We also sell vehicles through wholesale auctions, which provide a revenue source for vehicles that do not meet our Vroom retail salescriteria. Additionally, we generate revenue through the retail sale of used vehicles and value-added products at TDA. For the year endedDecember 31, 2019, our Ecommerce, TDA and Wholesale segments represented 49.3%, 32.8% and 17.9% of our total revenue,respectively. For the three months ended March 31, 2020, our Ecommerce, TDA and Wholesale segments represented 62.0%, 23.2% and14.8% of our total revenue, respectively.
65

Table of Contents
Our retail gross profit consists of two components: Vehicle Gross Profit and Product Gross Profit. Vehicle Gross Profit is calculated asthe aggregate retail sales price for all vehicles sold to customers along with delivery fee revenue and document fees received fromcustomers, less the aggregate cost to acquire such vehicles, the aggregate cost of inbound transportation for such vehicles to our vehiclereconditioning centers, which we refer to as VRCs, and the aggregate cost of reconditioning such vehicles for sale. Product Gross Profitconsists of fees earned on any value-added products sold as part of a vehicle sale. Because we are paid fees on the value-added productswe sell, our gross profit on such products is equal to the revenue we generate. See “—Key Operating and Financial Metrics.”
Below is an explanation of how we calculate vehicle gross profit per unit and product gross profit per unit:
Our profitability depends primarily on increasing unit sales and operating leverage, as well as improving unit economics. We deploy anasset-light strategy that optimizes a combination of ownership and operation of assets by us with strategic third-party partnerships. Ourhybrid approach also applies to the third-party value-added products we sell to customers, which enables us to generate additional revenuestreams without taking on the risk associated with underwriting vehicle financing or protection products. As we scale, we expect to benefitfrom efficiencies and operating leverage across our business, including our marketing and technology investments, and our inventoryprocurement, logistics, reconditioning and sales processes.
Inventory Sourcing
We source our vehicle inventory from a variety of channels, including auctions, consumers, rental car companies and dealers.Because the quality of vehicles and associated gross margin profile vary across each channel, the mix of inventory sources has an impact onour profitability. We continually evaluate the optimal mix of sourcing channels to generate the highest sales margins and shortest inventoryturns, both of which contribute to increased gross profit per unit. We generate a vast set of data derived from market demand, pricingdynamics, vehicle acquisitions and subsequent sales, and we leverage that data to optimize future vehicle acquisitions. As we scale, weexpect to continue to leverage the data at our disposal to optimize and enhance the volume and selection of vehicles in our inventory and, inturn, drive revenue growth and profitability. We also intend to pursue third party inventory listings that will expand our sourcing channelsthrough third party sellers while offering us attractive revenue models in an asset light, debt free structure. See “—Key Factors and TrendsAffecting our Operating Results—Ability to drive growth by cost effectively increasing the volume and selection of vehicles in our inventory.”
66

Table of Contents
Vehicle Reconditioning
Before a vehicle is listed for retail sale on our platform, it undergoes a thorough reconditioning process in order to meet our Vroomretail sales criteria. The efficiency of this reconditioning process is a key element in our ability to profitably grow. To recondition vehicles, werely on a combination of our Vroom VRC along with a network of VRCs owned and operated by third parties. We intend to continue to expandour network of third-party VRCs and going forward intend to make capital investments in additional Vroom VRCs. Utilizing this hybridapproach, we have increased our total reconditioning capacity from 235 units per day as of March 31, 2019, to 326 units per day as of March31, 2020, including an increase from 95 units per day to 186 units per day at our third-party VRCs. As we increase the number of vehicles inour inventory and expand our reconditioning capacity, we expect that reconditioning costs per unit will decrease as we benefit fromeconomies of scale and operating leverage in reconditioning costs. See “—Key Factors and Trends Affecting our Operating Results—Abilityto expand and optimize our reconditioning capacity to satisfy increasing demand.”
Logistics Network
For our logistics operations, we primarily use third-party carriers and are developing a hybrid strategy to build out our proprietarylogistics network. Our strategic carrier arrangements with national haulers allows us to efficiently deliver vehicles to customers throughout theUnited States while focusing on expanding other critical components of our business, such as the volume and selection of vehicles in ourinventory. This strategy enhances the flexibility, agility and speed of our growth while reducing the need for additional capital commitments aswe scale. As we leverage the experience and data at our disposal from the tens of thousands of deliveries we have completed, we regularlyfind ways to enhance the efficiencies in our logistics network. In addition, by strategically partnering with third party carriers with widelydispersed locations, we are able to quickly expand our last mile delivery hubs and enhance our customer experience. See “—Key Factorsand Trends Affecting our Operating Results—Ability to expand and develop our logistics network.”
Value-Added Products
We generate revenue by earning fees for selling value-added products to customers in connection with vehicle sales. Currently, ourthird-party value-added product offering consists of finance and protection products, including financing from third-party lenders for ourcustomers’ vehicle purchases, as well as sales of extended warranty contracts, GAP protection and wheel and tire coverage. As we scale ourbusiness, we intend to introduce additional value-added products that will be attractive to our customers and drive revenue and profitabilitygrowth. We expect that both expanded product offerings and increased attachment rates in value-added product sales will have a positiveimpact on our profitability. See “—Key Factors and Trends Affecting our Operating Results—Ability to increase and better monetize value-added products.”
Our Segments
We manage and report operating results through three reportable segments:
• Ecommerce (49.3% of 2019 revenue; 62.0% of quarter ended March 31, 2020 revenue): The Ecommerce segment represents
retail sales of used vehicles through our ecommerce platform and fees earned on sales of value-added products associated withthose vehicle sales.
• TDA (32.8% of 2019 revenue; 23.2% of quarter ended March 31, 2020 revenue): The TDA segment represents retail sales of usedvehicles from TDA and fees earned on sales of value-added products associated with those vehicle sales.
• Wholesale (17.9% of 2019 revenue; 14.8% of quarter ended March 31, 2020 revenue): The Wholesale segment represents salesof used vehicles through wholesale auctions.
67

Table of Contents
Gross profit is defined as revenue less cost of sales for each segment. Reflected below is a summary of reportable segment revenueand reportable segment gross profit for the years ended December 31, 2018 and 2019 and for the three months ended March 31, 2019 and2020:
For the Year Ended
December 31, Three Months Ended
March 31, 2018 2019 2019 2020 (in thousands) (in thousands) (unaudited) Revenue:
Ecommerce $ 301,172 $ 588,114 $ 89,855 $ 233,172 TDA 379,743 390,243 93,085 87,022 Wholesale 174,514 213,464 52,119 55,578
Total revenue $ 855,429 $ 1,191,821 $ 235,059 $ 375,772
Gross profit: Ecommerce $ 22,425 $ 32,127 $ 5,754 $ 14,267 TDA 35,125 25,392 6,077 5,412 Wholesale 3,257 340 181 (1,292)
Total gross profit $ 60,807 $ 57,859 $ 12,012 $ 18,387
Key Operating and Financial Metrics
We regularly review a number of metrics, including the following key operating and financial metrics, to evaluate our business,measure our performance, identify trends in our business, prepare financial forecasts and make strategic decisions. We believe theseoperational measures are useful in evaluating our performance, in addition to our financial results prepared in accordance with U.S.Generally Accepted Accounting Principles, or GAAP. You should read the key operating and financial metrics in conjunction with the followingdiscussion of our results of operations and together with our consolidated financial statements and related notes included elsewhere in thisprospectus. We focus heavily on metrics related to unit economics as improved gross profit per unit is a key element of our growth andprofitability strategies.
The calculation of our key operating and financial metrics is straightforward and does not rely on significant projections, estimates orassumptions. Nevertheless, each of our key operating and financial metrics has limitations because each focuses specifically on only onestandard by which to evaluate our business, without taking into account other applicable standards, performance measures or operatingtrends by which our business could be evaluated. Accordingly, no single metric should be viewed as the bellwether by which our businessshould be measured. Rather, each key operating and financial metric should be considered in conjunction with other metrics and componentsof our results of operations, such as each of the other key operating and financial metrics and our revenues, inventory, loss from operationsand segment results.
Year Ended
December 31, Three Months Ended
March 31, 2018 2019 2019 2020 Ecommerce units sold 10,006 18,945 3,187 7,930
Vehicle Gross Profit per ecommerce unit $ 1,666 $ 1,109 $ 1,421 $ 845 Product Gross Profit per ecommerce unit 576 587 385 954
Total Gross Profit per ecommerce unit $ 2,242 $ 1,696 $ 1,806 $ 1,799
Average monthly unique visitors 291,772 653,216 411,489 947,014 Vehicles available for sale 3,421 4,956 2,963 5,107 Ecommerce average days to sale 59 68 64 68
68

Table of Contents
Ecommerce Units Sold
Ecommerce units sold is defined as the number of vehicles sold and shipped to customers through our ecommerce platform, net ofreturns under our Vroom 7-Day Return Policy. Ecommerce units sold excludes sales of vehicles through the TDA and Wholesale segments.As we continue to expand our ecommerce business, we expect that ecommerce units sold will be the primary driver of our revenue growth.Additionally, each vehicle sale through our ecommerce platform also creates the opportunity to leverage such sale to sell value-addedproducts. Continued ecommerce growth will also increase the number of trade-in vehicles acquired from our customers, which we can eitherrecondition and add to our inventory or sell at wholesale auctions.
Vehicle Gross Profit per Ecommerce Unit
Vehicle Gross Profit per ecommerce unit, which we refer to as Vehicle GPPU, for a given period is defined as the aggregate retailsales price and delivery charges for all vehicles sold through our Ecommerce segment less the aggregate costs to acquire those vehicles,the aggregate costs of inbound transportation to the VRCs and the aggregate costs of reconditioning those vehicles in that period, divided bythe number of ecommerce units sold in that period. As we continue to expand our ecommerce business, we believe Vehicle GPPU will be akey driver of our long-term profitability.
Product Gross Profit per Ecommerce Unit
Product Gross Profit per ecommerce unit, which we refer to as Product GPPU, for a given period is defined as the aggregate feesearned on sales of value-added products in that period, net of the reserves for chargebacks on such products in that period, divided by thenumber of ecommerce units sold in that period. Because we are paid fees on the value-added products we sell, our gross profit is equal tothe revenue we generate from the sale of value added products. We plan to continue to increase the attachment rates of value-addedproducts and expand our offerings of value-added products which will grow our Product GPPU.
Total Gross Profit per Ecommerce Unit
Total Gross Profit per ecommerce unit, which we refer to as Total GPPU, for a given period is calculated as the sum of Vehicle GPPUand Product GPPU. We view Total GPPU as a key metric of the profitability of our Ecommerce segment.
Average Monthly Unique Visitors
Average monthly unique visitors is defined as the average number of individuals who access our ecommerce platform within acalendar month. We calculate the average monthly unique visitors over any period by dividing the aggregate monthly unique visitors duringsuch period by the number of months in that period. We use average monthly unique visitors to measure the quality of our customerexperience, the effectiveness of our marketing campaigns and customer acquisition as well as the strength of our brand and marketpenetration.
Average monthly unique visitors is calculated using data provided by Google Analytics. The computation of average monthly uniquevisitors excludes individuals who access our platform multiple times within a calendar month, counting such individuals only one time forpurposes of the calculation. If an individual accesses our ecommerce platform using different devices or different browsers on the samedevice within a given month, the first access through each such device or browser is counted as a separate monthly unique visitor.
69

Table of Contents
Vehicles Available for Sale
We define vehicles available for sale as the aggregate number of vehicles listed for sale on our platform at any given point in time.Vehicles available for sale is a key indicator of our performance because we believe that the number of vehicles listed on our platform is akey driver of vehicle sales and revenue growth. Increasing the number of vehicles listed on our platform results in a greater selection ofvehicles for our customers, creating demand and increasing conversion.
Ecommerce Average Days to Sale
We define ecommerce average days to sale as the average number of days between our acquisition of vehicles and the final deliveryof such vehicles to customers through our ecommerce platform. We calculate average days to sale for a given period by dividing theaggregate number of days between the acquisition of all vehicles sold through our ecommerce platform during such period and final deliveryof such vehicles to customers by the number of ecommerce units sold in that period. Average days to sale excludes vehicles sold through theTDA and Wholesale segments. Average days to sale is an important metric because a reduction in the number of days between theacquisition of a vehicle and the delivery of such vehicle typically results in a higher gross profit per unit.
Impact of COVID-19
During the first quarter of this year, we experienced significant growth in our ecommerce business. Ecommerce units sold andecommerce revenue increased by 149% and 160%, respectively, year over year. Gross profit per unit was consistent during the sameperiods.
In March 2020, the World Health Organization declared a global pandemic related to the rapidly growing outbreak of a novel strain ofcoronavirus known as COVID-19. In the following weeks, many states and counties across the United States responded by implementing anumber of measures designed to prevent its spread, including stay-at-home or shelter-in-place orders, quarantines and closure of all non-essential businesses.
Impact on our operations
The COVID-19 pandemic has rapidly escalated in the United States, creating significant uncertainty and economic disruption, andleading to record levels of unemployment nationally. Due to the evolving nature of the COVID-19 crisis, we continue to monitor the situationclosely and assess the impact on our business. We expect our operations will continue to be adversely impacted throughout 2020, however,the magnitude and duration of the ultimate impact is impossible to predict with certainty due to:
• uncertainties regarding the duration of the COVID-19 pandemic and the length of time over which the disruptions caused byCOVID-19 will continue;
• the impact of governmental orders and regulations that have been, and may in the future be, imposed in response to the pandemic;
• the impact of COVID-19 on VRCs, wholesale auctions, state DMV titling and registration services and other third parties on whichwe rely;
• the deterioration of economic conditions in the United States, as well as record high unemployment levels, which could have anadverse impact on discretionary consumer spending; and
• uncertainly regarding the potential for a “second wave” of the COVID-19 crisis to occur in the future.
70
Table of Contents
Impact on ecommerce operations
The COVID-19 pandemic began to have an impact on our ecommerce operations during the last three weeks of our fiscal quarterended March 31, 2020. Between March 11, 2020 and March 31, 2020, we experienced an approximate 15% decrease in total ecommercerevenue due to a decrease in consumer demand as compared to the 20 days prior to March 11, 2020.
Due to the drop in demand in the early days of the crisis, as well as uncertainty regarding future vehicle pricing in both the retail andwholesale markets, we made the strategic decision to quickly reduce our exposure to inventory risk and floorplan liabilities. Commencing inlate March, we reduced vehicle prices in order to drive vehicle sales and quickly reduce the amount of inventory that was purchased pre-COVID-19. We also paused all vehicle acquisitions other than trade-ins, and we sold at wholesale auctions many units that had not yet beenreconditioned. As a result of these strategic decisions, our total inventory levels went from approximately 8,500 retail and wholesale units asof the beginning of March to approximately 2,500 retail and wholesale units at the end of April. In addition, our inventory floorplan utilizationdeclined from $186.9 million as of March 11, 2020 to $56.7 million as of April 30, 2020.
Due to the inventory price reductions that began in late March, our demand returned to pre-COVID-19 levels, and we experiencedrobust ecommerce vehicle sales; however, those sales were at a greatly reduced gross profit per unit. During April 2020, we sold 2,880ecommerce units and gross profit per unit was approximately $1,236, as compared to the 2,771 units we sold at $1,769 gross profit per unitin March 2020. Due to the significant reduction in our inventory through April 30, 2020, we expect material decreases in future unit sales,revenue and gross profit until we are able to return inventory levels to pre-COVID-19 levels. On April 20, 2020, we began to acquire newinventory, with a primary focus on high-demand models that we believe will convert at target margins. We intend to strategically build ourinventory levels in the near term to return to and ultimately exceed pre-COVID-19 levels.
Impact on our vehicle reconditioning and our logistics network
The COVID-19 pandemic and the actions taken in response have had a significant impact on our VRC operations. During March andthrough April 2020, six of our thirteen third-party VRCs were either partially closed or completely closed, which initially resulted inapproximately 500 vehicles left either with incomplete reconditioning or no reconditioning across these third-party VRCs. As a result of theseclosures at our third-party VRCs, we prioritized the reconditioning of vehicles that were near completion, relocated vehicles to third-partyVRCs that remained open and listed such vehicles for sale, or sold vehicles at wholesale to minimize the risk of price deterioration. We wereable to successfully access and sell most of these stranded vehicles, and only approximately 50 vehicles remain inaccessible as of May 8,2020. Our Vroom VRC continued to operate, although at significantly reduced capacity due to our cessation of vehicle purchases. We beganpurchasing vehicles again on April 20, 2020 and have begun to ramp up our Vroom VRC operations. In addition, as shut-down orders arelifted on a state-by-state basis, we expect our third party VRCs to gradually return to pre-crisis capacity.
We experienced minimal disruption across our logistics network, with only a limited number of third-party providers unavailable todeliver our vehicles and adequate alternative sources remaining available.
Impact on TDA
Commencing on March 24, 2020, counties in the Houston area began to implement stay-at-home or shelter-in-place orders withlimited exceptions for essential businesses. Both TDA and our back-office facility in Houston qualified as essential businesses under therelevant ordinances and remained open. However, as a result of the these orders, we saw a significant reduction in foot traffic that caused usto experience an approximate 43% decrease in unit sales between March 11, 2020 and March 31, 2020 as compared to the 20 days prior toMarch 11, 2020.
71

Table of Contents
Impact on our administrative functions
Most of our corporate, engineering and back office operations have been able to successfully transition to a remote workingenvironment. However, the various shut-down orders have had a significant effect on certain of our back-office functions, such as the titlingand registration of vehicles sold to customers, which has been challenged by the temporary closure of state division of motor vehicle officesacross the United States. As states and counties continue to lift shut-down orders, we expect to regain efficiencies lost as a result of theseclosures.
As a result of these developments, we have experienced an adverse impact on our revenue, gross profit, results of operations andcash flows. The situation is fluid and additional impacts to our business may arise.
Management actions in response to the COVID-19 disruptions
In response to the COVID-19 disruptions, in addition to managing our inventory exposure, we have implemented a number ofmeasures to protect the health and safety of our workforce, proactively reduce operating costs, conserve liquidity and position Vroom toemerge from the current crisis in a healthy financial position. These measures include restrictions on non-essential business travel, theinstitution of work-from-home policies wherever feasible and the implementation of strategies for workplace safety at our facilities that remainopen. We are following the guidance from public health officials and government agencies, including implementation of enhanced cleaningmeasures, social distancing guidelines and wearing of masks. In addition, effective May 3, 2020, approximately one-third of our workforcewas placed on furlough. The majority of employees furloughed were in reconditioning, logistics, acquisitions and TDA sales, which were thepositions most affected by the reduction in unit volume. Furloughed employees remain enrolled in our medical plan through July 31, 2020,and we are paying the current cost of the employee’s portion of the medical plan premiums in addition to the employer portion. However,since we restarted vehicle acquisitions and increased our Vroom VRC operations, as of May 31, 2020, approximately 60% of furloughedemployees have returned to work, primarily those employed in reconditioning, logistics and acquisitions positions. Additionally, we haveinstituted an across-the-board salary reduction for our non-furloughed salaried employees, with our CEO forgoing 30% of his salary, eachmember of our senior leadership team taking a 20% salary reduction, and the balance of the employees experiencing reductions of 5-15%based upon salary levels.
We also have taken measures to reduce operating expenses by negotiating reductions and deferrals in payments to landlords, vehiclelisting sites, service providers and commercial vendors, as well as significantly reducing planned marketing expenditures by approximately$3.5 million through the end of May. We expect to gradually increase marketing expenditures commencing in June.
In addition, we have taken several precautionary measures to enhance our customer experience during the pandemic, such asincreasing the level of cleaning and sanitation of vehicles prior to making delivery to our customers. Additionally, we adjusted our deliveryprotocols to provide contact-free delivery and pick up of vehicles.
While our ecommerce business, including contact-free delivery, is continuing to operate nationwide, the COVID-19 crisis has had asignificant impact on our business operations. We are unable to accurately predict the ultimate impact that the COVID-19 disruptions willhave on our business and financial results going forward due to the uncertainties surrounding the extent, duration and risk of recurrence ofsuch disruptions. Nevertheless, we believe the measures we have taken and will continue to take will position Vroom to emerge from thecrisis in a healthy financial position, and that our business model and years of experience with ecommerce vehicle sales and home deliveryenable us to be highly responsive to consumers’ increased desire for ecommerce solutions and contact-free delivery.
72

Table of Contents
Update on liquidity and outlook
We believe that, upon consummation of this offering, based on our current projections, we will have sufficient liquidity and flexibility tooperate during future disruptions caused by COVID-19. As of April 30, 2020, we had $156.4 million in cash and cash equivalents and $280.8million was available under our 2020 Vehicle Floorplan Facility. We have resumed our vehicle sourcing and acquisition processes and arecurrently building our inventory to take advantage of our position and value proposition in the used automotive market. In response to theCOVID-19 disruptions, we expect to continue to actively manage our daily cash flows and evaluate additional measures that will maximizeflexibility, reduce operating costs and conserve cash.
We anticipate that there will be enhanced opportunities arising from greater consumer acceptance of our business model as a resultof the COVID-19 disruptions. We also intend to pursue third party inventory listings that will expand our sourcing channels through third partysellers while offering us attractive revenue models in an asset light, debt free structure. Our core business strategy remains intact and, in thepost-pandemic environment, we expect to benefit from consumers’ increased desire for ecommerce solutions and contact-free delivery.
Impact of COVID-19 on our monthly Ecommerce results
The following table summarizes our financial and other data for January, February, March and April of 2020:
January
2020 February
2020 March2020
April2020
(unaudited) Ecommerce Segment Units Sold 2,751 2,408 2,771 2,880 % year-over-year growth 176% 157% 121% 145% Total Revenue (in millions) $ 81 $ 70 $ 82 $ 81 % year-over-year growth 172% 151% 155% 136% Vehicles Available for Sale 4,607 5,252 5,107 1,430 % year-over-year growth 23% 36% 74% (48)% Total Gross Profit per Unit $1,782 $ 1,855 $1,769 $1,236 % year-over-year growth (8)% (11)% 19% (46)%
In January and February 2020, we were able to maintain robust unit and revenue growth while continuing to sequentially improve ourtotal gross profit per unit. During the last three weeks of the quarter ended March 31, 2020, we began to experience a deceleration of growthin units sold and a decline in total gross profit per unit as the COVID-19 pandemic began to have an impact on consumer demand and ourecommerce operations.
In April 2020, the COVID-19 pandemic continued to have an adverse impact on our business and financial results. The extent towhich COVID-19 ultimately impacts our business, financial condition and results of operations will depend on future developments, which arehighly uncertain and unpredictable, including new information which may emerge concerning the severity and duration of the COVID-19outbreak and the effectiveness of actions taken to contain the COVID-19 outbreak or treat its impact, among others. See “Risk Factors—Risks Related to Our Business—The novel coronavirus (COVID-19) pandemic has had and is expected to continue to have an adverse effecton our business, financial condition and results of operations.”
73

Table of Contents
Growth in Ecommerce Unit Sales
In 2019, following the successful completion of two test programs that indicated a strong potential for organic, national expansion, wemade the strategic decision to begin to aggressively scale our business and accelerate our growth. Since growth is driven by the demandgenerated by vehicle inventory, we began national marketing in February 2019 and simultaneously began to increase our inventorypurchasing across multiple dispersed markets, we expanded shifts and overtime at our Vroom VRC to more rapidly recondition units, and wepaid a premium to ship units more quickly nationwide. As a result, we nearly doubled our inventory, doubled our reconditioning capacity andmore than doubled our monthly sales in 2019.
The chart below reflects our monthly ecommerce units sold during 2019 and through April 2020, along with the year-over-year growthrate as compared to the same month during the previous year.
Accelerating Ecommerce Growth
Unit Economic Progression
The significant growth in consumer demand in 2019 exceeded the scale of our vehicle acquisition, logistics and reconditioninginfrastructure during that period. By consciously prioritizing growth during the first half of 2019, we put downward pressure on unit economicsfor the short term, which also coincided with a stronger cycle of price depreciation in the second half of 2019 as compared to the prior year.This resulted in ecommerce GPPU declining from $1,806 and $1,892 in the first and second quarters of 2019, respectively, to $1,577 and$1,626 in the third and fourth quarters of 2019, respectively. Accordingly, in the second half of the year, we began to take measures thatwould reduce our unit costs while maintaining our growth trajectory for the long term.
In order to improve our unit economics, we used data to inform and optimize our operations across acquisitions, reconditioning andlogistics. We introduced enhanced technology and proprietary algorithms that included an automated pricing tool to inform buying decisionsand routing algorithms to
74

Table of Contents
improve logistics efficiency and drive higher sales margin, and we identified locations for expanded third party reconditioning capacity thatreduced inbound shipping costs. We also reexamined our reconditioning standards and defect disclosures and adopted refinements,including setting standards based on vehicle value, that enabled us to reduce costs without reducing customer satisfaction.
In addition to the initiatives designed to improve our gross profit per ecommerce unit, we also entered into new arrangements with ourthird-party carriers that resulted in reduced outbound shipping costs, thereby reducing our SG&A expense.
The chart below demonstrates the most significant costs associated with a vehicle lifecycle subsequent to purchase, from inboundshipping, to reconditioning, to outbound shipping. Vehicles in each purchase “cohort” represent all vehicles acquired in a particular monththat were sold on or prior to March 15, 2020, which we believe is the date as of which the COVID-19 crisis began to meaningfully impact ouroperations. For example, there were 253 Ecommerce units acquired in the February 2020 cohort that were sold by March 15, 2020. Theexpenses shown represent the average cost per unit for each cohort of vehicles.
Significant Improvements in Variable Vehicle Expenses
The cost optimizations that we accomplished within a six-month period represent long-term enhancements to our operations that webelieve will continue to drive down unit costs. These enhancements resulted in increased operating efficiencies and improved unit economicsthat demonstrate the significant operating leverage in our business model as it scales.
75

Table of Contents
Other Key Factors and Trends Affecting our Operating Results
Our financial condition and results of operations have been, and will continue to be, affected by a number of factors and trends,including the following:
Ability to drive revenue growth by cost effectively increasing the volume and selection of vehicles in our inventory
Our growth is primarily driven by vehicle sales. Vehicle sales growth, in turn, is largely driven by the volume of inventory and theselection of vehicles listed on our platform. Accordingly, we believe that having the appropriate volume and mix of vehicle inventory is criticalto our ability to drive growth.
The continued growth of our vehicle inventory requires a number of important capabilities, including the ability to finance theacquisition of inventory at competitive rates, source high quality vehicles across various acquisition channels nationwide, secure adequatereconditioning capacity and execute effective marketing strategies to increase consumer sourcing. In addition, our ability to accuratelyforecast pricing and consumer demand for specific types of vehicles is critical to sourcing high quality, high-demand vehicles. This ability isenabled by our data science capabilities that leverage the growing amount of data at our disposal and fine-tune our supply and sourcingmodels. As we continue to invest in our operational efficiency and data analytics, we expect that we will continue to cost effectively increasethe volume and optimize the selection of our ecommerce inventory.
Ability to capitalize on the continued migration of vehicle purchasers to ecommerce platforms through data-driven marketingefforts
While the overall ecommerce penetration rate in used vehicle sales remains low, over the last several years, ecommerce used vehiclesales have experienced significant growth. There has been a shift in consumer buying patterns towards more convenient, personalized, andon-demand purchases, as well as a demand for ecommerce across more diverse categories, including the used vehicle market. We expectthat the ecommerce model for buying and selling used vehicles will continue to grow and such growth may be accelerated by the COVID-19pandemic. Our ability to continue to benefit from this trend will be an important driver of our future performance.
We seek to improve our brand awareness among consumers through national marketing campaigns in order to strengthen ourcustomer acquisition funnel. We also use digital performance marketing such as search engine marketing, automotive aggregator sites andsocial media to acquire customers more cost effectively. Our aggregate marketing spend has increased over time, with our first nationalbrand marketing campaign commencing in the first quarter of 2019, and we expect to continue to invest in both national brand marketing andperformance marketing efforts. As we leverage our national brand, we believe this investment in marketing spend will drive additionaldemand and sales. We also believe that we have the ability to drive down the cost of acquisition per unit sold by increasing the efficiency ofour marketing spend.
Ability to convert visitors to our platform into customers
The quality of the customer experience on our ecommerce platform is critical to our ability to attract new visitors to our platform,convert such visitors into customers and increase repeat customers. Our ability to drive higher customer conversion depends on our ability tomake our platform a compelling choice for consumers based on our functionalities and consumer offerings.
Data analytics and experimentation drive decision making across all of our conversion efforts. By analyzing the data generated by themillions of visitors and tens of thousands of transactions on our
76

Table of Contents
platform, and continually testing strategies to maximize conversion rates, we form a better understanding of consumer preferences and try tocreate a more tailored ecommerce experience. As we continue to invest in our brand and improve the customer experience, we expectthat we will attract more visitors, improve conversion and drive greater sales.
Ability to optimize the mix of inventory sources to drive increased gross profit and improvements to our unit economics
We strategically source inventory from auctions, consumers, rental car companies and dealers. Auctions and consumers representthe vast majority of our inventory sources, accounting for approximately 52% and 36% of our retail inventory sold in 2019, respectively, and48% and 36% for the three months ended March 31, 2020. Because the quality of vehicles and associated gross margin profile vary acrosseach channel, the mix of inventory sources has an impact on our profitability. We continually evaluate the optimal mix of sourcing channelsand will source vehicles in a way that maximizes our average gross profit per unit and improves our unit economics. For example, purchasingvehicles at third-party auctions is competitive and, consequently, vehicle prices at third-party auctions tend to be higher than vehicle pricesfor vehicles sourced directly from consumers. Accordingly, as part of our sourcing strategy, we seek to increase the percentage of vehiclesales that we source from consumers.
Our ability to increase the percentage of inventory sourced directly from consumers will depend on the popularity and success of ourecommerce platform. In order to continue to increase the percentage of vehicles that we source directly from consumers, we are expandingour national marketing efforts that are focused on our Sell Us Your Car® proposition, which we believe will result in more customers gainingfamiliarity with our platform. We expect that, as consumers experience the convenience of our platform to sell or trade in their used vehicles,the percentage of inventory we source directly from consumers will continue to grow.
We also intend to pursue third party inventory listings that will expand our sourcing channels through third party sellers while offeringus attractive revenue models in an asset light, debt free structure.
Ability to expand and optimize our reconditioning capacity to satisfy increasing demand
Our ability to recondition purchased vehicles to our quality standards is a critical component of our business. Historically, we havesuccessfully increased our reconditioning capacity as our business has grown, and our future success will depend on our ability to expandand optimize our reconditioning capacity to satisfy increasing customer demand. We employ a hybrid approach that combines the use of ourVroom VRC and third-party VRCs to best meet our reconditioning needs.
We expect that over time our per unit costs in our Vroom VRC will be lower than those in third-party VRCs because our Vroom VRCbenefits from greater scale and from our continued investment in manufacturing technology. In 2019, we significantly increased ourreconditioning capacity within our Vroom VRC by overhauling our operations and applying lean manufacturing techniques and othersoftware-enabled technological advances. As we continue to grow our business, we intend to continue to invest in increased reconditioningcapacity and operational efficiency through third-party VRC locations and going forward we expect to invest in additional proprietaryreconditioning capacity to provide added scale with reduced lead-time and greater flexibility. Additionally, our use of third-party VRCs torecondition vehicles allows us to avoid additional capital expenditures, quickly increase capacity, maintain greater operational flexibility andbroaden our geographic footprint to drive lower logistics costs. In 2019 and 2020, we expanded our third-party VRC operations by addingeleven additional VRCs across the nation for a current total of thirteen. See “—Liquidity and Capital Resources.”
We leverage our data analytics and deep industry experience to strategically select both Vroom VRCs and third-party VRCs inlocations where we believe there is the highest supply and demand for our vehicles. We expect that our continued investment inreconditioning capacity and technology will
77

Table of Contents
lower our reconditioning costs per unit and drive greater operational efficiency, higher gross profit per unit and improved unit economics.
Ability to expand and develop our logistics network
We primarily use third-party carriers and are developing a hybrid strategy to build out our proprietary logistics network. We are in theprocess of optimizing our third-party logistics network nationally through the development of strategic carrier arrangements with nationalhaulers. As we continue to grow, we plan to significantly consolidate our carrier base into dedicated operating regions. We expect that theseenhanced logistics operations, combined with the expansion of strategically located VRCs, will drive lower inbound and outbound logisticscosts, thus lowering costs per unit. Our VRCs also serve as pooling points to aggregate acquired vehicles and can serve as hubs for stagingvehicles for last-mile delivery to customers, which we expect will result in an improved experience for customers. We recently launched anumber of enhancements to our last-mile delivery service to enrich our customer experience. We expect that these enhancements will resultin an increase in outbound shipping costs, thereby increasing our SG&A expenses. However, we expect any such increase to be offset bycertain cost efficiencies gained from improvements in our reconditioning and logistics operations, which will ultimately lead to reduced totalcosts per unit. Over time, we expect that optimizing our logistics network will result in improved unit economics, increased profitability and anenhanced customer experience.
Ability to increase and better monetize value-added products
Our offering of value-added products is an integral part of providing a seamless vehicle-buying experience to our customers. Theseproducts provide added revenue streams for us as well as offering convenience, assurance and efficiency for our customers. We sell ourthird-party value-added products through our strategic relationships with multiple lenders and other third parties who bear the incrementalrisks associated with the underwriting of finance and protection products. In the fourth quarter of 2019 and first quarter of 2020, we enteredinto strategic partnerships with lenders such as Chase and Santander which have contributed to improvements in Product GPPU.Additionally, through our on-going data analytics, experimentation and further development of our ecommerce technology, we expect toincrease attachment rates of our existing value-added products while finding new opportunities to include additional finance and protectionand other value-added products. Because we are paid fees on value-added products we sell, our gross profit is equal to the revenue wegenerate on such sales. As a result, such sales help drive total gross profit per unit. We expect that, as we scale our business, we willincrease the breadth and variety of value-added products offered to customers and improve attachment rates to our vehicle sales, which inturn will grow revenue and drive profitability.
Seasonality
Used vehicle sales are seasonal. The used vehicle industry typically experiences an increase in sales early in the calendar year andreaches its highest point late in the first quarter and early in the second quarter. Vehicle sales then level off through the rest of the year, withthe lowest level of sales in the fourth quarter. This seasonality has historically corresponded with the timing of income tax refunds, which arean important source of funding for vehicle purchases. Additionally, used vehicles depreciate at a faster rate in the last two quarters of eachyear and a slower rate in the first two quarters of each year. In line with these macro trends, our gross profit per unit has historically beenhigher in the first half of the year when compared to the second half of the year. See “Risk Factors—Risks Related to Our Business—Wemay experience seasonal and other fluctuations in our quarterly results of operations, which may not fully reflect the underlying performanceof our business.”
78
Table of Contents
Components of Results of Operations
Revenue
Retail vehicle revenue
We sell vehicles through both our ecommerce platform and TDA. Revenue from vehicle sales, including any delivery charges, arerecognized when vehicles are delivered to the customers or picked up at our TDA retail location, net of a reserve for estimated returns. Thenumber of units sold and the average selling price per unit are the primary factors impacting our retail revenue stream.
The number of units sold depends on the volume of inventory and the selection of vehicles listed on our ecommerce platform, ourability to attract new customers, our brand awareness and our ability to expand our reconditioning operations and logistics network.
Average selling price per unit sold depends primarily on our pricing strategy, retail used car market prices, our average days to saleand our reconditioning and logistics costs.
Historically, we have focused our inventory on low-mileage, high-demand vehicles with average selling prices of approximately$30,000. As we ramp up our vehicle acquisitions following our strategic decision to reduce inventory in response to the COVID-19 pandemic,and as we scale our business going forward, we intend to strategically take advantage of a broader portion of the used vehicle market byadding more lower priced vehicles to our inventory. This will allow us to expand our vehicle selection, while potentially decreasing theaverage selling price per unit in any given period. See “—Impact of COVID-19”
Wholesale vehicle revenue
We sell vehicles that do not meet our Vroom retail sales criteria through third-party wholesale auctions. Vehicles sold at auction areacquired from customers who trade-in their vehicles when making a purchase from us and also from customers who sell their vehicle to us indirect-buy transactions. The number of wholesale vehicles sold and the average selling price per unit are the primary drivers of wholesalerevenue. The average selling price per unit is affected by the mix of the vehicles we acquire and general supply and demand conditions inthe wholesale market.
Product revenue
We generate revenue by earning fees on sales of value-added products to our customers in connection with vehicle sales, includingfees earned on customer vehicle financing from third-party lenders and fees earned on sales of other value-added products, such asextended warranty contracts, GAP protection and wheel and tire coverage. We earn fees on these products pursuant to arrangements withthe third parties that sell and administer these products. For accounting purposes, we are an agent for these transactions and, as a result, werecognize fees on a net basis when the customer enters into an arrangement to purchase these products or obtain third-party financing,which is typically at the time of a vehicle sale. Our gross profit on product revenue is equal to the revenue we generate.
Product revenue is affected by the number of vehicles sold, the attachment rate of value-added products and the amount of fees wereceive on each product. Product revenue also consists of estimated profit-sharing amounts to which we are entitled based on theperformance of third-party protection products once a required claims period has passed. See “—Critical Accounting Policies and Estimates—Revenue Recognition—Product Revenue.”
79

Table of Contents
A portion of the fees we receive is subject to chargeback in the event of early termination, default, or prepayment of the contracts byour customers. We recognize product revenue net of reserves for estimated chargebacks.
Other revenue
Other revenue consists of labor and parts revenue earned by us for vehicle repair services at TDA. In 2018, other revenue alsoincluded auction fees earned from a local wholesale auction previously hosted by TDA.
See “Note 2—Summary of Significant Accounting Policies—Accounting Standards Adopted” and “Note 3—Revenue Recognition” toour consolidated financial statements included elsewhere in this prospectus.
Cost of sales
Cost of sales primarily includes the costs to acquire vehicles, inbound transportation costs and direct and indirect reconditioning costsassociated with preparing vehicles for sale. Costs to acquire vehicles are primarily driven by the inventory source, vehicle mix and generalsupply and demand conditions of the used vehicle market. Inbound transportation costs include costs to transport the vehicle to our VRCs.Reconditioning costs include parts, labor and third-party reconditioning costs directly attributable to the vehicle and allocated overhead costs.Cost of sales also includes any accounting adjustments to reflect vehicle inventory at the lower of cost or net realizable value.
Total gross profit
Total gross profit is defined as total revenue less costs associated with such revenue.
Selling, general and administrative expenses
Our selling, general, and administrative expenses, which we refer to as SG&A expenses, consist primarily of advertising andmarketing expenses, outbound transportation costs, employee compensation, occupancy costs of our facilities and professional fees foraccounting, auditing, tax, legal and consulting services.
We expect that our SG&A expenses will increase in the future as we expand our operations, hire additional employees and continueto increase our marketing spend to build brand awareness and increase consumer traffic on our platform. We also expect to incur increasedexpenses associated with being a public company, including costs of accounting, audit, legal, regulatory and tax-related services associatedwith maintaining compliance with SEC and stock exchange requirements, director and officer insurance costs, and investor and publicrelations costs.
Depreciation and amortization
Our depreciation and amortization expense primarily includes depreciation related to our leasehold improvements, as well asamortization related to intangible assets acquired in the TDA acquisition and capitalized internal use software costs incurred in thedevelopment of our platform and website applications. Depreciation expense related to our Vroom VRC is included in cost of sales in theconsolidated statements of operations.
Interest expense
Our interest expense includes interest expense related to our Vehicle Floorplan Facility, which is used to finance our inventory, as wellas interest expense on the Term Loan Facility, which was repaid in full in December 2019.
80

Table of Contents
Interest Income
Interest income primarily represents interest credits earned on cash deposits maintained in relation to our Vehicle Floorplan Facility.
Results of Operations
The following table presents our consolidated results of operations for the years and periods indicated:
Year Ended
December 31, Three Months Ended
March 31, 2018 2019 % Change 2019 2020 % Change (in thousands) (in thousands) (unaudited) Revenue:
Retail vehicle, net $656,928 $ 952,910 45.1% $178,750 $308,710 72.7% Wholesale vehicle 174,514 213,464 22.3% 52,119 55,578 6.6% Product, net 19,653 23,708 20.6% 3,745 11,044 194.9% Other 4,334 1,739 (59.9)% 445 440 (1.1)%
Total revenue 855,429 1,191,821 39.3% 235,059 375,772 59.9% Cost of sales 794,622 1,133,962 42.7% 223,047 357,385 60.2%
Total gross profit 60,807 57,859 (4.8)% 12,012 18,387 53.1% Selling, general and administrative expenses 133,842 184,988 38.2% 36,583 58,380 59.6% Depreciation and amortization 6,857 6,019 (12.2)% 1,533 966 (37.0)%
Loss from operations (79,892) (133,148) 66.7% (26,104) (40,959) 56.9% Interest expense 8,513 14,596 71.5% 2,718 2,826 4.0% Interest income (3,135) (5,607) 78.9% (1,849) (1,956) 5.8% Other (income) expense, net (321) 673 (309.7)% 63 (823) (1,406.3)%
Loss before provision for income taxes (84,949) (142,810) 68.1% (27,036) (41,006) 51.7% Provision for income taxes 229 168 (26.6)% 103 53 (48.5)%
Net loss $ (85,178) $ (142,978) 67.9% $ (27,139) $ (41,059) 51.3%
Segments
We manage and report operating results through three reportable segments:
• Ecommerce (49.3% of 2019 revenue; 62.0% of quarter ended March 31, 2020 revenue): The Ecommerce segment represents
retail sales of used vehicles through our ecommerce platform and fees earned on sales of value-added products associated withthose vehicle sales.
• TDA (32.8% of 2019 revenue; 23.2% of quarter ended March 31, 2020 revenue): The TDA segment represents retail sales ofused vehicles from TDA and fees earned on sales of value-added products associated with those vehicle sales.
• Wholesale (17.9% of 2019 revenue; 14.8% of quarter ended March 31, 2020 revenue): The Wholesale segment representssales of used vehicles through wholesale auctions.
81

Table of Contents
Three Months Ended March 31, 2019 and 2020
Ecommerce
The following table presents our Ecommerce segment results of operations for the periods indicated:
Three Months Ended
March 31, 2019 2020 Change % Change
(in thousands, exceptunit data and average
days to sale) (unaudited) Ecommerce revenue:
Vehicle revenue $88,630 $225,606 $136,976 154.5% Product revenue 1,225 7,566 6,341 517.6%
Total ecommerce revenue $89,855 $233,172 $143,317 159.5%
Ecommerce gross profit: Vehicle gross profit $ 4,529 $ 6,701 $ 2,172 48.0% Product gross profit 1,225 7,566 6,341 517.6%
Total ecommerce gross profit $ 5,754 $ 14,267 $ 8,513 148.0%
Ecommerce units sold 3,187 7,930 4,743 148.8% Average vehicle selling price per ecommerce unit $27,810 $ 28,450 $ 640 2.3% Gross profit per ecommerce unit:
Vehicle gross profit per ecommerce unit $ 1,421 $ 845 $ (576) (40.5)% Product gross profit per ecommerce unit 385 954 569 147.8%
Total gross profit per ecommerce unit $ 1,806 $ 1,799 $ (7) (0.4)%
Ecommerce average days to sale 64 68 4 6.3%
Ecommerce units
Ecommerce units sold increased 4,743, or 148.8%, to 7,930 for the three months ended March 31, 2020 from 3,187 for the threemonths ended March 31, 2019, driven by our increased inventory levels, process improvements in our ecommerce platform and our nationaladvertising campaign which continues to strengthen our national brand awareness. Average monthly unique visitors to our website increasedby 130.1% to 947,014 for the three months ended March 31, 2020 from 411,489 for the three months ended March 31, 2019. We expectecommerce units sold to continue to grow in the future as we increase our inventory selection and marketing efforts and improve conversion.
Vehicle Revenue
Ecommerce vehicle revenue increased $137.0 million, or 154.5%, to $225.6 million for the three months ended March 31, 2020 from$88.6 million for the three months ended March 31, 2019. Of this increase, $131.9 million was attributable to the increase in ecommerce unitssold, while $5.1 million of the increase was driven by a higher average selling price per unit, which increased to $28,450 for the three monthsended March 31, 2020 from $27,810 for the three months ended March 31, 2019. While we believe that our average selling price per unit willdecrease as we scale our business, we expect ecommerce vehicle revenue will continue to grow driven by increases in ecommerce unitssold. The positive sales momentum experienced in 2019 continued for the three months ended March 31, 2020. During the last three weeksof March 2020, the escalation of the COVID-19 pandemic within the United States negatively impacted consumer demand and ecommercerevenue. However, due to our strategic
82

Table of Contents
decision to reduce vehicle pricing in order to drive vehicle sales, we maintained the number of ecommerce units sold at pre-COVID levels.
Product Revenue
Ecommerce product revenue increased $6.3 million, or 517.6%, to $7.5 million for the three months ended March 31, 2020 from $1.2million for the three months ended March 31, 2019. Of this increase, $4.5 million was driven by an increase in product revenue per unit, while$1.8 million was attributable to the increase in ecommerce units sold. Product revenue per unit increased by $569 to $954 for the threemonths ended March 31, 2020 from $385 for the three months ended March 31, 2019, which was primarily due to the mix of products sold,higher attachment rates, improved financing features in our ecommerce platform and our strategic partnerships. We expect ecommerceproduct revenue will continue to grow in the future driven by increases in ecommerce units sold, new product offerings, initiatives to improveproduct attachment rates and increases in per unit profit.
Vehicle Gross Profit
Ecommerce vehicle gross profit increased $2.2 million, or 48.0%, to $6.7 million for the three months ended March 31, 2020 from $4.5million for the three months ended March 31, 2019. Of this increase, $6.7 million was attributable to the increase in ecommerce units sold,partially offset by a $4.5 million decrease related to lower vehicle gross profit per unit for the three months ended March 31, 2020, ascompared to the three months ended March 31, 2019. Vehicle gross profit per unit decreased by $576 from $1,421 for the three monthsended March 31, 2019 to $845 for the three months ended March 31, 2020 as we continued to sell through the inventory originallyreconditioned in 2019 and early 2020 at higher costs per unit. Additionally, during the last three weeks of March 2020, the escalation of theCOVID-19 pandemic within the United States negatively impacted consumer demand and ecommerce revenue. Due to our strategic decisionto reduce vehicle pricing in order to drive vehicle sales, the number of ecommerce units sold returned to the pre-COVID-19 levels, howeverat reduced gross profit per unit. Finally, ecommerce vehicle gross profit was adversely impacted by an adjustment to the value of our unsoldused vehicle inventory of approximately $6.1 million to reflect its net realizable value as of March 31, 2020.
As we continue to mature our infrastructure, increase the number of VRCs and optimize our network of VRCs, we expect ecommercevehicle gross profit per unit to increase in the future driven by reduced costs across acquisitions, logistics and reconditioning.
Product Gross Profit
Ecommerce product gross profit increased $6.3 million, or 517.6%, to $7.5 million for the three months ended March 31, 2020 from$1.2 million for the three months ended March 31, 2019. Of this increase, $4.5 million was related to higher product gross profit per unit,while $1.8 million was attributable to the increase in ecommerce units sold for the three months ended March 31, 2020, as compared to thethree months ended March 31, 2019. The increase in product gross profit per unit was attributable to the mix of products sold, higherattachment rates, improved financing features in our e-commerce platform and our strategic partnerships. We expect ecommerce productgross profit will continue to grow in the future driven by increases in ecommerce units sold, new product offerings, initiatives to improveproduct attachment rates and increases in per unit profit.
83

Table of Contents
TDA
The following table presents our TDA segment results of operations for the periods indicated:
Three Months Ended
March 31, 2019 2020 Change % Change
(in thousands, exceptunit data and average
days to sale) (unaudited) TDA revenue:
Vehicle revenue $90,120 $83,106 $(7,014) (7.8)% Product revenue 2,521 3,477 956 37.9% Other 444 439 (5) (1.1)%
Total TDA revenue $93,085 $87,022 $(6,063) (6.5)%
TDA gross profit: Vehicle gross profit $ 3,407 $ 1,781 $(1,626) (47.7)% Product gross profit 2,521 3,477 956 37.9% Other gross profit 149 154 5 3.4%
Total TDA gross profit $ 6,077 $ 5,412 $ (665) (10.9)%
TDA units sold 3,370 3,035 (335) (9.9)% Average vehicle selling price per TDA unit $26,742 $27,383 $ 641 2.4% Gross profit per TDA unit:
Vehicle gross profit per TDA unit $ 1,011 $ 586 $ (425) (42.0)% Product gross profit per TDA unit 748 1,146 398 53.2%
Total gross profit per TDA unit $ 1,759 $ 1,732 $ (27) (1.5)%
TDA average days to sale 53 50 (3) (5.7)%
TDA units
TDA units sold decreased 335, or 9.9%, to 3,035 for the three months ended March 31, 2020 from 3,370 for the three months endedMarch 31, 2019. Although, our physical retail location remained open, the consumer demand for vehicles at TDA declined in the second halfof March 2020 due to government mandated “stay-home” orders related to the COVID-19 pandemic and other disruptions related to COVID-19. We expect our TDA units sold will continue to be negatively impacted by the COVID-19 pandemic, but the extent and duration of theimpact is uncertain at this time.
Vehicle Revenue
TDA vehicle revenue decreased $7.0 million, or 7.8%, to $83.1 million for the three months ended March 31, 2020 from $90.1 millionfor the three months ended March 31, 2019. Of this decrease, $9.0 million was driven by a decrease in TDA units sold for the three monthsended March 31, 2020, as compared to the three months ended March 31, 2019, partially offset by higher average selling price per unit,which increased to $27,383 for the three months ended March 31, 2020 from $26,742 in 2019. We expect our vehicle revenue will continueto be negatively impacted by the COVID-19 pandemic, but the extent and duration of the impact is uncertain at this time.
Product Revenue
TDA product revenue increased $1.0 million, or 37.9% to $3.5 million for the three months ended March 31, 2020 from $2.5 million forthe three months ended March 31, 2019. Of this increase,
84

Table of Contents
$1.2 million was driven by a $398 increase in product revenue per unit, partially offset by a $0.2 million decrease in TDA units sold for thethree months ended March 31, 2020, as compared to the three months ended March 31, 2019.
Other Revenue
TDA other revenue remained relatively flat for the three months ended March 31, 2020 as compared to the three months endedMarch 31, 2019.
Vehicle Gross Profit
TDA vehicle gross profit decreased $1.6 million, or 47.7%, to $1.8 million for the three months ended March 31, 2020 from$3.4 million for the three months ended March 31, 2019. Of this decrease, $1.3 million was attributable to a decrease in TDA vehicle grossprofit per unit, while $0.3 million was attributable to the decrease in TDA units sold for the three months ended March 31, 2020, as comparedto the three months ended March 31, 2019. Our national inventory is sold through both our TDA and Ecommerce segments. Because of thegeographic proximity, most of the inventory sold by TDA is reconditioned in our Vroom VRC. Accordingly, the higher than expected demandwe experienced in the Ecommerce segment impacted the cost efficiency of our Vroom VRC, which contributed to the decrease in TDAvehicle gross profit per unit in 2019. We expect our vehicle gross profit to continue to be negatively impacted by the COVID-19 pandemic andlimited consumer demand at TDA, but the extent and duration of the impact is uncertain at this time.
We expect that our continued investments in scaling our ecommerce infrastructure will also increase TDA vehicle gross profit per unitin the future through a more optimal distribution of VRCs and reduced costs across acquisitions, logistics and reconditioning. Due to theCOVID-19 pandemic, TDA vehicle gross profit was adversely impacted by an adjustment to the value of our unsold used vehicle inventory ofapproximately $2.9 million to reflect its net realizable value as of March 31, 2020.
Product Gross Profit
TDA product gross profit increased $1.0 million, or 37.9%, to $3.5 million for the three months ended March 31, 2020 from $2.5 millionfor the three months ended March 31, 2019. Of this increase, $1.2 million was attributable to an increase in product gross profit per unit,partially offset by a $0.2 million decrease in TDA units sold for the three months ended March 31, 2020, as compared to the three monthsended March 31, 2019. Product gross profit per unit increased to $1,146 for the three months ended March 31, 2020 from $748 for the threemonths ended March 31, 2019.
Other gross profit
TDA other gross profit remained relatively flat for the three months ended March 31, 2020 as compared to the three months endedMarch 31, 2019.
85

Table of Contents
Wholesale
The following table presents our Wholesale segment results of operations for the periods indicated:
Three Months Ended
March 31, 2019 2020 Change % Change
(in thousands, except
unit data) (unaudited) Wholesale revenue $52,119 $55,578 $ 3,459 6.6% Wholesale gross profit $ 181 $ (1,292) $(1,473) (813.8)% Wholesale units sold 5,230 4,685 (545) (10.4)% Average selling price per unit $ 9,965 $11,863 $ 1,898 19.0% Wholesale gross profit per unit $ 35 $ (276) $ (311) (888.6)%
Units
Wholesale units sold decreased 545, or 10.4%, to 4,685 for the three months ended March 31, 2020 from 5,230 for the three monthsended March 31, 2019, primarily driven by a decrease in the number of trade-in vehicles associated with the lower amount of TDA units soldas well as a decrease in the number of vehicles acquired through our Sell Us Your Car® centers, which have historically been sold inwholesale auctions.
Revenue
Wholesale revenue increased $3.5 million, or 6.6%, to $55.6 million for the three months ended March 31, 2020 from $52.1 million forthe three months ended March 31, 2019. Of this increase, $8.9 million was attributable to a higher average selling price per wholesale unitswhich increased to $11,863 for the three months ended March 31, 2020 from $9,965 for the three months ended March 31, 2019 primarilydriven by the sale of retail quality vehicles through the wholesale auctions as we reduced our inventory levels in order to respond to thedecreased consumer demand due to the COVID-19 pandemic. The increase was partially offset by a $5.4 million decrease related to lowernumber of wholesale units sold.
Gross Profit
Wholesale vehicle gross profit decreased $1.5 million from gross profit of $0.2 million for the three months ended March 31, 2019 togross loss of $1.3 million for the three months ended March 31, 2020. The decrease was primarily attributable to a $311 decrease inwholesale gross profit per unit for the three months ended March 31, 2020, as compared to the three months ended March 31, 2019. Due tothe COVID-19 pandemic, wholesale gross profit was adversely impacted by an adjustment to the value of our unsold used vehicle inventoryof approximately $1.8 million to reflect its net realizable value as of March 31, 2020.
86

Table of Contents
Selling, general and administrative expenses
Three Months Ended
March 31, 2019 2020 Change % Change (in thousands) (unaudited) Compensation & benefits $15,492 $20,321 $ 4,829 31.2% Marketing expense 7,100 17,915 10,815 152.3% Outbound logistics 2,294 5,792 3,498 152.5% Occupancy and related costs 2,286 2,697 411 18.0% Professional services 2,653 2,459 (194) (7.3)% Other 6,758 9,196 2,438 36.1%
Total selling, general & administrative expenses $36,583 $58,380 $21,797 59.6%
Selling, general and administrative expenses increased $21.8 million, or 59.6%, to $58.4 million for the three months ended March 31,2020, from $36.6 million for the three months ended March 31, 2019. The increase was primarily due to a $10.8 million increase inadvertising and marketing efforts as we expanded our national broad-reach advertising, a $4.8 million increase in compensation and benefitsdue to an increase in employee headcount throughout the organization as our business scaled and a $3.5 million increase in outboundlogistics costs attributable to the growth in our ecommerce business. However, as discussed under the heading “—Impact of COVID-19”above, we implemented certain measures in response to COVID-19 disruptions to reduce operating expenses by placing on furloughapproximately one-third of our workforce, salary reduction of our non-furloughed salaried employees and reduction of marketing spend.However, since we restarted vehicle acquisitions and increased our Vroom VRC operations, as of May 31, 2020, approximately 60% offurloughed employees have returned to work, primarily those employed in reconditioning, logistics and acquisitions positions.
Depreciation and amortization
Depreciation and amortization expenses decreased $0.6 million, or 37.0%, to $0.9 million for the three months ended March 31, 2020from $1.5 million for the three months ended March 31, 2019. The decrease was primarily due to reduced amortization expense as certainintangible assets were fully amortized.
Interest expense
Interest expense increased $0.1 million for the three months ended March 31, 2020, as compared to the three months ended March31, 2019. Interest expense increased $0.9 million as a result of an increase in the outstanding balance of the Vehicle Floorplan Facility. Theincrease was partially offset by a $0.8 million decrease in interest expense for the Eastward Term Loan Facility as the outstanding balancewas repaid in full in December 2019.
Interest income
Interest income remained relatively flat for the three months ended March 31, 2020, as compared to the three months ended March31, 2109. Interest income primarily relates to interest earned on cash deposits maintained with Ally Bank.
87

Table of Contents
Years Ended December 31, 2018 and 2019
Ecommerce
The following table presents our Ecommerce segment results of operations for the years indicated: Year Ended December 31, 2018 2019 Change % Change
(in thousands, except unit data
and average days to sale) Ecommerce revenue:
Vehicle revenue $ 295,414 $ 576,998 $281,584 95.3% Product revenue 5,758 11,116 5,358 93.1%
Total ecommerce revenue $ 301,172 $ 588,114 $286,942 95.3%
Ecommerce gross profit: Vehicle gross profit $ 16,667 $ 21,011 $ 4,344 26.1% Product gross profit 5,758 11,116 5,358 93.1%
Total ecommerce gross profit $ 22,425 $ 32,127 $ 9,702 43.3%
Ecommerce units sold 10,006 18,945 8,939 89.3% Average vehicle selling price per ecommerce unit $ 29,524 $ 30,456 $ 932 3.2% Gross profit per ecommerce unit:
Vehicle gross profit per ecommerce unit $ 1,666 $ 1,109 $ (557) (33.4%) Product gross profit per ecommerce unit 576 587 11 1.9%
Total gross profit per ecommerce unit $ 2,242 $ 1,696 $ (546) (24.4%)
Ecommerce average days to sale 59 68 9 15.3%
Ecommerce units
Ecommerce units sold increased 8,939, or 89.3%, to 18,945 in 2019 from 10,006 in 2018, driven by our increased inventory levels,process improvements in our ecommerce platform and our national advertising campaign, which began in February 2019 and hasstrengthened our national brand awareness. Average monthly unique visitors to our website increased to 653,216 in 2019 from 291,772 in2018. We expect ecommerce units sold to continue to grow in the future as we increase our inventory selection and marketing efforts, andimprove conversion.
Vehicle Revenue
Ecommerce vehicle revenue increased $281.6 million, or 95.3%, to $577.0 million in 2019 from $295.4 million in 2018. Of thisincrease, $263.9 million was attributable to the increase in ecommerce units sold, while $17.7 million of the increase was driven by a higheraverage selling price per unit, which increased to $30,456 in 2019 from $29,524 in 2018. While we believe that over time our average sellingprice per unit will decrease as we scale our business, we expect ecommerce vehicle revenue will continue to grow driven by increases inecommerce units sold.
Product Revenue
Ecommerce product revenue increased $5.4 million, or 93.1%, to $11.1 million in 2019 from $5.8 million in 2018. Of this increase,$5.2 million was attributable to the increase in ecommerce units sold,
88

Table of Contents
while $0.2 million was driven by an increase in product revenue per unit. Product revenue per unit increased $11 to $587 in 2019 from $576in 2018, which was primarily due to the mix of products sold in 2019. We expect ecommerce product revenue will continue to grow in thefuture driven by increases in ecommerce units sold, new product offerings, initiatives to improve product attachment rates and increases inper unit profit.
Vehicle Gross Profit
Ecommerce vehicle gross profit increased $4.3 million, or 26.1%, to $21.0 million in 2019 from $16.7 million in 2018. Of this increase,$14.9 million was attributable to the increase in ecommerce units sold, partially offset by a $10.6 million decrease related to lower vehiclegross profit per unit in 2019, as compared to 2018. Vehicle gross profit per unit decreased by $557 from $1,666 in 2018 to $1,109 in 2019,primarily driven by higher than expected demand for our vehicles during a period in which we were still building out our infrastructure. As thesignificant growth in consumer demand exceeded the scale of our vehicle acquisition, logistics and reconditioning infrastructure during thatperiod, we elected to prioritize meeting the higher demand over certain cost efficiencies in 2019. As we continue to scale our infrastructure,increase the number of VRCs and optimize our network of VRCs, we expect ecommerce vehicle gross profit per unit to increase in the futuredriven by reduced costs across acquisitions, logistics and reconditioning.
Product Gross Profit
Ecommerce product gross profit increased $5.4 million, or 93.1%, to $11.1 million in 2019 from $5.8 million in 2018. Of this increase,$5.2 million was attributable to the increase in ecommerce units sold, while $0.2 million was related to higher product gross profit per unit in2019, as compared to 2018. We expect ecommerce product gross profit will continue to grow in the future driven by increases in ecommerceunits sold, new product offerings, initiatives to improve product attachment rates and increases in per unit profit.
89

Table of Contents
TDA
The following table presents our TDA segment results of operations for the years indicated: Year Ended December 31, 2018 2019 Change % Change
(in thousands, except unit
data and average days to sale) TDA revenue:
Vehicle revenue $ 361,514 $ 375,912 $14,398 4.0 % Product revenue 13,895 12,592 (1,303) (9.4)% Other 4,334 1,739 (2,595) (59.9)%
Total TDA revenue $ 379,743 $ 390,243 $10,500 2.8 %
TDA gross profit: Vehicle gross profit $ 19,983 $ 12,069 $ (7,914) (39.6)% Product gross profit 13,895 12,592 (1,303) (9.4)% Other gross profit 1,247 731 (516) (41.4)%
Total TDA gross profit $ 35,125 $ 25,392 $ (9,733) (27.7)%
TDA units sold 13,193 13,018 (175) (1.3)% Average vehicle selling price per TDA unit $ 27,402 $ 28,876 $ 1,474 5.4 % Gross profit per TDA unit:
Vehicle gross profit per TDA unit $ 1,515 $ 927 $ (588) (38.8)% Product gross profit per TDA unit 1,053 967 (86) (8.2)%
Total gross profit per TDA unit $ 2,568 $ 1,894 $ (674) (26.2)%
TDA average days to sale 44 50 6 13.6 %
TDA units
TDA units sold decreased 175, or 1.3%, to 13,018 in 2019 from 13,193 in 2018. We expect TDA units to remain stable in the future.
Vehicle Revenue
TDA vehicle revenue increased $14.4 million, or 4.0%, to $375.9 million in 2019 from $361.5 million in 2018. Of this increase, $19.2million was driven by a higher average selling price per unit, which increased to $28,876 in 2019 from $27,402 in 2018, partially offset by$4.8 million attributable to the decrease in TDA units sold in 2019, as compared to 2018.
Product Revenue
TDA product revenue decreased $1.3 million, or 9.4% to $12.6 million in 2019 from $13.9 million in 2018. Of this decrease, $1.1million was driven by a $86 decrease in product revenue per unit, while $0.2 million was attributable to the decrease in TDA units sold in2019, as compared to 2018.
Other Revenue
TDA other revenue decreased $2.6 million, or 59.9%, to $1.7 million in 2019 from $4.3 million in 2018. The decrease was primarilyattributable to a decrease in auction fees earned from a local TDA hosted wholesale auction that was strategically terminated in November2018 in favor of utilizing national third-party wholesale auctions.
90

Table of Contents
Vehicle Gross Profit
TDA vehicle gross profit decreased $7.9 million, or 39.6%, to $12.1 million in 2019 from $20.0 million in 2018. Of this decrease, $7.6million was attributable to a decrease in TDA vehicle gross profit per unit, while $0.3 million was attributable to the decrease in TDA unitssold in 2019, as compared to 2018. Our national inventory is sold through both our TDA and Ecommerce segments. Because of thegeographic proximity, most of the inventory sold by TDA is reconditioned in our Vroom VRC. Accordingly, the higher than expected demandwe experienced in the Ecommerce segment impacted the cost efficiency of our Vroom VRC, which contributed to the decrease in TDAvehicle gross profit per unit in 2019. We expect that our continued investments in scaling our ecommerce infrastructure will also increaseTDA vehicle gross profit per unit in the future through a more optimal distribution of VRCs and reduced costs across acquisitions, logisticsand reconditioning.
Product Gross Profit
TDA product gross profit decreased $1.3 million, or 9.4%, to $12.6 million in 2019 from $13.9 million in 2018. Of this decrease, $1.1million was attributable to a decrease in product gross profit per unit, while $0.2 million was attributable to the decrease in TDA units sold in2019, as compared to 2018. Product gross profit per unit decreased to $967 in 2019 from $1,053 in 2018.
Other gross profit
TDA other gross profit decreased $0.5 million, or 41.4%, to $0.7 million in 2019 from $1.2 million in 2018. The decrease in TDA othergross profit was primarily attributable to the decrease of $2.6 million in TDA other revenue driven primarily by the decrease in auction feesearned from the local TDA hosted wholesale auction which was terminated in November 2018.
Wholesale
The following table presents our Wholesale segment results of operations for the years indicated: Year Ended December 31, 2018 2019 Change % Change (in thousands, except unit data) Wholesale revenue $ 174,514 $ 213,464 $38,950 22.3% Wholesale gross profit $ 3,257 $ 340 $ (2,917) (89.6%) Wholesale units sold 18,427 20,197 1,770 9.6% Average selling price per unit $ 9,471 $ 10,569 $ 1,099 11.6% Wholesale gross profit per unit $ 177 $ 17 $ (160) (90.5%)
Units
Wholesale units sold increased 1,770, or 9.6%, to 20,197 in 2019 from 18,427 in 2018 primarily driven by an increase in the numberof trade-in vehicles associated with the increased number of ecommerce units sold in 2019.
Revenue
Wholesale revenue increased $39.0 million, or 22.3%, to $213.5 million in 2019 from $174.5 million in 2018. Of this increase, $16.8million was attributable to the increase in wholesale units sold, while $22.2 million was attributable to a higher average selling price perwholesale unit which increased to $10,569 in 2019 from $9,471 in 2018.
91

Table of Contents
Gross Profit
Wholesale vehicle gross profit decreased $2.9 million, or 89.6%, to $0.3 million in 2019, from $3.3 million in 2018. Of this decrease,$3.2 million was attributable to a $160 decrease in wholesale gross profit per unit, partially offset by a $0.3 million increase attributable to theincrease in wholesale units sold in 2019, as compared to 2018.
Selling, general and administrative expenses Year Ended December 31, 2018 2019 Change % Change (in thousands) Compensation & benefits $ 63,024 $ 72,473 $ 9,449 15.0% Marketing expense 25,557 49,866 24,309 95.1% Outbound logistics 6,403 13,950 7,547 117.9% Occupancy and related costs 12,376 11,335 (1,041) (8.4)% Professional Services 2,624 11,560 8,936 340.5% Other 23,858 25,804 1,946 8.2%
Total selling, general & administrative expenses $ 133,842 $ 184,988 $51,146 38.2%
Selling, general and administrative expenses increased $51.1 million, or 38.2%, to $185.0 million for the year ended December 31,2019, from $133.8 million in 2018. The increase was primarily due to a $24.3 million increase in advertising and marketing efforts as weexpanded our national broad-reach advertising, a $9.4 million increase in compensation & benefits due to an increase in employeeheadcount throughout the organization as our business scales, a $8.9 million increase in professional expenses primarily related to preparingto become a public company and a $7.5 million increase in outbound logistics costs attributable to the growth in our ecommerce business.
Depreciation and amortization
Depreciation and amortization expenses decreased $0.8 million, or 12.2%, to $6.1 million for the year ended December 31, 2019 from$6.9 million in 2018. The decrease was primarily due to reduced depreciation as a result of the disposal and write-off of certain properties in2018.
Interest expense
Interest expense increased $6.1 million, or 71.5%, to $14.6 million for the year ended December 31, 2019 from $8.5 million in 2018.The increase was primarily attributable to higher inventory and a corresponding higher balance outstanding on our Vehicle Floorplan Facilityin 2019.
Interest Income
Interest income increased $2.5 million, or 78.9%, to $5.6 million from $3.1 million related to interest earned on increased cashdeposits maintained with Ally Bank.
92

Table of Contents
Quarterly Key Metrics and Results of Operations Supplemental data
The following table sets forth our key metrics and unaudited quarterly financial information for each of the nine most recent quartersfor the period ended March 31, 2020. We have prepared the unaudited quarterly results of operations data on a consistent basis with theconsolidated financial statements included elsewhere in this prospectus. In the opinion of management, the quarterly results of operationsdata reflect all necessary adjustments, consisting only of normal recurring adjustments, necessary for a fair statement of this data. Thisinformation should be read in conjunction with the consolidated financial statements and related notes included elsewhere in this prospectus.The results of historical periods are not necessarily indicative of results for a full year or for any future period. Three Months Ended,
Mar. 31,
2018 June 30,
2018 Sept. 30,
2018 Dec. 31,
2018 Mar. 31,
2019 June 30,
2019 Sept. 30,
2019 Dec. 31,
2019 Mar. 31,
2020 (in thousands, except unit data and average days to sale) (unaudited) Total revenues $ 230,011 $ 213,007 $ 211,824 $ 200,587 $ 235,059 $ 260,897 $ 340,273 $ 355,592 $ 375,772 Total gross profit $ 15,861 $ 17,219 $ 16,404 $ 11,323 $ 12,012 $ 13,845 $ 15,671 $ 16,331 $ 18,387 Ecommerce revenue $ 80,038 $ 63,932 $ 77,804 $ 79,398 $ 89,855 $ 120,953 $ 178,113 $ 199,193 $ 233,172 Ecommerce gross profit $ 4,965 $ 5,795 $ 6,637 $ 5,028 $ 5,754 $ 7,295 $ 8,774 $ 10,304 $ 14,267 Vehicle gross profit per ecommerce unit $ 1,461 $ 2,209 $ 1,941 $ 1,178 $ 1,421 $ 1,274 $ 929 $ 1,010 $ 845 Product gross profit per ecommerce unit 405 618 574 715 385 618 648 616 954
Total gross profit per ecommerce unit $ 1,866 $ 2,827 $ 2,515 $ 1,893 $ 1,806 $ 1,892 $ 1,577 $ 1,626 $ 1,799 Ecommerce units sold 2,661 2,050 2,639 2,656 3,187 3,856 5,563 6,339 7,930 TDA units sold 3,778 3,577 2,989 2,849 3,370 2,792 3,282 3,574 3,035 Wholesale units sold 4,702 4,659 4,906 4,160 5,230 5,396 5,420 4,151 4,685 Average monthly unique visitors 246,113 190,912 267,297 462,764 411,489 628,659 777,313 795,405 947,014 Vehicles available for sale 2,039 2,473 2,494 3,421 2,963 4,550 5,256 4,956 5,107 Ecommerce average days to sale 68 53 54 57 64 64 71 68 68 Total selling, general, and administrative expenses $ 38,065 $ 28,202 $ 28,378 $ 39,197 $ 36,583 $ 43,692 $ 50,934 $ 53,779 $ 58,380
Quarterly Trends
Ecommerce revenue trends
Our ecommerce revenue typically varies seasonally, with the used vehicle industry usually experiencing an increase in sales thatreaches its highest point late in the first quarter and early in the second quarter, which then diminishes through the rest of the year with thelowest level of sales in the fourth quarter. This seasonality typically corresponds with the timing of income tax refunds.
Ecommerce revenue fluctuated during 2018 due primarily to seasonality, but increased significantly during 2019 and into 2020because of the increase in ecommerce units sold attributable to our increased inventory levels, process improvements in our ecommerceplatform and strengthening of our national brand awareness, as well as higher average selling price per unit. This increase was acontinuation of accelerating growth we saw in the second half of 2019 when we meaningfully grew our inventory acquisitions, vehiclesavailable for sale and national marketing campaigns to drive and convert consumer demand. We expect ecommerce to continue to growdriven by increases in ecommerce units.
Gross profit trends
Our quarterly ecommerce gross profit in 2018, 2019 and the first quarter of 2020 increased consistently from approximately $5.0million in the first quarter of 2018 to $14.3 million in the first quarter of 2020, or approximately 187%. This increase was primarily attributableto increases in ecommerce units sold, partially offset by decreased gross profit per ecommerce units sold.
93

Table of Contents
Selling, general and administrative expense trends
Our quarterly total selling, general & administrative expenses increased consistently from the first quarter of 2019, primarily due toincreased advertising and marketing expenses as we expanded our national broad-reach advertising to build brand awareness and increaseconsumer traffic on our ecommerce platform. We also incurred increased compensation and benefits expenses due to an increase inemployee headcount throughout the organization as our business scaled, as well as increased outbound logistics costs attributable to thegrowth in our ecommerce business.
Liquidity and Capital Resources
Our operations historically have been financed primarily from the sale of redeemable convertible preferred stock and borrowingsunder our Vehicle Floorplan Facility and our Term Loan Facility. As of March 31, 2020, we had cash and cash equivalents of $169.8 million.
For the year ended December 31, 2019 and the three months ended March 31, 2020, we had negative cash flow from operations ofapproximately $215.6 million and $25.1 million, respectively, and generated a net loss of approximately $143.0 million and $41.1 million,respectively. We have not been profitable since our inception in 2012 and had an accumulated deficit of approximately $616.1 million as ofMarch 31, 2020. We expect to incur additional losses in the future.
Pursuant to a stock purchase agreement between us and certain accredited investors, in November and December 2019 we sold anaggregate of 8,371,664 shares of Series H Preferred Stock at a purchase price of $27.19 per share, for aggregate proceeds of$227.7 million. In January 2020, we sold an aggregate of 982,383 shares of Series H Preferred Stock in exchange for gross proceeds of$26.7 million. The discussion above does not give effect to the Forward Stock Split.
We historically have funded vehicle inventory purchases primarily through our Vehicle Floorplan Facility and, as of March 31, 2020,we had approximately $141.3 million available under such facility to fund future vehicle inventory purchases. In March 2020, we entered intoa new vehicle floorplan facility (the “2020 Vehicle Floorplan Facility”) with Ally Bank and Ally Financial, that provides a committed credit line ofup to $450.0 million. The commitment on the new facility expires in March 2021. We believe that, upon expiration, we will be able to renewthis facility or obtain alternative sources of financing on terms that are acceptable to us, as well as leverage our cash on hand to continue tofund our vehicle purchases. However, there can be no assurance we will be able to do so.
In response to the COVID-19 disruptions, we implemented a number of measures designed to protect the health and safety of ourworkforce, manage our inventory exposure and conserve liquidity, which include reducing our operating costs, including: furloughingapproximately one-third of our workforce, reducing salaries of our executives and employees and strategically evaluated our exposure toinventory and floorplan liability and reducing our marketing expenses. We believe we can continue to take similar actions to the extentnecessary to further reduce our operating costs. However, since we restarted vehicle acquisitions and increased our Vroom VRC operations,as of May 31, 2020, approximately 60% of furloughed employees have returned to work, primarily those employed in reconditioning, logisticsand acquisitions positions.
Our cash flows from operations may differ substantially from our net loss due to non-cash charges or due to changes in balance sheetaccounts. The timing of our cash flows from operating activities can also vary among periods due to the timing of payments made orreceived. Provided we raise sufficient proceeds in this offering, we anticipate that such proceeds, our existing cash and cash equivalents andthe vehicle floorplan facility will be sufficient to support our working capital and capital expenditure requirements for at least the next twelvemonths. However, there can be no assurance
94

Table of Contents
that we will be able to complete this offering and raise sufficient additional capital or take other actions that will provide us with sufficientliquidity to satisfy our obligations over the next twelve months or maintain sufficient levels of liquidity. Our future capital requirements willdepend on many factors, including our rate of revenue growth, our efforts to reduce costs per unit, the expansion of our inventory and salesand marketing activities, investment in our reconditioning and logistics operations, and enhancements to our ecommerce platform. We maybe required to seek additional equity or debt financing in the future to fund our operations or to fund our needs for capital expenditures. In theevent that additional financing is required, we may not be able to raise it on terms acceptable to us, or at all. If we are unable to raiseadditional capital or generate cash flows necessary to expand our operations, our business, results of operations and financial conditioncould be adversely affected.
Vehicle Financing
We entered into a vehicle floorplan facility in April 2016, as subsequently amended, with Ally Bank and Ally Financial, which we referto as our Vehicle Floorplan Facility. As of December 31, 2019, the Vehicle Floorplan Facility consisted of a revolving line of credit with aborrowing capacity of up to $220.0 million that could be used to finance our vehicle inventory.
In March 2020, we entered into the 2020 Vehicle Floorplan Facility, which replaces our prior Vehicle Floorplan Facility. The 2020Vehicle Floorplan Facility provides a committed credit line of up to $450.0 million which expires in March 2021. The amount of credit availableto us under the 2020 Vehicle Floorplan Facility is determined on a monthly basis based on a calculation that considers average outstandingborrowings and vehicle units paid off by us within the three immediately preceding months. Approximately $141.3 million was available underthis facility as of March 31, 2020. We may elect to increase our monthly credit line availability by an additional $25.0 million during any threemonths of each year. Outstanding borrowings are due as the vehicles financed are sold, or in any event, on the maturity date. The 2020Vehicle Floorplan Facility bears interest at a rate equal to the 1-Month LIBOR rate applicable in the immediately preceding month plus aspread of 425 basis points. Under the 2020 Vehicle Floorplan Facility, we are subject to financial covenants that require us to maintain acertain level of equity in the vehicles that are financed, to maintain at least 10% of the outstanding borrowings in cash and cash equivalents,to maintain 10% of the monthly credit line availability on deposit with Ally Bank and to maintain a minimum tangible adjusted net worth of$167.0 million, which is defined as shareholder (deficit) equity plus redeemable convertible preferred stock as determined under GAAP.
Term Loan Facility
On August 11, 2017, we entered into a loan and security agreement with Eastward Fund Management, LLC for a term loan creditfacility in an aggregate principal amount of up to $50.0 million. On the closing date, we borrowed $25.0 million of principal and paid a$0.5 million facility fee to the lender and certain other issuance costs that were deducted from the proceeds. As of December 31, 2018, theoutstanding balance on the Term Loan Facility, net of unamortized debt issuance costs of $0.7 million was $24.3 million. In December 2019,we repaid in full the outstanding balance of the Term Loan Facility in the amount of $17.9 million.
95

Table of Contents
Cash Flows from Operating, Investing, and Financing Activities
The following table summarizes our cash flows for the years ended December 31, 2018 and 2019 and for the three months endedMarch 31, 2019 and 2020:
Year Ended
December 31, Three Months Ended
March 31, 2018 2019 2019 2020 (in thousands) (in thousands) (unaudited) Net cash used in operating activities $ (64,911) $ (215,636) $ (37,917) $ (25,145) Net cash provided by (used in) investing activities 12,788 (3,528) (261) (1,699) Net cash provided by financing activities 132,375 275,242 15,455 9,600
Net increase (decrease) in cash and cash equivalents 80,252 56,078 (22,723) (17,244) Cash, cash equivalents and restricted cash at beginning of period 83,257 163,509 163,509 219,587
Cash, cash equivalents and restricted cash at end of period $ 163,509 $ 219,587 $ 140,786 $ 202,343
Operating Activities
Net cash flows used in operating activities decreased $12.8 million, or 33.7%, to $25.1 million for the three months ended March 31,2020, as compared to $37.9 million for the three months ended March 31, 2019. The decrease is primarily attributable to a decrease inworking capital requirements, primarily related to a lower inventory levels in response to the COVID-19 pandemic, resulting in a decrease inuse of cash of $33.1 million. Additionally, this decrease was partially offset by $10.4 million in incremental net loss after reconcilingadjustments and the net cash outflows related to changes in our operating assets and liabilities for the three months ended March 31, 2020,as compared with the three months ended March 31, 2019.
Net cash flows used in operating activities increased $150.7 million, or 232.2%, to $215.6 million for the year ended December 31,2019, as compared to $64.9 million in 2018. The increase is primarily attributable to $53.1 million in incremental net loss after reconcilingadjustments and an increase in working capital requirements as we scale our business, primarily related to an increase in our inventorylevels, resulting in an increase in use of cash of $104.8 million.
Investing Activities
Net cash flows used in investing activities increased $1.4 million, to $1.7 million for the three months ended March 31, 2020, ascompared to the three months ended March 31, 2019, primarily as a result of increases in capitalization of software development cost.
Net cash flows used in investing activities was $3.5 million for the year ended December 31, 2019, as compared to net cash flowsprovided by investing activities of $12.8 million in 2018. In 2018, net cash flows provided by investing activities included proceeds receivedfrom the sale of certain property and equipment. There were no proceeds received from the sale of property and equipment in 2019.
Financing Activities
Net cash flows provided by financing activities decreased $5.9 million, or 37.9%, to $9.6 million for the three months ended March 31,2020, as compared to the three months ended March 31, 2019.
96

Table of Contents
Proceeds from and payments on our Vehicle Floorplan Facility changed from the net cash inflow of $16.2 million for the three months endedMarch 31, 2019 to the net cash outflow of $8.3 million for the three months ended March 31, 2020, resulting in a net decrease in cashprovided by financing activities of $24.5 million, primarily due to a decrease in our working capital requirements related to the decreases inour inventory levels in order to respond to the COVID-19 disruptions. Additionally, for the three months ended March 31, 2020, net cash flowprovided by financing activities included a $1.1 million payment of issuance costs related to the 2020 Vehicle Floorplan Facility and $0.8million of payments related to planned initial public offering costs. These decreases were partially offset by the issuance of $21.7 million ofSeries H preferred stock, net of issuance costs paid, for the three months ended March 31, 2020.
Net cash flows provided by financing activities increased $142.9 million, or 107.9%, to $275.2 million for the year ended December31, 2019, as compared to 2018. Net cash flows provided by financing activities in 2019 included the issuance of $227.5 million of Series Hpreferred stock, as compared to the issuance of $145.9 million of Series G preferred stock in 2018. Additionally, proceeds from andpayments on our Vehicle Floorplan Facility increased $343.9 million and $258.0 million, respectively, resulting in a net increase in cashprovided by financing activities of $85.9 million for the year ended December 31, 2019, as compared to 2018. These increases were partiallyoffset by $25.2 million of repayments of our long-term debt in 2019.
Contractual Obligations and Commitments
The following table summarizes our contractual obligations and commitments as of December 31, 2019: Payments Due by Year
Total Less than 1 year 1-3 years 3-5 years More than 5
years (in thousands) Vehicle Floorplan Facility (excluding interest) $173,461 $ 173,461 $ — $ — $ — Operating leases 20,093 5,509 11,139 3,445 — Other 1,468 352 872 244 —
Total $195,022 $ 179,322 $12,011 $ 3,689 $ —
Off Balance Sheet Arrangements
We do not have any off balance sheet arrangements, as defined by applicable regulations of the SEC, that are reasonably likely tohave a current or future material effect on our financial condition, results of operations, liquidity, capital expenditures or capital resources.
JOBS Act
We ceased to be an emerging growth company as of December 31, 2019, due to generating more than $1.07 billion in annualrevenue for the year ended December 31, 2019. However, because we ceased to be an emerging growth company after we confidentiallysubmitted our registration statement related to this offering to the SEC, we will be treated as an “emerging growth company” as defined in theJobs Act for certain purposes until the earlier of the date on which we complete this offering and December 31, 2020. As such, we intend totake advantage of certain reduced disclosure and other requirements that are otherwise applicable generally to public companies. Theseprovisions include:
• only two years of audited financial statements are required to be included in this prospectus, in addition to any required interimfinancial statements, and correspondingly reduced disclosure in
97

Table of Contents
this “Management’s Discussion and Analysis of Financial Condition and Results of Operations;” and
• reduced disclosure obligations regarding executive compensation in this prospectus.
In addition, Section 107 of the JOBS Act also provides that an emerging growth company can use an extended transition period forcomplying with new or revised accounting standards. This permits an emerging growth company to delay the adoption of certain accountingstandards until those standards would otherwise apply to private companies. We elected to use this extended transition period under theJOBS Act.
Critical Accounting Policies and Estimates
Our consolidated financial statements are prepared in accordance with GAAP. The preparation of consolidated financial statementsrequires us to make estimates, assumptions and judgments that affect the reported amounts of assets, liabilities, revenue, and expenses andrelated disclosures. On an ongoing basis, we evaluate our estimates, including, among others, those related to income taxes, the realizabilityof inventory, stock-based compensation, revenue-related reserves, as well as impairment of goodwill and long-lived assets. We base ourestimates on historical experience, market conditions and on various other assumptions that are believed to be reasonable. Actual resultsmay differ from these estimates.
We believe that the accounting policies described below involve a significant degree of judgment and complexity. Accordingly, webelieve these are the most critical to aid in fully understanding and evaluating our financial condition and results of operations. For furtherinformation, see “Note 2—Summary of Significant Accounting Policies” and “Note 3—Revenue Recognition” in the Notes to ConsolidatedFinancial Statements included elsewhere in this prospectus.
Revenue Recognition
We elected to early adopt ASU 2014-09, Revenue from Contracts with Customers (“Topic 606”), as of January 1, 2018 utilizing themodified retrospective approach applied only to contracts not completed as of the date of adoption.
We recognized a net decrease to accumulated deficit of approximately $1.7 million as of January 1, 2018 due to the cumulative effectof adopting Topic 606.
Revenue consists of retail vehicle sales through our ecommerce platform and TDA retail location, wholesale vehicle sales and otherrevenues. Revenue also includes delivery charges. Our product revenue consists of fees earned on customer vehicle financing from third-party lenders and fees earned on sales of other value-added products, such as extended warranty contracts, GAP protection and wheel andtire coverage.
We recognize revenue upon transfer of control of goods or services to customers, in an amount that reflects the consideration towhich we expect to be entitled in exchange for those goods or services. We may collect sales taxes and other taxes from customers onbehalf of governmental authorities at the time of sale as required. These taxes are accounted for on a net basis and are not included inrevenues or cost of sales.
Our revenue is disaggregated within the consolidated statement of operations and is generated from customers throughout the UnitedStates.
98

Table of Contents
Retail Vehicle Revenue
We sell vehicles to our retail customers through our Ecommerce segment and our TDA segment. The transaction price for vehicles isa fixed amount as set forth within the customer contract at the time of sale. Customers frequently trade-in their existing vehicle to apply theamount received for such vehicle towards the transaction price of a purchased vehicle. Trade-in vehicles represent noncash consideration,which we measure at an agreed upon price based on fair value, which is based on external and internal market data for each specific vehicle.We generally satisfy our performance obligation and recognize revenue for vehicle sales at a point in time when the vehicles are delivered tothe customers for ecommerce sales or picked up by the customer for TDA sales. The revenue recognized by us includes the agreed upontransaction price, including any delivery charges stated within the customer contract. Revenue excludes any sales taxes, title and registrationfees, and other government fees that are collected from customers.
We receive payment for vehicle sales directly from the customer at the time of sale or from third-party financial institutions within ashort period of time following the sale if the customer obtains financing. Payments received prior to delivery or pick-up of used vehicles arerecorded as “Deferred revenue” within the consolidated balance sheet.
We offer a return policy for used vehicle sales and establish a provision for estimated returns based on historical information andcurrent trends. The reserve for estimated returns is presented gross on the consolidated balance sheet, with an asset recorded in “Prepaidexpenses and other current assets” and a refund liability recorded in “Other current liabilities.”
Wholesale Vehicle Revenue
We sell vehicles that do not meet our Vroom retail sales criteria primarily through wholesale auctions. Vehicles sold at auctions areacquired from customers who trade-in their vehicles when making a purchase from us and also from customers who sell their vehicles to usin direct-buy transactions. The transaction price for a wholesale vehicle is a fixed amount that is determined at the auction. We satisfy ourperformance obligation and recognize revenue for wholesale vehicle sales when the vehicle is sold at auction. The transaction price istypically due and collected within a short period of time following the vehicle sales.
Product Revenue
Our product revenue consists of fees earned on customer vehicle financing from third-party lenders and fees earned on sales of othervalue-added products such as extended warranty contracts, GAP protection and wheel and tire coverage. We sell these products pursuant toarrangements with the third parties that provide these products and are responsible for their fulfilment. We concluded that we are an agentfor these transactions because we do not control the products before they are transferred to the customer. As an agent, our performanceobligation is to arrange for the third party to provide the products. We recognize product revenues on a net basis when the customer entersinto an arrangement for the products, which is typically at the time of a used vehicle sale.
Customers may enter into retail installment sales contracts to finance the purchase of used vehicles. We sell these contracts on anon-recourse basis to various financial institutions. We receive fees from the financial institution based on the difference between the interestrate charged to the customer that purchased the vehicle and the interest rate set by the financial institution. These fees are recognized uponsale and assignment of the installment sales contract to the financial institution.
A portion of the fees earned on these products is subject to chargebacks in the event of early termination, default, or prepayment ofthe contracts by end-customers. Our exposure for these events
99

Table of Contents
is limited to fees that we receive. An estimated refund liability for chargebacks against the revenue recognized from sales of these products isrecorded in the period in which the related revenue is recognized and is based primarily on our historical chargeback experience. We updateour estimates at each reporting date. As of December 31, 2018 and 2019 and March 31, 2020, our reserve for chargebacks wasapproximately $1.7 million, $3.3 million and $3.5 million, respectively.
We also are contractually entitled to receive profit-sharing revenues based on the performance of the protection policies once arequired claims period has passed. We recognize profit-sharing revenue to the extent it is probable that it will not result in a significantrevenue reversal. We estimate the revenue based on historical claims and cancellation data from our customers, as well as other qualitativeassumptions. We reassess the estimate at each reporting period with any changes reflected as an adjustment to revenues in the periodidentified. As of December 31, 2018 and 2019 and March 31, 2020, we had recognized approximately $4.2 million, $6.9 million and $8.0million, respectively, related to cumulative profit-sharing payments to which we expect to be entitled.
Other Revenue
Other revenue primarily consists of labor and parts revenue earned by us for vehicle repair services at TDA.
Inventory
Inventory consists of vehicles and parts and accessories and is stated at the lower of cost or net realizable value. Inventory cost isdetermined by specific identification and includes acquisition cost, direct and indirect reconditioning costs, and in-bound transportation costs.Net realizable value is the estimated selling price less costs to complete, dispose and transport the vehicles. We recognize any necessaryadjustments to reflect inventory at the lower of cost or net realizable value in cost of sales in the consolidated statements of operations.
Shipping and Handling
Our logistics costs relate to transporting vehicle inventory and are primarily third-party transportation fees. The portion of these costsrelated to inbound transportation from the point of acquisition to the relevant reconditioning facility is included within inventory andreclassified into cost of sales when the related vehicle is sold. Logistics costs related to delivery vehicles sold to customers are accounted foras costs to fulfil contracts with customers and are included in “Selling, general and administrative expenses” in the consolidated statement ofoperations and were approximately $6.4 million and $14.0 million for the years ended December 31, 2018 and 2019, respectively, and $2.3million and $5.8 million for the three months ended March 31, 2019 and 2020, respectively.
Leases
We elected to early adopt Topic 842 as of January 1, 2020 using the modified retrospective approach with any cumulative-effectadjustment to opening retained earnings (accumulated deficit) with no restatement of comparative periods. Upon adoption, we recognized$18.4 million of operating lease liabilities and $17.4 million of operating lease right-of-use assets.
The adoption of Topic 842 did not result in a cumulative effect adjustment to accumulated deficit. We elected to utilize the package ofpractical expedients for transition which permitted us to not reassess our prior conclusions regarding whether a contract is or contains alease, lease classification and initial direct costs.
100

Table of Contents
We did not elect the hindsight practical expedient to determine lease terms. We elected the short-term lease recognition exemption forall leases that qualify and the practical expedient to not separate lease and non-lease components of leases.
Goodwill and Intangible Assets
Goodwill represents the excess of the consideration transferred over the fair value of the identifiable assets acquired and liabilitiesassumed in business combinations. Goodwill is tested for impairment annually as of October 1, or whenever events or changes incircumstances indicate that an impairment may exist.
We have three reporting units: Ecommerce, TDA and Wholesale. In performing our annual goodwill impairment test, we first reviewqualitative factors to determine whether it is more likely than not that the fair value of a reporting unit is less than its carrying amount. If, afterassessing qualitative factors, we determine that it is not more likely than not that the fair value of a reporting unit is less than its carryingamount, then performing the quantitative test is unnecessary and our goodwill is not considered to be impaired. However, if based on thequalitative assessment we conclude that it is more likely than not that the fair value of the reporting unit is less than its carrying amount, or ifwe elect to bypass the optional qualitative assessment as provided for under GAAP, we proceed with performing the quantitative impairmenttest.
As a result of developments in the current economic environment related to the COVID-19 pandemic and its impact on the operationsof our physical retail location, we determined that an interim quantitative goodwill impairment test was required for the TDA reporting unit asof March 31, 2020. The results of the quantitative test indicated that the fair value of the TDA reporting unit substantially exceeded carryingvalue and that the TDA reporting unit was not at risk of failing the quantitative impairment test. The quantitative impairment test wasperformed utilizing the discounted cash flow method described further below. The projected cash flows utilized for the impairment test weredeveloped by us to reflect the expected impact from the COVID-19 pandemic based on information that is known or knowable. Given theuncertainties regarding the magnitude and duration of the COVID-19 pandemic and the length of time over which the disruptions caused byCOVID-19 will continue, we also performed a sensitivity analysis whereby we adjusted our cash flow projections to assume a slower thanexpected recovery. The results of the sensitivity analysis indicated that the fair value of the TDA reporting unit would still exceed carryingvalue.
Given the amount the fair value for the Ecommerce and Wholesale reporting units exceeded their carrying values, and afterconsidering other relevant qualitative factors, we determined that interim goodwill impairment tests were not required for these reporting unitsas of March 31, 2020, as we determined that it is not more likely than not the fair value is less than the carrying value.
No goodwill impairment was determined to exist for the years ended December 31, 2018 and 2019. In connection with our annualgoodwill impairment test as of October 1, 2019, we performed qualitative impairment assessments for each of our reporting units. The resultsof the qualitative assessments indicated that it was not more likely than not that the fair values of the reporting units were less than thecarrying values. In connection with our annual goodwill impairment test as of October 1, 2018, we performed qualitative impairmentassessments for the Ecommerce and Wholesale reporting units. The results of the qualitative assessments indicated that it was not morelikely than not that the fair value of the reporting units were less than the carrying values. For our TDA reporting unit in 2018, we determinedthe most effective approach was to bypass the optional qualitative assessment and perform a quantitative impairment test. The results of thequantitative test indicated that the fair value of the TDA reporting unit substantially exceeded carrying value and that the TDA reporting unitwas not at risk of failing the quantitative impairment test.
101

Table of Contents
The quantitative goodwill impairment test requires a determination of whether the estimated fair value of a reporting unit is less thanits carrying value. We estimate the fair value of our reporting units using an income valuation approach. The income valuation approach isapplied using the discounted cash flow method which requires (1) estimating future cash flows for a discrete projection period (2) estimatingthe terminal value, which reflects the remaining value that the reporting unit is expected to generate beyond the projection period and(3) discounting those amounts to present value at a discount rate which is based on a weighted average cost of capital that considers therelative risk of the cash flows. The income valuation approach requires the use of significant estimates and assumptions, which includerevenue growth rates, future gross profit margins and operating expenses used to calculate projected future cash flows, determination of theweighted average cost of capital, and future economic and market conditions. The terminal value is based on an exit multiple which requiressignificant assumptions regarding the selection of appropriate multiples that consider relevant market trading data. We base our estimatesand assumptions on our knowledge of the automotive and ecommerce industries, our recent performance, our expectations of futureperformance and other assumptions we believe to be reasonable. Actual future results may differ from those estimates. We also makecertain judgments and assumptions in allocating shared assets and liabilities to determine the carrying values for each of our reporting units.
Our intangible assets are amortized on a straight-line basis over the following estimated useful lives:
Trademarks 5 yearsTechnology 4 years
We periodically reassess the useful lives of the definite-lived intangible assets when events or circumstances indicate that useful liveshave significantly changed from the previous estimate.
Impairment of Long-Lived Assets
We evaluate long-lived assets, including definite-lived intangible assets, for impairment whenever events or changes in circumstancesindicate that the carrying amount of an asset may not be recoverable. When impairment indicators are present, the recoverability of an assetis measured by comparing the carrying value of the asset to the estimated undiscounted future cash flows expected to be generated by theasset. If the asset is considered to be impaired, the impairment to be recognized is measured by the amount by which the carrying amount ofthe asset exceeds the fair value of the asset. No impairment charges were recognized for the years ended December 31, 2018 and 2019.
Income Taxes
We account for income taxes under the asset and liability method. We recognize deferred tax assets and liabilities for the future taxconsequences attributable to differences between the financial statement carrying amounts of existing assets and liabilities and theirrespective tax basis, as well as for operating loss and tax credit carry forwards. We measure deferred tax assets and liabilities using enactedtax rates expected to apply to taxable income in the years in which we expect to recover or settle those temporary differences. We recognizethe effect of a change in tax rates on deferred tax assets and liabilities in the results of operations in the period that includes the enactmentdate. We reduce the measurement of a deferred tax asset, if necessary, by a valuation allowance if it is “more-likely-than-not” that we will notrealize some or all of the deferred tax asset. We maintained a full valuation allowance against net deferred tax assets because wedetermined that is it more likely than not that these assets will not be fully realized based on a current evaluation of expected future taxableincome and we are in a cumulative loss position.
102

Table of Contents
We account for uncertain tax positions by recognizing the financial statement effects of a tax position only when, based upon technicalmerits, it is “more likely than not” that the position will be sustained upon examination. Potential interest and penalties associated withunrecognized tax positions are recognized in income tax expense.
Stock-Based Compensation
We recognize the cost of employee services received in exchange for stock awards based on the fair value of those awards at thedate of grant over the requisite service period. We use the Black-Scholes-Merton option-pricing model, which we refer to as Black Scholesoption-pricing model, to determine the fair value of our stock-based awards. Estimating the fair value of stock-based awards requires theinput of subjective assumptions, including the estimated fair value of our common stock, the expected life of the options, stock price volatility,the risk-free interest rate and expected dividends. The assumptions used in the Black-Scholes option-pricing model represent our bestestimates and involve a number of variables, uncertainties and assumptions and the application of management’s judgment, as they areinherently subjective.
Recently Issued and Adopted Accounting Pronouncements
See “Note 2—Summary of Significant Accounting Policies—Adoption of New Accounting Standards” in the Notes to consolidatedFinancial Statements included in this prospectus for a discussion of accounting pronouncements recently adopted and recently issuedaccounting pronouncements not yet adopted and their potential impact to our consolidated financial statements.
Quantitative and Qualitative Disclosure About Market Risk
Market risk is the risk of economic losses due to adverse changes in financial market prices and rates. Our primary market risk hasbeen interest rate risk and inflation risk. We do not have material exposure to commodity risk.
Interest Rate Risk
As of December 31, 2018, 2019 and March 31, 2020, we had an outstanding balance under the vehicle floorplan facility of$95.5 million, $173.5 million and $165.2 million, respectively. The vehicle floorplan facility bears interest at a rate equal to the 1-Month LIBORrate applicable in the immediately preceding month, plus a spread of 425 basis points. A hypothetical 10% change in interest rates during theyears presented would result in a change to annual interest expense of $0.8 million, $1.0 million and $0.3 million for the years endedDecember 31, 2018 and 2019 as well as the three months ended March 31, 2020, respectively.
As of December 31, 2018, we had an outstanding balance under the Term Loan Facility of $24.3 million net of issuance cost. InDecember 2019, we repaid in full the outstanding balance of the Term Loan Facility. The Term Loan Facility incurred interest at theone-month LIBOR rate as of the borrowing date.
Inflation Risk
Inflationary factors such as increases in overhead costs may adversely affect our operating results. Although we do not believe thatinflation has had a material impact on our financial position or results of operations to date, a high rate of inflation in the future may have anadverse effect on our ability to maintain current levels of operating expenses as a percentage of revenue, if the selling prices of our productsdo not increase with these increased costs.
103

Table of Contents
BUSINESS
Our Vision
Build the world’s premier platform to research, discover, buy and sell vehicles.
Our Company
Vroom is an innovative, end-to-end ecommerce platform that is transforming the used vehicle industry by offering a better way to buyand a better way to sell used vehicles. We are deeply committed to creating an exceptional experience for our customers.
We are driving enduring change in the industry on a national scale. We take a vertically integrated, asset-light approach that isreinventing all phases of the vehicle buying and selling process, from discovery to delivery and everything in between. Our platformencompasses:
• Ecommerce: We offer an exceptional ecommerce experience for our customers. In contrast to legacy dealerships and thepeer-to-peer market, we provide consumers with a personalized and intuitive ecommerce interface to research and select fromthousands of fully reconditioned vehicles. Our platform is accessible at any time on any device and provides transparent pricing,real-time financing and nationwide contact-free delivery right to a buyer’s driveway. For consumers looking to sell or trade in theirvehicles, we provide attractive market-based pricing, real-time, guaranteed purchase offers and convenient, at-home vehicle pick-up.
• Vehicle Operations: Our scalable and vertically integrated operations underpin our business model. We strategically sourceinventory from auctions, consumers, rental car companies and dealers. We improve our ability to acquire high-demand vehiclesthrough enhanced supply science across all our sourcing channels and we are expanding our national marketing efforts to driveconsumer sourcing. In our reconditioning and logistics operations, we deploy an asset-light strategy that optimizes a combination ofownership and operation of assets by us with strategic third-party partnerships. This hybrid approach provides flexibility, agility andspeed without taking on unnecessary risk and capital investment, and drives improved unit economics and operating leverage.
• Data Science and Experimentation: Data science and experimentation are at the core of everything we do. We rely on datascience, machine learning and A/B and multivariate testing to continually drive optimization and operating leverage across ourecommerce and vehicle operations. We leverage data to increase the effectiveness of our national brand and performancemarketing, enhance the customer experience, analyze market dynamics at scale, calibrate our vehicle pricing and optimize ouroverall inventory sales velocity. On the operations side, data science and experimentation enables us to fine tune our supply,sourcing and logistics models and to streamline our reconditioning processes.
The U.S. used automotive market is the largest consumer product category, generating approximately $841 billion from sales ofapproximately 40 million units in 2019. The industry is highly fragmented with over 42,000 dealers and millions of peer-to-peer transactions. Italso is ripe for disruption as an industry that is notorious for consumer dissatisfaction and has one of the lowest levels of ecommercepenetration at only 0.9%. Industry reports estimate that ecommerce penetration will grow to as much as half of all used vehicle sales by2030. Our platform, coupled with our national presence and brand, provides a significant competitive advantage versus local dealerships andregional players that lack nationwide reach and scalable technology, operations and logistics. The traditional auto dealers and peer-to-peermarket do not and cannot offer consumers what we offer.
104

Table of Contents
In December 2015, we acquired Houston-based TDA, which included our Vroom VRC, our sole physical retail location and our Sell UsYour Car® centers. From the launch of our combined operations in January 2016, our business has grown significantly as we have scaledour operations, developed our ecommerce platform and leveraged the network effects inherent in our model. Our ecommerce revenue grewat a 77.0% CAGR from 2016 to 2019, including year-over-year growth of 95.3% from 2018 to 2019.
Ecommerce Revenue
For the year ended December 31, 2019, we generated $1.2 billion in total revenue, representing a 39.3% increase over $855.4 millionfor the year ended December 31, 2018. For the three months ended March 31, 2020, we generated $375.8 million in total revenue,representing a 59.9% increase over $235.1 million for the three months ended March 31, 2019. Our business generated a net loss of$85.2 million, $143.0 million, $27.1 million and $41.1 million for the years ended December 31, 2018, 2019 and for the three months endedMarch 31, 2019 and 2020, respectively. We intend to continue to invest in growth to scale our company responsibly and drive towardsprofitability.
Our Industry and Market Opportunity
The U.S. used automotive industry is a massive market that is ripe for disruption due to its fragmentation, high level of consumerdissatisfaction, changing consumer buying patterns and lack of ecommerce and technology penetration.
The U.S. Used Automotive Market is Massive
The U.S. used automotive market is the largest consumer product category, generating approximately $841 billion from sales ofapproximately 40 million units in 2019. The used automotive market has sustained growth over time at significant scale, growing by$148 billion from sales of $693 billion in 2015 to $841 billion in 2019.15 15 2015 used automotive industry market size calculated from 2015 total units sold and 2015 average selling price according to Edmunds 2019 Report.
105

Table of Contents
Industry Market Size
The U.S. Used Automotive Market is Highly Fragmented
Against the massive total addressable market of approximately $841 billion, the used automotive market is highly fragmented withapproximately 42,000 automotive dealers and millions of peer-to-peer transactions across the country. Across all used vehicle sales in 2018,the largest U.S. used vehicle dealer had a market-share of only 1.8%, with the top 100 used vehicle dealers collectively representing only8.6%.
Additionally, distribution of the approximately 40 million used vehicles sold in 2018 is highly fragmented and consists of approximately20 million vehicles sold by franchised dealers and independent vehicle dealers (50%), which includes limited ecommerce sales, andapproximately 20 million units sold by peer-to-peer sellers (50%), all of which represent our total addressable market.16 16 Cox Automotive Data.
106

Table of Contents
Market Share by Unit (2018)17
Finally, of the dealership retail vehicles sold in 2019, approximately 39% had a selling price of over $20,000, which is where themajority of our inventory is priced. In addition, approximately 47% were less than five years old, which is the average age of our inventory.With close to 19,000 units sold in 2019, we addressed 0.2% of each of retail units priced over $20,000 and retail units below five years inage.
Retail Units Sold Distribution by Price (2019)18 Retail Units Sold Distribution by Age (2019)19
17 See footnote 5 for CarMax and top 100 dealers market share calculation. Market share of peer to peer sales according to Cox Automotive Data.18 Cox Automotive Data.19 Cox Automotive Data.
107

Table of Contents
The Primary Competitors in the U.S. Used Automotive Market Rely on an Outdated Business Model
The traditional dealership model involves limited selection, lack of transparency, high pressure sales tactics and inconvenient hours.These shortcomings have caused many consumers to circumvent the dealer and transact on their own, creating a large peer-to-peer marketfor used vehicles. However, the peer-to-peer market comes with its own set of challenges for both buyers and sellers, entailing home visits bystrangers, lack of secure payment methods or identity checks, difficulty researching available vehicles and lack of verified vehicle condition.Presented with these alternatives, the overwhelming majority of consumers are dissatisfied with the current automotive buying and sellingexperience. According to a 2019 Gallup survey, vehicle salespersons consistently rank as one of the least trusted professions, with only 9%of respondents reporting trust in that profession. Furthermore, in another survey, 81% of respondents reported dissatisfaction in the carbuying process.
Ecommerce Penetration in the U.S. Used Automotive Market is Just Beginning
The used automotive market has one of the lowest ecommerce penetration levels, with only a 0.9% share of all retail used automotivesales in 2018, representing significant upside as compared to the current ecommerce penetration of other consumer product categories.Industry reports estimate that ecommerce penetration will grow to as much as half of all used vehicle sales by 2030. In a 2019 survey, 49%of consumers reported that they are willing to make a vehicle purchase online.20 Furthermore, while it is too soon to measure the long-termimpact of the COVID-19 pandemic on consumer behavior, in a survey conducted after the onset of the COVID-19 pandemic, 61% ofrespondents were open to buying a vehicle online as compared to 32% prior to the COVID-19 pandemic. Moreover, in another surveyconducted after the onset of the COVID-19 pandemic, consumers reported reduced use of ride-sharing services, greater use of personalvehicles and an increase in willingness to purchase a vehicle.21
Ecommerce Penetration
Consumers Increasingly Desire Convenience and Customization through Ecommerce
Following the pattern in other consumer retail categories, the U.S. retail used automotive market is experiencing shifting consumerbuying patterns from in-store towards online purchases. In particular, mobile commerce is poised for even faster growth than broaderecommerce. Consumers are increasingly focused on customized products and personalized services, while also expecting delivery of thoseproducts and services on-demand. This trend creates opportunities for us as we offer an extensive inventory from which consumers canselect not only the make and model of a vehicle, but also the model year, color, trim and options in many combinations across any device atany time. This selection, combined with personalized search results, offers a customized shopping experience not possible at a traditionalused vehicle dealer or in the peer-to-peer market. 20 Digital Commerce 360 Report.21 Cars.com, Ride-Sharing Drops, Online Car Shopping Increases in Coronavirus’ Wake, March 2020.
108
Table of Contents
Used is the new “New”
Consumers are becoming increasingly willing to buy used goods. In 2019, 64% of vehicle shoppers considered buying a used vehiclebefore making a purchase decision, up from 61% in 2018. At the same time, the average price differential between new and three-year-oldused vehicles grew from $11,000 in 2015 to nearly $14,000 per vehicle in 2018.22 As a result, owning or leasing a new vehicle has becomeincreasingly unaffordable. Additionally, in 2019, used vehicle sales exceeded 98% as a percentage of new vehicle sales, up from 89% in theprevious year, further demonstrating consumers’ shifting preferences towards used cars. The purchase of a used vehicle enables aconsumer to obtain a fully reconditioned vehicle at a higher standard of luxury or with highly sought-after features for the same dollar amountas a new, lesser-model vehicle. In this shifting market, Used is the new “New.”
The U.S. Used Automotive Market is Growing and Resilient
American consumers continue to exhibit entrenched vehicle ownership trends with approximately 284 million registered vehicles onthe road in 2019, as compared to 279 million in 2018. Further, approximately 91.5% of families in the United States had at least one vehiclein 2018. Despite the rise in ridesharing and vehicle sharing, 83% of all U.S. adults drove a vehicle at least several times a week in 2018.23Additionally, the retail used vehicle market generally shows resilience through recessionary markets and other challenging economic cycles.Used car sales (including wholesale and retail) showed a much more muted decline of 11.9% from 2007 to 2009, while new car salesdeclined by 21.5% from 2007 to 2009. While the average new vehicle gross profit margin fell from 6.9% in 2007 to 6.7% in 2009, usedvehicle gross profit margins (including wholesale and retail) increased from 8.9% in 2007 to 9.4% in 2009. While it is too soon to know howthe used vehicle industry will perform once the COVID-19 pandemic has subsided, we believe the industry will continue to show resilienceand that our model is well suited to fulfill consumer demand for ecommerce vehicle transactions and convenient, contact-free delivery.
In light of the fragmentation, consumer dissatisfaction and lack of ecommerce penetration of the used vehicle industry, there is roomfor multiple participants to disrupt the traditional dealership model and peer-to-peer market by offering ecommerce solutions that leveragetechnology and data analytics to achieve superior operational efficiency and exceptional customer experience.
What We Do: Offer a Better Way
We are driving a better way to buy and a better way to sell used vehicles and bringing about enduring change in the industry. Ourplatform brings together all phases of the vehicle buying and selling process in a seamless, intuitive and convenient way. We create a climateof trust and provide an exceptional experience with complete transparency by eliminating friction and sales pressure. The traditional autodealers and peer-to-peer market do not and cannot offer consumers what we offer. We offer a better way.
A Better Way to Buy
For consumers looking to buy a used vehicle, we offer a value proposition that differs markedly from traditional auto dealers and thepeer-to-peer market. We are dedicated to helping customers evolve from wary shoppers to confident owners by streamlining the entirebuying process, from discovery through financing to delivery, by offering the following:
• Enormous Selection of Inventory. We currently offer a growing inventory of thousands of low-mileage, high-demand vehicles.By making purchasing decisions based on data rather than
22 Edmunds 2019 Outlook.23 Gallup, July 2019.
109

Table of Contents
intuition, we are able to offer a wide selection of vehicles that excite our customers. Consumers no longer have to settle fortraditional dealerships with a limited number of vehicles on hand or scour local peer-to-peer listings and travel to a seller’s location.
• Consistent High Quality. All of our vehicles pass our detailed inspections and meet our proprietary Vroom Reconditioning
Standards, which result in high-quality used vehicles backed by our free Vroom 90-Day Limited Warranty. We never lose sight ofthe fact that the used vehicles we sell are “new” to our customers.
• Comprehensive and Transparent Vehicle Information. We remove the asymmetry of information between dealers andconsumers by providing comprehensive and transparent information on the vehicles we sell. We eliminate bait-and-switch riskthrough high-resolution photography and detailed product descriptions on our platform, which show our customers every aspect ofour vehicles from all angles, and provide third-party vehicle history reports on all of our vehicles.
• Customized Vehicle Search and Discovery. In addition to the size and diversity of our inventory selection, we provide buyers
with a personalized, intuitive interface with detailed sorting, searching and filtering functionality. This enables our customers toresearch and discover the right car for their unique needs.
• Competitive, Market-based Pricing. We price our vehicles using data science and proprietary algorithms, ensuring that buyersreceive attractive, market-based, no-haggle pricing. Our pricing strategy takes into account hundreds of variables when determiningthe accurate market price of a vehicle, including items beyond make, model and color that are unavailable to traditional dealerships,such as proprietary historical purchase and sales data.
• Exceptional Customer Support. Our professional customer experience team accompanies the buyer through every step of the
process to make sure all questions are answered and any concerns are addressed. In all of our customer interactions, our goal is toensure that every customer is a delighted customer.
• On-Demand Shopping and Contact-Free, Convenient Delivery Experience. We offer customers the ability to shop for theirdesired vehicle at any time, on any device and from any location. We also deliver our vehicles nationwide to a location of ourcustomer’s choosing. Our on-demand shopping and contact-free, convenient delivery not only saves our customers a trip to thedealership, it provides the ultimate driveway experience.
• Value-Added Products. We provide seamlessly integrated, real-time, individualized financing solutions through our strategicpartnerships with trusted lenders in automotive finance and give our customers access to competitive market rates. We also offerthird-party finance and protection products, including other extended warranty contracts, GAP protection and wheel and tirecoverage, all with transparent pricing.
• Assurance. Our Vroom 7-Day Return Policy offers customers seven days or 250 miles to test drive their purchase with their
family, versus a seven-minute test drive around the block at a dealership. This fundamentally transforms the customers’ test driveexperience by providing the opportunity to see truly how their vehicle performs in day-to-day life.
110

Table of Contents
A Better Way to Sell
We are revolutionizing the process for consumers to sell or trade-in their vehicles. Consumers typically encounter either low-ballprices from their local dealer or face the prospect of advertising and selling the vehicle themselves in a time-consuming process through thepeer-to-peer market. In contrast, we offer consumers the following:
• Ease of Use. We offer the ease of online submission of basic vehicle information in order to receive an appraisal. There is no trip
to the dealership and no cost to submit a vehicle for sale, but rather a simple, hassle-free process enabling customers to sell ustheir vehicles.
• On-Demand Appraisals. Our Sell Us Your Car® proposition gives customers on-demand appraisals. We utilize our extensive
data insights and experience across thousands of transactions to generate a purchase offer that reflects a competitive market-based price, providing customers a fast and easy customer experience.
• A Guaranteed, Real-Time Price on Every Vehicle. For every vehicle that customers submit for appraisal, we provide aguaranteed price and purchase offer.
• No High-Pressure Tactics. We keep all purchase offers open for two days or 250 miles. This process allows customers to shop,
compare and analyze the sale of their vehicle from the convenience of their home to ensure they are getting the best value,eliminating pressure to take a deal on the spot.
• Convenient, Contact-Free Vehicle Pick-ups. Our customers enjoy the convenience of national, at-home contact-free vehiclepick-up free of charge within days of accepting our offer.
• No Hastle Pay-offs. As an added convenience, we offer hassle-free customer payment and/or pay-off of any loans on the vehiclebeing sold, saving the customer time and paperwork.
Our Competitive Strengths
A Leading Ecommerce Platform for Used Vehicles
We offer an end-to-end, ecommerce platform for buying, selling, transporting, reconditioning, pricing, financing, registering anddelivering vehicles nationwide. Our platform encompasses every element of the customer experience and ensures quality and consistency.Our customer-centric business model addresses the shortcomings of the traditional dealership model and peer-to-peer market. We combinehigh-quality and high-demand vehicles, asset-light, scalable reconditioning operations, a national logistics network and an exceptionalecommerce experience. In addition, our ability to control the entire customer value chain from demand generation to pick-up or delivery to thecustomer’s driveway creates operating leverage as we scale, further driving the network effects inherent in our business and contributing toour path to profitability.
Asset-Light, Scalable Operations
An asset-light strategy is fundamental to our business model, and our future growth strategies are focused on developing ourecommerce business without the need for capital investment in physical retail locations. We seek to optimize the combination of ownershipand operation of assets by us, with strategic third-party partnerships. Our strategy provides flexibility, agility and speed as we scale ourbusiness, without taking on the unnecessary risk and capital investment inherent in direct investment. We employ this hybrid approachacross our business and utilize strategic relationships with experienced and trusted providers to optimize reconditioning services, logistics,consumer financing and customer experience.
Reconditioning Facilities. Our hybrid approach combines the use of our Vroom VRC and third-party VRCs to best meet ourreconditioning needs as we continue to expand our business. Powered by
111

Table of Contents
lean manufacturing technology, our Vroom VRC currently handles the reconditioning of a majority of our vehicles. We also leverage ourpartnerships with third parties within the reconditioning industry to recondition the remainder of the vehicles in our inventory to our VroomReconditioning Standards, which creates capacity to scale quickly and efficiently, while simultaneously reducing our capital commitments andexpanding our geographic footprint.
VRC Locations24
Logistics. We primarily use third-party carriers for our inbound and outbound logistics operations while also developing ourproprietary logistics capabilities. Our strategic carrier arrangements with national haulers allow us to efficiently deliver vehicles to customersthroughout the United States while focusing on expanding other critical components of our business, such as the volume and selection ofvehicles in our inventory. This strategy enhances the flexibility, agility and speed of our growth and reduces the capital commitments inlogistics required to achieve such growth.
Customer Financing. By partnering with many of the largest and most trusted banks in the world, including our strategic lenderrelationship with Chase, we arrange reliable vehicle financing for our customers while avoiding the increased risk associated withunderwriting consumer debt and carrying financing receivables on our books. This low-risk, high-margin financing structure enables us toprovide customers with an essential aspect of the vehicle-buying process without adding additional debt commitments to our balance sheetand operational cost and complexities to our business.
Customer Experience Team. In addition to our in-house customer support personnel, we have partnered with a leading customerexperience management provider to operate our primary call center. This strategy enables us to centralize our contact center services,ensure consistency in customer interactions, increase conversion and maximize operating efficiencies.
Relentless Focus on Data Science
Data science is at the core of everything we do, and all aspects of our business are enhanced by data analytics. In an industry thathistorically used intuition and basic industry-wide data to drive purchasing and pricing decisions, we are moving from intuition to algorithm.We are expanding and continuously improving our access to data, using data science and machine learning across our business to maximizeefficiency. Our proprietary technology, machine learning and data analytics models continuously optimize our marketing investments andconversion funnel, fine-tune our supply, 24 National Automobile Dealers Organization.
112

Table of Contents
sourcing and logistics models, calibrate our vehicle pricing, streamline our reconditioning processes and optimize our overall inventory salesvelocity.
Continuous Experimentation and Innovation at Scale
We strive to make key decisions based on data and testing. We continuously experiment using A/B and multivariate testingmethodologies to drive conversion, innovation and improved unit economics. We test variables involved in sourcing, buying, reconditioning,and managing our inventory, and make decisions based on the data insights gained from such continuous experimentation. We integrate afull-stack statistics engine that is connected to our front-and back-end operations, enabling us to A/B test across all aspects of our business,including our marketing and conversion funnel, inventory procurement, management, refurbishment and sales processes. For example, werun testing on our pricing algorithms as a way to better understand the relationship between price point and time listed as it relates toprobability of sale and profitability. We utilize A/B tests against several variables, such as size and rate of price adjustments, as a way tooptimize our price adjustment curves.
National Market Penetration and Brand
Our national presence provides a significant competitive advantage versus local dealerships and regional players that lack scalabletechnology, operations and logistics, and are unable to take advantage of the efficiencies and lower costs of national brand advertising. Weare able to deliver a superior customer experience through the breadth and diversity of our national inventory of thousands of vehicles on ourplatform. Consumers no longer have to settle for whatever the local dealer has on the lot or scour local peer-to-peer listings and travel to aseller’s location for a unknown, time-consuming experience, which is demonstrated by our NPS score of 52 as of March 31, 2020.Additionally, our customers enjoy the convenience of national, at-home delivery and pick-up of vehicles. We also leverage our nationalmarketing campaigns to efficiently increase brand awareness and attract and convert new customers at lower cost. Our brand’s nationalreach provides a significant advantage over local dealers who typically rely on costly local or regional advertising campaigns.
Difficult to Replicate Business Model
Our platform overcomes the unique operational and technological challenges associated with buying and selling used vehicles in anecommerce channel. Each vehicle that we offer through our platform has a unique VIN and requires multiple touch points, includingappraisal, inspection, reconditioning, photography, pricing and delivery. It requires significant funding sources to finance the acquisition ofinventory, the ability to source and manage complex inventory, pricing and appraisal optimization skills, reconditioning expertise andsophisticated logistics capabilities. Given the significance of the purchase to a consumer, it also requires professional customer service and abrand that consumers can trust. These elements make our platform difficult to replicate. Our operational experience and the improvementswe have made over time serve as important competitive moats. As we optimize the reconditioning process and home delivery, we benefitfrom years of data collected and lessons learned from having reconditioned and delivered tens of thousands of vehicles since our founding.To succeed, any new entrant to ecommerce used auto sales would require data-driven automotive expertise, ecommerce capabilities andscalable operations integrated in a single platform. While it is too soon to know how the used vehicle industry will perform once the COVID-19 pandemic has subsided, we believe the industry will continue to show resilience and that our model is well suited to fulfill consumerdemand for ecommerce vehicle transactions and convenient, contact-free delivery.
Seasoned Leadership Team and an Exceptional Culture
Our success to date has been built on a culture that reflects our values: s.p.e.e.d – obsessive customer service, unwaveringcommitment to progress, appreciation of our employees, high
113

Table of Contents
engagement, and passionate development. We maintain a deep commitment to prudent corporate governance, transparency,accountability and collaboration. The leadership team is comprised of seasoned executives who possess cross-vertical experience in theecommerce, technology, retail and automotive sectors, and have a demonstrated track record of scaling businesses and achieving profitablegrowth. Building on lessons learned and experience leading digital disruption in other fields, we believe we can bring the same level ofinnovation to the automotive retail industry.
Our Growth Strategies and Path to Profitability
The core elements of our platform—ecommerce, vehicle operations and data science and experimentation—serve as the foundationof our growth strategies and path to profitability.
Drive Growth
Our business has grown significantly as we have scaled our operations. Our growth is not attributable to a single innovation orbreakthrough, but to coalescence around multiple strategies that serve as points on our flywheel. The diversity and number of vehicles in ourinventory drive demand and support expanded national marketing to enable us to acquire new customers more cost effectively, allowing us toinvest back into our platform to continue to improve the customer experience, all of which drives increased conversion. This flywheelrevolves, builds momentum and ultimately propels our business forward as we seek to drive disciplined growth and operating leverage.
Growth Flywheel
Grow and Optimize Vehicle Inventory
As a data driven business, we measure demand at the unique VIN level and use data analytics to inform our pricing and inventoryselection. This enables us to curate an optimal inventory that matches market demand signals, driving higher conversion and sales. As wegrow, we will continuously refine our inventory mix and expand our offerings across vehicle price points to serve a greater range of customersand increase our demand and conversion opportunities.
114

Table of Contents
Expand Marketing and Maximize ROI
The strength of our brand and effectiveness of our advertising programs is critical to our ability to attract new customers costeffectively. Leveraging our advanced data analytics, we will continue to invest in national marketing campaigns and targeted performancemarketing to identify, attract and convert new customers at lower cost. This strategy provides a significant advantage over local dealers whotypically rely on costly local or regional campaigns and enables us to maximize return on our marketing spend. We also run sophisticateddigital marketing across various vehicle listing sites, constantly monitoring performance and maximizing ROI with limited reliance on any oneplatform. Additionally, to date we have used search aggregators and social media platforms for advertising on a very limited basis, and wecontinuously seek new cost-efficient marketing opportunities and channels.
Deliver Exceptional Customer Experience
We believe that customer experience is fundamental to our ability to convert consumers into customers, attract new customers andensure repeat customers. We seek to provide customers with an intuitive, trustworthy and convenient buying and selling experience, and wewill continue to invest in our platform to further streamline the transaction process for our customers. We will also continue to invest in thedevelopment of our mobile experiences, including iOS and Android mobile applications, to strengthen customer engagement. We believethese investments will lead to greater consumer traffic to our platform, higher levels of customer satisfaction and increased conversion andsales.
Increase Conversion
Sales conversion drives revenue growth and is an output of the acceleration of every point on the growth flywheel. We will continue toinvest in our technology framework to optimize all aspects of our conversion funnel by constantly A/B testing our web and mobile applicationsto ensure we are displaying the features and formats that are most likely to resonate with our customers and lead to increased sales.
Drive Profitability
Our business model benefits from network effects and significant operating leverage as it scales. We believe that improvements in ourunit economics are the foundation to driving profitability and will be achieved by scaling and optimizing the following elements of our platform:
115

Table of Contents
Optimize Vehicle Acquisition and Pricing
We strategically source inventory from auctions, consumers, rental car companies and dealers. We improve our ability to acquire theright vehicle at the right price through enhanced supply science across all our sourcing channels. We are expanding our national marketingefforts featuring our Sell Us Your Car® proposition to drive consumer sourcing. As a result, we expect to increase the number of vehicles wepurchase from consumers, which typically generate higher gross profit per unit when sold compared to other inventory sources. In parallel,we continue to invest in data analytics and machine learning to optimize vehicle acquisition and pricing, increase sales velocity and driveprofitability. We also intend to pursue third-party inventory that will expand our sourcing channels while offering attractive revenue models inan asset light, debt free structure.
Increase Reconditioning Capacity
As we scale our business, we intend to invest in increased reconditioning capacity. In addition to achieving cost savings andoperational efficiencies, we will be focused on lowering our days to sale. We will continue to employ a hybrid approach that combines the useof Vroom VRCs with geographically dispersed third-party VRCs to best meet our reconditioning needs. As a key step in this strategy, goingforward we intend to make capital investments in additional Vroom VRCs. At the same time, we are expanding our third-party VRC locationsto provide added scale with reduced lead-time and greater flexibility. As we search for additional Vroom VRC and third-party VRC locations,leveraging our data analytics and deep industry experience, we take into account a combination of factors, including proximity to customers,transportation costs, access to inbound inventory and sustainable low-cost labor. All of these initiatives are designed to lower reconditioningcosts per unit, and thereby improve per unit economics while enhancing the customer experience.
Expand Value-Added Products
Every vehicle sale creates potential for multiple additional revenue streams, including fees earned on third-party vehicle financing andfees from the sale of other value-added products. As we expand our business, we believe there are substantial opportunities to increaseattachment rates on our existing value-added products through training, merchandising and technology enhancements. Strategicpartnerships with lenders such as Chase and Santander provide enhanced revenue streams for us, as well as offering convenience,assurance and efficiency for our customers. Introducing new types of vehicle related finance and protection products can provide additionalrevenues going forward. Because we are paid fees on the value-added products we sell, our gross profit on such products is equal to therevenue we generate on such sales. In addition to expanding our offering of value-added products, in the longer term, we see a significantopportunity to provide our customers with complementary services such as entertainment and location-based services. The addition of newvalue-added products and services will not only increase our product offerings and profitability but will also strengthen and extend ourinteractions with customers.
Strategically Develop Logistics Network
We primarily use third-party carriers for our inbound and outbound vehicle transport, and are in the process of developing strategiccarrier arrangements with national haulers in order to optimize our logistics network. As part of our hybrid approach, we also operate our ownlogistics network in select markets and intend to continually evaluate and strategically expand our proprietary logistics operations. Inoptimizing our logistics network, our VRCs also serve as pooling points to aggregate acquired vehicles and can serve as hubs for stagingvehicles for last-mile delivery to customers, which we expect will result in an improved delivery and pick-up experience for customers. Weexpect these enhanced logistics operations, combined with the expansion of strategically located VRCs, will drive lower inbound andoutbound logistics costs.
116

Table of Contents
Capitalize on New Product and Market Opportunities
Expand our Platform to Additional Products and Markets
We have designed and built an innovative platform with countless potential applications. We have the potential to leverage ourplatform for expansion into adjacent areas of technology-enabled commerce and fully deploy our technology, data analytics and businessexperience to take advantage of the opportunities this creates. We will have the flexibility to opportunistically pursue opportunities acrossmarkets, potentially including additional transportation and vehicle markets, global geographic markets and B-to-B business models.
Continue to Innovate on New Capabilities
Technological developments have had a significant impact on the automobile industry and are expected to continue to have an impactfor the foreseeable future. Electrification and shared mobility in particular are expected to have a transformative impact on roadtransportation. We continuously monitor developments in autonomy, ride-hailing and ride-sharing as it relates to the overall automotivemarket, and we are well-positioned to expand our capabilities to participate actively as the industry evolves. As the automotive landscapedevelops, we will seek to capitalize on new opportunities.
Our Customer Experience
Buying a Vehicle
Our platform provides prospective purchasers of vehicles a differentiated buying experience compared to traditional auto dealers andthe peer-to-peer market. This experience enables customers to easily browse our vast inventory, explore and arrange financing alternatives,select additional value-added products and schedule and coordinate the delivery of the purchased vehicle to a location of their choice.
Browsing our Inventory
Our platform provides customers the ability to browse an inventory of thousands of vehicles, including a broad selection of lowmileage, high-demand vehicles, through any connected device. We give customers the ability to filter our selection of vehicles, including bymake, model, mileage, color and other factors. Once a customer has selected a vehicle from our inventory, the customer can review thevehicle’s profile, which includes approximately 20 high resolution photographs of the vehicle, a description of the vehicle and its features andownership history. The description of the vehicle includes items such as body type, description of color scheme, VIN, fuel type, drive type,engine, transmission and other features, including items such as Bluetooth connectivity, rear-view cameras and heated seats. The platformprovides an enhanced vehicle purchasing experience by giving customers immediate and complete transparency with respect to thecondition and features of a vehicle.
117

Table of Contents
Making it Yours
Following vehicle selection, customers promptly receive a call from a member of our customer experience team. The customerexperience representative is available to answer any questions and to help the customer finalize the transaction. For customers who requirefinancing, the agent also will assist in the loan application process and will inform the customer of the terms on which their vehicle financinghas been approved. Depending on the customer’s payment method and how much information the customer has previously provided online,this call can include taking a deposit, taking a down payment, collecting required identification documents, providing further details aboutwhere to mail their payment, and/or providing any applicable trade-in documents.
Selecting Value-Added Products
As the customer completes the purchase process, the customer experience representative explains the value-added product options,including extended warranty contracts, GAP protection and wheel and tire coverage. Upon selection by the customer, we arrange for deliveryof the value-added products through our network of third-party partners.
Getting it Delivered
The last step in the customer journey involves arranging for vehicle delivery. Customers select the location and timing of deliveryalong with any specific delivery instructions, and we arrange the delivery with our network of third-party carriers. In Orlando, Floridaand Dallas, Texas, we provide Vroom last-mile delivery service, which involves delivery by a Vroom employee in one of our proprietarysingle-vehicle haulers. In response to the COVID-19 pandemic, we have increased the level of cleaning and sanitation of vehicles prior tomaking delivery to our customers, and also adjusted our delivery protocols to provide contact-free delivery to customers. After delivery iscomplete, under our Vroom 7-Day Return Policy, we offer customers seven days or 250 miles to test drive their purchase and return thevehicle to us if they are not satisfied.
Our 7-day (or 250-mile) return period starts once the vehicle is delivered to a customer, or when the customer picks it up from TDA. Acustomer can get to know the vehicle for a full week (or until driving it 250 miles, whichever comes first). To initiate a return, a customersimply emails us at a designated e-mail address or calls us at a toll-free number. For ecommerce customers, we then pick up the vehicle freeof charge and refund to the customer all amounts paid for the vehicle and any purchased value-added products, along with all fees andtaxes, other than the delivery fee. For TDA customers, they return the vehicle to our retail location and receive a full refund, other than arestocking fee.
Selling a Vehicle
We are replacing the time-consuming and stressful vehicle selling process with a hassle-free, contact-free experience that enablescustomers to sell us their vehicles quickly and efficiently using any desktop or mobile device. We have also adjusted our protocols to providefor contact-free pickup from customers in response to the COVID-19 pandemic. Customers answer a brief set of questions about their vehicleand receive a guaranteed purchase offer from Vroom. Customers who accept this offer then provide the basic documentation required (whichoften includes a title and mileage statement), after which Vroom provides free vehicle pick-up from the convenience of the customer’s home.We offer convenient customer payment and/or pay-off of any loans on the vehicle being sold, saving the customer time and paperwork.
118

Table of Contents
Tell Us About Your Car
Customers who choose the Sell Us Your Car® proposition visit our platform and start by providing a VIN. From there, the customerconfirms or updates information about the vehicle, including information such as make, model and mileage. This step generally takes only afew minutes. Customers do not need to provide photographs of the vehicle, as our data analytics tools are able to accurately appraise thevalue of a vehicle based on the answers provided. Unlike the peer-to-peer market or traditional dealership offers, the Vroom offer is fullyguaranteed.
Get Your Appraisal and Offer
Upon receiving a customer’s application for an appraisal, we run the vehicle information through our central vehicle database in orderto generate a competitive appraisal based on market demand, estimated reconditioning costs, depreciation and other factors that impact theretail and wholesale value of the vehicle. In order to offer customers the best value for their vehicle, we rely on a number of external andinternal data points. Additionally, our customer experience team will provide customer assistance and answer any potential questionscustomers may have regarding their appraisal and the final offer made on their vehicle.
We Pick It Up, You Get Paid
After a customer has accepted our guaranteed purchase offer on their vehicle, a customer can arrange payment and at-home vehiclepick-up free of charge within days of accepting our offer. Using our network of third-party logistics operators, we arrange for vehicle pick-upfrom the convenience of the customer’s home. In response to the COVID-19 pandemic, we have adjusted our logistics protocols to providecontact-free pick-up of vehicles from customers. If the vehicle we are picking up is to be resold by us through our retail channel, we ship it toone of our VRCs for reconditioning; if the vehicle we are picking up is to be sold at wholesale, we ship it to the nearest wholesale auction tobe sold. Once the vehicle has been picked-up, and we have received the title documentation, the customer receives payment.
Trade-in Optionality
We also give customers the option of using the value of the vehicle that they are looking to sell to us towards the purchase of a newvehicle through our platform. If a customer opts for a trade-in, we do not typically transmit any payment to the customer, and instead applythe value of the customer’s existing car towards lowering the overall amount of cash and/or financing for their new vehicle.
Our Marketing
We operate a multi-channel marketing strategy that includes both national brand and digital performance, marketing. We leveragevarious digital performance channels, including automotive
119

Table of Contents
aggregator sites, to generate demand for Vroom inventory by VIN. In these channels, we manage the national distribution footprint of eachVIN by continually optimizing its forward distribution to maximize consumer demand and achieve planned conversion, sales velocity andprofitability.
We also run a national brand campaign through TV and online media, which commenced in the first quarter of 2019, and has shownstrong momentum in its first year. Between the first quarter of 2019 and the first quarter of 2020, we have more than doubled total brandleads to our website, which means a customer began his or her journey by going straight to our website, and meaningfully increased oursales mix of direct brand leads. Because brand leads convert at a higher rate than all other marketing channels, we believe that continuedgrowth of our national brand marketing campaign and an increasing mix of brand leads will improve our marketing efficiency. Brand mediadrives demand with consumers who are responding to the Vroom consumer value propositions of an online purchase process, home delivery,no-haggle prices, convenient trade-in, and overall transparency.
We analyze visitor traffic and customer interaction with our platform to identify and correlate visitor behavior with sales conversion.Our analytics enables us to measure and monitor the ROI generated by our marketing placements, which we then use to optimize placementand spend across marketing channels to balance sales velocity and profitability.
In May 2020, we entered into an agreement with Rocket Auto LLC and certain of its affiliates (collectively, “Rocket”) providing for thelaunch of an e-commerce platform under the “Rocket Auto” brand for the marketing and sale of vehicles directly to consumers (the “RAAgreement”). We will list our used vehicle inventory for sale on the Rocket Auto platform, but all sales of Vroom inventory will be conductedthrough our platform. Rocket Auto is expected to launch publicly during the third quarter of this year and, during the term of the RAAgreement, Rocket will ensure that not less than a minimum percentage of all used vehicles sold or leased through the platform on a monthlybasis will be Vroom inventory. We will pay Rocket a combination of cash and stock for vehicle sales made through the platform, includingupfront equity consisting of 183,870 shares of our common stock that were issued upon execution of the RA Agreement, and the potentialissuance to Rocket of up to an additional 8,641,914 shares of our common stock (collectively with the shares issued upon execution, the “RAShares”), over a four-year period based upon sales volume of Vroom inventory through the Rocket Auto platform.
Our Operations
Inventory Management
Our inventory assortment and pricing models ingest millions of data points each day as we monitor, calibrate, and adjust our inventoryposition to fluctuations in the national market and within our ecommerce platform, including predicted sales performance and real-timecustomer demand and conversion.
Inventory Planning
Using national demand and conversion data, including both Vroom historical performance and third-party sales, we establish targetinventory levels by vehicle type, price point, mileage, features, and other key attributes. We seek to maintain an optimal inventory mix toproduce desired profits, sales velocity, and conversion outcomes as we manage our overall gross profit and growth rates.
Inventory Procurement
We source inventory from auctions, consumers, rental car companies and dealers. As we acquire vehicles, we continuously monitorinventory levels against our overall inventory model. In sourcing vehicles, we ingest supply available for sale nationally in the wholesalemarket and target vehicles for
120

Table of Contents
purchase based on our retail criteria, target margins, expected sales velocity and consumer demand that we see on our ecommerce platformand across our network of marketing partners.
Inventory Pricing
Using recent national sales data and leveraging proprietary data analytics, we establish the likely fair market value of each distinctVIN in our inventory, making adjustments based on the unique characteristics of the vehicle. Once the vehicle is posted for sale, we monitorreal-time demand, conversion, sales velocity, and profitability data across our listed inventory. Using our data analytics, we constantlyevaluate a variety of variables that impact conversion and adjust pricing, if needed, within our profitability targets.
Vehicle Operations
Our systems evaluate each new unit of inventory that we acquire in real-time. We use our proprietary software to process each unitincluding, queuing it for transport, assessing its reconditioning needs, tracking its location, and ultimately managing the vehicle through thereconditioning process.
Inbound Logistics
Upon acquisition, each vehicle is queued for pick-up and routed to an appropriate destination.
For retail-quality units we intend to recondition and sell, we analyze the time and cost required to transport a unit to each VRC, andthen select the appropriate facility based on each VRC’s current capacity and cycle time. The unit is then queued for delivery with a Vroomregional transport partner.
For units we intend to sell wholesale, we immediately queue transportation to the nearest auction site.
Our logistics algorithms are under continuous development and we expect to drive further efficiency in the near- and mid-term as weexpand our national network of VRCs as well as incorporate additional inventory aggregation hubs.
Reconditioning
As newly purchased vehicles arrive at our VRCs, our proprietary reconditioning management software platform tracks every cosmeticand mechanical defect, as well as progress towards remediation, including level of effort, elapsed work time, estimated and actual costs,parts required and assigned personnel. Our reconditioning process has been lean-optimized to achieve target speed and quality metrics andreduce waste. Throughout the process, vehicle movement, queues, and cycle times are captured in real-time. Our teams measureperformance against target throughput goals and a variety of additional operational metrics.
Once reconditioned, the vehicle goes through rigorous inspections and tests to comply with Vroom Reconditioning Standards.Vehicles that cannot satisfy Vroom Reconditioning Standards are flagged for wholesale disposition.
We have partnered with a leading national parts supplier to operate a large parts store within our Vroom VRC, complete with anon-site stockroom that maintains real-time availability for common parts, as well as expedited delivery for special orders.
Listing for Sale
We use proprietary software that supports full 360-degree exterior and interior views to capture high resolution pictures of eachvehicle. These images are instantly transferred to our centralized cloud platform for quality control and for listing on vroom.com and third-party listing sites.
121

Table of Contents
Transaction Processing
We have invested in technology and processes to streamline payment, financing, documentation and registration processes for ourcustomers.
Payment and Financing
Customers who wish to finance a vehicle may apply for a vehicle loan on our platform. We collect a basic set of personal and financialinformation, which we then transmit to a network of national lending partners. As offers are returned from this collective inquiry, we thenselect and present an option or options for each customer. We collect the required loan stipulations—for example, we ask the customer toupload a photo of their driver’s license—and facilitate the origination of the loan.
Once we collect a deposit, our system takes the vehicle off market and seamlessly synchronizes vehicle status on vroom.com andany other third-party listing site.
Documentation
Each transaction on our platform requires supporting documentation based on the transaction type (buy, sell, financed, cash, etc.) andlocal, state and federal regulation.
As customers progress through the purchase and sale processes, our systems generate the required supporting documents, populatethe documents with the details of the transaction, and then deliver the completed documents as electronic files. Many of these documentscan then be presented to the customer, signed, stored, and transmitted electronically. Where wet ink signatures are mandated, we produceprinted copies and then mail the contracts for the customer to execute.
Titling and Registration
We receive, store, and deliver the title associated with most of the vehicles we buy and with all of the vehicles we sell. We comply withlocal title regulations to support title transfers. In some cases, we manage the title and vehicle registration process on behalf of ourcustomers. Given the sensitivity of titles, we monitor and control the titling process with specialized business process automation software.
Other Value-Added Products
We present customers with applicable value-added products based on the characteristics of their vehicle purchase, including vehicleage, loan-to-value ratio, vehicle price, and customer location. If, for example, we present an extended warranty option to a customer, weseamlessly integrate with national insurance underwriters such as Safe-Guard to calculate the cost, length, and scope of the product to offer.Because our national lending partners provide loan approvals with loan capacity to accommodate value-added products without exceedingthe maximum approved amount, many customers are able to finance these value-added products along with their vehicle at a very lowincremental monthly cost.
Delivery and Pickup
Upon completion of a customer’s vehicle purchase, the customer experience team contacts the customer to confirm and monitor thevehicle delivery process. Meanwhile, at the applicable VRC, the vehicle is retrieved, washed, inspected, staged and scheduled for pick-up bya national transportation provider. In some transactions, the vehicle may be dropped off at a local Vroom delivery hub where a Vroomemployee completes the home delivery with a Vroom delivery truck. In response to the COVID-19 pandemic, we have increased the level ofcleaning and sanitation of vehicles prior to making delivery to our customers, and also adjusted our delivery protocols to provide delivery tocustomers.
122

Table of Contents
Deliveries per County25
Customers also can sell a vehicle to us through our platform, either as a direct transaction or as a trade-in on a vehicle purchase.Using our national logistics processes and infrastructure, we queue the customer’s vehicle for pick-up and transport to the optimalreconditioning center or to a nearby wholesale auction.
Customer Experience Team
At any point in the buying or selling process, our customers may encounter questions or challenges they are not equipped to orcomfortable with resolving online. Our customer experience team provides human support to our customers in these situations. Our customerexperience team handles customer questions about vehicle selection, financing, and the purchase or sale process. The team has beentrained on our sale process and our core values of transparency and high customer satisfaction.
Our Technology
Technology and data science are the foundation of all of our operations and strategic decision making.
Data Science
Our team of over 40 data scientists and engineers continuously extract and analyze additional information, processing over160 million data points daily to create models that inform purchasing, pricing and market decisions, allowing us to understand price elasticity.We adjust price as a function of overall market value trend, taking into account competitor inventory, market price fluctuations, and relativeinventory advantages. Leveraging this data and machine learning-based forecasting, our proprietary algorithms have historically beencapable of forecasting sales out 60 days to within a 2% margin of error. 25 Total deliveries shown for deliveries made in 2019.
123

Table of Contents
Core to our underlying technology is the real-time collection of customer and inventory data. We analyze and act on the data in realtime. As our systems collect new or updated incoming data signals, those signals are immediately available to downstream systems to triggerparallel event processes. For example, we employ data science to match incoming customers with patterns we’ve identified in previouscustomers to enable us to score, in real-time, the new customer’s likely conversion outcome. The score is available to inform our sales teamsand provide real-time performance marketing, as well as real-time reporting and analytics. Further, we monitor performance against the scoreto create algorithms which are continuously learning and improving.
Our technology supports multi-channel engagement with our customers, delivering consistent messaging via the web, in native appsand via email. In cases where customers need special attention outside of our ecommerce experience, we provide customer assistance viaphone.
Reconditioning
Our proprietary reconditioning technology, Vendor Lanes, allows us to quickly and cost-effectively repair vehicles, enabling us toprocess a larger number of vehicles through our facility to keep up with demand. The step-by-step process we have in place includes allaspects of preparing a vehicle for sale, including a multi-point inspection, mechanical and body reconditioning, paint, detail, merchandisingand imaging.
Our reconditioning technology is driven by years of know-how and expertise that enable us to operate facilities efficiently. Forexample, technology investments in lean manufacturing techniques have enabled us to produce 50% more units/day at consistent quality.We operate our facilities with various vendors specializing in each part of the repair process, allowing us to gain advantaged economics andconduct the most efficient process.
Competition
The U.S. used vehicle market is highly fragmented, with over 42,000 traditional franchised and independent dealerships nationwide aswell as the peer-to-peer market. The players in the used vehicle market can be classified into the following segments:
• traditional new and used car dealerships;
• large, national car dealers, such as CarMax and AutoNation, which are expanding into online sales, including “omni-channel”offerings;
• used car dealers or marketplaces that currently have existing ecommerce businesses or online platforms, such as Carvana;
• the peer-to-peer market, utilizing sites such as Facebook, Craigslist.com, eBay Motors and Nextdoor.com; and
• sales by rental car companies directly to consumers of used vehicles which were previously utilized in rental fleets, such as HertzCar Sales and Enterprise Car Sales.
Internet and online automotive sites could change their models to sell used vehicles and compete with us, such as Google, Amazon,AutoTrader.com, Edmunds.com, KBB.com, Autobytel.com, TrueCar.com, CarGurus and Cars.com. In addition, automobile manufacturerssuch as General Motors, Ford and Volkswagen could change their sales models to better compete with our model through technology andinfrastructure investments. While such enterprises may change their business models and endeavor to compete with us, the sale of usedvehicles through ecommerce presents unique operational and technical challenges. See “Business—Our Competitive Strengths—Difficult toReplicate Business Model.”
124

Table of Contents
We view our main competitors to be the traditional auto dealers, who make up the significant portion of U.S. used vehicle sales andare still operating under an outdated business model that is ripe for disruption.
Employees
As of March 31, 2020 we had approximately 800 employees. None of our employees is represented by a labor union. We consider ourrelationships with our employees to be good and have not experienced any interruptions of operations due to labor disagreements.
In response to the COVID-19 disruptions, we have implemented a number of measures to protect the health and safety of ourworkforce. These measures include restrictions on non-essential business travel, the institution of work-from-home policies wherever feasibleand the implementation of strategies for workplace safety at our facilities that remain open. We are following the guidance from public healthofficials and government agencies, including implementation of enhanced cleaning measures, social distancing guidelines and wearing ofmasks. In addition, effective May 3, 2020, approximately one-third of our workforce was placed on furlough. The majority of employeesfurloughed were in reconditioning, logistics, acquisitions and TDA sales, which were the positions most affected by the reduction in unitvolume. However, since we restarted vehicle acquisitions and increased our Vroom VRC operations, as of May 31, 2020, approximately 60%of furloughed employees have returned to work, primarily those employed in reconditioning, logistics and acquisitions positions. Furloughedemployees remain enrolled in our medical plan through July 31, 2020, and we are paying the current cost of the employee’s portion of themedical plan premiums in addition to the employer portion. Additionally, we have instituted an across-the-board salary reduction for our non-furloughed salaried employees, with our CEO forgoing 30% of his salary, each member of our senior leadership team taking a 20% salaryreduction, and the balance of the employees experiencing reductions of 5-15% based upon salary levels.
Facilities
Our corporate headquarters is located in New York, New York, and consists of approximately 22,549 square feet of space under alease that expires in September 2024. We use these facilities for finance, legal, human resources, information technology, engineering, salesand marketing and other administrative functions. We also lease office space outside Houston, Texas, which we use to support ouradministrative functions, under a lease that expires in March 2024.
Additionally, we operate our Vroom VRC located outside Houston, Texas, under a lease that expires in December 2021. We use ourVroom VRC to recondition vehicles.
We also operate TDA, our sole physical retail location, outside Houston, Texas under a lease that expires in December 2021.
We believe our existing and planned facilities are sufficient for our current needs and that, should it be needed, suitable additional oralternative space will be available to accommodate our operations.
Intellectual Property
The protection of our technology and intellectual property is an important aspect of our business. We seek to protect our intellectualproperty rights, including our intellectual property rights in our technology, through trademark, trade secret and copyright law, as well asconfidentiality agreements, procedures and other contractual commitments and other legal rights. We generally enter into confidentialityagreements and invention assignment agreements with our employees and consultants to control access to, and clarify ownership of, ourproprietary information.
125
Table of Contents
As of March 31, 2020, we do not own any U.S. or foreign patents and do not have any U.S. or foreign patent applications pending. Asof March 31, 2020, we owned 14 registrations for our trademarks in the United States, including Vroom®, Vroom Get In®, TDA®,DealerLane®, Texas Direct® and Sell Us Your Car®. As of March 31, 2020, we held registered trademarks in Mexico, Canada and Peru forthe Vroom® trademark and have several pending applications to register the Vroom® trademark in other jurisdictions. We continually reviewour branding strategies and technology development efforts to assess the existence, registrability, and patentability of new intellectualproperty.
Intellectual property laws, procedures and restrictions provide only limited protection and any of our intellectual property rights may bechallenged, invalidated, circumvented, infringed or misappropriated. Further, the laws of certain countries do not protect proprietary rights tothe same extent as the laws of the United States, and, therefore, in certain jurisdictions, we may be unable to protect our proprietarytechnology, brands, or other intellectual property.
Government Regulation
Our business is and will continue to be subject to extensive U.S. federal, state and local laws and regulations. The advertising, sale,purchase, financing and transportation of used vehicles are regulated by every state in which we operate and by the U.S. federalgovernment. We also are subject to state laws related to titling and registration and wholesale vehicle sales, and our sale of value-addedproducts is subject to state licensing requirements, as well as federal and state consumer protection laws. These laws can vary significantlyfrom state to state. In addition, we are subject to regulations and laws specifically governing the internet and ecommerce the collectionstorage and use of personal information and other customer data. We are also subject to federal and state consumer protection laws,including the Equal Credit Opportunities Act and prohibitions again unfair or deceptive acts or practices. The federal governmental agenciesthat regulate our business and have the authority to enforce such regulations and laws against us include the FTC, the U.S. Department ofTransportation, the U.S. Occupational Health and Safety Administration, the U.S. Department of Justice and the U.S. FederalCommunications Commission. For example, the FTC has jurisdiction to investigate and enforce our compliance with certain consumerprotection laws and has brought enforcement actions against auto dealers relating to a broad range of practices, including the sale andfinancing of value-added or add-on products. Additionally, we are subject to regulation by individual state dealer licensing authorities, stateconsumer protection agencies and state financial regulatory agencies. We also are subject to audit by such state regulatory authorities.
State dealer licensing authorities regulate the purchase and sale of used vehicles by dealers within their respective states. Theapplicability of these regulatory and legal compliance obligations to our ecommerce business is dependent on evolving interpretations ofthese laws and regulations and how our operations are, or are not, subject to them. We are licensed as a dealer in the State of Texas and allof our vehicle transactions are conducted under our Texas license. We believe that our activities in other states are not subject to Texas’vehicle dealer licensing laws. State regulators in such states could, however, seek to require us to maintain a used vehicle dealer license inorder to engage in activities in that state. In addition, we may elect to obtain a used vehicle dealer license in certain states to maximizeoperational flexibility and efficiency and invest in relationships with state regulators.
Most states regulate retail installment sales, including setting a maximum interest rate, caps on certain fees or maximum amountsfinanced. In addition, certain states require that retail installment sellers file a notice of intent or have a sales finance license or an installmentsellers license in order to solicit or originate installment sales in that state. We have obtained a motor vehicle sales finance license in Texas,which is the state in which our vehicle sale transactions are conducted under our Texas dealer license. The financial regulatory agency inPennsylvania determined that we need to
126

Table of Contents
obtain an installment seller license in order to enter into retail installment sales with residents of Pennsylvania, and, as a result, we no longeroffer third-party financing to our customers in Pennsylvania. Accordingly, our customers located in Pennsylvania must obtain independentfinancing to the extent needed to fund any vehicle purchases on our platform. We are in the process of applying for a Pennsylvaniainstallment seller license and expect to resume offering financing to Pennsylvania customers. In addition, we may elect to obtain salesfinance or installment seller licenses in certain other states in which our customers reside in order to maximize operational flexibility andefficiency and invest in relationships with state regulators.
We currently are not conducting business in Massachusetts. Under Massachusetts law, residents may not drive a vehicle withtemporary tags, which we typically provide to our customers upon delivery, inconveniencing consumers who need to register their vehicle andobtain permanent tags without being able to drive their vehicle. We are pursuing a solution that will enable us to sell vehicles inMassachusetts and provide customers with vehicle registration and permanent tags in a convenient manner.
In addition to these laws and regulations that apply specifically to the sale and financing of used vehicles, our facilities and businessoperations are subject to laws and regulations relating to environmental protection, occupational health and safety, and other broadlyapplicable business regulations. We also are subject to laws and regulations involving taxes, tariffs, privacy and data security, anti-spam,pricing, content protection, electronic contracts and communications, mobile communications, consumer protection, information-reportingrequirements, unencumbered internet access to our platform, the design and operation of websites and internet neutrality. After thecompletion of this offering, we will also be subject to laws and regulations affecting public companies, including securities laws and exchangelisting rules.
For a discussion of the various risks we face from regulation and compliance matters, see “Risk Factors—Risks Related to OurBusiness—We operate in a highly regulated industry and are subject to a wide range of federal, state and local laws and regulations. Failureto comply with these laws and regulations could have a material adverse effect on our business, financial condition and results ofoperations”; “—Failure to comply with federal, state and local laws and regulations relating to privacy, data protection and consumerprotection, or the expansion of current or the enactment of new laws or regulations relating to privacy, data protection and consumerprotection, as well as our actual or perceived failure to protect such information could harm our reputation and could adversely affect ourbusiness, financial condition and results of operations”; “—Government regulation of the internet and ecommerce is evolving, andunfavorable changes or failure by us to comply with these regulations could substantially harm our business, financial condition and results ofoperations”; and “—We are subject to risks related to online payment methods.”
Legal Proceedings
From time to time, we are subject to routine legal proceedings in the normal course of operating our business. Although the outcomeof litigation is inherently difficult to predict, we are not involved in any legal proceedings that we believe could reasonably be expected tohave a material adverse effect on our business, financial condition or results of operations.
127

Table of Contents
MANAGEMENT
The following table provides information regarding our executive officers and members of our board of directors (ages as of the dateof this prospectus): Name Age Position(s)Robert J. Mylod, Jr. 53 Chairperson of the BoardScott A. Dahnke 55 DirectorMichael J. Farello 55 DirectorLaura W. Lang 64 DirectorLaura G. O’Shaughnessy 42 DirectorAdam Valkin 46 DirectorPaul J. Hennessy 55 Chief Executive Officer, DirectorDavid K. Jones 50 Chief Financial OfficerMark E. Roszkowski 49 Chief Revenue OfficerPatricia Moran 60 Chief Legal Officer and SecretaryC. Denise Stott 52 Chief People and Culture Officer
Robert J. Mylod, Jr. has served as a member of our board of directors since September 2015. Mr. Mylod is the Managing Partner ofAnnox Capital Management, a private investment firm that he founded in 2013. Previously, Mr. Mylod served as Head of Worldwide Strategy& Planning and Vice Chairman for Bookings Holdings, Inc., an online travel services provider, from January 2009 to March 2011 and as itsChief Financial Officer and Vice Chairman from November 2000 to January 2009. He currently serves as a member of the board of directorsand of the compensation committee of Booking Holdings, Inc. and has been nominated to become Chairman of the board. Mr. Mylod alsocurrently serves as the Chairman of the board of directors and a member of the audit committee of Redfin Corporation, an online real estatecompany. He will step down as Chairman of Redfin Corporation in June 2020 and remain a director. He is also a member of the board ofdirectors and of the audit and compensation committees of Dropbox, Inc., a cloud-based collaboration and data storage company, and anumber of private companies. Mr. Mylod holds a Master of Business Administration from the University of Chicago Booth School of Businessand a Bachelor of Arts in English from the University of Michigan.
We believe that Mr. Mylod’s experience as a venture capital investor and a senior finance executive, including having served as thechief financial officer and vice chairman of a large publicly traded online services provider, qualifies him to serve on our board of directors.
Scott A. Dahnke has served on our board of directors since July 2015. Since 2016, Mr. Dahnke has served as co-Chief ExecutiveOfficer of L Catterton, a consumer-focused private equity firm, after previously serving as Managing Partner from 2003 to 2015. Prior to that,he was Managing Director of Deutsche Bank Capital Partners, the former private equity division of Deutsche Bank AG, from 2002 to 2003,and Managing Director of AEA Investors from 1998 to 2002. Previously, Mr. Dahnke was Chief Executive Officer of infoGROUP (formerlyknown as InfoUSA), a provider of data and data-driven marketing services, from 1997 to 1998. Prior to joining infoUSA, Mr. Dahnke servedclients on an array of strategic and operational issues as a Partner at McKinsey & Company. His early career also includes experience in theMerger Department of Goldman, Sachs & Co. and with General Motors. Mr. Dahnke currently serves as a member of the board of directorsand of the compensation committee and the nominations, corporate governance and social responsibility committee of Williams Sonoma Inc.,as well as a member of the board of directors of several private companies. Mr. Dahnke holds a Bachelor of Science from the University ofNotre Dame and a Master of Business Administration from Harvard Business School.
We believe Mr. Dahnke’s experience in private equity investment and expertise in the ecommerce, retail and consumer industry alongwith his service as a director at numerous companies qualifies him to serve on our board of directors.
128

Table of Contents
Michael Farello has served on our board of directors since July 2015. Since 2006, Mr. Farello has served as Managing Partner at LCatterton, a consumer-focused private equity firm. Prior to this, he served as an executive at Dell Technologies, Inc., a global end-to-endtechnology provider, from 2002 to 2005, and spent twelve years at McKinsey & Company, a management consulting firm. Mr. Farellocurrently serves as a member of the board of directors of several private companies including FlashParking, Inc. and ClassPass Inc. Mr.Farello holds a Bachelor of Science from Stanford University and a Master of Business Administration from Harvard Business School.
We believe Mr. Farello’s experience in private equity investments and expertise in the consumer sector, along with his service as adirector at numerous companies qualifies him to serve on our board of directors.
Laura W. Lang was elected to our board of directors on May 18, 2020. Ms. Lang has served as the Managing Director ofNarragansett Ventures, LLC, a strategic advisory firm focused on digital business transformation and growth investing, since January 2014.Since November 2018, Ms. Lang has also served as an adviser to L Catterton. Ms. Lang was the Chief Executive Officer of Time Inc., one ofthe largest branded media companies in the world, until 2013. From 2008 until she joined Time Inc. in 2012, Ms. Lang was Chief ExecutiveOfficer of Digitas Inc., a marketing and technology agency and unit of Publicis Groupe S.A. In addition, she headed the company’s pure-playdigital agencies, including Razorfish, Big Fuel, Denuo and Phonevalley. Ms. Lang currently serves as a member of the board of directors andthe talent and compensation and finance committees of V. F. Corporation, an international apparel and footwear company. She previouslyserved as a member of the board of directors of Care.com Inc. from August 2014 to June 2016, Nutrisystem, Inc. from 2010 to 2012 andBenchmark Electronics, Inc. from 2005 to 2011. Ms. Lang holds a Bachelor of Arts from Tufts University and a Master of BusinessAdministration from the Wharton School of the University of Pennsylvania.
We believe Ms. Lang’s extensive leadership experience, digital and media expertise and service on the board of directors of otherpublic companies qualifies her to serve on our board of directors.
Laura G. O’Shaughnessy was elected to our board of directors on May 18, 2020. Ms. O’Shaughnessy is the Chief Executive Officerof SocialCode, LLC, a technology company that manages digital and social advertising for leading consumer brands, which she co-foundedin 2009. Previously, Ms. O’Shaughnessy oversaw business development and product strategy for the Slate Group, an online publisher, whereshe specialized in advertising product development and strategic partnerships. Ms. O’Shaughnessy currently serves as a member of theboard of directors of several nonprofits. Ms. O’Shaughnessy holds a Master of Business Administration from the MIT Sloan School ofManagement and a Bachelor of Arts in Economics from the University of Chicago.
We believe Ms. O’Shaughnessy’s leadership experience, including serving in a chief executive officer role, and digital and technologyexpertise qualifies her to serve on our board of directors.
Adam Valkin has served on our board of directors since December 2015. Since 2013, Mr. Valkin has served as Managing Director ofGeneral Catalyst, a venture capital firm. Mr. Valkin currently serves on the boards of directors of several private companies. Mr. Valkin holdsa Bachelor of Arts in Economics from Harvard University.
We believe Mr. Valkin’s experience in private equity investments and expertise in consumer businesses, along with his service as adirector at numerous companies qualifies him to serve on our board of directors.
Paul J. Hennessy has served as our Chief Executive Officer and as a member of our board of directors since June 2016.Mr. Hennessy has over 20 years of global ecommerce leadership
129

Table of Contents
experience, previously serving in several leadership roles for Booking Holdings, Inc. (“Booking Holdings”), a world leader in online travel. AtBooking Holdings, he most recently served as Chief Executive Officer of Priceline.com, a leading online travel agency for finding discountrates for travel-related purchases, from April 2015 to June 2016, and as Chief Marketing Officer of Booking.com, a leading online service forbooking accommodation reservations, from November 2011 to March 2015. Mr. Hennessy also currently serves on the board of directors ofShutterstock Inc. Mr. Hennessy holds a Bachelor of Science in Marketing Management from Dominican College and a Master of BusinessAdministration from Long Island University. His first car was a Pontiac Catalina.
Mr. Hennessy was selected to serve on our board of directors based on his deep experience and the perspective he brings as ourChief Executive Officer, as well as his extensive prior ecommerce leadership experience, driving growth strategies and optimizing operationsand marketing for profitability.
David K. Jones has served as our Chief Financial Officer since November 2018. Prior to joining Vroom, he served as Executive VicePresident and Chief Financial Officer of Iconix Brand Group, Inc., a global brand management company, from July 2015 to November 2018.From May 2011 to July 2015, Mr. Jones served as Executive Vice President and Chief Financial Officer of Penske Automotive Group, aninternational transportation services company operating automotive and commercial truck dealerships. Mr. Jones joined Penske AutomotiveGroup in 2003 and served in various senior management roles through May 2011. He began his career in public accounting at Andersen LLPand remained there for over a decade. Mr. Jones holds a Bachelor of Business Administration in Accounting from Seton Hall University. Hisfirst car was a 1968 Pontiac GTO.
Mark E. Roszkowski has served as our Chief Revenue Officer since February 2019. Prior to joining Vroom, Mr. Roszkowski servedas Executive Vice President, Global Head of Corporate Development, Strategy and Strategic Partnerships of Verizon Media, the media andonline businesses division of Verizon Communications Inc., from June 2017 to January 2019. He previously served as Senior Vice President,Global Head of Corporate Development, Strategy and Strategic Partnerships of AOL Inc., a web portal and online service provider, from June2014 through its sale to Verizon in June 2015 and subsequently until June 2017. Mr. Roszkowski holds a B.S. in Mechanical Engineeringfrom Worcester Polytechnic Institute, a Master of Science in Mechanical Engineering from the University of Rochester and a Master ofBusiness Administration from Massachusetts Institute of Technology. His first car was a 1977 Chevy Nova.
Patricia Moran has served as our Chief Legal Officer and Secretary since January 2019. Previously, Ms. Moran was a ManagingDirector, Chief Legal Officer and Secretary of Greenhill & Co. Inc., a publicly traded, global independent investment bank, from April 2014 toOctober 2016, and a Senior Advisor from November 2016 to April 2017. Prior to joining Greenhill, Ms. Moran was a Partner at Skadden,Arps, Slate, Meagher & Flom LLP, a leading global law firm where she had a 30-year career and chaired the New York office DiversityCommittee. Ms. Moran has broad experience in corporate governance and corporate transactions, including mergers and acquisitions,private equity, joint ventures, restructurings and corporation finance. Ms. Moran holds a Bachelor of Science from the University of Scrantonand a Juris Doctor from the Villanova University School of Law. Her first car was an AMC Hornet hatchback.
C. Denise Stott has served as our Chief People and Culture Officer since November 2016. Previously, Ms. Stott was Senior VicePresident of Human Resources at Undertone, a digital advertising company, from May 2013 to October 2016. Ms. Stott’s tenure at Undertoneincluded leading the human resources function through multiple transformations including acquisitions and the eventual sale to a publiccompany. From February 2010 until she joined Undertone, Ms. Stott was Vice President of Human Resources at Yodle, a leader in localonline marketing, where she led people development through a focus on talent acquisition, employee engagement, employee training
130

Table of Contents
and compensation and benefits. Ms. Stott also served as Senior Vice President of Human Resources for ZenithOptimedia, a media andadvertising services provider, from August 2007 to July 2009. Ms. Stott holds a Bachelor of Science in Mathematical Economics from TulaneUniversity and a Master of Business Administration from Vanderbilt University. Her first car was a Mazda 626.
Composition of our Board of Directors
After this offering, our board of directors will consist of seven directors. Each director’s term will continue until the annual meeting ofstockholders next held after his or her election and the election and qualification of his or her successor, or his or her earlier death,disqualification, resignation or removal.
When considering whether directors have the experience, qualifications, attributes or skills, taken as a whole, to enable our board ofdirectors to satisfy its oversight responsibilities effectively in light of our business and structure, the board of directors focuses primarily oneach person’s background and experience as reflected in the information discussed in each of the directors’ individual biographies set forthabove. We believe that our directors provide an appropriate mix of experience and skills relevant to the size and nature of our business.
Director Independence
Prior to the consummation of this offering, our board of directors undertook a review of the independence of our directors andconsidered whether any director has a material relationship with us that could compromise that director’s ability to exercise independentjudgment in carrying out that director’s responsibilities. Our board of directors has affirmatively determined that Robert J. Mylod, Jr., Scott A.Dahnke, Michael J. Farello, Laura W. Lang, Laura G. O’Shaughnessy and Adam Valkin are each an “independent director,” as defined underthe rules of Nasdaq. In making these determinations, our board of directors considered the current and prior relationships that each directorhas with our Company and all other facts and circumstances our board of directors deemed relevant in determining their independence,including the beneficial ownership of our capital stock by each director, and the transactions involving them described in the section titled“Certain Relationships and Related Party Transactions.”
Committees of Our Board of Directors
Our board of directors directs the management of our business and affairs, as provided by Delaware law, and conducts its businessthrough meetings of the board of directors and standing committees. We will have a standing audit committee, nominating and corporategovernance committee and compensation committee. In addition, from time to time, special committees may be established under thedirection of the board of directors when necessary to address specific issues.
Audit Committee
Our audit committee will be responsible for, among other things:
• appointing, compensating, retaining, evaluating, terminating and overseeing our independent registered public accounting firm;
• discussing with our independent registered public accounting firm their independence from management;
• reviewing with our independent registered public accounting firm the scope and results of their audit;
131

Table of Contents
• approving all audit and permissible non-audit services to be performed by our independent registered public accounting firm;
• overseeing the financial reporting process and discussing with management and our independent registered public accounting firmthe quarterly and annual consolidated financial statements that we file with the SEC;
• overseeing our financial and accounting controls and compliance with legal and regulatory requirements;
• reviewing our policies on risk assessment and risk management;
• reviewing related person transactions; and
• establishing procedures for the confidential anonymous submission of concerns regarding questionable accounting, internalcontrols or auditing matters.
Upon the consummation of this offering, our audit committee will consist of Robert J. Mylod, Jr., Laura W. Lang and Adam Valkin, withRobert J. Mylod, Jr. serving as chair. Rule 10A-3 of the Exchange Act and Nasdaq rules require that our audit committee have at least oneindependent member upon the listing of our common stock, have a majority of independent members within 90 days of the date of thisprospectus and be composed entirely of independent members within one year of the date of this prospectus. Our board of directors hasaffirmatively determined that Robert J. Mylod, Jr., Laura W. Lang and Adam Valkin each meet the definition of “independent director” forpurposes of serving on the audit committee under Rule 10A-3 under the Exchange Act and Nasdaq rules. Each member of our auditcommittee also meets the financial literacy requirements of Nasdaq listing standards. In addition, our board of directors has determined thatRobert J. Mylod, Jr. will qualify as an “audit committee financial expert,” as such term is defined in Item 407(d)(5) of Regulation S-K. Ourboard of directors has adopted a written charter for the audit committee, which will be available on our principal corporate website atwww.vroom.com substantially concurrently with the consummation of this offering. The information on our website is deemed not to beincorporated in this prospectus or to be part of this prospectus.
Nominating and Corporate Governance Committee
Our nominating and corporate governance committee will be responsible for, among other things:
• identifying individuals qualified to become members of our board of directors, consistent with criteria approved by our board ofdirectors;
• overseeing our succession plan for the CEO and other executive officers;
• overseeing the evaluation of the effectiveness of our board of directors and its committees; and
• developing and recommending to our board of directors a set of corporate governance guidelines.
Upon the consummation of this offering, our nominating and corporate governance committee will consist of Scott A. Dahnke, LauraG. O’Shaughnessy and Adam Valkin, with Scott A. Dahnke serving as chair. Our board of directors has adopted a written charter for thenominating and corporate governance committee, which will be available on our principal corporate website at www.vroom.com substantiallyconcurrently with the consummation of this offering. The information on our website is deemed not to be incorporated in this prospectus or tobe part of this prospectus.
Compensation Committee
Our compensation committee will be responsible for, among other things:
• reviewing and approving the compensation of our Chief Executive Officer and other executive officers;
132

Table of Contents
• reviewing and making recommendations to the board of directors regarding director compensation; and
• appointing and overseeing any compensation consultants.
Upon the consummation of this offering, our compensation committee will consist of Michael J. Farello, Robert J. Mylod, Jr. and LauraW. Lang, with Michael J. Farello serving as chair. Our board has determined that Michael J. Farello, Robert J. Mylod, Jr. and Laura W. Langmeet the definition of “independent director” for purposes of serving on the compensation committee under Nasdaq rules, including theheightened independence standards for members of a compensation committee, and are “non-employee directors” as defined in Rule 16b-3of the Exchange Act. Our board of directors has adopted a written charter for the compensation committee, which will be available on ourprincipal corporate website at www.vroom.com substantially concurrently with the consummation of this offering. The information on ourwebsite is deemed not to be incorporated in this prospectus or to be part of this prospectus.
Risk Oversight
Our board of directors is responsible for overseeing our risk management process. Our board of directors focuses on our general riskmanagement strategy, the most significant risks facing us, and oversees the implementation of risk mitigation strategies by management. Ouraudit committee is also responsible for discussing our policies with respect to risk assessment and risk management. Our board of directorsbelieves its administration of its risk oversight function has not negatively affected our board of directors’ leadership structure.
Compensation Committee Interlocks and Insider Participation
None of the members of our compensation committee is or has been an officer or employee of our company. None of our executiveofficers serves as a member of the board of directors or compensation committee (or other committee performing equivalent functions) of anyentity that has one or more of its executive officers serving on our board of directors or compensation committee.
Code of Business Conduct and Ethics
Our board of directors has adopted a written code of business conduct and ethics that applies to our directors, officers andemployees, including our principal executive officer, principal financial officer, principal accounting officer or controller, or persons performingsimilar functions. A copy of the code will be posted on our website, www.vroom.com. In addition, we intend to post on our website alldisclosures that are required by law or Nasdaq listing standards concerning any amendments to, or waivers from, any provision of the code.The information on our website is deemed not to be incorporated in this prospectus or to be part of this prospectus.
133

Table of Contents
EXECUTIVE COMPENSATION
This section discusses the material components of the executive compensation program for our executive officers who are named inthe “Summary Compensation Table” below. In 2019, our “named executive officers”, or “NEOs”, and their positions were as follows:
• Paul J. Hennessy, Chief Executive Officer and Director;
• David K. Jones, Chief Financial Officer; and
• Mark E. Roszkowski, Chief Revenue Officer.
This discussion may contain forward-looking statements that are based on our current plans, considerations, expectations anddeterminations regarding future compensation programs. Actual compensation programs that we adopt following the completion of thisoffering may differ materially from the currently planned programs summarized in this discussion. The information set forth in this sectiongives effect to the Forward Stock Split to be effected prior to the closing of this offering.
Summary Compensation Table
The following table sets forth information concerning the compensation of our named executive officers for the years endedDecember 31, 2019. Name and PrincipalPosition Year
Salary ($)(2) Bonus ($)
StockAwards ($)
(4)
OptionAwards ($)
(4) Total Paul J. Hennessy 2019 393,077 — 421,000 — 814,077 Chief Executive Officer, Director
David K. Jones 2019 500,000 375,000(3) — 671,700 1,546,700 Chief Financial Officer
Mark E. Roszkowski(1) 2019 410,192 — — 592,592 1,002,784 Chief Revenue Officer (1) Mr. Roszkowski commenced employment as our Chief Revenue Officer on February 4, 2019.(2) Amounts reflect the actual base salary paid to each named executive officer in respect of 2019.(3) Amounts reflect (i) a sign-on bonus paid to Mr. Jones on February 8, 2019 in the amount of $250,000 and (ii) a guaranteed bonus in an amount equal to 50% of
Mr. Jones’ target annual bonus, to be paid to Mr. Jones in respect of 2019 pursuant to the terms of his offer letter. Please see the sections titled “Bonus Compensation—Jones Sign-on Bonus” and “Executive Compensation Arrangements—David K. Jones” below for further information.
(4) Amounts reflect the full grant-date fair value of restricted stock unit awards and options granted during 2019 computed in accordance with ASC Topic 718, rather than theamounts paid to or realized by the named individual. We provide information regarding the assumptions used to calculate the value of all restricted stock unit awards andoption awards made to executive officers in Note 12 to our consolidated financial statements included elsewhere in this prospectus.
Elements of the Company’s Executive Compensation Program
For the year ended December 31, 2019, the compensation for our named executive officers generally consisted of a base salary, cashbonuses and equity awards. These elements (and the amounts of compensation and benefits under each element) were selected becausewe believe they are necessary to help us attract and retain executive talent which is fundamental to our success.
Below is a more detailed summary of the current executive compensation program as it relates to our named executive officers.
Base Salaries
Our named executive officers receive a base salary to compensate them for the services they provide to our company. The basesalary payable to each named executive officer is intended to
134

Table of Contents
provide a fixed component of compensation reflecting the executive’s skill set, experience, role and responsibilities.
The base salaries for our named executive officers were originally established in their respective employment agreement and offerletters. Mr. Hennessy’s initial base salary for 2019 was $350,000, which was increased by the compensation committee to $400,000 effectiveon March 4, 2019. Messrs. Jones and Roszkowski were entitled to receive base salaries for 2019 of $500,000 and $450,000, respectively, asset forth in their offer letters described below.
Effective January 5, 2020, our board of directors increased Mr. Hennessy’s base salary to $500,000.
The actual salaries paid to each named executive officer for 2019 are set forth in the “Summary Compensation Table” above in thecolumn titled “Salary.”
Bonus Compensation
2019 Bonuses
From time to time our compensation committee may approve annual bonuses for our NEOs based on individual performance,company performance or as otherwise determined appropriate.
For 2019, annual bonuses were based on such factors as the compensation committee deemed appropriate, including achievementof company revenue and EBITDA targets, along with each individual NEO’s performance as it relates to his or her area of responsibility.Pursuant to his employment agreement, Mr. Hennessy was initially eligible to receive a base annual bonus of up to $325,000, or 100% of hisbase salary, as well as an additional “stretch” bonus of up to $325,000, or another 100% of his base salary, based on the achievement ofsuch performance criteria as the board of directors deemed appropriate in its discretion.
Effective March 4, 2019, our compensation committee determined to amend Mr. Hennessy’s annual bonus structure such thatMr. Hennessy would be eligible to earn an annual bonus with a target amount of 200% of his base salary with respect to 2019.
Messrs. Jones and Roszkowski are eligible to participate in our 2019 Short Term Incentive Plan, or 2019 STIP, a performance-basedannual incentive plan that provides cash bonuses to certain of our participating employees. The applicable 2019 STIP performance goalswere recommended by members of senior management and approved by our compensation committee and board of directors. In 2019, theboard of directors determined that Mr. Hennessy’s annual bonus would also be based on the achievement of the 2019 STIP performancegoals.
Pursuant to the 2019 STIP, the bonus pool under the 2019 STIP may be funded based on the achievement of specified EBITDA andshipped unit targets, each weighted at 50% of the bonus pool. If the company achieved target performance the 2019 STIP bonus pool wouldhave been funded at a level of 100% of the target payout, with the bonus pool eligible to be funded from a range of 0% to 175% of the targetpayout depending on achievement, as determined by our compensation committee in its discretion. Following the determination of theamount of the 2019 STIP bonus pool, members of management will then allocate a portion of the bonus pool to each department of thecompany, based on the department’s performance with respect to 2019.
Each 2019 STIP participant’s award under the 2019 STIP is determined as a function of the funding of the STIP bonus pool and theparticipant’s target bonus amount, as well as the participant’s
135

Table of Contents
individual performance and teamwork as evaluated by such participant’s supervisor. Each of Messrs. Jones and Roszkowski have anestablished target annual bonus pursuant to their respective offer letters. The 2019 target bonus amount for each of Messrs. Jones andRoszkowski was 50%, expressed as a percentage of his annual base salary. In addition, pursuant to the terms of his offer letter, Mr. Joneswill receive a guaranteed bonus payment with respect to 2019 of no less than half of his 2019 target bonus amount.
With respect to 2019, our compensation committee determined that the applicable 2019 STIP performance goals were not met and asa result, the 2019 STIP bonus pool would not be funded. The guaranteed bonus payment of $125,000 paid to Mr. Jones with respect to 2019is set forth above in the Summary Compensation Table in the column entitled “Bonus.”
Jones Sign-on Bonus
Pursuant to his offer letter, Mr. Jones was paid a sign-on bonus of $250,000 in 2019 in connection with his commencement ofemployment with us, subject to his continued employment for 90 days following his start date. For further information on Mr. Jones’ sign-onbonus, please see “Executive Compensation Arrangements—David K. Jones” below.
Equity Compensation
Outstanding Equity Awards
We currently maintain an equity incentive plan, the Vroom, Inc. Second Amended & Restated 2014 Equity Incentive Plan, or the 2014Plan, which provides for the grant of equity awards with respect to our common stock. The 2014 Plan provides our employees (including thenamed executive officers) and other eligible service providers the opportunity to participate in the equity appreciation of our business andincentivizes them to work towards Vroom’s long-term performance goals. We believe that such awards function as a compelling incentive andretention tool.
As of March 31, 2020, a total of 6,198,676 shares subject to options to purchase our common stock, 3,249,382 shares subject torestricted stock awards, and 978,060 shares subject to restricted stock unit awards granted under the 2014 Plan are currently outstanding.
As described in further detail below in the Outstanding Equity Awards at Fiscal Year End Table and related footnotes below, thefollowing equity awards currently are held by our named executive officers: Mr. Hennessy currently holds (i) an option to purchase 1,351,062shares of our common stock, which was granted to him on December 6, 2016 at an exercise price of $3.39 per share, (ii) a restricted stockunit award covering 100,000 shares of our common stock, granted December 6, 2016, and (iii) a restricted stock unit award covering 100,000shares of our common stock, granted March 25, 2019; Mr. Jones currently holds an option to purchase 400,000 shares of our common stock,which was granted to him on February 6, 2019 and which has an exercise price of $4.21 per share; and Mr. Roszkowski currently holds anoption to purchase 350,000 shares of our common stock, which was granted to him on February 6, 2019, and which has an exercise price of$4.21 per share.
Mr. Hennessy’s 2016 option grant is subject to both time-based and performance-based vesting, so long as Mr. Hennessy remainscontinuously employed with us through the applicable vesting dates. With respect to the time-based portion of the option, 100% of such time-based option has vested (25% of such time-based option vested on June 8, 2017, with the remainder vesting at the end of each subsequentthree-month period over the following three year period such that the time-based option was fully vested on June 8, 2020). The performance-vesting portion of the option vested with respect to 50% of such performance-based option when the company’s equity value reached$1.5 billion as determined by the board of directors in January 2020, and the remaining 50% shall vest when the company’s equity valuereaches $2 billion, as determined by our board of directors.
136

Table of Contents
Mr. Hennessy’s 2016 restricted stock unit award vests on the earlier of (i) June 6, 2020 and (ii) the date of a Deemed LiquidationEvent, subject to Mr. Hennessy’s continued employment through such date. For purposes of Mr. Hennessy’s 2016 restricted stock unit grant,“Deemed Liquidation Event” means, (a) a merger or consolidation in which the company is a constituent party or a subsidiary of the companyis a constituent party and the company issues shares of its capital stock pursuant to such merger or consolidation, except any such mergeror consolidation (1) involving the company or a subsidiary in which the shares of capital stock of the company outstanding immediately priorto such merger or consolidation continue to represent, or are converted into or exchanged for shares of capital stock that represent,immediately following such merger or consolidation, at least a majority, by voting power, of the capital stock of the surviving or resultingcorporation or, if the surviving or resulting corporation is a wholly owned subsidiary of another corporation immediately following such mergeror consolidation, the parent corporation of such surviving or resulting corporation or (2) to redomicile the company or any subsidiary of thecompany, or (b) the sale, lease, transfer, exclusive license or other disposition, in a single transaction or series of related transactions, by thecompany or any subsidiary of the company of all or substantially all of the assets of the company and its subsidiaries taken as a whole or thesale or disposition (whether by merger, consolidation or otherwise) of one or more subsidiaries of the company if substantially all of theassets of the company and its subsidiaries taken as a whole are held by such subsidiary or subsidiaries, except where such sale, lease,transfer, exclusive license or other disposition is to a wholly owned subsidiary of the company; provided that any of the foregoing events shallnot constitute a Deemed Liquidation Event if (i) the holders (voting separately) of at least a majority of the outstanding shares of thecompany’s Series A Preferred Stock, (ii) the holders (voting separately) of at least a majority of the outstanding shares of the company’sSeries B Preferred Stock and (iii) each of (A) the holders of at least two-thirds of the outstanding shares of the company’s Series C preferredstock, voting as a single class, and (B) the holders of at least 60% of the outstanding shares of the company’s Series D Preferred Stock,voting as a single class, elect otherwise by written notice to the company at least five days prior to the effective date of such event.
Mr. Hennessy’s 2019 restricted stock unit award is scheduled to vest over a period of three years such that 50% of the restricted stockunits will vest on the 18-month anniversary of the grant date and the remaining 50% will vest on the 36-month anniversary of the grant date,subject to the occurrence of a liquidity event and Mr. Hennessy’s continued employment through the applicable vesting date. For purposes ofMr. Hennessy’s 2019 restricted stock unit award, “liquidity event” means the first to occur of (i) a qualifying initial public offering of thecompany’s common stock and (ii) a change of control (as defined in the 2014 Plan). For the avoidance of doubt, this offering will constitute aliquidity event with respect to Mr. Hennessy’s 2019 restricted stock unit award.
Messrs. Jones and Roszkowski’s 2019 option grants are scheduled to vest over a period of four years in equal annual installments oneach of the first four anniversaries of the vesting commencement date (November 12, 2018 for Mr. Jones and February 4, 2019 forMr. Roszkowski), subject to the executive’s continued employment with us through each applicable vesting date.
Effective March 25, 2019, our board of directors determined to amend the vesting schedule of option awards under the 2014 Plan,including the options held by our named executive officers, such that, in the event that any such options are assumed or remain outstandingfollowing the occurrence of a change of control and the participant’s employment is terminated without Cause or the participant resigns forGood Reason (each as defined below) within the 12-month period following such change of control, the then-unvested portion of the optionshall fully accelerate and vest. For purposes of such option grants, (A) “Cause” is defined as: (i) the participant’s disregard of his or her dutiesor failure to act, where such action would be in the ordinary course of the participant’s duties, (ii) the material failure by the participant toobserve Vroom policies and/or policies of affiliates of Vroom generally applicable to employees of Vroom and/or its affiliates, including,without limitation, policies relating to anti-harassment,
137

Table of Contents
(iii) gross negligence or willful misconduct by the participant in the performance of his or her duties, (iv) the commission by the participant ofany act of fraud, theft, financial dishonesty or self-dealing with respect to Vroom or any of its affiliates, or any felony or criminal act involvingmoral turpitude, (v) any breach by the participant of the provisions of any confidentiality, non-competition or non-solicitation agreementbetween the participant and Vroom or any of its affiliates, or any other agreement or contract with Vroom or any of its affiliates, (vi) chronicabsenteeism, (vii) alcohol or other substance abuse that impairs the participant’s ability to perform his or her duties, or (viii) the commissionof any violation of any state or federal law relating to the workplace environment (including, without limitation, laws relating to sexualharassment or age, sex or other prohibited discrimination) by the participant; (B) “Good Reason” is defined as any of the following events, ineach case, without the participant’s consent: (i) a reduction in the participant’s base salary or a material reduction by Vroom in the kind orlevel of employee benefits to which the participant is entitled immediately prior to such reduction, other than a general across-the-boardreduction as a result of an economic or strategic measure that affects all similarly situated employees in substantially the same proportions,(ii) a relocation of the participant’s principal place of employment by more than 30 miles from both the participant’s principal place ofemployment and principal residence, (iii) a material adverse change to the participant’s title, authority, reporting structure, duties orresponsibilities (other than temporarily while the participant is physically or mentally incapacitated), or (iv) Vroom’s failure to obtain anagreement from any successor thereto to assume or replace (with consistent vesting and other material terms) the participant’s stock awardunder the 2014 Plan in the same manner and to the same extent that Vroom would be required to perform if no succession had taken place,except where such assumption occurs by operation of law; and (C) “change of control” shall mean the first to occur of any transaction (orseries of related transactions involving a person or entity, or a group of affiliated persons or entities) effecting: (i) a sale, lease or otherdisposition of all or substantially all of the assets of Vroom, (ii) a consolidation or merger of Vroom with or into any other corporation or entityor person, or any other corporate reorganization, or (iii) a transfer of more than fifty percent (50%) of Vroom’s outstanding voting power;provided that, in the cause of any of clauses (i), (ii) or (iii), no change of control shall have occurred if the shareholders of Vroom immediatelyprior to such transaction(s) own at least fifty percent (50%) of the outstanding voting power of the acquiring person or entity, or group ofaffiliated persons or entities, or the surviving entity or its parent, as the case may be, following such transaction(s).
2020 Equity Awards
In February 2020, we granted equity awards under the 2014 Plan to certain employees (including our NEOs). In particular, Mr.Hennessy received an award of 367,782 performance restricted stock units (at target). This award will vest subject to the attainment ofspecified EBITDA or revenue targets during the performance period and the occurrence of a “liquidity event” prior to a specified date. Vestingof this award is also subject to Mr. Hennessy’s continued employment through the vesting date. Messrs. Jones and Roszkoski receivedawards of 36,778 and 33,100 restricted stock units, respectively. These awards vest subject to the occurrence of a “liquidity event” prior to aspecified date and the executive’s continuous service for a 48-month period following the date of grant. A “liquidity event” for the purposes ofthese awards means the first to occur of (i) an initial public offering, or (ii) a change of control (as defined in the 2014 Plan).
Other Elements of Compensation
Retirement Plans
We currently maintain a 401(k) retirement savings plan for our employees, including our named executive officers, who satisfy certaineligibility requirements. The Code allows eligible employees to defer a portion of their compensation, within prescribed limits, on a pre-taxbasis through contributions to the 401(k) plan. Currently, we do not provide any matching contributions in the 401(k) plan. We do
138

Table of Contents
not maintain any defined benefit pension plans or deferred compensation plans for our named executive officers.
Employee Benefits and Perquisites
All of our full-time employees, including our named executive officers, are eligible to participate in our health and welfare plans,including:
• medical, dental and vision benefits;
• medical care flexible spending accounts and health savings accounts;
• employee assistance program (EAP);
• short-term and long-term disability insurance; and
• life and accidental death & dismemberment insurance.
No tax gross-ups
We do not provide tax gross-ups to our employees, including our named executive officers.
Outstanding Equity Awards at Fiscal Year-End
The following table summarizes the number of shares of common stock underlying outstanding equity incentive plan awards for eachnamed executive officer as of December 31, 2019.
Option Awards Stock Awards
Name GrantDate
Number ofSecuritiesUnderlying
UnexercisedOptions (#)Exercisable
Number ofSecuritiesUnderlying
UnexercisedOptions (#)
Unexercisable
OptionExercise
Price($)
OptionExpiration
Date
Number ofShares orUnits of
Stock ThatHave NotVested (#)
MarketValue of
Shares orUnits of
Stock ThatHave Not
Vested ($)(5) Paul J. Hennessy 12/06/16 — — — — 100,000(1) 1,046,000
12/06/16 886,634 464,428(2) 3.39 12/06/26 — — 03/25/19 — — — — 100,000(3) 1,046,000
David K. Jones 02/06/19 100,000 300,000(4) 4.21 02/06/29 — — Mark E. Roszkowski 02/06/19 — 350,000(4) 4.21 02/06/29 — — (1) The restricted stock units shall vest on the earlier of (i) June 6, 2020 and (ii) the date of a Deemed Liquidation Event, subject to Mr. Hennessy’s continued employment
through such date.(2) With respect to the option, 1,013,296 shares are subject to time-vesting and 337,766 shares are subject to performance-vesting. 87.5% of the time-vesting portion of the
option has already vested. 25% vested on June 8, 2017, with the remainder vesting at the end of each subsequent three-month period over the following three yearperiod, such that the time-based option shall be fully vested on June 8, 2020, subject to Mr. Hennessy’s continued employment through each applicable vesting date.50% of the performance-vesting portion of the option shall vest when the company’s equity value reaches $1.5 billion and the remainder of the performance-vestingoption shall vest when the company’s equity value reaches $2 billion, subject to Mr. Hennessy’s continued employment through the applicable vesting date. IfMr. Hennessy’s employment is terminated without Cause or for Good Reason (each as defined above) within twelve months following the date of a change of control (asdefined above), any unvested portion of the option will accelerate and fully vest.
(3) The restricted stock unit award vests upon both the satisfaction of a service condition and the occurrence of a liquidity event. 50% of the restricted stock units will vest onthe 18-month anniversary of the grant date and the remaining 50% will vest on the 36-month anniversary of the grant date, subject to the occurrence of a liquidity eventand Mr. Hennessy’s continued employment through the applicable vesting date. If Mr. Hennessy’s employment is terminated without Cause or for Good Reason (each asdefined above) within twelve months following the date of a change of control (as defined above), any unvested portion of the option will accelerate and fully vest.
(4) The option vests over a period of four years in equal annual installments on each of the first four anniversaries of the vesting commencement date (November 12, 2018for Mr. Jones and February 4, 2019 for Mr. Roszkowski), subject to the
139

Table of Contents
executive’s continued employment with us through each applicable vesting date. If the executive’s employment is terminated without Cause or for Good Reason (each asdefined above) within twelve months following the date of a change of control (as defined above), any unvested portion of the option will accelerate and fully vest. 25% ofthe option held by Mr. Jones has already vested.
(5) There was no public market for shares of our common stock prior to this offering. The amount reported was based on the fair market value of a share as of December 31,2019, as determined with reference to a third-party valuation.
Executive Compensation Arrangements
Below are written descriptions of our employment arrangements with each of our named executive officers. Each of our namedexecutive officers’ employment is “at will” and may be terminated at any time.
In connection with this offering, we intend to enter into new employment agreements with each of our named executive officers to beeffective upon the consummation of this offering. The material terms of such new employment agreements have not yet been determined.
Paul J. Hennessy
On June 8, 2016, we entered into an employment agreement with Mr. Hennessy providing for his employment as our Chief ExecutiveOfficer (the “CEO Agreement”). The CEO Agreement provides for a three-year initial term of employment, with automatic renewal forsuccessive one-year periods until terminated in accordance with the terms of the agreement.
Pursuant to the CEO Agreement, Mr. Hennessy was entitled to an initial annual base salary of $325,000 (which base salary has beenfurther increased as discussed above under the section titled “Base Salaries”). The CEO Agreement also provides that Mr. Hennessy iseligible to receive an annual performance-based cash bonus of up to $325,000, as well as an additional “stretch” incentive bonus of up to$325,000, in each case based on the achievement of performance criteria established by our board of directors in its sole discretion andsubject to Mr. Hennessy’s continued employment through the payment date. Effective March 4, 2019, our compensation committeedetermined to amend Mr. Hennessy’s annual bonus structure such that Mr. Hennessy would be eligible to earn an annual bonus with a targetamount of 200% of his base salary with respect to 2019.
The CEO Agreement provides that Mr. Hennessy will be entitled to receive a stock option award under the 2014 Plan with anaggregate fair market value equal to 3% of the outstanding fully-diluted shares of the company as of June 8, 2016, as well as the right topurchase shares of the company’s common stock and Series D Preferred Stock in an aggregate amount of up to $1 million.
Pursuant to the CEO Agreement, if Mr. Hennessy’s employment is terminated by us without Cause (as defined below), then, subjectto his timely execution and non-revocation of a release of claims, (i) he will be entitled to 12 months acceleration of his outstanding time-vesting equity awards and (ii) the board of directors shall use its best efforts to extend the exercise period of the stock option award providedfor in the CEO Agreement for two years, provided such extension shall not be beyond the original expiration date of the option and subject toapplicable registration requirements.
For purposes of the CEO Agreement, “Cause” means one or more of the following: (i) the employee’s substantial and repeated failureto perform duties as reasonably and lawfully directed by the board of directors; (ii) conduct by the employee reasonably likely to bring thecompany or any of its affiliates into disgrace or disrepute; (iii) the employee’s commission of any felony, crime involving moral turpitude orother act of material dishonestly, disloyalty or fraud; (iv) the employee’s breach of fiduciary duty, gross negligence or willful misconduct withrespect to the company or any of its affiliates; (v) the employee’s failure in any material respect to comply with any material written policy ofthe company; (vi) a breach of the covenants in Sections 6, 7 or 8 of the CEO Agreement; or (vii) any other material breach of the CEOAgreement.
140

Table of Contents
The CEO Agreement contains 18-month post-termination non-competition and non-solicitation of customers and employeescovenants, as well as perpetual confidentiality and non-disparagement covenants.
David K. Jones
On October 15, 2018, we entered into an offer letter with Mr. Jones to employ him as our Chief Financial Officer, effective as ofNovember 12, 2018 (the “CFO Offer Letter”). The CFO Offer Letter provides for an initial annual base salary of $500,000, as well as the rightto receive his initial option grant, subject to the approval of our board of directors.
Pursuant to the CFO Offer Letter, Mr. Jones may be eligible to earn an annual performance-based bonus under our Incentive BonusPlan with a target bonus amount equal to 50% of his annual base salary. For 2019, such annual bonus is guaranteed to equal at least half ofhis target bonus amount. In addition, the CFO Offer Letter provided for (i) a sign-on bonus of $250,000, payable on the earliest practicalpayroll date after the expiration of the 90-day period following Mr. Jones’ commencement of employment with the company, and (ii) anadditional bonus of $150,000, subject to Mr. Jones’ continued employment with us for 15 months following the commencement of hisemployment and payable on the earliest practical payroll date thereafter; in each case subject to Mr. Jones’ continued employment throughsuch applicable payment date. Notwithstanding the foregoing, if Mr. Jones’ employment with the company is terminated for Cause (asdefined below) or by Mr. Jones for any reason prior to the two-year anniversary of the payment date for either bonus, Mr. Jones shall repay aprorated amount of such bonus.
Pursuant to the CFO Offer Letter, in the event we terminate Mr. Jones for any reason other than for Cause or if he resigns for GoodReason, Mr. Jones is entitled to receive a lump sum cash payment equal to the greater of (i) the amount equal to three months of his then-current base salary plus continued health benefits and (ii) the separation pay amount otherwise payable to company employees based onthe company’s then in-force policy at the time of termination.
In addition to the CFO Offer Letter, Mr. Jones was required to enter into the company’s Proprietary Information and InventionsAssignment Agreement in connection with his employment, which provides that Mr. Jones will be subject to 12-month post-terminationnon-competition and non-solicitation of customers and employees covenants, as well as a perpetual confidentiality covenant.
For purposes of the CFO Offer Letter, “Cause” generally means the executive has: (i) committed any act constituting financialdishonesty against the company or its subsidiaries; (ii) engaged in any other act of dishonesty, fraud, intentional misrepresentation, moralturpitude, illegality or harassment which, as determined in good faith, would (A) adversely affect the business or prospective customers,suppliers, lenders and/or other third parties with whom the company does or might do business or (B) expose the company or any of itssubsidiaries to a risk of civil or criminal legal damages, liabilities or penalties; (iii) engaged in or committed any misconduct, violation of thecompany’s written policies, including the company’s employee handbook, or committed non-performance of duty in connection with thebusiness affairs of the company or its subsidiaries; or (iv) breached any agreement, including without limitation, the executive’s applicableoffer letter and any agreement relating to non-competition, non-solicitation or confidentiality.
For purposes of the CFO Offer Letter, “Good Reason” generally means a material reduction in the executive’s salary, position, dutiesor responsibilities of the role.
141

Table of Contents
Mark E. Roszkowski
On January 6, 2019, we entered into an offer letter with Mr. Roszkowski to employ him as our Chief Revenue Officer, effective as ofFebruary 4, 2019 (the “CRO Offer Letter”). The CRO Offer Letter provides for an initial annual base salary of $450,000, as well as the right toreceive his initial option grant, subject to the approval of our board of directors. The CRO Offer Letter also provides that Mr. Roszkowski maybe eligible to earn an annual performance-based bonus under our Incentive Bonus Plan with a target bonus amount equal to 50% of hisannual base salary.
Pursuant to the CRO Offer Letter, in the event we terminate Mr. Roszkowski for any reason other than for Cause or if he resigns forGood Reason (each as defined below), Mr. Roszkowski is entitled to receive a lump sum cash payment equal to the greater of (i) the amountequal to six months of his then-current base salary plus continued health benefits and (ii) the separation pay amount otherwise payable tocompany employees based on the company’s then in-force policy at the time of termination.
In addition to the CRO Offer Letter, Mr. Roszkowski was required to enter into the company’s Proprietary Information and InventionsAssignment Agreement in connection with his employment, which provides that Mr. Roszkowski will be subject to 12-month post-terminationnon-competition and non-solicitation of customers and employees covenants, as well as a perpetual confidentiality covenant.
For purposes of the CRO Offer Letter, “Cause” has the same meaning as in the CFO Offer Letter.
For purposes of the CRO Offer Letter, “Good Reason” generally means: (i) a material reduction in the executive’s salary, position,duties or responsibilities or (ii) a relocation of the executive’s workplace that requires an increase in the executive’s commute of 35 miles orgreater.
Director Compensation Name
Stock Awards($)(1) Total ($)
Robert J. Mylod, Jr.(2) 421,000 421,000 (1) Amount reflects the full grant-date fair value of restricted stock unit awards granted during 2019 computed in accordance with ASC
Topic 718, rather than the amounts paid to or realized by the named individual. We provide information regarding the assumptionsused to calculate the value of all stock awards made to our directors in Note 12 to our consolidated financial statements includedelsewhere in this prospectus.
(2) As of December 31, 2019, Mr. Mylod holds 100,000 outstanding restricted stock units, none of which are vested, and 250,000outstanding options, of which 187,500 are vested and 62,500 are unvested.
During 2019, none of our directors received any cash compensation other than the compensation paid to our employee directorMr. Hennessy in respect of his employment, as discussed above. Mr. Hennessy does not receive any additional compensation for his serviceon our board of directors.
On March 25, 2019 we granted Robert J. Mylod, Jr., Chairman of our Board of Directors, an award of 100,000 restricted stock units.The restricted stock units vest in connection with the occurrence of a liquidity event, defined as the first to occur of (i) a qualifying initial publicoffering of the company’s common stock at an initial public offering price equal to at least $15 per share and (ii) a change of control (withinthe meaning of the 2014 Plan) pursuant to which the holders of our common stock receive proceeds, including any estimated escrow,contingent or deferred amounts likely to be paid following the closing of such change of control, equal at least $15 per share (subject toadjustment
142

Table of Contents
in the event of any extraordinary corporate transaction). Subject to the occurrence of a liquidity event that is a qualifying initial public offering,the restricted stock units are scheduled to vest over a period of three years such that one-third of the restricted stock units will vest on the12-month anniversary of the grant date, one-third of the restricted stock units shall vest on the 24-month anniversary of the grant date andthe remaining one-third will vest on the 36-month anniversary of the grant date, so long as Mr. Mylod continues to serve through theapplicable vesting date; provided that if a change of control occurs following such qualifying initial public offering but prior to the satisfactionof the time-vesting condition, such remaining unvested restricted stock units shall accelerate and vest, regardless of whether such change ofcontrol is a qualifying change of control for purposes of Mr. Mylod’s grant. In the event the liquidity event trigger is a qualifying change ofcontrol, such restricted stock units shall accelerate and vest in full, subject to Mr. Mylod’s continued service through the date of such changeof control.
On December 6, 2016, we granted Mr. Mylod an award of 250,000 options to purchase our common stock at an exercise price of$3.39 per share. Such options are scheduled to vest over a period of four years in equal annual installments on each of the first fouranniversaries of the vesting commencement date, or June 1, 2016, subject to Mr. Mylod’s continued service with us through each suchvesting date.
On September 1, 2015, we granted Mr. Mylod an award of 98,060 shares of restricted stock. Such award is fully vested.
No other non-employee directors received equity compensation with respect to 2019. With respect to 2020, on May 18, 2020, wegranted restricted stock unit awards under the 2014 Plan with a grant date value (as reasonably determined by our compensation committee)of $250,000 to each of Mses. O’Shaughnessy and Lang in connection with their election as new directors.
Non-Employee Director Compensation Policy
In connection with this offering, our board of directors has adopted a non-employee director compensation policy that, effective uponthe closing of this offering, will be applicable to each of our non-employee directors. Pursuant to this non-employee director compensationpolicy, each non-employee director will receive a mixture of cash and equity compensation, including a $30,000 annual cash retainer (plusadditional cash retainers of up to $10,000 for service as chairperson of the board of directors or service on other committees) and annualequity awards with a grant date fair value of $100,000.
Equity Plans
Equity Incentive Arrangements
Existing Equity Plan
We currently maintain our 2014 Plan, as described above. On and after the closing of this offering and following the effectiveness ofthe 2020 Plan, no further grants will be made under the 2014 Plan.
2020 Incentive Award Plan
In connection with the offering, our board of directors has adopted the 2020 Plan, subject to approval by our stockholders, underwhich we may grant cash and equity incentive awards to eligible service providers in order to attract, motivate and retain the talent for whichwe compete. The material terms of the 2020 Plan, as it is currently contemplated, are summarized below.
Eligibility and Administration
Our employees, consultants and directors, and employees, consultants and directors of our parents and subsidiaries, are eligible toreceive awards under the 2020 Plan. The 2020 Plan is
143

Table of Contents
administered by our board of directors with respect to awards to non-employee directors and by the compensation committee with respect toother participants, each of which may delegate its duties and responsibilities to committees of our directors and/or officers (referred tocollectively as the plan administrator below), subject to certain limitations that may be imposed under Section 16 of the Exchange Act, and/orstock exchange rules, as applicable. The plan administrator has the authority to make all determinations and interpretations under, prescribeall forms for use with, and adopt rules for the administration of, the 2020 Plan, subject to its express terms and conditions. The planadministrator will also set the terms and conditions of all awards under the 2020 Plan, including any vesting and vesting accelerationconditions.
Limitation on Awards and Shares Available
The maximum number of shares of our common stock available for issuance under the 2020 Plan is equal to the sum of (i) 3,019,108shares of our common stock, (ii) an annual increase on the first day of each year beginning on January 1, 2022 and ending in and includingJanuary 1, 2030, equal to the lesser of (A) four percent (4%) of the outstanding shares of all classes of our common stock on the last day ofthe immediately preceding fiscal year and (B) such lesser amount as determined by our board of directors or compensation committee, and(iii) any shares of our common stock subject to awards under the 2014 Plan which are forfeited or lapse unexercised and which following theeffective date are not issued under the 2014 Plan; provided, however, no more than 10,000,000 shares may be issued upon the exercise ofincentive stock options, or ISOs. The share reserve formula under the 2020 Plan is intended to provide us with the continuing ability to grantequity awards to eligible employees, directors and consultants for the ten-year term of the 2020 Plan.
Awards granted under the 2020 Plan upon the assumption of, or in substitution for, outstanding equity awards previously granted byan entity in connection with a corporate transaction, such as a merger, combination, consolidation or acquisition of property or stock will notreduce the shares authorized for grant under the 2020 Plan. The maximum grant date fair value of awards granted to any non-employeedirector pursuant to the 2020 Plan during any calendar year is $500,000.
Awards
The 2020 Plan provides for the grant of stock options, including ISOs, and nonqualified stock options, or NSOs, restricted stock,dividend equivalents, stock payments, restricted stock units, or RSUs, other incentive awards, SARs, and cash awards. No determination hasbeen made as to the types or amounts of awards that will be granted to certain individuals pursuant to the 2020 Plan. Certain awards underthe 2020 Plan may constitute or provide for a deferral of compensation, subject to Section 409A of the Code, which may impose additionalrequirements on the terms and conditions of such awards. All awards under the 2020 Plan will be set forth in award agreements, which willdetail all terms and conditions of the awards, including any applicable vesting and payment terms and post-termination exercise limitations.Awards other than cash awards generally will be settled in shares of our common stock, but the plan administrator may provide for cashsettlement of any award. A brief description of each award type follows.
• Stock Options. Stock options provide for the purchase of shares of our common stock in the future at an exercise price set on thegrant date. ISOs, by contrast to NSOs, may provide tax deferral beyond exercise and favorable capital gains tax treatment to theirholders if certain holding period and other requirements of the Code are satisfied. The exercise price of a stock option may not beless than 100% of the fair market value of the underlying share on the date of grant (or 110% in the case of ISOs granted to certainsignificant stockholders), except with
144

Table of Contents
respect to certain substitute options granted in connection with a corporate transaction. The term of a stock option may not belonger than ten years (or five years in the case of ISOs granted to certain significant stockholders).
• SARs. SARs entitle their holder, upon exercise, to receive from us an amount equal to the appreciation of the shares subject tothe award between the grant date and the exercise date. The exercise price of a SAR may not be less than 100% of the fair marketvalue of the underlying share on the date of grant (except with respect to certain substitute SARs granted in connection with acorporate transaction) and the term of a SAR may not be longer than ten years.
• Restricted Stock and RSUs. Restricted stock is an award of nontransferable shares of our common stock that remain forfeitableunless and until specified conditions are met, and which may be subject to a purchase price. RSUs are contractual promises todeliver shares of our common stock in the future, which may also remain forfeitable unless and until specified conditions are met.Delivery of the shares underlying RSUs may be deferred under the terms of the award or at the election of the participant, if theplan administrator permits such a deferral.
• Stock Payments, Other Incentive Awards and Cash Awards. Stock payments are awards of fully vested shares of our commonstock that may, but need not, be made in lieu of base salary, bonus, fees or other cash compensation otherwise payable to anyindividual who is eligible to receive awards. Other incentive awards are awards other than those enumerated in this summary thatare denominated in, linked to or derived from shares of our common stock or value metrics related to our shares, and may remainforfeitable unless and until specified conditions are met. Cash awards are cash incentive bonuses subject to performance goals.
• Dividend Equivalents. Dividend equivalents represent the right to receive the equivalent value of dividends paid on shares of ourcommon stock and may be granted alone or in tandem with another award other than stock options or SARs. Dividend equivalentsare credited as of dividend record dates during the period between the date an award is granted and the date such award vests, isexercised, is distributed or expires, as determined by the plan administrator.
Vesting
Vesting conditions determined by the plan administrator may apply to each award and may include continued service, performanceand/or other conditions.
Certain Transactions
The plan administrator has broad discretion to take action under the 2020 Plan, as well as make adjustments to the terms andconditions of existing and future awards, to prevent the dilution or enlargement of intended benefits and facilitate necessary or desirablechanges in the event of certain transactions and events affecting our common stock, such as stock dividends, stock splits, mergers,acquisitions, consolidations and other corporate transactions. In addition, in the event of certain non-reciprocal transactions with ourstockholders known as “equity restructurings,” the plan administrator will make equitable adjustments to the 2020 Plan and outstandingawards. In the event of a “change in control” of the company (as defined in the 2020 Plan), to the extent that the surviving entity declines tocontinue, convert, assume or replace outstanding awards, then the plan administrator may provide that all such awards will terminate inexchange for cash or other consideration, or become fully vested and exercisable in connection with the transaction. Upon or in anticipationof a change in control, the plan administrator may cause any outstanding awards to terminate at a specified time in the future and give theparticipant the right to exercise such awards during a period of time determined by the plan administrator in its sole discretion. Individualaward agreements may provide for additional accelerated vesting and payment provisions.
145

Table of Contents
Foreign Participants, Claw-Back Provisions, Transferability, and Participant Payments
The plan administrator may modify award terms, establish subplans and/or adjust other terms and conditions of awards, subject to theshare limits described above, in order to facilitate grants of awards subject to the laws and/or stock exchange rules of countries outside of theUnited States. All awards will be subject to the provisions of any claw-back policy implemented by us to the extent set forth in such claw-backpolicy and/or in the applicable award agreement. With limited exceptions for estate planning, domestic relations orders, certain beneficiarydesignations and the laws of descent and distribution, awards under the 2020 Plan are generally non-transferable, and are exercisable onlyby the participant. With regard to tax withholding, exercise price and purchase price obligations arising in connection with awards under the2020 Plan, the plan administrator may, in its discretion, accept cash or check, provide for net withholding of shares, allow shares of ourcommon stock that meet specified conditions to be repurchased, allow a “market sell order” or such other consideration as it deems suitable.
Plan Amendment and Termination
Our board of directors may amend or terminate the 2020 Plan at any time; however, except in connection with certain changes in ourcapital structure, stockholder approval will be required for any amendment that increases the number of shares available under the 2020Plan. No award may be granted pursuant to the 2020 Plan after the tenth anniversary of the earlier of (i) the date on which our board ofdirectors adopts the 2020 Plan and (ii) the date on which our stockholders approve the Plan.
146

Table of Contents
CERTAIN RELATIONSHIPS AND RELATED PARTY TRANSACTIONS
In addition to the compensation arrangements, including employment, termination of employment and change in controlarrangements, discussed in the sections titled “Management” and “Executive Compensation,” the following is a description of eachtransaction or agreement since January 1, 2017 and each currently proposed transaction in which:
• we have been or are to be a participant;
• the amount involved exceeded or exceeds $120,000; and
• any of our directors, executive officers or holders of more than 5% of our outstanding capital stock, or any immediate family
member of, or person sharing the household with, any of these individuals or entities, had or will have a direct or indirect materialinterest.
We also describe below certain other transactions and relationships with our directors, executive officers and stockholders. Thediscussion below does not give effect to the Forward Stock Split.
Equity Financings
Series F Preferred Stock Financing. From June 2017 to November 2017, we sold an aggregate of 6,057,805 shares of our Series Fpreferred stock to certain investors, including General Catalyst Group VII, L.P. (“General Catalyst”) and entities affiliated with L Catterton(“Catterton”), T. Rowe Price Associates, Inc. (“T. Rowe”) and two members of our board of directors at that time, Robert J. Mylod, Jr. and ElieWurtman, at a purchase price of $17.05763 per share for an aggregate purchase price of approximately $103.3 million. General Catalyst,Catterton and T.Rowe each currently hold more than 5% of our outstanding capital stock. Scott A. Dahnke and Michael J. Farello, currentmembers of our board of directors, are affiliated with Catterton, and Adam Valkin, a current member of our board of directors, is affiliated withGeneral Catalyst.
Series G Preferred Stock. From August 2018 to December 2018, we sold an aggregate of 8,140,020 shares of our Series G preferredstock to certain investors, including our Chief Executive Officer, Paul J. Hennessy, Auto Holdings, Inc. (“Auto Holdings”), an affiliate ofAutoNation (“AutoNation”), Cascade Investment, L.L.C. (“Cascade”), General Catalyst and entities affiliated with Catterton, T. Rowe andthree members of our board of directors at that time, Robert J. Mylod Jr., Ethan E. Benovitz and Elie Wurtman, at a purchase price of$17.95097 per share for an aggregate purchase price of approximately $146.1 million. Auto Holdings, Cascade, General Catalyst, Cattertonand T. Rowe each currently hold more than 5% of our outstanding capital stock.
Series H Preferred Stock. From November 2019 to January 2020, we sold an aggregate of 9,354,047 shares of our Series Hpreferred stock to certain investors, including a member of our board of directors, Robert J. Mylod, Jr., General Catalyst, Cascade, PICOCo-Investments V and entities affiliated with Catterton and T. Rowe, at a purchase price of $27.19305 per share for an aggregate purchaseprice of approximately $254.4 million. General Catalyst, Cascade, Catterton and T. Rowe each currently hold more than 5% of ouroutstanding capital stock. Elie Wurtman, who was a member of our board of directors at that time, is affiliated with PICO Co-Investments V.
Investors’ Rights Agreement
We are party to an Eighth Amended and Restated Investors’ Rights Agreement (“IRA”) dated as of November 21, 2019, with certainholders of our capital stock, including Auto Holdings, Cascade,
147

Table of Contents
General Catalyst and entities affiliated with Catterton and T. Rowe. Paul J. Hennessy, our Chief Executive Officer, and Robert J. Mylod, Jr.,Scott A. Dahnke, Michael J. Farello and Adam Valkin, members of our board of directors, and/or certain entities affiliated with them are alsoparties to the IRA. Under the IRA, certain holders of our capital stock have the right to demand that we file a registration statement or requestthat their shares of our capital stock be covered by a registration statement that we are otherwise filing. See the section titled “Description ofCapital Stock—Registration Rights” for additional information regarding these registration rights.
Right of First Refusal and Co-Sale Agreement
We are party to an Eighth Amended and Restated Right of First Refusal and Co-Sale Agreement (“ROFR Agreement”), dated as ofNovember 21, 2019, pursuant to which we or our assignees have a right to purchase shares of our capital stock that our stockholderspropose to sell to other parties. Auto Holdings, Cascade, General Catalyst and entities affiliated with Catterton and T. Rowe are parties to theROFR Agreement. Paul J. Hennessy, our Chief Executive Officer, and Robert J. Mylod, Jr., Scott A. Dahnke, Michael J. Farello and AdamValkin, members of our board of directors, and/or certain entities affiliated with them are also a party to the ROFR Agreement. See thesection titled “Principal Stockholders” for additional information regarding beneficial ownership of our capital stock. Upon completion of thisoffering, the ROFR Agreement will terminate and we will not have the right to purchase shares of our capital stock that our stockholderspropose to sell to other parties.
Voting Agreement
We are party to an Eighth Amended and Restated Voting Agreement (“Voting Agreement”), dated as of November 21, 2019, underwhich certain holders of our capital stock, including Auto Holdings, Cascade, General Catalyst and affiliates of Catterton and T. Rowe, haveagreed to vote their shares of our capital stock on certain matters, including with respect to the election of directors. Paul J. Hennessy, ourChief Executive Officer, and Robert J. Mylod, Jr., Scott A. Dahnke, Michael J. Farello and Adam Valkin, members of our board of directors,and/or certain entities affiliated with them are also parties to the Voting Agreement. Upon completion of this offering, the Voting Agreementwill terminate and none of our stockholders will have any special rights regarding the election or designation of members of our board ofdirectors.
Promissory Notes
In September 2016, we issued certain amended and restated promissory notes to Elie Wurtman, who was a member of our board ofdirectors at that time, and two entities affiliated with Mr. Wurtman, totaling approximately $1.8 million, payable to us, as payment for thepurchase price for an aggregate of 656,086 shares of common stock pursuant to the terms of restricted stock grants in 2014 and 2015.Pursuant to an amended and restated stock pledge agreement and joinder, these notes are secured by an aggregate of 848,910 shares ofcommon stock. The promissory notes bear simple interest at the rate of 2.75% per annum until paid.
AutoNation Reconditioning Agreement
In January 2019, we entered into a vendor agreement (“Vendor Agreement”) with AutoNation, an affiliate of Auto Holdings, a holder ofmore than 5% of our outstanding capital stock, pursuant to which AutoNation will provide certain reconditioning and repair services ofvehicles owned by us. Amounts due under the Vendor Agreement for parts supplied and services performed by AutoNation become due andpayable as they accrue. The Vendor Agreement was terminated in February 2020.
Master Services Agreement
In July 2015, we entered into a management services agreement (“MSA”) with Catterton Management Company, L.L.C. (“CattertonManagement”), an affiliate of Catterton, a holder of more
148

Table of Contents
than 5% of our outstanding capital stock, pursuant to which Catterton Management agreed to provide consulting services on certain businessand financial matters. Under the MSA, we were required to pay Catterton Management an annual fee of $250,000 until the expiration of theMSA upon the earlier of (i) termination by mutual consent of the parties and (ii) such time that Catterton and/or its affiliates cease to be one ofour stockholders. Catterton waived our fee due under the MSA for 2018, 2019 and 2020. The MSA was terminated in May 2020.
Employment Agreements
We have granted stock options to our executive officers and certain of our directors. See the section titled “Executive Compensation—Summary Compensation Table” for a description of these stock options.
Director and Officer Indemnification and Insurance
Our amended and restated certificate of incorporation and amended and restated bylaws will provide indemnification andadvancement of expenses for our directors and officers to the fullest extent permitted by the DGCL, subject to certain limited exceptions.Prior to the consummation of this offering, we intend to enter into separate indemnification agreements with each of our directors andexecutive officers. We have also purchased directors’ and officers’ liability insurance for each of our directors and executive officers. See“Description of Capital Stock—Limitations on Liability and Indemnification of Officers and Directors.”
Our Policy Regarding Related Person Transactions
Our board of directors recognizes the fact that transactions with related persons present a heightened risk of conflicts of interests (orthe perception thereof). Our board of directors has adopted a written policy on transactions with related persons. Under the policy, our legaldepartment is primarily responsible for developing and implementing processes and procedures to obtain information regarding relatedpersons with respect to potential related person transactions and then determining, based on the facts and circumstances, whether suchpotential related person transactions do, in fact, constitute related person transactions requiring compliance with the policy. If our legaldepartment determines that a transaction or relationship is a related person transaction requiring compliance with the policy, our Chief LegalOfficer is required to present to the audit committee all relevant facts and circumstances relating to the related person transaction. Our auditcommittee must review the relevant facts and circumstances of each related person transaction, including if the transaction is on termscomparable to those that could be obtained in arm’s length dealings with an unrelated third party and the extent of the related person’sinterest in the transaction, take into account the conflicts of interest and corporate opportunity provisions of our code of business conduct andethics (which has been adopted prior to the completion of this offering), and either approve or disapprove the related person transaction. Ifadvance audit committee approval of a related person transaction requiring the audit committee’s approval is not feasible, then thetransaction may be preliminarily entered into by management upon prior approval of the transaction by the chair of the audit committeesubject to ratification of the transaction by the audit committee at the audit committee’s next regularly scheduled meeting; provided, that ifratification is not forthcoming, management will make all reasonable efforts to cancel or annul the transaction. If a transaction was not initiallyrecognized as a related person transaction, then upon such recognition the transaction will be presented to the audit committee forratification at the audit committee’s next regularly scheduled meeting; provided, that if ratification is not forthcoming, management will makeall reasonable efforts to cancel or annul the transaction. Our management will update the audit committee as to any material changes to anyapproved or ratified related person transaction and will provide a status report at least annually of all then current related person transactions.No director may participate in approval of a related person transaction for which he or she is a related person.
149

Table of Contents
PRINCIPAL STOCKHOLDERS
The following table sets forth information with respect to the beneficial ownership of our common stock (1)(i) reflecting the AutomaticConversion (ii) the Forward Stock Split, (iii) the issuance of 183,870 of the RA Shares and (iv) the filing and effectiveness of our amendedand restated certificate of incorporation and the adoption of our amended and restated bylaws upon the closing of this offering, in each caseas if such event had occurred on March 31, 2020, and (2) as adjusted to give effect to this offering, for:
• each person known by us to beneficially own more than 5% of our common stock;
• each of our directors;
• each of our named executive officers; and
• all of our executive officers and directors as a group.
The number of shares beneficially owned by each stockholder as described in this prospectus is determined under rules issued by theSEC. Under these rules, beneficial ownership includes any shares as to which the individual or entity has sole or shared voting power orinvestment power. In computing the number of shares beneficially owned by an individual or entity and the percentage ownership of thatperson, shares of common stock subject to options, warrants or other rights held by such person that are currently exercisable or will becomeexercisable within 60 days of May 18, 2020 are considered outstanding, although these shares are not considered outstanding for purposesof computing the percentage ownership of any other person. The applicable percentage ownership after this offering is based on115,420,960 shares of our common stock outstanding immediately following the completion of this offering, assuming that the underwriterswill not exercise their over-allotment option and assuming the issuance of up to 21,250,000 shares of common stock at the closing of thisoffering. Unless otherwise indicated, the address of all listed stockholders is 1375 Broadway, Floor 11, New York, NY 10018.
Each of the stockholders listed below has sole voting and investment power with respect to the shares beneficially owned by suchstockholder unless noted otherwise, subject to community property laws where applicable.
Shares of CommonStock Beneficially
Owned BeforeThis Offering
Shares of CommonStock Beneficially
Owned AfterThis Offering
Name of Beneficial Owner Number % Number % 5% Stockholders: Entities affiliated with L Catterton(1) 19,422,834 20.6% 19,422,834 16.8% General Catalyst Group VII, L.P.(2) 6,051,670 6.4% 6,051,670 5.2% Certain funds and accounts advised by T. Rowe Price Associates, Inc.(3) 15,028,926 16.0% 15,028,926 13.0% Auto Holdings, LLC(4) 5,570,730 5.9% 5,570,730 4.8% Cascade Investment, L.L.C.(5) 6,771,076 7.2% 6,771,076 5.9% Named Executive Officers and Directors: Robert J. Mylod, Jr.(6) 1,798,012 1.9% 1,798,012 1.6% Scott A. Dahnke(7) 19,422,834 20.6% 19,422,834 16.8% Michael J. Farello — * — * Laura W. Lang — * — * Laura G. O’Shaughnessy — * — * Adam Valkin(8) 6,051,670 6.4% 6,051,670 5.2% Paul J. Hennessy(9) 1,277,096 1.3% 1,277,096 1.1% David K. Jones(10) 100,000 * 100,000 * Mark E. Roszkowski(11) 87,500 * 87,500 * All Executive Officers and Directors as a group (11 individuals)(12) 28,947,112 30.2% 28,947,112 24.7%
150

Table of Contents
* Indicates beneficial ownership of less than 1%.(1) Consists of (i) 6,994,354 shares of preferred stock held of record by CGP2 Zoom Holding, L.P. (“CGP2 Zoom”), (ii) 254,256 shares of common stock and 10,335,520
shares of preferred stock held of record by CGP2 Lone Star, L.P. (“CGP2 Lone Star”) and (iii) 1,838,704 shares of preferred stock held of record by LCGP3 Accelerator,L.P. (“LCGP3 Accelerator”). CGP2 Managers, L.L.C. is the general partner for each of CGP2 Zoom and CGP2 Lone Star. CGP3 Managers, L.L.C. is the general partnerof LCGP3 Accelerator. The management of each of CGP2 Managers, L.L.C. and CGP3 Managers, L.L.C. is controlled by a managing board. J. Michael Chu and Scott A.Dahnke are the members of the managing board of each of CGP2 Managers, L.L.C. and CGP3 Managers, L.L.C. and as such could be deemed to share voting controland investment power over shares that may be deemed to be beneficially owned by the entities affiliated with L Catterton, but each disclaims beneficial ownership of suchshares except to the extent of his pecuniary interest therein. The address of the entities and individuals mentioned in this footnote is 599 West Putnam Avenue,Greenwich, CT 06830.
(2) Consists of 1,169,868 shares of common stock and 4,881,802 shares of preferred stock held by General Catalyst Group VII, L.P. (“GCG VII”). General Catalyst GP VII,LLC (“GCGP VII”) is the general partner of General Catalyst Partners VII, L.P. (“GCP VII”), which is the general partner of GCG VII. General Catalyst Group ManagementHoldings, L.P. (“GCGMH”) is the manager of General Catalyst Group Management, LLC (“GCGM”), which is the manager of GCGP VII. As the Managing Members ofGeneral Catalyst Group Management Holdings GP, LLC, the general partner of GCGMH, Kenneth Chenault, Joel Cutler, David Fialkow and Hement Taneja (collectively,the “Managing Members”), share voting and dispositive power with respect to the shares held by GCG VII. Each of the Managing Members, Adam Valkin, the generalpartner of GCGMH, GCGMH, GCGM, GCGP VII and GCP VII may be deemed to beneficially own such shares but each disclaims beneficial ownership of such shares.Adam Valkin, a member of our board of directors, is a limited partner of GCP VII and a managing director of GCP VII. The address of the entities and individualsmentioned in this footnote is 20 University Road, Suite 450, Cambridge, MA 02138.
(3) Consists of 385,238 shares of common stock and 14,643,688 shares of preferred stock held by funds and accounts for which T. Rowe Price Associates, Inc. (“TRPA”)serves as investment adviser or subadviser, as applicable, with power to direct investments and/or sole power to vote the securities owned by such funds and accounts(with the exception of one advisory fund that retains its own voting authority). TRPA may be deemed to be the beneficial owner of the shares held by such funds andaccounts; however, TRPA expressly disclaims that it is, in fact, the beneficial owner of such securities. TRPA is the wholly owned subsidiary of T. Rowe Price Group, Inc.,which is a publicly traded financial services holding company. T. Rowe Price Investment Services, Inc. (“TRPIS”), a registered broker-dealer (and FINRA member), is asubsidiary of TRPA. TRPIS was formed primarily for the limited purpose of acting as the principal underwriter and distributor of shares of the funds in the T. Rowe Pricefund family. TRPIS does not engage in underwriting or market-making activities involving individual securities. The address for these entities is 100 East Pratt Street,Baltimore, MD 21202.
(4) Consists of 5,570,730 shares of preferred stock held by Auto Holdings, LLC. AutoNation, Inc., a publicly traded company with securities listed on the New York StockExchange, is the sole member of Auto Holdings, LLC. The address for these entities is 200 SW 1st Avenue, Fort Lauderdale, FL 33301.
(5) Consists of 6,771,076 shares of preferred stock held by Cascade Investment, L.L.C. (“Cascade”). All shares of our common stock held by Cascade may be deemed to bebeneficially owned by William H. Gates III as the sole member of Cascade. The address of Cascade is 2365 Carillon Point, Kirkland, WA 98033.
(6) Consists of (i) 98,060 shares of common stock, (ii) 301,412 shares of preferred stock, and (iii) 250,000 shares of common stock subject to options that are exercisablewithin 60 days of May 18, 2020 in each case held by Mr. Mylod. Also consists of (i) 203,872 shares of common stock and (ii) 944,668 shares of preferred stock held byAnnox Capital, LLC. Mr. Mylod is the managing member of Annox Capital and therefore holds voting or dispositive power over the shares held by Annox Capital. Theaddress for Annox Capital is 480 Pierce Street, Suite 240, Birmingham, MI 48009.
(7) Consists of the shares identified in footnote (1) above. Mr. Dahnke is a member of the managing board of each of CGP2 Managers, L.L.C. and CGP3 Managers, L.L.C.and as such could be deemed to share voting control and investment power over shares that may be deemed to be beneficially owned by the entities affiliated with LCatterton, but disclaims beneficial ownership of such shares except to the extent of his pecuniary interest therein.
(8) Consists of the shares identified in footnote (2) above.(9) Consists of (i) 154,094 shares of common stock, (ii) 9,706 shares of preferred stock, (iii) 100,000 restricted stock units vesting within 60 days of May 18, 2020 and
(iv) 1,013,296 shares of common stock subject to options that are exercisable within 60 days of May 18, 2020 in each case held by Mr. Hennessy.(10) Consists of 100,000 shares of common stock subject to options held by Mr. Jones that are exercisable within 60 days of May 18, 2020.(11) Consists of 87,500 shares of common stock subject to options held by Mr. Roszkowski that are exercisable within 60 days of May 18, 2020.(12) Consists of (i) 1,880,150 shares of common stock, (ii) 25,306,166 shares of preferred stock, (iii) 100,000 restricted stock units vesting within 60 days of May 18, 2020 and
(iv) 1,660,796 shares of common stock subject to options held by all our current directors and executive officers as a group that are exercisable within 60 days of May 18,2020.
151

Table of Contents
DESCRIPTION OF CAPITAL STOCK
General
At or prior to the consummation of this offering, we will file an amended and restated certificate of incorporation and we will adopt ouramended and restated bylaws. Our amended and restated certificate of incorporation will authorize capital stock consisting of:
• 500,000,000 shares of common stock, par value $0.001 per share; and
• 10,000,000 shares of preferred stock, par value $0.001 per share.
We are selling 21,250,000 shares of common stock in this offering (24,437,500 shares if the underwriters exercise their over-allotmentoption to purchase additional shares of our common stock in full).
Assuming (i) the Automatic Conversion, (ii) the Forward Stock Split and (iii) the filing and effectiveness of our amended and restatedcertificate of incorporation and the adoption of our amended and restated bylaws, as of March 31, 2020, there were 93,987,090 shares of ourcommon stock outstanding, held by 170 stockholders of record, and no shares of our preferred stock outstanding.
The following summary describes the material provisions of our capital stock. We urge you to read our amended and restatedcertificate of incorporation and our amended and restated bylaws, which are included as exhibits to the registration statement of which thisprospectus forms a part.
Certain provisions of our amended and restated certificate of incorporation and our amended and restated bylaws summarized belowmay be deemed to have an anti-takeover effect and may delay or prevent a tender offer or takeover attempt that a stockholder mightconsider in its best interest, including those attempts that might result in a premium over the market price for the shares of common stock.
Common Stock
Voting Rights
Holders of shares of our common stock will be entitled to one vote for each share held of record on all matters submitted to a vote ofstockholders. The holders of our common stock will not have cumulative voting rights in the election of directors.
Dividends
Holders of shares of our common stock will be entitled to receive ratably those dividends, if any, as may be declared by our board ofdirectors out of funds legally available therefor, subject to any statutory or contractual restrictions on the payment of dividends and to anyrestrictions on the payment of dividends imposed by the terms of any outstanding preferred stock.
Liquidation
In the event of our dissolution or liquidation, after payment in full of all amounts required to be paid to creditors and to the holders ofpreferred stock having liquidation preferences, if any, the holders of shares of our common stock will be entitled to share ratably in theremaining assets legally available for distribution.
152

Table of Contents
Rights and Preferences
Holders of our common stock will not have preemptive, subscription, redemption or conversion rights. There will be no redemption orsinking fund provisions applicable to our common stock. The rights, preferences and privileges of the holders of our common stock will besubject to and may be adversely affected by the rights of the holders of shares of any series of our preferred stock that we may designate inthe future.
Fully Paid and Nonassessable
All shares of our common stock outstanding upon consummation of this offering will be fully paid and non-assessable.
Preferred Stock
Upon the consummation of this offering and pursuant to our amended and restated certificate of incorporation that will becomeeffective at the consummation of this offering, the total number of authorized shares of preferred stock will be 10,000,000 shares. Upon theconsummation of this offering, we will have no shares of preferred stock outstanding.
Under the terms of our amended and restated certificate of incorporation that will become effective upon the consummation of thisoffering, our board of directors is authorized to direct us to issue shares of preferred stock in one or more series without stockholderapproval. Our board of directors has the discretion to determine the rights, powers, preferences, privileges and restrictions, including votingrights, dividend rights, conversion rights, redemption privileges and liquidation preferences, of each series of preferred stock.
The purpose of authorizing our board of directors to issue preferred stock and determine its rights and preferences is to eliminatedelays associated with a stockholder vote on specific issuances. The issuance of preferred stock, while providing flexibility in connection withpossible acquisitions, future financings and other corporate purposes, could have the effect of making it more difficult for a third party toacquire, or could discourage a third party from seeking to acquire, a majority of our outstanding voting stock. Additionally, the issuance ofpreferred stock may adversely affect the holders of our common stock by restricting dividends on the common stock, diluting the votingpower of the common stock or subordinating the liquidation rights of the common stock. As a result of these or other factors, the issuance ofpreferred stock could have an adverse impact on the market price of our common stock.
Warrants
As of March 31, 2020, there were warrants to purchase up to 161,136 shares of common stock and up to 589,970 shares of theSeries F preferred stock. The warrants to purchase common stock include warrants issued to Genesis Capital Advisors LLC, with an exerciseprice of $0.72 per share. The warrants to purchase Series F preferred stock include warrants issued to Eastward Fund Management, LLC inconnection with a Term Loan Facility (which has been repaid in full), with an exercise price of $8.53 per share.
Upon the Automatic Conversion, the warrant for Series F preferred stock, which will remain outstanding following the closing of thisoffering, will become a warrant to purchase common stock. The warrant for Series F preferred stock will expire upon the earlier of August 11,2027 and the third anniversary of this offering.
153

Table of Contents
Registration Rights
The IRA provides that certain holders of our common stock and preferred stock, including, but not limited to, certain holders of at least5% of our capital stock and entities affiliated with certain of our directors, have certain registration rights, as set forth below. The registrationrights set forth in the IRA will expire five years following the completion of this offering, or, with respect to any particular stockholder, whensuch stockholder is able to sell all of its shares pursuant to Rule 144 of the Securities Act during any 90-day period without regard to volumeand manner of sale limitation. We will pay the registration expenses (other than underwriting discounts and commissions and certain otherexpenses) of the holders of the shares registered pursuant to the registrations described below.
In an underwritten offering, the managing underwriter, if any, has the right, subject to specified conditions, to limit the number ofshares such holders may include. In connection with this offering, we expect that each stockholder will agree not to sell or otherwise disposeof any securities without the prior written consent of Goldman Sachs & Co. LLC for a period of 180 days after the date of this prospectus,subject to certain terms and conditions and early release of certain holders in specified circumstances. See the section titled ‘‘Shares Eligiblefor Future Sale—Lock-Up Agreements’’ for additional information regarding such restrictions.
Demand Registration Rights
After the completion of this offering, the holders of an aggregate of 85,533,394 shares of our common stock will be entitled to certaindemand registration rights. At any time beginning six months after the effective date of this registration statement, the holders of at least 20%of the registrable securities then outstanding may request that we register all or a portion of their shares. Such request for registration mustcover securities the aggregate offering price of which, after payment of underwriting discounts and commissions, would exceed $5,000,000.We will not be required to effect more than two registrations on Form S-1 that have been declared effective. The company has the right todefer such registration under certain circumstances.
Piggyback Registration Rights
After the completion of this offering, in the event that we propose to register any of our securities under the Securities Act, either forour own account or for the account of other security holders, in connection with such offering, certain holders of our common stock will beentitled to certain piggyback registration rights allowing the holder to include its shares in such registration, subject to certain marketing andother limitations. As a result, whenever we propose to file a registration statement under the Securities Act, other than with respect to (i) aregistration relating solely to the sale of securities to participants in a company stock plan, (ii) a registration relating to a corporatereorganization or other transaction listed in Rule 145 under the Securities Act and (iii) a registration on any form that does not includesubstantially the same information as would be required to be included in a registration statement covering the sale of the registrablesecurities, the holders of these shares are entitled to notice of the registration and have the right, subject to certain limitations, to include theirshares in the registration.
Form S-3 Registration Rights
After the completion of this offering, the holders of an aggregate of 91,664,706 shares of our common stock will be entitled to certainForm S-3 registration rights. The holders of at least 10% of the registrable securities then outstanding can make a request that we registertheir shares on Form S-3 if we are qualified to file a registration statement on Form S-3 and if the reasonably anticipated aggregate offeringprice, after payment of underwriting discounts and commissions, would equal or
154

Table of Contents
exceed $1,000,000. We will not be required to effect more than two registrations on Form S-3 within any 12-month period. The company hasthe right to defer such registration under certain circumstances.
Forum Selection
Our amended and restated certificate of incorporation will provide that, unless we consent in writing to the selection of an alternativeforum, the Court of Chancery of the State of Delaware will, to the fullest extent permitted by applicable law, be the sole and exclusive forumfor: (1) any derivative action or proceeding brought on our behalf; (2) any action asserting a claim of breach of a fiduciary duty owed by anyof our directors, officers or other employees or stockholders to us or our stockholders; (3) any action asserting a claim against us, anydirector or our officers and employees arising pursuant to any provision of the DGCL, our amended and restated certificate of incorporationor our amended and restated bylaws, or as to which the DGCL confers exclusive jurisdiction on the Court of Chancery; or (4) any actionasserting a claim against us, any director or our officers or employees that is governed by the internal affairs doctrine; provided that theexclusive forum provisions will not apply to suits brought to enforce any liability or duty created by the Exchange Act, or to any claim forwhich the federal courts have exclusive jurisdiction. Our amended and restated certificate of incorporation will further provide that, unless weconsent in writing to the selections of an alternative forum, the federal district courts are the sole and exclusive forum for the resolution of anycomplaint asserting a cause of action arising under the Securities Act, subject to a final adjudication in the State of Delaware of theenforceability of such exclusive forum provision.
Dividends
Declaration and payment of any dividend will be subject to the discretion of our board of directors. The time and amount of dividendswill be dependent upon, among other things, our business prospects, results of operations, financial condition, cash requirements andavailability, debt repayment obligations, capital expenditure needs, contractual restrictions, covenants in the agreements governing ourcurrent and future indebtedness, industry trends, the provisions of Delaware law affecting the payment of dividends and distributions tostockholders and any other factors or considerations our board of directors may regard as relevant. We currently intend to retain all availablefunds and any future earnings to fund the development and growth of our business, and therefore do not anticipate declaring or paying anycash dividends on our common stock in the foreseeable future. See “Dividend Policy” and “Risk Factors—Risks Relating to this Offering andOwnership of our Common Stock—We do not intend to pay dividends on our common stock for the foreseeable future.”
Anti-Takeover Provisions
Our amended and restated certificate of incorporation and amended and restated bylaws, as they will be in effect upon theconsummation of this offering, will contain provisions that may delay, defer or discourage another party from acquiring control of us. Weexpect that these provisions, which are summarized below, will discourage coercive takeover practices or inadequate takeover bids. Theseprovisions are also designed to encourage persons seeking to acquire control of us to first negotiate with our board of directors, which webelieve may result in an improvement of the terms of any such acquisition in favor of our stockholders. However, they also give our board ofdirectors the power to discourage acquisitions that some stockholders may favor.
Stockholder Action; Special Meetings of Stockholders
Our amended and restated certificate of incorporation and amended and restated bylaws will provide that our stockholders may nottake action by written consent, but may only take action at
155

Table of Contents
annual or special meetings of our stockholders. As a result, a holder controlling a majority of our capital stock would not be able to amend ouramended and restated bylaws or remove directors without holding a meeting of our stockholders called in accordance with our amended andrestated bylaws. Further, our amended and restated bylaws provide that only our board of directors, the chairperson of our board of directorsor our chief executive officer may call special meetings of our stockholders, thus prohibiting a stockholder from calling a special meeting.These provisions might delay the ability of our stockholders to force consideration of a proposal or for stockholders controlling a majority ofour capital stock to take any action, including the removal of directors.
Advance Notice Requirements for Stockholder Proposals and Director Nominations
In addition, our amended and restated bylaws will establish an advance notice procedure for stockholder proposals to be broughtbefore an annual meeting or special meeting of stockholders, including proposed nominations of candidates for election to our board ofdirectors. Generally, in order for any matter to be “properly brought” before a meeting, the matter must be (a) specified in a notice of meetinggiven by or at the direction of our board of directors, (b) if not specified in a notice of meeting, otherwise brought before the meeting by ourboard of directors or the chairperson of the meeting, or (c) otherwise properly brought before the meeting by a stockholder present in personwho (1) was a stockholder both at the time of giving the notice and at the time of the meeting, (2) is entitled to vote at the meeting, and(3) has complied with the advance notice procedures specified in the amended and restated bylaws or properly made such proposal inaccordance with Rule 14a-8 under the Exchange Act and the rules and regulations thereunder, which proposal has been included in theproxy statement for the annual meeting. Further, for business to be properly brought before an annual meeting by a stockholder, thestockholder must (a) provide Timely Notice (as defined below) thereof in writing and in proper form to the secretary and (b) provide anyupdates or supplements to such notice at the times and in the forms required by our amended and restated bylaws. To be timely, astockholder’s notice must be delivered to, or mailed and received at, our principal executive offices not less than 90 days nor more than 120days prior to the one-year anniversary of the preceding year’s annual meeting (deemed to be June 4, 2021 for the first annual meetingfollowing consummation of this offering); provided, however, that if the date of the annual meeting is more than 30 days before or more than60 days after such anniversary date, to be timely, notice by the stockholder must be so delivered, or mailed and received, not later than the10th day following the day on which public disclosure of the date of such annual meeting was first made (such notice within such timeperiods, “Timely Notice”).
Stockholders at a special meeting may only consider proposals or nominations specified in the notice of meeting or, in the case of ourannual meetings, brought before the meeting by or at the direction of our board of directors or by a qualified stockholder of record on therecord date for the meeting, who is entitled to vote at the meeting and who has delivered Timely Notice as discussed above. Theseprovisions could have the effect of delaying stockholder actions that are favored by the holders of a majority of our outstanding votingsecurities until the next stockholder meeting.
Amendment of Certificate of Incorporation or Bylaws
Upon consummation of this offering, our amended and restated bylaws may be amended or repealed by a majority vote of our boardof directors or by the affirmative vote of two-thirds of the voting power of the outstanding shares of capital stock entitled to vote thereon. Theaffirmative vote of a majority of our board of directors and two-thirds in voting power of the outstanding shares entitled to vote thereon wouldbe required to amend our amended and restated certificate of incorporation.
156

Table of Contents
Section 203 of the DGCL
We will be governed by the provisions of Section 203 of the DGCL. In general, Section 203 prohibits a public Delaware corporationfrom engaging in a “business combination” with an “interested stockholder” for a period of three years after the time of the transaction inwhich the person became an interested stockholder, unless:
• the business combination or transaction which resulted in the stockholder becoming an interested stockholder was approved by theboard of directors prior to the time that the stockholder became an interested stockholder;
• upon consummation of the transaction which resulted in the stockholder becoming an interested stockholder, the interestedstockholder owned at least 85% of the voting stock of the corporation outstanding at the time the transaction commenced,excluding shares owned by directors who are also officers of the corporation and shares owned by employee stock plans in whichemployee participants do not have the right to determine confidentially whether shares held subject to the plan will be tendered in atender or exchange offer; or
• at or subsequent to the time the stockholder became an interested stockholder, the business combination was approved by the
board of directors and authorized at an annual or special meeting of the stockholders, and not by written consent, by the affirmativevote of at least 662/3% of the outstanding voting stock which is not owned by the interested stockholder.
In general, Section 203 defines a “business combination” to include mergers, asset sales and other transactions resulting in financialbenefit to a stockholder and an “interested stockholder” as a person who, together with affiliates and associates, owns, or, if such person isan affiliate or associate of the corporation, within three years did own, 15% or more of the corporation’s outstanding voting stock. Theseprovisions may have the effect of delaying, deferring or preventing changes in control of our company.
Limitations on Liability and Indemnification of Officers and Directors
Our amended and restated certificate of incorporation and amended and restated bylaws will provide indemnification andadvancement of expenses for our directors and officers to the fullest extent permitted by the DGCL, subject to certain limited exceptions.Prior to the consummation of this offering, we intend to enter into separate indemnification agreements with each of our directors and ourexecutive officers. In some cases, the provisions of our indemnification agreements with our directors and executive officers may be broaderthan the specific indemnification provisions contained under Delaware law. In addition, as permitted by Delaware law, our amended andrestated certificate of incorporation will include provisions that eliminate the personal liability of our directors for monetary damages resultingfrom breaches of certain fiduciary duties as a director. The effect of this provision is to restrict our rights and the rights of our stockholders inderivative suits to recover monetary damages against a director for breach of fiduciary duties as a director. This provision does not, however,eliminate the personal liability of our directors for monetary damages resulting from: (1) breach of the director’s duty of loyalty, (2) acts oromissions not in good faith that involve intentional misconduct or knowing violation of law, (3) an unlawful payment of dividends or anunlawful stock purchase or redemption, or (4) any transaction from which the director derived an improper personal benefit.
These provisions may be held not to be enforceable for violations of the federal securities laws of the United States.
157

Table of Contents
Dissenters’ Rights of Appraisal and Payment
Under the DGCL, with certain exceptions, our stockholders will have appraisal rights in connection with a merger or consolidation ofVroom, Inc. Pursuant to the Section 262 of the DGCL, stockholders who properly demand and perfect appraisal rights in connection withsuch merger or consolidation will have the right to receive payment of the fair value of their shares as determined by the Delaware Court ofChancery.
Stockholders’ Derivative Actions
Under the DGCL, any of our stockholders may bring an action in our name to procure a judgment in our favor, also known as aderivative action, provided that the stockholder bringing the action is a holder of our shares at the time of the transaction to which the actionrelates.
Transfer Agent and Registrar
The transfer agent and registrar for our common stock will be American Stock Transfer & Trust Company.
Trading Symbol and Market
We have been approved to list our common stock on Nasdaq under the symbol “VRM.”
158

Table of Contents
SHARES ELIGIBLE FOR FUTURE SALE
Immediately prior to this offering, there was no public market for our common stock. Future sales of substantial amounts of ourcommon stock in the public market, or the perception that such sales may occur, could adversely affect the market price of our commonstock. Although we have applied to have our common stock listed on Nasdaq, we cannot assure you that there will be an active public marketfor our common stock.
Upon the closing of this offering, we will have outstanding an aggregate of 115,237,090 shares of common stock, assuming theissuance of 21,250,000 shares of common stock offered by us in this offering. Of these shares, all shares sold in this offering will be freelytradable without restriction or further registration under the Securities Act, except for any shares purchased by our “affiliates,” as that term isdefined in Rule 144 under the Securities Act, whose sales would be subject to the Rule 144 resale restrictions described below, other thanthe holding period requirement.
The remaining 93,987,090 shares of common stock will be “restricted securities,” as that term is defined in Rule 144 under theSecurities Act. These restricted securities are eligible for public sale only if they are registered under the Securities Act or if they qualify for anexemption from registration under Rules 144 or 701 under the Securities Act, which are summarized below.
Registration Rights
Pursuant to our IRA, after the completion of this offering, the holders of up to 91,664,706 shares of our common stock, or certaintransferees, will be entitled to certain rights with respect to the registration of the offer and sale of those shares under the Securities Act. Seethe section titled “Description of Capital Stock—Registration Rights” for a description of these registration rights. If the offer and sale of theseshares of our common stock are registered, the shares will be freely tradable without restriction under the Securities Act, subject to theRule 144 limitations applicable to affiliates, and a large number of shares may be sold into the public market.
Lock-Up Agreements
We, our executive officers, directors and the holders of substantially all of our outstanding stock, without the prior written consentof Goldman Sachs & Co. LLC, will not, subject to certain exceptions, during the period ending 180 days after the date of this prospectus:
• offer, sell, contract to sell, pledge, grant any option to purchase, lend or otherwise dispose of, or publicly disclose the intention tomake any offer, sale, pledge or disposition of any shares of our common stock, or any options or warrants to purchase any sharesof our common stock, or any securities convertible into, exchangeable for, or that represent the right to receive, shares of ourcommon stock; or
• engage in any hedging or other transaction or arrangement (including, without limitation, any short sale or the purchase or sale of,or entry into, any put or call option, or combination thereof, forward, swap or other derivative transaction or instrument) which isdesigned to or which could reasonably be expected to lead to or result in a sale, loan, pledge or other disposition or transfer of all ora portion of the economic consequences of ownership of our common stock or any securities convertible into or exercisable orexchangeable for shares of our common stock,
whether any transaction described above is to be settled by delivery of our common stock or such other securities, in cash or otherwise.
159

Table of Contents
Upon the expiration of the lock-up period, substantially all of the shares subject to such lock-up restrictions will become eligible forsale, subject to the limitations discussed above. For a further description of these lock-up agreements, please see “Underwriting.”
In connection with the RA Agreement, Rocket and Robert J. Mylod, Jr., the chairperson of our board of directors entered into a letteragreement (the “Rocket Lock-up Letter”), which will restrict Rocket’s ability to dispose of RA Shares issued to Rocket pursuant to the RAAgreement. These restrictions apply only to the RA Shares and not to other shares that may be owned by Rocket or its affiliates. Under theRocket Lock-up Letter, following the closing of this offering, subject to certain exceptions, including charitable contributions, (i) Mr. Mylod willnot dispose of Vroom shares owned by him, other than pursuant to a 10b5-1 plan, and no earlier than six months after the adoption of such10b5-1 Plan and (ii) Rocket may not dispose of the RA Shares, other than disposal of up to two times the percentage of any shares (a)subject to sale by Mr. Mylod pursuant to such 10b5-1 Plan or (b) donated by Mr. Mylod to charity. The terms of the Rocket Lock-up Letter willterminate on the earlier to occur of four years after execution or Mr. Mylod ceasing to be a member of our board of directors.
Rule 144
Affiliate Resales of Restricted Securities
In general, beginning 90 days after the effective date of the registration statement of which this prospectus is a part, a person who isan affiliate of ours, or who was an affiliate at any time during the 90 days before a sale, who has beneficially owned shares of our commonstock for at least 180 days would be entitled to sell in “broker’s transactions” or certain “riskless principal transactions” or to market makers, anumber of shares within any three-month period that does not exceed the greater of:
• 1% of the number of shares of our common stock then outstanding; and
• the average weekly trading volume in our common stock on Nasdaq during the four calendar weeks preceding the filing of a noticeon Form 144 with respect to such sale.
Affiliate resales under Rule 144 are also subject to the availability of current public information about us. In addition, if the number ofshares being sold under Rule 144 by an affiliate during any three-month period exceeds 5,000 shares or has an aggregate sale price inexcess of $50,000, the seller must file a notice on Form 144 with the SEC and Nasdaq concurrently with either the placing of a sale orderwith the broker or the execution directly with a market maker.
Non-Affiliate Resales of Restricted Securities
Under Rule 144, a person who is not an affiliate of ours at the time of sale, and has not been an affiliate at any time during the90 days preceding a sale, and who has beneficially owned shares of our common stock for at least six months but less than a year, is entitledto sell such shares subject only to the availability of current public information about us. If such person has held our shares for at least oneyear, such person can resell without regard to any Rule 144 restrictions, including the 90-day public company requirement and the currentpublic information requirement.
Non-affiliate resales are not subject to the manner of sale, volume limitation or notice filing provisions of Rule 144.
Rule 701
In general, under Rule 701, any of our employees, directors, officers, consultants or advisors who purchases shares from us inconnection with a compensatory stock or option plan or other written agreement before the effective date of the registration statement ofwhich this prospectus forms a part
160

Table of Contents
is entitled to sell such shares 90 days after such effective date in reliance on Rule 144. Our affiliates can resell shares in reliance on Rule144 without having to comply with the holding period requirement, and non-affiliates of the issuer can resell shares in reliance on Rule 144without having to comply with the current public information and holding period requirements.
The SEC has indicated that Rule 701 will apply to typical stock options granted by an issuer before it becomes subject to the reportingrequirements of the Exchange Act, along with the shares acquired upon exercise of such options, including exercises after an issuerbecomes subject to the reporting requirements of the Exchange Act.
Equity Plans
We intend to file one or more registration statements on Form S-8 under the Securities Act to register the offer and sale of all sharesof our common stock subject to outstanding stock options and common stock issued or issuable under our 2020 Plan. We expect to file theregistration statement covering shares offered pursuant to our 2020 Plan shortly after the date of this prospectus, permitting the resale ofsuch shares by non-affiliates in the public market without restriction under the Securities Act and the sale by affiliates in the public marketsubject to compliance with the resale provisions of Rule 144. See the section titled “Executive Compensation—Equity Plans” for a descriptionof our equity compensation plans.
161

Table of Contents
MATERIAL U.S. FEDERAL INCOME TAX CONSEQUENCESTO NON-U.S. HOLDERS
The following discussion is a summary of the material U.S. federal income tax consequences to Non-U.S. Holders (as defined below)of the purchase, ownership and disposition of our common stock issued pursuant to this offering, but does not purport to be a completeanalysis of all potential tax effects. The effects of other U.S. federal tax laws, such as estate and gift tax laws, and any applicable state, localor non-U.S. tax laws are not discussed. This discussion is based on the Code, Treasury Regulations promulgated thereunder, judicialdecisions, and published rulings and administrative pronouncements of the IRS, in each case in effect as of the date hereof. Theseauthorities may change or be subject to differing interpretations. Any such change or differing interpretation may be applied retroactively in amanner that could adversely affect a Non-U.S. Holder of our common stock. We have not sought and will not seek any rulings from the IRSregarding the matters discussed below. There can be no assurance the IRS or a court will not take a contrary position to that discussedbelow regarding the tax consequences of the ownership and disposition of our common stock.
This discussion is limited to Non-U.S. Holders that hold our common stock as a “capital asset” within the meaning of Section 1221 ofthe Code (generally, property held for investment). This discussion does not address all U.S. federal income tax consequences relevant to aNon-U.S. Holder’s particular circumstances, including the impact of the Medicare contribution tax on net investment income. In addition, itdoes not address consequences relevant to Non-U.S. Holders subject to special rules, including, without limitation:
• U.S. expatriates and former citizens or long-term residents of the United States;
• persons subject to the alternative minimum tax;
• persons holding our common stock as part of a hedge, straddle or other risk reduction strategy or as part of a conversiontransaction or other integrated investment;
• banks, insurance companies, and other financial institutions;
• brokers, dealers or traders in securities;
• “controlled foreign corporations,” “passive foreign investment companies,” and corporations that accumulate earnings to avoid U.S.federal income tax;
• partnerships or other entities or arrangements treated as partnerships for U.S. federal income tax purposes (and investors in suchentities);
• tax-exempt organizations or governmental organizations;
• persons deemed to sell our common stock under the constructive sale provisions of the Code;
• persons who hold or receive our common stock pursuant to the exercise of any employee stock option or otherwise ascompensation;
• persons for whom our common stock constitutes “qualified small business stock” within the meaning of Section 1202 of the Code;
• tax-qualified retirement plans;
• “qualified foreign pension funds” as defined in Section 897(l)(2) of the Code and entities all of the interests of which are held byqualified foreign pension funds; and
• persons subject to special tax accounting rules as a result of any item of gross income with respect to the stock being taken intoaccount in an applicable financial statement.
If an entity treated as a partnership for U.S. federal income tax purposes holds our common stock, the tax treatment of a partner in thepartnership will depend on the status of the partner, the
162

Table of Contents
activities of the partnership and certain determinations made at the partner level. Accordingly, partnerships holding our common stock andthe partners in such partnerships should consult their tax advisors regarding the U.S. federal income tax consequences to them.
THIS DISCUSSION IS FOR INFORMATIONAL PURPOSES ONLY AND IS NOT TAX ADVICE. INVESTORS SHOULD CONSULTTHEIR TAX ADVISORS WITH RESPECT TO THE APPLICATION OF THE U.S. FEDERAL INCOME TAX LAWS TO THEIR PARTICULARSITUATIONS AS WELL AS ANY TAX CONSEQUENCES OF THE OWNERSHIP AND DISPOSITION OF OUR COMMON STOCKARISING UNDER THE U.S. FEDERAL ESTATE OR GIFT TAX LAWS OR UNDER THE LAWS OF ANY STATE, LOCAL OR NON-U.S.TAXING JURISDICTION OR UNDER ANY APPLICABLE INCOME TAX TREATY.
Definition of a Non-U.S. Holder
For purposes of this discussion, a “Non-U.S. Holder” is any beneficial owner of our common stock that is neither a “U.S. person” noran entity treated as a partnership for U.S. federal income tax purposes. A U.S. person is any person that, for U.S. federal income taxpurposes, is or is treated as any of the following:
• an individual who is a citizen or resident of the United States;
• a corporation created or organized under the laws of the United States, any state thereof, or the District of Columbia;
• an estate, the income of which is subject to U.S. federal income tax regardless of its source; or
• a trust that (1) is subject to the primary supervision of a U.S. court and the control of one or more “United States persons” (within
the meaning of Section 7701(a)(30) of the Code), or (2) has a valid election in effect to be treated as a United States person forU.S. federal income tax purposes.
Distributions
As described in the section entitled, “Dividend Policy,” we do not anticipate declaring or paying dividends to holders of our commonstock in the foreseeable future. However, if we do make distributions of cash or property on our common stock will constitute dividends forU.S. federal income tax purposes to the extent paid from our current or accumulated earnings and profits, as determined under U.S. federalincome tax principles. Amounts not treated as dividends for U.S. federal income tax purposes will constitute a return of capital and first beapplied against and reduce a Non-U.S. Holder’s adjusted tax basis in its common stock, but not below zero. Any excess will be treated ascapital gain and will be treated as described below under “—Sale or Other Taxable Disposition.” Because we may not know the extent towhich a distribution is a dividend for U.S. federal income tax purposes at the time it is made, for purposes of the withholding rules discussedbelow, we or the applicable withholding agent may treat the entire distribution as a dividend.
Subject to the discussion below on effectively connected income, dividends paid to a Non-U.S. Holder of our common stock will besubject to U.S. federal withholding tax at a rate of 30% of the gross amount of the dividends (or such lower rate specified by an applicableincome tax treaty, provided the Non-U.S. Holder furnishes a valid IRS Form W-8BEN or W-8BEN-E (or other applicable documentation)certifying qualification for the lower treaty rate). A Non-U.S. Holder that does not timely furnish the required documentation, but that qualifiesfor a reduced treaty rate, may obtain a refund of any excess amounts withheld by timely filing an appropriate claim for refund with the IRS.Non-U.S. Holders should consult their tax advisors regarding their entitlement to benefits under any applicable income tax treaty.
163

Table of Contents
If dividends paid to a Non-U.S. Holder are effectively connected with the Non-U.S. Holder’s conduct of a trade or business within theUnited States (and, if required by an applicable income tax treaty, the Non-U.S. Holder maintains a permanent establishment in the UnitedStates to which such dividends are attributable), the Non-U.S. Holder will be exempt from the U.S. federal withholding tax described above.To claim the exemption, the Non-U.S. Holder must furnish to the applicable withholding agent a valid IRS Form W-8ECI, certifying that thedividends are effectively connected with the Non-U.S. Holder’s conduct of a trade or business within the United States.
Any such effectively connected dividends will be subject to U.S. federal income tax on a net income basis at the regular graduatedrates. A Non-U.S. Holder that is a corporation also may be subject to a branch profits tax at a rate of 30% (or such lower rate specified by anapplicable income tax treaty) on such effectively connected dividends, as adjusted for certain items. Non-U.S. Holders should consult theirtax advisors regarding any applicable tax treaties that may provide for different rules.
Sale or Other Taxable Disposition
A Non-U.S. Holder will not be subject to U.S. federal income tax on any gain realized upon the sale or other taxable disposition of ourcommon stock unless:
• the gain is effectively connected with the Non-U.S. Holder’s conduct of a trade or business within the United States (and, if required
by an applicable income tax treaty, the Non-U.S. Holder maintains a permanent establishment in the United States to which suchgain is attributable);
• the Non-U.S. Holder is a nonresident alien individual present in the United States for 183 days or more during the taxable year ofthe disposition and certain other requirements are met; or
• our common stock constitutes a U.S. real property interest (“USRPI”), by reason of our status as a U.S. real property holdingcorporation (“USRPHC”) for U.S. federal income tax purposes.
Gain described in the first bullet point above generally will be subject to U.S. federal income tax on a net income basis at the regulargraduated rates. A Non-U.S. Holder that is a corporation also may be subject to a branch profits tax at a rate of 30% (or such lower ratespecified by an applicable income tax treaty) on such effectively connected gain, as adjusted for certain items.
Gain described in the second bullet point above will be subject to U.S. federal income tax at a rate of 30% (or such lower ratespecified by an applicable income tax treaty), which may be offset by U.S. source capital losses of the Non-U.S. Holder (even though theindividual is not considered a resident of the United States), provided the Non-U.S. Holder has timely filed U.S. federal income tax returnswith respect to such losses.
With respect to the third bullet point above, we believe we currently are not, and do not anticipate becoming, a USRPHC. Because thedetermination of whether we are a USRPHC depends, however, on the fair market value of our USRPIs relative to the fair market value ofour non-U.S. real property interests and our other business assets, there can be no assurance we currently are not a USRPHC or will notbecome one in the future. Even if we are or were to become a USRPHC, gain arising from the sale or other taxable disposition by a Non-U.S.Holder of our common stock will not be subject to U.S. federal income tax if our common stock is “regularly traded,” as defined by applicableTreasury Regulations, on an established securities market, and such Non-U.S. Holder owned, actually and constructively, 5% or less of ourcommon stock throughout the shorter of the five-year period ending on the date of the sale or other taxable disposition or the Non-U.S.Holder’s holding period.
164

Table of Contents
Non-U.S. Holders should consult their tax advisors regarding potentially applicable income tax treaties that may provide for differentrules.
Information Reporting and Backup Withholding
Payments of dividends on our common stock will not be subject to backup withholding, provided the applicable withholding agentdoes not have actual knowledge or reason to know the holder is a United States person and the holder either certifies its non-U.S. status,such as by furnishing a valid IRS Form W-8BEN, W-8BEN-E or W-8ECI, or other applicable documentation, or otherwise establishes anexemption. However, information returns are required to be filed with the IRS in connection with any dividends on our common stock paid tothe Non-U.S. Holder, regardless of whether any tax was actually withheld. In addition, proceeds of the sale or other taxable disposition of ourcommon stock within the United States or conducted through certain U.S.-related brokers generally will not be subject to backup withholdingor information reporting, if the applicable withholding agent receives the certification described above and does not have actual knowledge orreason to know that such holder is a United States person, or the holder otherwise establishes an exemption. Proceeds of a disposition ofour common stock conducted through a non-U.S. office of a non-U.S. broker generally will not be subject to backup withholding orinformation reporting.
Copies of information returns that are filed with the IRS may also be made available under the provisions of an applicable treaty oragreement to the tax authorities of the country in which the Non-U.S. Holder resides or is established.
Backup withholding is not an additional tax. Any amounts withheld under the backup withholding rules may be allowed as a refund ora credit against a Non-U.S. Holder’s U.S. federal income tax liability, provided the required information is timely furnished to the IRS.
Additional Withholding Tax on Payments Made to Foreign Accounts
Withholding taxes may be imposed under Sections 1471 to 1474 of the Code (such Sections commonly referred to as the ForeignAccount Tax Compliance Act (“FATCA”)) on certain types of payments made to non-U.S. financial institutions and certain other non-U.S.entities. Specifically, a 30% withholding tax may be imposed on dividends on, or (subject to the proposed Treasury Regulations discussedbelow) gross proceeds from the sale or other disposition of, our common stock paid to a “foreign financial institution” or a “non-financialforeign entity” (each as defined in the Code), unless (1) the foreign financial institution undertakes certain diligence and reporting obligations,(2) the non-financial foreign entity either certifies it does not have any “substantial United States owners” (as defined in the Code) orfurnishes identifying information regarding each substantial United States owner, or (3) the foreign financial institution or non-financial foreignentity otherwise qualifies for an exemption from these rules. If the payee is a foreign financial institution and is subject to the diligence andreporting requirements in (1) above, it must enter into an agreement with the U.S. Department of the Treasury requiring, among other things,that it undertake to identify accounts held by certain “specified United States persons” or “United States-owned foreign entities” (each asdefined in the Code), annually report certain information about such accounts, and withhold 30% on certain payments to non-compliantforeign financial institutions and certain other account holders. Foreign financial institutions located in jurisdictions that have anintergovernmental agreement with the United States governing FATCA may be subject to different rules.
Under the applicable Treasury Regulations and administrative guidance, withholding under FATCA generally applies to payments ofdividends on our common stock. While withholding under FATCA would have applied also to payments of gross proceeds from the sale orother disposition of
165

Table of Contents
such stock on or after January 1, 2019, proposed Treasury Regulations eliminate FATCA withholding on payments of gross proceeds entirely.Taxpayers generally may rely on these proposed Treasury Regulations until final Treasury Regulations are issued.
Prospective investors should consult their tax advisors regarding the potential application of withholding under FATCA to theirinvestment in our common stock.
166

Table of Contents
UNDERWRITING
The company and Goldman Sachs & Co. LLC, BofA Securities, Inc., Allen & Company LLC and Wells Fargo Securities, LLC, asrepresentatives of the underwriters named below, will enter into an underwriting agreement with respect to the shares of common stock beingoffered. Subject to certain conditions, each underwriter will severally agree to purchase the number of shares indicated in the following table. Underwriters Number of Shares Goldman Sachs & Co. LLC 7,715,949 BofA Securities, Inc. 5,400,431 Allen & Company LLC 4,264,655 Wells Fargo Securities, LLC 879,310 Stifel, Nicolaus & Company, Incorporated 835,345 William Blair & Company, L.L.C. 615,517 Robert W. Baird & Co. Incorporated 571,552 JMP Securities LLC 527,586 Wedbush Securities Inc. 439,655
Total 21,250,000
The underwriters will commit to take and pay for all of the shares being offered, if any are taken, other than the shares covered by theoption described below unless and until this option is exercised.
The underwriters have an option to buy up to an additional 3,187,500 shares of common stock from the company to cover sales bythe underwriters of a greater number of shares than the total number set forth in the table above. They may exercise that option for 30 days.If any shares are purchased pursuant to this option, the underwriters will severally purchase shares in approximately the same proportion asset forth in the table above.
The following table shows the per share and total underwriting discounts to be paid to the underwriters by the company. Suchamounts are shown assuming both no exercise and full exercise of the underwriters’ over-allotment option to purchase 3,187,500 additionalshares of our common stock. Paid by the Company No Exercise Full Exercise Per Share $ 1.43 $ 1.43 Total $ 30,387,500 $ 34,945,625
Shares sold by the underwriters to the public will initially be offered at the initial public offering price set forth on the cover of thisprospectus. Any shares sold by the underwriters to securities dealers may be sold at a discount of up to $0.7920 per share from the initialpublic offering price. After the initial offering of the shares, the representatives may change the offering price and the other selling terms. Theoffering of the shares by the underwriters is subject to receipt and acceptance and subject to the underwriters’ right to reject any order inwhole or in part.
At our request, the underwriters will allocate for sale, at the initial public offering price, up to 5.0% of the shares in this offering tocertain investors at our direction. We do not know if any of these potential investors will choose to purchase all or any portion of the allocatedshares but the number of shares of our common stock available for sale to the general public will be reduced to the extent these personspurchase the allocated shares. Any shares of our common stock that are not so purchased will be offered by the underwriters to the generalpublic on the same terms as the other shares of our common stock offered by this prospectus.
167

Table of Contents
The company and its officers, directors, and holders of substantially all of the company’s common stock and securities convertible intoor exchangeable for the company’s common stock have agreed or will agree with the underwriters, subject to certain exceptions, not to offer,sell, contract to sell, pledge, grant any option to purchase, lend or otherwise dispose of, or publicly disclose the intention to make any offer,sale, pledge or disposition of any shares of our common stock, or any options or warrants to purchase any shares of our common stock, orany securities convertible into, exchangeable for, or that represent the right to receive, shares of our common stock, engage in any hedgingor other transaction or arrangement (including, without limitation, any short sale or the purchase or sale of, or entry into, any put or calloperation, or combination thereof, forward, swap or other derivative transaction or instrument) which is designed to or which couldreasonably be expected to lead to or result in a sale, loan, pledge or other disposition or transfer of all or a portion of the economicconsequences of ownership of our common stock or any securities convertible into or exercisable or exchangeable for shares of our commonstock during the period from the date of this prospectus continuing through the date 180 days after the date of this prospectus, except withthe prior written consent of Goldman Sachs & Co. LLC. See “Shares Eligible for Future Sale” for a discussion of certain transfer restrictions.
Prior to the offering, there has been no public market for the shares of our common stock. The initial public offering price has beennegotiated between the company and the representatives. Among the factors to be considered in determining the initial public offering priceof the shares, in addition to prevailing market conditions, will be the company’s historical performance, estimates of the business potentialand earnings prospects of the company, an assessment of the company’s management and the consideration of the above factors in relationto market valuation of companies in related businesses.
We have been approved to list the common stock on Nasdaq under the symbol “VRM.”
In connection with the offering, the underwriters may purchase and sell shares of common stock in the open market. Thesetransactions may include short sales, stabilizing transactions and purchases to cover positions created by short sales. Short sales involve thesale by the underwriters of a greater number of shares than they are required to purchase in the offering, and a short position represents theamount of such sales that have not been covered by subsequent purchases. A “covered short position” is a short position that is not greaterthan the amount of additional shares for which the underwriters’ option described above may be exercised. The underwriters may cover anycovered short position by either exercising their option to purchase additional shares or purchasing shares in the open market. In determiningthe source of shares to cover the covered short position, the underwriters will consider, among other things, the price of shares available forpurchase in the open market as compared to the price at which they may purchase additional shares pursuant to the option described above.“Naked” short sales are any short sales that create a short position greater than the amount of additional shares for which the optiondescribed above may be exercised. The underwriters must cover any such naked short position by purchasing shares in the open market. Anaked short position is more likely to be created if the underwriters are concerned that there may be downward pressure on the price of thecommon stock in the open market after pricing that could adversely affect investors who purchase in the offering. Stabilizing transactionsconsist of various bids for or purchases of common stock made by the underwriters in the open market prior to the completion of the offering.
The underwriters may also impose a penalty bid. This occurs when a particular underwriter repays to the underwriters a portion of theunderwriting discount received by it because the representatives have repurchased shares sold by or for the account of such underwriter instabilizing or short covering transactions.
Purchases to cover a short position and stabilizing transactions, as well as other purchases by the underwriters for their ownaccounts, may have the effect of preventing or retarding a decline in the market price of the company’s stock, and together with theimposition of the penalty bid, may stabilize,
168

Table of Contents
maintain or otherwise affect the market price of the common stock. As a result, the price of the common stock may be higher than the pricethat otherwise might exist in the open market. The underwriters are not required to engage in these activities and may end any of theseactivities at any time. These transactions may be effected on Nasdaq, in the over-the-counter market or otherwise.
The company estimates that its share of the total expenses of the offering, excluding the underwriting discount, will be approximately$6.8 million. The underwriters have agreed to reimburse us for certain of our expenses incurred in connection with the offering. TheCompany has agreed to reimburse the underwriters for certain out-of-pocket expenses in connection with this offering in an amount not toexceed $45,000.
The company has agreed to indemnify the several underwriters against certain liabilities, including liabilities under the Securities Act.
The underwriters and their respective affiliates are full service financial institutions engaged in various activities, which may includesales and trading, commercial and investment banking, advisory, investment management, investment research, principal investment,hedging, market making, brokerage and other financial and non-financial activities and services. Certain of the underwriters and theirrespective affiliates have provided, and may in the future provide, a variety of these services to the company and to persons and entities withrelationships with the company, for which they received or will receive customary fees and expenses.
Certain entities and persons affiliated with certain of the underwriters own or have an economic interest in shares of our commonstock received upon the automatic conversion of our preferred stock acquired in private placements (as adjusted for the Forward Stock Split).The difference between the price paid for 69,170 of such shares (the “Acquired Securities”) and the public offering price in this offering will bedeemed to be underwriting compensation in connection with this offering. The aggregate purchase price paid for the Acquired Securities wasapproximately $940,366. Such Acquired Securities will be subject to lock-up restrictions, as required by FINRA Rule 5110(g)(1), and may notbe sold during the offering, or sold, transferred, assigned, pledged, or hypothecated, or be the subject of any hedging, short sale, derivative,put, or call transaction that would result in the effective economic disposition of such securities by any person for a period of 180 daysimmediately following the date of effectiveness of the registration statement of which this prospectus forms a part or commencement of salesof the offering, except as provided in FINRA Rule 5110(g)(2).
In the ordinary course of their various business activities, the underwriters and their respective affiliates, officers, directors andemployees may purchase, sell or hold a broad array of investments and actively trade securities, derivatives, loans, commodities, currencies,credit default swaps and other financial instruments for their own account and for the accounts of their customers, and such investment andtrading activities may involve or relate to assets, securities and/or instruments of the company (directly, as collateral securing otherobligations or otherwise) and/or persons and entities with relationships with the company. The underwriters and their respective affiliates mayalso communicate independent investment recommendations, market color or trading ideas and/or publish or express independent researchviews in respect of such assets, securities or instruments and may at any time hold, or recommend to clients that they should acquire, longand/or short positions in such assets, securities and instruments.
European Economic Area
In relation to each Member State of the European Economic Area (each a “Member State”), no shares of our common stock havebeen offered or will be offered pursuant to the offering to the public in that Member State prior to the publication of a prospectus in relation tothe shares which has been
169

Table of Contents
approved by the competent authority in that Member State or, where appropriate, approved in another Member State and notified to thecompetent authority in that Member State, all in accordance with the Prospectus Regulation), except that offers of shares may be made tothe public in that Member State at any time under the following exemptions under the Prospectus Regulation:
(a) to any legal entity which is a qualified investor as defined under the Prospectus Regulation;
(b) to fewer than 150 natural or legal persons (other than qualified investors as defined under the Prospectus Regulation), subjectto obtaining the prior consent of the representative for any such offer; or
(c) in any other circumstances falling within Article 1(4) of the Prospectus Regulation,
provided that no such offer of shares of our common stock shall require the company or the representative to publish a prospectus pursuantto Article 3 of the Prospectus Regulation or supplement a prospectus pursuant to Article 23 of the Prospectus Regulation.
For the purposes of this provision, the expression an “offer to the public” in relation to any shares of common stock in any MemberState means the communication in any form and by any means of sufficient information on the terms of the offer and any shares of commonstock to be offered so as to enable an investor to decide to purchase or subscribe for any shares of common stock, and the expression“Prospectus Regulation” means Regulation (EU) 2017/1129.
United Kingdom
Each underwriter has represented and agreed that:
(a) it has only communicated or caused to be communicated and will only communicate or cause to be communicated aninvitation or inducement to engage in investment activity (within the meaning of Section 21 of the Financial Services andMarkets Act 2000 (FSMA)) received by it in connection with the issue or sale of the shares in circumstances in whichSection 21(1) of the FSMA does not apply to the company; and
(b) it has complied and will comply with all applicable provisions of the FSMA with respect to anything done by it in relation to theshares in, from or otherwise involving the United Kingdom.
Canada
The securities may be sold in Canada only to purchasers purchasing, or deemed to be purchasing, as principal that are accreditedinvestors, as defined in National Instrument 45-106 Prospectus Exemptions or subsection 73.3(1) of the Securities Act (Ontario), and arepermitted clients, as defined in National Instrument 31-103 Registration Requirements, Exemptions, and Ongoing Registrant Obligations. Anyresale of the securities must be made in accordance with an exemption form, or in a transaction not subject to, the prospectus requirementsof applicable securities laws.
Securities legislation in certain provinces or territories of Canada may provide a purchaser with remedies for rescission or damages ifthis prospectus (including any amendment thereto) contains a misrepresentation, provided that the remedies for rescission or damages areexercised by the purchaser within the time limit prescribed by the securities legislation of the purchaser’s province or territory. The purchasershould refer to any applicable provisions of the securities legislation of the purchaser’s province or territory of these rights or consult with alegal advisor.
Pursuant to section 3A.3 of National Instrument 33-105 Underwriting Conflicts (NI 33-105), the underwriters are not required tocomply with the disclosure requirements of NI 33-105 regarding underwriter conflicts of interest in connection with this offering.
170

Table of Contents
Hong Kong
The shares may not be offered or sold in Hong Kong by means of any document other than (i) in circumstances which do notconstitute an offer to the public within the meaning of the Companies (Winding Up and Miscellaneous Provisions) Ordinance (Cap. 32 of theLaws of Hong Kong) (“Companies (Winding Up and Miscellaneous Provisions) Ordinance”) or which do not constitute an invitation to thepublic within the meaning of the Securities and Futures Ordinance (Cap. 571 of the Laws of Hong Kong) (“Securities and FuturesOrdinance”), or (ii) to “professional investors” as defined in the Securities and Futures Ordinance and any rules made thereunder, or (iii) inother circumstances which do not result in the document being a “prospectus” as defined in the Companies (Winding Up and MiscellaneousProvisions) Ordinance, and no advertisement, invitation or document relating to the shares may be issued or may be in the possession of anyperson for the purpose of issue (in each case whether in Hong Kong or elsewhere), which is directed at, or the contents of which are likely tobe accessed or read by, the public in Hong Kong (except if permitted to do so under the securities laws of Hong Kong) other than withrespect to shares which are or are intended to be disposed of only to persons outside Hong Kong or only to “professional investors” in HongKong as defined in the Securities and Futures Ordinance and any rules made thereunder.
Singapore
This prospectus has not been registered as a prospectus with the Monetary Authority of Singapore. Accordingly, this prospectus andany other document or material in connection with the offer or sale, or invitation for subscription or purchase, of the shares may not becirculated or distributed, nor may the shares be offered or sold, or be made the subject of an invitation for subscription or purchase, whetherdirectly or indirectly, to persons in Singapore other than (i) to an institutional investor (as defined under Section 4A of the Securities andFutures Act, Chapter 289 of Singapore (the “SFA”)) under Section 274 of the SFA, (ii) to a relevant person (as defined in Section 275(2) ofthe SFA) pursuant to Section 275(1) of the SFA, or any person pursuant to Section 275(1A) of the SFA, and in accordance with theconditions specified in Section 275 of the SFA or (iii) otherwise pursuant to, and in accordance with the conditions of, any other applicableprovision of the SFA, in each case subject to conditions set forth in the SFA.
Where the shares are subscribed or purchased under Section 275 of the SFA by a relevant person which is a corporation (which isnot an accredited investor (as defined in Section 4A of the SFA)) the sole business of which is to hold investments and the entire sharecapital of which is owned by one or more individuals, each of whom is an accredited investor, the securities (as defined in Section 239(1) ofthe SFA) of that corporation shall not be transferable for 6 months after that corporation has acquired the shares under Section 275 of theSFA except: (1) to an institutional investor under Section 274 of the SFA or to a relevant person (as defined in Section 275(2) of the SFA), (2)where such transfer arises from an offer in that corporation’s securities pursuant to Section 275(1A) of the SFA, (3) where no consideration isor will be given for the transfer, (4) where the transfer is by operation of law, (5) as specified in Section 276(7) of the SFA, or (6) as specifiedin Regulation 32 of the Securities and Futures (Offers of Investments) (Shares and Debentures) Regulations 2005 of Singapore (“Regulation32”).
Where the shares are subscribed or purchased under Section 275 of the SFA by a relevant person which is a trust (where the trusteeis not an accredited investor (as defined in Section 4A of the SFA)) whose sole purpose is to hold investments and each beneficiary of thetrust is an accredited investor, the beneficiaries’ rights and interest (howsoever described) in that trust shall not be transferable for 6 monthsafter that trust has acquired the shares under Section 275 of the SFA except: (1) to an institutional investor under Section 274 of the SFA orto a relevant person (as defined in
171

Table of Contents
Section 275(2) of the SFA), (2) where such transfer arises from an offer that is made on terms that such rights or interest are acquired at aconsideration of not less than S$200,000 (or its equivalent in a foreign currency) for each transaction (whether such amount is to be paid forin cash or by exchange of securities or other assets), (3) where no consideration is or will be given for the transfer, (4) where the transfer isby operation of law, (5) as specified in Section 276(7) of the SFA, or (6) as specified in Regulation 32.
Japan
The securities have not been and will not be registered under the Financial Instruments and Exchange Act of Japan (Act No. 25 of1948, as amended), or the FIEA. The securities may not be offered or sold, directly or indirectly, in Japan or to or for the benefit of anyresident of Japan (including any person resident in Japan or any corporation or other entity organized under the laws of Japan) or to othersfor reoffering or resale, directly or indirectly, in Japan or to or for the benefit of any resident of Japan, except pursuant to an exemption fromthe registration requirements of the FIEA and otherwise in compliance with any relevant laws and regulations of Japan.
Switzerland
The shares may not be publicly offered in Switzerland and will not be listed on the SIX Swiss Exchange (“SIX”) or on any other stockexchange or regulated trading facility in Switzerland. This prospectus has been prepared without regard to the disclosure standards forissuance prospectuses under art. 652a or art. 1156 of the Swiss Code of Obligations or the disclosure standards for listing prospectusesunder art. 27 ff. of the SIX Listing Rules or the listing rules of any other stock exchange or regulated trading facility in Switzerland. Neitherthis prospectus nor any other offering or marketing material relating to the shares or the offering may be publicly distributed or otherwisemade publicly available in Switzerland.
Neither this prospectus nor any other offering or marketing material relating to the offering, the Company or the shares have been orwill be filed with or approved by any Swiss regulatory authority. In particular, this prospectus will not be filed with, and the offer of shares willnot be supervised by, the Swiss Financial Market Supervisory Authority, and the offer of shares has not been and will not be authorized underthe Swiss Federal Act on Collective Investment Schemes (“CISA”). The investor protection afforded to acquirers of interests in collectiveinvestment schemes under the CISA does not extend to acquirers of shares.
Dubai International Financial Centre
This prospectus relates to an Exempt Offer in accordance with the Offered Securities Rules of the Dubai Financial Services Authority(“DFSA”). This prospectus is intended for distribution only to persons of a type specified in the Offered Securities Rules of the DFSA. It mustnot be delivered to, or relied on by, any other person. The DFSA has no responsibility for reviewing or verifying any documents in connectionwith Exempt Offers. The DFSA has not approved this prospectus nor taken steps to verify the information set forth herein and has noresponsibility for the prospectus. The shares to which this prospectus relates may be illiquid and/or subject to restrictions on their resale.Prospective purchasers of the shares offered should conduct their own due diligence on the shares. If you do not understand the contents ofthis prospectus you should consult an authorized financial advisor.
172

Table of Contents
Australia
No placement document, prospectus, product disclosure statement or other disclosure document has been lodged with the AustralianSecurities and Investments Commission, in relation to the offering. This prospectus does not constitute a prospectus, product disclosurestatement or other disclosure document under the Corporations Act 2001 (the “Corporations Act”), and does not purport to include theinformation required for a prospectus, product disclosure statement or other disclosure document under the Corporations Act.
Any offer in Australia of the shares may only be made to persons (the “Exempt Investors”) who are “sophisticated investors” (withinthe meaning of section 708(8) of the Corporations Act), “professional investors” (within the meaning of section 708(11) of the CorporationsAct) or otherwise pursuant to one or more exemptions contained in section 708 of the Corporations Act so that it is lawful to offer the shareswithout disclosure to investors under Chapter 6D of the Corporations Act.
The shares applied for by Exempt Investors in Australia must not be offered for sale in Australia in the period of 12 months after thedate of allotment under the offering, except in circumstances where disclosure to investors under Chapter 6D of the Corporations Act wouldnot be required pursuant to an exemption under section 708 of the Corporations Act or otherwise or where the offer is pursuant to adisclosure document which complies with Chapter 6D of the Corporations Act. Any person acquiring shares must observe such Australianon-sale restrictions.
This prospectus contains general information only and does not take account of the investment objectives, financial situation orparticular needs of any particular person. It does not contain any securities recommendations or financial product advice. Before making aninvestment decision, investors need to consider whether the information in this prospectus is appropriate to their needs, objectives andcircumstances, and, if necessary, seek expert advice on those matters.
173

Table of Contents
LEGAL MATTERS
The validity of the shares of our common stock offered hereby will be passed upon for us by Latham & Watkins LLP, New York, NewYork. Skadden, Arps, Slate, Meagher & Flom LLP, New York, New York, has acted as counsel for the underwriters in connection with certainlegal matters related to this offering.
EXPERTS
The financial statements as of December 31, 2019 and 2018 and for the years then ended included in this prospectus have been soincluded in reliance on the report (which contains an explanatory paragraph relating to the Company’s ability to continue as a going concernas described in Note 2 to the financial statements) of PricewaterhouseCoopers LLP, an independent registered public accounting firm, givenon the authority of said firm as experts in auditing and accounting.
WHERE YOU CAN FIND MORE INFORMATION
We have filed with the Securities and Exchange Commission a registration statement on Form S-1 under the Securities Act withrespect to the shares of common stock offered hereby. This prospectus, which constitutes a part of the registration statement, does notcontain all of the information set forth in the registration statement or the exhibits and schedules filed with the registration statement. Forfurther information about us and the common stock offered hereby, we refer you to the registration statement and the exhibits filed with theregistration statement. Statements contained in this prospectus regarding the contents of any contract or any other document that is filed asan exhibit to the registration statement are not necessarily complete, and each such statement is qualified in all respects by reference to thefull text of such contract or other document filed as an exhibit to the registration statement. The SEC also maintains an internet website thatcontains reports, proxy statements and other information about registrants, like us, that file electronically with the SEC. The address of thatwebsite is www.sec.gov.
Upon the closing of this offering, we will be required to file periodic reports, proxy statements, and other information with the SECpursuant to the Exchange Act. These reports, proxy statements, and other information will be available on the website of the SEC referred toabove.
We also maintain a website at www.vroom.com, through which you may access these materials free of charge as soon as reasonablypracticable after they are electronically filed with, or furnished to, the SEC. Information contained on our website is not a part of thisprospectus and the inclusion of our website address in this prospectus is an inactive textual reference only.
174

Table of Contents
INDEX TO CONSOLIDATED FINANCIAL STATEMENTS Report of Independent Registered Public Accounting Firm F-2 Consolidated Financial Statements
Consolidated Balance Sheets F-3 Consolidated Statements of Operations F-4 Consolidated Statements of Changes in Redeemable Convertible Preferred Stock and Stockholders’ Deficit F-5 Consolidated Statements of Cash Flows F-6 Notes to Consolidated Financial Statements F-7
F-1

Table of Contents
Report of Independent Registered Public Accounting Firm
To the Board of Directors and Stockholders of Vroom, Inc.
Opinion on the Financial Statements
We have audited the accompanying consolidated balance sheets of Vroom, Inc. and its subsidiaries (the “Company”) as of December31, 2019 and 2018, and the related consolidated statements of operations, of changes in redeemable convertible preferred stock andstockholders’ deficit and of cash flows for the years then ended, including the related notes (collectively referred to as the “consolidatedfinancial statements”). In our opinion, the consolidated financial statements present fairly, in all material respects, the financial position of theCompany as of December 31, 2019 and 2018, and the results of its operations and its cash flows for the years then ended in conformity withaccounting principles generally accepted in the United States of America.
Substantial Doubt About the Company’s Ability to Continue as a Going Concern
The accompanying consolidated financial statements have been prepared assuming that the Company will continue as a goingconcern. As discussed in Note 2 to the consolidated financial statements, since inception, the Company has had losses and negative cashflows from operations which it has funded primarily through issuances of common and preferred stock. The continued spread of COVID-19has resulted in adverse macroeconomic conditions and uncertainties that have and are expected to continue to adversely impact theCompany’s liquidity and operations which raises substantial doubt about the Company’s ability to continue as a going concern.Management’s plans in regard to these matters are also described in Note 2. The consolidated financial statements do not include anyadjustments that might result from the outcome of this uncertainty.
Basis for Opinion
These consolidated financial statements are the responsibility of the Company’s management. Our responsibility is to express anopinion on the Company’s consolidated financial statements based on our audits. We are a public accounting firm registered with the PublicCompany Accounting Oversight Board (United States) (PCAOB) and are required to be independent with respect to the Company inaccordance with the U.S. federal securities laws and the applicable rules and regulations of the Securities and Exchange Commission andthe PCAOB.
We conducted our audits of these consolidated financial statements in accordance with the standards of the PCAOB. Thosestandards require that we plan and perform the audits to obtain reasonable assurance about whether the consolidated financial statementsare free of material misstatement, whether due to error or fraud.
Our audits included performing procedures to assess the risks of material misstatement of the consolidated financial statements,whether due to error or fraud, and performing procedures that respond to those risks. Such procedures included examining, on a test basis,evidence regarding the amounts and disclosures in the consolidated financial statements. Our audits also included evaluating the accountingprinciples used and significant estimates made by management, as well as evaluating the overall presentation of the consolidated financialstatements. We believe that our audits provide a reasonable basis for our opinion.
/s/ PricewaterhouseCoopers LLP
New York, New York
March 12, 2020, except with respect to the matters that raise substantial doubt about the Company’s ability to continue as a going concerndiscussed in Note 2 under Liquidity and Management’s Plan, as to which the date is May 12, 2020
We have served as the Company’s auditor since 2016.
F-2

Table of Contents
VROOM, INC.CONSOLIDATED BALANCE SHEETS
(in thousands, except share and per share amounts)
As of
December 31, As of
March 31
Pro Formaas of
March 31, 2018 2019 2020 2020 (unaudited) (unaudited) ASSETS Current Assets:
Cash and cash equivalents $ 161,656 $ 217,734 $ 169,842 Restricted cash 1,853 1,853 32,501 Accounts receivable, net 13,207 30,848 35,033 Inventory 115,551 205,746 179,617 Prepaid expenses and other current assets 5,214 9,149 12,264
Total current assets 297,481 465,330 429,257 Property and equipment, net 7,673 7,828 8,984 Intangible assets, net 3,945 572 434 Goodwill 78,172 78,172 78,172 Operating lease right-of-use assets — — 16,656 Other assets 5,573 11,485 13,580
Total assets $ 392,844 $ 563,387 $ 547,083
LIABILITIES, REDEEMABLE CONVERTIBLE PREFERRED STOCK AND STOCKHOLDERS’DEFICIT
Current Liabilities: Accounts payable $ 14,824 $ 18,987 $ 16,033 Accrued expenses 21,565 38,491 32,371 Vehicle floorplan 95,482 173,461 165,166 Current portion of long-term debt 8,386 135 137 Deferred revenue 6,421 17,323 12,824 Operating lease liabilities, current — — 4,724 Other current liabilities 5,617 11,437 15,712
Total current liabilities 152,295 259,834 246,967 Long-term debt, net of current portion 16,045 181 145 Operating lease liabilities, excluding current portion — — 12,912 Other long-term liabilities 2,270 2,892 2,136
Total liabilities 170,610 262,907 262,160
Commitments and contingencies (Note 10) Redeemable convertible preferred stock, $0.001 par value; 35,316,392, 43,061,682, and
43,061,682 shares authorized as of December 31, 2018 and 2019 and March 31, 2020,respectively; 33,412,650, 41,784,314, and 42,766,697 shares issued and outstanding as ofDecember 31, 2018 and 2019 and March 31, 2020, respectively; no shares issued andoutstanding as of March 31, 2020, pro forma (unaudited); aggregate liquidation preference of$466,796, $694,477, and 721,161 as of December 31, 2018 and 2019 and March 31, 2020,respectively 519,100 874,332 901,046 —
Stockholders’ deficit: Common stock, $0.001 par value; 46,476,600, 56,721,927, and 56,721,927 shares authorized as of
December 31, 2018 and 2019 and March 31, 2020, respectively; 4,285,693, 4,325,461, and4,226,848 shares issued and outstanding as of December 31, 2018 and 2019 and March 31,2020, respectively; 93,987,090 shares issued and outstanding as of March 31, 2020, pro forma(unaudited) 4 4 4 94
Additional paid-in-capital — — — 900,956 Accumulated deficit (296,870) (573,856) (616,127) (616,127)
Total stockholders’ (deficit) equity (296,866) (573,852) (616,123) $ 284,923
Total liabilities, redeemable convertible preferred stock and stockholders’ deficit $ 392,844 $ 563,387 $ 547,083
See Notes to Consolidated Financial Statements.
F-3

Table of Contents
VROOM, INC.CONSOLIDATED STATEMENTS OF OPERATIONS
(in thousands, except share and per share amounts)
Year Ended
December 31, Three Months Ended
March 31, 2018 2019 2019 2020 (unaudited) Revenue:
Retail vehicle, net $ 656,928 $ 952,910 $ 178,750 $ 308,710 Wholesale vehicle 174,514 213,464 52,119 55,578 Product, net 19,653 23,708 3,745 11,044 Other 4,334 1,739 445 440
Total revenue 855,429 1,191,821 235,059 375,772 Cost of sales 794,622 1,133,962 223,047 357,385
Total gross profit 60,807 57,859 12,012 18,387 Selling, general and administrative expenses 133,842 184,988 36,583 58,380 Depreciation and amortization 6,857 6,019 1,533 966
Loss from operations (79,892) (133,148) (26,104) (40,959) Interest expense 8,513 14,596 2,718 2,826 Interest income (3,135) (5,607) (1,849) (1,956) Other (income) expense, net (321) 673 63 (823)
Loss before provision for income taxes (84,949) (142,810) (27,036) (41,006) Provision for income taxes 229 168 103 53
Net loss $ (85,178) $ (142,978) $ (27,139) $ (41,059)
Accretion of redeemable convertible preferred stock (13,036) (132,750) (17,964) —
Net loss attributable to common stockholders $ (98,214) $ (275,728) $ (45,103) $ (41,059)
Net loss per share attributable to common stockholders, basicand diluted $ (23.00) $ (64.08) $ (10.51) $ (9.69)
Weighted-average number of shares outstanding used tocompute net loss per share attributable to commonstockholders, basic and diluted 4,270,389 4,302,981 4,289,415 4,235,728
Pro forma net loss per share attributable to commonstockholders, basic and diluted (unaudited) $ (1.55) $ (0.44)
Pro forma weighted-average shares used in computing pro formanet loss per share attributable to common stockholders, basicand diluted (unaudited) 92,174,590 94,004,850
See Notes to Consolidated Financial Statements.
F-4

Table of Contents
VROOM, INC.CONSOLIDATED STATEMENTS OF CHANGES IN REDEEMABLE CONVERTIBLE
PREFERRED STOCK AND STOCKHOLDERS’ DEFICIT(in thousands, except share amounts)
RedeemableConvertible
Preferred Stock Common Stock
AdditionalPaid-inCapital
AccumulatedDeficit
TotalStockholders’
Deficit Shares Amount Shares Amount Balance at January 1, 2018 25,272,630 $360,165 4,261,055 $ 4 $ — $ (201,503) $ (201,499)
Cumulative effect of accounting change—revenue recognition — — — — — 1,658 1,658 Stock-based compensation — — — — 1,158 — 1,158 Exercise of stock options — — 6,251 — 31 — 31 Vesting of restricted stock awards — — 18,387 — — — — Issuance of Series G redeemable convertible preferred stock, net
of issuance costs 8,140,020 145,899 — — — — — Accretion of redeemable convertible preferred stock — 13,036 — — (1,189) (11,847) (13,036) Net loss — — — — — (85,178) (85,178)
Balance at December 31, 2018 33,412,650 $519,100 4,285,693 $ 4 $ — $ (296,870) $ (296,866)
Stock-based compensation — $ — — $ — $ 2,756 $ — $ 2,756 Exercise of stock options — — 67,975 — 466 — 466 Vesting of restricted stock awards — — 311,916 — 1,344 — 1,344 Repurchase of common stock — — (340,123) — (4,566) (1,258) (5,824) Issuance of Series H redeemable convertible preferred stock, net
of issuance costs 8,371,664 222,482 — — — — — Accretion of redeemable convertible preferred stock — 132,750 — — — (132,750) (132,750) Net loss — — — — — (142,978) (142,978)
Balance at December 31, 2019 41,784,314 $874,332 4,325,461 $ 4 $ — $ (573,856) $ (573,852)
Stock-based compensation (unaudited) — $ — — $ — $ 600 $ — $ 600 Exercise of stock options (unaudited) — — 1,387 — 6 — 6 Repurchase of common stock (unaudited) — — (100,000) — (606) (1,212) (1,818) Issuance of Series H redeemable convertible preferred stock, net
of issuance costs (unaudited) 982,383 26,714 — — — — — Net loss (unaudited) — — — — — (41,059) (41,059)
Balance at March 31, 2020 (unaudited) 42,766,697 $901,046 4,226,848 $ 4 $ — $ (616,127) $ (616,123)
RedeemableConvertible
Preferred Stock Common Stock
AdditionalPaid-inCapital
AccumulatedDeficit
TotalStockholders’
Deficit Shares Amount Shares Amount
Balance at December 31, 2018 33,412,650 $519,100 4,285,693 $ 4 $ — $ (296,870) $ (296,866) Stock-based compensation (unaudited) — $ — — $ — $ 869 $ — $ 869 Exercise of stock options (unaudited) — — 50,975 — 347 — 347 Repurchase of common stock (unaudited) — — (46,593) — (1,216) 674 (542) Accretion of redeemable convertible preferred stock (unaudited) — 17,964 — — — (17,964) (17,964) Net loss (unaudited) — — — — — (27,139) (27,139)
Balance at March 31, 2019 (unaudited) 33,412,650 $537,064 4,290,075 $ 4 $ — $ (341,299) $ (341,295)
See Notes to Consolidated Financial Statements.
F-5
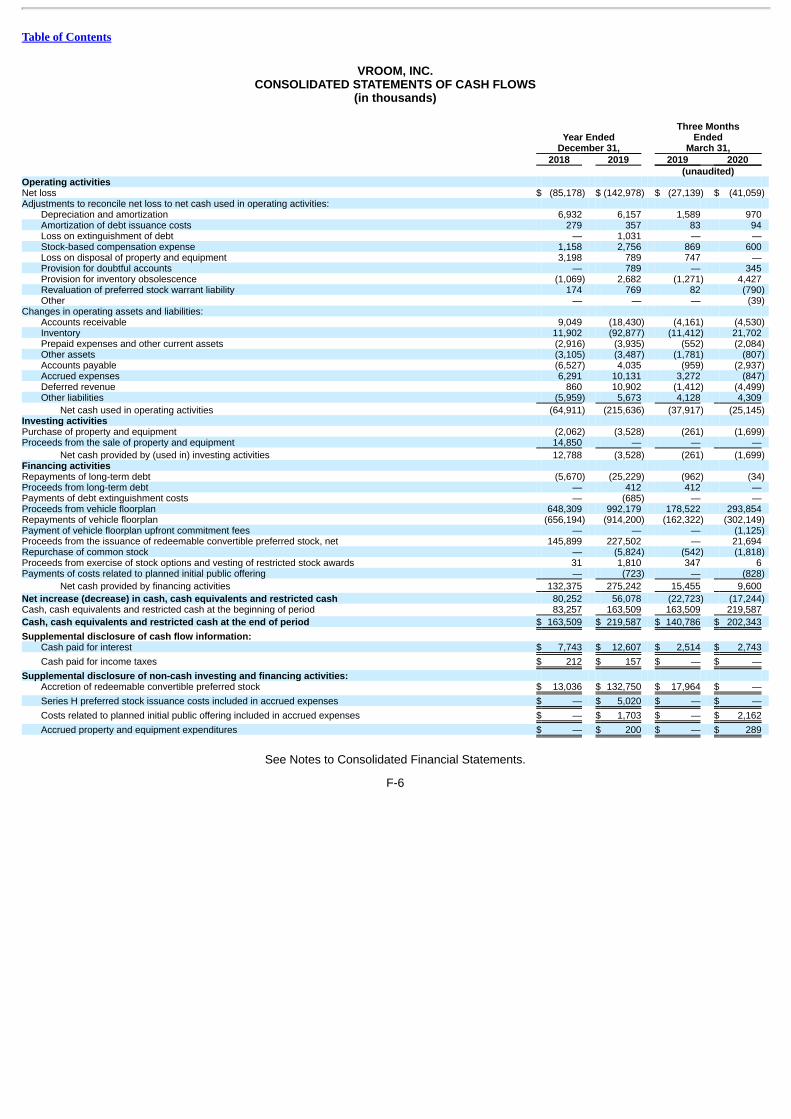
Table of Contents
VROOM, INC.CONSOLIDATED STATEMENTS OF CASH FLOWS
(in thousands)
Year Ended
December 31,
Three MonthsEnded
March 31, 2018 2019 2019 2020 (unaudited) Operating activities Net loss $ (85,178) $ (142,978) $ (27,139) $ (41,059) Adjustments to reconcile net loss to net cash used in operating activities:
Depreciation and amortization 6,932 6,157 1,589 970 Amortization of debt issuance costs 279 357 83 94 Loss on extinguishment of debt — 1,031 — — Stock-based compensation expense 1,158 2,756 869 600 Loss on disposal of property and equipment 3,198 789 747 — Provision for doubtful accounts — 789 — 345 Provision for inventory obsolescence (1,069) 2,682 (1,271) 4,427 Revaluation of preferred stock warrant liability 174 769 82 (790) Other — — — (39)
Changes in operating assets and liabilities: Accounts receivable 9,049 (18,430) (4,161) (4,530) Inventory 11,902 (92,877) (11,412) 21,702 Prepaid expenses and other current assets (2,916) (3,935) (552) (2,084) Other assets (3,105) (3,487) (1,781) (807) Accounts payable (6,527) 4,035 (959) (2,937) Accrued expenses 6,291 10,131 3,272 (847) Deferred revenue 860 10,902 (1,412) (4,499) Other liabilities (5,959) 5,673 4,128 4,309
Net cash used in operating activities (64,911) (215,636) (37,917) (25,145) Investing activities Purchase of property and equipment (2,062) (3,528) (261) (1,699) Proceeds from the sale of property and equipment 14,850 — — —
Net cash provided by (used in) investing activities 12,788 (3,528) (261) (1,699) Financing activities Repayments of long-term debt (5,670) (25,229) (962) (34) Proceeds from long-term debt — 412 412 — Payments of debt extinguishment costs — (685) — — Proceeds from vehicle floorplan 648,309 992,179 178,522 293,854 Repayments of vehicle floorplan (656,194) (914,200) (162,322) (302,149) Payment of vehicle floorplan upfront commitment fees — — — (1,125) Proceeds from the issuance of redeemable convertible preferred stock, net 145,899 227,502 — 21,694 Repurchase of common stock — (5,824) (542) (1,818) Proceeds from exercise of stock options and vesting of restricted stock awards 31 1,810 347 6 Payments of costs related to planned initial public offering — (723) — (828)
Net cash provided by financing activities 132,375 275,242 15,455 9,600
Net increase (decrease) in cash, cash equivalents and restricted cash 80,252 56,078 (22,723) (17,244) Cash, cash equivalents and restricted cash at the beginning of period 83,257 163,509 163,509 219,587
Cash, cash equivalents and restricted cash at the end of period $ 163,509 $ 219,587 $ 140,786 $ 202,343
Supplemental disclosure of cash flow information: Cash paid for interest $ 7,743 $ 12,607 $ 2,514 $ 2,743
Cash paid for income taxes $ 212 $ 157 $ — $ —
Supplemental disclosure of non-cash investing and financing activities: Accretion of redeemable convertible preferred stock $ 13,036 $ 132,750 $ 17,964 $ —
Series H preferred stock issuance costs included in accrued expenses $ — $ 5,020 $ — $ —
Costs related to planned initial public offering included in accrued expenses $ — $ 1,703 $ — $ 2,162
Accrued property and equipment expenditures $ — $ 200 $ — $ 289
See Notes to Consolidated Financial Statements.
F-6

Table of Contents
VROOM, INC.NOTES TO CONSOLIDATED FINANCIAL STATEMENTS
1. Description of Business and Basis of Presentation
Description of Business and Organization
Vroom, Inc., and its wholly owned subsidiaries (collectively “the Company”) is an innovative, end-to-end ecommerce platform that istransforming the used vehicle industry by offering a better way to buy and a better way to sell used vehicles.
In December 2015, the Company acquired Houston-based Left Gate Property Holding, LLC (d/b/a as Texas Direct Auto and hereinreferred to as “TDA”) which is the Company’s physical retail location.
The Company currently is organized into three reportable segments: Ecommerce, TDA, and Wholesale. The Ecommerce reportablesegment represents retail sales of used vehicles through the Company’s ecommerce platform and fees earned on sales of value-addedproducts associated with those vehicles sales. The TDA reportable segment represents retail sales of used vehicles from TDA and feesearned on sales of value-added products associated with those vehicles sales. The Wholesale reportable segment represents sales of usedvehicles through wholesale auctions.
The Company was incorporated in Delaware on January 31, 2012 under the name BCM Partners III, Corp. On June 25, 2013, theCompany changed its name to Auto America, Inc. and on July 9, 2015, the Company changed its name to Vroom, Inc.
Basis of Presentation
The consolidated financial statements of the Company have been prepared in accordance with U.S. generally accepted accountingprinciples (“U.S. GAAP”) and include the accounts of the Company and its wholly owned subsidiaries. All intercompany accounts andtransactions have been eliminated in consolidation.
Unaudited Interim Consolidated Financial Statements
The accompanying interim consolidated balance sheet as of March 31, 2020, the interim consolidated statements of operations andcash flows for the three months ended March 31, 2019 and 2020 and the interim consolidated statements of redeemable convertiblepreferred stock and stockholders’ deficit for the three months ended March 31, 2019 and 2020 and amounts relating to the interim periodsincluded in the accompanying notes to the interim consolidated financial statements are unaudited. The unaudited interim financialstatements have been prepared on the same basis as the audited consolidated financial statements, and in management’s opinion, includesall adjustments, consisting of only normal recurring adjustments, necessary for the fair presentation of the Company’s consolidated balancesheet as of March 31, 2020 and its results of operations and cash flows for the three months ended March 31, 2019 and 2020. The results forthe three months ended March 31, 2020 are not necessarily indicative of the results expected for the fiscal year or any other periods.
Unaudited Pro Forma Consolidated Balance Sheet Information
The unaudited pro forma balance sheet information as of March 31, 2020 presents the Company’s stockholders’ equity (deficit) asthough a 2-for-1 stock split of the Company’s common stock had been effected and all of the Company’s redeemable convertible preferredstock outstanding had automatically converted into an aggregate of 85,533,394 shares of the Company’s common stock,
F-7

Table of Contents
VROOM, INC.NOTES TO CONSOLIDATED FINANCIAL STATEMENTS
upon the completion of a qualifying initial public offering (“IPO”) of the Company’s common stock. The shares of common stock issuable andthe proceeds expected to be received by the Company upon the completion of a qualifying IPO are excluded from such pro forma financialinformation.
On May 28, 2020, the Company’s Board approved an amendment to the Company’s certificate of incorporation (the “Amendment”) toeffect a 2-for-1 stock split of shares of the Company’s outstanding common stock, such that each share of common stock, $0.001 par valuebecomes two shares of common stock, $0.001 par value per share. The Amendment will become effective when filed with the Secretary ofState of the State of Delaware prior to the closing of the Company’s initial public offering of common stock. As a result of the stock split, inaccordance with the terms of the Company’s certificate of incorporation, the conversion ratio of the Company’s redeemable convertiblepreferred stock will automatically adjust such that each share of the Company’s series redeemable convertible preferred stock will convertinto two shares of the Company’s common stock.
2. Summary of Significant Accounting Policies
Use of Estimates
The preparation of consolidated financial statements in accordance with U.S. GAAP requires management to make estimates,assumptions and judgments that affect the reported amounts of assets, liabilities, revenue, and expenses and related disclosures. On anongoing basis, the Company evaluates its estimates, including, among others, those related to income taxes, the realizability of inventory,stock-based compensation, contingencies, revenue-related reserves, fair value measurements, goodwill, and useful lives of property andequipment and intangible assets. The Company bases its estimates on historical experience, market conditions, and on various otherassumptions that are believed to be reasonable. Actual results may differ from these estimates.
Beginning in the first quarter of 2020, the coronavirus disease (“COVID-19”) pandemic has negatively impacted, and may continue tonegatively impact, the macroeconomic environment in the United States and globally, including the Company’s business, financial conditionand results of operations. Due to the evolving and uncertain nature of COVID-19, it is reasonably possible that it could materially impact theCompany’s estimates, particularly those noted above that require consideration of forecasted financial information, in the near to mediumterm. The ultimate impact will depend on numerous evolving factors that the Company may not be able to accurately predict, including theduration and extent of the pandemic, the impact of federal, state, local and foreign governmental actions, consumer behavior in response tothe pandemic and other economic and operational conditions the Company may face.
Comprehensive Loss
The Company did not have any other comprehensive income or loss for years ended December 31, 2018 and 2019 and for the threemonths ended March 31, 2019 and 2020. Accordingly, net loss and comprehensive loss are the same for the periods presented.
Revenue Recognition
Revenue consists of retail used vehicle sales, wholesale used vehicle sales, fees earned on sales of value-added products tocustomers in connection with vehicles sales, and other revenues. Refer to Note 3 – Revenue Recognition for a discussion of the Company’ssignificant accounting policies related to revenue recognition.
F-8

Table of Contents
VROOM, INC.NOTES TO CONSOLIDATED FINANCIAL STATEMENTS
Cost of sales
Cost of sales primarily includes the cost to acquire used vehicles, inbound transportation costs and direct and indirect reconditioningcosts associated with preparing vehicles for resale. Reconditioning costs include parts, labor and third-party reconditioning costs directlyattributable to the vehicle and allocated overhead costs. Cost of sales also includes any necessary adjustments to reflect vehicle inventory atthe lower of cost or net realizable value.
Cash and Cash Equivalents
Cash and cash equivalents include cash deposits at financial institutions and highly liquid investments with original maturities of threemonths or less. Outstanding checks that are in excess of the cash balances at certain financial institutions are included in “Accounts payable”in the consolidated balance sheets and changes in these amounts are reflected in operating cash flows in the consolidated statements ofcash flows.
Restricted Cash
Restricted cash as of December 31, 2018 and 2019 and March 31, 2020 includes cash deposits required under letter of creditagreements as explained in Note 10 – Commitments and Contingencies. Restricted cash as of March 31, 2020 also includes a $30.6 millioncash deposit required under the Company’s 2020 Vehicle Floorplan Facility as explained in Note 8 – Vehicle Floorplan Facilities.
Accounts Receivable, Net
Accounts receivable, net of an allowance for doubtful accounts, includes amounts due from customers and from third-party financialinstitutions related to vehicle purchases. The allowance for doubtful accounts is estimated based upon historical experience, age of thebalances, current economic conditions and other factors and is evaluated as of each reporting date. The allowance for doubtful accounts was$0.0, $0.8 million and $1.1 million as of December 31, 2018 and 2019 and March 31, 2020, respectively. Increases and decreases in theallowance for doubtful accounts are recorded in “Selling, general and administrative expenses” in the consolidated statements of operations.
Inventory
Inventory consists primarily of used vehicles and parts and accessories and is stated at the lower of cost or net realizable value.Inventory cost is determined by specific identification and includes acquisition cost, direct and indirect reconditioning costs and inboundtransportation expenses. Net realizable value represents the estimated selling price less costs to complete, dispose and transport thevehicles. The Company recognizes any necessary adjustments to reflect inventory at the lower of cost or net realizable value throughadjustments to “Cost of sales” in the consolidated statements of operations.
Property and Equipment, Net
Property and equipment are recorded at cost less accumulated depreciation and amortization. Charges for repairs and maintenancethat do not improve or extend the life of the respective assets are expensed as incurred. When assets are retired or otherwise disposed of,their costs and related accumulated depreciation are written off and any resulting gains or losses are recorded during the period.
F-9

Table of Contents
VROOM, INC.NOTES TO CONSOLIDATED FINANCIAL STATEMENTS
Depreciation and amortization are calculated using the straight-line method over the following estimated useful lives of the assets:
Equipment 3 to 7 yearsFurniture and fixtures 3 to 15 yearsCompany Vehicles 4 to 7 yearsLeasehold improvements Lesser of useful life or lease termInternal-use software 3 to 5 years
The Company capitalizes direct costs of materials and services utilized in developing or obtaining internal-use software. TheCompany also capitalizes payroll and payroll-related costs for employees who are directly associated with and who devote time to thedevelopment of software products for internal use, to the extent of the time spent directly on the project. Capitalization of costs begins duringthe application development stage and ends when the software is available for general use. Costs incurred during the preliminary project andpost-implementation stages are charged to expense as incurred.
Goodwill and Intangible Assets
Goodwill represents the excess of the consideration transferred over the fair value of the identifiable assets acquired and liabilitiesassumed in business combinations. Goodwill is tested for impairment annually as of October 1 or whenever events or changes incircumstances indicate that an impairment may exist.
The Company has three reporting units: Ecommerce, TDA, and Wholesale. In performing its annual goodwill impairment test, theCompany first reviews qualitative factors to determine whether it is more likely than not that the fair value of a reporting unit is less than itscarrying amount. If, after assessing qualitative factors, the Company determines that it is not more likely than not that the fair value of areporting unit is less than its carrying amount, then performing the quantitative test is unnecessary and the Company’s goodwill is notconsidered to be impaired. However, if based on the qualitative assessment the Company concludes that it is more likely than not that the fairvalue of the reporting unit is less than its carrying amount, or if the Company elects to bypass the optional qualitative assessment asprovided for under U.S. GAAP, the Company proceeds with performing the quantitative impairment test.
As a result of developments in the current economic environment related to the COVID-19 pandemic and its impact on the operationsof the Company’s physical retail location, the Company determined that an interim quantitative goodwill impairment test was required for theTDA reporting unit as of March 31, 2020. The results of the quantitative test indicated that the fair value of the TDA reporting unitsubstantially exceeded carrying value and that the TDA reporting unit was not at risk of failing the quantitative impairment test. Given theamount the fair value for the Ecommerce and Wholesale reporting units exceeded their carrying values, and after considering other relevantqualitative factors, the Company determined that interim goodwill tests were not required for these reporting units, as the Companydetermined it is not more likely than not that the fair value is less than the carrying value.
No goodwill impairment was determined to exist in connection with the Company’s annual impairment tests for the years endedDecember 31, 2018 and 2019. In connection with its annual goodwill impairment test as of October 1, 2019, the Company performedqualitative impairment assessments for each of its reporting units. The results of the qualitative assessments indicated that it was not morelikely than not that the fair value of the reporting units were less than the carrying values. In connection with the annual goodwill impairmenttest as of October 1, 2018, the Company performed
F-10

Table of Contents
VROOM, INC.NOTES TO CONSOLIDATED FINANCIAL STATEMENTS
qualitative impairment assessments for the Ecommerce and Wholesale reporting units. The results of the qualitative assessments indicatedthat it was not more likely than not that the fair value of the reporting units were less than the carrying values. For the TDA reporting unit, theCompany determined the most effective approach was to bypass the optional qualitative assessment and perform a quantitative impairmenttest. The results of the quantitative test indicated that the fair value of the TDA reporting unit substantially exceeded carrying value and thatthe TDA reporting unit was not at risk of failing the quantitative impairment test.
A quantitative goodwill impairment test requires a determination of whether the estimated fair value of a reporting unit is less than itscarrying value. The Company estimates the fair value of a reporting unit using an income valuation approach. The income valuationapproach is applied using the discounted cash flow method which requires (1) estimating future cash flows for a discrete projection period(2) estimating the terminal value, which reflects the remaining value that the reporting unit is expected to generate beyond the projectionperiod and (3) discounting those amounts to present value at a discount rate which is based on a weighted average cost of capital thatconsiders the relative risk of the cash flows. The income valuation approach requires the use of significant estimates and assumptions, whichinclude revenue growth rates, future gross profit margins and operating expenses used to calculate projected future cash flows,determination of the weighted average cost of capital, and future economic and market conditions. The terminal value is based on an exitmultiple which requires significant assumptions regarding the selection of appropriate multiples that consider relevant market trading data.The Company bases its estimates and assumptions on its knowledge of the automotive and ecommerce industries, its recent performance,its expectations of its future performance, and other assumptions it believes to be reasonable. Actual future results may differ from thoseestimates. The Company also makes certain judgments and assumptions in allocating shared assets and liabilities to determine the carryingvalues for each of its reporting units.
The Company’s intangible assets are amortized on a straight-line basis over the following estimated useful lives:
Trademarks 5 yearsTechnology 4 years
The Company periodically reassesses the useful lives of its definite-lived intangible assets when events or circumstances indicate thatuseful lives have significantly changed from the previous estimate.
Impairment of Long-Lived Assets
The Company evaluates long-lived assets, including definite-lived intangible assets, for impairment whenever events or changes incircumstances indicate that the carrying amount of an asset may not be recoverable. When impairment indicators are present, therecoverability of an asset is measured by comparing the carrying value of the asset to the estimated undiscounted future cash flows expectedto be generated by the asset. If the asset is considered to be impaired, the impairment to be recognized is measured by the amount by whichthe carrying amount of the asset exceeds the fair value of the asset. No impairment charges were recognized for the years endedDecember 31, 2018 and 2019 and for the three months ended March 31, 2019 and 2020.
Deferred Offering Costs
Deferred offering costs, including legal, accounting and other fees and costs relating to the Company’s planned initial public offering,are capitalized and included within “Other assets” in the
F-11

Table of Contents
VROOM, INC.NOTES TO CONSOLIDATED FINANCIAL STATEMENTS
consolidated balance sheets. The deferred offering costs will be offset against initial public offering proceeds within equity upon the closing ofthe initial public offering. As of December 31, 2018 and 2019 and March 31, 2020, there were $0.0 million, $2.4 million and $3.8 million,respectively, of capitalized deferred offering costs included within “Other assets.”
Vehicle Floorplan
The vehicle floorplan facility reflects amounts borrowed by the Company to finance the purchase of specific vehicle inventories.Portions of the vehicle floorplan facility are settled on a daily basis depending on the Company’s sales and purchasing activity. The vehiclefloorplan facility is collateralized by vehicle inventories and certain other assets of the Company. Borrowings and repayments are presentedseparately and classified as financing activities within the consolidated statements of cash flows.
Income Taxes
The Company accounts for income taxes under the asset and liability method. The Company recognizes deferred tax assets andliabilities for the future tax consequences attributable to differences between the financial statement carrying amounts of existing assets andliabilities and their respective tax basis, as well as for operating loss and tax credit carry forwards. The Company measures deferred taxassets and liabilities using enacted tax rates expected to apply to taxable income in the years in which the Company expects to recover orsettle those temporary differences. The Company recognizes the effect of a change in tax rates on deferred tax assets and liabilities in theresults of operations in the period that includes the enactment date. The Company reduces the measurement of a deferred tax asset, ifnecessary, by a valuation allowance if it is “more-likely-than-not” that the Company will not realize some or all of the deferred tax asset. TheCompany accounts for uncertain tax positions by recognizing the financial statement effects of a tax position only when, based upontechnical merits, it is “more likely than not” that the position will be sustained upon examination. Potential interest and penalties associatedwith unrecognized tax positions are recognized in income tax expense.
Stock-Based Compensation
The Company recognizes the cost of employee services received in exchange for stock awards based on the fair value of thoseawards at the date of grant over the requisite service period. The Company uses the Black-Scholes-Merton (“Black-Scholes”) option pricingmodel to determine the fair value of its stock-based awards. Estimating the fair value of stock-based awards requires the input of subjectiveassumptions, including the estimated fair value of the Company’s common stock, the expected life of the options, stock price volatility, therisk-free interest rate and expected dividends. The assumptions used in the Company’s Black-Scholes option-pricing model representmanagement’s best estimates and involve a number of variables, uncertainties and assumptions and the application of management’sjudgment, as they are inherently subjective.
Advertising
Advertising costs are expensed as incurred and are included within “Selling, general and administrative expenses” in the consolidatedstatements of operations. Advertising expenses were $25.6 million and $49.9 million for the years ended December 31, 2018 and 2019,respectively and $7.1 million and $17.9 million for the three months ended March 31, 2019 and 2020, respectively.
F-12

Table of Contents
VROOM, INC.NOTES TO CONSOLIDATED FINANCIAL STATEMENTS
Shipping and Handling
The Company’s logistics costs related to transporting its used vehicle inventory primarily include third-party transportation fees. Theportion of these costs related to inbound transportation from the point of acquisition to the relevant reconditioning facility is included in cost ofsales when the related used vehicle is sold. Logistics costs not included in cost of sales are accounted for as costs to fulfil contracts withcustomers and are included in “Selling, general and administrative expenses” in the consolidated statements of operations and were$6.4 million and $14.0 million for the years ended December 31, 2018 and 2019, respectively and $2.3 million and $5.8 million for the threemonths ended March 31, 2019 and 2020, respectively.
Concentration of Credit Risk and Significant Customers
The Company’s principal financial instruments subject to potential concentration of credit risk are cash and cash equivalents andaccounts receivable, which are unsecured. The Company’s cash and cash equivalents are maintained at various large financial institutions.Deposits held with financial institutions may at times exceed the amount of insurance provided on such deposits. Generally, these depositsmay be redeemed upon demand and, therefore, management believes they bear minimal risk. Concentration of credit risk with respect toaccounts receivables is generally mitigated by a large customer base.
For the years ended December 31, 2018 and 2019 and the three months ended March 31, 2019 and 2020, no customer represented10% or more of the Company’s revenues or accounts receivable.
Liquidity and Management’s Plan
For the years ended December 31, 2018 and 2019, the Company generated negative cash flows from operations of approximately$64.9 million and $215.6 million, respectively, and generated net losses of approximately $85.2 million and $143.0 million, respectively. Forthe three months ended March 31, 2019 and 2020, the Company generated negative cash flows from operations of approximately $37.9million and $25.1 million, respectively, and generated net losses of approximately $27.1 million and $41.1 million, respectively. Sinceinception, the Company has had negative cash flows and losses from operations which it has funded primarily through issuances of commonand preferred stock. The Company has historically funded vehicle inventory purchases through its vehicle floorplan facility (refer to Note 8 –Vehicle Floorplan Facilities). As further discussed in Note 8, the Company entered into a new vehicle floorplan facility in March 2020 whichincreased the borrowing capacity up to $450.0 million and extended the term through March 2021.
The COVID-19 pandemic has rapidly escalated in the United States, creating significant uncertainties and economic disruption, andleading to record levels of unemployment nationally. The Company expects that its operations will continue to be adversely impactedthroughout 2020 and potentially beyond, however, the magnitude and duration of the ultimate impact is impossible to predict with certainty.
In response to the COVID-19 disruptions, the Company implemented a number of measures designed to protect the health and safetyof its workforce, manage its inventory exposure, conserve liquidity and reduce its operating costs, including: furloughing approximately one-third of its workforce, reducing salaries of its executives and employees, strategically evaluating its exposure to inventory and floorplanliability and reducing its marketing expenses. The Company believes it can continue to take similar actions, to the extent needed, to furtherreduce its cost structure.
F-13

Table of Contents
VROOM, INC.NOTES TO CONSOLIDATED FINANCIAL STATEMENTS
If the Company successfully completes its planned initial public offering, it would provide net proceeds which the Company believes
will be sufficient to provide the liquidity necessary to satisfy its obligations over the next twelve months.
There can be no assurance that the Company will be able to complete its planned initial public offering and raise sufficient additionalcapital or take other actions that will provide it with sufficient liquidity to satisfy its obligations over the next twelve months.
In accordance with Accounting Standards Update No. 2014-15, Disclosure of Uncertainties about an Entity’s Ability to Continue as aGoing Concern (Subtopic 205-40), the Company has evaluated whether there are conditions and events, considered in the aggregate, thatraise substantial doubt about the Company’s ability to continue as a going concern within one year after the date that the consolidatedfinancial statements are issued or available to be issued. The COVID-19 pandemic described above, combined with the losses and negativecash flows from operations since inception, and the fact that management’s plan to obtain additional capital has not yet been completed,have raised substantial doubt about the Company’s ability to continue as a going concern.
The consolidated financial statements have been prepared on a basis that assumes the Company will continue as a going concernwhich contemplates the realization of assets and satisfaction of liabilities and commitments in the ordinary course of business. Accordingly,the accompanying consolidated financial statements do not include any adjustments that might result from the outcome of this uncertainty.
Net Loss Per Share Attributable to Common Stockholders
Basic and diluted net loss per share attributable to common stockholders is presented in conformity with the two-class methodrequired for participating securities. Under the two-class method, net loss is attributed to common stockholders and participating securitiesbased on their participation rights. The Company considers all series of its redeemable convertible preferred stock to be participatingsecurities. Under the two-class method, the net loss attributable to common stockholders is not allocated to the redeemable convertiblepreferred stock as the holders of the Company’s redeemable convertible preferred stock do not have a contractual obligation to share in theCompany’s losses. Under the two-class method, basic net loss per share attributable to common stockholders is computed by dividing thenet loss attributable to common stockholders by the weighted-average number of shares of common stock outstanding during the period. Forperiods in which the Company reports net losses, diluted net loss per common share attributable to common stockholders is the same asbasic net loss per common share attributable to common stockholders because potentially dilutive common shares are not assumed to havebeen issued if their effect is anti-dilutive.
The accretion of the Company’s redeemable convertible preferred stock (refer to Note 12) has been presented as an increase to netloss to determine net loss attributable to common stockholders.
Adoption of New Accounting Standards
The Company qualifies to be treated as an “emerging growth company” as defined in the Jumpstart Our Business Startups Act of2012 (the “JOBS Act”) and therefore intends to take advantage of certain exemptions from various public company reporting requirements,including delaying adoption of new or revised accounting standards until those standards apply to private companies. The Company haselected to use this extended transition period under the JOBS Act. The effective dates shown below reflect the election to use the extendedtransition period.
F-14

Table of Contents
VROOM, INC.NOTES TO CONSOLIDATED FINANCIAL STATEMENTS
Accounting Standards Adopted
In May 2014, the Financial Accounting Standards Board (“FASB”) issued ASU 2014-09, Revenue from Contracts withCustomers (“Topic 606”), which amends the guidance on revenue recognition. Under the new standard, revenue is recognized upon transferof control of promised goods or services to customers in an amount that reflects the consideration the entity expects to receive in exchangefor those goods and services. The principles in the standard are applied using a five-step model that includes 1) identifying the contract(s)with a customer, 2) identifying the performance obligations in the contract, 3) determining the transaction price, 4) allocating the transactionprice to the performance obligations in the contract, and 5) recognizing revenue when (or as) the performance obligations are satisfied. Thestandard also requires disclosure of the nature, amount, timing, and uncertainty of revenue and cash flows arising from contracts withcustomers. The FASB also subsequently issued several amendments to the standard to clarify the guidance.
The guidance was effective for financial statements issued for fiscal years beginning after December 15, 2018. The Company electedto early adopt Topic 606 as of January 1, 2018 utilizing the modified retrospective approach applied only to contracts not completed as of thedate of adoption. The Company recognized a net decrease to accumulated deficit of $1.7 million as January 1, 2018 due to the cumulativeeffect of adopting Topic 606.
The cumulative effect adjustment primarily resulted from a change in revenue recognition for sales of extended warranty contractswhich are provided by a third-party and are sold by the Company on a commission basis. For these products, the Company is contractuallyentitled to receive profit-sharing revenues based on the performance of the extended warranty contracts once a required claims period haspassed. The Company previously recognized this revenue at each reporting date based on the performance of the extended warrantycontracts at such date. Under Topic 606, profit sharing revenues are recognized earlier because they represent variable consideration whichthe Company estimates and recognizes at the time the extended warranties are sold to the end-customer.
Topic 606 also requires the Company to make additional disclosures about the amount, timing, and uncertainty of revenue and cashflows arising from contracts with customers. Refer to Note 3 – Revenue Recognition for further information on the Company’s revenuerecognition accounting policies.
In February 2016, the FASB issued, ASU 2016-02, Leases (Topic 842), which amends the accounting guidance on leases. The newstandard requires a lessee to recognize right-of-use assets and lease obligations on the balance sheet for most lease agreements. Leasesare classified as either operating or finance, with classification affecting the pattern of expense recognition in the statement of operations.The FASB also subsequently issued amendments to the standard to provide additional practical expedients and an additional transitionmethod option. The guidance is effective for financial statements issued for fiscal years beginning after December 15, 2020 and earlyadoption is permitted.
The Company elected to early adopt Topic 842 as of January 1, 2020 using the modified retrospective approach with a cumulative-effect adjustment to opening retained earnings (accumulated deficit) with no restatement of comparative periods. Upon adoption, theCompany recognized $18.4 million of operating lease liabilities and $17.4 million of operating lease right-of-use assets. The adoption of Topic842 did not result in a cumulative effect adjustment to accumulated deficit.
Topic 842 provides various optional practical expedients for transition. The Company elected to utilize the package of practicalexpedients for transition which permitted the Company to not reassess its prior conclusions regarding whether a contract is or contains alease, lease classification and initial direct costs. The Company did not elect the hindsight practical expedient to determine lease terms.
F-15

Table of Contents
VROOM, INC.NOTES TO CONSOLIDATED FINANCIAL STATEMENTS
Topic 842 also provides optional practical expedients for an entity’s ongoing lease accounting. The Company elected the short-term
lease recognition exemption for all leases that qualify and the practical expedient to not separate lease and non-lease components of leases.
In August 2016, the FASB issued new guidance, ASU 2016-15, Classification of Certain Cash Receipts and Cash Payments, whichclarifies how entities should classify cash receipts and cash payments related to eight specific cash flow matters on the statement of cashflows, with the objective of reducing existing diversity in practice. The guidance was effective for financial statements issued for fiscal yearsbeginning after December 15, 2018 and is required to be applied retrospectively. The Company early adopted the guidance on January 1,2018 which did not have a material impact on the Company’s consolidated statements of cash flows.
In November 2016, the FASB issued new guidance, ASU 2016-18, Restricted Cash, which requires that an entity’s statement of cashflows explain the change during the period in the total of cash, cash equivalents, and amounts generally described as restricted cash orrestricted cash equivalents. Accordingly, restricted cash and restricted cash equivalents are required to be included with cash and cashequivalents when reconciling the beginning and end of period total amounts shown on the statement of cash flows. The guidance waseffective for financial statements issued for fiscal years beginning after December 15, 2018 and is required to be applied retrospectively. TheCompany early adopted this guidance on January 1, 2018, and made the relevant changes, which were not material, to the Company’sconsolidated statements of cash flows.
In January 2017, the FASB issued new guidance, ASU 2017-01, Business Combinations (Topic 805): Clarifying the Definition of aBusiness, which changes the definition of a business to assist entities with evaluating whether transactions should be accounted for astransfers of assets or business combinations. The guidance was effective for financial statements issued for fiscal years beginning afterDecember 15, 2018 and is required to be applied prospectively. The Company early adopted this guidance on January 1, 2018. Thisguidance will be applied prospectively to business combinations and did not have an impact on the Company’s consolidated financialstatements.
In January 2017, the FASB issued new guidance, ASU 2017-04, Intangibles-Goodwill and Other (Topic 350): Simplifying the Test forGoodwill Impairment, which simplifies the subsequent measurement of goodwill by eliminating the second step of the goodwill impairmenttest. Under the new guidance, an entity performs its annual or interim goodwill impairment test by comparing the fair value of a reporting unitwith its carrying amount and recognizes an impairment charge, if applicable, for the amount by which the carrying amount exceeds thereporting unit’s fair value. The impairment charge recognized should not exceed the total amount of goodwill allocated to the reporting unit.The guidance is effective for financial statements issued for fiscal years beginning after December 15, 2020 and is required to be appliedprospectively. The Company early adopted this guidance on January 1, 2018 which did not have an impact on the Company’s consolidatedfinancial statements.
In August 2018, the FASB issued ASU 2018-15, Intangibles — Goodwill and Other — Internal-Use Software (Subtopic 350-40):Customer’s Accounting for Implementation Costs Incurred in a Cloud Computing Arrangement That Is a Service Contract (“ASU 2018-15”).The intent of this new guidance is to align the requirements for capitalizing implementation costs incurred in a cloud computing arrangementthat is a service contract with the requirements for capitalizing implementation costs incurred to develop or obtain internal-use software asdefined in ASC 350-40. Under ASU 2018-15, the capitalized implementation costs related to a cloud computing arrangement will beamortized over the term of the arrangement and all capitalized implementation amounts will be required to be presented in the same lineitems of the financial statements as the related hosting fees.
F-16

Table of Contents
VROOM, INC.NOTES TO CONSOLIDATED FINANCIAL STATEMENTS
The guidance is effective for financial statements issued for fiscal years beginning after December 15, 2020. As permitted by the standard,the Company early adopted ASU 2018-15 as of January 1, 2019. The new guidance was applied prospectively to all implementation costsincurred after the date of adoption and resulted in the capitalization of $2.7 million of implementation costs, which primarily relate to theCompany’s hosted general ledger system. Capitalized implementation costs are included in “Other assets” in the consolidated balance sheetas of December 31, 2019 and are amortized over the terms of the arrangements, which range between 2 and 5 years. Total amortizationexpense for the year ended December 31, 2019 was $0.3 million and total amortization expense for the three months ended March 31, 2019and 2020 was $0.0 million and $0.2 million, respectively.
In August 2018, the FASB issued ASU 2018-13, Fair Value Measurement (Topic 820): Disclosure Framework — Changes to theDisclosure Requirements for Fair Value Measurement, related to updated requirements over the disclosures of fair value measurements.Under ASU 2018-13, certain disclosure requirements for fair value measurements will be eliminated, modified or added to facilitate betterdisclosure regarding recurring and non-recurring fair value measurements. The guidance is effective for financial statements issued for fiscalyears beginning after December 15, 2019, with some amendments applied prospectively, some applied retrospectively. The Companyadopted the guidance on January 1, 2020 which did not have a material impact on the Company’s consolidated financial statements andrelated disclosures.
Accounting Standards Issued But Not Yet Adopted
In June 2016, the FASB issued ASU 2016-13, Financial instruments, Credit Losses (Topic 326): Measurement of Credit Losses onFinancial Instruments, which amends the guidance on the impairment of financial instruments by requiring measurement and recognition ofexpected credit losses for most financial assets, including trade receivables, and other instruments that are not measured at fair valuethrough net income. The guidance is effective for financial statements issued for fiscal years, and for interim periods within those fiscal years,beginning after December 15, 2022. The Company is currently evaluating the impact that the adoption of this guidance will have on itsconsolidated financial statements and related disclosures.
In December 2019, the FASB issued ASU 2019-12, Income Taxes (Topic 740): Simplifying the Accounting for Income Taxes, whichenhances and simplifies various aspects of the income tax accounting guidance including the elimination of certain exceptions related to theapproach for intraperiod tax allocation, the methodology for calculating income taxes in an interim period and the recognition of deferred taxliabilities for outside basis differences. The guidance will be effective for fiscal years beginning after December 15, 2021, and interim periodsin fiscal years beginning after December 15, 2022, with early adoption permitted. The Company is currently evaluating the impact that theadoption of this guidance will have on its consolidated financial statements and related disclosures.
3. Revenue Recognition
The Company recognizes revenue upon transfer of control of goods or services to customers, in an amount that reflects theconsideration to which the Company expects to be entitled in exchange for those goods or services. The Company may collect sales taxesand other taxes from customers on behalf of governmental authorities at the time of sale as required. These taxes are accounted for on a netbasis and are not included in revenues or cost of sales.
The Company’s revenue is disaggregated within the consolidated statements of operations and is generated from customersthroughout the United States. The Company recognizes revenue at a point in time as described below.
F-17

Table of Contents
VROOM, INC.NOTES TO CONSOLIDATED FINANCIAL STATEMENTS
Retail Vehicle Revenue
The Company sells used vehicles to its retail customers through its ecommerce platform and TDA retail location. The transaction pricefor used vehicles is a fixed amount as set forth within the customer contract at the time of sale. Customers frequently trade-in their existingvehicle to apply toward the transaction price of a used vehicle. Trade-in vehicles represent non-cash consideration which the Companymeasures at fair value based on external and internal market data for each specific vehicle. The Company satisfies its performanceobligation and recognizes revenue for used vehicle sales generally at a point in time when the vehicles are delivered to the customer forecommerce sales or picked up by the customer for TDA sales. The revenue recognized by the Company includes the agreed upontransaction price, including any delivery charges stated within the customer contract. Revenue excludes any sales taxes, title and registrationfees, and other government fees that are collected from customers.
The Company receives payment for used vehicle sales directly from the customer at the time of sale or from third-party financialinstitutions within a short period of time following the sale if the customer obtains financing. Payments received prior to delivery or pick-up ofused vehicles are recorded as “Deferred revenue” within the consolidated balance sheets.
The Company offers a return policy for used vehicle sales and establishes a provision for estimated returns based on historicalinformation and current trends. The reserve for estimated returns is presented gross on the consolidated balance sheets, with an assetrecorded in “Prepaid expenses and other current assets” and a refund liability recorded in “Other current liabilities.”
Wholesale Vehicle Revenue
The Company sells vehicles that do not meet its retail sales criteria through third-party wholesale auctions. Vehicles sold at auctionare acquired from customers who trade-in their vehicles when making a purchase from the Company and also from customers who sell theirvehicles to the Company in direct-buy transactions. The transaction price for wholesale vehicles is a fixed amount that is determined at theauction. The Company satisfies it performance obligation and recognizes revenue for wholesale vehicle sales at a point in time when thevehicle is sold at auction. The transaction price is typically due and collected within a short period of time following the vehicle sales.
Product Revenue
The Company’s product revenue consists of fees earned on selling extended warranty contracts, guaranteed asset protection (“GAP”)and wheel and tire coverage. The Company sells these products pursuant to arrangements with the third parties that provide these productsand are responsible for their fulfillment. The Company concluded that it is an agent for these transactions because it does not control theproducts before they are transferred to the customer. The Company recognizes product revenues on a net basis when the customer entersinto an arrangement for the products, which is typically at the time of a used vehicle sale.
Customers may enter into a retail installment sales contract to finance the purchase of used vehicles. The Company sells thesecontracts on a non-recourse basis to various financial institutions. The Company receives a fee from the financial institution based on thedifference between the interest rate charged to the customer that purchased the used vehicle and the interest rate set by the financialinstitution. These fees are recognized upon sale and assignment of the installment sales contract to the financial institution, which occursconcurrently at the time of a used vehicle sale.
F-18

Table of Contents
VROOM, INC.NOTES TO CONSOLIDATED FINANCIAL STATEMENTS
A portion of the fees earned on these products is subject to chargebacks in the event of early termination, default, or prepayment of
the contracts by end-customers. The Company’s exposure for these events is limited to the fees that it receives. An estimated refund liabilityfor chargebacks against the revenue recognized from sales of these products is recorded in the period in which the related revenue isrecognized and is based primarily on the Company’s historical chargeback experience. The Company updates its estimates at each reportingdate. As of December 31, 2018 and 2019 and March 31, 2020, the Company’s reserve for chargebacks was $1.7 million, $3.3 million and$3.5 million, respectively, of which $1.3 million, $1.8 million and $2.0 million, respectively, are included within “Accrued expenses” and$0.4 million, $1.5 million and $1.5 million, respectively, are included in “Other long-term liabilities.”
The Company also is contractually entitled to receive profit-sharing revenues based on the performance of the extended warrantypolicies once a required claims period has passed. The Company recognizes profit-sharing revenues to the extent it is probable that it will notresult in a significant revenue reversal. The Company estimates the revenue based on historical claims and cancellation data from itscustomers, as well as other qualitative assumptions. The Company reassesses the estimate at each reporting period with any changesreflected as an adjustment to revenues in the period identified. As of December 31, 2018 and 2019 and March 31, 2020, the Companyrecognized $4.2 million, $6.9 million and $8.0 million, respectively, related to cumulative profit-sharing payments to which it expects to beentitled, of which $0.1 million, $0.3 million and $1.0 million, respectively, are included within “Prepaid expenses and other current assets” and$4.1 million, $6.6 million and $7.0 million, respectively, are included within “Other assets.”
Other Revenue
Other revenue primarily consists of labor and parts revenue earned by the Company for vehicle repair services at TDA.
Contract Costs
The Company has elected, as a practical expedient, to expense sales commissions when incurred because the amortization periodwould have been less than one year. These costs are recorded within “Selling general and administrative expenses” in the consolidatedstatements of operations.
4. Inventory
Inventory consisted of the following (in thousands): December 31, March 31, 2018 2019 2020 (unaudited) Vehicles $ 115,213 $ 203,290 $ 178,130 Parts and accessories 338 2,456 1,487
Total inventory $ 115,551 $ 205,746 $ 179,617
As of December 31, 2018 and 2019 and March 31, 2020, “Inventory” includes an adjustment of $3.6 million, $6.3 million, and$10.7 million, respectively, to record the balances at the lower of cost or net realizable value.
F-19

Table of Contents
VROOM, INC.NOTES TO CONSOLIDATED FINANCIAL STATEMENTS
5. Property and Equipment, Net
Property and equipment, net consisted of the following (in thousands): December 31, March 31, 2018 2019 2020 (unaudited) Equipment $ 866 $ 930 $ 930 Furniture and fixtures 1,837 1,725 1,725 Company vehicles 1,494 1,151 1,151 Leasehold improvements 7,297 6,556 6,556 Internal-use software 1,460 4,406 6,357 Other 1,982 2,580 2,617
14,936 17,348 19,336 Accumulated depreciation and amortization (7,263) (9,520) (10,352)
Property and equipment, net $ 7,673 $ 7,828 $ 8,984
Depreciation and amortization expense was $3.5 million and $2.8 million for the years ended December 31, 2018 and 2019,respectively, and $0.7 million and $0.9 million for the three months ended March 31, 2019 and 2020, respectively. Depreciation andamortization expense of $0.1 million was included within “Cost of sales” in the consolidated statements of operations for the years endedDecember 31, 2018 and 2019 and the three months ended March 31, 2019. For the three months ended March 31, 2020, depreciation andamortization expense included within “Cost of sales” was $0.0 million.
6. Goodwill and Intangible Assets
The carrying amount of goodwill allocated to the Company’s reportable segments was as follows (in thousands): Ecommerce TDA Wholesale Total Balance as of January 1, 2018 $ 72,231 $4,221 $ 1,720 $78,172 Change in carrying amount — — — —
Balance as of December 31, 2018 $ 72,231 $4,221 $ 1,720 $78,172
Change in carrying amount — — — —
Balance as of December 31, 2019 $ 72,231 $4,221 $ 1,720 $78,172
Change in carrying amount (unaudited) — — — —
Balance as of March 31, 2020 (unaudited) $ 72,231 $4,221 $ 1,720 $78,172
There have been no accumulated impairment charges for goodwill.
F-20

Table of Contents
VROOM, INC.NOTES TO CONSOLIDATED FINANCIAL STATEMENTS
The Company’s intangible assets consisted of the following (in thousands):
December 31, 2018
GrossCarrying
Value AccumulatedAmortization
CarryingValue
Trademarks $ 2,490 $ (1,481) $ 1,009 Technology 11,500 (8,686) 2,814 Other 252 (130) 122
Total intangible assets $14,242 $ (10,297) $ 3,945
December 31, 2019
GrossCarrying
Value AccumulatedAmortization
CarryingValue
Trademarks $ 2,490 $ (1,990) $ 500 Technology 11,500 (11,500) — Other 252 (180) 72
Total intangible assets $14,242 $ (13,670) $ 572
March 31, 2020 (unaudited)
GrossCarrying
Value AccumulatedAmortization
CarryingValue
Trademarks $ 2,490 $ (2,114) $ 376 Technology 11,500 (11,500) — Other 252 (194) 58
Total intangible assets $14,242 $ (13,808) $ 434
Amortization expense for intangible assets was $3.4 million for each of the years ended December 31, 2018 and 2019 and$0.9 million and $0.1 million for the three months ended March 31, 2019 and 2020, respectively.
The estimated annual amortization expense for intangible assets subsequent to December 31, 2019 consists of the following (inthousands): Year Ending December 31: 2020 $ 538 2021 29 2022 5
$ 572
F-21

Table of Contents
VROOM, INC.NOTES TO CONSOLIDATED FINANCIAL STATEMENTS
7. Accrued Expenses and Other Current Liabilities
The Company’s accrued expenses consisted of the following (in thousands): December 31, March 31, 2018 2019 2020 (unaudited) Accrued marketing expenses $ 4,083 $ 3,158 $ 3,695 Vehicle related expenses 4,015 8,923 6,812 Sales taxes 2,049 7,455 10,199 Accrued compensation and benefits 2,877 3,386 3,347 Accrued professional services 1,955 2,964 2,527 Accrued Series H preferred stock issuance costs — 5,020 — Lease exit costs 1,375 531 — Other 5,211 7,054 5,791
Total accrued expenses $21,565 $38,491 $ 32,371
During the year ended December 31, 2018, the Company recorded lease exit costs of $2.6 million related to certain cost savinginitiatives, which were recorded within “Selling, general and administrative expenses” in the consolidated statements of operations. Theassociated lease exit cost liability was $2.6 million and $0.5 million as of December 31, 2018 and 2019, respectively, of which $1.4 millionand $0.5 million, respectively, were included within “Accrued expenses” and $1.2 million and $0.0 million, respectively, were included in“Other long-term liabilities.”
The Company’s other current liabilities consisted of the following (in thousands): December 31, March 31, 2018 2019 2020 (unaudited) Vehicle payable $4,799 $ 8,904 $ 11,857 Other 818 2,533 3,855
Total other current liabilities $5,617 $11,437 $ 15,712
8. Vehicle Floorplan Facilities
In March 2020, the Company entered into a new vehicle floorplan facility with Ally Bank and Ally Financial (the “2020 VehicleFloorplan Facility”), which replaces the Company’s existing vehicle floorplan facility. The 2020 Vehicle Floorplan Facility provides a committedcredit line up to $450.0 million which expires in March 2021. The amount of credit line available is determined on a monthly basis based on acalculation that considers average outstanding borrowings and vehicle units paid off by the Company within the immediately preceding three-month period. The Company may elect to increase its monthly credit line availability by an additional $25.0 million during any three months ofeach year. As of March 31, 2020, the borrowing capacity of the 2020 Vehicle Floorplan Facility was $306.5 million, of which $141.3 millionwas unutilized.
Outstanding borrowings related to the 2020 Vehicle Floorplan Facility are due as the vehicles financed are sold, or in any event, onthe maturity date. The 2020 Vehicle Floorplan Facility bears interest at a rate equal to the 1-Month LIBOR rate applicable in the immediatelypreceding month plus
F-22

Table of Contents
VROOM, INC.NOTES TO CONSOLIDATED FINANCIAL STATEMENTS
a spread of 425 basis points. The 2020 Vehicle Floorplan Facility is collateralized by the Company’s vehicle inventory and certain otherassets and the Company is subject to covenants that require it to maintain a certain level of equity in the vehicles that are financed, tomaintain at least 10% of the outstanding borrowings in cash and cash equivalents, to maintain 10% of the monthly credit line availability ondeposit with Ally Bank and to maintain a minimum tangible adjusted net worth of $167.0 million, which is defined as shareholder (deficit)equity plus redeemable convertible preferred stock as determined under US GAAP. The Company was required to pay an upfrontcommitment fee of $1.1 million upon execution of the 2020 Vehicle Floorplan Facility.
The Company previously entered into a vehicle floorplan (the “Vehicle Floorplan Facility”) with Ally Bank and Ally Financial in April2016, as subsequently amended. The Vehicle Floorplan Facility consisted of a revolving line of credit with a borrowing capacity of$117.0 million and $220.0 million as of December 31, 2018 and 2019, respectively, which could be used to finance the Company’s vehicleinventory. For the years ended December 2018 and 2019, the Company’s ability to request and obtain borrowings under the VehicleFloorplan Facility could be terminated at the lender’s discretion upon the lender providing sixty calendar days prior written notice.
Outstanding borrowings related to the Vehicle Floorplan Facility were due on demand or as the vehicles financed are sold. TheVehicle Floorplan Facility was collateralized by the Company’s vehicle inventory and certain other assets of the Company and included twoaffirmative covenants which required the Company to maintain a certain level of equity in the vehicles that were financed and to maintain atleast 10% of the outstanding borrowings in cash and cash equivalents. The interest rate on the Vehicle Floorplan Facility was equal to the1-Month LIBOR rate applicable in the immediately preceding month plus a spread of 425 basis points and was payable on a monthly basis.
As of December 31, 2018 and 2019 and March 31, 2020, outstanding borrowings on the vehicle floorplan facilities were $95.5 million,$173.5 million and $165.2 million, respectively.
Interest expense incurred by the Company for the vehicle floorplan facilities was $4.7 million and $10.4 million for the years andDecember 31, 2018 and 2019, respectively, and $1.9 million and $2.7 million for the three months ended March 31, 2019 and 2020,respectively, which are recorded within “Interest expense” in the consolidated statements of operations. The weighted average interest rateon the vehicle floorplan borrowings was 6.56%, 6.00% and 5.9% as of December 31, 2018 and 2019 and March 31, 2020, respectively.
As of December 31, 2018 and 2019 and March 31, 2020, the Company was in compliance with all covenants related to the vehiclefloorplan facilities.
In connection with the vehicle floorplan facilities, the Company entered into credit balance agreements with Ally Bank and AllyFinancial that permits the Company to deposit cash with the bank for the purpose of reducing the amount of interest payable for borrowings.Interest credits earned by the Company were $2.9 million and $5.1 for the years and December 31, 2018 and 2019, respectively, and$1.6 million and $1.7 million for the three months ended March 31, 2019 and 2020, respectively, which are recorded within “Interest income”in the consolidated statements of operations.
F-23

Table of Contents
VROOM, INC.NOTES TO CONSOLIDATED FINANCIAL STATEMENTS
9. Long-Term Debt
Long-term debt consisted of the following (in thousands): December 31, March 31, 2018 2019 2020 (unaudited) Term loan credit facility $ 25,000 $ — $ — Other 129 316 282
Total debt 25,129 316 282 Less: current portion (8,386) (135) (137) Less: unamortized debt issuance costs (698) — —
Total long-term debt, net $ 16,045 $ 181 $ 145
Scheduled maturities of debt subsequent to December 31, 2019 are as follows (in thousands): Year Ending December 31, 2020 $135 2021 144 2022 37
Total $316
Term Loan Credit Facility
On August 11, 2017 (the “Closing Date”), the Company entered into a Loan and Security Agreement with Eastward FundManagement, LLC for a term loan credit facility in an aggregate principal amount of up to $50.0 million (the “Term Loan Facility”). On theClosing Date, the Company borrowed $25.0 million of principal (the “Closing Date Advance”) and paid a $0.5 million facility fee to the lenderand certain other issuance costs that were deducted from the proceeds. The Company did not request any additional borrowings under theTerm Loan Facility.
In December 2019, the Company repaid in full the outstanding balance on the Term Loan Facility and recognized a loss onextinguishment of $1.0 million which is included within “Interest expense” within the consolidated statement of operations for the year endedDecember 31, 2019. As of December 31, 2018, the outstanding balance on the Term Loan Facility, net of unamortized debt issuance costs of$0.7 million, was $24.3 million.
The Closing Date Advance accrued interest at an annual rate of 11.73%, which was required to be paid monthly on the first businessday of each month (the “Payment Date”). The final principal installment payment for the Closing Date Advance required an additional finalpayment equal to 3.5% of the original principal amount. The principal amount of the Closing Date Advance was required to be repaid in equalmonthly installments commencing with the 19th Payment Date of the advance and ending on the 48th Payment Date of the advance.
Mortgage payable
On June 1, 2016, the Company entered into a Commercial Real Estate Loan and Security Agreement and Promissory Note with AllyBank (the “Ally Mortgage Payable”) to borrow $6.0 million,
F-24

Table of Contents
VROOM, INC.NOTES TO CONSOLIDATED FINANCIAL STATEMENTS
related to a facility the Company owned in Grand Prairie, Texas. In February 2018, the Company sold the related property and repaid theoutstanding principal and accrued interest which totaled $5.5 million. The Ally Mortgage Payable accrued interest at a fixed annual rate of4.78% and principal payments of $25 thousand plus interest were due on a monthly basis beginning in July 2016.
10. Commitments and Contingencies
Litigation
From time to time, the Company is involved in various claims and legal actions that arise in the ordinary course of business. As ofDecember 31, 2018 and 2019 and March 31, 2020, the Company was not a party to any legal proceedings, that individually or in theaggregate, are reasonably expected to have a material adverse effect on the Company’s consolidated results of operations, financialcondition or cash flows. However, the results of these matters cannot be predicted with certainty, and an unfavorable resolution of one ormore matters could have a material adverse effect on the Company’s consolidated results of operations, financial condition or cash flows.
Letters of Credit
The Company has obtained stand-by letters of credit totaling $1.9 million to satisfy conditions under two lease agreements. TheCompany is required to maintain a cash deposit of $1.9 million with the financial institution that issued the stand-by letter of credits, which isclassified as “Restricted cash” within the consolidated balance sheets as of December 31, 2018 and 2019 and March 31, 2020, respectively.
Other Matters
The Company enters into agreements with third parties in the ordinary course of business that may contain indemnification provisions.In the event that an indemnification claim is asserted, the Company’s liability, if any, would be limited by the terms of the applicableagreement. Historically, the Company has not incurred material costs to defend lawsuits or settle claims related to indemnification provisions.
11. Leases
The Company’s leasing activities primarily consists of real estate leases for its operations, including office space, the Company’sreconditioning facility and its physical retail location in Houston, the Company’s Sell Us Your Car centers, parking lots and other facilities. Thereal estate leases have terms ranging from six months to eight years. The Company also has leases for various types of equipment, whichare not material, individually or in the aggregate. The Company assesses whether each lease is an operating or finance lease at the leasecommencement date. The Company does not have any material leases, individually or in the aggregate, classified as a finance leasingarrangement.
The Company’s lease agreements do not contain any material residual value guarantees or material restrictive covenants. TheCompany does not have any significant leases that have not yet commenced but that create significant rights and obligations for theCompany.
The Company’s real estate leases often require it to make payments for maintenance in addition to rent as well as payments for realestate taxes and insurance. Maintenance, real estate taxes, and
F-25

Table of Contents
VROOM, INC.NOTES TO CONSOLIDATED FINANCIAL STATEMENTS
insurance payments are generally variable costs which are based on actual expenses incurred by the lessor. Therefore, these amounts arenot included in the consideration of the contract when determining the right-of-use asset and lease liability but are reflected as variable leaseexpenses.
Leases with an initial term of 12 months or less are not recorded on the Company’s consolidated balance sheet and expense for theseleases are recognized on a straight-line basis over the lease term.
Options to extend or terminate leases
Certain of the Company’s real estate leases include one or more options to renew, with renewal terms that can extend the lease termfrom one to five years. The exercise of lease renewal options is at the Company’s sole discretion. If it is reasonably certain that the Companywill exercise such options, the periods covered by such options are included in the lease term and are recognized as part of the Company’sright-of-use assets and lease liabilities. The depreciable life of assets and leasehold improvements are limited by the expected lease term,unless there is a transfer of title or purchase option reasonably certain of exercise.
Lease term and discount rate
As of March 31, 2020, the weighted-average remaining lease term and discount rate for the Company’s operating leases were 4.2years and 3.4%, excluding short-term operating leases.
As the rate implicit in the lease is generally not readily determinable for the Company’s operating leases, the discount rates used todetermine the present value of the Company’s lease liabilities are based on the Company’s incremental borrowing rate at the leasecommencement date and commensurate with the remaining lease term. The incremental borrowing rate for a lease is the rate of interest theCompany would have to pay to borrow on a collateralized basis over a similar term for an amount equal to the lease payments in a similareconomic environment. The Company determines its incremental borrowing rate based on a synthetic credit rating that was developed withthe assistance of a third party specialist.
F-26

Table of Contents
VROOM, INC.NOTES TO CONSOLIDATED FINANCIAL STATEMENTS
Lease costs and activity
The Company’s lease costs and activity for the three months ended March 31, 2020 were as follows (in thousands):
Three Months Ended
March 31, 2020 Lease Cost (unaudited) Operating lease cost $ 1,398 Short-term lease cost 884 Variable lease cost 529 Sublease income (237)
Net lease cost $ 2,574
Three Months Ended
March 31, 2020 Other information (unaudited) Cash paid for amounts included in the measurement of lease liabilities:
Operating cash flows from operating leases $ 1,427 Right-of-use assets obtained in exchange for operating lease liabilities $ 521
Maturity of Lease Liabilities
The maturity of the Company’s lease liabilities on an undiscounted cash flow basis and a reconciliation to the operating lease liabilitiesrecognized on the Company’s consolidated balance sheet as of March 31, 2020 were as follows (in thousands):
(unaudited) For remainder of 2020 $ 3,983 2021 5,022 2022 3,291 2023 3,138 2024 2,858 Thereafter 724
Total lease payments 19,016 Less: interest (1,380)
Present value of lease liabilities $ 17,636
Operating lease liabilities, current $ 4,724 Operating lease liabilities, noncurrent 12,912
Total operating lease liabilities $ 17,636
F-27

Table of Contents
VROOM, INC.NOTES TO CONSOLIDATED FINANCIAL STATEMENTS
Future minimum payments under non-cancelable operating leases with initial terms of one year or more consisted of the following as
of December 31, 2019 in accordance with ASC Topic 840 (in thousands): Year Ending December 31, 2020 $ 5,509 2021 4,909 2022 3,204 2023 3,026 2024 2,746 Thereafter 699
Total future minimum lease payments $20,093
In accordance with ASC Topic 840, rent expense was $5.7 million and $7.2 million for the years ended December 31, 2018 and 2019,respectively, and $1.5 million for the three months ended March 31, 2019. Certain of the Company’s lease agreements contain escalationclauses, and accordingly, the Company records the rent expense on a straight-line basis over the lease term. Deferred rent under ASC TopicASC 840 is recorded within “Accrued expenses” in the consolidated balance sheets.
12. Redeemable Convertible Preferred Stock and Stockholders’ Deficit
Redeemable Convertible Preferred Stock
The Company has eight outstanding series of redeemable convertible preferred stock (collectively the “Series Preferred”). Theauthorized, issued and outstanding shares, issue price, conversion price, liquidation preference, and carrying value of the Series Preferredwere as follows: As of December 31, 2018 (in thousands, except share and per share amounts)
Shares
authorized
Sharesissued andoutstanding
Issueprice
Per shareconversion
price Liquidationpreference
Carryingvalue
Series A 1,991,998 1,991,998 $ 3.22 $ 3.22 $ 6,419 $ 6,167 Series B 2,358,242 2,358,242 4.97 4.97 11,709 29,478 Series C 4,567,121 4,567,121 11.87 11.87 54,209 68,004 Series D 7,215,568 7,215,568 13.17 13.17 95,000 111,481 Series E 3,081,896 3,081,896 16.22 16.22 50,000 52,269 Series F 6,352,790 6,057,805 17.06 17.06 103,346 105,588 Series G 9,748,777 8,140,020 17.95 17.95 146,113 146,113
35,316,392 33,412,650 $ 466,796 $ 519,100
F-28

Table of Contents
VROOM, INC.NOTES TO CONSOLIDATED FINANCIAL STATEMENTS
As of December 31, 2019 (in thousands, except share and per share amounts)
Shares
authorized
Sharesissued andoutstanding
Issueprice
Per shareconversion
price Liquidationpreference
Carryingvalue
Series A 1,991,998 1,991,998 $ 3.22 $ 3.22 $ 6,419 $ 6,167 Series B 2,358,242 2,358,242 4.97 4.97 11,709 42,425 Series C 4,567,121 4,567,121 11.87 11.87 54,209 88,739 Series D 7,215,568 7,215,568 13.17 13.17 95,000 142,724 Series E 3,081,896 3,081,896 16.22 16.22 50,000 64,042 Series F 6,352,790 6,057,805 17.06 17.06 103,346 127,820 Series G 8,140,020 8,140,020 17.95 17.95 146,113 174,764 Series H 9,354,047 8,371,664 27.19 27.19 227,651 227,651
43,061,682 41,784,314 $ 694,447 $ 874,332
As of March 31, 2020 (in thousands, except share and per share amounts) (unaudited)
Shares
authorized
Sharesissued andoutstanding
Issueprice
Per shareconversion
price Liquidationpreference
Carryingvalue
Series A 1,991,998 1,991,998 $ 3.22 $ 3.22 $ 6,419 $ 6,167 Series B 2,358,242 2,358,242 4.97 4.97 11,709 42,425 Series C 4,567,121 4,567,121 11.87 11.87 54,209 88,739 Series D 7,215,568 7,215,568 13.17 13.17 95,000 142,724 Series E 3,081,896 3,081,896 16.22 16.22 50,000 64,042 Series F 6,352,790 6,057,805 17.06 17.06 103,346 127,820 Series G 8,140,020 8,140,020 17.95 17.95 146,113 174,764 Series H 9,354,047 9,354,047 27.19 27.19 254,365 254,365
43,061,682 42,766,697 $ 721,161 $ 901,046
During the years ended December 31, 2018 and 2019, the Company amended its Amended and Restated Certificate of Incorporation(the “COI”) to authorize the issuance of up to 9,748,777 shares of a new Series G Preferred Stock and up to 9,354,047 shares of a newSeries H Preferred Stock, respectively. Pursuant to stock purchase agreements entered into with certain accredited investors, the Companysold and issued an aggregate of 8,140,020 shares of Series G Preferred Stock and 8,371,664 shares of Series H Preferred Stock, inexchange for gross proceeds of $146.1 million and $227.7 million during the years ended December 31, 2018 and 2019, respectively. Theproceeds were used for general corporate purposes and business development. The Company incurred issuance costs of $0.2 million and$5.2 million during the years ended December 31, 2018 and 2019, respectively, in connection with the issuance of the Series G and Series HPreferred Stock.
On January 8, 2020, the Company completed an additional closing of its Series H Preferred Stock whereby it sold and issued anaggregate of 982,383 shares of Series H Preferred Stock in exchange for gross proceeds of $26.7 million. The proceeds will be used forgeneral corporate purposes and business development.
The Company classifies its Series B Preferred Stock, Series C Preferred Stock, Series D Preferred Stock, Series E Preferred Stock,Series F Preferred Stock, Series G Preferred Stock and
F-29

Table of Contents
VROOM, INC.NOTES TO CONSOLIDATED FINANCIAL STATEMENTS
Series H Preferred Stock (collectively the “Senior Preferred Stock”) as temporary equity within the Company’s consolidated balance sheetsbecause the instruments contain redemption rights. In accordance with ASC 480, Distinguishing Liabilities from Equity, the Company adjuststhe carrying values of the Senior Preferred Stock to their redemption values at the end of each reporting period if the instruments areconsidered probable of becoming redeemable. The carrying values of the Senior Preferred Stock are not adjusted below their initial carryingvalues.
The Company concluded that the Senior Preferred Stock were considered probable of becoming redeemable through November 2019and therefore recorded accretion to their redemption values of $13.0 million and $132.8 million during the years ended December 31, 2018and 2019, respectively and $18.0 million during the three months ended March 31, 2019. During December 2019, the Company assessedthat the Senior Preferred Stock are no longer probable of becoming redeemable due to a sufficiently high likelihood of an initial public offeringrequiring a conversion of the Preferred Stock into common stock and as a result the Company ceased accretion of the Senior PreferredStock to their redemption values.
The Company classifies its Series A Preferred Stock as temporary equity within the Company’s consolidated balance sheets becausethe instrument contains liquidation features, including a liquidation preference in the event of a deemed liquidation event, that are not solelywithin the Company’s control. The Company does not adjust the carrying value of the Series A Preferred Stock to its redemption valuebecause it is not probable that the Series A Preferred Stock will become redeemable.
The characteristics of the Series Preferred are as follows:
Voting
The holders of each share of the Series Preferred are entitled to one vote for each share of common stock into which such preferredstock is convertible at the time of the vote, subject to certain preferred stock class votes specified in the Company’s COI or as required bylaw. The holders of the Series Preferred and the Company’s common stock currently have the right to elect the Company’s Board ofDirectors (the “Board”) as follows:
(a) two directors elected by the holders of the Series B Preferred Stock, voting as a separate class,
(b) two directors elected by the holders of the Series C Preferred Stock, voting as a separate class,
(c) one director elected by the holders of the Series D Preferred Stock, voting as a separate class,
(d) one director elected by the holders of the Series G Preferred Stock, voting as a separate class; and
(e) all remaining directors elected by the holders of the Series Preferred and common stock, voting together as a single class on anas-if-converted to common stock basis.
Dividends
The holders of each share of the Senior Preferred Stock, in preference to the holders of the Series A Preferred Stock and commonstock, are entitled to receive dividends if and when declared by the Board, pari passu with the holders of each series of the Senior PreferredStock. The holders of each share of the Series A Preferred Stock are entitled to receive dividends in preference to the holders of commonstock.
As of March 31, 2020, no dividends have been declared or paid to the Company’s stockholders.
F-30

Table of Contents
VROOM, INC.NOTES TO CONSOLIDATED FINANCIAL STATEMENTS
Conversion
Each share of the Series Preferred is convertible into common stock, at any time, at its holder’s discretion, at the conversion pricethen in effect. The conversion price for each of the Series A Preferred Stock, Series B Preferred Stock, Series C Preferred Stock, Series DPreferred Stock, Series E Preferred Stock, Series F Preferred Stock, Series G Preferred Stock and Series H Preferred Stock is initially $3.22,$4.97, $11.87, $13.17, $16.22, $17.06, $17.95 and $27.19 per share, respectively (each subject to adjustments upon the occurrence ofcertain dilutive events).
All outstanding shares of the Series Preferred shall be automatically converted into common stock upon the consummation of a firm-commitment underwritten initial public offering of not less than $75.0 million of gross proceeds and at a price of at least $29.67 per share(subject to appropriate adjustment in the event of any stock dividend, stock split, combination or other similar recapitalization with respect tothe common stock) (a “Qualified IPO”).
All outstanding shares of the Series A Preferred Stock, Series B Preferred Stock, Series C Preferred Stock, Series D Preferred Stock,Series E Preferred Stock, Series F Preferred Stock and Series G Preferred Stock shall be automatically converted into common stock uponthe date and time, or the occurrence of an event, specified by vote or written consent of (i) at least a majority of the outstanding shares ofSeries B Preferred Stock (a “Series B Majority”) and (ii) the holders of at least two-thirds of the outstanding shares of Series C PreferredStock, voting as a single class, and the holders of at least sixty percent (60.0%) of the outstanding shares of Series D Preferred Stock, votingas a single class (the vote of each of the Series C and Series D Preferred Stock being referred to as the “Required Vote”).
All outstanding shares of the Series H Preferred Stock shall be automatically converted into common stock upon the date and time, orthe occurrence of an event, specified by vote or written consent of at least a majority of the outstanding shares of Series H Preferred Stock (a“Series H Vote”).
Liquidation Preference
In the event of a liquidation, dissolution or winding up of the Company, either voluntary or involuntary, or in the event of a deemedliquidation event, which is defined in the COI to include a change of control, holders of the Senior Preferred Stock are entitled to receive, inpreference to the holders of Series A Preferred Stock or common stock, an amount equal to the greater of (a) the respective series ofPreferred Stock’s original issue price, plus any declared and unpaid dividends and (b) the amount the holders would receive had theyconverted into common stock immediately prior to the liquidation event (such greater amount, the “Liquidation Amount”). If upon theoccurrence of such event, the assets and funds available for distribution are insufficient to pay the holders of the Senior Preferred Stock thefull amount to which they are entitled, then the entire funds and assets legally available for distribution shall be distributed ratably among theholders of the Senior Preferred Stock in proportion to the full amounts to which they would otherwise be entitled.
After payment in full of the Liquidation Amount to the holders of Senior Preferred Stock, holders of Series A Preferred Stock areentitled to receive, in preference to all holders of common stock, an amount equal to the greater of (i) the original issue price of the Series APreferred Stock, plus any declared and unpaid dividends and (ii) the amount the holders of Series A Preferred Stock would receive had theyconverted into common stock immediately prior to the liquidation event. If upon the occurrence of such event, the assets and funds availablefor distribution are insufficient to pay such
F-31

Table of Contents
VROOM, INC.NOTES TO CONSOLIDATED FINANCIAL STATEMENTS
holders the full amount to which they are entitled, then the entire remaining assets and funds legally available for distribution shall bedistributed ratably among the holders of the Series A Preferred Stock in proportion to the full amounts to which they would otherwise beentitled.
After payment in full of the liquidation preferences of the Series Preferred, any remaining assets shall be distributed ratably to theholders of common stock.
Redemption
Prior to November 2019, a Series B Majority could have required the Company to redeem all outstanding shares of the Series BPreferred Stock at any time on or after November 12, 2020. In the event of such Series B redemption request, each of the holders of SeriesC Preferred Stock, Series D Preferred Stock, Series E Preferred Stock, Series F Preferred Stock and Series G Preferred Stock could havealso requested redemption of all of such holder’s shares of Series C, Series D, Series E, Series F and Series G Preferred Stock (“tag alongrights”). In connection with the Company’s issuance of Series H Preferred Stock, such Series B redemption rights and associated tag alongrights of other preferred stockholders was eliminated.
If the Company does not consummate a Qualified IPO or a deemed liquidation event (as defined in the COI) on or prior December 22,2022, a majority of the holders of Series C Preferred Stock, Series D Preferred Stock, and Series E Preferred Stock then outstanding, votingtogether as a single class on an as-converted basis (the “Series C—E Majority”), may require (at any time from and after December 22, 2022and provided a minimum number of Series C through H preferred shares are outstanding as specified in the COI) the Company to redeem alloutstanding shares of Series C through H Preferred Stock held by such Series C—E Majority. The redemption price is defined as the greaterof the Liquidation Amount of the respective series of Preferred Stock and the respective fair market value of each series of Preferred Stock atthe time of redemption determined in accordance with the COI. In the event of a redemption by the Series C—E Majority, each other holderof Series C through Series H Preferred Stock may require the Company to redeem, on a pari passu basis, all of such holder’s shares ofSeries C through Series H Preferred Stock at the same redemption price.
Common Stock
On October 19, 2018 and December 5, 2019, the Company amended and restated the COI to increase the shares of common stockauthorized for issuance to 46,476,600 and 56,721,927, respectively. Each share of common stock entitles the holder to one vote on allmatters submitted to a vote of the Company’s stockholders.
Warrants
In connection with the offering of shares of Series B Preferred Stock, the Company issued warrants to an investor in return forproviding ongoing advisory services (“Series B Warrants”). The Series B Warrants allow the investor to purchase up to 80,568 shares ofcommon stock with an exercise price of $1.44 per share. The Series B Warrants vested in equal monthly installments through October 1,2017. The Series B Warrants expire upon the earlier of (i) November 12, 2024, (ii) the time immediately prior to the consummation of aninitial public offering of the Company, and (iii) the time immediately prior to the consummation of a deemed liquidation event.
In connection with the Term Loan Facility, the Company issued a warrant (the “Series F Preferred Stock Warrant”) in August 2017which allows the lender to purchase 294,985 shares of the Company’s
F-32

Table of Contents
VROOM, INC.NOTES TO CONSOLIDATED FINANCIAL STATEMENTS
Series F Preferred Stock with an exercise price of $17.06 per share. The warrant expires at the earlier of (i) August 11, 2027 and (ii) the thirdanniversary of an initial public offering. The fair value of the warrant on the issuance date was recorded as debt issuance costs for the TermLoan Facility with a corresponding amount recorded to “Other long-term liabilities” in the consolidated balance sheets. The warrant isclassified as a liability due to the contingent redemption features in the underlying preferred stock and is measured at fair value at eachreporting date. As of December 31, 2018 and 2019 and March 31, 2020, the estimated fair value of the Series F Preferred Stock Warrantwas $0.6 million, $1.4 million and $0.6 million, respectively.
13. Stock-based Compensation
On November 12, 2014, the Company adopted the 2014 Equity Incentive Plan (“the Plan”), which authorized the issuance of up to1,603,731 shares of common stock to employees, directors, and consultants of the Company, in the form of restricted stock, stockappreciation rights, and stock options. On September 20, 2016 and November 21, 2019, the Plan was amended to increase the number ofauthorized shares of common stock available for issuance to 6,231,730 and 8,731,730, respectively. As of December 31, 2019, there were2,564,539 shares available for future issuance under the Plan.
The amount and terms of grants under the Plan are determined by the Board. The stock options granted under the Plan generallyexpire within 10 years from the date of grant and generally vest over 4 years, at the rate of 25% on each first anniversary of the date of grantsubject to continued service.
Stock Options
The following table summarizes stock option activity for the years ended December 31, 2018 and 2019 and three months endedMarch 31, 2020:
Shares
WeightedAverageExercise
Price
WeightedAverage
RemainingContractual
Life Outstanding as of January 1, 2018 2,041,641 $ 6.93 8.57 Exercised (6,251) 7.42 Forfeited / cancelled (554,886) 7.03
Outstanding as of December 31, 2018 1,480,504 $ 6.89 7.47
Granted 1,751,225 8.62 Exercised (67,975) 6.83 Forfeited / cancelled (108,754) 7.11
Outstanding as of December 31, 2019 3,055,000 $ 7.89 8.28
Granted (unaudited) 210,250 20.92 Exercised (unaudited) (1,387) 8.42 Forfeited / cancelled (unaudited) (164,525) 8.61
Outstanding as of March 31, 2020 (unaudited) 3,099,338 $ 8.73 8.10
Vested and exercisable as of December 31, 2018 715,839 $ 6.85 7.47
Vested and exercisable as of December 31, 2019 1,232,705 $ 7.19 7.45
Vested and exercisable as of March 31, 2020 (unaudited) 1,415,937 $ 7.35 7.42
F-33

Table of Contents
VROOM, INC.NOTES TO CONSOLIDATED FINANCIAL STATEMENTS
The Company recognized $1.0 million and $2.6 million of stock-based compensation expense related to stock options during the
years ended December 31, 2018 and 2019, respectively and $0.8 million and $0.6 million for the three months ended March 31, 2019 and2020, respectively. As of December 31, 2018 and 2019 and March 31, 2020, the Company had $1.9 million, $5.2 million, and $5.4 million,respectively, of unrecognized stock-based compensation expense that is expected to be recognized over a weighted-average period of 1.7years, 2.6 years, and 2.8 years, respectively.
The Company estimates the fair value of stock options on the date of the grant using the Black-Scholes option pricing model. Each ofthe Black-Scholes inputs generally require significant judgment, including the assumptions discussed below.
• Given the absence of a publicly trading market, the Board considered various subjective factors to determine the fair value of theCompany’s common stock at each meeting at which awards were approved. These factors include, but are not limited to,contemporaneous third-party valuations of its common stock, the lack of marketability of common stock and the likelihood ofachieving a liquidity event such as an IPO or sale of the Company.
• The expected term represents the period that the Company’s stock options are expected to be outstanding and is determinedbased on the “simplified” method, as prescribed in SEC Staff Accounting Bulletin (SAB) No. 107.
• The risk-free interest rate is based on the interest rate payable on the U.S. Treasury securities with an equivalent expected term ofthe options.
• The Company determines the price volatility factor based on the historical volatilities of several publicly listed peer companies asthe Company does not have trading history for its common stock.
• The expected dividend yield assumption is based on the Company’s current expectations about its anticipated dividend policy.
There were no stock options granted during the year ended December 31, 2018. The grant date fair value of stock options grantedduring the year ended December 31, 2019 and the three months ended March 31, 2020 were estimated at the time of grant using the Black-Scholes option-pricing model and utilized the following weighted average assumptions:
Year Ended
December 31, 2019 Three Months Ended
March 31, 2020 (unaudited)Fair value of common stock (per share) $8.42 — $10.89 $20.92Expected term (in years) 6.1 5.9 — 6.3Risk-free interest rate 1.5% — 2.5% 1.7%Expected volatility 36.3% — 36.9% 36.3% — 36.6%Dividend yield — % — %
The weighted average fair value of stock options granted during the year ended December 31, 2019 and the three months endedMarch 31, 2020 were estimated to be $3.41 per share and $7.94 per share, respectively.
The aggregate intrinsic value of options exercised during the year ended December 31, 2018 was immaterial, and the aggregateintrinsic value of options outstanding and options exercisable as of December 31, 2018 was $2.3 million and $1.1 million, respectively. Theaggregate intrinsic value of
F-34

Table of Contents
VROOM, INC.NOTES TO CONSOLIDATED FINANCIAL STATEMENTS
options exercised during the year ended December 31, 2019 was $0.2 million, and the aggregate intrinsic value of options outstanding andoptions exercisable as of December 31, 2019 was $39.9 million and $16.9 million, respectively. The aggregate intrinsic value of optionsexercised during the three months ended March 31, 2020 was immaterial, and the aggregate intrinsic value of options outstanding andoptions exercisable as of March 31, 2020 was $44.8 million and $22.4 million, respectively.
RSUs
In December 2016, the Company granted 50,000 restricted stock units (RSUs) which cliff vest on the earlier of June 6, 2020 or aliquidity event, which includes a change in control, initial public offering, or dissolution of the Company. For each of the years endedDecember 31, 2018 and 2019, the Company recognized $0.1 million of stock-based compensation expense related to these RSUs. As ofDecember 31, 2019 and March 31, 2020, there were 50,000 unvested RSUs outstanding which have an immaterial amount of unrecognizedstock-based compensation.
In March 2019, the Company granted 154,000 RSUs to certain key management that vest upon continuous service periods rangingfrom 12 to 36-months and the achievement of a liquidity event, which includes a change of control or an initial public offering. The fair valueof the RSUs were determined to be $8.42 per share based on the estimated fair value the Company’s common stock on the grant date. TheCompany will commence recognition of compensation expense upon the occurrence of a qualifying liquidity event. Accordingly, no stock-based compensation expense was recorded for these RSUs for the year ended December 31, 2019 and the three months ended March 31,2019 and 2020. As of December 31, 2019 and March 31, 2020, there were 154,000 unvested RSUs outstanding which have $1.3 million ofunrecognized stock-based compensation.
In February 2020, the Company granted 108,495 RSUs to certain key management that vest upon continuous service periods rangingfrom 18 to 48-months and the achievement of a liquidity event, which includes a change of control or an initial public offering. The fair valueof the RSUs were determined to be $20.92 per share based on the estimated fair value the Company’s common stock on the grant date. TheCompany will commence recognition of compensation expense upon the occurrence of a qualifying liquidity event. Accordingly, no stock-based compensation expense was recorded for these RSUs for the three months ended March 31, 2020. As of March 31, 2020, there were101,139 unvested RSUs outstanding which have $2.1 million of unrecognized stock-based compensation.
In February 2020, the Company granted 183,891 RSUs to its chief executive officer that vest upon the achievement of performance-based conditions, which includes Revenue and EBITDA targets, and the achievement of a liquidity event, which includes a change of controlor an initial public offering. The fair value of the RSUs were determined to be $20.92 per share based on the estimated fair value theCompany’s common stock on the grant date. The Company will commence recognition of compensation expense upon the occurrence of aqualifying liquidity event. Accordingly, no stock-based compensation expense was recorded for these RSUs for the three months endedMarch 31, 2020. As of March 31, 2020, there were 183,891 unvested RSUs outstanding which have $3.8 million of unrecognized stock-based compensation.
Certain of the Company’s RSU grants are subject to acceleration upon a change of control or termination within 12 months, and upondeath, disability, retirement and certain “good leaver” circumstances.
F-35

Table of Contents
VROOM, INC.NOTES TO CONSOLIDATED FINANCIAL STATEMENTS
RSAs
During the years ended December 31, 2014 and 2015, the Board approved the grant of 2,375,937 shares of restricted common stockawards (the “RSAs”). As of December 31, 2019 and March 31, 2020, 2,239,503 shares are fully vested and 136,434 shares remain subject torepurchase, at the Company’s option, until the earlier of (i) the 10-year anniversary from original issuance, and (ii) a liquidity event such as achange in control, initial public offering, or dissolution of the Company. Certain of the RSAs also contain a market condition as portions of therepurchase right expire based on the Company achieving specific returns for the Series B preferred stockholders at the time of the liquidityevent. The repurchase, if elected, would be at the estimated fair value of Company’s common stock on the grant date. The repurchase rightis deemed to be an in-substance service period for awards that also contain performance conditions. The liquidity events are not probableuntil they occur and the Company will record unrecognized compensation expense at the time of a liquidity event if such event were to occur.
Holders of the RSAs have the ability to early exercise the awards prior to vesting and the Company has the right to repurchase earlyexercised restricted stock without transferring any appreciation to the employee if the employee terminates employment before the end of theoriginal vesting period.
The RSAs were issued to certain directors and employees of the Company in exchange for recourse promissory notes with theaggregate price of the underlying shares as the principal amount. The Company deemed all such recourse promissory notes tobe non-substantive in nature and therefore the notes are not reflected in the Company’s consolidated balance sheets. Rather, the noteissuances and the share purchases are accounted for as share option grants. The Company recognizes proceeds from the repayment of thepromissory notes as a liability until the repurchase features expire.
The following table summarizes the activity related to the Company’s RSAs for the years ended December 31, 2018 and 2019 and thethree months ended March 31, 2020: Shares Unvested at January 1, 2018 222,129 Vested (67,309)
Unvested at December 31, 2018 154,820
Vested (18,386)
Unvested at December 31, 2019 136,434
Vested (unaudited) —
Unvested at March 31, 2020 (unaudited) 136,434
For the year ended December 31, 2018, the Company recognized $0.1 million of stock-based compensation expense related to theRSAs. For the year ended December 31, 2019, the expense related to the RSA’s was immaterial. As of December 31, 2019 and March 31,2020, the Company has $0.2 million of unrecognized stock-based compensation expense related to the RSAs which will be recognized uponcompletion of a liquidity event.
F-36

Table of Contents
VROOM, INC.NOTES TO CONSOLIDATED FINANCIAL STATEMENTS
14. Financial Instruments and Fair Value Measurements
U.S. GAAP defines fair value as the price that would be received from selling an asset or paid to transfer a liability in the principal ormost advantageous market for the asset or liability in an orderly transaction between market participants at the measurement date. Theseestimates are subjective in nature and involve uncertainties and matters of judgment, and therefore cannot be determined with precision.U.S. GAAP establishes a fair value hierarchy which requires an entity to maximize the use of observable inputs and minimize the use ofunobservable inputs when measuring fair value and establishes the following three levels of inputs that may be used to measure fair value:
Level 1—Quoted prices in active markets for identical assets or liabilities
Level 2—Observable inputs other than Level 1 prices such as quoted prices for similar assets or liabilities; quoted market prices inmarkets that are not active; or model-derived valuations or other inputs that are observable or can be corroborated by observablemarket data for substantially the full term of the assets or liabilities
Level 3—Unobservable inputs that are supported by little or no market activity and that are significant to the fair value of the assets orliabilities
Items Measured at Fair Value on a Recurring Basis
The following tables present the Company’s financial assets and liabilities measured at fair value on a recurring basis:
` As of December 31, 2018 Level 1 Level 2 Level 3 Total (in thousands) Financial Assets Cash and cash equivalents:
Money market funds $72,586 $ — $ — $72,586
Total financial assets $72,586 $ — $ — $72,586
Financial Liabilities Other long-term liabilities:
Series F Preferred Stock Warrant — — 634 634
Total financial liabilities $ — $ — $ 634 $ 634
` As of December 31, 2019 Level 1 Level 2 Level 3 Total (in thousands) Financial Assets Cash and cash equivalents:
Money market funds $70,059 $ — $ — $ —
Total financial assets $70,059 $ — $ — $ —
Financial Liabilities Other long-term liabilities:
Series F Preferred Stock Warrant — — 1,403 1,403
Total financial liabilities $ — $ — $ 1,403 $ 1,403
F-37

Table of Contents
VROOM, INC.NOTES TO CONSOLIDATED FINANCIAL STATEMENTS
` As of March 31, 2020
Level 1 Level 2 Level 3 Total (in thousands) (unaudited) Financial Assets Cash and cash equivalents:
Money market funds $40,021 $ — $ — $ —
Total financial assets $40,021 $ — $ — $ —
Financial Liabilities Other long-term liabilities:
Series F Preferred Stock Warrant — — 613 613
Total financial liabilities $ — $ — $ 613 $ 613
The following table presents a reconciliation of the Series F Preferred Stock Warrant, which is measured at fair value using Level 3inputs:
Series FPreferred
StockWarrant
(in thousands) Balance as of January 1, 2018 $ 460 Change in fair value 174
Balance as of December 31, 2018 $ 634
Change in fair value 769
Balance as of December 31, 2019 $ 1,403
Change in fair value (unaudited) (790)
Balance as of March 31, 2020 (unaudited) $ 613
The change in fair value of the Series F Preferred Stock Warrant is recorded in “Other (income) expense, net” in the consolidatedstatements of operations. The Company estimates the fair value of the Series F Preferred Stock Warrant based on the Black-Scholes option-pricing model which utilizes the value of shares sold in the Company’s latest preferred stock financing and allocates the estimated equityvalue of the Company to each class of the Company’s outstanding securities using an option-pricing back-solve model.
Fair Value of Financial Instruments
The carrying amounts of restricted cash, accounts receivable, accounts payable and accrued liabilities approximate fair value due totheir short-term nature. The carrying value of the Vehicle Floorplan Facility was determined to approximate fair value due to its short-termduration and variable interest rate that approximates prevailing interest rates as of each reporting period.
F-38

Table of Contents
VROOM, INC.NOTES TO CONSOLIDATED FINANCIAL STATEMENTS
The Term Loan Facility was repaid in full in December 2019. The fair value of the Term Loan Facility as of December 31, 2018, which
was not carried at fair value on the consolidated balance sheets, was determined using Level 2 inputs. The carrying value and fair value ofthe Term Loan Facility as of December 31, 2018 were as follows:
December 31, 2018 (in thousands) Carrying value, net of unamortized debt issuance costs $ 24,302 Fair value $ 25,045
15. Segment Information
The Company has three reportable segments: Ecommerce, TDA, and Wholesale. No operating segments have been aggregated toform the reportable segments. The Company determined its operating segments based on how the chief operating decision maker (“CODM”)reviews the Company’s operating results in assessing performance and allocating resources. The CODM reviews revenue and gross profitfor each of the reportable segments. Gross profit is defined as revenue less cost of sales incurred by the segment. The CODM does notevaluate operating segments using asset information as these are managed on an enterprise wide group basis. Accordingly, the Companydoes not report segment asset information. As of December 31, 2018 and 2019 and March 31, 2020, the Company did not have any assetslocated outside of the United States.
The Ecommerce reportable segment represents retail sales of used vehicles through the Company’s ecommerce platform and feesearned on sales of value-added products associated with those vehicle sales. The TDA reportable segment represents retail sales of usedvehicles from TDA and fees earned on sales of value-added products associated with those vehicle sales. The Wholesale reportablesegment represents sales of used vehicles through wholesale auctions.
Information about the Company’s reportable segments are as follows (in thousands):
Year Ended December 31, 2018 Ecommerce TDA Wholesale Consolidated Revenues from external customers $ 301,172 $379,743 $174,514 $ 855,429 Gross profit $ 22,425 $ 35,125 $ 3,257 $ 60,807
Year Ended December 31, 2019 Ecommerce TDA Wholesale Consolidated Revenues from external customers $ 588,114 $390,243 $213,464 $1,191,821 Gross profit $ 32,127 $ 25,392 $ 340 $ 57,859
Three Months Ended March 31, 2019 (unaudited) Ecommerce TDA Wholesale Consolidated Revenues from external customers $ 89,855 $ 93,085 $ 52,119 $ 235,059 Gross profit $ 5,754 $ 6,077 $ 181 $ 12,012
F-39

Table of Contents
VROOM, INC.NOTES TO CONSOLIDATED FINANCIAL STATEMENTS
Three Months Ended March 31, 2020 (unaudited) Ecommerce TDA Wholesale Consolidated Revenues from external customers $ 233,172 $87,022 $ 55,578 $ 375,772 Gross profit $ 14,267 $ 5,412 $ (1,292) $ 18,387
The reconciliation between reportable segment gross profit to consolidated loss before provision for income taxes is as follows (inthousands):
Year Ended
December 31, Three Months Ended
March 31, 2018 2019 2019 2020 (unaudited) Segment gross profit $ 60,807 $ 57,859 $ 12,012 $ 18,387 Selling, general and administrative expenses 133,842 184,988 36,583 58,380 Depreciation and amortization 6,857 6,019 1,533 966 Interest expense 8,513 14,596 2,718 2,826 Interest Income (3,135) (5,607) (1,849) (1,956) Other (income) expense, net (321) 673 63 (823)
Loss before provision for income taxes $ (84,949) $(142,810) $(27,036) $(41,006)
16. Income Taxes
The components of the provision for income taxes are as follows for the years ended December 31, 2018 and 2019:
Year Ended
December 31, 2018 2019 (in thousands) Current:
Federal $ — $ — State and local 229 168
Total current tax expense 229 168 Deferred tax (benefit):
Federal — — State and local — —
Total deferred tax (benefit) — —
Provision for income taxes $ 229 $ 168
The provision for income taxes of $0.2 million for each of the years ended December 31, 2018 and 2019 is due to the state taxramifications of the Company’s operations. The provision for income taxes for the three months ended March 31, 2019 and 2020 wasimmaterial.
F-40

Table of Contents
VROOM, INC.NOTES TO CONSOLIDATED FINANCIAL STATEMENTS
A reconciliation of the provision for income taxes at the statutory rate to the amount reflected in the consolidated statements of
operations is as follows:
Year Ended
December 31, 2018 2019 (in thousands) Income taxes at statutory rate $(17,839) $(29,990) State income taxes, net of federal benefit 180 125 Permanent differences 229 772 Change in valuation allowance 17,756 30,051 Other (97) (790)
Provision for income taxes $ 229 $ 168
Significant components of the Company’s deferred tax assets and liabilities are as follows: As of December 31, 2018 2019 (in thousands) Deferred income tax assets:
Net operating loss carryforwards $ 41,510 $ 66,879 Inventory reserves 3,899 5,911 Stock-based compensation 719 840 Accrued Expense — 867 Depreciation — 114 Other 98 596
Total deferred tax assets 46,226 75,207 Less: valuation allowance (44,906) (74,959)
Net deferred tax assets 1,320 248 Deferred tax liabilities:
Intangible amortization (866) (248) Depreciation (454) —
Net deferred tax liabilities (1,320) (248) Net deferred income taxes $ — $ —
In assessing the realizability of deferred tax assets, the Company considers whether it is more likely than not that certain deferred taxassets will not be realized. The ultimate realization of deferred tax assets is dependent upon the generation of future taxable income in thosespecific jurisdictions prior to the dates on which such net operating losses expire. The Company maintained a full valuation allowance againstits net deferred tax assets as of December 31, 2018 and December 31, 2019, respectively, because the Company has determined that is itmore likely than not that these assets will not be fully realized based on a current evaluation of expected future taxable income and theCompany is in a cumulative loss position.
As of December 31, 2019, the Company has net operating loss carryforwards for U.S. federal income tax purposes of $126.2 million,which expire from 2034 through 2037 and $186.6 million, which do not expire. The Company has net operating loss carryforwards for stateincome tax purposes of $22.3 million, which expire from 2034 through 2039.
F-41

Table of Contents
VROOM, INC.NOTES TO CONSOLIDATED FINANCIAL STATEMENTS
The Internal Revenue Code (IRC) Section 382 provides for a limitation of the annual use of net operating loss and tax credit
carryforwards following certain ownership changes (as defined by the IRC Section 382) that limits the Company’s ability to utilize thesecarryforwards. The Company completed a Section 382 study to determine the applicable limitation, if any. It was determined that theCompany has undergone three ownership changes. There was a change in each of July 2013, November 2014 and July 2015 whichsubstantially limit the use of the NOLs generated before the change in control. The Company has not identified any uncertain tax positions asof December 31, 2018 and 2019.
Tax Cuts and Jobs Act
On December 22, 2017, the U.S. federal income tax reform legislation known as the Tax Cuts and Jobs Act (“TCJA”) was signed intolaw. The TCJA resulted in fundamental changes to the Internal Revenue Code of 1986, as amended. The TCJA, among other things,includes changes to U.S. federal tax rates, additional limitations on the deductibility of interest, and allows for the expensing of capitalexpenditures. There was no material impact to the Company’s effective tax rate due to the full valuation allowance position. The Company’snet deferred tax assets and liabilities were revalued at the newly enacted U.S. corporate rate and the impact of the reduced corporate ratewas fully offset by a reduction in the valuation allowance.
17. Net Loss Per Share
The following table sets forth the computation of basic and diluted net loss per share attributable to common stockholders:
Year Ended
December 31, Three Months Ended
March 31, (in thousands, except share and per share amounts) 2018 2019 2019 2020 (unaudited) Net loss $ (85,178) $ (142,978) $ (27,139) $ (41,059) Accretion of redeemable convertible preferred stock (13,036) (132,750) (17,964) —
Net loss attributable to common stockholders $ (98,214) $ (275,728) $ (45,103) $ (41,059)
Weighted-average number of shares outstanding used to computenet loss per share attributable to common stockholders, basic anddiluted 4,270,389 4,302,981 4,289,415 4,235,728
Net loss per share attributable to common stockholders, basic anddiluted $ (23.00) $ (64.08) $ (10.51) $ (9.69)
F-42

Table of Contents
VROOM, INC.NOTES TO CONSOLIDATED FINANCIAL STATEMENTS
The following potentially dilutive shares were not included in the calculation of diluted shares outstanding for the periods presented as
the effect would have been anti-dilutive:
Year Ended
December 31, Three Months Ended
March 31, 2018 2019 2019 2020 (unaudited) Redeemable convertible preferred stock 33,412,650 41,784,314 33,412,650 42,766,697 Warrants 80,568 80,568 80,568 80,568 Stock options 1,480,504 3,055,000 2,860,504 3,099,338 Restricted stock awards 1,936,607 1,624,691 1,936,607 1,624,691 Restricted stock units 50,000 204,000 204,000 489,030
Total 36,960,329 46,748,573 38,494,329 48,060,324
Unaudited Pro Forma Net Loss Per Share
The unaudited pro forma basic and diluted net loss per share attributable to common stockholders has been computed to give effectof (i) a 2-for-1 stock split of the Company’s common stock and (ii) to the assumed automatic conversion of the Company’s redeemableconvertible preferred stock into shares of common stock using the if converted method upon the completion of a qualifying IPO as though theconversion had occurred as of the beginning of the period.
The following table sets forth the computation of the Company’s unaudited pro forma basic and diluted net loss per share attributableto common stockholders for the periods indicated:
Year Ended
December 31, Three Months Ended
March 31, 2019 2020 (in thousands, except share and per share amounts) (unaudited) (unaudited) Numerator: Net loss attributable to common stockholders $ (275,728) $ (41,059) Accretion of redeemable convertible preferred stock 132,750 —
Pro forma net loss per share attributable to common stockholders $ (142,978) $ (41,059)
Denominator: Weighted-average shares used in computing net loss per share attributable to common
stockholders after giving effect to a 2-for-1 stock split, basic and diluted 8,605,962 8,471,456
Pro forma adjustment to reflect a 2-for-1 stock split and the assumed conversion ofredeemable convertible preferred stock 83,568,628 85,533,394
Weighted-average shares used in computing pro forma net loss per share after givingeffect to a 2-for-1 stock split, basic and diluted 92,174,590 94,004,850
Pro forma net loss per share, basic and diluted $ (1.55) $ (0.44)
18. Related Party Transactions
Management Services Agreement
In July 2015, the Company entered into a management services agreement (“MSA”) with Catterton Management Company, L.L.C.(“Catterton Management”), an affiliate of L Catterton
F-43

Table of Contents
VROOM, INC.NOTES TO CONSOLIDATED FINANCIAL STATEMENTS
(“Catterton”), a holder of more than 5% of the Company’s outstanding capital stock, pursuant to which Catterton Management agreed toprovide consulting services on certain business and financial matters. Under the MSA, the Company pays Catterton Management an annualfee of $0.3 million until the expiration of the MSA upon the earlier of (i) termination by mutual consent of the parties and (ii) such time thatCatterton and/or its affiliates cease to be one of the Company’s stockholders. For the years ended December 31, 2018, 2019 and 2020,payments of the annual fees were waived.
AutoNation Reconditioning Agreement
In January 2019, the Company entered into a vendor agreement (“Vendor Agreement”) with AutoNation, Inc. (“AutoNation”), anaffiliate of Auto Holdings, Inc., a holder of more than 5% of the Company’s outstanding capital stock, pursuant to which AutoNation willprovide certain reconditioning and repair services of vehicles owned by the Company. Amounts due under the Vendor Agreement for partssupplied and services performed by AutoNation become due and payable as they accrue. The Vendor Agreement may be terminated byeither party (i) upon five days’ written notice, in case of a material breach of the agreement or (ii) upon 30 days’ written notice with or withoutcause. For the year ended December 31, 2019, the Company incurred $1.1 million of costs under the Vendor Agreement. For the threemonths ended March 31, 2019 and 2020, the Company incurred $0.0 million and $0.1 million of costs, respectively. The Vendor Agreementwas terminated in February 2020.
19. Subsequent Events
The Company has evaluated subsequent events through March 12, 2020, the date that these consolidated financial statements wereavailable to be issued and through May 12, 2020 with respect to the matters discussed in Note 2 under Liquidity and Management’s Plan.
Subsequent Events (unaudited)
The Company evaluated all subsequent events through June 5, 2020, the date the consolidated financial statements as of and foreach of the two years in the periods ended December 31, 2018 and 2019 were available to be reissued and the date the unaudited interimconsolidated financial statements as of March 31, 2020 and for the three months ended March 31, 2019 and 2020 were available to bereissued.
In May 2020, the Company entered into an agreement with Rocket Auto LLC and certain of its affiliates (collectively, “Rocket”)providing for the launch of an e-commerce platform under the “Rocket Auto” brand for the marketing and sale of vehicles directly toconsumers (the “RA Agreement”). The Company will list its used vehicle inventory for sale on the Rocket Auto platform, but all sales of theCompany’s inventory will be conducted through the Company’s platform. Rocket Auto is expected to launch publicly during the third quarterof the year ended December 31, 2020 and, during the term of the RA Agreement, Rocket will ensure that not less than a minimumpercentage of all used vehicles sold or leased through the platform on a monthly basis will be Vroom inventory. The Company will pay Rocketa combination of cash and stock for vehicle sales made through the platform, including upfront equity consisting of 183,870 shares of ourcommon stock that were issued upon execution of the RA Agreement, and the potential issuance to Rocket of up to an additional 8,641,914shares of common stock, in each case after giving effect to a 2-for-1 stock split, over a four-year period based upon sales volume of Vroominventory through the Rocket Auto platform.
In May 2020, the Company’s MSA with Catterton Management was terminated.
F-44

Table of Contents
“The experience of shopping online allowed me to take all the time I needed to do research and compare vehicles without any sales pressure…The sales process was organized; the price was good; and Vroom delivered on its promises.” -sandra r. Pensacola, FL

Table of Contents
vroom