Proposed Integrated Industrial Township “Orange Smart City ...
756
-
Upload
khangminh22 -
Category
Documents
-
view
1 -
download
0
Transcript of Proposed Integrated Industrial Township “Orange Smart City ...


Environmental Impact Assessment Report
for
Proposed Integrated Industrial Township
“Orange Smart City”, Taluka Pen, District Raigad
Submitted to
Expert Appraisal Committee (EAC)
July 2018
Environmental consultant:
Building Environment (India) Pvt. Ltd
Proponent:
M/s. Orange Smart City
Infrastructure Pvt. Ltd. (OSCIPL)

Final EIA Report – Orange Smart City, Pen, Raigad July 2018
2
BE/EIA-OSC/002

Final EIA Report – Orange Smart City, Pen, Raigad July 2018
3
BE/EIA-OSC/002

Final EIA Report – Orange Smart City, Pen, Raigad July 2018
4
BE/EIA-OSC/002

Final EIA Report – Orange Smart City, Pen, Raigad July 2018
5
BE/EIA-OSC/002
TABLE OF CONTENTS
1. INTRODUCTION ........................................................................................................... 28
1.1 Purpose of the Report .................................................................................................. 28
1.2 Identification of project ............................................................................................... 28
1.3 Identification of Project Proponent .............................................................................. 30
1.4 Brief of the Project ...................................................................................................... 30
1.5 Litigation(S)/ Orders Passed by Any Court of Law/ Any Statutory Authority against the
Project ................................................................................................................................... 32
1.6 Scope of the EIA Study ............................................................................................... 32
2. PROJECT DESCRIPTION ............................................................................................ 35
2.1 Type of the Project ...................................................................................................... 35
2.2 Land Area Details ....................................................................................................... 37
2.3 Demand Assessment ................................................................................................... 37
2.4 Product Mix Assessment ............................................................................................. 38
2.5 Site Description .......................................................................................................... 38
2.6 Site Settings and Analysis ........................................................................................... 41
2.7 Site Description .......................................................................................................... 42
2.8 Site Connectivity......................................................................................................... 46
2.9 Traffic Analysis & Forecast ........................................................................................ 53
2.10 Project Overview ..................................................................................................... 54
2.11 Development Concept ............................................................................................. 54
2.12 Proposed Concept Master Plan and basis for the location of the land parcels ........... 56
2.13 Area and the population details ................................................................................ 60
2.14 Population projection and Employment Generation ................................................. 67
2.15 Proposed Industrial Area ......................................................................................... 68
2.16 Proposed Commercial Area ..................................................................................... 72
2.17 Proposed Residential Area ....................................................................................... 73
2.18 Proposed Amenities & Utilities ............................................................................... 73
2.19 Parks and landscaped areas ...................................................................................... 76
2.20 Proposed Common use buildings in OSC ................................................................ 77
2.21 Resource requirements – Construction phase ........................................................... 77
2.22 Resource requirements – Operation Phase ............................................................... 79

Final EIA Report – Orange Smart City, Pen, Raigad July 2018
6
BE/EIA-OSC/002
2.23 Available Infrastructure and Proposed Infrastructure ............................................... 80
2.24 Storm water drainage system, rain water harvesting and storage facilities ................ 93
2.25 Power Infrastructure ................................................................................................ 96
2.26 Street Lighting system ........................................................................................... 100
2.27 Smart Initiatives .................................................................................................... 100
2.28 Smart Grid ............................................................................................................. 100
2.29 Solid waste handling system .................................................................................. 101
2.30 HVAC Infrastructure/District Cooling System ....................................................... 114
2.31 IT & telecommunication ........................................................................................ 114
2.32 Telephone and Internet / Optical Fiber Network .................................................... 114
2.33 Proposed ICT Infrastructure .................................................................................. 116
2.34 Other proposed smart Infrastructure ....................................................................... 116
2.35 Summary of Utilities ............................................................................................. 117
2.36 Traffic and Transportation Plan ............................................................................. 117
2.37 Connectivity to Orange Smart City (Existing) ........................................................ 118
2.38 Parking Proposals .................................................................................................. 120
2.39 Project Implementation and Scheduling ................................................................. 124
2.40 Safety and Security Plan of Orange Smart City ...................................................... 129
2.41 Solar PV installation .............................................................................................. 131
3. DESCRIPTION OF THE ENVIRONMENT ............................................................... 132
3.1 Study area and period ................................................................................................ 132
3.2 Methodology ............................................................................................................. 132
3.3 Establishment of Baseline for Valued Environmental Components............................ 132
3.4 Physical Environment ............................................................................................... 133
3.5 Land-use ................................................................................................................... 136
3.6 Climate and Meteorology .......................................................................................... 143
3.7 Ambient Air Quality ................................................................................................. 154
3.8 Ambient Noise Quality ............................................................................................. 163
3.9 Water quality ............................................................................................................ 168
3.10 Soil quality ............................................................................................................ 174
3.11 Ecology and biodiversity ....................................................................................... 181
3.12 Socio-Economy ..................................................................................................... 223

Final EIA Report – Orange Smart City, Pen, Raigad July 2018
7
BE/EIA-OSC/002
4. ANTICIPATED ENVIRONMENTAL IMPACTS AND MITIGATION MEASURES
239
4.1 Identification of Impacts ........................................................................................... 239
4.2 Evaluation of Impact ................................................................................................. 244
4.3 Impacts and Mitigations – Construction Phase .......................................................... 247
4.4 Impacts and Mitigations – Operations Phase ............................................................. 272
5. ANALYSIS OF ALTERNATIVES ............................................................................... 304
5.1 Alternatives Considered for Selection of Site ............................................................ 304
5.2 Description of each alternative .................................................................................. 304
5.3 Suitability / Justification of Site for Development of Proposed Project ...................... 311
6. ENVIRONMENTAL MONITORING PROGRAMME .............................................. 313
6.1 Objectives of Environmental Monitoring Plan ........................................................... 313
6.2 Suggested Environmental Monitoring Plan ............................................................... 314
6.3 Data Analysis ............................................................................................................ 318
6.4 Reporting Schedule ................................................................................................... 318
6.5 Emergency Procedures/Corrective Measures ............................................................. 318
6.6 Detailed Budgetary Provisions .................................................................................. 319
7. ADDITIONAL STUDIES ............................................................................................. 320
7.1 Public hearing ........................................................................................................... 320
7.2 Risk Assessment and Disaster Management Plan ...................................................... 332
8. PROJECT BENEFITS .................................................................................................. 333
8.1 Socio –Economic Welfare Measures ......................................................................... 333
8.2 Corporate Environmental Responsibility ................................................................... 334
9. ENVIRONMENTAL MANAGEMENT PLAN ........................................................... 336
9.1 Introduction .............................................................................................................. 336
9.2 Environment Cell ...................................................................................................... 336
9.3 Applicable Environment and Social Legislations ....................................................... 337
9.4 Suggested Management and Monitoring Plans .......................................................... 338
9.5 Environment Management Plan (EMP) ..................................................................... 338
9.6 Green Belt Development Plan ................................................................................... 355
9.7 Cost of the mitigation measures ................................................................................ 374
9.8 Environmental Management Cell .............................................................................. 376
10. SUMMARY AND CONCLUSION ............................................................................ 379

Final EIA Report – Orange Smart City, Pen, Raigad July 2018
8
BE/EIA-OSC/002
10.1 Introduction ........................................................................................................... 379
10.2 Project Description ................................................................................................ 380
10.3 Description of the Environment ............................................................................. 381
10.4 Anticipated Environmental Impacts and Mitigation Measures................................ 390
10.5 Environmental Management Plan .......................................................................... 407
10.6 Environmental Management Cell ........................................................................... 409
10.7 Conclusion ............................................................................................................ 412
11. DISCLOSURE OF CONSULTANTS ........................................................................ 413
LIST OF FIGURES
Figure 1-1-1: Location Map –Integrated Industrial Township ............................................. 32
Figure 2-1: Distribution of Industrial Demand Assessment .................................................. 38
Figure 2-2: Location on google map ...................................................................................... 40
Figure 2-3: Elevations and Slopes at T1 ................................................................................. 42
Figure 2-4: Elevations and Slopes at T2 ................................................................................. 43
Figure 2-5: Elevations and Slopes at T3 ................................................................................. 44
Figure 2-6: Elevations and Slopes at T4 ................................................................................. 44
Figure 2-7: Site Photograph .................................................................................................... 46
Figure 2-8: Site Connectivity .................................................................................................. 47
Figure 2-9: Road network in site region ................................................................................. 49
Figure 2-10: Figure showing Mumbai Suburban Rail Network ........................................... 50
Figure 2-11: Map showing nearby air connectivity from site ................................................ 52
Figure 2-12: Map showing nearby ports from site ................................................................. 53
Figure 2-13: Images showing the current scenario of the road network of NH 66 and SH 88
respectively 54
Figure 2-14: Concept Master Plan and Zoning ...................................................................... 59
Figure 2-15: Layout plans for T1 land parcel ........................................................................ 61
Figure 2-16: Layout plans for T2 land parcel ........................................................................ 62
Figure 2-17: Layout plans for T3 land parcel ........................................................................ 63
Figure 2-18: Layout plans for T4 land parcel ........................................................................ 64
Figure 2-19: Type of industries in T1 ..................................................................................... 70
Figure 2-20: Types of industries in T2.................................................................................... 71

Final EIA Report – Orange Smart City, Pen, Raigad July 2018
9
BE/EIA-OSC/002
Figure 2-21: Type of industries in T3 ..................................................................................... 72
Figure 2-22: Proposed CETP site ........................................................................................... 74
Figure 2-23: Proposed land fill location ................................................................................. 75
Figure 2-24: Water supply infrastructure .............................................................................. 82
Figure 2-25: Sewage treatment infrastructure details ........................................................... 86
Figure 2-26: Water balance diagram ..................................................................................... 87
Figure 2-27: Storm water channels ........................................................................................ 95
Figure 2-28: Proposed electrical infrastructure ..................................................................... 99
Figure 2-29: Primary waste collection bins and codes ......................................................... 106
Figure 2-30 : Waste Processing Centre ................................................................................ 107
Figure 2-31: Map depicting solid waste infrastructure ....................................................... 108
Figure 2-32: Bus Transit Services......................................................................................... 120
Figure 2-33: Bicycle Sharing Services .................................................................................. 121
Figure 2-34: Map depicting road network related infrastructure ...................................... 123
Figure 3-1: Hydrogeology, Raigad district, Maharashtra (Source: CGWB report, Raigad
District) 135
Figure 3-2: IRS Resourcesat-2 L4FMX Image of the Study Area ...................................... 138
Figure 3-3: Flowchart of simplified methodology ................................................................ 139
Figure 3-4: land use/land cover map of the study area ........................................................ 140
Figure 3-5: Distribution of LU/LC in 15 Km Radius Area.................................................. 142
Figure 3-6: Wind rose for the period March -2014 to May-2014 –IMD Murud................. 144
Figure 3-7: Wind rose for the period March -2014 to May-2014 –IMD Murud................. 145
Figure 3-8: Wind rose for the month of March 2014 (IMD station–Murud) ......... 147
Figure 3-9: Wind class frequency distribution chart of IMD Murud (March-2014).......... 147
Figure 3-10: Wind rose for the month of April -2014 (IMD Murud) .................................. 147
Figure 3-11: Wind class frequency distribution chart of IMD Murud (April-2014) .......... 147
Figure 3-12: Wind rose for the month of May 2014 (IMD station –Murud) .... 148
Figure 3-13: Wind class frequency distribution chart IMD Murud (May -2014) .............. 148
Figure 3-14: Seasonal wind pattern (March 2015 – May 2015)........................................... 149
Figure 3-15: Wind class frequency distribution (March 2015 – May 2015) ....................... 150
Figure 3-16: Site specific wind rose (March 2015) ............................................................... 152
Figure 3-17: Wind class frequency distribution (March -2015) .......................................... 152
Figure 3-18: Site specific wind rose (April 2015) ................................................................. 152
Final EIA Report – Orange Smart City, Pen, Raigad July 2018
10
BE/EIA-OSC/002
Figure 3-19: Wind class frequency distribution (April -2015) ............................................ 152
Figure 3-20: Site specific wind rose (May 2015) .................................................................. 153
Figure 3-21: Wind class frequency distribution ................................................................... 153
Figure 3-22: Total monthly rainfall for IMD station Alibag ............................................... 153
Figure 3-23: Map depicting the ambient air quality monitoring locations ......................... 156
Figure 3-24: Graphical representation of the maximum values of PM10 ............................ 161
Figure 3-25: Graphical representation of maximum values of PM2.5 ................................. 162
Figure 3-26: Graphical representation of maximum values of SO2 .................................... 162
Figure 3-27: Graphical representation of maximum values of NOx ................................... 163
Figure 3-28: Noise monitoring locations marked on Google Earth ..................................... 165
Figure 3-29: Variation in Leq (day) during the study period (March 2016 to May -2016) 167
Figure 3-30: Variation in Leq (night) during the study period (March -2016 to May -2016)
167
Figure 3-31: Map depicting ground water quality locations ............................................... 168
Figure 3-32: Map depicting surface water quality locations ............................................... 169
Figure 3-33: Map depicting the soil sampling locations ...................................................... 174
Figure 3-34: The photographs of soil from tree plantation within the Plot and agricultural
fields around surrounding area ............................................................................................ 181
Figure 3-35: Map depicting sampling locations in the buffer zone ..................................... 188
Figure 3-36: Map depicting the sampling locations at the site ............................................ 188
Figure 3-37: Map depicting the ecological sampling locations within 5km of the project
boundary 189
Figure 3-38 : Distribution of the ground cover in the study area ........................................ 204
Figure 3-39 : Select common animals in the study area ...................................................... 210
Figure 3-40 : Select common butterfly in the study area ..................................................... 210
Figure 3-41 : Select common avifauna observed in the study area ..................................... 211
Figure 4-1 : Map depicting the road network in the vicinity of the project site ................. 247
Figure 4-2 : Isopleths depicting the resultant concentrations of CO due to combined
operations of the D.G sets and traffic -2019 ......................................................................... 250
Figure 4-3 : : Isopleths depicting the resultant concentrations of NOx due to combined
operations of the D.G sets and traffic -2019 ......................................................................... 251
Figure 4-4 : Isopleths depicting the resultant concentrations of PM10 due to combined
operations of the D.G sets and traffic -2019 ......................................................................... 252
Figure 4-5 : Isopleths depicting the resultant concentrations of CO due to combined
operations of the D.G sets and traffic -2029 ......................................................................... 275
Final EIA Report – Orange Smart City, Pen, Raigad July 2018
11
BE/EIA-OSC/002
Figure 4-6 : Isopleths depicting the resultant concentrations of NOx due to combined
operations of the D.G sets and traffic in 2029 ...................................................................... 276
Figure 4-7 : Isopleths depicting the resultant concentrations of PM10 due to combined
operations of the D.G sets and traffic in 2029 ...................................................................... 277
Figure 4-8 : Isopleths depicting the resultant concentrations of CO due to combined
operations of the D.G sets and traffic in 2035 ...................................................................... 278
Figure 4-9 : Isopleths depicting the resultant concentrations of NOx due to combined
operations of the D.G sets and traffic in 2035 ...................................................................... 279
Figure 4-10 : Isopleths depicting the resultant concentrations of PM10 due to combined
operations of the D.G sets and traffic in 2035 ...................................................................... 280
Figure 5-1: Site No. 1 – Tarankhop Ramraj and Dhavate................................................... 307
Figure 5-2: Site No. 2 – Meleghar and Kashmire................................................................. 308
Figure 5-3: Site No. 3 – Boregaon, Shene, Virani, Belawade Budruk, Walak, Mungoshi,
Govirle, Belawade Khurd, Padale, Kopar, Ambeghar, Balawali, Ambiwali & Hamrapur
309
Figure 9-1: Structure of Environmental Management Cell ................................................ 376
LIST OF TABLES
Table 1-1 : Details of land-use parcel-wise ............................................................................. 31
Table 1-2: Threshold Limit of Category ’A & B’ projects as per MoEF&CC Notification . 33
Table 2-1: Key Details of the project ...................................................................................... 35
Table 2-2: Land Profile of Proposed Orange Smart City Project ......................................... 37
Table 2-3: Summary of the industrial demand assessment ................................................... 37
Table 2-4: Land-use mix assessment ...................................................................................... 38
Table 2-5: Geographical Coordinates for the Delineated Area Boundary............................ 40
Table 2-6: Infrastructure along proposed Project Site .......................................................... 41
Table 2-7: Salient features along proposed Project Site ........................................................ 41
Table 2-8: National Highways and Expressway in site surroundings ................................... 47
Table 2-9: The Major State Highways in the immediate surroundings ................................ 48
Table 2-10: Land use break up of land parcel –T1 ................................................................ 65
Table 2-11: Land use break up of land parcel –T2 ................................................................ 65
Table 2-12 : Land use break up of parcel –T3 ....................................................................... 66
Table 2-13 : Land use break up of parcel –T4 ....................................................................... 66

Final EIA Report – Orange Smart City, Pen, Raigad July 2018
12
BE/EIA-OSC/002
Table 2-14: The summary of proposed built up area in million sq.m ................................... 67
Table 2-15: Residential Population Estimates........................................................................ 68
Table 2-16: Working Population Estimates ........................................................................... 68
Table 2-17: Type of Industries and Parcel-wise Land Allocation ......................................... 69
Table 2-18: Land Parcel wise Type of Industry with Tentative Built-up Areas .................. 69
Table 2-19: Type of industries in each category .................................................................... 71
Table 2-20: Parcel-wise land allocation & built-up areas for Commercial areas ................. 72
Table 2-21: Total land allocation ............................................................................................ 73
Table 2-22: Landscape, Green & Open Space Details ........................................................... 76
Table 2-23: Common use buildings with Built-up areas ........................................................ 77
Table 2-24: Potable water demand assessment ...................................................................... 79
Table 2-25: Non-potable water demand assessment .............................................................. 79
Table 2-26 : Summary of water demand assessment ............................................................. 80
Table 2-27: Water supply infrastructure ............................................................................... 81
Table 2-28: Waste Water Generation from Industrial Processing ........................................ 83
Table 2-29: Waste water generation from Commercial worker usage ................................. 83
Table 2-30: Waste water generation from residential areas .................................................. 84
Table 2-31: Summary of Total Sewage Generation ............................................................... 84
Table 2-32: Proposed STP details ........................................................................................... 85
Table 2-33 : Electricity Requirements for Industrial Areas .................................................. 96
Table 2-34 : Electricity requirements for commercial areas ................................................. 96
Table 2-35 : Electricity requirements for residential areas ................................................... 96
Table 2-36: Electricity requirements for amenity and utilities areas .................................... 97
Table 2-37 : Parcel wise sub-stations with Area requirements ............................................. 98
Table 2-38 : Solid Waste Generation Norms considered ..................................................... 102
Table 2-39: Solid Waste Generation in Industrial Areas ..................................................... 103
Table 2-40 : Solid Waste Generation in residential areas .................................................... 103
Table 2-41: Solid Waste Generation in commercial areas ................................................... 103
Table 2-42: Summary of Utilities .......................................................................................... 117
Table 2-43: Regional Connectivity Details ........................................................................... 117
Table 2-44: Approximate distances from nearby landmarks .............................................. 118
Table 2-45: Number of Vehicles in Industrial areas ............................................................ 118

Final EIA Report – Orange Smart City, Pen, Raigad July 2018
13
BE/EIA-OSC/002
Table 2-46: Number of Vehicles in Commercial and Recreational areas ........................... 119
Table 2-47: Number of Vehicles in Residential areas .......................................................... 119
Table 2-48: Total Number of vehicles in OSC ..................................................................... 119
Table 2-49: Infrastructure related to Road .......................................................................... 122
Table 2-50: Details of phasing............................................................................................... 124
Table 3-1: Methodology of Baseline Data collection ............................................................ 133
Table 3-2: Details of Satellite Data ....................................................................................... 137
Table 3-3: Characteristics of IRS Resourcesat-2 Data ........................................................ 137
Table 3-4: IRS Resourcesat-2 L4FMX, Satellite Spectral Bands and their Principal
Applications 137
Table 3-5: Land Use/Land Cover statistics of 15 km Radius Area ..................................... 141
Table 3-6: Meteorological Parameters Monitored at site .................................................... 143
Table 3-7: Synopsis of site specific meteorological data (March 2014 – May 2014) ........... 148
Table 3-8: Synopsis of site specific meteorological data (March 2015 – May 2015) .......... 151
Table 3-9: Monitoring Stations for Air Quality Assessment ............................................... 155
Table 3-10: Measurement Techniques ................................................................................. 157
Table 3-11: AAQ Monitoring Results in µg/m3 .................................................................... 159
Table 3-12: AAQ Monitoring Results in mg/m3 for CO ...................................................... 160
Table 3-13: Details of Ambient Noise Locations .................................................................. 163
Table 3-14: Noise quality monitoring results ....................................................................... 166
Table 3-15: Monitoring Stations for Ground water Quality Assessment ........................... 168
Table 3-16: Monitoring Stations for Surface water Quality Assessment ............................ 169
Table 3-17: Ground Water Quality results .......................................................................... 171
Table 3-18: Surface water quality results ............................................................................ 172
Table 3-19: Details of soil sampling locations ...................................................................... 175
Table 3-20: Soil Analysis Results .......................................................................................... 175
Table 3-21 : Details of terrestrial ecology sampling locations ............................................. 186
Table 3-22: Floristic composition in the study area ............................................................. 191
Table 3-23 : Classification of the commonly occurring plant species as per resource use/ value
205
Table 3-24: Most common floral species observed in the study area .................................. 206
Table 3-25 : Fauna recorded in the study area upto 5 km radius ....................................... 208
Table 3-26 : Details of aquatic sampling locations ............................................................... 215

Final EIA Report – Orange Smart City, Pen, Raigad July 2018
14
BE/EIA-OSC/002
Table 3-27 : List of fresh water plaktonic flora and fauna from the study area................. 216
Table 3-28 : Shannon Weaver’s Diversity Index of Plankton ............................................. 217
Table 3-29 : Marine Plankton species recorded from the study area ................................. 219
Table 3-30 : Benthic species recorded from the study area ................................................. 220
Table 3-31 : List of the fishes in the study area .................................................................... 222
Table 3-32: Comparative data for population, sex ratio, & Literacy rates in affected villages
224
Table 3-33: Names of the villages and categorization .......................................................... 225
Table 3-34: Demographic details of the study area.............................................................. 226
Table 3-35: SC and ST populations in the Project Study Area ........................................... 227
Table 3-36: Sex Ratio and Literacy rate in the Project Study Area .................................... 227
Table 3-37: Workforce participation Ratio (WPR) in the Project Study Area .................. 228
Table 3-38: Occupational profile of the villages in the Project Study Area ........................ 229
Table 3-39: Family Size of Surveyed Respondents .............................................................. 230
Table 3-40: Social classification of respondents ................................................................... 231
Table 3-41: Literacy Rate in the project study area ............................................................ 231
Table 3-42: Distribution of primary schools by management ............................................. 232
Table 3-43: Average monthly income of families ................................................................. 232
Table 3-44: Primary Occupation of Families ....................................................................... 233
Table 3-45: Asset ownership ................................................................................................. 235
Table 3-46: Consultation at Villages .................................................................................... 236
Table 4-1: Identification of Potential Impacts: Pre-Construction and Construction Phase
239
Table 4-2: Identification of Potential Impacts in Operations Phase ................................... 243
Table 4-3: Criteria based significance of Impact ................................................................. 246
Table 4-4 : Emissions from the D.G set ............................................................................... 248
Table 4-5 : Emission due to the projected traffic in 2019 .................................................... 248
Table 4-6 : Resultant concentrations of CO at AAQM locations ........................................ 249
Table 4-7 : Resultant concentrations of NOx at AAQM locations ...................................... 250
Table 4-8 : Resultant concentrations of PM10 at AAQM locations .................................... 251
Table 4-9:Construction Waste Debris .................................................................................. 257
Table 4-10: Waste from Labor facility ................................................................................. 258
Table 4-11: Noise Modeling results in the construction phase ............................................ 261

Final EIA Report – Orange Smart City, Pen, Raigad July 2018
15
BE/EIA-OSC/002
Table 4-12 : Emission due to the projected traffic in 2029 and 2035 .................................. 274
Table 4-13 : Resultant concentrations of CO, NOx and PM10 (Year 2029) ........................ 274
Table 4-14 : Resultant concentrations of CO, NOx and PM10 (Year 2035) ........................ 277
Table 4-15: The water consumption from each parcel ........................................................ 281
Table 4-16: The total sewage generated ............................................................................... 282
Table 4-17: The total effluent generation from the industries............................................. 283
Table 4-18: Results of noise modelling study (Operational Phase) ..................................... 287
Table 4-19: Mitigation measures during operational phase ................................................ 288
Table 4-20: Estimated Population ........................................................................................ 302
Table 4-21: Employment generation in OSC ....................................................................... 302
Table 5-1: Key Characteristics and Comparative Site Evaluation ..................................... 310
Table 5-2: Comparative Analysis Table For Above Alternate Sites ................................... 311
Table 6-1: Recommended Environmental Monitoring Programme ................................... 315
Table 6-2: Applicable Standards for Different Environmental Components ..................... 318
Table 6-3: Cost Estimates for Environmental Monitoring .................................................. 319
Table 8-1: CSR measures along with cost and the timelines ............................................... 334
Table 9-1: Environmental Management Plan during the construction phase .................... 339
Table 9-2: Environmental Management Plan during the operation phase ......................... 347
Table 9-3: List of recommended species for plantation ....................................................... 355
Table 9-4: Recommended species for fruit tree plantation .................................................. 361
Table 9-5: Cost of mitigation measures – Construction Phase ............................................ 374
Table 9-6: Cost of mitigation measures- Operation Phase .................................................. 374
Table 9-7: Responsibilities of the EMC personnel ............................................................... 376
Table 10-1 : Key details of the project .................................................................................. 380
Table 10-2: Synopsis of onsite meteorological data ............................................................. 383
Table 10-3: Synopsis of the IMD Murud data (March 2014 to May 2014) ......................... 383

Final EIA Report – Orange Smart City, Pen, Raigad July 2018
16
BE/EIA-OSC/002
List of Abbreviations
AAS/ICP Atomic Absorption Spectroscopy/ Inductively Coupled Plasma
ALARP As Low As Reasonably Practicable
AMI Advanced Metering Infrastructure
APHA American Public Health Association
AQM Air Quailty Monitoring
ARAI Automobile Research Association Of India
BDL Below Detection Limit
BEIPL Building Environment India Pvt Ltd.
BIS Bureau Of Indian Standards
BOD Biochemical Oxygen Demand
BT Bio Terrorism
BW Biological Warfare
CCT Continuous Contour Trenching
CETP Common Effluent Treatment Plant
CFC Chloro Fluoro Carbon
CFL Compact Fluorescent Lamp
CGWB Central Ground Water Board
CHP Combined Heat And Power
CIDCO City And Industrial Development Corporation Of Maharashtra
CLO Community Liaison Officer
COD Chemical Oxygen Demand
CPCB Central Pollution Control Board
CPHEEO Central Public Health And Environmental Engineering Organisation
CPTED Crime Prevention Through Environmental Design
CSR Corporate Social Responsibility
DCP District Cooling Plants
DCR Development Control Regulations
DCS Distributed Control System
DDMA District Disaster Management Authority
DFO Divisional Forest Officer
DG Diesel Generator
DMIC Delhi Mumbai Industrial Corridor
DMP Disaster Management Plan
DO Dissolved Oxygen
F&E Fire & Explosion
DSS Distribution Substation
EC Environmental Clearance
ED-XRF Energy Dispersive X-Ray Fluorescence
EHS Environmental Health & Safety
EIA Environmental Impact Assessment
EMC Environment Management Committee
EMP Environmental Management Plan
EPA Environmental Protection Agency
EPZ Export Processing Zones

Final EIA Report – Orange Smart City, Pen, Raigad July 2018
17
BE/EIA-OSC/002
ERDAS Earth Resources Data Analysis System
ERP Enterprise Resource Planning
ESIA Environmental And Social Impact Assessment
ETP Effluent Treatment Plant
FCC False Colour Composite
FDIR Advanced Metering Infrastructure
FSI Floor Space Index
GC/HPLC Gas Chromatography /High-Performance Liquid Chromatography
GCP Ground Control Point
GDCR General Development Control Regulations
GIS Advanced Metering Infrastructure
GoI Government Of India
GoM Government Of Maharashtra
GW Ground Water
HC Hydrocarbon
HCV High Commercial Vehicles
HH Household
HIG Light Commercial Vehicle
HOV High Occupancy Vehicle
HVAC Heating, Ventilation, And Air Conditioning
IBMS Intelligent Building Management System
ICT Information And Communication Technology
IIA Integrated Industrial Areas
IMD India Meteorological Department
IT Information Technology
JLL M/S Jones Lang Lasalle
JNPT Jawaharlal Nehru Port
LCA Life Cycle Assessment
LCV Light Commercial Vehicle
LCV Light Commercial Vehicle
LDAR Leak Detection And Repair
LED Light Emitting Diode
LIG Low Income Group
LPG Liquefied Petroleum Gas
LU/LC Land Use/Land Cover
MAH Major Accident Hazard
MCC Maximum Credible Accident
MCGM Municipal Corporation Of Greater Mumbai
MIDC Maharashtra Industrial Development Corporation
MIG Middle Income Group
MINAS Minimum National Standards
MMR Mumbai Metropolitan Region
MMRDA Mumbai Metropolitan Region Development Authority
MoEF&CC Ministry Of Environment And Forests And Climate Change Govt. Of India
MPCB Maharashtra Pollution Control Board
MRSS Main Receiving Substation

Final EIA Report – Orange Smart City, Pen, Raigad July 2018
18
BE/EIA-OSC/002
MSDS Material Safety Data Sheet
MSEDCL Maharashtra State Electricity Distribution Company Ltd.
MSL Mean Sea Level
MSRTC Maharashtra State Road Transport Corporation
MSW Municipal Solid Waste
MTHL Mumbai Trans-Harbour Link
NAAQS National Ambient Air Quality Standards
NABL National Accreditation Board For Testing And Calibration Laboratories
NBC National Bureau Of Standards
NBSS & LUP National Bureau Of Soil Survey And Land Use Planning
NDIR Non Dispersive Infra-Red
NGO Non-Governmental Organization
NMIA Navi Mumbai International Airport
OBC Other Backward Class
OM Organic Matter
OMS Advanced Metering Infrastructure
OSC Orange Smart City
OSCIPL Orange Smart City Infrastructure Pvt. Ltd.
PCU Passenger Car Unit
PHA Preliminary Hazard Analysis
PM Particulate Matter
PPE Personal Protective Equipment
PSIMS Physical Security Information Management System
PTFE Polytetrafluoroethylene
PV Photovoltaic
PWD Public Works Department
QRA Quality Risk Assessment
RDMC Regional Disaster Management Centre
ROW Right Of Way
RWH Rain Water Harvesting
SCADA Supervisory Control And Data Acquisition Systems
SDI Spatial Data Infrastructure
SEIAA State Environment Impact Assessment Authority
SEZ Special Economic Zones
SLDC State Load Dispatch Centre
SOP Standard Operating Procedures
SPL Sound Pressure Level
SC / ST Scheduled Caste/ Scheduled Tribe
STP Sewage Treatment Plant
SW Surface Water
SWM Solid Waste Management
TDS Total Dissolved Solids
TOD Transit-Oriented Development
TOEM PM Instrument
ToR Terms Of Reference
TSS Total Suspended Solids

Final EIA Report – Orange Smart City, Pen, Raigad July 2018
19
BE/EIA-OSC/002
UMIG Upper Middle Income Group
URDPFI Urban And Regional Development Plans Formulation And Implementation
VEC Value Ecosystem Components
VKT Vehicle Kilometers Travelled
VOC Volatile Organic Chemical
VOC Volatile Organic Chemical
WPR Workforce participation Ratio
WTP Water Treatment Plant

Final EIA Report – Orange Smart City, Pen, Raigad July 2018
20
BE/EIA-OSC/002
LIST OF ANNEXURES
Sr. No. Annexure
I. ToR issued by MoEF
II. Certificate of Incorporation and name change
III. Consent to establish under RED category from MPCB
IV. NOC for location clearance from Water Resources Department
V. Archaeological NOC
VI. Letter for consideration of water demand from Hetawne Medium Project
Division
VII. In principle approval from MSEDCL
VIII. Borgaon NOC
IX. Letter of consent from MWML
X. Cost of noise mitigation measures during construction and operational phase
XI. Environmental monitoring reports
XII. Bore hole details
XIII. Different Ecosystems observed in the buffer zone
XIV. List of trees reported at Karnala WLS
XV. List of Shrubs, Herbs, Climbers & Grasses reported at Karnala WLS
XVI. Birds Reported In The Karnala Wild Life Sanctuary
XVII. List of Flora & fauna from the working plan of the Raigad Dist.
XVIII. Public hearing and its minutes
XIX. Risk assessment and Disaster Management plan
XX. Distance of the buffer zone of the Karnala Bird Sanctuary from T3 land parcel
XXI. Tree census details
XXII. Approved layout plan

Final EIA Report – Orange Smart City, Pen, Raigad July 2018
21
BE/EIA-OSC/002
ToR compliance
Sr. No ToR condition Section where complied
1. Reasons for selecting the site
with details of alternate sites
examined/rejected/ selected on
merit with comparative
statement and reason/basis for
selection. The examination
should justify site suitability in
terms of environmental damage,
resources sustainability
associated with selected site as
compared to rejected sites. The
analysis should include
parameters considered along
with weightage criteria for short-
listing selected site.
Refer Chapter -5 titled “ Analysis of Alternatives”
2. Submit the details of the land use
break-up for the proposed
project. Details of land use
around 10 km radius of the
project site. Analysis should be
made based on latest satellite
imagery for land use with raw
images. Check on flood plain of
any river.
For existing land use Refer Table-2.2 titled “Land
Profile of Proposed Orange Smart City Project
For details of the 10km radius of the project site using
the satellite imagery please refer Table-3.5 “ Land
Use/Land Cover statistics of 15 km Radius Area”
3. Submit details of
environmentally sensitive
places, land acquisition status,
rehabilitation of communities/
villages and present status of
such activities.
The land is already in possession of the proponent.
Hence the land acquisition and the R&R is not
applicable.
4. Examine the impact of proposed
project on the nearest
settlements.
Refer Section 4.3.6 titled Socio –Economic
Environment” under the Section Impacts and
Mitigations Construction Phase.
5. Examine baseline environmental
quality along with projected
incremental load due to the
Refer chapter -3 “ Description of the Environment”

Final EIA Report – Orange Smart City, Pen, Raigad July 2018
22
BE/EIA-OSC/002
Sr. No ToR condition Section where complied
project taking into account of the
existing developments nearby.
6. Environmental data to be
considered in relation to the
project development would be
(a) land, (b) groundwater, (c)
surface water, (d) air, (e) bio-
diversity,(f) noise and
vibrations, (g)socio economic
and health.
Refer Chapter 3 “Description of the Environment”
7. Submit a copy of the contour
plan with slopes, drainage
pattern of the site and
surrounding area, and any
obstruction of the same by the
project.
Refer Section-2-7 titled “Site Description” in
Chapter-2
8. Details regarding project
boundary passing through any
eco- sensitive area and within 10
km from eco- sensitive area.
Karanala bird sanctuary is located at a distance of 6.7
km from the buffer zone of Karnala Bird Sanctuary.
Refer Annexure- XXI
9. Green buffer in the form of green
belt to a width of 15 meters
should be provided all along the
periphery of the industrial area.
The individual units should keep
33% of the allotted area as a
green area.
Refer Section -9.6 in the Chapter-9 titled “
Environmental Management Plan”
10. Submit the details of the trees to
be felled for the project.
Refer the Tree Census Report attached as Annexure-
XXII. There are a total of 1692 trees at the site. Efforts
will be made to protect the trees and incorporate them
as a part of design. Areas with maximum tree density
are designated as green areas in the master plan.
11. Submit the details of the
infrastructure to be developed.
Refer Section 2.23 to 2.38
12. Submit the present land use and
permission required for any
conversion such as forest,
agriculture etc.
For existing land use Refer Table-2-2. titled “ Land
Profile of Proposed Integrated Industrial Township
Project”
Final EIA Report – Orange Smart City, Pen, Raigad July 2018
23
BE/EIA-OSC/002
Sr. No ToR condition Section where complied
The land is already in possession of the proponent.
Land conversion is subsumed in the permission
accorded as per the IIA Policy
13. Submit details regarding R&R
involved in the project
The land is already in possession. Hence R&R is not
applicable
14 Zoning of the area in terms of
type of industries' coming-up in
the industrial area based on the
resource requirement along with
likely pollutants with the
quantity from the various
industries.
Category A and Life sciences, Engineering,
Agro/Food Processing, Logistic, Research &
Development, Gems & Jewellery, and Electronics &
Semi-conductors industries are proposed in the
project The zoning has been done as per the prevailing
rules and regulations.
Resource requirement during the construction phase
is given in Section: 2.21 and the same during the
operation phase is given in Section- 2.22 (Water
requirement, Section-2.25 (Power Infrastructure)
As the project is an industrial integrated Township
capacities of the individual industries in not known at
this point of time as the project is in planning stage.
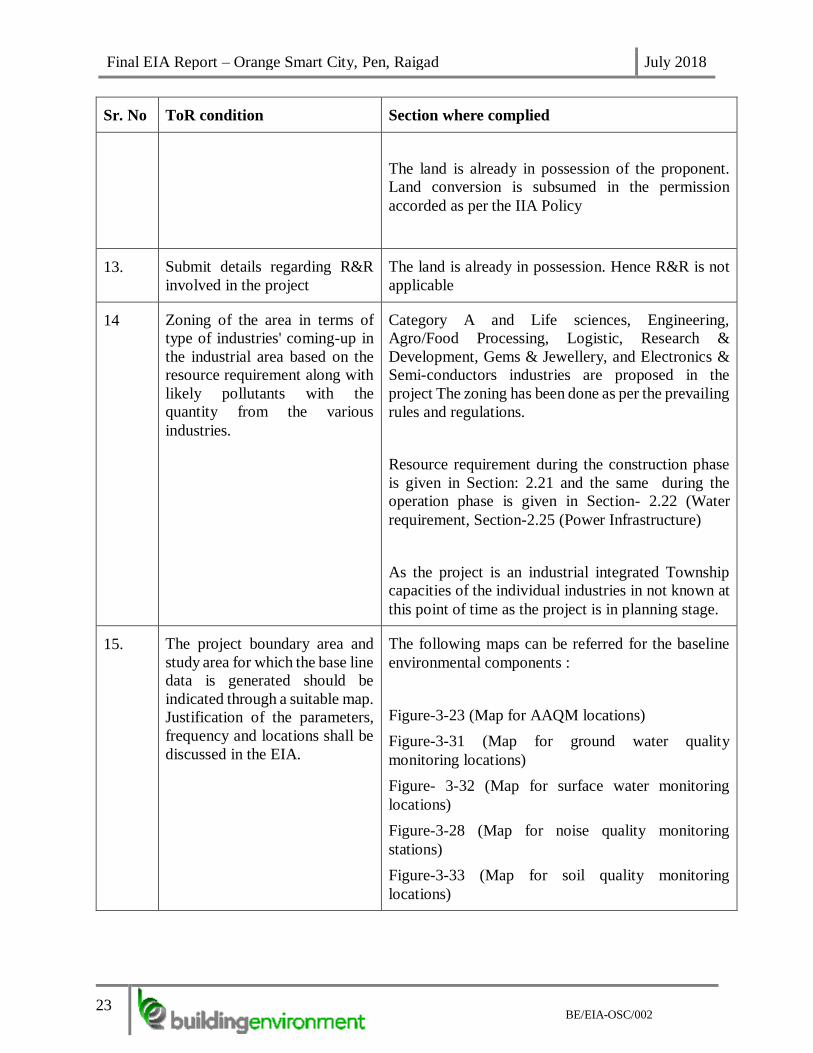
15. The project boundary area and
study area for which the base line
data is generated should be
indicated through a suitable map.
Justification of the parameters,
frequency and locations shall be
discussed in the EIA.
The following maps can be referred for the baseline
environmental components :
Figure-3-23 (Map for AAQM locations)
Figure-3-31 (Map for ground water quality
monitoring locations)
Figure- 3-32 (Map for surface water monitoring
locations)
Figure-3-28 (Map for noise quality monitoring
stations)
Figure-3-33 (Map for soil quality monitoring
locations)

Final EIA Report – Orange Smart City, Pen, Raigad July 2018
24
BE/EIA-OSC/002
Sr. No ToR condition Section where complied
16 Submit Legal frame work for the
implementation of
Environmental
Clearance conditions - to be
clearly spelt out in the EIA
report.
Refer Section - 9.3 titled “ Applicable Environment
and Social Legislations
17. Site justification of the identified
industry sectors from
environmental angle and the
details of the studies conducted
if any.
Category A and Life sciences, Engineering,
Agro/Food Processing, Logistic, Research &
Development, Gems & Jewellery, and Electronics &
Semi-conductors industries are proposed in the
project and the layout has been prepared keeping in
view the prevailing meteorological conditions.
Refer – Section-3.6 “Climate and Meteorology” for
detailed analysis of meteorological conditions”
18. Ground water classification as
per the Central Ground Water
Authority.
As per CGWA the Pen Taluka comes under the list of
“List of Non-notified Areas of the States / UTs where
CGWA regulate and control ground water
management & development.”
No ground water will be abstracted for the proposed
project either in construction phase or in operation
phase.
19. Submit the source of water,
requirement vis-a-vis waste
water to be generated along with
treatment facilities, use of
treated waste water along with
water balance chart taking into
account all forms of water use
and management.
The source of the water is from the Hetwane Dam.
The water balance is depicted in the Figure- 2.26
titled “ Water Balance Diagram”
20 Rain water harvesting proposals
should be made with due
safeguards for ground water
quality. Maximize recycling of
water and utilization of rain
water. Examine details.
Refer Section 2.24 titled “Storm Water Drainage
System, rainwater harvesting and storage facilities”
The rain water harvesting will be done through the
holding ponds catering to the run-off and the it will
be made mandatory for all the individual plot owners
to implement rainwater harvesting at the plot level

Final EIA Report – Orange Smart City, Pen, Raigad July 2018
25
BE/EIA-OSC/002
Sr. No ToR condition Section where complied
21 Examine soil characteristics and
depth of ground water table for
rainwater harvesting.
The soil characteristics are given in Table:-3.20 while
the ground water levels are given in Section -
3.10.4.Detailed borehole investigations are given in
Annexure-XIII.
22. Examine details of solid waste
generation treatment and its
disposal.
Refer section-2.29 titled “ Solid waste handling
system and the landfill details”
23 Examine and submit details of
use of solar energy and
alternative source of energy to
reduce the fossil energy
consumption.
Refer Section -2.41 for the details of the proposed
Solar PV installation.
24 In case DG sets are likely to be
used during construction and
operational phase of the project,
emissions from DG sets must be
taken into consideration while
estimating the impacts on air
environment. Examine and
submit details.
The details of the air quality modelling during the
construction phase and the operation phase are
covered in Section-4.3.1 and 4.4.1 respectively
25. Examine road/rail connectivity
to the project site and impact on
the traffic due to the proposed
project. Present and future traffic
and transport facilities for the
region should be analysed with
measures for preventing traffic
congestion and providing faster
trouble free system to reach
different destinations in the city.
Refer Section-3.33 titled “ Traffic and Transportation
Plan”
26 A detailed traffic and
transportation study should be
made for existing and projected
passenger and cargo traffic.
Refer Section-2.36 titled “ Traffic and Transportation
Plan”
27. Examine the details of transport
of materials for construction
which should include source and
availability.
Refer Section-2.21 titled “Resource Requirements-
Construction Phase. The materials for the
construction will be sourced from local approved
quarries”

Final EIA Report – Orange Smart City, Pen, Raigad July 2018
26
BE/EIA-OSC/002
Sr. No ToR condition Section where complied
28 Examine the details of National
Highways/State Highways/
Expressways falling along the
corridor and the impact of the
development on them.
Refer section 4.4.1 Impact of the project traffic on the
surrounding roads
29 Examine noise levels - present
and future with noise abatement
measures.
Refer Section-3.8 Ambient Noise Quality for the
baseline noise levels
Refer section 4.3.5 for noise modelling during the
construction phase and mitigation measures
Refer section 4.4.5 titled “Impact on noise
environment during the operation phase” noise
modelling during the operation phase and mitigation
measures
30 Identify, predict and assess the
environmental and sociological
impacts on account of the
project. A detailed description
with costs estimates of CSR
should be incorporated in the
EIA / EMP report.
Orange Smart City is willing to spend CSR money in
providing skill development, clean and safe drinking
water, sanitation facility, primary health care support
in the near by villages.
Orange Smart City will provide housing to approx
1,50,000 people which will include social housing.
31 Examine separately the details
for construction and operation
phases both for Environmental
Management Plan and
Environmental Monitoring Plan
with cost and parameters.
Refer Chapter-6 titled “ Environmental Monitoring
Plan and
Chapter-9 “Environmental Management Plan”
32 Submit details of a
comprehensive Disaster
Management Plan including
emergency evacuation during
natural and man-made disaster.
Refer Annexure-XIX titled ‘Risk Assessment and
Disaster Management Plan’

Final EIA Report – Orange Smart City, Pen, Raigad July 2018
27
BE/EIA-OSC/002
Sr. No ToR condition Section where complied
33 Any further clarification on
carrying out the above studies
including anticipated impacts
due to the project and mitigative
measure, project proponent can
refer to the model ToR available
on Ministry website "http.y
Zmoef.ntc.In/ Manual/ Industrial
Estate".
Noted

Final EIA Report – Orange Smart City, Pen, Raigad July 2018
28
BE/EIA-OSC/002
1. INTRODUCTION
1.1 Purpose of the Report
Environmental Impact assessment (EIA) is a process of identifying, predicting, evaluating the
impact of the implementation of project and working out the mitigation measures required to
counter the probable adverse impact if any on the biophysical, social and other relevant aspects of
developmental proposals prior to major decisions being taken. EIA provides general information
pertaining to purpose of the report, identification of project and project proponent. It also includes
scope of study as well as regulatory scoping and organization of the report. The objective of this
EIA is to foresee the potential environmental problems that would arise out of a proposed
development and address them in the project's planning and implementation stage. The EIA
process shall then allow for the communication of this information to:
➢ The project proponent
➢ The regulatory agencies
➢ All stakeholders and interest groups.
1.2 Identification of project
Orange Smart City Infrastructure Pvt. Ltd. (OSCIPL) has planned to develop a Smart Integrated
Township at Taluka Pen, Dist Raigad, Maharashtra. Although it is not part of Government of
India’s 100 Smart City Mission, but it has been planned along the lines of Smart City Guidelines
of Government of India (GoI). This is the first green field smart city planned in Maharashtra.
The proposal for development of the Smart Integrated Township at Taluka Pen, District Raigad is
the culmination of an elaborate study of various factors, potential of the project area with reference
to industrial and infrastructure development scenario in the Mumbai Metropolitan Region (MMR)
and Raigad region.
Maharashtra has been a pioneer in many of the policy initiatives that support manufacturing in
industrial sector and the State Government recognizes that manufacturing is a key driver of state’s
economic growth. In view of the above, Government of Maharashtra (GoM) as per Industrial
Policy,2013-2018 allows creation of integrated industrial areas / IIAs to promote integrated
development primarily with industrial and all allied activities including residential, commercial,
etc.
With the current policy of economic liberalization and stress on privatization and reacting to urban
development problems like increasing urban population, urban sprawl, traffic congestion, water
shortages, and air and water pollution. OSCIPL advocates the use of urban-led strategies to
proactively spark economic and social development.
Orange Smart City (OSC) is to adapt the most advanced technical know-how to start smart
facilities systems such as
• Smart Energy
• Smart Mobility

Final EIA Report – Orange Smart City, Pen, Raigad July 2018
29
BE/EIA-OSC/002
• Smart Water
• Smart Public services
• Smart Buildings and Homes
OSC is a planned urban development having more open space which encourages walk to work
communities. It is planned Transit Oriented Development (ToD), which reduces use of fuel with
emphasis on walk-ability and pedestrian comfortable environment. The activities on different sites
had been planned as per their significance to the functions/uses/business of the OSC. The location
of these activities is encapsulated as cluster with the proximity to transport and facilities. OSC
Development plan facilitates development of following industries:
• Category A and Life Sciences: Pharmaceutical, Bulk drugs and Intermediates
• Engineering: Automotive industries preferably one anchor unit and others will be tier-2
and tier-3 category.
• Food Processing: Fish poultry and Meat processing, Food processing and packaging,
Sorting, grading and cold storage.
• IT/ITES
• Logistics
• KPO/BPO
• Other related industrial, commercial (offices) as per the predominant land use.
OSC is planned with mix use development with predominant industrial use. To support the
industrial and other economic uses, Residential and commercial is also proposed with all required
infrastructural utilities and allied facilities. The OSC is planned to address Industrial demand and
new emerging housing need including affordable housing by creating infrastructure and a globally
competitive environment that attracts investment and promotes sustainable development.
The project site spread across over 1042.51 acres of land, is closely clustered at four locations. The
site parcels are located in close proximity to India’s financial capital, Mumbai. The site cluster is
well connected and is in close proximity of the Jawaharlal Nehru Port (JNPT), the well-developed
urban center of Navi Mumbai, the proposed Mumbai Trans-Harbor Link (MTHL) and the
proposed Navi Mumbai International Airport (NMIA).
OSC is within the influence zone of India’s most ambitious infrastructure project – the Delhi
Mumbai Industrial Corridor (DMIC) and is in vicinity of the terminal point of the Western
Dedicated Freight Corridor (DFC). The NH-66 and the suburban railway network presently
connect OSC to the major urban centres of the Mumbai Metropolitan Region (MMR).
The objective of OSC is to develop Green Sustainable Smart City to cater the industrial demand,
create employment opportunities and provide sustainable smart housing with provision of adequate

Final EIA Report – Orange Smart City, Pen, Raigad July 2018
30
BE/EIA-OSC/002
infrastructure and public services assurance of environmental justice and healthful living
environment and achievement of the vision for a more livable city.
The project proposes to have sustainable economic base primarily driven by manufacturing
product mix along with institutional, residential and commercial supporting activities. The
township proposes to provide trunk infrastructure facilities including supporting social and
physical infrastructure to boost the sustainable economy in combination of Industrial Parks, IT/
BT Parks and Logistics, Warehousing and Financial Centers.
1.3 Identification of Project Proponent
OSCIPL is a newly formed SPV solely to establish OSC.The board of directors comprises eminent
and experienced persons on the subject of urban development and industrial township projects of
large size.
Promoters role in this project :- the promoters seeks to create the sustainable smart city under the
Govt of Maharashtra’s industrial policy for which basic role would be to create common and city
level infrastructure only , Market the plots on predefined land use basis, The promoter has also
initiated this report based on the development mix planned in the development plan proposed here
which presents a comprehensive overall picture of environmental impact assessment if whole
township is built in time frame of 10 to 12 years and the mitigation measures required if any
adverse impact is noticed. The environmental clearance for each of the industrial units and other
supporting projects is proposed to be taken independently.
Promoter shall also discharge the partial municipal functions (only maintenance of infrastructure)
as per Maharashtra Municipal councils, Nagar Panchayats and Industrial Townships act 1965 till
government declares the new municipal body and takes over such functions.
1.4 Brief of the Project
1.4.1 Nature, Size, Location of the Project
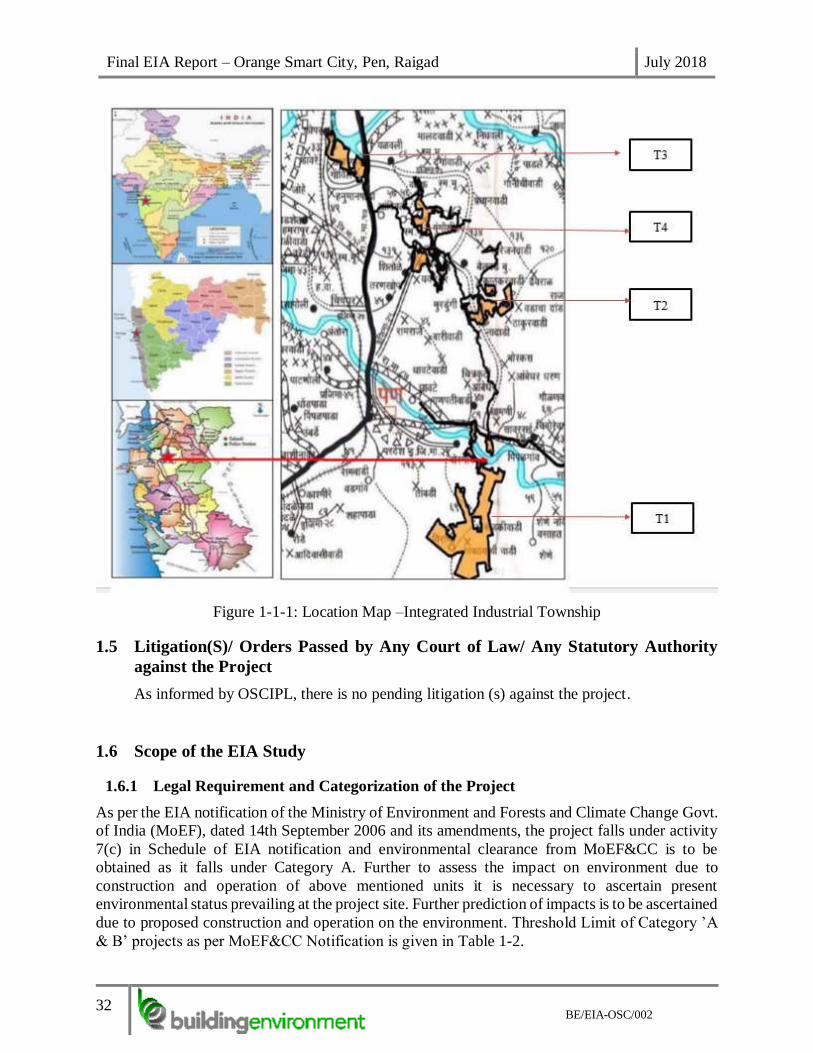
The project boundary is linear irregular shaped clustered around four land parcels i.e T1, T2, T3
and T4 that fall within the Delhi Mumbai Industrial Corridor (DMIC) influence zone The site
cluster is well connected and is in proximity of the Jawaharlal Nehru Port (JNPT), the well-
developed urban center of Navi Mumbai, the proposed Mumbai Trans-Harbour Link (MTHL) and
the proposed Navi Mumbai International Airport (NMIA).
The site falls within two planning areas namely Raigad Regional Plan (approximately 900 acres)
and Mumbai Metropolitan Region (MMR) Development Authority (approximately 100 acres)
limits. The Project will comprise of residential, industrial commercial land use, green and open
spaces with basic provisions of city infrastructures viz; roads, amenities, bridges, water supply
infrastructure, wastewater infrastructure etc. All the four land parcels have moderate vegetative
growth or and are devoid of manmade structures. The details of the parcel-wise land-use is shown
in Table 1-1 below and Location of the project site is depicted in Figure 1-1Figure 1-1

Final EIA Report – Orange Smart City, Pen, Raigad July 2018
31
BE/EIA-OSC/002
Table 1-1 : Details of land-use parcel-wise
Sr.
No
Land
Use
Zone
Physiography Type of Proposed Use Total site
area in
Acres
1. T1 A South –North valley divides this
Parcel in two hills. Side slopes of
the valley are nearly 1v:2.5h. This
valley has upstream maximum
elevation of 220m and downstream
minimum elevation of 26m where
it meets the river, whereas ridge has
highest elevation of 340m at top.
Predominantly Industrial
with low Residential and
Commercial Land Use
723.33
2. T2 T2 Parcel has relatively flat ground.
The ground elevation of this Parcel
ranges from 80m to 55 and
approximate slope of 1v:10h.
Predominantly Industrial
with low Residential and
Commercial Land Use
102.40
3. T3 The site is generally flat at top
having slope leading to the
Balganga River. The ground
elevation of this Parcel ranges from
40m to 80.
Predominantly Industrial
followed by Residential
and Commercial
83.59
4. T4 The site boundary along the
northern side has larger parcel of
flat land, which is favourable for
development. This Parcel is
situated at base of major hills on
West. T4 Parcel is made up of
eighteen small land parcels and two
major parcels. One of the major
parcel have ground elevation
ranges from 55m to 7m. And other
major parcel is relatively hilly
ground with elevations ranges from
86m to 12m.
Predominantly Residential
followed by Commercial
133.19
Total project area 1042.51
Final EIA Report – Orange Smart City, Pen, Raigad July 2018
32
BE/EIA-OSC/002
Figure 1-1-1: Location Map –Integrated Industrial Township
1.5 Litigation(S)/ Orders Passed by Any Court of Law/ Any Statutory Authority
against the Project
As informed by OSCIPL, there is no pending litigation (s) against the project.
1.6 Scope of the EIA Study
1.6.1 Legal Requirement and Categorization of the Project
As per the EIA notification of the Ministry of Environment and Forests and Climate Change Govt.
of India (MoEF), dated 14th September 2006 and its amendments, the project falls under activity
7(c) in Schedule of EIA notification and environmental clearance from MoEF&CC is to be
obtained as it falls under Category A. Further to assess the impact on environment due to
construction and operation of above mentioned units it is necessary to ascertain present
environmental status prevailing at the project site. Further prediction of impacts is to be ascertained
due to proposed construction and operation on the environment. Threshold Limit of Category ’A
& B’ projects as per MoEF&CC Notification is given in Table 1-2.

Final EIA Report – Orange Smart City, Pen, Raigad July 2018
33
BE/EIA-OSC/002
Table 1-2: Threshold Limit of Category ’A & B’ projects as per MoEF&CC
Notification
Project or
Activity
Category with
Threshold Limit
Applicability Category with
Threshold Limit
Applicability
A B
7 C
Industrial estates/
parks/
complexes/ areas,
export processing
Zones (EPZs),
Special
Economic Zones
(SEZs), Biotech
Parks, Leather
Complexes
If at least one industry
in the proposed
industrial estate falls
under the Category
A, entire industrial
area shall be treated
as Category A,
irrespective of the
area.
Yes
Industrial estates
housing at least one
Category B industry
and area <500 ha.
No
Industrial estates with
area greater than 500
ha and housing at
least one Category B
industry.
No Industrial estates of
area >500 ha. and not
housing any industry
belonging to
Category A or B.
No
1.6.2 Objectives and Scope of work
➢ To undertake an Environment Impact Assessment (EIA) study as per the approved Terms
of Reference (ToR) from MoEF&CC Delhi in 151st EAC 151st EAC meeting obtained
vide letter dated 23rd Nov 2015 (Attached as Annexure I) and as per the suggestions by
EAC committee provided in 187th Minutes of meeting held on 12th April 2018.
➢ To establish the baseline environmental and social scenario of the project surroundings
➢ To identify, predict and evaluate environmental and social impacts
➢ Recommend appropriate preventive and mitigation measures to eliminate or minimize
pollution, environmental & social disturbances during the life-cycle of the project, ensuring
compliance with environmental laws and regulation applicable
➢ Formulate an Environmental Management Plan (EMP) that they can be implemented,
monitored and suitable corrective action can be taken in case of deviations
➢ Conduct a Risk Analysis Study and identify the major hazards
➢ Recommend measures to eliminate / minimize hazard levels and develop a Disaster
Management Plan (DMP)
➢ To conduct public hearing under State Pollution Control Board (SPCB) in accordance with
the requirements of EIA Notification, 2006 and amendments.
➢ Final EIA Report Submission to EAC, MoEF&CC Delhi for Prior Environmental
Clearance (EC)

Final EIA Report – Orange Smart City, Pen, Raigad July 2018
34
BE/EIA-OSC/002

Final EIA Report – Orange Smart City, Pen, Raigad July 2018
35
BE/EIA-OSC/002
2. PROJECT DESCRIPTION
2.1 Type of the Project
Orange Smart City is proposed be a Integrated Industrial township spread over on four land parcels,
namely, T1, T2, T3 & T4 admeasuring total plot area of 1042.51 acres. OSC comprises of
Industrial (various sectors), Residential & Commercial components. The project sites are irregular
in shape and overlook the river Bhogeshwari & Balganga.
The proposed project components are as given below:
• Residential Area
• Commercial Area
• Industrial Area (Including Category A : Synthetic Organic Chemicals)
• Internal Roads including the Storm Water Disposal System
• Water supply infrastructure
• Wastewater Treatment infrastructure
• Power supply infrastructure
• Solid waste management infrastructure
• ICT Infrastructure
• Traffic and transport infrastructure
• HVAC Infrastructure
• IT and telecommunication
• Telephone and Internet / Optical Fibre Network
The key details are as in Table 2-1: Key Details of the project
Table 2-1: Key Details of the project
Sr. No Item Details
1. Name of the project Orange Smart City (OSC)
2. Project Type Integrated Industrial Township
3. Location Pen, Raigad
4. Name of the villages
coming under project area
T1: Boregaon, Shene, Ambeghar & Virani
T2: Belawade Budruk
T3: Balawali, Govirle, Kopar, Ambiwali & Hamrapur

Final EIA Report – Orange Smart City, Pen, Raigad July 2018
36
BE/EIA-OSC/002
Sr. No Item Details
T4: Mungoshi, Walak, Belawade Khurd, Padale and
Belawade Budruk
5. Project Connectivity NH 66 & SH 88
6. Total site area 1042.51 acres
7. Built Up Space 5.01 million sq.m
8. Industrial Built Up Area 3075720 sq.m
9. Commercial Built Up Area 710896 sq.m
10. Residential Area 1100784 sq.m
11. Green Area and Open
spaces
1031746 sq.m
12. Amenities / Utilities 23307 sq.m
13. Estimated Population 73068
14. Estimated Employment
Opportunities
150000 (approx)
15. Project Cost Rs 2032 Crores (+Rs. 2000 crores land cost)
16. Project Start Year FY 2019
17. Start of Operations FY 2029
18. Horizon Years of
development
10 Years
19. Project Land Use
Components
Includes industrial commercial residential and
institutional developments as well as open and green
spaces, industries such as Synthetic Organic Chemicals
Logistics, Engineering, Agro, Electronics and Semi-
Conductor, Life Sciences, Information technology,
Gems and Jewellery, & Research and Development.
20. Power requirement
Construction Phase: 5 MVA
Operation Phase: 142.18 MVA
21. Source of Power Maharashtra State Electricity Distribution Company
Ltd. (MSEDCL)
22. Water requirement
Construction Phase: 320 m3/day
Operation Phase: 38.60 MLD
23. Source of water Hetwane Dam
24. Waste water Generated
Construction Phase: 256 m3/day
Operation Phase: 21.56 MLD
25. Solid Waste Generation
Solid waste from
residential areas
Solid waste from industrial
areas
Solid waste from
commercial areas
29.2 Tonnes (At 400 gms/capita/day)
13.1 Tonnes (At 150 gms/capita/day)
9.2 tonnes (At 9.22 gms/capita/day)

Final EIA Report – Orange Smart City, Pen, Raigad July 2018
37
BE/EIA-OSC/002
Sr. No Item Details
26. Project Status Detailed Project Report has been completed. The land
is privately owned by company Detailed Master Plan
has been approved by MIDC Public hearing has been
held.
2.2 Land Area Details
The project will be built on 1042.51 acres. The land has been purchased from private owners on
the willing buyer and seller basis. Following Table 2-2 illustrates the land profile of Orange Smart
City project as per information obtained from Orange Smart City Infrastructure Pvt. Ltd. The entire
land shown is under possession of OSCIPL.
Table 2-2: Land Profile of Proposed Orange Smart City Project
Site Name of Village Area in
Acres
T1 Boregaon, Shene, Ambeghar and Virani 723.33
T2 Belawade Budruk 102.40
T3 Balawali, Govirle, Kopar, Ambiwali and Hamrapur 83.59
T4 Mungoshi, Walak, , Belawade Khurd, Padale and Belawade Budruk 133.19
Total 1042.51
2.3 Demand Assessment
The demand assessment for the industrial use has been carried out by M/s Jones Lang LaSalle
(JLL) which has vast experience in market assessment. The assessment was carried out assuming
production / export trend for the industry. JLL study recommended development mix for the
project based on their demand analysis, for industrial commercial and residential development in
the region taking into account the infrastructure projects coming up in the region including NMIA,
MTHL, JNPT expansion, etc. and the same is as under. The summary of the recommended
development mix assessment is given Table 1-1 : Details of land-use parcel-wisebelow:
Table 2-3: Summary of the industrial demand assessment
Industry Type Area demand in the region
(Acres)
Logistic 114.93
Engineering 118.42
Agro 74.88
Electronics & Semi-conductor 19.71
Life Sciences 21.29
Information Technology 22.06
Gems & Jewellery 5.22
Research & Development 3.49
TOTAL 380.00

Final EIA Report – Orange Smart City, Pen, Raigad July 2018
38
BE/EIA-OSC/002
Based on the above assessment, modest refinements to future land use designations related to
industrial uses could be accommodated by OSCIPL without jeopardizing the overall industrial
market in the Region and industrial demand in OSC. Presently OSCIPL proposes to provide about
380 acres of land for industrial use in the Orange Smart City and balance for supporting activities.
Figure 2-1 shows distribution of Industrial Demand Assessment
Figure 2-1: Distribution of Industrial Demand Assessment
2.4 Product Mix Assessment
Based on the industrial demand assessment, the product mix for the development of OSC is worked
out considering to create Balanced & efficient land-use patterns, Mixed and complementary land
uses (i.e. Industrial, Residential, Commercial, Retail, Recreation).
The recommended land use mix at OSC is inclusive of all required land area provisions for
recreational green and open space, social infrastructure, utility, road and parking at detailed layout
level.is as follows: The OSC land use mix assessment in given in Table 2-4 below:
Table 2-4: Land-use mix assessment
Land-use Total (Acres) Percentage (%)
Industrial 380.00 36.45
Commercial Area 87.83 8.42
Residential Area 136.00 13.05
Major Roads 126.14 12.10
Undevelopable/Green/Open 254.95 24.46
Amenities/Utilities 57.59 5.52
Total 1042.51 100
2.5 Site Description
2.5.1 Site Location

Final EIA Report – Orange Smart City, Pen, Raigad July 2018
39
BE/EIA-OSC/002
The delineated Proposed Project is located in Pen Tehsil of Raigad district of Maharashtra State.
It partly falls in MMR & majorly in Raigad RP boundary. Project is scattered on four parcels,
namely, T1, T2, T3 & T4 in villages as mentioned in Table 2-2. The distance between these parcels
varies from 2 to 3 km. Project is located geographically between 18o42’14.11” N, 73o08’37.90” E
and 18o46’53.73” N, 73o07’28.52” E at an average altitude of 225 m from the sea level. The general
location of the project is shown in Error! Reference source not found. and the geographical
coordinates for the delineated area boundary for selected locations have been presented in Figure
2-2 below.
The proposed smart and sustainable OSC project site is located amidst scenic hills, rivers and
pastoral lands. It is located at the very foothills of the Western Ghats as they descend to the Arabian
Sea.

Final EIA Report – Orange Smart City, Pen, Raigad July 2018
40
BE/EIA-OSC/002
Figure 2-2: Location on google map
Table 2-5: Geographical Coordinates for the Delineated Area Boundary
Land Parcels Geographical Coordinates
T1
Latitude: 18042’14.11” N
Longitude: 73008’37.90” E
T2
Latitude: 18046’23.80” N
Longitude: 73007’17.44” E
T3
Latitude: 18046’53.73” N
Longitude: 73007’28.52” E
T4
Latitude: 18047’26.51” N
Longitude: 73005’27.74” E

Final EIA Report – Orange Smart City, Pen, Raigad July 2018
41
BE/EIA-OSC/002
2.6 Site Settings and Analysis
The sites are irregular in shape and located in four parcels and overlook the River Bogeshwari, &
Balganga. The T1 site is contoured and has a rocky terrain, with a little vegetation cover.
The proposed sites are open on all sides, connected by access to SH 88 and NH 66. The site is well
connected by Pen, Jite and Hamrapur railway routes. It has good proximity to JNPT and MTHL at
about 20.8 and 15 kms distance respectively. The infrastructure along proposed site and general
site environmental settings are presented in Table 2-6 and Table 2-7 respectively.
Table 2-6: Infrastructure along proposed Project Site
Sr. No. Feature Details
1 Nearest Highway NH 66 & SH 88 (Now notified as NH)
Proposed MTHL-15 km from north end (T3) (Aerial
distance)
2 Nearest Airport Chhatrapati Shivaji International Airport (40 km-
Aerial distance) from T3 land parcel
Proposed Navi Mumbai International Airport (from
the funnel zone): 19.83 km distance from northern
edge of T3 land parcel___
3 Nearest Railway Station Pen on Konkan Railway Route (4.7 km from T-1 Land
parcel), Hamrapur on Panvel –Roha railway route
(1.14 km from T3 land parcel) (All aerial distances)
4 Nearest Town Pen (5 km) from T1 –Land parcel (Aerial distance)
5 Sea Port JNPT: 20.8 km from north end (T3) (Aerial distance)
Table 2-7: Salient features along proposed Project Site
Sr. No. Feature Details
1 Altitude MSL Approximately 225 m
2 Climatic Condition Average Annual Temperature -28°C, Dominant Wind
Direction– SW and Speed 14 km/h, Relative Humidity
82%, Average Annual rainfall – 3000 mm
3 Topography Elevation range of T1 land parcel: 26 to 340 m
Elevation range of T2 land parcel: 40 to 80 m
Elevation range of T3 land parcel: 40 to 80 m
Elevation range of T4 land parcel: 7 to 55 m
4 Protected Forest/ Reserve
Forest
Nil
5 Archaeological Monuments/
Religious Historic Places
Karnala Fort (Approximately 16.5 km away from the
project site)
6 Water bodies (River/ Lake/
Natural Streams/Reservoir)
Hetavane Dam, Ambeghar Dam, Bhogeshwari River
& Balganga River
7 Defense Installations None
8 Seismic Zone Zone - IV

Final EIA Report – Orange Smart City, Pen, Raigad July 2018
42
BE/EIA-OSC/002
Sr. No. Feature Details
9 Reserved and Protected
Forest / Nearest National
Park / Wildlife Sanctuary
Buffer Zone of Karnala Bird Sanctuary is approx. 6.7
km away from T3 Land Parcel.
2.7 Site Description
The proposed Orange Smart City is spread over four land parcels, namely, T1, T2, T3 & T4
admeasuring total plot area of 1042.51 acres.
2.7.1 T1 Parcel
The T1 site is located at latitude: 18°43'33.99"N, longitude: 73° 7'44.05"E around the villages of
Boregaon, Shene, Virani and Ambegarh of Pen Taluka, Maharashtra. The northern part of the site
has a frontage to the State Highway-88 i.e. Pen-Khopoli Road connecting it to the National
Highway-66 in the Western side and the Mumbai-Pune Expressway in the eastern side.
This Parcel is situated at southern catchment of Hetavane (Bhogishwari) river. A South –North
valley divides this Parcel in two hills. Side slopes of the valley are nearly 1v:2.5h. This valley has
upstream maximum elevation of 220m and downstream minimum elevation of 26m where it meets
the river, whereas ridge has highest elevation of 340m at top. An irrigation canal from Hetavane
dam also runs at base of this Parcel.
The terrain of this land parcel contributes to moderately steeper slopes requiring mitigation for
smooth future vehicular and pedestrian movements. The terrain at the top is flatter, thereby creating
future opportunities for development. Presently western side of the site is accessed through a ODR
linking the site directly to State Highway-88. Figure 2-3 shows elevations and slopes at T1
Figure 2-3: Elevations and Slopes at T1
2.7.2 T2 Parcel
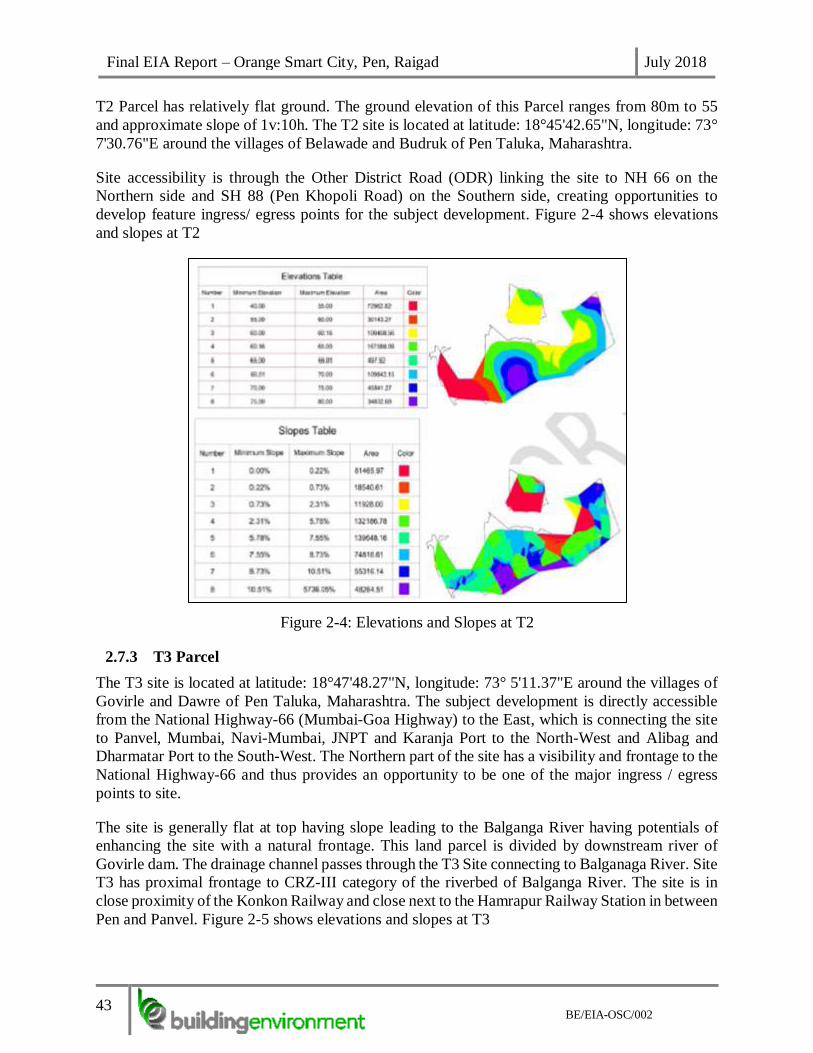
Final EIA Report – Orange Smart City, Pen, Raigad July 2018
43
BE/EIA-OSC/002
T2 Parcel has relatively flat ground. The ground elevation of this Parcel ranges from 80m to 55
and approximate slope of 1v:10h. The T2 site is located at latitude: 18°45'42.65"N, longitude: 73°
7'30.76"E around the villages of Belawade and Budruk of Pen Taluka, Maharashtra.
Site accessibility is through the Other District Road (ODR) linking the site to NH 66 on the
Northern side and SH 88 (Pen Khopoli Road) on the Southern side, creating opportunities to
develop feature ingress/ egress points for the subject development. Figure 2-4 shows elevations
and slopes at T2
Figure 2-4: Elevations and Slopes at T2
2.7.3 T3 Parcel
The T3 site is located at latitude: 18°47'48.27"N, longitude: 73° 5'11.37"E around the villages of
Govirle and Dawre of Pen Taluka, Maharashtra. The subject development is directly accessible
from the National Highway-66 (Mumbai-Goa Highway) to the East, which is connecting the site
to Panvel, Mumbai, Navi-Mumbai, JNPT and Karanja Port to the North-West and Alibag and
Dharmatar Port to the South-West. The Northern part of the site has a visibility and frontage to the
National Highway-66 and thus provides an opportunity to be one of the major ingress / egress
points to site.
The site is generally flat at top having slope leading to the Balganga River having potentials of
enhancing the site with a natural frontage. This land parcel is divided by downstream river of
Govirle dam. The drainage channel passes through the T3 Site connecting to Balganaga River. Site
T3 has proximal frontage to CRZ-III category of the riverbed of Balganga River. The site is in
close proximity of the Konkon Railway and close next to the Hamrapur Railway Station in between
Pen and Panvel. Figure 2-5 shows elevations and slopes at T3

Final EIA Report – Orange Smart City, Pen, Raigad July 2018
44
BE/EIA-OSC/002
Figure 2-5: Elevations and Slopes at T3
2.7.4 T4 Parcel
The T4 site is located at latitude: 18°46'42.20"N, longitude: 73° 6'50.02"E around the villages of
Valak, Mungeshi, Belwade and Khurd of Pen Taluka, Maharashtra. Present ODR (Other District
Road) connecting the site to NH-66. The ingress and egress points are presently narrow and
widening of approach road would be necessary.
The site boundary along the northern side has larger parcel of flat land, which is favourable for
development. This Parcel is situated at base of major hills on West. T4 Parcel is made up of
eighteen small land parcels and two major parcels. One of the major parcel have ground elevation
ranges from 55m to 7m. And other major parcel is relatively hilly ground with elevations ranges
from 86m to 12m. Figure 2-6 shows elevations and slopes at T4
Figure 2-6: Elevations and Slopes at T4
Site photographs are presented in figure 2-7

Final EIA Report – Orange Smart City, Pen, Raigad July 2018
45
BE/EIA-OSC/002

Final EIA Report – Orange Smart City, Pen, Raigad July 2018
46
BE/EIA-OSC/002
T3 Land Parcel
Figure 2-7: Site Photograph
2.8 Site Connectivity
2.8.1 Accessibility to site by Road
Site (T3) is readily accessible through the National Highway 66. The site (T1) is adjacent to SH
88 (Pen - Khopoli Highway) through the proposed access via 18-metre wide road, apart from this,
the subject-site region (T2 & T4) is also connected by about 6 km. of road length fall under major
district roads and other district roads which are maintained by PWD and Zilla Parishad. Figure2-
8 and Figure 2-9 shows site connectivity and Road network in site region respectively

Final EIA Report – Orange Smart City, Pen, Raigad July 2018
47
BE/EIA-OSC/002
Figure 2-8: Site Connectivity
The major National, State Highways, Railways and expressway in vicinity to the subject site are
provided in the following tables 2-8 and 2-9:
Table 2-8: National Highways and Expressway in site surroundings
Sr. No. Name of Road From - To
1 Mumbai Pune Expressway Kalamboli (Navi Mumbai) to Pune
2 NH 4 Mumbai to Pune further down to Banglore
3 NH 4 B Panvel to JNPT
4 NH 3 Mumbai to Nashik further down to Agra
5 NH 8 Mumbai to Ahmedabad

Final EIA Report – Orange Smart City, Pen, Raigad July 2018
48
BE/EIA-OSC/002
Sr. No. Name of Road From - To
6 NH 17 Mumbai to Goa
Table 2-9: The Major State Highways in the immediate surroundings
Sr. No. Name of Road From - To
1 SH 88 Pen Khopoli
2 SH 85 Khopta - Sai
4 SH 81 Ghavan Phata to SH 85
5 SH 54 Uran to Panvel

Final EIA Report – Orange Smart City, Pen, Raigad July 2018
49
BE/EIA-OSC/002
Figure 2-9: Road network in site region
Source: Revised draft DPR (June 2018)
2.8.2 Accessibility to Site by Railway
Pen Railway Station is one of the major rail terminus. It is situated on the Panvel - Roha route of
Central Railway. It is at a distance of 103.59 km from Chhatrapati Shivaji Terminus via Diva
junction. Its station code is PEN. It belongs to the Mumbai division of Central Railway. Hamarapur
Railway Station is also one of the railway stations on the Panvel-Roha route of Central Railway
abutting Orange Smart City. It is situated between Jite and Pen railway stations.

Final EIA Report – Orange Smart City, Pen, Raigad July 2018
50
BE/EIA-OSC/002
Konkan railway line runs parallel to project region along NH-66. The railway stations within the
project region are Hamarapur and Pen along NH-66. Pen Railway Station is a major rail terminus.
Panvel-Hamrapur-Pen konkan railway line connects the OSC project region with 30 km and 36km
distance from Panvel respectively. Passenger train connectivity is available at the Pen station for
local commute as well as for select long distance trains. Figure2-10 shows Mumbai suburban rail
network. Rail Cargo access points are available at the JNPT terminal of the Dedicated freight
corridor about 45km away for access to the Northern markets on the DMIC line as well as the
Southern Markets on the BMIC line. In addition to this at Nagothane, which is about 30 km away,
a Roll-on Roll-off facility for trucks plying to the Konkan belt is available. The facility provides
significant timesaving for cargo by limiting the road travel on hilly terrain through the Western
Ghats.
Figure 2-10: Figure showing Mumbai Suburban Rail Network
Source: Revised draft DPR (June 2018)

Final EIA Report – Orange Smart City, Pen, Raigad July 2018
51
BE/EIA-OSC/002
2.8.3 Accessibility to Site by Air
Proposed Navi Mumbai international airport: Proposed Navi Mumbai international airport is
about 26 km from the project site along NH - 66 and also connectivity will be further enhanced
through the development of proposed elevated corridor.
Mumbai international airport (Chhatrapati Shivaji International Airport): The Mumbai
international airport is about 85 Kms from the project site and has undergone sea change and
capacity expansion many times over. The city has been well served by the airport, but it is
becoming increasingly difficult to keep up with the exponentially growing demand of the Indian
aviation industry.
Pune airport: Pune also has an international airport approximately 120 km from the site, making
it a viable alternative to Mumbai given the travel times in question. The airport is well connected
to the domestic market and has limited international connectivity as well. Figure 2-11 shows
nearby airport connectivity from the site

Final EIA Report – Orange Smart City, Pen, Raigad July 2018
52
BE/EIA-OSC/002
Figure 2-11: Map showing nearby air connectivity from site
Source: Revised draft DPR (June 2018)
2.8.4 Accessibility to Site by Sea Port
Jawaharlal Nehru Port Trust, India’s largest & most modern sea port that provides cargo linkages
to all the international markets, is located at a distance of about 20.8 km (aerial distance). It is
connected to this site by Land Parcel T3. Proximity to Mumbai Port and proposed Rewas Port,
another major port in India. The connectivity network around JNPT is proposed to be upgraded as
it is the terminal point of the DMIC corridor.

Final EIA Report – Orange Smart City, Pen, Raigad July 2018
53
BE/EIA-OSC/002
Karanja Port is located in Uran, Raigad district in close proximity to OSC. The site’s prime location
will be key to the facility’s success, given its proximity to Mumbai and the fact that the surrounding
area is expected to undergo substantial regeneration including the construction of the proposed
Mumbai-Trans Harbour Link bridge, the Dedicated Freight Corridor, expansion of JNPT and the
proposed new international airport, all of which will significantly improve transportation links and
access to and from the facility.
JSW Dharamtar Port, at Dolvi in Raigad District, is an existing port and terminal facility, located
in Amba river about 23 nautical miles away from Mumbai Harbour by sea route. This upgradation
will ensure faster connectivity to the Proposed Project. Figure 2-12 shows nearby ports.
Figure 2-12: Map showing nearby ports from site
Source: Revised draft DPR (June 2018)
2.9 Traffic Analysis & Forecast
The major roads present close to the different parcels are NH 66, SH 88 and Balavali road. Apart
from this there are a number of government schemes proposed in the future that shall improve the
future traffic infrastructure which includes the following:

Final EIA Report – Orange Smart City, Pen, Raigad July 2018
54
BE/EIA-OSC/002
The project is connected to the major road network via NH 66 road and SH 88. Apart from that,
there is also a Hamrapur-Pen railway line moving close to the project boundary. The two major
roads mentioned above serve as the pathway for traffic movement from and towards the project.
The current condition of the access road network is shown in the below in Figure 2-133.
Figure 2-13: Images showing the current scenario of the road network of NH 66 and SH 88
respectively
The traffic volume contribution in the current year would be mostly due to the NH 66 and SH 88
road only as they are the major carriers of the traffic through and toward the project location. NH
66 and SH 88 comes in the category of arterial road and is a 4-lane two-way road. The Table 2-9
shows the traffic scenario on the aforesaid three roads in 2018.
Table 2-8: Current Traffic projections in vehicles / hr (2018)
Balavali NH 66 SH 88
2018 2018 2018
Two W 75 646 192
Three Wheeler 19 83 25
Four W 1 1266 376
LCV 0 56 17
Bus 4 49 15
Truck 0 111 33
Total 99 2211 657
The above table reflects that the category of car, van and jeep had major contribution to the traffic
at each of the roads. The other major categories contributing to the traffic were 4 wheelers, 3
wheelers.
2.10 Project Overview
The proposed project is an Integrated Industrial Township and has been planned as a mixed-use
development comprising of residential, industrial and commercial land uses. The following
sections provide brief description of the project.
2.11 Development Concept
Rapid Urbanization is posing infrastructural challenges to governments & municipalities. As cities
grow and expand their services, management and governance become increasingly complex. The
proposed Orange Smart City project will provide infrastructure for industries, academic

Final EIA Report – Orange Smart City, Pen, Raigad July 2018
55
BE/EIA-OSC/002
institutions, students & faculty housing and support social & physical infrastructure. It is intended
to have sustainable economic base around industries and educational, institutional activities for
technical & professional skill development. The proposed Orange Smart City Project of 1042.51
acres is divided into 4 land parcels inclusive of the Main trunk road and the Arterial roads. A
smarter, efficient city that would encompass aspects of intelligent transportation, security, energy
management. Table 2-9 presents principles for development of concept master plan.
Development concept will implement Integrated IT and telecommunication network for data,
voice, video and internet with uninterruptible power supply, smart meters, power system
automation, traffic management system, Surveillance CCTV‘s, Access control system etc. The
Orange Smart City will foster learning, earning and living. It aims to take advantage of the
synergistic relationship that can be established between centers of learning and working. The
proposed project aims to create such a center near Pen. Co-location of educational institutions in
the industrial township makes collaboration between academia and industry more efficient and
effective. Presence of industries in the same township not only will have an impact on the course-
curriculum and vice-versa, it could also improve employment opportunities for graduates of these
institutes, and a ready talent pool for industries to recruit from.
Table 2-9: Key Guiding Principles for Development of Concept Master Plan
Design Principle Strategy
Sustainable Development Right balance of jobs to resident population to be economically
self-sufficient and self-supporting.
About 15% land within the townships to be set aside for clean
and green industry to provide employment opportunities for the
residents living there especially the female workers.
Modular township development of about 1042.51 acres for ease
of implementation and of sufficient critical mass
Optimum and Effective
Land Utilization
Integration with development of infrastructure within the
proposed development.
Provision of high density development along major
transportation network to promote Transit Oriented Development
(TOD)
The Non-buildable area can entirely be utilized for creation of
green area by undertaking afforestation on the hill slopes
Maximum Network
Efficiency & Regional
Connectivity
Provision of good infrastructure and utilities including a
comprehensive transportation system that will satisfy the needs
of residents and workers.
Ensuring good accessibility with efficient road system with
linkages to main landmarks like MTHL, JNPT, Airport, NH and
SH along with DMIC zone.
Provision of a hierarchy of roads and standardization of road
widths for ease of implementation and to match with city level
network.
All-inclusive planning strategy for the entire region and regional
connectivity.

Final EIA Report – Orange Smart City, Pen, Raigad July 2018
56
BE/EIA-OSC/002
Design Principle Strategy
Best Deal with Social &
Environment Issues/
Concerns
Juxtaposition of industrial clusters based on pollution standards
with adequate separation buffers between the industrial and
residential areas. Cleaner industries located within new towns.
This is to provide employment opportunities for residents and
curb inter- region traffic flow.
Conservation of natural features.
Provision of a high quality environmental living with green
vistas, good landscape, range of leisure and recreation facilities.
A full range of social community and institution facilities to
support different income groups within the target population of
Investment Region.
Barrier Free Infrastructure Proposed project will create vital infrastructure of roads,
communication networks, commercial facilities and certain
common infrastructure that will benefit the local population as
well as improve the region’s perception for real estate
developments
Design to include pedestrian walkways and green connectors at
accessible locations to make the townships more walk able with
convenient access to amenities.
Appealing Urban Form/
Visual Aesthetics
Introduce linear greens into the residential and industrial
township
Provide conducive environment by water collection / retention
ponds / reservoir.
Tree planting strips and buffers along major roads and arterials/
sub-arterials for visual relief and green vistas.
Education and Employment Human capital will be created through educational institutes of
the Proposed Orange Smart City project and contribute to the
overall growth of the community, region, and of nation.
Industrial city will provide employment opportunities for
individuals of diverse capabilities ranging from unskilled and
semi-skilled to skilled professionals and managers
Innovation &
Entrepreneurship
Intellectual Property
Proposed Project will be able to incubate innovative business
ideas by providing guidance, and other support. Businesses thus
launched will be able to further strengthen the virtuous cycle of
education and employment
Proposed Industrial development along with other companies
will generate valuable intellectual property
2.12 Proposed Concept Master Plan and basis for the location of the land parcels
The concept master plan for the delineated ‘Proposed Integrated Township Project’ has been
designed considering the existing MMR, Raigad and DMIC Influence zone as the growth centre.
The proposed Logistic hubs, warehousing and freight terminals and proximity of JNPT & MTHL
will be serving as strategic inland port and primary discharge point for transportation of goods.
This has been considered as the focal point for developing the master plan for the Proposed Orange

Final EIA Report – Orange Smart City, Pen, Raigad July 2018
57
BE/EIA-OSC/002
Smart City project. The proposed concept master plan for the region has been provided as Figure
2-14.
Due to geographical profile of Proposed Project Site, the entire area has been divided into four
planning zones. Each zone is identified based on actual profile of project site boundary, physical
distribution of hubs in Land use linked by main trunk road and ease of implementation. Proposed
zones are shown in the map given below in Figure 2-15 to Figure 2-1818.
Based on above maps it can be observed that all planning zones basically consist of industrial
establishment along with initial supporting residential, commercial facilities and social
infrastructure. The quality of life in any town depends upon the availability of and accessibility to
quality facilities indicated in the Master Plan and Community Facilities, which are indicated at the
layout plan level in various zones. Together, these include facilities pertaining to health, education,
sports and socio-cultural facilities. Apart from these basic utilities like water supply and sewerage
system, pumping stations, service reservoirs and related infrastructure, electrical substations and
power distribution, fire station, information and communication system etc. are planned to cater
industrial and residential establishments along with all facilities.
The basis for locating the land parcels is given below:
The total land of OSC is divided into 4 parcels, T1, T2, T3 and T4. T1 is the largest land parcel,
located in the hilly region close to the city of pen. The rest of the parcels i.e. T2, T3, & T4 are
smaller and are located towards the north along the proposed Elevated Freeway and parallel to
Nh17, which will allow better connectivity to them in future. Amongst all T3 is located on the
northern most part having access from the sea creek.
The total area of OSC is segregated in two types, the Undevelopable and developable land. This
division of land gives us open areas which act at buffer zones between the industrial and support /
residential. All the developable land except for T4 is further divided into Industrial (60%) and
Support (40%). The detailed review is as below
T1:T1 is the largest Parcel with a North-south valley that divides the parcel in two hills. The terrain
of the valley is steep and undevelopable. The undevelopable land acts as a natural barrier and
buffer zone between Industrial and Residential areas. All the proposed Residential areas are placed
on the Eastern side of the valley and industrial areas on the west whereas the Industrial areas have
been proposed to be located in the areas of moderate slopes. T1 has direct connectivity from SH88
and hence, the commercial areas are provided on the northern most part of the parcel having better
access.
T2:T2 has moderate slope. It is further sub-divided in to three parts, Industrial, residential and
commercial. The layout of these areas has been done such that we get a buffer zone between the
Industrial and Residential. The Industrial zone is placed in the largest sub-parcel so as the
industries can have larger plots. The residential areas are placed away from the entry and the
highways. This reduces the impact of Noise and Air pollution from the highways.T2 has a flatter
topography and more usable areas.

Final EIA Report – Orange Smart City, Pen, Raigad July 2018
58
BE/EIA-OSC/002
T3:T3 is the smallest parcel of all. It has direct connectivity from NH 17. Hence, maximum areas
have been provided for Industries and the commercial areas are placed on plots having access form
the Highway.T3 has a flatter topography and more usable areas. The Types of Industries have been
decided depending on the proximity to NH 17 and CRZ area.
T4:T4 has moderate slopes and has sub-parcels connected by district roads. These parcels have
smaller individual areas to place any industries. Hence, the entire T4 parcel is kept for Residential
and commercial areas.

Final EIA Report – Orange Smart City, Pen, Raigad July 2018
59
BE/EIA-OSC/002
Figure 2-14: Concept Master Plan and Zoning

Final EIA Report – Orange Smart City, Pen, Raigad July 2018
60
BE/EIA-OSC/002
2.13 Area and the population details
The land use details of all the parcels are given in Table: 2-10.
Table 2-10: Land use details of all the parcels
Land use Land Use in Acres
T1 T2 T3 T4 Total %
Industrial 282.00 58.00 40.00 0.00 380.00 36.45
Commercial 38.33 7.87 2.40 39.23 87.83 8.42
Residential 58.00 8.00 8.00 62.00 136.00 13.05
Major Roads 87.00 12.29 10.87 15.98 126.14 12.10
Undevelopable / Green /
Open Space
220.00 10.24 16.72 7.99 254.95 24.46
Amenities / Utilities /
Facilities
38.00 6.00 5.60 7.99 57.59 5.52
Total 723.33 102.40 83.59 133.19 1042.51 100
Note: All dimensions in Acre except percentage
The Table 2-10 reflects that the total areas of T1, T2, T3, and T4 are 723.33, 102.40, 83.59 and
133.19 acres. The major component of the land use is industrial land use amounting to a percentage
of 36%. Followed by undevelopable/ green/open area amounting to 25%. The other significant
areas are residential area (13%) and major roads (12%).

Final EIA Report – Orange Smart City, Pen, Raigad July 2018
61
BE/EIA-OSC/002
Figure 2-15: Layout plans for T1 land parcel
Labour camp for 200 workers (space requirement -620 sq.m)

Final EIA Report – Orange Smart City, Pen, Raigad July 2018
62
BE/EIA-OSC/002
Figure 2-16: Layout plans for T2 land parcel
Labour camp location for 100 workers (space requirement – 310 sq.m)
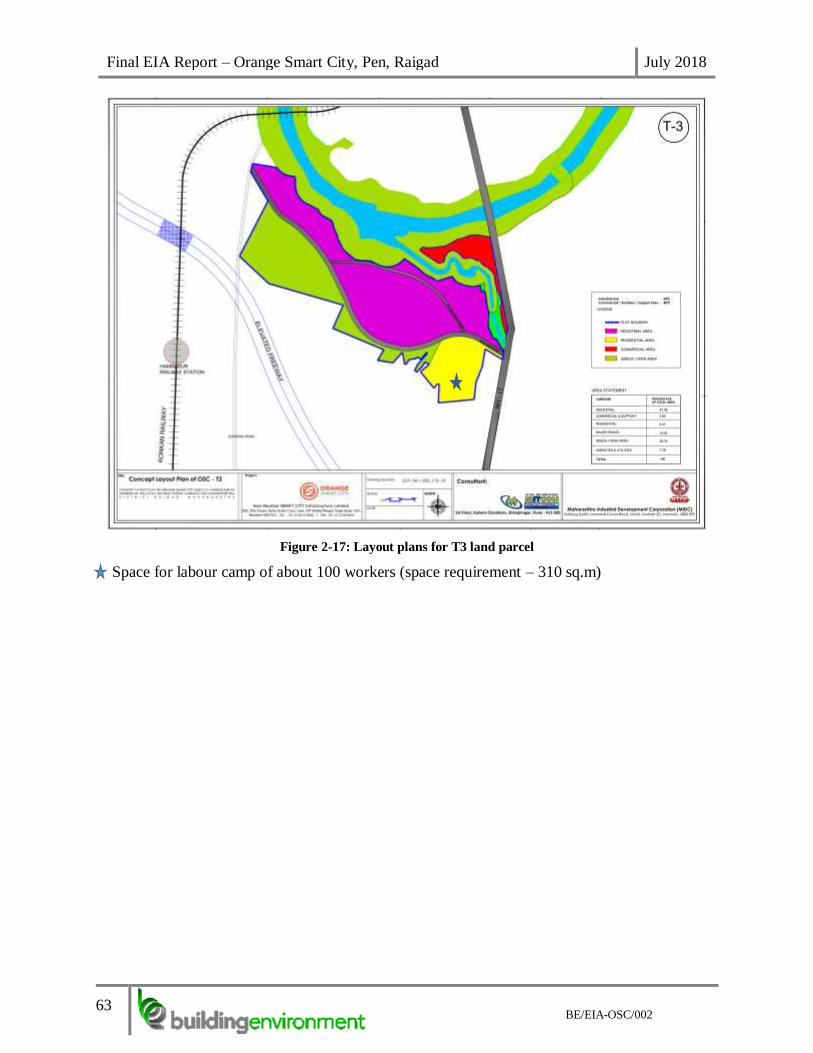
Final EIA Report – Orange Smart City, Pen, Raigad July 2018
63
BE/EIA-OSC/002
Figure 2-17: Layout plans for T3 land parcel
Space for labour camp of about 100 workers (space requirement – 310 sq.m)

Final EIA Report – Orange Smart City, Pen, Raigad July 2018
64
BE/EIA-OSC/002
Figure 2-18: Layout plans for T4 land parcel
Labour camp of 100 workers (space requirement of about 310 sq.m)

Final EIA Report – Orange Smart City, Pen, Raigad July 2018
65
BE/EIA-OSC/002
The Land-use allocation and break-up formulated are presented from Table 2-10 till Table 2-133.
Table 2-10: Land use break up of land parcel –T1
Are
a
(Acr
es)
Are
a
(m2)
Are
a
(Sq
.Ft)
FS
I co
nsi
der
ed
Bu
ilt-
Up
Are
a
(m2)
Bu
ilt-
Up
Are
a
(MS
M)
La
nd
Dis
trib
uti
on
(%)
Industrial 282.00 1141254 12284458 2.00 2282508 2.28 39
Commercial
Area 38.33 155122 1669728 2.00 310243 0.31 5
Residential Area 58.00 234726 2526591 2.00 469452 0.47 8
Major Roads 87.00 352089 3789886 - 0 - 12
Undevelopable/
Green/Open 220.00 890340 9583620 0.10 89034 0.09 30
Amenities/
Utilities 38.00 153786 1655353 0.10 15379 0.02 5
Total 723.33 2927317 31509635 - 3166616 3.17 100
Note: MSM: Million Square meter and sq.ft.: square feet
Table 2-11: Land use break up of land parcel –T2
Are
a
(Acr
es)
Are
a
(m2)
Are
a
(Sq
.Ft)
FS
I co
nsi
der
ed
Bu
ilt-
Up
Are
a
(m2)
Bu
ilt-
Up
Are
a
(MS
M)
Lan
d D
istr
ibu
tion
(%)
Industrial 58.00 234726 2526591 2.00 469452 0.47 57
Commercial
Area 7.87 31850 342832 2.00 63700 0.06 8
Residential Area 8.00 32376 348495 2.00 64752 0.06 8
Major Roads 12.29 49738 535376 - 0 - 12
Undevelopable/
Green/Open 10.24 41441 446074 0.10 4144 0.00 10
Amenities/Utilit
ies 6.00 24282 261371 0.10 2428 0.00 6
Total 102.40 414413 4460739 - 604476 0.60 100
Note: MSM: Million Square meter and sq.ft.: square feet

Final EIA Report – Orange Smart City, Pen, Raigad July 2018
66
BE/EIA-OSC/002
Table 2-12 : Land use break up of parcel –T3
Are
a
(Acr
es)
Are
a
(m2)
Are
a
(Sq
.Ft)
FS
I co
nsi
der
ed
Bu
ilt-
Up
Are
a
(m2)
Bu
ilt-
Up
Are
a
(MS
M)
La
nd
Dis
trib
uti
on
(%)
Industrial 40.00 161880 1742476 2.00 323760 0.32 48
Commercial
Area 2.40 9713 104549 2.00 19426 0.02 3
Residential Area 8.00 32376 348495 2.00 64752 0.06 10
Major Roads 10.87 43999 473605 - - - 13
Undevelopable/
Green/Open 16.72 67658 728268 0.10 72827 0.07 20
Amenities/
Utilities 5.60 22663 243947 0.10 24395 0.02 7
Total 83.59 338289 3641340 - 505159 0.51 100
Note: MSM: Million Square meter and sq.ft.: square feet
Table 2-13 : Land use break up of parcel –T4
Are
a
(Acr
es)
Are
a
(m2)
Are
a
(Sq
.Ft)
FS
I co
nsi
der
ed
Bu
ilt-
Up
Are
a
(m2)
Bu
ilt-
Up
Are
a
(MS
M)
Lan
d D
istr
ibu
tion
(%)
Industrial 0.00 0 0 0.00 - - 0
Commercial
Area 39.23 158764 1708934 2.00 317528 0.32 29
Residential Area 62.00 250914 2700838 2.00 501828 0.50 47
Major Roads 15.98 64671 696119 - 0 - 12
Undevelopable/
Green/Open 7.99 32336 348060 0.10 3234 0.00 6
Amenities/
Utilities 7.99 32336 348060 0.10 3234 0.00 6
Total 133.19 539020 5802011 - 825823 0.83 100
Note: MSM: Million Square meter and sq.ft.: square feet

Final EIA Report – Orange Smart City, Pen, Raigad July 2018
67
BE/EIA-OSC/002
The summary of proposed built up area in million sq.m is given in Table2-14 below:
Table 2-14: The summary of proposed built up area in million sq.m
Landuse T1 (MSM) T2 (MSM) T3 (MSM) T4 (MSM Total
(MSM)
Industrial 2.28 0.47 0.32 0.00 3.08
Commercial
Area 0.31 0.06 0.02 0.32 0.71
Residential Area 0.47 0.06 0.06 0.50 1.10
Major Roads - - - - 0.00
Undevelopable/
Green/ Open 0.09 0.00 0.07 0.00 0.17
Amenities/Utiliti
es 0.02 0.00 0.02 0.00 0.05
Total 3.17 0.60 0.51 0.83 5.10
The Total Proposed Built-up area in Orange Smart City is 5.10 MSM and this area is spread over
the four land parcels.
Note– The FSI figures considered for the calculations are considering upcoming major
development projects viz elevated freeway, Navi Mumbai International Airport etc.
However, it should be noted that the maximum permissible FSI for residential and commercial in
Mumbai region is 1.33 which can be increased upto 4 on payment of premium/ TDR, and the same
is applicable for industrial areas.
2.14 Population projection and Employment Generation
The Proposed project comprises of 4 land parcels admeasuring 1042.51 Acres. The land parcels
T1, T2, T3 and T4 are located in the vicinity and have good connectivity from existing road
network and transit facilities. The details regarding the estimated population projection and
employment generation calculated on the basis of land use proposed in the project has been
explained in the subsequent sections.
2.14.1 Resident Population Estimates
The estimates for resident population in OSC has been calculated on the basis of the total proposed
built-up area in all four land parcels T1, T2, T3 and T4. The built-up area for each individual land
parcel has been bifurcated into housing typologies based on the types of units and the area of each
single unit. The housing typologies include dwellings for following user groups:
➢ Lower Income Group Middle Income Group
➢ Upper Middle-Income Group
➢ Higher Income Group
Standard areas have been designated to each of these housing typologies and number of units for
each type has been calculated. The total number of residents has been calculated by assuming

Final EIA Report – Orange Smart City, Pen, Raigad July 2018
68
BE/EIA-OSC/002
average household size of 4 persons per Household. The Table 2-155 states the calculations for all
four land parcels:
Table 2-15: Residential Population Estimates
Land
Parcel
Total Plot
Area
(Acres)
Net Residential
Area
(Acres)
Residential Built-
up Area (m2)
Estimated Resident
Population
T1 723.33 58 469452 31161
T2 102.40 8 64752 4298
T3 83.59 8 64752 4298
T4 133.19 62 501828 33310
Total 1042.51 136 1100784 73068
2.14.2 Working Population Estimates
The estimates for working population in OSC has been calculated on the basis of the total proposed
built-up area in all four land parcels T1, T2, T3 and T4. The calculations are based on the type of
industries proposed in each of the land parcel as per JLL study and the areas allotted for each type
of industry as per the proposed land use plan. The number of employees per acre has been
calculated as per standard assumptions. Also, the same methodology has been adopted while
calculating the worker population in commercial and institutional areas. Floating population for
each land parcel has been calculated as per 40% of the direct employees. The description of all
these calculations is in the Table 2-166
Table 2-16: Working Population Estimates
Lan
d P
arc
el
Ind
ust
rial
Bu
ilt
Up
Are
a
(m2)
Com
mer
cial
Bu
ilt
Up
Are
a
(m2)
Ind
ust
rial
Em
plo
ym
ent
Com
mer
cial
Em
plo
ym
ent
Ind
irec
t/
Flo
ati
ng
Em
plo
ym
ent
Tota
l
Em
plo
ym
ent
T1 2282508 310243 35746 19165 21964 76876
T2 469452 63700 13910 3935 7138 24982
T3 323760 19426 12859 1200 5624 19683
T4 0 317528 0 19615 7846 27461
Total 3075720 710896 62515 43915 42572 149002
So, a conclusion of all the above table states that the entire project site will generate roughly 2.22
lakh people out of which it is expected that 33% population will be residing in OSC.
2.15 Proposed Industrial Area
The total land allocation for industrial development in Orange Smart City is 380 acres which
amounts to 36.45% of the total land available. The proposed industrial area has been allocated in
T1, T2 and T3 parcels and shown in Table 2-177 and

Final EIA Report – Orange Smart City, Pen, Raigad July 2018
69
BE/EIA-OSC/002
8.
Table 2-17: Type of Industries and Parcel-wise Land Allocation
Type of Industry T1
(Acres)
T2
(Acres)
T3
(Acres)
T4
(Acres)
Engineering 104.4 13.98 - -
IT - 9.08 12.97 -
Agro 67.9 6.99 - -
Life Sciences - 10.48 10.81 -
Logistic 104.4 10.48 - -
Research & Development - 3.49 - -
Gems & Jewellery 5.2 - - -
Electronics & Semi-conductor - 3.49 16.22 -
Total 282 58 40 -
Note- area allocation for Category ‘A’ industries and its required CETP & MEE facility will be
considered under total industrial area allocation of 282 acres of T1.
Table 2-18: Land Parcel wise Type of Industry with Tentative Built-up Areas
Type of Industry FSI
Considered
T1
(sq ft)
T2
(sq ft)
T3
(sq ft)
T4
(sq ft) Total
Engineering 2 9099599 1217634 - - 10317233
IT 2 - 791462 1130255 - 1921717
Agro 2 5914739 608817 - - 6523556
Life Sciences 2 - 913226 941879 - 1855105
Logistic 2 9099599 913226 - - 10012824
Research &
Development 2 - 304409 - - 304409
Gems & Jewellery 2 454980 - - - 454980
Electronics & Semi-
conductor 2 - 304409 1412819 - 1717227
Total 24568916 5053181 3484953 - 33107050
Types of industries in T1, T2 and T3 land parcels are shown in figure 2-19, figure 2-20 and figure
2-21, respectively and Table2-17.

Final EIA Report – Orange Smart City, Pen, Raigad July 2018
70
BE/EIA-OSC/002
Figure 2-19: Type of industries in T1

Final EIA Report – Orange Smart City, Pen, Raigad July 2018
71
BE/EIA-OSC/002
Figure 2-20: Types of industries in T2
Table 2-19: Type of industries in each category
Category Type of industry
Category A and Life sciences Pharmaceutical Bulk drugs and intermediates
Engineering Automotive industries preferably One anchor unit and others will be Tier 2 and 3 Category
Agro/Food Processing Fish, Poultry and Meat processing Food processing and packaging Sorting grading and cold storage
Logistic Temperature controlled storage, CFS, warehousing etc.
Research & Development R&D for manufacturing and biotech etc.
Gems & Jewellery Diamond processing and Jewellery making
Electronics & Semi-
conductor
Manufacture of domestic electric appliances

Final EIA Report – Orange Smart City, Pen, Raigad July 2018
72
BE/EIA-OSC/002
Figure 2-21: Type of industries in T3
2.16 Proposed Commercial Area
The total land allocation for Commercial development in Orange Smart City is 87 acres which
amounts to 8.3% of the total land available. The proposed commercial area has been allocated in
all four land parcels. These commercial areas will include convenience shopping areas,
neighborhood retail outlets, stores for personal care, recreational areas, hospitality and health care
facilities, etc. The details are depicted above. Table2-20 shows parcel-wise land allocation
Table 2-20: Parcel-wise land allocation & built-up areas for Commercial areas
Land Parcel
Commercial
Area
(Acres)
Commercial
Area
(m2)
T1 38 310243
T2 8 63700
T3 2 19426
T4 39 317528
Total 87 710896

Final EIA Report – Orange Smart City, Pen, Raigad July 2018
73
BE/EIA-OSC/002
2.17 Proposed Residential Area
The total land allocation for Residential development in Orange Smart City is 136 acres which
amounts to 13.04% of the total land available. The proposed residential area has been allocated in
all four land parcels. The details are presented below.
The built-up area for each individual land parcel has been bifurcated into housing typologies based
on the types of units and the area of each single unit. The housing typologies include dwellings for
LIG, MIG, Upper MIG and HIG user groups. In total 18267 dwelling units are proposed in Orange
Smart City. Table 2-21: Total land allocation
Table 2-21: Total land allocation
Land Parcel
Residential
Area
(Acres)
Residential
(m2)
Total No. of
Dwellings
T1 58 469452 7790
T2 8 64752 1075
T3 8 64752 1075
T4 62 501828 8328
Total 136 1100784 18267
2.18 Proposed Amenities & Utilities
Amenities and Utilities in OSC have been proposed in all four land parcels on 57.59 acres of land
which makes up 6% of the total site area. The proposed amenities and utilities have been planned
aiming to make OSC a self-sufficient development project.
Some major proposed utilities are as below:
➢ Central Effluent Treatment Plant (CETP) & Multi Effect Evaporator (MEE): Considering
the inclusion of Category A industries and other water polluting industries, a CETP along
with MEE is considered. An area of 3 acres is allotted for the same excluding buffer areas.
Proposed CETP site is shown in Figure 2-22: Proposed CETP site

Final EIA Report – Orange Smart City, Pen, Raigad July 2018
74
BE/EIA-OSC/002
Figure 2-22: Proposed CETP site

Final EIA Report – Orange Smart City, Pen, Raigad July 2018
75
BE/EIA-OSC/002
➢ Landfill: A provision of landfill along with ancillary infrastructure is also considered and
shown in the plan, with total area of about 10 acres. Location of landfill is shown in Figure
2-23: Proposed land fill location.
Figure 2-23: Proposed land fill location

Final EIA Report – Orange Smart City, Pen, Raigad July 2018
76
BE/EIA-OSC/002
2.18.1 Landscape, Green and Open Space Development
OSC has been planned with an objective to enhance the vegetation cover, develop green envelope
and natural environment, by creation of a range of landscaped open spaces. The total green area
proposed shall be approx. 254.95 acres which accounts for 24.46% of the total OSC Site area. The
landscaping will be integral part of the development and shall be driven by emerging trends and
the rising popularity of garden outdoor spaces as an extension of built environment.
The green space proposed will accommodates a variety of recreational and adventure need while
integrating parks into a functioning urban environment. Each type of park provides a distinct range
of opportunities. Green spaces proposed at OSC shall exist in a great variety of shapes, forms and
types within the OSC urban fabric. The successful creation and development of the spaces are one
of the key elements required to achieve sustainable urban development.
The proposed green areas shall have plantation of local species. The landscape, green and open
space details are presented in Table 2-2222.
Table 2-22: Landscape, Green & Open Space Details
Sr. No. Particulars Acres % of OSC land
1. Open/Green Valley 208.50 20%
2. Parks and landscaped areas 46.45 4.46%
TOTAL 254.95 24.46%
2.18.2 Central Green / Valley
A large central green area, measuring approx. 208.50 Acres is planned and developed which will
act as a lung of the OSC. This green area is proposed for dense plantation of various types of local
species detailed out in the Green Development Plan in Chapter-9.
The vastness of this green area along with its central location makes it a major environmental
feature of proposed OSC development. This landscape area shall serve as Central Leisure Area
for all the users of OSC, as well as people of adjoining area. The said central green area shall have
dense plantation of trees& vegetation up to 8-10 m height. A pond/small lake shall be developed
as part of this central green to harvest rainwater from the catchment of OSC. The water body &
green vegetation, together shall lead to creation of pleasant, aesthetic and sustainable green
development.
2.19 Parks and landscaped areas
Apart from the aforesaid two categories of green developments, several large parks and landscape
areas are proposed as part of OSC Master Plan. The total area under this category of green
development is approx. 54 acres. These green areas are planned across various parcels of OSC,
and they shall provide dense green cover, accessible green space for OSC users at walking distance
of their work and living areas. Small ponds and water bodies shall be part of this category of green
areas, providing rain water harvesting, water for landscape and other non-potable uses. In addition
to above, trees and dense vegetation shall be planted along all major roads, offering green cover

Final EIA Report – Orange Smart City, Pen, Raigad July 2018
77
BE/EIA-OSC/002
and shade to road users and also assisting in encouraging pedestrian movement within OSC site
area.
2.20 Proposed Common use buildings in OSC
OSC shall provide plots for construction of following common use buildings as part of City Area
development, as part of OSC Master Plan: Some of these buildings shall be on standalone like
common facility block or training and management school. The common use buildings with built-
up areas is given in Table 2-233.
Table 2-23: Common use buildings with Built-up areas
Sr. No. Buildings / Facilities Built-Up Area (In sqm)
1 OSC Management Office 35,000
2 OSC Administration 1,00,080
3 MLCP (2 no’s ) 2,10,000
4 Hospital - 200 Bed 25,000
5 Police Station, Police posts, security offices 2,900/1000
6 Utility Plant - STP (24.50 MLD) 48,000
7 Utility Plant - WTP & Storage Tank 22,800
8 Bus Stop, Bus Terminal, Bus Parking, Taxi Parking 1,000
9 Common Service Block - Facilities 25,000
10 Common Service Block - Retail & Offices 25,000
11 Training Center 10,000
12 Training & Management School 50,000
13 Common Services Block - Recreation, Entertainment 20,000
14 Sports Club 10,000
15 Conference / Convention Center 50,000
16 Service Apartments 25,000
17 Temporary Warehouse, Site Offices 4,500
18 Exhibition Facility 10,000
19 Common Service Block - Art & Museum 10,000
20 Solid Waste Collection Center 10,800
Total 322,100
2.21 Resource requirements – Construction phase
2.21.1 Labor
It is estimated that the number of labourers for the T1, are 200nos. and 100 each for T2, T3 and
T4. The space requirement for labour camps assuming that 100 sq.ft (9.2 sq.m) space will be
required for 3 labourers – the space requirement for the labourer camps for T1,T2,T3 and T4 will
be 6666 sq.ft (620 sq.m) and 3333 sq.ft (310 sq.m) each for T2,T3 and T4 respectively.
Final EIA Report – Orange Smart City, Pen, Raigad July 2018
78
BE/EIA-OSC/002
The construction phase will include hiring of local laborer but considering the magnitude of
development, a temporary influx of population from outside areas is expected. The labour facilities
will be established and will be provided with water and power supply and sanitation facilities
including toilet facilities along with septic tanks.
2.21.2 Construction Material
The proposed project will involve large scale construction activities and will involve large
quantities of construction materials. The construction materials will be sourced only from
authorized quarries and local sources in and around the region.
2.21.3 Power Requirement
Power demand during initial period mainly will be for construction power which will be in the
range of 5 MVA. This will be made available by taking 22 kV supply from MSEDCL Raigad. The
ultimate power requirement for the development will be made available by taking 22/33 kV supply
from Pen substation. To fulfil the power requirement during outages, DG sets shall be utilized the
details of which have been discussed in the air quality impacts of the project.
2.21.4 Water Requirements
The water requirement for the construction phase will include water for construction activities
such as curing and formation of concrete mixtures and water for domestic consumption.
Considering the number of workers required for the development during construction as per NBC
norms, water demand for domestic consumption has been estimated to be about 80 m3/day which
may go up to 320 m3/ day at the peak construction period. Proponent will make adequate
allocations for providing piped water supply to the labour colonies. For construction activities,
tankers will be provided and adequate water allocations will be made by the contractor.
2.21.5 Wastewater Generation
The estimated quantity of sewage likely to be generated during each phase of construction is about
36 m3/day. The labour camps will be provided with adequate number of soak pits and septic tanks
for disposal of sewage. After completion of construction work, compact STPs would be properly
cleared and demolished.
2.21.6 Solid Waste Generation
The waste generation during construction phase will include construction waste and residential
waste from labour facilities. The construction waste will largely comprise of excavated earth and
debris which can be used as a fill material for low lying areas and for construction of roads. The
residential waste generated during the construction period from labour facilities would be collected
and transported to an interim transfer station where it will be treated (composting) by modular
composter. Only residual waste will be transported to proposed landfill facility for disposal.
The construction activities will also entail generation of hazardous wastes such as waste oil.
Proponent, through contractual obligations, will specify disposal of hazardous waste by the
contractor to authorized recyclers/agencies.

Final EIA Report – Orange Smart City, Pen, Raigad July 2018
79
BE/EIA-OSC/002
2.22 Resource requirements – Operation Phase
2.22.1 Water requirement
The proposed development mix at city side of OSC includes various facilities including Industrial,
logistics and freight, transport facilities, commercial / office spaces, Residential, retail and F&B,
entertainment, educational / institutional, cultural and event spaces, health care, etc. As OSC being
mix land use development having various water demands including drinking, flushing,
horticulture, industrial process, HVAC etc.
Detailed water demand assessment has been carried out for proposed facilities as above for the
ultimate stage year. Water demand of Horticulture, industrial, flushing and HVAC is proposed to
be sourced by recycled water. Site wise water demand is worked out as per NBC. The treated water
from STP’s is proposed to be utilized for various non-potable water demands. The calculations are
based on prevalent standards as per URDPFI and CPHEEO standards.
Table 2-24: Potable water demand assessment
Particulars T1 T2 T3 T4 Total
Potable Water Requirements (MLD)
Industrial
(at 30 KLD/Ha) 4.23 0.70 0.49 0.00 5.42
Residential
(at 105 lpcd) 3.27 0.45 0.45 3.50 7.67
Industrial & Commercial
Workers (at 50 lpcd) 3.84 1.25 0.98 1.37 7.45
The Table 2-24: Potable water demand assessment reflects that the total potable water demand for
the industrial area, residential area and industrial and commercial workers is 5.42, 7.67 and 7.45
MLD respectively.
Table 2-25: Non-potable water demand assessment
Particulars T1 T2 T3 T4 Total
Non-Potable Water Requirements (MLD)
Industrial & Commercial
Workers (at 30 lpcd) 2.31 0.75 0.59 0.82 4.47
Residential
(at 45 lpcd) 1.40 0.19 0.19 1.50 3.29
HVAC 7.18 1.48 0.97 0.68 10.30
The Table 2-255 reflects that the total non-potable demand for the industrial and commercial
workers, residential workers and HVAC requirement is 4.47, 3.29 and 10.30 MLD.

Final EIA Report – Orange Smart City, Pen, Raigad July 2018
80
BE/EIA-OSC/002
The water demands as arrived for potable water and non-potable water for Industrial, Commercial
and Residential are totaled to arrive at the total water requirement for all the developments planned
at OSC. The total Water Demand includes water supply requirements for Residential, Industrial
and Commercial areas proposed in the four land parcels – T1, T2, T3 and T4. This will provide
the total water requirement for the OSC for the future years.
The summary of water demand assessment is given below in Table 2-266 below:
Table 2-26 : Summary of water demand assessment
Land Parcel Total Potable Water
(MLD)
Total Non-Potable
Water
(MLD)
Total Water
Demand
(MLD)
T1 11.34 10.89 22.23
T2 2.40 2.42 4.82
T3 1.92 1.75 3.67
T4 4.87 3.01 7.88
Total 20.54 18.06 38.60
The total water demand is 38.60 MLD which includes potable water demand of 20.54 MLD and
non-potable demand of about 18.60 MLD.
2.23 Available Infrastructure and Proposed Infrastructure
Available Infrastructure
Hetawane Dam
Hetawane reservoir on the upstream of medium size earthen dam about 6.00 km from T1 parcel of
OSC, is the potential water source for the proposed development. The dam project was completed
in year 2000, by the water resources department, Konkan region. The project falls under the
purview of North Konkan Irrigation Project Circle. The usable storage capacity of the Dam is
about 145million meter cube. Currently water is supplied for irrigation and about 150 MLD to
CIDCO Navi Mumbai. A 2 MW hydro-electric plant is also currently operational at dam site.
CIDCO 150 MLD raw water supply line (1500 & 1200 mm diameter) runs partly along Sh-88 that
is Pen-Khopoli road. The water drawn from Hetawane dam is treated at the Water Treatment Plant
of capacity 150 MLD located near Jite and then the treated water is supplied to Navi-Mumbai.
Balganga Dam
Balganga dam is under construction, approx. 4 km north of parcel T4. The project is likely to be
completed by 2026. The dam will have the capacity to supply water at 350 MLD.
Proposed Infrastructure
2.23.1 Water supply Infrastructure

Final EIA Report – Orange Smart City, Pen, Raigad July 2018
81
BE/EIA-OSC/002
The primary water source for Orange Smart City is the Hetawane reservoir. Facilities for each land
parcel are proposed separately/ decentralized system. A dedicated water supply line from
Hetawane reservoir to the T1 Site of OSC site is being proposed along the existing alignment. A
dedicated conveyance system has been considered from Hetawane Dam to T1 Site.
Water Transmission from CIDCO pipe line to WTP at T1 of about 750 diameter pipe with tapping
length of about 3000 m is proposed. Water Treatment Plant (total 20 MLD) including SCADA
system is proposed at T1 Site. Clear water reservoir (GSR) and Clear water pumping station from
WTP with intermediate pumping stations is also proposed to ensure continuous supply of water
without any disturbance. Water Distribution is planned through gravity from individual GSR to
respective parcel. Smart metering system for the entire project site is also planned.
The JITE WTP is near to T3; T4 & T2 Site of OSC. Also, a new supply line is planned to be laid
upto Jite WTP from Hetawane Dam. For external water supply to these 3 sites of OSC, it is
proposed to lay a separate water supply line from Jite Water Treatment Plant following the existing
road alignment. The 500 mm diameter pipe with tapping length of about 5500 m is proposed to be
laid along the existing road alignment / elevated corridor alignment.
Water Treatment Plant is proposed on each respective site (T2; T3 & T4) including SCADA
system for the total demand. It will also house Clear water reservoir (GSR) and Clear water
pumping station having intermediate pumping stations. Water Distribution from individual GSR
to respective parcel is proposed through gravity system. The entire system is planned with smart
metering. The distribution system would cater gross water demand required during regular
operation and critical demand during maintenance period. The water supply infrastructure is given
in Table 2-277 below:
Table 2-27: Water supply infrastructure
Land Parcel No. of WTP’s Area of WTP
(sq mtr)
T1 1 10000
T2 1 2500
T3 1 2500
T4 1 2500
Total 4 17500
The water supply infrastructure is given below in Figure 2-24.

Final EIA Report – Orange Smart City, Pen, Raigad July 2018
82
BE/EIA-OSC/002
Figure 2-24: Water supply infrastructure

Final EIA Report – Orange Smart City, Pen, Raigad July 2018
83
BE/EIA-OSC/002
2.23.2 Wastewater Infrastructure
The wastewater system will consist of collection, treatment, and reuse of wastewater for OSC
requirement. Wastewater will be collected and conveyed to the Sewage Treatment Plant (STP).
The treated water would be used for Flushing, Landscaping and as Make-up Water for District
Cooling Towers.
The waste water generated from within OSC will be treated as per international standards and local
pollution control board’s norms. This recycled water can be used for flushing, gardening and other
non-potable water demands. As prescribed in CPHEEO manual, it is assumed that 80% of water
actually supplied at consumer end for domestic use and 60% of water supplied to industries shall
be generated as waste water. As OSC is a green field development project there is no existing
Sewage Treatment Facility available within OSC Site.
Estimation of Sewage Flow
The Waste Water Generation for OSC project has been calculated on the basis of the proposed
land use in all four parcels – T1, T2, T3 and T4. The calculations are based on prevalent standards
as per URDPFI and CPHEEO standards. The Waste Water Generation for Industrial areas is as
follows. Table 2-28: Waste Water Generation from Industrial Processing
Table 2-28: Waste Water Generation from Industrial Processing
Land
Parcel
Total Plot
Area
(In Acres)
Net Industrial
Area
(In Acres)
Total Water
Demand (MLD)
(At 30KLD/ Ha)
Sewage Generation
(60% of Water
Demand) (MLD)
T1 723.33 282.00 4.23 2.54
T2 102.40 58.00 0.70 0.42
T3 83.59 40.00 0.49 0.29
T4 133.19 0.00 0.00 0.00
Total 1042.51 380.00 5.42 3.25
Table 2-29: Waste water generation from Commercial worker usage
Land
Parcel
Total Plot
Area
(In Acres)
Commercial
Area
(In Acres)
Estimated
Working
Population
Total Water
Demand
(MLD)
Sewage Generation
(80% of Water
Demand) (MLD)
T1 723.33 38 26831 2.15 1.72
T2 102.40 8 5509 0.44 0.35
T3 83.59 2 1680 0.13 0.11
T4 133.19 39 27461 2.20 1.76
Total 1042.51 88 61481 4.92 3.93

Final EIA Report – Orange Smart City, Pen, Raigad July 2018
84
BE/EIA-OSC/002
The waste water generation from the residential areas is presented below:
Table 2-30: Waste water generation from residential areas
Land
Parcel
Total Plot
Area
(In Acres)
Residential
Area
(In Acres)
Estimated
Resident
Population
Total Water
Demand
(MLD)
Sewage Generation
(80% of Water
Demand) (MLD)
T1 723.33 58 31161 4.67 3.74
T2 102.40 8 4298 0.64 0.52
T3 83.59 8 4298 0.64 0.52
T4 133.19 62 33310 5.00 4.00
Total 1042.51 136 73068 10.96 8.77
The total waste water generation from residential area is 8.77 MLD.
The Table 2-31 reflects that the Total Waste Water Generation for the OSC project is
approximately 21.56 MLD. The total Waste Water Generation includes waste water generated
from Residential, Industrial and commercial areas proposed in the four land parcels – T1, T2, T3
and T4.
Table 2-31: Summary of Total Sewage Generation
Land Parcel Total Water
Demand (MLD)
Total Sewage
Generation (MLD)
T1 22.23 11.20
T2 4.82 2.54
T3 3.67 2.07
T4 7.88 5.75
Total 38.60 21.56
Wastewater Treatment Facilities
The amount of waste water generated in the four land parcels has been calculated on the basis of
the prevalent CPHEEO norms and other relevant guidelines and by-laws. Looking at the
geographical conditions and expanse of the four land parcels, the topography will play a crucial
role in the working of the entire waste water management system. Focus is on optimizing the use
of the topographical conditions. The waste water conveyance system is mostly planned on the
gravitational flow and attempts to reduce the number of pumping stations in the overall project.
The waste water conveyance facilities, waste water collection and treatment facilities are proposed
in a decentralized manner limiting to each individual site of OSC.
Sewage treatment Plant including SCADA system is planned in each site of OSC with well-
planned sewerage network. Intermediate sewage pumping stations are also proposed at suitable
location. All the individual sites are planned with treated water tank and treated water pumping
station next to STP’s.

Final EIA Report – Orange Smart City, Pen, Raigad July 2018
85
BE/EIA-OSC/002
Waste water will be treated in STPs and recycled for non-potable water demands like flushing,
gardening, HVAC etc. Total treated water supply will be around 35 MLD. The infrastructure
related to the sewage management is given in Table 2-3232.
Table 2-32: Proposed STP details
Land Parcel Underground Drains
(In kms)
No. of STP’s
(Area of 3600 m2 each)
T1 4.9 1
T2 2.2 1
T3 2.65 1
T4 1.8 1
Total 11.55 4
At present the industries proposed in OSC all are less-polluting. No proposed industry is in red
category. Hence, it is assumed that effluent generated is very less and individual ETP at each
industry level is proposed which will implement zero effluent discharge norms. The map depicting
sewage treatment infrastructure is given below in Figure 2-25.

Final EIA Report – Orange Smart City, Pen, Raigad July 2018
86
BE/EIA-OSC/002
Figure 2-25: Sewage treatment infrastructure details

Final EIA Report – Orange Smart City, Pen, Raigad July 2018
87
BE/EIA-OSC/002
Water Balance Diagram
The water balance diagram is given below in Figure 2-26.
Figure 2-26: Water balance diagram
It is proposed that the water treated from the STP’s will be used for all non-potable water uses
such as HVAC, horticulture, flushing, etc. minimizing the need for treated potable water. The
water balance diagram suggests that additional treated water of 3.28 MLD will be generated.
2.23.3 Common Effluent Treatment Plant
A CETP of capacity 2 MLD along with Multieffect evaporator is proposed for treatment of
effluents from category ‘A’ industries for the project of Orange Smart City in an area of 3 acres
excluding the buffer zone.
The map depicting the location of the CETP in the T1 land parcel is shown below:

Final EIA Report – Orange Smart City, Pen, Raigad July 2018
88
BE/EIA-OSC/002
The influent parameters for the CETP will be as follows:
Location of
the CETP

Final EIA Report – Orange Smart City, Pen, Raigad July 2018
89
BE/EIA-OSC/002
Sr. No Parameters Standards considered for the design of
CETP
Limiting concentration in mg/lit except
for pH and temperature
1 pH 7-8
2 Total dissolved solids 2100
3 Suspended solids 600
4 COD 1000
5 BOD 700
6 Total Nitrogen 80
7 Total Phosphorus 10
8 Chlorides 600
9 Sulphate 1000
10 Total Oil (free + emulsified) 350 ppm
11 (a) Free Oil 100 ppm
12 (b) Emulsified Oil 250 ppm
13 Iron 5
14 Arsenic 0.5
15 Cadmium 0.5
16 Lead 1
17 Copper 3
18 Zinc 15
19 Nickel 3
20 Mercury 0.02
21 Selenium 0.1

Final EIA Report – Orange Smart City, Pen, Raigad July 2018
90
BE/EIA-OSC/002
Sr. No Parameters Standards considered for the design of
CETP
Limiting concentration in mg/lit except
for pH and temperature
22 Chromium 1
23 Hexavalent Chromium 0.1
24 Cyanide 0.1
The treated effluent parameters for the CETP to be maintained by operator will confirm to the
CPCB norms as mentioned in section below:
CPCB Norms for discharge of the treated effluent from CETP
Max. permissible values (in milligram/litre except
for pH and Temperature)
Sr.No General Parameters Into inland
surface water
On land for
irrigation
Into sea
1 pH 6-9 6-9 6-9
2 Biological Oxygen
Demand, BOD3, 27 o C
30 100 100
3 Chemical Oxygen
Demand (COD)
250 250 250 *
4 Total Suspended Solids
(TSS)
100 100 100
5 Fixed Dissolved Solids
(FDS
2100** 2100** NS
6 Temperature, o C Shall not exceed
more than 5oC
above ambient
water
temperature
Shall not exceed
more than 5oC
above ambient
water
temperature
Shall not exceed
more than 5oC
above ambient
water
temperature
7 Oil & Grease 10 10 10
8 Ammonical –Nitrogen 50 NS 50

Final EIA Report – Orange Smart City, Pen, Raigad July 2018
91
BE/EIA-OSC/002
Max. permissible values (in milligram/litre except
for pH and Temperature)
Sr.No General Parameters Into inland
surface water
On land for
irrigation
Into sea
9 Total Kjeldahl Nitrogen
(TKN)
50 NS 50
10 Nitrate- Nitrogen 10 NS 50
11 Phosphates, as P 5 NS NS
12 Chlorides 1000 1000 NS
13 Sulphates, as SO4 1000 1000 NS
14 Flouride 2 2 15
15 Sulphides, as S 2 2 5
16 Phenolic compounds (as
C6H5OH)
1 1 5
17 Total Res. Chlorine 1 1 1
18 Zinc 5 15 15
19 Iron 3 3 3
20 Copper 3 3 3
21 Trivalent Chromium 2 2 2
22 Manganese 2 NS 2
23 Nickel 3 NS 3
24 Arsenic 0.2 NS 0.2
25 Cyanide as CN 0.2 NS 0.2
26 Vanadium 0.2 NS 0.2
27 Lead 0.1 NS 0.1
28 Hexavalent Chromium 0.1 NS 0.1

Final EIA Report – Orange Smart City, Pen, Raigad July 2018
92
BE/EIA-OSC/002
Max. permissible values (in milligram/litre except
for pH and Temperature)
Sr.No General Parameters Into inland
surface water
On land for
irrigation
Into sea
29 Selenium 0.05 NS 0.05
30 Cadmium 0.05 NS 0.05
31 Mercury 0.01 NS 0.01
32 Bioassay test As per industry
specific
standards
As per industry
specific
standards
As per industry
specific
standards
Notes : NS – Not specified
*Discharge of treated effluent into sea shall be through proper marine outfall. The existing shore
discharges shall be converted to marine outfalls. In cases where the marine outfall provides a
minimum initial dilution of 150 times at the point of discharge and a minimum dilution of 1500
times at a point 100 m away from discharge point, then, the State Board may relax the Chemical
Oxygen Demand (COD) limit: Provided that the maximum permissible value for Chemical
Oxygen Demand (COD) in treated effluent shall be 500 milligram/litre
**Maximum permissible Fixed Dissolved Solids (FDS) contribution by constituent units of a
Common Effluent Treatment Plant (CETP) shall be 1000 milligram/litre. In cases where Fixed
Dissolved Solids (FDS) concentration in raw water used by the constituent units is already high
(i.e. it is more than 1100 milligram/litre) then the maximum permissible value for Fixed Dissolved
Solids (FDS) in treated effluent shall be accordingly modified by the State Board.
In case of discharge of treated effluent on land for irrigation, the impact on soil and groundwater
quality shall be monitored twice a year (pre- and post-monsoon) by Common Effluent Treatment
Plants (CETP) management. For combined discharge of treated effluent and sewage on land for
irrigation, the mixing ratio with sewage shall be prescribed by State Board.
Cost of the CETP
The bifurcation of the capital cost of CETP is presented in section below:
Sr.
No
Item Capital cost Cost
(Rs. Crore)
1. For the 2MLD CETP 2
2. Additional Cost for CETP (10%) 0.2
3 ZLD cost 3

Final EIA Report – Orange Smart City, Pen, Raigad July 2018
93
BE/EIA-OSC/002
Total 5.2
Operation and Maintenance cost for the CETP : Rs. 6 lakhs per annum
Mandatory permissions for setting up the CETP : The operator of the CETP will seek separate
environmental clearance for establishing the CETP as per the EIA Notification 2006 and its
amendments thereof.
2.24 Storm water drainage system, rain water harvesting and storage facilities
The four land parcels in the project have a unique topography. The land parcel T1 has the most
promising topography. Relatively the land parcels T2, T3 and T4 are flat plain lands. The T1 site
has natural drains which will drain the rainfall received to the adjoining Bhogeshwari River.
The conveyance facilities for the storm water is designed to avoid instances of water logging,
preserve water, and conserve soil. The rainfall data for past couple of decades has been considered
for working out storm water drainage details. Rainwater harvesting is proposed and judiciously
planned in all parcels of OSC.
The proposed development at OSC ensures that no disturbances will be caused to the existing
natural drainage system, hence for crossings over these drains is made by box culverts, pipe
culverts and bridges depending upon flow and topography.
As per IMD, the average annual rainfall for the Raigad district as a whole is 3,028.9 mm. The
suggested maximum rainfall in 24 hours for 100 years return period comes as 878.1 mm. So, the
critical intensity of rainfall as per IMD recommendations is = 0.16 x 878.1 = 140.49 mm per hour.
The co-efficient of runoff is the portion of precipitation that makes its way to the drain. Its value
depends upon, permeability of the surface, type of ground cover, shape and size of catchment area,
the topography and geology. As per recommendation of IRC-SP-50, the following values have to
be adopted for the design of storm water drains.
➢ Residential Area: 0.60
➢ Industrial Area: 0.55
➢ Open / Parks: 0.15
➢ Roads: 0.90
In general, the drainage of the area is from South East (where high hills are seen) towards the
North Western side.
The Storm water drainage system is provided to drain the rain water within the project area. Due
care has to be taken during designing of the drainage system, that the drains flow along the natural
slope of ground, to avoid unwanted earth work during construction. The map depicting the storm
water channels is given in

Final EIA Report – Orange Smart City, Pen, Raigad July 2018
94
BE/EIA-OSC/002
Figure 2-27. The rain water harvesting will be done through the detention ponds catering to 1 day
run-off and then it will be made mandatory for all the individual plot owners to implement
rainwater harvesting at the plot level.
The post project run off calculations are given in the section below :
Landuse T1 T2 T3 T4 TotalIndustrial 282 58 40 0 380
Commercial Area 38 8 2 39 88
Residential Area 58 8 8 62 136
Major Roads 87 12 11 16 126
Undevelopable/Green 220 10 17 8 255
Amenities/Utilities 38 6 6 8 58
Total 723 102 84 133 1043
Landuse T1 T2 T3 T4 Total Coverage
Industrial 282 58 40 0 380 0.3
Commercial Area 38 8 2 39 88 0.6
Residential Area 58 8 8 62 136 0.5
Amenities/Utilities 38 6 6 8 58 0.1
Total 416 80 56 109 661
Area(Sq.Mtr)
Rainfall(m)
Runoff
Co-Eff
Total Yearly
Rainfall(Cu.Mtr)
Area(Sq.Mtr)
Rainfall(m)
Runoff
Co-Eff
Total Daily
Rainfall(Cu.Mtr)
T1 1053055 3.492 0.9 3309540 T1 1053055 1 0.9 947749
T2 202021 3.492 0.9 634912 T2 202021 1 0.9 181819
T3 141645 3.492 0.9 445162 T3 141645 1 0.9 127481
T4 276258 3.492 0.9 868225 T4 276258 1 0.9 248633
Total 1672979 3.492 0.9 5257839 Total 1672979 1 0.9 1505681

Final EIA Report – Orange Smart City, Pen, Raigad July 2018
95
BE/EIA-OSC/002
Figure 2-27: Storm water channels

Final EIA Report – Orange Smart City, Pen, Raigad July 2018
96
BE/EIA-OSC/002
2.25 Power Infrastructure
Estimated Electricity Requirements:
The Electricity Demand Assessment for OSC project has been calculated on the basis of the
proposed land use in all four parcels – T1, T2, T3 and T4. The calculations are based on prevalent
standards as per MSEDCL and MIDC standards. The Electricity Demand Assessment for
Industrial, Commercial, Residential, amenities and Recreational areas is presented in Tables 2-33
to Table 2-36 below.
Table 2-33 : Electricity Requirements for Industrial Areas
Land
Parcel
Total Plot
Area
(Acres)
Built Up
Area
(m2)
Load
Density
(45W/m2)
Diversity
factor
(0.35 for
Industrial)
Electricity
Demand
(Watts)
Electricity
Demand
(MVA)
T1 723.33 2282508 102712860 0.35 35949501 39.90
T2 102.40 469452 21125340 0.35 7393869 8.21
T3 83.59 323760 14569200 0.35 5099220 5.66
T4 133.19 0 0 0.35 0 0.00
Total 1042.51 3075720 138407400 48442590 53.77
Total Electricity Requirement in Industrial Areas is 53.77 MVA.
Table 2-34 : Electricity requirements for commercial areas
Land
Parcel
Total Plot
Area
(Acres)
Built Up
Area
(m2)
Load
Density
(100W/m2)
Diversity
Factor
(0.65 for
Commercial)
Electricity
Demand
(Watts)
Electricity
Demand
(MVA)
T1 723.33 310243 31024302 0.65 20165796 22.38
T2 102.40 63700 6369978 0.65 4140486 4.60
T3 83.59 19426 1942560 0.65 1262664 1.40
T4 133.19 317528 31752762 0.65 20639295 22.91
Total 1042.51 710896 71089602 46208241 51.29
Total Electricity Requirement in Commercial Areas is 51.29 MVA.
Table 2-35 : Electricity requirements for residential areas
Land
Parcel
Total
Plot
Area
(Acres)
Built Up
Area
(m2)
Load
Density
(75W/ m2)
Diversity
Factor
(0.4 for
Residential)
Electricity
Demand
(Watts)
Electricity
Demand
(MVA)
T1 723.33 469452 35208900 0.4 14083560 15.63
T2 102.40 64752 4856400 0.4 1942560 2.16
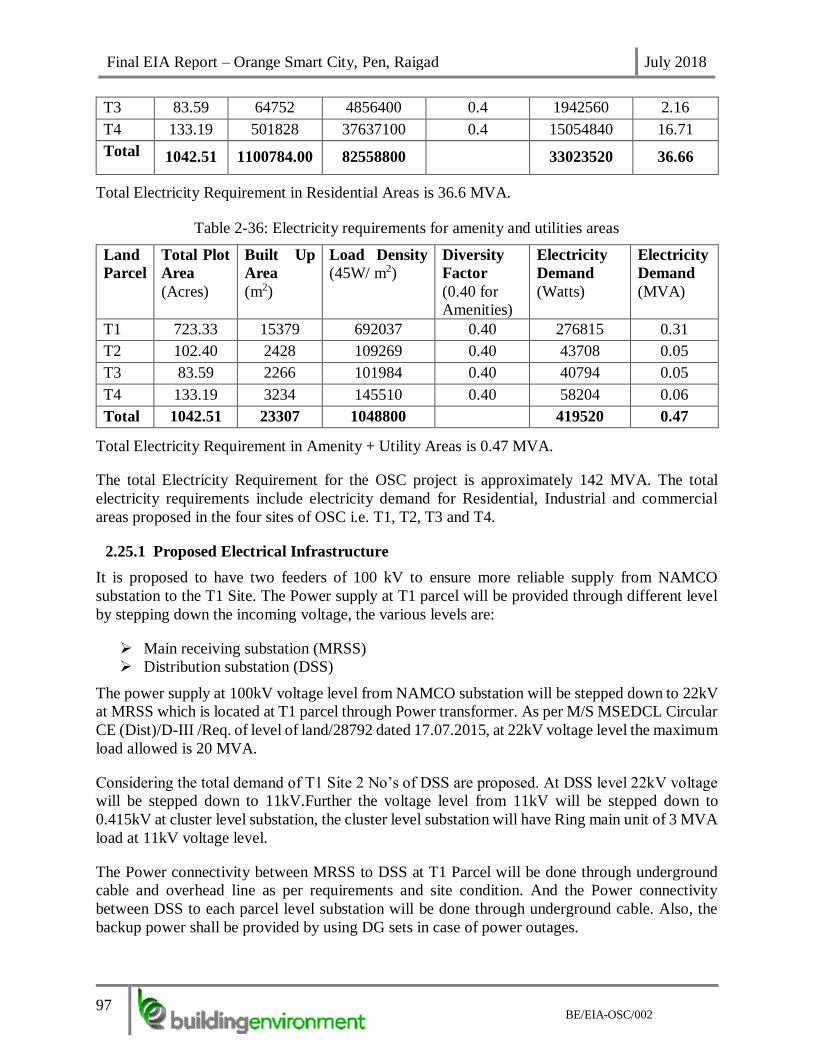
Final EIA Report – Orange Smart City, Pen, Raigad July 2018
97
BE/EIA-OSC/002
T3 83.59 64752 4856400 0.4 1942560 2.16
T4 133.19 501828 37637100 0.4 15054840 16.71
Total 1042.51 1100784.00 82558800 33023520 36.66
Total Electricity Requirement in Residential Areas is 36.6 MVA.
Table 2-36: Electricity requirements for amenity and utilities areas
Land
Parcel
Total Plot
Area
(Acres)
Built Up
Area
(m2)
Load Density
(45W/ m2)
Diversity
Factor
(0.40 for
Amenities)
Electricity
Demand
(Watts)
Electricity
Demand
(MVA)
T1 723.33 15379 692037 0.40 276815 0.31
T2 102.40 2428 109269 0.40 43708 0.05
T3 83.59 2266 101984 0.40 40794 0.05
T4 133.19 3234 145510 0.40 58204 0.06
Total 1042.51 23307 1048800 419520 0.47
Total Electricity Requirement in Amenity + Utility Areas is 0.47 MVA.
The total Electricity Requirement for the OSC project is approximately 142 MVA. The total
electricity requirements include electricity demand for Residential, Industrial and commercial
areas proposed in the four sites of OSC i.e. T1, T2, T3 and T4.
2.25.1 Proposed Electrical Infrastructure
It is proposed to have two feeders of 100 kV to ensure more reliable supply from NAMCO
substation to the T1 Site. The Power supply at T1 parcel will be provided through different level
by stepping down the incoming voltage, the various levels are:
➢ Main receiving substation (MRSS)
➢ Distribution substation (DSS)
The power supply at 100kV voltage level from NAMCO substation will be stepped down to 22kV
at MRSS which is located at T1 parcel through Power transformer. As per M/S MSEDCL Circular
CE (Dist)/D-III /Req. of level of land/28792 dated 17.07.2015, at 22kV voltage level the maximum
load allowed is 20 MVA.
Considering the total demand of T1 Site 2 No’s of DSS are proposed. At DSS level 22kV voltage
will be stepped down to 11kV.Further the voltage level from 11kV will be stepped down to
0.415kV at cluster level substation, the cluster level substation will have Ring main unit of 3 MVA
load at 11kV voltage level.
The Power connectivity between MRSS to DSS at T1 Parcel will be done through underground
cable and overhead line as per requirements and site condition. And the Power connectivity
between DSS to each parcel level substation will be done through underground cable. Also, the
backup power shall be provided by using DG sets in case of power outages.

Final EIA Report – Orange Smart City, Pen, Raigad July 2018
98
BE/EIA-OSC/002
Considering the total power requirement for T2, T3 & T4 sites, a substation is proposed on each
site having connection from existing Receiving station at JITE. It is proposed to have two feeders
of 22kV lines for each DSS for reliable supply through overhead lines and further the distribution
inside the sites will be carried out underground cable. At Sub Station level 22kV voltage will be
step down to 11kV. The area requirements for the Substation in each parcel are shown in Table
2-37.
Table 2-37 : Parcel wise sub-stations with Area requirements
Parcel Substation Area (m2)
T1 MRSS 8000
T1 DSS 1 1500
T1 DSS 2 1500
T2 Sub Station 1500
T3 Sub Station 1500
T4 Sub Station 1500
The map depicting proposed electrical infrastructure is given in Figure 2-28: Proposed electrical
infrastructure.

Final EIA Report – Orange Smart City, Pen, Raigad July 2018
99
BE/EIA-OSC/002
Figure 2-28: Proposed electrical infrastructure

Final EIA Report – Orange Smart City, Pen, Raigad July 2018
100
BE/EIA-OSC/002
2.26 Street Lighting system
LED luminaries of various ratings are proposed for the street lighting to have energy efficient
system. The lux level has been considered as per IS1944. The street lights shall be controlled from
outdoor street light DB with 4Pole RCBO incomer, LT Tariff meter, power contactor for switching
ON/ OFF the lights and MCB outgoings for distribution.
A Centralized Smart Street lighting control system is proposed for monitoring and control of the
street lights throughout the project area. The centralized lighting management system is a complete
web-based solution with advanced communication facilitating remote control and monitoring of
the entire street lighting system. The system shall be modular and easily scalable. The centralized
solution shall provide on/off control for burn hour optimization; to simplify maintenance and
remote operation. Programming shall be enabled remotely and can be changed at any time. The
ON / OFF times shall be optimized for the different daylight hours every day for energy
optimization based on the sunrise and sunset times.
The Centralized Lighting management system shall consist of a RF capable nodal device to be
installed on each pole and a Gateway device with microcontroller that has both RF and GPRS
capability installed in the Street light Feeder Pillars which can control no. of luminaries. The
Feeder Pillar monitoring configurations shall be enabled remotely and can be changed at any time.
Power supply voltage input to Feeder Pillars shall be made available from the CSS LT panels/ LT
Feeder Pillars as the case may be. All alarm/fault detection events shall be logged and available
for reporting and analysis.
2.27 Smart Initiatives
Smart initiatives in urban areas with the help of information and communication technologies help
solve specific problems and support sustainable development in social, economic and / or
environmental terms. Smart initiatives enhance quality, performance and interactivity of urban
services, reduce costs and resource consumption.
➢ Few initiatives which can be taken in the power supply system are:
➢ Implementation of SMART GRID feature for better power management
➢ Generation of power through sustainable means from renewable sources
2.28 Smart Grid
A smart grid is an electrical grid which includes a variety of operational and energy measures
including smart meters, smart appliances and energy efficiency resources. The traditional electric
grid will need to build additional layers of automation, communication and IT systems to transform
it to a smarter grid. Some of the applications or building blocks of a smart grid include:
➢ Advanced Metering Infrastructure (AMI) with two-way communication and Meter Data
Management Systems,
➢ Distribution Management Systems (DMS),
➢ Fault Detection, Isolation & Restoration (FDIR) System.
➢ Outage Management Systems (OMS),
➢ Geographical Information Systems (GIS) – mapping of electrical network assets and
consumers on geospatial maps,

Final EIA Report – Orange Smart City, Pen, Raigad July 2018
101
BE/EIA-OSC/002
➢ Automation of the substations with modern switchgear and numerical relays,
➢ Substation Automation System - Supervisory Control and Data Acquisition Systems
(SCADA)
➢ Enterprise IT network covering all substations and field offices with reliable
communication systems,
➢ Electronic billing systems and customer care systems,
➢ Mobile Crew Management Systems,
➢ Wide Area Measurement and Control Systems,
➢ Enterprise Resource Planning (ERP)/Asset Management Systems,
➢ Enterprise Application Integration; and
➢ Analytics.
The above list is focused on applications and systems, i.e., enablers. From a functionality point of
view, one might aim for variable or dynamic tariffs, renewable integration, etc.
2.28.1 Smart Grid system shall include the following;
Connectivity with the State Load Dispatch Centre (SLDC) for the exchange of information
regarding Load Management & Forecast, AT&C losses, Outages etc. for township/ city. The
system shall be compatible with the existing IT/ ERP systems of the Utility Supply Company.
The proposed system shall be capable of Data acquisition, validation, processing, and data
archiving/ storage of the electrical network within city in order to control and manage the Load
including forecasting and outages, billing, and interface with end consumers through various
portals.
The system shall be capable to interface with the Substation Automation system appropriately for
On-line monitoring, controlling and operation of the network elements and parameters to achieve
optimal results and fulfilment of the scope objective.
2.29 Solid waste handling system
The objective of solid waste management or handling for the development is to manage waste
generation, storage, collection, transportation, treatment and disposal of solid waste in a manner
that is in accordance with the best principles of public health, economics, engineering, aesthetics,
and other environmental considerations. The sources of solid waste are residential units, industrial
units, offices, and commercial establishment, parks and logistics areas. Solid waste generated from
these sources will be collected and handled as per the CPHEEO norms.
As OSC is a green field development project there are no existing Solid Waste Treatment Facilities
available on the proposed land parcel.
The proposed solid waste management system is derived on the basis of analysis of different
functions of waste management system and aimed to improve the value of the project through
adaptation of an advanced system. The value improvements for the proposed system includes
minimizing human intervention in the process, reduce adverse environmental & health impacts,
reduce traffic inconvenience, improving the aesthetic value, cost economics in the long run.

Final EIA Report – Orange Smart City, Pen, Raigad July 2018
102
BE/EIA-OSC/002
2.29.1 Solid waste management planned
The waste generation units envisaged for OSC includes, Industrial, commercial and residential
development and its associated facilities. The waste generated from the above facility
sectors/sources are broadly categorized as follows;
➢ Biodegradable Waste: Food and kitchen waste, green waste (vegetables, flowers, leaves,
fruits), paper (can also be recycled).
➢ Recyclable Material: Paper, glass, bottles, cans, metals, certain plastics, tyres, tubes etc.
➢ Inert Waste: Construction and demolition waste, dirt, rocks, debris.
➢ Composite Wastes: waste clothing, tetra packs, waste plastics such as toys.
➢ Domestic Hazardous Waste (also called “Household Hazardous Waste”) & Toxic Waste:
Medications, e-waste, paints, chemicals, light bulbs, fluorescent tubes, spray cans, fertilizer
and pesticide containers, batteries, shoe polish.
In the present initiative, it is proposed to have the waste segregation process at source, provide
separate colour bins / drop boxes to facilitate the users, collect and segregate in scientific manner,
adopt 3R approach in waste management process. Based on the Land use planning; it is proposed
to have decentralized waste collection centres to have effective solid waste management system.
2.29.2 Estimation of solid waste quantity for future years
Based on the data of solid waste generation from proposed land uses, detailed estimation has been
carried out for solid waste generation quantity from different facilities i.e. industrial, commercial
/ Office Spaces, Residential, Retail and F&B, Entertainment, Health Care and Educational
Institutions, Cultural & Event Spaces, Pedestrian Plaza, Transport Facilities. Industrial process
waste has also been projected as per CPHEEO norms. Solid Waste Generation norms are given in
the Table 2-38 below:
Table 2-38 : Solid Waste Generation Norms considered
Sr. No. Source Type Generation
(Kg/Capita/Day)
1 Residential Population 0.4
2 Industrial Population 0.15
The Solid Waste Generation for OSC project has been calculated on the basis of the proposed land
use in all four parcels – T1, T2, T3 and T4. The calculations are based on prevalent standards as
per URDPFI and CPHEEO standards. The Solid Waste Generation in different areas are presented
in Table 2-39 to Table 2-41.

Final EIA Report – Orange Smart City, Pen, Raigad July 2018
103
BE/EIA-OSC/002
Table 2-39: Solid Waste Generation in Industrial Areas
Land
Parcel
Total Plot
Area
(In Acres)
Industrial Area
(In Acres)
Estimated
Working
Population
Total Waste
Generation
(Tonnes) (At 150
gms/capita/day)
T1 723.33 282 50045 7.51
T2 102.40 58 19473 2.92
T3 83.59 40 18003 2.70
T4 133.19 0 0 0.00
Total 1042.51 380 87521 13.13
Total Solid Waste Generation in Industrial Areas is 13.3 Tonnes per Day.
Similarly, the Solid Waste Generation in Residential Areas has been calculated in the Table 2-40.
Table 2-40 : Solid Waste Generation in residential areas
Land
Parcel
Total Plot
Area
(In Acres)
Residential Area
(In Acres)
Estimated
Resident
Population
Total Waste Generation
(Tonnes) (At 400
gms/capita/day)
T1 723.33 58 31161 12.46
T2 102.40 8 4298 1.72
T3 83.59 8 4298 1.72
T4 133.19 62 33310 13.32
Total 1042.51 136 73068 29.23
Total Solid Waste Generation in Residential Areas is 29.23 Tonnes per Day.
Table 2-41: Solid Waste Generation in commercial areas
Land
Parcel
Total Plot
Area
(In Acres)
Commercial Area
(In Acres)
Estimated
Working
Population
Total Waste Generation
(Tonnes) (At 150
gms/capita/day)
T1 723.33 38.33 26831 4.02
T2 102.40 7.87 5509 0.83
T3 83.59 2.40 1680 0.25
T4 133.19 39.23 27461 4.12
Total 1042.51 87.83 61481 9.22
Total Solid Waste Generation in Commercial Areas is 9.22 Tonnes per Day
Total Solid Waste Generation for the OSC project is approximately 51.58 Tonnes/Day. The total
Solid Waste Generation includes solid waste generated from Residential, Industrial and
commercial areas proposed in the four land parcels – T1, T2, T3 and T4.

Final EIA Report – Orange Smart City, Pen, Raigad July 2018
104
BE/EIA-OSC/002
2.29.3 Methodology for solid waste management
The general methodology for Solid Waste Management is as follows.
Identification of Waste Generation Sources and Collection & review of existing data available
with the project proponent and other concerned departments about the inventory of:
➢ Type and size wise Industrial establishments in OSC
➢ Type and number of households and residential development planned
➢ Category and size wise commercial, recreational and institutional establishments and major
centres.
➢ Type and size wise commercial establishments / markets
➢ Intensity and location of construction activities
➢ Hospital, clinics and other health care facilities
➢ Open spaces and parks
➢ Hierarchy and inventory of road.
Waste Quantification and characterization
Estimation of quantum of solid waste generated and its characteristics assume great significance
for identifying the most suitable collection, conveyance, treatment and disposal options. To assess
the waste generation, a comprehensive desk research will be undertaken to develop key indicators
of various types of waste sources such as, residential, commercial and institutional, recreational,
roads, construction and other utilities etc. The following tasks would be performed to ascertain the
same:
➢ Assess the present MSW quantities and characteristics based on primary field assessments
and validation with data available from secondary sources (CPHEEO manual, etc.);
➢ Estimate different categories of waste and assessment of total quantum of waste generated
category wise.
➢ The construction and demolition waste, street sweeping, waste from parks etc. shall also
be assessed using suitable quantification techniques.
➢ The hazardous waste and e-waste shall be quantified based on population estimation in
OSC.
➢ Characterization and categorization – biodegradable, recyclable, inert, and domestic
hazardous
➢ Establish future generation trends by projecting the population and per capita generation
rate for the reference year.
Solid Waste Management Conceptual Plan
➢ Based on the outputs derived from various tasks discussed above, a solid waste
management plan has been prepared. The management plan essentially consists of specific
proposals for improving various facets of solid waste management, phased implementation
schedule and cost estimates for the proposed measures. The following tasks shall be
undertaken:
o Review of the environmental, physical, social and economic conditions of all the
sites of OSC.

Final EIA Report – Orange Smart City, Pen, Raigad July 2018
105
BE/EIA-OSC/002
o Integrate the Industrial solid waste with the Commercial and Residential waste
management system.
o Technical viability of the different technologies of solid waste management
considering the existing Waste Quantity & Quality, requirement for waste
segregation, primary and secondary storage and collection and waste treatment as
described below.
Waste Segregation & Storage
The segregated waste is packed perfectly before transporting for recycling to avoid any spillage
and other inconveniences. The waste is weighed and transported to the statutory authorized
recycling agency for complete recycling of waste generated. The complete recycling of waste is
continuously monitored and recycled up to end products production like bio fertilizers,
construction blocks and raw bituminous for construction of roads. The following tasks would be
performed to ascertain the same:
o Modalities of storing waste at source & plan for source segregation
o Develop waste minimization & recycling strategy including implementation
options.
Primary Collection
All bins with nomenclature have been provided to ease the user to drop the waste into suitable
bins. The filled bins are collected in scientific manner and transferred to solid waste collection
centre for further segregation and packing after weighing. The color codes and nomenclature
represented shown in the Figure 2-29 below have been used in OSC. The following tasks would
be performed to ascertain the same.

Final EIA Report – Orange Smart City, Pen, Raigad July 2018
106
BE/EIA-OSC/002
Figure 2-29: Primary waste collection bins and codes
Secondary Storage / Collection
➢ Planning and design of transfer stations / collection points for secondary/intermediate
storage
➢ Develop efficient collection and transportation of waste
➢ Identification of vehicles for collection of different categorization of waste
➢ Design of vehicle routing and collection schedule.
Waste Collection Centre
➢ The waste collection centre is constructed to handle the waste generated in OSC by means
of scientific method of segregation and recycling. The waste collection centre is
constructed in environment friendly manner as listed below:
➢ The roof top of the waste collection centre is fixed with transparent roof for natural light
illumination due to which the activities at waste collection centre takes place without light
during day time. The main idea of this structure is to save power.
➢ The activities at waste collection centre are planned in day time only.
➢ The exhaust to clear off all the waste smell elimination in the waste collection centre is of
natural wind operational type exhaust fan where the power is not require running the
exhaust. The exhaust fans runs on wind energy.
➢ The platform of the waste collection centre is raised by 10 ft. from ground level in order to
avoid any rain water entry or animals.

Final EIA Report – Orange Smart City, Pen, Raigad July 2018
107
BE/EIA-OSC/002
Figure 2-30 : Waste Processing Centre
Waste Processing, Treatment and Disposal of Waste
The completely segregated and packed solid waste transferred by good transport vehicle to
statutory authorized agency for complete recycling after the quantity measurement. The complete
scientific method of recycling is ensured and continuously monitored. The plastic waste is recycled
for production of bituminous, the paper and other waste are recycled as bio fertilizer and wet waste
is recycled as bio gas generation.
The end products like bio fertilizers and concrete blocks from OSC solid waste is again utilized by
OSC on agreed terms and conditions with the agency in various field like irrigation and
construction works. The sludge generated in OSC STP is also used as fertilizer for landscaping
after de-composting in earth pits.
Disposal of solid waste shall be made at the designated site prescribed by Pollution Control Board.
The map depicting solid waste infrastructure is given in Figure 2-31: Map depicting solid waste
infrastructure

Final EIA Report – Orange Smart City, Pen, Raigad July 2018
108
BE/EIA-OSC/002
Figure 2-31: Map depicting solid waste infrastructure

Final EIA Report – Orange Smart City, Pen, Raigad July 2018
109
BE/EIA-OSC/002
2.29.3 Landfill site
The landfill site for the Orange Smart City has been proposed in the T1 land parcel amounting to
total area of 10 acres including the ancillary infrastructure.
The compliance against the CPHEEO criteria for selecting the site for the landfill is mentioned
below :
Sr.No Criteria Minimum
siting distance
Site selected Remark
1 Coastal regulation,
wetland, critical habitat
areas, sensitive eco-fragile
areas, and flood
plains as recorded for last
100 years
Not permitted
within these
areas
Not Applicable
2 Rivers 100 metres from
flood plain
Closest distance
is 1200
metres from the
river in
T1
3 Ponds, lakes, water bodies 200m Not Applicable
4 Non- meandering water
channel (canal,
drainage, etc.)
30m 500 metres from
the natural drain
in T1, 530
metres from the
irrigation canal
5 Highway or railway line,
water supply wells
500m from
centre line
1800 metres
from Pen -
Khopoli
highway
6 Habitation 500m from such
areas
510 metres from
nearby
existing
settlements, 970
metres from
proposed
residential area

Final EIA Report – Orange Smart City, Pen, Raigad July 2018
110
BE/EIA-OSC/002
7 Earthquake zone 500m from fault
line fracture
Not Applicable
8 Flood Prone area Not permitted
within these
areas
Not Applicable
9 Water table (highest level) Bottom liner
atleast 2m above
highest water
table
Average ground
water table is
more than 5
metres in the
selected area
10 Airport 20 km 45 kms from
CSIA & 30 kms
aerial distance
from
Proposed Navi
Mumbai Airport
The operator should comply with the following requirements for the landfill site confirming
to the SWM Rules 2016 as under:
Criteria for development of facilities at the sanitary landfills.-
1. Landfill site shall be fenced or hedged and provided with proper gate to monitor incoming
vehicles, to prevent entry of unauthorised persons and stray animals
2. The approach and / internal roads shall be concreted or paved so as to avoid generation of
dust particles due to vehicular movement and shall be so designed to ensure free movement
of vehicles and other machinery.
3. The landfill site shall have waste inspection facility to monitor waste brought in for
landfilling h, office facility for record keeping and shelter for keeping equipment and
machinery including pollution monitoring equipment. The operator of the facility shall
maintain record of waste received, processed and disposed.
4. Utilities such as drinking water and sanitary facilities (preferably washing/bathing facilities
for workers) and lighting arrangements for easy landfill operations during night hours shall
be provided
5. Safety provisions including health inspections of workers at landfill sites shall be carried
out made.
6. Provisions for parking, cleaning, washing of transport vehicles carrying solid waste shall
be provided. The wastewater so generated shall be treated to meet the prescribed standards.
Criteria for specifications for land filling operations and closure on completion of land
filling.-
Final EIA Report – Orange Smart City, Pen, Raigad July 2018
111
BE/EIA-OSC/002
1. Waste for land filling shall be compacted in thin layers using heavy compactors to achieve
high density of the waste. In high rainfall areas where heavy compactors cannot be used,
alternative measures shall be adopted.
2. Till the time waste processing facilities for composting or recycling or energy recovery are
set up, the waste shall be sent to the sanitary landfill. The landfill cell shall be covered at
the end of each working day with minimum 10 cm of soil, inert debris or construction
material..
3. Prior to the commencement of monsoon season, an intermediate cover of 40-65 cm
thickness of soil shall be placed on the landfill with proper compaction and grading to
prevent infiltration during monsoon. Proper drainage shall be constructed to divert run-off
away from the active cell of the landfill.
After completion of landfill, a final cover shall be designed to minimise infiltration and
erosion. The final cover shall meet the following specifications, namely :--
➢ The final cover shall have a barrier soil layer comprising of 60 cm of clay or amended soil
with permeability coefficient less than 1 x 10⁻⁷ cm/sec.
➢ On top of the barrier soil layer, there shall be a drainage layer of 15 cm.
➢ On top of the drainage layer, there shall be a vegetative layer of 45 cm to support natural
plant growth and to minimise erosion.
(D) Criteria for pollution prevention.-In order to prevent pollution from landfill operations,
the following provisions shall be made, namely:-
(i) The storm water drain shall be designed and constructed in such a way that the surface runoff
water is diverted from the landfilling site and leachates from solid waste locations do not get mixed
with the surface runoff water. Provisions for diversion of storm water discharge drains shall be
made to minimise leachate generation and prevent pollution of surface water and also for avoiding
flooding and creation of marshy conditions.
(ii) Non-permeable lining system at the base and walls of waste disposal area. For landfill receiving
residues of waste processing facilities or mixed waste or waste having contamination of hazardous
materials (such as aerosols, bleaches, polishes, batteries, waste oils, paint products and pesticides)
shall have liner of composite barrier of 1.5 mm thick high density polyethylene (HDPE) geo-
membrane or geo-synthetic liners, or equivalent, overlying 90 cm of soil (clay or amended soil)
having permeability coefficient not greater than 1 x 10⁻⁷ cm/sec. The highest level of water table
shall be at least two meter below the base of clay or amended soil barrier layer provided at the
bottom of landfills.
(iii) Provisions for management of leachates including its collection and treatment shall be made.
The treated leachate shall be recycled or utilized as permitted, otherwise shall be released into the
sewerage line, after meeting the standards specified in Schedule- II.. In no case, leachate shall be
released into open environment.
(iv) Arrangement shall be made to prevent leachate runoff from landfill area entering any drain,
stream, river, lake or pond. In case of mixing of runoff water with leachate or solid waste, the
entire mixed water shall be treated by the concern authority.
Criteria for water quality monitoring.-

Final EIA Report – Orange Smart City, Pen, Raigad July 2018
112
BE/EIA-OSC/002
Before establishing any landfill site, baseline data of ground water quality in the area shall be
collected and kept in record for future reference. The ground water quality within 50 meter of the
periphery of landfill site shall be periodically monitored covering different seasons in a year that
is, summer, monsoon and post-monsoon period to ensure that the ground water is not
contaminated.
Usage of groundwater in and around landfill sites for any purpose (including drinking and
irrigation) shall be considered only after ensuring its quality. The following specifications for
drinking water quality shall apply for monitoring purpose, namely:-
Criteria for the ambient air quality monitoring

Final EIA Report – Orange Smart City, Pen, Raigad July 2018
113
BE/EIA-OSC/002
1. Landfill gas control system including gas collection system shall be installed at landfill site
to minimize odour, prevent off-site migration of gases, to protect vegetation planted on the
rehabilitated landfill surface. For enhancing landfill gas recovery, use of geomembranes in
cover systems along with gas collection wells should be considered.
2. The concentration of methane gas generated at landfill site shall not exceed 25 per cent of
the lower explosive limit (LEL).
3. The landfill gas from the collection facility at a landfill site shall be utilized for either direct
thermal applications or power generation, as per viability. Otherwise, landfill gas shall be
burnt (flared) and shall not be allowed to escape directly to the atmosphere or for illegal
tapping. Passive venting shall be allowed in case if its utilisation or flaring is not possible.
4. Ambient air quality at the landfill site and at the vicinity shall be regularly monitored.
Ambient air quality shall meet the standards prescribed by the Central Pollution Control
Board for Industrial area.
Criteria for plantation at landfill Site.-
A vegetative cover shall be provided over the completed site in accordance with the following
specifications, namely:-
1. Locally adopted non-edible perennial plants that are resistant to drought and extreme
temperatures shall be planted;
2. The selection of plants should be of such variety that their roots do not penetrate more than
30 cms. This condition shall apply till the landfill is stabilized;
3. Selected plants shall have ability to thrive on low-nutrient soil with minimum nutrient
addition;
4. Plantation to be made in sufficient density to minimise soil erosion.
5. Green belts shall be developed all around the boundary of the landfill in consultation with
State Pollution Control Boards or Pollution Control Committees.
Criteria for post-care of landfill site.-
(1) The post-closure care of landfill site shall be conducted for at least fifteen years and long term
monitoring or care plan shall consist of the following, namely :-‘
(a) Maintaining the integrity and effectiveness of final cover, making repairs and preventing run-
on and run-off from eroding or otherwise damaging the final cover;
(b) Monitoring leachate collection system in accordance with the requirement;
(c) Monitoring of ground water in and around landfill;
(d) Maintaining and operating the landfill gas collection system to meet the standards.
(2) Use of closed landfill sites after fifteen years of post-closure monitoring can be considered for
human settlement or otherwise only after ensuring that gaseous emission and leachate quality
analysis complies with the specified standards and the soil stability is ensured.
Requirement of seeking environmental clearance: The operator of the Common Waste
Management Facility will seek environmental clearance as per EIA notification 2006 and its
amendments thereof.

Final EIA Report – Orange Smart City, Pen, Raigad July 2018
114
BE/EIA-OSC/002
2.30 HVAC Infrastructure/District Cooling System
It is proposed to provide air-conditioning and ventilation system for Orange Smart City. District
Cooling Plants (DCP) would be provided to meet the requirements placed in a modular form. The
efficiencies gained by central chilled water facilities result in lower overall energy consumption,
increased reliability, increased diversification of cooling load, and reduced environmental impact.
2.30.1 Proposed HVAC System
It is proposed to have centralized water-cooled system for the industrial and Hospitality Sector
while air-cooled units are proposed for the Commercial, Neighborhood and Residential areas at all
the four sites of OSC.
2.30.2 Strategy & Phasing of Implementation
For Industrial and Hospitality Sector, the cooling load and plant capacity will be depending on the
area development strategy and the phasing. The chilled water piping buried or in trenches up to
individual building location will be developed by Developer. Further the individual building owner
or developer has to connect and extend the network at desired locations inside the building.
For Commercial, Neighborhood and Residential areas, the building owner/ developer will design,
plan, procure, execute and meet his building air-conditioning and ventilation requirement. In
future, looking at the feasibility and requirements proposed HVAC system and DCS options will
be implemented.
2.31 IT & telecommunication
ICT Plan for Orange Smart City consists of the smart Infrastructure within the City for providing
the communication system such as telephone & Internet, monitoring of the city services, planning
and controlling the City Infrastructure, provide communication medium for Systems, People and
effectively manage the resources. In order to meet the growing needs and the opportunities
associated with an increasing urban population, cities require innovative approaches to achieve
sustainable development, which are crucial to ensure more inclusive development pathways and a
higher quality of life (QoL) for its inhabitants. This will enable an Orange Smart City to become
an efficient urban center of the future, safe, secure, green and sustainable with a well-balanced
relationship between city and government managers, business and industry, research and academia
and the citizens. Information & Communication Technology (ICT) acts as a key enabler for the
achievement of these goals, there is an increasing need to better understand and foster the use of
new technologies, particularly of rapidly diffusing Information and Communication Technologies
(ICTs). Following ICT Systems are planned for the Orange Smart City:
➢ Trunk infrastructure for Telephone & Internet Connectivity
➢ Safety and Security System
➢ Command Centre & Emergency Response System
➢ Utility Monitoring and Management
2.32 Telephone and Internet / Optical Fiber Network
Telephone and Broadband access is an essential part of our daily needs and also an economy. To
create jobs and grow wages at home, and to compete in the global information economy, the

Final EIA Report – Orange Smart City, Pen, Raigad July 2018
115
BE/EIA-OSC/002
delivery of fast, affordable and reliable broadband service to all corners is must. The build-out of
broadband infrastructure itself is a major driver of investment and job creation, but even more
significant are the ways that connectivity is transforming a range of industries, education,
entertainment, agriculture, business, and many more.
To fulfill the requirement of communication systems of telephone and Internet services for
residential, Industrial and commercial user’s Broadband network has to be planned for its trunk
infrastructure. The provision for the trunk infrastructure for communication is made in the initial
phase of the project planning to lay down the Optical Fiber network for using telephone, internet
and entertainment services. Provision of Ducts for laying the telephone and Broadband cables is
planned. Ducts and street furniture is planned along both sides of the Arterial Roads and Internal
roads. The Internet Service Providers / Telecom service Providers will lay down their optical fiber
cable in the duct to provide the telecom and internet services to the residents.
T2, T3 and T4 Sites of OSC will be connected on lease lines for centralized monitoring of the
utilities and facility management. Facility management and central monitoring will be done from
T1 Land parcel and other land parcels will have secondary monitoring Stations.
2.32.1 Safety, security and Surveillance system
The Aim of the Safety, Security and Surveillance is to provide safe and secure environment to the
residents, Maintain Law and Order, Crime Control and traffic control and management. Video
Surveillance System will be implemented at junctions, common area and market places for
monitoring the movement of the people, Vehicles, etc. This system will also integrate with other
stakeholder’s surveillance System to provide the holistic and integrated video surveillance System.
Command and control system will also be integrated with Emergency Response System
Mechanism to provide the quick response. A mix of High definition IP based Fixed; ANPR and
PTZ cameras will be used for the purpose.
2.32.2 Command Centre and Emergency Response System
Centralized command centre will be established at T1 parcel for monitoring and control of
following Systems:
➢ City / Township wide Video Surveillance System
➢ SCADA System for Water & Waste Water
➢ Solid waste Management System (GPS & RFID based)
➢ Remote monitoring & Control of Electricity
➢ Utility and Facility Management and Billing System
➢ Emergency Response System
➢ Call Centre for Residents
Emergency response System and Facility management System is provided to the residents by
providing Helpline number. Helpline number shall be displayed at prominent public places and
Panic/ Emergency call points are installed throughout the city. Citizen can call to Emergency
response call centre by means of mobile, landline, installed emergency call point and established
two way audio communications with Emergency Response Team. Helpline Call Center from
Command and control centre will receive call and providing response mechanism for safety,
security, utility management, facility management and Emergency response. Well trained

Final EIA Report – Orange Smart City, Pen, Raigad July 2018
116
BE/EIA-OSC/002
operators will provide the response solution based on the type of call / emergency. Response team
such as police help, fire help, medical help, etc. shall be integrated to Emergency Response System.
2.33 Proposed ICT Infrastructure
Proposed Infrastructure will provide the compliance to the following Smart and Sustainable City
Guidelines of the MoUD:
➢ Safety and Security of the residents including women and children
➢ 100% coverage for providing High speed internet connectivity to the Dwellers
➢ 100% coverage for telephone and mobile phone connectivity
➢ 100% metering for utilities such as Water, Energy and other utilities
➢ Quality of life for the people with clean and safe environment
➢ Smart Solutions such as remote monitoring and management of the Utilities, Automated
billing System, Video Surveillance
2.34 Other proposed smart Infrastructure
Domestic Gas
An integrated approach for Orange Smart City consists of the smart Infrastructure within the City
for providing better facilities to the residents and the working population. Such facilities include a
centralized gas supply system for the entire project area. Such facilities will enable the project to
become an efficient urban center of the future, safe, secure, green and sustainable with a well-
balanced relationship between the citizens.
Nowadays, a reticulated LPG Piped Gas System has been adopted in the Orange Smart City. The
system includes underground piped LPG distribution system, bulk installations as per
requirements, valve stations, and gas banks to the entire project area. This is a sustainable, safe
and secure approach for providing piped gas. It also includes an independent gas usage monitory
system with smart meters for increasing the collections of charges as per usage and reducing
leakages, losses and unaccounted gas proportions.
Benefits of a Centralized Gas Supply System proposed at OSC is that No storage of LPG is
required, hence valuable Space Saving, Uninterrupted supply of LPG as there is a standby cylinder
bank with automatic changeover when the main cylinder bank becomes empty, Enhanced safety
and Value Addition to the projects with Cutting Edge modern technology.
2.34.1 Intelligent Building Management System
The buildings in OSC shall be equipped with IBMS and same shall be connected to central control
and command center to provide interface between user and utility service providers.
2.34.2 Fire Fighting System
For the building level firefighting, the water supply would be from Fire Water Storage Tanks. In
all buildings, arrangement or occupancy for firefighting will be provided with warning to
occupants, automatic fire detecting and alarm facilities, for the escape of occupants, or to facilitate
the orderly conduct of fire exit drills.

Final EIA Report – Orange Smart City, Pen, Raigad July 2018
117
BE/EIA-OSC/002
2.34.3 Utility Infrastructure Areas
➢ The utility infrastructure plants for various services such as water, sewerage, solid waste
collection and treatment, district cooling system, power are located so as to meet the
requirements of the proposed development optimally.
➢ These infrastructure facilities are planned to be modular in nature. The distribution of these
infrastructure services would underground / at grade / overhead as per requirement and
feasibility. These utilities would be integrated with the overall OSC infrastructure.
2.35 Summary of Utilities
The Table 2-42 summarizes the Water Supply requirements, Waste Water Generation, Solid Waste
Generation and Electricity Requirements for the OSC Project on the basis of proposed land use in
four parcels – T1, T2, T3 and T4.
Table 2-42: Summary of Utilities
Land
Parcel
Tota
l P
lot
Are
a
(In A
cres
)
Wate
r S
up
ply
Req
uir
emen
ts
(ML
D)
Sew
age
Gen
erati
on
Req
uir
emen
ts
(ML
D)
Soli
d W
ast
e
Gen
erati
on
(Tonnes
/Day
)
Ele
ctri
city
Req
uir
emen
ts
(MV
A)
Eff
luen
t
Gen
erati
on
(ML
D)
T1 723.33 22.23 11.20 24.00 78.23 1.18
T2 102.40 4.82 2.54 5.47 15.01 0.00
T3 83.59 3.67 2.07 4.67 9.26 0.00
T4 133.19 7.88 5.75 17.44 39.69 0.00
Total 1042.51 38.60 21.56 51.58 142.18 1.18
2.36 Traffic and Transportation Plan
The Proposed project comprises of 4 land parcels admeasuring 1042.51 Acres. The land parcels
T1, T2, T3 and T4 are located in the vicinity and have good connectivity from National highways,
State highways and from existing road network and regional transit facilities. The following
section details out the existing and proposed transportation facilities in the project. The regional
connectivity details are given in Table 2-43: Regional Connectivity Details
Table 2-43: Regional Connectivity Details
Sr. No. Particulars Connecting Places
1 Mumbai – Pune Expressway Navi Mumbai to Pune
2 NH 4 Mumbai – Pune-Bangalore
3 NH 4B Panvel to JNPT
4 NH 3 Mumbai to Nashik
5 SH 88 Pen to Khopoli
6 SH 85 Khopta to Sai

Final EIA Report – Orange Smart City, Pen, Raigad July 2018
118
BE/EIA-OSC/002
Sr. No. Particulars Connecting Places
7 SH 54 Uran to Panvel
2.37 Connectivity to Orange Smart City (Existing)
The proposed project site is centered at a strategic location and has good connectivity from major
urban centres, towns and upcoming areas. The Table 2-44 explains the approximate distances from
nearby urban centres and major landmarks.
Table 2-44: Approximate distances from nearby landmarks
Areas Approximate Aerial Distance (km)
Mumbai City (Fort) 30
Pen Town 02
Navi Mumbai SEZ 08
Panvel 24
Alibaug 30
Khopoli 26
Chhatrapati Shivaji International Airport 85
Proposed Navi Mumbai International Airport 25
Pen railway station 03
2.37.1 Proposed Transport Infrastructure for OSC in the Horizon Year
The transport infrastructure has been proposed on the basis of proposed land use in the four land
parcels T1, T2, T3 and T4 as per OSC development plan. On the basis of percentage distribution
of the land use in each parcel of OSC and norms formulated by MMRDA, MCGM, MIDC, GDCR
and IIA policy have been taken into consideration for calculating the number of four wheelers and
two wheelers on the basis of proposed built up area and the housing typologies.
Table 2-45: Number of Vehicles in Industrial areas
Land
Parcel
Total
Plot
Area
(In
Acres)
Industrial
Area
(m2)
Total 4
Wheelers
(1Cars/200
m2)
Visitor 4
Wheelers
(10%
Addn)
Total 4
Wheelers
Total 2
Wheelers
Truck
(1 per
1000 m2)
T1 723 2282508 11413 1141 12554 34238 2283
T2 102 469452 2347 235 2582 7042 469
T3 84 323760 1619 162 1781 4856 324
T4 133 0 0 0 0 0 0
Total 1043 3075720 15379 1538 16916 46136 3076
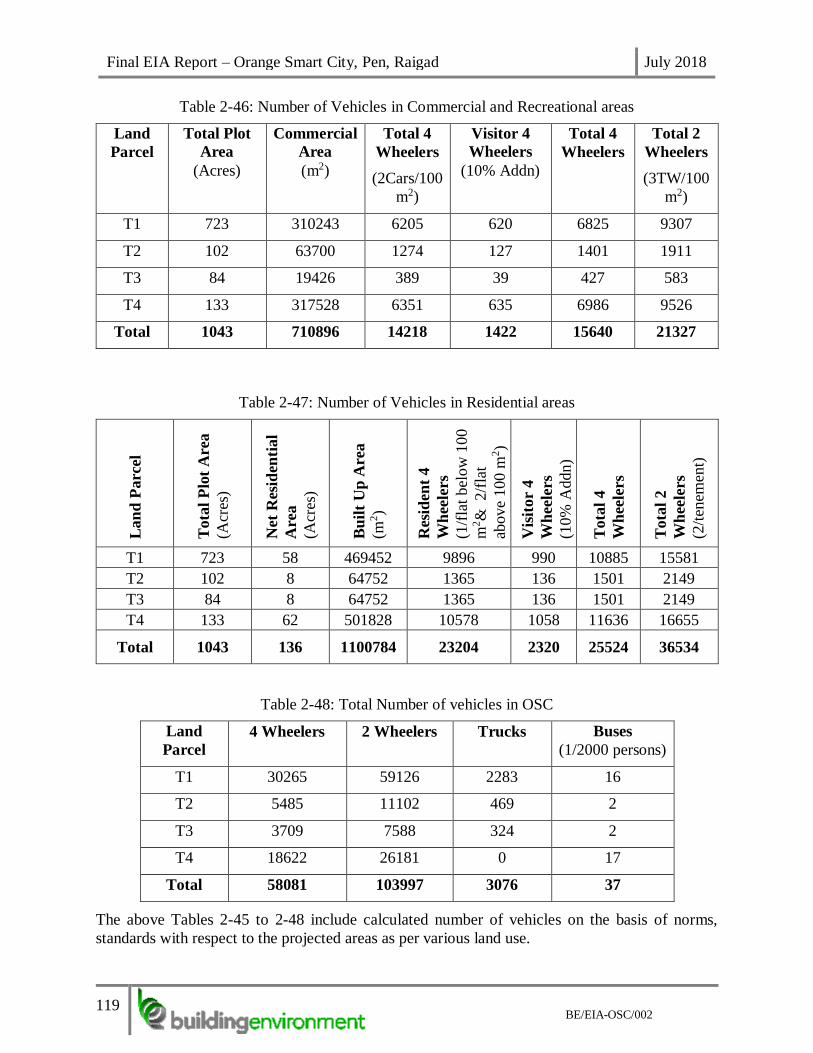
Final EIA Report – Orange Smart City, Pen, Raigad July 2018
119
BE/EIA-OSC/002
Table 2-46: Number of Vehicles in Commercial and Recreational areas
Land
Parcel
Total Plot
Area
(Acres)
Commercial
Area
(m2)
Total 4
Wheelers
(2Cars/100
m2)
Visitor 4
Wheelers
(10% Addn)
Total 4
Wheelers
Total 2
Wheelers
(3TW/100
m2)
T1 723 310243 6205 620 6825 9307
T2 102 63700 1274 127 1401 1911
T3 84 19426 389 39 427 583
T4 133 317528 6351 635 6986 9526
Total 1043 710896 14218 1422 15640 21327
Table 2-47: Number of Vehicles in Residential areas
Lan
d P
arc
el
Tota
l P
lot
Are
a
(Acr
es)
Net
Res
iden
tial
Are
a
(Acr
es)
Bu
ilt
Up
Are
a
(m2)
Res
iden
t 4
Wh
eele
rs
(1/f
lat
bel
ow
100
m2&
2/f
lat
above
100 m
2)
Vis
itor
4
Wh
eele
rs
(10%
Addn)
Tota
l 4
Wh
eele
rs
Tota
l 2
Wh
eele
rs
(2/t
enem
ent)
T1 723 58 469452 9896 990 10885 15581
T2 102 8 64752 1365 136 1501 2149
T3 84 8 64752 1365 136 1501 2149
T4 133 62 501828 10578 1058 11636 16655
Total 1043 136 1100784 23204 2320 25524 36534
Table 2-48: Total Number of vehicles in OSC
Land
Parcel
4 Wheelers 2 Wheelers Trucks Buses
(1/2000 persons)
T1 30265 59126 2283 16
T2 5485 11102 469 2
T3 3709 7588 324 2
T4 18622 26181 0 17
Total 58081 103997 3076 37
The above Tables 2-45 to 2-48 include calculated number of vehicles on the basis of norms,
standards with respect to the projected areas as per various land use.

Final EIA Report – Orange Smart City, Pen, Raigad July 2018
120
BE/EIA-OSC/002
2.38 Parking Proposals
All the proposed residential, commercial and industrial development in the proposed project has
incorporated parking facilities for the workers, cargo and residents respectively inside the
dedicated site areas. Apart from these, dedicated road side parking facilities for the tourists and
other floating population commuting inside OSC have been proposed. Similar facilities for cargo
trucks, commuter buses have been provided at identified locations in the four land parcels.
2.38.1 Proposed Roadways and Kerb Side Facilities
Detailed road network for the entire project site has been worked out on the basis of the contour
survey drawings and from the proposed land use plans. The road widths have been allocated as per
the location of various industrial, residential and commercial plot sizes with appropriate road
sections and street furniture incorporated (footpaths, cycle tracks, ROW’s, etc.)
2.38.2 Proposed Public Transport Facilities
Bus Transit System
A commuter bus service is a fixed-route bus characterized by service predominantly in one
direction during peak periods, limited stops, use of multi-ride tickets and routes of extended length,
usually between the central business district and outlying suburbs. Commuter bus services also
include other services, characterized by a limited route structure, limited stops and a coordinated
relationship with another mode of transportation. Such transit system has been proposed in the
OSC project keeping in mind the total area of the township as well as the frequency of other modes
of transport available for the commuters. Proposing such services in the project will not only help
reduce personal transport but help improve environmental conditions.
Figure 2-32: Bus Transit Services
Rent-a-Cycle System
A bicycle-sharing system is a service in which bicycles are made available for shared use to
individuals on a very short-term basis. Bike share schemes allow people to borrow a bike from
point A and return it at point B. The service is mostly free or with a nominal charge. It helps in
promoting non-motorized approach and is a very sustainable way for local commute. Incorporating
such transportation concepts will add value to the project. Such smart non-motorized transit
facilities have been included in OSC project.

Final EIA Report – Orange Smart City, Pen, Raigad July 2018
121
BE/EIA-OSC/002
Figure 2-33: Bicycle Sharing Services
Proposed Pedestrian Facilities
As the main vision of this project is to incorporate smart concepts into conventional integrated
township planning techniques, a stress will be given on promoting non-motorized facilities and
creating a pedestrian friendly environment in the entire township. Adequate importance has been
given to proposing vehicle-free zones, walking plazas, pedestrian zones, walkways, etc. in the
project. This will not only improvise the quality of life of the users and residents but also help
achieve an eco-friendly environment in the township.
Traffic Management System
The Advanced Traffic Management System is a top-down management perspective that integrates
technology primarily to improve the flow of vehicle traffic and improve safety. The primary
approach of this system is increase transportation system efficiency, enhance mobility, improve
safety, reduce fuel consumption and environmental cost and increase economic productivity. Such
systems will be incorporated in the project.
Proposed Road Network
The Road Network proposed in all four land parcels has been worked out on basis of the proposed
land-use and the topographical conditions. The placement of roads has been worked out on the
detailed slope analysis and study of the natural drains and gradients. At present 24-meter-wide
roads have been proposed with bridges at relevant locations. The following table explains the
proposed facilities:

Final EIA Report – Orange Smart City, Pen, Raigad July 2018
122
BE/EIA-OSC/002
Table 2-49: Infrastructure related to Road
Land Parcel Road (km) Bridges (Nos.)
T1 8.4 3
T2 2.2 -
T3 1.8 (24 m) & 0.8 (12 m) -
T4 1.7 (12 m) -
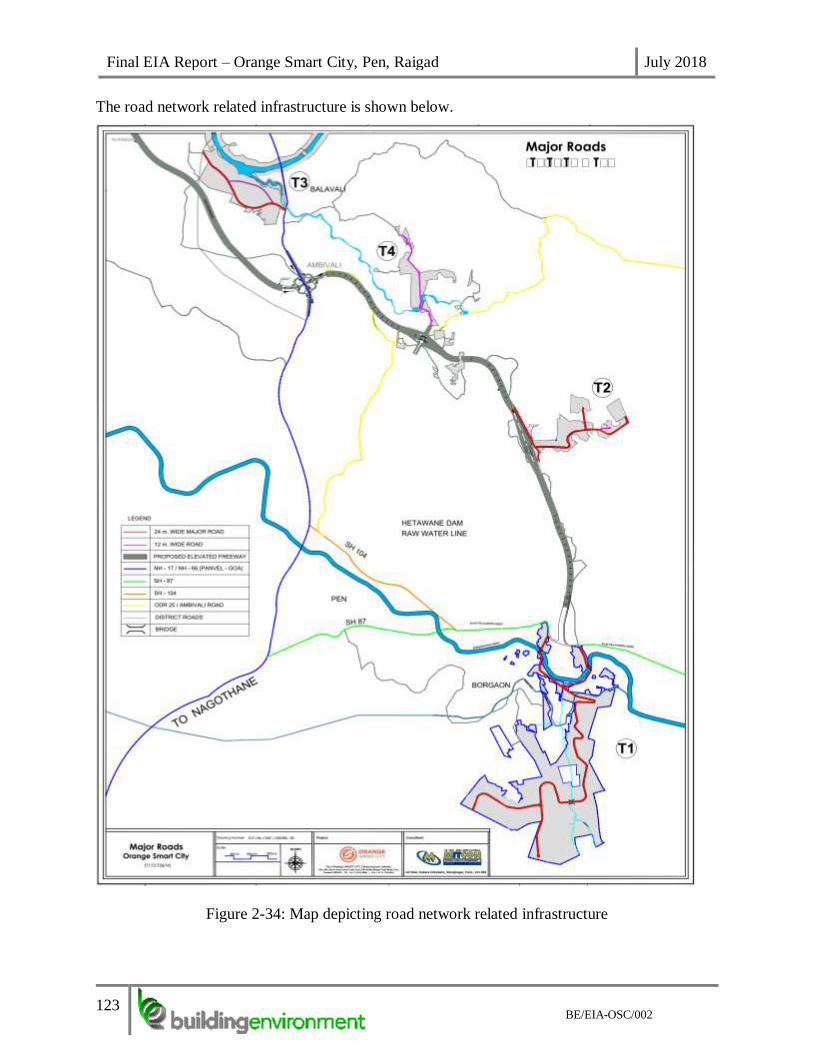
Final EIA Report – Orange Smart City, Pen, Raigad July 2018
123
BE/EIA-OSC/002
The road network related infrastructure is shown below.
Figure 2-34: Map depicting road network related infrastructure

Final EIA Report – Orange Smart City, Pen, Raigad July 2018
124
BE/EIA-OSC/002
2.39 Project Implementation and Scheduling
Orange Smart City Infrastructure Pvt. Ltd. (OSCIPL), as the Project Proponent has the overall
responsibility for the planning, design, construction and operation of the Orange Smart City
(OSC). Proposed Master Plan of OSC is an orderly series of development intended to provide
physically balanced distribution of land uses that contributes towards and facilitates the long-term
fiscal and economic viability and a safe, efficient, attractive and smart infrastructure facility
providing flexibility to meet the short and long-range needs of the OSC in a timely manner.
OSC Master Plan provides a strategic approach for construction work in Phases. The scheduling
of projects within the master plan has been prioritized to permit construction work in a coordinated
approach.
The Phasing has been planned considering required OSC demand at each stage, optimum
utilization of the available OSC land resources, minimum impact on existing and adjoining
development, safeguarding future unconstrained development by means of a coherent and
comprehensive phasing strategy. As per OSC proposed Master Plan, the development is proposed
to balance the overall demand and capacity in each stage of development.
As the development at OSC is spread over 4 sites within 10 Km of Radius. The development at all
the Sites will start concurrently to meet the growing demand in the region.
The proposed infrastructure development and supporting facilities including STP, ETP, WTP, Sub
Stations, Parking facilities, administrative buildings, etc. will be developed in 2 Phases. The details
of Phasing are as given in Table 2-50.
Table 2-50: Details of phasing
Phase Timeframe
Phase I 2019 – 2023
Phase II 2024 - 2029
The implementation plans have been prepared considering overall development of OSC and covers
the entire 7-year master planning horizon, ending at Phase II (2024 - 29). The implementation plan
is driven primarily to provide entire Infrastructure Facility. The infrastructure shall be completed
by developing infrastructure required to make the OSC operational like internal roads, all the
utilities, Fire Station, Parking facilities, Administrative Buildings, required fencing / boundary
wall, etc.
The earth work for the entire OSC area is planned to be completed in the Phase I over the entire
site. The earthwork boundaries include undeveloped site required for the development of the
infrastructure including roads and services. This provides the platform for utilities corridors and
road pavements and structures, and the building foundations for essential buildings to make OSC
Operational.

Final EIA Report – Orange Smart City, Pen, Raigad July 2018
125
BE/EIA-OSC/002
Gross area of approx. 600 acres shall be developed in Phase I (2019 – 2023) including OSC
management and administration offices, facilities like police station, required utilities, healthcare
facilities, Traffic and Transportation facilitates, Training Center & School, facilities for
entertainment & recreation, conference & exhibition facilities, etc.
The section below shows proposed OSC development of BIA, in phase I & II development
programme through 2019 – 2029. This staged development of projects will enable the OSC to get
operational and fulfill the demand and support the development in the region.
Sr.
No.
Project Description Implementation
(Phase)
1 Ground Improvement, Grading, Boundary Wall as per
Master Plan
Phase I & Phase II
2 Roads Phase I & Phase II
3 Storm Water Phase I & Phase II
4 Skywalk / Underpass (Pedestrian & Vehicular / Bridges) Phase I & Phase II
5 Water Supply Phase I & Phase II
6 Sewage Management Phase I & Phase II
7 Rain Water Harvesting Phase I & Phase II
8 Recycle Water Phase I & Phase II
9 Power & Electricity Phase I & Phase II
10 IT & Security Phase I & Phase II
11 Gas Supply Phase I & Phase II
12 Fire Station Phase I & Phase II
13 Solid waste Disposal System including collection Phase I & Phase II
14 Site Development Phase I
15 Parking Facility Phase I & Phase II
16 Landscape / Parks / Open Space Development Phase I & Phase II
17 All other essential Infrastructure, Utilities and Services Phase II
18 Entrance Gates Phase I & Phase II
19 Essential Buildings including OSC Management
Building, Administrative Building, Training Center,
Hospital, Police Station, Police posts, security offices,
Common Service Blocks, Sports Club, etc.
Phase I & Phase II

Final EIA Report – Orange Smart City, Pen, Raigad July 2018
126
BE/EIA-OSC/002
Long-term Implementation Plan

Final EIA Report – Orange Smart City, Pen, Raigad July 2018
127
BE/EIA-OSC/002

Final EIA Report – Orange Smart City, Pen, Raigad July 2018
128
BE/EIA-OSC/002

Final EIA Report – Orange Smart City, Pen, Raigad July 2018
129
BE/EIA-OSC/002
2.40 Safety and Security Plan of Orange Smart City
Safety and Security becomes critical today as the nature of threat and risk in today’s world is
multifaceted and multi-channeled and therefore, OSC Master Plan considers every aspect and
worked on holistic approach to safety and security with overall development at OSC.
OSC being Greenfield smart city is planned with a holistic approach which enables the entire
infrastructure and people living in OSC to support the others which creates an environment
where people can live without worrying about safety. OSC is planned with an integrated
approach and created incredible places which allow strong, integrated communities to flourish
in an environmentally safe and secure space.
As safety & security becomes more critical, OSC is planned on principles of Crime prevention
through environmental design (CPTED), which shapes the Built Environment of OSC,
encourages legitimate use and discourage the illegitimate use within OSC. OSC has also
planned to standardized the CPTED working processes.
The physical built environment in OSC is planned with multidisciplinary approach having
maximum open space which discourages crime and minimize the opportunities for such events.
The built environment is designed to reduce crime opportunity and fear of crime through
natural, mechanical, and practical means. The OSC is designed with more open environment,
greater permeability which enable pedestrian and vehicle permissive with soft controls. OSC
master plan provides natural surveillance, visibility, accessibility, and shall be attractive and
robust.
OSC is planned with integrated approach including infrastructure facilities which improves
system performance by leveraging synergies between multiple infrastructure systems.
The working population and residents of the OSC will be trained / reinforced with notions of a
“sense of ownership”. OSC will have its own natural and technical Surveillance, Access control
Situational Awareness and Incident Response system and shall ensure that the physical
environment transmits positive signals to all users, which leads to a reduction in the fear and
incidence of crime, and an improvement in the quality of life.
OSC is also proposed to use Information and Communications Technology (ICT) to manage
its critical functions (infrastructure and social systems) in smarter and more integrated ways,
which will benefit OSC in its overall development including increased efficiency, resiliency,
sustainability, economic growth and citizen quality of life.
OSC is planned with Central Control and Command Center (C4) at each site integrated with
entire infrastructure system, buildings, utilities, etc. The integrated system enforces standard
operating procedures (SOPs) and provides greater of all security activity in real-time single
view and helps OSC Authorities to implement and enforce rules and regulations. It also enables
situational awareness throughout its infrastructure and buildings by creating a unified and
interactive intelligence image, drawing, data from all sensors, showing the details of incident
and provide video from different sources. The combined image is constantly updated and will
be shared with the concern, thereby serving as a uniform basis for operational planning and
management and allocation of tasks.

Final EIA Report – Orange Smart City, Pen, Raigad July 2018
130
BE/EIA-OSC/002
OSC is also planned with Physical Security Information Management System (PSIMs), which
operates as part of an overall incident cycle that integrates all the security action together. It is
based on Plan, detect, react and analyze principles. The planned system through C4 at OSC
will enable Multi-Agency Collaboration, Situational Awareness, Video & Data Analytics and
Automated Processes.
C4 at OSC is planned to regulate various services and provide security and assistance in disaster
management and emergency situations. The main aim of C4 at OSC is as follows:
➢ Ensuring Safety and Security;
➢ Disaster Management & Emergency Services;
➢ Ensuring efficient services to the Users;
➢ Co-ordination and Integration among various service providers & Users and
➢ Record keeping / documentation.
Also as part of overall development of OSC, the buildings in OSC shall be equipped with
intelligent building management system (IBMS) and same shall be connected to central control
and command center to provide interface between user and utility service providers.
In all buildings, arrangement or occupancy for firefighting will be provided with warning to
occupants, automatic fire detecting and alarm facilities, for the escape of occupants, or to
facilitate the orderly conduct of fire exit drills.
In addition to above, OSC is planned with an integrated technology that is embedded in city
infrastructure, such as integrated traffic management systems and public transport control
systems, weather intelligence, which is unified to facilitate crime prevention and to enable
emergency access or citizen evacuation in the event of a crisis.
Apart from making OSC safer in planning and design, it is also proposed to ensure that a
rigorous system is in place with clear processes and procedures and shall be rigorously
rehearsed.
Most of the natural calamities occur quite suddenly without any forewarning. OSC is in district
Raigad, Maharashtra, falls in seismic Zone IV. All the building and structures including
infrastructure and utility shall be earthquake resistant and shall be designed in compliance with
the codes of seismic Zone IV.
Further, the C4 at OSC will also be integrated with the government authorities including
District Disaster Management Authority (DDMA) and Regional Disaster Management Centre
(RDMC) at Alibaugh and Mumbai. Warning / Alert shall be issued at time of any disaster after
confirmation and proper integrated evacuation system shall be planned for safe evacuation of
the residents and employees of the OSC.
OSC shall also design an effective Crisis Management Plan including establishing a framework
that best suits the needs of the built environment of OSC. A practical framework will be
prepared to ensure the unexpected does happen and the OSC authority shall be prepared to
respond flexibly within established processes to tackle the challenge.
OSC shall also have provision of periodical audit for Safety and security of the overall
development at OSC including Buildings, Infrastructure, Utility, Fire, etc.

Final EIA Report – Orange Smart City, Pen, Raigad July 2018
131
BE/EIA-OSC/002
OSC is environmentally safe and resilient future Smart City as it is cost effective and ensures
that there is no duplication of effort in trying to mitigate risks from a physical and technological
perspective. OSC ensures that security is coherent and non-obtrusive by designing security in
to infrastructure and services it becomes part of daily life and doesn’t become a burden on the
citizen of OSC.
2.41 Solar PV installation
As developers of OSCIL we aim to make maximum usage and reliance on sustainable energy
resources. We are committed to install solar PV cells on all the buildings owned and operated
by the developer. As per calculations the total surface area we are aiming in the proposed
amenities and facilities amounts to around 23.60 Acres of land available for Solar PV
installations.
• Total Area allocated for Solar Roof-Top PV Installations: 23.60 Acres
(40% ground coverage considered on the total proposed Amenity Space of 59 Acres)
• Total electricity generation from proposed Solar PV Installation: 23 MW
(Area requirement: 1Acre per 1 MW & Solar PV Panel efficiency of 15% considered)
• Contribution of electricity generated from Solar PV Installations: 6.68% of total
electricity requirement (1 MVA = 1 MW (if power factor is “1”))
The total contribution of electricity generated from Solar PV Installations on buildings owned
and operated by the Developer accounts to 6.68% of the total Project electricity requirements.
Apart from this the developers will urge all the individual project proponents (industrial,
commercial and residential establishments) to maximize Solar PV installations in their
individual premises.

Final EIA Report – Orange Smart City, Pen, Raigad July 2018
132
BE/EIA-OSC/002
3. DESCRIPTION OF THE ENVIRONMENT
The baseline has been carried out at different locations along the alignment considering
different environmental aspects like topography, drainage, meteorology, biological
environment, socio-economic status etc. The data generation included site visits, primary
environmental monitoring, ecological surveys, social surveys and interviews, processing of
satellite imagery, etc.
3.1 Study area and period
As a primary requirement of EIA process, the baseline data for ambient air quality, water
quality, soil quality, noise levels and meteorology were collected within the study area and area
extending up to 10 km beyond the site boundary, as specifically mentioned at Para 9(iii) of
Form I of EIA Notification 2006 amended hitherto. The baseline study was conducted during
the pre-monsoon season from March 2015 to May 2015 by Avanira Labs (MoEF&CC
recognized and NABL Accredited) as per the Terms of Reference (ToR) approved by the EAC
CRZ and Miscellaneous Committee, Ministry of Environment and Forests & Climate Change
(MoEF&CC).
3.2 Methodology
The guiding factors for the present baseline study are the MoEF&CC’s requirements for the
Environmental Impact Assessment notification. The various environmental attributes were
divided into primary and secondary studies. Primary attributes such as air environment, water,
soil, biological environment was assessed by conducting field studies, on-site monitoring.
Secondary attributes such as land use studies, geology, physiological characteristics, and socio-
economic status have been assessed by literature review of previous studies conducted by
various government publications. The scoping and the extent of data generation were
formulated with interdisciplinary team discussions, criteria questions and professional
judgment. The baseline studies started with site visits and reconnaissance survey in the study
area for fixing the monitoring locations for the primary data. As a secondary data source,
various government agencies were approached for getting information and relevant data.
3.3 Establishment of Baseline for Valued Environmental Components
The primary baseline environmental data are those which need to be collected on the field to
define the status of environment (like air quality data, water quality data, noise quality etc.).
The secondary data are those data which have been collected over the years by some recognized
agencies. (Such as IMD data for micrometeorological data rainfall, humidity and Census data
for Socio Economic, Geological data to understand geological formation of the area etc.,) and
is used to understand the existing environmental scenario of the study area. The Environmental
Impact Assessment (EIA) studies are conducted over a short period of time and therefore
understanding of environmental trends based on few months of primary data has its own
limitations. Ideally, the primary data has to be considered along with the secondary data for
complete understanding of the existing environmental status of the area.
In order to identify the existing environmental and social conditions, following attributes were
considered: Table 3-1.

Final EIA Report – Orange Smart City, Pen, Raigad July 2018
133
BE/EIA-OSC/002
Table 3-1: Methodology of Baseline Data collection
ATTRIBUTE PARAMETERS FREQUENCY OF MONITORING
Meteorology Wind Speed, Wind
Direction, Temperature,
Relative Humidity,
Rainfall, Visibility
Microprocessor based Weather Monitoring
Station
Continuous hourly recording for 10 Days
Ambient Air
Quality
SO2, NOx, PM10,
PM2.5, CO
14 Locations
24 hourly samples Twice a week
3 months
Noise Level Noise Level in dB(A) 8 Locations
Continuously over 24 hours period
Once in season
Vehicular
Traffic
No. of vehicles At major junctions
Water Quality Physical, Chemical and
Biological Parameters
Once in season
14 Locations- (8 Surface water + 6 Ground
water)
Ecology Existing terrestrial and
Aquatic flora and fauna
General in 10 km study area and data collected
around the project site through field visits
Land
Environment
Land use Land use for different Categories
Soil Characteristics 8 Locations
Soil type & texture, Physico-chemical
properties, NPK
Socio-
economic
Aspects
Socio-Economic
Assessment
General in 10 km study area through Census of
India, 2011
3.4 Physical Environment
3.4.1 Physiography
The project area is divided in four patches and these patches occupy diverse topography from
a steeply sloping hilly terrain situated at higher elevations to almost plain topography along
lower contours.
The T1 parcel is situated at southern catchment of Hetavane (Bhogeshwari) river. A South–
North valley divides this parcel in two hills. This valley has upstream maximum elevation of
220 m and downstream minimum elevation of 26 m where it meets the river, whereas ridge has
highest elevation of 340 m at top. The terrain of this land parcel has moderately steeper slopes
but at the top it is flatter. T2 Parcel has relatively flat ground. The ground elevation of this
Parcel ranges from 80 m to 55 m. The T3 land parcel is generally flat at top having slope leading
to the Balganga River having potentials of enhancing the site with a natural frontage. This land
parcel is divided by downstream river of Govirle dam. The drainage channel passes through
the T3 Site connecting to Balganaga River. For T3, elevation ranges from 80m to 40m. The T4
parcel is situated at base of major hills on West. T4 Parcel is made up of eighteen small land
parcels and two major parcels. One of the major parcel have ground elevation ranges from 55m

Final EIA Report – Orange Smart City, Pen, Raigad July 2018
134
BE/EIA-OSC/002
to 7m. And other major parcel is relatively hilly ground with elevations ranges from 86m to
12m.
3.4.2 Drainage
The proposed Integrated Industry Hub Project area is divided in four patches i.e. T1, T2, T3,
and T4. Bhogeshwari River forms Northern boundary of T1 patch and this area comes under
the Bhogeshwari River catchment. Balganga river forms Northern boundary of T3 patch and
this area comes under Balganga River catchment. These two rivers meet Arabian Sea. Whereas
patch T2 & T4 are situated on water divide of these two rivers.
3.4.3 Geology
Deccan Trap Basalt of upper Cretaceous to lower Eocene period is the sole rock formation in
this area. This rock occupies considerable portion of the Central India, covering significant
portion in states of Maharashtra, Madhya Pradesh, Gujarat, Andhra Pradesh, Chhattisgarh and
Karnataka. Nearly 82% of geographical area of Maharashtra state alone is made up of this rock.
This rock is formed due to solidification of lava flows owing their origin to volcanic eruption.
In the study area too, two layers of this rock, separated from each other by an intervening layer
of soft, weathered rock and red soil are observed. The thickness of the individual layers is
generally 12 m to 30 m.
3.4.4 Hydrogeological Survey
The proposed project shall occupy more than 1000 acres land. Therefore, in order to understand
the groundwater regime in the project as well as surrounding area in a proper way to assess the
probable impacts of the proposed activity on the geology, groundwater and surface water of
this neighborhood and to design appropriate Rainwater Harvesting Scheme suitable for
proposed project site for conservation of this precious natural resource, systematic
Hydrogeological study was carried out in and around project area. This assignment was
handled by M/s Sujalam Consultants, Nagpur. Name of Mr. S. A. Kothe – Head Sujalam
Consultants is approved by QCI NABET (accredited vide Accreditation Committee Meeting
for Surveillance Assessment held on May 12, 2017) as empaneled functional area expert for
Hydrology and Groundwater and Geology.
1.1.1.1 Methodology
Methodology used for survey is given as follows:
➢ Reconnaissance visit to assess Geology, Soil, Topography, and drainage within study
area.
➢ To understand the hydrogeological regime within study area along with groundwater
bearing structures and their performance.
➢ To assess water level fluctuation in study area.
➢ To assess probable impacts of the proposed activity on the Surface and Groundwater
regime in the study area.
➢ Baseline data & Quality Control.
1.1.1.2 Hydrogeological Observations
Groundwater Occurrence: The groundwater formation depends upon the topography as well as
the subsurface geology in the area of interest. In the case of OSC project, the topography, as
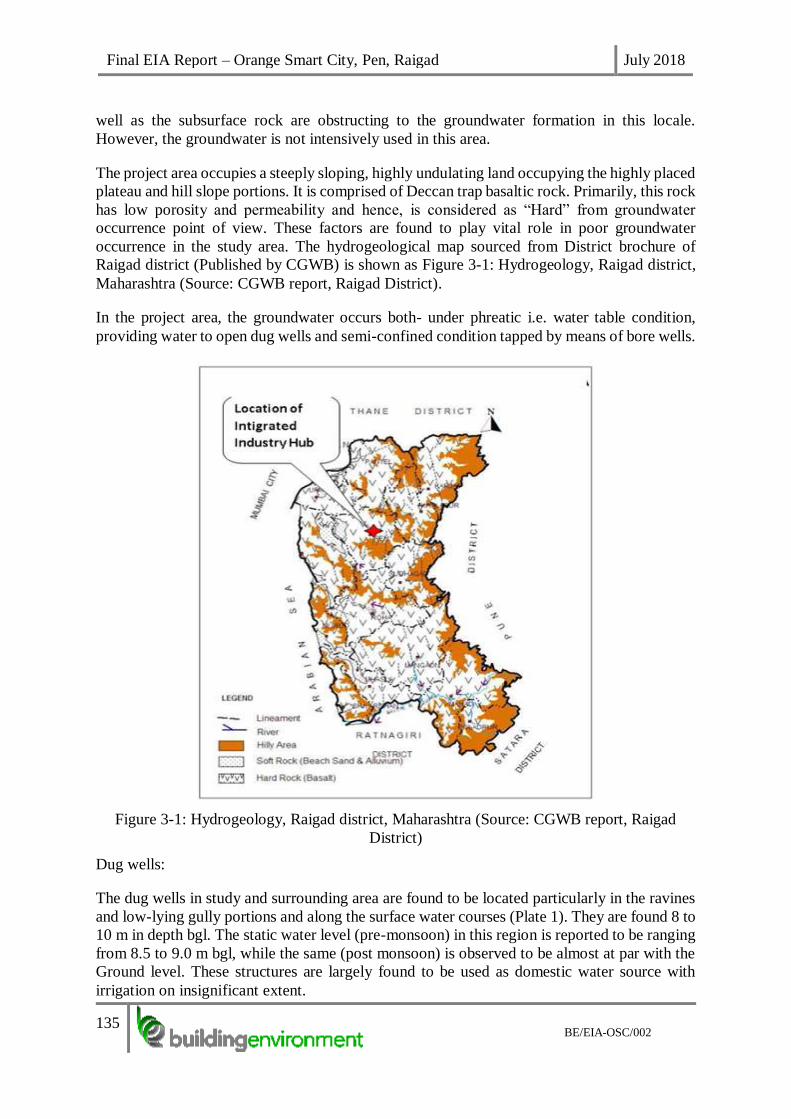
Final EIA Report – Orange Smart City, Pen, Raigad July 2018
135
BE/EIA-OSC/002
well as the subsurface rock are obstructing to the groundwater formation in this locale.
However, the groundwater is not intensively used in this area.
The project area occupies a steeply sloping, highly undulating land occupying the highly placed
plateau and hill slope portions. It is comprised of Deccan trap basaltic rock. Primarily, this rock
has low porosity and permeability and hence, is considered as “Hard” from groundwater
occurrence point of view. These factors are found to play vital role in poor groundwater
occurrence in the study area. The hydrogeological map sourced from District brochure of
Raigad district (Published by CGWB) is shown as Figure 3-1: Hydrogeology, Raigad district,
Maharashtra (Source: CGWB report, Raigad District).
In the project area, the groundwater occurs both- under phreatic i.e. water table condition,
providing water to open dug wells and semi-confined condition tapped by means of bore wells.
Figure 3-1: Hydrogeology, Raigad district, Maharashtra (Source: CGWB report, Raigad
District)
Dug wells:
The dug wells in study and surrounding area are found to be located particularly in the ravines
and low-lying gully portions and along the surface water courses (Plate 1). They are found 8 to
10 m in depth bgl. The static water level (pre-monsoon) in this region is reported to be ranging
from 8.5 to 9.0 m bgl, while the same (post monsoon) is observed to be almost at par with the
Ground level. These structures are largely found to be used as domestic water source with
irrigation on insignificant extent.

Final EIA Report – Orange Smart City, Pen, Raigad July 2018
136
BE/EIA-OSC/002
Bore wells: The study and surrounding area hosts few bore wells. These are observed along the
lower reaches. They are found to tap the semi confined and confined aquifer in this area. They
are reported to be 90 to 100 m in depth bgl. Majority of bore wells are fitted with hand pump
while few are installed with low capacity pumps as per requirement.
The proposed project will not utilize the ground water. It is planned to take water from nearby
Hetawane dam. However, this area is categorized as “SAFE” for further groundwater
utilization by Central Groundwater Board (Ministry of Water Resources, Government of
India).
Plate 1: Dug well adjacent to streamlet
3.5 Land-use
3.5.1 Methodology
Remote Sensing data is a classic source of information on natural resources for a region and
provides a record of the continuum of resource status because of its repetitive coverage. It is a
powerful and accurate means of collecting data. The study of satellite imagery gives an
excellent opportunity to monitor the quantitative extent of vegetation cover as well as
qualitative changes due to changes in environment. This aspect is very significant in
understanding the dynamics of the earth surface features and phenomenon such as various
ecosystems.
3.5.2 Data Base
1.1.1.3 Satellite Data
IRS Resourcesat-2 L4FMX multispectral satellite data of 29th December 2014 was utilized for
the present study and shown in Table 3-2: Details of Satellite Data. The rectification of imagery
was carried out on to bring the digital data on the earth coordinate system by means of ground
control point (GCP) assignments from SOI toposheets. The spectral bands of IRS Resroucesat-
2 data are furnished in Table 3-3: Characteristics of IRS Resourcesat-2 Data and Table 3-4:
IRS Resourcesat-2 L4FMX, Satellite Spectral Bands and their Principal Applications and
image of study area in Figure 3-2: IRS Resourcesat-2 L4FMX Image of the Study Area

Final EIA Report – Orange Smart City, Pen, Raigad July 2018
137
BE/EIA-OSC/002
Table 3-2: Details of Satellite Data
S.No.
Satellite
Sensor
Scale
Path & Row
SOI
Toposheet
No.
Date of
Pass
1
IRS
Resourcesat-
2
L4FMX
1:50,000
94 & 59 B & D
E43H01,
E43H02,
E43H05 &
E43H06
(OSM
Series)
29.12.2014
Table 3-3: Characteristics of IRS Resourcesat-2 Data
Type of
the
Satellite
Multi
Spectral
Bands
Bandwidth /
wave length
in microns
Spectral
resolution
(m)
Product type
Format / scale
1
IRS
Resourcesat-
2
L4FMX
1:50,000
94 & 59 B &
D
E43H01, E43H02,
E43H05 &
E43H06
(OSM Series)
Table 3-4: IRS Resourcesat-2 L4FMX, Satellite Spectral Bands and their Principal
Applications
Band
Wave
Length
(microns)
Application
2 0.52 - 0.59 Soil/vegetation differentiations, coniferous/deciduous flora
discrimination, vegetation vigour assessment, rock/soil boundary
differentiation, turbidity and bathymetry in shallow water.
3 0.62 - 0.68 Strong chlorophyll absorption leading to discrimination of
vegetation types mining area, mapping of settlements and transport
network.
4 0.76 - 0.86 Delineation of surface water features, land forms / rock types, mining
area, mapping of settlements and transport network.

Final EIA Report – Orange Smart City, Pen, Raigad July 2018
138
BE/EIA-OSC/002
Figure 3-2: IRS Resourcesat-2 L4FMX Image of the Study Area
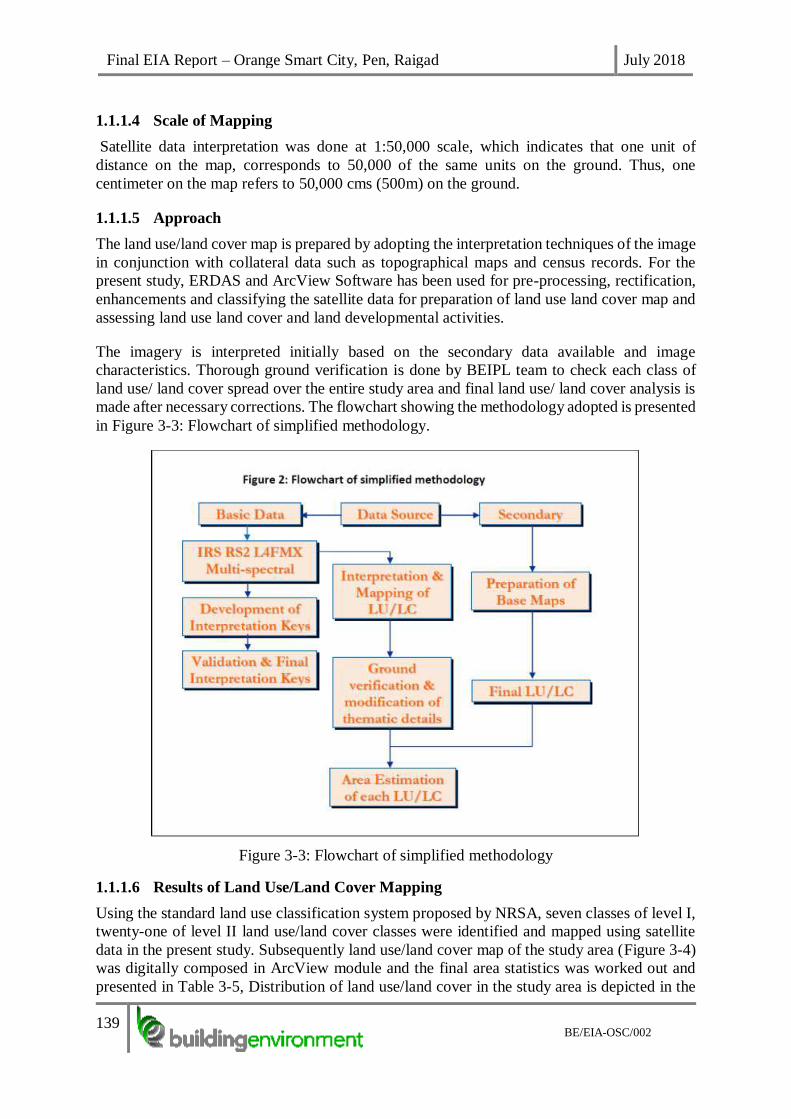
Final EIA Report – Orange Smart City, Pen, Raigad July 2018
139
BE/EIA-OSC/002
1.1.1.4 Scale of Mapping
Satellite data interpretation was done at 1:50,000 scale, which indicates that one unit of
distance on the map, corresponds to 50,000 of the same units on the ground. Thus, one
centimeter on the map refers to 50,000 cms (500m) on the ground.
1.1.1.5 Approach
The land use/land cover map is prepared by adopting the interpretation techniques of the image
in conjunction with collateral data such as topographical maps and census records. For the
present study, ERDAS and ArcView Software has been used for pre-processing, rectification,
enhancements and classifying the satellite data for preparation of land use land cover map and
assessing land use land cover and land developmental activities.
The imagery is interpreted initially based on the secondary data available and image
characteristics. Thorough ground verification is done by BEIPL team to check each class of
land use/ land cover spread over the entire study area and final land use/ land cover analysis is
made after necessary corrections. The flowchart showing the methodology adopted is presented
in Figure 3-3: Flowchart of simplified methodology.
Figure 3-3: Flowchart of simplified methodology
1.1.1.6 Results of Land Use/Land Cover Mapping
Using the standard land use classification system proposed by NRSA, seven classes of level I,
twenty-one of level II land use/land cover classes were identified and mapped using satellite
data in the present study. Subsequently land use/land cover map of the study area (Figure 3-4)
was digitally composed in ArcView module and the final area statistics was worked out and
presented in Table 3-5, Distribution of land use/land cover in the study area is depicted in the

Final EIA Report – Orange Smart City, Pen, Raigad July 2018
140
BE/EIA-OSC/002
form of a bar chart in Figure 3-5. The results depict that the predominant land use is land with
/ without scrub (31.04%), followed by other agricultural (19.02%), dense open vegetation
(18.89%). The other land uses along with respective percentages are given in Table 3-5.
Figure 3-4: land use/land cover map of the study area

Final EIA Report – Orange Smart City, Pen, Raigad July 2018
141
BE/EIA-OSC/002
Table 3-5: Land Use/Land Cover statistics of 15 km Radius Area
S. No
Land Use Area
(Hectares)
Area (%)
1. Settlement 3172.7 3.04
2 Industry 2504.7 2.40
3 Layout 41.7 0.04
4 Expressway 10.4 0.01
5 Dense / Open Vegetation 19714.4 18.89
6 Degraded Scrub 4623.3 4.43
7 Plantation 219.2 0.21
8 Irrigated 1565.5 1.50
9 Other agricultural 19850.0 19.02
10 Fallow Land 3266.6 3.13
11 Land with / without scrub 32394.6 31.04
12 Rocky / Barren 3861.5 3.70
13 Quarry Mining Land 135.7 0.13
14 Stream /River /Canal 4654.6 4.46
15 Reservoir /Tank / Pond 1429.8 1.37
16 Water Logged 114.8 0.11
17 Mudflats / Marshy Land 1722.0 1.65
18 Mangroves 4445.9 4.26
19 Aquaculture Ponds 250.5 0.24
20 Salt Pans 386.1 0.37
Total 104364 100.00
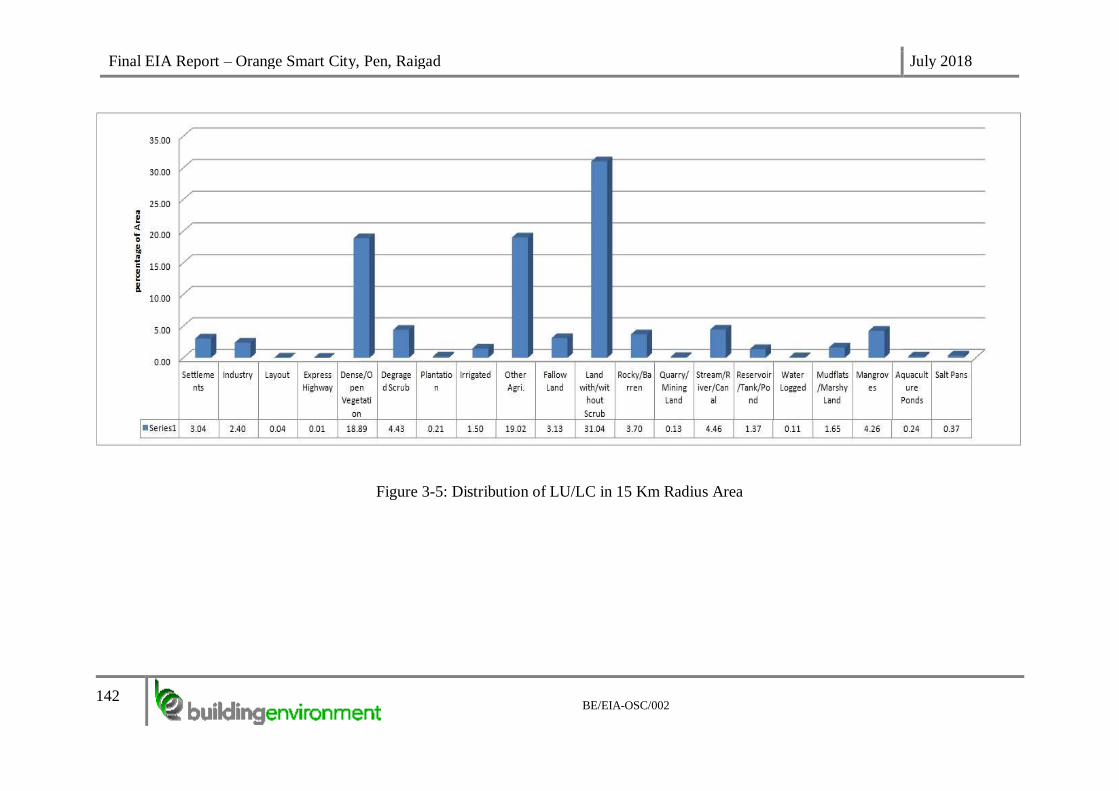
Final EIA Report – Orange Smart City, Pen, Raigad July 2018
142
BE/EIA-OSC/002
Figure 3-5: Distribution of LU/LC in 15 Km Radius Area

Final EIA Report – Orange Smart City, Pen, Raigad July 2018
143
BE/EIA-OSC/002
3.6 Climate and Meteorology
3.6.1 Primary Data
On site monitoring was undertaken for various meteorological variables in order to generate the
site-specific data. The data generated has been compared with meteorological data generated by
nearest observatory at Murud.
An automatic weather monitoring station was installed at a height of 10 meters from the ground
level at proposed site to monitor parameters of wind speed and wind direction, temperature, &
relative humidity. The 24 hourly meteorological data were collected for the study period from
March 2015- May 2015. The data is recorded as the maximum, minimum, instantaneous value,
and average value of all the readings collected during the proceeding hour. Monitoring was done
as per IS: 8829: Micro-meteorological Techniques in Air Pollution. The details of parameters
monitored, equipment used and the frequency of monitoring are given in Table 3-6.
Table 3-6: Meteorological Parameters Monitored at site
Sr. No Parameters Instruments Frequency
1. Wind speed Counter Cup Anemometer Hourly /Continuous
2. Wind direction Wind vane Hourly /Continuous
3. Temperature Thermo sensor Hourly /Continuous
4. Relative humidity Thermo –hydro sensor Hourly /Continuous
3.6.2 Secondary Data
The secondary data for meteorological variables such as wind speed, wind direction and
temperature for the period March -2014 to May 2014 was collected from the nearest IMD station
Murud.
The secondary data of Murud IMD station were analyzed w.r.t wind pattern and temperature. The
seasonal and month –wise interpretation of the secondary data is presented below:
1.1.1.7 Seasonal (March 2014 – May 2014) – Secondary Data
Wind pattern: The seasonal wind pattern is presented in the form of wind rose from the month of
March -2014 – May 2014 (Refer Figure 3-6). The wind rose reflects that the predominant wind
direction is from the W-NW quadrant followed by the East direction. The wind speed varied from
0 m/s to 4.6 m/s, while the average was computed to be 1.37 m/s. The wind speed frequency
distribution chart for the period from March – 2014 to May -2014 is presented in Error! Reference
source not found. and reflects that the wind speed class - 0.5 m/s to 2.1 m/s was found to be
predominant (about 70.8%) most of the time during the season (March 2014 – May 2014). The
frequency of calm period prevailed for 1.5% during the season (March 2014 – May 2014).
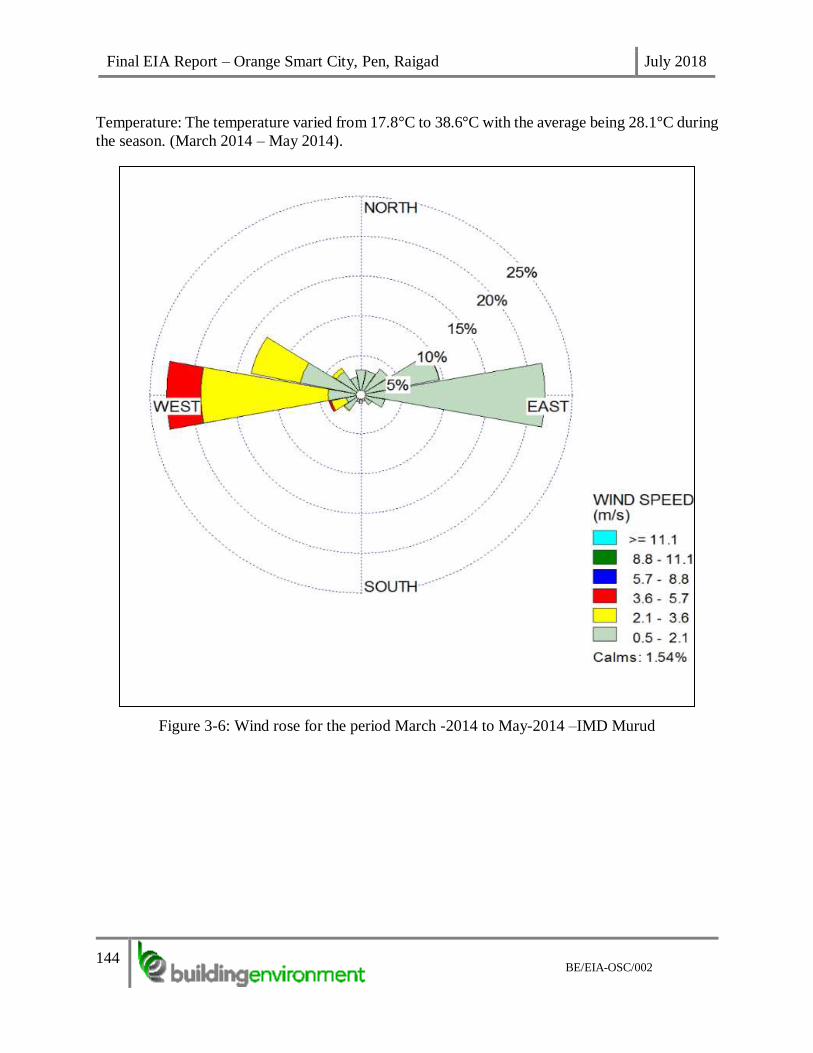
Final EIA Report – Orange Smart City, Pen, Raigad July 2018
144
BE/EIA-OSC/002
Temperature: The temperature varied from 17.8°C to 38.6°C with the average being 28.1°C during
the season. (March 2014 – May 2014).
Figure 3-6: Wind rose for the period March -2014 to May-2014 –IMD Murud

Final EIA Report – Orange Smart City, Pen, Raigad July 2018
145
BE/EIA-OSC/002
Figure 3-7: Wind rose for the period March -2014 to May-2014 –IMD Murud
1.1.1.8 Monthly pattern
March -2014
Wind pattern: The wind pattern is presented in the form of wind rose for the month of March -
2014 (Figure 3-8). The wind rose reflects that the predominant wind direction is from East
followed by the W-NW quadrant. The wind speed varied from 0 m/s to 4.1 m/s, while the average
was computed to be 1.2 m/s. The wind speed frequency distribution chart for the month of March-
2014 is presented in Figure 3-9: Wind class frequency distribution chart of IMD Murud (March-
2014) and reflects that the wind speed class - 0.5m/s to 2.1 m/s was found to be predominant (about
79.7%) most of the time during the month of March 2014. The frequency of calm period prevailed
for 1.9% of during the month.
Temperature: The temperature varied from 17.8°C to 38.6°C with the average being 27°C.
April 2014

Final EIA Report – Orange Smart City, Pen, Raigad July 2018
146
BE/EIA-OSC/002
Wind pattern: The wind pattern is presented in the form of wind rose for the month of April -2014
(Refer Error! Reference source not found.). The wind rose reflects that the predominant wind
direction is from the W-NW quadrant followed by the East direction. The wind speed varied from
0 m/s to 3.9 m/s, while the average was computed to be 1.4 m/s. The wind speed frequency
distribution chart for the month of April 2014 is presented in Error! Reference source not found.
and reflects that the wind speed class - 0.5m/s to 2.1 m/s was found to be predominant (about
69.3%) most of the time during the month of April - 2014. The frequency of calm period prevailed
for 1.3% during the month.
Temperature: The temperature varied from 19.2°C to 36.6°C with an average being 27.7°C during
the month of April-2014.
May 2014
Wind pattern: The wind pattern is presented in the form of wind rose for the month of May -2014
(Refer Error! Reference source not found.. The wind rose reflects that the predominant wind
direction is from the W direction followed by the East direction. The wind speed varied from 0
m/s to 4.6 m/s, while the average was computed to be 1.5 m/s. The wind speed frequency
distribution chart for the month of May - 2014 is presented in Error! Reference source not found.
and reflects that the wind speed class - 0.5m/s to 2.1 m/s was found to be predominant (about
63.3%) most of the time during the month of May - 2014. The frequency of calm period prevailed
for 1.5% during the month. Temperature: The temperature varied from 23.8°C to 34.3°C with the
average being 29.6°C during the month of May-2014.

Final EIA Report – Orange Smart City, Pen, Raigad July 2018
147
BE/EIA-OSC/002
Figure 3-8: Wind rose for the month of
March 2014 (IMD station–Murud)
Figure 3-9: Wind class frequency distribution
chart of IMD Murud (March-2014)
Figure 3-10: Wind rose for the month of
April -2014 (IMD Murud)
Figure 3-11: Wind class frequency
distribution chart of IMD Murud (April-
2014)

Final EIA Report – Orange Smart City, Pen, Raigad July 2018
148
BE/EIA-OSC/002
Figure 3-12: Wind rose for the month of
May 2014 (IMD station –Murud)
Figure 3-13: Wind class frequency
distribution chart IMD Murud (May -2014)
The synopsis of data collected from the nearest IMD station Murud is presented in Table 3-7:
Table 3-7: Synopsis of site specific meteorological data (March 2014 – May 2014)
Month Wind speed (m/s) Temperature (°C)
Max Min Avg Max Min Avg
March -2014 4.1 0 1.2 38.6 17.8 27
April-2014 3.9 0 1.4 36.6 19.2 27.7
May -2014 4.6 0 1.5 34.3 23.8 29.6
1.1.1.9 Seasonal (March 2015 – May 2015) – Primary Data
The seasonal wind pattern is presented in the form of wind rose from the month of March -2015–
May 2015 (Refer Figure 3-14: Seasonal wind pattern (March 2015 – May 2015)). The wind rose
reflects that the predominant wind direction is from the W-NW quadrant followed by the East
direction. The wind speed varied from 0 m/s to 6.0 m/s, while the average was computed to be
1.48 m/s. The wind class frequency distribution chart for the period from March–2015 to May-
2015 is presented in Figure 3-15: Wind class frequency distribution (March 2015 – May 2015) and
reflects that the wind speed fraction in the range of 0.5 m/s to 2.1 m/s was found to be predominant
(about 67.5%) most of the time during the season (March 2015–May 2015). The frequency of calm
period prevailed for 2.4% during the season.

Final EIA Report – Orange Smart City, Pen, Raigad July 2018
149
BE/EIA-OSC/002
Figure 3-14: Seasonal wind pattern (March 2015 – May 2015)

Final EIA Report – Orange Smart City, Pen, Raigad July 2018
150
BE/EIA-OSC/002
Figure 3-15: Wind class frequency distribution (March 2015 – May 2015)
1.1.1.10 Monthly pattern
March 2015
Wind pattern: The wind pattern is presented in the form of wind rose for the month of March -
2015 (Refer Figure 3-16). The wind rose reflects that the predominant wind direction is from W-
NW quadrant followed by the East direction. The wind speed varied from 0 m/s to 5.5 m/s, while
the average was computed to be 1.25 m/s. The wind speed frequency distribution chart for the
month of March-2015 is presented in Figure 3-17: Wind class frequency distribution (March -
2015) and reflects that the wind speed fraction in the range of 0.5m/s to 2.1 m/s was found to be
predominant (about 75%) most of the time during the month of March 2015. The frequency of
calm period prevailed for 4.2% during the month.
Temperature: The temperature varied from 18°C to 39.1°C with the average being 26.8°C during
the month of March-2015.
April 2015

Final EIA Report – Orange Smart City, Pen, Raigad July 2018
151
BE/EIA-OSC/002
Wind pattern: The wind pattern is presented in the form of wind rose for the month of April -2015
(Refer Figure 3-18: Site specific wind rose (April 2015)). The wind rose reflects that the
predominant wind direction is from W-NW quadrant followed by the East direction. The wind
speed varied from 0 m/s to 6.0 m/s, while the average was computed to be 1.61 m/s. The wind
speed frequency distribution chart for the month of April- 2015 is presented in Figure 3-19: Wind
class frequency distribution (April -2015) and reflects that the wind speed fraction in the range of
0.5m/s to 2.1 m/s was found to be predominant (about 65%) most of the time during the month of
April 2015. The frequency of calm period prevailed for 1.5% during the month.
Temperature: The temperature varied from 20.9°C to 36°C with the average being 27.7oC during
the month of April- 2015
May 2015
Wind Pattern: The wind pattern is presented in the form of wind rose for the month of May-2015
(Refer Figure 3-20: Site specific wind rose (May 2015)). The wind rose reflects that the
predominant wind direction is from W direction followed by the East direction. The wind speed
varied from 0 m/s to 4.6 m/s, while the average was computed to be 1.57 m/s. The wind speed
frequency distribution chart for the month of May -2015 is presented in Figure 3-21: Wind class
frequency distribution
(May 2015) and reflects that the wind speed fraction in the range of 0.5m/s to 2.1 m/s was found
to be predominant (about 62.4%) most of the time during the month of May 2015. The frequency
of calm period prevailed for 1.3% during the month.
Temperature: The temperature varied from 23.4°C to 34°C with the average being 29.4°C during
the month of May-2015.
Primary site specific meteorological data: The primary site specific meteorological parameters
viz., wind speed, wind direction and temperature were recorded for the period from March 2015 –
May 2015 were recorded by installing onsite meteorological weather station on the site at an
anemometric height of 10m above the ground level. The synopsis of the findings is presented in
Table 3-8: Synopsis of site specific meteorological data (March 2015 – May 2015) below.
Table 3-8: Synopsis of site specific meteorological data (March 2015 – May 2015)
Month Wind speed (m/s) Temperature (°C)
Max Min Avg Max Min Avg
March -2015 5.5 0 1.25 39.1 18 26.8
April-2015 6 0 1.6 36 20.9 27.7
May -2015 4.6 0 1.57 34 23.4 29.4

Final EIA Report – Orange Smart City, Pen, Raigad July 2018
152
BE/EIA-OSC/002
Figure 3-16: Site specific wind
rose (March 2015)
Figure 3-17: Wind class frequency
distribution (March -2015)
Figure 3-19: Wind class frequency
distribution (April -2015)
Figure 3-18: Site specific wind rose (April 2015)
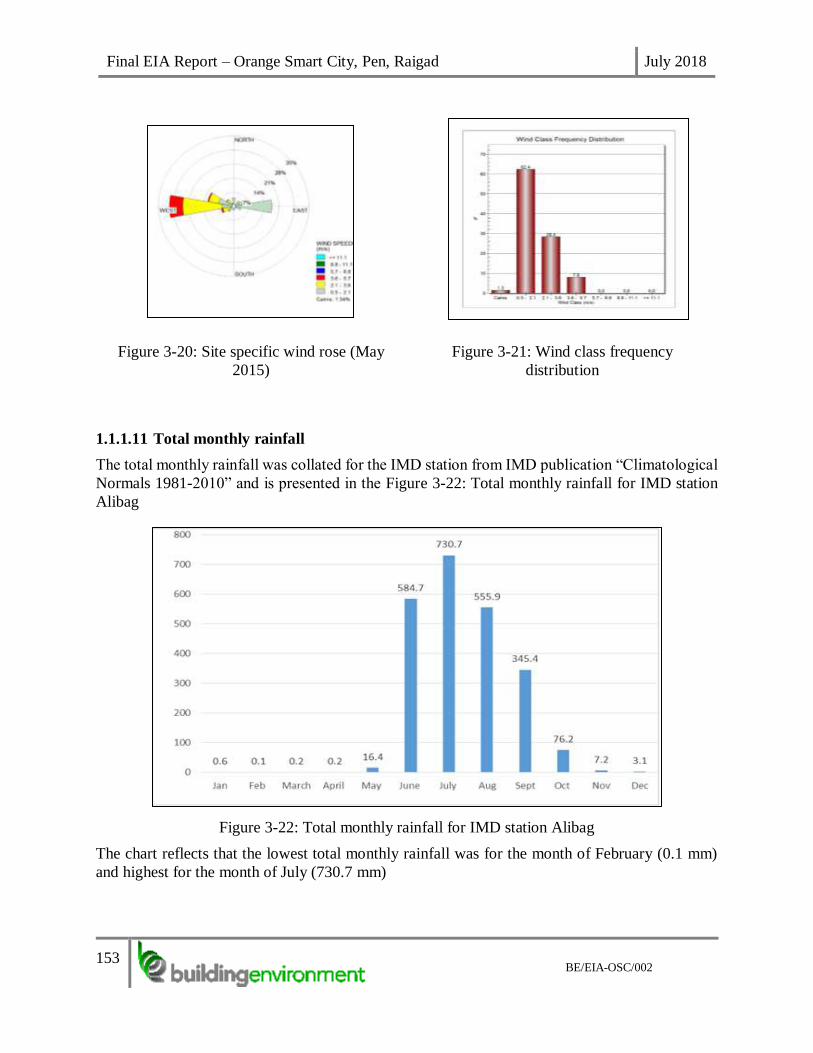
Final EIA Report – Orange Smart City, Pen, Raigad July 2018
153
BE/EIA-OSC/002
Figure 3-20: Site specific wind rose (May
2015)
Figure 3-21: Wind class frequency
distribution
(May 2015)
1.1.1.11 Total monthly rainfall
The total monthly rainfall was collated for the IMD station from IMD publication “Climatological
Normals 1981-2010” and is presented in the Figure 3-22: Total monthly rainfall for IMD station
Alibag
Figure 3-22: Total monthly rainfall for IMD station Alibag
The chart reflects that the lowest total monthly rainfall was for the month of February (0.1 mm)
and highest for the month of July (730.7 mm)

Final EIA Report – Orange Smart City, Pen, Raigad July 2018
154
BE/EIA-OSC/002
3.7 Ambient Air Quality
The existing ambient air quality of the study area provides an assessment of pollution load and
assimilative capacity of region and forms an important tool for planning further development in
the area. The main sources of air pollution in the study area include industrial emissions from
vehicular traffic and from domestic burning of fuel. The air quality was studied to assess the
current status of the same and to check the air quality status of the region vis-à-vis the air quality
standards prescribed by the Central Pollution Control Board. The ambient air quality monitoring
was conducted at 14 locations considering the sensitive receptors w.r.t. the proposed project site.
The monitoring locations have been selected primarily based on the predominant wind direction.
The details are given in Table 3-9. The other factors considered while selection of the monitoring
stations includes topography, representative nature of the sample, accessibility, location of
receptors and availability of power.

Final EIA Report – Orange Smart City, Pen, Raigad July 2018
155
BE/EIA-OSC/002
Table 3-9: Monitoring Stations for Air Quality Assessment
Sr.
No.
Location Sample
Code
Distance from the
boundary of
nearest land parcel
(km)
Geographical Location Direction from the
boundary of the
nearest land parcel
1 Onsite of T3 Land Parcel AQ1 2.98 w.r.t T4 18°48'21.68"N; 73° 4'54.59"E NW
2 Downwind of T3 at Rave village AQ2 4.52 w.r.t T4 18°48'53.77"N; 73° 4'8.77"E NW
3 Upwind of T-3 at Kharoshi Padale Village AQ3 1.50 w.r.t T4 18°48'36.59"N; 73° 6'2.84"E NW
4 Onsite T-4 Land Parcel AQ4 Project site at T4 18°46'39.19"N; 73° 6'51.91"E ---
5 Downwind of T-4 at Balavali Village AQ5 1.23 km w.r.t T4 18°47'39.15"N; 73° 5'54.32"E NW
6 Upwind of T-4 at Nidhavali Village AQ6 1.3 km w.r.t T4 18°47'19.72"N; 73° 7'30.23"E NE
7 Onsite T-2 Land Parcel AQ7 Project site T2 18°45'48.89"N; 73° 8'14.23"E ---
8 Downwind of T-2 at South of Belawade Budruk
AQ8 0.44 w.r.t T2 18°45'22.82"N; 73° 7'38.90"E SW
9 Upwind of T-2 at base of Hills AQ9 3.64 w.r.t T2 18°45'54.28"N; 73°10'34.16"E E
10 Onsite T-1 Land Parcel AQ10 Project site T1 18°42'32.00"N; 73° 8'4.01"E ---
11 Downwind of T-1 at Wirani Village AQ11 1.02 w.r.t T1 18°43'1.00"N; 73° 9'16.66"E E
12 Upwind of T-1 at Talavali Village AQ12 0.27 w.r.t T1 18°42'32.77"N; 73° 7'11.64"E W
13 Crosswind in North of the Project area at
Village Jui Khur
AQ13 1.74 w.r.t T4 18°48'52.88"N; 73° 6'18.50"E
NNW
14 Crosswind in South of the Project area at
Village Shene
AQ14 2.82 w.r.t T1 18°40'20.62"N; 73° 6'1.37"E SW

Final EIA Report – Orange Smart City, Pen, Raigad July 2018
156
BE/EIA-OSC/002
3.7.1 Sampling Period, Frequency and Parameters
During the period from March 2015 to May -2015. 24-hourly samples were collected twice a week
from each location. The following air pollution parameters were measured by sampling during the
sampling period. Map of monitoring locations in Figure 3-23: Map depicting the ambient air
quality monitoring locations Particulate Matter less than 10µm (PM10)
➢ Particulate Matter less than 2.5µm (PM2.5)
➢ Sulphur dioxide (SO2)
➢ Oxides of nitrogen (NO2)
➢ Carbon monoxide (CO)
➢ Hydrocarbon (HC)
Figure 3-23: Map depicting the ambient air quality monitoring locations
3.7.2 Sampling and Analytical Procedure
A brief description of the sampling and analytical procedures followed during the ambient air
quality survey is as follows:
PM10: The sampling of ambient air for evaluating PM10 levels were performed with a Fine Dust
Sampler NPM-FDS 2.5 A without PM2.5 Inlet. The PM10 concentrations were evaluated
gravimetrically and computed from the average air flow rate, sampling Period and the mass of
particulate matter collected over the filter paper.

Final EIA Report – Orange Smart City, Pen, Raigad July 2018
157
BE/EIA-OSC/002
PM2.5: Ambient air enters the NPM-FDS 2.5 A with impactor through an inlet designed to provide
a clean aerodynamic cut-point for particles greater than 10 microns. Particles in the air stream less
than 10 microns proceed to a “WINS” impactor that has an aerodynamic cut point at 2.5 microns.
The air sample and fine particulates exiting from the PM2.5 impactor is passed through a 47mm
diameter filter membrane that retains the Fine Particulate Matter. The PM2.5 concentrations are
evaluated gravimetrically and computed from the mass of PM2.5 collected on filter paper and total
volume of air sampled.
Sulphur Dioxide: The sampling of ambient air for evaluating the gaseous pollutants was
performed with a Multi-gas Sampler, using the vacuum created by the sampler for drawing the air
samples through the impingers. For SO2, air was drawn at a measured and controlled rate of 400
to 500 ml/min through a solution of potassium tetrachloro mercurate. After completion of the
sampling, the used absorbing reagent was treated with dilute solutions of sulfamic acid,
formaldehyde and para-rosaniline hydrochloride. The absorbance of the intensely colored para-
rosaniline methyl sulphonic acid was measured and the amount of SO2 in the sample was
computed. The ambient SO2 concentrations were computed from the amount of SO2 collected and
the volume of air sampled.
Oxides of Nitrogen: Air was drawn at a measured and controlled rate of about 500 ml/min through
an orifice-tipped impinger containing solutions of sodium hydroxide and sodium arsenite. After
completion of the sampling, an aliquot of the used absorbing solution was treated with solutions
of H2O2, sulphanilamide and NEDA. The nitrite ion present in the Impinger was calculated from
the absorbance of the resulting solution. The ambient NOx concentrations were computed from
the total nitrite ion present in the impingers, overall efficiency of the Impinger and the procedure,
and the volume of air sampled.
Hydrocarbon: Rubber Bladder and Aspirators have been used to collect the samples for
hydrocarbon. The HC levels were analyzed through Gas Chromatography.
Carbon Monoxide: Rubber Bladder and Aspirators have been used to collect the samples for
carbon monoxide. The CO levels were analyzed by NDIR Technology.
1.1.1.12 Techniques for Measurement
The techniques used for measurement of pollutants may be summarized in Table 3-10:
Measurement Techniques. The ambient air quality monitoring was undertaken twice a week for a
period of twelve weeks. One set of 24-hour average samples were collected continuously.
Analytical results of the air monitoring are presented in Table 3-11: AAQ Monitoring Results
below. The results of the CO monitored are presented in Table 3-12: .
Table 3-10: Measurement Techniques
S.N. Pollutant Code of Practice Methods of
Measurement
1 Particulate Matter (size less
than 10 µm) or PM10
IS-5182 (PART-23):2006
& CPCB Guidelines
Gravimetric
2 Particulate Matter (size less
than 2.5 µm) or PM2.5

Final EIA Report – Orange Smart City, Pen, Raigad July 2018
158
BE/EIA-OSC/002
3 Sulphur Dioxide (SO2) IS-5182 (Part-II):2001 &
CPCB Guidelines
Improved West and
Geake
4 Nitrogen Dioxide (NO2) IS-5182 (Part-VI): 2006 &
CPCB Guidelines
Modified Jacob &
Hochheiser (Na-
Arsenite)
5 Hydrocarbon (HC) NIOSH 1500 Gas Chromatography
6 Carbon Monoxide (CO) IS: 5182 (Part-X) & CPCB
Guidelines
Non Dispersive Infra-
Red (NDIR)
spectroscopy
7 Volatile Organic Compounds
(VOC)
NIOSH 2549 Gas Chromatography

Final EIA Report – Orange Smart City, Pen, Raigad July 2018
159
BE/EIA-OSC/002
Table 3-11: AAQ Monitoring Results in µg/m3
Location code
Pollutant
SO2 NOx PM10 PM2.5
Min Max Average 98th %tile Min Max Average 98th %tile Min Max Average 98th %tile Min Max Average 98th %tile
AQ1 11.74 22.75 19.09 22.33 34.25 51.64 42.62 50.23 48.16 64.46 54.36 50.23 24.42 38.42 27.48 35.18
AQ2 9.05 12.65 11.06 12.48 17.28 22.52 20.7 22.37 47.68 54.28 50.84 53.43 20.21 27.49 24.36 27.09
AQ3 8.15 12.95 10.3 12.72 47.68 54.28 50.84 23.12 36.19 50.33 41.87 49.32 17.21 25.56 20.66 24.63
AQ4 9.58 15.02 12.79 14.91 19.15 29.15 24.44 28.23 47.02 61.25 56.41 60.81 23.27 31.78 27.94 31.36
AQ5 12.79 15.02 9.58 10.94 12.58 23.25 17.99 22.23 35.1 43.2 38.74 42.73 15.77 20.65 17.76 20.53
AQ6 8.75 10.44 6.5 10.35 12.21 20.42 17.35 20.3 36.02 43.38 38.73 43.11 16.76 21.31 18.95 20.96
AQ7 13.55 17.41 15.47 17.28 22.45 29.15 25.35 29.12 43.45 58.67 50.96 56.59 21.14 29.79 24.55 29.017
AQ8 6.65 10.44 8.54 9.98 13.15 20.34 17.41 20.2 34.85 40.18 37.96 40.03 15.82 20.28 18.2 20.25
AQ9 7.27 11.35 8.82 10.78 12.62 23.3 18.05 22.35 35.08 41.5 38.46 41.1 17.06 20.85 18.82 20.62
AQ10 14.1 18.63 16.1 18.51 20.22 28.95 25.43 28.84 54.2 64.12 59.53 64.11 19.06 22.85 20.81 22.62
AQ11 7.27 11.35 8.82 10.77 12.62 23.3 18.05 22.35 35.08 41.5 38.46 41.09 17.06 20.85 18.81 20.62
AQ12 9.42 14.62 11.9 14.48 18.3 23.65 21.13 23.46 40.65 53.02 46.94 52.95 19.87 26.77 23.32 26.56
AQ13 9.88 15.11 12.31 14.79 19.24 25.1 21.26 24.54 47.17 52.45 49.52 52.19 17.21 26.33 23.48 26
AQ14 8.93 14.65 11.45 14.63 14.3 23.66 19.3 23.43 35.77 49.32 42.7 49.3 17.2 21.65 19.2 21.61
CPCB limits 80 80 100 60

Final EIA Report – Orange Smart City, Pen, Raigad July 2018
160
BE/EIA-OSC/002
Table 3-12: AAQ Monitoring Results in mg/m3 for CO
Location code
Pollutant
CO
Min Max Avg 98th %tile
A1 0.2 0.7 0.37 0.65
A2 BDL BDL BDL BDL
A3 BDL BDL BDL BDL
A4 0.1 0.6 0.38 0.6
A5 BDL BDL BDL BDL
A6 BDL BDL BDL BDL
A7 0.1 0.4 0.26 0.4
A8 BDL BDL BDL BDL
A9 BDL BDL BDL BDL
A10 0.2 0.8 0.4 0.76
A11 BDL BDL BDL BDL
A12 BDL BDL BDL BDL
A13 BDL BDL BDL BDL
A14 BDL BDL BDL BDL
3.7.3 Inferences
1.1.1.13 Particulate Matter – PM10
The average PM10 concentration recorded at all the sampling locations are well below the
prescribed CPCB limits of 100μg/m3. The minimum value recorded was 34.85 μg/m3 at
downwind of T-2 at South of Belawade Budruk (AQ8). The maximum value recorded was
64.46 μg/m3 at onsite of T3 land parcel (AQ-1). The 98 percentile values ranged from 20.2
μg/m3 to 50.23 μg/m3. The high values of PM10 can be attributed to the terrain and sandy soil
type of the region. The average values varied from 17.35 μg/m3 to 50.84 μg/m3. The graphical
representation is provided in Figure 3-24: Graphical representation of the maximum values
of PM10

Final EIA Report – Orange Smart City, Pen, Raigad July 2018
161
BE/EIA-OSC/002
Figure 3-24: Graphical representation of the maximum values of PM10
Note: All figures in μg/m3
1.1.1.14 Particulate Matter – PM2.5
The average PM2.5 concentration recorded at all the sampling locations are well below the
prescribed CPCB limits of 60μg/m3. The minimum value recorded was 15.77 μg/m3 at
downwind of T-4 at Balavali village (AQ5). The maximum value recorded was 38.42 μg/m3 at
onsite of T3 land parcel (AQ-1). The 98 percentile values ranged from 20.25 μg/m3 to 35.18
μg/m3. The high values of PM2.5 can be attributed to the terrain and sandy soil type of the
region. The average values varied from 17.76 μg/m3 to 27.94 μg/m3. The graphical
representation is provided in Figure 3-25: Graphical representation of maximum values of
PM2.5

Final EIA Report – Orange Smart City, Pen, Raigad July 2018
162
BE/EIA-OSC/002
Figure 3-25: Graphical representation of maximum values of PM2.5
Note: All values in µg/m3
1.1.1.15 Sulphur Dioxide (SO2)
The average concentrations of SO2 were found to well within the prescribed CPCB limit of 80
μg/ m3. The concentrations of sulphur dioxide in the region are observed to be in the range of
6.65 to 22.75 μg/m3. The maximum values of SO2 were recorded at Onsite of T3 land parcel
(AQ-1). The average values ranged from 6.5 μg/ m3 to 19.09 μg/m3 and 98 percentile values
varied from 9.98 μg/ m3 to 22.33 μg/m3. The graphical representation of observations is
presented in Figure 3-26: Graphical representation of maximum values of SO2
Figure 3-26: Graphical representation of maximum values of SO2
Note: All values in µg/m3
1.1.1.16 Oxides of Nitrogen
The minimum NOx concentration was observed to be 12.21 μg/m3 at Upwind of T-4 at
Nidhavali Village, (AQ6). The maximum NOx concentration observed is 54.28 μg/m3 at
Upwind of T-3 at Kharoshi Padale Village (AQ-3). The 98 percentile values measured were in
the range of 20.2 μg/m3 and 50.23 μg/m3. The average values ranged from 17.35 μg/m3 to
50.84 μg/m3. The NOx concentrations were within the prescribed norms of 80 μg/m3 as per
38.42
27.4925.56
31.78
20.65 21.31
29.79
20.28 20.8522.85
20.85
26.77 26.33
21.65
0
5
10
15
20
25
30
35
40
45
AQ1 AQ2 AQ3 AQ4 AQ5 AQ6 AQ7 AQ8 AQ9 AQ10 AQ11 AQ12 AQ13 AQ14

Final EIA Report – Orange Smart City, Pen, Raigad July 2018
163
BE/EIA-OSC/002
NAAQS guidelines. The observations of NOx are presented graphically in Figure 3-27:
Graphical representation of maximum values of NOx.
Figure 3-27: Graphical representation of maximum values of NOx
1.1.1.17 CO results
The average CO concentration recorded at all the sampling locations are well below the
prescribed CPCB limits of 2 mg/m3. The minimum value recorded was 0.1 mg/m3 at onsite T-
4 land parcel (AQ4). The maximum value recorded was 0.2 mg/m3 at onsite of T3 land parcel
(AQ-1). The 98 percentile values ranged from 0.4 mg/m3 to 0.76 mg/m3. The average values
varied from 0.26 mg/m3 to 0.4 mg/m3.
1.1.1.18 Hydrocarbons (HCs) and Volatile Organic Compounds (VOCs)
The HCs and the VOCs were found to be below detectable limit throughout the study period at
all the locations.
3.8 Ambient Noise Quality
Ambient noise levels were monitored at 8 locations within the study area, identified during
preliminary baseline survey. Noise levels were measured by Integrating Sound Level Meter
manufactured by Rion (model no. NL – 20) continuously over 24 hours period. The details of
sampling stations are depicted in Table 3-13: Details of Ambient Noise Locations. Sampling
locations are shown in Figure 3-28: Noise monitoring locations marked on Google Earth. The
day noise level has been monitored during 6 am to 10 pm and night levels during 10 pm to 6
am at all ambient locations.
Table 3-13: Details of Ambient Noise Locations
Station
code
Station Name Geographical
Co-ordinates
Distance w.r.t
nearest land
parcel site
(km)
Direction
w.r.t
nearest
land parcel
site
Zone as
per CPCB
N1 Onsite of T-3
Land Parcel
18°48’24.78” N
73° 4’51.41” E
Project site T3 --- Residential

Final EIA Report – Orange Smart City, Pen, Raigad July 2018
164
BE/EIA-OSC/002
Station
code
Station Name Geographical
Co-ordinates
Distance w.r.t
nearest land
parcel site
(km)
Direction
w.r.t
nearest
land parcel
site
Zone as
per CPCB
N2 Crosswind of T-
3 at Kopar
village
18°48’27.79” N
73° 5’20.20” E
0.84 w.r.t T3 E Residential
N3 Downwind of T-
3 at Jite village
18°48’10.80” N
73° 4’49.67” E
0.43 w.r.t T3 S Residential
N4 Onsite of T-4
Land Parcel
18°47’11.59” N
73° 6’23.85” E
0.14 w.r.t T4 W Residential
N5 Downwind of T-
4 at Mungoshi
Village
18°46’44.35” N
73° 7’11.77” E
0.03 w.r.t T4 W Residential
N6 Upwind of T-4 at
Ambivali village
18°46’24.77” N
73° 7’14.47” E
Project site T4 --- Residential
N7 Upwind of T-2 at
Belvade village
18°45’46.36” N
73° 8’2.96” E
Project site T2 --- Residential
N8 Downwind of T-
1 within Land
Parcel
18°42’6.04” N
73° 8’15.52” E
0.02 w.r.t T1 E Residential
N9 Upwind of T-1
Wirani Village
18°41’29.51” N
73° 8’4.06” E
0.06 w.r.t T1 SW Residential
N10 Crosswind of T-
1 abutting Plot
Boundary
18°42’31.76” N
73° 7’15.48” E
0.18 km w.r.t
T1
SW Residential
N11 Crosswind of T-1
within land
parcel
18°43’7.17”N
73° 8’9.76” E
Project site T1 --- Residential

Final EIA Report – Orange Smart City, Pen, Raigad July 2018
165
BE/EIA-OSC/002
Figure 3-28: Noise monitoring locations marked on Google Earth
3.8.1 Parameters measured during monitoring
Equivalent sound Pressure Level (Leq):
The Leq is the equivalent continuous sound level which is equivalent to the same sound energy
as the actual fluctuating sound measured in the same period. This is necessary because sound
from noise source often fluctuates widely during a given period of time.
The instrument internally performs the statistics of frequency distribution for the set time
period (in this case one-hour) and hourly Leq are obtained at each location. These hourly Leq
is added logarithmically to obtain 24 hours Leq as well as Lday and Lnight levels. Lday is
defined as the equivalent noise level measured over a period of time during day (10 am to 6
pm). The Leq value measured for each individual hour and then averaged for 10 am to 6 pm
and is known as Lday.
Lnight is defined as the equivalent noise level measured over a period of time during night (10
pm to 6 am). The Leq value measured for each individual hour and then averaged for 10 pm to
6 am and is known as Lnight.
Further the noise rating developed by EPA for specification of community noise from all
sources is the day night sound level, Ldn. It is similar to a 24 hour equivalent sound level except
that during the night period, which extends from 10.00 p.m. to 6.00 a.m. A 10 Dba weighing
penalty is added to the account for the fact that noise at night when people are trying to sleep
is judged more annoying than the same noise during the day time.
3.8.2 Result and Discussion
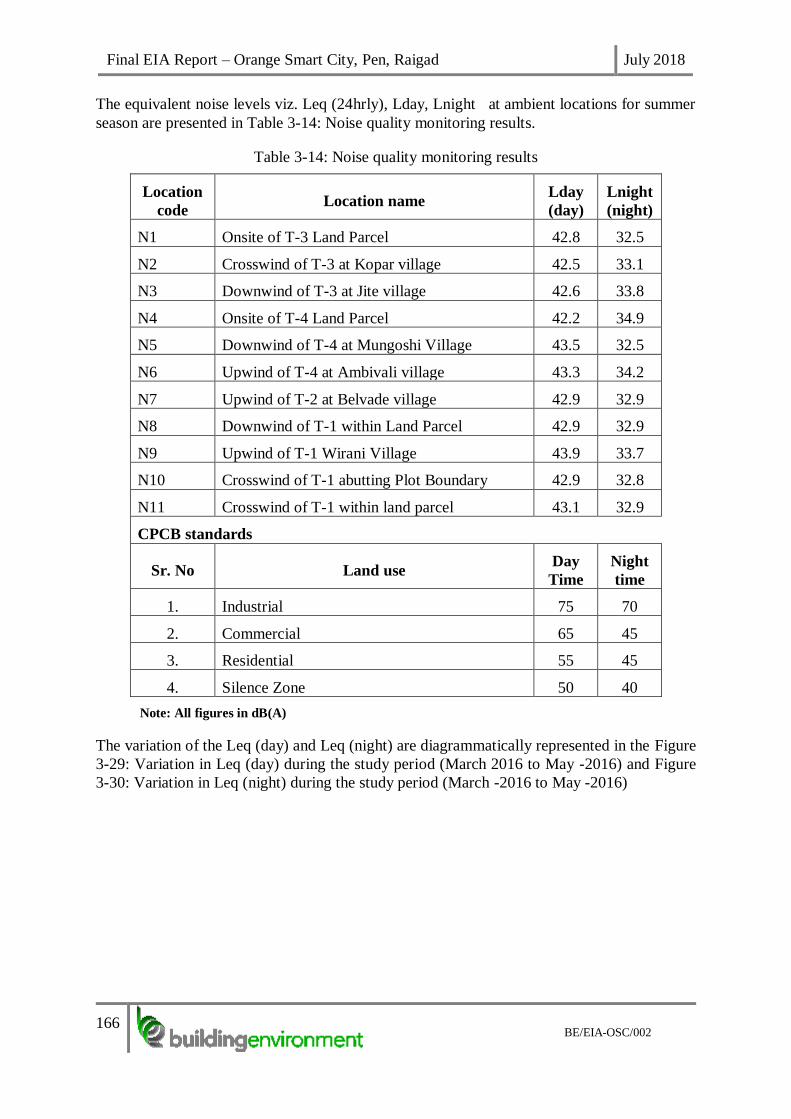
Final EIA Report – Orange Smart City, Pen, Raigad July 2018
166
BE/EIA-OSC/002
The equivalent noise levels viz. Leq (24hrly), Lday, Lnight at ambient locations for summer
season are presented in Table 3-14: Noise quality monitoring results.
Table 3-14: Noise quality monitoring results
Location
code Location name
Lday
(day)
Lnight
(night)
N1 Onsite of T-3 Land Parcel 42.8 32.5
N2 Crosswind of T-3 at Kopar village 42.5 33.1
N3 Downwind of T-3 at Jite village 42.6 33.8
N4 Onsite of T-4 Land Parcel 42.2 34.9
N5 Downwind of T-4 at Mungoshi Village 43.5 32.5
N6 Upwind of T-4 at Ambivali village 43.3 34.2
N7 Upwind of T-2 at Belvade village 42.9 32.9
N8 Downwind of T-1 within Land Parcel 42.9 32.9
N9 Upwind of T-1 Wirani Village 43.9 33.7
N10 Crosswind of T-1 abutting Plot Boundary 42.9 32.8
N11 Crosswind of T-1 within land parcel 43.1 32.9
CPCB standards
Sr. No Land use Day
Time
Night
time
1. Industrial 75 70
2. Commercial 65 45
3. Residential 55 45
4. Silence Zone 50 40
Note: All figures in dB(A)
The variation of the Leq (day) and Leq (night) are diagrammatically represented in the Figure
3-29: Variation in Leq (day) during the study period (March 2016 to May -2016) and Figure
3-30: Variation in Leq (night) during the study period (March -2016 to May -2016)

Final EIA Report – Orange Smart City, Pen, Raigad July 2018
167
BE/EIA-OSC/002
Residential Zone: Noise levels (Leq) observed during daytime in this zone is in the range of
42.2 (Onsite of T4 Land parcel) to 43.9 dB (A) (Upwind of T-1 Wirani Village) while during
nighttime it is 32.5 (Downwind of T-4 at Mungoshi Village) to 34.9 dB (A) (Onsite of T4 Land
Parcel).The Leq during day and night is within the prescribed CPCB limits for residential zone.
32.5
33.1
33.8
34.9
32.5
34.2
32.9 32.9
33.7
32.8 32.9
31
31.5
32
32.5
33
33.5
34
34.5
35
35.5
N1 N2 N3 N4 N5 N6 N7 N8 N9 N10 N11
42.8
42.542.6
42.2
43.543.3
42.9 42.9
43.9
42.943.1
41
41.5
42
42.5
43
43.5
44
44.5
N1 N2 N3 N4 N5 N6 N7 N8 N9 N10 N11
Figure 3-29: Variation in Leq (day) during the study period (March 2016 to
May -2016)
Figure 3-30: Variation in Leq (night) during the study period (March -2016 to
May -2016)

Final EIA Report – Orange Smart City, Pen, Raigad July 2018
168
BE/EIA-OSC/002
3.9 Water quality
Sampling was carried out in the month of March 2015 – May 2015. 6 groundwater sampling
stations and 8 surface water sampling station where selected depending upon the location and
usage of resource. The details of sampling stations are depicted in Table 3-15: Monitoring
Stations for Ground water Quality Assessment and Table 3-16: Monitoring Stations for Surface
water Quality Assessment. The ground water sampling locations are shown in Figure 3-31:
Map depicting ground water quality locations and surface water and in Figure 3-32: Map
depicting surface water quality locations.
3.9.1 Monitoring locations
Ground water Sampling was carried out by APHA 1060 B & C Method. The ground water
samples were analyzed for parameters as per IS: 10500 standards and the analysis were
undertaken as per IS: 3025 and relevant APHA (American Public Health Association) standard
methods.
Figure 3-31: Map depicting ground water quality locations
Table 3-15: Monitoring Stations for Ground water Quality Assessment
Sr.
No.
Location Sample
Code
Distance from the
boundary of site
Geographical
Location
Direction from
the center of site
1 T-3 Land Parcel GW1 ---- 18°47'44.35"N
73° 5'12.22"E
---
2 T-4 Land Parcel GW2 ---- 18°47'13.50"N
73° 6'47.63"E
----

Final EIA Report – Orange Smart City, Pen, Raigad July 2018
169
BE/EIA-OSC/002
Sr.
No.
Location Sample
Code
Distance from the
boundary of site
Geographical
Location
Direction from
the center of site
3 T-4 Land Parcel GW3 ---- 18°46'44.55"N
73° 6'51.75"E
----
4 T-2 Land Parcel GW4 ---- 18°45'53.24"N
73° 8'14.15"E
---
5 T-1 Land Parcel GW5 ----- 18°43'8.67"N
73° 8'7.63"E
----
6 T-1 Land Parcel GW6 ---- 18°41'49.35"N
73° 7'44.60"E
----
Figure 3-32: Map depicting surface water quality locations
Table 3-16: Monitoring Stations for Surface water Quality Assessment
Sr.
No.
Location Sample
Code
Distance from the
boundary of site
Geographical
Location
Direction from
the center of site
1. Upstream of the
Balganga River
SW1 3.05 18°49'45.23"N
73° 5'15.47"E
N
2. Downstream of
Balganga River
SW2 1.3 18°48'7.62"N
73° 5'45.50"E
E
3. Ambhegar Dam SW3 1.3 18°44'44.45"N
73° 8'2.26"E
S
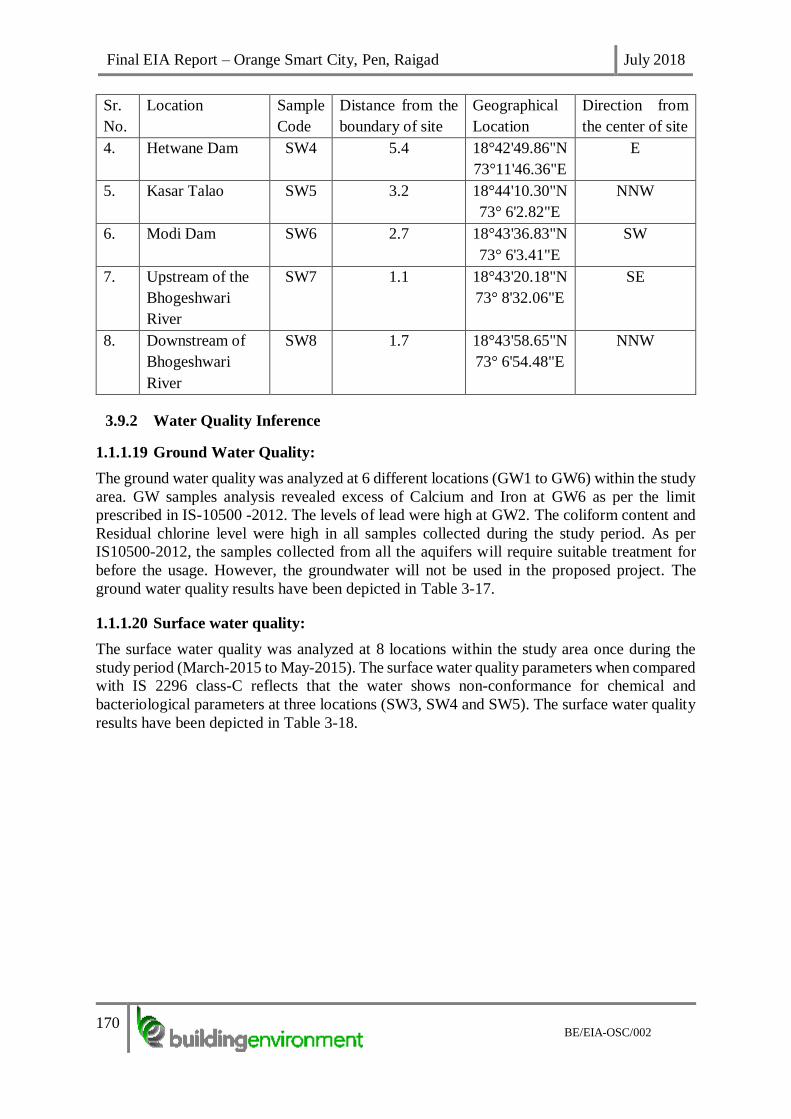
Final EIA Report – Orange Smart City, Pen, Raigad July 2018
170
BE/EIA-OSC/002
Sr.
No.
Location Sample
Code
Distance from the
boundary of site
Geographical
Location
Direction from
the center of site
4. Hetwane Dam SW4 5.4 18°42'49.86"N
73°11'46.36"E
E
5. Kasar Talao SW5 3.2 18°44'10.30"N
73° 6'2.82"E
NNW
6. Modi Dam SW6 2.7 18°43'36.83"N
73° 6'3.41"E
SW
7. Upstream of the
Bhogeshwari
River
SW7 1.1 18°43'20.18"N
73° 8'32.06"E
SE
8. Downstream of
Bhogeshwari
River
SW8 1.7 18°43'58.65"N
73° 6'54.48"E
NNW
3.9.2 Water Quality Inference
1.1.1.19 Ground Water Quality:
The ground water quality was analyzed at 6 different locations (GW1 to GW6) within the study
area. GW samples analysis revealed excess of Calcium and Iron at GW6 as per the limit
prescribed in IS-10500 -2012. The levels of lead were high at GW2. The coliform content and
Residual chlorine level were high in all samples collected during the study period. As per
IS10500-2012, the samples collected from all the aquifers will require suitable treatment for
before the usage. However, the groundwater will not be used in the proposed project. The
ground water quality results have been depicted in Table 3-17.
1.1.1.20 Surface water quality:
The surface water quality was analyzed at 8 locations within the study area once during the
study period (March-2015 to May-2015). The surface water quality parameters when compared
with IS 2296 class-C reflects that the water shows non-conformance for chemical and
bacteriological parameters at three locations (SW3, SW4 and SW5). The surface water quality
results have been depicted in Table 3-18.

Final EIA Report – Orange Smart City, Pen, Raigad July 2018
171
BE/EIA-OSC/002
3.9.3 Results
Table 3-17: Ground Water Quality results
Sr.
No Parameter Unit GW1 GW2 GW3 GW4 GW5 GW6 IS 10500 Limits
Physical Parameter
1 Turbidity NTU 0.6 1 1 1.9 1 0.6 <1.0
2 TDS mg/l 293 298 289 285 286 304 <500
Chemical Parameter
1 pH -- 6.6 6.94 6.67 6.6 7.1 6.61 6.5-8.5
2 E. Conductivity µS/cm 521.1 425 510 510 490.2 515.69 N.S
3 Total Hardness as CaCO3 mg/l 127.45 128.36 155.56 140.52 145.75 199.35 <200
4 Total Alkalinity as CaCO3 mg/l 115.79 112.63 96.15 107.89 114.21 117.89 <200
5 Chloride as Cl mg/l 12.25 11.76 17.15 12.74 18.88 48.02 <250
6 Sulphate as SO4 mg/l 3.69 8.38 26.96 28.38 23.27 22.57 <200
7 Fluoride as F mg/l 0.41 0.83 0.01 0.53 0.69 0.14 <1.0
8 Residual chlorine mg/l <1.0 <1.0 <1.0 <1.0 <1.0 <1.0 >0.2
9 Nitrate as NO3 mg/l 0.01 0.49 0.5 0.01 0.01 1.73 <45
Elemental Testing
1 Calcium as Ca mg/l 30.11 28.15 29.08 27.9 10.05 76.09 <75
2 Magnesium as Mg mg/l 12.9 14.46 15.25 19.89 3.605 14.88 <30
3 Iron as Fe mg/l 0.25 0.13 0.06 0.145 0.07 1.74 <0.3
4 Copper as Cu mg/l <0.01 0.01 <0.01 <0.01 <0.01 <0.01 <0.05
5 Cadmium as Cd mg/l <0.01 <0.01 <0.01 <0.01 <0.01 <0.01 <0.003
6 Chromium as Cr mg/l <0.01 <0.01 <0.01 <0.01 <0.01 <0.01 <0.05

Final EIA Report – Orange Smart City, Pen, Raigad July 2018
172
BE/EIA-OSC/002
Sr.
No Parameter Unit GW1 GW2 GW3 GW4 GW5 GW6 IS 10500 Limits
7 Lead as Pb mg/l 0.01 0.03 0.01 0.01 <0.01 0.01 <0.01
8 Selenium as Se mg/l <0.01 <0.01 <0.01 0.01 <0.01 <0.01 <0.01
9 Manganese as Mn mg/l <0.01 <0.01 <0.01 <0.01 <0.01 <0.01 <0.1
10 Zinc as Zn mg/l 0.01 0.02 <0.01 0.065 <0.01 0.02 <5.0
11 Sodium as Na mg/l 1.3 1.3 1.9 1.09 1.12 1.17 N.S
12 Potassium As K mg/l 0.21 0.35 0.3 0.32 0.42 0.4 NS
Microbiological Parameter 1 Total Coliform MPN/100ml 1600 1600 220 <2 1600 2 Absent
2 Fecal Coliform MPN/100ml 27 900 2 <2 350 <2 Absent
Table 3-18: Surface water quality results
Sr. No Parameter Name Unit SW1 SW2 SW3 SW4 SW5 SW6 SW7 SW8
As per IS:
2296
Class C
(Clause
3.3)
Physical Parameters
1 Turbidity NTU 0.9 0.97 0.6 0.63 2.1 0.83 0.92 0.22 NS
2 TDS mg/l 412 350 63 61 193 70 255 222 <1500
Chemical Parameters
1 pH -- 7.09 6.85 7.25 7.33 6.71 7.29 7.35 7.25 6.5-8.5
2 E. Conductivity µS/cm 690.2 490.2 190.2 490.2 289.46 240.2 359.85 390.2 NS
3 Total Hardness as CaCO3 mg/l 155.1 123.96 42.48 41.2 81.96 43.6 129.5 115 NS
4 Total Alkalinity as CaCO3 mg/l 82.63 65.96 39.47 37.6 43.68 39.2 53.1 59 NS

Final EIA Report – Orange Smart City, Pen, Raigad July 2018
173
BE/EIA-OSC/002
Sr. No Parameter Name Unit SW1 SW2 SW3 SW4 SW5 SW6 SW7 SW8
As per IS:
2296
Class C
(Clause
3.3)
5 Chloride as Cl mg/l 105.64 106.56 7.84 7.65 18.62 7.82 94.48 72.38 <600
6 Sulphate as SO4 mg/l 80.29 49.12 4.69 4.56 17.52 4.66 42.85 22.21 <400
7 Fluoride as F mg/l 0.25 0.33 0.19 0.17 0.46 0.17 2.1 1.07 <1.5
8 Residual chlorine mg/l <1.0 <1.0 <1.0 <1.0 <1.0 <1.0 <1.0 <1.0 NS
9 Nitrate as NO3 mg/l 0.72 0.77 0.05 0.03 0.06 0.03 0.68 0.66 <50
Elemental Testing
1 Calcium as Ca mg/l 56.9 58.3 9.72 8.63 15.94 7.42 49.3 29.44 NS
2 Magnesium as Mg mg/l 39.6 37.5 3.645 2.43 6.265 3.43 20.3 17.12 NS
3 Iron as Fe mg/l 0.05 0.05 0.06 0.05 0.03 0.05 0.04 0.04 <50
4 Copper as Cu mg/l 0.01 0.01 <0.01 <0.01 <0.01 <0.01 0.01 0.01 <1.5
5 Cadmium as Cd mg/l <0.01 <0.01 <0.01 <0.01 <0.01 <0.01 <0.01 <0.01 <0.01
6 Chromium as Cr mg/l <0.01 <0.01 <0.01 <0.01 <0.01 <0.01 <0.01 <0.01 <0.05
7 Lead as Pb mg/l <0.01 <0.01 <0.01 <0.01 <0.01 <0.01 <0.01 <0.01 <0.1
8 Selenium as Se mg/l 0.01 0.01 <0.01 <0.01 <0.01 <0.01 0.01 0.01 <0.05
9 Manganese as Mn mg/l <0.01 <0.01 <0.01 <0.01 <0.01 <0.01 <0.01 <0.01 NS
10 Zinc as Zn mg/l 0.02 0.02 0.02 0.01 <0.01 0.01 0.01 0.01 <15
11 Sodium as Na mg/l 1.12 1.09 0.89 1.09 0.76 0.69 1 0.56 NS
12 Potassium As K mg/l 0.38 0.32 0.22 0.32 0.49 0.12 0.22 0.02 NS
Microbiological Parameters
1 Total Coliform CFU/100ml 240 252 300 266 1600 273 233 233 5000
2 Faecal Coliform MPN/100ml 130 133 17 15 34 18 111 129 Absent

Final EIA Report – Orange Smart City, Pen, Raigad July 2018
174
BE/EIA-OSC/002
3.10 Soil quality
3.10.1 Introduction
The soils of the district are formed from the Deccan trap. The study region has many areas
where green vegetation can be seen indicating that for trees and shrubs and Shallow to Medium
Deep soil is identified in study region. This soil is composed of various disintegrated rocks of
the overlying trap formation, with a varying proportion of calcareous substances. It is reddish,
light brown in color. Rice is a major crop commonly observed in study area followed by Pulses,
oil seeds and vegetables.
The sampling locations have been finalized with the following objectives:
➢ To determine the baseline soil characteristics of the study area; and
➢ To determine the impact on agricultural productivity of soil due to the proposed
industrial estate.
3.10.2 Monitoring and analysis
Soil sampling locations were chosen based on a reconnaissance survey of the area and
prevailing activities within the 10 km study area. Samples were collected by hand sampling
augurs from surface region. All the soil samples were taken at depth of 60 cm. Samples were
homogenized before testing. The samples were packed in dependable, waterproof containers
and analyzed as per APHA, C.A. Black (Soil Chemical Analysis) and IS: 2720 (Physical
Parameters). The soil sampling locations are depicted in Figure 3-33: Map depicting the soil
sampling locations and details of the same are tabulated in Table 3-19: Details of soil sampling
locations. The sampled soil quality results are presented in Table 3-20: and are described in
the further subsections.
Figure 3-33: Map depicting the soil sampling locations

Final EIA Report – Orange Smart City, Pen, Raigad July 2018
175
BE/EIA-OSC/002
Table 3-19: Details of soil sampling locations
Sr.
No
Location
code
Sampling location
name
Geographical
Co-ordinates
Direction
w.r.t
project site
Description of
the location
1 S1 Onsite of T-3 Land
Parcel on North
18°48'12.10"N
73° 4'51.71"E
N Barren Land
2 S2 Onsite of T-3 Land
Parcel on South
18°47'33.25"N
73° 5'18.87"E
S Mild vegetation
3 S3 Onsite of T-4 Land
Parcel on North
18°47'30.27"N
73° 6'44.40"E
N Hilly terrain
4 S4 Onsite of T4 Land
Parcel on South
18°46'7.53"N
73° 7'9.01"E
S Agricultural field
5 S5 Onsite of T-2 land
parcel
18°45'50.98"N
73° 8'9.71"E
-- Agricultural field
6 S6 Onsite of T-1 land
parcel on North
18°43'7.29"N
73° 8'1.93"E
N Barren Land
7
S7 Onsite of T-1 land
parcel in Centre
18°42'20.42"N
73° 7'56.32"E
--- Barren land
8 S8 Onsite of T-1 land
parcel on South
18°41'24.20"N
73° 7'47.28"E
S Hilly terrain
Table 3-20: Soil Analysis Results
Sr.
No Parameter Unit S1 S2 S3 S4 S5 S6 S7 S8
Physical Parameter
1 Salinity % 0.02 0.004 0.02 0.01 0.01 0.01 0.03 0.05
2
Water
Holding
Capacity
% 50 55 60 55 60 65 68 75
3 Soil texture -- Clay
Loam Clay Clay
Clay
Loam
Clay
Loam
Clay
Loam
Clay
Loam Clay
Chemical Parameter
1 pH -- 5 .99 6.46 6.06 6.36 6.44 6.34 6.49 6.82
2 Electrical
Conductivity µS/cm 476 78 339 265 225 190.1 201.4 308.1
3
Total
Organic
Matter
% 3.15 3.22 9.91 4.35 3.54 3.26 3.63 5.66
4 Total
Nitrogen mg/kg 1120 910 2380 2170 1890 1750 1863 1533
5
Sodium
Absorption
Ratio
-- 2.85 0.96 1.42 1.39 2.02 8.97 9.39 9.2
Elemental Testing

Final EIA Report – Orange Smart City, Pen, Raigad July 2018
176
BE/EIA-OSC/002
Sr.
No Parameter Unit S1 S2 S3 S4 S5 S6 S7 S8
1 Potassium as
K mg/kg 493.4 242.6 383.1 62.4 333.8 876.5 892.2 882.5
2 Phosphorous
as P mg/kg 1054 2575 2601 999 1738 1592 1660 1663
3 Sodium as
Na mg/kg 513 100.4 178.7 166.8 401.5 1467 1556 1557
4 Calcium as
Ca mg/kg 5965 1193 1793 1399 4460 7385 7860 7651
5 Magnesium
as Mg mg/kg 2825 1476 2052 2003 5137 7388 7581 7755
6 Iron as Fe mg/kg 28810 22570 47300 16070 49760 48230 47361 44662
7 Copper as
Cu mg/kg 121.3 294.3 654.8 251.1 470.6 298.87 305.26 310.25
8 Manganese
as Mn mg/kg 1848 3622 6157 3894 6338 5870 5982 5525
9 Zinc as Zn mg/kg 117.2 193.2 327.7 128.8 240.2 204.8 222.3 211.07
10 Nickel as Ni mg/kg 64.78 97.97 163.7 87.43 167.8 179.6 186.5 186.4
3.10.3 Results and discussion
The soil samples were analyzed for all the important parameters like pH, electrical
conductance, calcium, magnesium, nitrogen, phosphorus, potassium, etc. The NPK represents
the nutrients available in the soil, which directly indicates the soil fertility. The range of
variation of different parameters found in the study area is explained briefly below.
Soil Texture Classification
The soil texture for all the locations was observed to be Clay and Clay loam. The soil texture
classification for the eight soil samples is depicted below:

Final EIA Report – Orange Smart City, Pen, Raigad July 2018
177
BE/EIA-OSC/002
pH
The pH of the all samples collected were in the range of 5.99 to 6.82 i.e. moderately acidic to
slightly acidic as per the ranges and classification of pH given by Department of Agriculture.
(Source: Method Manual, Soil Testing in India, 2011). It is a very important property of soil as
it determines the availability of nutrients, microbial activity and physical condition of soil.
Electrical Conductivity
Electrical conductivity expresses ion contents of solution which determine the current carrying
capacity thus giving a clear idea of the soluble salts present in the soil. The Collected Soil
samples was highly saline. Electrical Conductivity value ranges from 78 µs/cm to 476 µs/cm.
Water Holding Capacity
Water holding capacity as the amount of water held in the soil. Soil structure influences the
extent of pore space in the soil, water holding capacity, aeration, root movement and the
nutrient availability. The better and more stable soil aggregates are considered as a desirable
soil property with regard to plant growth. Water holding capacity of Collected Soil samples
ranges from 50 to 75 %.
Calcium and Magnesium
The important cations present in soil are calcium and magnesium. It is observed that both
calcium and magnesium concentrations are in the range of 1193 to 7860 mg/kg and 1476 to
7755 mg/kg respectively whereas sodium and potassium are in the range of 100.4 to 1557
mg/kg and 62.4 to 892.2 mg/kg respectively.
Micronutrients
The concentration of micronutrient in the soil was observed in the ranges of 16070 to 49760
mg/kg for iron, 1848 to 6338 mg/kg for manganese, 117.2 to 327.7 mg/kg for zinc, 121.3 to
654.8 mg/kg for copper and 64.78 to 186.5 mg/kg for nickel. Thus it was observed that the
soils from the study area are enriched in micronutrients like Zn, Mn, Cu, and Fe although they
show varying range.
Macronutrients
The important cations present in soil are calcium and magnesium. It is observed that both
calcium and magnesium concentrations are in the range of 1193 to 7860 mg/kg and 1476 to
7755 mg/kg respectively whereas sodium and potassium are in the range of 100.4 to 1557
mg/kg and 62.4 to 892.2 mg/kg respectively.
Organic matter present in soil influences its physical and chemical properties of soil. Soil OM
is important to a wide variety of soil’s chemical, physical, and biological properties. As soil
OM increases, so does CEC, soil total N content, and other soil properties such as water holding
capacity and microbiological activity. Organic matter, total nitrogen and phosphorous are
found to be in the range of 3.15 to 9.91%, 910 to 2380 mg/kg and 999 to 2601 mg/kg
respectively. These soils are having high range of organic matter content and total nitrogen
content in the soil. Also having high range of Phosphorus and Potassium content thus shows
good fertility level and fulfil the minimum nutrient requirement for plants.

Final EIA Report – Orange Smart City, Pen, Raigad July 2018
178
BE/EIA-OSC/002
Soil Type in the Study area
Based on Soil map of Raigad district (Source - NBSS & LUP, Nagpur), soil of the study area
is classified as shallow to moderate deep. The soil map of the area is shown in section below.
3.10.4 Ground water levels
As per the geo-technical investigation conducted by the proponent the ground water levels are
tabulated below :
BoreHole –
No.
Location Depth of
GWT
(bgl)
Depth of Borehole below existing GL (m)
BH-01 Dhamani Naka (T1) 2.0 13.5

Final EIA Report – Orange Smart City, Pen, Raigad July 2018
179
BE/EIA-OSC/002
BH-02 Belwade Gaon(T2) 6.0 13.5
BH-03 Boregaon (Virani)(T1) 5.5 15
BH-04 Olakh (T4) 7.5 13.5
The representative borelog is shown below and the borehole logs are enclosed in Annexure-
XXX :

Final EIA Report – Orange Smart City, Pen, Raigad July 2018
180
BE/EIA-OSC/002

Final EIA Report – Orange Smart City, Pen, Raigad July 2018
181
BE/EIA-OSC/002
3.10.5 Interpretation
The construction activities will result in loss of vegetation which along with digging and
excavations in the project area would make the land susceptible to erosion during rainy season.
The top soil removed will be reused for proposed landscaping purpose. The project would
involve compaction of soil due to construction activities and landscaping towards the later part
which would reduce the chance of subsidence. The photographs of soil from tree plantation
within the Plot and agricultural fields in surrounding area are shown in Figure 3-34.
Figure 3-34: The photographs of soil from tree plantation within the Plot and agricultural
fields around surrounding area
3.11 Ecology and biodiversity
The purpose of this study is to characterize and describe the terrestrial environment, habitats
and species present at the site and provide an assessment of the likely impacts of developing a
township at Pen.
The broad terms of reference for the assessment include the following:
➢ Assess and detail the potential impacts of the proposed development on both vegetation
and fauna at the site
➢ Outline possible mitigation measures, rehabilitation procedures and or vegetation
removal procedures that would reduce the potential impacts of the development.
➢ Identify and rate the significance of potential impacts and outline additional
management guidelines.
The detailed terms of reference for the study are described below.
3.11.1 Scope of Study
1.1.1.21 Vegetation Study
• Carrying out fieldwork to locate and describe the current status of vegetation in the study
area.
• Determine the forest type as per Champion & Seth guidelines, enumerating species present
in the study areas
• A description of different micro−habitats, and the species associated with those habitats.
• Disclose any gaps in information or assumptions made.

Final EIA Report – Orange Smart City, Pen, Raigad July 2018
182
BE/EIA-OSC/002
• Recommendations for migratory measures to minimize impacts identified.
• An outline of additional management guidelines.
• Provide monitoring requirements, mitigation measures and recommendations in a table
format as input into the Environmental Management Plan (EMP), as well as generic
rehabilitation and re−vegetation guidelines.
Faunal Study
• Carrying out fieldwork to locate and describe the current status of faunal species in the
study area.
• Conduct a faunal assessment that can be integrated into the ecological study.
• Describe the existing impacts of current land use as they affect the fauna.
• Describe the different micro−habitats, and the species associated with those habitats.
• Describe the potential direct, indirect and cumulative negative and positive impacts of the
proposed activity on inhabitant and reliant faunal species.
• Provide a detailed fauna sensitivity map of the site, including mapping of faunal
community disturbance, transformation and potential “no−go” areas on site.
• Clarify species of special concern (SSC) as per Wildlife (Protection) Act, 1972 Schedule
& IUCN Red Data list and that are known to be:
➢ endemic to the region;
➢ that are considered to be of conservational concern;
➢ that are in commercial trade (CITES listed species);
➢ Or, are of cultural significance.
• A description of species composition and conservation status in terms of protected,
endangered or vulnerable faunal species.
3.11.2 Regulatory and legislative overview
A summary of the relevant portions of the Acts which govern the activities and potential
impacts to the environment associated with the development are listed below. Provided that
standard mitigation and impact avoidance measures are implemented, not all the activities
listed in the Acts below would actually be triggered.
Environment (Protection) Act of 1986
• The Act is an “umbrella” for legislations designed to provide a framework for Central
Government, coordination of the activities of various central and state authorities
established under previous Acts, such as the Water Act and the Air Act.
• The purpose of the Act is to implement the decisions of the United Nations Conference on
the Human Environment of 1972, in so far as they relate to the protection and improvement
of the human environment and the prevention of hazards to human beings, other living
creatures, plants and property.

Final EIA Report – Orange Smart City, Pen, Raigad July 2018
183
BE/EIA-OSC/002
• In this Act, main emphasis is given to “Environment”, defined to include water, air and
land and the inter-relationships which exist among water, air and land and human beings
and other living creatures, plants, micro-organisms and property.
• “Environmental pollution” is the presence of pollutant, defined as any solid, liquid or
gaseous substance present in such a concentration as may be or may tend to be injurious
to the environment.
• “Hazardous substances” include any substance or preparation, which may cause harm to
human beings, other living creatures, plants, microorganisms, property or the environment.
Wild Life (Protection) Act of 1972 and Amendment, 1982
• The Wild Life Act provides for
➢ state wildlife advisory boards,
➢ regulations for hunting wild animals and birds,
➢ establishment of sanctuaries and national parks,
➢ regulations for trade in wild animals, animal products and trophies, and
➢ Judicially imposed penalties for violating the Act.
• Harming endangered species listed in Schedule 1 of the Act is prohibited throughout India.
• Hunting species, like those requiring special protection (Schedule II), big game (Schedule
III), and small game (Schedule IV), is regulated through licensing.
• An amendment to the Act in 1982, introduced a provision permitting the capture and
transportation of wild animals for the scientific management of animal population.
Forest (Conservation) Act of 1980
• Forest Conservation Act was enacted to consolidate the law related to forest, the transit of
forest produce and the duty livable on timber and other forest produce.
• Under the provisions of this Act, prior approval of the Central Government is required for
diversion of forestlands for non-forest purposes.
• An Advisory Committee constituted under the Act advises the Centre on these approvals.
• The Act deals with the four categories of the forests, namely reserved forests, village
forests, protected forests and private forests.
➢ Reserved forest:
• A state may declare forestlands or waste lands as reserved forest and may sell the produce
from these forests.
• Any unauthorized felling of trees quarrying, grazing and hunting in reserved forests is
punishable with a fine or imprisonment, or both
➢ Village forests:
• Reserved forests assigned to a village community are called village forests.
➢ Protected forests:
• The state governments are empowered to designate protected forests and may prohibit the
felling of trees, quarrying and the removal of forest produce from these forests.

Final EIA Report – Orange Smart City, Pen, Raigad July 2018
184
BE/EIA-OSC/002
• The preservation of protected forests is enforces through rules, licenses and criminal
prosecutions.
Biodiversity Act 2000
The legislation aims at regulating access to biological resources so as to ensure equitable
sharing of benefits arising from their use.
• Salient features of the biodiversity legislation
➢ The main intent of this legislation is to protect India’s rich biodiversity and associated
knowledge against their use by foreign individuals and organizations without sharing
the benefits arising out of such use, and to check bio-piracy
➢ This bill seeks to check bio-piracy, protect biological diversity and local growers
through a three-tier structure of central and state boards and local committees.
➢ Collaborative research projects and exchange of knowledge and resources are
exempted provided they are drawn as per the policy guidelines of the Central
Government.
3.11.3 Methodology
Data review & sourcing
The data sources consulted and used where necessary in the study includes the following:
Flora & Ecosystem
• Vegetation types for the area were extracted from Report of the Committee to Formulate
Objective Parameters for Identification of Inviolate Forest Areas, July 2012. Identification
of species was done according to the ENVIS publication of plant species & their
importance; published in November 2016.
• The IUCN conservation status (Table 1) of the species in the list was also extracted from
the database and is based on the Threatened Species Programme.
• Freshwater and wetland information was extracted from the National Wetland
Conservation Programme (NWCP) and The List of Wetlands of International Importance
Published 6 July 2018 as published on the Ramsar website.
Fauna
• Lists of mammals, reptiles and amphibians which are likely to occur at the site were
derived based on distribution records from the literature and various databases
• Bird data for the site was extracted from the Ebird listing for the region and Birds of the
Indian Subcontinent by Richard Grimmett, Carol Inskipp, Tim Inskipp was used during
site visit for the identification of species and Birdlife India’s Important Bird Areas was
also referred to ascertain if the site falls within the range of any range−restricted or globally
threatened species.
• The faunal species lists provided are based on species which are known to occur in the
broad geographical area, as well as a preliminary assessment of the availability and quality
of suitable habitat at the site. For each species, the likelihood that it occurs at the site was
rated according to the following scale:
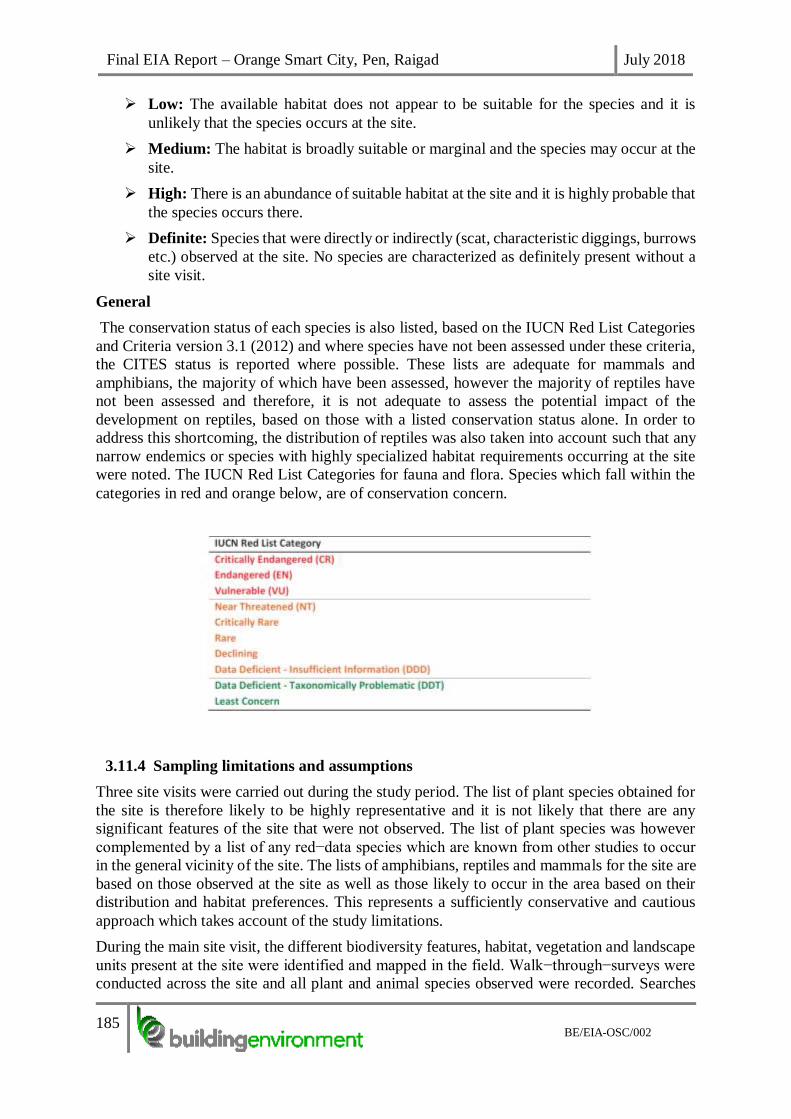
Final EIA Report – Orange Smart City, Pen, Raigad July 2018
185
BE/EIA-OSC/002
➢ Low: The available habitat does not appear to be suitable for the species and it is
unlikely that the species occurs at the site.
➢ Medium: The habitat is broadly suitable or marginal and the species may occur at the
site.
➢ High: There is an abundance of suitable habitat at the site and it is highly probable that
the species occurs there.
➢ Definite: Species that were directly or indirectly (scat, characteristic diggings, burrows
etc.) observed at the site. No species are characterized as definitely present without a
site visit.
General
The conservation status of each species is also listed, based on the IUCN Red List Categories
and Criteria version 3.1 (2012) and where species have not been assessed under these criteria,
the CITES status is reported where possible. These lists are adequate for mammals and
amphibians, the majority of which have been assessed, however the majority of reptiles have
not been assessed and therefore, it is not adequate to assess the potential impact of the
development on reptiles, based on those with a listed conservation status alone. In order to
address this shortcoming, the distribution of reptiles was also taken into account such that any
narrow endemics or species with highly specialized habitat requirements occurring at the site
were noted. The IUCN Red List Categories for fauna and flora. Species which fall within the
categories in red and orange below, are of conservation concern.
3.11.4 Sampling limitations and assumptions
Three site visits were carried out during the study period. The list of plant species obtained for
the site is therefore likely to be highly representative and it is not likely that there are any
significant features of the site that were not observed. The list of plant species was however
complemented by a list of any red−data species which are known from other studies to occur
in the general vicinity of the site. The lists of amphibians, reptiles and mammals for the site are
based on those observed at the site as well as those likely to occur in the area based on their
distribution and habitat preferences. This represents a sufficiently conservative and cautious
approach which takes account of the study limitations.
During the main site visit, the different biodiversity features, habitat, vegetation and landscape
units present at the site were identified and mapped in the field. Walk−through−surveys were
conducted across the site and all plant and animal species observed were recorded. Searches

Final EIA Report – Orange Smart City, Pen, Raigad July 2018
186
BE/EIA-OSC/002
for listed and protected plant species at the site were conducted and the location of all listed
plant species observed was recorded. Active searches for reptiles and amphibians were also
conducted within habitats likely to harbor or be important for such species. The presence of
sensitive habitats such as mangroves especially incase of parcel T3 were noted in the field and
recorded.
3.11.5 Ecological Settings
The project is situated in the hilly region of North Konkan, though the proposed activities are
mainly in plain and rolling areas. The Forested hills in the surrounding area has moist evergreen
forests that are mixed with deciduous varieties. Some of the Forests are Bombax dominant
forests. The forest vegetation is interspersed with fruit trees like Mango, Cashew, Chickoo,
Jackfruit, etc.
There are number of hills within 15 km boundary of project site that have reserved forest. The
nearest Protected forest is Karnala Wildlife Sanctuary. The hillslopes are largely cultivated
with millets whereas foothills are cultivated with Paddy. Many hillslopes are cultivated for
Cucumber and other vegetables during the Monsoon. The entire area has low to moderate
wildlife value and fauna is significantly dominated by fringe species that are usually associated
with rural settings
Western Ghat
Western Ghats is one of the eight "hottest hot-spots" of biological diversity in the world. The
range runs north to south along the western edge of the Deccan Plateau, and separates the
plateau from a narrow coastal plain, called Konkan, along the Arabian Sea. A total of national
parks, wildlife sanctuaries and reserve forests were designated as world heritage sites - four in
Maharashtra. The area is one of the world's ten "Hottest biodiversity hotspots" and has over
7,402 species of flowering plants, 1,814 species of non-flowering plants, 139 mammal species,
508 bird species, 179 amphibian species, 6,000 insects species and 290 freshwater fish species;
it is likely that many undiscovered species live in the Western Ghats. At least 325 globally
threatened species occur in the Western Ghats.
The Western Ghats form one of the four watersheds of India, feeding the perennial rivers of
India. The major river systems originating in the Western Ghats include Godavari, Kaveri,
Krishna, Thamiraparani and Tungabhadra.
3.11.6 Terrestrial Ecological Status: Primary Survey
Eleven locations were selected to conduct a detailed study within in the study area. Of
the total locations studied eight are in the core zone and eight in the buffer zone. The
locations are given in Table 3-21.
Table 3-21 : Details of terrestrial ecology sampling locations
Code Name of the location Direction from Project
Site
Distance from
Project Site (km)
EB-1 Kalambusare :
18°51'30.44"N
NE
SE
6.2
7.8

Final EIA Report – Orange Smart City, Pen, Raigad July 2018
187
BE/EIA-OSC/002
73° 03'30.18"E
EB-2 Chirner
18°50'51.44"N
73° 02'56.24"E
NE
SE
3.4
6.5
EB-3 Vadgaon
18°51'13.45"N
73° 12'00.62"E
NE
S
5.4
11.3
EB-4 Jambhulpada
18°55'40.49"N
73° 02'30.64"E
NW
S
7.2
12.8
EB-5 Poynad
18°40'40.76"N
73° 00'27.22"E
S
SW
12.8
22.6
EB-6 Bense
18°35'04.39"N
73° 05'23.86"E
S
S
13.6
30.6
EB-7 Palas
18°34'26.62"N
73° 07'44.13"E
S
S
12.96
31.63
EB-8 Ransai
18°46'25.71"N
73° 12'32.82"E
E
NE
7.51
9.3
The sampling locations in the core zone and the buffer zone are shown in the section below:

Final EIA Report – Orange Smart City, Pen, Raigad July 2018
188
BE/EIA-OSC/002
Figure 3-35: Map depicting sampling locations in the buffer zone
Figure 3-36: Map depicting the sampling locations at the site

Final EIA Report – Orange Smart City, Pen, Raigad July 2018
189
BE/EIA-OSC/002
Figure 3-37: Map depicting the ecological sampling locations within 5km of the project
boundary
3.11.7 Ecological Sampling
Generally, the duration of an ecological baseline survey should be commensurate with the scale
of the proposed development at hand, and the duration of sampling conducted for the proposed
project is regarded as the minimum requirement.
The duration of this ecological baseline survey was dependent on the following factors:
➢ The geographical coverage of the study area
➢ The diversity of habitats within the study area
➢ The diversity of flora and fauna within the study area
➢ Presence of ecologically important species or habitats which exhibit distinct seasonal
patterns (e.g. migratory animals, seasonal wetlands)
➢ Ecological information of the study area available
Vegetation Survey
The region of the proposed project supports diverse habitats and thus the entire sampling was
based on random sampling through “Plot Quadrate Method”.
Plot Quadrate Method
➢ This technique is used only when a part of a much large area is sampled, on the basis
of which, the total population of species in the larger area can be estimated.

Final EIA Report – Orange Smart City, Pen, Raigad July 2018
190
BE/EIA-OSC/002
➢ The shape and sizes of the quadrates were selected, based on previous experiences in
undertaking similar studies. The plot quadrate method was adopted to evaluate phyto-
sociological parameters like density, diversity and the frequency of the plant species.
The sizes of the quadrate were selected on the basis of species area curve’ and also
based on the past experience of undertaking such studies.
For the present vegetation survey
➢ Quadrates of size 10 m x 10 m were selected for studying the trees and shrubs and a 1m
x1m quadrate was selected for studying the ground cover dominantly the herbaceous
vegetation.
➢ About 3-4 quadrates were studied at each location depending upon the vegetation cover
and species diversity.
➢ A quadrant of 1 m2 area was sited at the center of each sample plot for the ground cover
sampling.
➢ Species composition was expressed in terms of frequency of occurrence, the most
frequent species indicated as common and the least frequent as rare.
➢ The photographs showing Vegetation in the Study Area are shown as Annexure-XIII
Wildlife Survey
➢ The plant species were identified with standard field keys. Unidentified plant specimens
were photographed & tagged, and/or collected & tagged. These tagged specimens were
identified with various available species photographs in and around the study areas and
later counter-checked and confirmed with the reference material available in the
reference keys.
➢ In addition, the Red Data Book Plants of India (Nayar &Sastry 1987-88 &
http://www.bsienvis.nic.in/RET/maharashtra was referred for the rare, endangered or
threatened species.
➢ All the data was corroborated with the available floral and faunal list by the Forest Dept.
of Raigad.
Ecological Settings
➢ Natural ecological features and wild life can be seen in forests of hilly tracts but these
are restricted to ranges of Sahayadris that are at considerable distance from the study
area.
➢ There are some reserved forest areas in the North East and South West of the site. The
project site is irregular in shape and overlooks the River Bhogeshwari & Balganga.
Habitats in the Study Area
Considering the location and topography of the study area, distinct habitats can be demarcated.
The study area can be divided into terrestrial, aquatic (freshwater bodies-lotic and lentic),
estuarine (marshland, mudflats and mangroves), and estuarine subtidal habitats. There are some
more pockets of habitat that are formed in the study area due to anthropogenic interventions
like the, agricultural land, settlements, industries and salt pans and aquaculture farms. The
region within 15 km radius where the present project is located has a total area of 104364
hectares out of which, approximately 25% of the area is covered by forests. The dense/open
forest acquires 18.6% of the total area and degraded scrub forests covers 5% of the study area.
Total agricultural land is about 21 % of the area with a small percentage of 0.2% plantation
and 1.5 % irrigated crop whereas other agriculture land comprises approx.19%.

Final EIA Report – Orange Smart City, Pen, Raigad July 2018
191
BE/EIA-OSC/002
The existing project area primarily comprises of barren land Part of the T3 land parcel comes
under CRZ limit (CRZ-III).
Floristic Composition- Primary Survey
The forests of this region have features, which are very similar to tropical rain forests although
much of the Western Ghats in the northern sector is drier as compared to those regions further
South in Goa, Karnataka, Tamil Nadu and Kerala. Because of general differences in the
ecological patterns, the floral and faunal communities of the Western Ghats in the northern
sector differ from the biological communities from the southern part of Western Ghats.
The study area considered for the proposed Orange Smart City has within its area several trees
Some of the landscape elements, which occur at the project site, include the following:
- Shrub covered hill tops and plateaus,
- Rivers adjacent to the project site
- Creek
- Rocky slopes
- Some cultivation is seen in the surroundings and the environs of the villages present
around the site.
- During the surveys of all the villages, cultivation of paddy and Nachni in some
places (Eleusine coracana) were noticed.
Floristic Diversity
During the field survey, a total number of 279 plant species (except algae, fungi and
bryophytes) were recorded from the study area which are given in Table 3-22. The floral data
collected for the baseline study was verified with the "List of Flora from the Working Plan of
Raigad District" and the species recorded in the baseline study are very much comparable with
the forest department list.
Table 3-22: Floristic composition in the study area
Sr. No. Scientific Name Common Name Family
I Agricultural crops
1 Oryza sativa Rice sp Poaceae
2 Eleusine coracana Millet sp Eleusine
3
II Commercial crops (Including Vegetables)
4 Amorphophallus paeoniifolius Elephnat Foot Yam
5 Abelmoschus indicus Hibiscus Malvaceae

Final EIA Report – Orange Smart City, Pen, Raigad July 2018
192
BE/EIA-OSC/002
Sr. No. Scientific Name Common Name Family
6 Allium cepa Onion Liliaceae
7 Allium sativum Garlic Liliaceae
8 Annona squamosa Custard Apple Annonaceae
9 Arachis hypogia Peanuts Fabaceae
10 Artocarpus heterophyllus Jackfruit Artocarpus
11 Cajanus cajan Pigeon Pea Fabaceae
12 Carica papaya Papaya Caricaceae
13 Citrus lemon Lemon Ruataceae
14 Colacasia esculenta Colocasia Areaceae
15 Ipomoea batatas Sweet Potato Umbelliferae
16 Lycopersicum esculentus Tomato Solanaceae
17 Mangifera indica Mango Anacardiaceae
18 Memordia charantia Bitter gourd Cucurbitaceae
19 Psidium guava Guava Myrtaceae
20 Raphanus sativa Raddish Cruciferae
21 Solanum tuberosum Potato Solanaceae
22 Vigna radiata Moong
III Plantations
23 Acacia nilotica Mimosaceae
24 Albizia lebbeck Mimosaceae
25 Albizia odorattissima Mimosaceae
26 Albizia procera Mimosaceae
27 Azadirachta indica Meliaceae
28 Bauhinia variegate Caesalpinaceae

Final EIA Report – Orange Smart City, Pen, Raigad July 2018
193
BE/EIA-OSC/002
Sr. No. Scientific Name Common Name Family
29 Bauhinia purpuria Caesalpinaceae
30 Bambusa arundanaceae Poaceae
31 Blumea sp.
32 Butea superba Caesalpinaceae
33 Butea frondosa Caesalpinaceae
34 Cocos nucifera
35 Eucalyptus sp Myrtaceae
36 Delonix regia Caesalpinaceae
37 Leucena leucophloe Caesalpinaceae
IV Natural Vegetation
38 Abelmoschus esculentus Orka
39 Abrus precatorius Crab’s eye Fabaceae
40 Abutilon indicum Indian Mallow Malvaceae
41 Acacia Arabica Acacia spp Mimosaceae
42 Acacia auriculiformis Acacia spp Mimosaceae
43 Acacia leucophloe Acacia spp Mimosaceae
44 Achras sapota Chikoo Sapotaceae
45 Acalypha hispida Fox tail Mimosaceae
46 Acanthospermum hispidum Goat’s head Compositae
47 Achyranthes aspera Prickly Chaff Flower Amaranthaceae
48 Adathoda vasica Adulsa
49 Adiantum philippense Fern
50 Adenanthera pavonina Ratan Gunj
51 Aegle marmelos Indian Bel Rutaceae

Final EIA Report – Orange Smart City, Pen, Raigad July 2018
194
BE/EIA-OSC/002
Sr. No. Scientific Name Common Name Family
52 Aegeratum conyzoides
53 Ageratum conyzoides Compositae
54 Ailanthes excela Simaroubaceae
55 Albizia odoratissima Caesalpinaceae
56 Albizia procera Caesalpinaceae
57 Aloe barbedensis Agavaceae
58 Allophylus cobbe
59 Alternanthera sessilis Amaranthaceae
60 Alysicarpus hamosus Fabaceae
61 Alysicarpus monilifer Fabaceae
62 Argyreia elliptica Convolucae
63 Argemone mexicana Papevaraceae
64 Asparagaus racemosus Liliaceae
65 Atalantia monophylla Rutaceae
66 Azadirachta indica Meliaceae
67 Barleria cuspidata
68 Bauhinia racemosa
69 Bridelia retusa
70 Blepharis asperima Acanthaceae
71 Blumea lacera Compositae
72 Bombax ceiba Bombacaceae
73 Borreria stricta Rubiaceae
74 Bridelia retusa Euphorbiaceae
75 Buchanania lanzan

Final EIA Report – Orange Smart City, Pen, Raigad July 2018
195
BE/EIA-OSC/002
Sr. No. Scientific Name Common Name Family
76 Butea monosperma
77 Caesalpina pulcherima Caesalpinaceae
78 Calotropis procera Asclipiadaceae
79 Canna indicda Cannaceae
80 Calycotropis floribunda
81 Careya arborea Palmae
82 Carissa carandus Apocyanaceae
83 Carissa spinarium Apocyanaceae
84 Carvia callosa
85 Casearia tomentosa
86 Cassia auriculata Caesalpinaceae
87 Cassia obtuse Caesalpinaceae
88 Cassia occidentalis Caesalpinaceae
89 Cassia tora Caesalpinaceae
90 Cassia fistula
91 Catunaregam spinosa
92 Calycotropis floribunda
93 Ceiba pentandra Bombacaceae
94 Celosia argentea
95 Cestrum noctrunum Rubiaceae
96 Chromalaena odorata
97 Chrysanthemum sp Compositae
98 Cissus quadrangularis Vitaceae
99 Citrus media Rutaceae
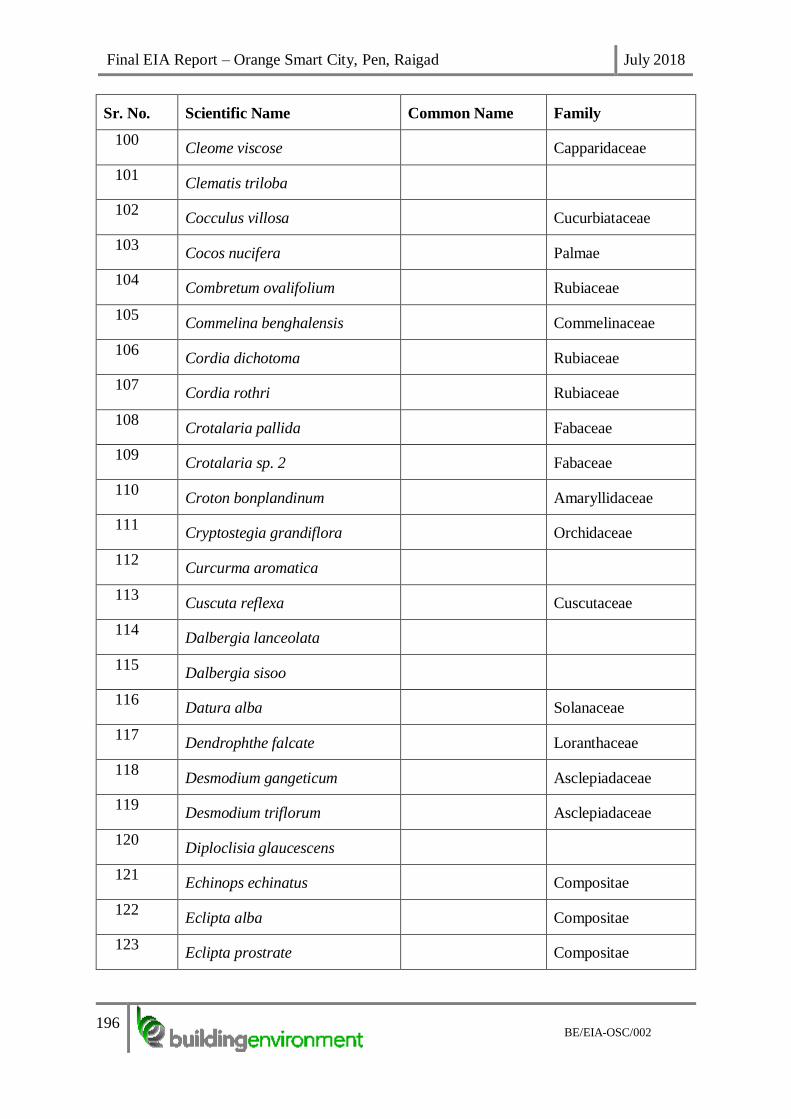
Final EIA Report – Orange Smart City, Pen, Raigad July 2018
196
BE/EIA-OSC/002
Sr. No. Scientific Name Common Name Family
100 Cleome viscose Capparidaceae
101 Clematis triloba
102 Cocculus villosa Cucurbiataceae
103 Cocos nucifera Palmae
104 Combretum ovalifolium Rubiaceae
105 Commelina benghalensis Commelinaceae
106 Cordia dichotoma Rubiaceae
107 Cordia rothri Rubiaceae
108 Crotalaria pallida Fabaceae
109 Crotalaria sp. 2 Fabaceae
110 Croton bonplandinum Amaryllidaceae
111 Cryptostegia grandiflora Orchidaceae
112 Curcurma aromatica
113 Cuscuta reflexa Cuscutaceae
114 Dalbergia lanceolata
115 Dalbergia sisoo
116 Datura alba Solanaceae
117 Dendrophthe falcate Loranthaceae
118 Desmodium gangeticum Asclepiadaceae
119 Desmodium triflorum Asclepiadaceae
120 Diploclisia glaucescens
121 Echinops echinatus Compositae
122 Eclipta alba Compositae
123 Eclipta prostrate Compositae

Final EIA Report – Orange Smart City, Pen, Raigad July 2018
197
BE/EIA-OSC/002
Sr. No. Scientific Name Common Name Family
124 Eichhornia cressipes Pontederiaceae
125 Emblica officinalis Euphorbiaceae
126 Entada pursaetha
127 Erythrina indica Papillionaceae
128 Eupatorium glandulosum
129 Euphorbia nerifolia Euphorbiaceae
130 Euphorbia neruri Euphorbiaceae
131 Euphorbia nivula Euphorbiaceae
132 Ficus asperrima
133 Ficus benghalensis Moraceae
134 Ficus glomerata Moraceae
135 Ficus hispida Moraceae
136 Ficus microcarpa
137 Ficus racemosus Moraceae
138 Ficus relisiosa Moraceae
139 Flacourtia indica Flacourtiaceae
140 Flacourtia latifolia Flacourtiaceae
141 Gardenia latifolia Rubiaceae
142 Garuga pinnata Burseraceae
143 Garcinia indica
144 Gloriosa superba
145 Gossypium herbaceum Malvaceae
146 Grewia abutifolia Tiliaceae
147 Grewia asiatica Tiliaceae

Final EIA Report – Orange Smart City, Pen, Raigad July 2018
198
BE/EIA-OSC/002
Sr. No. Scientific Name Common Name Family
148 Grewia subinaqualis Tiliaceae
149 Helictris isora Rubiaceae
150 Heliotropium indicum Rubiaceae
151 Helitropium ovalifolium Rubiaceae
152 Heterophragma quadriculare
153 Hemidesmus indicus Asclepiadaceae
154 Hibiscus micronthus Malvaceae
155 Hibiscus ovalifolia Malvaceae
156 Hibiscus rosa-cianensis Malvaceae
157 Holarrhena antidysentrrica
158 Hygrophylla auriculata Acanthaceae
159 Hymenodictyon excelsum
160 Hyptis suavalens Labiatae
161 Ipomea sp. Convolvulaceae
162 Ixora parviflora Rubiaceae
163 Ixora coccinea
164 Jasminum malbarichum
165 Jatropha gossypifolia Euphorbiaceae
166 Justicia carnea Acanthaceae
167 Justicia procumbens Acanthaceae
168 Lantana camara Verbinacaee
169 Lathyrus sativus Papillionaceae
170 Lawsonia inermis Lythraceae
171 Largestromia lanceolata

Final EIA Report – Orange Smart City, Pen, Raigad July 2018
199
BE/EIA-OSC/002
Sr. No. Scientific Name Common Name Family
172 Leea microphylla
173 Lepisanthes tetraphylla
174 Leucas aspera Labiatae
175 Leucas stelligera Labiatae
176 Loranthus sp Loranthaceae
177 Mancranga peltata
178 Mangifera indica Anacardiaceae
179 Melia azadirachta Meliaceae
180 Merremia umbellata Convolvulaceae
181 Merremia vitifolia Convolvulaceae
182 Mimosa pudica Mimosaceae
183 Mitrgyna parviflora Rubiaceae
184 Moullava spicata
185 Mollugo hirta Aizoaceae
186 Moringa oleifera Moringaceae
187 Mucuna pruriens
188 Murraya koenigii Rutaceae
189 Musa paradisica Musaceae
190 Nerium indicum Apocyanaceae
191 Ocimum americanum Labiatae
192 Ocimum basillum Labiatae
193 Ocimum sanctum
194 Operculina turpethum
195 Opuntia dillinii Opuntiaceae

Final EIA Report – Orange Smart City, Pen, Raigad July 2018
200
BE/EIA-OSC/002
Sr. No. Scientific Name Common Name Family
196 Opuntia elator Cacataceae
197 Oxalis corniculata Oxalidaceae
198 Panicum notatum Poaceae
199 Parthenium hysterophorus Compositae
200 Passiflora foetida Passifloraceae
201 Pavonia zeylanica Malvaceae
202 Peltophorum ferrugineum Caesalpinaceae
203 Peristrophe bicalculata Acanthaceae
204 Phoenix aculis Palmae
205 Phyllanthes emblica Euphorbiaceae
206 Phyllanthes nirurii Euphorbiaceae
207 Physalis minima Solanaceae
208 Pithocolobium dulce Mimosaceae
209 Polyalthia longifolia Annonaceae
210 Pongamia glabra
211 Pongamia pinnata Fabaceae
212 Portulaca oleracea Portulaccaceae
213 Psidium guava Myrtaceae
214 Pteris sp
215 Punica granulatum Puniaceae
216 Rhus mysoorensis Rosaceae
217 Samanea saman
218 Sapindus emerginatus Sapindaceae
219 Schleichera oleosa

Final EIA Report – Orange Smart City, Pen, Raigad July 2018
201
BE/EIA-OSC/002
Sr. No. Scientific Name Common Name Family
220 Sida acuta
221 Sida cordifolia Malvaceae
222 Sida rhombifolia Malvaceae
223 Smilax zeylanica
224 Solanum nigrum Solanaceae
225 Solanum xanthocarpum Solanaceae
226 Spondias pinnata
227 Sterculia villosa Tiliaceae
228 Strobilanthus callossus
229 Sygygium cumini Myrtaceae
230 Tabernaemontana pandacaqui
231 Tagetus sp Compositae
232 Tamarindus indica Caesalpinaceae
233 Tectona grandis Verbinaceae
234 Tephrosia purpuria Fabaceae
235 Teramnus labialis
236 Terminalia paniculata Terminalia
paniculata
• Terminalia tomentosa Terminalia
tomentosa
237 Terminalia chebula
238 Terminalia elliptica
239 Tetrasigma sp.
240 Thespesia populanea Malvaceae
241 Thespesia lampas Malvaceae
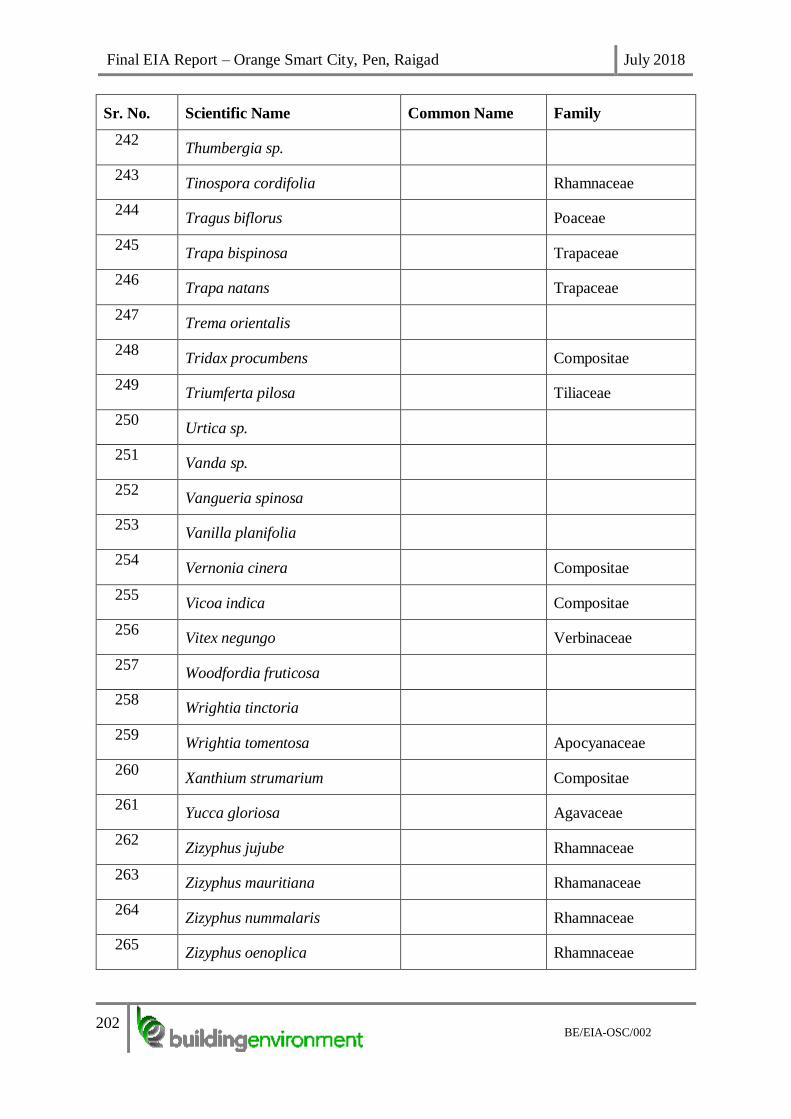
Final EIA Report – Orange Smart City, Pen, Raigad July 2018
202
BE/EIA-OSC/002
Sr. No. Scientific Name Common Name Family
242 Thumbergia sp.
243 Tinospora cordifolia Rhamnaceae
244 Tragus biflorus Poaceae
245 Trapa bispinosa Trapaceae
246 Trapa natans Trapaceae
247 Trema orientalis
248 Tridax procumbens Compositae
249 Triumferta pilosa Tiliaceae
250 Urtica sp.
251 Vanda sp.
252 Vangueria spinosa
253 Vanilla planifolia
254 Vernonia cinera Compositae
255 Vicoa indica Compositae
256 Vitex negungo Verbinaceae
257 Woodfordia fruticosa
258 Wrightia tinctoria
259 Wrightia tomentosa Apocyanaceae
260 Xanthium strumarium Compositae
261 Yucca gloriosa Agavaceae
262 Zizyphus jujube Rhamnaceae
263 Zizyphus mauritiana Rhamanaceae
264 Zizyphus nummalaris Rhamnaceae
265 Zizyphus oenoplica Rhamnaceae

Final EIA Report – Orange Smart City, Pen, Raigad July 2018
203
BE/EIA-OSC/002
Sr. No. Scientific Name Common Name Family
266 Cenchurus ciliaris Poaceae
267 Apluda mutica Poaceae
268 Chloris dolichosta Poaceae
269 Cyanodactylon sp Poaceae
270 Dichanthium annulatum Poaceae
271 Aristida adscensionsis Poaceae
V Grasses
272 Andropogon pumilis
273 Andropogon pertusus
274 Andropogon monticola
275 Cenchrus setifgera Poaceae
276 Cyperus aristatus Cyperaceae
277 Cyperus rotundus Cyperaceae
278 Cynadon dactylum
279 Digetaria bicornis Poaceae
280 Digetaria Segetaria Poaceae
281 Digetaria stricta Poaceae
282 Eragrostis tenella Poaceae
283 Fibrystylis dichotoma Poaceae
284 Ischaemum pilosum
285 Heteropogon contortus
VI Mangroves
286 Avicennia alba Verbenacea
287 Avicennia marina Verbenacea

Final EIA Report – Orange Smart City, Pen, Raigad July 2018
204
BE/EIA-OSC/002
Sr. No. Scientific Name Common Name Family
288 Acanthus illicifolius Acanthaceae
289 Derres heterophylla Fabaceae
290 Salvadora persica Salvadoraceae
291 Sonneratia apetala Sonneratiaceae
The percentage of the ground cover in the study area is depicted in Figure 3-38
Figure 3-38 : Distribution of the ground cover in the study area
3.11.8 Observations and Discussion
Ecological Resources
The ecological studies at the above locations at clearly indicates that the project area is
inhabited by several plant and animal species that supports a biological diversity of the
project area. Local plant communities, which were recorded, include many evergreen
species, like Ficus racemosa, and Mangifera indica. Deciduous elements are, however,
Hills/Forest Patches
Valleys/Plataeus
Open Areas

Final EIA Report – Orange Smart City, Pen, Raigad July 2018
205
BE/EIA-OSC/002
less in abundance in the area. The under storey development was observed to be
moderate and the presence of bamboo patches were also a common feature. The local
and tribal people in the region collect species like Terminalia tomentosa, Terminalia
chebula,Syzigium cumin, Pongamia pinnata, Garcinia indica for their medicinal
values. There are less number of big mammals and there are sporadic records of
leopard, barking deer and jackals. Avifauna activity, which was recorded here during
the short visit included Thrushes, Babblers, Shama, woodpeckers etc.
Common Floral Species
• As per primary survey conducted in post- monsoon 2015, predominant plant species
observed in the study area were Tectona grandis, Bombax ceiba, Erythrina indica, Grewia
spp., Moullava spictata, Mucuna pruriens, Justicia spp., Chromalaena odorata, Cassia tora,
and Macranga peltata. Outside project site, in buffer zone, Shirsish / Albizzia spp.,coconut
plantation,banana, Drumstick plantation, Tamarind tree and paddy plantation is observed
• Scrub species that are commonly found in the region are Ziziphus rugosa, Acacia
concinna, Carissa congesta.
• The species present in the region have further been depleted because of the human
interventions and the associated exploitation of the forest resources due to cutting by the
villagers and the tribal communities in the region. The floral communities of the site were
observed to be fairly diverse except for plateau level habitats where there is poor diversity
and abundance of flora, which was subsequently reflected in the faunal communities as
well.
• Wild plants play a very important role in the livelihoods of the neighbouring villages and
tribal communities as an integral part of the subsistence strategy of people in many forest
regions.
• Food plants serve as one of the primary alternative sources of income for many resource
poor communities, and the source of species for domestication.
• Some of the economically important forest vegetation that was recorded during the survey
has been classified according to their resource use/value and are given in Table 3-23.
Table 3-23 : Classification of the commonly occurring plant species as per resource use/ value
Timber & other
Economic Products
Edible Fruit Medicinal Value Ornamental Value
Acacia concinna Carissa congesta Bauhinia
purpurea
Bauhinia purpurea
Acacia catechu Ficus racemose Dillenia indica Bauhinia racemosa
Bauhinia purpurea Mangifera indica Erythrina spp. Cassia fistula
Bombax insigne Emblica officinalis Euphorbia
nerifolia
Erythrina spp.
Butea monosperma Catunaregam
Spinose Ferns Jasminum
malabaricum

Final EIA Report – Orange Smart City, Pen, Raigad July 2018
206
BE/EIA-OSC/002
Timber & other
Economic Products
Edible Fruit Medicinal Value Ornamental Value
Careya arborea Syzygium cumini Ficus racemosa -
Cassia fistula Zyziphus mauritiana Pongamia
pinnata.
-
Dillenia indica Zyziphus rugosa Emblica
officinalis
-
Ficus racemosa Syzygium cumini Syzygium cumini -
Pongamia pinnata . Meyna laxiflora Terminalia
chebula
-
Catunaregam spinosa Phyllanthus emblica Garncinia indica -
Carvia callosa Emblica officinalis - -
Syzygium cumini Tamarindus indica - -
Terminalia chebula Garcinia indica - -
Terminalia crenulata Syzigium
caryophyllatum
- -
Terminalia tomentosa Buchanania lanzan - -
Dalbergia latifolia - - -
Trema orientalis - - -
The most common floral species observed are given in Table 3-24.
Table 3-24: Most common floral species observed in the study area
Sl. No. Scientific name Local name
1. Carissa congesta Karvanda
2. Erythrina sp. Pangar
3. Euphorbia neriifolia
4. Ficus racemose Umbar
5. Moullava spictata

Final EIA Report – Orange Smart City, Pen, Raigad July 2018
207
BE/EIA-OSC/002
Sl. No. Scientific name Local name
6. Mucuna pruriens Khazkhuzli
7. Chromalaena odorata
8. Tectona grandis Sagvan
9. Syzygium cumini Jambhul
10. Terminalia crenulata
11. Terminalia tomentosa Ain
12. Macranga peltata Chanda
13. Zyziphus rugosa Toran
14. Careya arborea Kumbhi
15. Emblica officinalis Anvala
16. Acacia concinna Shikakai
17. Mangifera indica Amba
18. Bombax ceiba Kante Savar
19. Albizzia spp. Siris
20. Dalbergia latifolia Shisham
Ground Cover
Almost the entire region of the study area ground cover was majorly contributed by grass and
few herbs which grow in the monsoon season. Since the sampling was done in the non-
monsoon period, almost all ground vegetation was dried, although some places still retained
the remnants of monsoon grown live herbs. The actual project site being an open area, more
than 93% of the groundcover was by dry grass and remaining area was barren land.
Observation on fauna:
Domestic Animals: The domestic animals in the study area mostly comprise of goat, buffalo,
rat, dog, cow. The survey revealed that cow constituted the most abundant species, followed
by buffalo and goat.
Wild Animals: The diversity of fauna basically depends upon density and diversity of flora.
The study area do not support the presence of wild mammals. Further, besides avifauna, which
has been addressed separately, species of amphibians, reptiles and butterflies were recorded
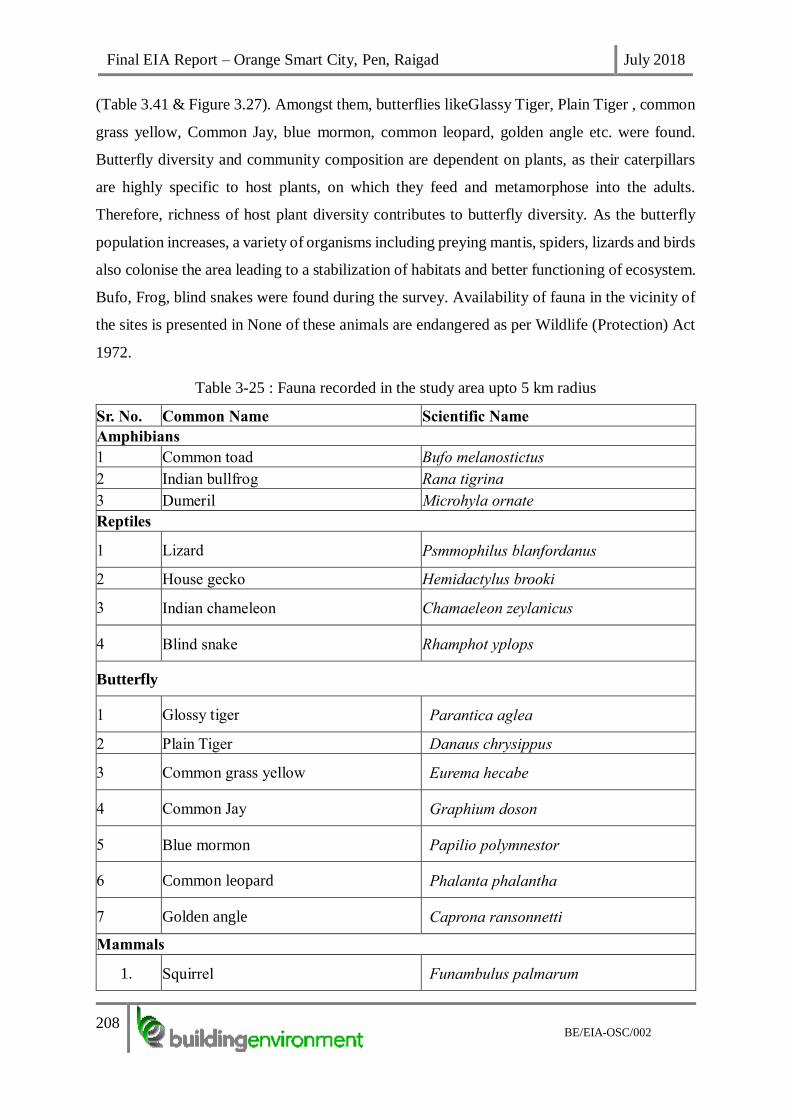
Final EIA Report – Orange Smart City, Pen, Raigad July 2018
208
BE/EIA-OSC/002
(Table 3.41 & Figure 3.27). Amongst them, butterflies likeGlassy Tiger, Plain Tiger , common
grass yellow, Common Jay, blue mormon, common leopard, golden angle etc. were found.
Butterfly diversity and community composition are dependent on plants, as their caterpillars
are highly specific to host plants, on which they feed and metamorphose into the adults.
Therefore, richness of host plant diversity contributes to butterfly diversity. As the butterfly
population increases, a variety of organisms including preying mantis, spiders, lizards and birds
also colonise the area leading to a stabilization of habitats and better functioning of ecosystem.
Bufo, Frog, blind snakes were found during the survey. Availability of fauna in the vicinity of
the sites is presented in None of these animals are endangered as per Wildlife (Protection) Act
1972.
Table 3-25 : Fauna recorded in the study area upto 5 km radius
Sr. No. Common Name Scientific Name
Amphibians
1 Common toad Bufo melanostictus
2 Indian bullfrog Rana tigrina
3 Dumeril Microhyla ornate
Reptiles
1 Lizard Psmmophilus blanfordanus
2 House gecko Hemidactylus brooki
3 Indian chameleon Chamaeleon zeylanicus
4 Blind snake Rhamphot yplops
Butterfly
1 Glossy tiger Parantica aglea
2 Plain Tiger Danaus chrysippus
3 Common grass yellow Eurema hecabe
4 Common Jay Graphium doson
5 Blue mormon Papilio polymnestor
6 Common leopard Phalanta phalantha
7 Golden angle Caprona ransonnetti
Mammals
1. Squirrel Funambulus palmarum

Final EIA Report – Orange Smart City, Pen, Raigad July 2018
209
BE/EIA-OSC/002
Sr. No. Common Name Scientific Name
2. Jackal Canis aureus
3. Cow
4. Domestic Buffalo
5. Goat
6. Common dog
7. Common cat
Avifauna
1. House sparrow Passer domesticus
2. Black drongo Dicrusus adsimilis
3. Kingfisher Alcedo atthis
4. Bulbul Pycnonotus jacous
5. Fantail flycatcher Rhipidura sp..
6. Common myna Acridotheres tristis
7. Cuckoo Cuculus canorus
8. Parakeets Psittacula sp.
Source: Field Observation and discussion with local people
*Barring Indian Chameleon (Sch II), no other animals are enlisted in Schedules I through
V under Wild Life (Protection) Act 1972

Final EIA Report – Orange Smart City, Pen, Raigad July 2018
210
BE/EIA-OSC/002
Rhamphotyplops Bufomelanostictus
Psammophilusblanfordanus Chamaeleonzeylanicus
Paranticaaglea Euremahecabe
Papiliopolymnestor Graphiumdoson
Figure 3-39 : Select common animals in the study area
Figure 3-40 : Select common butterfly in the study area

Final EIA Report – Orange Smart City, Pen, Raigad July 2018
211
BE/EIA-OSC/002
FIGURE 3.29: SELECT COMMON AVIFAUNA OBSERVED IN THE STUDY AREA
3.1.1 Sanctuaries within the study area
Karnala Bird Sanctuary:
The project site is in the vicinity of Karnala Bird Sanctuary. In addition to the available
secondary data, the sanctuary was also part of the field survey as one of the EB survey location.
Findings are provided in Annexure-XIV to Annexure-XVI. Karnala Bird Sanctuary is at
Karnala in Panvel and Uran Tahsil of Raigad District. Total area of the sanctuary is 12.154
Sq.Km. Consisting of 6.562sq.Km. Reserve forest, 5.547Sq. Km. Acquired forest and 0.045
sq.km. Private land.
The place along the Mumbai Goa NH 66, the road passes through sanctuary is about 1.5 km.
Karnala Bird Sanctuary, there is fort called Karnala fort which has very interesting history. In
spite of being a small pocket it holds a rich diversity of wood land vegetation & wood land bird
species. It also forms a catchment area of Patalganga River. The Sanctuary is an important
green oasis surrounded by industrial areas of Panvel, Khopoli & Patalganga. Hilly terrain
consist of nallas on eastern and western slopes which drains in Patalganga River. Mean
max.temp.: 34.25OC while Mean min.temp.: 24.82O C while average annual rainfall is
2404.45mm.
Prior to 31st March, 1994 the area of this sanctuary was under administrative control of Alibag
Forest Division. Henceforth, the area is transferred to Wild Life Division, Thane. Area 4.27
Passer domesticus Dicrususadsimilis
Psittacula sp. Alcedoatthis
Figure 3-41 : Select common avifauna observed in the study
area

Final EIA Report – Orange Smart City, Pen, Raigad July 2018
212
BE/EIA-OSC/002
Sq.Km. of reserve forest was earlier declared as Karnala Fort sanctuary in the year 1968 under
“Bombay Wild Animal And Wild Bird Act,1951”. In 1986, as per the provision of Wild life
Protection Act,1972 of Section 18, the area 12.11 Sq.Km. was notified for Karnala Bird
Sanctuary . The rights and privileges were settle down.In 2003, an area of 12.109Sq.km. of
reserve and acquired forest including earlier declared area was notified as Karnala Bird
Sanctuary under sec. 26(a) of Wild Life Protection Act,1972. In 2003, subsequently a private
cultivation area 0.045Sq.Km. Added by declaration as Karnala Bird Sanctuary. Thus today the
total area of the sanctuary is 12.154Sq.Km.
The total length of external boundary is 29.56 km. The sanctuary area is divided in
compartments hence the internal boundary is16.50 km. At the bottom of the funnel hill of the
fort there are 12 water storage dug out tanks in impermeable basalt rock that retain stagnated
rain water all around the year.23 cement water dishes kept at strategic places to provide water
to animals and birds.
Flora and Fauna within the Sanctuary
FLORA
3B/C1b – Southern Teak Bearing Forest
2B/C2 – Southern Moist Mixed Deciduous
4E/RS1 – Tropical reparine Fringe Forest
➢ The Sanctuary area is covered with mixed forest. In Southern teak bearing forest,
the teak dominance seen in Karnala Sanctuary.
➢ With teak, top canopy consists of Ain, Amba, Behada, Hed, Kusum, Sawar,
Dhavada, middle canopy Alu, Bahawa, Dhaman, Dikamali, Asana, Apta, Palas,
Lokhnadi, Kuda. herbs, shrubs and grasses like atrun, Karvand, Kusali and Marvel.
➢ The moist mixed deciduous forest are similar with Southern Teak bearing Forest
except that percentage of Kinjal, Nana, amba and Behda are more than Teak.
➢ The density of the forest is between 0.6 to 0.8.
➢ The Riparian Fringing Forest occur along the nala bank consists of top canopy with
Umbar, Jambhul, Karanj Amba. Middle canopy with Alu, Bahava, Dhaman,
Dikemali, Lokhandi, Palas, Kumbhi.
➢ In 1980, Botonical Survey of India Pune carried out the survey of this area and found
out about 642 species.

Final EIA Report – Orange Smart City, Pen, Raigad July 2018
213
BE/EIA-OSC/002
FAUNA
➢ The topographical features and ecological conditions are favourable for boarding
large variety of birds and small animals like wild pig, barking deer, porcupine,
mongoose, jungle cat, monitor lizard, squirrels, hyena and monkey.
➢ As many as 132 bird spp. have been listed in the sanctuary. Of these 92 spp. are
resident and 40 spp. are migratory.
➢ Globally threatened and endemic birds like Long Billed Vultures, Malbar Gray
Hornbill, Small Sun Bird and Shahin Falcon birds spp. are found in Karnala Bird
Sanctuary.
Around 11 spp. of reptiles are found in sanctuary area like Cobra, Krait, Viper,
Python, Rat snake etc.
(Source: http://www.thanewildlife.org/Sanctuaries/karnala-wildlife-sanctuary)

Final EIA Report – Orange Smart City, Pen, Raigad July 2018
214
BE/EIA-OSC/002
Agriculture
The common crops in the study area are Oryza sativa and Eleusine coracana which mainly
depend on rainwater and irrigation in non-monsoon season.Apart from that commercial crops
like Mangoes, Cashews, Suran and vegetables such as Onions, Sweet potatoes, Chilies, Brinjal,
Ladyfinger and leafy vegetables are common. A sizable land in the study area was also under
farms for cultivation of fish and prawn. Most of the farms cultivate prawns and this in semi-
intensive farming wherein mostly fresh water and some places brackish water is used. Some
farms use it for both paddy and sometimes prawn/fish farming depending on the season and
availability of water.
Estuaries and Mangroves
• The intertidal area on the landward side is actually a broad area inundated by tidal flooding
daily twice and thus muddy. This forms an intertidal estuarine habitat which are capable
of growing the mangroves. Mangroves are found at the fringe and interior as well, and at
some places they are dense.
• Mangrove species were observed along the shores of Balganga and estuarine creek near
Sonkar village. Except for these creeks and its shore, no other area within 15 km radius of
project location harbours mangroves. Large stretches of associated species of Derres
heterophylla and Acanthus ilicifolius were observed in this area. The predominant
mangrove species were Sonneratia apetala as dominant species and Avicennia marina and
A. alba were present but very sparse with few nos. All the mangroves together showed a
height range of 2-10 ft. The mangroves observed in this location have healthy luxuriant
growth. These mangroves have been classified by the Wildlife Department as “Marine
Protected Areas of India‟ as listed by the Wildlife of India, 1999 and “Mangrove Wetlands
of India” as per records of the State Forest Department. Natural mangrove vegetation in
the project area is primarily limited to a layer of a single predominantly less salt tolerant
species, with much of the area devoid of other species.
• The species in the marshy areas alongside the creeks were represented by Suaeda nudiflora
and Sesuvium portulacastrum. The other species which also occur in these marshes were
Asparagus racemosus, and Casuarina sp.
• Some of the areas which do not have frequent tidal flushing were intruded by Thespesia
populnae but in other estuarine areas it was absent possibly due to daily inundation.
• In some water-logged areas aquatic species lke Trapa sp., Salvinia sp, Eichornia sp.,
Nymphea sp. and submerged vegetation like Hydrilla sp. was observed
Aquatic Ecosystem
Unpolluted fresh water is amongst the most endangered of our natural resources, basically
fragile communities that supports may similarly be under threat. With increased understanding
of the process that operates in these dynamic assemblages of species, attention has been
directed towards the effect exerted by different groups of the substances such as heavy metals
and organic substances on the aquatic plant and animal communities. An attempt has been
made to generate baseline data of the water bodies in study area to know the existing biological
spectrum. This information will give a clear picture of current load of pollution or inflows
coming from surrounding areas to the aquatic bodies.
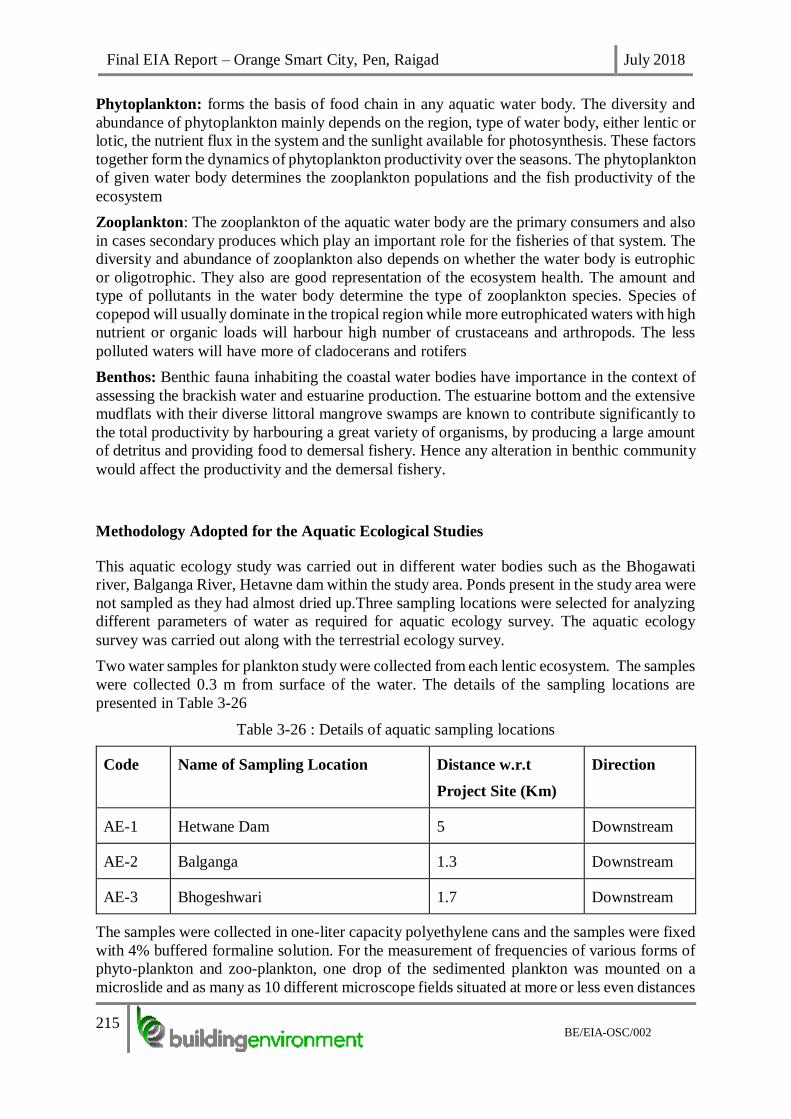
Final EIA Report – Orange Smart City, Pen, Raigad July 2018
215
BE/EIA-OSC/002
Phytoplankton: forms the basis of food chain in any aquatic water body. The diversity and
abundance of phytoplankton mainly depends on the region, type of water body, either lentic or
lotic, the nutrient flux in the system and the sunlight available for photosynthesis. These factors
together form the dynamics of phytoplankton productivity over the seasons. The phytoplankton
of given water body determines the zooplankton populations and the fish productivity of the
ecosystem
Zooplankton: The zooplankton of the aquatic water body are the primary consumers and also
in cases secondary produces which play an important role for the fisheries of that system. The
diversity and abundance of zooplankton also depends on whether the water body is eutrophic
or oligotrophic. They also are good representation of the ecosystem health. The amount and
type of pollutants in the water body determine the type of zooplankton species. Species of
copepod will usually dominate in the tropical region while more eutrophicated waters with high
nutrient or organic loads will harbour high number of crustaceans and arthropods. The less
polluted waters will have more of cladocerans and rotifers
Benthos: Benthic fauna inhabiting the coastal water bodies have importance in the context of
assessing the brackish water and estuarine production. The estuarine bottom and the extensive
mudflats with their diverse littoral mangrove swamps are known to contribute significantly to
the total productivity by harbouring a great variety of organisms, by producing a large amount
of detritus and providing food to demersal fishery. Hence any alteration in benthic community
would affect the productivity and the demersal fishery.
Methodology Adopted for the Aquatic Ecological Studies
This aquatic ecology study was carried out in different water bodies such as the Bhogawati
river, Balganga River, Hetavne dam within the study area. Ponds present in the study area were
not sampled as they had almost dried up.Three sampling locations were selected for analyzing
different parameters of water as required for aquatic ecology survey. The aquatic ecology
survey was carried out along with the terrestrial ecology survey.
Two water samples for plankton study were collected from each lentic ecosystem. The samples
were collected 0.3 m from surface of the water. The details of the sampling locations are
presented in Table 3-26
Table 3-26 : Details of aquatic sampling locations
Code Name of Sampling Location Distance w.r.t
Project Site (Km)
Direction
AE-1 Hetwane Dam 5 Downstream
AE-2 Balganga 1.3 Downstream
AE-3 Bhogeshwari 1.7 Downstream
The samples were collected in one-liter capacity polyethylene cans and the samples were fixed
with 4% buffered formaline solution. For the measurement of frequencies of various forms of
phyto-plankton and zoo-plankton, one drop of the sedimented plankton was mounted on a
microslide and as many as 10 different microscope fields situated at more or less even distances

Final EIA Report – Orange Smart City, Pen, Raigad July 2018
216
BE/EIA-OSC/002
from each other were examined (Lackey Method, 17th edition, APHA, AWWA 1992). The
plankton forms were identified upto species level and Shannon Weaver’s index was calculated.
Shannon Wiener s Diversity Index
Diversity of plankton depends on physico-chemical characteristics of water especially on
trophic levels in oligotrophic waters. With increasing levels of pollution such as mesotrophic
or eutrophic conditions, diversity of plankton decreases. Shannon-weaver’s index is a measure
of diversity of plankton, which takes into account the total and important species count in a
water sample. It should be noted that diversity is also susceptible to other parameters such as
turbidity, colour and nutrients. A widely accepted ecological concept is that community with
larger number of species i.e with high diversity that can resist adverse environmental factors.
The maximum value of Shannon weaver index of phytoplankton for clear water has been
reported to be 6 though it may differ slightly in different locations. Decrease in the value index
may thus be taken as indicator of pollution. The Shannon weavers index values there and above
for zooplankton generally considered as indicator of healthy conditions of water bodies. The
values between 1 and 3 and less than one are believed to be for mild and highly polluted
conditions respectively.
Table 3-27 : List of fresh water plaktonic flora and fauna from the study area
Freshwater Phytoplankton Freshwater Zooplankton
Gyrosigma sp Keratella monospina
Achananthes affinis Brachirous caudatus
Gyrosigma accuminatus Asplancha brighwell
Pandorina sp Colpidium colpoda
Ankistrodesmus falcatus Daphnia sp
Pediastrum boryanum Ceriodaphnia reticulate
Scenedesmus bijuga Mesocyclops leuckarti
Melosira granulate Mesocyclops hyalinus
Cyclotella meneghiana Coleps hirsutus
Microcystis sp Arcella sp
Navicula gracilis Actinophyros sp
Nitzschia gracilis Asplancha sp
Chroococcus minutes Ceriodaphnia sp
Spirulina princepes Mesocyclops sp

Final EIA Report – Orange Smart City, Pen, Raigad July 2018
217
BE/EIA-OSC/002
Freshwater Phytoplankton Freshwater Zooplankton
Pinnularia braunii -
Synedra tabulate -
Ophora sp -
Cymbella sp -
Navicula radiosa -
Table 3-28 : Shannon Weaver’s Diversity Index of Plankton
Sampling Location Phyto-Plankton Zoo-Plankton
Bhogavati River 2.68 2.25
Balganga River 2.54 2.37
Hetavne dam 276 2.31
Observations and Discussion of Aquatic Ecosystem
Phytoplankton & Zooplankton
Dominance of chlorophyceae followed by bacillariophyceae was observed at sampling location
(AE-1 & AE-2) and rest was dominated by chlorophycean and cyanophycean members.
Cladoceran members were dominant at sampling location (AE-1) and rotifers were dominant
at sampling location (AE-3).
The results of phyto and zooplanktons are presented in
Table 3-29. It may be observed from the
Table 3-29 that the population of phytoplankton and zooplankton is satisfactory in both the
both the rivers and the Hetavne dam. The moderately high value of algal biomass and
chlorophyll indicates that the river water is favorable for the growth aquatic species. occurence
of higher amount of macrophytes (aquatic plants and algae), which is related to the primary
production of organic carbon in rivers shows these ecosystems to be conducive for the normal
growth and population of aquatic animals.
Occurrence of Osciplaria sp., Euglena sp.and Paramecium sp.etc.in the Bhogavati River
indicates presence of bio degradable matter, which acts as food for fishes in in this River
aquatic eco-system.
Systematic ecological monitoring of population dynamics and composition of relevant parts of
the water bodies was carried out to generate the baseline data. The Shannon weaver’s index for

Final EIA Report – Orange Smart City, Pen, Raigad July 2018
218
BE/EIA-OSC/002
phytoplankton varies in between 2.68 to 2.76 and the same for zooplankton varies in between
2.45 to 2.37 indicating that these water bodies were enriched with nutrients and free from any
sort of anthropogenic pollution loads.
The species diversity index value for the phytoplankton and zooplankton in the studied water
bodies indicates that the system is moderately favorable for the growth of phytoplankton and
zooplankton community. The value of chlorophyll also supports the presence of observed
population of aquatic community.
Therefore, the values of phyto and zooplankton community in these three water bodies are
almost satisfactory in terms of taxonomic diversity. The obtained value of different parameters
indicates that the existence of balanced eco system in the rivers and dam water for
phytoplankton and zooplankton community.
Marine Plankton & Benthos Study
The marine biodiversity studies conducted during post-monsoon season i.e Jan 2016.
a) Sampling procedure:
Polyethylene bucket and Niskin sampler respectively, were used for sampling surface and
bottom waters for the estimation of phytoplankton pigments and population. Sample for
phytoplankton cell count was fixed in Lugol’s iodine and a few drops of 3% buffered
formaldehyde.
Zooplankton were collected by oblique hauls using a Heron Tranter net (Mesh size 0.33 mm,
mouth area 0.25 m2 ) with an attached calibrated digital flow meter (General Oceanic). All
collections were of 5 min duration. Samples were preserved in 5% buffered formaldehyde.
Sediment samples for macro benthos were collected using a van-Veen grab of 0.04 m2 area.
Intertidal collections between the HTL and the LTL were done with quadrants. Samples were
preserved in 5% buffered formaldehyde - Rose Bengal.
b) Methods of analysis:
i) Phytoplankton:
The cells in the sample preserved with Lugol’s solution were allowed to settle and transferred
into a Sedgwick Rafter slide. Enumeration and identification of phytoplankton were done
under a microscope.
ii) Zooplankton:
Volume (biomass) was obtained by displacement method. A portion of the sample (25-50%)
was analysed under a microscope for faunal composition and population count.
iii) Macrobenthos:
Sediment was sieved through a 0.5 mm mesh sieve and animals retained were preserved in
5% buffered Rose Bengal formaldehyde. Total population was estimated as number of
animals in 1 m2 area and biomass was determined on wet weight basis (g/m2).

Final EIA Report – Orange Smart City, Pen, Raigad July 2018
219
BE/EIA-OSC/002
Table 3-29 : Marine Plankton species recorded from the study area
Phytoplankton
Group
Marine
Phytoplankton
Zooplankton
Group
Marine Zooplankton
Diatoms Gyrosigma sp Copepods Canthocalanus sp.
Asterionella sp. Eucalanus sp.
Bacillaria sp. Bestiolina sp.
Odontella sinensis Acrocalanus sp.
Odontella sp. Paracalanus sp.
Chaetoceros affinis Euchaeta sp.
Chaetoceros sp. Centropages sp.
Coscinodiscus
centralis Temora sp.
Coscinodiscus gigas Candacia sp.
Coscinodiscus
radiatus Labidocera sp.
Cyclotella striata Pontella sp.
Ditylum sp. Acartia sp.
Gyrosigma sp. Oithona sp.
Navicula henneydii Corycaeus sp.
Navicula sp. Heliodiaptomus sp.
Netrium digitus
Pseudodiaptomus sp. Pleurosigma
angulatum
Rhizosolenia robusta Decapods Acetes sp.
Rhizosolenia sp. Lucifer hanseni
Skeletonema Zoea larvae

Final EIA Report – Orange Smart City, Pen, Raigad July 2018
220
BE/EIA-OSC/002
Table 3-30 : Benthic species recorded from the study area
Mieobenthic
Group Macrobenthic Group Macrobenthos Species
Nematodes
Bivalves
Glucocom acerca
Copepods Brachyodontes sp.
Polychaetes Katelysia marmorata
Turbellarians Cardium asiaticum
Thalassiosira subtilis Megalopa larvae
Planktoniella sp. Branchopoda Evadne tergestina
Triceratium favus Hydroids/Medusae Globigerina bulloides
Dinoflagellates Amphisolenia
bidentata Globigerina sp.
Ceratium furca Eirene viridula
Ceratium sp. Spirotrichea Tintinnopsis butschi
Ceratium macroceros Tintinnopsis mortensenii
Dinophysis sp. Appendicularia Oikopleura dioica
Noctiluca scintillans Sagittoidea
Pyrophacus sp. Sagitta elegans
Blue-green
alagae
Anabena sp. Sagitta bedoti
Microcystis sp. Mongononta Brachionus plicatilis
Nostac sp. Brachionus calyciflorus
OSCIPLlatoria sp. Monostyla lunaris
Spirulina major - -
Chlorella sp. - -
Spirogyra sp. - -
Volvox sp. - -

Final EIA Report – Orange Smart City, Pen, Raigad July 2018
221
BE/EIA-OSC/002
Mieobenthic
Group Macrobenthic Group Macrobenthos Species
Nemertins Katelysia opima
Foraminifera Dosinia sp.
Kinorynchs
Cnidarian Pelocoetes sp. Halacarids
Others Stephensonactis sp.
-- Cerianthids
Crustaceans
Sesarma sp.
Varuna sp.
Uca sp
Hermit carb
Uca annulipes
Polychaetes
Lycastis sp.
Nereis sp.
Dendronereis sp.
Glycera alba
Prinospio pinnata
Perinereis cultrifera
Gastropods
Cerethedea sp.
Melampus sp.
Onchidium sp.
Nassarius sp.
Auricula sp.
Littorina sp.

Final EIA Report – Orange Smart City, Pen, Raigad July 2018
222
BE/EIA-OSC/002
Fishes
The data for fishes in the study area was collected through actual visits to the mudflats,
mangroves, surveys of local fishes in the nearby markets, observations from the fish catch by
locals’ fishermen in the vicinity of water bodies. The list of the fishes in the study area is given
in Table 3-31.
Table 3-31 : List of the fishes in the study area
Sr.
No. Scientific Name Local Name
Freshwater Fishes
1 Catla catla catfish
2 Channa striatus
3 Clarius batrachus
4 Mystsus singhala
5 Labeo bata
6 Puntius sarana
7 Wallago atta
Marine/Estuarine Fishes
8 Mugil Cephalus Mullet
9 Boleopthalmus dussimerii Mudskipper
10 Boleopthalmus boddarti
Decapods
(Prawns/Shrimps)
11 Penaeus monodon
12 Squilla mantis
13 Metapeneaus affinis
14 Acetes indicus
15 Panularius polyphagus

Final EIA Report – Orange Smart City, Pen, Raigad July 2018
223
BE/EIA-OSC/002
Crabs
16 Uca sps.
17 Scylla serrata
18 Leptodius exaratus
19 Portunus spp.
21 Charybdis sp.
3.11.9 Conclusions
The project area is outside any recorded forest area. In the project site, no formal logging of
wood and other such activities were observed, the exploitation of the forest resources by the
nearby villagers and the local communities was evident in the surroundings of the project site.
The marks of forests fire were also visible near two locations viz. Chirner and Palas village.
Flora
By and large the habitat is dominated by evergreen and deciduous foliage. Amongst the
locations surveyed, it was seen that many of the sites have localized biological diversity with
a great variety of evergreen tree species as well as shrub layer.The development activities may
result in clearing of many plant species mostly grasses and shrubs which are not unique or rare
species because of their abundant occurrence in other areas. Thus, the loss of these species
would have no serious ecological consequences.
Fauna
The project area could be home to general avifaunal species which are widespread and therefore
any loss of habitat in this area is not expected to lead to any major loss in species numbers or
diversity. Generally the concerns of non- recorded species do exist although it may be on
smaller scale owing to their non-sighting in the three day sampling period between Dec 16-18,
2015.
3.12 Socio-Economy
The proposed “OSC” Project by M/S. OSCIPL is located in Raigad District of the state of
Maharashtra. The project shall occupy more than 1000 acres land and is planned to develop the
Township in four patches namely T1 covering the villages Boregaon, Ambeghar, Shene &
Virani, T2 & T4 by villages Belawade Budruk, Belawade Khurd, Padale, Walak & Mugoshi
and T3 by Govirle, Kopar, Ambiwali, Balawali & Hamrapur villages in Pen (Tehsil) of Raigad
District, Maharashtra. The following section describes the socio-economic baseline of the
Project site and its surrounding area. For this purpose, 25 urban areas, 247 rural villages and
14 project affected villages were studied.

Final EIA Report – Orange Smart City, Pen, Raigad July 2018
224
BE/EIA-OSC/002
3.12.1 Methodology
Socio-Economic baseline data was collected through primary survey as well as secondary
sources. Primary survey involved visiting project site, discussion with the local population
including project affected, local elected representatives such as panchayats and local
administrative units of government. Secondary data collection involved collecting existing
Census data, published documents on various aspects such as land use, demography, literacy,
employment, social structure of society, and socio-cultural aspects from different institutions,
government offices, literature etc. and discussions with the concerned departments/agencies.
Raigad District
Raigad is located in the Konkan region bound by Mumbai Harbor to the northwest, Thane
District to the north, Pune District to the east, Ratnagiri district to the south, and the Arabian
Sea to the west. It includes the large natural harbor of Pen-Mandwa, which is immediately
south of Mumbai harbor, forming a single landform with it. The northern part of the district is
included in the planned metropolis of Navi Mumbai, and its port, the Jawaharlal Nehru Port.
The district includes towns/cities of Panvel, Alibag, Mangaon, Roha, Pen, Khopoli, Kharghar,
Taloja, Khalapur, Uran, Patalganga, Rasayani, Nagothana, Poladpur, Alibag, Karjat and
Mahad. The largest city both in area and population is Panvel. The district also includes the
isle of Gharapuri or Elephanta, located in Uran which has ancient Hindu and Buddhist caves.
Comparative data for population, sex ratio & Literacy rates in Affected Villages, Pen Tehsil,
Raigad District and entire Maharashtra State is given in the Table 3-32.
Table 3-32: Comparative data for population, sex ratio, & Literacy rates in affected villages
Demographic features Affected Villages
(14 no.)
Pen Raigad Maharashtra state
Total Population 11,187 37,852 2,634,200 11.24 crores
Sex Ratio Per 1000 males 493 966 955 929
Literacy rate 63.53% 91.40% 83.89% 82.34%
3.12.2 Socio-Economic Profile – Secondary Data
As per the EIA notification 2006, socio-economic impact can be seen on villages and urban
centers lying within the 15-km radius of the project area. For the purpose of this assessment,
the study area has been divided into following:
➢ Villages within the 15-km radius of the project area: 247 rural villages &25 urban areas
➢ Villages within project site on the basis of willing seller willing buyer basis: 14 villages
➢ Total study area covering 285 villages
The names of the villages within the project study area and their categorization are given in the
Table 3-33 below:

Final EIA Report – Orange Smart City, Pen, Raigad July 2018
225
BE/EIA-OSC/002
Table 3-33: Names of the villages and categorization
Category Name of village Type
of
village
Villages
within
project site
Virani, Mungoshi, Boregaon, Ambeghar, Shene, Belwade Khurd,
Belvade Budruk, Walak, Padale, Hamrapur, Balawali, Govirle,
Ambiwali .and Kopar
Rural
Villages
within 15
km of the
project area
Sonkhar, Sawarsai, Sapoli, Pimpalgaon, Dhamni, Uchede,
Odhangi, Johe, Kalave, MotheVadhav, Kane, Borze, Dhondpada,
Antore, Washi, Jirne Kurnad, MahalmiryaDongar, Nidhavali,
Shitole, Chinchghar, Davansar, Ramraj, Kandlepada, Kashmire,
Kandale, Meleghar, Tarankhop, Pen Rural, Patnoli, Urnilee,
KharDutarfaBorli, Jite, Dushmi, Koproli, Panchgani, Kurnad,
Karav, Rode, Kurmurli, Nanegaon, Hetavane, Ashte, Warsai,
Tarankhop, Mangrul, MohiliKhalsa, Sai, Kasar Bhat, Dolghar,
Padale, Niphad, Balawali, KharBorli, Kopar, Davre,
Hanumanpada, Warawane, Paned, Gagode Bk, Washiwali, Gagode
Khurd, Umbarde, Turkhul, Waredi KharBorli, Kopar, Davre,
Hanumanpada, Warawane, Paned, Gagode Bk, Washiwali, Gagode
Khurd, Umbarde, Turkhul, Waredi Jui Khurd, Meleghar, Kalad
Kharpale, Odhangi, Koproli, Davansar Shetpalas, Koleti,
Kondgaon, Karli, Warap, Talekhar, Kalai, Chole, Gandhe,
KharOvali, KharKoleti, Tarshet, JambhulTep., Atiwali, Amtem,
Benase, Bidwagale, Kasurghuntwadi, PataniPandapur, Dhaulpada,
Burdi, Kasu, Salinde, Mhaisbad, Kharpada, Usar, Nigade,
Kasurghuntwadi, Dhaulpada, Revoli, Pabal, Kondhavi, Uddhar,
Chandragaon, Mahagaon, Tadegaon, Padsare, Kavele, Palas,
Dhamni,Hatond,Wakrul,Aghai, JambhivalitarChhattishi,
Gothivali, Gorthan BK.,Wanvate, Gorthan Khurd, Ransai, Tondali,
Uaroli, Dhamni, Nandanpada, Narangi, Swali, Kharivali,Gohe,
Karambeli, Apati, Ajivali(N.V.), Horale, Parkhande, Vavoshi,
Mohinlam, Ghote, AmbivaliT. Wankhal,Wadgaon,Talavali,
Isambe,Vayal,Vat , Kaire, Borivali, Vanivali, Kambe, Kasap,
Lodivali, Chambharli, Parade, Gulsunde, Karade Khurd, Posari,
Dapiwali,Vaveghar,Turade, Nanoshi, Kalhe, Karnala,Barapada,
Kasar Bhat, Dolghar, Koral, Sarsai, Kaliwali , Chawane ,
KauliBelodakhar, Jambhivali, Veshvi, Belondakhar, Chirle,
Paundkhar, Dhutum, Muthekar, Shematikhar, Waltikhar, Dighode,
Kanthavali, Pohi, Ransai, Vindhane, Taki, HArishchandraPimpale,
Bori Bk., BorichaKotha, Dhasakhosi, Jui, chikhalibhom, Bhom,
Chirner, Kalamusare, Pirkon, Waltikhar, Muthekhar,
Sangapalekhar, Govathane, Pale, Sarde, Vasheni,
Punade,MotheBhal,Vitthalwadi, Kanhoba, Kaleshriwadi, Lakhola,
Benavale, Bahiramwatak, Narwel, Wadhav, Div, Umbarde, Shirki,
ShirkiChawl No.1, Masad Bk, MasadBeli (N.V.) , MasadKhurd,
Borwe, Urnilee, KharDutarfaBorli, DolviDababa, Johe,
Tambadshet, Govirle, Nidhavali, Jawali, Karodi, Dherand,
Rural

Final EIA Report – Orange Smart City, Pen, Raigad July 2018
226
BE/EIA-OSC/002
Category Name of village Type
of
village
Shahapur, Ramkotha, Bahirichapada, Beneghat, Sarebhag, Kurdus,
Hemnagar, Kolghar, DalaviKharoshi, Ravet, Shihu, Poynad,
Chikhali
Urban
villages
within 15
km of
project area
Dadar (CT)
Dadar (CT) WARD NO.-0001
Mohpada Alias Wasambe (CT)
Mohpada Alias Wasambe (CT) WARD NO.-0001
Zotirpada (CT), Zotirpada (CT) WARD NO.-0001
Pen (M Cl), Pen (M Cl) WARD NO.-0001 to 0018
Urban
Source: Census of India; 2011
Table 3-34: Demographic details of the study area
Project Study Area
Number of
Households
(HHs)
Number
of HHs
%
Total
Population
Total
population
%
Population
in the age
group 0-6
% of
population
in the age
group 0-6
%
Demographic details of
villages affected by land
purchase
2544 3 11187 3 1370 3
Demographic details of
Villages within the study
area (minus the affected
villages)
54863 65 241080 66 27629 67
Demographic details of
Urban areas within the
study area
26938 32 112648 31 12098 29
Demographic details of
Total Study Area 84345 100 364915 100 41097 100
Source: Census 2011
According to the 2011 Census data, population in the total study area was 364915 living in
84345 households project site was whereas the affected villages population was 11187 persons
that is about 3% of the total study area population and the population of all the rural villages
within the 15 km radius of the study area (Refer Table 3-34: Demographic details of the study
area).

Final EIA Report – Orange Smart City, Pen, Raigad July 2018
227
BE/EIA-OSC/002
Social Groups
The proportion of Scheduled Castes (SCs) and Scheduled Tribes (STs) population within the
project study area is on an average 3.0% and 15.3% respectively. The proportion of SC
population in affected villages is merely 0.8% found only in 14 villages, which is less than
other rural villages (2.2%) and urban centers (4.9%) in the study area. Whereas the proportions
of ST population for affected villages is (43.9%), which together constitutes to 44.7% which is
much higher than the other rural villages (21.9%) & urban areas (18.3%) (Refer Table 3-35:
SC and ST populations in the Project Study Area).
Table 3-35: SC and ST populations in the Project Study Area
SC and ST populations in Project Study Area Proportion of SC
population %
Proportion of ST
population %
SC and ST population in villages affected by land
purchase
93 (0.8%) 4906 (43.9%)
SC and ST population in Villages within the study
area (minus the affected villages)
5310 (2.2%) 47441(19.7%)
SC and ST population in Urban areas within the
study area
5540 (4.9%) 3314 (2.9%)
SC and ST population in Total Study Area 10943 (3.0%) 95661 (15.3%)
Source: Census 2011
Gender
Table 3-36: Sex Ratio and Literacy rate in the Project Study Area
Sex Ratio and Literacy rate in Project Study
Area
Sex Ratio
per 1000
male
Literacy
Rate %
(Male)
Literacy
Rate %
(Female)
Sex Ratio and Literacy rate in villages
affected by land purchase
972 57% 43
Sex Ratio and Literacy rate in Villages
within the study area (minus the affected
villages)
957 56% 44
Sex Ratio and Literacy rate in Urban areas
within the study area
943 53% 47
Sex Ratio and Literacy rate in Total Study
Area
953 55% 45
Source: Census 2011
According to 2011 census, sex ratio in the total study area was found to be 953 while in the
affected villages was found to be 972. The sex ratio in the villages other than the affected
villages was found to be 957. It is important to note that, literacy rate for male and female in
project affected villages is 57% and 43% respectively which indicates that the literate male
population is more than the female literate population. (Refer Table 3-36: Sex Ratio and
Literacy rate in the Project Study Area).

Final EIA Report – Orange Smart City, Pen, Raigad July 2018
228
BE/EIA-OSC/002
Vulnerability
As regards vulnerability, poverty is actually a reason for making any section of a population
vulnerable. The data for families below poverty line for the all the villages in study area is not
available. However, based on the studies in other areas of Maharashtra, most of the SC and ST
families can be considered as the vulnerable group which constitutes about 45% of the total
population in the project affected villages in addition to any other BPL families in the region.
Occupational Pattern
Table 3-37: Workforce participation Ratio (WPR) in the Project Study Area
Workforce
participation in Project
Study Area
Total
WPR %
Male
WPR%
Female
WPR %
Main
Workers
Marginal
Workers
Non-
Workers
Workforce
participation in
villages affected by
project
48% 69% 31% 3478 1840 5869
Workforce
participation in
Villages within the
study area (minus the
affected villages)
43% 73% 27% 73892 29382 137806
Workforce
participation in Urban
areas within the study
area
35% 79% 21% 34740 5142 72766
Workforce
participation in Total
Study Area
41% 76% 24% 112110 36364 216441
Source: Census 2011
It can be seen from Table 3-37: Workforce participation Ratio (WPR) in the Project Study Area
that the workforce participation ratio (WPR) in the study area as a whole is about 41%, and the
same for project affected villages is 43%. Of the total WPR, the female workforce participation
ratio is 24% and the same for project affected villages is 31% and other rural villages is 27%.
The higher participation of female in project affected villages and other villages in the study
area is the reflection of role of women in household’s economic contribution. Higher
participation of women in economic contribution in rural areas is mainly due to their
involvement in agriculture and other activities such as dairy, wage labors, etc. The data also
reveals that the female participation ratio in workforce in urban areas of study area is only 21%,
which is lower than the rural areas of the study area.

Final EIA Report – Orange Smart City, Pen, Raigad July 2018
229
BE/EIA-OSC/002
Table 3-38: Occupational profile of the villages in the Project Study Area
Occupational profile of the main
workers in Project Study Area
% of Male &
Female as, Main
Workers
Occupation Type (%)
Male Female Cultivator
Agri.
Laborers
HH
industry Others
Occupational profile of the Main
Workers in villages affected by land
purchase
69 31 19 45 4 32
Occupational profile of the main
workers in Villages within the study
area (minus the affected villages)
73 23 30 21 3 46
Occupational profile of the Main
workers in Urban areas within the
study area
79 21 1 1 5 93
Occupational profile of the main
workers in Total Study Area 74 26 21 16 3 60
Occupational profile of the
marginal workers in Project
Study Area
% of Male &
Female as
Marginal
Workers
Occupation Type (%)
Male Female Cultivator Agro.
Laborers
HH
industry
Others
Occupational profile of the
marginal workers in villages
affected by land purchase
49 51 13 73 2 12
Occupational profile of the
marginal workers in Villages within the study area (minus the affected
villages)
53 47 24 44 6 26
Occupational profile of the
marginal workers in Urban areas
within the study area
68 32 2 20 6 72
Occupational profile of the
marginal workers in Total Study
Area
55 45 21 42 6 31
Source: Census 2011
From the Table 3-38 it is observed that in case of Main Workers, the contribution of females
is low compared to the males which is about 2-3 times high as main workers in the overall
study area. Nevertheless, the contribution of females as main workers is much higher and that
of males in the project affected areas than the other rural villages & urban areas. The main
occupation type of the main workers in the project affected villages is Agro-laborers (45%)
followed by Others (32%) and HH industry (4%) as the least but in the other rural villages, the
main occupation type is Cultivators with a similar trend as others & HH industry. Similarly, in
case of Marginal Workers also the contribution of females is low compared to the males in the
overall study area but the contribution of females as marginal workers also is much higher and
that of males in the project affected areas than the other rural villages & urban areas.

Final EIA Report – Orange Smart City, Pen, Raigad July 2018
230
BE/EIA-OSC/002
The main occupation type of the marginal workers in the overall study area is agro-laborers
followed by Cultivators with the highest percentage (73%) of Agro-laborers in the project
affected villages and Cultivators in the other rural villages.
3.12.3 Socio-Economic Profile – Primary Data
Socio-Economic survey was conducted in all the villages affected by land purchase for the
project. In all 2544 households (Sample size) were surveyed and the village wise sample size
is shown in Table 3-39. Out of the total surveyed population, about 47% or 1653 did not
respond to the survey questions.
Family size
The respondents, 47% or 1653 people did not respond to the questions and the highest number
of families (31%) which responded to the survey consisted of 3 to 5-person size and 14% of
families were with 6 to 9-person size and only 8% of the families comprised of 2 persons.
Table 3-39: Family Size of Surveyed Respondents
Name of
village Sample size
% of
Sample
size
Not
respon
ders
(NR)
%
NR
Family Size
2 % 3 to 5 % 6 to 9 %
Virani 143 5.6 44 3 27 13.8 54 6.9 18 6
Mungoshi 105 4.1 5 0 16 8.2 55 7.0 29 9
Boregaon 248 9.7 147 9 15 7.7 64 8.1 22 7
Ambeghar 427 16.8 327 20 18 9.2 60 7.6 22 7
Shene 236 9.3 136 8 16 8.2 51 6.5 33 10
Belwade
Khurd 24 0.9 77 5 12 6.1 77 9.8 12 4
Belvade
Budruk 304 11.9 205 12 21 10.7 52 6.6 26 8
Walak 52 2.0 50 3 12 6.1 60 7.6 30 9
Padale 59 2.3 41 2 9 4.6 58 7.4 33 10
Hamrapur 418 16.4 317 19 14 7.1 64 8.1 23 7
Balawali 346 13.6 246 15 16 8.2 65 8.3 19 6
Govirle 62 2.4 38 2 12 6.1 61 7.8 27 8
Ambiwali 120 4.7 20 1 8 4.1 66 8.4 26 8
Kopar
Total 2544 100.0 1653 100 196 100 787 100 320 100
100% 47% 8% 31% 14%
Source: Primary Survey
Social Groups
Social group classification of respondents reflects all strata and groups in the collected data. In
the affected villages, the lowest percentage is of the SC group which is only 0.8% of the total
population compared to the General and OBC together which is 55.3% and 43.9% of ST
category (Refer Table 3-40: Social classification of respondents).
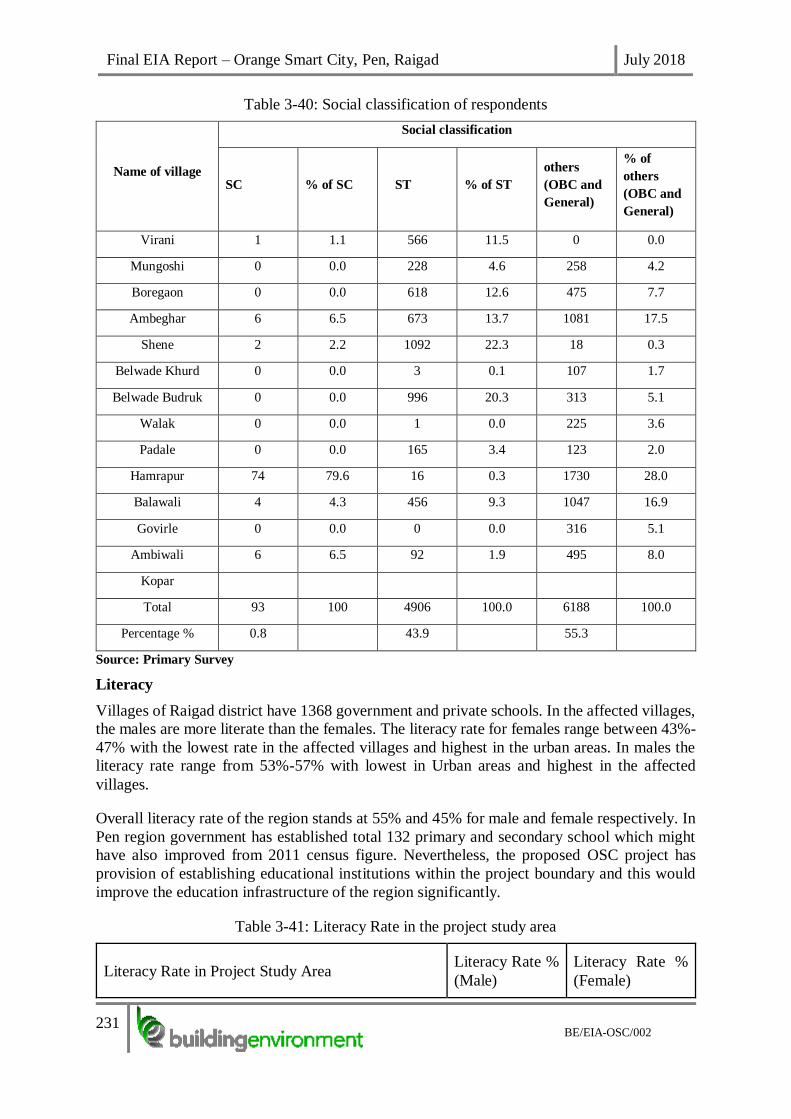
Final EIA Report – Orange Smart City, Pen, Raigad July 2018
231
BE/EIA-OSC/002
Table 3-40: Social classification of respondents
Name of village
Social classification
SC % of SC ST % of ST
others
(OBC and
General)
% of
others
(OBC and
General)
Virani 1 1.1 566 11.5 0 0.0
Mungoshi 0 0.0 228 4.6 258 4.2
Boregaon 0 0.0 618 12.6 475 7.7
Ambeghar 6 6.5 673 13.7 1081 17.5
Shene 2 2.2 1092 22.3 18 0.3
Belwade Khurd 0 0.0 3 0.1 107 1.7
Belwade Budruk 0 0.0 996 20.3 313 5.1
Walak 0 0.0 1 0.0 225 3.6
Padale 0 0.0 165 3.4 123 2.0
Hamrapur 74 79.6 16 0.3 1730 28.0
Balawali 4 4.3 456 9.3 1047 16.9
Govirle 0 0.0 0 0.0 316 5.1
Ambiwali 6 6.5 92 1.9 495 8.0
Kopar
Total 93 100 4906 100.0 6188 100.0
Percentage % 0.8 43.9 55.3
Source: Primary Survey
Literacy
Villages of Raigad district have 1368 government and private schools. In the affected villages,
the males are more literate than the females. The literacy rate for females range between 43%-
47% with the lowest rate in the affected villages and highest in the urban areas. In males the
literacy rate range from 53%-57% with lowest in Urban areas and highest in the affected
villages.
Overall literacy rate of the region stands at 55% and 45% for male and female respectively. In
Pen region government has established total 132 primary and secondary school which might
have also improved from 2011 census figure. Nevertheless, the proposed OSC project has
provision of establishing educational institutions within the project boundary and this would
improve the education infrastructure of the region significantly.
Table 3-41: Literacy Rate in the project study area
Literacy Rate in Project Study Area Literacy Rate %
(Male)
Literacy Rate %
(Female)

Final EIA Report – Orange Smart City, Pen, Raigad July 2018
232
BE/EIA-OSC/002
Literacy Rate in villages affected by land purchase 57% 43%
Literacy Rate in Villages within the study area
(minus the affected villages) 56% 44%
Literacy Rate in Urban areas within the study area 53% 47%
Literacy Rate in Total Study Area 55% 45%
Table 3-42: Distribution of primary schools by management
Distribution of primary school by management No.
Government and Government Aided Schools 5
District School Board 1,283
Municipal School Board --
Schools Aided by- --
(1) District School Board 75
(2) Municipal School Board --
Unaided Schools 5
Total 1,368
Source: Kulaba Gazetteer Department
Income
In the project affected villages, the average monthly income based on the respondent data, of
the families range from rupees 3000 or less per month to more than 20,000 per month. The
highest percentage (56.3%) of surveyed families earned up to rupees 3000 or less per month
and only about 1.4% of the families earn rupees more than 20000 income per month. Another
19.7% of families are earning between rupees 3001 to 5000 per month. The rupees 3000 or less
& 3001 to 5000 per month categories of families put together constitutes 76.0% of total sample
size and, thus revealing that the families in general are poor or marginally above poverty level
and the OSC project in these villages would create opportunities for betterment.
Table 3-43: Average monthly income of families
Name of village
Monthly Family Income in Rs.
NA
3000 or
less
3001 to
5000
5001 to
10000
10001 to
20000 >20001
Virani 1 8 2
1
Mungoshi 1 7 2
1

Final EIA Report – Orange Smart City, Pen, Raigad July 2018
233
BE/EIA-OSC/002
Boregaon 1 6 3 1
Ambeghar 1 9 4 1 2
Shene 1 6 2
1
BelwadeKhurd 3 4
Belwade Budruk 1 7 3 1
Walak 4 3 1
Padale 2 4 1
Hamrapur 1 9 4 1 2
Balawali 1 8 3 1
Govirle 2 4 1
Ambiwali 2 5 2
1
Kopar
Total 21 80 28 5 6 2
14.7% 56.3% 19.7% 3.5% 4.2% 1.4%
Source: Primary source
Occupation
The data in the Table 3-44 below depicts that 33.9% of respondents in the affected villages are
engaged in farming as their primary occupation for livelihood. This is somewhat in line with
the census data of 2011 where in 21% of the main workers are engaged as cultivators.
Occupation like business and other work (jobs and professionals) constitutes 13.7% of total
surveyed population.
Table 3-44: Primary Occupation of Families
Name of village
Primary occupation of HoH
NA Farming Business Other
work
House
wife
Wirani 114 237 0 21 195
Mungoshi 101 217 1 78 89
Boregaon 216 458 3 88 328
Ambeghar 319 499 60 357 525
Shene 243 452 9 94 314
Belwade Khurd 24 32 0 16 38
Belwade Budruk 270 760 0 29 250
Walak 45 110 3 16 52
Padale 71 144 0 5 68
Hamrapur 447 189 61 402 721

Final EIA Report – Orange Smart City, Pen, Raigad July 2018
234
BE/EIA-OSC/002
Name of village
Primary occupation of HoH
NA Farming Business Other
work
House
wife
Balawali 318 584 24 84 497
Govirle 77 22 14 58 145
Ambiwali 132 86 10 95 270
Kopar
total no. affected of villages
affected
2377 3790 185 1343 3492
21.2% 33.9% 1.7% 12.0% 31.2%
Source: Census 2011
3.12.4 Asset ownership
Ownership of various asset class at household level gives an insight into the economic
wellbeing of the family and a general affluence level of the area. Therefore, the asset base of
the respondent households was also surveyed. The asset ownership information has been
collected for electronic appliances like television, refrigerator etc. and vehicles owned. Of the
total assets, the electronic appliances contribute to 87% and about 13% was from vehicles.
Among the electronics, 38% is from the Television and about 28% is from Telephone/Mobiles.
In terms of vehicles, about 11.55 was from Scooter/motorcycle and Car/Van/Jeep is only 1.3%.
Overall, of all the assets refrigerator was lowest with only 1.1% (Refer Table 3-45).

Final EIA Report – Orange Smart City, Pen, Raigad July 2018
235
BE/EIA-OSC/002
Table 3-45: Asset ownership
Assets
ownership
in surveyed
HH
Name of village (insert Kopar village)
Virani Mungoshi Boregaon Ambeghar Shene Belwade
Khurd
Belwade
Budruk Walak Padale Hamrapur Balawali Govirle Ambiwali Total %
Radio/
Transistor 24 22 9 11 8 43 0 4 100 13 5 2 14 255 16.2
Television 6 36 36 44 24 65 16 33 100 69 45 84 50 608 38.5
Computer/
Laptop 1 2 2 5 4 16 1 4 2 5 3 3 2 50 3.2
Telephone/
Mobile
Phone
4 36 26 20 16 54 10 35 82 42 24 53 42 444 28.1
Refrigerator 0 0 1.2 1.7 0 7.7 0 2 0 2.9 0.3 1.6 0 17.4 1.1
Scooter/
Motorcycle 4 16 18 17 3 19 4 14 2 22 10 31 22 182 11.5
Car/
Jeep/Van 0 4 1 3 0 0 0 0 0 2 0 9 2 21 1.3
Total 39 116 93.2 101.7 55 204.7 31 92 286 155.9 87.3 183.6 132 1577.4 100

Final EIA Report – Orange Smart City, Pen, Raigad February 2018
236 ORANGE SMART CITY INFRASTRUCTURE PVT. LTD.
3.12.5 Public Consultation and Discussion
Stakeholder consultations were carried out in the surrounding villages viz., BelawadeKhurd,
Ambeghar, Kopar to appraise the locals about the proposed project and to understand their
expectations and concerns about the project. A survey was carried out in the villages to
supplement the consultation process. The details of discussion are presented in Table 3-46.
Table 3-46: Consultation at Villages
Date of Visit 20/10/2015
Venue : Project Site
Client BEIPL : Mr. Hrushikesh Kolatkar
Client : Representative from Client
Village
Name
Kopar village Belawade village Ambeghar village
Discussion Points:
Key points
of the
meeting
were
The village has school
only for Primary level
and for Middle and high
school students have to
go to Jambhul tep, Pen.
There is no primary
health center facility.
For critical health
related matters, Pen is
the nearest place.
Rain water and Dug-
well are the main
sources of irrigation.
For domestic use, Dug-
well and Hand pumps
are the sources.
Most of the people in
the village are engaged
in agriculture, dairy.
Rice and seasonal
vegetables are
cultivated by the
people. Most of the
seasonal vegetables
grown are sold at Pen
and Navi Mumbai.
Almost each family has
cows or buffaloes to
supplement their
income by selling milk.
There are also people is
The village has a total
of 328 houses
The school in the
village is only up to
eight standards. For
studies after eight,
students have to go to
Pen.
There is a private
clinic of a Physician
in the village. The
nearest government
primary health center
is at Pen village.
Most of the village
land is rain fed for
agriculture purpose.
For the domestic use
well and hand pumps
are the sources.
People of the village
in general are
engaged in
agriculture, dairy and
wage labour. Rice
and seasonal
vegetables are
cultivated by the
people. Seasonal
vegetable grown are
The village Ambeghar has
427 houses. The village
has relatively large
population. It can be seen
that the village is well
connected by road.
The village has
Government school up to
8th standard. For studies
after eight, students have
to go to Pen.
There is a private doctor in
the village. The nearest
government primary
health center is at Pen.
Most of the village land is
irrigated through dug-
wells and tube wells.
For domestic use, dug-
wells and hand pumps are
the sources of water for
villagers.
People of the village in
general are engaged in
agriculture, dairy and
wage labour. Main crops
are paddy and seasonal
vegetables Some families
are dependent on small
vegetable cultivation for

Final EIA Report – Orange Smart City, Pen, Raigad July 2018
237 ORANGE SMART CITY INFRASTRUCTURE PVT. LTD.
engaged in wage labor
in agriculture and
construction activity in
nearby urban areas.
Women in general
support the family by
engaging in agriculture
and dairy activity &
household chores.
sold in nearby urban
areas.
Almost each family
has cows or buffaloes
to supplement their
income.
About half the male
population of village
is engaged in
construction activity
in nearby urban areas.
The education level is
generally low among
the villagers
Women in general
support the family
with household
chores. In addition,
women are also
involved in
agriculture and dairy
activity of family.
lack of any other source of
income.
In addition to agriculture,
the other two main
occupation for earning for
the locals is dairy and
wage labour. Almost each
family has cows or
buffaloes to supplement
their income.
Most of the male
population of villages is
engaged in construction
and factories in Pen as
wage labor.
The education level is
generally low among the
villagers.
Women in general support
the family with household
chores. In addition,
women are also involved
in agriculture and dairy
activity of family.
Key
observations
and issues:
People are aware about
the project and have a
very positive opinion on
the project.
People expect the
project would bring
development in their
villages and would open
up opportunity of
employment and other
business avenues
People were keen to
know when the project
would start and what
kind of factories will
come up.
People also expect the
project to give
preference to local in
employment
Unemployment and
lack of opportunity is
evident in the village.
People are aware
about the project and
have a very positive
opinion on the
project.
People expect the
project would bring
development in their
villages and would
open up opportunity
of employment and
other business
avenues
People were keen to
know when the
project would start
and what kind of
factories will come
up
People also expect
the project to give
preference to local in
employment
People are aware about the
project and have a very
positive opinion on the
project.
People expect the project
would bring development
in their villages and would
open up opportunity of
employment and other
business avenues
People were keen to know
when the project would
start and what kind of
factories will come up
People also expect the
project to give preference
to local in employment
In project construction
phase the locals can be
good source of
construction labour as they
are already in to that
activities currently.

Final EIA Report – Orange Smart City, Pen, Raigad July 2018
238 ORANGE SMART CITY INFRASTRUCTURE PVT. LTD.
With respect to
compensation, people
are somewhat
unhappy about the
amount of
compensation. They
feel that the market
rate is higher than
what they have
received from the
government.
In project
construction phase
the locals can be good
source of
construction labour
as they are already in
to that activities
currently.
There is large scale
unemployment reported
during the survey

Final EIA Report – Orange Smart City, Pen, Raigad July 2018
239 ORANGE SMART CITY INFRASTRUCTURE PVT. LTD.
4. ANTICIPATED ENVIRONMENTAL IMPACTS AND MITIGATION
MEASURES
This chapter describes potential social and environmental impacts for construction and
operation phases of the proposed project in line with the description of project presented in
Chapter 2 of this report. The impact assessment is done in two steps: Identification of Impacts
and Evaluation of Impacts. The impacts have been identified taking into account the nature of
the project and the project components including the trunk infrastructure being proposed, size
and magnitude of the project activities, sub activities, and prevailing baseline environmental
conditions in the study area. In the subsequent stage the evaluation of the impacts has been
carried out with the standard impact assessment matrix. Additionally, available project
documents; discussions with the local community; the project proponents and BEIPL’s
previous project experience in similar assignments is also considered. Based on the significance
of impact, the specific mitigation measures are also suggested with a management plan.
4.1 Identification of Impacts
The impact identification has been presented in the form of interactive matrix between the
various project activities and the environmental attributes. The identification of impacts is done
based on the proposed project components both for construction and operations phase and
various activities involved which may potentially have impacts on the environment. The project
phases, timelines, proposed design, main activities, sub-activities, resource requirements, and
baseline environmental settings are considered in this exercise. The identification of impacts is
done separately for construction and operation phase as presented in the following sections.
4.1.1 Construction Phase
The project activities comprise principally the construction of trunk infrastructure components
such as water supply system, road infrastructure, wastewater management system, solid waste
management system, ICT system, power supply system, storm water management system,
common utility buildings and other ancillary / support infrastructure. The construction phase
will span from 2019-2029. The potential impacts identified for pre-construction and
construction phase of the proposed project is presented in Table 4-1. At the end of construction
phase, there would be some demobilization activities which also are covered in this matrix,
however, since the nature of these activities is similar to the construction phase activities, these
are not considered separately for evaluation of impacts in Section 4.2 of this report.
Table 4-1: Identification of Potential Impacts: Pre-Construction and Construction Phase
S.
N. Main Activities
Potential Impacts
Chan
ge
in l
and u
se
Chan
ge
in T
opogra
phy
Eco
logy
Wat
er Q
ual
ity
(Surf
ace/
gro
und)
Wat
er R
esourc
es
(Surf
ace/
Gro
und)
Am
bie
nt
Air
Qual
ity
Soil
(E
rosi
on,
Conta
min
atio
n)
Nois
e
Soci
o-e
conom
ics
Tra
ffic
&T
ransp
ort
Liv
elih
ood
Occ
upat
ional
Hea
lth &
Saf
ety
A Site Preparation
1 Site Clearing,
Grading √ √ √ √ √ √ √ √ √ √ √
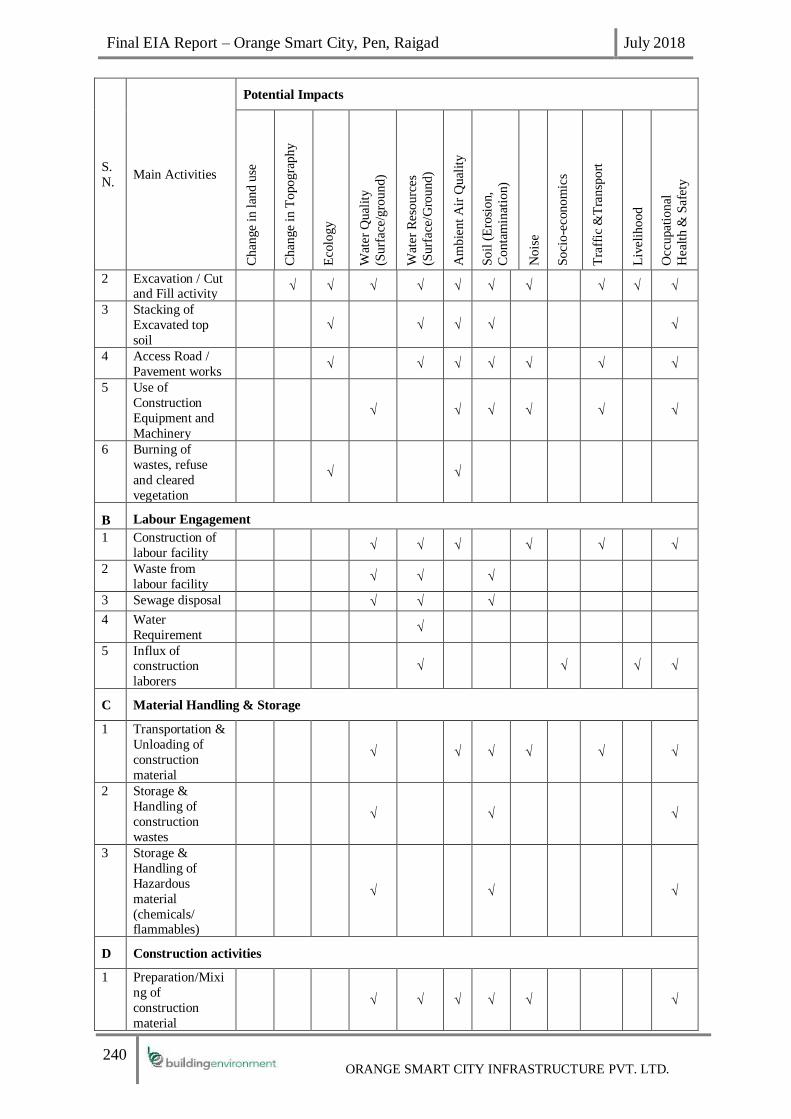
Final EIA Report – Orange Smart City, Pen, Raigad July 2018
240 ORANGE SMART CITY INFRASTRUCTURE PVT. LTD.
S.
N. Main Activities
Potential Impacts
Chan
ge
in l
and u
se
Chan
ge
in T
opogra
phy
Eco
logy
Wat
er Q
ual
ity
(Surf
ace/
gro
und)
Wat
er R
esourc
es
(Surf
ace/
Gro
und)
Am
bie
nt
Air
Qual
ity
Soil
(E
rosi
on,
Conta
min
atio
n)
Nois
e
Soci
o-e
conom
ics
Tra
ffic
&T
ransp
ort
Liv
elih
ood
Occ
upat
ional
Hea
lth &
Saf
ety
2 Excavation / Cut and Fill activity
√ √ √ √ √ √ √ √ √ √
3 Stacking of
Excavated top
soil
√ √ √ √ √
4 Access Road /
Pavement works √ √ √ √ √ √ √
5 Use of
Construction
Equipment and
Machinery
√ √ √ √ √ √
6 Burning of
wastes, refuse
and cleared
vegetation
√ √
B Labour Engagement
1 Construction of
labour facility √ √ √ √ √ √
2 Waste from
labour facility √ √ √
3 Sewage disposal √ √ √
4 Water
Requirement √
5 Influx of construction
laborers
√ √ √ √
C Material Handling & Storage
1 Transportation &
Unloading of
construction
material
√ √ √ √ √ √
2 Storage &
Handling of
construction
wastes
√ √ √
3 Storage &
Handling of
Hazardous
material
(chemicals/ flammables)
√ √ √
D Construction activities
1 Preparation/Mixi
ng of
construction
material
√ √ √ √ √ √

Final EIA Report – Orange Smart City, Pen, Raigad July 2018
241 ORANGE SMART CITY INFRASTRUCTURE PVT. LTD.
S.
N. Main Activities
Potential Impacts
Chan
ge
in l
and u
se
Chan
ge
in T
opogra
phy
Eco
logy
Wat
er Q
ual
ity
(Surf
ace/
gro
und)
Wat
er R
esourc
es
(Surf
ace/
Gro
und)
Am
bie
nt
Air
Qual
ity
Soil
(E
rosi
on,
Conta
min
atio
n)
Nois
e
Soci
o-e
conom
ics
Tra
ffic
&T
ransp
ort
Liv
elih
ood
Occ
upat
ional
Hea
lth &
Saf
ety
2 Operation of construction
machinery
√ √ √ √
3 Handling and
Disposal of
construction
wastes
√ √ √ √ √
4 Construction of
Boundary Wall /
Separation
between
zones within
Industrial
township
√ √ √ √
5 Development of plots, site zoning
√ √ √
6 Laying of roads √ √ √ √ √ √ √
7 Water Supply & Pipelines,
Overhead tanks,
etc
√ √
9 Storm water and
Drainage
Network
√ √ √ √ √ √
10 Laying of treated
water disposal
Pipe Lines
√ √ √ √ √ √
11 Power connection
and laying of
transmission lines
√ √ √ √ √ √
12 Laying of
Telecom lines √ √ √ √ √ √
13 Laying of Gas
Distribution lines √ √ √ √ √ √
14 Earth moving operations
√ √ √ √ √ √
15 Construction of
building
including
temporary
structures and
common facilities
√ √ √ √ √
16 Heavy
Equipment
operations
√ √ √ √ √
17 Disposal of
construction
wastes
√ √ √

Final EIA Report – Orange Smart City, Pen, Raigad July 2018
242 ORANGE SMART CITY INFRASTRUCTURE PVT. LTD.
S.
N. Main Activities
Potential Impacts
Chan
ge
in l
and u
se
Chan
ge
in T
opogra
phy
Eco
logy
Wat
er Q
ual
ity
(Surf
ace/
gro
und)
Wat
er R
esourc
es
(Surf
ace/
Gro
und)
Am
bie
nt
Air
Qual
ity
Soil
(E
rosi
on,
Conta
min
atio
n)
Nois
e
Soci
o-e
conom
ics
Tra
ffic
&T
ransp
ort
Liv
elih
ood
Occ
upat
ional
Hea
lth &
Saf
ety
18 Vehicular traffic √ √ √ √
20 DG set operations
√ √ √
21 Laying of
pipeline for
collection of
Wastewater from
individual
industries leading
to CETP & also
for
recycling/disposa
l of
treated
wastewater
√ √ √ √ √ √
E Demobilization at the end of construction phase
1 Demobilization of construction
Equipment
√ √ √ √
2 Dismantling of
temporary
support
construction
structures/
equipment
√ √ √ √ √
3 Transportation
and disposal of
Construction/De
molition wastes
√ √ √ √ √
4 Vehicular traffic √ √ √ √
4.1.2 Operations Phase
The operations phase mainly includes the operation of individual components (residential,
commercial establishments and industries such as manufacturing of synthetic organic
chemicals, engineering, roads, agro based industries, IT industry, Gems and Jewelry etc.). Also,
the operation phase activities include the operation and maintenance of trunk infrastructure
components such as water supply system, road infrastructure, wastewater management system,
solid waste management system, ICT system, power supply system, storm water management
system, common utility buildings and other ancillary / support infrastructure. Based on the
activities involved, an impact interaction matrix for operation phase has been prepared for the
project. The potential impacts identified for operation phase of the proposed project is
presented in Table 4-2.
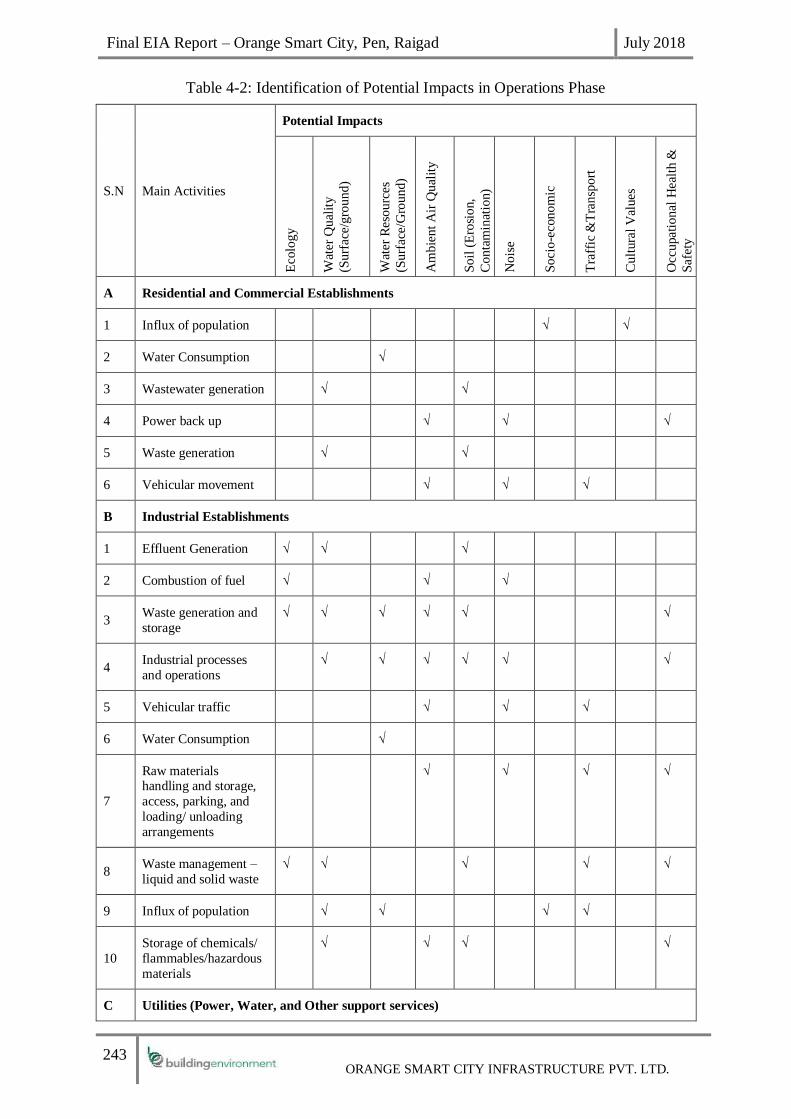
Final EIA Report – Orange Smart City, Pen, Raigad July 2018
243 ORANGE SMART CITY INFRASTRUCTURE PVT. LTD.
Table 4-2: Identification of Potential Impacts in Operations Phase
S.N Main Activities
Potential Impacts
Eco
logy
Wat
er Q
ual
ity
(Surf
ace/
gro
und)
Wat
er R
esourc
es
(Surf
ace/
Gro
und)
Am
bie
nt
Air
Qual
ity
Soil
(E
rosi
on,
Conta
min
atio
n)
Nois
e
Soci
o-e
conom
ic
Tra
ffic
&T
ransp
ort
Cult
ura
l V
alues
Occ
upat
ional
Hea
lth &
Saf
ety
A Residential and Commercial Establishments
1 Influx of population √ √
2 Water Consumption √
3 Wastewater generation √ √
4 Power back up √ √ √
5 Waste generation √ √
6 Vehicular movement √ √ √
B Industrial Establishments
1 Effluent Generation √ √ √
2 Combustion of fuel √ √ √
3 Waste generation and
storage
√ √ √ √ √
√
4 Industrial processes
and operations
√ √ √ √ √
√
5 Vehicular traffic √ √ √
6 Water Consumption √
7
Raw materials handling and storage,
access, parking, and
loading/ unloading
arrangements
√ √
√
√
8 Waste management –
liquid and solid waste
√ √
√
√
√
9 Influx of population √ √ √ √
10
Storage of chemicals/
flammables/hazardous
materials
√
√ √
√
C Utilities (Power, Water, and Other support services)

Final EIA Report – Orange Smart City, Pen, Raigad July 2018
244 ORANGE SMART CITY INFRASTRUCTURE PVT. LTD.
S.N Main Activities
Potential Impacts
Eco
logy
Wat
er Q
ual
ity
(Surf
ace/
gro
und)
Wat
er R
esourc
es
(Surf
ace/
Gro
und)
Am
bie
nt
Air
Qual
ity
Soil
(E
rosi
on,
Conta
min
atio
n)
Nois
e
Soci
o-e
conom
ic
Tra
ffic
&T
ransp
ort
Cult
ura
l V
alues
Occ
upat
ional
Hea
lth &
Saf
ety
1 Operation √ √ √ √ √
2 Maintenance √
3 Structural failure √
D Waste Management Facilities
1 Waste transportation √ √ √ √ √ √
2 Waste
treatment/processing √ √ √ √ √ √
3 Handling and Storage
of wastes √ √ √ √
4 Landfilling √ √ √ √ √
5 DG set operation √ √
E CETP & STP
1 Wastewater collection
(Tankers/ Pipelines √ √ √ √ √ √ √ √
2 Treatment & other
operations √ √ √ √ √ √
3 Disposal √ √ √ √ √ √ √ √
4 DG set operations √ √
4.2 Evaluation of Impact
The impact evaluation is done based on Severity, Extent and Duration of the impact. The
resultant of the impact evaluation is represented by the Significance of the impact which is
basically the multiplication of these three parameters as shown in Table 4-3. Based on standard
environmental assessment methodologies, three key elements are considered for this analysis.
4.2.1 Severity of Impact:
The degree of damage that may be caused to the environmental components concerned. This
will be decided by the standards available for the parameter. To decide severity a scale is
essential. This scale is assumed to be percentage value of the parameter with respect to the
existing standard. The 0 reading would be considered as 0 % and the standards valued will be
considered as 100%. For example, SOx standard is 80 microgram/ m3. In this case if a project
depicts baseline or prediction value as 80 microgram/ m3 then the value in terms of scale is

Final EIA Report – Orange Smart City, Pen, Raigad July 2018
245 ORANGE SMART CITY INFRASTRUCTURE PVT. LTD.
considered as 100%. If a project depicts baseline or predicted value as 72 microgram/ m3 then
the value is 90%. Based on this scale three levels of severity are considered which are defined
below.
Severity 1 (Low) The baseline and / or predicted value is less than
90% /or if the activity is intermittent
Severity 2 (Moderate) The baseline and / or predicted value is between
90% to 110% or the activity is continuous
Severity 3 (High) The baseline and / or predicted value is more than
110%
4.2.2 Extent of Impact:
The geographical spread of the impact around project location and corridors of activities.
Extent of the project impact is based on the impacts extent beyond the project boundary. As
per the Standard ToR for Industrial Estates issued by MoEF (2010) the primary impact zone is
10 km from the project boundary. Based on this data the scale of extent of impact is defined as
below.
Extent 1 (Low) The extent of the impact is within the project
boundary.
Extent 2 (Moderate) The extent of the impact is within 10km. from the
project boundary.
Extent 3 (High) The extent of the impact is beyond 10km from the
project boundary.
4.2.3 Duration of Impact:
The time for which the impact lasts taking into account the project lifecycle. The duration
impact for said project has been bifurcated in to Construction and Operation Phase especially.
For Construction Phase the following criteria are used to decide intensity of the duration.
Cont. Duration 1 (Low) Impacts those are instantaneous. (e.g. Noise)
Cont. Duration 2 (Moderate) Impacts those last during the entire construction
phase.
Cont. Duration 3 (High) Impacts those last after the construction phase.
Any impact that is going to happen because of the operation of the project will continue
throughout the life of the project. Hence these impacts are categorized based on their likely
occurrence or frequency. These are defined in the following manner.
Operation Duration 1 (Low) Rare (e.g. D. G. set operation)
Operation Duration 2
(Moderate) Periodic
Operation Duration 3 (High) Regular (e.g. traffic generated by the project
occupants)
A positive or beneficial impact that may result from this project is not ranked and is depicted
in the form of ++.

Final EIA Report – Orange Smart City, Pen, Raigad July 2018
246 ORANGE SMART CITY INFRASTRUCTURE PVT. LTD.
4.2.4 Impact Significance:
The significance of the impact is adjudged based on a multiplicative factor of the three element
rankings mentioned above. The Error! Reference source not found. below assigns impact
significance in the scale of Low-Medium-High and will be used for delineation of preventive
actions, if any, and management plans for mitigation of the impacts.
The impact significance is determined taking into account the measures which are factored at
the design and planning phase of the project. Legal issues are taken into account in the criteria
sets, wherever appropriate, to aid in OSCIPL effort to comply with all relevant legislations.
Additionally, the results of quantitative impact prediction exercise, wherever undertaken, are
also fed into the process. It is also to be noted that the estimation of significance is done based
on the experience and judgment of the respective functional area expert and the EIA
coordinator where the quantitative assessment is not possible.
Table 4-3: Criteria based significance of Impact
Severity of
Impact (A)
Extent of Impact
(B)
Duration of
Impact (C)
Impact Significance
(A X B X C)
1 1 1 1
LOW
1 1 2 2
1 2 1 2
2 1 1 2
2 1 2 4
1 2 2 4
3 1 2 6
MEDIUM/
MODERATE
1 3 2 6
2 2 2 8
3 2 2 12
2 3 2 12
2 2 3 12
3 3 2 18
HIGH
3 2 3 18
2 3 3 18
3 3 3 27
- Impact is Beneficial - ++ POSITIVE

Final EIA Report – Orange Smart City, Pen, Raigad July 2018
247 ORANGE SMART CITY INFRASTRUCTURE PVT. LTD.
To assist in determining and presenting the significance of an impact, an impact evaluation
matrix was developed. The significance of the impact is depicted using colour codes for easy
understanding. In the case that an environmental component might be impacted by more than
one project activity the higher impact significance ranking is taken as the significance ranking
for the subject receptor. Impacts that are determined to have high significance ranking of “>12”
are considered to be significant and hence require examination in terms of preventive actions
and/or required additional mitigation to reduce the level of the potential impact.
4.3 Impacts and Mitigations – Construction Phase
The impact during pre-construction and construction phase are primarily from site preparation
activities, construction activities, transportation, combustion of fuel, operation of heavy
equipment and machinery and vehicular traffic. The assessment of impacts on various
environmental components and the respective mitigation measures are discussed in the
following sections.
4.3.1 Ambient Air Quality
The initial construction year 2019 has been considered for the air quality modelling purposes
during the construction phase. The major sources of air pollution during the construction phase
are D.G sets and the traffic plying on the following roads which include the project traffic:
• Balavali Road
• NH-66
• SH-88
The map depicting the roads is shown in Figure-1.1
Figure 4-1 : Map depicting the road network in the vicinity of the project site
The emission inventory considered for the air quality modelling is depicted in Table- 1-1. The
major sources of emission as mentioned earlier are D.G sets and the traffic on the roads. The
details are presented in Table 4-4 and Table-1.2. Each D.G set is assumed to operate for one
hour daily for the entire year only for the back-up supply purposes.
Balavali road
NH-66
SH-88

Final EIA Report – Orange Smart City, Pen, Raigad July 2018
248 ORANGE SMART CITY INFRASTRUCTURE PVT. LTD.
Table 4-4 : Emissions from the D.G set 1
Parcel Configuration
of the D.G sets
(Nos x KVA
rating)
Emissions per D.G set (g/sec)
CO
(g/sec)
NOx
(g/sec)
PM10 (g/sec)
T1 9 x 2000 1.49 3.51 0.19
T1 1x 3500 2.60 6.15 0.33
T2 5 x 1000 0.74 1.76 0.09
T2 1x 550 0.41 0.97 0.05
T3 8 x 500 0.37 0.88 0.05
T3 1x 700 0.52 1.23 0.07
T4 4 x 1000 0.74 1.76 0.09
T4 5 x 500 0.37 0.88 0.052
The traffic plying on the roads mentioned above which includes the contribution from the
project traffic is presented in Table 4-5 along with the emission rates from the traffic on the
roads (considered as area sources for the purpose of modelling exercise). The Euro –III & Euro
IV emission factors have been considered for estimating the emission from the traffic.
Table 4-5 : Emission due to the projected traffic in 2019
Sr No Road
No of vehicles (vehicles/Hour) Emission Factor (g/s/sq.m)
2W 3W 4W LCV Bus Truck Total CO Nox PM10
1 Balavali Road 79 20 1 0 4 0 104 1.01E-05 2.07E-06 6.01E-07
2 NH66 680 87 1333 59 51.5 116.5 2327 6.51E-05 2.89E-05 6.63E-06
3 SH88 202 26 396 17.5 15.5 34.5 692 1.937E-05 8.60E-06 1.97E-06
Methodology for dispersion modelling and scenario analysis
Industrial Source Complex Short Term Model (ISCST3) model is based on Gaussian plume
dispersion model, which is the simplified form of the three-dimensional transmission-
distribution equation. The Short-Term model incorporates the COMPLEX1 screening model
dispersion algorithms for receptors in complex terrain. ISCST3 model is capable of handling
multiple sources, including point, volume, area and open pit source types. To run the model,
the main model input files include: input run-stream file and meteorological data file. Run-
stream setup file contains modelling options, source information, receptor locations,
meteorological data file specifications and output options. However, meteorological data file
contains all the required meteorological data on hourly basis. ISCST3 Gaussian plume model
for predicting downwind pollutant concentrations from line sources. In the present study
ISCST3 model has been used to predict the dispersion of pollutants over the study area to
predict pollutant concentrations near highways or roads by approximating them as area sources.
The D.G sets have been assumed as point sources for the modeling purposes.
Model Inputs
1AP-42 : Gaseous Emission Factors For Large Stationary Diesel Engines - Diesel Fuel ((Source Classification Code) SCC 2-02-004-01)

Final EIA Report – Orange Smart City, Pen, Raigad July 2018
249 ORANGE SMART CITY INFRASTRUCTURE PVT. LTD.
The data base included in model are meteorological data, traffic emissions data and ambient
air quality data. Background concentrations were calculated using monitored values from sites.
Model Used ISCST3 for Area Source
Source Type Area Source: for vehicle tail pipe emissions
Point Source : D.G sets
Modelling Grid 1 Cartesian Grid , 17 km x 17 km
Emission
Factor
Emission rates in g/s.m2 based on total traffic estimates based on ARAI
emission factors
Emission rates in g/sec for the D.G sets based on the AP-42 emission
factors
Met File (ISC
Ready)
Dec 2016- Nov 2017, Anemometer Height: 10 m
Prediction
Years
2019, 2029, 2035
Receptors GLC at 14 receptors as per baseline monitoring program.
Scenario Analysis for the construction phase (2019)
a) CO
The resultant concentrations for the pollutants CO at the AAQM locations are presented in
Table 4-6
Table 4-6 : Resultant concentrations of CO at AAQM locations
Receptor Baseline Predicted Total
AQ1 650 43.938 693.9
AQ2 0 20.853 20.85
AQ3 0 52.09 52.09
AQ4 600 38.161 638.2
AQ5 0 135.639 135.6
AQ6 0 31.721 31.72
AQ7 400 41.061 441.1
AQ8 0 56.485 56.49
AQ9 0 24.787 24.79
AQ10 400 22.03 422
AQ11 0 25.185 25.19
AQ12 0 21.913 21.91
AQ13 0 42.387 42.39
NAAQS
standard 2000 µg/m3
Note : - All values in µg/m3
The Table 4-6 reflects that the minimum resultant CO concentations was at the location AQ12
(21.91 µg/m3) while the maximum resultant concentration was at AQ5 (135.639 µg/m3). The

Final EIA Report – Orange Smart City, Pen, Raigad July 2018
250 ORANGE SMART CITY INFRASTRUCTURE PVT. LTD.
maximum resultant concentration of CO was found to be within the NAAQS limit for CO (2000
µg/m3).
The isopleths of CO for the year 2019 is depicted in Figure 4-2
Figure 4-2 : Isopleths depicting the resultant concentrations of CO due to combined
operations of the D.G sets and traffic -2019
b) NOx
The resultant concentrations for the pollutants NOx at the AAQM locations are presented in
Table 4-7
Table 4-7 : Resultant concentrations of NOx at AAQM locations
AAQM location code Baseline (µg/m3) Predicted (µg/m3) Total (µg/m3)
AQ1 50.23 12.063 62.3
AQ2 22.37 6.806 29.2
AQ3 23.12 14.77 37.9
AQ4 28.23 12.439 40.7
AQ5 22.23 80.274 103
AQ6 20.3 7.861 28.2
AQ7 29.12 23.374 52.5
AQ8 20.2 16.512 36.7
AQ9 22.35 7.453 29.8
AQ10 28.84 19.964 48.8

Final EIA Report – Orange Smart City, Pen, Raigad July 2018
251 ORANGE SMART CITY INFRASTRUCTURE PVT. LTD.
AQ11 22.35 9.78 32.1
AQ12 23.46 8.831 32.3
AQ13 24.54 11.681 36.2
AQ14 23.43 3.165 26.6
NAAQS 80 µg/m3
The Table 4-7 reflects that the minimum resultant NOx concentation was at the location AQ14
(26.6 µg/m3) while the maximum resultant concentration was at AQ5 (103 µg/m3). The
maximum resultant concentration of NOx was found to exceed the NAAQS limit for NOx (80
µg/m3).
The isopleths of NOx for the year 2019 is depicted in Figure 4-3.
Figure 4-3 : : Isopleths depicting the resultant concentrations of NOx due to combined
operations of the D.G sets and traffic -2019
c) PM10
The resultant concentrations for the pollutants PM10 at the AAQM locations are presented in
Table 4-8
Table 4-8 : Resultant concentrations of PM10 at AAQM locations
Station Code Baseline (µg/m3) Predicted (µg/m3) Total (µg/m3)
AQ1 50.23 1.306 51.5
AQ2 53.43 0.679 54.1

Final EIA Report – Orange Smart City, Pen, Raigad July 2018
252 ORANGE SMART CITY INFRASTRUCTURE PVT. LTD.
AQ3 49.32 2.142 51.5
AQ4 60.81 1.509 62.3
AQ5 42.73 3.481 46.2
AQ6 43.11 1.086 44.2
AQ7 56.59 1.853 58.4
AQ8 40.03 1.881 41.9
AQ9 41.1 1.008 42.1
AQ10 64.11 1.062 65.2
AQ11 41.09 0.961 42.1
AQ12 52.95 0.704 53.7
AQ13 52.19 1.68 53.9
AQ14 49.3 0.278 49.6
NAAQS 100 µg/m3
The Table 4-8 reflects that the minimum resultant PM10 concentation was at the location AQ8
(41.9 µg/m3) while the maximum resultant concentration was at AQ10 (65.2 µg/m3). The
maximum resultant concentration of PM10 was found to be within the NAAQS limit for PM10
(100 µg/m3).
The isopleths of PM10 for the year 2019 is depicted in Figure 4-4.
Figure 4-4 : Isopleths depicting the resultant concentrations of PM10 due to combined
operations of the D.G sets and traffic -2019
Significance of Impact
As the per the modelling results, the resultant concnetrations of NOx are exceeding the NAAQS
standard during the construction phase the severity of the impact is High (3), also as the extent

Final EIA Report – Orange Smart City, Pen, Raigad July 2018
253 ORANGE SMART CITY INFRASTRUCTURE PVT. LTD.
of the impact is within the 10 km of the project boundary the extent is categorized as Moderate
(2) and as the duration of the impact is for the entire construction period, the duration of the
impact is categorized as moderate (2) and subsequently the impact has been ranked as
‘Medium’.
Severity of Impact 3 Extent of Impact 2 Duration of Impact 2
Impact Significance = 12 i.e. Moderate
4.1.1.2 Mitigation measures
• Material Handling
The transport of materials such as concrete and asphalt to construction sites generate significant
amounts of road dust, especially for sites that are relatively far from material manufacturers.
Setting up temporary portable concrete plants and/or asphalt plants at construction sites can
eliminate haulage of materials.
• Idling Time Reduction
The traffic management plan to be prepared and implemented to reduce the idling time and
adequate parking space for construction vehicles.
• Improved Maintenance
Recognizing that significant emission reductions can be achieved through regular equipment
maintenance, contractors will be asked to provide maintenance records for their fleet as part of
the contract bid and at regular intervals throughout the life of the contract.
• Reduction of On-site Construction Time
Rapid on-site construction would reduce the duration of traffic interference and therefore,
reduce emission from traffic delay. Off-site fabrication of structural components can also
enhance the quality of work, as the production takes place in controlled settings and external
factors such as weather and traffic do not interfere.
• Other pollution control measures:
o Emission Control System at Stone Crushers & Batching Plants.
o Dust suppression on construction sites.
o The excavation debris shall be kept at one place and covered with grass turf to
reduce runoff during monsoon season.
4.3.2 Water
Water Usage
The construction activities that will have potential impact on water resources (surface and
ground) are site preparation, labour engagement and various construction activities as detailed
in Table-1.1 above. The construction activities will require setting up of 3 - 4 construction
labour facilities for each phase of project with a capacity to accommodate a peak labour of 100
- 200 at each labour facility and an average labour of around 500. The labour facilities will
require water for domestic consumption of workers as well as for the construction activities
such as brickwork, concreting and plastering, curing, domestic purpose, housekeeping, RMC
plant, truck washing, dust suppression, for checking/reporting/repairing leaks etc. It is
estimated that domestic water requirement of about 59 KLD and 320 KLD of water for
construction activities would be required. The water will be sourced by contractor from
authorized sources/approved agencies for the construction phase.

Final EIA Report – Orange Smart City, Pen, Raigad July 2018
254 ORANGE SMART CITY INFRASTRUCTURE PVT. LTD.
Significance of the Impact
The severity is categorized as ‘Moderate’ (2) due to continuous burden on the existing water
resources in the area. The extent of the impact is not restricted within the project boundary
(water will be sourced from outside the project boundary), the same is classified as ‘Moderate’
(2) and as the duration of the impact will last during the entire construction period, it has been
categorized Moderate (2) and accordingly the impact has been ranked as Moderate (8).
Severity of Impact 2 Extent of Impact 2 Duration of Impact 2
Impact Significance = 8 i.e. Moderate
Suggested Mitigation Measures
• Water for the construction phase will be sourced through authorized tanker supply. The
contractor shall ensure that supply is from approved water sources;
• The construction campsites will put in place optimal water consumption measures along
with adequate awareness measures for the laborer;
Water Quality
The major activities that may contribute to the degradation of water quality are site preparation,
labour engagement, material handling and storage and various construction activities as
detailed in Table 4-1. It is expected that during construction phase, there will be generation of
sewage from labor facilities and minor quantity of rejected water from testing of utility tanks
and pipelines. About 57 KLD of sewage is expected to be generated from labour facility. There
is a potential for contamination of surface and groundwater resources resulting from improper
management of sewage.
Significance of the impact
Significant water quality impact will occur, if the sewage is disposed without any prior
treatment. The sewage disposal from the labour facility will be to the tune of maximum upto
57 KLD and will be continuous ,the severity has been categorized as ‘Medium’ (2), also as the
adequate number of toilets (at least 8 toilets per 100 labour) will be provided on site along with
packaged STP ,the extent of the impact is restricted within the project boundary, the extent is
classified as ‘Low’ (1) and as the duration of the impact is during the entire construction period
i.e, ‘Medium’ (2) the impact has been ranked as ‘Low’.
Severity of Impact 2 Extent of Impact 1 Duration of Impact 2
Impact Significance = 4 i.e. Low
4.1.1.3 Mitigation Measures
Onsite Packaged STP will be provided for treating the sewage from the labour facility. The
treated water from the packaged STP will be used for non-potable uses such as dust
suppression, green belt development, etc. Training programs and awareness camps will be
conducted for workers to educate them about the indiscriminate disposal of untreated sewage,
open defecation etc.
4.3.3 Land use, Landscape and Topography
Impact on Land Use

Final EIA Report – Orange Smart City, Pen, Raigad July 2018
255 ORANGE SMART CITY INFRASTRUCTURE PVT. LTD.
The study area occupies a highly undulating terrain in T1 Parcel. The land use at the land
parcels is a mix of land with / without scrub, dense open vegetation, Stony /rocky/barren land
as per the land use /land cover statistics derived from the classified satellite image and will
change to mixed land use comprising predominantly industrial, commercial and residential
components. The land use change will be permanent which will be for beneficial purposes and
the impact will be positive.
Impact significance
Impact is positive ++
Impact on topography
The change in topography will be mostly at the micro-level due to leveling of area or
modification of terrain. The construction activities such as site clearing, gradation, cut fill,
excavation works for foundations of various project-components, development of drains,
providing proper slopes across the area, erection of the associated structures and buildings will
change the topography of the area.
Significance of the impact
As the topography is undulating especially in T1 land parcel, the severity has been classified
as moderate (2), also as the extent of the impact will be within the project site, the extent has
been classified as Low (1) and as the duration of the impact last during the entire construction
phase, the duration has been classified as Moderate (2), the impact on the topography and the
landscape has been accordingly ranked as ‘Low’(4).
Severity of Impact 2 Extent of Impact 1 Duration of Impact 2
Impact Significance = 4 i.e. Low
4.1.1.4 Mitigation measures
For topography
• The land clearance shall be kept to a minimum. Clearing of areas with highly erodible
soils and steep slopes which are prone to water and wind erosion shall be avoided.
• The roads are advised to be carefully constructed for; there will be multiple patches
where the soil shall be exposed. The soil being loose and fast draining, has tendency to
wash out during heavy rainfall and result in landslides. Hence, the road sections
adjacent to such soil patches should have retention walls to avoid mishaps.
• The earth material that will be excavated at the time of construction should be properly
stacked, covered with grass and suitable plant species and utilized for developing
landscapes in respective areas.
• Rainwater harvesting shall be carried out in the entire industrial and residential,
commercial areas. This will minimize the surface run off and thereby impact of
rainwater on the structures in lower reaches of site. This will also save the natural
resource in the form of soil and rainwater from going waste;
• No extra soil shall be brought into the site from outside the project boundary for the
construction activity. All excavated soil to be used in land levelling;

Final EIA Report – Orange Smart City, Pen, Raigad July 2018
256 ORANGE SMART CITY INFRASTRUCTURE PVT. LTD.
• Road corridor to be provided with adequate cross drainage.
For landscape
• The green area (254.95 acres) will be developed in the beginning of construction phase
to the extent possible;
• The construction contractors shall be instructed not to cut any tree. Wherever possible
avoid disturbance to existing ecology to improve the landscape of the project site;
• Diversion dykes would be constructed to channel runoff around the excavated site to
avoid surface runoff of excavated material.
4.3.4 Soil Quality
4.1.1.5 Soil Erosion:
The project activities will include site preparation which further involves the activities of
grading, excavation, which will result in top soil removal and will disturb the soil surfaces.
And may lead to soil erosion. Soil erosion may be caused by exposure of soil surfaces to rain
and wind during site clearing, grading, excavation, cut and fill activities. The mobilization and
transport of soil particles may result in sedimentation of surface drainage networks. However,
such impacts will be primarily confined to the project site during initial construction period.
Significance of Impact
Due to the undulating terrain in T1 land parcel as compared to the other parcels (T2,T3 and
T4), there may be considerable localized cut and fill activity confined to the project site during
initial construction period, hence the severity of the impact has been classified as Moderate (2),
the extent of the impact will be restricted to the project boundary, the same has been classified
as Low (1) and as the duration of the impact will last during the entire construction period, the
duration has been ranked as moderate (2) , accordingly the impact has been ranked as ‘Low’
(4).
The significance of the impact is presented below:
Severity of Impact 2 Extent of Impact 1 Duration of Impact 2
Impact Significance = 4 i.e. Low
4.1.1.6 Mitigation Measures
• Immediate management measures using extensive high-density plantation, slope
stabilization, metal mesh netting, etc.
• Management of lose soil in the impact zones of construction using a combination of
ecological resistance mechanism, using landscaping for flat & gentle slopes whereas
coir netting for medium / moderate slopes and gabion wall for steep slopes.
• Major activities pertaining to site grading and excavation for foundation and backfilling
will be avoided during monsoons and shall be planned for dry season;
• Surface runoff from the construction site and exposed areas will be diverted to drainage
swales or ditches. The method of choice will depend on the size of the drainage area
and the steepness of the slope;

Final EIA Report – Orange Smart City, Pen, Raigad July 2018
257 ORANGE SMART CITY INFRASTRUCTURE PVT. LTD.
• Retention wall or bund shall be provided around the storage areas for excavated soil
and other construction material to check the flow of sediments with storm water in case
of rain;
4.1.1.7 Top Soil Management:
As mentioned earlier , due to the undulating terrain in T1 land parcel as compared to the other
parcels (T2, T3 and T4), there may be considerable localized cut and fill activity, site grading,
excavation confined to the project site during initial construction period which may , hence the
severity of the impact has been classified as Moderate (2), the extent of the impact will be
restricted to the project boundary, the same has been classified as Low (1) and as the duration
of the impact will last during the entire construction period, the duration has been ranked as
moderate (2) , accordingly the impact has been ranked as ‘Low’ (4).
The significance of the impact is presented below:
Significance of Impact
Severity of Impact 2 Extent of Impact 1 Duration of Impact 2
Impact Significance = 4 i.e. Low
Mitigation Measures
• Excavated soil shall be used/transported at the earliest for filling low lying areas at the
site for raising of level as planned;
• Proper routing and adequate capacity of the storm water run-offs drains with catch pits
shall be provided at all construction sites;
• Completed earthworks will be sealed and/ or re-vegetated as soon as reasonably
practicable with the help of landscape expert;
• The excavated soil material shall be stacked in earmarked areas. It is advised to be
dumped properly and stabilized with grass and trees or utilized for green area
development to avoid its washing due to rains;
• Moreover, the washed soil will also be arrested by creating garland drains, leading to
settling pond/s to allow its settling and avoid its mixing with surface water and result
in their silting.
• The Top soil will be lost due to the site clearing, grading, excavation / cut and fill
activity, construction of the access road/ pavement works in the proposed development
within project site.
4.1.1.8 Soil contamination
The soil contamination can occur due to the labour engagement (Waste from labour facility
Sewage disposal), Material Handling and Storage (Transportation & Unloading of construction
material, Storage & Handling of construction wastes and Storage & Handling of Hazardous
material (chemicals/ flammables). The tentative quantification of the construction debris
generated from the project is given in Table 4-9.
Table 4-9:Construction Waste Debris
Sr.
No
Particulars Quantity in
Tonnes
Management
1 PCC Waste 2005.55 Will be used for Site filling
2 Concrete Waste 34846.49 Will be used for Site filling

Final EIA Report – Orange Smart City, Pen, Raigad July 2018
258 ORANGE SMART CITY INFRASTRUCTURE PVT. LTD.
3 Reinforcement steel
scrap 7019.44 To be sold to vendors
4 Brick Debris 13286.79 Will be used for Site filling
5 RCC 46879.82 Will be handed over to recyclers
6 Tiles Waste 120834.61 To be sold to vendors
7 Glass Waste 12785.40 To be sold to vendors
8 Paint Cans 10027.77 To be taken by Contractor
9 Wood Waste 3008.33 To be taken by Contractor
Total 250694.21
Total Construction debris generated: 250694.21 T
Table 4-10: Waste from Labor facility
No. of Workers Solid Waste Generation
Kg/capital/day
Dry waste
(Kg/day)
Wet
waste
(Kg/day)
Total
waste
(kg/day)
500 0.25 38 88 125
Significance of Impact
Construction wastes from site such as metal cuttings, reinforced steel scrap, tiles waste, glass
waste, debris, plastic packing material, wooden logs etc. will be segregated and will be kept in
specially identified waste bins. All metal scrap, reinforced steel scrap, tiles waste, glass waste
will be sold to local vendors; concrete waste, PCC waste, brick debris will be used for site
levelling; paint cans, oil cans, plastic and cardboard packing material will be taken by
contractors and other inert materials like rubber, tyres etc will be disposed off to authorized
agency. Since most of the waste generated will be segregated, sold to local vendors and
construction waste generated will be off to local vendors, contractors and reused on site, the
severity has been classified as low (2), also as the extent of the impact will be within the project
site, the extent has been classified as Low (1) and as the duration of the impact last during the
entire construction phase , the duration has been classified as Moderate (2), the impact on the
soil has been accordingly ranked as ‘Low’(4).
Impact significance
Severity of Impact 1 Extent of Impact 1 Duration of Impact 2
Impact Significance =2 i.e. Low
Mitigation Measures
• Storage facilities will be designed within paved surface, provided with covered shed
and adequate containment facility at the construction site to prevent contamination of
soil due to accidental spills of lubricating oil, fuel oil, paints, thinner, varnishes,
chemicals etc.;

Final EIA Report – Orange Smart City, Pen, Raigad July 2018
259 ORANGE SMART CITY INFRASTRUCTURE PVT. LTD.
• Storage of machine oil, used oil and grease will be provided with adequate secondary
containment to avoid any soil contamination;
• Adequate hazardous waste collection and storage facilities shall be provided in a
designated place away from storm water drains or watercourses with proper access
control and proper labeling;
• All the hazardous waste containers will be properly labeled with the waste being stored
and the date of generation;
• The hazardous waste shall not be stored for more than 90 days at the site and will be
sold to authorized recyclers;
• An inventory of the hazardous waste generated, stored and sold to recyclers shall be
maintained by the contractors;
• A spill contingency plan shall be delineated by the contractor. A portable spill
containment and cleanup equipment will be available at site and training in the
equipment deployment will be imparted to the contractors;
• Covered garbage bins shall be provided for the construction labour facilities and will
be collected and transferred to the proposed waste management facilities within site;
• The construction waste shall be used as a fill material for the low-lying areas and for
construction of roads;
• Empty containers, which may contain some toxic substances such as paints, solvents,
adhesives, chemicals and sealants shall be returned to the manufacturers or disposed
appropriately as the case may be;
• Waste generated will be segregated into biodegradable and non-biodegradable contents.
All biodegradable wastes from canteens to be collected and disposed of in humus pits
generated onsite for subsequent use as manure;
• Construction wastes from site such as metal cuttings, reinforced steel scrap, tiles waste,
glass waste, debris, plastic packing material, wooden logs etc. will be segregated and
kept in specially identified waste bins. All metal scrap, reinforced steel scrap, tiles
waste, glass waste will be sold to local vendors; concrete waste, PCC waste, brick debris
will be used for site levelling; Paint cans, Oil cans, plastic and cardboard packing
material will be taken by contractors and other inert materials like rubber, tyres etc. will
be disposed off to authorized agency;
• Hazardous wastes including used oil, waste oil and residue containing oil or other
hazardous substances will be stored at a designated place at all construction sites for
disposal through authorized vendors;
• Paintbrushes and equipment for water and oil-based paints shall be cleaned within a
contained area and shall not be allowed to contaminate site soils, watercourses, or
drainage systems;
• All oil handling will be done in an area underlined by gravel and PCC to avoid soil
contamination.

Final EIA Report – Orange Smart City, Pen, Raigad July 2018
260 ORANGE SMART CITY INFRASTRUCTURE PVT. LTD.
• Segregation of potentially hazardous waste from non-hazardous construction site
debris;
• The contractor shall educate the workers and subcontractors about hazardous waste
storage and disposal procedures.
4.3.5 Ambient Noise Quality
OSC is a new construction project for with industrial, residential, commercial components
proposed in this facility. Being a construction project, majority of the machinery are only going
to be present at the project site during the construction phase only. Following are the identified
major sound sources from the list of machinery with their respective Sound Pressure Levels.
➢ Concrete Mixer (2 Nos) – 90~100 dB
➢ Submersible pumps – 80~85 dB
➢ Grinding Machines (Multiple) – 95 dB
➢ Concrete Batching Plant – 100 dB
➢ Bar cutting and bending machines - <80~85 dB
➢ Chipping Machine - < 85~95 dB
➢ Electric Drill machines - 10 Nos. – < 80 dB
➢ Dumpers / Trucks – 80~85 dB
➢ JCB / Excavators / Breakers / Earth Moving Machinery (Multiple) – 85~90 dB
DG Sets (Multiple Numbers) – As per the CPCB norms, the DG sets are supposed to have <75
dBA of SPL when measured in anechoic conditions, but in real conditions, the noise level
actually observed is usually higher. Additionally, due to multiple DG sets being kept at the
same location, it increases the overall SPL due to logarithmic addition of sound pressure levels
of each of the individual DG Sets.
It can be observed that extremely low noise levels are observed at all of the locations as per the
baseline noise levels recorded, which are in the range of 42 to 44 dB during the day time as
well. During the site visit, it was noted that there was no nearby construction activity or
vehicular movement or any other activity which can potentially raise the baseline noise levels,
due to which low baseline noise levels are recorded as above.
Noise modelling predictive analysis was conducted to predict the potential increase in the Leq-
Day Sound Pressure Levels at the nearby areas surrounding the construction activity. Noise
modelling analysis assumes that the construction activity is conducted right near the project
boundary and calculates the potential increase in noise levels in surrounding villages with the
consideration of the attenuation achieved due to green-belt and mitigations implemented as per
the suggestions of this report. In real conditions, the construction activity would in fact be
conducted well within the project boundary, and hence the actual noise levels noted during the
construction activity would be lesser than what is mentioned in this report. This analysis is
conducted for the worse-case scenario, in which case the construction is done right near the
project boundary.
Villages which are within a distance of 50 to 200 meters were chosen for the noise modeling
study from the available data of 10 Noise monitoring locations. The results predicted are based
on distance from the project boundary or from construction activity. Similar results would be
observed at villages located at same distance from the project boundary or the construction
activity.
The noise modeling results are given below in Table 4-11:

Final EIA Report – Orange Smart City, Pen, Raigad July 2018
261 ORANGE SMART CITY INFRASTRUCTURE PVT. LTD.
Table 4-11: Noise Modeling results in the construction phase
The inferences from the noise modeling results are given below:
• The highest increase was predicted at the village Belawade which is located at 50 meters
distance upwind of T2, with an increase over the baseline noise levels of 6 dB.
• At Mungoshi Village, which is located at 100 meters downwind of T4, increase of 2.1
dB was predicted which is very minor, considering that the minimum change in Sound
Pressure Level detectable by a human ear is measured at 0.5 dB.
• At Ambivali Village which is located at 150 meters from project boundary, upwind of
T4, increase of 1.1 dB was predicted, which is again negligible.
• At Kopar Village and Wirant Village, which are located at 200 meters away from the
project boundary, increase over the baseline noise levels of 0.8 dB each is predicted,
which is very negligible.
The results of the noise modeling indicate that the predicted values are less than the 90% of the
existing standards, the severity is classified as ‘Low’ (1), the extent of the impact will be within
the 10 km boundary of the project site, the same is classified as ‘Moderate’ (2) and as the
duration of the impact will last during the entire construction phase, the duration has been
classified as Moderate (2), accordingly the impact has been ranked as ‘Low’.
Severity of Impact 1 Extent of Impact 2 Duration of Impact 2
Impact Significance = 4 i.e. Low
4.1.1.9 Mitigation Measures
During the construction phase, Noise Reflective Corrugated Roof-sheets to be temporarily
installed as “Noise Reflective Barriers” which are effective in reducing the noise levels by up
to 5 dB. Upon implementation, the SPL measured at approx. 150 meters distance should be
equal to the background noise level measured in absence of these noise sources.
Batching Plant:

Final EIA Report – Orange Smart City, Pen, Raigad July 2018
262 ORANGE SMART CITY INFRASTRUCTURE PVT. LTD.
The batching plant contains several different sources, the collective noise level of which may
rise to 100 dB. Following are the several different sources present in a batching plant.
➢ Truck and front-end loader engine noise
➢ Hydraulic pumps
➢ Conveyor belts
➢ Air valves
➢ Filters
➢ Alarms
➢ Compressors
➢ Swinging, scrapping and loading devices
The contractor should carefully choose the above equipment in order to meet with the CPCB
Norms.
Hydraulic pumps and compressors should be covered with Acoustical Enclosures with 20 dB
Transmission Loss Rating in order to reduce the noise.
Valves should be covered with Removable Acoustical Blankets.
The contractor should choose controlled operating hours for noisy activities such as delivery,
loading unloading etc.
Vehicular Movement:
There would be increased activity of vehicular movement during the construction phase of the
project. Dumpers/Trucks with sound Pressure Levels of 80~85 dB would be moving around
the project sites on the available roads. The increased vehicular movement is likely to affect
the houses abutting the roads that lead to the construction sites, but the impact and increase
over the baseline noise levels is going to be momentary and only during the truck/dumpers pass
the certain houses.
• Well maintained vehicles to be chosen for the project so that the sound generated by
the vehicles is as low as possible.
• It is recommended that vehicular movement to be avoided during the night time, and
most of the material movement to be conducted during the day time to avoid disturbance
to surrounding villages.
• These calculations are done using theoretical formulation, which assumes that there are
no reflective surfaces or no other surfaces which may lead to attenuation of the sound.
But in actual conditions, the project site being located in a densely populated area, or
an urban area, there will be several tall buildings, walls or trees which will lead to
attenuation of the Sound, and thus the sound will not affect any project beyond 150
meters radius outside the boundary walls.
• This analysis is done assuming that the Noise level of the mentioned sources is going
to be 85~100 dB at the Boundary of the project site, where as in actual, the machinery
will be installed well within the boundary of the Plot, and other sound sources e.g.
Compressors, Dewatering Pumps, Cranes, JCBs etc. are going to be located well within
the plot boundary, because of which there will additional attenuation and hence the SPL
measured at the boundary of the project because of the machinery involved in this
project is going to be much lower than what is considered in this report. This Analysis
is done for the absolute worst-case scenario for the Noise Environment.

Final EIA Report – Orange Smart City, Pen, Raigad July 2018
263 ORANGE SMART CITY INFRASTRUCTURE PVT. LTD.
4.3.6 Socio-Economic Environment
The establishment of proposed the proposed Integrated Industrial Township at Pen, Raigad, is
likely to generate a range of permanent and temporary social impacts. These impacts will also
be both positive and negative in nature. The positive impacts include increase in employment
opportunities, improvement in infrastructure facility in the project site and business
opportunities for the local people, increase in real estate value in surrounding area etc. The
potential negative impacts of the project changes in land-use, changes in the traffic pattern and
related impacts. The entire range of impacts can be broadly categorized as:
• Direct impacts on the prevailing natural and social systems;
• Indirect impacts that may be secondary impacts, derived from the existing natural and
social systems; and
All impacts have been identified through consultation with the Project proponent, with
government officials, elected representatives at village and consultation with various
stakeholders including the people living in villages affected by the project.
The actual impacts are documented from the examination of available data, socio-economic
survey and feedback received from the stakeholder consultations.
The pre-construction and construction phase impacts on socio-economic conditions of the
Project area are discussed in the following sub-sections.
4.1.1.10 Land Related Impact
Impact of Loss of land
The land required for project has been purchased on willing buyer –willing seller basis from
15 affected villages. The land use at the land parcels is a mix of land with / without scrub, dense
open vegetation, Stony /rocky/barren land as per the land use /land cover statistics derived from
the classified satellite image. As the land at the project site is predominantly non-agricultural
land, subsequently there is no loss of productive agricultural land.
As the land is predominantly non-agricultural land the severity of the impact has been classified
as ‘Low’ (1), the extent of the impact is restricted to be project site the same has been classified
as ‘Low’ (1) and as the duration of the impact will last after the construction phase the same
has been classified as ‘High (3)’ accordingly the impact related to the loss of land has been
ranked as ‘Low’(3).
Severity of Impact 1 Extent of Impact 1 Duration of Impact 3
Impact Significance = 3 i.e.Low
Extent of loss of agricultural land
In terms of extent of land loss, in all approx. 1042.51 acres land has been purchased on the
willing buyer –willing seller basis from 14 village’s viz., Boregaon, Virani, Shene, Ambeghar,
Belawade Khurd, Belawade Budruk, Mungoshi, Padale, Walak, Govirle, Hamrapur, Ambiwali,
Balawali and Kopar.
A study of OSC sites reflects that the loss of agricultural land is minimal and the conversion of
this mixed land into industrial, residential and commercial use will have positive socio –

Final EIA Report – Orange Smart City, Pen, Raigad July 2018
264 ORANGE SMART CITY INFRASTRUCTURE PVT. LTD.
economic impact in the surrounding region. The project will have 25% of green and open space
which will have positive impact on the environment. . (Impact is beneficial and is positive)
Impact is beneficial ++
Land use planning
The proposed ‘OSC project’ will comprise of industries of various sectors, commercial &
residential buildings. The proposed land use pattern will be under mixed-use category.
4.1.1.11 Impact on Livelihood
The Land was purchased on willing buyer - willing seller basis & is in control/possession of
the Group. No rehabilitation and resettlement is required. However the villagers were of the
opinion that as the project is expected to generate employment opportunities which will be
beneficial for them. The villagers also had expectations of benefitting from CSR activities
associated with the project. Hence the overall impact on the livelihoods will be positive.
Impact is beneficial ++
4.1.1.12 Impact on utilities
There is no utility present within the project site. Hence there is no impact on the utility
infrastructure in the area.
4.1.1.13 Impact on Livelihood Opportunities
The impact will be beneficial on account of the following reasons
Job Opportunities
The proposed project will create new jobs in skilled, semi-skilled, unskilled, managerial and
technical level. This along with other project related requirements like security, housekeeping,
gardening etc. will create a constant requirement for labor, for the entire operation phase of the
project life. In addition, the manufacturing units in the project will create number of job
opportunities & also other proposed facilities such as commercial, recreational, hospital,
education, logistic, etc. It is also envisaged that a number of jobs will be created outside the
project boundary by various ancillary units catering to the needs of primary manufacturing
units in the project. However, the benefit of project will trickle down to the local communities
if adequate measures are taken in a planned way.
The project would spur the employment opportunity 1,50,000 no.s at local and regional level.
In order to benefit the local population from the implementation of the project the following
measures should be adopted:
Dissemination of information to the local youths about various types of jobs opportunities
likely to be generated by the project;
Under CSR program companies should identify local youths and extend necessary skill
development trainings leading to linkages to job;
The coordination between industry and community should start well in advance so that both
can benefit from it;

Final EIA Report – Orange Smart City, Pen, Raigad July 2018
265 ORANGE SMART CITY INFRASTRUCTURE PVT. LTD.
As there will be generation of the employment due to the creation of the job opportunities, the
impact on the livelihood opportunities will be beneficial.
Impact is beneficial ++
4.1.1.14 Impact on the Infrastructure / Institutional Development
Currently there is paucity of the infrastructure such as schools, colleges and sanitation facilities
in the nearby villages. Due to the establishing of the OSC there will be upgradation of the
surrounding infrastructure indirectly. Hence the impact will be positive and beneficial. With
the development of project activities, the locals expressed that infrastructural development in
their villages such as access roads, water supply. Also the schools and college facilities should
be provided so that the education will be available in the village. Due to the infrastructure /
institutional development the impact will be beneficial
Impact is beneficial ++
Additional Benefits of the Community Development Activities
Once the proposed projects established, the continued sustenance of community relations will
require the project proponents to engage in community development initiatives as per needs
and priorities. The project proponent has identified focal areas of CSR activity such a women
empowerment, skill development etc. The project development will generate direct and
indirect employment, will improve infrastructure in the region which will socio-economically
transform the region. The impact due to the above will be beneficial.
4.1.1.15 Impact on the Utilities & Resources
Another key impact that the project will bring about in the betterment of the public is the
increase in utilities and resources. Presently, the villages are dependent on nearest urban centers
namely Kopar, Belawade, Govirle, Ambeghar and Pen for facilities like higher education,
medical, recreation etc. Improved facilities in project will significantly benefit the local
community in terms of access to public utilities and in supporting overall social development.
Hence the impact will be beneficial and positive.
Better value for Local Products
Development of project will create a market in itself for local products such as vegetables,
dairy, poultry etc. Presently nearest urban center is the primary market for the villagers and
mostly sales their product through middleman. With the development of residential and market
in the project will give the villagers to sale their product directly to the consumers at a market
rate, thus making more profit. The project may also encourage the villagers to take up
cultivation of vegetables seriously and diversify to meet the growing demand from the project
residents.
Improvement in women’s socio-economic conditions
Enhanced facilities such as schools, health, recreation in vicinity has direct linkages to the
improvement in women’s social- economic condition. This is especially true for the women
living in surrounding villages of project area. Furthermore, local educated women will have
opportunity to work in the manufacturing units and other facilities are will be established in the
project. Additionally, there would be opportunity to work as domestic help in the residence
colony in the project. The project will surely enhance the situation of women.
Access of the facilities to the poor segment

Final EIA Report – Orange Smart City, Pen, Raigad July 2018
266 ORANGE SMART CITY INFRASTRUCTURE PVT. LTD.
With the implementation of the project, poorer section of society living around the project area
would be benefited from access to employment, education, medical and other utilities. This
section of the population would also have access to market and many other unskilled jobs for
the entire operation period of the project.
Increase in surrounding land value
The value of land around project has already increased significantly with the announcement of
the project. It is expected that the value of surrounding land will further enhance once the
implementation of project starts Villagers around the project site will reap the benefit of
enhanced value of the land. The project will also bring in many workers of different categories
who will be looking for accommodation outside the project boundary. Local people will have
continuous source of earning by letting out their house for accommodation to these families.
Impact is beneficial ++
4.3.7 Ecology
4.1.1.16 Ecological Parameters
The project will comprise of residential area, commercial, industrial area, open and green area.
The Site is situated close to many water bodies particularly the Hetawane Dam is situated at a
distance of approx. 5km from the T1 site. The project site is irregular in shape and overlooks
the River Bhogeshwari & Balganga. The site has rocky terrain, with a little vegetation cover.e
After the Hetawane dam , the downstream portion of Bhogeshwari river runs to the North of
the T1 site in a East to West direction.. The existing irrigation channel originating from the
Hetawane dam passes next to T1 site and as the contour of T1 are much higher than the water
level in the channel.
The major components and the allied infrastructure and facilities of proposed project:
residential area, industrial area and economic zone will be setup in land parcels which are non-
fertile/low fertility and non-irrigated with no major vegetation. Hence it is envisaged that there
will not be significant impact on ecology due to development works for proposed project within
site as the forest land is
4.1.1.17 Major Impacts
In general, the potential impacts associated with the construction phase of the development can
be summarized under the following areas of impact:
➢ Air Pollution: Effects on Fauna and Flora
Damage to Fauna – Air pollution harms animals and wildlife in many ways. The
increased ozone level in atmosphere damages the lung tissues in animals. Air pollution
also produces acid rain that results in leaching of aluminum from the soil, thus, killing
the fish. The harmful particulate particles suspended in the air affects the respiratory,
circulatory and nervous system of the animals. Even the migration cycle of birds and
animals get disturbed due to air pollution as smog creates confused vision for them.
Damage to Flora – Trees may also get affected from air pollution through different
ways including eutrophication. While acid rain makes the soil poisonous and adversely
affects the growth and survival of plants, the ground level ozone causes respiratory
problems in plants by blocking the stomata in plants.

Final EIA Report – Orange Smart City, Pen, Raigad July 2018
267 ORANGE SMART CITY INFRASTRUCTURE PVT. LTD.
Adverse effects on flowering quality of plants – Air pollution may also affect the
flowering quality of plants. Due to cement dust and other pollutants in the air, crusts
are formed on the flowers, giving them a poor quality and look. Moreover, the plants
do not get to grow well in excessive air pollution and give poor flowering results.
➢ Water pollution on aquatic habitat
Due to increased construction activites, there could be direct impact on the aquatic
habitat incase of land parcel T3 which is close to the creek. Dust and smoke from the
construction activites can affect the growth of the mangroves.
➢ Habitat fragmentation
Habitat fragmentation affects the wildlife movement and presence of microhabitats.
➢ Existing fields in the vicinity of the project site
Increased levels of chlorine, ammonia, ethylene, carbon monoxide, and other harmful
gases are putting food crops in danger. The decreased food crop and poor quality of
crop are also results of air pollution. The harmful effects of air pollution can be observed
on the leaves, roots, flowers and fruits of plants.
The potential impact on ecology during the construction phase will be primarily due to the
following activities:
➢ Site clearance,
➢ Excavations,
➢ Site formation,
➢ Filling of habitats with spoil
➢ Waste disposal
The construction activities will entail site clearance and development activities which will lead
to loss of vegetation and tree felling within the delineated area for the development of the
various projects. The loss of vegetation will result in destruction of habitats for small mammals
and birds. The project related construction activities involving noise and vibrations,
construction vehicle movement, illumination at the project site will have adverse impacts on
flora and fauna. Use of wood as fuel by cutting trees in the nearby area by construction labour
may also result as a threat to the ecology of the area.
Unplanned storage of construction raw material and indiscrete disposal of construction debris
can result in contamination of soil and water bodies in the proximity, which may also lead to
increase in turbidity of water and increase siltation towards mouth of river. High turbidity and
presence of construction debris can result in damage to aquatic habitats.
Impact on Flora:
The major impact on flora associated with the development will occur during the construction
phase of the project. The major impacts at this stage will be the loss of natural vegetation and
transformation and disturbance of natural ecosystems at the site.
Varying degrees of risks are also anticipated in view of the presence of a sizeable construction
workforce and the operation and presence of construction machinery at the site.
In general, the major impacts associated with the construction phase of the development can
be:
➢ Destruction and loss of habitat & deposition of dust

Final EIA Report – Orange Smart City, Pen, Raigad July 2018
268 ORANGE SMART CITY INFRASTRUCTURE PVT. LTD.
➢ Impact on plant / trees due to uprooting / cutting / trimming
The selection of development site and the master plan for OSC is planned in a manner so as to
maintain maximum existing flora and fauna, minimum interference with existing vegetation.
During site preparation only, some vegetation mostly comprising wild shrubs, grasses and
herbs and some will be removed. Although mangroves are present adjacent to the project
boundary in one of the land parcel, any disturbance or impact to them during construction is
ruled out as they are more than 500m from the project boundary. Construction phase would
require proper monitoring of movement of workers, Vehicles etc. to restrict any movement in
mangrove area.
Agriculture activities practiced in the close vicinity of of the development may impacted to
some extent due to of dust generation but mitigative measures such as regular water sprinkling
on active areas for example hole roads, dumpsites should be strictly followed so that impact is
minimized.
Impacts on fauna
The development of the site would directly impact the fauna of the site in several different
ways. Firstly, the loss of vegetation or habitat will lead to death or moving of the fauna from
the project site. The anticipated noise pollution and disturbance associated with the
construction phase including equipment noise. This would frighten many of the larger
mammals away from the area and would probably cause increased pressures and survival fight
among these individuals as they would have to move into sub-optimal habitat or compete with
other individuals for new territories.
There are no major faunal species observed within the project area. All the aquatic and marine
fauna is outside the actual project site. Therefore, other than small invertebrates, no major loss
of faunal biomass is envisaged. Moreover, the core does not have much of the wildlife, but
however the increased noise level during construction phase can disturb the resident bird
population. This disturbance is temporary & potential noise impacts would be restricted within
the site.
The effect due to noise pollution and disturbance associated with construction would be
transient and affected species would be able to return once construction has been completed.
However, the presence of the newly developed structures & population may deter sensitive
species from returning or would require some time for them to become habituated to their
presence. Secondly, the transformation of intact vegetation would constitute habitat loss and
fragmentation for fauna.
Apart from the direct loss of vegetation, this will also render the disturbed areas vulnerable to
erosion. The extent of the impact will be limited to the development footprint and near
surroundings. Erosion may however also affect adjacent and downstream areas but proper
measures are incorporated to protect the top soil layer & erosion control and for use later. Green
belt development on cleared areas will alleviate the erosion problem.
No protected / rare or endangered plant species were observed within the development footprint
indicating that there will not be any impact on the protected species. The project area does not
encroach into any wildlife sanctuary or any other type of protected area.
Before the publication of the Karnala Eco-sensitive Zone notification no. S.O.230 (E) dated
22nd January 2016, the distance of the project site was around approx. 16.5 kms from the
Karnala Bird sanctuary, but after the promulgation of the aforesaid notification, the distance of
Final EIA Report – Orange Smart City, Pen, Raigad July 2018
269 ORANGE SMART CITY INFRASTRUCTURE PVT. LTD.
the nearest land parcel T3 is approximately 6.7 km from the buffer zone of Karnala Bird
Sanctuary and therefore no significant impact is envisaged.
Broad Principles for Identification of Pristine Areas
The pristine areas are sites of significance for conservation of biodiversity (floral and faunal)
and forest types that are unique and ecologically important. Besides these, the forested areas
having high density coverage that are important for rendering invaluable ecological services,
also need protection and conservation for sustainability of these services through the
generations. Similarly the identification of the areas was carried out depending upon the
secondary data & primary data.
• Forest Type:
Of the 178 forest types identified in the country's forests as per 'Champion and Seth'
classification (1968), many of them are unique (and therefore irreplaceable) to a particular site
while some of these forest types, such as Tropical Wet Evergreen forests, are ecologically
sensitive as they harbor a wide range of species diversity. Likewise, there are several forest
types (e.g. Myristica swamp forest, reed breaks, desert dunes scrub etc.) which are either very
small in extent and are found in one or few localities in the entire country and are hence
irreplaceable. Based on the principles of their comparative ecological significance, extent and
range, uniqueness etc. an attempt has been made to score these types on a scale of 1-100.
• Forest Cover:
Forest cover density is an important parameter for assessing the health of a forest ecosystem.
Biennial estimates of forest cover in country are made by Forest Survey of India and presented
in India State of Forest Report (ISFR). As per ISFR 2011, very dense forests (having crown
density more than 7o %) constitute only 2.54% of the geographical area, while moderately
dense forest (having crown density from 4o % to 70 %) and open forest (having crown density
from in % to 40 %) are 9.76% and 8.75% respectively.
• Landscape Integrity
Integrity of landscape is an important factor to ensure integration of various elements of
habitats, thereby fulfilling the requirement of connectivity, livelihoods and contiguity among
them, besides lending aesthetic values. The world over, landscape approach is being adopted
in land resources management and conservation. From biodiversity prospective also, it
provides necessary gradients for species movement and their dispersion, thus ensuring their
sustainability. Based on the land-use pattern and vegetation, some areas representing integrity
of landscape, therefore, need to be protected for aforesaid reasons.
• Hydrological Value:
Forests play important role in maintenance of hydrological cycle. Water is regarded as one of
the important products of the forests. Maintenance of forest cover in catchment area of first
order perennial streams is important for survival of these streams.
• Wildlife Value:
The country has a network of protected areas (PAN) in its forests. Although, global average
for PAN coverage is 12%, India has only 4.9% of its geographical area under PAN comprising
notified sanctuaries and national parks. These areas enjoy legal protection under Wild Life
(Protection) Act, 1972 and specific provisions thereto, prohibit diversion of these areas for
activities which are ecologically incompatible and may adversely affect their integrity. These
PAs should therefore, be treated as inviolate. However, besides the protected areas, there are

Final EIA Report – Orange Smart City, Pen, Raigad July 2018
270 ORANGE SMART CITY INFRASTRUCTURE PVT. LTD.
corridors that connect these and special wildlife habitat such as Nvetlands, breeding sites of
important bird species, congregation sites which also need to be conserved and preserved for
the persiStence of biodiversity. Based on these considerations, scoring criteria have been
developed for assigning wildlife values to a site.
Assigning Score for Each Parameter
Forest Cover
1. The FSI estimates forest cover of the country at an interval of every two years and
publishes it is in the form of State of Forest Reports.
2. Score for forest cover will be average of the gross forest cover and weighted forest
cover, both expressed as fraction of the total area, multiplied by one hundred.
3. Gross forest cover will be the sum-total of the area of the open forest, moderately dense
forests and the very dense forests3.
4. Based on the functional value and abundance/rarity, each forest type has been assigned
a score on 0 to 100 scale.
5. This region comes under Southern Dry Mixed Deciduous Forest and is scored at
40 as the area mainly consists of dry shrubs & grasses along with very little
canopy.
Forest Type
1. FSI has prepared forest type map by mapping of 178 forest types (of natural
origin) and plantations/ trees outside forests available in the country.
2. Based on the functional value and abundance/rarity, each forest type has
been assigned a score on 0 to 100 scale.
3. This region comes under Southern Dry Mixed Deciduous Forest and is scored at 40 as the area mainly consists of dry shrubs & grasses along with very little
canopy.
Wildlife Value
1. All protected areas notified under Wild Life (Protection) Act, 1972 would automatically
be categorised as inviolate. However, the score for wildlife value of areas falling
outside PAN would be based on its intrinsic value as wildlife habitat.
2. This areas is located outside the protected area network but having presence of more
than 5 Schedule-I wildlife species and hence the total score of this area is 60.
Landscape Integrity
1. Depending on the level of fragmentation, size and distance from boundary of the un-
fragmented landscapes in which these areas are located, a score of 0 to l00 scale will be
assigned.
2. As this area is located in the totally fragmented landscapes having not a single un-
fragmented patch of size more than 5.00 hectare within and 2 km
distance from boundary of the cell, the score is 0.
Hydrological Value

Final EIA Report – Orange Smart City, Pen, Raigad July 2018
271 ORANGE SMART CITY INFRASTRUCTURE PVT. LTD.
1. The score for hydrological value of an area will be based on utility of area as catchment
for a perennial/seasonal stream/river, economic importance of the river/ streams fed by
the catchment and distance from river/stream/wetland bank etc.
2. As this area is located in catchment area of perennial rivers having no hydro power/
irrigation/multi-purpose projects on them and also not being a part of the catchment
area of a first order perennial stream the score is 55.
Cumulative Value:
Averaging the score of forest cover (40), forest type (40), wildlife value (60), landscape
integrity (0) & hydrological value (55), the total score of the area is 39.
4.1.1.18 Mitigation
The mitigation measures shall be implemented by each individual project based on its
applicability to the activities and processes. The project authorities set shall supervise and
monitor the performance of all project contractors during construction.
Tree Felling
All projects envisaged in future (Industrial and/or Residential) shall ensure that no felling of
trees is taken up unless necessary, however the wherever possible trees shall be transplanted
the construction contractors shall be instructed to avoid tree cutting and avoid disturbance to
ecology to the extent possible;
Emphasis will be on growing nesting and birds, butterflies, insect and other fauna attracting
trees while development of green belt
In addition, the awareness program will be conducted for site incharge, labours, drivers & local
community about the ecology &biodiversity so as to minimize any potential impacts due to
their unawareness
No hunting activity shall be permitted within and around the delineated area and strict
guidelines will be given to contractors to ensure that such activities are not allowed;
All project proponents shall ensure implementation of measures to control silt/sediments during
construction phase and special attention should be given to containment systems in project-
related dumping-sites to prevent leaching of foreign materials into the surrounding
environment;
The project activities shall ensure that storage of raw material and debris are kept away from
water bodies, streams and run off areas to avoid any increase in turbidity or sedimentation in
the key rivers of the area.
The impact of the construction activities on the existing fields in the vicinity of the project site
will be pronounced in the form of dust generation from the various activities such as
excavation, site levelling etc. Various measures such as use of water sprinklers for dust
suppression and the wetting of the stockpile have been suggested to minimize the impact due
to the dust generation from the various activities during the construction phase.
Disturbance due to Noise and Visual Intrusions
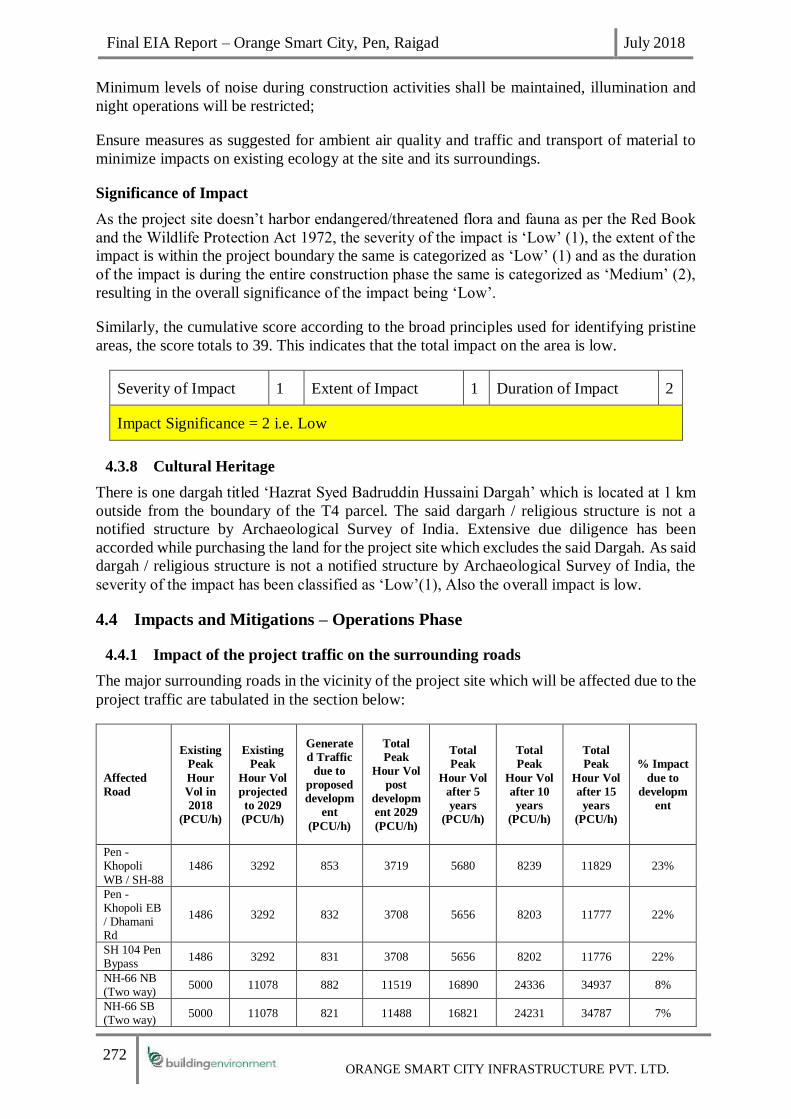
Final EIA Report – Orange Smart City, Pen, Raigad July 2018
272 ORANGE SMART CITY INFRASTRUCTURE PVT. LTD.
Minimum levels of noise during construction activities shall be maintained, illumination and
night operations will be restricted;
Ensure measures as suggested for ambient air quality and traffic and transport of material to
minimize impacts on existing ecology at the site and its surroundings.
Significance of Impact
As the project site doesn’t harbor endangered/threatened flora and fauna as per the Red Book
and the Wildlife Protection Act 1972, the severity of the impact is ‘Low’ (1), the extent of the
impact is within the project boundary the same is categorized as ‘Low’ (1) and as the duration
of the impact is during the entire construction phase the same is categorized as ‘Medium’ (2),
resulting in the overall significance of the impact being ‘Low’.
Similarly, the cumulative score according to the broad principles used for identifying pristine
areas, the score totals to 39. This indicates that the total impact on the area is low.
Severity of Impact 1 Extent of Impact 1 Duration of Impact 2
Impact Significance = 2 i.e. Low
4.3.8 Cultural Heritage
There is one dargah titled ‘Hazrat Syed Badruddin Hussaini Dargah’ which is located at 1 km
outside from the boundary of the T4 parcel. The said dargarh / religious structure is not a
notified structure by Archaeological Survey of India. Extensive due diligence has been
accorded while purchasing the land for the project site which excludes the said Dargah. As said
dargah / religious structure is not a notified structure by Archaeological Survey of India, the
severity of the impact has been classified as ‘Low’(1), Also the overall impact is low.
4.4 Impacts and Mitigations – Operations Phase
4.4.1 Impact of the project traffic on the surrounding roads
The major surrounding roads in the vicinity of the project site which will be affected due to the
project traffic are tabulated in the section below:
Affected
Road
Existing
Peak
Hour
Vol in
2018
(PCU/h)
Existing
Peak
Hour Vol
projected
to 2029
(PCU/h)
Generate
d Traffic
due to
proposed
developm
ent
(PCU/h)
Total
Peak
Hour Vol
post
developm
ent 2029
(PCU/h)
Total
Peak
Hour Vol
after 5
years
(PCU/h)
Total
Peak
Hour Vol
after 10
years
(PCU/h)
Total
Peak
Hour Vol
after 15
years
(PCU/h)
% Impact
due to
developm
ent
Pen - Khopoli
WB / SH-88
1486 3292 853 3719 5680 8239 11829 23%
Pen - Khopoli EB / Dhamani Rd
1486 3292 832 3708 5656 8203 11777 22%
SH 104 Pen Bypass
1486 3292 831 3708 5656 8202 11776 22%
NH-66 NB (Two way)
5000 11078 882 11519 16890 24336 34937 8%
NH-66 SB (Two way)
5000 11078 821 11488 16821 24231 34787 7%

Final EIA Report – Orange Smart City, Pen, Raigad July 2018
273 ORANGE SMART CITY INFRASTRUCTURE PVT. LTD.
Ambivali Road / Balavali Road
149 329 492 575 1023 1518 2179 86%
Davansar Road
149 329 391 525 910 1345 1931 75%
Mumbai-Pune Expressway
6534 14477 40 14497 20828 29906 42934 0.3%
Old NH-4 3442 7626 9 7630 10958 15732 22586 0.1%
The tabulated data reflects that the major affected roads are Pen-Khpoli WB/ SH-88, Pen
Khopoli EB/Dhamani road, SH 104 Pen Bypass. The percentage impact due to development
of the Orange Smart City on the SH-88, Dhamani road and SH-104 is 23%, 22% and 22%
respectively. The capacity analysis of the surrounding roads was also conducted with the level
of the service of the roads keeping in view the project traffic due to the Orange Smart City. The
capacity analysis of the adjoining roads is tabulated in the section below:
Road
Base
Capacity
(PCU/h)
Adjustme
nt factor
for c/w
(fw)
Adjustme
nt factor
for paved
shoulder
(fps)
Adjustme
nt factor
for
directiona
l split (fds)
Adjustment
factor for
road
geometry
(fds)
Capacity
, C
(PCU/h)
Existing Vol
Estimate, V
(PCU/h)
V / C Existing
LOS
Pen -
Khopoli
WB /SH-88
1754 0.95 1.22 1 1 2033 1486 0.73 D
Pen -
Khopoli EB
/ Dhamani
Rd
1754 0.95 1.22 1 1 2033 1486 0.73 D
SH 104 Pen
Bypass 1754 0.8 1.2 1 1 1684 1486 0.88 E
NH-66 2434 1.14 1.55 1 1 4301 5000 1.16 F
Mumbai-
Pune
Expresswa
y (Pune to
Mumbai)
7370 1 1 1 1 7370 3267 0.44 B
Mumbai-
Pune
Expresswa
y (Mumbai
to Pune)
5245 1 1 1 1 5245 3267 0.62 C
Old NH-4
(Pune to
Mumbai)
3636 1 1 1 1 3636 1721 0.47 C
Old NH-4
(Mumbai to
Pune)
3632 1 1 1 1 3632 1721 0.47 C
The tabulated data reflects that the existing level of service for adjoining roads varies from B
to F wherein LOS ‘B’ to LOS ‘F’ represents the best to the worst conditions in terms of catering
to the traffic. In this context the Mumbai - Pune Express way has the LOS ‘B’ reposenting the
best roads conditons w.r.t catering to the traffic volume while NH-66 has the relatively difficult
conditions w.r.t catering to the traffic volume.
4.4.2 Ambient Air Quality
Though the project operations commence from the year 2029, 2035 also has been considered
for the purposes of air quality modelling exercise. The major source of air pollution during the
operation phase is the traffic plying on the roads which include the project traffic. Also, the

Final EIA Report – Orange Smart City, Pen, Raigad July 2018
274 ORANGE SMART CITY INFRASTRUCTURE PVT. LTD.
D.G sets used as the back up power source will also contribute to the air emissions. The traffic
on following roads is considered for impact assessment:
➢ Balavali Road
➢ NH-66
➢ SH-88
The following table presents the emission rates from the traffic movement on these roads
including the project traffic. The Euro IV emission factors have been considered for estimating
the emission from the traffic.
Table 4-12 : Emission due to the projected traffic in 2029 and 2035
Sr
No
Y
e
a
r Road
No of vehicles (vehicles/Hour) Emission Factor (g/s/sq.m)
2-W 3-W 4-W LCV Bus Truck Total CO Nox PM10
1 2
0
2
9
Balavali
Road 983 246 249 0 62 0
1540 1.30E-04 2.48E-05 2.46E-06
2 NH66 2136.5 363 2968 195 156 320.5 6139 1.57E-04 5.62E-05 1.09E-05
3 SH88 1127 231 1029.5 107 79 199.5 2773 7.97E-05 3.10E-05 6.33E-06
4 2
0
3
5
Balavali
Road 1111 278 298 0 72 0
1759 1.35E-04 2.84E-05 2.83E-06
5 NH66 3929.5 718 4770 365 282 564.5 10629 2.68E-04 1.01E-04 1.94E-05
6 SH88 2351 509 1772.5 227 163 298 5320 1.53E-04 5.62E-05 1.04E-05
4.1.1.19 Prediction for Year 2029
The resultant concentrations of CO, NOx and PM10 are presented in Table 4-13.
Table 4-13 : Resultant concentrations of CO, NOx and PM10 (Year 2029)
Emission Prediction for 2029
CO µg/m3 NOx, µg/m3 PM10, µg/m3
Receptor Baseline Predicted Total Baseline Predicted Total Baseline Predicted Total
AQ1 650 106.252 756.25 50.23 12.074 62.3 50.23 2.312 52.54
AQ2 0 55.912 55.91 22.37 6.803 29.17 53.43 1.251 54.68
AQ3 0 131.229 131.23 23.12 14.685 37.81 49.32 3.621 52.94
AQ4 600 95.265 695.27 28.23 12.454 40.68 60.81 2.405 63.22
AQ5 0 1224.204 1224.2 22.23 80.268 102.5 42.73 11.242 53.97
AQ6 0 77.182 77.18 20.3 7.757 28.06 43.11 1.852 44.96
AQ7 400 98.126 498.13 29.12 23.415 52.54 56.59 2.704 59.29
AQ8 0 134.7 134.7 20.2 16.586 36.79 40.03 3.132 43.16
AQ9 0 60.176 60.18 22.35 7.473 29.82 41.1 1.793 42.89
AQ10 400 44.153 444.15 28.84 19.968 48.81 64.11 1.407 65.52
AQ11 0 61.029 61.03 22.35 9.792 32.14 41.09 1.984 43.07
AQ12 0 52.726 52.73 23.46 8.831 32.29 52.95 1.228 54.18

Final EIA Report – Orange Smart City, Pen, Raigad July 2018
275 ORANGE SMART CITY INFRASTRUCTURE PVT. LTD.
AQ13 0 111.675 111.68 24.54 11.72 36.26 52.19 2.811 55
AQ14 0 16.271 16.27 23.43 3.165 26.6 49.3 0.539 49.84
NAAQS 2000 µg/m3 80 µg/m3 100 µg/m3
Results and discussion
a) CO
The Table 4-13 reflects that the minimum resultant CO concentations was at the location AQ14
(16.27 µg/m3) while the maximum resultant concentration was at AQ5 (1224 µg/m3). The
maximum resultant concentration of CO was found to be within the NAAQS limit for CO (2000
µg/m3) for the year 2029.
The isopleths of CO for the year 2029 are depicted in Figure 4-5.
Figure 4-5 : Isopleths depicting the resultant concentrations of CO due to combined
operations of the D.G sets and traffic -2029
b) NOx
The Table 4-13 reflects that the minimum resultant NOx concentations was at the location
AQ14 (26.6 µg/m3) while the maximum resultant concentration was at AQ5 (102.5 µg/m3).
The maximum resultant concentration of NOx was found to be exceeding the NAAQS limit.
(80 µg/m3) for the year 2029.
The isopleths of NOx for the year 2029 are depicted in Figure 4-6.

Final EIA Report – Orange Smart City, Pen, Raigad July 2018
276 ORANGE SMART CITY INFRASTRUCTURE PVT. LTD.
Figure 4-6 : Isopleths depicting the resultant concentrations of NOx due to combined
operations of the D.G sets and traffic in 2029
c) PM10
The Table 4-13 reflects that the minimum resultant PM10 concentations was at the location
AQ9 (42.89 µg/m3) while the maximum resultant concentration was at AQ10 (65.52 µg/m3).
The maximum resultant concentration of NOx was found to be within the NAAQS limit. (100
µg/m3) for the year 2029.
The isopleths of PM10 for the year 2029 are depicted in Figure 4-7.

Final EIA Report – Orange Smart City, Pen, Raigad July 2018
277 ORANGE SMART CITY INFRASTRUCTURE PVT. LTD.
Figure 4-7 : Isopleths depicting the resultant concentrations of PM10 due to combined
operations of the D.G sets and traffic in 2029
4.1.1.20 Prediction for Year 2035
The resultant concentrations of CO, NOx and PM10 for the year 2035 are presented in Table
4-14.
Table 4-14 : Resultant concentrations of CO, NOx and PM10 (Year 2035)
Emission Prediction for 2035
CO µg/m3 NOx, µg/m3 PM10, µg/m3
Receptor Baseline Predicted Total Baseline Predicted Total Baseline Predicted Total
AQ1 650 196.224 846.22 50.23 21.156 71.39 50.23 4 54.23
AQ2 0 102.772 102.77 22.37 11.854 34.22 53.43 2.105 55.54
AQ3 0 221.46 221.46 23.12 26.247 49.37 49.32 6.265 55.59
AQ4 600 169.53 769.53 28.23 20.537 48.77 60.81 4.193 65
AQ5 0 1357.852 1357.85 22.23 103.03 125.26 42.73 15.335 58.07
AQ6 0 131.578 131.58 20.3 14.208 34.51 43.11 3.252 46.36
AQ7 400 172.573 572.57 29.12 32.38 61.5 56.59 4.299 60.89
AQ8 0 244.98 244.98 20.2 29.549 49.75 40.03 5.792 45.82
AQ9 0 115.281 115.28 22.35 13.347 35.7 41.1 3.238 44.34
AQ10 400 90.532 490.53 28.84 22.035 50.88 64.11 2.357 66.47
AQ11 0 138.303 138.3 22.35 17.638 39.99 41.09 3.403 44.49
AQ12 0 103.475 103.48 23.46 13.999 37.46 52.95 2.12 55.07

Final EIA Report – Orange Smart City, Pen, Raigad July 2018
278 ORANGE SMART CITY INFRASTRUCTURE PVT. LTD.
Emission Prediction for 2035
CO µg/m3 NOx, µg/m3 PM10, µg/m3
AQ13 0 185.695 185.7 24.54 20.867 45.41 52.19 4.98 57.17
AQ14 0 38.731 38.73 23.43 5.221 28.65 49.3 0.931 50.23
NAAQS 2000 µg/m3 80 µg/m3 100 µg/m3
Results and discussion
a) CO
The Table 4-14 reflects that the minimum resultant CO concentations was at the location AQ14
(38.73 µg/m3) while the maximum resultant concentration was at AQ5 (1357 µg/m3). The
maximum resultant concentration of CO was found to be within the NAAQS limit for CO (2000
µg/m3) for the year 2035.
Figure 4-8 : Isopleths depicting the resultant concentrations of CO due to combined
operations of the D.G sets and traffic in 2035
b) NOx
The Table 4-14 reflects that the minimum resultant NOx concentations was at the location
AQ14 (28.65 µg/m3) while the maximum resultant concentration was at AQ5 (125.26 µg/m3).
The maximum resultant concentration of NOx was found to exceed the NAAQS limit for NOx
(80 µg/m3) for the year 2035.
The isopleths of NOx for the year 2035 are depicted in Figure 4-9

Final EIA Report – Orange Smart City, Pen, Raigad July 2018
279 ORANGE SMART CITY INFRASTRUCTURE PVT. LTD.
Figure 4-9 : Isopleths depicting the resultant concentrations of NOx due to combined
operations of the D.G sets and traffic in 2035
c) PM10
The Table 4-14 reflects that the minimum resultant PM10 concentations was at the location
AQ9 (44.34 µg/m3) while the maximum resultant concentration was at AQ10 (66.47 µg/m3).
The maximum resultant concentration of PM10 was within the NAAQS limit for PM10 (100
µg/m3) for the year 2035.
The isopleths of PM10 for the year 2035 are depicted in Figure 4-10.

Final EIA Report – Orange Smart City, Pen, Raigad July 2018
280 ORANGE SMART CITY INFRASTRUCTURE PVT. LTD.
Figure 4-10 : Isopleths depicting the resultant concentrations of PM10 due to combined
operations of the D.G sets and traffic in 2035
Signifcance of the Impact
As the per the modelling results, the predicted concnetrations of NOx for year 2035 are not
exceeding the NAAQS standard during the operation phase except at AQ5, therefore the
severity of the impact is moderate (2), also as the extent of the impact is within the 10 km of
the project boundary the extent is categorized as Moderate (2) and as the duration of the impact
is regular, the same is categorized as high (3) and subsequently the impact has been ranked as
‘Moderate’.
Severity of Impact 2 Extent of Impact 2 Duration of Impact 3
Impact Significance = 12 i.e. Moderate
Mitigation Mesasures
• Comprehensive planning has been undertaken as a part of master plan development to
mitigate impacts due to industries.
• Planning ensures that the proposed Industrial areas and existing residential are placed in such
a way to avoid the impact of air pollution on people.
• Vehicular traffic management plan to be implemented so as to maintain the smooth traffic
flow and avoid congestion during normal operations.
• Adequate buffer to be provided for Residential areas and industries.

Final EIA Report – Orange Smart City, Pen, Raigad July 2018
281 ORANGE SMART CITY INFRASTRUCTURE PVT. LTD.
• Individual industries will be required to obtain adequate approvals such as Consent to
Establish / Consent to Operate or Environment Clearance from MPCB / SEIAA / MoEF.
• All emission sources to be provided with adequate stack height as per CPCB / MoEF norms.
• Low emission fuels to be used by industries.
• Air pollution control equipment to be deployed by industries.
• Good housekeeping to be practiced.
• PP to organize seminars and Capacity Building training programmes about the best practices
in different industrial sectors.
• PP in association with the MPCB to regularly monitor the environmental performance of the
industries.
• CETP – to be provided with adequate ventilation system to prevent emissions such as HAPs,
Odour etc. The adequate management practices to be adopted to control and mitigate the air
emissions during CETP operations;
• Waste Management Facility: Odour control measures to be adopted. The adequate
management practices to be adopted to control and mitigate the air emissions during facility
operations;
• All maintenance activities should ensure that the dust control measures are applied.
• It is seen from the results of the air quality modeling that NOx is exceeding the prescribed
NAAQS standards at some locations. The propoenent has proposed the use of electric vehicles
within the OSC with the charging points to mitigate the impact of NOx.
• Under the National Electric Mobility Mission Plan (NEMP) the government is laying
emphasis on the adoption of electrical vehicles which will reduce the emissions by indirectly
lessening the pollution load on the environment.
• The BS VI emission standards are planned to be enforced by government by 2020 which will
result in emission reduction significantly.
• The upcoming infrastructural facilties in the vicinity of the project site such as elevated free
corridor will result in considerable reduction in the traffic on the adjoining roads which will
further reduce the emissions to a large extent.
4.4.3 Water
The potential impact on the water resources and the water quality during the operation phase
can arise from the following:
4.1.1.21 Water resources
The water resources can get impacted from the residential and commercial establishments
(water consumption), industrial establishments (Waste generation and storage, Industrial
processes and operations, Water Consumption, Storage of chemicals/ flammables/hazardous
materials), operation of the utilities, disposal of the treated effluent from the CETP. The water
consumption from each parcel is given in Table 4-15.
Table 4-15: The water consumption from each parcel
Land Parcel Total Water Demand (MLD)
T1 22.23
T2 4.82
T3 3.67

Final EIA Report – Orange Smart City, Pen, Raigad July 2018
282 ORANGE SMART CITY INFRASTRUCTURE PVT. LTD.
T4 7.88
Total 38.60
As reflected from the Table 4-13 above, the fresh water requirement for the OSC is 38.60 MLD.
The water will be met from the Hetavane Dam. The details of the water supply infrastructure
(including dedicated water supply, Water Treatment Plant, Clear water reservoir (GSR) and
Clear water pumping station from WTP, intermediate pumping stations etc.) are given in
Section 2.23.1 titled “Water Supply Infrastructure”
Significance of the Impact
As the consumption of the water will be continuous in nature, the severity of the impact is
classified as Moderate (2), the extent of the impact will be within the 10 km radius of the project
boundary the same has been classified as ‘Moderate’ (2) and as the duration of the impact is
regular the same has been classified as ‘High’ (3) and subsequently the impact significance has
been ranked as Moderate (12).
Severity of Impact 2 Extent of Impact 2 Duration of Impact 3
Impact Significance = 12 i.e. Moderate
Mitigation Measures
1. Monitoring of unaccounted water and detection of leakage shall be done by providing
bulk water meters to measure water consumption, inspection of all consumer meters,
fixing of new meters, testing of meters for accuracy, recording of consumptions on
installed meters to measure water supplied to the consumers;
2. Leak detection and water auditing shall be done for assessing leaks and losses;
4.1.1.22 Water Quality
The water quality can get potentially deteriorate from the residential and commercial
establishments (wastewater generation and waste generation), industrial establishments
(effluent generation, waste generation and storage, industrial processes and operations, waste
management – liquid and solid waste, influx of population, storage of chemicals/
flammables/hazardous materials), operation of the utilities, waste management facilities (waste
transportation, waste treatment/ processing, Handling and Storage of wastes, landfilling),
CETP and STP.
Sewage:
The total sewage generated and the details of the underground drains and number of STP’s per
parcel is given in Table 4-14:
Table 4-16: The total sewage generated
Land
Parcel
Total Sewage Generation
(MLD)
Underground Drains No of STPs
(Area of 3600 m2
each)
T1 11.20 4.9 1
T2 2.54 2.2 1

Final EIA Report – Orange Smart City, Pen, Raigad July 2018
283 ORANGE SMART CITY INFRASTRUCTURE PVT. LTD.
T3 2.07 2.65 1
T4 5.75 1.8 1
Total 21.56 11.55 4
According to the water balance depicted in Figure -2-26, treated wastewater to the tune of 18.06
MLD from the total amount of 21.34 MLD will be recycled back into the system for non –
potable uses such as such as HVAC, horticulture, flushing, etc. thereby minimizing the need
for treated potable water. The balance 3.28 MLD of treated wastewater will be stored in holding
ponds and given to nearby gram panchayat for use in agricultural fields / discharged in the
inland surface water body confirming to the discharge norms of CPCB. OSCIPL will be solely
responsible for the maintaining the quality of the treated sewage discharged as per the CPCB
norms. The consent from the gram panchayat is given in Annexure-VIII.
Effluent:
The total effluent generation from the industries is given in Table 4-17.
Table 4-17: The total effluent generation from the industries3
Particulars Category A industries -
Effluent generation in
MLD*
Agro & Food
processing***
Effluent generation in
MLD
Effluent Generations 0.43 1
Total Effluent treated 1.43 MLD
Proposed Capacity of CETP including MEE 2.0 MLD
Assumptions:
*Cat A industries - Bulk Drug and Drug Intermediate considered for the calculation
**Considered only Engg. Industries with allied Tier 1 and 2 Suppliers
Considered 2 plots of 5 Acres each for Poultry and Fish Processing wherein CETP is required
For the Electronics and Semiconductor industry offsite effluent take away and treatment is
preferred hence not considered in CETP calculation
The total effluent amounting to 1.43 MLD will be generated from the category ‘A’ industries
(Bulk Drug and Drug Intermediates) and Agro industries (Poultry and Fish Processing etc.),
out of which 1.18 MLD will be treated in CETP which will be Zero Liquid discharge unit.
3 As per DPR of OSC prepared by MITCON

Final EIA Report – Orange Smart City, Pen, Raigad July 2018
284 ORANGE SMART CITY INFRASTRUCTURE PVT. LTD.
Significance of the impact
As the sewage and effluent generation will be continuous in nature, the severity of the impact
is classified as Moderate (2), the extent of the impact will be within the 10 km radius from the
project boundary the same has been classified as ‘Moderate’ (2) and as the duration of the
impact is regular the same has been classified as ‘High’ (3) and subsequently the impact has
been ranked as Moderate (12).
Severity of Impact 2 Extent of Impact 2 Duration of Impact 3
Impact Significance = 12 i.e. Moderate
Mitigation Measures:
The following general mitigation measures are proposed for alleviating the impact of the
sewage and effluent generation:
➢ Minimize flow variation from the mean flow
➢ Storing of oil wastes in lagoons should be minimized in order to avoid possible
contamination of the ground water system.
➢ All effluents containing acid/alkali/organic/toxic wastes should be properly treated.
➢ Monitoring of ground water
➢ For wastes containing high TDS, treatment methods include removal of liquid and
disposal of residue by controlled landfilling to avoid any possible leaching of the fills
➢ Neutralization and sedimentation of wastewaters, where applicable
➢ Dewatering of sludges and appropriate disposal of solids
➢ In case of oil waste, oil separation before treatment and discharge into the environment
➢ By controlling discharge of sanitary sewage and industrial waste into the environment.
For synthetic Organic chemicals industries:
➢ Develop spill prevention plans in case of chemical discharges and spills
➢ Develop traps and containment system and chemically treat discharges on site
➢ Treated wastewater (such as sewage, industrial wastes, or stored surface runoffs) can
be used as cooling water makeup.
4.1.1.23 Impact due to the abstraction of ground water
OSC will not extract / abstract ground water for its routine operations and also make it binding
on the individual industries, residential and commercial areas to discourage the use of ground
water thereby minimizing the impact on the ground water. As the severity of the impact is
‘Low’, the extent is also Low and the duration is also ‘Low’, the overall impact rating is
classified as ‘Low’
Severity of Impact 1 Extent of Impact 1 Duration of Impact 1
Impact Significance = 1 i.e. Low
Additional measures
Adequate water supply shall be made available to individual projects to discourage the use of
groundwater.

Final EIA Report – Orange Smart City, Pen, Raigad July 2018
285 ORANGE SMART CITY INFRASTRUCTURE PVT. LTD.
The proposed developments will result in increase in paved areas, thereby resulting in increased
runoff. During planning stage, it has been suggested that the increased runoff shall be tapped
for rainwater harvesting.
4.1.1.24 Impact due to the increased surface runoff
The development of the plot as Industrial Integrated Township will result in change in land use
which thereby results in increased surface run off.
As the proposed run off will be intermittent only peaking during the rainy season, the severity
has been categorized as ‘Low’ (1), the extent of the impact will be beyond the 10 km radius of
the project site boundary, the extent has been categorized as ‘High’ (3) and as the duration will
be periodic the same will be Moderate (2) resulting in the impact ranking as ‘Low’.
Severity of Impact 1 Extent of Impact 3 Duration of Impact 2
Impact Significance = 6 i.e. Moderate
Mitigation Measures:
There is a direct relationship between the velocity of water flowing over exposed soil and the
rate of erosion. Installation of various artificial recharge structures on the site to retard the
overland water flow is an effective measure to reduce erosion in areas where high water flows
are expected. It is desirable to minimize continuous slopes where flowing water can scour the
top soil and result in erosion.
Even though the proposed activity shall occupy 1042 acres of land, the covered area occupied
by industrial sheds, residential quarters/ colonies is going to be less than 47%. The agriculture
in this neighborhood is principally rain-fed single crop agriculture. Still, it is advised to develop
a green belt within the project area.
The development of the plot shall result in increase in covered area thereby to boost surface
run off; but it is also advised to be countered with rainwater harvesting within the project
premises and surrounding area.
Working in Waterways, Floodplains and Creek: The site Govirle is located along bank of creek.
Hence, it is necessary to adopt appropriate precautionary measures. It is advised to develop the
low-lying plots as green belts so as to have minimal disturbance in case of any mishap.
Rainwater Harvesting Potential for Integrated Industry Hub
The run off calculations and the rainwater harvesting potential in the OSC is given in the section
below:

Final EIA Report – Orange Smart City, Pen, Raigad July 2018
286 ORANGE SMART CITY INFRASTRUCTURE PVT. LTD.
The tables in the above section reflect that the post project runoff from the various land uses in
the OSC amounts to yearly total of 5257839 cu.m. Thus, the OSC project may attain self-
sufficiency on water front if it adopts rainwater harvesting to maximum possible extent.
As the study area is occupying a steeply sloping, hilly terrain, it forms a prominent run off
zone. Hence it is advised to recharge the groundwater artificially by nalla bunds, check dams,
gabions, etc. so as to induce the recharge in open areas and to adopt rooftop rainwater
harvesting in industrial and residential areas for artificial recharge.
Even though these structures will not harvest incident rainfall significantly, still they will help
to improve the water balance in this region and also contribute in soil and water conservation.
Significance of Impact
Severity of Impact 2 Extent of Impact 2 Duration of Impact 2
Impact Significance = 6 i.e. Moderate
4.4.4 Soil
The activities that can have potential impacts on the soil quality are residential and commercial
establishments (waste water generation, waste generation), Industrial establishments (Effluent
Generation, Waste generation and storage, Industrial processes and operations, Waste
Management- Liquid and Solid Waste ,Storage of Chemicals/flammables/hazardous material),
Waste Management facilities (Waste transportation, Waste treatment/processing, Handling and
Storage of wastes , Landfilling), CETP /STP (Wastewater collection (Tankers/ Pipelines,
Treatment & other operations, Disposal)
As the generation of the solid /industrial waste will be intermittent in nature, the severity has
been classified as ‘Low’ (1) , the extent of the impact will be restricted to the project site the
same has been categorized as ‘Low’ (1) and as the duration of the impact will be periodic, the
same has been categorized as ‘Moderate’ (2) resulting in the impact ranking as ‘Low’
Significance of Impact
Severity of Impact 1 Extent of Impact 1 Duration of Impact 2
Impact Significance = 2 i.e. Low
4.1.1.25 Mitigation Measures
Individual industries will dispose of their hazardous waste through Mumbai Waste
Management Ltd (MWML). The letter of intent from the MWML has been enclosed as
Annexure-IX. The sewage from the OSC will be treated in four STPs and then used for non-
potable uses such as horticulture, HVAC makeup, flushing.
The domestic solid waste from the OSC will be properly segregated at source into
biodegradable, non-biodegradable, and inerts. The biodegradable waste will be composted,
while inerts will be landfilled within OSC thereby minimizing the impact on the soil quality.
Individual IT industries will tie up with authorized e-waste recycler to dispose off the same.
The hazardous waste oil from the D.G. sets will be sent to MWML for disposal

Final EIA Report – Orange Smart City, Pen, Raigad July 2018
287 ORANGE SMART CITY INFRASTRUCTURE PVT. LTD.
4.4.5 Noise
During operational phase, the only sources going to be present at the project site are the DG
Sets, the Sewage treatment plant which would have multiple Blowers, Pumps etc., the
combined noise of which is assumed at 90 dB after installation of Acoustical Enclosures for
Blowers and Pumps, and the vehicular movement, the noise contribution of which is minimal.
The impact of the noise environment from the above noise sources has been gauged through
the noise modelling study results of which are presented in below Table 4-18.
Table 4-18: Results of noise modelling study (Operational Phase)
During the operational phase, increase of approximately 0.1 dB ~ 1.1 dB is predicted at the
Noise monitoring locations, depending on their baseline noise levels. For the Belawade Village
located at at 50 meters from the project site, and allowable CPCB noise level of 55 dB, it is
predicted that there would not be an increase beyond 1.1 dB for any distance beyond 50 meters
from the project site, and the Sound Pressure Level even during the operational Phase would
be within the allowable CPCB limit.
Contribution due to vehicular movement is likely to be even less than 80 dB, and it would be
significant only during morning and evening peak hours, hence no mitigations are required for
this source of noise.
During the operational phase, the impact on the noise environment is negligible (0.1~1.1 dB
for distances of up to 200 meters from the project site).
Beyond a distance of 250 meters from the project site, there will not be any increase in the
Sound Pressure Levels.
Increase of approximately 6 dB was predicted at Noise Monitoring locations located within 50
meters from the project boundary during the construction phase. Beyond 100 meters, the
increase predicted is 2.1 dB at 100 meters, 1.1 dB at 150 meters and 0.8 dB beyond 200 meters
distance from project boundary. This increase would be controlled by installing Sound-
Reflective corrugated sheets as Noise reflective barriers around the project site boundary.
Significance of the Impact
As the predicted values of the noise levels are within the 90% of the existing standards, the
severity of the impact has been categorized as ‘Low’ (1), the extent of the impact is within the
10 km radius of the project site hence, the same has been categorized as Moderate (2) and as
the duration of the impact is regular the same has been categorized as ‘High’ (3) resulting in
the impact ranking to be ‘Medium’ (6)

Final EIA Report – Orange Smart City, Pen, Raigad July 2018
288 ORANGE SMART CITY INFRASTRUCTURE PVT. LTD.
Severity of Impact 1 Extent of Impact 2 Duration of Impact 3
Impact Significance = 6 i.e. Moderate
Mitigation Measures
The mitigation measures are tabulated below:
Table 4-19: Mitigation measures during operational phase
Sr. Machinery / Equipment
Description
Predicted SPL
at 1 m distance
Mitigations Required
1. DG Sets (Multiple Numbers) <85 dB Diesel Generator Sets are
supposed to have Sound
Pressure Levels of lesser than
75 dBA when measured at 1
meter distance. However,
when multiple DG sets are
supposed to be kept close to
one another, a single
Acoustical Enclosure
combined for all the DG Sets
is recommended with a
minimum Transmission Loss
Rating of 30 dBA.
2. Submersible Pumps 80~85 dB Submersible type de-watering
pumps have lower Sound
Pressure Levels than 80 or 85
dB, therefore no mitigations
are necessary for this source
of noise.
3. Cranes / Hoists < 80 dB. Cranes usually are silent and
have noise levels of less than
80 dB in case they are
electrically driven and no
mitigation is necessary for the
same.
In case the cranes are driven
using an engine, in that case,
Acoustical Enclosure with 20
dB Transmission Loss Rating
is recommended for the
engine and the driving
mechanism.

Final EIA Report – Orange Smart City, Pen, Raigad July 2018
289 ORANGE SMART CITY INFRASTRUCTURE PVT. LTD.
Sr. Machinery / Equipment
Description
Predicted SPL
at 1 m distance
Mitigations Required
4. Sewage Treatment Plant 100 dB 1. STP consists of multiple of
blowers and pumps, out of
which blowers can generate
noise levels exceeding 100
dB. Acosutical Enclosures for
STP Blowers are strongly
recommended, with 30 dB
Transmission Loss Rating.
8. Additional Mitigations /
Care to take
N/A Sound Reflective barriers to
be installed at the boundary of
the project site.
All people working in the
vicinity of the
Equipment/Machinery with
Sound Pressure Levels higher
than 90 dB should wear
protective ear plugs to avoid
permanent hearing damage.
4.4.6 Ecology
The following section presents the impacts envisaged during the operation phase of the project.
The OSC comprises of industrial and residential developments along with commercial,
institutional landuses. About 390 acres of industrial area will be developed and will comprise
of the following industry mix.
➢ Engineering
➢ IT
➢ Agro
➢ Life Sciences
➢ Logistics
➢ Research
➢ Development
➢ Gems and Jewelry
➢ Electronics and Semi-Conductor
➢ Services
In general, the major impacts associated with the Operation phase of the development can be
summarized under the following areas of impact:
• Alteration of habitats and removal of available habitats by the development of project
• Use of fertilizers & pesticides for maintenance of Golf course grasses
• Operation of the industries, regular traffic residential areas, institutions with events,
celebrations
Impact on Flora and Fauna:

Final EIA Report – Orange Smart City, Pen, Raigad July 2018
290 ORANGE SMART CITY INFRASTRUCTURE PVT. LTD.
The establishment of township project will require the destruction of vegetation project
development footprint. Given the limited extent of transformation of the site and the limited
land requirement of the development relative to the extent of available intact habitat, the direct
loss of habitat would be minimal for most faunal species and there do not appear to be any
species which would be significantly impacted by the direct loss of habitat especially in light
of the green belt development on 254.95 acres.
Fragmentation poses a greater threat as some species may avoid open areas or become
vulnerable to predation while traversing open ground
Regular events with loud music can negatively affect the birds and other animals found within
the surrounding habitats. The project influence area is known to harbour a large number of
birds including migratory species. However, considering the fact that beyond a distance of 250
meters from the project site, there will not be any increase in the Sound Pressure Levels no
impact is envisaged.
The aquatic and marine fauna from the water bodies may be threatened by the water quality
deterioration coming largely from industrial wastes if not managed properly
Mangroves found along the periphery of the project may be threatened from siltation and
damage.
Significance of the Impact
The impact will be low considering the less polluting nature of the industries and the provision
of the extensive green belt plan which will further offset the adverse impacts due to the
operation of the OSC project.
Severity of Impact - Extent of Impact - Duration of Impact -
Impact Significance = Low
i. Mitigation Measures
Each individual project to be developed within the OSC will obtain environmental clearance
and consents from regulatory authorities as per the relevant Acts and Notifications. Each
individual project shall comply with the clearance/consent conditions. The mitigation measures
provided shall be implemented by each individual project based on its applicability to the
activities and processes.
Wherever the project development activity is in close proximity to forest area, utmost care will
be taken that no forest area shall be disturbed while developing / construction & the same shall
be kept untouched maintaining the biodiversity of the area maintaining minimum a buffer of
atleast 20-100m wherever possible with ecological barriers
The mangrove vegetation fringing the project boundary in the T1 parcel will be protected from
all damage following proper measures.
Proposed maintenance of existing ponds within the project site will help the wildlife and more
specifically the birds to use the areas
The purpose of landscape planning is to protect the environment, as also to provide the much-
needed aesthetic excellence. A diverse wildlife population can be achieved with an integrated
landscape composed of lawns, tree, shrub and water features.
Green Belt Development

Final EIA Report – Orange Smart City, Pen, Raigad July 2018
291 ORANGE SMART CITY INFRASTRUCTURE PVT. LTD.
The proposed green belt development will aid the lost biomass and lead to sustainable
development. The green belt will enrich soil organic matter thereby nitrogen. It will be
developed to attain maximum attenuation of noise. Green belt will also control temperatures
and keep the surroundings cool. It will attract avifauna and create suitable habitat to micro flora
and fauna. The green belt will help as a sink to dust and gaseous pollutants. On the whole it
will have a positive impact on the environment. In the proposed green belt development scheme
mainly fruit bearing, ornamental, medicinal values trees will be planted; which results in
enrichment of biodiversity & beautification of area.
The ecological survey has been done to establish the baseline ecological conditions in the
project site in order to assess the potential ecological impacts and develop a suitable
management plan to mitigate the impact due to the proposed project. This section of report
presents the ecological baseline of the project site. There will be a positive impact on the
ecology due to the upcoming proposed project.
Extensive plantation and green area development in the area of XXXXX m2 is planned in the
proposed project along with landscaping. This is hereby ensured that the mostly indigenous/
local plants will be planted all around the periphery of the project area and along the roadsides.
Plantations would be of large leaf trees that provide adequate shade and are semi-evergreen to
evergreen. The landscape plan showing green area, trees and table of tree species is enclosed.
Various native and indigenous trees would be planted for mitigation purpose which includes
Sr. No. Scientific Name
1 Amorphophallus paeoniifolius
2 Abelmoschus indicus
3 Annona squamosal
4 Artocarpus heterophyllus
5 Carica papaya
6 Citrus lemon
7 Mangifera indica
8 Albizia odorattissima
9 Albizia procera
10 Azadirachta indica
11 Bauhinia variegate
12 Bauhinia purpuria
13 Bambusa arundanaceae
14 Blumea sp.
15 Butea superba

Final EIA Report – Orange Smart City, Pen, Raigad July 2018
292 ORANGE SMART CITY INFRASTRUCTURE PVT. LTD.
Sr. No. Scientific Name
16 Butea frondosa
17 Cocos nucifera
18 Eucalyptus sp
19 Delonix regia
20 Leucena leucophloe
21 Abelmoschus esculentus
22 Abrus precatorius
23 Abutilon indicum
24 Acacia Arabica
25 Acacia auriculiformis
26 Acacia leucophloe
27 Achras sapota
28 Acalypha hispida
29 Acanthospermum hispidum
30 Achyranthes aspera
31 Adathoda vasica
32 Adiantum philippense
33 Adenanthera pavonina
34 Aegle marmelos
35 Aegeratum conyzoides
36 Ageratum conyzoides
37 Ailanthes excela
38 Albizia odoratissima
39 Albizia procera
40 Aloe barbedensis
41 Allophylus cobbe

Final EIA Report – Orange Smart City, Pen, Raigad July 2018
293 ORANGE SMART CITY INFRASTRUCTURE PVT. LTD.
Sr. No. Scientific Name
42 Alternanthera sessilis
43 Alysicarpus hamosus
44 Alysicarpus monilifer
45 Argyreia elliptica
46 Argemone Mexicana
47 Asparagaus racemosus
48 Atalantia monophylla
49 Azadirachta indica
50 Barleria cuspidate
51 Bauhinia racemose
52 Bridelia retusa
53 Blepharis asperima
54 Blumea lacera
55 Bombax ceiba
56 Borreria stricta
57 Bridelia retusa
58 Buchanania lanzan
59 Butea monosperma
60 Caesalpina pulcherima
61 Calotropis procera
62 Canna indicda
63 Calycotropis floribunda
64 Careya arborea
65 Carissa carandus
66 Carissa spinarium
67 Carvia callosa

Final EIA Report – Orange Smart City, Pen, Raigad July 2018
294 ORANGE SMART CITY INFRASTRUCTURE PVT. LTD.
Sr. No. Scientific Name
68 Casearia tomentosa
69 Cassia auriculata
70 Cassia obtuse
71 Cassia occidentalis
72 Cassia tora
73 Cassia fistula
74 Catunaregam spinose
75 Calycotropis floribunda
76 Ceiba pentandra
77 Celosia argentea
78 Cestrum noctrunum
79 Chromalaena odorata
80 Chrysanthemum sp
81 Cissus quadrangularis
82 Citrus media
83 Cleome viscose
84 Clematis triloba
85 Cocculus villosa
86 Cocos nucifera
87 Combretum ovalifolium
88 Commelina benghalensis
89 Cordia dichotoma
90 Cordia rothri
91 Crotalaria pallida
92 Crotalaria sp. 2
93 Croton bonplandinum
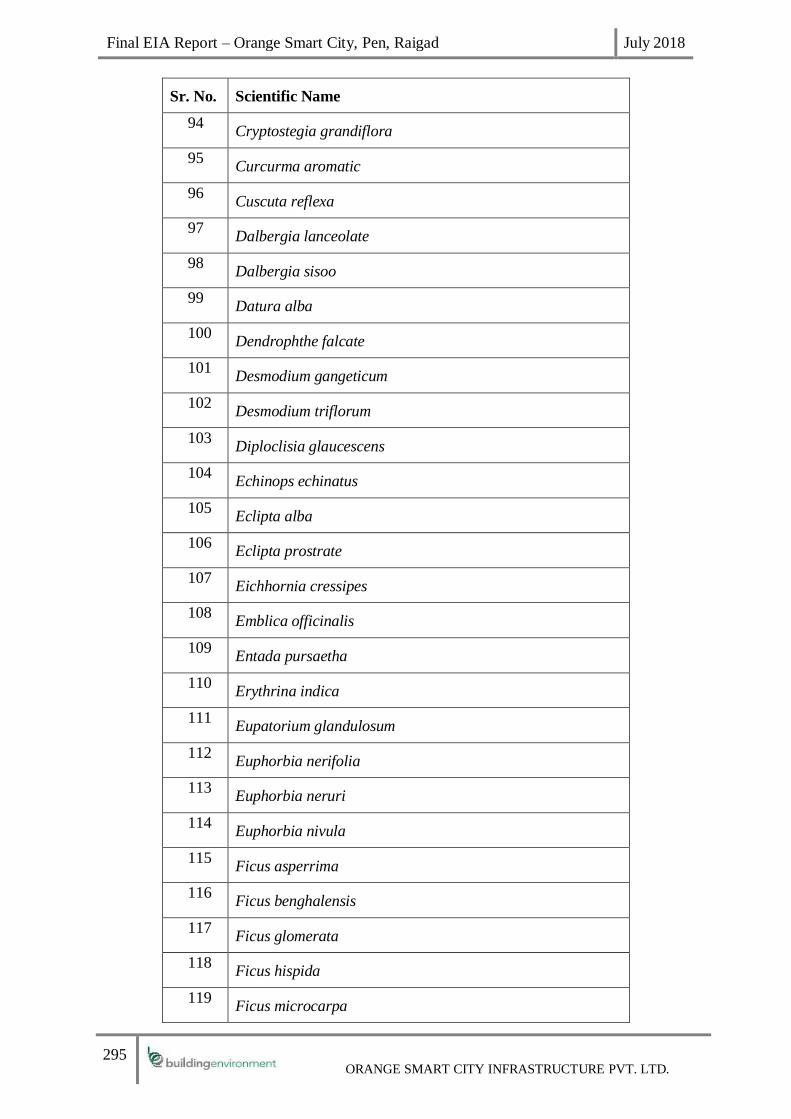
Final EIA Report – Orange Smart City, Pen, Raigad July 2018
295 ORANGE SMART CITY INFRASTRUCTURE PVT. LTD.
Sr. No. Scientific Name
94 Cryptostegia grandiflora
95 Curcurma aromatic
96 Cuscuta reflexa
97 Dalbergia lanceolate
98 Dalbergia sisoo
99 Datura alba
100 Dendrophthe falcate
101 Desmodium gangeticum
102 Desmodium triflorum
103 Diploclisia glaucescens
104 Echinops echinatus
105 Eclipta alba
106 Eclipta prostrate
107 Eichhornia cressipes
108 Emblica officinalis
109 Entada pursaetha
110 Erythrina indica
111 Eupatorium glandulosum
112 Euphorbia nerifolia
113 Euphorbia neruri
114 Euphorbia nivula
115 Ficus asperrima
116 Ficus benghalensis
117 Ficus glomerata
118 Ficus hispida
119 Ficus microcarpa

Final EIA Report – Orange Smart City, Pen, Raigad July 2018
296 ORANGE SMART CITY INFRASTRUCTURE PVT. LTD.
Sr. No. Scientific Name
120 Ficus racemosus
121 Ficus relisiosa
122 Flacourtia indica
123 Flacourtia latifolia
124 Gardenia latifolia
125 Garuga pinnata
126 Garcinia indica
127 Gloriosa superba
128 Gossypium herbaceum
129 Grewia abutifolia
130 Grewia asiatica
131 Grewia subinaqualis
132 Helictris isora
133 Heliotropium indicum
134 Helitropium ovalifolium
135 Heterophragma quadriculare
136 Hemidesmus indicus
137 Hibiscus micronthus
138 Hibiscus ovalifolia
139 Hibiscus rosa-cianensis
140 Holarrhena antidysentrrica
141 Hygrophylla auriculata
142 Hymenodictyon excelsum
143 Hyptis suavalens
144 Ipomea sp.
145 Ixora parviflora

Final EIA Report – Orange Smart City, Pen, Raigad July 2018
297 ORANGE SMART CITY INFRASTRUCTURE PVT. LTD.
Sr. No. Scientific Name
146 Ixora coccinea
147 Jasminum malbarichum
148 Jatropha gossypifolia
149 Justicia carnea
150 Justicia procumbens
151 Lantana camara
152 Lathyrus sativus
153 Lawsonia inermis
154 Largestromia lanceolate
155 Leea microphylla
156 Lepisanthes tetraphylla
157 Leucas aspera
158 Leucas stelligera
159 Loranthus sp
160 Mancranga peltata
161 Mangifera indica
162 Melia azadirachta
163 Merremia umbellate
164 Merremia vitifolia
165 Mimosa pudica
166 Mitrgyna parviflora
167 Moullava spicata
168 Mollugo hirta
169 Moringa oleifera
170 Mucuna pruriens
171 Murraya koenigii

Final EIA Report – Orange Smart City, Pen, Raigad July 2018
298 ORANGE SMART CITY INFRASTRUCTURE PVT. LTD.
Sr. No. Scientific Name
172 Musa paradisiac
173 Nerium indicum
174 Ocimum americanum
175 Ocimum basillum
176 Ocimum sanctum
177 Operculina turpethum
178 Opuntia dillinii
179 Opuntia elator
180 Oxalis corniculata
181 Panicum notatum
182 Parthenium hysterophorus
183 Passiflora foetida
184 Pavonia zeylanica
185 Peltophorum ferrugineum
186 Peristrophe bicalculata
187 Phoenix aculis
188 Phyllanthes emblica
189 Phyllanthes nirurii
190 Physalis minima
191 Pithocolobium dulce
192 Polyalthia longifolia
193 Pongamia glabra
194 Pongamia pinnata
195 Portulaca oleracea
196 Psidium guava
197 Pteris sp

Final EIA Report – Orange Smart City, Pen, Raigad July 2018
299 ORANGE SMART CITY INFRASTRUCTURE PVT. LTD.
Sr. No. Scientific Name
198 Punica granulatum
199 Rhus mysoorensis
200 Samanea saman
201 Sapindus emerginatus
202 Schleichera oleosa
203 Sida acuta
204 Sida cordifolia
205 Sida rhombifolia
206 Smilax zeylanica
207 Solanum nigrum
208 Solanum xanthocarpum
209 Spondias pinnata
210 Sterculia villosa
211 Strobilanthus callossus
212 Sygygium cumini
213 Tabernaemontana pandacaqui
214 Tagetus sp
215 Tamarindus indica
216 Tectona grandis
217 Tephrosia purpuria
218 Teramnus labialis
219 Terminalia paniculata
220 Terminalia chebula
221 Terminalia elliptica
222 Tetrasigma sp.
223 Thespesia populanea

Final EIA Report – Orange Smart City, Pen, Raigad July 2018
300 ORANGE SMART CITY INFRASTRUCTURE PVT. LTD.
Sr. No. Scientific Name
224 Thespesia lampas
225 Thumbergia sp.
226 Tinospora cordifolia
227 Tragus biflorus
228 Trapa bispinosa
229 Trapa natans
230 Trema orientalis
231 Tridax procumbens
232 Triumferta pilosa
233 Urtica sp.
234 Vanda sp.
235 Vangueria spinose
236 Vanilla planifolia
237 Vernonia cinera
238 Vicoa indica
239 Vitex negungo
240 Woodfordia fruticose
241 Wrightia tinctoria
242 Wrightia tomentosa
243 Xanthium strumarium
244 Yucca gloriosa
245 Zizyphus jujube
246 Zizyphus mauritiana
247 Zizyphus nummalaris
248 Zizyphus oenoplica
249 Cenchurus ciliaris

Final EIA Report – Orange Smart City, Pen, Raigad July 2018
301 ORANGE SMART CITY INFRASTRUCTURE PVT. LTD.
Sr. No. Scientific Name
250 Apluda mutica
251 Chloris dolichosta
252 Cyanodactylon sp
253 Dichanthium annulatum
254 Aristida adscensionsis
255 Andropogon pertusus
256 Andropogon monticola
257 Cenchrus setifgera
258 Cyperus aristatus
259 Cyperus rotundus
260 Cynadon dactylum
261 Digetaria bicornis
262 Digetaria Segetaria
263 Digetaria stricta
264 Eragrostis tenella
265 Fibrystylis dichotoma
266 Ischaemum pilosum
267 Heteropogon contortus
Plantation of these tress will not only ensure the presence of native speices but will also help
in creating corridors for thriving faunal activites.
4.4.7 Socio Economics
There will be impact on the socio-economic conditions in the study area in general due to influx
of the external population which may put stress on the existing resources such as water and
electricity. But the project proponent will not draw on these existing resources as it will take
water from the sanctioned quota for industrial use from the Hetwane Dam and also electricity
for which it has already secured permission from the competent authority after carefully
calculating the requirements for the various uses in the OSC project without disturbing the
existing resources in the surrounding area.

Final EIA Report – Orange Smart City, Pen, Raigad July 2018
302 ORANGE SMART CITY INFRASTRUCTURE PVT. LTD.
Also, the project will provide housing to the 73068 (Refer Table-4-15) people which includes
provision of the social housing thereby reducing the stress on the local resources and the
existing infrastructure.
Table 4-20: Estimated Population
Land Parcel Total Plot Area
(Acres)
Industrial Area
(Acres)
Residential
Area
(Acres)
Estimated
Resident
Population
T1 723.33 282.00 58.00 31161
T2 102.40 58.00 8.00 4298
T3 83.59 40.00 8.00 4298
T4 133.19 0.00 62.00 33310
Total 1042.51 380.00 136.00 73068
There will be general improvement in the socio-economic conditions in the nearby villages due
to establishment of the ancillary small scale petty shops and other small scale commercial
establishments which will go a long way in contributing to the economic development in the
vicinity of the project area such as which will be positive in nature due to general improvement
in the socio-economic conditions in the study area and upliftment of the people. The land
purchase has been done keeping in view the access roads to the project site and the village
roads in the vicinity of the project site i.e, these will be left undisturbed by the project proponent
wherein due diligence has been accorded while planning the project boundary. The access roads
/ village roads connecting the various residential areas outside the project boundary will be left
undisturbed. As a result, the impact will be beneficial.
Provision of employment
There will be possibility of the employing a population of about 1,49,002 nos of people (Refer
Table –4-17) in the operational phase of the project depending on the qualifications / credentials
and the skill sets of the people. The split up of the working population estimates is presented
below.
Table 4-21: Employment generation in OSC
Land
Parcel
Total
Plot
Area
(Acres)
Industrial
Employment
Commercial
Employment
Total Direct
Employment
Indirect/Floating
Employment
Total
Employment
T1 723.33 35746 19165 54911 21964 76876
T2 102.40 13910 3935 17845 7138 24982
T3 83.59 12859 1200 14059 5624 19683
T4 133.19 0 19615 19615 7846 27461

Final EIA Report – Orange Smart City, Pen, Raigad July 2018
303 ORANGE SMART CITY INFRASTRUCTURE PVT. LTD.
Total 1042.51 62515 43915 106430 42572 149002
As a result of the employment opportunities the impact will be beneficial.
4.1.1.26 Impact on cultural heritage
While planning the land use within the T4 land parcel which predominantly consists of the
residential and commercial area along with the green /open area which will not impact the said
Dargah due to less polluting nature of the activities in the designated for these land uses.
Hence the impact will be low in nature in the operation phase.
Severity of Impact Extent of Impact - Duration of Impact -
Impact Significance = Low

Final EIA Report – Orange Smart City, Pen, Raigad July 2018
304 ORANGE SMART CITY INFRASTRUCTURE PVT. LTD.
5. ANALYSIS OF ALTERNATIVES
This section of the report presents the justification for the project and the analysis of
alternatives considered. The sections is this chapter are as under:
➢ Alternatives considered for selection of site;
➢ Alternative Site Assessment
➢ Suitability of Site for Proposed Industrial Township Development
5.1 Alternatives Considered for Selection of Site
Pen, sub region of MMR is the untapped area from development perspective in spite of the
existing connectivity by National Highway, proximity to the Jawaharlal Nehru Port (JNPT)
and proposed Navi Mumbai International Airport. It also falls on the proposed Multi-modal
Corridor from Virar to Alibaug proposed by MMRDA and within the influenced zone of the
proposed Delhi Mumbai Industrial Corridor (DMIC). Considering all the above OSCIPL has
proposed to establish an IIA in the Pen Tehsil. In connection with the same the reconnaissance
survey of the entire Pen Tehsil area was carried out to locate suitable parcels of land which
were ideal for the development of an IIA without any detrimental influence on the surrounding
environment. A total number of three sites were shortlisted for further study and finalization.
5.1.1 Sites Selected for Study
➢ Site 1 – Tarankhop Ramraj and Dhavate
➢ Site 2 – Meleghar & Kashmire
➢ Site 3 – Boregaon, Shene, Virani, Ambeghar Belawade Budruk, Belawade Khurd,
Padale, Walak, Mungoshi, Govirle, Kopar, Ambiwali, Balawali & Hamrapur
5.1.2 Key Characteristics and Comparative Site Evaluation
For identification of the most suitable region for development of the proposed OSC project,
assessment of the sub regions was carried out on the following aspects.
➢ Connectivity
➢ Terrain
➢ Land Availability
➢ Cost
➢ Water Availability
➢ Manpower Availability
➢ Proximity to JNPT
5.2 Description of each alternative
5.2.1 Site No.1: (Tarankhop Ramraj and Dhavate):
The site admeasures 480 Acres approximately. The same is located to the North of Pen-Khopoli
by-pass road (SH -88). This site is situated directly on the NH 66 on the West side and the SH
88 towards the South and ODR 25 (Pen to Belawade-Khurd) of Pen Tehsil. The site has a
gradual slope towards the West and South and appears flat and buildable.
The Hetawane canal passes along the eastern side of the site. Though the site appears to be
strategically located, it is also inherent with the following drawbacks. Being adjacent to the
irrigation canal it will fall under the command area of irrigation and therefore permission for

Final EIA Report – Orange Smart City, Pen, Raigad July 2018
305 ORANGE SMART CITY INFRASTRUCTURE PVT. LTD.
conversion from agricultural to other land uses will be difficult. Also, the land for lease will be
difficult since only 60% to 70% of the land owners are willing to part with their land holdings.
The existing settlement of Tarankhop village is situated between the site and the NH 17 and as
such it is difficult to derive access from the same.
5.2.2 Site No.2: (Meleghar and Kashmire)
This site admeasures 633 Acres approximately. This site derives access from a narrow land
parcel connecting to NH 66 and is situated to the South of Pen-Khopoli by-pass road (SH 88).
The site is also separated from the NH 66 by the Konkan rail and can derive access from NH
66 only by means of a flyover. The site is also bounded to the East, West and the South by
Hetawane canal. As such the accessibility of the site appears to be severely restricted. The land
is relatively sloping from south east to north-west direction. The land is also divided by two
village roads and as such the land parcel is split into three parcels which needs to be connected
either by shifting the village roads or bridging the parcels by means of ROBs (Road over
bridges). The entire parcel of land is irrigated land. Hence the same is costlier. Being adjacent
to the irrigation canal it will fall under the command area of Irrigation and therefore permission
for conversion from Agriculture to other land uses will also be difficult. Also the land purchase
for the proposed project area is also difficult since only between 40% to 50% of the land owners
are willing to part with their land holdings.
5.2.3 Site No.3: (Boregaon, Shene, Virani, Belawade Budruk, Walak, Mungoshi,
Govirle, Belawade Khurd, Padale, Kopar, Ambeghar, Balawali, Ambiwali &
Hamrapur)
The Total project area for T1, T2, T3 and T4 is 1042.51 acres. These pockets are spread at
close intervals and connected by arterial roads as indicated below and together constitute the
OSC project. The Project Area Map as also the satellite imagery for the same are shown in
Figure 5-3.
The site is in four parcels which are closely located and internally connected by proposed ODR
25 of Pen Tehsil. Together the four parcels add to 1042.51 Acres which is almost double to the
earlier locations. The villages falling within this site area are Boregaon, Virani, Shene,
Ambeghar, Belawade Khurd, Belawade Budruk, Mungoshi, Govirle, Balawali, Padale, Walak,
Kopar, Ambiwali and Hamrapur. The site is approached from SH 88 (Pen to Khopoli) highway
at an RL of around 25–39 m from MSL. Since some of the land parcels are abutting creeks and
also the railway and National Highway, the accessibility of the land parcels are greatly
enhanced due to the availability of multi-modal transport and connectivity.
The major part of the site is situated at a contour of 200–220 which is developable. The site is
divided into four parts and situated at different villages which are located nearby. Also none of
the land parcels are below 100 acres and as such is considered a good parcel from Integrated
Industrial Area development point of view and each parcel can function as a self-sustaining
unit. This also facilitates the location of different types of industries on different parcels lending
a unique character to each parcel. Considering other lands in Pen Tehsil, these parcels identified
are observed to be non-fertile and non-irrigated and therefore more suitable for industrial
development. The eastern part of the site stretches from North to South from Bhogeshwari
River to the North to Mahal Mira village to the South. The western part extends around village
Virani. The Western portion is relatively flat as compared to the Eastern portion. Due to the
undulating features on the site which includes hill slopes as well as valley portion which are
found to be undevelopable due to the steep slopes, almost 35% of the gross area is being left
open. However these spaces can be well developed by landscaping and afforestation to augment
the Open space requirements of the OSC project.

Final EIA Report – Orange Smart City, Pen, Raigad July 2018
306 ORANGE SMART CITY INFRASTRUCTURE PVT. LTD.
The valley portion also provides the opportunity for creation of a water retention pond
especially during monsoon where in the runoff simply flows into the creek and completely
wasted and unutilized. This proposed water retention pond will not only conserve water but
also provide as a valuable resource for the sustenance of the OSC project. In addition this water
retention pond can also be used for recreational purposes and contribute to the Imagery and
microclimate of the non-Industrial Land Use area. The water retention pond also satisfies the
stipulation of the MOEF guidelines with regard to water retention from rainfall runoff and also
contribute to environmental conservation.
The hill slopes can also be proposed to be utilized for solar farming and other sources of
renewable energy which could contribute to the energy requirements of street lighting,
pumping etc.

Final EIA Report – Orange Smart City, Pen, Raigad July 2018
307 ORANGE SMART CITY INFRASTRUCTURE PVT. LTD.
Figure 5-1: Site No. 1 – Tarankhop Ramraj and Dhavate

Final EIA Report – Orange Smart City, Pen, Raigad July 2018
308 ORANGE SMART CITY INFRASTRUCTURE PVT. LTD.
Figure 5-2: Site No. 2 – Meleghar and Kashmire
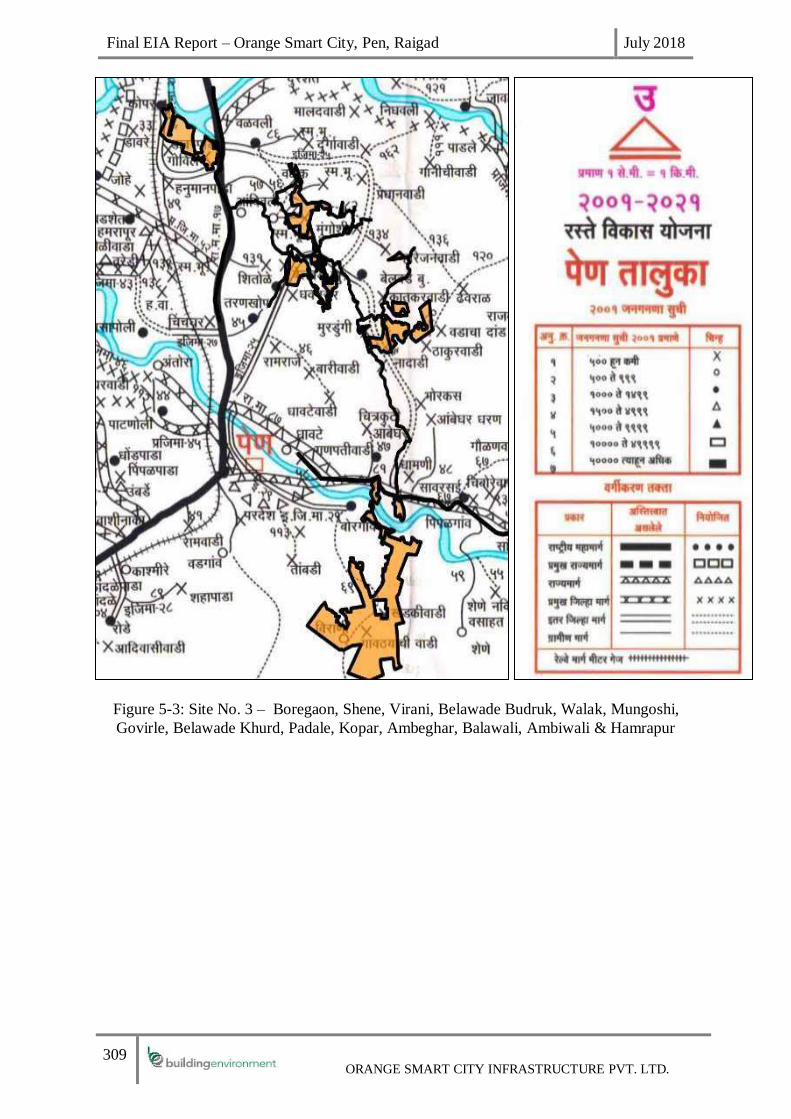
Final EIA Report – Orange Smart City, Pen, Raigad July 2018
309 ORANGE SMART CITY INFRASTRUCTURE PVT. LTD.
Figure 5-3: Site No. 3 – Boregaon, Shene, Virani, Belawade Budruk, Walak, Mungoshi,
Govirle, Belawade Khurd, Padale, Kopar, Ambeghar, Balawali, Ambiwali & Hamrapur

Final EIA Report – Orange Smart City, Pen, Raigad July 2018
310 ORANGE SMART CITY INFRASTRUCTURE PVT. LTD.
5.2.4 Evaluation of Alternative Sites
The three sites are assessed with respect to various parameters like Connectivity, Terrain, Land
Availability, Cost, Water Availability, Manpower Availability, and Proximity to JNPT. The
key characteristics and comparative site evaluation on the basis of different aspects to have a
better understanding of selection of a suitable site for development of Smart Integrated
Township is presented in Table 5-1
Table 5-1: Key Characteristics and Comparative Site Evaluation
Sr.
No
Aspect Site – 1
Tarankhop &
Ramraj
Site – 2
Meleghar &
Kashmire
Site – 3
Boregaon, Shene, Virani,
Belawade Budruk, Walak,
Mungoshi, Govirle, Belawade
Khurd, Padale, Kopar,
Ambeghar, Balawali,
Ambiwali & Hamrapur
1. Connectivity From state
Highway and
indirectly from
National
Highway
Access from
ODR 28 of Pen
Tehsil Required
ROB on Railway
for access from
NH 66
Very good multi point access
on National Highway and
State Highway.
Also feasible to have railhead
and water transport connect
near Hamarpur.
2. Terrain Plain Plain Plateau with slopes
3. Availability
of Land
50% Irrigated
and 50% Fallow
Land.
Hence more
agricultural land
will be used for
the project
80% Irrigated and
20% Non-
irrigated
Predominant land use is land
with / without scrub (31.04%),
followed by other agricultural
(19.02%), dense open
vegetation (18.89%) as per
Land use / land cover statistics
4. Cost High
Unaffordable Relatively affordable
5. Water
Availability
Water can be
available from
Hetwane Dam
Only Hetwane
Dam is nearest
Water
Water can be available from
Hetwane Dam
6. Manpower
Availability
Good Moderate Good
7. Proximity to
JNPT
Proximity to the
proposed MTHL
& JNPT within
30 to 35 kms
respectively
Proximity to the
proposed MTHL
& JNPT within
30 to 35 kms
respectively
Proximity to the proposed
MTHL & JNPT within 21.32
to 20.8 kms respectively

Final EIA Report – Orange Smart City, Pen, Raigad July 2018
311 ORANGE SMART CITY INFRASTRUCTURE PVT. LTD.
Table 5-2: Comparative Analysis Table For Above Alternate Sites
Sr.
No.
Locations/Options Tarankhop
& Ramraj
(Option.1)
Meleghar &
Kashmire
(Option.2)
Boregaon, Shene, Virani,
Belawade Budruk,
Walak, Mungoshi,
Govirle, Belawade
Khurd, Padale, Kopar,
Ambeghar, Balawali,
Ambiwali & Hamrapur
(Option.3)
Site Selection Criteria
1 Connectivity 9 4 9
2 Terrain 4 6 8
3 Land Availability 4 4 9
4 Cost 3 3 7
5 Water Availability 8 3 8
6 Manpower Availability 9 8 9
7 Proximity to JNPT 6 5 8
Total 43 33 58
Please note: 0-3: Poor; 4-7: Moderate; 8-10: Excellent
Based on the comparative evaluation of the three identified sites, it was decided that the third
location covering villages Boregaon, Shene, Virani, Belawade Budruk, Walak, Mungoshi,
Govirle, Belawade Khurd, Padale, Kopar, Ambeghar, Balawali, Ambiwali & Hamrapur was
highly suitable for locating the OSC at the current location.
5.3 Suitability / Justification of Site for Development of Proposed Project
5.3.1 Industrial Development
The easy availability of land strengthens the scope of setting up of industries. At present there
is minimum existence of transport infrastructure and industries in the region, however with the
completion of the proposed project, the region will be well connected with the other major
cities making it highly accessible and appropriate location for setting up of industries. Thus,
the proposed investment will bring overall enhancement in communication, infrastructure
facilities, human capital, local demand and connectivity.
5.3.2 Residential Development
In the long run, the residential sector in MMR is expected to have a stable demand with the
increasing affordability of the population. With a perspective of the future infrastructure and
economic growth initiatives proposed near the subject site, the residential sector assumes a
moderate compatibility to the future development on the subject site and would play a
supporting role to the dominant Industrial development. The residential development would be
commensurate with the Industrial development. The walk to work concept will get
implemented there by reducing carbon footprint etc.
5.3.3 Commercial Development

Final EIA Report – Orange Smart City, Pen, Raigad July 2018
312 ORANGE SMART CITY INFRASTRUCTURE PVT. LTD.
The commercial sector growth, which has gained some strength in recent past at at Navi
Mumbai may have an induced affect near the subject site region in a long term time frame of
10-12 years. As the demand shall pick up when the economic activities (IIP) and infrastructure
development activities (MTHL, International Airport) become operational. In a medium
timeframe of 4 -6 years, non-prime commercial spaces of basic typology like Banks, ATMs
shall be feasible. Further, offices of telecom and insurance sector on a small scale may be
developed in a time frame of 5 -6 years.
5.3.4 Education / Institutional and Healthcare Development
An Education facility/hub which complements the Residential development e is likely to be a
strong attraction point for at the regional level. In the initial phases (2-3 year’s time frame), the
site for educational facility / hub as this activity is not dependent on the present infrastructure
conditions or the present real estate demand. This activity shall also be instrumental in
accelerating residential growth over a medium term (5-6 years).
However, a healthcare facility on a small scale may also be considered in the short term (2-3
years). The key to the development will be securing social activities such as educational
institute, which are envisaged at the beginning of the projects. The sale of plotted development
has been scheduled as next activity followed by development of apartments in the last stage of
the project.
5.3.5 Retail Development
This sector may not have a sustained demand in the time frame of 5 -6 years. However, it may
derive demand only from an expected in-migration of residential population after the proposed
economic and infrastructure development activities take place. Thus the time frame for retail
activities to pick up shall be higher (10 -12 years). It is recommended that any retail
development proposed may suitably be positioned on the subject site to draw maximum
benefits from a catchment of student population if an education hub is proposed in the subject
site. Initially, neighborhood level shopping areas shall be sustained i.e. in 2-3 years’ time frame.
After the influx of more population (5-6 years’ time frame) shopping arcades may be
considered for development while 312acemose312 stand-alone retail complexes of a higher
scale may be feasible only after a 10 years time frame, after substantial catchment population
is available to sustain the retail demand.
5.3.6 Hospitality / Leisure Entertainment
Considerable latent demand exists in the leisure and entertainment sector and it may have a
moderate compatibility on site given the demand derived by the residential population, who
are likely to be the frequent patrons of this destination. The subject site also fares high in respect
of land availability (as leisure and entertainment are land intensive sectors) also coupled by
ideal geographic settings.
In the initial 4-5 years’ timeframe, small scale entertainment destinations like standalone
Cinemas may be considered for development. However, high level entertainment activities like
multiplexes, Golf Course and amusement park etc. may be considered only after a period of 10
years, when the substantial demand from residential population exists

Final EIA Report – Orange Smart City, Pen, Raigad July 2018
313 ORANGE SMART CITY INFRASTRUCTURE PVT. LTD.
6. ENVIRONMENTAL MONITORING PROGRAMME
Monitoring is one of the most paramount constituents of a management system. An
environmental monitoring plan provides feedback about the discrepancy between actual
environmental scenario and the impacts of the project on the environment. The purpose of
environmental monitoring is to evaluate the efficacy of implementation of Environmental
Management Plan (EMP) by periodically monitoring the important environmental parameters
within the impact area, so that any adverse effects can be detected and timely action can be
taken.
6.1 Objectives of Environmental Monitoring Plan
The key issues associated with the life cycle of a project are the monitoring of environmental
parameters. Three types of environmental monitoring are associated with the project, during
the project period to determine existing conditions ranges of variation and process of change.
Effects/impact monitoring involves measurements of environmental variable during
construction and operation phase of the project to assess the impact that may have been caused
by the project. Finally, compliance monitoring takes the form of periodic sampling and
continuous measurements of level of pollutant emissions in the air, waste discharge on land or
water, level of noise to ensure that standards are met. The basic objectives of the environment
monitoring program are:
➢ Planning a survey and sampling program for systematic data/information collection
Conducting survey and sampling program
➢ Analysis of samples and data/information collected, and interpretation of data and
Information
➢ To ensure effective implementation of mitigation measures during project
implementation;
➢ To provide constant feedback to the decision makers about the efficacy of their
actions and measures taken;
➢ Environmental monitoring is carried throughout project operation phase to detect
changes in the key environmental quality parameters, which can be attributed to the
project;
➢ To determine the project’s actual environmental impacts so that modifications can
be affected to mitigate the impacts;
➢ To identify the need for enforcement action before irreversible environmental
damage occurs;
➢ To provide scientific information about the response of an ecosystem to a given set
of
➢ human activities and mitigation measures;
➢ Preparation of reports for submitting to management and statutory authorities.

Final EIA Report – Orange Smart City, Pen, Raigad July 2018
314 ORANGE SMART CITY INFRASTRUCTURE PVT. LTD.
The results of the monitoring program used to evaluate the following:
➢ Extent and severity of the environmental impacts against the predicted impacts;
➢ Performance of the environmental protection measures or compliance with pertinent
rules and regulations
➢ Trends in impacts and Overall effectiveness of the project EMP
6.2 Suggested Environmental Monitoring Plan
The environmental monitoring plan for the proposed project has been developed in view of the
institutional, scientific and fiscal issues pertaining to the project. For developing the monitoring
plan, appropriate Value Ecosystem Components (VEC’s) which are likely to be affected have
been identified. For each component, suitable measurable environmental indicators which are
appropriate to the impact mechanism and scale of disturbance and have a low natural
variability, broad applicability and an existing data series have been defined. The monitoring
plan has been designed for the construction and the operation phase of the project and the
details of the plan have been presented in Table 6-1.
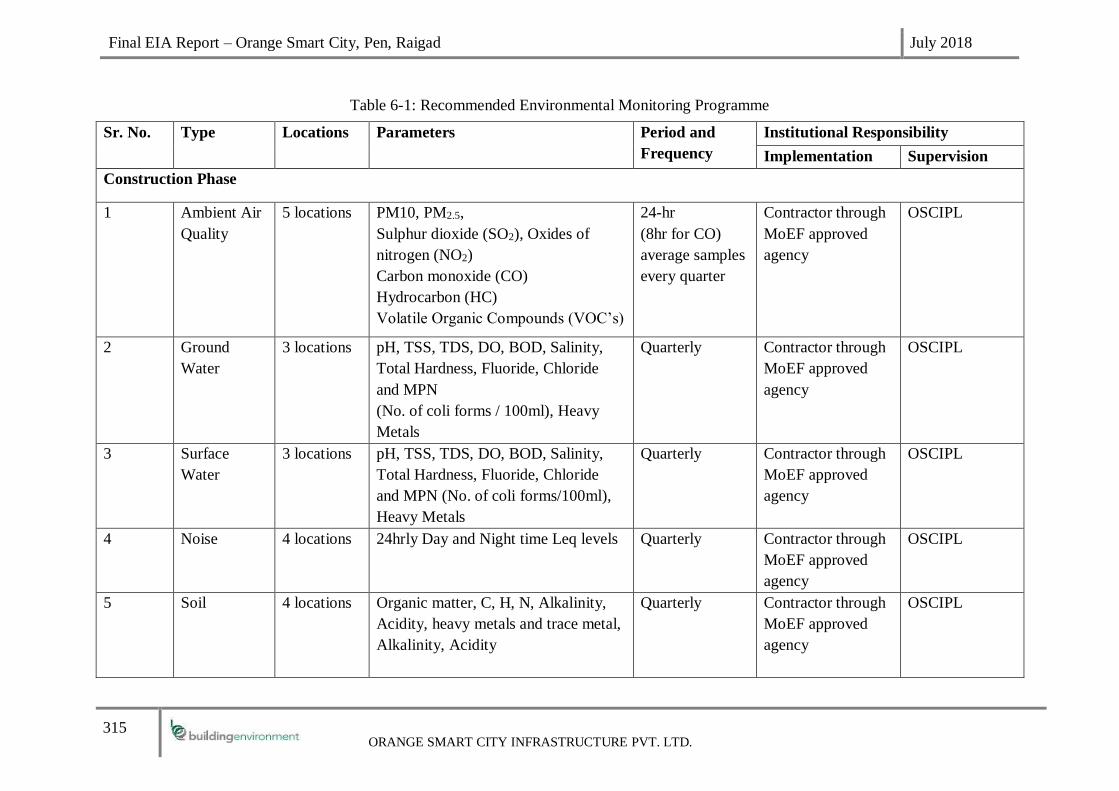
Final EIA Report – Orange Smart City, Pen, Raigad July 2018
315 ORANGE SMART CITY INFRASTRUCTURE PVT. LTD.
Table 6-1: Recommended Environmental Monitoring Programme
Sr. No. Type
Locations Parameters
Period and
Frequency
Institutional Responsibility
Implementation Supervision
Construction Phase
1 Ambient Air
Quality
5 locations PM10, PM2.5,
Sulphur dioxide (SO2), Oxides of
nitrogen (NO2)
Carbon monoxide (CO)
Hydrocarbon (HC)
Volatile Organic Compounds (VOC’s)
24-hr
(8hr for CO)
average samples
every quarter
Contractor through
MoEF approved
agency
OSCIPL
2 Ground
Water
3 locations pH, TSS, TDS, DO, BOD, Salinity,
Total Hardness, Fluoride, Chloride
and MPN
(No. of coli forms / 100ml), Heavy
Metals
Quarterly Contractor through
MoEF approved
agency
OSCIPL
3 Surface
Water
3 locations pH, TSS, TDS, DO, BOD, Salinity,
Total Hardness, Fluoride, Chloride
and MPN (No. of coli forms/100ml),
Heavy Metals
Quarterly Contractor through
MoEF approved
agency
OSCIPL
4 Noise 4 locations 24hrly Day and Night time Leq levels Quarterly Contractor through
MoEF approved
agency
OSCIPL
5 Soil 4 locations Organic matter, C, H, N, Alkalinity,
Acidity, heavy metals and trace metal,
Alkalinity, Acidity
Quarterly Contractor through
MoEF approved
agency
OSCIPL

Final EIA Report – Orange Smart City, Pen, Raigad July 2018
316 ORANGE SMART CITY INFRASTRUCTURE PVT. LTD.
Sr. No. Type
Locations Parameters
Period and
Frequency
Institutional Responsibility
Implementation Supervision
Operation Phase
1 Ambient Air
Quality
4 locations
as selected
after
consultation
with MPCB
PM10, PM2.5,
Sulphur dioxide (SO2), Oxides of
nitrogen (NO2)
Carbon monoxide (CO)
Hydrocarbon (HC)
Volatile Organic Compounds (VOC’s)
24-hr
(8hr for CO)
average samples
every quarter
OSCIPL through
MoEF approved
agency
OSCIPL
2 Ground
Water
3 locations
as selected
after
consultation
with MPCB
pH, TSS, TDS, DO, BOD, Salinity,
Total Hardness, Fluoride, Chloride
and MPN (No. of coli forms / 100ml),
Heavy Metals
Quarterly OSCIPL through
MoEF approved
agency
OSCIPL
3 Surface
Water
3 locations
as selected
after
consultation
with MPCB
pH, TSS, TDS, DO, BOD, Salinity,
Total Hardness, Fluoride, Chloride
and MPN
(No. of coli forms / 100ml), Heavy
Metals
Quarterly OSCIPL through
MoEF approved
agency
OSCIPL
4 Noise 4 locations
covering the
project site
and in the
surrounding
areas to be
identified in
consultation
with MPCB
24hrly Day and Night time Leq
levels
Quarterly OSCIPL through
MoEF approved
agency
OSCIPL

Final EIA Report – Orange Smart City, Pen, Raigad July 2018
317 ORANGE SMART CITY INFRASTRUCTURE PVT. LTD.
Sr. No. Type
Locations Parameters
Period and
Frequency
Institutional Responsibility
Implementation Supervision
5 Soil 5 locations
as selected
after
consultation
with MPCB
Organic matter, C, H, N, Alkalinity,
Acidity, heavy metals and trace metal,
Alkalinity, Acidity
Quarterly OSCIPL through
MoEF approved
agency
OSCIPL
6 Treated
potable
water quality
Water
Treatment
Plant
Parameters for horticulture use –
BOD, pH, S.S, Coliforms
Half Monthly OSCIPL through
MoEF approved
agency
OSCIPL
7 Treated
Sewage
Water
Quality
All STPs
(3 no.)
Parameters for horticulture use –
BOD, pH, S.S, Coliforms
Half Monthly OSCIPL through
MoEF approved
agency
OSCIPL
8 Treated
Effluent
Quality
ETP
As per IS 10500 – potable water
standards
Half Monthly OSCIPL through
MoEF approved
agency
OSCIPL

Final EIA Report – Orange Smart City, Pen, Raigad July 2018
318 ORANGE SMART CITY INFRASTRUCTURE PVT. LTD.
6.3 Data Analysis
The monitored data will be analyzed and compared with the baseline levels as established in
the EIA study and the regulatory standards specified by different government agencies. The
standards against which the different environment components will be compared are as per
Table 6-2: Applicable Standards for Different Environmental Components
Table 6-2: Applicable Standards for Different Environmental Components
Sr. No. Component Applicable Standards
1 Ambient Air Quality National Ambient Air Quality standards, CPCB
2 Noise Quality
Ambient Air Quality Standards with
Respect to Noise, CPCB
3 Surface water quality IS:2296: Class ‘C’ Water, CPCB
4 Ground water quality IS: 10500 Standards, BIS
5 Soil Quality --
6 Treated sewage water
quality
IS 2490(1974) – Discharge into surface water,
IS 3306(1974) – Discharge on land,
IS 3307(1974)- Discharge for agricultural use
7 Effluent
Minimum National Standards (MINAS) for
industries by CPCB
6.4 Reporting Schedule
The monitoring results of the different environmental components will be analyzed and
compiled every six months during the construction and the operation phase.
The report will be assessed through competent environmental agencies to analyze and ascertain
the reasons for any high pollutant level. The development possibly responsible for this high
pollutant level will be identified by OSC Infrastructure Pvt. Ltd. The environmental
management plan corresponding to that development or activity will be checked for its
efficacy.
6.5 Emergency Procedures/Corrective Measures
Corrective measures will be adopted if the review of the monitoring report reveals that the
environmental management plan is inadequate or has not been implemented properly. A
detailed review will be carried out by the interdisciplinary team of experts of the Environment
Management Cell for assessing the gaps between the EMP and its implementation. A corrective
action plan will be worked out for the environmental component and a rigorous follow up of
that plan will be adopted.
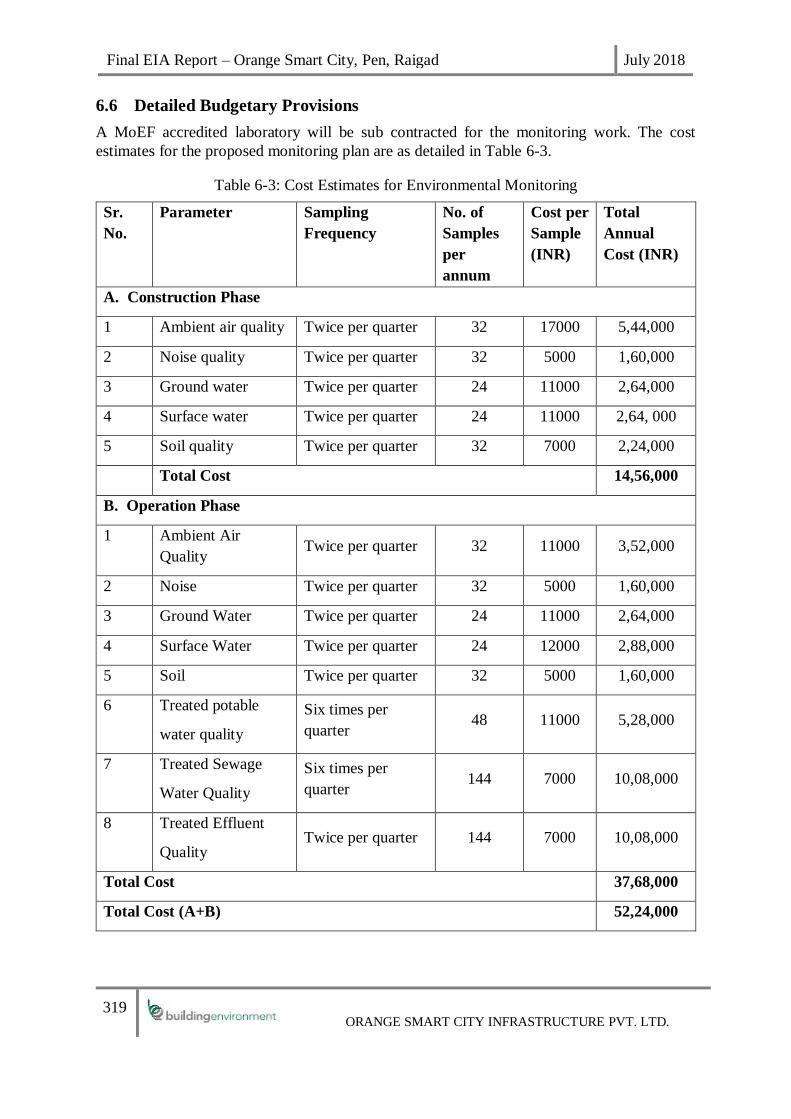
Final EIA Report – Orange Smart City, Pen, Raigad July 2018
319 ORANGE SMART CITY INFRASTRUCTURE PVT. LTD.
6.6 Detailed Budgetary Provisions
A MoEF accredited laboratory will be sub contracted for the monitoring work. The cost
estimates for the proposed monitoring plan are as detailed in Table 6-3.
Table 6-3: Cost Estimates for Environmental Monitoring
Sr.
No.
Parameter Sampling
Frequency
No. of
Samples
per
annum
Cost per
Sample
(INR)
Total
Annual
Cost (INR)
A. Construction Phase
1 Ambient air quality Twice per quarter 32 17000 5,44,000
2 Noise quality Twice per quarter 32 5000 1,60,000
3 Ground water Twice per quarter 24 11000 2,64,000
4 Surface water Twice per quarter 24 11000 2,64, 000
5 Soil quality Twice per quarter 32 7000 2,24,000
Total Cost 14,56,000
B. Operation Phase
1 Ambient Air
Quality Twice per quarter 32 11000 3,52,000
2 Noise Twice per quarter 32 5000 1,60,000
3 Ground Water Twice per quarter 24 11000 2,64,000
4 Surface Water Twice per quarter 24 12000 2,88,000
5 Soil Twice per quarter 32 5000 1,60,000
6 Treated potable
water quality
Six times per
quarter 48 11000 5,28,000
7 Treated Sewage
Water Quality
Six times per
quarter 144 7000 10,08,000
8 Treated Effluent
Quality Twice per quarter 144 7000 10,08,000
Total Cost 37,68,000
Total Cost (A+B) 52,24,000

Final EIA Report – Orange Smart City, Pen, Raigad July 2018
320 ORANGE SMART CITY INFRASTRUCTURE PVT. LTD.
7. ADDITIONAL STUDIES
7.1 Public hearing
As per the EIA Notification 2006 and its amendments thereof all category ‘A’ projects need to
undertake public hearing wherein the concerns of the local affected persons and others who
have a plausible stake in the environmental aspects of the project or activity are ascertained
with a view to take into account all the material concerns in the project or activity design as
appropriate. In this context the public hearing for OSC was conducted at Aagri Samaj Hall,
Nagarpalika Road, Chichpada, Tal:Pen, Dist Raigad on 11th July 2017 at 11.00 am.
Banner of public hearing at a prominent
location depicting the venue and the time of
public hearing.
A close up of the banner depicting the
venue and the time of public hearing
A participant in the public hearing asking
questions
OSC’s representative Mr. C.S Sangvi
explaining the project features

Final EIA Report – Orange Smart City, Pen, Raigad July 2018
321 ORANGE SMART CITY INFRASTRUCTURE PVT. LTD.
BEIPL representative Mr. Hrushikesh
Kolatkar explaining the environmental
aspects of the project
A public hearing participant expressing
opinion in the public hearing
7.1.1 Public hearing compliances
The compliance of the comments /issues raised in public hearing are given below:
Sr.No Queries Compliance
Queries by Vaishali Tai Patil
1 As per the Notification of MoEFCC, Gol
dated 14th September, 2006, it is
mandatory to make available the copies
of detail EIA report in vernacular
language (Marathi) well before 30 days
of the public hearing. However, the
detailed report is not made available 30
days prior to the hearing.
The Public hearing has been carried
out as per the Notification of
MoEF&CC, GOI. The detailed report
along with the Executive summary
was provided by MPCB to the
respective Gram Panchayats.
MPCB had also published the
Executive summary of EIA report on
their website 30 days prior to the
Public hearing.
2 There are discrepancies in informalties in
Executive Summary and in the
presentation.
Executive Summary has been
prepared as per the guidelines
mentioned in the EIA Notification
2006 and its amendments thereof, and
it is an abridged version of the EIA
report and includes the major findings
of the EIA study.
3 Most of Grampanchayat offices has not
received the copies of Executive
Summary well before 30 days advance.
The Public hearing has been carried
out as per the Notification of
MoEF&CC, GOI. The detailed report
along with the Executive summary

Final EIA Report – Orange Smart City, Pen, Raigad July 2018
322 ORANGE SMART CITY INFRASTRUCTURE PVT. LTD.
Sr.No Queries Compliance
was provided by MPCB to the
respective Gram Panchayats.
4 The project proponent’s has not
mentioned number of job opportunities
created by the project. The project
proponent has mentioned the total figure
of laborers and future job opportunities.
Estimated Employment
Opportunities after completion is
depicted in Table: 2-1 in the EIA
report.
5 The project proponent has not obtained
“Consent to Establish,” from MPCB.
Project proponent informs that there may
be change in the plan of the project.
Hence if project plan is changed, then
will project proponent conduct the public
hearing again? .
The Project Proponent confirms that
they have obtained the Consent to
Establish from MPCB.
6 The project proponent did not inform the
sources of water for the project.
The Sources of Water has been
mentioned in Table no. 2-1 of EIA
report i.e. Hetavane Dam.
7 Most of local people from Schedule
Tribe Communities (Adivasi
Community) could not attend the hearing
due to the paddy sowing season. There
are sixteen Adivasi hamlets (Vastis), they
could not ‘ attend the hearing.
The date and time of public hearing
was fixed by MPCB and not by the
Project Proponent.
8 The page numbers in the report are not
correct. Either the page numbers have
been deleted or not written
It was an inadvertent mistake. The
page numbers have been corrected in
the EIA report.
9 As per the EIA Notification, 2006, EIA
should be conducted for an area of 10
Kms radius of the proposed project. It
was alleged that the Environment
Advisor of the project have not visited
the area. Proponent should give proof of
the fact that they have visited the
Grampanchayat office and conducted the
meeting with officials of Gram
Panchayat and local people.
BEIPL conducted the EIA studies as
per the provisions of the EIA
Notification 2006 and its
amendments thereof and had
undertaken socio-economic
consultations during the study period
from March 2015 to May 2015. The
meeting was not conducted at the
gram panchayat office. The interview
with local people were conducted
with adequate sampling size.
10 All the details mentioned in the EIA
report are not included in the Executive
Summary Report.
Executive Summary has been
prepared as per the guidelines
mentioned in the EIA Notification
2006 and its amendments thereof, and
it includes the major findings of the
EIA study.

Final EIA Report – Orange Smart City, Pen, Raigad July 2018
323 ORANGE SMART CITY INFRASTRUCTURE PVT. LTD.
Sr.No Queries Compliance
11 Hence the public hearing should be
postponed and local people should be
provided with complete EIA report in
vernacular language. The next public
hearing should be conducted on the
project site only as per the directives of
MoEF& CC.
The preparation of the EIA report and
conducting of public hearing has been
undertaken as per the provisions of
the EIA Notification 2006 and its
amendments thereof issued by
MoEF&CC, GOI till date.
12 The project proponent did not inform the
exact sources of water for the project.
Hence local people fear that Proponent
will lift the water from Hetvane or
Ambegaon dam which will affect the
drinking water system of the local
people.
The Project Proponent has secured in-
principle approval from the Irrigation
Department, Govt. of Maharashtra,
for the supply of water for the project.
13 Convener has not mentioned the venue of
public hearing in the letter which they
have sent to Grampanchyats.
The venue details were informed in
the letters sent to Gram Panchayats.
The Venue was also published in
local newspaper (Marathi) and
national newspaper.
14 It is suggested that after the meeting of
public hearing, the
summary/minutes/points of the meeting
will have to be read before the public in
the meeting only.
The summary / minutes / points of the
meeting were read before the public
in the meeting only.
Queries by Shri. Saniay Dangar, resident of Balavali, Tal. PenI Dist. Raigad:-
1 Township will be developed on four sites
which are not contiguous. Hence these
sites will have to be connected by roads.
But construction of road and availability
of land for construction of road is not
mentioned in the report. ‘
The four parcels in the township will
be connected by roads of adequate
length and width, thus making it
contiguous. The details of the
transport infrastructure can be
referred to in the Section 2.36 titled
“Traffic and Transportation Plan” in
the EIA report. The details of the
roads in the land parcels are given in
Table-2-49 titled “Infrastructure
related to road”.
2 The Patalganga, Balganga and
Bhogeshwari rivers which flows in the
vicinity of project have become highly
polluted rivers due to discharge of
industrial effluent from the existing
The Project Proponent commits that
the industrial effluent will not be
discharged in the
Patalganga/Balganga and
Bhogeshwari rivers.

Final EIA Report – Orange Smart City, Pen, Raigad July 2018
324 ORANGE SMART CITY INFRASTRUCTURE PVT. LTD.
Sr.No Queries Compliance
chemical units. If the new hazardous and
chemical factories allowed to develop in
the project area, the effluent will be
discharged in the river. The project
proponent did not inform the treatment of
treated domestic and industrial effluent.
3 The ancient Badaruddin Darga is just
adjacent to the project. Nothing is
mentioned about the Darga in the
presentation and in the report.
The Badaruddin Dargah is not a
notified monument / structure by the
Archaeological Survey of India. The
aforesaid Dargah is located outside
the project boundary. Extensive due
diligence has been accorded while
purchasing the land for the project
site which excludes the said Dargah.
OSC is planned as an eco-friendly
city. Thus, the development
envisaged will not affect the aforesaid
Dargah.
4 The efforts were made in the past by the
other project proponent for the
development and they left the project.
The local people fears that this total
project will be handed over to another
company. The local people are already
suffering due to pollution of chemical
factories and there will be increase in the
pollution and new project proponent will
not honour the promises made by the
present proponent.
The Project Proponent has made
considerable investment for the
project and has firm commitment to
completing it.
OSC is envisaged to be an eco-
friendly development and will
comply will all the rules and
regulations as per Environmental
Protection Act, 1986. Adequate
pollution control measures such as
Sewage Treatment Plants, along with
other extensive pollution control
measures, have been planned to
mitigate the adverse impacts, if any,
from the proposed project.
Queries by Dilip Mukund Patil, Resident of Kane, Tal. Pen, Dist. Raigad
1 In this presentation, it is mentioned that
no village will be relocated or displaced.
A detail of population of the project and
floating population is not mentioned.
This is not clear whether this project will
be beneficial to local people. Project
proponent answered that the no village
will be relocated or displaced due to the
The population estimates include the
resident population and the working
population that includes the floating
population. The same may be referred
to in the Table:2-15 and Table 2-16.
The estimated residential population
amounts to 73068 and the estimated
working population amounts to

Final EIA Report – Orange Smart City, Pen, Raigad July 2018
325 ORANGE SMART CITY INFRASTRUCTURE PVT. LTD.
Sr.No Queries Compliance
project. Moreover, this project will bring
prosperity in the vicinity of the project
149002 approximately which
includes a floating population of
about 42,572 during the operation
phase. The project will also include
affordable housing.
The Project Proponent during the
Public hearing confirmed that no
village will be relocated or displaced.
This project will generate direct and
indirect employment opportunities.
Project Proponent will also carry out
necessary CSR activities as per the
needs of the local people.
Queries by Shri. Dhairyashil Patil, MLA
1 This is not a first attempt for the
development of the project site.
Previously, the efforts were made by
other project proponents by planning to
develop Kanchangiri Complex and for
development of Special Economic Zone
(SEZ). Both the project were abandoned.
It is noted that after huge investment, the
SEZ project, which is established in other
parts of country, can give only 3% job
Opportunities. The people have sighed of
relief as SEZ project is abandoned. Now,
the project proponent M/s OSCIPL,
desires to develop Integrated Township.
The project proponent has appointed an
environment consultant for the
preparation of EIA study. Naturally, the
EIA study will be in favour of the project
only.
The said projects were never planned
at the proposed site of OSC.
The job opportunities generated due
to the project will be approximately
149002. .
The EIA Consultant has been
appointed as per the provisions of
EIA Notification 2006 as amended
till date. Moreover, the consultant is
NABET Accredited Consultant and
works under purview of MoEF&CC,
GOI.
2 As per the EIA report, the population of
the proposed city may be 300,000 (Three
lakhs only). There may be more than
4,50,000 souls in the proposed project,
hence the local people have to face civic
issues.
The population estimates and the
project infrastructure have been
worked out as per the relevant
applicable guidelines. Adequate
infrastructure such as transportation
network, sewage treatment,
information technology etc. has been
planned and designed by the Project
Proponent to ensure that local people

Final EIA Report – Orange Smart City, Pen, Raigad July 2018
326 ORANGE SMART CITY INFRASTRUCTURE PVT. LTD.
Sr.No Queries Compliance
do not face any civic issues because
of the project or the influx of
population in OSC.
3 The inception of the project will affect
the drinking water sources of the Pen
City. There may be decrease of nearly
2,000 hector irrigated land/area. The EIA
report mentions that 36.0 MLD drinking
water will require for the proposed
project. But he feels that more quantity of
water will be required than mentioned.
The sewage of Pen City is already
released in Bhogeshwari River. After
township comes up sewage will be
discharged in the Bhogeshwari River.
The development of OSC will not
disturb the existing water supply
arrangements of the surrounding area,
including Pen Town.
The water requirement for the project
has been worked out taking into
account the relevant guidelines. The
Project Proponent has secured in-
principle approval from the Irrigation
Department, Govt. of Maharashtra,
for the supply of water for the project.
Sewage treatment plants of adequate
capacity have been planned to cater to
the domestic sewage and the details
of the same can be referred to in the
Section 2.23.2 titled “Wastewater
Infrastructure”.
The treated water amounting to 3.28
MLD is available for various uses.
4 In the EIA report, it is mentioned that the
water will be lifted from Hetwane dam.
This point is missing in the presentation.
The water of Hetwane dam is reserved
only for irrigation purposes and local
people will oppose the lifting of water for
this project. The water of Ambegaon dam
which is exclusively reserved for Pen
City and hence project proponent will not
be allowed to lift the water from
Ambegaon ‘ Dam.
The Sources of Water has been
mentioned in Table no.2-1 of EIA
report i.e. Hetavane Dam,
The Development of Hetavane Dam
is for dual purpose including
Irrigation and Water Supply.
Hetavane Dam supplies a small
quantity of water for irrigation for
about four months a year to the
nearby areas of the dam and there is
availability of surplus stock of water
for drinking purpose.
Hetavane Dam, at present, mostly
supplies water to CIDCO for Navi
Mumbai having an intake of about
150 MLD.
The Ownership of the Dam is with
Irrigation Department, Government
of Maharashtra.

Final EIA Report – Orange Smart City, Pen, Raigad July 2018
327 ORANGE SMART CITY INFRASTRUCTURE PVT. LTD.
Sr.No Queries Compliance
Irrigation Department, Government
of Maharashtra has agreed in
principle to supply of about 36 MLD
of water for the project.
5 Due to this project, the local agriculture
may be hampered.
The project will not affect the local
agriculture. Adequate measures such
as sprinkling of water etc. during the
construction phase, and adequate
mitigation measures have been
integrated in the design of the project
to counter adverse impacts, if any,
during the operation phase of the
project.
6 While acquiring the land in 2007, the
project proponent has already issued
Indemnity Letter of job Opportunities,
from whom the land for the project was
bought. After ten years, nothing is done.
As per the policy, if at all the project is
not implemented within five years, the
land/plot has to be handed over to the
owner of the plot.
Project will bring economic
opportunity to the residents and
businesses of the region, with a
particular focus on local jobs, skill
development and apprenticeships.
Project Proponent will hire local
workers with required skill sets
throughout the lifecycle of the project
and will also provide training
opportunities to local residents in
order to build a skilled labour force
and long-term capacity and
encourage local participation.
The land purchase and aggregation to
the extent of about 1042.51 acres on a
‘willing buyer, willing seller’ basis is
a time consuming task. The project
will move at a fast pace after
Environment Clearance is received.
7 The project proponent has not considered
the study/findings of KasturiRangan
Committee, though the project area falls
under Western Ghat. UNESCO has
already declared Western Ghat as World
Natural Heritage and declared more than
139 plants and animals as “highly
sensitive protective species.”
The project area doesn’t fall in the
Western Ghats.
8 This public hearing shall be cancelled &
shall be re-conduct it
The public hearing has been carried
out as per the provisions of the EIA

Final EIA Report – Orange Smart City, Pen, Raigad July 2018
328 ORANGE SMART CITY INFRASTRUCTURE PVT. LTD.
Sr.No Queries Compliance
Notification, 2006 and its
amendments thereof till date.
Queries by Shri. Vikas Mhatre, resident of Koproli, Tal. Pen Dist. Raigad
1 He expressed the opinion that project
proponent is promising the vague job
opportunities to local youths as the
requirement of manpower and labor is
not bifurcated.
Estimated Employment
Opportunities while in final operating
stage is depicted in Table: 2-1 in the
EIA report.
The project will provide employment
to an estimated working population of
about 149002. The total labour during
the construction phase will be around
500.
2 He further expressed the opinion that the
project will require additional land.
The additional land if required will be
taken through proper procedure and
the requisite permissions will be
secured.
3 He asked to Environment Consultant for
the information of the Proprietor and
Board of Directors of the project.
Environment Consultant were unable to
answer the same.
Name of proprietor & officers from
the company was provided during
public hearing.
Queries by Shri. PromodPatil, Member,Zilla Parishad Raigad
1 Name of the project is Orange City,
which is in English. This needs to be
changed to Marathi.
The company should consider
conducting the public hearing in
individual villages.
However, if the project is going to benefit
the people we will support it.
Name change is not relevant to
Environmental public hearing.
The public hearing has been
conducted in accordance with the
provisions of the EIA Notification
2006 and its amendments thereof till
date.
The project will generate direct and
indirect employment opportunities
and skill development which will
enhance the socio-economic status of
the surrounding area.
Queries by Shri. Jinesh Shirsath, resident of Antola, Tal. Pen, Dist. Raigad.
1 It is mentioned that hazardous waste will
be generated. If the project is a residential
project how will hazardous waste be
generated and if it is generated how it will
be managed. Seasonal study for EIA is
not carried out. In presentation, it is
The project is a planned mixed use
development including residential,
commercial and industrial
components. Also, OSC has been
planned as an eco-friendly smart city.

Final EIA Report – Orange Smart City, Pen, Raigad July 2018
329 ORANGE SMART CITY INFRASTRUCTURE PVT. LTD.
Sr.No Queries Compliance
mentioned that the plan may change a bit
but it is not mentioned in EIA report.
The individual industries will comply
with the Hazardous Waste
Management Rules 2016 which will
be under the scrutiny of the
Maharashtra Pollution Control
Board.
The EIA has been carried out for one
season as per the provisions of the
EIA Notification 2006 and its
amendments thereof till date.
Queries by Koshitai Pawar, Sarpanch, Balavali, Tal. Pen, Dist. Raigad
1 The report has been submitted in English,
it should be submitted in Marathi. We
can’t read English. Water source will be
affected.
The EIA report has been prepared as
per the provisions of the EIA
notification 2006 and its amendments
thereof till date issued by MoEF&CC,
GOI. As per MoEF&CC guidelines
the Executive Summary was also
made available in local language i.e.
Marathi. The presentation during the
public hearing was also made in local
language Marathi.
The development of OSC will not
disturb the existing water supply
arrangements of the surrounding area.
Queries by Shri. Madan Patil
1 Shri. Madan Patil asked whether project
proponent will buy construction
materials from outside? It is informed
that construction materials will be
purchased from Authorized mines. He
suggested that contract shall be given to
the local people.
The Project Proponent will give
priority to local contractor provided
they are able to meet the contract
requirements.
Queries by Shri. Saniay Naik, resident of Ambivali, Tal. Pen, Dist. Raigad.
1 The total EIA report should be made
available in Marathi and another public
hearing should be arranged.
The preparation of the EIA report and
the conducting of public hearing has
been undertaken in accordance with
the provisions of the EIA Notification
2006 and its amendments thereof
issued by MoEF&CC, GOI till date.
Queries by Shri. Saniay Dangar, resident of Balavali, Tal. Pen, Dist. Raigad.

Final EIA Report – Orange Smart City, Pen, Raigad July 2018
330 ORANGE SMART CITY INFRASTRUCTURE PVT. LTD.
Sr.No Queries Compliance
1 The project is proposed at four locations
which are at a distance of 3 to 7 km and
there is limited connectivity to reach this
location. Will the company acquire land
through government to strengthen the
connectivity?
OSC is planned on 1042.51 acres
located at 4 different location within
3 kms from each other.
The sites are connected through
NH66, SH88 and a ODR (Other
District Road).
The upgradation of existing
connectivity is already in progress by
the Government.
2 Historical monuments have not been
mentioned in the report.
Reply: -company representative clarified
that the the road shown in the plans are
along the ODR (other district roads).The
company will use existing roads for
connectivity purpose till such time that
this road may be widen by the
government at the later stage.
There are no notified historical
monuments/relics etc. as notified by
the Archaeological Survey of India
within the project site and within the
10 km radial study area for which the
EIA studies have been undertaken.
The notice for the conducting of public hearing published in the English newspaper and in the
local vernacular language newspaper in shown below:
Notices for the conduct of public hearing in English newspaper and the local vernacular
newspaper
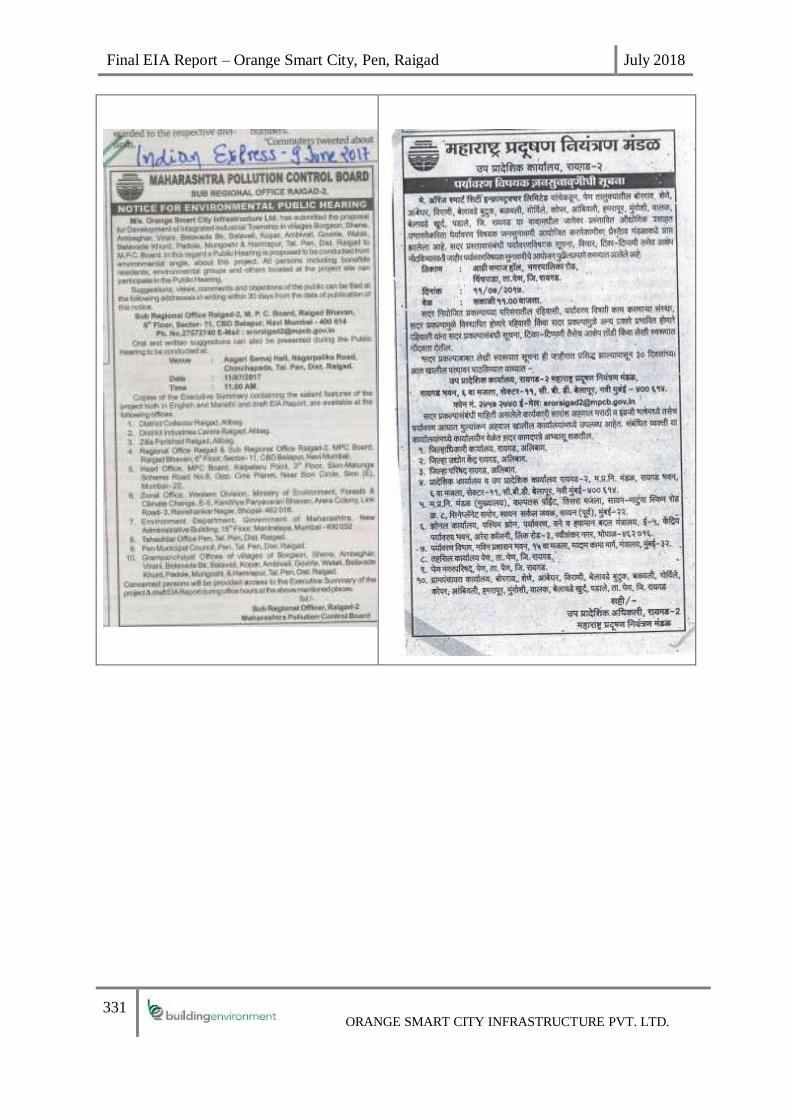
Final EIA Report – Orange Smart City, Pen, Raigad July 2018
331 ORANGE SMART CITY INFRASTRUCTURE PVT. LTD.

Final EIA Report – Orange Smart City, Pen, Raigad July 2018
332 ORANGE SMART CITY INFRASTRUCTURE PVT. LTD.
7.2 Risk Assessment and Disaster Management Plan
The risk assessment is conducted for the project and accordingly DMP is prepared. The RA &
DMP document is attached as Annexure XIX.

Final EIA Report – Orange Smart City, Pen, Raigad July 2018
333 ORANGE SMART CITY INFRASTRUCTURE PVT. LTD.
8. PROJECT BENEFITS
This section of report describes the direct and indirect benefits due to proposed project is
expected to have at the local, regional or even national scale. The benefits from the project on
the infrastructure in general and on the socio-economic status will be described.
The Project will have Industrial (less polluting), Residential & Commercial clusters with state-
of-the-art infrastructure and globally benchmarked smart features. The project development
envisages Indian and foreign investments over a period of 15 years, creating a total built-up
area of 8.64 million square meter of industrial, residential and commercial space. The project
also aims to become home to a population of approximately three lakhs and create job
opportunities for approximately 1.5 lakhs skilled and unskilled professionals.
The said project will have some of the following major socio-economic benefits.
a) Employment
The socio-economic benefits arising out of this project for the local populace will include
creation of direct and indirect jobs and consequent rise in the income levels, associated
commercial and social infrastructure development in the mofussil areas, improved quality.
The skilled manpower required for operation of the industrial estate will be easily available
from the proposed areas. Manpower training and skill up-gradation will be encouraged.
b) Infrastructure Development
The proposed project will increase the Infrastructural facility for the area especially which will
provide an opportunity for employment generation and development of service sectors.
c) Economic Development
Proposed project will add benefit to the regional socio-economic status due to development of
ancillary facilities besides main project.
d) Multiplier Effect
The project will have excellent multiplier effect and will become truly a win-win situation for
all the stakeholders. Thus, the proposed project has substantial socio-economic and
environmental benefits at the local, the State, the Regional and the National levels.
g) Aesthetic Environment
The proposed project will reduce the pollution load in the micro level environment. And the
aesthetic beauty will get a chance to be much better than earlier.
8.1 Socio –Economic Welfare Measures
OSCIPL is committed for various social welfare development in the surrounding region. The
following CSR measures will be implemented by OSCIPL which along with cost are given in
Table 8-1: CSR measures along with cost.

Final EIA Report – Orange Smart City, Pen, Raigad July 2018
334 ORANGE SMART CITY INFRASTRUCTURE PVT. LTD.
Table 8-1: CSR measures along with cost and the timelines
Sr.
No.
CSR measures Cost (Rs.
Crores)
Timelines
1 In the proposed development repair of primary
schools will be undertaken and academic facilities
will be developed. Assistance will be provided to
start computer education classes
7-8 2022-2028
2 Skill development program for locals by
conducting through ITI or special classes.
5-7 2022-2028
3. Providing support for primary health care facilities,
gymnasium and yoga classes & special programs
will be undertaken on health education
2-3 2022-2028
4 Activities for women empowerment, support to
women’s self-help groups and child welfare
5-6 2022-2028
5. Awareness program and activities on cleanliness
(Swachh Bharat) and environment protection will
be conducted
1-2 2022-2028
6. Provision of social infrastructure such as pure
drinking water, solar lights, development of
community toilets etc.
12-15 2019-2025
8.2 Corporate Environmental Responsibility
As per the requirements of MoEF & CC, OSC will spend an amount of 10.16 crores (0.5% of
the total project cost i.,e, 2032 crores) for undertaking afforestation programme on the land
identified outside the OSC premises.

Final EIA Report – Orange Smart City, Pen, Raigad July 2018
335 ORANGE SMART CITY INFRASTRUCTURE PVT. LTD.

Final EIA Report – Orange Smart City, Pen, Raigad July 2018
336 ORANGE SMART CITY INFRASTRUCTURE PVT. LTD.
9. ENVIRONMENTAL MANAGEMENT PLAN
9.1 Introduction
Environmental Management Plan (EMP) outlines the various pollution control systems and
other measures envisioned for alleviating environmental impacts identified separately for
construction and operation phases. Individual mitigation measures has been assessed with
respect to:
➢ Adoption of state of art technological measures;
➢ Identification of human resources for its effective implementation;
➢ Allocation of financial resources for its effective implementation; and
➢ Effectiveness of mitigatory measures.
EMP specifies various technological measures for pollution prevention, waste minimization,
attenuation etc. proposed to be undertaken to mitigate the environmental impacts on each sector
of environment during each phase of the project, i.e. construction phase and operation phase.
Apart from mitigation measures, EMP also includes institutional set-up for implementation of
various measures.
9.2 Environment Cell
Comprising of all environment and public relations departments of all departments formed
under the project and headed by the OSCIPL Environmental Officer. The environment cell will
be responsible for:
➢ Periodic review of environmental status
➢ Implementation and maintenance of green buffer areas,
➢ Overall environmental compliance management,
➢ Review of STP/CETP operations and taking corrective measures,if any,
➢ Monitoring of waste management system,
➢ Implementation of EMP and Compliance to conditions stipulated in Environmental
clearances and consents,
The Environment Management Committee (EMC) shall undertake the activities as discussed
below:
9.2.1 Inspection, Monitoring & Audit
The Environment cell under the Environment Management Committee will undertake
inspection and monitoring of the environmental management measures during construction of
infrastructure in order to ensure the effectiveness of suggested mitigations.
OSCIPL through its Project Management department will ensure that all the contractors
comply with the requirements of conditions for all applicable permits and guidelines. The
inspections and audits will be undertaken by an Environment cell directly or through external
agencies/experts.

Final EIA Report – Orange Smart City, Pen, Raigad July 2018
337 ORANGE SMART CITY INFRASTRUCTURE PVT. LTD.
The inspection and audit findings will be implemented by the contractors in their respective
areas. The entire process of inspections and audits will be documented.
Monitoring of green buffer areas, eco protection zone and other delineated area will also be
undertaken by the Environment cell.
9.2.2 Reporting and Review
Reporting of environmental, health, safety and social performance reports or check list,
incident record register etc will be developed and implemented through a program of reporting
by the Environment Cell throughout the project.
All contractors engaged will be required to adhere to the reporting requirements in terms of
timely report submission with required details. All complaints and enquiries will be addressed
with records maintained in an assigned register by the safety officer of each contractor.
Internal and external reporting mechanism will be developed, internal reporting will comprise
of the Environment Cell, the representatives of the contractors and the top management of
OSCIPL while external reporting will comprise of the top management, other government
agencies and civil society.
The internal reporting will be undertaken on quarterly basis while the external reporting will
be undertaken as per the requirement of the authorities.
9.2.3 Record Keeping
OSCIPL will be required to keep records of all EHS (Environmental Health & Safety) and
social aspects, which will be documented and updated. Personnel will be identified to ensure
documentation with detail of responsibilities and training on documentation system.
Documents of key importance to be developed and controlled include:
➢ Standard Operation Procedures (SOP);
➢ Register on Legal Commitment;
➢ Incident Communication Report;
➢ Complaints register and Grievances
➢ Emergency Response Procedures;
➢ Training Records;
➢ Monitoring Reports and;
➢ Inspection and Auditing Reports
9.2.4 Review and Amendments of EMP
This EMP shall be reviewed annually or as considered essential to incorporate any change in
the organization, process, or regulatory requirements. Following a review, amended EMP will
be communicated to all the staff.
9.3 Applicable Environment and Social Legislations
OSCIPL will abide by all the environmental and social legislations as enlisted below:

Final EIA Report – Orange Smart City, Pen, Raigad July 2018
338 ORANGE SMART CITY INFRASTRUCTURE PVT. LTD.
➢ The Environment (Protection) Act, 1986 and Environment (Protection) Rules 1986
➢ The Water (Prevention and Control of Pollution) Act 1974
➢ The Air (Prevention and Control of Pollution) Act 1981
➢ Environment Impact Assessment Notification, 2006 amended in 2009
➢ Municipal Solid Wastes (Management and Handling) Rules, 2016
➢ Bio-Medical Waste (Management and Handling) Rules, 2018 and its amendments
thereof
➢ Hazardous Waste Management And Handling Rules 1998 and Other Wastes
(Management and Transboundary Movement) Rules, 2016
➢ Central Ground Water Authority Notification
➢ Noise Pollution (Regulation and Control) Rules, 2000
9.4 Suggested Management and Monitoring Plans
Based on the findings of the Environmental Assessment management plans for mitigation,
monitoring and performance improvement measures for identified social and environmental
impacts has been prepared. The following plans are detailed in the following subsections:
➢ Environment Management Plan (EMP)
➢ Monitoring Action Plan (Environment)
➢ Disaster Management Plan (DMP)
9.5 Environment Management Plan (EMP)
The Environment management plan lists out the mitigation measures and management
strategies for construction and operation phases of the proposed project. The proposed
mitigation measures have been prepared considering all possible strategies oriented towards
effective environmental management including pollution prevention and control, waste
minimization and management, and residual attenuation for the proposed project. The
environmental impacts and mitigation measures suggested for various environmental
components for the construction and operation phase of the project are provided in Table 9-3
and Table 9-4 respectively

Final EIA Report – Orange Smart City, Pen, Raigad July 2018
339 ORANGE SMART CITY INFRASTRUCTURE PVT. LTD.
Table 9-1: Environmental Management Plan during the construction phase
Sr. No Component Significance of Impact
Impacts Identified
Suggested Mitigation Measures Responsibility
1. Ambient Air Quality
• Emissions from construction
equipment, vehicles
• Proper maintenance of machines and vehicles.
• Contractors to maintain proper records for fleet engaged.
• Limited vehicular movement to be permitted on disturbed
soil.
• Vehicle speed to be restricted to 15 km/h on unpaved roads.
• Trucks /dumpers engaged to be covered during off site
transportation.
• A minimum freeboard of six inches to be maintained by
haul trucks when material is transported on any paved road.
• Vehicles with valid Pollution under Control (PUC)
certificate to be engaged for project.
• Downwash of trucks to be undertaken prior to departure.
Implementation by Contractor and Supervision
by OSCIPL
• Improper handling and storage
of construction material
• Minimum possible drop height to be maintained while
unloading /screening of material.
• Stockpiling of excess fill material.
• Covers and enclosures to be provided for loose
construction material at construction site
Implementation by
Contractor and Supervision by OSCIPL
• Dust emissions
• Suppression of dust emissions by spraying water, wetting
of the stockpile,
• Paved roads to be cleaned regularly and un-paved roads
to be stabilized and watered regularly.
• Inactive disturbed surfaces to be sprinkled with water on
daily basis
Implementation by
Contractor and Supervision
by OSCIPL

Final EIA Report – Orange Smart City, Pen, Raigad July 2018
340 ORANGE SMART CITY INFRASTRUCTURE PVT. LTD.
Sr. No Component Significance of Impact
Impacts Identified
Suggested Mitigation Measures Responsibility
• Emissions from onsite operation
of diesel generators
• Power supply for construction will be sourced from local
distribution company.
• Generators to be used only as backup source.
• Diesel generators to be optimally operated and regularly maintained.
• Appropriate stack height as per the CPCB guidelines to
be provided for DG sets.
Implementation by Contractor and Supervision
by OSCIPL
• Burning of waste at labour
facilities
• LPG cylinders to be provided in labour canteens and use
of fuel wood to be discouraged.
• Open burning of waste shall not be permitted.
• Community kitchen to be promoted among subcontractors
Implementation by Contractor and Supervision
by OSCIPL
2. Water
Resources and Quality
• Burden on the water resources • Water for construction phase to be sourced from existing
sources allocated to PP supplemented with authorized
tanker supply.
• Optimal water consumption measures at labour facility sites along with adequate awareness programmers to be
organized for the workers.
Implementation by
Contractor and Supervision by OSCIPL
• Disposal of sewage from
construction camps
• Adequate number of toilets (at least 8-10 toilets per 100
labours) to be provided onsite.
• Random disposal of wastewater from labour facility to be
restricted
• Sludge from waste water treatment systems to be disposed off properly.
• Regular removal of debris from construction site to be
practiced.
Implementation by
Contractor and Supervision by OSCIPL

Final EIA Report – Orange Smart City, Pen, Raigad July 2018
341 ORANGE SMART CITY INFRASTRUCTURE PVT. LTD.
Sr. No Component Significance of Impact
Impacts Identified
Suggested Mitigation Measures Responsibility
• Contamination of surface and
groundwater resources from sewage and oil & grease
• Packaged STP to be deployed at the construction camp
site
• Oil and grease containing effluents to be pre-treated before discharge.
• Sludge from the packaged STP to be used as manure for
the green belt development / horticultural purposes
Implementation by Contractor and Supervision
by OSCIPL
Landscape
and
Topography
• Change in topography and landscape
• The 90% soil requirement will be fulfilled from cutting within the site and only 10% will be sourced from
approved quarries.
• Excavated soil to be used in level raising;
• Land surface contours to be restored in relation to the
surroundings.
• Construction footprint will be well defined and construction work to be carried out within the Project
footprints only.
• The construction contractors shall be instructed not to cut
any tree without prior approval from OSCIPL. Whereas
OSCIPL will facilitate to obtain permissions for tree cutting from relevant authority.
• Green area and green buffers will be developed to
improve the landscape.
Implementation by
Contractor and Supervision
by OSCIPL
•Localized flooding and related health issues due to decreased
infiltration
• Diversion dykes to channel runoff to be constructed around
the excavated site.
• Road corridor to be provided with adequate cross drainage.
Implementation by Contractor and Supervision
by OSCIPL
Soil Soil Erosion • Top soil to be preserved and reused for landscaping purpose
• Clearance of vegetative cover to be minimized to the extent
possible and redeveloped later on.
Implementation by
Contractor and Supervision
by OSCIPL

Final EIA Report – Orange Smart City, Pen, Raigad July 2018
342 ORANGE SMART CITY INFRASTRUCTURE PVT. LTD.
Sr. No Component Significance of Impact
Impacts Identified
Suggested Mitigation Measures Responsibility
• Site grading and excavation to be undertaken during dry
season.
• Dikes, berms, drainage swales or ditches to be provided to divert surface run-off to specific channels.
• A retention wall or bund to be provided around the storage
areas for excavated soil and other construction material.
• Completed earthworks to be sealed and/or re-vegetated at
the earliest with the help of landscape expert.
• Stacking of excavated soil material will be made only in
earmarked areas.
• Excavated soil to be used/ transported at the earliest for filling low lying areas.
• Proper routing and adequate capacity of the storm water
run-offs drains to be provided.
• Movement and parking of heavy machinery and vehicles
to be restricted to identified area.
• Area used for parking purposes to be restored immediately after completion of each project activity.
Soil contamination • All storage facilities to be designed with paved surface, provided with covered shed and adequate containment
facility at the construction.
• All waste to be handled as per applicable regulations.
• Hazardous waste to be handled and disposed of in
accordance with the requirements of Hazardous waste
management rules 2016
• Contractor to develop spill contingency plan.
• Provision of covered bins at labour facilities.
Implementation by
Contractor and Supervision
by OSCIPL

Final EIA Report – Orange Smart City, Pen, Raigad July 2018
343 ORANGE SMART CITY INFRASTRUCTURE PVT. LTD.
Sr. No Component Significance of Impact
Impacts Identified
Suggested Mitigation Measures Responsibility
• Waste to be segregated in biodegradable and non-
biodegradable fraction.
• Biodegradable waste will be treated with composting.
• Contaminated sand/ soil shall be prevented during construction activities.
• Trainings to be imparted to all workers and subcontractors
regarding hazardous waste storage and disposal procedures
Traffic and
transport • Increased traffic volume
• Wherever required temporary widening of roads to be
undertaken.
• Traffic and heavy machinery movement schedule to be
communicated clearly to the local inhabitants.
• Prior consultation with local Police Providing dedicated path within the site for entry and exit of the construction
vehicles
Implementation by
Contractor and Supervision by OSCIPL
• Damage to existing village roads
• Roads damaged due to project vehicles will be continuously repaired
Implementation by
Contractor and Supervision
by OSCIPL
• Disruption of traffic and
increased cases of road related
hazards
• Provision of adequate training to drivers.
• Dedicated parking area to be provided for project vehicles.
• Parking along footpaths, single lane roads shall be
prohibited.
• Detailed plan for signage around the construction areas to
be prepared to facilitate traffic movement.
• Inventory of the vehicles used in project and construction equipment along with their PUC’s to be maintained.
Implementation by
Contractor and Supervision by OSCIPL
Noise • Noise due to Construction
activities (such as excavation,
grading, erecting equipment,
piling, etc)
• Adequate planning to avoid high noise activities to be
undertaken.
• Acoustic enclosures, noise barriers to be provided in areas
of high noise generating sources.
Implementation by
Contractor and Supervision
by OSCIPL
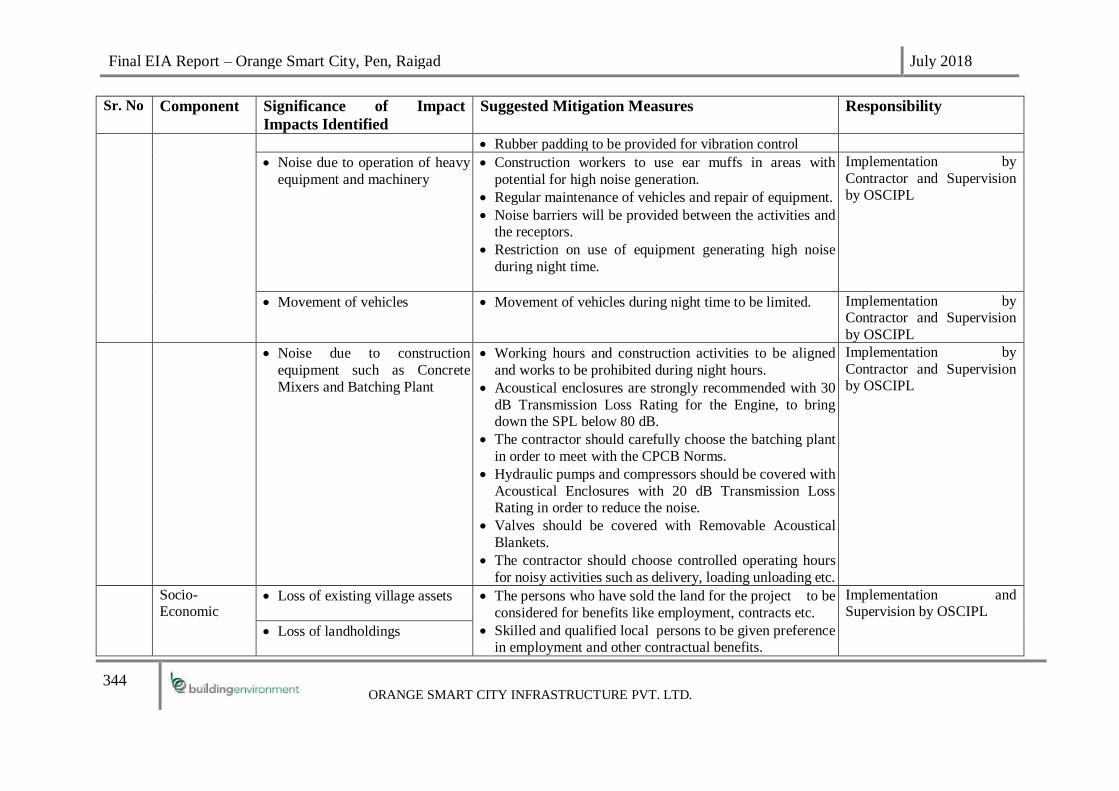
Final EIA Report – Orange Smart City, Pen, Raigad July 2018
344 ORANGE SMART CITY INFRASTRUCTURE PVT. LTD.
Sr. No Component Significance of Impact
Impacts Identified
Suggested Mitigation Measures Responsibility
• Rubber padding to be provided for vibration control
• Noise due to operation of heavy
equipment and machinery
• Construction workers to use ear muffs in areas with
potential for high noise generation.
• Regular maintenance of vehicles and repair of equipment.
• Noise barriers will be provided between the activities and the receptors.
• Restriction on use of equipment generating high noise
during night time.
Implementation by
Contractor and Supervision by OSCIPL
• Movement of vehicles
• Movement of vehicles during night time to be limited.
Implementation by Contractor and Supervision
by OSCIPL
• Noise due to construction
equipment such as Concrete
Mixers and Batching Plant
• Working hours and construction activities to be aligned
and works to be prohibited during night hours.
• Acoustical enclosures are strongly recommended with 30
dB Transmission Loss Rating for the Engine, to bring down the SPL below 80 dB.
• The contractor should carefully choose the batching plant
in order to meet with the CPCB Norms.
• Hydraulic pumps and compressors should be covered with
Acoustical Enclosures with 20 dB Transmission Loss Rating in order to reduce the noise.
• Valves should be covered with Removable Acoustical
Blankets.
• The contractor should choose controlled operating hours
for noisy activities such as delivery, loading unloading etc.
Implementation by
Contractor and Supervision by OSCIPL
Socio- Economic
• Loss of existing village assets
• The persons who have sold the land for the project to be
considered for benefits like employment, contracts etc.
• Skilled and qualified local persons to be given preference in employment and other contractual benefits.
Implementation and Supervision by OSCIPL
• Loss of landholdings

Final EIA Report – Orange Smart City, Pen, Raigad July 2018
345 ORANGE SMART CITY INFRASTRUCTURE PVT. LTD.
Sr. No Component Significance of Impact
Impacts Identified
Suggested Mitigation Measures Responsibility
• Impact on livelihood of the
villages
•
• .
Labour Camp
Management
• Domestic solid waste generation
• Regular removal of debris from construction site to be practiced.
• Integrated solid waste management plan will be
developed for collection, transportation, treatment
and disposal of waste.
Implementation by Contractor and Supervision
by OSCIPL
• Firewood for cooking and burning of garbage and
subsequent deterioration in air
quality
• Arrangement of cooking gas supply to be done by contractor
• Awareness to be created among workers to avoid use
of firewood or kerosene.
Implementation by
Contractor and Supervision
by OSCIPL
• Waste water generation
• Adequate number of toilets (at least 8-10 toilets per
100 labors) with septic tanks and soak pits arrangements to be provided onsite
• Random disposal of wastewater from labour colonies
to be restricted.
• Packaged STP to be provided for workers
Implementation by Contractor and Supervision
by OSCIPL
Health and hygiene • Workers to be provided with health and safety
training.
• First aid and essential medical services to be
provided at site.
• Health Check-up: (Quarterly)
• Personal protective equipment
• Creches for children:
• Medicines and preliminary check-up
equipment/ materials:
Implementation by Contractor and Supervision
by OSCIPL
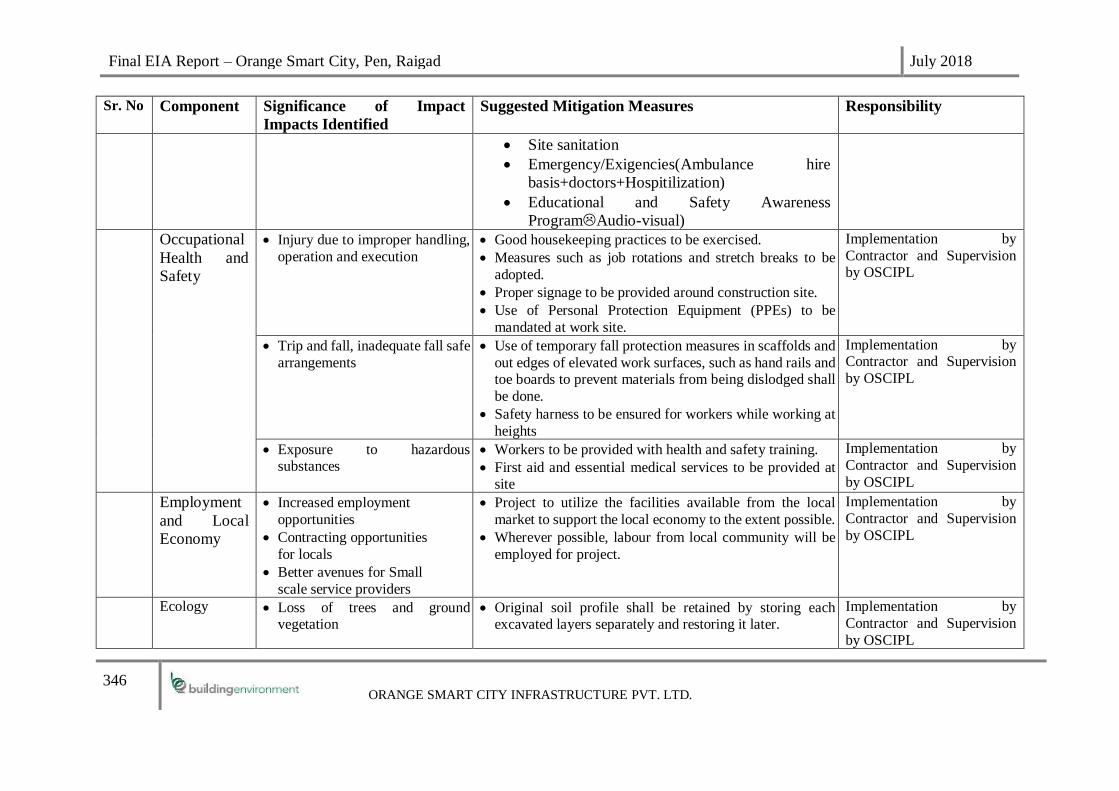
Final EIA Report – Orange Smart City, Pen, Raigad July 2018
346 ORANGE SMART CITY INFRASTRUCTURE PVT. LTD.
Sr. No Component Significance of Impact
Impacts Identified
Suggested Mitigation Measures Responsibility
• Site sanitation
• Emergency/Exigencies(Ambulance hire
basis+doctors+Hospitilization)
• Educational and Safety Awareness
ProgramAudio-visual) Occupational
Health and
Safety
• Injury due to improper handling,
operation and execution
• Good housekeeping practices to be exercised.
• Measures such as job rotations and stretch breaks to be
adopted.
• Proper signage to be provided around construction site.
• Use of Personal Protection Equipment (PPEs) to be
mandated at work site.
Implementation by
Contractor and Supervision by OSCIPL
• Trip and fall, inadequate fall safe
arrangements
• Use of temporary fall protection measures in scaffolds and
out edges of elevated work surfaces, such as hand rails and toe boards to prevent materials from being dislodged shall
be done.
• Safety harness to be ensured for workers while working at
heights
Implementation by Contractor and Supervision
by OSCIPL
• Exposure to hazardous substances
• Workers to be provided with health and safety training.
• First aid and essential medical services to be provided at site
Implementation by
Contractor and Supervision
by OSCIPL
Employment
and Local
Economy
• Increased employment
opportunities
• Contracting opportunities
for locals
• Better avenues for Small
scale service providers
• Project to utilize the facilities available from the local
market to support the local economy to the extent possible.
• Wherever possible, labour from local community will be
employed for project.
Implementation by
Contractor and Supervision
by OSCIPL
Ecology • Loss of trees and ground vegetation
• Original soil profile shall be retained by storing each excavated layers separately and restoring it later.
Implementation by
Contractor and Supervision
by OSCIPL

Final EIA Report – Orange Smart City, Pen, Raigad July 2018
347 ORANGE SMART CITY INFRASTRUCTURE PVT. LTD.
Sr. No Component Significance of Impact
Impacts Identified
Suggested Mitigation Measures Responsibility
• Tree felling to be minimized to the extent possible.
Contractors shall be instructed to practice the same.
• Adverse impact on wildlife due
to noise, vehicle movement
• Standard noise levels to be maintained during construction
activities
Implementation by Contractor and Supervision
by OSCIPL
• Increased turbidity and siltation • No silt/waste to be allowed in the nearby waterbodies Implementation by Contractor and Supervision
by OSCIPL
Table 9-2: Environmental Management Plan during the operation phase4
Sr.No. Component Impacts Identified Suggested Mitigation Measures Responsibility
1. Air Emission from industrial processes
• Comprehensive planning has been undertaken which ensures
that the proposed Industrial areas and existing residential are placed in such a way to avoid the impact of air pollution on
people.
• Adequate buffer to be provided for Residential areas and
industries.
• Individual industries will be required to obtain adequate
approvals such as Consent to Establish / Consent to Operate or Environment Clearance from MPCB / SEIAA / MoEF.
• All emission sources to be provided with adequate stack height
as per CPCB / MoEF norms.
Implementation by individual industry as per
Env clearance obtauined
by them as applicable.
Supervision by EMC5
4 The proponent will run the project till full occupancy / till handover to the tenants. Once the project is completed, it is likely to be taken up by MIDC or by municipality.
5 Environmental Management Cell (EMC) will be managed by the area authority (such as Municipality /MIDC / Any other body) responsible for overall operations of Orange Smart City

Final EIA Report – Orange Smart City, Pen, Raigad July 2018
348 ORANGE SMART CITY INFRASTRUCTURE PVT. LTD.
Sr.No. Component Impacts Identified Suggested Mitigation Measures Responsibility
• Low emission fuels to be used by industries.
• Air pollution control equipment to be deployed by industries.
• Good housekeeping to be practiced.
• PP to organize seminars and Capacity Building training programmes about the best practices in different industrial
sectors.
• PP in association with the MPCB to regularly monitor the
environmental performance of the industries.
• CETP – to be provided with adequate ventilation system to
prevent emissions such as HAPs, Odour etc. The adequate management practices to be adopted to control and mitigate
the air emissions during CETP operations;
• Waste Management Facility: Odour control measures to be
adopted. The adequate management practices to be adopted to control and mitigate the air emissions during facility
operations;
• All maintenance activities should ensure that the dust control
measures are applied.
2 Noise • Increase in noise levels in
residential areas and adjoining villages
• All habitations to have a suitable buffer area delineated around
them.
• Vegetative barriers in form of green belt to be provided around
all industrial areas.
• All industrial operations to have acoustic enclosure and
employ noise attenuation measures.
• All roads to be provided with vegetative barriers and barrier
walls.
Implementation by individual industry and
Supervision by EMC;
• Movement of vehicles
• All roads to be provided with vegetative barriers and barrier walls as applicable.
OSCIPL

Final EIA Report – Orange Smart City, Pen, Raigad July 2018
349 ORANGE SMART CITY INFRASTRUCTURE PVT. LTD.
Sr.No. Component Impacts Identified Suggested Mitigation Measures Responsibility
• D.G sets
• Diesel Generator Sets are supposed to have Sound Pressure Levels of lesser than 75 dBA when measured at 1 meter
distance. However, when multiple DG sets are supposed to be
kept close to one another, a single Acoustical Enclosure
combined for all the DG Sets is recommended with a minimum Transmission Loss Rating of 30 dBA
Implementation by
individual industry &
Supervision by EMC
• Sewage Treatment Plant/CETP
• multiple of blowers and pumps, out of which blowers can
generate noise levels exceeding 100 dB. Acoustical
Enclosures for Blowers are strongly recommended, with 30 dB Transmission Loss Rating.
OSCIPL
• Exposure to high noise prone areas
• All people working in the vicinity of the Equipment/Machinery with Sound Pressure Levels higher
than 90 dB should wear protective ear plugs to avoid
permanent hearing damage.
Implementation by
individual industry &
Supervision by EMC
• Increase in noise levels due to the
various operations at the Waste
Management Facility
• Use of heavy duty muffler systems on heavy equipment
• Limiting certain activities
• By using damping, absorption, dissipation, and deflection methods
• By using common techniques such as constructing sound
enclosures, applying mufflers, mounting noise sources on
isolators, and/or using materials with damping properties
• Preference to be given to low noise generating equipment while procurement
• Use of ear protective devices.
• In case of steady noise levels above 85-dB (A), initiation of
hearingconservation measures, etc.
OSCIPL

Final EIA Report – Orange Smart City, Pen, Raigad July 2018
350 ORANGE SMART CITY INFRASTRUCTURE PVT. LTD.
Sr.No. Component Impacts Identified Suggested Mitigation Measures Responsibility
3 Water • Increase load on fresh water
sources
• Individual projects will have separate water meters and two inlet sources, one for fresh water and second for use of treated
wastewater;
• SCADA system to be implemented for monitoring leakages in
the water conveyance system;
• Minimise flow variation from the mean flow;
Implementation by
individual industry and
& Supervision by EMC;
• Unplanned disposal of industrial
waste water generated and sewage leading to
Contamination of natural water
resources and ground water aquifers
• Building and plumbing code to propose dual plumbing layout;
• Domestic and industrial wastewater generated will be treated
separately;
• Storing of oil wastes in lagoons should be minimized in order to avoid possible contamination of the ground water system.
• All effluents containing acid/alkali/organic/toxic wastes
should be properly treated
• In case of oil waste, oil separation before treatment and
discharge into the environment.
Implementation by individual industry and
Supervision by EMC;

Final EIA Report – Orange Smart City, Pen, Raigad July 2018
351 ORANGE SMART CITY INFRASTRUCTURE PVT. LTD.
Sr.No. Component Impacts Identified Suggested Mitigation Measures Responsibility
For synthetic Organic chemicals industry
• Develop spill prevention plans in case of chemical discharges
and spills
• Develop traps and containment system and chemically treat
discharges on site
• Treated wastewater (such as sewage, industrial wastes, or
stored surface runoffs) can be used as cooling water makeup.
Implementation by
respective industries and Supervision by EMC;
• Inadequate management of
storm water
• Proper and well-designed storm water drainage system is
planned by OSCIPL Supervision by OSCIPL
• Spills, leaks from industries,
storage areas
• Spill contingency plan to be delineated Implementation by
individual industry and
Supervision by EMC;
Contamination of the surface water and ground water by discharge of
effluent from CETP
• Regular inspection of wastewater conveyance pipelines to be
undertaken
• Operation and maintenance of the all components of the CETP to be undertaken scrupulously at regular intervals
• Backup plan for temporary storage for untreated effluent with
adequate capacity in case of failure of CETP
Implementation by operator and Supervision
by EMC;
Contamination of the ground water by Solid Waste Management
facility (Landfill)
• Collection and treatment of leachate, sewage and storm water
run-off
• Increased recycling of treated leachate
• Monitoring of ground waters
• Run-off control measures
Implementation by operator and Supervision
by EMC;

Final EIA Report – Orange Smart City, Pen, Raigad July 2018
352 ORANGE SMART CITY INFRASTRUCTURE PVT. LTD.
Sr.No. Component Impacts Identified Suggested Mitigation Measures Responsibility
4 Solid Waste
• Inadequate collection and treatment of domestic waste and
hazardous waste,e-waste leading
to contamination of soil and
ground water resources, unhygienic conditions and odour
problem
• Industries generating hazardous waste to comply with the requirements of Hazardous Wastes (Management and
Handling) Rules, 1998 and Hazardous and Other Wastes
(Management and Transboundary Movement) Rules, 2016
• OSCIPL to comply with SWM Rules 2016
• OSCIPL to undertake benchmarking as per Ministry of Urban
Development for SWM
• Integrated solid waste management plan will be developed for collection, transportation, treatment and disposal of waste.
• Facilities will be designed to cater to the requirements of
horizon year
• Industries to contact hazardous waste management facility
near Taloja for disposal of their hazardous waste
• E waste to be sold to authorized recyclers.
• Recyclable waste to be collected separately and sold to authorized recyclers/ vendors.
Implementation by
individual industry
Supervision by EMC;
• Improper disposal of domestic
sludge, CETP sludge and
industrial waste
• Sludge will be generated from the sewage treatment plants
which will be de-watered using filter press, dried and used for
gardening purpose.
• CETP sludge to be disposed off at the nearest CHWTSDF;
• OSCIPL to secure necessary permission for disposing off CETP sludge at the nearest CHWTSDF;
Implementation by
operator and Supervision
by EMC;
5 Traffic
Volume
• Increase in traffic flow and volume
• The roads in general to be designed to carry the maximum traffic loads with anticipated future development and on a par
with IRC (Indian Road Congress) Standards;
• A well planned public transport infrastructure has been
envisaged for the project;
• The proposed road circulation shall provide for safe and efficient movement of people;
OSCIPL

Final EIA Report – Orange Smart City, Pen, Raigad July 2018
353 ORANGE SMART CITY INFRASTRUCTURE PVT. LTD.
Sr.No. Component Impacts Identified Suggested Mitigation Measures Responsibility
• Maintenance of systematic spatial and technical database for the roads which would enable regular monitoring and feedback
on road conditions thereby managing effective periodic
maintenance;
• Traffic congestion • Non-motorized vehicles to be encouraged
• Comprehensive traffic and travel surveys shall be conducted
every 5 years to monitor traffic characteristics and travel pattern to develop strategies for effective transportation;
• The proposed road circulation shall provide for safe and
efficient movement of people;
• Pedestrian Guard Rails, Road safety Signage and overhead
signs shall be placed wherever necessary;
• Road widths and lane configurations to be designed based on the modelling exercise;
OSCIPL
• Irregular Parking • Each individual project shall develop parking facilities as per
the Development Control Regulations.
• Each residential project to provide parking facilities as per
applicable norms and regulations.
• Sufficient Loading/unloading space to be provided
Implementation by
individual industries and
Supervision by EMC;
6 Land use
Pattern
• Impacts on existing human
settlements
• During the master planning stage, detailed analysis has been
undertaken to delineate site for OSC and various site alternatives were examined and ranked to select the option
based on socio-economic and environmental factors.
• Adequate buffer has been provided around environmentally
sensitive features
• Industrial land use has not been proposed in proximity of the sensitive receptors.
• The residential and commercial users to undertake the
development in consonance with the master plan of OSC and
also comply with the local regulation as applicable.
OSCIPL

Final EIA Report – Orange Smart City, Pen, Raigad July 2018
354 ORANGE SMART CITY INFRASTRUCTURE PVT. LTD.
Sr.No. Component Impacts Identified Suggested Mitigation Measures Responsibility
7 Ecology • Impact on flora and fauna of the
adjoining green areas • As per master plan, no forest land is falling in the delineated
area;
• Only native and local species will be chosen for green area.
• Each industry shall follow the CPCB guidelines;
• Only permissible activities shall be planned in the green
buffer.
• The fronts of river passing adjacent to the sites is planned as
green area.
Implementation by
operator of common
infrastructure and
individual industries
• Illegal cutting of trees • The project proponent will not allow illegal cutting of trees in
the project area by contractors /labourers working on the project site.
Implementation by operator of common
infrastructure and
individual industries
8 Social • Increased employment and
business opportunities ,
Improvement in infrastructure
Increased income levels,
Stabilization of the rural economies , Potential for
cultural conflict , Unplanned
secondary development in the
adjoining areas
• OSCIPL and individual project to undertake CSR program to ensure harmony and cooperation.
• .
• OSC is willing to spend CSR money in providing skill
development, clean and safe drinking water, sanitation facility,
primary health care support in the nearby villages. Further
details are presented in Section 8.2 titled ‘Socio –Economic Welfare Measures’ of the Chapter -8
OSCIPL

Final EIA Report – Orange Smart City, Pen, Raigad February 2018
355 ORANGE SMART CITY INFRASTRUCTURE PVT. LTD.
9.6 Green Belt Development Plan
Objectives of the green belt are to enhance the vegetation cover for increasing the biodiversity
of the region and consequently creating a noise barrier, Maintain and enhance the ecological
equilibrium of the area and to enhance the Aesthetic value of the area.
The green belt will also act as a barrier to the adjoining habitats and will have additional
environmental benefits. The plantation/greenbelt development proposed project area is 268
acres/ 108 Ha. Thus, plantation will be carried out on 254.95 acres/ 106.2 Ha @ of 1500
trees/ha, which will be about 25% of the proposed project area. It is proposed to plan 1000
tree saplings every year. Some trees shall be planted along road side in proposed industrial
project area. Development of green belt plantation within the industrial area along with
plantations of different species for the purpose of minimizing air pollution as well as
landscaping other than listed here. The list of recommended species for plantation is given in
Table 9-3.
Table 9-3: List of recommended species for plantation
Sr.
No.
Species/Local
Name
Spacing Important
features
Evergreen/
Deciduous
Growth Rate
Trees for general green areas and also suitable for roadside/borders/avenue
plantation
1 Ailanthus exelsa
(Maharukh)
3 x 3m Native
species and
grows to
the height
of 10-15m.
Have
medicinal
value.
Large tree,
good for
roadside
plantation
Deciduous Quick growing
2 Alstonia
scholaris
(Satwin)
3 x 3m Native
species and
grows to
the height
of 25m.
Shady Tree,
white
Evergreen Moderately
growing

Final EIA Report – Orange Smart City, Pen, Raigad July
2018
356 ORANGE SMART CITY INFRASTRUCTURE PVT. LTD.
Sr.
No.
Species/Local
Name
Spacing Important
features
Evergreen/
Deciduous
Growth Rate
fragrant
flowers
3 Albizia lebbeck
(Kala Shirish)
3 x 3m Shady tree,
yellowish
green
fragrant
flowers
.Widely
used for
green belt
developme
nt. The tree
grows upto
18m-30m
in height.
Briefly
Deciduous
Quick growing
4 Anthocephallus
cadamba
(Kadamb)
3 x 3m Native
species and
grows to
the height
of upto 35m
Large tree,
red flowers
Evergreen Quick growing
5 Azadirachta
indica (Neem)
3 x 3m Native
species and
grows to
the height
of 8-12m.
Have
medicinal
value.
Large tree,
good for
roadside
plantation
Evergreen Quick growing
6 Bauhinia
racemose
(Apta)
3 x 3m Small tree
with small
white
flowers,
grows to
the height
of 15-20m.
Deciduous Quick growing

Final EIA Report – Orange Smart City, Pen, Raigad July
2018
357 ORANGE SMART CITY INFRASTRUCTURE PVT. LTD.
Sr.
No.
Species/Local
Name
Spacing Important
features
Evergreen/
Deciduous
Growth Rate
Butterfly
host plant
7 Bombax ceiba
(Katesavar)
3 x 3m Native
species and
grows to
the height
of 12-35m.
Large tree,
with
attractive
red flowers.
The flowers
attract
many birds
to the trees.
Deciduous Quick growing
8 Butea
Monosperma
(Palas)
3 x 3m Medium
sized
deciduous
tree.
Beautiful
orange
flowers,
Butterfly
host plant
Native
species and
grows to
the height
of 6-12m.
Moderately
growing
Deciduous
9 Pongamia
pinnata
(Karanj)
3 x 3m Medium
size tree, 3-
6 m tall.
Shady tree
usually
planted
along the
roads.
Seeds are
harvested
for its oil.
Evergreen Quick growing
10 Ficus retusa 3 x 3m Native
species
Moderately
growing
Evergreen

Final EIA Report – Orange Smart City, Pen, Raigad July
2018
358 ORANGE SMART CITY INFRASTRUCTURE PVT. LTD.
Sr.
No.
Species/Local
Name
Spacing Important
features
Evergreen/
Deciduous
Growth Rate
(Nandrukh) grows to
the height
of 15m or
more taller.
Shady tree,
good for
roadside
plantation
Trees for beautification of the garden/building premises
11 Butea
Monosperma
(Palas)
3 x 3m Medium
sized tree.
Beautiful
orange
flowers,
Butterfly
host plant
Native
species and
grows to
the height
of 6-12m.
Moderately
growing
Deciduous
12 Cassia fistula
Bahava)
3 x 3m Medium
sized
deciduous
tree.
Beautiful
yellow
flowers,
Butterfly
host plant.
Grows to
the height
of upto 10m
to 12m in
height
Deciduous Quick growing
13 Erythrina indica
(Pangara)
3 x 3m Medium
sized
deciduous
tree. Bright
scarlet
flowers,
grows upto
Deciduous Quick growing

Final EIA Report – Orange Smart City, Pen, Raigad July
2018
359 ORANGE SMART CITY INFRASTRUCTURE PVT. LTD.
Sr.
No.
Species/Local
Name
Spacing Important
features
Evergreen/
Deciduous
Growth Rate
6m to 9m in
height
14 Lagerstroemia
flos-regineae
(Tamhan)
3 x 3m State
flower tree
of
Maharashtr
a
Medium
sized tree,
beautiful
purple
flowers
Grows to
the height
of upto 20m
Evergreen Quick growing
15 Saraca asoka
(Sita Ashok)
3 x 3m Shady tree
with red-
yellow
flowers
Grows to
the height
of 8-10m
Evergreen Quick growing
16 Caryota urens
(Bhirla Mad)
3 x 3m Medium
size Palm
tree upto
12m in
height
The sap
harvested
from this
palm is a
very
favorite
drink of
locals
Evergreen Quick growing
17 Putranjiva
roxburghii
A medium
sized tree
with
drooping
branches
and grows
Evergreen Quick growing

Final EIA Report – Orange Smart City, Pen, Raigad July
2018
360 ORANGE SMART CITY INFRASTRUCTURE PVT. LTD.
Sr.
No.
Species/Local
Name
Spacing Important
features
Evergreen/
Deciduous
Growth Rate
upto 12 m
in height
Shrubs
Species/Local
Name
Spacing Important
features
Perennial/Ann
ual
Evergreen/Decid
uos
1 Adhatoda
vsasica
(Adulsa)
1 x 1m Native
species and
grows to
the height
of 2.5m.
Very
important
medicinal
plant in the
locality
Perennial Evergreen
2 Cassia
auriculata
(Tarwad)
1 x 1m Native
species and
grows to
the height
of 1 t0 1.5m
Have
medicinal
importance.
Perennial Evergreen
3 Plumbago
zeylanica
(Chitrak)
1 x 1m Native
species
grows
upto6 feet
and very
important
medicinal
plants for
the locals.
Beautiful
white
flowers
throughout
the year
Perennial Evergreen
4 Stachytarpheta i
ndica
1 x 1m Native
species and
grows to
the height
Perennial Evergreen

Final EIA Report – Orange Smart City, Pen, Raigad July
2018
361 ORANGE SMART CITY INFRASTRUCTURE PVT. LTD.
Sr.
No.
Species/Local
Name
Spacing Important
features
Evergreen/
Deciduous
Growth Rate
of 2m.
Yields
beautiful
blue
flowers.
5 Vitex negundo
(Nirgudi)
1 x 1m Native
species and
grows to
the height
of 2 t0 8m
Commonly
grows near
water
bodies in
general.
Perennial Deciduous
Apart from the above tree species, some Indian fruit trees will also be planted in the green
belt. These trees may require longer duration of irrigation and maintenance. The list of these
tree species are given below in Table 9-4.
Table 9-4: Recommended species for fruit tree plantation
Sr.
No.
Tree Species Spacing Features
1. Mangifera indica
(Amba/Mango)
5 x 2m Reach 15-20 m in height, with a
crown radius of 10 m.
2. Achras zapota
(Chickoo/Sapota)
5 x 2m Native to India, a middle sized tree,
the average height is 12m.
3. Ziziphus mauritiana
(Bor)
5 x 2m Fast growing & hardy plant
4. Artocarpus
heterophyllus or
Artocarpus
heterophylla
(Jackfruit/Phanas)
5 x 2m Fruit bearing tree of India. Grows
upto 15m.
5. Syzygium cumini
(Jamun)
5 x 2m Native Indian tree grows upto 20m.

Final EIA Report – Orange Smart City, Pen, Raigad July
2018
362 ORANGE SMART CITY INFRASTRUCTURE PVT. LTD.
This is hereby ensured that the mostly indigenous/ local plants will be planted all around the
periphery of the project area and along the roadsides. Plantations would be of large leaf trees
that provide adequate shade and are semi-evergreen to evergreen. The landscape plan showing
green area, trees and table of tree species is enclosed.
Various native and indigenous trees would be planted for mitigation purpose which includes
in the section below:
Sr. No. Scientific Name
1 Amorphophallus paeoniifolius
2 Abelmoschus indicus
3 Annona squamosal
4 Artocarpus heterophyllus
5 Carica papaya
6 Citrus lemon
7 Mangifera indica
8 Albizia odorattissima
9 Albizia procera
10 Azadirachta indica
11 Bauhinia variegate
12 Bauhinia purpuria
13 Bambusa arundanaceae
14 Blumea sp.
15 Butea superba
16 Butea frondosa
17 Cocos nucifera

Final EIA Report – Orange Smart City, Pen, Raigad July
2018
363 ORANGE SMART CITY INFRASTRUCTURE PVT. LTD.
Sr. No. Scientific Name
18 Eucalyptus sp
19 Delonix regia
20 Leucena leucophloe
21 Abelmoschus esculentus
22 Abrus precatorius
23 Abutilon indicum
24 Acacia Arabica
25 Acacia auriculiformis
26 Acacia leucophloe
27 Achras sapota
28 Acalypha hispida
29 Acanthospermum hispidum
30 Achyranthes aspera
31 Adathoda vasica
32 Adiantum philippense
33 Adenanthera pavonina
34 Aegle marmelos
35 Aegeratum conyzoides
36 Ageratum conyzoides
37 Ailanthes excela
38 Albizia odoratissima
39 Albizia procera
40 Aloe barbedensis

Final EIA Report – Orange Smart City, Pen, Raigad July
2018
364 ORANGE SMART CITY INFRASTRUCTURE PVT. LTD.
Sr. No. Scientific Name
41 Allophylus cobbe
42 Alternanthera sessilis
43 Alysicarpus hamosus
44 Alysicarpus monilifer
45 Argyreia elliptica
46 Argemone Mexicana
47 Asparagaus racemosus
48 Atalantia monophylla
49 Azadirachta indica
50 Barleria cuspidate
51 Bauhinia racemose
52 Bridelia retusa
53 Blepharis asperima
54 Blumea lacera
55 Bombax ceiba
56 Borreria stricta
57 Bridelia retusa
58 Buchanania lanzan
59 Butea monosperma
60 Caesalpina pulcherima
61 Calotropis procera
62 Canna indicda
63 Calycotropis floribunda

Final EIA Report – Orange Smart City, Pen, Raigad July
2018
365 ORANGE SMART CITY INFRASTRUCTURE PVT. LTD.
Sr. No. Scientific Name
64 Careya arborea
65 Carissa carandus
66 Carissa spinarium
67 Carvia callosa
68 Casearia tomentosa
69 Cassia auriculata
70 Cassia obtuse
71 Cassia occidentalis
72 Cassia tora
73 Cassia fistula
74 Catunaregam spinose
75 Calycotropis floribunda
76 Ceiba pentandra
77 Celosia argentea
78 Cestrum noctrunum
79 Chromalaena odorata
80 Chrysanthemum sp
81 Cissus quadrangularis
82 Citrus media
83 Cleome viscose
84 Clematis triloba
85 Cocculus villosa
86 Cocos nucifera

Final EIA Report – Orange Smart City, Pen, Raigad July
2018
366 ORANGE SMART CITY INFRASTRUCTURE PVT. LTD.
Sr. No. Scientific Name
87 Combretum ovalifolium
88 Commelina benghalensis
89 Cordia dichotoma
90 Cordia rothri
91 Crotalaria pallida
92 Crotalaria sp. 2
93 Croton bonplandinum
94 Cryptostegia grandiflora
95 Curcurma aromatic
96 Cuscuta reflexa
97 Dalbergia lanceolate
98 Dalbergia sisoo
99 Datura alba
100 Dendrophthe falcate
101 Desmodium gangeticum
102 Desmodium triflorum
103 Diploclisia glaucescens
104 Echinops echinatus
105 Eclipta alba
106 Eclipta prostrate
107 Eichhornia cressipes
108 Emblica officinalis
109 Entada pursaetha

Final EIA Report – Orange Smart City, Pen, Raigad July
2018
367 ORANGE SMART CITY INFRASTRUCTURE PVT. LTD.
Sr. No. Scientific Name
110 Erythrina indica
111 Eupatorium glandulosum
112 Euphorbia nerifolia
113 Euphorbia neruri
114 Euphorbia nivula
115 Ficus asperrima
116 Ficus benghalensis
117 Ficus glomerata
118 Ficus hispida
119 Ficus microcarpa
120 Ficus racemosus
121 Ficus relisiosa
122 Flacourtia indica
123 Flacourtia latifolia
124 Gardenia latifolia
125 Garuga pinnata
126 Garcinia indica
127 Gloriosa superba
128 Gossypium herbaceum
129 Grewia abutifolia
130 Grewia asiatica
131 Grewia subinaqualis
132 Helictris isora

Final EIA Report – Orange Smart City, Pen, Raigad July
2018
368 ORANGE SMART CITY INFRASTRUCTURE PVT. LTD.
Sr. No. Scientific Name
133 Heliotropium indicum
134 Helitropium ovalifolium
135 Heterophragma quadriculare
136 Hemidesmus indicus
137 Hibiscus micronthus
138 Hibiscus ovalifolia
139 Hibiscus rosa-cianensis
140 Holarrhena antidysentrrica
141 Hygrophylla auriculata
142 Hymenodictyon excelsum
143 Hyptis suavalens
144 Ipomea sp.
145 Ixora parviflora
146 Ixora coccinea
147 Jasminum malbarichum
148 Jatropha gossypifolia
149 Justicia carnea
150 Justicia procumbens
151 Lantana camara
152 Lathyrus sativus
153 Lawsonia inermis
154 Largestromia lanceolate
155 Leea microphylla

Final EIA Report – Orange Smart City, Pen, Raigad July
2018
369 ORANGE SMART CITY INFRASTRUCTURE PVT. LTD.
Sr. No. Scientific Name
156 Lepisanthes tetraphylla
157 Leucas aspera
158 Leucas stelligera
159 Loranthus sp
160 Mancranga peltata
161 Mangifera indica
162 Melia azadirachta
163 Merremia umbellate
164 Merremia vitifolia
165 Mimosa pudica
166 Mitrgyna parviflora
167 Moullava spicata
168 Mollugo hirta
169 Moringa oleifera
170 Mucuna pruriens
171 Murraya koenigii
172 Musa paradisiac
173 Nerium indicum
174 Ocimum americanum
175 Ocimum basillum
176 Ocimum sanctum
177 Operculina turpethum
178 Opuntia dillinii

Final EIA Report – Orange Smart City, Pen, Raigad July
2018
370 ORANGE SMART CITY INFRASTRUCTURE PVT. LTD.
Sr. No. Scientific Name
179 Opuntia elator
180 Oxalis corniculata
181 Panicum notatum
182 Parthenium hysterophorus
183 Passiflora foetida
184 Pavonia zeylanica
185 Peltophorum ferrugineum
186 Peristrophe bicalculata
187 Phoenix aculis
188 Phyllanthes emblica
189 Phyllanthes nirurii
190 Physalis minima
191 Pithocolobium dulce
192 Polyalthia longifolia
193 Pongamia glabra
194 Pongamia pinnata
195 Portulaca oleracea
196 Psidium guava
197 Pteris sp
198 Punica granulatum
199 Rhus mysoorensis
200 Samanea saman
201 Sapindus emerginatus

Final EIA Report – Orange Smart City, Pen, Raigad July
2018
371 ORANGE SMART CITY INFRASTRUCTURE PVT. LTD.
Sr. No. Scientific Name
202 Schleichera oleosa
203 Sida acuta
204 Sida cordifolia
205 Sida rhombifolia
206 Smilax zeylanica
207 Solanum nigrum
208 Solanum xanthocarpum
209 Spondias pinnata
210 Sterculia villosa
211 Strobilanthus callossus
212 Sygygium cumini
213 Tabernaemontana pandacaqui
214 Tagetus sp
215 Tamarindus indica
216 Tectona grandis
217 Tephrosia purpuria
218 Teramnus labialis
219 Terminalia paniculata
220 Terminalia chebula
221 Terminalia elliptica
222 Tetrasigma sp.
223 Thespesia populanea
224 Thespesia lampas

Final EIA Report – Orange Smart City, Pen, Raigad July
2018
372 ORANGE SMART CITY INFRASTRUCTURE PVT. LTD.
Sr. No. Scientific Name
225 Thumbergia sp.
226 Tinospora cordifolia
227 Tragus biflorus
228 Trapa bispinosa
229 Trapa natans
230 Trema orientalis
231 Tridax procumbens
232 Triumferta pilosa
233 Urtica sp.
234 Vanda sp.
235 Vangueria spinose
236 Vanilla planifolia
237 Vernonia cinera
238 Vicoa indica
239 Vitex negungo
240 Woodfordia fruticose
241 Wrightia tinctoria
242 Wrightia tomentosa
243 Xanthium strumarium
244 Yucca gloriosa
245 Zizyphus jujube
246 Zizyphus mauritiana
247 Zizyphus nummalaris

Final EIA Report – Orange Smart City, Pen, Raigad July
2018
373 ORANGE SMART CITY INFRASTRUCTURE PVT. LTD.
Sr. No. Scientific Name
248 Zizyphus oenoplica
249 Cenchurus ciliaris
250 Apluda mutica
251 Chloris dolichosta
252 Cyanodactylon sp
253 Dichanthium annulatum
254 Aristida adscensionsis
255 Andropogon pertusus
256 Andropogon monticola
257 Cenchrus setifgera
258 Cyperus aristatus
259 Cyperus rotundus
260 Cynadon dactylum
261 Digetaria bicornis
262 Digetaria Segetaria
263 Digetaria stricta
264 Eragrostis tenella
265 Fibrystylis dichotoma
266 Ischaemum pilosum
267 Heteropogon contortus
Plantation of these tress will not only ensure the presence of native speices but will also help
in creating corridors for thriving faunal activites.

Final EIA Report – Orange Smart City, Pen, Raigad July
2018
374 ORANGE SMART CITY INFRASTRUCTURE PVT. LTD.
9.7 Cost of the mitigation measures
The cost of mitigation measures during the construction phase and the operation phase is
presented in Table 9-5 and Table 9-6 respectively.
Table 9-5: Cost of mitigation measures – Construction Phase
Sr.
No. Parameter Timeline for
implementation
Recurring cost per
year (Rs. Lacs)
1. PPE Progressive 25
2. Site Sanitation Facility +Housekeeping Progressive 5.5
3. Drinking water facility Progressive 3.0
4. Solid Waste Management Progressive 4.5
5. Safety railing, platform, ladder, hoist,
Cranes+ education and safety awareness
program etc.
Progressive 6.0
7. Health Check+ Ambulance facility
+Crèche facility Progressive 4.0
8. Environmental Monitoring(Monitoring
charges for air, water, waste water,
drinking water ,soil, DG stack, noise.)
2019 15.0
9 Pollution Control – STP & Noise
Control Measures
(Sound Reflective barriers)
Site barricading
2019 6.0
5.0
10 Dust control measures by engagement of
sprinklers 2019 10.0
11 Storm water drains with silt traps and
collection sump: 2019 28
12 EMC 2019 6
Total Cost 118
Table 9-6: Cost of mitigation measures- Operation Phase
S.No. Description Timeline for
implementation
Capital
Cost
(Lakhs)
O&M Cost
(lakhs) per
annum

Final EIA Report – Orange Smart City, Pen, Raigad July
2018
375 ORANGE SMART CITY INFRASTRUCTURE PVT. LTD.
1 Rain Water Harvesting 2019-2029 50 5
2 Fire Fighting measures, Disaster
Management Kit , Well-equipped
Control Room , CCTV , Disaster
Management training to labours
and Security Staff, Mock Exercise
, 2 way Public announcement
system
2019 -2029 1500 150
3 Water supply system including
WTP 2019 -2029 45000 2250
4 Sewerage System and Recycling
System 2019 -2029 35600 2101
5 Landscaping 2019 -2029 2000 400
6 Solid Waste Management 2019 -2029 4000 200
7 Information and Communication
Technology (ICT) 2019 -2029 3300 330
8 Energy saving 2024 -2029 1300 195
9 Traffic Management Plan
Implementation
2019 -2029 500 50
10 Pollution Control – STP & Noise
Control Measures
Sound Reflective barriers,
Acoustical Enclosures for STP
Blowers
2019 -2029 24.2 38
11 EM Cell -- Covered in
construction
phase
2
12 Ambient air quality sensors and
display 2019 -2029 100 10
13 CETP 2019-2029 520 6
14 Landfill cost 2019-2029 200 13.5
Total 94094.2
5750
The expenditure shown in the Table 9-6has been included in the project cost
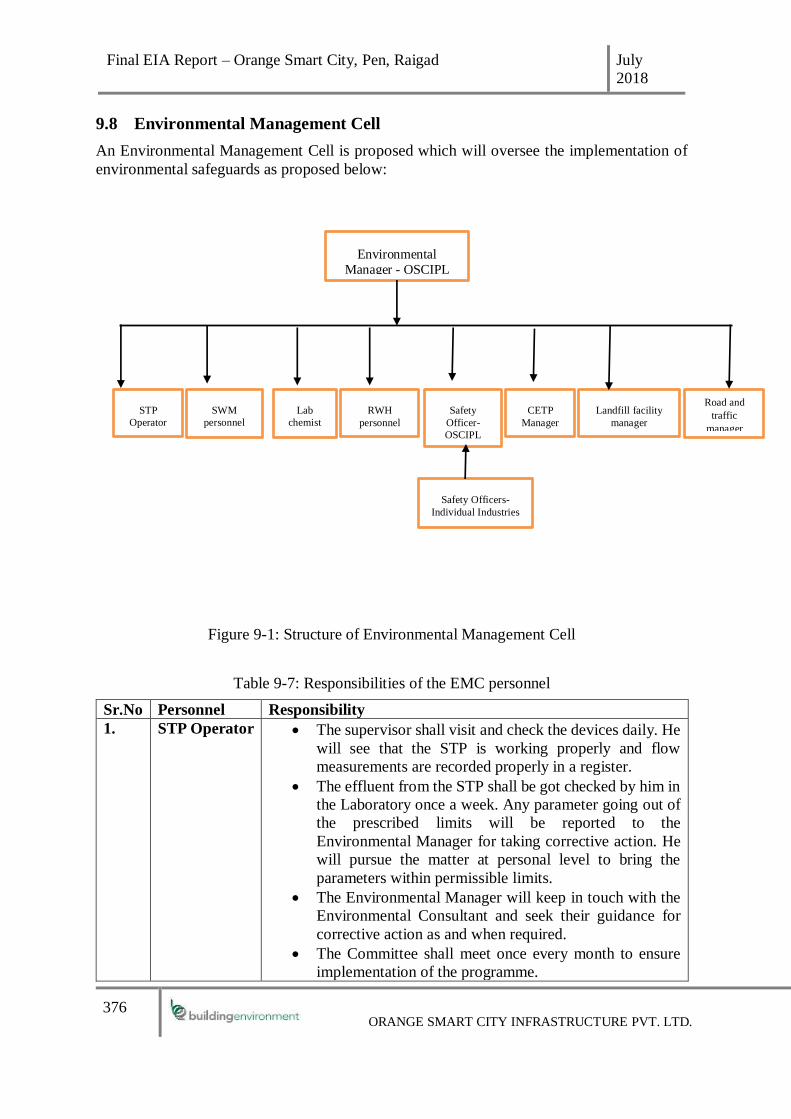
Final EIA Report – Orange Smart City, Pen, Raigad July
2018
376 ORANGE SMART CITY INFRASTRUCTURE PVT. LTD.
9.8 Environmental Management Cell
An Environmental Management Cell is proposed which will oversee the implementation of
environmental safeguards as proposed below:
Figure 9-1: Structure of Environmental Management Cell
Table 9-7: Responsibilities of the EMC personnel
Sr.No Personnel Responsibility
1. STP Operator • The supervisor shall visit and check the devices daily. He
will see that the STP is working properly and flow
measurements are recorded properly in a register.
• The effluent from the STP shall be got checked by him in
the Laboratory once a week. Any parameter going out of
the prescribed limits will be reported to the
Environmental Manager for taking corrective action. He
will pursue the matter at personal level to bring the
parameters within permissible limits.
• The Environmental Manager will keep in touch with the
Environmental Consultant and seek their guidance for
corrective action as and when required.
• The Committee shall meet once every month to ensure
implementation of the programme.
Environmental
Manager - OSCIPL
SWM
personnel
STP
Operator
CETP
Manager
Lab
chemist
RWH
personnel
Safety
Officer-
OSCIPL
Landfill facility
manager
Road and
traffic
manager
Safety Officers-
Individual Industries

Final EIA Report – Orange Smart City, Pen, Raigad July
2018
377 ORANGE SMART CITY INFRASTRUCTURE PVT. LTD.
• The Environmental Manager will bring to the notice of
the Managing Director any further action to be taken to
ensure environmental requirements. The Managing
Director will report to the Board of Directors, the action
taken to set right deficiency, if any.
2. SWM
personnel • Maintain the records / inventory of the solid waste
generated at the site for onward disposal to the MPCB
authorised vendor
• Interface with the SWM machinery vendor for the
maintenance of all the equipment related to the
segregation of the solid waste at site
• Supervise the segregation of the solid waste at the site.
• Makes necessary field inspections to assure safe working
conditions and that established methods and policies are
followed.
• To ensure compliance with the Solid Waste Management
Rules 2016 and all the relevant statutes.
3. Lab Chemist • To analyse the samples collected for the environmental
components such as air, water, noise and soil.
• To maintain the records of the results of analysis
• To maintain the laboratory equipment in working
condition.
• To identify the budgetary requirements for the upkeep of
the environmental laboratory.
• To oversee / supervise the environmental monitoring , if
outsourced to the MoEF/NABL accredited laboratory.
• To report the exceedance of the relevant parameters w,r.t
regulatory standards and bring it to the notice of the
Environmental Manager for corrective action.
4. RWH
personnel • To supervise the installation of the RWH systems by the
contractor.
• To maintain the records of the results of rainwater
harvesting quantities.
• To supervise operation and maintenance of the rainwater
harvesting structures and to keep a log of the same
• To monitor the implementation of the RWH measures by
individual industries.
5 CETP
Manager • To scrupulously check/ conduct inspections for all the
equipment installed and treatment systems in the CETP at
defined intervals as per the program.
• To maintain the record pertaining to the measurements of
flow and quality of effluent emanating from the CETP
• To get the quality of effluent monitored /checked by the
Environmental Laboratory at regular intervals. Any

Final EIA Report – Orange Smart City, Pen, Raigad July
2018
378 ORANGE SMART CITY INFRASTRUCTURE PVT. LTD.
exceedance of the parameters / deviation from the normal
values will be thoroughly investigated and corrective
action taken.
• To monitor the overall compliance by individual
industries against the respective effluent disposal
standards/ EC issued by MoEF & CC / CTE & CTO
issued by SPCB.
• To report any requirement for the procurement of any
components/ upgradation of the CETP to the
Environmental Management Committee.
6 Landfill
Facility
Manager
• To ensure regulatory compliance with SWM Rules 2016
• To oversee the monitoring of the ground and surface
water quality/air quality/ around the landfill site as per the
environmental monitoring plan outlined
• To keep the records of the Solid Waste Transportation
(Daily quantity of inert waste transported to landfill, No.
of trips made to site per vehicle to landfill),Solid Waste
Handling and Disposal (Daily quantity of inert waste
received), Monitoring and Survey(Records of all
monitoring carried out as per the finalized monitoring
protocol)
• To oversee monitoring of the leachate characteristics by
a MoEF accredited laboratory.
• To monitor the overall compliance against the EC issued/
CTE & CTO issued
• To inspect all the equipment (weighbridge etc), vehicles
at periodic intervals and to ensure their proper
functioning.
7 Road &
Traffic
Manager
• To oversee the functioning of the smart traffic
management system proposed for the OSC.
• To check/ inspect the condition of the pavements at
regular intervals, internal roads, bridges and to oversee
the personnel undertaking the repairs of the same.
• To maintain the records of the traffic volume and
characteristics of traffic and to evolve a smooth traffic
management plan on ground as per the specific
requirement.
5. Safety Officer • To periodically review and update the Disaster
Management Plan of the OSC.
• To keep a log / checklist of the potential accidents that
may occur.
• To conduct mock drills with the safety heads of the
individual industries

Final EIA Report – Orange Smart City, Pen, Raigad July
2018
379 ORANGE SMART CITY INFRASTRUCTURE PVT. LTD.
• To ensure the preparedness of OSC to counter any
emergency.
• To ensure that the individual industries have an EHS plan
in place along with necessary measures to counter
emergencies.
10. SUMMARY AND CONCLUSION
10.1 Introduction
Orange Smart City Infrastructure Pvt. Ltd. (OSCIPL) has planned to develop an Integrated
Industrial Township titled “Orange Smart City” at Taluka Pen, Dist Raigad, Maharashtra.
Although it is not part of Government of India’s 100 Smart City Mission, but it has been
planned along the lines of Smart City Guidelines of Government of India (GoI). This is the
first green field smart city planned in Maharashtra.
OSC is a planned urban development having more open space which encourages walk to work
communities. It is planned Transit Oriented Development (ToD), which reduces use of fuel
with emphasis on walk-ability and pedestrian comfortable environment. The activities on
different sites had been planned as per their significance to the functions/uses/business of the
OSC. The location of these activities is encapsulated as cluster with the proximity to transport
and facilities. OSC Development plan facilitates development of following industries:
• Category A and Life Sciences: Pharmaceutical, Bulk drugs and Intermediates
• Engineering: Automotive industries preferably one anchor unit and others will be tier-
2 and tier-3 category.
• Food Processing: Fish poultry and Meat processing, Food processing and packaging,
Sorting, grading and cold storage.
• IT/ITES
• Logistics
• KPO/BPO
• Other related industrial, commercial (offices) as per the predominant land use.
OSC is planned with mix use development with predominant industrial use. To support the
industrial and other economic uses, Residential and commercial is also proposed with all
required infrastructural utilities and allied facilities. The OSC is planned to address Industrial
demand and new emerging housing need including affordable housing by creating
infrastructure and a globally competitive environment that attracts investment and promotes
sustainable development.

Final EIA Report – Orange Smart City, Pen, Raigad July
2018
380 ORANGE SMART CITY INFRASTRUCTURE PVT. LTD.
The project site spread across over 1042.51 acres of land, is closely clustered at four locations.
The site parcels are located in close proximity to India’s financial capital, Mumbai. The site
cluster is well connected and is in close proximity of the Jawaharlal Nehru Port (JNPT), the
well-developed urban center of Navi Mumbai, the proposed Mumbai Trans-Harbor Link
(MTHL) and the proposed Navi Mumbai International Airport (NMIA).
OSC is within the influence zone of India’s most ambitious infrastructure project – the Delhi
Mumbai Industrial Corridor (DMIC) and is in vicinity of the terminal point of the Western
Dedicated Freight Corridor (DFC). The NH-66 and the suburban railway network presently
connect OSC to the major urban centres of the Mumbai Metropolitan Region (MMR).
The objective of OSC is to develop Green Sustainable Smart City to cater the industrial
demand, create employment opportunities and provide sustainable smart housing with
provision of adequate infrastructure and public services assurance of environmental justice
and healthful living environment and achievement of the vision for a more livable city.
The project proposes to have sustainable economic base primarily driven by manufacturing
product mix along with institutional, residential and commercial supporting activities. The
township proposes to provide trunk infrastructure facilities including supporting social and
physical infrastructure to boost the sustainable economy in combination of Industrial Parks,
IT/ BT Parks and Logistics, Warehousing and Financial Centers.
As per the EIA Notification 2006 and its amendments thereof, The aforesaid project cosists
of category ‘A’ synthetic organic chemical industries, the whole industrial integrated
township will be considered as Category ‘A’ and will be appraised at Central Level by
MoEF& CC at Delhi by the relevant Expert Appraisal Committee.
10.2 Project Description
The key details of the project are presented in Table 10-1.
Table 10-1 : Key details of the project
Sr. No Item Details
1. Name of the project Orange Smart City (OSC)
2. Project Type Integrated Industrial Township
3. Location Pen, Raigad
4. Name of the villages
coming under project area
T1: Boregaon, Shene, Ambeghar& Virani
T2: BelawadeBudruk
T3: Balawali, Govirle, Kopar,
Ambiwali&Hamrapur
T4: Mungoshi, Walak, BelawadeKhurd, Padale and
BelawadeBudruk
5. Project Connectivity NH 66 & SH 88
6. Total site area 1042.51 acres
7. Built Up Space 5.01 million sq.m
8. Industrial Built Up Area 3075720 sq.m (approx)
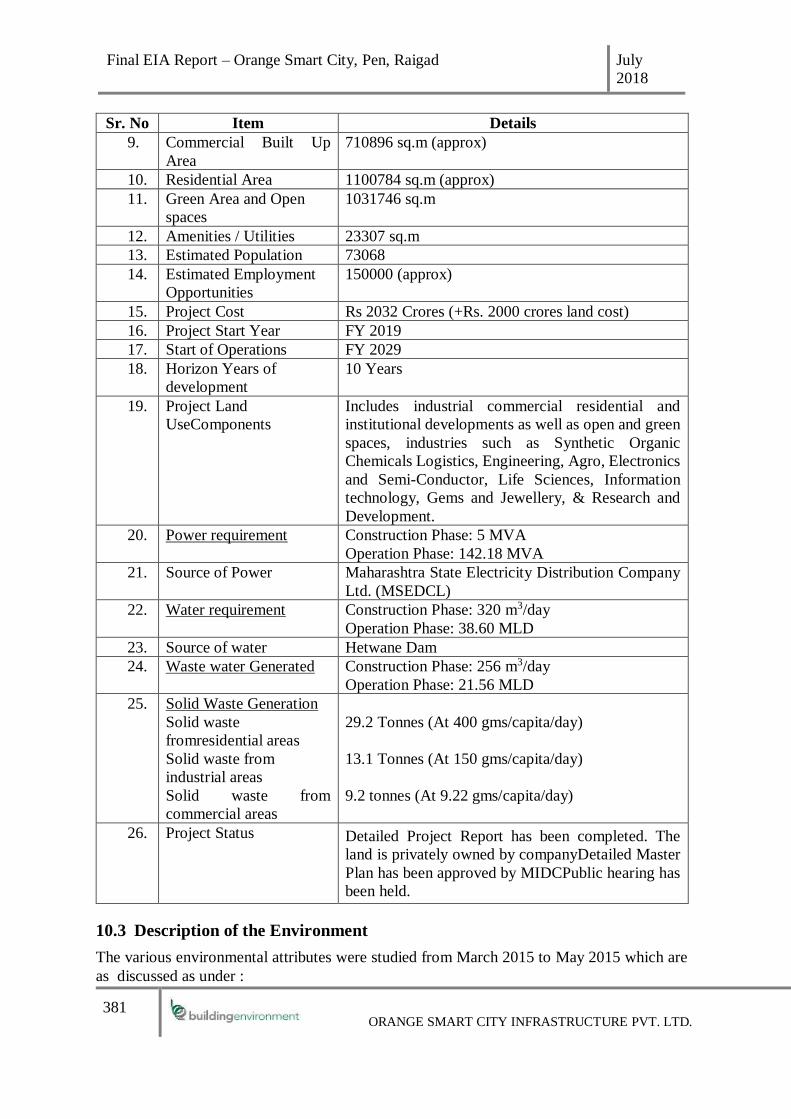
Final EIA Report – Orange Smart City, Pen, Raigad July
2018
381 ORANGE SMART CITY INFRASTRUCTURE PVT. LTD.
Sr. No Item Details
9. Commercial Built Up
Area
710896 sq.m (approx)
10. Residential Area 1100784 sq.m (approx)
11. Green Area and Open
spaces
1031746 sq.m
12. Amenities / Utilities 23307 sq.m
13. Estimated Population 73068
14. Estimated Employment
Opportunities
150000 (approx)
15. Project Cost Rs 2032 Crores (+Rs. 2000 crores land cost)
16. Project Start Year FY 2019
17. Start of Operations FY 2029
18. Horizon Years of
development
10 Years
19. Project Land
UseComponents
Includes industrial commercial residential and
institutional developments as well as open and green
spaces, industries such as Synthetic Organic
Chemicals Logistics, Engineering, Agro, Electronics
and Semi-Conductor, Life Sciences, Information
technology, Gems and Jewellery, & Research and
Development.
20. Power requirement
Construction Phase: 5 MVA
Operation Phase: 142.18 MVA
21. Source of Power Maharashtra State Electricity Distribution Company
Ltd. (MSEDCL)
22. Water requirement
Construction Phase: 320 m3/day
Operation Phase: 38.60 MLD
23. Source of water Hetwane Dam
24. Waste water Generated
Construction Phase: 256 m3/day
Operation Phase: 21.56 MLD
25. Solid Waste Generation
Solid waste
fromresidential areas
Solid waste from
industrial areas
Solid waste from
commercial areas
29.2 Tonnes (At 400 gms/capita/day)
13.1 Tonnes (At 150 gms/capita/day)
9.2 tonnes (At 9.22 gms/capita/day)
26. Project Status Detailed Project Report has been completed. The
land is privately owned by companyDetailed Master
Plan has been approved by MIDCPublic hearing has
been held.
10.3 Description of the Environment
The various environmental attributes were studied from March 2015 to May 2015 which are
as discussed as under :

Final EIA Report – Orange Smart City, Pen, Raigad July
2018
382 ORANGE SMART CITY INFRASTRUCTURE PVT. LTD.
10.3.1 Physiography
The project area is divided in four patches and these patches occupy diverse topography from
a steeply sloping hilly terrain situated at higher elevations to almost plain topography along
lower contours.
The T1 parcel is situated at southern downstream of Hetavane (Bhogeshwari) river. A South–
North valley divides this parcel in two hills. This valley has upstream maximum elevation of
220 m and downstream minimum elevation of 26 m where it meets the river, whereas ridge
has highest elevation of 340 m at top. The terrain of this land parcel has moderately steeper
slopes but at the top it is flatter. T2 Parcel has relatively flat ground. The ground elevation of
this Parcel ranges from 80 m to 55 m. The T3 land parcel is generally flat at top having slope
leading to the Balganga River near the area where it meets creek having potentials of
enhancing the site with a natural frontage. This land parcel is divided by downstream river of
Govirle bandhara (minor earthen check dam) . The drainage channel passes through the T3
Site connecting to Balganaga River. For T3, elevation ranges from 80m to 40m. The T4 parcel
is situated at base of major hills on West. T4 Parcel is made up of eighteen small land parcels
and two major parcels. One of the major parcel have ground elevation ranges from 55m to
7m. And other major parcel is relatively hilly ground with elevations ranges from 86m to 12m.
10.3.2 Hydrogeoological Observations
Groundwater Occurrence: The groundwater formation depends upon the topography as well
as the subsurface geology in the area of interest. In the case of OSC project, the topography,
as well as the subsurface rock are obstructing to the groundwater formation in this locale.
However, the groundwater is not intensively used in this area.
The project area occupies a steeply sloping, highly undulating land occupying the highly
placed plateau and hill slope portions. It is comprised of Deccan trap basaltic rock. Primarily,
this rock has low porosity and permeability and hence, is considered as “Hard” from
groundwater occurrence point of view. These factors are found to play vital role in poor
groundwater occurrence in the study area.
Dug wells:
The dug wells in study and surrounding area are found to be located particularly in the ravines
and low-lying gully portions and along the surface water courses (Plate 1). They are found 8
to 10 m in depth bgl. The static water level (pre-monsoon) in this region is reported to be
ranging from 8.5 to 9.0 m bgl, while the same (post monsoon) is observed to be almost at par
with the Ground level. These structures are largely found to be used as domestic water source.
Bore wells: The study and surrounding area hosts few bore wells. These are observed along
the lower reaches. They are found to tap the semi confined and confined aquifer in this area.
They are reported to be 90 to 100 m in depth bgl. Majority of bore wells are fitted with hand
pump while few are installed with low capacity pumps as per requirement.
10.3.3 Meteorology
An onsite meteorological station was installed to study wind speed, wind direction and
temperature during the period from March 2016 to May 2016. The predominant wind

Final EIA Report – Orange Smart City, Pen, Raigad July
2018
383 ORANGE SMART CITY INFRASTRUCTURE PVT. LTD.
direction during the period was from the West –North West quadrant. The findings are
summarised in Table 10-2.
Table 10-2: Synopsis of onsite meteorological data
Month Wind speed (m/sec) Temperature (0C)
Max Min Avg Max Min Avg
March -2016 5.5 0 1.25 39.1 18 26.8
April-2016 6 0 1.6 36 20.9 27.7
May -2016 4.6 0 1.57 34 23.4 29.4
The onsite meteorological data was compared with data from the nearest India Meteorological
Department (IMD) station Murud. The predominant wind direction as per the IMD Murud
station is from the West –North West quadrant. The summary of the IMD data is presented in
Table 10-3.
Table 10-3: Synopsis of the IMD Murud data (March 2014 to May 2014)
Month Wind speed
(m/sec)
Temperature (0C)
Max Min Avg Max Min Avg
March -2014 4.1 0 1.2 38.6 17.8 27
April-2014 3.9 0 1.4 36.6 19.2 27.7
May -2014 4.6 0 1.5 34.3 23.8 29.6
The onsite meteorological data is in general agreement with the IMD Murud data. The minor
differences are observed due to the difference in the period of recording.
10.3.4 Ambient Air Quality
The ambient air quality was recorded at the 14 stations. The air quality was recorded w.r.t.
the following parameters:
i. Particulate Matter less than 10µm (PM10)
ii. Particulate Matter less than 2.5µm (PM2.5)
iii. Sulphur dioxide (SO2)
iv. Oxides of nitrogen (NO2)
v. Carbon monoxide (CO)
vi. Hydrocarbon (HC)

Final EIA Report – Orange Smart City, Pen, Raigad July
2018
384 ORANGE SMART CITY INFRASTRUCTURE PVT. LTD.
vii. Volatile Organic Compounds (VoC)
The maximum 24 hourly values of the PM10, PM2.5, SO2, NOx were found to be within the
National Ambient Air Quality Standards (NAAQS)limit. The CO levels were also found to
be within the NAAQS limit of 2 mg/m3 for 8 hours. The Hydrocarbons and the VOCs were
found to be below detectable limit throughout the monitoring period.
10.3.5 Noise Quality
The noise quality was recorded at 11 locations. The noise levels (Leq) observed during
daytime in residential zone is in the range of 42.5 (Crosswind of T-3 at Kopar village) to 43.9
dB (A) (Upwind of T-1 Wirani Village) while during nighttime it is 32.5 (Downwind of T-4
at Mungoshi Village) to 33.8 dB (A) (Downwind of T-3 at Jite. village). The results reflect
that the Leq (day) and Leq (night) was within the limits stipulated by Central Pollution Control
Board (CPCB).
10.3.6 Water Quality
The ground water quality and the surface water quality was recorded at 6 stations and 8 surface
monitoring locations. The ground water quality parameters were analysed are per IS 10500.
The ground water results reflect that the calcium slightly exceeds the desirable limit of 75
mg/lit. The surface water quality parameters reflect that the water is chemically and
bacteriologically non-potable at three locations while it is potable at remaining five locations.
10.3.7 Soil Quality
The soil quality was recorded at 8 locations. The results indicate that the texture was mostly
clay and clay loam. The range of micronutrients reflect that the soil has good fertility level
and fulfils the minimum nutrient requirement for growth of plants.
10.3.8 Ecology and Biodiversity
The project is situated in the hilly region of North Konkan, though the proposed activities are
mainly in plain and rolling areas. The Forested hills in the surrounding area has moist
evergreen forests that are mixed with deciduous varieties. Some of the Forests are Bombax
dominant forests. The forest vegetation is interspersed with fruit trees like Mango, Cashew,
Chickoo, Jackfruit, etc.
There are number of hills within 15 km boundary of project site that have reserved forest. The
nearest Protected forest is Karnala Wildlife Sanctuary. The hillslopes are largely cultivated
with millets whereas foothills are cultivated with Paddy. Many hillslopes are cultivated for
Cucumber and other vegetables during the Monsoon. The entire area has low to moderate
wildlife value and fauna is significantly dominated by fringe species that are usually
associated with rural settings
An elaborate ecology and biodiversity study was conducted within the impact zone (10-15
km radius) of the project site. The conclusions of the study are given below:
The project area is outside any recorded forest area. In the project site, no formal logging of
wood and other such activities were observed, the exploitation of the forest resources by the
nearby villagers and the local communities was evident in the surroundings of the project site.
The marks of forests fire were also visible near two locations viz. Chirner and Palas village.

Final EIA Report – Orange Smart City, Pen, Raigad July
2018
385 ORANGE SMART CITY INFRASTRUCTURE PVT. LTD.
Flora
By and large the habitat is dominated by evergreen and deciduous foliage. Amongst the
locations surveyed, it was seen that many of the sites have localized biological diversity with
a great variety of evergreen tree species as well as shrub layer.The development activities
may result in clearing of many plant species mostly grasses and shrubs which are not unique
or rare species because of their abundant occurrence in other areas. Thus, the loss of these
species would have no serious ecological consequences.
Fauna
The project area could be home to general avifaunal species which are widespread and
therefore any loss of habitat in this area is not expected to lead to any major loss in species
numbers or diversity. Generally, the concerns of non- recorded species do exist although it
may be on smaller scale owing to their non-sighting in the three day sampling period between
Dec 16-18, 2015.
10.3.9 Socio –Economic Profile of the study area
The socio-economic baseline environment is described with respect to the various parameters
are as given below:
i. Demographic profile
According to the 2011 Census data, population in the total study area was 364915 living in
84345 households whereas the villages population in the project area was 11187 persons that
is about 3% of the total study area population and the population of all the rural villages within
the 15 km radius of the study area
ii. Social Groups
The proportion of Scheduled Castes (SCs) and Scheduled Tribes (STs) population within the
project study area is on an average 3.0% and 15.3% respectively. The proportion of SC
population in affected villages is merely 0.8% found only in 13 villages, which is less than
other rural villages (2.2%) and urban centres (4.9%) in the study area. Whereas the
proportions of ST population for villages within the project area is (43.9%), which together
constitutes to 44.7% which is much higher than the other rural villages (21.9%) & urban areas
(18.3%)
iii. Sex Ratio
According to 2011 census, sex ratio in the total study area was found to be 953 while in the
affected villages was found to be 972. The sex ratio in the villages other than the affected
villages was found to be 957.
It is important to note that, literacy rate for male and female in project affected villages is 57%
and 43% respectively which indicates that the literate male population is more than the female
literate population.
iv. Vulnerability
As regards vulnerability, poverty is actually a reason for making any section of a population
vulnerable. The data for families below poverty line for the all the villages in study area is not
available. However based on the studies in other areas of Maharashtra, most of the SC and ST

Final EIA Report – Orange Smart City, Pen, Raigad July
2018
386 ORANGE SMART CITY INFRASTRUCTURE PVT. LTD.
families can be considered as the vulnerable group which constitutes about 45% of the total
population in the project affected villages in addition to any other BPL families in the region.
A primary baseline survey was also conducted by BEIPL and the details can be referred in
the EIA study report.
v. Consultation with the villagers
The minutes of the consultation with the villagers in the affected area is given below in Table-
1.9 below:

Final EIA Report – Orange Smart City, Pen, Raigad July 2018
387 ORANGE SMART CITY INFRASTRUCTURE PVT. LTD.
Date of Visit 20/10/2015
Venue : Project Site
Client BEIPL : Mr. Hrushikesh Kolatkar
Client : Representative from Client
Village Name Kopar village Belawade village Ambeghar village
Discussion Points:
Key points of
the meeting
were
The village has school only for Primary
level and for Middle and high school
students have to go to Jambhultep, Pen.
There is no primary health center
facility. For critical health related
matters, Pen is the nearest place.
Rain water and Dug-well are the main
sources of irrigation. For domestic use,
Dug-well and Hand pumps are the
sources.
Most of the people in the village are
engaged in agriculture, dairy. Rice and
seasonal vegetables are cultivated by
the people. Most of the seasonal
vegetables grown are sold in Pen and
Navi Mumbai. Almost each family has
cows or buffaloes to supplement their
The village has a total of 328 houses
The school in the village is only up
to eight class. For studies after eight,
students have to go to Pen.
There is a private clinic of a
Physician in the village. The nearest
government primary health center is
at Pen village.
Most of the village land is rain fed
for agriculture purpose. For the
domestic use well and hand pumps
are the sources.
People of the village in general are
engaged in agriculture, dairy and
daily wage labourers. Rice and
seasonal vegetables are cultivated
by the people. Seasonal vegetable
The village Ambeghar has 427 houses. The
village has relatively large population. It can
be seen that the village is well connected by
road.
The village has Government school up to 8th
standard. For studies after eight, students have
to go to Pen.
There is a private doctor in the village. The
nearest government primary health center is at
Pen.
Most of the village land is irrigated through
dug-wells and tube wells.
For domestic use, dug-wells and hand pumps
are the sources of water for villagers.
People of the village in general are engaged in
agriculture, dairy and wage labour. Main
crops is rice and seasonal vegetables are also

Final EIA Report – Orange Smart City, Pen, Raigad July 2018
388 ORANGE SMART CITY INFRASTRUCTURE PVT. LTD.
income by selling milk. There are also
people who are engaged as daily wage
labourers in agriculture and
construction activity in nearby urban
areas.
Women in general support the family by
engaging in agriculture and dairy
activity & household chores.
grown are sold in nearby urban
areas.
Almost each family has cows or
buffaloes to supplement their
income.
About half the male population of
village is engaged in construction
activity in nearby urban areas.
The education level is generally low
among the villagers
Women in general support the
family with household chores. In
addition, women are also involved
in agriculture and dairy activity of
family.
cultivated. Some families are fully into
vegetable cultivation which is a main source
of income.
In addition to agriculture, the other two main
occupation for earning for the locals is dairy
and wage labour. Almost each family has
cows or buffaloes to supplement their income.
Most of the male population of villages is
engaged in construction and factories in Pen
as wage labor.
The education level is generally low among
the villagers.
Women in general support the family with
household chores. In addition, women are also
involved in agriculture and dairy activity of
family.
Key
observations
and issues:
People are aware about the project and
have a very positive opinion on the
project.
People expect the project would bring
development in their villages and would
open up opportunity of employment and
other business avenues
People were keen to know when the
project would start and what kind of
factories will come up.
People are aware about the project
and have a very positive opinion on
the project.
People expect the project would
bring development in their villages
and would open up opportunity of
employment and other business
avenues
People are aware about the project and have a
very positive opinion on the project.
People expect the project would bring
development in their villages and would open
up opportunity of employment and other
business avenues
People were keen to know when the project
would start and what kind of factories will
come up

Final EIA Report – Orange Smart City, Pen, Raigad July 2018
389 ORANGE SMART CITY INFRASTRUCTURE PVT. LTD.
People also expect the project to give
preference to local in employment
Unemployment and lack of opportunity
is evident in the village.
People were keen to know when the
project would start and what kind of
factories will come up
People also expect the project to
give preference to local in
employment
In project during the construction
phase the locals can be good source
of construction labour as they are
already in to that activities currently.
People also expect the project to give
preference to local in employment
In project construction phase the locals can be
good source of construction labour as they are
already in to that activities currently.
There is large scale unemployment reported
during the survey

Final EIA Report – Orange Smart City, Pen, Raigad July 2018
390 ORANGE SMART CITY INFRASTRUCTURE PVT. LTD.
10.4 Anticipated Environmental Impacts and Mitigation Measures
The impacts of the project activities were studied on the various environmental attributes by
the matrix methods considering the severity, extent and duration of the activities . The summary
of the impacts during the construction and the operation phase is given below:
Summary of impacts during the construction phase
Sr.No Aspect Impact Significance
1 Air Moderate
2 Water Usage Moderate
3 Water quality Low
3 Land use Positive
4 Landscape and Topography Low
5 Soil Low
6 Noise Low
7 Socio –Economics Low
8 Ecology Low
9 Cultural Heritage Low
The summary of the impacts during the operation phase are summarized below :
Sr.No Aspect Impact Significance
1 Air Moderate
2 Water Resources &Usage Moderate
3 Water quality Moderate
4 Soil Low
6 Noise Moderate
7 Ecology Low
8 Socio –Economics Low
The detailed impacts and mitigation measures along with responsibility for the
implementation and supervision of the mitigation measuresduring the construction and
operation phases is given below:

Final EIA Report – Orange Smart City, Pen, Raigad July 2018
391 ORANGE SMART CITY INFRASTRUCTURE PVT. LTD.
Detailed responsibility matrix of mitigation measures for the implementation and supervision of the same during the construction phase is given
below :
Sr. No Component Significance of Impact
Impacts Identified
Suggested Mitigation Measures Responsibility
1. Ambient Air Quality
• Emissions from construction
equipment, vehicles
• Proper maintenance of machines and vehicles.
• Contractors to maintain proper records for fleet engaged.
• Limited vehicular movement to be permitted on disturbed
soil.
• Vehicle speed to be restricted to 15 km/h on unpaved roads.
• Trucks /dumpers engaged to be covered during off site
transportation.
• A minimum freeboard of six inches to be maintained by
haul trucks when material is transported on any paved road.
• Vehicles with valid Pollution under Control (PUC)
certificate to be engaged for project.
• Downwash of trucks to be undertaken prior to departure.
Implementation by Contractor and Supervision
by OSCIPL
• Improper handling and storage
of construction material
• Minimum possible drop height to be maintained while
unloading /screening of material.
• Stockpiling of excess fill material.
• Covers and enclosures to be provided for loose
construction material at construction site
Implementation by
Contractor and Supervision by OSCIPL
• Dust emissions
• Suppression of dust emissions by spraying water, wetting
of the stockpile,
• Paved roads to be cleaned regularly and un-paved roads
to be stabilized and watered regularly.
• Inactive disturbed surfaces to be sprinkled with water on
daily basis
Implementation by
Contractor and Supervision
by OSCIPL

Final EIA Report – Orange Smart City, Pen, Raigad July 2018
392 ORANGE SMART CITY INFRASTRUCTURE PVT. LTD.
Sr. No Component Significance of Impact
Impacts Identified
Suggested Mitigation Measures Responsibility
• Emissions from onsite operation
of diesel generators
• Power supply for construction will be sourced from local
distribution company.
• Generators to be used only as backup source.
• Diesel generators to be optimally operated and regularly maintained.
• Appropriate stack height as per the CPCB guidelines to
be provided for DG sets.
Implementation by Contractor and Supervision
by OSCIPL
• Burning of waste at labour
facilities
• LPG cylinders to be provided in labour canteens and use
of fuel wood to be discouraged.
• Open burning of waste shall not be permitted.
• Community kitchen to be promoted among subcontractors
Implementation by Contractor and Supervision
by OSCIPL
2. Water
Resources and Quality
• Burden on the water resources • Water for construction phase to be sourced from existing
sources allocated to PP supplemented with authorized
tanker supply.
• Optimal water consumption measures at labour facility sites along with adequate awareness programmers to be
organized for the workers.
Implementation by
Contractor and Supervision by OSCIPL
• Disposal of sewage from
construction camps
• Adequate number of toilets (at least 8-10 toilets per 100
labours) to be provided onsite.
• Random disposal of wastewater from labour facility to be
restricted
• Sludge from waste water treatment systems to be disposed off properly.
• Regular removal of debris from construction site to be
practiced.
Implementation by
Contractor and Supervision by OSCIPL

Final EIA Report – Orange Smart City, Pen, Raigad July 2018
393 ORANGE SMART CITY INFRASTRUCTURE PVT. LTD.
Sr. No Component Significance of Impact
Impacts Identified
Suggested Mitigation Measures Responsibility
• Contamination of surface and
groundwater resources from sewage and oil & grease
• Packaged STP to be deployed at the construction camp
site
• Oil and grease containing effluents to be pre-treated before discharge.
• Sludge from the packaged STP to be used as manure for
the green belt development / horticultural purposes
Implementation by Contractor and Supervision
by OSCIPL
Landscape
and
Topography
• Change in topography and landscape
• The 90% soil requirement will be fulfilled from cutting within the site and only 10% will be sourced from
approved quarries.
• Excavated soil to be used in level raising;
• Land surface contours to be restored in relation to the
surroundings.
• Construction footprint will be well defined and construction work to be carried out within the Project
footprints only.
• The construction contractors shall be instructed not to cut
any tree without prior approval from OSCIPL. Whereas
OSCIPL will facilitate to obtain permissions for tree cutting from relevant authority.
• Green area and green buffers will be developed to
improve the landscape.
Implementation by
Contractor and Supervision
by OSCIPL
•Localized flooding and related health issues due to decreased
infiltration
• Diversion dykes to channel runoff to be constructed around
the excavated site.
• Road corridor to be provided with adequate cross drainage.
Implementation by Contractor and Supervision
by OSCIPL
Soil Soil Erosion • Top soil to be preserved and reused for landscaping purpose
• Clearance of vegetative cover to be minimized to the extent
possible and redeveloped later on.
Implementation by
Contractor and Supervision
by OSCIPL

Final EIA Report – Orange Smart City, Pen, Raigad July 2018
394 ORANGE SMART CITY INFRASTRUCTURE PVT. LTD.
Sr. No Component Significance of Impact
Impacts Identified
Suggested Mitigation Measures Responsibility
• Site grading and excavation to be undertaken during dry
season.
• Dikes, berms, drainage swales or ditches to be provided to divert surface run-off to specific channels.
• A retention wall or bund to be provided around the storage
areas for excavated soil and other construction material.
• Completed earthworks to be sealed and/or re-vegetated at
the earliest with the help of landscape expert.
• Stacking of excavated soil material will be made only in
earmarked areas.
• Excavated soil to be used/ transported at the earliest for filling low lying areas.
• Proper routing and adequate capacity of the storm water
run-offs drains to be provided.
• Movement and parking of heavy machinery and vehicles
to be restricted to identified area.
• Area used for parking purposes to be restored immediately after completion of each project activity.
Soil contamination • All storage facilities to be designed with paved surface, provided with covered shed and adequate containment
facility at the construction.
• All waste to be handled as per applicable regulations.
• Hazardous waste to be handled and disposed of in
accordance with the requirements of Hazardous waste
management rules 2016
• Contractor to develop spill contingency plan.
• Provision of covered bins at labour facilities.
Implementation by
Contractor and Supervision
by OSCIPL

Final EIA Report – Orange Smart City, Pen, Raigad July 2018
395 ORANGE SMART CITY INFRASTRUCTURE PVT. LTD.
Sr. No Component Significance of Impact
Impacts Identified
Suggested Mitigation Measures Responsibility
• Waste to be segregated in biodegradable and non-
biodegradable fraction.
• Biodegradable waste will be treated with composting.
• Contaminated sand/ soil shall be prevented during construction activities.
• Trainings to be imparted to all workers and subcontractors
regarding hazardous waste storage and disposal procedures
Traffic and
transport • Increased traffic volume
• Wherever required temporary widening of roads to be
undertaken.
• Traffic and heavy machinery movement schedule to be
communicated clearly to the local inhabitants.
• Prior consultation with local Police Providing dedicated path within the site for entry and exit of the construction
vehicles
Implementation by
Contractor and Supervision by OSCIPL
• Damage to existing village roads
• Roads damaged due to project vehicles will be continuously repaired
Implementation by
Contractor and Supervision
by OSCIPL
• Disruption of traffic and
increased cases of road related
hazards
• Provision of adequate training to drivers.
• Dedicated parking area to be provided for project vehicles.
• Parking along footpaths, single lane roads shall be
prohibited.
• Detailed plan for signage around the construction areas to
be prepared to facilitate traffic movement.
• Inventory of the vehicles used in project and construction equipment along with their PUC’s to be maintained.
Implementation by
Contractor and Supervision by OSCIPL
Noise • Noise due to Construction
activities (such as excavation,
grading, erecting equipment,
piling, etc)
• Adequate planning to avoid high noise activities to be
undertaken.
• Acoustic enclosures, noise barriers to be provided in areas
of high noise generating sources.
Implementation by
Contractor and Supervision
by OSCIPL

Final EIA Report – Orange Smart City, Pen, Raigad July 2018
396 ORANGE SMART CITY INFRASTRUCTURE PVT. LTD.
Sr. No Component Significance of Impact
Impacts Identified
Suggested Mitigation Measures Responsibility
• Rubber padding to be provided for vibration control
• Noise due to operation of heavy
equipment and machinery
• Construction workers to use ear muffs in areas with
potential for high noise generation.
• Regular maintenance of vehicles and repair of equipment.
• Noise barriers will be provided between the activities and the receptors.
• Restriction on use of equipment generating high noise
during night time.
Implementation by
Contractor and Supervision by OSCIPL
• Movement of vehicles
• Movement of vehicles during night time to be limited.
Implementation by Contractor and Supervision
by OSCIPL
• Noise due to construction
equipment such as Concrete
Mixers and Batching Plant
• Working hours and construction activities to be aligned
and works to be prohibited during night hours.
• Acoustical enclosures are strongly recommended with 30
dB Transmission Loss Rating for the Engine, to bring down the SPL below 80 dB.
• The contractor should carefully choose the batching plant
in order to meet with the CPCB Norms.
• Hydraulic pumps and compressors should be covered with
Acoustical Enclosures with 20 dB Transmission Loss Rating in order to reduce the noise.
• Valves should be covered with Removable Acoustical
Blankets.
• The contractor should choose controlled operating hours
for noisy activities such as delivery, loading unloading etc.
Implementation by
Contractor and Supervision by OSCIPL
Socio- Economic
• Loss of existing village assets
• The persons who have sold the land for the project to be
considered for benefits like employment, contracts etc.
• Skilled and qualified local persons to be given preference in employment and other contractual benefits.
Implementation and Supervision by OSCIPL
• Loss of landholdings

Final EIA Report – Orange Smart City, Pen, Raigad July 2018
397 ORANGE SMART CITY INFRASTRUCTURE PVT. LTD.
Sr. No Component Significance of Impact
Impacts Identified
Suggested Mitigation Measures Responsibility
• Impact on livelihood of the
villages
•
• .
Labour Camp
Management
• Domestic solid waste generation
• Regular removal of debris from construction site to be practiced.
• Integrated solid waste management plan will be
developed for collection, transportation, treatment
and disposal of waste.
Implementation by Contractor and Supervision
by OSCIPL
• Firewood for cooking and burning of garbage and
subsequent deterioration in air
quality
• Arrangement of cooking gas supply to be done by contractor
• Awareness to be created among workers to avoid use
of firewood or kerosene.
Implementation by
Contractor and Supervision
by OSCIPL
• Waste water generation
• Adequate number of toilets (at least 8-10 toilets per
100 labors) with septic tanks and soak pits arrangements to be provided onsite
• Random disposal of wastewater from labour colonies
to be restricted.
• Packaged STP to be provided for workers
Implementation by Contractor and Supervision
by OSCIPL
Health and hygiene • Workers to be provided with health and safety
training.
• First aid and essential medical services to be
provided at site.
• Health Check-up: (Quarterly)
• Personal protective equipment
• Creches for children:
• Medicines and preliminary check-up
equipment/ materials:
Implementation by Contractor and Supervision
by OSCIPL

Final EIA Report – Orange Smart City, Pen, Raigad July 2018
398 ORANGE SMART CITY INFRASTRUCTURE PVT. LTD.
Sr. No Component Significance of Impact
Impacts Identified
Suggested Mitigation Measures Responsibility
• Site sanitation
• Emergency/Exigencies(Ambulance hire
basis+doctors+Hospitilization)
• Educational and Safety Awareness
ProgramAudio-visual) Occupational
Health and
Safety
• Injury due to improper handling,
operation and execution
• Good housekeeping practices to be exercised.
• Measures such as job rotations and stretch breaks to be
adopted.
• Proper signage to be provided around construction site.
• Use of Personal Protection Equipment (PPEs) to be
mandated at work site.
Implementation by
Contractor and Supervision by OSCIPL
• Trip and fall, inadequate fall safe
arrangements
• Use of temporary fall protection measures in scaffolds and
out edges of elevated work surfaces, such as hand rails and toe boards to prevent materials from being dislodged shall
be done.
• Safety harness to be ensured for workers while working at
heights
Implementation by Contractor and Supervision
by OSCIPL
• Exposure to hazardous substances
• Workers to be provided with health and safety training.
• First aid and essential medical services to be provided at site
Implementation by
Contractor and Supervision
by OSCIPL
Employment
and Local
Economy
• Increased employment
opportunities
• Contracting opportunities
for locals
• Better avenues for Small
scale service providers
• Project to utilize the facilities available from the local
market to support the local economy to the extent possible.
• Wherever possible, labour from local community will be
employed for project.
Implementation by
Contractor and Supervision
by OSCIPL
Ecology • Loss of trees and ground vegetation
• Original soil profile shall be retained by storing each excavated layers separately and restoring it later.
Implementation by
Contractor and Supervision
by OSCIPL

Final EIA Report – Orange Smart City, Pen, Raigad July 2018
399 ORANGE SMART CITY INFRASTRUCTURE PVT. LTD.
Sr. No Component Significance of Impact
Impacts Identified
Suggested Mitigation Measures Responsibility
• Tree felling to be minimized to the extent possible.
Contractors shall be instructed to practice the same.
• Adverse impact on wildlife due
to noise, vehicle movement
• Standard noise levels to be maintained during construction
activities
Implementation by Contractor and Supervision
by OSCIPL
• Increased turbidity and siltation • No silt/waste to be allowed in the nearby waterbodies Implementation by Contractor and Supervision
by OSCIPL
Detailed responsibility matrix of mitigation measures for the implementation and supervision of the same during the operation phase is given
below :
Sr.No. Component Impacts Identified Suggested Mitigation Measures Responsibility
1. Air Emission from industrial processes
• Comprehensive planning has been undertaken which ensures that the proposed Industrial areas and existing residential are
placed in such a way to avoid the impact of air pollution on
people.
• Adequate buffer to be provided for Residential areas and industries.
• Individual industries will be required to obtain adequate
approvals such as Consent to Establish / Consent to Operate or
Environment Clearance from MPCB / SEIAA / MoEF.
• All emission sources to be provided with adequate stack height as per CPCB / MoEF norms.
• Low emission fuels to be used by industries.
• Air pollution control equipment to be deployed by industries.
• Good housekeeping to be practiced.
Implementation by
individual industry and
as per Env clearance obtauined by them as
applicable

Final EIA Report – Orange Smart City, Pen, Raigad July 2018
400 ORANGE SMART CITY INFRASTRUCTURE PVT. LTD.
Sr.No. Component Impacts Identified Suggested Mitigation Measures Responsibility
• PP to organize seminars and Capacity Building training programmes about the best practices in different industrial
sectors.
• PP in association with the MPCB to regularly monitor the
environmental performance of the industries.
• CETP – to be provided with adequate ventilation system to
prevent emissions such as HAPs, Odour etc. The adequate management practices to be adopted to control and mitigate
the air emissions during CETP operations;
• Waste Management Facility: Odour control measures to be
adopted. The adequate management practices to be adopted to control and mitigate the air emissions during facility
operations;
• All maintenance activities should ensure that the dust control
measures are applied.
2 Noise • Increase in noise levels in
residential areas and adjoining villages
• All habitations to have a suitable buffer area delineated around
them.
• Vegetative barriers in form of green belt to be provided around all industrial areas.
• All industrial operations to have acoustic enclosure and
employ noise attenuation measures.
• All roads to be provided with vegetative barriers and barrier
walls.
Implementation by individual industry and
Supervision by EMC;
• Movement of vehicles
• All roads to be provided with vegetative barriers and barrier walls as applicable.
OSCIPL
• D.G sets
• Diesel Generator Sets are supposed to have Sound Pressure
Levels of lesser than 75 dBA when measured at 1 meter
distance. However, when multiple DG sets are supposed to be kept close to one another, a single Acoustical Enclosure
Implementation by
individual industry &
Supervision by EMC;

Final EIA Report – Orange Smart City, Pen, Raigad July 2018
401 ORANGE SMART CITY INFRASTRUCTURE PVT. LTD.
Sr.No. Component Impacts Identified Suggested Mitigation Measures Responsibility
combined for all the DG Sets is recommended with a minimum
Transmission Loss Rating of 30 dBA
• Sewage Treatment Plant/CETP
• multiple of blowers and pumps, out of which blowers can
generate noise levels exceeding 100 dB. Acoustical
Enclosures for Blowers are strongly recommended, with 30 dB Transmission Loss Rating.
OSCIPL
• Exposure to high noise prone
areas
• All people working in the vicinity of the
Equipment/Machinery with Sound Pressure Levels higher
than 90 dB should wear protective ear plugs to avoid
permanent hearing damage.
Implementation by
individual industry &
Supervision by EMC;
• Increase in noise levels due to the
various operations at the Waste
Management Facility
• Use of heavy duty muffler systems on heavy equipment
• Limiting certain activities
• By using damping, absorption, dissipation, and deflection methods
• By using common techniques such as constructing sound
enclosures, applying mufflers, mounting noise sources on
isolators, and/or using materials with damping properties
• Preference to be given to low noise generating equipment while procurement
• Use of ear protective devices.
• In case of steady noise levels above 85-dB (A), initiation of
hearingconservation measures, etc.
OSCIPL
3 Water • Increase load on fresh water
sources
• Individual projects will have separate water meters and two
inlet sources, one for fresh water and second for use of
treated wastewater;
• SCADA system to be implemented for monitoring leakages in the water conveyance system;
• Minimise flow variation from the mean flow;
Implementation by
individual industry and
Supervision by EMC;
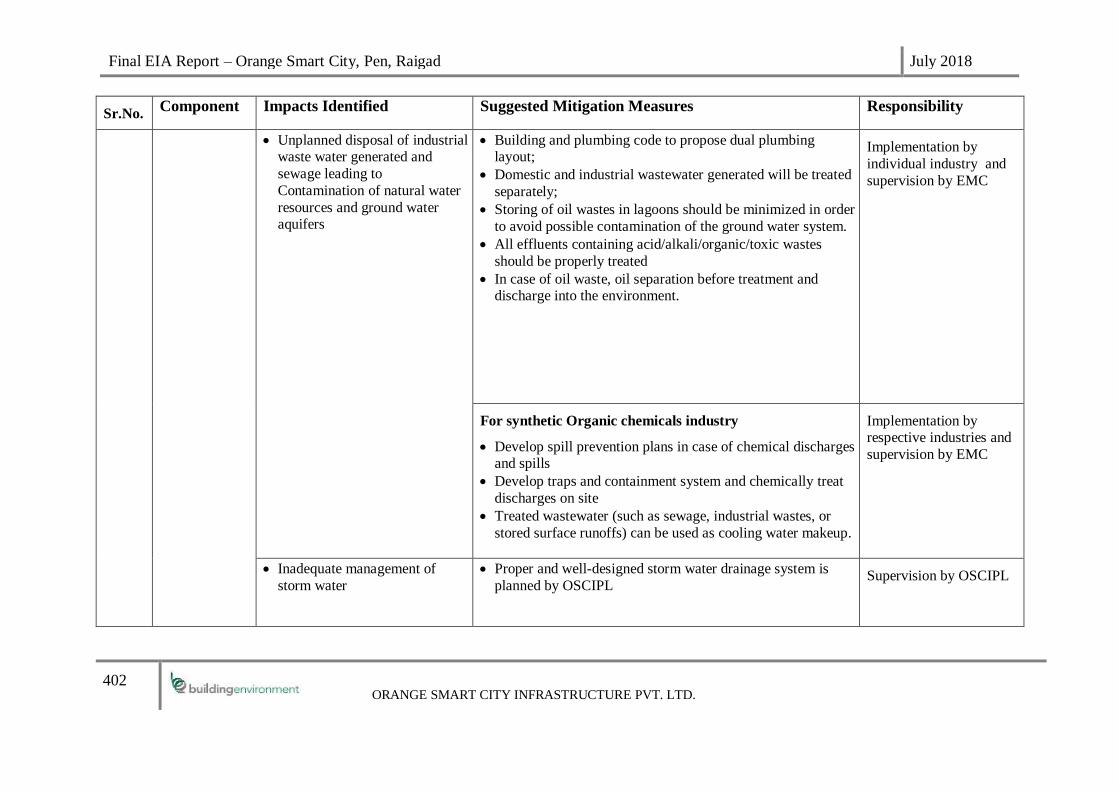
Final EIA Report – Orange Smart City, Pen, Raigad July 2018
402 ORANGE SMART CITY INFRASTRUCTURE PVT. LTD.
Sr.No. Component Impacts Identified Suggested Mitigation Measures Responsibility
• Unplanned disposal of industrial waste water generated and
sewage leading to
Contamination of natural water
resources and ground water aquifers
• Building and plumbing code to propose dual plumbing layout;
• Domestic and industrial wastewater generated will be treated
separately;
• Storing of oil wastes in lagoons should be minimized in order
to avoid possible contamination of the ground water system.
• All effluents containing acid/alkali/organic/toxic wastes
should be properly treated
• In case of oil waste, oil separation before treatment and discharge into the environment.
Implementation by
individual industry and
supervision by EMC
For synthetic Organic chemicals industry
• Develop spill prevention plans in case of chemical discharges and spills
• Develop traps and containment system and chemically treat
discharges on site
• Treated wastewater (such as sewage, industrial wastes, or
stored surface runoffs) can be used as cooling water makeup.
Implementation by respective industries and
supervision by EMC
• Inadequate management of
storm water
• Proper and well-designed storm water drainage system is
planned by OSCIPL Supervision by OSCIPL

Final EIA Report – Orange Smart City, Pen, Raigad July 2018
403 ORANGE SMART CITY INFRASTRUCTURE PVT. LTD.
Sr.No. Component Impacts Identified Suggested Mitigation Measures Responsibility
• Spills, leaks from industries, storage areas
• Spill contingency plan to be delineated Implementation by
individual industry and
supervision by EMC
Contamination of the surface water
and ground water by discharge of
effluent from CETP
• Regular inspection of wastewater conveyance pipelines to be
undertaken
• Operation and maintenance of the all components of the
CETP to be undertaken scrupulously at regular intervals
• Backup plan for temporary storage for untreated effluent with adequate capacity in case of failure of CETP
Implementation by
operator and Supervision
by EMC
Contamination of the ground water
by Solid Waste Management
facility (Landfill)
• Collection and treatment of leachate, sewage and storm water
run-off
• Increased recycling of treated leachate
• Monitoring of ground waters
• Run-off control measures
Implementation by
operator and Supervision
by EMC
4 Solid Waste
• Inadequate collection and
treatment of domestic waste and
hazardous waste,e-waste leading to contamination of soil and
ground water resources,
unhygienic conditions and odour problem
• Industries generating hazardous waste to comply with the
requirements of Hazardous Wastes (Management and
Handling) Rules, 1998 and Hazardous and Other Wastes (Management and Transboundary Movement) Rules, 2016
• OSCIPL to comply with SWM Rules 2016
• OSCIPL to undertake benchmarking as per Ministry of Urban
Development for SWM
• Integrated solid waste management plan will be developed
for collection, transportation, treatment and disposal of waste.
• Facilities will be designed to cater to the requirements of horizon year
• Industries to contact hazardous waste management facility
near Taloja for disposal of their hazardous waste
• E waste to be sold to authorized recyclers.
Implementation by
individual industry and
supervision by EMC

Final EIA Report – Orange Smart City, Pen, Raigad July 2018
404 ORANGE SMART CITY INFRASTRUCTURE PVT. LTD.
Sr.No. Component Impacts Identified Suggested Mitigation Measures Responsibility
• Recyclable waste to be collected separately and sold to authorized recyclers/ vendors.
• Improper disposal of domestic sludge, CETP sludge and
industrial waste
• Sludge will be generated from the sewage treatment plants which will be de-watered using filter press, dried and used
for gardening purpose.
• CETP sludge to be disposed off at the nearest CHWTSDF;
• OSCIPL to secure necessary permission for disposing off
CETP sludge at the nearest CHWTSDF;
Implementation by
operator and Supervision
by EMC
5 Traffic
Volume
• Increase in traffic flow and volume
• The roads in general to be designed to carry the maximum traffic loads with anticipated future development and on a par
with IRC (Indian Road Congress) Standards;
• A well planned public transport infrastructure has been
envisaged for the project;
• The proposed road circulation shall provide for safe and efficient movement of people;
• Maintenance of systematic spatial and technical database for
the roads which would enable regular monitoring and
feedback on road conditions thereby managing effective
periodic maintenance;
OSCIPL
• Traffic congestion • Non-motorized vehicles to be encouraged
• Comprehensive traffic and travel surveys shall be conducted every 5 years to monitor traffic characteristics and travel
pattern to develop strategies for effective transportation;
• The proposed road circulation shall provide for safe and
efficient movement of people;
• Pedestrian Guard Rails, Road safety Signage and overhead signs shall be placed wherever necessary;
• Road widths and lane configurations to be designed based on
the modelling exercise;
OSCIPL

Final EIA Report – Orange Smart City, Pen, Raigad July 2018
405 ORANGE SMART CITY INFRASTRUCTURE PVT. LTD.
Sr.No. Component Impacts Identified Suggested Mitigation Measures Responsibility
• Irregular Parking • Each individual project shall develop parking facilities as per the Development Control Regulations.
• Each residential project to provide parking facilities as per
applicable norms and regulations.
• Sufficient Loading/unloading space to be provided
Implementation by
individual industries ans
supervision by EMC
6 Land use
Pattern
• Impacts on existing human
settlements
• During the master planning stage, detailed analysis has been
undertaken to delineate site for OSC and various site
alternatives were examined and ranked to select the option based on socio-economic and environmental factors.
• Adequate buffer has been provided around environmentally
sensitive features
• Industrial land use has not been proposed in proximity of the
sensitive receptors.
• The residential and commercial users to undertake the development in consonance with the master plan of OSC and
also comply with the local regulation as applicable.
OSCIPL
7 Ecology • Impact on flora and fauna of the
adjoining green areas
• As per master plan, no forest land is falling in the delineated
area;
• Only native and local species will be chosen for green area.
• Each industry shall follow the CPCB guidelines;
• Only permissible activities shall be planned in the green
buffer.
• The fronts of river passing adjacent to the sites is planned as green area.
Implementation by
operator of common infrastructure and
individual industries
• Illegal cutting of trees • The project proponent will not allow illegal cutting of trees in
the project area by contractors /labourers working on the
project site.
Implementation by
operator of common infrastructure and
individual industries

Final EIA Report – Orange Smart City, Pen, Raigad July 2018
406 ORANGE SMART CITY INFRASTRUCTURE PVT. LTD.
Sr.No. Component Impacts Identified Suggested Mitigation Measures Responsibility
8 Social • Increased employment and
business opportunities ,
Improvement in infrastructure
Increased income levels,
Stabilization of the rural economies , Potential for
cultural conflict , Unplanned
secondary development in the
adjoining areas
• OSCIPL and individual project to undertake CSR program to ensure harmony and cooperation.
• .
• OSC is willing to spend CSR money in providing skill
development, clean and safe drinking water, sanitation
facility, primary health care support in the nearby villages.
Further details are presented in Section 8.2 titled ‘Socio –Economic Welfare Measures’ of the Chapter -8
OSCIPL

Final EIA Report – Orange Smart City, Pen, Raigad July 2018
407 ORANGE SMART CITY INFRASTRUCTURE PVT. LTD.
10.5 Environmental Management Plan
The cost of the mitigation measures to be implemented during the construction phase and the
operation phase, along with the structure of the Environmental Management Cell along with
the its duties and responsibilities is given in this section:
Cost of mitigation measures – Construction Phase
Sr.
No. Parameter Timeline for
implementation
Recurring cost per
year (Rs. Lacs)
1. PPE Progressive 25
2. Site Sanitation Facility +Housekeeping Progressive 5.5
3. Drinking water facility Progressive 3.0
4. Solid Waste Management Progressive 4.5
5. Safety railing, platform, ladder, hoist,
Cranes+ education and safety awareness
program etc.
Progressive 6.0
7. Health Check+ Ambulance facility
+Crèche facility Progressive 4.0
8. Environmental Monitoring(Monitoring
charges for air, water, waste water,
drinking water ,soil, DG stack, noise.)
2019 15.0
9 Pollution Control – STP & Noise
Control Measures
(Sound Reflective barriers)
Site barricading
2019 6.0
5.0
10 Dust control measures by engagement of
sprinklers 2019 10.0
11 Storm water drains with silt traps and
collection sump: 2019 28
12 EMC 2019 6
Total Cost 118
Cost of mitigation measures- Operation Phase
S.No. Description Timeline for
implementation
Capital
Cost
(Lakhs)
O&M Cost
(lakhs) per
annum

Final EIA Report – Orange Smart City, Pen, Raigad July 2018
408 ORANGE SMART CITY INFRASTRUCTURE PVT. LTD.
1 Rain Water Harvesting 2019-2029 50 5
2 Fire Fighting measures, Disaster
Management Kit , Well-equipped
Control Room , CCTV , Disaster
Management training to labours
and Security Staff, Mock Exercise ,
2 way Public announcement system
2019 -2029 1500 150
3 Water supply system including
WTP 2019 -2029 45000 2250
4 Sewerage System and Recycling
System 2019 -2029 35600 2101
5 Landscaping 2019 -2029 2000 400
6 Solid Waste Management 2019 -2029 4000 200
7 Information and Communication
Technology (ICT) 2019 -2029 3300 330
8 Energy saving 2024 -2029 1300 195
9 Traffic Management Plan
Implementation
2019 -2029 500 50
10 Pollution Control – STP & Noise
Control Measures
Sound Reflective barriers,
Acoustical Enclosures for STP
Blowers
2019 -2029 24.2 38
11 EM Cell -- Covered in
construction
phase
2
12 Ambient air quality sensors and
display 2019 -2029 100 10
13 CETP 2019-2029 520 6
14 Landfill cost 2019-2029 200 13.5
Total 94094.2
5750
The expenditure shown in the above table has been included in the project cost

Final EIA Report – Orange Smart City, Pen, Raigad July 2018
409 ORANGE SMART CITY INFRASTRUCTURE PVT. LTD.
10.6 Environmental Management Cell
An Environmental Management Cell is proposed which will oversee the implementation of
environmental safeguards as proposed below:
Structure of Environmental Management Cell
Responsibilities of the EMC personnel
Sr.No Personnel Responsibility
1. STP Operator • The supervisor shall visit and check the devices daily. He
will see that the STP is working properly and flow
measurements are recorded properly in a register.
• The effluent from the STP shall be got checked by him in
the Laboratory once a week. Any parameter going out of
the prescribed limits will be reported to the Environmental
Manager for taking corrective action. He will pursue the
matter at personal level to bring the parameters within
permissible limits.
• The Environmental Manager will keep in touch with the
Environmental Consultant and seek their guidance for
corrective action as and when required.
• The Committee shall meet once every month to ensure
implementation of the programme.
• The Environmental Manager will bring to the notice of the
Managing Director any further action to be taken to ensure
Environmental
Manager - OSCIPL
SWM
personnel
STP
Operator
CETP
Manager
Lab
chemist
RWH
personnel
Safety
Officer-
OSCIPL
Landfill facility
manager
Road and
traffic
manager
Safety Officers-
Individual Industries
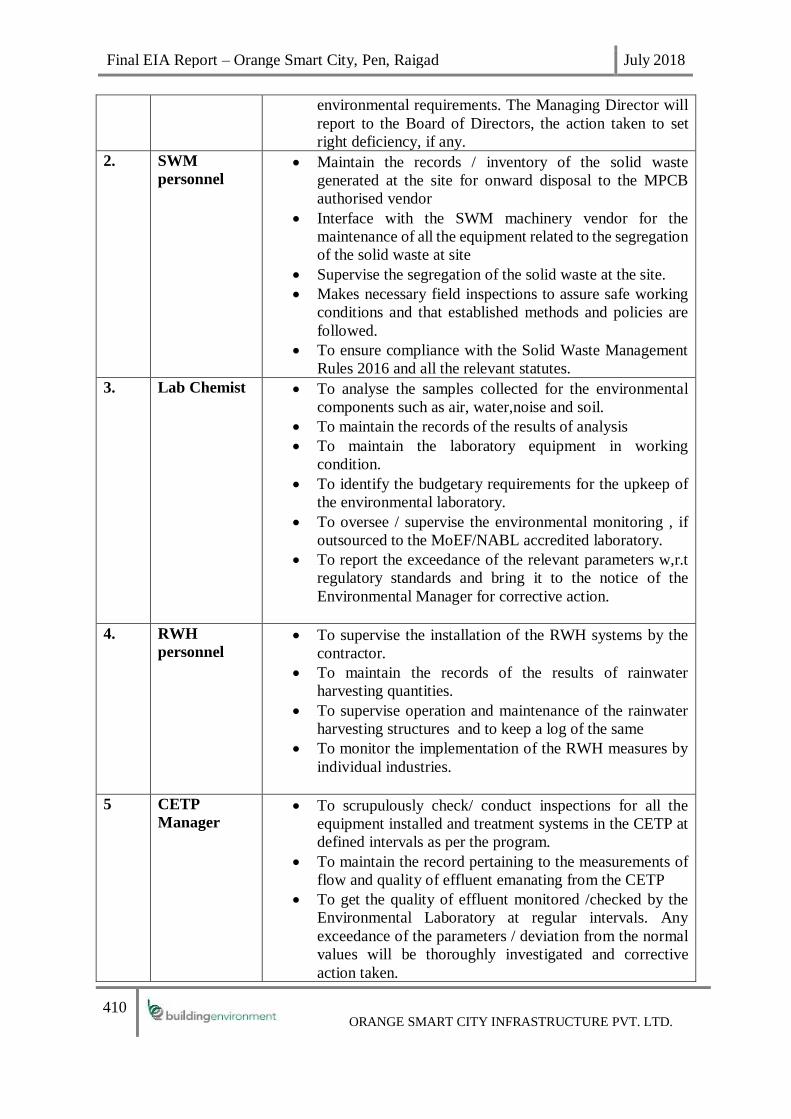
Final EIA Report – Orange Smart City, Pen, Raigad July 2018
410 ORANGE SMART CITY INFRASTRUCTURE PVT. LTD.
environmental requirements. The Managing Director will
report to the Board of Directors, the action taken to set
right deficiency, if any.
2. SWM
personnel • Maintain the records / inventory of the solid waste
generated at the site for onward disposal to the MPCB
authorised vendor
• Interface with the SWM machinery vendor for the
maintenance of all the equipment related to the segregation
of the solid waste at site
• Supervise the segregation of the solid waste at the site.
• Makes necessary field inspections to assure safe working
conditions and that established methods and policies are
followed.
• To ensure compliance with the Solid Waste Management
Rules 2016 and all the relevant statutes.
3. Lab Chemist • To analyse the samples collected for the environmental
components such as air, water,noise and soil.
• To maintain the records of the results of analysis
• To maintain the laboratory equipment in working
condition.
• To identify the budgetary requirements for the upkeep of
the environmental laboratory.
• To oversee / supervise the environmental monitoring , if
outsourced to the MoEF/NABL accredited laboratory.
• To report the exceedance of the relevant parameters w,r.t
regulatory standards and bring it to the notice of the
Environmental Manager for corrective action.
4. RWH
personnel • To supervise the installation of the RWH systems by the
contractor.
• To maintain the records of the results of rainwater
harvesting quantities.
• To supervise operation and maintenance of the rainwater
harvesting structures and to keep a log of the same
• To monitor the implementation of the RWH measures by
individual industries.
5 CETP
Manager • To scrupulously check/ conduct inspections for all the
equipment installed and treatment systems in the CETP at
defined intervals as per the program.
• To maintain the record pertaining to the measurements of
flow and quality of effluent emanating from the CETP
• To get the quality of effluent monitored /checked by the
Environmental Laboratory at regular intervals. Any
exceedance of the parameters / deviation from the normal
values will be thoroughly investigated and corrective
action taken.

Final EIA Report – Orange Smart City, Pen, Raigad July 2018
411 ORANGE SMART CITY INFRASTRUCTURE PVT. LTD.
• To monitor the overall compliance by individual industries
against the respective effluent disposal standards/ EC
issued by MoEF& CC / CTE & CTO issued by SPCB.
• To report any requirement for the procurement of any
components/ upgradation of the CETP to the
Environmental Management Committee.
6 Landfill
Facility
Manager
• To ensure regulatory compliance with SWM Rules 2016
• To oversee the monitoring of the ground and surface water
quality/air quality/ around the landfill site as per the
environmental monitoring plan outlined
• To keep the records of the Solid Waste Transportation
(Daily quantity of inert waste transported to landfill, No.
of trips made to site per vehicle to landfill),Solid Waste
Handling and Disposal (Daily quantity of inert waste
received),Monitoring and Survey(Records of all
monitoring carried out as per the finalized monitoring
protocol)
• To oversee monitoring of the leachate characteristics by a
MoEF accredited laboratory.
• To monitor the overall compliance against the EC issued/
CTE & CTO issued
• To inspect all the equipment (weighbridge etc), vehicles at
periodic intervals and to ensure their proper functioning.
7 Road &
Traffic
Manager
• To oversee the functioning of the smart traffic
management system proposed for the OSC.
• To check/ inspect the condition of the pavements at regular
intervals, internal roads, bridges and to oversee the
personnel undertaking the repairs of the same.
• To maintain the records of the traffic volume and
characteristics of traffic and to evolve a smooth traffic
management plan on ground as per the specific
requirement.
5. Safety Officer • To periodically review and update the Disaster
Management Plan of the OSC.
• To keep a log / checklist of the potential accidents that may
occur.
• To conduct mock drills with the safety heads of the
individual industries
• To ensure the preparedness of OSC to counter any
emergency.
• To ensure that the individual industries have an EHS plan
in place along with necessary measures to counter
emergencies.

Final EIA Report – Orange Smart City, Pen, Raigad July 2018
412 ORANGE SMART CITY INFRASTRUCTURE PVT. LTD.
10.7 Conclusion
The baseline environmental studies conducted and the impact identification carried out reflect
that the activities in the Orange Smart City will have minimal impact on the various VEC’s
and the development of this project will outweigh the impacts by integrating the various
prevention, control and mitigation measures into project planning phase, construction phase
and the operation phase. In addition, it will bring economic prosperity to the region.

Final EIA Report – Orange Smart City, Pen, Raigad July 2018
413 ORANGE SMART CITY INFRASTRUCTURE PVT. LTD.
11. DISCLOSURE OF CONSULTANTS
BUILDING ENVIRONMENT INDIA PVT LTD
This report is released for the purpose of obtaining Environment clearance for project, under
the provision of EIA notification dated 14th September 2006, of Orange Smart City.
Information provided (unless attributed to referenced third parties) is otherwise copyrighted
and shall not be used for any other purpose without the written consent of Building
Environment India Pvt Ltd.
Report Environmental Impact Assessment and Environmental Management Plan
Project Details
Name of the
Report
Orange Smart City, Pen, Raigad.
EIA / EMP Report for Integrated Industrial Township of “Orange Smart City”
Client Orange Smart City Infrastructure Pvt. Ltd.
Prepared by Building Environment India Pvt Ltd.
Project
Number
Report No Version 01 Released
Date
July 2018
Contact Details
Building Environment India Pvt Ltd,
Dakshina Building, Office No-401,4th Floor,
Beside Raigad Bhavan | Sakal Bhavan Rd,
Sector 11 | CBD Belapur, Navi Mumbai, Maharashtra 400614
Tel. No.: 91-22-41237073
NABET Accreditation No. – SA- 191st AC Meeting May 12, 2017
EC
Application
Reference
Document
TOR Issued:
ToR issued vide 151st meeting of Expert Appraisal Committee for projects related to
Infrastructure Development, Coastal Regulation Zone, Building/Construction and
Miscellaneous projects held on 7th – 9th September, 2015
Issue Order
Date Building Environment India Pvt Ltd. OSCIPL
Originated by Checked and Approved by Checked by Approved by
Name Signature Name Signature Name Signature
Mr.
Kapil
Awtani
Hrushikesh
Kolatkar
Mr. Chintan
Chheda
Disclaimer
Building Environment India Pvt Ltd. has taken all reasonable precaution in the preparation of this report as per
its auditable quality plan. Building Environment India Pvt Ltd. also believes that the facts presented in the
report are accurate as on the date it was written. However, it is impossible to dismiss absolutely, the possibility
of errors or omissions. Building Environment India Pvt Ltd. therefore specifically disclaims any liability
resulting from the use or application of the information contained in this report. The information is not intended
to serve as legal advice related to the individual situation.

Final EIA Report – Orange Smart City, Pen, Raigad February 2018
414 ORANGE SMART CITY INFRASTRUCTURE PVT. LTD.
Project Team
Nature of Work Person
Responsible (s)
Name of the person(s) responsible
Issue of List of requirements,
draft of covering letter &
undertaking to Client
Project manager Mr. Kapil Awtani
Site Visit EIA Coordinator Mr. Hrushikesh Kolatkar
Associate EC Mr. Vivek Kulkarni
Project Manager
and FAEs
Mr. Hrushikesh Kolatkar
Dr. Ajay Ojha/ Mr. Sanjay Shevkar
Mr. Rishabh Sharma/ Mr. Kapil
Awtani
Mr. Chintan Athalye
Mr. Shrivallabh kothe
Ms. Shraddha Gathe
Dr. Sandhya Clemente
Mr. Vivek Kulkarni
Mr. S.L Bonde/ Mr. Nilesh Potdar
Ms. Rujwi Dawe/ Mr. Nilesh Potdar
Mr. Vivek Kulkarni
As per terms of reference given
in MoEF EIA manual, the
baseline data generation for
different environmental
parameters
All FAEs (In-house& Empanelled) each for the below
given respective functional area
AREA FAE AFAE / Team
Member
Land Use Mr. Hrushikesh
Kolatkar
Mr. Kedarnath
Rao Ghorpade
(Replaced by
Mr. Sanket
Awsare from
January 2018)
Air AP Dr. Ajay Ojha
(replaced by Mr.
Sanjay Shevkar
from May 2017)
Kapil Awtani
AQ Mr. Rishabh
Sharma (replaced
by Mr. Kapil
Awtani from May
2018)
Ashok
Bandgar
Noise Mr. Chintan
Athalye
Anuja Pawar
Water Dr. Ajay Ojha
(replaced by Mr.
Sanjay Shevkar
from May 2017)
Dilip Shenai
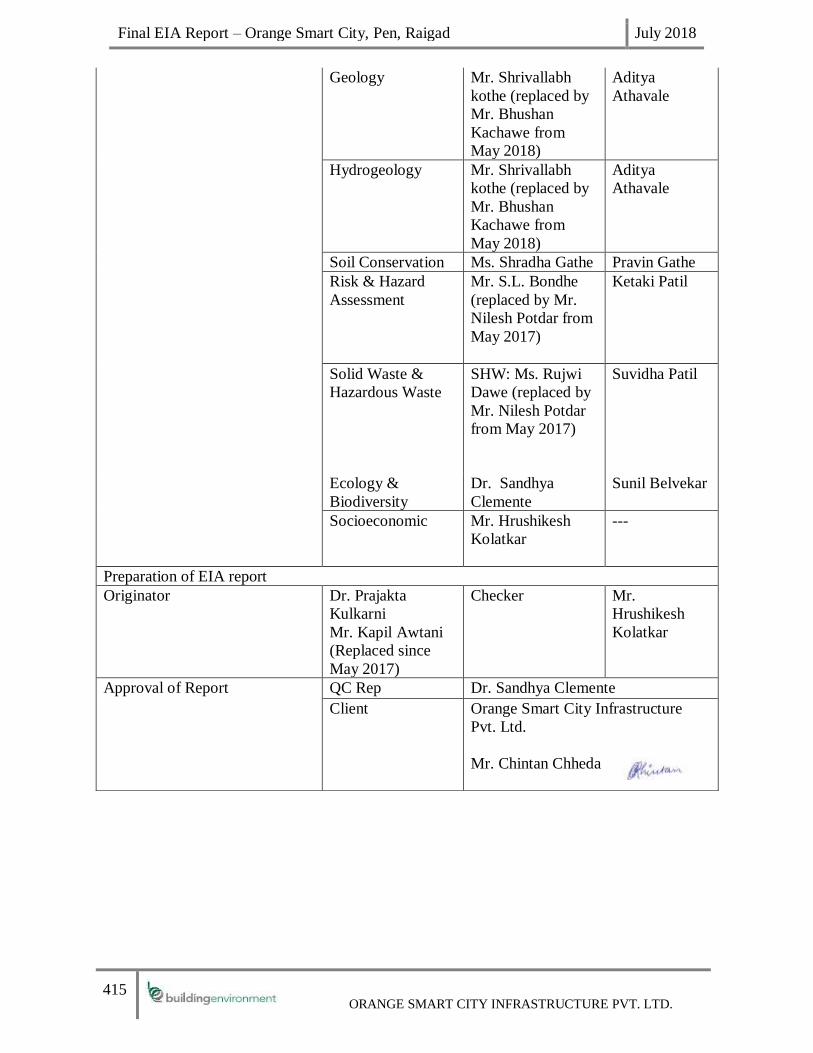
Final EIA Report – Orange Smart City, Pen, Raigad July 2018
415 ORANGE SMART CITY INFRASTRUCTURE PVT. LTD.
Geology Mr. Shrivallabh
kothe (replaced by
Mr. Bhushan
Kachawe from
May 2018)
Aditya
Athavale
Hydrogeology Mr. Shrivallabh
kothe (replaced by
Mr. Bhushan
Kachawe from
May 2018)
Aditya
Athavale
Soil Conservation Ms. Shradha Gathe Pravin Gathe
Risk & Hazard
Assessment
Mr. S.L. Bondhe
(replaced by Mr.
Nilesh Potdar from
May 2017)
Ketaki Patil
Solid Waste &
Hazardous Waste
SHW: Ms. Rujwi
Dawe (replaced by
Mr. Nilesh Potdar
from May 2017)
Suvidha Patil
Ecology &
Biodiversity
Dr. Sandhya
Clemente
Sunil Belvekar
Socioeconomic Mr. Hrushikesh
Kolatkar
---
Preparation of EIA report
Originator Dr. Prajakta
Kulkarni
Mr. Kapil Awtani
(Replaced since
May 2017)
Checker Mr.
Hrushikesh
Kolatkar
Approval of Report QC Rep Dr. Sandhya Clemente
Client Orange Smart City Infrastructure
Pvt. Ltd.
Mr. Chintan Chheda

Final EIA Report – Orange Smart City, Pen, Raigad July 2018
416 ORANGE SMART CITY INFRASTRUCTURE PVT. LTD.
Declaration by Experts contributing to the EIA/ EMP of Orange Smart City project at Pen, District
Raigad
I, hereby, certify that I was a part of the EIA team in the following capacity that developed the
above EIA.
EIA Coordinator:
Name Mr. Hrushikesh Kolatkar
Signature and Date
20.07.2018
Period of Involvement January 2015 till date
Contact Information Address
Building Environment India Pvt Ltd,
Dakshina Building, Office No-
401,4th Floor,
Beside Raigad Bhavan | Sakal
Bhavan Rd,
Sector 11 | CBD Belapur,
Navi Mumbai, Maharashtra 400614
Contact Number
Tel. No.:
91-22-41237073
Functional Area Expert:
Functional Area FAE Signature TEAM MEMBER Signature
Land Use Mr. Hrushikesh
Kolatkar
TM - Mr.
Kedarnath Rao
Ghorpade
(Replaced by Mr.
Sanket Awasare
Air AP Dr. Ajay Ojha
(replaced by Mr.
Sanjay Shevkar
from May 2017)
Ms. Kapil Awtani
AQ Mr. Rishabh
Sharma (replaced
by Mr. Kapil
Awtani from May
2018)
TM - Mr. Ashok
Bandgar
Noise
Mr. Chintan
Athalye
Anuja Pawar

Final EIA Report – Orange Smart City, Pen, Raigad July 2018
417 ORANGE SMART CITY INFRASTRUCTURE PVT. LTD.
Water Dr. Ajay Ojha
(replaced by Mr.
Sanjay Shevkar
from May 2017)
Dilip Shenai
Geology Mr. Shrivallabh
kothe (replaced by
Mr. Bhushan
Kachawe from
May 2018)
Mr. Aditya
Athavale
Hydrogeology Mr. Shrivallabh
kothe (replaced by
Mr. Bhushan
Kachawe from
May 2018)
Mr. Aditya
Athavale
Soil
Conservation
Ms. Shradha
Gathe
Mr. Pravin Gathe
Ecology &
Biodiversity
Dr. Sandhya
Clemente
Mr. Sunil Belvekar
Risk & Hazard
Assessment
Mr. S.L. Bondhe
(replaced by Mr.
Nilesh Potdar from
May 2017)
Ms. Ketaki Patil
Solid Waste &
Hazardous
Waste
SHW: Ms. Rujwi
Dawe (replaced by
Mr. Nilesh Potdar
from May 2017)
Ms. Suvidha Patil
Socioeconomic Mr. Hrushikesh
Kolatkar
-----
Declaration by the Head of the Accredited Consultant Organization:
I, Hrushikesh Kolatkar, hereby confirm that the above mentioned experts prepared the “EIA/ EMP
Report for Industrial Integrated Township titled ‘Orange Smart City’. I also confirm that I shall be
fully accountable for any misleading information mentioned in this statement.
Signature:
Name: Hrushikesh Kolatkar
Designation: Managing Director

Final EIA Report – Orange Smart City, Pen, Raigad July 2018
418 ORANGE SMART CITY INFRASTRUCTURE PVT. LTD.
Name of EIA Consultant Organization: Building Environment India Pvt Ltd.
NABET RA Certificate Number & Issue Date: Certificate No. NABET/RA/1518/SA 048 dated
12th May, 2017 valid till Nov 25, 2018
Functional Area Code Details:
Sr. No. Functional Area Code Complete Name of Functional Area
1 LU Land Use
2 AP Air Pollution Prevention, Monitoring & Control
3 AQ Meteorology, Air Quality Modeling & Prediction
4 WP Water Pollution Prevention, Control & Prediction of Impacts
5 EB Ecology & Biodiversity
6 NV Noise &Vibration
7 SE Socio- Economic Aspects
8 HG Hydrology, Ground Water & Water Conservation
9 GEO Geology
10 SC Soil Conservation
11 RH Risk & Hazards Management
12 SHW
(HW/SW/MSW)
Solid & Hazardous Waste Management
(including Municipal solid wastes)

Annexure-I

F.No.21-130 /20 IS-IA.III
Government of India
Ministry of Environment, Forest & Climate Change
(IA.IIISection)Indira Paryavaran Bhawan,
Jor Bagh Road,
New Delhi - 3.
Dated: 23rd November, 2015
ToThe Managing Director & Chief Executive Officer,
M/ s Karanja Infrastructure Pvt Ltd,
16thFloor, 165, 'C' Wing, Mittal Tower, Nariman Point,
Mumbai - 21 (Maharashtra)
Sub: 'Development of Integrated Industrial Township' in Villages Boregaon,
Shene, Virani, Belavade, Walak, Mugoshi, Govirle & Hamrapur of Tehsil
Pen, District Raigad (Maharashtra) by M/ s Karanja Infrastructure Pvt
Ltd - Terms of Reference - reg.
Sir,
This has reference to your application submitted the above mentioned
proposal to this Ministry for seeking Terms of Reference (ToR) in terms of the
provisions of the Environment Impact Assessment Notification (EIA), 2006 under
the Environment (Protection), Act, 1986.
2. The proposal for 'Development of Integrated Industrial Township' in
Villages Boregaon, Shene, Virani, Belavade, Walak, Mugoshi, Govirle &
Hamrapur of Tehsil Pen, District Raigad (Maharashtra) by M/ s Karanja
Infrastructure Pvt Ltd, was considered by the Expert Appraisal Committee (EAC)
in the Ministry for Infrastructure Development, Coastal Regulation Zone:
Building/ Construction and Miscellaneous projects, in its 151st meeting held on
7th- 9th September, 2015.
3. The details of the project, as per the documents submitted by the Project
Proponents (PP), and also as informed during the above said EAC meeting, are
reported to be as under:-
(i) The proposal involves development of Integrated Industrial Township in
Villages Boregaon, Shene, Virani, Belavade, Walak, Mugoshi, Govirle & Hamrapur
of Tehsil Pen, District Raigad (Maharashtra) by M/s Karanja Infrastructure Pvt
Ltd. The project is to be developed under 'Integrated Industrial Area' (IIA)policy of
MIDC, Maharashtra State Government's Industrial Infrastructure Agency.
(ii) The proposed project will be developed in four land parcels namely, T1, T2,
T3, & T4 with land spread in the revenue map of 8 villages i.e. T1: Boregaon,
Shene & Virani; T2 & T4: Belavade, Walak & Mugoshi & T3: Govirle & Hamrapur.
The geographical coordinates of the site are given below:
Tl: Latitude: 18°42'14.11" N, Longitude: 73°08'37.90" E;
T2: Latitude: 18°46'23.80" N, Longitude: 73°07'17.44" E;
T3: Latitude: 18°46'53.73" N, Longitude: 73°07'28.52" E and
T4: Latitude: 18°47'26.51" N, Longitude: 73°05'27.74" E.
Proposal No. IA/MH/NCP /28699/2015Page 1 of 7

Proposal No. IA/MH/NCP/28699/2015 Page 2 0[7
ePlot/Survey/Khasra No.: Tl- 69, 113, 116, 118, 308, 117, 120, 170, 171, 172,
174,189,38,46,121,25,8,10,24,26,27,30,34,40,123, 131, 144,295,2,87,
90, 93, 106, 279, 284, 4, 13, 74, 200, 209, 211, 136, 296, 303, 115, 124, 132,
135,101,276,122,39, lA, 4/1+5/1, 4A, 21,19, 4/A/4, 4/A/5, 4/A/7, 4/A/10,
4/A/11, 4/A/12, 4/A/13, 4/A/14, 4/A/15, 4/A/16, 4/A/17, 4/A/24, 4/A/25,
4/ A/28, 4/ A/29, 4/ A/30, 4/ A/31, 4/ A/32, 4/ A/33, 4/ A/35, 4/ A/36, 4/ A/38,
4/A/39, 4/A/40, 4/A/42, 4/A/43, 21/1A/1, 21/1A/10, 21/1A/11, 21/1A/12,
21/1A/13, 1/A/3, 1/A/6, 1/A/7, 1/A/8, 1/A/17, 1/A/23, 1/A/34, 1/A/35,
1/A/46, 1/A/48, 1/A/57, 1/A/78, 1/A/89, 1/A/90, 1/A/94, 1/A/95, 1/A/98,
1/A/99, 1/A/127, 1/A/132, 1/A/135, 1/A/141, 1/A/147, 1/A/149, 1/A/150,
1/A/153, 1/A/154, 1/A/155, 1/A/265, 1/A/266, 1/A/267, 1/A/268, 1/A/269,
1/A/270, 1/A/271, 1/A/277, 1/A/278, 1/A/279, 1/A/284, 1/A/276, 4/A/1,
4/A/2, 4/A/3, 4/A/6, 4/A/34, 4/A/18, 4/A/19, 4/A/20, 4/A/21, 4/A/22,
4/A/23, 4/A/41, 4/A/44, 4/A/45,4/A/46, 4/A/47, 4/A/53, 21/1A/7, 21/1A/8,
21/1A/9,4/A/26, 4/A/27, 4/A/37, 21/1A/2,4/A/49, 4/A/50, 4/A/51, 4/A/52,
4/A/54, 21/1A/14, 21/1A/15, 21/1A/16, II/lA/I, 11/lA/2, 11/lA/3,
11/lA/4, 11/lA/5, 11/lA/6, 11/lA/7, 11/lA/8, 11/lA/9, II/lA/10,
11/ lA/II, 11/ 1A/12, 11/ 1A/13, 11/ 1A/14, 11/ 1A/ 15, 11/ 1A/ 16, 11/ 1A/17,
11/ 1A/18, 11/ 1A/19, 11/ lA/20, 11/lA/21, 11/lA/22, 11/lA/23, 11/lA/24,
11/lA/25, 11/lA/26, 11/lA/27, 11/lA/28, 11/1A/29, II/lA/30, 11/lA/31,
11/lA/32, 11/lA/33, 11/lA/34, 11/lA/35, 11/lA/36, 11/lA/37, 11/lA/38,
11/lA/39, II/lA/40, 11/lA/41, 11/lA/42, 11/lA/43, 11/lA/44, 11/lA/45,
11/lA/46, 11/lA/47, 11/lA/48, 11/lA/49, II/lA/50, II/lA/51, II/lA/52,
II/lA/53, II/lA/54, II/lA/55, 1/A/2, 1/A/4, 1/A/9, 1/A/10, 1/A/13,
1/A/14, 1/A/15, 1/A/16, 1/A/18, 1/A/19, 1/A/21, 1/A/22, 1/A/24, 1/A/26,
1/A/27, 1/A/28, 1/A/30, 1/A/36, 1/A/42, 1/A/43, 1/A/45, 1/A/47, 1/A/56,
1/A/58, 1/A/59, 1/A/60, 1/A/61, 1/A/62, 1/A/63, 1/A/64, 1/A/65, 1/A/66,
1/A/68, 1/A/69, 1/A/70, 1/A/71, 1/A/72, 1/A/73, 1/A/74, 1/A/75, 1/A/76,
1/A/77, 1/A/79, 1/A/80, 1/A/81, 1/A/83, 1/A/86, 1/A/91, 1/A/93, 1/A/96,
1/A/97, 1/A/100, 1/A/103, 1/A/105, 1/A/122, 1/A/123, 1/A/125, 1/A/126,
1/A/129, 1/A/130, 1/A/134, 1/A/143, 1/A/146, 1/A/159, 1/A/160, 1/A/161,
1/A/162, 1/A/232, 1/A/233, 1/A/234, 1/A/235, 1/A/236, 1/A/237, 1/A/106,
1/A/107, 1/A/108, 1/A/109, 1/A/110, 1/A/111, 1/A/112, 1/A/113, 1/A/114,
1/A/115, 1/A/116, 1/A/117, 1/A/118, 1/A/119, 1/A/120, 1/A/121, 1/A/145,
1/A/148, 1/A/151, 1/A/152, 1/A/156, 1/A/166, 1/A/167, 1/A/168, 1/A/169,
1/A/170, 1/A/171, 1/A/220, 1/A/221, 1/A/224, 1/A/225, 1/A/226, 1/A/227,
1/A/228, 1/A/254, 1/A/253, 1/A/255, 1/A/256, 1/A/275, 1/A/280, 1/A/281,
1/A/282, 1/A/283, 1/A/285, 1/A/286, 1/A/287, 1/A/288, 1/A/289, 1/A/290,
1/A/291, 1/A/292, 1/A/293, 1/A/294, 1/A/295, 1/A/124, 1/A/128, 1/A/131,
1/A/142, 1/A/144, 1/A/157, 1/A/158, 1/A/163, 1/A/164, 1/A/165, 1/A/172,
1/A/173, 1/A/174, 1/A/175, 1/A/176, 1/A/242, 1/A/243, 1/A/244, 1/A/245,
1/A/246, 1/A/247, 1/A/251, 1/A/252, 1/A/257, 1/A/258, 1/A/259, 1/A/260,
1/A/261, 1/A/262, 1/A/263, 1/A/1, 1/A/5, 1/A/11, 1/A/12, 1/A/20, 1/A/25,
1/A/29, 1/A/31, 1/A/32, 1/A/33, 1/A/37, 1/A/38, 1/A/39, 1/A/40, 1/A/41,1/A/44, 1/A/49, 1/A/50, 1/A/51, 1/A/52, 1/A/53, 1/A/54, 1/A/55, 1/A/67,
1/A/82, 1/A/84, 1/A/85, 1/A/87, 1/A/88, 1/A/92, 1/A/101, 1/A/102,
1/A/104, 1/A/133, 1/A/137, 1/A/138, 1/A/177, 1/A/178, 1/A/179, 1/A/180,
1/A/181,1/A/183, 1/A/184, 1/A/185, 1/A/186, 1/A/187, 1/A/188, 1/A/189,
1/A/190, 1/A/191, 1/A/192, 1/A/193, 1/A/194, 1/A/195, 1/A/196, 1/A/197,
1/A/198, 1/A/199, 1/A/200, 1/A/201, 1/A/202, 1/A/203, 1/A/204, 1/A/205,
1/A/206, 1/A/207, 1/A/208, 1/A/209, 1/A/210, 1/A/211, 1/A/212, 1/A/213,
1/A/214, 1/A/215, 1/A/216, 1/A/217, 1/A/218, 1/A/219, 1/A/222, 1/A/223,
1/A/229, 1/A/230, 1/A/231, 1/A/238, 1/A/239, 1/A/240, 1/A/241, 1/A/248,

J
e1/A/249, 1/A/250, 1/A/264, 1/A/272, 1/A/273, 1/A/274, 1/A/296, 1/A/297,
1/A/298, 1/A/299, 1/A/300, 1/A/301, 1/A/302, 1/A/303, 1/A/304; T2: 277,
278,311,96, 102, 105, 113,62,94, 100; T3: 1-118 A, 1-18, 1-19,2-7,2-11,2-13
B, 3-2, 3-5, 4-1, 4-4, 5-1, 7-1B, 2/1A 1, 2/3A 1, 5/2 B, 77/1, 77/2, 77/3, 81/6,
105, 106, 111,31,32,2,7,3,4,5,80,81,82,83,29,59,60,78 and T4: 82, 180,
187, 192,204,222,227,23,38,50,53, 18, 179,42,20, 140,37,41, 199,207,
266,22,274,85,205,123,42,21,223,17,126,14,34,241, 247, 248, 54,10,
25,101,22,244,200,214, 191, 181, 182, 185,261.
(iii) The total plot area of proposed project is 1100 acres (44,51,700 sqm) and
total built-up area 30,29,422 sqm.
(iv) The proposed project comprises of:
� Industrial Parks and Export Processing Zones (including 'A' Category
Industries viz. Manmade Fibre, Synthetic Organic etc.)
� Physical infrastructures will include roads, amenities, bridges, water
retention ponds, residential and commercial complexes etc ..)
� IT/BT Parks
� Service Centers, Skill Development Centers
� Financial Centers and Services
� Logistic hubs, warehousing and freight terminals
� Mentoring and Counselling services
(v) The estimated quantity of solid waste would be about 32 Metric tons per
day. Source segregation is proposed for recyclables (300/0) and the other waste
would be treated and disposed as per MSW Rules. The solid waste will be treated
with the help of suitable technology in compliance with the site conditions. Sewage
from various sources shall be send to the STP and treated sewage would be used
for gardening and non -potable purposes.
(vi) STPs with combined capacity of about 18 MLDwith suitable technology viz,
MBR, MBBR or Constructed Wetland will be installed depending on the site
conditions and requirement. Excess treated water and sludge from STP can be
used for gardening or can be transported as manure to nearby villages for
agriculture land. The effluent will be treated by using suitable ETPs & CETPs.
(vii) The site is in the vicinity of water bodies. The estimated total water
requirement for the project would be about 19 MLD.
(viii) Total estimated power requirement for entire project is 505 MVA.The power
will be sourced from MSEDCL.
(ix) Part of the project plot area (part of T3 site) lies in CRZ-III and therefore CRZ
Notification is applicable to that part of the project. Hetawane Dam lies at a
distance of 5 kms from project site towards east (T1). Also, part of the plot lies in
CRZ III area (T3). Ambeghar Dam is about 1.25 kms on North of T1 and same is
about 1.75 km south ofT2. Except part ofT3 CRZ area, there are no wet lands.
(x) Investment/Cost: The total cost of the project is Rs.14206 Crores.
Proposal No. IA/MH/NCP /28699/2015 Page 3 0[7
4. The proposal was considered by the EAC and recommended in its 151st
meeting held on 7th - 9th September, 2015 for grant of ToR. As per the
recommendation of the EAC, the Ministry of Environment, Forest & Climate
Change hereby accords ToR for 'Development of Integrated Industrial
Township' in Villages Boregaon, Shene, Virani, Belavade, Walak, Mugoshi,
Govirle & Hamrapur of Tehsil Pen, District Raigad (Maharashtra) by M/
Karanja Infrastructure Pvt Ltd, with the following specific and general conditions
for preparation of the Environment Impact Assessment (EIA) Report and
Environment Management Plan (EMP):
e(i) Reasons for selecting the site with details of alternate sites examined/
rejected/ selected on merit with comparative statement and reason/basis for
selection. The examination should justify site suitability in terms of
environmental damage, resources sustainability associated with selected site
as compared to rejected sites. The analysis should include parameters
considered along with weightage criteria for short-listing selected site.
(ii) Submit the details of the land use break-up for the proposed project.
Details of land use around 10 km radius of the project site. Analysis should
be made based on latest satellite imagery for land use with raw images.Check on flood plain of any river.
(iii) Submit details of environmentally sensitive places, land acquisition status,
rehabilitation of communities/ villages and present status of such activities.
(iv) Examine the impact of proposed project on the nearest settlements.
(v) Examine baseline environmental quality along with projected incremental
load due to the project taking into account of the existing developmentsnearby.
(vi) Environmental data to be considered in relation to the project development
would be (a) land, (b) groundwater, (c) surface water, (d) air, (e)bio-diversity,(f)noise and vibrations, (g)socio economic and health.
(vii) Submit a copy of the contour plan with slopes, drainage pattern of the site
and surrounding area, and any obstruction of the same by the project.
(viii) Details regarding project boundary passing through any eco- sensitive areaand within 10 km from eco- sensitive area.
(ix) Green buffer in the form of green belt to a width of 15 meters should be
provided all along the periphery of the industrial area. The individual units
should keep 330/0 of the allotted area as a green area.
(x) Submit the details of the trees to be felled for the project.
(xi) Submit the details of the infrastructure to be developed.
(xii) Submit the present land use and permission required for any conversionsuch as forest, agriculture etc.
(xiii) Submit details regarding R&Rinvolved in the project
(xiv) Zoning of the area in terms of 'type of industries' coming-up in the industrial
area based on the resource requirement along with likely pollutants with·quantity from the various industries.
(xv) The project boundary area and study area for which the base line data is
generated should be indicated through a suitable map. Justification of the
parameters, frequency and locations shall be discussed in the EIA.
(xvi) Submit Legal frame work for the implementation of EnvironmentalClearance conditions - to be clearly spelt out in the EIAreport.
(xvii) Submit Roles and responsibility of the developer etc for compliance ofenvironmental regulations under the provisions of EP Act.
Proposal No. IA/MH/NCP/28699/2015 Page 4 of7

e(xviii)Site justification of the identified industry sectors from environmental angle
and the details of the studies conducted if any.
(xix) Ground water classification as per the Central Ground Water Authority.
(xx) Submit the source of water, requirement vis-a-vis waste water to be
generated along with treatment facilities, use of treated waste water along
with water balance chart taking into account all forms of water use and
management.
(xxi) Rain water harvesting proposals should be made with due safeguards for
ground water quality. Maximize recycling of water and utilization of rain
water. Examine details.
(xxii) Examine soil characteristics and depth of ground water table for rainwater
harvesting.
(xxiii)Examine details of solid waste generation treatment and its disposal.
(xxiv)Examine and submit details of use of solar energy and alternative source of
energy to reduce the fossil energy consumption.
(xxv) In case DG sets are likely to be used during construction and operational
phase of the project, emissions from DG sets must be taken into
consideration while estimating the impacts on air environment. Examine
and submit details.
(xxvi)Examine road/rail connectivity to the project site and impact on the traffic
due to the proposed project. Present and future traffic and transport
facilities for the region should be analysed with measures for preventing
traffic congestion and providing faster trouble free system to reach different
destinations in the city.
(xxvii)A detailed traffic and transportation study should be made for existing and
projected passenger and cargo traffic.
(xxviii)Examine the details of transport of materials for construction which should
include source and availability.
(xxix)Examine the details of National Highways/State Highways/ expressways
falling along the corridor and the impact of the development on them.
(xxx) Examine noise levels - present and future with noise abatement measures.
(xxxi)Identify, predict and assess the environmental and sociological impacts on
account of the project. A detailed description with costs estimates of CSR
should be incorporated in the EIA / EMP report.
(xxxii)Examine separately the details for construction and operation phases both
for Environmental Management Plan and Environmental Monitoring Plan
with cost and parameters.
(xxxiii)Submit details of a comprehensive Disaster Management Plan including
emergency evacuation during natural and man-made disaster.
(xxxiv)Any further clarification on carrying out the above studies includinganticipated impacts due to the project and mitigative measure, project
Proposal No. IA/MH/NCP /28699/2015Page 5 of7

eproponent can refer to the model ToR available on Ministry website"http.y Zmoef.ntc.In/ Manual/ Industrial Estate".
General Guidelines
(i) The EIAdocument shall be printed on both sides, as for as possible.
(ii) All documents should be properly indexed, page numbered.
(iii) Period/ date of data collection should be clearly indicated.
(iv) Authenticated English translation of all material provided In Regionallanguages.
(v) The letter j application for EC should quote the MoEF&CC File No. and alsoattach a copy of the letter prescribing the TOR.
(vi) The copy of the letter received from the Ministry on the TOR prescribed for
the project should be attached as an annexure to the final EIA-EMPReport.
(vii) The final EIA-EMP report submitted to the Ministry must incorporate the
issues in TOR and that raised in Public Hearing. The index of the final EIA-
EMP report, must indicate the specific chapter and page no. of the EIA-EMP
Report where the specific TOR prescribed by Ministry and the issue raised in
the P.H. have been incorporated. Questionnaire related to the project (posted
on MoEF&CCwebsite) with all sections duly filled in shall also be submittedat the time of applying for EC.
(viii) Grant of TOR does not mean grant of EC.
(ix) Grant of TORjEC to the present project does not mean grant of approvals in
other regulations such as the Forest (Conservation) Act 1980 or the Wildlife(Protection) Act, 1972.
(x) Grant of EC is also subject to Circulars issued under the EIA Notification
2006, which are available on the MoEF&CCwebsite: www.envfor.nic.in.
(xi) The status of accreditation of the EIA consultant with NABETj QCI shall be
specifically mentioned. The consultant shall certify that his accreditation isfor the sector for which this EIAis prepared.
(xii) On the front page of EIA/EMP reports, the name of the
consultant/ consultancy firm along with their complete details including
their accreditation, if any shall be indicated. The consultant while
submitting the EIAjEMP report shall give an undertaking to the effect that
the prescribed TORs (TORproposed by the project proponent and additional
TOR given by the MoEF)have been complied with and the data submitted is
factually correct (Refer MoEF office memorandum dated 4th August, 2009).
(xiii) While submitting the EIA/EMP reports, the name of the experts associated
with/ involved in the preparation of these reports and the laboratories
through which the samples have been got analysed should be stated in the
report. It shall clearly be indicated whether these laboratories are approved
under the Environment (Protection) Act, 1986 and the rules made there
under (Please refer MoEF office memorandum dated 4th August, 2009). Theproject leader of the EIA study shall also be mentioned.
ProposalNo. IA/MH/NCP/28699/2015Page 6 of7

-(xiv) All the TOR points as presented before the Expert Appraisal Committee
(EAC)shall be covered.
5. A detailed draft EIA/EMP report should be prepared in terms of the above
additional ToRs and should be submitted to the State Pollution Control Board for
conduct of Public Hearing. Public Hearing to be conducted for the project in
accordance with the provisions of Environmental Impact Assessment Notification,
2006 and the issues raised by the public should be addressed in the
Environmental Management Plan. The Public Hearing should be conducted based
on the ToR letter issued by the Ministry and not on the basis of Minutes of the
Meeting available on the web-site.
6. The project proponent submit the detailed final EIA/EMP prepared as per
ToRs including issues raised during Public Hearing to the Ministry for considering
the proposal for environmental clearance within 3 years as per the MoEF&CC O.M.
No.J-11013/41/2006-IA-II(I) (P) dated 08.10.2014.
7. The consultants involved in preparation of EIA/EMP report after
accreditation with Quality Council of India/National Accreditation Board of
Education and Training (QCI/NABET) would need to include a certificate in this
regard in the EIA/EMP reports prepared by them and data provided by other
Organization(s)/Laboratories including their status of approvals etc. vide
notification of the MoEF dated 19.07.2013.
8. The prescribed ToRs would be valid for a period of
submission of the EIA/EMP Reports.
three years for
i\I!\2-01>(S.K. Srivastava)
Scientist E
Copy to:The Member Secretary, Maharashtra Pollution Control Board, Kalpataru Points, 3rd
& 4thfloor, Opp. Cine Planet, Sion Circle, Sion (E), Mumbai - 22
Proposal No. IA/MH/NCP/28699/2015Page 7 0[7

Annexure-II


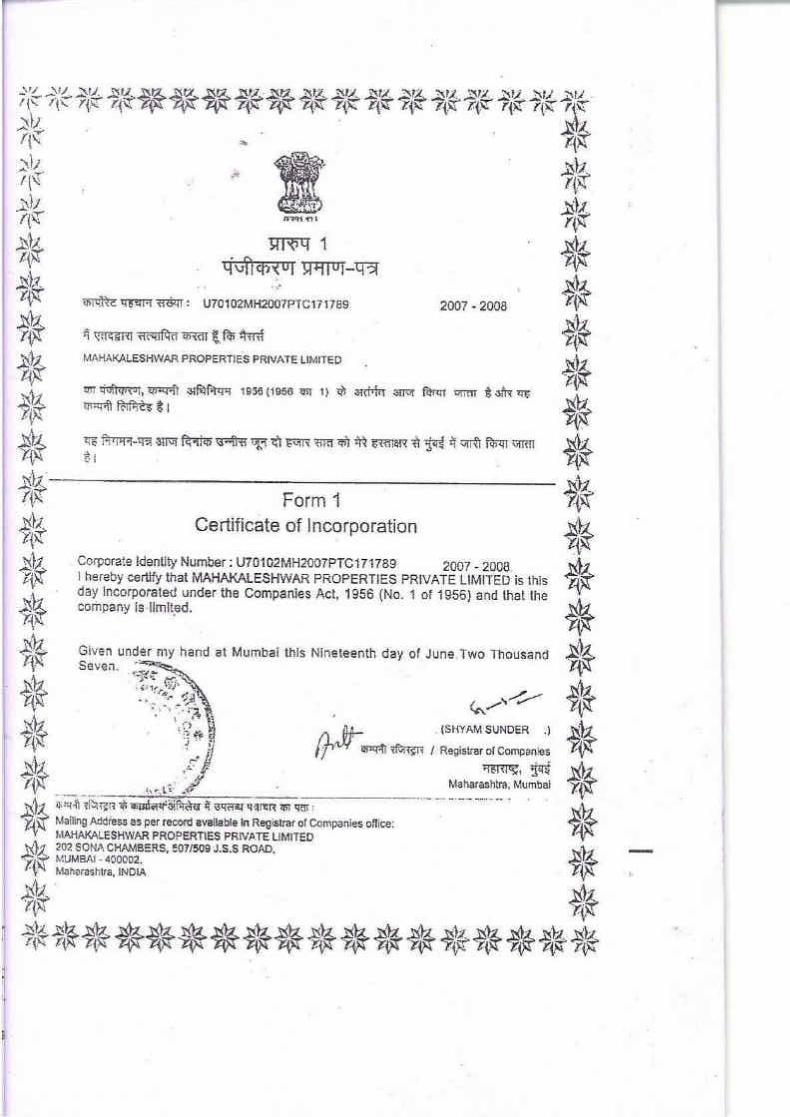

Annexure-III


Annexure-IV


Annexure-V

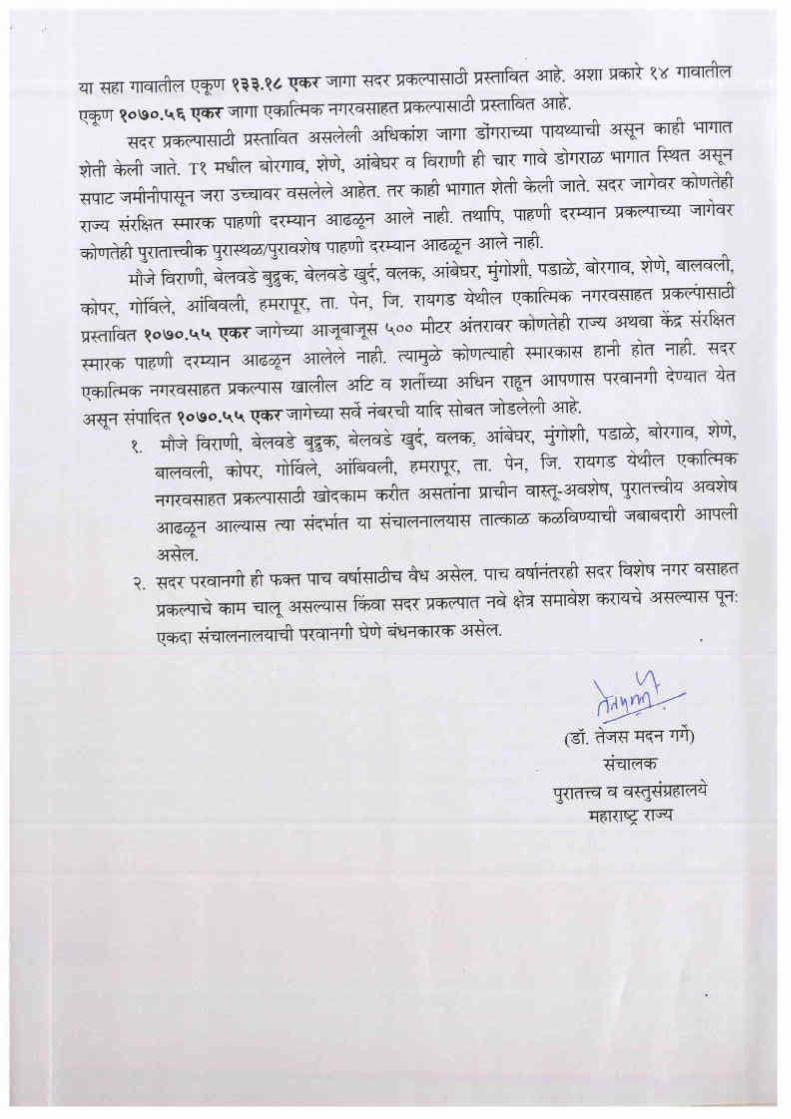

Annexure-VI


Annexure-VII


Annexure-VIII

Annexure-IX


Annexure-X
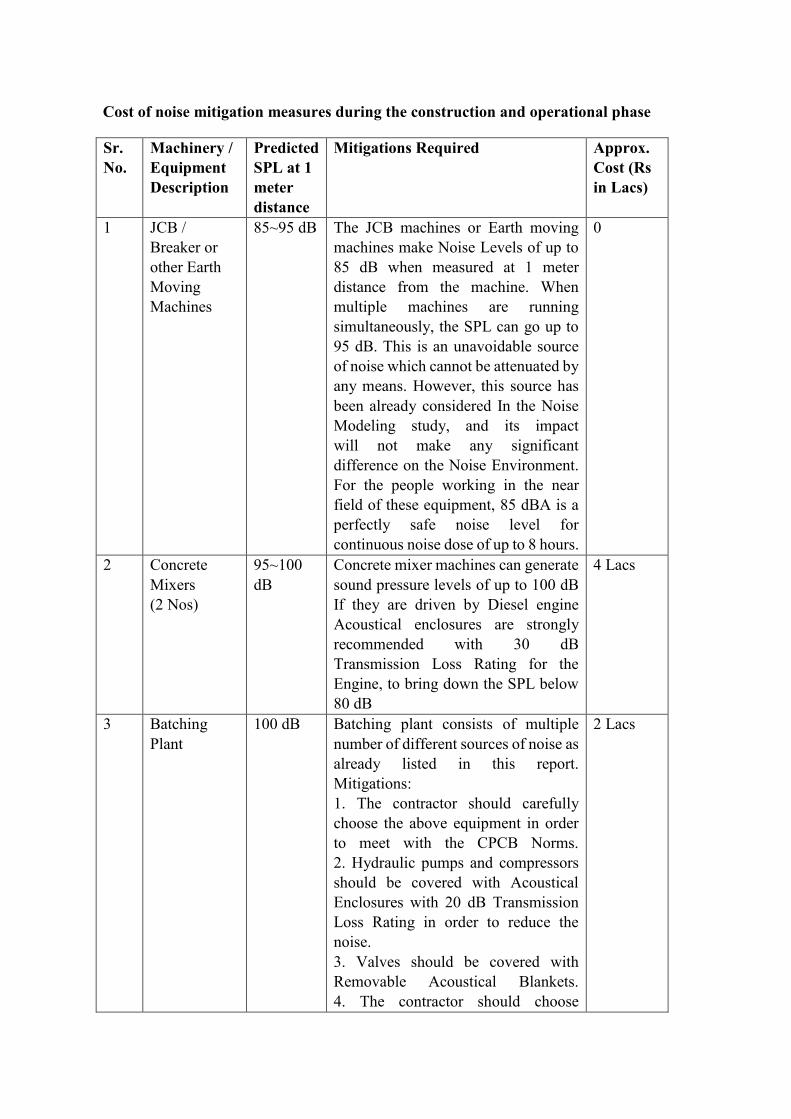
Cost of noise mitigation measures during the construction and operational phase
Sr.
No.
Machinery /
Equipment
Description
Predicted
SPL at 1
meter
distance
Mitigations Required Approx.
Cost (Rs
in Lacs)
1 JCB /
Breaker or
other Earth
Moving
Machines
85~95 dB The JCB machines or Earth moving
machines make Noise Levels of up to
85 dB when measured at 1 meter
distance from the machine. When
multiple machines are running
simultaneously, the SPL can go up to
95 dB. This is an unavoidable source
of noise which cannot be attenuated by
any means. However, this source has
been already considered In the Noise
Modeling study, and its impact
will not make any significant
difference on the Noise Environment.
For the people working in the near
field of these equipment, 85 dBA is a
perfectly safe noise level for
continuous noise dose of up to 8 hours.
0
2 Concrete
Mixers
(2 Nos)
95~100
dB
Concrete mixer machines can generate
sound pressure levels of up to 100 dB
If they are driven by Diesel engine
Acoustical enclosures are strongly
recommended with 30 dB
Transmission Loss Rating for the
Engine, to bring down the SPL below
80 dB
4 Lacs
3 Batching
Plant
100 dB Batching plant consists of multiple
number of different sources of noise as
already listed in this report.
Mitigations:
1. The contractor should carefully
choose the above equipment in order
to meet with the CPCB Norms.
2. Hydraulic pumps and compressors
should be covered with Acoustical
Enclosures with 20 dB Transmission
Loss Rating in order to reduce the
noise.
3. Valves should be covered with
Removable Acoustical Blankets.
4. The contractor should choose
2 Lacs

controlled operating hours for noisy
activities such as delivery, loading
unloading etc.
4 DG Sets
(Multiple
Numbers)
<85 dB
Diesel Generator Sets are supposed to
have Sound Pressure Levels of lesser
than 75 dBA when measured at 1
meter distance. However, when
multiple DG sets are supposed to be
kept close to one another, a single
Acoustical Enclosure combined for all
the DG Sets is recommended with a
minimum Transmission Loss
Rating of 30 dBA
0
5 Submersible
Pumps
80~85 dB Submersible type de-watering pumps
have lower Sound Pressure Levels
than 80 or 85 dB, therefore no
mitigations are necessary for this
source of noise.
0
6 Cranes /
Hoists
< 80 dB 1. Cranes usually are silent and have
noise levels of less than 80 dB in case
they are electrically driven and no
mitigation is necessary for the
same.
2. In case the cranes are driven using
an engine, in that case, Acoustical
Enclosure with 20 dB Transmission
Loss , Rating is recommended for the
engine and the driving
mechanism
0
7 Sewage
Treatment
Plant
100 dB 1. STP consists of multiple of blowers
and pumps, out of which blowers can
generate noise levels exceeding 100
dB. Acoustical Enclosures for STP
Blowers are strongly recommended,
with 30 dB Transmission Loss Rating
4 Lacs
8 Additional
Mitigations /
Cares to take
N/A 1. Sound Reflective barriers to be
installed at the boundary of the
project site.
2. All people working in the vicinity
of the Equipment/Machinery with
Sound Pressure. Levels higher than 90
dB should wear protective ear plugs to
avoid permanent hearing damage.
1. 0 for
Reusable
barriers
if already
available,
Else 10
to 20Lacs.
2. 0.2Lacs

Annexure-XI


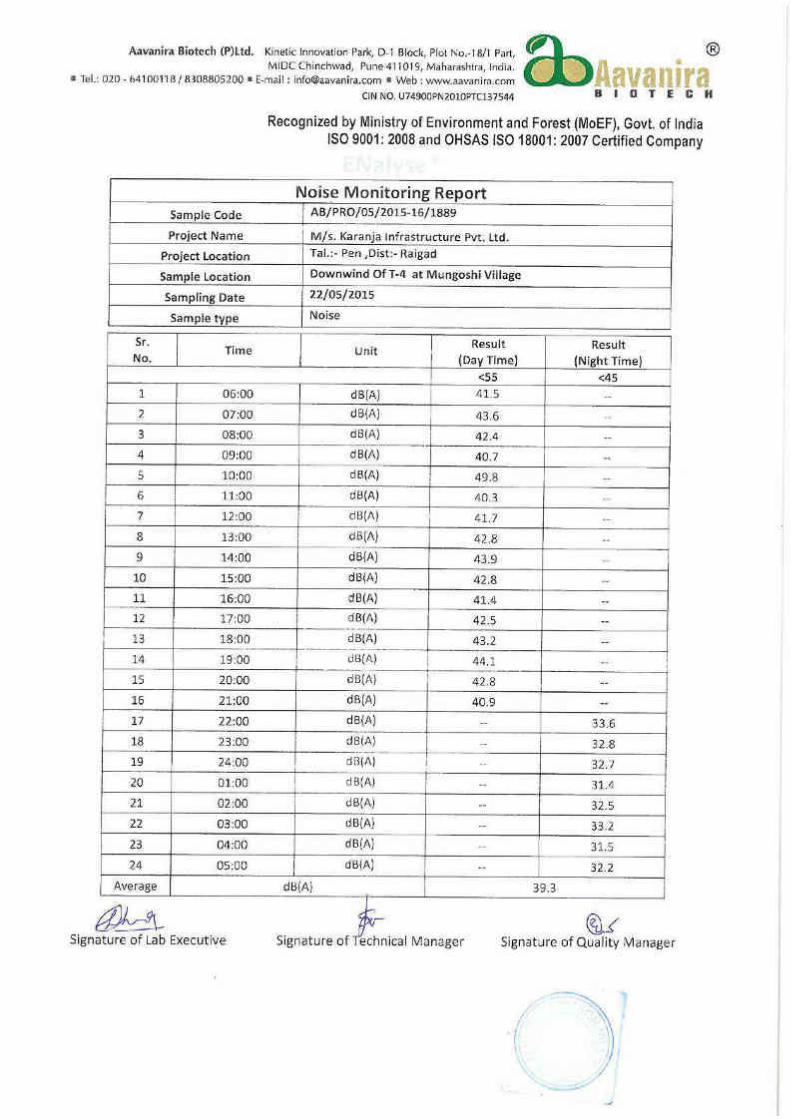


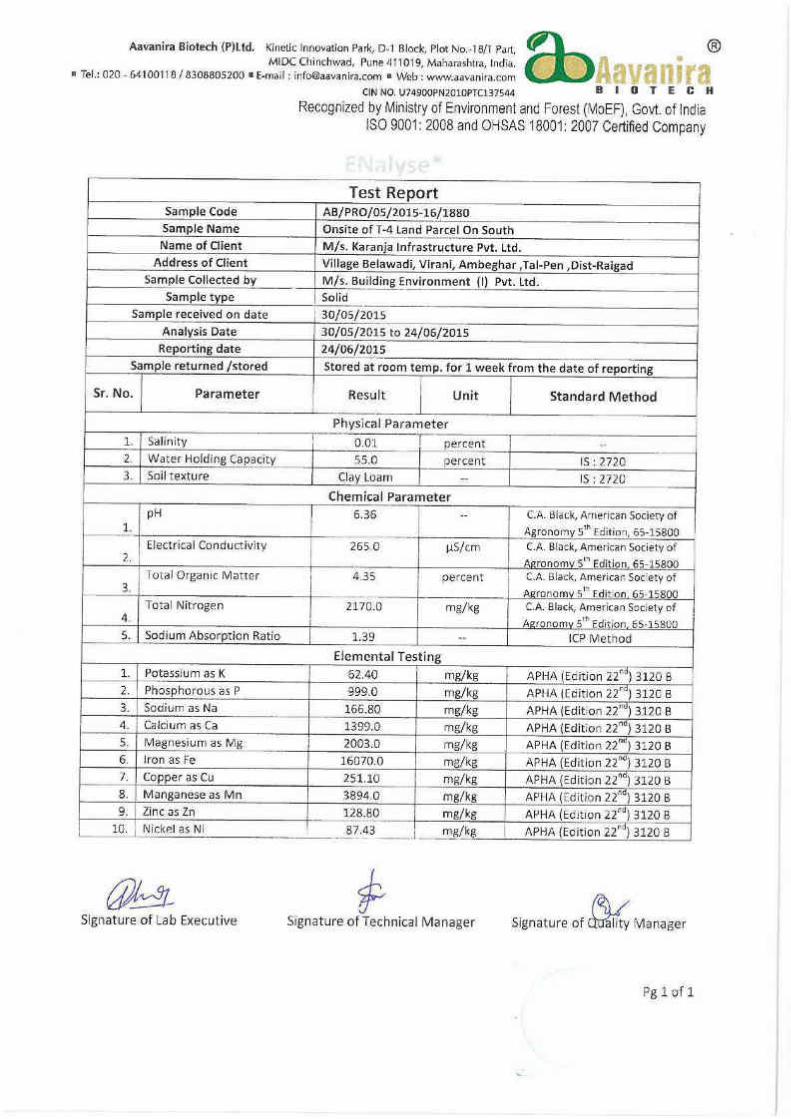


Annexure-XII

Annexure-XIII

SKW SOIL AND SURVEY CO. NEW MUMBAI.
CONTINUED ON NEXT PAGEREMARKS :
SPT N =STANDARD PENETRATION TEST VALUE
CR = CORE RECOVERY
6.00
10.00
9.00
7.00
8.00
RQD = ROCK QUALITY DESIGNATION
DS = DISTURBED SOIL SAMPLE
Reviewed By : Drawn By:Checked By :
-- V. Patil
JOB NO. : 165
SCALE : 1: 50UDS = UNDISTURBED SOIL SAMPLE
VST = VANE SHEAR TEST
MR.KALE SAHEB
Geotechnical Investigation Work for Pen Site.
METHOD
SHEET NO.
CASING
DATE
TYPE
1.00
3.00
4.00
5.00
2.00
--
2.00 m.BGL
BH-01
PROJECT :
DhamaniLOCATION
CHAINAGE
BORE HOLE NO.
:
:
:
:
:
--
GROUND R. L.
GROUND W. T.
CLIENT :
LOG.DEPTH
(m.)
DIA. OF
BORE HOLE
SAMPLE
(m)DEPTH
STRATA DESCRIPTION
100 mm Ø Nx Upto 1.50 m Below G.L.
07/03/2016 to 18/03/2016
1 OF 2
ROTARY DRILLING:
:
:
:
RQD
%
SPTBLOWS/15cm
151515 15
C R
%N
OTHER
TESTS
Dinesh
1.50Rock
3.00Rock
7.50
9.00
0.00
0.50 DS1
4.50Rock
6.00Rock
Rock
Rock
13 NIL
19 NIL
16 NIL
33 32
37 36
06 NIL
N
X
Brownish Highly weathered
ROCK
Brownish Highly weathered
BASALT
08 NIL
Brownish Completely weathered
Rock

SKW SOIL AND SURVEY CO. NEW MUMBAI.
THE BORE HOLES TERMINATE AT DEPTH 13.50 MTR BGL.REMARKS :
SPT N =STANDARD PENETRATION TEST VALUE
CR = CORE RECOVERY
16.00
20.00
19.00
17.00
18.00
RQD = ROCK QUALITY DESIGNATION
DS = DISTURBED SOIL SAMPLE
Reviewed By : Drawn By:Checked By :
-- V. Patil
JOB NO. : 165
SCALE : 1: 50UDS = UNDISTURBED SOIL SAMPLE
VST = VANE SHEAR TEST
MR.KALE SAHEB
Geotechnical Investigation Work for Pen Site.
METHOD
SHEET NO.
CASING
DATE
TYPE
11.00
13.00
14.00
15.00
12.00
--
2.00 m.BGL
BH-01
PROJECT :
DhamaniLOCATION
CHAINAGE
BORE HOLE NO.
:
:
:
:
:
--
GROUND R. L.
GROUND W. T.
CLIENT :
LOG.DEPTH
(m.)
DIA. OF
BORE HOLE
SAMPLE
(m)DEPTH
STRATA DESCRIPTION
100 mm Ø Nx Upto 1.50 m Below G.L.
07/03/2016 to 18/03/2016
2 OF 2
ROTARY DRILLING:
:
:
:
RQD
%
SPTBLOWS/15cm
151515 15
C R
%N
OTHER
TESTS
Dinesh
0.00
Brownish Slightly weathered
BASALT
08 NIL
12.00 Rock
15 07
10.50 Rock
13.50 Rock
55 54
Brownish Highly weathered
fracture BASALT
Brownish Completely weathered
Rock

SKW SOIL AND SURVEY CO. NEW MUMBAI.
CONTINUED ON NEXT PAGEREMARKS :
SPT N =STANDARD PENETRATION TEST VALUE
CR = CORE RECOVERY
6.00
10.00
9.00
7.00
8.00
RQD = ROCK QUALITY DESIGNATION
DS = DISTURBED SOIL SAMPLE
Reviewed By : Drawn By:Checked By :
-- V. Patil
JOB NO. : 165
SCALE : 1: 50UDS = UNDISTURBED SOIL SAMPLE
VST = VANE SHEAR TEST
MR.KALE SAHEB
Geotechnical Investigation Work for Pen Site.
METHOD
SHEET NO.
CASING
DATE
TYPE
1.00
3.00
4.00
5.00
2.00
--
6.00 m.BGL
BH-02
PROJECT :
BelwadeLOCATION
CHAINAGE
BORE HOLE NO.
:
:
:
:
:
--
GROUND R. L.
GROUND W. T.
CLIENT :
LOG.DEPTH
(m.)
DIA. OF
BORE HOLE
SAMPLE
(m)DEPTH
STRATA DESCRIPTION
100 mm Ø Nx Upto 3.00 m Below G.L.
18/03/2016 to 22/03/2016
1 OF 2
ROTARY DRILLING:
:
:
:
RQD
%
SPTBLOWS/15cm
151515 15
C R
%N
OTHER
TESTS
Dinesh
1.50
3.00
100
Ø
7.50
9.00
0.00
10.00
4.50
6.00
Rock
20 NIL
51 15
N
X
Reddish highly weathered
Fracture BASALT
SPT1SPT11502
3004
4006
6009
N10
SPT21052
----
----
----
NR
SPT30852
----
----
----
NR
SPT40452
----
----
----
NR
Rock
3.10
4.58
6.04
51 23
Reddish Moderately weathered
BASALT
Reddish gray fine silty SAND
2.10
MM

SKW SOIL AND SURVEY CO. NEW MUMBAI.
THE BORE HOLES TERMINATE AT DEPTH 13.50 MTR BGL.REMARKS :
SPT N =STANDARD PENETRATION TEST VALUE
CR = CORE RECOVERY
16.00
20.00
19.00
17.00
18.00
RQD = ROCK QUALITY DESIGNATION
DS = DISTURBED SOIL SAMPLE
Reviewed By : Drawn By:Checked By :
-- V. Patil
JOB NO. : 165
SCALE : 1: 50UDS = UNDISTURBED SOIL SAMPLE
VST = VANE SHEAR TEST
MR.KALE SAHEB
Geotechnical Investigation Work for Pen Site.
METHOD
SHEET NO.
CASING
DATE
TYPE
11.00
13.00
14.00
15.00
12.00
--
6.00 m.BGL
BH-02
PROJECT :
BelwadeLOCATION
CHAINAGE
BORE HOLE NO.
:
:
:
:
:
--
GROUND R. L.
GROUND W. T.
CLIENT :
LOG.DEPTH
(m.)
DIA. OF
BORE HOLE
SAMPLE
(m)DEPTH
STRATA DESCRIPTION
100 mm Ø Nx Upto 3.00 m Below G.L.
18/03/2016 to 22/03/2016
2 OF 2
ROTARY DRILLING:
:
:
:
RQD
%
SPTBLOWS/15cm
151515 15
C R
%N
OTHER
TESTS
Dinesh
51 23
12.00 Rock
58 18
10.50 Rock
13.50 Rock
54 13
Reddish Moderately weathered
BASALT

SKW SOIL AND SURVEY CO. NEW MUMBAI.
CONTINUED ON NEXT PAGEREMARKS :
SPT N =STANDARD PENETRATION TEST VALUE
CR = CORE RECOVERY
6.00
10.00
9.00
7.00
8.00
RQD = ROCK QUALITY DESIGNATION
DS = DISTURBED SOIL SAMPLE
Reviewed By : Drawn By:Checked By :
-- V. Patil
JOB NO. : 165
SCALE : 1: 50UDS = UNDISTURBED SOIL SAMPLE
VST = VANE SHEAR TEST
MR.KALE SAHEB
Geotechnical Investigation Work for Pen Site.
METHOD
SHEET NO.
CASING
DATE
TYPE
1.00
3.00
4.00
5.00
2.00
--
5.50 m.BGL
BH-03
PROJECT :
Boregoan (Virani)LOCATION
CHAINAGE
BORE HOLE NO.
:
:
:
:
:
--
GROUND R. L.
GROUND W. T.
CLIENT :
LOG.DEPTH
(m.)
DIA. OF
BORE HOLE
SAMPLE
(m)DEPTH
STRATA DESCRIPTION
100 mm Ø Nx Upto 1.50 m Below G.L.
26/03/2016 to 28/03/2016
1 OF 2
ROTARY DRILLING:
:
:
:
RQD
%
SPTBLOWS/15cm
151515 15
C R
%N
OTHER
TESTS
Dinesh
1.50Rock
3.00Rock
7.50
9.00
0.00
0.50 DS1
4.50Rock
6.00Rock
Rock
Rock
21 17
55 37
51 42
52 51
63 61
61 61
N
X
Gray Moderately weathered
BASALT
Gray Slightly weathered
BASALT87 80
Gray Highly weathered
BASALT

SKW SOIL AND SURVEY CO. NEW MUMBAI.
THE BORE HOLES TERMINATE AT DEPTH 15.00 MTR BGL.REMARKS :
SPT N =STANDARD PENETRATION TEST VALUE
CR = CORE RECOVERY
16.00
20.00
19.00
17.00
18.00
RQD = ROCK QUALITY DESIGNATION
DS = DISTURBED SOIL SAMPLE
Reviewed By : Drawn By:Checked By :
-- V. Patil
JOB NO. : 165
SCALE : 1: 50UDS = UNDISTURBED SOIL SAMPLE
VST = VANE SHEAR TEST
MR.KALE SAHEB
Geotechnical Investigation Work for Pen Site.
METHOD
SHEET NO.
CASING
DATE
TYPE
11.00
13.00
14.00
15.00
12.00
--
5.50 m.BGL
BH-03
PROJECT :
Boregoan (Virani)LOCATION
CHAINAGE
BORE HOLE NO.
:
:
:
:
:
--
GROUND R. L.
GROUND W. T.
CLIENT :
LOG.DEPTH
(m.)
DIA. OF
BORE HOLE
SAMPLE
(m)DEPTH
STRATA DESCRIPTION
100 mm Ø Nx Upto 1.50 m Below G.L.
26/03/2016 to 28/03/2016
2 OF 2
ROTARY DRILLING:
:
:
:
RQD
%
SPTBLOWS/15cm
151515 15
C R
%N
OTHER
TESTS
Dinesh
87 80
12.00 Rock
61 60
10.50 Rock
13.50 Rock
60 58
62 61
15.00 Rock
Gray Moderately weathered
BRACCIA
Gray Slightly weathered
BASALT
Gray Moderately weathered
BASALT

SKW SOIL AND SURVEY CO. NEW MUMBAI.
CONTINUED ON NEXT PAGEREMARKS :
SPT N =STANDARD PENETRATION TEST VALUE
CR = CORE RECOVERY
6.00
10.00
9.00
7.00
8.00
RQD = ROCK QUALITY DESIGNATION
DS = DISTURBED SOIL SAMPLE
Reviewed By : Drawn By:Checked By :
-- V. Patil
JOB NO. : 165
SCALE : 1: 50UDS = UNDISTURBED SOIL SAMPLE
VST = VANE SHEAR TEST
MR.KALE SAHEB
Geotechnical Investigation Work for Pen Site.
METHOD
SHEET NO.
CASING
DATE
TYPE
1.00
3.00
4.00
5.00
2.00
--
7.50 m.BGL
BH-04
PROJECT :
OlakhLOCATION
CHAINAGE
BORE HOLE NO.
:
:
:
:
:
--
GROUND R. L.
GROUND W. T.
CLIENT :
LOG.DEPTH
(m.)
DIA. OF
BORE HOLE
SAMPLE
(m)DEPTH
STRATA DESCRIPTION
100 mm Ø Nx Upto 3.00 m Below G.L.
01/04/2016 to 2/04/2016
1 OF 2
ROTARY DRILLING:
:
:
:
RQD
%
SPTBLOWS/15cm
151515 15
C R
%N
OTHER
TESTS
Dinesh
1.00
3.0075
Ø
7.50
9.00
0.00
1.00DS1
4.50
6.00Rock
Rock
Rock
20 NIL
27 NIL
59 59
N
X
Grayish silty sand with
GRAVELS
Filling Up Material
Blackish Moderately weathered
BASALT
64 64
mm
SPT1SPT11052
----
----
----
NR1.10
3.10SPT1SPT1
1054
----
----
----
NR
1.50
1.58SPT2
0852
----
----
----
NR
Blackish highly weathered
BASALT

SKW SOIL AND SURVEY CO. NEW MUMBAI.
THE BORE HOLES TERMINATE AT DEPTH 13.50 MTR BGL.REMARKS :
SPT N =STANDARD PENETRATION TEST VALUE
CR = CORE RECOVERY
16.00
20.00
19.00
17.00
18.00
RQD = ROCK QUALITY DESIGNATION
DS = DISTURBED SOIL SAMPLE
Reviewed By : Drawn By:Checked By :
-- V. Patil
JOB NO. : 165
SCALE : 1: 50UDS = UNDISTURBED SOIL SAMPLE
VST = VANE SHEAR TEST
MR.KALE SAHEB
Geotechnical Investigation Work for Pen Site.
METHOD
SHEET NO.
CASING
DATE
TYPE
11.00
13.00
14.00
15.00
12.00
--
7.50 m.BGL
BH-04
PROJECT :
OlakhLOCATION
CHAINAGE
BORE HOLE NO.
:
:
:
:
:
--
GROUND R. L.
GROUND W. T.
CLIENT :
LOG.DEPTH
(m.)
DIA. OF
BORE HOLE
SAMPLE
(m)DEPTH
STRATA DESCRIPTION
100 mm Ø Nx Upto 3.00 m Below G.L.
01/04/2016 to 2/04/2016
2 OF 2
ROTARY DRILLING:
:
:
:
RQD
%
SPTBLOWS/15cm
151515 15
C R
%N
OTHER
TESTS
Dinesh
64 64
12.00 Rock
89 86
N
X
10.50 Rock
13.50 Rock
84 81
Blackish Moderately weathered
BASALT
Blackish Slightly weathered
BASALT
Annexure-XIV

ANNEXURE -7

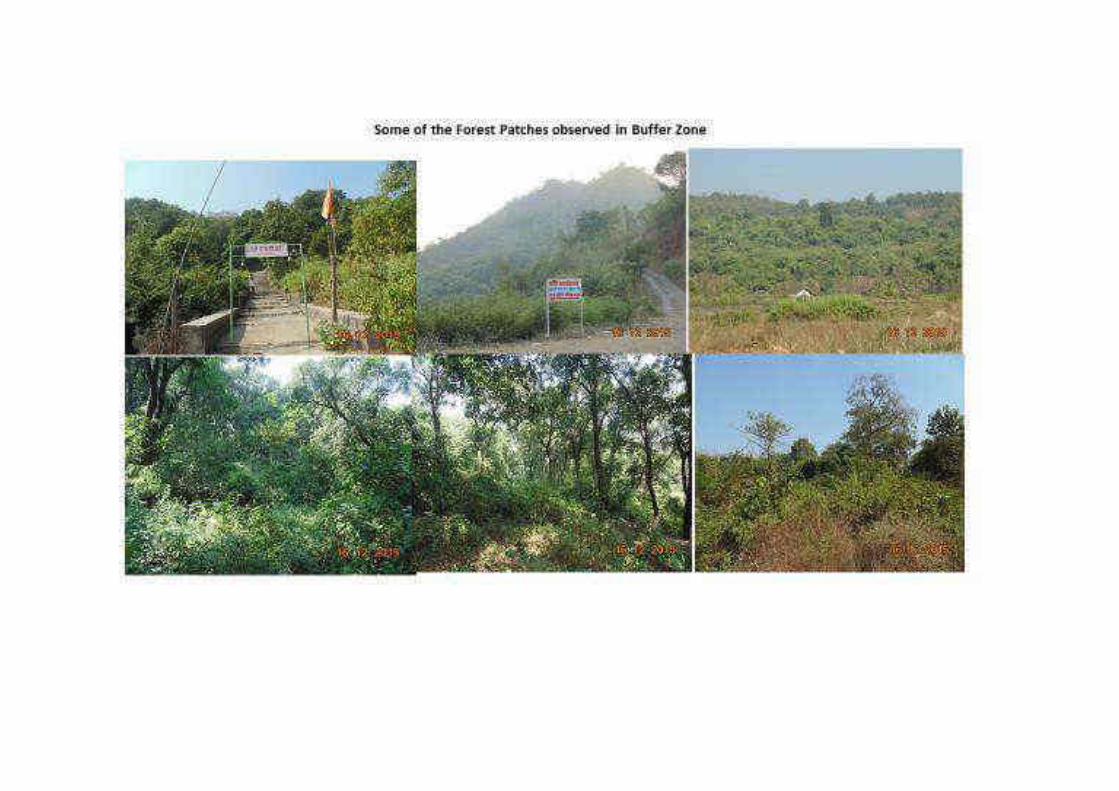

Representative Floral species


Annexure-XV

List of Trees reported at Karnala WLS
Sr. No Names Sr. No Names
1. Vangueria spinosa 2. Acacia ferruginea
3. Flacoartia indica 4. Randia uliginosa
5. Bauhinia racemosa 6. Ficus religiosa
7. Morinda pubescens 8. Ficus arnottiana
9. Bridelia retusa 10. Oleo dioica
11. Emblica offcinalis 12. Albizzia chinensis
13. Spondias pinnata 14. Microcos paniculata
15. Mangifera indica 16. Dalbergia paniculata
17. Ficas glomerata 18. Mimusops elengi
19. Terminalia timentosa 20. Cassia fistula
21. Hymenodictyon excelsum 22. Pterocarpus Marsumpium
23. Ficus asperrima 24. Elaeodendron glaucum
25. Murraya koeniglii 26. Semecarpus anacaedium
27. Dillenia pentagyna 28. Aegle marmelos
29. Pongamia glabra 30. Terminalia bellirica
31. Mitragyana parvifolia 32. Lagerstroemia parviflora
33. Garuga pinnata 34. Cordia dichotoma
35. Lepisanthes tetraphylla 36. Ziziphus jujuba
37. Wrightia tinctoria 38. Thespesia populnea
39. Anacardium occidentale 40. Murraya exotica
41. Sideroxylon tomentosum 42. Dolichondrone falcate
43. Albizia procera 44. Madhuca latifolia
45. Casearia tomentosa 46. Maba nigrescens
47. Holarrhena antidysentrrica 48. Trewia nudiflora
49. Schleichera oleos 50. Sapindus emerginata
51. Garcinia indica 52. Wringhtia arborea
53. Bauhinia malabarica 54. Ixora parvifolia
55. Stericulia cotorata 56. Ixora arborea
57. Careya arborea 58. Ficus Bengalensis

Sr. No Names Sr. No Names
59. Stereospermum xylocarpum 60. Albizia odoratissima
61. Sterculia cotorata 62. Heterophragma roxburghii
63. Streblus asper 64. Kotoptelea integrifolia
65. Mimusops hexandra 66. Embelia robusta sensu
67. Acacia catechu 68. Kydia calycina
69. Randia dumetorum 70. Albizia lebbek
71. Gliricidia sepium 72. Gmelina arborea
73. Ziziphus xylopyrus 74. Dalbergia lalifolia
75. Grewia serrulata 76. Lannea coromandelica
77. Erinocarpus nimmonii 78. Phoenix sylvestris
79. Bauhinia foveolata 80. Mallotus philippensis
81. Macaranga peltata 82. Tectono grandis
83. Tamarindus indica 84. Alstonia scholaris
85. Lagerstroemia 86. Bombax ceiba
87. Xylia xylocarpa 88. Salmalia insignis
89. Eugenia jambolana 90. Sageraea laurifolia
91. Oroylum indicum 92. Mammea suriga
93. Diospyros melanoxylon 94. Terminalia chebula
95. Borassus Flabellifer 96. Adina cordifolia
97. Gardenia gummifera 98. Saccopetalum tomentosum
99. Cordia macleodii 100 Grewia titiaefolia
101. Ficus heterophylla 102 Anogeissus latifolius
103. Dalbargia lanceolaria 104 Tabernaemontana heyneana
105. Butea monosperma 106 Lagerstroemia microcarpa
107. Stereosparmum chelonides 108 Azadirachta indica
109. Ficus tseila 110 Ficus retusa
111. Peltophorum ferrugineum 112 Erythrina indica
Annexure-XVI

List of Shrubs, Herbs, Climbers & Grasses reported at Karnala WLS
Shrubs Climbers Herbs Grasses
Adhatoda Vasica Gnetum ula Hemidesmus indicus Ischaemum pilosum
Jatropha curcas
Calycopteris
floribunda Blumea tecera Eragrostis tenella
Carissa congesta Gloriosa superba Indigofera enephylla Andropogon pumilis
Moghania
Strobelifera
Celastrus
Paniculatos Cassia tora
Andropogon
pertusus
Strobilanthes
Callosus Mucuna pruriens Urena lobata
Andropogon
monticola
Crotolaria refusa Entada rheedei Pavetta tomentosa
Dendrocalamus
strictus
Lantana camera Abrus precatorius Cleome viscose Ischaemum
rugousm
Allophylus cobbe
Tinospora
cordifolia Musa superba Andropogontriticeus
Zizphus rugosa
Caesalpinia
sepiaria Solanum anguivi Anthistria ciliate
Wood fordia
fruticosa Butea superta Cureuma aromatic
Andropogon
annulatus
Datura innoxia mill Dalbergia horrida
Asteracantha
iongifolia
Andropogon
schoenanthus
Vitex negundo
Combretum
ovalifolium Senecio grahami Ischaemum indicum
Opuntia elatior Capparis sepiaria Cynodon dactylon
Pogostemon
purpurascens Clematis triloba
Barteria prionitis Wagatea Spicata
Helicteris isora
Diploclisia
glaucescens
Ocimum
americanum
Thespesia lampas
Eupatorium
glandulosum
Calotropis
gigantean
Xanthium indicum
Annexure-XVII

Birds Reported In Karnala Wild Life Sanctuary
R/M Status
Babbler
Indian Scimitar R C
Jungle R C
Puff Throated (Spotted) R C
Tawny Bellied R O
Fulveta Brown Checked
(Quaker Babbler) R C
Barbet
Brown headed (large green) R C
Coppersmith (Crimson breasted) R C
Bee Eater
Small green R O
Bulbul
Red vented R C
Red Whiskered R C
White Browed R C
White Eared (White checked) R Rare
Buzzard
Oriental Honey R C
White Eyed LM O
Crow
House R C
Large billed (Jungle) R C
Coucal (Crow Pheasant) R C
Cuckoo
Koel Asian R C
Banded bay BM O
Common Hawk BM O
Drongo BM Rare
Pied BM O
Dove
Emerald
Spotted
Drongo
Black R C
Bronzed R O
Greater Racket tailed R C
Hair crested M O
White bellied R O
Eagle
Black LM Rare
Booted M Rare

Crested Serpent R C
Egret
Cattle R C
Falcon
Common Kestrel LM O
Peregrine-Shaheen R C
Hawk/Shikra
Shikra R C
Basera Sparrow hawk M Rare
Eurasian Sparrow hawk M Rare
Flower pecker
Pale billed (Tickle’s) R C
Thick billed R C
Flycatcher
Asian brown M O
Asian Paradise LM O
Grey headed M O
Monarch R C
Red Breasted M O
Rusty tailed M Rare
Tickle’s blue R C
Ultramarine M O
Verditer M O
White Throated R C
Heron
Black crown R C
Indian Pond R C
Hoopoe
Common M O
Hornbill
Indian Grey R C
Iora
Fowl
Jungle fowl, Grey R Rare
Peafowl, Common R Rare
Spur fowl, Red R Rare
Kingfisher
Common R C
Oriental dwarf (three-toed) BM Rare
White Throated R C
Kite
Black R C
Black Shouldered R O
Lapwing
Red Wattled R C

Lark
Malabar R O
Leaf bird
Blue winged /Jordon’s R C
Golden fronted R C
Martin
Dusky crag R C
Minivet
Orange R C
Small R C
Munia
Scaly breasted R C
White rumped R O
Avadavat, red R O
Myna
Common R C
Jungle R O
Nightjar
Grey R O
Jungle R O
Oriole
Black hooded R C
Black napped M Rare
Eurasian golden M C
Owlet/Owl
Jungle barred R C
Spotted R O
Parakeet
Alexandrine R C
Plum-headed R C
Rose ringed R C
Vernal hanging (Lorikeet) LM Rare
Grey fronted R C
Blue Rock R C
Yellow footed Green R O
Pipit
Tree
Pitta
Indian Pitta R O
Redstart
Black M Rare
Robin
Indian R C
Oriental Magpie R C
Roller

Indian M Rare
Sandpiper
Common M O
Green M O
Shama
White rumped R C
Shrike
Long tailed/ backed M C
Common hood R C
Black headed BM O
Large grey R O
Sparrow
Chestnut – shoulder R C
Sparrow house R C
Starling
Asian pied R O
Chest nut tailed M O
Sunbird
Crimpson R O
Crimpson-backed R C
Loten’s R O
Purple R C
Purple rumped R C
Swallow
Barn M C
Red Rumped R O
Swift
Asian Palm R C
House LM O
Tailor Bird
Common R C
Thrush
Blue Rock M Rare
Blue capped rock M Rare
Malabbar whistling R C
Orange headed R C
Tree Pie
Rufous R C
Wagtail
Forest M O
Grey M O
Booted M C
Greenish M C
Sulpher bellied M O
Water Hen

White breasted R C
Weaver
Baya R C
Wood pecker
Brown capped Pigmy R C
Heart spotted R O
Rufus R C
White napped R Rare
Yellow crowed R O
Annexure-XVIII


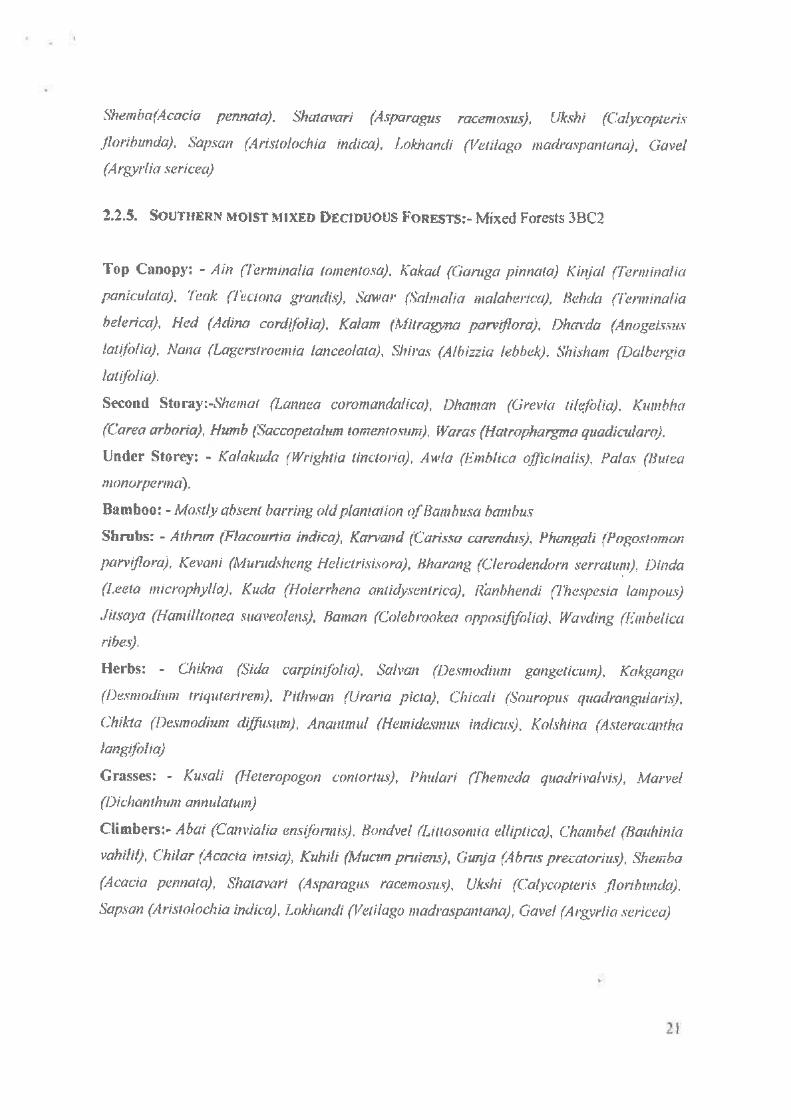


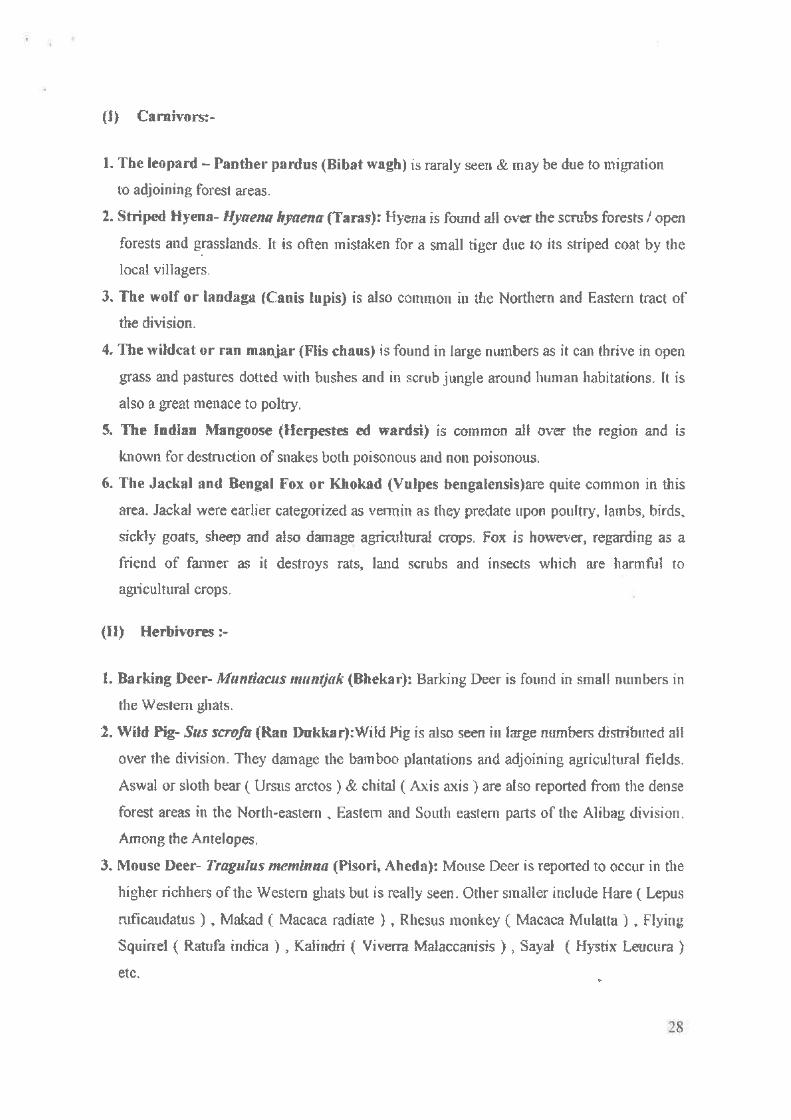

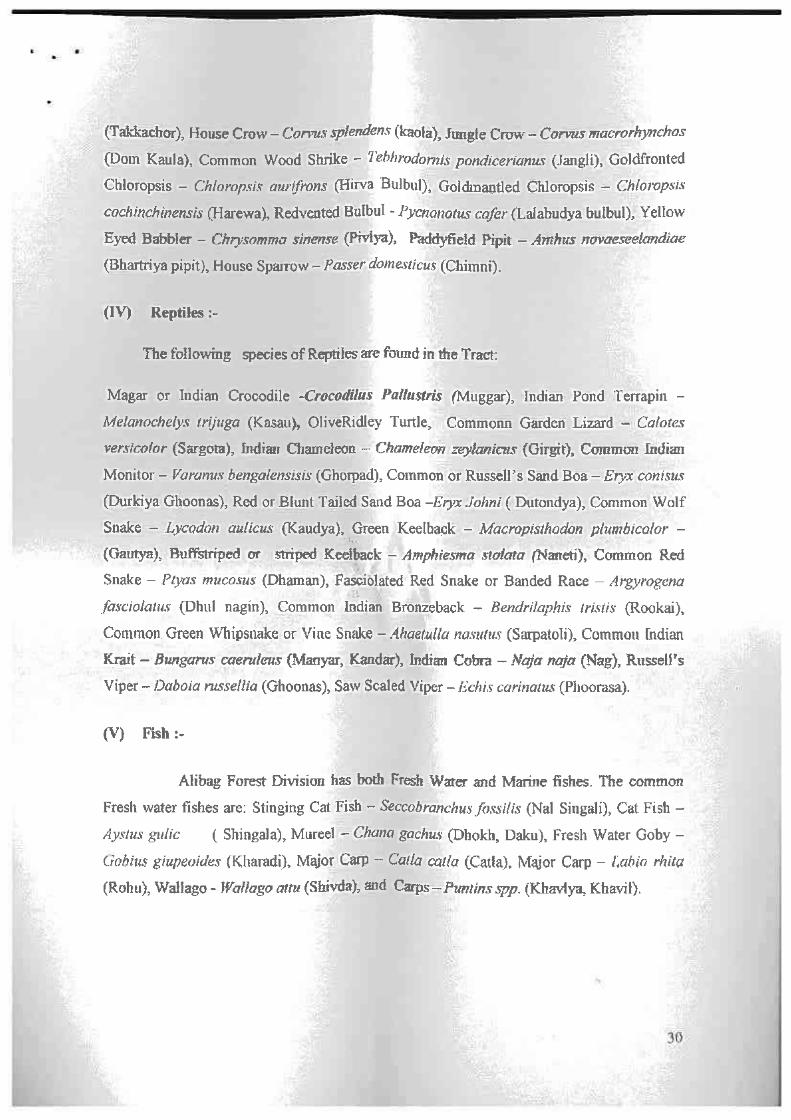


Annexure-XIX


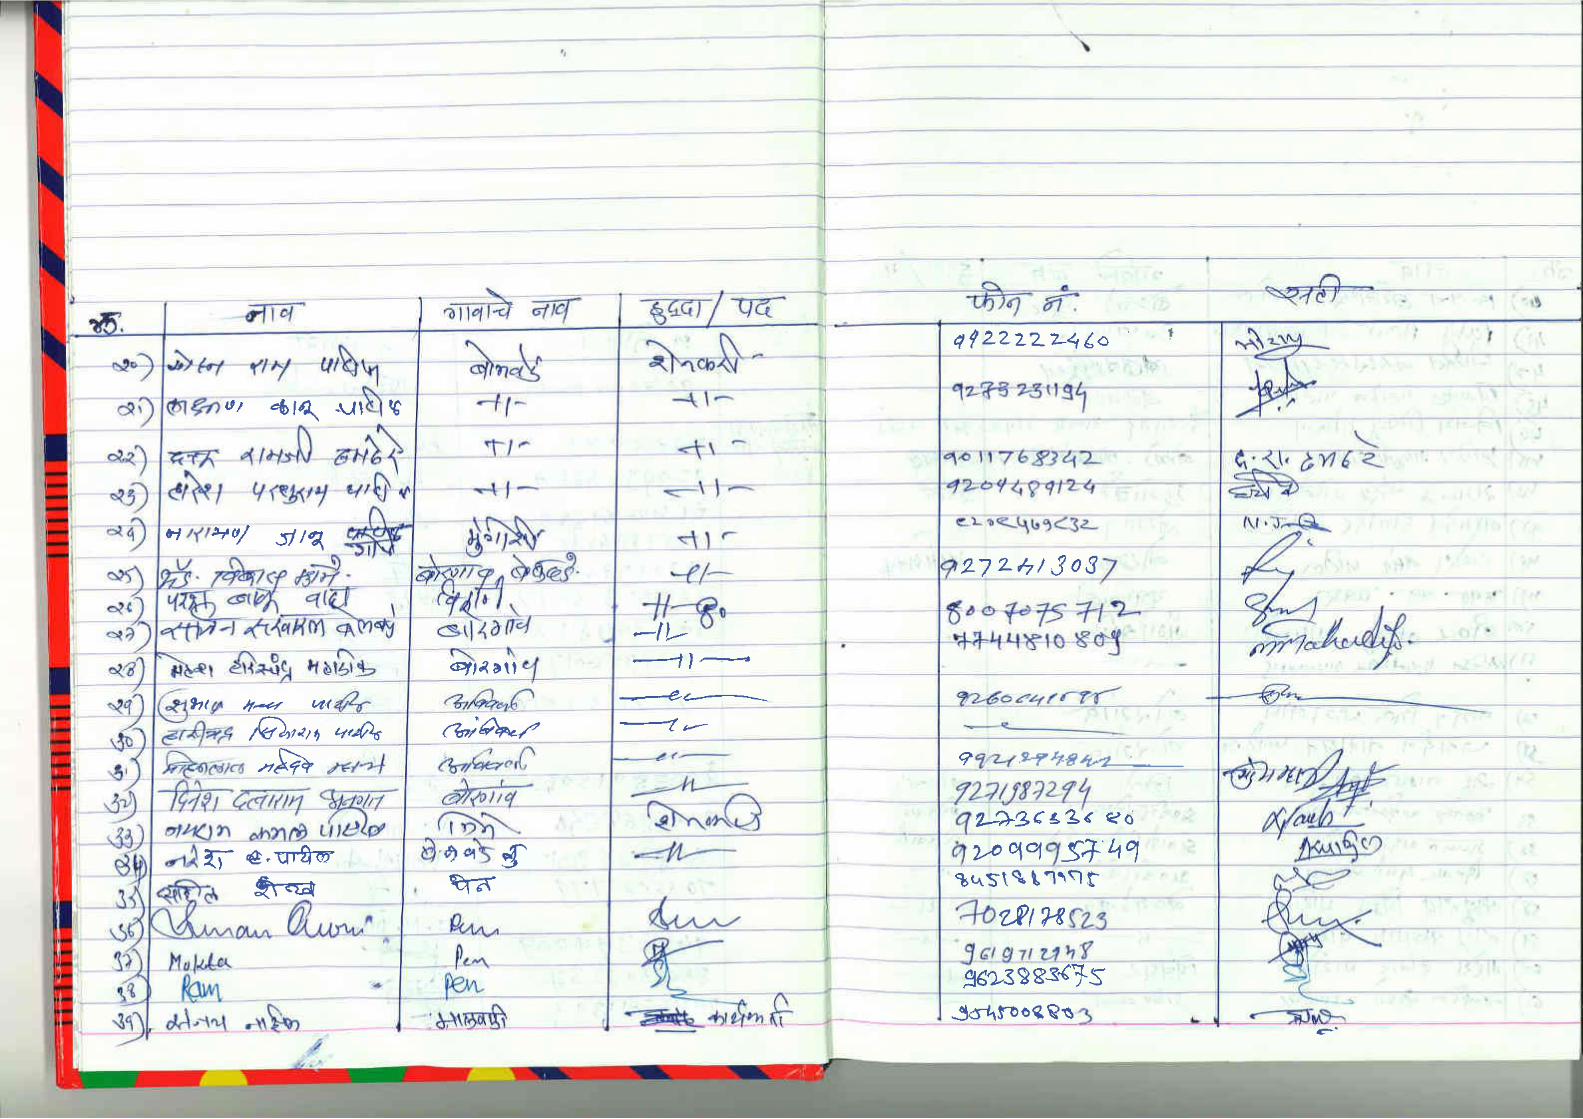


Annexure-XX

1
Risk Assessment
and
Disaster Management Plan
For
Proposed Integrated Industrial Township
“Orange Smart City”, Taluka Pen, District Raigad

RADMP July 2018
2
TABLE OF CONTENT
1 INTRODUCTION ............................................................................................................. 3
2 RISK ASSESSMENT ........................................................................................................ 3
2.1 Hazard Identification ................................................................................................... 3
2.2 Risk Evaluation ......................................................................................................... 11
3 PREVENTIVE MEASURES........................................................................................... 13
3.1 Safety Inspection ....................................................................................................... 13
3.2 Approved Plan ........................................................................................................... 13
3.3 Maintenance of Equipment And Systems ................................................................. 13
3.4 Precautions and Preparedness During Construction Phase ....................................... 14
3.5 Preparedness .............................................................................................................. 17
4 ON-SITE DISASTER MANAGEMENT PLAN............................................................. 21
4.1 Disaster Management Organization .......................................................................... 21
4.2 List of DMP Resources Proposed ............................................................................. 22
4.3 Emergency Response Guide...................................................................................... 23
4.4 Rescue and Relief Operation ..................................................................................... 24
4.5 Requisition of Off-Site Services/ Assistance ............................................................ 24
5 OFF-SITE DISASTER MANAGEMENT ...................................................................... 25
5.1 Pre-Disaster Phase ..................................................................................................... 25
5.2 Impact Phase ............................................................................................................. 25
5.3 Recovery Phase ......................................................................................................... 26
5.4 Disaster Management Cycle...................................................................................... 26
5.5 Mitigation Measures .................................................................................................. 26
5.6 Warning System ........................................................................................................ 27
5.7 Role & Responsibilities ............................................................................................. 27
LIST OF FIGURES
Figure 4-1: Structure of Onsite Disaster Management Cell..................................................... 22
LIST OF TABLES
Table 2-1: Potential Natural Hazards ......................................................................................... 3
Table 2-2: Potential Manmade Hazards ..................................................................................... 4
Table 2-3: Identification of Hazards during Operation Phase ................................................. 10
Table 2-4: Likelihood of Event Occurring............................................................................... 11
Table 2-5: Likelihood Analysis for Project Specific Disasters ................................................ 11
Table 2-6: Consequence Level of Event Occurring ................................................................. 11
Table 2-7: Consequence Analysis for Project Specific Disasters ............................................ 12
Table 2-8: Risk Level Matrix ................................................................................................... 12
Table 2-9: Determination of Project Specific Risk Level ........................................................ 12
Table 2-10: Action Plan for Risk Level ................................................................................... 13
Table 2-11: Determination of Project Specific Risk Control Actions ..................................... 13
Table 5-1: Nodal agencies for early warning of different natural hazards .............................. 27

RADMP July 2018
3
1 INTRODUCTION
This report is prepared to identify the risks associated with the proposed project activities,
evaluate the same, propose the risk prevention and mitigation measures and delineation of on-
site and off-site disaster management plan. In this report, the various components and the
related activities are considered to identify the potential sources of hazard during operation
phase of the project. However, these hazards are generic in nature as the individual capacity of
industries and the extent of the operations envisaged within the project are not known at this
point of time. Hence individual industries and developers need to formulate the specific Risk
Assessment and Disaster Management Plan in line with the specific requirements, relevant
statutes and regulatory framework.
2 RISK ASSESSMENT
Risk assessment is the process to:
o Identify hazards.
o Analyse or evaluate the risk associated with that hazard.
o Determine appropriate ways to eliminate or control the hazard.
In practical terms, a risk assessment is a thorough look to identify those things, situations,
processes, etc. that may cause harm, particularly to people. After identification is made, there
are need to evaluate how likely and severe the risk is, and then decide what measures should
be in place to effectively prevent or control the harm from happening.
2.1 Hazard Identification
A hazard is the potential for harm (physical or mental). In practical terms, a hazard often is
associated with a condition or activity that, if left uncontrolled, can result in an injury or illness.
Identifying hazards and eliminating or controlling them as early as possible will help prevent
injuries and illnesses.
Hazard identification is a process used to identify possible situations where people may be
exposed to injury, illness or disease, the type of injury or illness that may result from these and
the way in which work is organized and managed.
The proposed project consist of following component.
1. Industrial
2. Residential
3. Commercial
4. Open Space& Undevelopable area
2.1.1 Natural Hazard
The following natural hazards are identified for the project area:
Table 2-1: Potential Natural Hazards
S.N Disasters Vulnerability
Yes/No
Reason
A Natural Disasters
1 Flood Yes The T3 site is prone to flooding in peak rains.

RADMP July 2018
4
2 Earthquake Yes Project site located in Seismic Zone IV as per the
Seismic Zoning Map of India. This is a ‘High damage
Risk Zone’ and has the potential to give effects of MSK
VIII scale.
3 Cyclone Yes The proposed project site is in Pen, Raigad, District
and as per NDMA report, Raigad region comes under
Moderate damage risk zone – A (Vb = 44 m/s)
Therefore, the Proposed project has a moderate risk to
Cyclones.
4 Landslide Yes Due to nature of site slope in T1
2.1.2 Manmade Hazard
The following key potential manmade hazards are associated with proposed project activities:
Table 2-2: Potential Manmade Hazards
S.N. Disasters Vulnerability
Yes/No
Reason
1 Physical Hazard Yes Due to industrial workplace activities
2 Fire/Explosion/Toxic
Release
Yes Due to use of fuel, chemicals, gas etc.
3 Building Collapse Yes Due to non-conformity with the design
4 Vehicle Mishap Yes The proposed project will help in handling and
transport of personnel, raw material and finished
products
The various manmade hazards during construction and operation phase are identified in
following sections.
2.1.2.1 Construction Phase
One of the most hazardous and accident-prone working environments is the construction site.
Everyday construction workers are exposed to excessive construction site dangers that could
result in injury or even death. The most frequent hazards/risks in the construction industry fall
into two main categories:
a) hazards/risks that may cause occupational accidents, sometimes fatal, immediately or soon
after they occur;
b) hazards/risks that may cause occupational illness, sometimes also fatal, in the medium or
long term (from a few hours to many years later).
The leading accident hazards/risks on the construction site are:
i) Physical hazards
Falls from height (from unguarded floors, platforms, scaffoldings, roofs, etc.);
Caught in/between (malfunction of machinery, etc.);
Excavation related accidents;
Cave in (malfunction of the shoring system, sloping missing in excavations, etc.);
Electrocution (by contact with power lines, power tools, etc.); and

RADMP July 2018
5
Struck by (falling objects, etc.);
Fire/Explosion;
Failure of temporary structures;
Others (Slipping on the same level, oxygen deficiency in confined spaces, lightning
strike etc.)
ii) Chemical Hazards
Hazards arising due to exposure to dangerous substances/chemicals.
iii) Health Hazards
The leading occupational illnesses hazards/risks on the construction site are:
Back injuries (from carrying heavy loads, working in inappropriate positions, etc.);
Respiratory diseases (from inhaling dust, fumes, etc.);
Musculoskeletal disorders (from sprains and strains of the muscles, injuries affecting
the hand and wrist, the shoulders, neck and upper back, the knees, etc.);
Hearing losses (from long time exposure to noise); and
Skin diseases (manipulation of dangerous materials, exposure to the ultraviolet rays).
iv) Hazards arising due to hazardous/dangerous activities
1. Excavation works
Excavations are of three types:
Trenches;
wide excavations
Pits/shafts (for pad and pile foundations)
They expose workers to similar hazards and accidents. Accidents in excavation works occur in
one of the following ways
a. Collapse of sides / cave-in:
Cave-in is perhaps the most feared and chief cause of accidents in excavation works. It buries
workers and/or cause crushing injuries to survivors.
b. Contact with necessities:
Works in excavations often encounter obstructions from intersecting utilities lines, if any, that
may cause injuries and/or fatalities to workers by:
Electrocution and/or explosion when electrical cables are damaged;
Collapse of excavation due to flooding led by damage to water lines and/or sewer lines;
and
Drowning in floods from damaged water/sewer lines
c. Dangerous atmospheres:
Dangerous atmospheres in excavations may result from oxygen deficiency as well as the
presence of carbon dioxide, carbon monoxide, nitrous fumes and methane gas, which suffocate
workers, kill or cause respiratory problems.

RADMP July 2018
6
d. Workers being struck by falling materials/objects from top.
e. Workers falling into excavations.
Excavation-related accidents and identified five hazard rating variables for excavation works,
viz:
Excavation configuration (depth, width and length);
Geological condition (soil type and water table);
Presence of underground utilities (electrical, water and sewer lines)
Nearby vehicular traffic (vibration and surcharge load); and
Nearby structures.
2. Scaffolding and ladder works;
Scaffolding is the most common way of providing platforms to works at heights. The following
hazards are associated with scaffold use:
Workers falling from the working platform;
Workers below the working platform being struck by materials falling from it; and
The scaffold or part of it collapsing and throwing workers off with the collapsed
structure and crushing workers under it or nearby.
Access to scaffolds is provided by ladders. Also, ladders themselves are often used as working
platforms for the performance of light works. Many serious accidents result from the misuse
of ladders because:
(1) Ladders slip when users are climbing or working from them;
(2) Users slip or miss their footing while climbing;
(3) Users overbalance when carrying materials or tools; and
(4) When defective ladders are used, they fracture under the weight of the user.
Two key risk factors in scaffolding and ladder-related accidents:
Design factors - height of the scaffold/ladder; suitability of the type for the task and
height; and adequacy of design (member size, bracing, guardrails, platform size, and
toe board).
Work environment and conditions – defects in the members of the scaffold/ladder;
slippery condition on the platform; loading of materials and workers on the platform;
and the nature of the platform the scaffold/ladder is rested on.
4. Workers being struck by falling materials/objects from top.
5. Workers falling into excavations.
3. Falseworks (temporary structures);
A falsework is defined as a temporary structure used to support a permanent structure during
its construction and until it becomes self-supporting. Falseworks may be required to support
in-situ and pre-cast concrete construction, masonry arches as well as timber and steel
frameworks. Accidents in falseworks occur by two means:

RADMP July 2018
7
Total or partial collapse of falseworks leading to workers being thrown off or falling
off from their place of work; and
Other than the collapse of falseworks, workers slip and fall from falseworks through
unprotected edges and holes of decking, and access ladders.
Two causes for falseworks collapses:
Inadequate design – deficiency in falsework design is caused by:
(1) Failure to correctly estimate the type and extent of loading;
(2) Inadequate foundation;
(3) Incorrect choice or use of materials; and/or
(4) Lack of provision for lateral stability.
Poor assembly – caused by the failure to inspect the materials (such as struts, planks, etc.), the
soil condition at the foundation and the falsework erection
4. Roof works
Falls from roofs constitute the leading cause for work-related fall fatalities. The injuries caused
by falls from roofs are typically extremely severe, requiring long periods of treatment and
recovery and resulting in substantial medical costs (observed a higher proportion of roofing
accidents during maintenance). These include roof edge falls, falls through fragile roofing
materials and falls from the internal structure of roofs.
5. Erection of structural frameworks
The most serious accidents that occur during the erection and assembly of structural steel or
pre-cast frameworks are:
Erectors falling from heights when at their places of work, going to or returning from
them;
The collapse of the whole or part of the framework causing workers to fall or striking
those at lower levels; and
Workers at lower levels being struck by tools or materials falling or being thrown down.
The hazard level in erection works is dictated by the following variables:
Height and size of the structure/erection;
Design and erection method; and
Provision of a safe workplace such as safe access/egress, safe working platform at
heights, safe tools containers and safety equipment (safety belt, harness, net, etc.).
6. Crane use
Hazards associated with the use of cranes are:
Overturning of a crane or the structural failure of its parts
Dropping of the suspended load
Electrocution
Trapping of people
Accidents during erection and dismantling as well as loading and unloading.

RADMP July 2018
8
7. Construction machinery and tools usage
The types of machinery involved in accidents include excavators and shovels, earthmoving
equipment (i.e. crawler tractors and bulldozers, scrapers and graders), dumpers and dump
trucks, forklift trucks, road rollers and Lorries. Accidents in construction machinery usage
occur in one of the following modes
Workers being run-over or struck by machinery moving forward or reversing
Collision between machinery or with fixed objects such as falseworks or scaffoldings;
Overturning of machinery while in operation; and
Workers falling from machinery.
These accidents are caused by the following major factors:
Failure of machinery- inoperative back-up alarms, brake failures
Inadequate site planning resulting in poor visibility, inadequate manoeuvre space
Inadequate signboards and poor site traffic control;
Lack of supervision and training of workers and operators; and
Use of construction tools cause injuries and fatalities to workers by the following ways
Eye injuries caused by foreign objects getting into eyes by operations such as grinding,
welding, cutting, drilling and breaking
Finger/hand injuries by cut and burns
Injuries caused by moving/broken machine parts
Electrocution
Vibration from powered hand-held tools, causing a group of diseases. One of them is
blood circulation disturbance known as “vibration white finger”. Most of the hazards are the result of faulty tools and/or unsafe handling of tools. Moreover, the
type of tools and duration of use also dictate the hazard.
8. Welding and cutting works
Welding and cutting works on construction sites expose workers to both injury and health
hazards. Injury hazards due to welding and cutting are:
Fire or explosion due to extreme temperatures (up to 10,000° F) from welding sparks
coming into contact with flammable materials (e.g. coatings of metals, gasoline, oil,
paint, thinner, wood, cardboard, paper, acetylene, hydrogen, etc.)
Electric shock from excess moisture (e.g. perspiration or wet conditions) and contact
with metal parts which are "electrically hot"
Injuries due to flying sparks, particles of hot metals, molten metals, liquid chemicals,
acids or caustic liquids, or chemical gases or vapours
Falls during work on ladders, above ground and in confined spaces.
Health hazards due to welding works are:
Exposure to high noise levels from welding equipment, power sources and processes;

RADMP July 2018
9
Exposure to ultraviolet (UV) radiation resulting in skin burns and skin cancer.
"Welder's flash" (brief exposure to UV radiation) may result in temporary swelling and
fluid excretion of the eyes or temporary blindness
Irritation of lungs due to heat and UV radiation
Exposure to fumes and chemical substances
The level of hazard in welding and cutting works depends on the following variables:
The volume of work
Location of welding and cutting (confined space, underground, on ladders, etc.
The use of safety protective equipment
Housekeeping
10. Works in confined spaces
The term “confined space” refers to a space, which by design has limited openings for entry and exit, unfavorable natural ventilation that could contain or produce dangerous air
contaminants and is not intended for continuous employee occupancy. Confined spaces include
tanks, process vessels, pits, silos, pipelines, manholes, box girders and columns. Workers are
required to enter confined spaces for tasks such as repair, inspection and maintenance, and are
often exposed to multiple hazards. Fatal injuries that occur in confined spaces are most likely
to be from atmospheric hazards. The types of atmospheric hazards in confined spaces can be
quite varied – some examples are shown in Table below:
The exact nature of construction activity, the components involve & the type of structure
proposed are not available in details at this stage. Therefore, it is recommended that the
construction contractors refer this document as a guidance and prepare an activity specific plan
for safety & disaster management.

RADMP July 2018
10
2.1.2.2 Operations Phase
In this section, the various components and the related activities are considered to identify the
potential sources of hazard during operation phase of the project. However, these hazards are
generic in nature as the individual capacity of industries and the extent of the operations
envisaged within the project are not known at this point of time. Hence individual industries
and developers need to formulate the specific Risk Assessment and Disaster Management Plan
in line with the specific requirements, relevant statutes and regulatory framework.
The various hazards anticipated due to operation of various project components, utilities,
facilities etc. during the operation phase are as under:
The following disasters may occur at the project site as depicted in Table: 2.5.
Table 2-3: Identification of Hazards during Operation Phase
Sr. No Component Hazard
1. LPG release Fire /explosion
2. Diesel spill at DG set Fire /explosion
3. AC, refrigerators Units Fire /explosion
4. Vehicles Accident/Fire /explosion
/toxic / flammable gas
release
5. Transformer Fire /explosion
6. E – waste Fire/ toxic release
7. Break Electrical Wires Fire/Shock
8. Hazardous Waste Toxic, corrosive
9. Storage Area Chemicals, fuels, hazardous waste
etc.
Toxic, corrosive, Fire &
Accident
16 Hospital Equipment
Toxic, corrosive, Fire &
Accident
17 Patient
handling
ambulatory (outpatients) panic, chaos, hazard
evacuation, avoidable
injuries and loss of lives
admitted patients (inpatients) panic, chaos, hazard
evacuation, avoidable
injuries and loss of lives
18 Vehicle mishaps Fire /explosion /toxic /
flammable gas release
19 Services and
Utilities
From within and from
outside to inside the
building (Water supply pipelines,
Electricity cables & wires, Gas
pipelines, Sewage pipelines,
Telecommunication wires,
Rainwater drain pipes, Elevators,
Air-conditioning ducts)
Fire /explosion /toxic
19 Building
Structure
Improper planning, design,
construction and maintenance
Structural failure, Fire &
Accident

RADMP July 2018
11
2.2 Risk Evaluation
The next step in the disaster management cycle is assessment of risk level of probable disasters
to understand their vulnerability potential. This analysis helps further to formulate a project
specific ‘Disaster Management Plan’. This section describes the risk level associated with the identified 5 disasters in operation phase.
The risk level is calculated by referring ‘ASSA: OHS, T.4F4- Risk Level Calculators’ version 7.0 issued in 01/2012’ document.
STEP 1: Consider how likely a risk is encountered and what might happen (Likelihood
- L)
STEP 2: Use the risk level calculator to determine the likely risk level to persons who
may be exposed to the hazards (Consequences - C)
STEP 3: Determination of Risk Level outcome
STEP 4: Identify & develop effective control measure
The risk level of identified 5 events is explained in detail below:
STEP 1: LIKELIHOOD ANALYSIS
Table 2-4: Likelihood of Event Occurring
Likelihood of event occurring
Almost Certain Event is expected to occur in most circumstances
Likely Event will probably occur in most circumstances
Possible Event might occur at some time
Unlikely Event could occur at some time
Rare Event may occur only in exceptional circumstances
Table 2-5: Likelihood Analysis for Project Specific Disasters
Project Specific Disasters Likelihood
Flood likely
Earthquake Unlikely
Cyclone Rare
Landslide Unlikely
Physical Hazards likely
Fire/explosion/toxic release likely
Building Collapse Rare
Vehicle Mishap likely
STEP 2: CONSEQUENCES ANALYSIS
Table 2-6: Consequence Level of Event Occurring
Level of Consequences
Catastrophic (C) Fatality or permanent disability; toxic release of chemicals, long-term
environmental impact; loss of facilities; very high financial loss
High (H) Long-term illness or serious injury; serious medium-term
environmental effects; major property damage; loss of production; high
financial loss

RADMP July 2018
12
Moderate (M) Medical treatment requiring up to several days off work; spillage
contained with outside assistance; significant property damage; med –
high financial loss,
Low (L) Minor injury requiring First-Aid; spillage contained on site; moderate
property damage; low-med. financial loss
Insignificant (I) No injuries; minor property or environmental damage; very low
financial loss
Table 2-7: Consequence Analysis for Project Specific Disasters
Project Specific Disasters Level of Consequences
Flood Moderate
Earthquake Moderate
Cyclone Low
Landslide Low
Physical Hazards Moderate
Fire Moderate
Building Collapse Low
Vehicle Mishap Moderate
STEP 3: DETERMINATION OF RISK LEVEL OUTCOME
Table 2-8: Risk Level Matrix
Likelihood
Consequences
Risk Level Outcome
Almost Certain Likely Possible Unlikely Rare
Catastrophic (I) E E E E H
High (H) E E E H M
Moderate/Medium (M) E H M M L
Low (L) H H M M L
Insignificant (I) H M L L L
Where, E – Extreme; H- High; M – Medium; L- Low;
Based on the results obtained for project specific disaster’s likelihood & consequences, their risk level is determined as below:
Table 2-9: Determination of Project Specific Risk Level
Sr.
No.
Project Specific Disaster Likelihood Consequence Risk Level
1) Flood likely Moderate H (High)
2) Earthquake Unlikely Moderate M (Medium)
3) Cyclone Rare Low L (Low)
4) Landslide Unlikely Low M (Medium)
5) Physical Hazards likely Moderate H(High)
6) Fire likely Moderate H (High)
7) Building Collapse Rare Low L (Low)
8) Vehicle Mishap likely Moderate H (High)

RADMP July 2018
13
STEP 4: IDENTIFY & DEVELOP EFFECTIVE CONTROL MEASURE
This step describes the type of actions required to control the measured risk.
Table 2-10: Action Plan for Risk Level
Sr.
No.
Risk Level outcome
(from matrix)
Action Required
1 E – Extreme URGENT - Immediate action required to control risk
2 H- High Highest management decision required urgently
3 M- Medium Follow management instructions regarding risk
4 L- Low These risks may not require immediate attention -
monitor
The determination of risk control actions with respect to project specific disasters are given
below:
Table 2-11: Determination of Project Specific Risk Control Actions
Sr.
No.
Hazard Risk Level outcome (from
matrix)
Action Required
1 Flood H (High) Highest management decision
required urgently
2 Earthquake M (Medium) Follow management instructions
regarding risk
3 Cyclone L (Low) These risks may not require
immediate attention - monitor
4 Landslide M (Medium) Follow management instructions
regarding risk
5 Physical
Hazards
H(High) Highest management decision
required urgently
6 Fire H (High) Highest management decision
required urgently
7 Building
Collapse
L (Low) These risks may not require
immediate attention - monitor
8 Vehicle
Mishap
H (High) Highest management decision
required urgently
3 PREVENTIVE MEASURES
3.1 Safety Inspection
Regular inspection of equipment and systems mandated by Chief Fire Officer in the NOC
granted.
3.2 Approved Plan
i) Scrupulous adherence to approved plan of buildings, Commercial & industrial units
ii) Protection of system put in place to handle disaster.
3.3 Maintenance of Equipment And Systems
Preventive maintenance of following systems
Fire hydrant system.

RADMP July 2018
14
Sprinkler system.
Ventilator
Boyles Apparatus
Bedside Monitors
Colour Doppler
Endoscopes
Phototherapy unit
Operating Microscope
Detectors calibration.
CCTV system.
Emergency power system.
Rescue equipment.
Emergency communication systems
Industrial Equipment
Any other equipment as deemed necessary
3.4 Precautions and Preparedness During Construction Phase
1. Flood Proposed project will have proper drainage network. Storm water
drainage plan is attached as Annexure.
To provide emergency management training for workers & staff
Preparedness of Evacuation of Plan
Dewatering pump
Life jackets, Floats,
Ring buoys.
Counter Plan showing catchment areas
2. Earthquake New seismic design/methods/techniques will improve the
structural stability of the Building / Unit which will help to
reduce damage.
To provide emergency management training for workers & staff
Preparedness of Evacuation of Plan
3. Cyclone New seismic design/methods/techniques will improve the
structural stability of the Building which will help to reduce
damage.
To provide emergency management training for workers & staff
Preparedness of Evacuation of Plan
Lightening arrestors ( during construction phase also )
4. Landslide To provide emergency management training for Occupant,
workers & staff
Preparedness of Evacuation of Plan
Slope stability and landslide prevention measures (such as
plantation etc.)

RADMP July 2018
15
5. Physical Hazard To provide emergency management training for Occupant,
workers & staff
Work inspection should be carried out
SOP should be prepared and followed
Housekeeping should be carried out in construction & operation
phase
Proper personal protective equipment should be used.
6. Fire Fire detection and alarm at fire Control room system, Automatic
Smoke detector system especially at electric meter room,
Automatic Water sprinkler system with Thermal Detector. CCTV
security system, Sprinkler System.
Fire water Underground storage tank, Fire water pumps, Portable
Fire extinguishers CO2, DCP, Foam, sand buckets type,
Emergency power DG set, Mechanical Ventilation system, Two
hrs. Fire Resistant Doors.
To provide emergency management training for workers & staff
Hazardous material kept away from worker & staff during
construction & operation phase
Proper personal protective equipment should be used.
7. Building Structure New seismic design/methods/techniques will improve the
structural stability of the Building / Unit which will help to
reduce damage.
To provide emergency management training for Occupant,
workers & staff
Preparedness of Evacuation of Plan
8. Vehicle Mishap Provide adequate signs and signages
Signs at lift landings,
Floor numbering signs,
Stair and elevator identification signs,
Exit signs at each exit door, Stair re-entry signs,
Floor layout plans,
Escape route direction signs.
Escape route near each change of direction in the route,
Install safety mirrors to aid visibility in conflict points
Provide speed humps to regulate speed of vehicles
Exit signs
Escape route direction signs.
Escape route near each change of direction in the route
Emergency Control Centre (ECC) and First aid
Assembly point, Emergency Control Centre (ECC) and First aid,
Danger sign at electrical rooms.
9. Improper Patient
handling in the
hospital
Hazards and Risks: In and around the hospital through
prominently displayed posters, wall hangings and hoardings. The
posters, wall hangings and hoardings shall be permanent and
displayed at all times in the hospital premises and shall be updated
as necessary.
Emergency Exit Routes and Evacuation Plans: to be followed
during disasters through the prominent display of exit and

RADMP July 2018
16
evacuation route maps at strategic locations throughout the hospital
premises. Hospitals shall also ensure that their alarms, emergency
communication and Hospital Safety and Security Procedures,
adequately take into consideration the needs of patients, their
attendants and visitors; and ensure that no panic and chaos is
initiated.
10. Construction
Activities Environment, Health & Safety Policy communication to all the
employees & workmen through display boards, Posters, EHS
Meetings & Pep Talk & etc.
Appointment of OHSAS certified contactor
Implementation of OHSAS 18001 during Construction work
Observe “No Smoking" rule
Periodical maintenance of safety construction machinery,
equipment by certified, competent person at regular intervals.
Work Permit Systems.
Use of Proper PPE's like Helmet, Goggles, boot & hand gloves etc.
Use of safety nets while working from heights, use of life line
Safety trainings/ safety checks/ and use of PPE
Proper storage and handling of any potentially hazardous
chemicals, gases.
Educating / Training of all concerned on adoption of safe practices
at construction site.
Documentation, investigation of every dangerous occurrence and
required notifications and reports to the appropriate authorities.
11. Emergency
Evacuation
Ensure effective emergency communication during evacuation to
avoid panic and stampede. Siren / bell with clearly defined
emergency alarm code for fire, evacuation and all clear. Intercoms &
Cell phones, Two way radio, Hand held loud speaker.
In order to reduce the evacuation time other than movement period
Periodic Safety Awareness programs are suggested for effective and
timely evacuation.
12. Search & Rescue
Kit
Torch with battery,
Whistles,
Ropes-Nylon (800 m) ,
Ladder
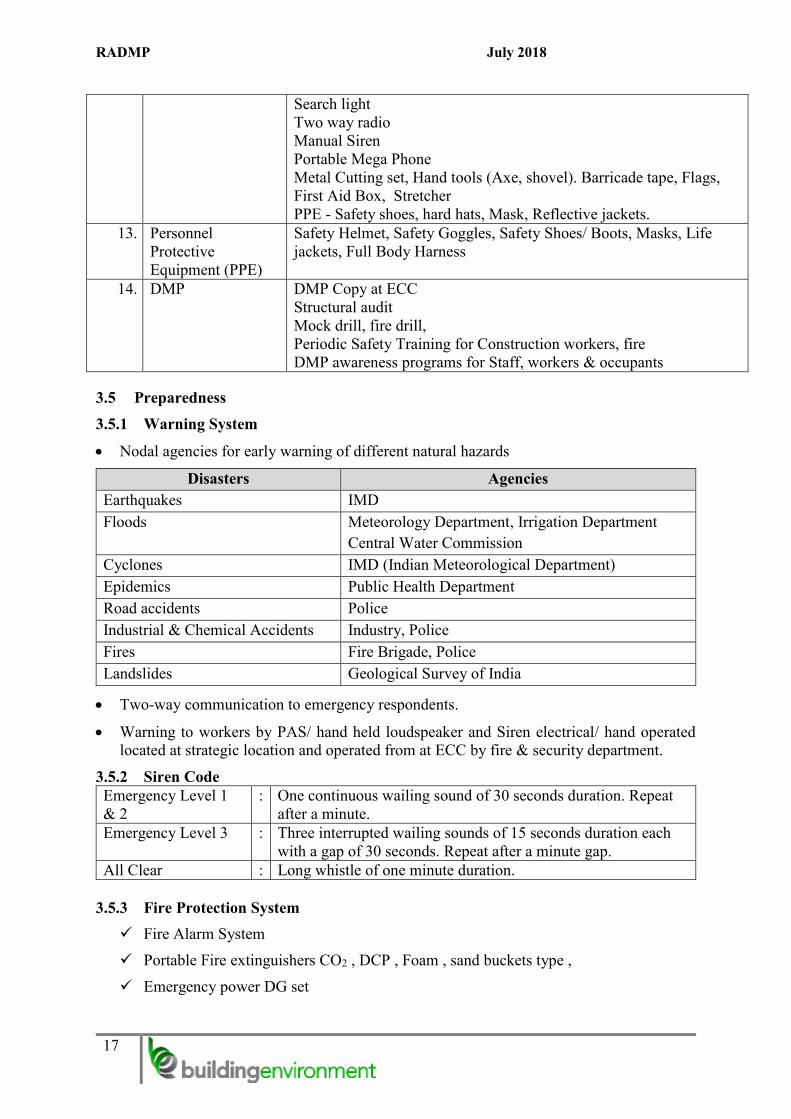
RADMP July 2018
17
Search light
Two way radio
Manual Siren
Portable Mega Phone
Metal Cutting set, Hand tools (Axe, shovel). Barricade tape, Flags,
First Aid Box, Stretcher
PPE - Safety shoes, hard hats, Mask, Reflective jackets.
13. Personnel
Protective
Equipment (PPE)
Safety Helmet, Safety Goggles, Safety Shoes/ Boots, Masks, Life
jackets, Full Body Harness
14. DMP DMP Copy at ECC
Structural audit
Mock drill, fire drill,
Periodic Safety Training for Construction workers, fire
DMP awareness programs for Staff, workers & occupants
3.5 Preparedness
3.5.1 Warning System
Nodal agencies for early warning of different natural hazards
Disasters Agencies
Earthquakes IMD
Floods Meteorology Department, Irrigation Department
Central Water Commission
Cyclones IMD (Indian Meteorological Department)
Epidemics Public Health Department
Road accidents Police
Industrial & Chemical Accidents Industry, Police
Fires Fire Brigade, Police
Landslides Geological Survey of India
Two-way communication to emergency respondents.
Warning to workers by PAS/ hand held loudspeaker and Siren electrical/ hand operated
located at strategic location and operated from at ECC by fire & security department.
3.5.2 Siren Code
Emergency Level 1
& 2
: One continuous wailing sound of 30 seconds duration. Repeat
after a minute.
Emergency Level 3 : Three interrupted wailing sounds of 15 seconds duration each
with a gap of 30 seconds. Repeat after a minute gap.
All Clear : Long whistle of one minute duration.
3.5.3 Fire Protection System
Fire Alarm System
Portable Fire extinguishers CO2 , DCP , Foam , sand buckets type ,
Emergency power DG set

RADMP July 2018
18
3.5.4 Emergency Control Centre (ECC)
Emergency Control Center - Construction Phase
Emergency level Construction Phase
Emergency Level 1 Security Office – Construction Contractor
Emergency Level 2 Security Office of OSC
Emergency Level 3 Site Safety Managers Office.
Emergency Control Center - Operation Phase
Emergency Level Operation Phase
Emergency Level 1 Security Office of Individual Units
Emergency Level 2 Security Office of OSC
ECC equipped with following items;
Copy of “DMP” and Technical Manuals on operating, maintenance procedures. Telephone (Internal and External).
Networked Computer Systems, Note pads, pencil etc.
Personal Protective Equipment (PPE). Safety helmets, Safety shoes, Safety goggles,
Reflective jackets, SCBA, Full Body Harness
Public Address System (PAS).
Control panels & layout drawing for CCTV, Fire Alarm, electrical single line diagram.
First aid box, stretcher Hand tools (Axe, shovel), Mega Phone, Manual siren, Ring
buoys, Explosive meter Search light/ torch, Spare Portable fire extinguishers
Uninterruptible Power Supplies with Generators.
3.5.5 Life Saving Measures (Fire Safety Plan)
Evacuation diagram
Assembly point
Site surroundings map

RADMP July 2018
19
3.5.6 Assembly Point
Assembly Point - Construction Phase
Emergency Level Construction Phase
Emergency Level 1 Near Site Office.
Emergency Level 2 Near Site Office.
Emergency Level 3 Near Site Office.
Assembly Point - Operation Phase
Emergency Level Operation Phase
Emergency Level Residential, Industrial & commercial
Emergency Level 1 Outside the respective building/unit
Emergency Level 2 Nearest RG
Guidelines to Reduce Evacuation Time
Measures Proposed Additional Measures Required
Pre Alarm Period
1. Early warning system a) Fire alarm & fire detection system.
b) Signal located at fire Control room.
c) With appropriate zonal indications.
d) Smoke detector system.
e) Auto water sprinkler with Thermal.
f) Detector.
g) LPG /PNG detector system.
h) CCTV system.
2. Watch and ward staff.
1. Automatic smoke detection system shall
be provided in lift machine room and electric
meter room.
2. Trained security staff & fire staff shall be
posted on duty at strategic location around
the clock.
Pre Evacuation Period
1. Communication systems
a) Intercoms & Cell phones.
b) Public address system.
c) Hand held loud speaker.
d) Two way radio.
e) Siren.
1. Periodic Awareness programs.
Movement Period
1. Detailed SOP's for disaster management in
Section 9 of DMP.
2. ECC, Refuge floor, Escape route signage,
enclosed staircases, fire resistance doors,
illumination of escape route, emergency
power supply etc. as per NBC provisions.
1. Mock drill shall be conducted regularly
2. Building / Unit management system
3. Voice evacuation system will be
additional advantage
3.5.7 Decontamination Support
Sources of contamination such as accidental oil spills e.g. Diesel, transformer oil; paint brush
washings during construction phase will be minimized by using mechanical means to contain
& recover the oil & chemical means to disperse or clean it.
RADMP July 2018
20
3.5.8 Special Population Support
Special consideration during evacuation required construction workers at site during
construction phase.
3.5.9 Training
Drills:
These test a single emergency response function and involve an actual field response. Drills
are generally practiced or tested under realistic conditions.
Functional Drill:
This is used to assess the allocation of resources and manpower. It also evaluates the
communication between different groups and assesses the adequacy of current procedures and
policies. The exercise is a simulation and while it covers the complete extent of the deployment
of resources at the simulated level it does not go beyond the exercise room.
Mock Drill/ Full Scale Exercise:
Evaluates the operational capability of the system in an interactive manner, allows for
coordination of information, communication capabilities to be explored, inter-tenant and tenant
landlord cooperation to be explored and for negotiation skills to be deployed. Full scale
exercises will have a number of observers and invitation to the relevant government agency to
attend. Observations will be recorded and actions will be implemented based on learning points
that are discussed at the review session, where necessary.
Note: Real Emergencies during Exercises
There is always the potential for a real emergency to arise during the conduct of a drill. This
situation calls for an immediate cessation of the exercise/drill and Emergency respondents
should stand by for further instructions.
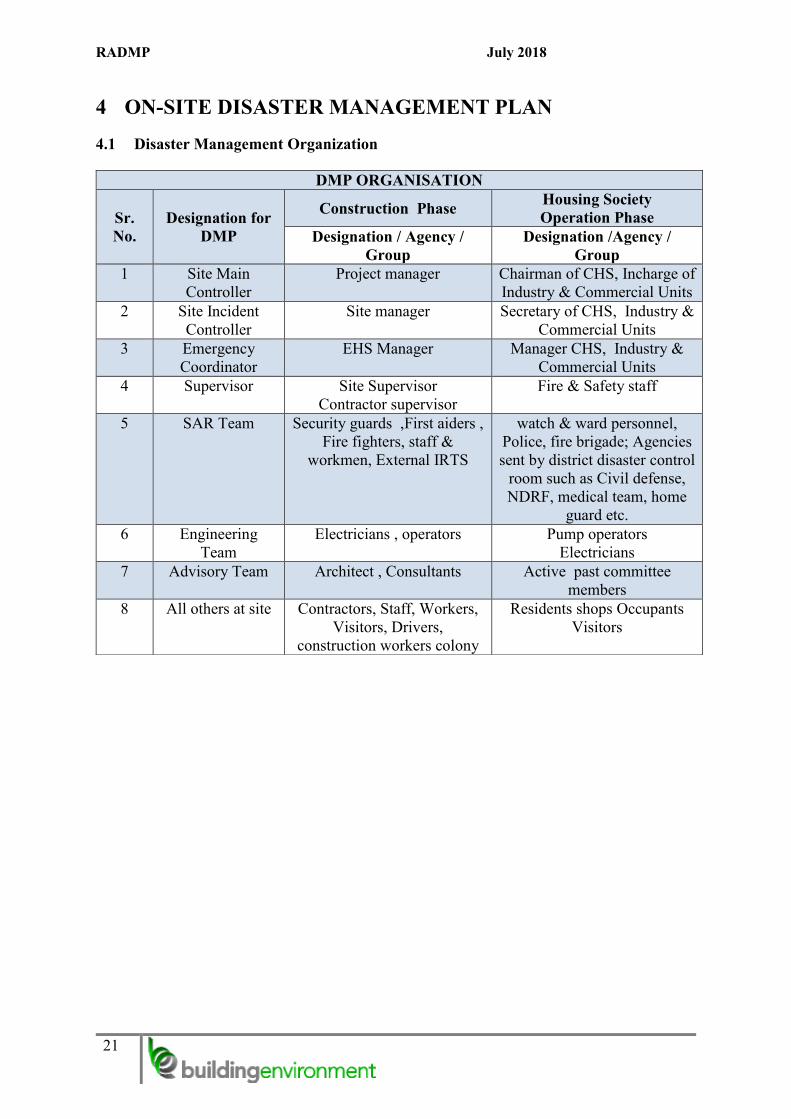
RADMP July 2018
21
4 ON-SITE DISASTER MANAGEMENT PLAN
4.1 Disaster Management Organization
DMP ORGANISATION
Sr.
No.
Designation for
DMP
Construction Phase Housing Society
Operation Phase
Designation / Agency /
Group
Designation /Agency /
Group
1 Site Main
Controller
Project manager Chairman of CHS, Incharge of
Industry & Commercial Units
2 Site Incident
Controller
Site manager Secretary of CHS, Industry &
Commercial Units
3 Emergency
Coordinator
EHS Manager Manager CHS, Industry &
Commercial Units
4 Supervisor Site Supervisor
Contractor supervisor
Fire & Safety staff
5 SAR Team Security guards ,First aiders ,
Fire fighters, staff &
workmen, External IRTS
watch & ward personnel,
Police, fire brigade; Agencies
sent by district disaster control
room such as Civil defense,
NDRF, medical team, home
guard etc.
6 Engineering
Team
Electricians , operators Pump operators
Electricians
7 Advisory Team Architect , Consultants Active past committee
members
8 All others at site Contractors, Staff, Workers,
Visitors, Drivers,
construction workers colony
Residents shops Occupants
Visitors

RADMP July 2018
22
Figure 4-1: Structure of Onsite Disaster Management Cell
4.2 List of DMP Resources Proposed
(Hazard specific infrastructure, equipment and manpower)
Item No Name Description
1. Life Protection
PORTABLE FIRE EXTINGUISHERS.
Carbon Dioxide (CO2) fire extinguisher
ABC Dry Powder fire extinguisher
Foam Type fire extinguisher
Sand Bucket post buckets with sand.
FIRE ALARM SYSTEM
Response Indicator at ECC.
Addressable Fire Alarm Panel.
Emergency Power: DG Set
2. SAR KIT Torch with battery.
Whistles.
Ropes -Nylon (800 m).
Ladder.
Search light.
Two-way radio.
Hand Operating Siren.
Metal Cutting set.
Life jackets.
PPE – Safety Helmet.
PPE – Safety Goggles.
PPE – Safety Shoes/ Boots.
PPE – Reflective jackets.

RADMP July 2018
23
PPE – Masks.
PPE –safety harness ,net
Public Address System (PAS).
Portable Mega Phone.
Barricade tape.
Flags.
Emergency lights in escape route.
First Aid Box.
Stretcher.
3. SIGNAGES layout plans. ,Assembly point., Emergency Control
Centre (ECC). ,First aid.Danger at electrical rooms.
Exit signs at each exit door.
4. Security Watch and ward system
Vehicle checking mirror
Note: The Ministry of Home Affairs, Government of India has developed a web-based
database of resource named India Disaster Resource Network (IRDN). This database contains
information about equipment (such as boats, bulldozers, chain saw, etc), manpower (divers,
swimmers, etc) and critical supplies (oxygen cylinder, firefighting foams, etc) required during
response. It can be accessed by anyone and its direct link is
http://idrn.gov.in/publicaccess/countryquerypublic.asp. One can also access it by clicking on
the Quick link to inventory of disaster response resources on the idrn site (idrn.gov.in);
4.3 Emergency Response Guide
Where the numerical indicate task, number detailed in the following table.
DMP FLOW CHART S.N Task
1 Raising the site emergency alarm.
2 Inform police, Fire brigade and Mobilizing
site emergency services.
3 Determination of level of emergency, help
from Advisory team, if required.
4 Mobilizing ECC and AP.
5 Mobilizing Emergency Respondent teams,
(IRT’s)
6 Mobilize resources for emergency response
teams
7 Ensure Co-ordination between site
emergency services.
8 Review situation, assess the emergency
level, consult advisory team, take external
help if required, inform district disaster
control cell, and declare off site emergency.
9 Evacuation
10 Ensure operations as per SOP
11 Ensure proper coordination between all
IRTs
12 Head count at assembly point
13 Feedback of head count to SAR

RADMP July 2018
24
14 Ensure traffic , law & Order and crowd
control
15 Withdraw the staff if the human life is in
peril.
16 Ensure any conflict resolved at the earliest
17 Authorize release of information to the
media
18 Release of authorized information to the
media.
19 Emergency under control , inform to CSC
20 Authorize to raise ‘All Clear ‘ alarm
21 Raise ‘All Clear ‘ alarm
4.4 Rescue and Relief Operation
The priority of the SAR will be to:
Protect life;
Maintain safety;
Protect assets;
Ensure security; and
Maintain or return business continuity.
4.5 Requisition of Off-Site Services/ Assistance
In case of any situation beyond the scope of On-site Disaster Management Plant, the
Emergency coordinator will establish communication with all the relevant external agencies
for requisition of services/support.
RADMP July 2018
25
5 OFF-SITE DISASTER MANAGEMENT The Offsite Disaster Management Plan is aimed at responding to the disaster and establish
various protocols to minimize the loss of life and property with aid of external agencies
including local, regional or state level support. Different stakeholders from the proposed
development, district administration, public, NGO sector, civil defense, interest groups are
required to play a major role in disaster mitigation. It has been divided into three phases viz
Pre-Disaster Phase, Impact Phase and Recovery Phase.
5.1 Pre-Disaster Phase
Preparedness in "no disaster situation"; in the pre-disaster Phase - prevention, Mitigation and
Preparedness activities are undertaken. The key activities are:-
Formulation/updating of the Disaster Management Plan.
Allocation of responsibilities to the individual respondents / Groups/ Institutions/
Organizations.
Training and capacity building etc.
5.2 Impact Phase
This phase includes relief measures taken immediately after the disaster. The key activities
are:-
Rescue operation/Evacuation by teams (already identified) and providing basic
infrastructure and movement to rescue centers.
Functioning of the Disaster management Control Rooms
To take Coordination with Disaster management stake holders and Control Rooms
such as
- Police control room
- Fire brigade control room
- District disaster management control room
- Civil defence control room
- High way authorities control room
Management of Rescue Shelters
Monitoring Disaster Management by ensuring a line of control through
- Police & Paramilitary forces,
- Civil Defence,
- Fire services, Civilians,
- NGOs etc.
- Administration of Relief.

RADMP July 2018
26
5.3 Recovery Phase
All measures at this stage aim at damage assessment and relief to achieve speedy recovery of
the affected areas and return to normalcy and to mitigate the long-term consequence of the
disaster. The key activities are:-
- Assessment & enumeration of damage.
- Developing a Reconstruction and Rehabilitation plan.
- Monitoring Relief Operation organized by outside agencies/ NGOs/ PSUs/ other states
etc. through District Administration.
- Restoration of Communication- Roads, Railways, Electronic Communication etc.
- Maintenance of Law & Order.
- Provision of Medical facilities, Minimum sanitation, drinking water, food etc. Removal
of debris and disposal of carcasses.
- Coordination with Disaster management Control Rooms and stakeholders to take stock
of the situation.
- Collection of Information and submission of daily situation report to Government
through District Collector.
- Documentation of the entire event - Black & white/ Audio & Video.
5.4 Disaster Management Cycle
Three major functional areas were recognized as necessary components of a comprehensive
approach; prevention, response and recovery. The key responsibilities of agencies include:
Planning
The analysis of requirements and the development of strategies for resource utilization
Preparedness
The establishment of structures, development of systems and testing and evaluation by
organizations of their capacity to perform their allotted roles
Co-ordination
The bringing together of organizations and resources to ensure
5.5 Mitigation Measures
- Provision of Helpline number: The Helpline number shall be displayed at prominent
public places and Panic/ Emergency call points are installed throughout the smart city.
- Call Centre for Residents: Residents can call to Emergency response call center by
means of mobile, landline, installed emergency call points and established two-way audio
communications with Emergency Response Team.
- Helpline Call Center from Command and control center will receive call and providing
response mechanism for safety, security, utility management.

RADMP July 2018
27
- Well trained operators will provide the response solution based on the type of call /
emergency.
- Response team such as police help, fire help, medical help, etc. shall be integrated to
Emergency Response System.
5.6 Warning System
Nodal Agency:
Nodal agencies for early warning of different hazards:
Table 5-1: Nodal agencies for early warning of different natural hazards
Disasters Agencies
Earthquakes IMD, MERI
Floods Meteorology Department, Irrigation Department Central
Water Commission
Cyclones IMD( Indian Meteorological Department)
Epidemics Public Health Department
Road accidents Police
Industrial & Chemical
Accidents
Industry, Police
Fires Fire Brigade, Police
Tsunami Indian National Centre for Oceanic Information Services
(INCOIS) Hyderabad
Landslides Geological Survey of India
5.7 Role & Responsibilities
Police Commissionerate
Maintain law and order
Control crowd
Dispose of corpses
Transport / shift injured persons to hospitals
Transport / shift stranded or affected persons through police and other vehicles
Aid and supplement efforts and activities of all other departments and agencies with
regard to disaster management.
Fire Brigade
Firefighting operations in the affected area
Rescue operations
Transport of injured to the hospitals on a priority
Evacuation of persons from the affected area
Ensure safety from electrical installations or power supply at disaster site
Clearing of roads or pathways due to uprooted trees
Salvage operations

RADMP July 2018
28
Hospital
First-aid to victims of accident and treatment at local level.
Hospitalization and treatment in the case of large scale exposure.
Ensure availability of adequate medicines/equipment.
DETAILS CONTACTS
Pen Fire Station 101
Disaster Management Cell (022)-25331155
Pen Police Station
Police Department Hanuman Ali, Ziral Ali Pen, Maharashtra
402107
02143 252 066
Police Control Room 100
Hospitals & Ambulance
Mahajan Hospital Agri Samaj Rd, Chinchpada Pen, Maharashtra
402107
02143 252 418
Soham Hospital Prem Nagar Rd, Chinchpada
Pen, Maharashtra 402107
092723 36664
District Civil Surgeon Blood Bank
Rotary Club New Panvel Charitable Trust S Late Dr. B.V.
Limaye Blood Bank
022 27459322, 022
32092960
NDRF
National disaster Response Force
+91-9711077372
SDRF
022-
26514742/26556805
9833620113

RADMP July 2018
29
ANNEXURE 1: Standard Operating Procedure (SOP)
Sr. No. Procedures
A. CONSTRUCTION PHASE
1. Excavation
2. Tower Crane
3. Scaffold – Fixed and Mobile
4. Bar Bending
5. Bar Cutting
6. Construction fires
B. OPERATION PHASE
7. Flood
8. Earthquake
9. Fire
10. Lightning

RADMP July 2018
30
CONSTRUCTION PHASE:
1. Excavation/Trenching
Standard Operating Procedure – Safety Department
Subject: Excavation Or Trenching Number: 01
Effective Date: Page:
1. Objective: To carry excavation work smoothly and control accidents generally occurs due
to excavation hazard & risk.
2. General Information:
Excavation and trenching are among the most hazardous construction operations. Excavation
is any man-made cut, cavity, trench, or depression in the earth’s surface formed by earth removal. A trench is defined as a narrow underground excavation that is deeper than it is wide,
and is no wider than 15 feet (4.5 meters).
2.1 Excavation Risks:
The most common hazard at any work site is the threat of cave-in. A cave-in occurs
when walls of an excavation collapse
Accidental contact with utility lines
Crushing and striking hazards posed by mechanized equipment
Atmospheric Conditions
Materials/Equipment falling into excavation site
Struck by Accidents
Asphyxiation
Explosion
Fall Hazard
2.2 Preparedness:
Re-route traffic whenever possible, and keeping only the heavy; Construction
equipment needed near the excavation
Keeping the spoil pile at least 2 feet back from the edge of the excavation
Pumping water out of the excavation before any one enters it
Using protective systems when required
Establish and maintain a safety and health program for the worksite
Provide adequate systematic policies, procedures, practices
Wear warning vests when near traffic
Trained employees to operate heavy equipment
Passing order to Stay away from loads being handled by lifting/digging equipment
Use barricades, hand or mechanical signals, stop logs to keep operators safe
Barricade or cover wells, pits, shafts
Use appropriate PPE’s. Trenches 4 m or more feet deep need a safe means of egress
o Stairway
o Ladder
o Ramps
Means of egress shall kept fixed and secure
Keep surface materials approximately 2 feet from the edge of excavation sites

RADMP July 2018
31
2.3 Access and Egress
Safe access and egress to all excavations, including ladders, steps, ramps, or other safe
means of exit for employees working in trench excavations 4 feet (1.22 meters) or
deeper. These devices must be located within 25 feet (7.6 meters) of all workers.
3. Roles & Responsibilities
3.1 Roles & responsibility of Head- HSE:
1. Will restrict the entry of un protected trench.
2. Arrange protective system to 5 feet (1.5 meters) deep or greater trenches before
permitting the entry.
3. Arrange protective system be designed by a registered professional engineer to 20 feet
(601 meters) deep or greater.
3.2 Roles and responsibilities of Project Manager:
1. Inspection of trench condition daily before workers entry to eliminate excavation
hazard.
2. Ensuring heavy equipment are away from the trench edges.
3. Ensuring surcharge load at least 2 feet (0.6 meters) from trench edges.
4. Test for low oxygen, hazardous fumes and toxic gases before workers entry.
5. Inspect trench at the start of each shift.
6. Inspect trench following a rainstorm.
7. Provision of PPE’s for the workers.
3.3 Roles and responsibilities of Site supervisor:
1. Check the barricades of all edges do they are on their place or not.
2. Check the excavated debris is unloaded away from the trench
3. Inspect ladders, steps; ramps are in safe conditions for workers use.
4. Ensure the use of PPE’s by excavation workers
5. Ensure the worker is following safe working procedure or not.
6. Take PEP talk daily for workers before starting the work.
7. Immediate reporting to the safety manager in case of any accident & its recording.
8. Immediate reporting to the safety manager in case of finding any unsafe condition.
9. Arranging first aid facility or ambulance immediately in case of injury to any personnel.
3.4 Roles and responsibility of worker:
1. Follow the safety supervisors/ officer direction for work.
2. Use of provided PPE’s while working. 3. Immediate reporting to safety supervisor/ officer in case of any danger.
4. Keep tools at its proper place after completing the work.

RADMP July 2018
32
2. Tower Crane
Standard Operating Procedure – Safety Department
Subject: Tower Crane Number: 02
Effective Date: Page:
1. Objective: To carry lifting, shifting and material handling task without any damage to the
human and property and also to avoid accidents generally occurs due to tower crane
operation
2. General Information
2.1 Operating rules for crane operators
1. The crane should be centered over the load before starting the hoist to avoid swinging of
the load as lifting starts. Load should not be swung by cranes to reach areas not under or
within reach of crane.
2. Crane should be operated smoothly to avoid jerk & abrupt movements of the load. Slack
must be taken from the sling & hoisting ropes before the load is lifted.
3. The crane hoisting ropes should be kept vertical. Crane must not be used for side pulls.
4. The area should be clear and all persons in the area aware when load is lifted. This is to be
ensured by a warning signal while lifting, lowering & while moving. Additional warning
signal to be used in high traffic density area.
5. The load should be checked to be certain that it is lifted high enough to clear all
observations and personnel when moving.
6. Loads must not be carried over people, especially loads carried by magnets. Load or part
of loads, held magnetically may drop. Failure in power to magnets will result in dropping
of the load unless backup power supply is furnished.
7. Lift should not be attempted beyond the rated load capacity of the crane, sling ropes chains
etc.
8. On all capacity near capacity loads, the hoist brakes should be tested by returning the motor
switch or push button to the OFF position after raising the load a few inches of the floor. If
the hoist brakes do not hold the load should be set on the floor and the crane not further
operated. The defect should be reported immediately to the supervisor.
9. Before moving a load, load slings, load chains or other load lifting devises must be fully
seated on the saddle of the hook.
10. The block should never be lowered below the point where less than two full wraps of the
rope remain on the drum. Should all the rope get unwrapped from the drum, it should be
rewound in the drum groove in the correct direction and seated properly in the groove
otherwise the rope may get damaged and the hoist limit switch will not operate to stop the
hoist in the high position.
11. At no time a load should be held suspended from the crane with the power “ON” unless
the operator is at the operator’s switch. Under this condition the load should be kept as close as possible to the floor to minimize the possibility of an injury if the load should drop.
12. When a hitcher is used, it is the joint responsibility of the crane operator and the hitcher to
see that hitches are secure and that all loose materials has been removed from the load
before starting a lift.
13. Sling hooks hanging loose should not be used to lift loads (if slings hooks are not needed,
they should be properly stored)
14. All slings or ropes should be removed from the crane hooks when not in use (Dangling
slings or hooks hung in sling rings can inadvertently snag other objects when moving the
crane)
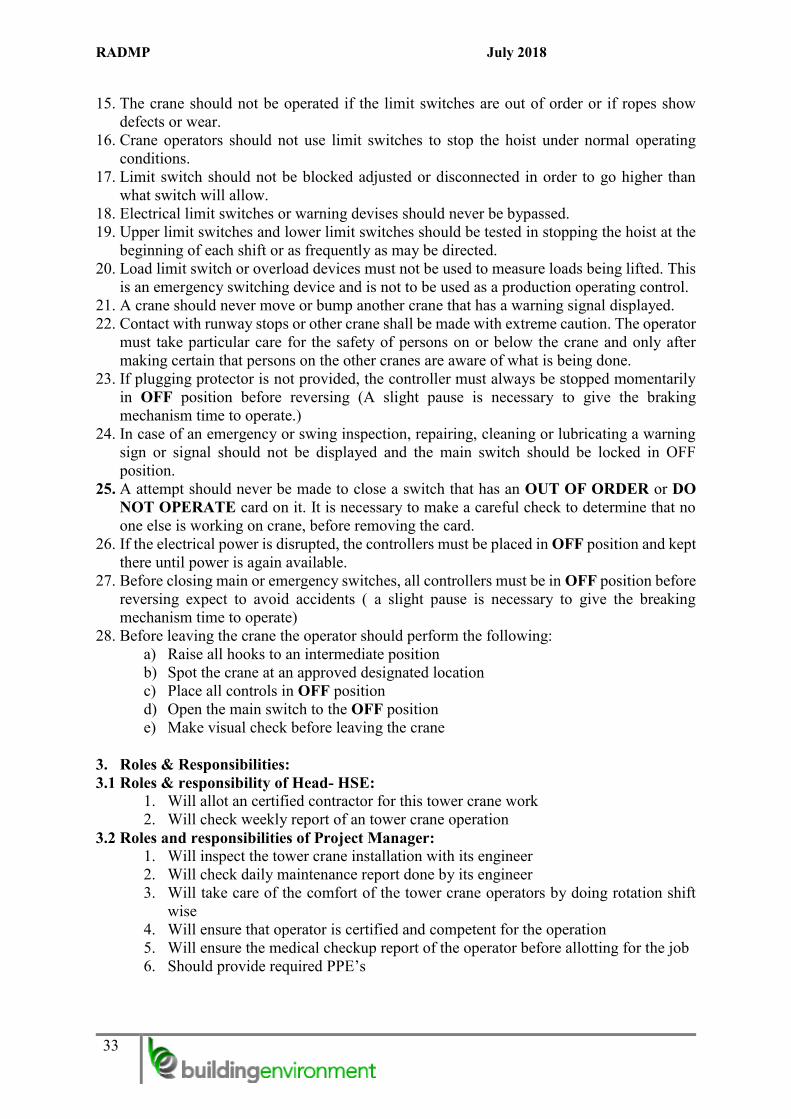
RADMP July 2018
33
15. The crane should not be operated if the limit switches are out of order or if ropes show
defects or wear.
16. Crane operators should not use limit switches to stop the hoist under normal operating
conditions.
17. Limit switch should not be blocked adjusted or disconnected in order to go higher than
what switch will allow.
18. Electrical limit switches or warning devises should never be bypassed.
19. Upper limit switches and lower limit switches should be tested in stopping the hoist at the
beginning of each shift or as frequently as may be directed.
20. Load limit switch or overload devices must not be used to measure loads being lifted. This
is an emergency switching device and is not to be used as a production operating control.
21. A crane should never move or bump another crane that has a warning signal displayed.
22. Contact with runway stops or other crane shall be made with extreme caution. The operator
must take particular care for the safety of persons on or below the crane and only after
making certain that persons on the other cranes are aware of what is being done.
23. If plugging protector is not provided, the controller must always be stopped momentarily
in OFF position before reversing (A slight pause is necessary to give the braking
mechanism time to operate.)
24. In case of an emergency or swing inspection, repairing, cleaning or lubricating a warning
sign or signal should not be displayed and the main switch should be locked in OFF
position.
25. A attempt should never be made to close a switch that has an OUT OF ORDER or DO
NOT OPERATE card on it. It is necessary to make a careful check to determine that no
one else is working on crane, before removing the card.
26. If the electrical power is disrupted, the controllers must be placed in OFF position and kept
there until power is again available.
27. Before closing main or emergency switches, all controllers must be in OFF position before
reversing expect to avoid accidents ( a slight pause is necessary to give the breaking
mechanism time to operate)
28. Before leaving the crane the operator should perform the following:
a) Raise all hooks to an intermediate position
b) Spot the crane at an approved designated location
c) Place all controls in OFF position
d) Open the main switch to the OFF position
e) Make visual check before leaving the crane
3. Roles & Responsibilities:
3.1 Roles & responsibility of Head- HSE:
1. Will allot an certified contractor for this tower crane work
2. Will check weekly report of an tower crane operation
3.2 Roles and responsibilities of Project Manager:
1. Will inspect the tower crane installation with its engineer
2. Will check daily maintenance report done by its engineer
3. Will take care of the comfort of the tower crane operators by doing rotation shift
wise
4. Will ensure that operator is certified and competent for the operation
5. Will ensure the medical checkup report of the operator before allotting for the job
6. Should provide required PPE’s

RADMP July 2018
34
3.3 Roles and responsibilities of Safety supervisor:
1. Should direct and supervise tower crane operation
2. Should check the use of necessary PPE’s
3. Should ensure that no one stand below the tower crane while operation
4. Will ensure presence of fist aid box in the tower crane cabin

RADMP July 2018
35
2. Scaffolding- Fixed and Mobile
Standard Operating Procedure – Safety Department
Subject: Scaffolding- Fixed And Mobile Number: 03
Effective Date: Page:
1. Objective: To avoid the fall accident while working on scaffold
2. General Information
2.1 Potential Hazards
Collapse of scaffold due to overload, sinking into ground, struck by site traffic,
insufficient bracing, unlocked castors.
Incorrect assembly of scaffolding (insufficient planks, mismatched parts, no guard rails,
fittings unsecured, work platform split or has gaps)
Material handling hazards (force, posture, lifting, lowering, pushing/pulling and
vibration)
Struck by falling objects
Slip/Trip/Fall
Exposure to weather
Sprains/Strains
Electrocution
2.2 Pre-Operational Safety Checks:
Ensure all components are well maintained. Do not use components that are in poor
condition.
Do not mix components from differently branded scaffolding systems.
Read and follow the manufacturer’s specifications, assembly instructions and warning labels.
Inspect scaffold before its first use and at the start of each day. Ensure scaffold remains
level and plumb at all times. Incomplete or defective scaffolds must never be accessed.
Use barricades, danger tags or warning signs to prevent unauthorized access.
Ensure edge protection (hand rails, mid-rails and toe boards) is provided at every open
edge of a work platform
Familiarize yourself with safe work procedures for the task.
Wear appropriate personal protective equipment such as safety footwear (with slip-
resistant soles), safety glasses and head protection.
Review weather conditions before starting. Do not work during a storm, wet conditions
or high winds.
2.3 Operational Safety Checks:
Castor brakes are to be applied at all times while the mobile scaffold is stationary.
Access is to be only by way of an internal ladder. No climbing is allowed on the scaffold
itself.
Only work on fully planked work platforms. Ensure that working platforms are kept
clear of debris and obstructions along their length. DO NOT leave tools and equipment
on scaffolds.
Scaffold is not to be moved while workers are on the scaffold work platform.

RADMP July 2018
36
Limit the number of workers on a scaffold at any one time. More than one worker
should be present as a safety precaution.
DO NOT exceed the safe working load of the scaffold.
DO NOT to make any unauthorized alterations to the scaffold (such as removing guard
rails, planks, ties, toe boards and braces).
DO NOT permit workers or other persons to stand directly below a scaffold.
DO NOT drop materials from the platforms.
DO NOT fix high voltage leads and cables to the scaffolding.
NEVER use ladders or makeshift devices on top of scaffolds to increase height.
Adhere to the work practices itemized on the safe work method statement.
If identified controls are insufficient, cease work, revise processes, implement new
controls and resume work. Document any changes on the SWMS/risk assessment.
2.4 Safety Tips:
DO NOT use scaffold unless you have been trained in its safe use and operation.
Inspect scaffold before its first use and at the start of each day.
Do not work in isolation when using scaffolding.
Scaffolding less than 4 m is to be supervised by a competent person.
Work on mobile scaffold above 6 m must be undertaken by licensed scaffolder
Scaffold must be inspected by safety officer after installation before use.
3. Roles & Responsibilities:
3.1 Roles & responsibility of Head-HSE: 1. Will allot an certified personnel for this scaffold installation
2. Should ensure the quality and durability of scaffold system and its necessary parts
3.2 Roles and responsibilities of Project Manager:
1. Will inspect the scaffold installation with civil engineer
2. Will check daily maintenance report done by its engineer
3. Should check report of scaffold condition
4. Should provide required PPE’s
3.3 Roles and responsibilities of Site supervisor:
1. Should inspect the scaffold thoroughly periodically
2. Should ensure lifeline hooks at risky area work
3. Should ensure daily maintenance of scaffold
4. Should check the use of necessary PPE’s
3.4 Housekeeping staff
1. Check and maintain all scaffold parts. Repair or discard and replace any damaged
pieces immediately.
2. Lubricate moving parts of all fittings.

RADMP July 2018
37
4. Bar Bending
Standard Operating Procedure – Safety Department
Subject: Bar Bending Number: 04
Effective Date: Page:
1. Objective: To avoid the fatal and other injuries while working bar bending machine
2. General Information
2.1 Pre-Operational Safety Checks:
Guards or safety devices must never be removed or adjusted, except by an authorized
person for maintenance purposes.
Working parts (ie. hinges) should be well lubricated and working surfaces kept free of
rust and dirt.
Ensure no slip/trip hazards are present in workspaces and walkways.
Be aware of other personnel in the immediate vicinity and ensure the area is clear before
using equipment.
Familiarize yourself with all machine operations and controls- refer to ‘User Manual’. Faulty equipment must not be used. Immediately report suspect machinery.
2.2 Operational Safety Checks:
Never use this machine for bending metal that is beyond the machine’s capacity with respect to thickness, shape, or type. Refer to the manufacturer ‘User Manual’.
Never attempt to wire, strap, or spring steel sheets in this machine.
Adjust for thickness of work piece – rotate adjusters either ends of clamp bar.
Insert work piece and align bending edge of clamp bar & bending-beam with the bend
line of the work piece.
Press and hold the ‘START’ button (this applies pre-clamping pressure to the work
piece).
Using other hand lift handle (this applies full clamping) and continue bend to required
angle.
Keep clear of moving handles and bending-beam.
Slotted or short clamp bars should be used for bending box shapes – refer to ‘user manual’.
3. Roles & Responsibilities:
3.1 Roles & responsibility of Head-HSE: 1. Should arrange to provide standard ISI coded machine for the job
3.2 Roles and responsibilities of Project Manager:
1. Should provide sufficient place for the job & storage
2. Should provide adequate quantity required PPE’s for the job
3.3 Roles and responsibilities of Site supervisor:
1. Should inspect the working area thoroughly daily
2. Should ensure the use of necessary PPE’s 3. Should ensure working procedure is in correct manner or not
4. Should check out any oil spillage on machine or bars while preventive maintenance

RADMP July 2018
38
5. Should check for preventive maintenance tag
6. Should ensure that worker is competent or not
3.4 Housekeeping staff
1. Ensure machine is turned off after use.
2. Return all accessories to storage racks.
3. Leave the work area in a safe, clean and tidy state.
4. Safety Tips
4.1 Do’s for workers job:
Safety glasses must be worn at all times in work areas
Appropriate footwear with substantial uppers must be worn
Long and loose hair must be contained
Close fitting/protective clothing must be worn
4.2 Don’ts for workers job
Rings and jewelery must not be worn
Gloves must not be worn when using this machine
DO NOT use this machine unless a teacher has instructed you in its safe use and
operation and has given permission

RADMP July 2018
39
5. Bar Cutting
Standard Operating Procedure – Safety Department
Subject: Bar Cutting Number: 05
Effective Date: Page:
1. Objective: To avoid the fatal and other injuries while working bar bending machine
2. General Information
2.1 Pre-Operational Safety Checks:
Ensure fixed guards are in place to prevent hands or other parts of the body from
entering the trapping space.
Guards or safety devices must never be removed or adjusted, except by an authorized
person for maintenance purposes.
Working parts should be well lubricated and free of rust and dirt.
The area around the machine must be adequately lit and kept free of materials, which
might cause slips or trips.
Be aware of other personnel in the immediate vicinity and ensure the area is clear before
using equipment.
Familiarize yourself with and check all machine operations and controls.
Ensure cutting table is clear of scrap and tools.
Faulty equipment must not be used. Immediately report suspect machinery.
2.2 Operational Safety Checks:
Do not attempt to cut material beyond the capacity of the machine.
Never attempt to cut rod, strap or wire with this machine.
Use correct lifting procedures when handling large sheets of material.
Take extreme care during the initial feeding of the work piece into the machine.
The work piece should always be held sufficiently far back from the edge being fed into
the guillotine.
Ensure fingers and limbs are clear before actuating the guillotine.
Hold material firmly to prevent inaccurate cutting due to creep.
When cutting ensure feet are positioned to avoid contact with the foot operated lever
3. Roles & Responsibilities:
3.1 Roles & responsibility of Head-HSE: 1. Should arrange to provide standard ISI coded machine for the job
3.2 Roles and responsibilities of Project Manager:
1. Should provide sufficient place for the job & storage
2. Should provide adequate quantity required PPE’s for the job
3.3 Roles and responsibilities of Site supervisor:
1. Should inspect the working area thoroughly daily
2. Should ensure the use of necessary PPE’s 3. Should ensure working procedure is in correct manner or not
4. Should check out any oil spillage on machine or bars while preventive maintenance
5. Should check the fineness of the cutter blade

RADMP July 2018
40
6. Should check for preventive maintenance tag
7. Should ensure that worker is competent or not
3.4 Housekeeping staff
1. Remove all off cuts and place them in either in the storage rack or waste bin.
2. Leave the work area in a safe, clean and tidy state.
4. Safety Tips
4.1 Do’s for workers job:
Safety glasses must be worn at all times in work areas
Appropriate footwear with substantial uppers must be worn
Long and loose hair must be contained
Close fitting/protective clothing must be worn
4.2 Don’ts for workers job:
Rings and jewellery must not be worn
Gloves must not be worn when using this machine
DO NOT use this machine unless a teacher has instructed you in its safe use and
operation and has given permission

RADMP July 2018
41
6. Fire during Construction
Standard Operating Procedure – Safety Department
Subject: Fire during Construction Number: 06
Effective Date: Page:
1. Objective: To avoid the burn injuries, loss of property and delay in work schedule.
2. General Information: Construction fire are generally occurred due to the improper storage of shuttering oil, diesel,
uncovered electric cables, unsafe practice of gas welding & gas cutting, unsafe stacking of
empty & filled LPG & acetylene cylinder and unsafe act by workers sometimes.
3. Role & responsibility
3.1 Role & responsibility of project Manager:
1. Provide adequate place for storage of Shuttering oil, diesel and cylinders separately
2. Contact fire brigade & police in case of fire for evacuation & law work by having talk
with Project Manager.
3. Provide sufficient no of required fire extinguishers as per requirement at designated
location
4. Provision of adequate no of sand buckets & water at security cabin, storage room and
welding area.
5. Provision of PPE’s to workers
6. Ask for emergency response team for action in case of emergency by informing to HSE
manager/ Project Manager
3.2 Role & responsibility of Site supervisor :
1. Ensure the prevention of leakage of oil & diesel daily
2. Ensure the stacking of empty and filled cylinders is done separately or not
3. Ensure the use of PPE’s by workers
4. Supervise the working procedure of gas welding & cutting
5. Check the condition of noses, hose pipe & flash back arrester before the welding
process
6. Arrange for the periodical fire training
7. Conduct mock drill
3.3 Role & responsibility of worker/Housekeeping:
1. Follow the orders of EHS officer while working
2. Do stacking of cylinder as per the EHS officer direction or as per training
3. Check drum before storing of oil & cover it by lid
4. Don’t smoke in oil & diesel storage room
5. Report to EHS officer immediately in case of any danger
6. Wear PPE’s daily before going for the job
3.4 Role & responsibility of First aid leader:
1. Organize evacuation by serious patient, priority wise shift them by first aid person to
safe place for First aid /Artificial breathing
2. Identify the number of burnt patients & make arrangement for shifting to burn ward by
first aid person

RADMP July 2018
42
3. Ensure that first aid person had supported oxygen cylinder the one who had breathing
problem due smoke inhalation for long period
4. Ensure that first aid person had supported saline the one who had become weak due
to trapping

RADMP July 2018
43
7. Fire (During operation Phase)
Standard Operating Procedure – Safety Department
Subject: Fire (During operation Phase) Number: 07
Effective Date: Page:
1. Objective: To avoid burn injuries of the occupants & working staff, loss of occupant, Staff
& workers, property, building / unit property and to avoid fatal accident.
2. Policy
To ensure that the procedure is simple, clear and easy to follow to enable continuous
training of all concerned persons and effective handling of the incident if it occurs.
3. Definition of a Fire
A process in which substances combine chemically with oxygen from the air and typically
give out bright light, heat, and smoke; combustion or burning. Fires start when a flammable
or a combustible material, in combination with a sufficient quantity of an oxidizer such as
oxygen gas or another oxygen‐rich compound (though non‐oxygen oxidizers exist), is
exposed to a source of heat or ambient temperature above the flash point for the
fuel/oxidizer mix, and is able to sustain a rate of rapid oxidation that produces a chain
reaction.
4. Classes of Fire
There are six classes of fire i.e. class A, class B, class C, class D, class E & class F.
Class A: Class A fire occurs generally due to wood, paper, fabric, plastic and most kind
of trash.
Class B: Class B fire occurs generally due to flammable liquids (for example gasoline,
petrol, diesel etc.)
Class C: Class C fire occurs generally due to burning of gases (for example natural
gas)
Class D: Class D fire occurs generally due to combustible metals* such as magnesium,
potassium, titanium and zirconium [* Exception of the metals that burn in contact with
air and water (for example sodium)]
Class E: Class E fire occurs due to electrical equipment which are potentially energized
Class F: Class F fire occurs due to unsaturated cooking oils in well insulated cooking
appliances located in commercial kitchens.

RADMP July 2018
44
5. Understanding:
Fire is a process in which substances combine chemically with oxygen from the air and
typically give out bright light, heat and smoke; combustion or burning.
It is very important to understand the nature of threat and the procedures to be adopted.
All agencies from Building / Unit Management to security department should involved
in evacuation must have a common understanding of their roles and responsibilities in
order to avoid confusion and panic behavior.
Different situations demand different priorities and hence the responsibility for ordering
evacuation is assigned to different agencies.
All evacuations will be ordered only by the State Relief Commissioner, District
Magistrate & Collector, Police, Fire Brigade or by the Security Officer.
6. Pre‐Fire Preparations
While Fire will strike without any notice or warning, certain pre‐fire preparations can go a
long way in mitigating the post incident losses and damages. These are as follows:
Ensure that the structure is fire‐proof.
Procedures and drills on evacuation are regularly practiced.
All the occupants, worker & staff are in the know of their roles and responsibilities for
all contingencies.
Continuous liaison is maintained with civic agencies so that prompt assistance is
received, when required.
Items and objects maybe which cause injury, like heavy/blunt/sharp items, ought to
preferably not be kept overhead, especially in the shops/Pantry/office.
Requisite emergency and recovery equipment, like ladders and personal protective
equipment should be catered for and every one should know their location and usage.
Automatic Sprinkler system on each floor level
Sprinklers shall be distributed throughout the building as per the National Building
Code requirement, so as to cover every 12 sq.m area
Sprinklers shall be provided in lobbies at all levels.
The sprinkler pump shall be suitable for automatic operation in case of a drop of
pressure in the system. Sprinklers shall be provided throughout the building/unit with
a separate sprinkler riser. All the risers shall be provided with installation control
valves. An electrical sensor switch shall be provided on each floor and connected to the
fire control panel in the security room to make it possible to identify the location of
effected floor immediately.
An overhead water storage tank adequate capacity shall be provided to back up the
firefighting system.
Automatic drencher system on each car parking floor.
Fire Hydrant Cabinets with hose reels & hand held Fire Extinguishers.
Fire tank capacities as per NOC, with separate fire pumps for Hydrants and Sprinklers.
Under Ground Fire Tank
Over Head Fire Tank.
Stand by diesel operated pumps.
All fire pumps will be powered from the emergency panel, which in turn is fed by DG
sets.
Fire pumps are manufactured as per BIS and selected based on that the pumps should
deliver water at terrace with minimum pressure of 3.2 kg/sq.mt.

RADMP July 2018
45
Types of Fire Extinguishers
SOP of Building / unit occupant evacuation under supervision of Building / Unit
Management
3. Role & Responsibility
3.1 Role & Responsibility Society / Unit In-charge
1. Keeps watch on Main receiving stations, parking areas and other fire likely hazard
areas by Safety Officers reports/ Security reports/any other personnel report.
2. Communicate or Display steps /arrangement which will be helpful during fire
situation.
3. Ensure the working of sprinklers/ smoke detectors & fire alarms periodically.
4. Ensure the working of fire hydrant system and also ensure that all necessary
required equipment of hydrant system are available on their designated locations.
5. Ensure the working of all fire pumps & standby pumps periodically
6. All evacuations should be reported to DM & Collector or District Superintendent
of Police immediately.
7. Arrange equipment and lifesaving appliance available at assembly point
8. Monitor Fire Evacuation operation and coordinate with external agencies for help.
9. Conduct mock drill for occupants, workers & staff in every six months.
10. Arrange periodical training session for an emergency team.
11. Arrange wheel chairs, crèches to rescue team during emergency.
3.2 Role & responsibility of Security In-charge
1. Will arrange adequate water supply source for fire brigade tankers for putting off fire.
2. He will do adequate provision of applicable fire extinguishers as per class of fire, sand
buckets & other equipment for controlling fire.
3. He will arrange dust masks, smoke masks, blankets and SCBA.
4. He should do arrangement of walky-talky, torch, First aid, personal medicines &
Ambulance service.
5. He will give direction to rescuers for the evacuation of occupant, workers & staff
priority wise for eg.
I- Injured or affected persons will be evacuated first
II- Handicapped & disabled persons will be evacuated by providing wheel chairs etc.
III- Women’s & small children will be evacuated will specials arrangements
IV- Other occupant, workers & staff will be evacuated by other alternative
arrangements

RADMP July 2018
46
V- Dead bodies will be removed very soon and will be handed over to family or
responsible departments for identification.
6. Will take current information from managers of the electric supply & STP/OWC during
fire accident.
3.3 Role & responsibility Manager/Electrician
1. He should coordinate with Security In-charge to ensure no one is trapped before switch
off equipment/Lift supply
2. He should provide D G Supply to evacuation light system continuously to assembly
point & refuge areas
3. He should arrange power supply to Control room & Telecommunication equipment
3.4 Role & responsibility of Manager Environmental facilities
1. He should ensure that fire should not travel till electric panel of STP
2. He should ensure that fire should not travel till diesel operating pumps & temporary
storage area of diesel & oil
3. He should arrange to enclose the OWC room if not got caught by fire or will arrange
members to empty the OWC room from garbage stored there.
3.5 Role & responsibility of Security officer
1. He should control stamped of Panic crowed
2. He should watch and ward assembly point resident
3. He should give direction to the emergency rescue team
4. He should control robbery & theft of buildings / Units
3.6 Role & responsibility of Parking In-charge
1. Evacuate people trapped in parking area by coordinating with evacuation team leader
or site controller
2. Arrange systematic car flow out from parking area
3. Internal road should not block due to panic driving
4. Continuous reporting of the parking situation to the Site controller/Chief Site Controller
5. Ensuring that all occupants, worker & staff had evacuated from the parking area
6. Inform exact fire location to fire brigade team to control.
3.7 Role & responsibility of Elected Building / Unit Chairman
1. Organize group of Occupant, Staff & workers
2. Guide Occupant, Staff & workers to safe place
3. Advice Evacuation team leader their duties
4. Instruct & confirm that all light/oven/geyser/LPG Cylinder /Gas line taps are closed
properly
5. Confirm that all Occupant, Staff & workers of floor wise /wing wise left their Buildings
/ Units temporally till fire get in control by fire brigade team
3.8 Role & responsibility of First Aid Team Leader
1. Organize evacuation by serious patient, priority wise shift them by first aid person to
safe place for First aid /Artificial breathing
2. Identify the number of burnt patients & make arrangement for shifting to burn ward by
first aid person 3. Ensure that first aid person had supported oxygen cylinder the one who had breathing
problem due smoke inhalation for long period

RADMP July 2018
47
4. Ensure that first aid person had supported saline the one who had become weak due
to trapping
3.9 Role & responsibility of Evacuation Team Leader
1. Ensure that evacuation team had rescued all occupant, workers & staff has been
evacuated from fire area
2. Ensure that fire brigade team had rescued all Occupant, Staff & workers
3. Ensure that all occupants had been shifted to safe location from building /unit assembly
points and main assembly points
4. Arrange adequate provision of required
4. Safety Tips
4.1 Do’s to stay safe during a fire: 5. If fire occurs, first switch off all gas, pipe line knobs & electrical switches.
6. Close all windows to cut the oxygen source and then leave the home / unit.
7. If fire rises in your home / unit before you evacuate, go to the nearest refuge area or
assembly point as soon as possible.
8. Turn off all utilities at the main power switch and close the main gas & pipe valve of
the building / unit if advised to do so.
9. If your clothes catch fire, Stop Drop and Roll to put them out.
10. Apply antiseptic or take treatment from first aid person as soon as possible if you got
affected from fire.
11. When leaving, close doors behind you and pull any fire alarms you may pass.
12. Stay low — beneath the smoke where the air is clearer and safer to breathe.
13. Cool burns quickly with water — get medical attention immediately.
14. Keep a wet handkerchief or piece of cloth/ sari on face during evacuation
4.2 Don’ts to stay safe during a fire: Do not panic, evacuate calmly and quickly perpendicular to wind direction through
the designated escape route
Never ignore fire or smoke alarms.
Leave the building / unit immediately — do not stop to collect belongings.
Don’t pay attention to the rumors and don’t spread rumors.

RADMP July 2018
48
8. Flood
Standard Operating Procedure – Safety Department
Subject: Flood Number: 08
Effective Date: Page:
1. Objective: To safeguard the lives of occupants, workers & staff by evacuation and
mitigation measures during flooding conditions or flooding.
2. General Information:
2.1 Category of flood disaster
Category IV: Low Flood (Water level between Warning Level and Danger Level)
Category III: Moderate Flood (Water Level below 0.50m. less than HFL and above
Danger Level)
Category II: High Flood (Water Level less than Highest Flood Level but still within
0.50m. of the HFL)
Category I: Unprecedented Flood (Water Level equal and above Highest Flood Level
(HFL)
2.2 Understandings:
Flood disasters category will be different and may require evacuation of occupants,
workers & staff from category I to III.
It is important to understand the nature of threat and the procedures to be adopted.
All agencies from Building / Unit Management to security department should involved
in evacuation must have a common understanding of their roles and responsibilities in
order to avoid confusion and panic behaviour.
Different situations demand different priorities and hence the responsibility for ordering
evacuation is assigned to different agencies.
All evacuations will be ordered only by the State Relief Commissioner, District
Magistrate & Collector, Police, Fire Brigade or by the Security Officer.
2.3 Evacuation Planning
Shelter sites should be within one hour's walk and three miles (5 km) of dwellings.
The evacuation routes should be away from the flood-prone areas.
Evacuation routes should not include roads likely to be submerged in flood, but may
include pathways.
Ensure proper evacuation by seeking community participation along the following
lines:
o Evacuation should be undertaken with assistance from community leaders
o Care should be taken to see that evacuation routes are not blocked.
o It is always preferable to encourage the entire family to evacuate together as a unit.
o In case of inadequate transport or limited time, encourage community for
emergency evacuation in the following order:
I. Seriously injured and sick
II. Children, women and handicapped
III. Aged persons
IV. Able-bodied. [An evacuation plan on a priority basis helps avoid stampede
and confusion.]

RADMP July 2018
49
2.4 Emergency Evacuations Procedure:
Families should be encouraged to take along adequate supplies of water, food, clothing
and emergency supplies.
The families should be encouraged to assemble at project main assembly point
SOP of Building / Unit occupants, workers & staff evacuation under supervision of
Building / Unit Management
3. Role & Responsibility
3.1 Role & Responsibility Society / Unit In-charge
1. Keeps watch on flood forecasting stations received by Metrological dept/civil
authorities/ TV/Paper.
2. Communicate or Display steps /arrangement during likely Flood situation
3. All evacuations should be reported to DM & Collector or District Superintendent of
Police immediately.
4. Arrange equipment and lifesaving appliance available at assembly point
5. Monitor Flood Evacuation operation and coordinate with external agencies for help.
3.2 Role & responsibility of Security In-charge
1. He should arrange adequate supply of water in closed unbreakable containers.
2. He should do adequate supply of non-perishable packaged food and dry rations.
3. He should arrange clothing and rain gear, blankets and bed sheets, towels.
4. He should do arrangement of Buckets, plates, glasses, mugs made of plastic, Battery-
powered radio, torch, lantern, matches, and Personal medicines.
3.3 Role & responsibility Manager/Electrician
1. He should do coordinate with Security In-charge to ensure that no one trapped inside
lift before switch off equipment / Lift supply
2. He should provide D G Supply to flood light system continuously to assembly point &
dewatering pumps
3. He should arrange power supply to Control room & Telecommunication equipment
3.4 Role & responsibility of Manager environmental facilities
1. He should ensure that no flood water enter in aeration tank
2. He should ensure that no STP waste water overflow in parking area
3.5 Role & responsibility of Security officer
1. He should do control stamped of Panic crowed
2. He should watch and ward assembly point occupants, workers & staff
3. He should Control robbery & theft of building flats / unit
3.6 Role & responsibility of Parking In-charge
1. Evacuate people trapped in parking area
2. Arrange systematic car flow out from parking area
3. Internal road should not block due to panic driving
3.7 Role & responsibility of Elected Building / Unit Chairman
1. Organize group of occupants, workers & staff
2. Guide them to safe place

RADMP July 2018
50
3. Advice team leader their duties
4. Instruct & confirm that all light/oven/geyser/LPG Cylinder /Gas line taps are closed
properly
5. Confirm that all occupants, workers & staff of floor wise /wing wise locked their flats
/ units
3.8 Role & responsibility of First Aid Team Leader
1. Organize evacuation by serious patient priority wise shift them to safe place for First
aid /Artificial breathing
2. Identify who need extra support on Raft/rubber boat
3. Support by saline/oxygen cylinder who submerged
4. Identify the fainted person and do the needful procedure for getting normal.
3.9 Role & responsibility of Evacuation Team Leader 1. Provide Life jacket /boats/raft who need extra support on Raft/rubber boat
4. Safety Tips
4.1 Do’s to stay safe during a flood: If flooding occurs, go to higher ground and avoid areas subject to flooding.
If water rises in your buildings before you evacuate, go to the top floor, attic, or roof.
If water rises in your units before you evacuate, go to the top floor, attic, or roof.
Listen to a battery-operated radio for the latest storm information.
Turn off all utilities at the main power switch and close the main gas valve if advised
to do so.
If you've come in contact with floodwaters, wash your hands with soap and disinfected
water.
4.2 Don’ts to stay safe during a flood: Do not attempt to walk across flowing streams or drive through flooded roadways.
Don't swim through fast flowing water
Don't drive through a flooded area
Don’t get carried away by rumours and don not spread rumours.

RADMP July 2018
51
9. Earthquake
Standard Operating Procedure – Safety Department
Subject: Earthquake Number: 09
Effective Date: Page:
1. Objective: To safeguard the lives of occupants, workers & staff by evacuation and
mitigation measures during earthquake
2. General Information:
Magnitude Class of Earthquake:
Earthquakes are also classified in categories ranging from minor to great, depending on their
magnitude.
Class Magnitude Great 8 or more
Major 7 - 7.9
Strong 6 - 6.9
Moderate 5 - 5.9
Light 4 - 4.9
Minor 3 -3.9
2.2 Understanding:
An earthquake is the perceptible shaking of the surface of the Earth, which can be
violent enough to destroy major buildings, other properties, vegetation and kill
thousands of people.
It is important to understand the nature of threat and the procedures to be adopted.
All agencies from Building / Unit Management to security department should involved
in evacuation must have a common understanding of their roles and responsibilities in
order to avoid confusion and panic behavior.
Different situations demand different priorities and hence the responsibility for ordering
evacuation is assigned to different agencies.
All evacuations will be ordered only by the State Relief Commissioner, District
Magistrate & Collector, Police, Fire Brigade or by the Security Officer.
2.3 Evacuation Planning
All building / unit occupants, workers & staff will be shifted to a nearest Open land location
within the city or few kilometer away.
Sequence of evacuation:
1. First Site controller will arrange announcement of evacuation plan
2. Secondly site controller will arrange crèches for the evacuation of small babies
3. Then site controller will arrange different route for disabled and handicapped people by
some special arrangement
4. Then site controller will arrange some special facilities for the evacuation of old people.
5. Then site controller will arrange first aid facilities and medical treatment to all injured
people.

RADMP July 2018
52
6. Then all occupants, workers & staff will be evacuated to safe place by DM members as
per the direction given by site controller
7. Then site controller will arrange for the search and removal of dead bodies and its
handover to concern ward/police/ or family to avoid spreading of diseases.
3. Roles & responsibilities:
3.1 Roles & responsibilities of Society / Unit In-charge to all levels/departments
1. Keep watch on aftershocks scale and frequency received by Metrological dept/civil
authorities/ TV/Paper.
2. Communicate or Display steps /arrangement during likely Earthquake situation
3. All evacuations should be reported to DM & Collector or District Superintendent of
Police immediately.
4. Arrange equipment and lifesaving appliance available at assembly point
5. Monitor Earthquake Evacuation operation and coordinate with external agencies for
help.
6. Arrange basic necessity of human for all evacuated building / unit occupants, workers
& staff
7. Monitor the food, water & blanket distribution to all evacuated building / unit
occupants, workers & staff
8. Collect updates about the situation time to time from site controller/ first aid
person/security or other local people daily.
4. Earthquake procedure:
a. During all earthquake (all occupants, workers & staff)
Inside the Building / Unit (Do’s & don’t) Duck under the nearest sturdy object and hold onto it until tremors stops. If you are not
near a sturdy object, make yourself as small as possible and cover your head and neck.
If you stand in a doorway, brace yourself against the frame and watch out for a swinging
door or other obstruction.
Avoid windows, filing cabinets, bookcases, and other heavy objects that could fall or
shatter.
Stay under cover until tremors stops, then leave the building / unit and go to the EAA,
refuge area or another designated location. Report to your roll taker.
If safe, before evacuating, neutralize / turn off any flammable source (cooking gas,
electricity etc.) that could lead to further danger.
Outside the Building / Unit (Do’s & don’t) Move away from trees, signs, buildings, units, electrical poles and wires, fires, and
smoke.
Protect your head with your arms from falling debris.
Proceed to the EAA or a pre-designated alternate assembly area. Report to your roll
taker.
Stay alert for further instructions.
Don’t stand below any shade, quickly move to open area as soon as possible.
b. After a MAJOR Earthquake (violent shaking motion). Evacuation Wardens shall:

RADMP July 2018
53
Check for injuries to personnel in your area. Do not attempt to move seriously
injured persons unless they are in immediate danger. Render first aid assistance if
required.
Be familiar with the location of first aid and kits, fire alarms and extinguishers as well
as personnel with first aid kits.
Check for fires or fire hazards, spills of flammable or combustible liquids, or leaks of
flammable gases.
Turn off ignition and heat sources if properly trained and it is safe to do so.
Shut off all gas sources if trained to do so.
Exit the building / unit, if possible
Do not reenter until the building has been declared safe by trained emergency personnel
Use the telephone system only for urgent matters. Call or send a runner to the
Emergency Operations Center or Unit Response Center to notify them of any
needed assistance and emergencies that may exist. Use handheld radios if telephone
services are not available.
Expect Aftershocks.
c. After a MINOR Earthquake
Restore calm.
Examine your area for damage. Evacuation Directors may use checklist to help
assess if the building / unit should be occupied, evacuated, and/or re-entered. Look
for: o Damaged, leaking or ruptured utility lines (gas, water, electrical, telephone,
computer network)
o Toppled furnishings or equipment
o Spilled hazardous materials
o Damaged building components such as ceilings, walls, beams, columns, doors
Evacuate the building / unit if damage is found or the power is out. Report evacuation
to Safety In-charge. Do not reenter until the building has been declared safe by trained
emergency personnel.
5. Standard Operating Procedure (SOP)
A. Search & Rescue:
Objective
To trace and locate people who are physically trapped and distressed, people who are living in
buildings, workers & staff working in units & other industry to rescue these persons, move
them to the safe locations identified in advance and to organize further care.
Composition of the Disaster Management committee:
Ten to twelve young, physically and mentally strong men and women with following skills sets
will constitute the search and rescue (S & R) task force: driver, swimmer, cutter and climber.
All members will have a basic knowledge of first aid and who normally reside in the building
during the expected disaster season.
Pre-Disaster Preparedness Activities for Earthquake:

RADMP July 2018
54
The DMC will familiarize themselves with existing response mechanisms of the
Government at all levels to ensure effective coordination and reduced response time
during disasters.
The Society / Unit In-charge may arrange for the necessary S&R equipment with the
help of local self-government, industrial houses and NGO as and when required.
The Security In-charge will keep the equipment in a safe place, use the equipment
properly and maintain it well.
The Security In-charge will have with it a detailed map of the building indication
vulnerable areas, individuals and households, safe areas safe shelter, evacuation routes
and transport arrangements.
The Security In-charge will devise search strategies and rescue plans, which are
hazard specific.
The DMC will organize themselves into pairs (buddy system).
The DMC will have back up teams ready so that shifts and the rotation of personnel can
be organized.
The DMC will prepare themselves mentally for what they expect to see and what they
can expect in terms of emotional responses to themselves and others.
During Earthquake:
The DMC will if caught inside stand with their backs against a strong indoor wall.
The DMC if outside during the earthquake will run to an open space away from trees,
buildings and electric lines.
The DMC if in a moving vehicle will stop and stay inside.
Standard Operating Procedures for Earthquake: Post Disaster
Before undertaking any search and rescue operation the DMC will make a preliminary
assessment and plan their response based on the following criteria:
Degree of Damage and Risk Should an Intervention be attempted
Heavy/High No. Too dangerous. Secure the perimeter
and restrict access into the structure
Moderate/Medium Perform only quick and safe removals, limit
on site medical treatment of checking for
breathing, stopping major bleeding and
treating for shock. Limit the number of
rescuers involved
Light/Low Yes. Locate victims, check airway,
breathing and circulation of those
unconscious’s and prioritize removal of victims to the designated treatment area.
The Society / Unit In-charge will conduct a general hazard assessment to determine the
possible hazards that they may encounter during the operation.
The Security In-charge will make a quick head count and maintain a list of missing
persons.
The Security person will conduct a physical search involving a systematic movement
across the site whilst listening to calls for help.
The Security person will clear debris and fallen trees in order to reach trapped victim.
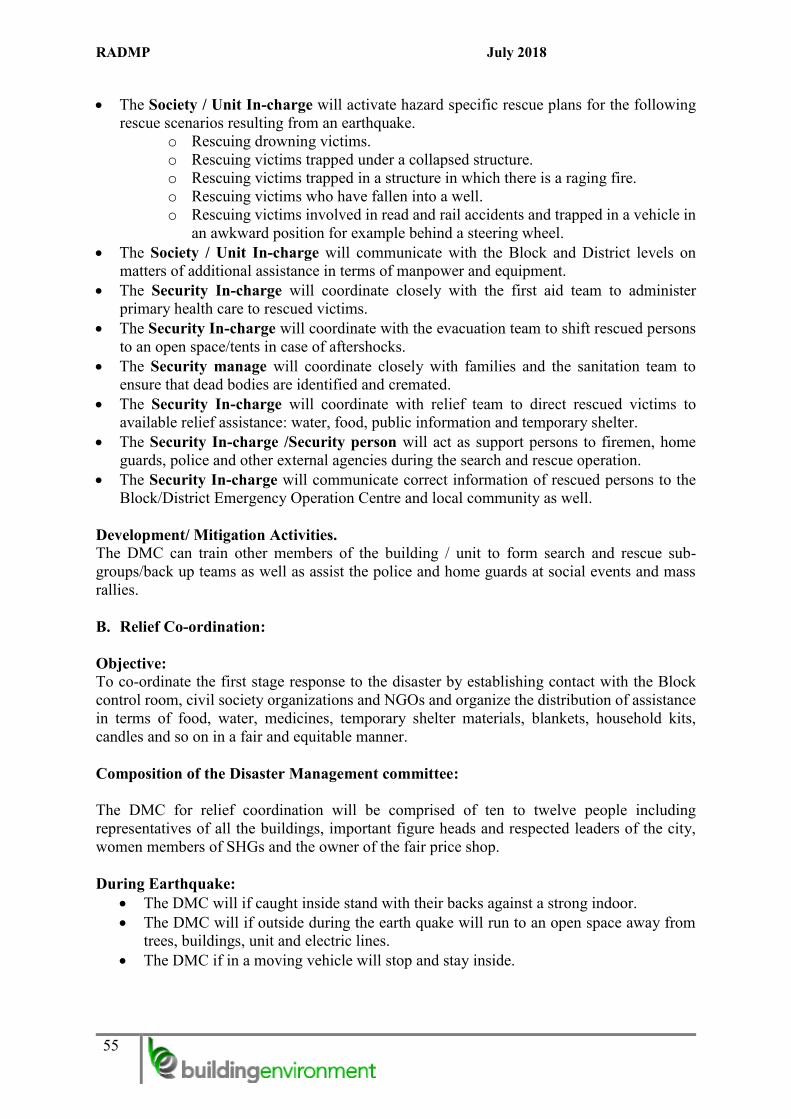
RADMP July 2018
55
The Society / Unit In-charge will activate hazard specific rescue plans for the following
rescue scenarios resulting from an earthquake.
o Rescuing drowning victims.
o Rescuing victims trapped under a collapsed structure.
o Rescuing victims trapped in a structure in which there is a raging fire.
o Rescuing victims who have fallen into a well.
o Rescuing victims involved in read and rail accidents and trapped in a vehicle in
an awkward position for example behind a steering wheel.
The Society / Unit In-charge will communicate with the Block and District levels on
matters of additional assistance in terms of manpower and equipment.
The Security In-charge will coordinate closely with the first aid team to administer
primary health care to rescued victims.
The Security In-charge will coordinate with the evacuation team to shift rescued persons
to an open space/tents in case of aftershocks.
The Security manage will coordinate closely with families and the sanitation team to
ensure that dead bodies are identified and cremated.
The Security In-charge will coordinate with relief team to direct rescued victims to
available relief assistance: water, food, public information and temporary shelter.
The Security In-charge /Security person will act as support persons to firemen, home
guards, police and other external agencies during the search and rescue operation.
The Security In-charge will communicate correct information of rescued persons to the
Block/District Emergency Operation Centre and local community as well.
Development/ Mitigation Activities. The DMC can train other members of the building / unit to form search and rescue sub-
groups/back up teams as well as assist the police and home guards at social events and mass
rallies.
B. Relief Co-ordination:
Objective:
To co-ordinate the first stage response to the disaster by establishing contact with the Block
control room, civil society organizations and NGOs and organize the distribution of assistance
in terms of food, water, medicines, temporary shelter materials, blankets, household kits,
candles and so on in a fair and equitable manner.
Composition of the Disaster Management committee:
The DMC for relief coordination will be comprised of ten to twelve people including
representatives of all the buildings, important figure heads and respected leaders of the city,
women members of SHGs and the owner of the fair price shop.
During Earthquake:
The DMC will if caught inside stand with their backs against a strong indoor.
The DMC will if outside during the earth quake will run to an open space away from
trees, buildings, unit and electric lines.
The DMC if in a moving vehicle will stop and stay inside.

RADMP July 2018
56
Standard Operation Procedures for Earthquake: Recovery Phase of Disaster
The Society / Unit In-charge of buildings/ Unit will conduct a complete damage and
needs assessment.
Based on a preliminary needs assessment in line with the following check list the
Society / Unit In-charge of building / unit will communicate their preferences to the
Block Emergency Operation Center and NGOs.
o The size, scope and likely duration of the distribution of relief material.
o The estimated number of people affected and demographic characteristics.
o Local capacity and resources as well as what will be required externally.
o The needs of the groups affected.
o Access to the affected population and the best methods for making assistance
available.
The Security In-charge will do assessment findings to other Task Force groups, local
authorities, and civil society organizations.
The Society / Unit In-charge will establish a distribution center or community kitchen
and immediately begin distributing what is locally available within the Building / Unit
for emergencies until external assistance arrives.
The Security In-charge will ensure that food and other materials are distributed in an
equitable manner addressing the needs of the most vulnerable.
The Security Manager will prioritize the elderly persons, pregnant women, children,
workers, staff and injured persons in relief distribution.
The Society / Unit In-charge will provide information on the quantity and type of
ration to be distributed for each distribution cycle.
The Security In-charge communicates with individuals and institutions along the
supply chain in order to highlight anticipated shortfalls or problems with the supply of
food and other commodities.
The Security In-charge will make a physical inventory of stocks when external
assistance arrives.
The Society / Unit In-charge will co-ordinate with the communications group to keep
people informed about the government policies which entitle them to assistance in cash
and kind.
The Society / Unit In-charge will work closely with the communication group to stay
in constant touch with Block level Officials and external aid agencies.
The Security In-charge will organize a general meeting to evaluate the experience,
internalize learning and ensure accountability when the relief phase is over.
The Security Manager will keep the undistributed relief material in a safe
place/godown and preserve the stock.
Development/Mitigation Activities:
The DMC will develop stocks of dry food, medicines and temporary shelter materials within
the buildings, unit, maintain these stocks, replenish them and account for them.
C. Early Warning and Communication:
Overall Objectives:
To ensure that: (a) the warning of the impending disaster reaches every single household,
thereby allowing people to take timely action to protect their lives and property (b) accurate
information is provided regularly as events unfold (c) information flows quickly and reliably
upwards to Block level and downwards from Block level to Building / Unit level.

RADMP July 2018
57
Composition of the Disaster Management committee:
Ten to twelve members, who can communicate orally confidently and accurately, are literate,
mobile and energetic, who have a land line phone, mobile phone, radio or television and or
read the newspapers regularly.
Development/Mitigation Activities:
The group will be involved in raising awareness of hazard specific do's and don'ts by
distributing leaflets and putting up posters within the buildings / Unit. The group will also
maintain the communications equipment stored in the communications room * which will be
open to the members for accessing news.
D. First Aid and Health:
Objective
To provide primary health care to the ill or injured until more advanced care is provided and
the patient is transported to a hospital.
Composition of Disaster Management committee:
The group will be comprised of three to seven people who are literate, have some health related
knowledge or are working in medicine and are respected members of the community.
Pre-Disaster Preparedness Activities for Earthquake:
The First aid head will maintain a list of pregnant women/ occupant, staff & worker,
infants, the disabled, sick and old in the buildings to ensure that their medical needs are
met.
The First aid head will keep a First Aid kit ready and ensure that expired drugs are
replaced with new ones.
The First aid person will distribute basic medicines (chlorine tablets, ORS packets and
so on) and demonstrate their use, to families in advance.
The First aid person will keep stretchers/local alternative ready to carry injured people.
During Earthquake:
The DMC will if caught inside stand with their backs against a strong indoor.
The DMC will if outside during the earth quake will run to an open space away from
trees, buildings, units and electric lines.
The DMC if in a moving vehicle will stop and stay inside.
Standard Operation Procedures for Earthquake: Recovery Phase of Disaster
The First aid head will attend to the injuries and trauma of rescued people.
The Fist aid person will help doctors and paramedics shift the ill and the injured to
hospitals.
The First aid head will isolate cases with infectious diseases and prevent them from
spreading.
The First aid person will provide preventive medication if there is a danger of
epidemics like cholera, gastroenteritis, dysentery, and malaria spreading.
The First aid head will inform the relief group about medical supplies that are running
low.

RADMP July 2018
58
Development/Mitigation Activities:
The group will work with the local PHC during normal times, assisting in government
programs such as polio and leprosy cams and imparting training to other interested volunteers
in the building. The group will also launch an awareness campaign about HIV/AIDS.
E. Evacuation and Shelter Management:
Objectives
To construct/identify, maintain and make repairs to the temporary earthquake shelters, to
evacuate people on receipt of a warning and to make all the necessary arrangements to
accommodate evacuees during an earthquake.
Composition of Disaster Management committee:
The group will constitute between ten or twelve people with knowledge of construction and
preferable including a civil engineer.
During Earthquake:
The DMC will if caught inside stand with their backs against a strong indoor.
The DMC will if outside during the earth quake will run to an open space away form
trees, buildings, unit and electric lines.
The DMC if in a moving vehicle will stop and stay inside.
Standard Operation Procedures for Earthquake: Recovery Phase of Disaster
The Society / Unit In-charge will organize for tents and materials for the construction
of temporary shelters to be provided to the local community.
The Security Manager will help the community to reconstruct their permanent shelters
(providing and identifying local material which can be used for reconstruction)
The Security In-charge will help NGOs and their engineers in conduction general
meetings and other rehabilitation and reconstruction related activity.
The Security Manager will monitor the rehabilitation and reconstruction process of
the community.
Development/Mitigation Activities:
The DMC will contribute to government programs and the reconstruction programs of other
NGOs and aid agencies operating in the city. The DMC will undertake a program to raise
awareness of seismic and earthquake safe construction techniques and technologies which
build upon local knowledge and construction skills.
Disaster Psychology:
Since all the task force members will be in constant contact with survivors it is important that
they understand the distinct emotional phases that survivors go through.
Stage Characteristics The Impact phase Survivors do not panic; they may display no
emotions and do what they must to keep
themselves and their families alive.
The Inventory phase (period which
immediately follows the Disaster)
Survivors assess damage and try to locate
other survivors. During this phase routine
social ties are disrupted in favor of the more
functional relationships required for initial
response activities such as search and rescue.

RADMP July 2018
59
Stage Characteristics Rescue phase Emergency rescue services and DMC
members arrive on the scene and survivors
are willing to take their directions without
protest. They trust that the rescuers will help
address their needs so that they can then get
their lives together quickly. DMC members
must be easily identical with helmets,
armbands and so on.
Recovery phase Survivors may feel that rescue and relief
efforts are not proceeding quickly enough
and this coupled with a sense of frustration
with insurance and compensation claims
aggravates stress levels. Frustration may be
directed towards DMC members.
In the post-disaster scenario as people pick up the pieces of their lives shattered by calamity
they may experiences the following psychological and physiological conditions.
Psychological Physiological
Fear of recurrence Loss of appetite
Frustration Headaches
Self-blame and blame towards others Stomach cramps and diarrhea
Feeling overwhelmed Hyperactivity
Sadness and grief Increase in alcohol or drug consumption
Coordination and memory problems Fatigue and low energy
Denial Nightmares and sleeplessness, Mood swings
It is important for all DMC members to remember the following:
Talk to the survivors and encourage them to express their feelings and physiological
needs.
Listen attentively to what the person has to say.
Respond with empathy, understand the concerns of the individual and reassure them
that such feelings are expected.
Keep information confidential and respect their confidence.

RADMP July 2018
60
10. Lightning
Standard Operating Procedure – Safety Department
Subject: Lightning Number: 10
Effective Date: Page:
1. Objective: To avoid burn injury, fire catch, damage of occupant, staff, worker, building &
unit property & fatal accident caused due to lightning storm.
2. General Information:
2.1 Introduction:
Lightning is a sudden electrostatic discharge during an electrical storm between electrically
charged regions of a cloud (called intra-cloud lightning or IC), between that cloud and another
cloud (CC lightning), or between a cloud and the ground (CG lightning).
It is important to understand the nature of threat and the procedures to be adopted.
All agencies from Building / unit Management to security department should involved
in evacuation must have a common understanding of their roles and responsibilities in
order to avoid confusion and panic behavior.
Different situations demand different priorities and hence the responsibility for ordering
evacuation is assigned to different agencies.
All evacuations will be ordered only by the State Relief Commissioner, District
Magistrate & Collector, Police, Fire Brigade or by the Security Officer.
2.2 Types of lightning
Intra-Cloud: The most common type of lightning. It happens completely inside the
cloud, jumping between different charge regions in the cloud. Intra-cloud lightning is
sometimes called sheet lightning because it lights up the sky with a 'sheet' of light.
Cloud to Cloud: Lightning that occurs between two or more separate clouds.
Cloud to Ground: Lightning that occurs between the cloud and the ground.
Cloud to Air: Lightning that occurs when the air around a positively charged cloud top
reaches out to the negatively charged air around it.
Bolt from the blue: A positive lightning bolt which originates within the updraft of the
storm, typically 2/3rds of the way up, travels horizontally for many miles, then strikes
the ground.
Anvil Lightning: A positive lightning bolt which develops in the anvil, or top of the
thunderstorm cloud, and travels generally straight down to strike the ground.
Heat Lightning: Lightning from a thunderstorm that is too far away to be heard.
2.3 Lightning Safety Tips (will be displayed by Security In-charge in building):
The best shelter from lightning is inside a large enclosed structure, such as your home
or school. No place outside is safe during a thunderstorm. Once inside, stay away from
any windows and doorways, electrical appliances, lighting, electric sockets and
plumbing, such as toilets and showers.
If you can't get to a house, a vehicle with a solid metal roof and metal sides (such as a
bus) is a reasonable second choice. Avoid contact with the windows. Close the windows
and lean away from the door. Don't touch anything metal, such as the steering wheel,
ignition, gear shifter or radio.
Stay inside for 30 minutes after you last see lightning or hear thunder. People have been
struck by lightning from storms centered as far as 10 miles (16 kilometers) away.

RADMP July 2018
61
Find a low spot or depression and crouch down as low as possible, but don't lie down
on the ground. Lightning can move in and along the ground surface, and many victims
are struck not by bolts but by this current.
Stay away from:
o Tall isolated objects (trees, flag poles, light poles, lawn, telephone poles)
o Wide-open areas (garden, terrace, balcony on height)
o Water related activities (swimming pool, fountains etc.)
o Open vehicles (battery car, riding lawn mowers, trucks & open jeep)
o Metal (fences, bleachers, tools etc.)
Avoid using electrical devices. When a lightning storm rages outside, it's a good idea
to avoid using electrical devices inside. This means you should avoid using the
telephone during a lightning storm. Also, it's advisable that you turn off the television,
turn off your computer, and any other electrical device. Although very rare, it's possible
that the electrical surges caused by the lightning storm can travel through your
telephone line or electrical wiring. Cordless phones and cell phones are considered
safe.
Use of surge protector. Surge protectors are safety plugs designed to automatically
protect electrical devices in case lightning should strike. They try and reduce the
amount of surge before it reaches your equipment. Surge protectors are highly
recommended for all computers and electrical appliances. Using a surge protector can
not only help prevent damage being done to your expensive electrical devices, but can
also prevent fire in case lightning strikes. However, as long as lightning has a
conductive path, there is risk of damage.
Lightning arrestor must be installed to the buildings which should be grounded.
Every individual should remove metal or jewelry worn or carried by him/her during
lightning.
3. Roles & Responsibilities
3.1 Roles & Responsibilities of Society / Unit In-charge:
1. Will ensure the working of lightning arrester periodically.
2. Will ask electric supply manager to switch off the power till the lightning gets stops.
3. Will ensure all facility room electric supply is been switch off by taking info from
concern In-charge, Parking In-charge & Security In-charge.

Annexure-XXI
Distance of the buffer zone of the Karnala Bird Sanctuary from T3 land parcel


Annexure-XXII
Tree Census Details
Sr.No Land Parcels No of trees (species) identified at the sites
1. T1 1261 (37)
2 T2 317 Nos (25)
3 T3 11 (5)
4 T4 103 (17)
Total 1692

A Tree census and inventory Report-T1 Land
Parcel

Contents Page no
1. Introduction 6
2. Background of the Project 8
2.1 Physical settings of the project site
2.2 Climate
2.3 Rainfall
2.4 Location
3. Scope of the study 11
3.1 Objectives
3.2 Sampling
3.3 Identification of tree species
3.4 Technology used
3.5 Data processing analysis
4. Results 14
4.1 Species composition of trees
4.2 Abundance
4.3 Relative abundance
4.4 Diversity

4.5 Diameter classes and height of trees
4.6 Assessment of species protected by specific legislation
5. Discussion 17
6. Conclusion 20
7. Recommendations 21
8. Photo Gallery 22
9. Annexure 29

Table 1. Species composition of the study site
Table 2. Relative abundance of the species
Table 3. Density and Basal of the different tree species
Table 4. Mean DBH of the different tree species
Figure 1. Location of the Project site
Figure2. Location of Tree with GPS point near Wirani viilage of Site T1
Figure3. Location of Tree with GPS point near road site for T1 sit
Figure 4. Girth class of total trees of the area
Summary of the Report
This study assessed the diversity, abundance, density of trees in 86.97 ha plot
in Pen area. Each tree was counted and marked on a GPS device. The girth of the trees
and shrubs were measured and species identified. A total of 37 species belonging to 32
genera and 19 families were recorded. Leguminosae had the highest number of genera
10 and species 10 followed by the Moraceae with 4 species and 2 genera. Acacia
auriculiformis recorded the highest tree density (9.01 individual’s ha-1).
The girth class distribution showed that with the highest number of trees in the
larger girth class (>29.9 cm). Tree number decreases with lower girth (<29.9) class. In
this site, most of the tree species are understorey (medium sized trees). Tree
diameter and height range of trees shows that site is disturbed with anthropogenic
activities. A dominance index of trees was 0.6.
Site T1 shows the very poor diversity with H’=168. In terms of evenness, the
Pielou’s Evenness value of the site is 0.23. It shows that site has lower value for
evenness. If this site is selected for any developmental activity, along with
conservation, more focus should be given for mixed plantation including different
native species of Herbs, Shrubs and Trees. It will increase species richness of the site
and will provide protected habitat for different faunal species of nearby area.

1. Introduction
The present document is a Tree census and inventory report of the ‘Integrated
Industrial Township’ at Pen, Dist Raigad, Maharashtra. The present Tree census and
inventory report was done to quantify, map and to create an inventory of Tree species.
The present study gives a detailed account of Tree diversity, health status,
density, distribution and their locations by using GIS and mapping tool.
2. Background of the Project
2.1 Physical setting of the Proposed Project Site:
The proposed “Integrated Industrial Township” by Karanja Infrastructure
(P) Ltd. will be developed in Pen region of Raigad district. Raigad district forms a part
of Maharashtra littoral, the micro level divisions of coastal plain. Though the districts
form an important part of the traditional “Konkan Plain”, ruggedness and uneven
topography form the governing theme in its physical features. The Sahyadri (Western
Ghats) in the east send several transverse numbers of subsidiary hills westwards
denying the plains of a uniform level and continuous character.
The proposed site lies on leeward side of Sahyadri i.e Western ghat. The
project site is irregular in shape and overlooks the River Bhogeshwari & Balganga.
The site is at a height of 185 meters above mean sea level. The highest point within
the site is at 201m whereas the lowest point of the site is at 84 meter. This site is
highly contoured with a little vegetation cover.
2.2 Climate:
The climate of the district is typical of that on the west coast of India, with
plentiful, regular and seasonal rainfall during the monsoon season. Being a coastal

district, the diurnal and seasonal variations in temperature is not large.The temperature
here averages 26.9°C.
2.3 Rainfall:
The south- west monsoon commences by about the first week of June and the
rains continue till about the beginning of October. The average rainfall for the district
is 3207 mm.
Location: T1: Latitude: 18042’14.11” N
Longitude: 73008’37.90” E
2.4 Location
Pen town is located at 18°40'.N, 73°05' E, on the outskirts of Mumbai
Metropolitan Region. It gained prominence in ancient times due to vantage location on
trade routes to Deccan, proximity to both Mumbai & Pune and its central position in
the Raigad District. It lies on the bank of Bhogavati creek about 16 km from its
mouth. Pen has total area of 199.6 sq. miles and area of Pen City is 6.75 sq.miles.

L
o
n
g
i
t
u
d
e
:
7
3
0
0
8
’
3
7
.
9
0
”
E
Figure 1. Location of the Project site

Figure 2: Location of Tree with GPS point near Wirani viilage of Site T1

Figure 3: Location of Tree with GPS point near road site for T1 site

3. Scope of the study
3.1 Objectives:
1. To make an inventory of tree individuals and tree species in the proposed project
site with the help of GPS
2. To create a distribution / vegetation map of the whole area representing Tree
individuals
3. To undertake ecological analysis with the help of
a. Abundance, Relative abundance
b. Density and Basal area
c. Simpson’s biodiversity Index, Shannon’s Biodiversity index
d. Diameter class and height of the trees
4. Assessment of species protected by specific legislation (Rare, endangered, critically
endangered, endemic and vulnerable)
3.2. Sampling
Since the purpose of the project was to create a detailed inventory of Tree
individuals and species, the “Census” was used as a sampling technique. In total,
214.93, acres of the project site were surveyed and each tree was counted and marked
on a GPS device.
Within each plot (survey no), all individual trees were identified, measured, and
recorded. The diameters at breast height of the species were measured using a
measuring tape. Trees were grouped into the following diameter classes: medium-
sized trees (16–29.9 cm), and large trees (>29.9 cm).

1. These species were further grouped into four life forms defined by their maximum
attainable heights as follows: treelets (small trees) (<10 m), understorey (10–
20 m), canopy (20–30 m), and emergent (>30 m) .
3.3 Identification of Tree species
Most of the tree species encountered were identified on field on the basis of
their morphological characters - Bark shape, texture, and color, Leaves- shape, size,
texture, color, arrangement, flower and fruit color, shape, size, internal morphology,
odor and arrangement of reproductive features. Morphological characteristics were
used to identify the Tree species to the species level. The Flora of Maharashtra, and
Bombay Presidency were used as references and online database of The International
Plant Names Index (IPNI) was used to find out the latest and acceptable international
scientific name of the Tree species.
3.4 Technology used
GPS device (GARMIN 76S) was used to take GPS positioning of each tree
individuals.
ArcGIS was used as platform to create GIS based maps.
3.5 Data Processing and Analysis
(i) Density, abundance, Relative abundance of plant species were calculated. The basal
area of each individual tree species was calculated
(ii) Species diversities and evenness were determined using
a) The Shannon-Weaver Diversity Index

Where Pi = ni/N, ni = number of individuals of species and N = total
number of individuals
Typical values are generally between 1.5 and 3.5 in most ecological studies,
and the index is rarely greater than 4. A Plant community is said to be rich if it has
a Shannon Diversity value ≥3.5.
b) Simpson's Diversity Index
n = the total number of organisms of a particular species
N = the total number of organisms of all species
The value of D ranges between 0 and 1. With this index, 1 represents infinite diversity
and 0, no diversity.
c) Pielou evenness index (Jsw) is calculated as SHHHJsw ln'' '
max

4. Results
4.1 Species composition of Trees
Table 1(see Annexure file) shows the different Tree species found in the study
area. A total of 37 species were recorded belonging to 19 families and 32 genera.
Table 1 shows the different plant species, their families found in the study site T1. A
total of 1261 tree individuals (height above 3 meters) species were recorded in the
study site (Table 1).
4.2 Abundance
From the 19 families recorded in the study sites, the Leguminosae had the
highest number of genera (10) and species (10) followed by the Moraceae with 4
species and 2 genera. A total of 32 genera were recorded in the study sites. Acacia
auriculiformis (Leguminosae) were the most abundant Tree species. This was
followed by the species Eucalyptus globulus (Myrtaceae), Glirisidia sepium
(Leguminosae) and Mangifera indica (Anacardiaceae) having 108, 61 and 48 species
respectively.
There were 11 rare species of this site having only one individual. Out of
which only 2 species were exotic. Cultivated species has higher population over study
area. Majority of the Native species are rare having very little population. First three
abundant species of the site are cultivated species. Those three cultivated species
(Acacia auriculiformis, Eucalyptus globulus, Glirisidia sepium) make up 74% of total
population. One cultivated species having 21 number of i remain unidentified.
4.3 Relative abundance
Table 2 (see Annexure file) shows the different trees species found in the study
sites and their relative abundance. In this site, 1261 individuals were sampled. The

species with the highest number of individual was Acacia auriculiformis (784) with a
relative abundance of 60.17%. It was followed by Eucalyptus globulus (108
individuals and relative abundance of 8.56%), Glirisidia sepium (61) and Mangifera
indica (48) with relative abundance of 4.83% and 3.80% respectively.
4.4 Diversity
The Shannon-Weaver Diversity Index (H’), Pielou’s Evenness, and the species
richness (d) of the study site is shown in following table. Site T1 shows the very poor
diversity with H’=1.68. In terms of evenness, the Pielou’s Evenness value of the site is
0.23. It shows that site has lower value I,e below 0.5 for evenness. The site is less
diverse with 37 numbers of species over such a large area of 86.97 hectares. The site
shows greater value of simpson index i.e 0.6.
Table 3 Characteristics of trees in the study area.
4.5 Diameter classes and height of the trees
Trees with different diameter classes were found in the different study sites.
The diameter range was grouped as medium-sized trees (16.9–29.9 cm), and large
trees (>29.9 cm). The site was dominated by trees species having diameters
(>29.9 cm) (large trees). There were only 7 trees with medium diameters (16.9–
Parameter Value
Shannon's diversity index (H') 1.6877
Pielou evenness index (Jsw) 0.23
Simpson index (Cd) 0.60
Richness (total number of species) 37

26.9 cm). Those trees include – Trema orientalis (2 trees), Acacia auriculiformis (3
trees), Glirisidia sepium (1 tree), Holoptelea integrifolia ( 1 tree).
Out of the 1261 species identified in the study sites, 561 species were treelets,
mostly <10 m tall, and 605 species were understory trees <20 m tall and 94 reaching
the canopy (20-30m). One emergent species (>30m) of Mangifera indica was found.
Figure 3: Girth class of total trees of the area
4.6 Assessment of species protected by specific legislation
The site T1 does not contain any species which is protected by specific
legislation (Rare, endangered, critically endangered, endemic and vulnerable).

5. Discussion:
The Leguminosae were observed to be the most prevalent family. This may be
due to their fast germination ability, associated with sym-biotic properties which have
enabled species to easily establish within this habitat. Leguminoceae is well
represented family of western ghat. The site T1 represents Leguminosae as a largest
family having 10 genera and 10 species of this family. Acacia auriculiformis having
highest population of 784 trees. This makes more than half of the total population.
Though the number of this species is high, the risk of invasion is low (the risk of
invasion was not widely reported in India). Monoculture of this species is also one of
the reasons for lower value of species diversity index.
Photograph of Acacia auriculiformis on site T1
First three abundant species of the site are cultivated species. Those three
cultivated species (Acacia auriculiformis, Eucalyptus globulus, Glirisidia sepium)
make up 74% of total population. These species are exotic species. This underlines

that 74% area of the site is under cultivation of Exotic species and which is not good
for biodiversity of the study area and nearby area.
Certain problems have emerged as a result of growing G. sepium on large area
in various regions. The seed germination rate of Gliricedia sepium above 90% are
typical. Following germination, trees grow extremely quickly and may attain a height
of 3 m before flowering at age 6-8 months. This species inhibit the growth of other
vegetation. So it negatively affects biodiversity of the nearby area. Eucalyptus
globulus also inhibit the growth of other vegetation and it has 60% germination rate.
At many places, forest areas in India plantation of Gliricedia sepium was removed and
cultivated by other native species. This was done for protection of exiting Biodiversity
and for Biodiversity richness.
Photograph of Gliricedia sepium
Generally, species diversity is one of the most important indices used to
evaluate an ecosystem. A rich eco-system with high species diversity has a large value
(H’) while an ecosystem with low value (H’) will have low species diversity. The
present study site had a poor diversity of trees. i.e (H’=1.68). In case of Simpson’s

dominance index - The lower the index value, the lower the dominance of species.
The greater the value of index of dominance, the lower is the species diversity. This
site has higher value of dominance index. It shows that this site has low species
diversity.
As shown by Pielou’s Evenness value (0.23), tree community of study area has
low level of evenness or unevenly distributed.
The stem density of tree species increases with increase in girth class
distribution in the study area. This could result from anthropogenic activities such as
the cutting and burning of trees for plantation crops and domestic purpose by local
people and tribes.
In this site most of the tree species are medium sized trees (understorey) with a
height between 10-20m. It also signifies anthropogenic disturbance.

6. Conclusions
This study revealed that the site T1 has low tree species diversity.
Leguminosae is the dominant family and Acacia auriculiformis is the dominant
species of this area. The result of ecological analysis shows that this site is very poor
in diversity and disturbed. It may be due to the anthropogenic activities.
Following major things are observed and concluded from the survey of site T1
a) 74% area of the site is under cultivation of Exotic species and which is not
good for Biodiversity of the study area and nearby area.
b) Certain problems will be emerged because of large population of G. sepium on
large area. Because this species inhibit the growth of other vegetation. So it
negatively affects biodiversity of the nearby area.
c) This site comprises a low level of diversity of Tree species.
d) Tree community of study area is unevenly distributed.
e) It has no significance as a habitat for wildlife. No wild life has been
observed during the survey.
f) It does not includes Trees of a rare, vulnerable or endangered species
g) This site does not contain tallest layer of vegetation. Only one emergent tree of
Mangifera indica was found. This site has more individuals of medium size (10-
20). So it shows poor natural regeneration potential of the site.
h) Very few species in the lower girth class also indicates that site has poor
natural regeneration potential
i) Acacia auriculiformis is representative of the total vegetation but it is
monocultured and its population is more than half of the total population i.e 62%.
Large population of Mangifera is one of the reasons for low value of evenness.

7. Recommendations:
1. If this site is selected for any developmental activity, along with conservation
more focus should be given for mixed plantation. Plantings should include a
diverse array of species, genera, and families, of different herbs shrubs and
trees. This will provide protected habitat for different faunal species of nearby
area.
2. Particularly those trees other than Mangifera indica and exotic species should
be selected for plantation.
3. The removal of Gliricedia sepium and replantation of the site T1 with different
native species will have positive effect on Biodiversity
4. Only 1 (Bulbul) species of bird were found during the survey. The reason
(which we heard) behind it was shocking. For some tribes living near study
area, some birds still form a part of their diet. Tribes near the study area still
lead a nomadic life and hunt some birds for food.
If this site is planted with different native species of herbs, shrubs and trees.
And along with this if supply of fresh, clean water is provided within the site
then it will attract many birds. Creation of these types of environments within
the Industrial Township will give roosting, protective place for birds. This will
be a major step towards sustainability.
5. Maintain and restore plants native to the place, so as to facilitate adaptability
and reap the environmental benefits. Benefits and time are lost when older
trees are removed and replaced with smaller and younger tree species.
6. Protect or restore existing water bodies, so as to promote biodiversity.
7. Transplantation is a good option to protect Biodiversity.

Photo Gallery of T1 site


A Tree census and inventory Report-T2
Land Parcel

Contents Page no
1. Introduction 6
2. Background of the Project 7
2.1 Physical settings of the project site
2.2 Climate
2.3 Rainfall
2.4 Location
3. Scope of the study 9
3.1 Objectives
3.2 Sampling
3.3 Identification of tree species
3.4 Technology used
3.5 Data processing analysis
4. Results 12
4.1 Species composition of trees
4.2 Abundance

4.3 Relative abundance
4.4 Rank abundance Curve
4.5 Diversity
4.6 Diameter classes and height of trees
4.7 Assessment of species protected by specific legislation
5. Discussion 16
6. Conclusion 17
7. Recommendations 18
8. Photo Gallery 19
9. Annexure
Table 1. Species composition of the study site
Table 2. Relative abundance of the species
Table 3. Density and Basal of the different tree species

Table 4. Mean DBH of the different tree species
Figure 1. Location of the Project site
Figure 2. GPS point showing location of Tree
Figure 3. A Rank – abundance curve
Figure 4. Girth class of total trees of the area

Summary of the Report
This study assessed the diversity, abundance, density of trees in a 41.35 ha plot
in Pen. Each tree was counted and marked on a GPS device. The girth of the trees and
shrubs were measured and species identified. A total of 25 species belonging to 23
genera and 15 families were recorded. Fabaceae had the highest number of genera 4
and species 4 followed by the Mimosaceae with 4 species and 3 genera. Mangifera
indica recorded the highest tree density (4.52 individual’s per ha).
The girth class distribution showed that with the highest number of trees in the
larger girth class (>29.9 cm). Tree number decreases with lower girth (<29.9) class. In
this site most of the tree species are treelets (small trees) with a height <10 m. Tree
diameter and height range of trees shows that site is disturbed with anthropogenic
activities. A dominance index of trees was 0.635.
Site T2 shows the very poor diversity with H’=1.74. In terms of evenness, the
Pielou’s Evenness value of the site is 0.54. It shows that species richness is exactly
intermediate in evenness. If this site is selected for any developmental activity, along
with conservation, more focus should be given for mixed plantation including
different native species of Herbs, Shrubs and Trees. It will increase species richness of
the site and will provide protected habitat for different faunal species of nearby area.

1. Introduction
The present document is a Tree census and inventory report of the ‘Integrated
Industrial Township’ at Pen, Dist Raigad, Maharashtra. The present Tree census and
inventory report was done to quantify, map and to create an inventory of Tree species.
The study gives a detailed account of Tree diversity, health status, density,
distribution and their locations by using GIS and mapping tool.
2. Physical setting of the Proposed Project Site
The proposed “Integrated Industrial Township” by Karanja Infrastructure (P)
Ltd. will be developed in Pen region of Raigad district. Raigad district forms a part of
Maharashtra littoral, the micro level divisions of coastal plain. Though the districts
form an important part of the traditional “Konkan Plain”, ruggedness and uneven
topography form the governing theme in its physical features. The Sahyadri (Western
Ghats) in the east send several transverse numbers of subsidiary hills westwards
denying the plains of a uniform level and continuous character.
The proposed site lies on leeward side of sahyadri i.e Western ghat. The project
site is irregular in shape and overlooks the River Bhogeshwari & Balganga. The site is
at a height of 189.01 meters above mean sea level. The highest point within the site is
at 201 m whereas the lowest point of the site is at 72 meters. This site is highly
contoured with a little vegetation cover.
2.1 Climate:
The climate of the district is typical of that on the west coast of India, with
plentiful, regular and seasonal rainfall during the monsoon season. Being a coastal

district, the diurnal and seasonal variations in temperature is not large.The temperature
here averages 26.9°C.
2.2 Rainfall:
The south- west monsoon commences by about the first week of June and the
rains continue till about the beginning of October. The average rainfall for the district
is 3207 mm.
Location: T2: Latitude: 18046’23.80” N
Longitude: 73007’17.44” E
Figure 1. Location of the Project site

Figure 2: GPS location at T2 site.

3.0 Scope of the study
3.1 Objectives:
1. To make an inventory of tree individuals and tree species in the proposed project
site with the help of GPS
2. To create a distribution / vegetation map of the whole area representing Tree
individuals
3. To undertake ecological analysis with the help of
a. Abundance, Relative abundance
b. Density and Basal area
c. Simpson’s biodiversity Index, Shannon’s Biodiversity index
d. Diameter class and height of the trees
4. Assessment of species protected by specific legislation (Rare, endangered, critically
endangered, endemic and vulnerable)
3.2. Sampling
Since the purpose of the project was to create a detailed inventory of Tree
individuals and species, the “Census” was used as a sampling technique. In total,
102.20, acres of the project site were surveyed and each tree was counted and marked
on a GPS device.
Within each plot (survey no), all individual trees were identified, measured, and
recorded. The diameters at breast height of the species were measured using a
measuring tape. Trees were grouped into the following diameter classes: medium-
sized trees (16–29.9 cm), and large trees (>29.9 cm).
1. These species were further grouped into four life forms defined by their maximum
attainable heights as follows: treelets (small trees) (<10 m), understorey (10–
20 m), canopy (20–30 m), and emergent (>30 m) .

3.3 Identification of Tree species
Most of the tree species encountered were identified on field on the basis of
their morphological characters - Bark shape, texture, and color, Leaves- shape, size,
texture, color, arrangement, flower and fruit color, shape, size, internal morphology,
odor and arrangement of reproductive features. Morphological characteristics were
used to identify the Tree species to the species level. The Flora of Maharashtra, and
Bombay Presidency were used as references and online database of The International
Plant Names Index (IPNI) was used to find out the latest and acceptable international
scientific name of the Tree species.
3.4 Technology used
GPS device (GARMIN 76S) was used to take GPS positioning of each tree
individuals.
ArcGIS was used as platform to create GIS based maps.
3.5 Data Processing and Analysis
(i) Density, abundance, Relative abundance of plant species were calculated. The basal
area of each individual tree species was calculated
(ii) Species diversities and evenness were determined using
a) The Shannon-Weaver Diversity Index
Where Pi = ni/N, ni = number of individuals of species and N = total
number of individuals

Typical values are generally between 1.5 and 3.5 in most ecological studies,
and the index is rarely greater than 4. A Plant community is said to be rich if it has
a Shannon Diversity value ≥3.5.
b) Simpson's Diversity Index
n = the total number of organisms of a particular species
N = the total number of organisms of all species
The value of D ranges between 0 and 1. With this index, 1 represents infinite diversity
and 0, no diversity.
c) Pielou evenness index (Jsw) is calculated as SHHHJsw ln'' '
max

4. Results
4.1 Species composition of Trees
Table 1(see Annexure file) shows the different Tree species found in the study
area. A total of 25 species were recorded belonging to 15 families and 23 genera.
Table 1 shows the different plant species, their families found in the study site T2. A
total of 317 tree individuals (height above 3 meters) species were recorded in the study
site (Table 1).
4.2 Abundance
From the 15 families recorded in the study sites, the Fabaceae had the highest
number of genera 4 and species 4 followed by the Mimosaceae with 4 species and 3
genera. A total of 23 genera were recorded in the study sites. Mangifera indica
(Anacardiaceae) were the most abundant Tree species. This was followed by the
species Bombax ceiba (Bombacaceae), Phyllanthus emblica (Euphorbiaceae) and
Butea monosperma (Fabaceae) having 22, 20 and 19 species respectively.
There were 11 rare species of this site having only one individual. Out of
which 4 species were exotic. The rare native species of the included –Pterocarpus
marsupium, Terminalia paniculata, Albizia procera, Syzygium cuminii, Albizia
lebbeck,Sterculia villosa and Trema orientalis.
4.3 Relative abundance
Table 2 (see Annexure file) shows the different trees species found in the study
sites and their relative abundance. In this site, 317 individuals were sampled. The
species with the highest number of individual was Mangifera indica (187) with a

relative abundance of 59%. It was followed by Bombax ceiba (22 individuals and
relative abundance of 6.9%), Phyllanthus emblica (20) and Butea monosperma (19)
with relative abundance of 6.3% and 6% respectively.
Rank abundance curve: Rank abundance curve is one of the way to plot species
abundance data, in which each species is represented by a vertical bar proportional to
its abundance. See Figure 1. Notice the long ‘‘tail’’ of rarer species. A rank-abundance
plot for a hypothetical community with perfect evenness would be flat instead of
declining, indicating that every species had the same abundance. Here species rank
abundance plot of site T2 shows long tail which means this community is unevenly
distributed. The value of evenness in this report is calculated by formula of Pielou
evenness index which shows that species richness is exactly intermediate in evenness.
Figure 3. A Rank – abundance curve
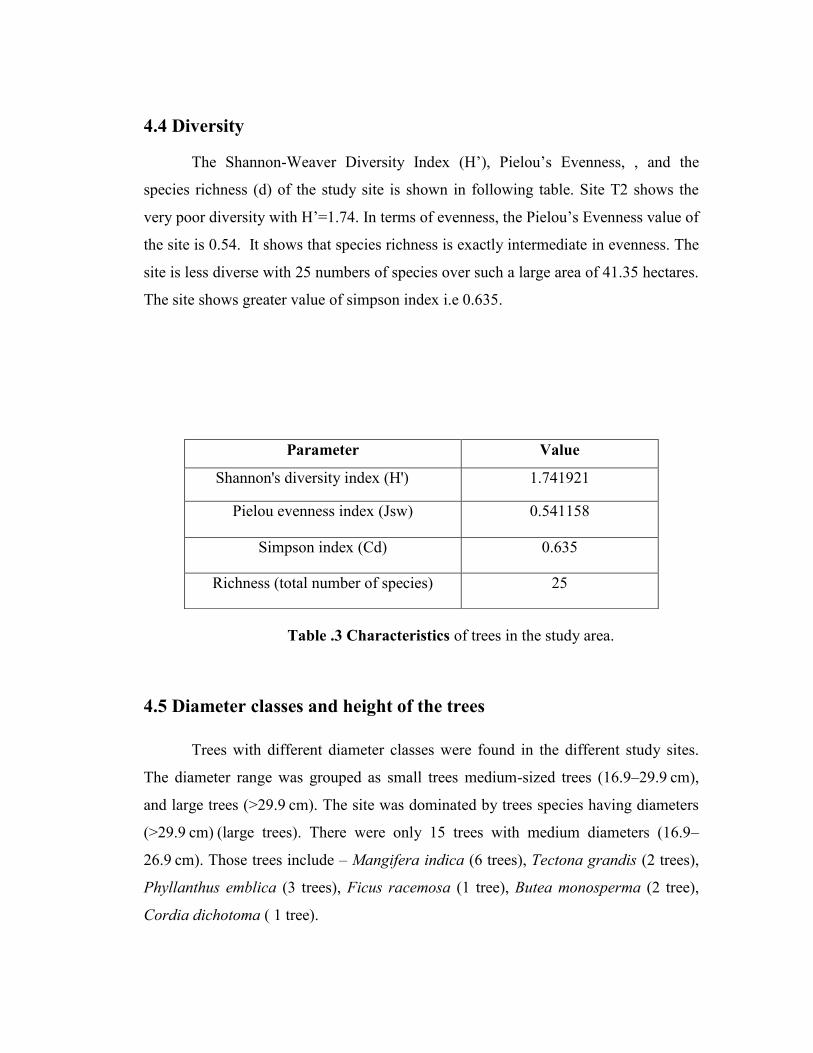
4.4 Diversity
The Shannon-Weaver Diversity Index (H’), Pielou’s Evenness, , and the
species richness (d) of the study site is shown in following table. Site T2 shows the
very poor diversity with H’=1.74. In terms of evenness, the Pielou’s Evenness value of
the site is 0.54. It shows that species richness is exactly intermediate in evenness. The
site is less diverse with 25 numbers of species over such a large area of 41.35 hectares.
The site shows greater value of simpson index i.e 0.635.
Table .3 Characteristics of trees in the study area.
4.5 Diameter classes and height of the trees
Trees with different diameter classes were found in the different study sites.
The diameter range was grouped as small trees medium-sized trees (16.9–29.9 cm),
and large trees (>29.9 cm). The site was dominated by trees species having diameters
(>29.9 cm) (large trees). There were only 15 trees with medium diameters (16.9–
26.9 cm). Those trees include – Mangifera indica (6 trees), Tectona grandis (2 trees),
Phyllanthus emblica (3 trees), Ficus racemosa (1 tree), Butea monosperma (2 tree),
Cordia dichotoma ( 1 tree).
Parameter Value
Shannon's diversity index (H') 1.741921
Pielou evenness index (Jsw) 0.541158
Simpson index (Cd) 0.635
Richness (total number of species) 25

Out of the 317 species identified in the study sites, 310 species were treelets,
mostly <10 m tall, and 7 species were understory trees <20 m tall. No canopy and
emergent tree species were found in the site.
Figure 3 : Girth class of total trees of the area
4.6 Assessment of species protected by specific legislation
The site T2 does not contain any species which is protected by specific
legislation (Rare, endangered, critically endangered, endemic and vulnerable).

5. Discussion:
The Fabaceae were observed to be the most prevalent family. This may be due
to their fast germination ability, associated with sym-biotic properties which have
enabled species to easily establish within this habitat. Fabaceae/Leguminoceae is well
represented family of western ghat. Though site represents Fabaceae as a largest
family, total individuals of this family are less than Mangifera indica of
Anacardiaceae. This is due to the cultivation of Mangifera indica on large area.
Monoculture of Mangifera indica is also one of the reasons for lower value of species
diversity index.
Generally, species diversity is one of the most important indices used to
evaluate an ecosystem. A rich eco-system with high species diversity has a large value
(H’) while an ecosystem with low value (H’) will have low species diversity. The
present study site had a poor diversity of trees. i.e (H’=1.74). In case of Simpson’s
dominance index - The lower the index value, the lower the dominance of species.
The greater the value of index of dominance, the lower is the species diversity. This
site has higher value of dominance index. It shows that this site has low species
diversity.
As shown by Pielou’s Evenness value (0.54), tree community of study area is
exactly intermediate in evenness.
The stem density of tree species increases with increase in girth class
distribution in the study area. This could result from anthropogenic activities such as
the cutting and burning of trees for plantation crops and domestic purpose by local
people and tribes.
In this site most of the tree species are treelets (small trees) with a height
<10 m. It also signifies anthropogenic disturbance.

6. Conclusion:
This study revealed that the site T2 has low tree species diversity. Fabaceae is
the dominant family and Mangifera indica is the dominant species of this area. The
result of ecological analysis shows that this site is very poor in diversity and disturbed.
It may be due to the anthropogenic activities.
Following major things are observed and concluded from the survey of site T2
a) This site comprises a low level of diversity of Tree species
(b) It has no significance as a habitat for wildlife. No wild life has been
observed during the survey.
(c) It does not includes Trees of a rare, vulnerable or endangered species
(d) This site does not contain tallest layer of vegetation i.e canopy or emergent tree
species are not observed on the site. So it shows poor natural regeneration potential of
the site.
(e) Very few species in the lower girth class also indicates that site has poor
natural regeneration potential
(f) Mangifera indica is representative of the total vegetation but it is
monocultured and its population is more than half of the total population. Large
population of Mangifera is one of the reasons for low value of evenness.

Photo Gallery:
Dominat Mango Plantation


A tree census and inventory Report of T3
Orange Smart City, Mungoshi, Pen, Raigad,
Maharashtra

Location of the Site: Latitude: 180 ’ . ” N
Longitude: 7300 ’ . ” E
Area: 111.26 acre
Vegetation of the site: This study assessed the diversity, abundance,
density of trees in a 111.26 acre plot. Each tree was counted and
marked on a GPS device. This Site is a barren land having very less
vegetation. Only 11 trees are there on this site. No shrub was found on
site. All the trees of this site are treelets (<10 m tall).
Species composition:
Following table shows the different Tree species found in the study
area. A total of 5 species were recorded belonging to 5 families and 5
genera. Table shows the different plant species, their families found on
the study site T3. A total of 11 tree individuals (height above 3 meters)
were recorded in the study site (Table 1). Bombax ceiba is the most
dominant species of the site having 7 individuals.
Common name Scientific name Family No of species
Saver Bombax ceiba Bombacaceae 7
Bhokar Cordia dichotoma Boraginaceae 1
Umber Ficus racemosa Moraceae 1
Nimb Azardirachta indica Meliaceae 1
Hirda Terminalia chebula Combretaceae 1
Table : Species composition of the study site

A Tree census and inventory Report Site T4,
Orange Smart City, Valak-Mungoshi, Pen,
Raigad, Maharashtra

2
Contents Page no
1. Introduction
2. Backround of the Project
2.1 Physical settings of the project site
2.2 Climate
2.3 Rainfall
2.4 Location
3. Scope of the study
3.1 Objectives
3.2 Sampling
3.3 Identification of tree species
3.4 Technology used
3.5 Data processing analysis
4. Results
4.1 Species composition of trees
4.2 Abundance
4.3 Relative abundance
4.4 Diversity
4.5 Diameter classes and height of trees
4.6 Assesment of species protected by specific legislation

3
5. Disscusion
6. Conclusion
7. Recommendations
8. Annexures
Table 1. Species composition of the study site
Table 2. Relative abundance of the species
Table 3. Density and Basal of the different tree species
Figure 1. Location of the Project site

4
Summary of the Report
This study assessed the diversity, abundance, density of trees in a 78.48 ha plot. Each tree
was counted and marked on a GPS device. The girth of the trees and shrubs were measured
and species identified. A total of 17 species belonging to 16 genera and 13 families were
recorded. Leguminosae had the highest number of genera 5 and 5 species. Bombax ceiba
recorded the highest tree density (0.86 individual’s ha-1).
The girth class distribution showed that with the highest number of trees in the larger girth
class (>29.9 cm). Tree number decreases with lower girth (<29.9) class. In this site all the tree
individuals are small trees (treelets) except 2. Diameter class of the trees shows that site is
disturbed with anthropogenic activities. A dominance index of trees was 0.52.
Site T4 shows the very poor diversity with H’=1.44. In terms of evenness, the Pielou’s
Evenness value of the site is 0.50. It shows that site has intermediate value for evenness. If
this site is selected for any developmental activity, along with conservation, more focus
should be given for mixed plantation including different native species of Herbs, Shrubs and
Trees. It will increase species richness of the site and will provide protected habitat for
different faunal species of nearby area.
This site has one patch having dense and diverse vegetation of shrubs and trees. One deity is
there in the middle of this vegetation patch. This vegetation patch must be conserved and 100
% protection should be to this specific patch while developing the site.

5
Introduction
The present document is a Tree census and inventory report of the ‘Integrated Industrial
Township’ at Pen, Dist Raigad, Maharashtra. The present Tree census and inventory report
was done to quantify, map and to create an inventory of Tree species.
The study gives a detailed account of Tree diversity, health status, density, distribution and
their locations by using GIS and mapping tool.
Physical setting of the Proposed Project Site:
The proposed “Integrated Industrial Township” by Karanja Infrastructure (P) Ltd. will be
developed in Pen region of Raigad district. Raigad district forms a part of Maharashtra
littoral, the micro level divisions of coastal plain. Though the districts form an important part
of the traditional “Konkan Plain”, ruggedness and uneven topography form the governing
theme in its physical features. The Sahyadri (Western Ghats) in the east send several
transverse numbers of subsidiary hills westwards denying the plains of a uniform level and
continuous character.
The proposed site lies on leeward side of Sahyadri i.e Western ghat. The project site is
irregular in shape and overlooks the River Bhogeshwari & Balganga. The site is at a height of
185 meters above mean sea level. The highest point within the site is at 201m whereas the
lowest point of the site is at 84 meter. This site is highly contoured with a little vegetation
cover.
Climate:
The climate of the district is typical of that on the west coast of India, with plentiful, regular
and seasonal rainfall during the monsoon season. Being a coastal district, the diurnal and
seasonal variations in temperature is not large. The temperature here averages 26.9°C.
Rainfall:
The south- west monsoon commences by about the first week of June and the rains continue
till about the beginning of October. The average rainfall for the district is 3207 mm.

6
Location: T4: Latitude: 18047’26.51” N
Longitude: 73005’27.74” E
Figure 1. Location of the Project site

7
2.0 Scope of the study
2.1 Objectives:
1. To make an inventory of tree individuals and tree species in the proposed project site with
the help of GPS
2. To create a distribution / vegetation map of the whole area representing Tree individuals
3. To undertake ecological analysis with the help of
a. Abundance, Relative abundance
b. Density and Basal area
c. Simpson’s biodiversity Index, Shannon’s Biodiversity index
d. Diameter class and height of the trees
4. Assessment of species protected by specific legislation (Rare, endangered, critically
endangered, endemic and vulnerable)
2.2. Sampling
Since the purpose of the project was to create a detailed inventory of Tree individuals and
species, the “Census” was used as a sampling technique. In total, 193.95, acres of the project
site were surveyed and each tree was counted and marked on a GPS device.
Within each plot (survey no), all individual trees were identified, measured, and recorded.
The diameters at breast height of the species were measured using a measuring tape. Trees
were grouped into the following diameter classes: medium-sized trees (16–29.9 cm), and
large trees (>29.9 cm).
1. These species were further grouped into four life forms defined by their maximum
attainable heights as follows: treelets (small trees) (<10 m), understorey (10–20 m),
canopy (20–30 m), and emergent (>30 m) .
2.3 Identification of Tree species
Most of the tree species encountered were identified on field on the basis of their
morphological characters - Bark shape, texture, and color, Leaves- shape, size, texture, color,
arrangement, flower and fruit color, shape, size, internal morphology, odor and arrangement

8
of reproductive features. Morphological characteristics were used to identify the Tree species
to the species level. The Flora of Maharashtra, and Bombay Presidency were used as
references and online database of The International Plant Names Index (IPNI) was used to
find out the latest and acceptable international scientific name of the Tree species.
2.4 Technology used
GPS device (GARMIN 76S) was used to take GPS positioning of each tree individuals.
ArcGIS was used as platform to create GIS based maps.
2.5 Data Processing and Analysis
(i) Density, abundance, Relative abundance of plant species were calculated. The basal area
of each individual tree species was calculated
(ii) Species diversities and evenness were determined using
a) The Shannon-Weaver Diversity Index
Where Pi = ni/N, ni = number of individuals of species and N = total number
of individuals
Typical values are generally between 1.5 and 3.5 in most ecological studies,
and the index is rarely greater than 4. A Plant community is said to be rich if it has a
Shannon Diversity value ≥3.5.
b) Simpson's Diversity Index
n = the total number of organisms of a particular species
N = the total number of organisms of all species
The value of D ranges between 0 and 1. With this index, 1 represents infinite diversity and 0,
no diversity.

9
c) Pielou evenness index (Jsw) is calculated as SHHHJsw ln'' '
max
3. Results
3.1 Species composition of Trees
Table 1(see Annexure file) shows the different Tree species found in the study area. A total
of 17 species were recorded belonging to 13 families and 16 genera. Table 1 shows the
different plant species, their families found in the study site T3. A total of 103 tree
individuals (height above 3 meters) were recorded in the study site (Table 1).
3.2 Abundance
From the 13 families recorded in the study sites, the Leguminosae had the highest number of
genera (5) and species (5) followed by the Moraceae with 2 species and 1 genus. A total of 16
genera were recorded in the study sites. Bombax ceiba (Bombacaceae) was the most abundant
Tree species. This was followed by the species Erythrina stricta (Leguminosae), Casearia
tomentosa (Salicaceae) and having 5 species of both.
There were 9 rare species of this site having only one individual. All those species are native
to India. No exotic species was found on the site except disturbed plantation Acacia
auriculiformis. It must be caused by cutting of large Acacia auriculiformis trees.
3.3 Relative abundance
Table 2 (see Annexure file) shows the different trees species found in the study sites and their
relative abundance. In this site, 103 individuals were sampled. The species with the highest
number of individual is Bombax ceiba (68) with a relative abundance of 70.04%. It was
followed by Erythrina stricta and casearia tomentosa (5 individuals and relative abundance
of 5.15%).
3.4 Diversity
The Shannon-Weaver Diversity Index (H’), Pielou’s Evenness, and the species richness (d) of
the study site is shown in following table. Site T4 shows the very poor diversity with
H’=1.44. In terms of evenness, the Pielou’s Evenness value of the site is 0.50. It shows that

10
site has intermediate value i,e 0.5 for evenness. The site is less diverse with 17 numbers of
species over such a large area of 193.95 acres. The site shows intermediate value of simpson
index i.e 0.52
Table .3 Characteristics of trees in the study area.
3.5 Diameter classes and height of the trees
Trees with different diameter classes were found in the different study sites. The diameter
range was grouped as medium-sized trees (16.9–29.9 cm), and large trees (>29.9 cm). 24 tree
species of the area were measured between 16.9–26.9 cm. 79 species are large trees (>29.9)
Out of the 103 species identified in the study sites, 101 species were treelets (<10 m tall), and
only 2 species were understory trees (10-20 m tall ).
3.6 Assessment of species protected by specific legislation
The site T4 does not contain any species which is protected by specific legislation (Rare,
endangered, critically endangered, endemic and vulnerable)
4. Discussion:
The Leguminosae were observed to be the most prevalent family. This may be due to their
fast germination ability, associated with sym-biotic properties which have enabled species to
easily establish within this habitat. Leguminoceae is well represented family of western ghat.
The site T4 represents Leguminosae as a largest family having 5 genera and 5 species of this
family.
Parameter Value
Shannon's diversity index (H') 1.4463
Pielou evenness index (Jsw) 0.50
Simpson index (Cd) 0.52
Richness (total number of species) 17

11
The species with highest number of individual is Bombax ceiba (68) with a relative
abundance of 70.04%. The seed dispersal mechanism is very important in species distribution
and composition of woody plants. Bombax ceiba shows anomophilous mode of seed disperal.
This may be one of the reasons for its population and evenly distribution in and outside the
study area.
There were 9 rare species of this site having only one individual. All those species are native
to India. No exotic species was found on the site except disturbed and plantation Acacia
auriculiformis. It must be caused by cutting of large Acacia auriculiformis trees.
Photograph of disturbed plantation – Acacia auriculiformis
Generally, species diversity is one of the most important indices used to evaluate an
ecosystem. A rich eco-system with high species diversity has a large value (H’) while an
ecosystem with low value (H’) will have low species diversity. The present study site had a
poor diversity of trees. i.e (H’=1.44). In case of Simpson’s dominance index - The lower the
index value, the lower the dominance of species. The greater the value of index of
dominance, the lower is the species diversity. This site has intermediate value of dominance
index (0.52). It shows that this site is having intermediate status of species diversity.
As shown by Pielou’s Evenness value (0.50), tree community of study area has intermediate
level of evenness.

12
The stem density of tree species increases with increase in girth class distribution in the study
area. This could result from anthropogenic activities such as the cutting and burning of trees
for plantation crops and domestic purpose by local people and tribes.
In this site out of 103 trees, 101 are small sized trees (treelets) with a height smaller than
10m. It also signifies anthropogenic disturbance.
Instead of having low species diversity, this site has one patch where tree diversity is high.
Though this specific patch is small, it has dense vegetation compare to other area. This patch
has dense and diverse shrub and tree diversity than other vegetation patches of the site.
Woody climbers are also present on some trees. One deity is there in the middle of this
vegetation patch. Tribes and communities of surrounding area respects and do worship of this
deity.
Photograph of Deity on site T4
5. Conclusion:
This study revealed that the site T4 has low tree species diversity. Leguminosae is the
dominant family and Bombax ceiba is the dominant species of this area. The result of
ecological analysis shows that this site is very poor in diversity and disturbed. It may be due
to the anthropogenic activities.
Though this site is poor in species diversity, this site has one patch having dense and diverse
vegetation of shrub and tree. One deity is there in the middle of this vegetation patch. This

13
vegetation patch must be conserved and 100 % protection should be to this area while
developing the site
Following major things are observed and concluded from the survey of site T1
a) All the species of this area are native to Maharashtra.
b) This site comprises a low level of diversity Tree species.
c) Tree community of study area showed intermediate value for evenness.
e) It has no significance as a habitat for wildlife. No wild life has been
observed during the survey.
f) It does not includes Trees of a rare, vulnerable or endangered species
g) This site has more individuals of small size (treelets). So the site shows
good natural regeneration potential.
h) Very few species in the lower girth class shows anthropogenic
disturbance. This could result from anthropogenic activities such as the
cutting and burning of trees for plantation of crops and domestic purpose
by local people and tribes.
6. Recommendations:
1. If this site is selected for any developmental activity, along with conservation more
focus should be given for mixed plantation. Plantings should include a diverse array
of species, genera, and families, of different herbs shrubs and trees. This will provide
protected habitat for different faunal species of nearby area.
2. Particularly those trees other than Bombax ceiba and exotic species should be selected
for plantation.
3. The removal of disturbed plantation of Acacia auriculiformis and re- plantation of the
site T4 with different native species will have positive effect on Biodiversity
4. This site has one patch having dense and diverse vegetation of shrub and tree. One
deity is there in the middle of this vegetation patch. This vegetation patch must be
conserved and 100 % protection should be to this area while developing the site.
5. No bird was found during the survey. The reason (which we heard) behind it was
shocking. For some tribes living near study area, some birds still form a part of their
diet. Tribes near the study area still lead a nomadic life and hunt some birds for food.

14
If this site is planted with different native species of herbs, shrubs and trees. And
along with this if supply of fresh, clean water is provided within the site then it will
attract many birds. Creation of these types of environments within the Industrial
Township will give roosting, protective place for birds. This will be a major step
towards sustainability.
6. Maintain and restore plants native to the place, so as to facilitate adaptability and reap
the environmental benefits. Benefits and time are lost when older trees are removed
and replaced with smaller and younger tree species.
7. Protect or restore existing water bodies, so as to promote biodiversity.
8. Transplantation is a good option to protect Biodiversity.

Annexure-XXIII
Approved Layout Plans
Approved Concept Master Plan

Approved Layout Plan for T1 Land parcel

Approved Layout Plan for T2 Land parcel

Approved Layout Plan for T3 Land parcel

Approved Layout Plan for T4 Land parcel