proposed active pharmaceutical - Environmental Clearance
261
PROPOSED ACTIVE PHARMACEUTICAL INGREDIENTS (APIS) AND API INTERMEDIATES MANUFACTURING UNIT AT D-10, MIDC PAITHAN, DISTRICT.AURANGABAD, MAHARASHTRA BY M/S. SHALINI ORGANICS PRIVATTE. LIMITED, PROPOSAL FOR ENVIRONMENT CLEARANCE Industry falls under 5(f) under Category ‘A’ as per the EIA Notification, 2006 and amendments thereof Report Prepared By: DR. SUBBARAO’S ENVIRONMENT CENTER ‘Arundhati’, Opp. Sahyognagar, MSEB Road, Vishrambag, Sangli-416415 Phone: 0233-2301857, (M) 9372109522,9890992118 QCI-NABET Accredited EIA Consultant Organization Certificate No. NABET/EIA/1922/ RA 0159
-
Upload
khangminh22 -
Category
Documents
-
view
3 -
download
0
Transcript of proposed active pharmaceutical - Environmental Clearance

PROPOSED ACTIVE PHARMACEUTICAL
INGREDIENTS (APIS) AND API INTERMEDIATES
MANUFACTURING UNIT
AT
D-10, MIDC PAITHAN, DISTRICT.AURANGABAD,
MAHARASHTRA
BY
M/S. SHALINI ORGANICS PRIVATTE. LIMITED,
PROPOSAL FOR
ENVIRONMENT CLEARANCE
Industry falls under 5(f) under Category ‘A’ as per the EIA
Notification, 2006 and amendments thereof
Report Prepared By:
DR. SUBBARAO’S ENVIRONMENT CENTER
‘Arundhati’, Opp. Sahyognagar, MSEB Road,
Vishrambag, Sangli-416415
Phone: 0233-2301857, (M) 9372109522,9890992118
QCI-NABET Accredited EIA Consultant Organization
Certificate No. NABET/EIA/1922/ RA 0159
NABL Quality Assurance Laboratory Accreditation
Certificate No.TC-6121

M/s. Shalini Organics Pvt. Ltd., MIDC Paitha, Dist- Aurangabad. EIA/EMP
Page ii
DECLARATION
Declaration by Experts contributing to the EIA “Proposed Active Pharmaceutical Ingredients
(APIs) and API Intermediates Manufacturing Unit at Plot No. D-10, MIDC Paithan-431107,
Taluka- Paithan, Dist.- Aurangabad, Maharashtra, by Shalini Organics Private Limited”. I,
herby, certify that I was a part of the team in the following capacity that developed the above EIA.
EIA coordinator:
Name: Dr. B. Subbarao
Signature Date: 31st May 2021
Period of involvement: December 2020 Onwards
Contact information: ‘Arundhati’, opposite- Sahayognagar, M.S.E.B. Road, Sangli 416415.
Sr.
No.
Name of
Expert/s
EC/FAE
Sector Involvement (Period and Task) Date Signature
1. Dr. B.
Subbarao
EIA
Coordinator
WP, SHW,
AP,AQ
December 2020 Onwards
Overall Project Coordination including
Planning Schedule Discussions with
project proponent/local community,
interpretation of data, Overall
assessment of impacts and its mitigation
measures and preparation of EIA report.
1st December
2020 to till
completion
of project.
2. Mrs. B.
Nagjyoti WP
December 2020 Onwards
Project Planning in Coordination with
EIA Coordinator. Preparation of Waste
Water Management Plan, Selection of
sampling stations, interpretation of the
data, identification of impacts and its
mitigation measures.
1stDecember
2020 to till
completion of
project
3. Dr. S. P.
Chavan NV
December 2020 Onwards
Assessment and Prediction of Impact
Noise Quality on the project site and
entire study area due to the proposed
expansion and Preparation of Report.
1stJanuary
2020 to 1st
February
2020.
4. Dr. V. B.
Jugale SE
December 2020 Onwards
Baseline study related with Socio-
economic Status of the project site and
entire study area. Identification of
impacts (Positive & negative) by
proposed project in study area.
Suggestion for improvement of social
status of the study area.
1stJanuary
2020 to
1stFebruary
2020.
5. Mr. S. V.
Chikurde LU
December 2020 Onwards
Assessment of Land use and Land Cover
of the project site and entire study area.
Categorization of land use pattern based
on the Satellite imagery and supporting
software.
1st February
2020 to
1stMarch
2020.

M/s. Shalini Organics Pvt. Ltd., MIDC Paitha, Dist- Aurangabad. EIA/EMP
Page iii
Sr.
No.
Name of
Expert/s
EC/FAE
Sector Involvement (Period and Task) Date Signature
6. Mr. G. G.
Watwe RH
December 2020 Onwards
Identification of Risk associated with
the project, Preparation of Disaster
Management Plan, Occupational Health
and Safety etc. Preparation of Risk
Assessment Report.
1st February
2020 to 1st
March 2020.
7.
Prof. M.
B.
Kulkarni
HG & GEO
December 2020 Onwards
Assessment of Hydro-geological
condition of the project and study area,
Prediction of impacts due to the
proposed project and preparation of
Management Plan for the same.
1stJanuary
2020 to 1st
February
2020.
8. Mr. D. D.
Shenai EB
December 2020 Onwards
Assessment of Impact due to proposed
project on Ecology & biodiversity of the
project site and preparation of
Management Plan for the same
1stFebruary
2020 to
1stMarch
2020.
9. Mr. S. A.
Khatode AQ
December 2020 Onwards
Project Planning in Coordination with
EIA Coordinator. Baseline study related
to Air Qualityand, identification of
impacts and its mitigation measures.
1stDecember
2020 to till
completion of
project
10. Mr. A.S.
Tompe WP
December 2020 Onwards
Project Planning in Coordination with
EIA Coordinator. Preparation of Waste
Water Management Plan, Selection of
sampling stations, interpretation of the
data, identification of impacts and its
mitigation measures.
1stDecember
2020 to till
completion of
project
Declaration by the Head of the accredited consultant organization/authorized person
I, Dr. B. Subbarao hereby, confirm that the above mentioned experts prepared the EIA for “Proposed Active
Pharmaceutical Ingredients (APIs) and API Intermediates Manufacturing Unit at Plot No. D-10, MIDC
Paithan-431107, Taluka- Paithan, Dist.- Aurangabad, Maharashtra, by Shalini Organics Private Limited”.
I also confirm that the consultant organization shall be fully accountable for any mis-leading information
mentioned in this statement.
Signature: Date: 31st May 2021
Designation: Head of the Organization
Name of the EIA consultant organization: DR. SUBBARAO’S ENVIRONMENT CENTER
NABET Certificate No.& Issue Date: NABET/ EIA/1922/RA 0159, Issue date- 29.05.2020
M/s. Shalini Organics Pvt. Ltd., MIDC Paitha, Dist- Aurangabad. EIA/EMP
Page iv
CONSULTANANT UNDERTAKING

M/s. Shalini Organics Pvt. Ltd., MIDC Paitha, Dist- Aurangabad. EIA/EMP
Page v
TABLE OF CONTENTS
DECLARATION .......................................................................................................................................... ii
CONSULTANANT UNDERTAKING ....................................................................................................... iv
TABLE OF CONTENTS .............................................................................................................................. v
LIST OF TABLES ...................................................................................................................................... xii
LIST OF FIGURES .................................................................................................................................... xv
LIST OF ABBREVIATIONS ................................................................................................................... xvii
EXECUTIVE SUMMERY ........................................................................................................................... 1
1. INTRODUCTION .............................................................................................................................. 15
1.1. Preface......................................................................................................................................... 15
1.2. Purpose of the Project ................................................................................................................. 15
1.3. Identification of Project and Project Proponent .......................................................................... 16
1.4. Importance of the Project ............................................................................................................ 16
1.5. Brief Description of the Project .................................................................................................. 17
1.6. Applicable Environmental Regulatory frame work – ................................................................. 22
1.7. Scope of EIA Study- ................................................................................................................... 22
1.8. Compliance of Terms of Reference ............................................................................................ 23
1.9. Objective of EIA ......................................................................................................................... 42
1.10. Methodology for EIA .............................................................................................................. 42
1.11. List of Industries Surrounding Project Site ............................................................................. 44
1.12. Structure of EIA Report .......................................................................................................... 44
2. PROJECT DESCRIPTION ................................................................................................................. 32
2.1. Introduction ................................................................................................................................. 32
2.2. Need of the Project ...................................................................................................................... 32
2.3. Location of the Project ................................................................................................................ 33
2.4. Size or magnitude of Operation .................................................................................................. 36
2.4.1. Land Breakup & Project Site Layout .................................................................................. 36
2.5. Project Magnitude ....................................................................................................................... 75
2.6. Infrastructure Facilities (Proposed Plant Machineries and Equipment’s) ................................... 77
2.7. Description of Manufacturing Process- ...................................................................................... 80
2.7.1. API Product Manufacturing Process-.................................................................................. 80
2.8. Input Requirements ..................................................................................................................... 84
2.8.1. Raw Material Requirement ................................................................................................. 84
M/s. Shalini Organics Pvt. Ltd., MIDC Paitha, Dist- Aurangabad. EIA/EMP
Page vi
2.8.2. Water Requirement ............................................................................................................. 90
2.8.3. Power: ................................................................................................................................. 92
2.8.4. Fuel requirement details: ..................................................................................................... 92
2.8.5. Man Power .......................................................................................................................... 92
2.9. Generation of Pollutants.............................................................................................................. 92
2.10. Gaseous Emission ................................................................................................................... 92
2.10.1. Hazardous & Solid waste generation .................................................................................. 94
2.11. Pollution Control Strategy ...................................................................................................... 95
2.11.1. Effluent Management .......................................................................................................... 95
2.9.2 Air Pollution Control (APC) Measures ............................................................................. 104
2.11.2. Hazardous/Solid Waste Management ............................................................................... 105
2.11.3. Noise Pollution Control Measures .................................................................................... 106
2.12. Rain Water Harvesting .......................................................................................................... 106
2.13. Green Belt Development ....................................................................................................... 106
2.14. Occupational Health and Safety ............................................................................................ 107
3. DESCRIPTION OF ENVIRONMENT ............................................................................................ 108
3.1. General ...................................................................................................................................... 108
3.2. Study Area ................................................................................................................................ 108
3.3. Study Period .............................................................................................................................. 109
3.4. Source of Environmental Data Generation ............................................................................... 110
3.5. Methodology ............................................................................................................................. 110
3.5.1. Land Use of Study Area .................................................................................................... 110
3.5.2. Land Environment............................................................................................................. 111
3.5.3. Methodology ..................................................................................................................... 111
3.5.4. Pre-Field Interpretation Of Satellite Data ......................................................................... 112
3.6. Topography ............................................................................................................................... 112
3.6.1. Land Use/Land Cover Classification ................................................................................ 113
3.6.2. Core Land Use .................................................................................................................. 114
3.7. Meteorology .............................................................................................................................. 118
3.7.1. Site specific micro-meteorological data ............................................................................ 118
3.7.2. Windrose – ........................................................................................................................ 119
3.8. Ambient Air Quality ................................................................................................................. 120
3.8.1. Introduction ....................................................................................................................... 120

M/s. Shalini Organics Pvt. Ltd., MIDC Paitha, Dist- Aurangabad. EIA/EMP
Page vii
3.8.2. Selection of Sampling Locations ...................................................................................... 121
3.8.3. Reconnaissance ................................................................................................................. 121
3.8.4. Parameters, Frequency and monitoring Methodology ...................................................... 121
3.8.5. Interpretation of result ....................................................................................................... 125
3.8.6. Noise Environment ........................................................................................................... 125
3.9. Hydrogeology ........................................................................................................................... 126
3.10. Hydrogeology of District ...................................................................................................... 129
3.10.1. Geology ............................................................................................................................. 130
3.11. Ground Water Sampling ....................................................................................................... 131
3.12. Surface Water Sampling ....................................................................................................... 137
3.13. Soil Environment .................................................................................................................. 143
3.14. Ecology & Biodiversity ........................................................................................................ 145
3.15. Socioeconomic Study ............................................................................................................ 160
4. ANTICIPATED ENVIRONMENTAL IMPACTS AND MITIGATION MEASURES.................. 166
4.1. Introduction ............................................................................................................................... 166
4.2. Construction Phase .................................................................................................................... 166
4.2.1. Land Environment Impacts ............................................................................................... 166
4.2.2. Air Environment ............................................................................................................... 167
4.2.3. Water Environment ........................................................................................................... 168
4.2.4. Noise Environment ........................................................................................................... 168
4.2.5. Waste Generation .............................................................................................................. 169
4.2.6. Ecology ............................................................................................................................. 169
4.2.7. Social Environment ........................................................................................................... 169
4.3. Operation phase ........................................................................................................................ 170
4.3.1. Land Environment and Location ....................................................................................... 170
4.3.2. Discharges on Land-Impact .............................................................................................. 170
4.3.3. Impacts- Soil Contamination- ........................................................................................... 170
4.3.4. Air Environment ............................................................................................................... 170
4.3.5. Noise Environment ........................................................................................................... 181
4.3.6. Vibration ........................................................................................................................... 183
4.3.7. Water Environment ........................................................................................................... 183
4.3.8. Land Use/Land Cover ....................................................................................................... 184
4.3.9. Geology ............................................................................................................................. 184

M/s. Shalini Organics Pvt. Ltd., MIDC Paitha, Dist- Aurangabad. EIA/EMP
Page viii
4.3.10. Solid/Hazardous Wastes ................................................................................................... 184
4.3.11. Risk and Occupational Hazards ........................................................................................ 184
4.3.12. Ecological Biodiversity ..................................................................................................... 186
4.3.13. Traffic Study ..................................................................................................................... 187
4.3.14. Odor Management............................................................................................................. 188
4.3.15. Socio- Economic ............................................................................................................... 188
5. ANALYSIS OF ALTERNATIVES (TECHNOLOGY & SITE) ..................................................... 190
5.1. Analysis to alternative- ............................................................................................................. 190
5.2. Site Alternative ......................................................................................................................... 190
5.3. Process Alternative ................................................................................................................... 191
6. ENVIRONMENTAL MONITORING REPORT ............................................................................. 192
6.1. Prelude ...................................................................................................................................... 192
6.2. Environmental Monitoring Programme .................................................................................... 192
6.3. Action Scheduled ...................................................................................................................... 193
6.4. Success Indicator ...................................................................................................................... 194
6.5. Environmental Monitoring Hierarchy ....................................................................................... 194
6.6. Conclusion ................................................................................................................................ 194
7. ADDITIONAL STUDIES ................................................................................................................ 195
7.1. Introduction - ............................................................................................................................ 195
7.2. Objectives and Scope of work .................................................................................................. 195
7.2.1. Details of source of water, fire water tanks and fire Fighting equipments (f/e’s, fier
hydrants, nozzles & monitors) .......................................................................................................... 197
7.2.2. Availability of fire extinguishers at strategic locations and accessories and medical
facilities 197
7.3. Hazard identification and visualization of mca scenarios ......................................................... 197
7.4. Hazard potential: Deciding factor ............................................................................................. 197
7.5. Identification of hazards............................................................................................................ 197
7.5.1. M/s Shalini organics as per MSIHC rules, 2000 ............................................................... 198
7.5.2. Fire Explosion & Toxicity Index (FEI & TI) Analysis for Shalini organics .................... 200
7.6. Visualization of MCA Scenarios .............................................................................................. 204
7.6.1. Introduction ....................................................................................................................... 204
7.6.2. Chemical InventoryAnalysis ............................................................................................. 204
7.6.3. Identification of Chemical Release & Accident Scenarios ............................................... 204
7.6.4. Even tree analysis to define outcome of release ............................................................... 204

M/s. Shalini Organics Pvt. Ltd., MIDC Paitha, Dist- Aurangabad. EIA/EMP
Page ix
7.6.5. Short listing of mca scenarios ........................................................................................... 204
7.7. Consequence analysis ............................................................................................................... 208
7.7.1. Factors which influence the use of physicAL EFFECT MODEL .................................... 209
7.8. Models for Determining the Source Strength for The Release of Hazardous Substances ........ 209
7.8.1. Instantaneous Release ....................................................................................................... 209
7.8.2. Semi-Continuous Outflow ................................................................................................ 209
7.9. Model for Evaporation .............................................................................................................. 210
7.10. Model for Dispersion ............................................................................................................ 211
7.11. Modelfor HeatLoad sndShock Waves .................................................................................. 211
7.11.1. Model for Flare ................................................................................................................. 211
7.11.2. Model for Pool Fire ........................................................................................................... 211
7.12. Vulnerability Model .............................................................................................................. 211
7.12.1. Injuries resulting from flammable liquids and gases ........................................................ 212
7.12.2. Damage models for heat radiation .................................................................................... 212
7.12.3. Summary of damage criteria ............................................................................................. 212
7.13. Result of maximum credible accident analysis (Mca) .......................................................... 214
7.14. Catagorization risk based on above identifies mca’s ............................................................ 216
7.15. Analysis for propensity towards predicted consequences ..................................................... 217
7.15.1. Possibility of fire & it’S propagation ................................................................................ 217
7.15.2. Spilled Product fire ........................................................................................................... 217
7.15.3. Jet fire in Pipeline/product pump house/tank farm/tt decanting area/tank truck ............... 217
7.15.4. Propensity of the Installation towards occurance of such initiating event ........................ 217
7.15.5. Propensity of failure of the designed counter measures .................................................... 217
7.15.6. Propoensity of a certain consequence of an accident ........................................................ 217
7.15.7. Probability estimation for occurance of mca scenario ...................................................... 218
7.16. Uncertainty surrounding consequence analysis .................................................................... 218
7.17. Alarp principle ...................................................................................................................... 218
7.17.1. Mitigation/preventive measures for mca scenarios ........................................................... 221
7.17.2. Recommendations ............................................................................................................. 241
8. PROJECT BENEFITS ...................................................................................................................... 243
8.1. Introduction ............................................................................................................................... 243
8.2. Improvement in Physical Infrastructure .................................................................................... 243
8.3. Direct Revenue Earning to the National & State Exchequer .................................................... 243

M/s. Shalini Organics Pvt. Ltd., MIDC Paitha, Dist- Aurangabad. EIA/EMP
Page x
8.4. Employment Potential ............................................................................................................... 243
8.5. Other Tangible Benefits ............................................................................................................ 243
9. ENVIRONMENTAL COST BENEFIT ANALYSIS ....................................................................... 245
10. ENVIRONMENTAL MANAGEMENT PLAN ........................................................................... 246
10.1. Introduction ........................................................................................................................... 246
10.2. Environmental management plan during Construction Phase .............................................. 246
10.2.1. 10.2.1 Air and Noise Environment ................................................................................... 246
10.2.2. Water supply & sanitation ................................................................................................. 247
10.2.3. Socio-Economic Environment .......................................................................................... 247
10.2.4. Health and Safety .............................................................................................................. 248
10.3. Environmental Management during the Operational Phase .................................................. 248
10.3.1. Air Pollution Management ................................................................................................ 248
10.3.2. Water Environment ........................................................................................................... 249
10.3.3. Hazardous/Solid Waste Management ............................................................................... 252
10.3.4. Green belt development .................................................................................................... 252
10.3.5. Occupational Health & Safety Plan .................................................................................. 253
10.3.6. Rain Water HarvestingScheme ......................................................................................... 254
10.3.7. Storm water management .................................................................................................. 254
10.4. Post-Project Environmental Monitoring ............................................................................... 254
10.5. Environment Management Budget Allocation ...................................................................... 255
10.6. Environmental Management Cell ......................................................................................... 256
10.6.1. Hierarchical Structure of Environmental Management Cell ............................................. 257
10.6.2. Environment Policy........................................................................................................... 257
10.7. Corporate Environment Responsibility (CER) Activities ..................................................... 257
11. SUMMARY & CONCLUSION ................................................................................................... 259
11.1. Overall Justification for Implementation of Project .............................................................. 259
11.2. Explanation of How, Adverse Effects Have Been Mitigated ................................................ 259
11.3. Conclusion ............................................................................................................................ 259
12. DISCLOSURE OF THE CONSULTANT ................................................................................... 261
LIST OF ANNEXURES ........................................................................................................................... 268
ANNEXURE-I: GRANTED ToR ............................................................................................................. 269
ANNEXURE-II: DISTANCE CERTIFACTE FROM DFO .................................................................... 277
ANNEXURE-III: MIDC ORDER ............................................................................................................ 279

M/s. Shalini Organics Pvt. Ltd., MIDC Paitha, Dist- Aurangabad. EIA/EMP
Page xi
ANNEXURE-IV: MONITORING REPORTS ......................................................................................... 282
ANNEXURE-V: RAINWATER HARVESTING REPORT .................................................................... 299
ANNEXURE-VI: STORMWATER DRAINAGE REPORT ................................................................... 303

M/s. Shalini Organics Pvt. Ltd., MIDC Paitha, Dist- Aurangabad. EIA/EMP
Page xii
LIST OF TABLES
Table 1-1 Silent feature of the project ........................................................................................................ 18
Table 1-2 List of proposed products ........................................................................................................... 19
Table 1-3 Details of API Intermediates ...................................................................................................... 19
Table 1-4 Details of total capacity .............................................................................................................. 22
Table 1-5 ToR Compliance ......................................................................................................................... 23
Table 1-6 List of industries in the study area are shown below .................................................................. 44
Table 2-1 Silent feature of the project ........................................................................................................ 33
Table 2-2 Co-ordinated of the site .............................................................................................................. 33
Table 2-3 Land use breakup ........................................................................................................................ 36
Table 2-4 List of API Products ................................................................................................................... 75
Table 2-5 List of API Intermediates ........................................................................................................... 75
Table 2-6 Total capacity of the project ....................................................................................................... 77
Table 2-7 Plant machineries and equipments details. ................................................................................. 77
Table 2-8 Details of utility .......................................................................................................................... 77
Table 2-9 Details of utility .......................................................................................................................... 77
Table 2-10 Details of Solvent and Mother Liquor tank .............................................................................. 78
Table 2-11 Details of Tanks ........................................................................................................................ 78
Table 2-12 Details of Heat exchanger ......................................................................................................... 79
Table 2-13 ETP plant details ....................................................................................................................... 79
Table 2-14 Details of laboratory ................................................................................................................. 79
Table 2-15 Details of proposed QC Instruments......................................................................................... 79
Table 2-16 List of Raw material ................................................................................................................. 84
Table 2-17 Details of Water Consumption ................................................................................................. 90
Table 2-18 Effluent generation ................................................................................................................... 90
Table 2-19 Summary of water budget ......................................................................................................... 90
Table 2-20 Fuel requirement ....................................................................................................................... 92
Table 2-21 Details of effluent generation ................................................................................................... 92
Table 2-22 Details of emission from process and flue gas ......................................................................... 93
Table 2-23 Details of proposed process and air emission ........................................................................... 93
Table 2-24 Details of stack ......................................................................................................................... 94
Table 2-25 Details of Non-hazardous waste ............................................................................................... 94
Table 2-26 Details of hazardous waste ....................................................................................................... 94
Table 2-27 Characteristic of Untreated HCOD Effluent ............................................................................. 98
Table 2-28 Characteristic of LCOD Effluent- 57.1 M3/day ....................................................................... 98
Table 2-29Characteristic of treated Effluent ............................................................................................... 99
Table 2-30 Technical specification of various unit ................................................................................... 100
Table 2-31 Details of mechanical equipments .......................................................................................... 100
Table 2-32 Details of electrical units ........................................................................................................ 101
Table 2-33 Details of STP ......................................................................................................................... 102
Table 2-34 details of electro-mechanical works ....................................................................................... 103
Table 2-35 Details of air pollution control measure ................................................................................. 104
Table 2-36 Hazardous waste Details ......................................................................................................... 105
Table 2-37 Details of Non-hazardous waste ............................................................................................. 106

M/s. Shalini Organics Pvt. Ltd., MIDC Paitha, Dist- Aurangabad. EIA/EMP
Page xiii
Table 3-1 Environmental settling of study area ........................................................................................ 109
Table 3-2 details of the used satellite details ............................................................................................ 111
Table 3-3 LU/LC within 1 km radius ........................................................................................................ 114
Table 3-4LU/LC and its Coverage Within 10 KM Radius ....................................................................... 116
Table 3-5Frequency of Environmental Monitoring .................................................................................. 119
Table 3-6Monitoring Methodology of Meteorological Data .................................................................... 122
Table 3-7Monitored Parameters and Frequency of Sampling .................................................................. 122
Table 3-8Monitoring locations.................................................................................................................. 123
Table 3-9Monitoring Results and observations ........................................................................................ 124
Table 3-10The Noise Level in study area ................................................................................................. 126
Table 3-11 Seismic Zoning of India ......................................................................................................... 131
Table 3-12Monitoring locations for Ground water sampling ................................................................... 132
Table 3-13Ground water analysis report ................................................................................................... 133
Table 3-14 Surface water locations ........................................................................................................... 137
Table 3-15Surface water analysis report ................................................................................................... 138
Table 3-16Soil Sampling Locations .......................................................................................................... 143
Table 3-17 Soil analysis report ................................................................................................................. 144
Table 3-18The list of plant species ........................................................................................................... 146
Table 3-19 List of fauna ............................................................................................................................ 153
Table 3-20 Deatails of beetels ................................................................................................................... 153
Table 3-21Dertails of Bugs ....................................................................................................................... 154
Table 3-22 Details of Butterflies ............................................................................................................... 154
Table 3-23Details of Mammals................................................................................................................. 156
Table 3-24 Details of Avifauna ................................................................................................................. 156
Table 3-25Villages Identified for Socioeconomic Survey of Study Area ................................................ 161
Table 3-26Socio economic Profile of District, Taluka& Project site at a Glance .................................... 162
Table 3-27 Details of Socio-economic Indicator ...................................................................................... 162
Table 3-28Details on Population of District Aurangabad ......................................................................... 163
Table 3-29Comparison between Rural and Urabn Area ........................................................................... 164
Table 4-1Modeling Input data for Steam boiler of 2 TPH capacity .......................................................... 174
Table 4-2Modeling Input data for Steam boiler of 2 TPH capacity .......................................................... 175
Table 4-3Incremental emission load due to current activity, contributing in existing baseline values..... 180
Table 4-4 Impacts and Mitigation measure ............................................................................................... 183
Table 4-5 Impact and mitigation measures .......................................................................................... 187
Table 4-6Impact and Mitigation Measure for Transportation ................................................................... 188
Table 6-1Environmental Monitoring Program ......................................................................................... 193
Table 7-1 Details of Flamibility ................................................................................................................ 198
Table 7-2 Applicability of MSIHC Rule ................................................................................................... 199
Table 7-3List of hazardous chemicals and its respective DOW F& E Index ........................................... 202
Table 7-4Degree of Hazards ..................................................................................................................... 203
Table 7-5Toxicity Index and degree of Hazard for Hazardous chemicals ................................................ 203
Table 7-6Short Listing of MCA Scenarios for Plant ................................................................................ 205
Table 7-7Mathematical and Analytical Model for Hazard Analysis ........................................................ 208
Table 7-8Fatal Radiation Exposure Levels ............................................................................................... 213
M/s. Shalini Organics Pvt. Ltd., MIDC Paitha, Dist- Aurangabad. EIA/EMP
Page xiv
Table 7-9 Detils of damage due to radiation ............................................................................................. 213
Table 7-10Overpressure Damage.............................................................................................................. 214
Table 7-11 Damage Distances Due to Spilled/Pool Product Fire Scenario, Jet Fire, BLEAVE Fireball
of tank Rupture/failure, Leak from hole in tank ....................................................................................... 215
Table 7-12Risk Matrix .............................................................................................................................. 216
Table 7-13Risk Criteria and Action Requirements ................................................................................... 216
Table 7-14Categorization of Risk as per Identified MCA Scenarios ....................................................... 216
Table 7-15Probability of Occurrences of Identified MCA Scenarios ....................................................... 218
Table 7-16The probabilities for various accident scenarios have been estimated .................................... 218
Table 10-1List of Plants Suggested For Green Belt.................................................................................. 253
Table 10-2Environment Monitoring Plan ................................................................................................. 255
Table 10-3Budget Allocation for Environment Management .................................................................. 255
Table 11-1Summary on Impacts and Mitigation Measures ...................................................................... 259

M/s. Shalini Organics Pvt. Ltd., MIDC Paitha, Dist- Aurangabad. EIA/EMP
Page xv
LIST OF FIGURES
Figure 1-1 Site Photographs ........................................................................................................................ 16
Figure 2-1 Project Location ........................................................................................................................ 34
Figure 2-2 Specific location ........................................................................................................................ 34
Figure 2-3 Layout map ................................................................................................................................ 32
Figure 2-4 10 km radius toposheet .............................................................................................................. 36
Figure 2-5 Water balance diagram .............................................................................................................. 91
Figure 2-6 Details of treatment facilities .................................................................................................... 98
Figure 2-7 Details of RO ............................................................................................................................. 99
Figure 3-1 FCC of the 10 km radius with project location ....................................................................... 112
Figure 3-2 Elevation Profile of NW-SE Direction with in 10 km Radius ................................................ 113
Figure 3-3 Elevation Profile of NE-SW Direction with in 10 km Radius ................................................ 113
Figure 3-4Digital Elevation Model with in 10 km Radius ........................................................................ 113
Figure 3-5LU/LC Details of 1 KM Radius ............................................................................................... 115
Figure 3-6 Pie Chart of The Lu/Lc Classification Within 1 Km Radius .................................................. 115
Figure 3-7LU/LC Details of 10 KM Radius ............................................................................................. 117
Figure 3-8Pie Chart of the Lu/Lc Classification Within 10 KM Radius .................................................. 117
Figure 3-9Drainage Pattern Present in the Study Area Within 10 Km Radius ......................................... 118
Figure 3-10Meteorological Data for the Monitoring Period ..................................................................... 120
Figure 3-11Monitoring Locations for AAQM and Noise ......................................................................... 123
Figure 3-12Seismic zone map of India ..................................................................................................... 131
Figure 3-13Monitoring Locations for Ground water and Surface water sampling locations within 10 Km
.................................................................................................................................................................. 132
Figure 3-14Soil sampling locations within 10 Km radius ........................................................................ 143
Figure 3-15 Photographs of floral species ................................................................................................ 151
Figure 3-16 Photographs of Butterflies ..................................................................................................... 155
Figure 3-17 Photographs of Avifauna ....................................................................................................... 160
Figure 4-1 Wind rose diagram .................................................................................................................. 173
Figure 4-2Air Dispersion Modeling Image for PM10 criteria pollutant ................................................... 176
Figure 4-3Air Dispersion Modeling Image for SO2 criteria pollutant...................................................... 177
Figure 4-4Air Dispersion Modeling Image for NOx criteria pollutant ..................................................... 178
Figure 4-5Air Dispersion Modeling Image for CO criteria pollutant ....................................................... 179
Figure 7-1Event Tree Analysis of failure of Atmospheric Storage tank of Flammable Liquids .............. 206
Figure 7-2FN Curve .................................................................................................................................. 221
Figure 7-3Pool Fire Scenario for Methanol Tanks Enclosed in Tank farm area showing Damage Distances
for considered Heat Intensities .................................................................................................................. 223
Figure 7-4Jet Fire Scenario for Methanol Tanks Enclosed in Tank farm area showing Damage Distances
for considered Heat Intensities .................................................................................................................. 224
Figure 7-5Tank on fire Scenario for Methanol Tanks Enclosed in Tank Farm Area showing Damage
Distances for considered Heat Intensities ................................................................................................. 225
Figure 7-6Pool Fire Scenario for Toluene Tanks Enclosed in Tank farm area showing Damage Distances
for considered Heat Intensities .................................................................................................................. 226
Figure 7-7Jet Fire Scenario for Toluene Tanks Enclosed in Tank farm area showing Damage Distances for
considered Heat Intensities ....................................................................................................................... 227

M/s. Shalini Organics Pvt. Ltd., MIDC Paitha, Dist- Aurangabad. EIA/EMP
Page xvi
Figure 7-8Tank on fire Scenario for Toluene Tanks Enclosed in Tank Farm Area showing Damage
Distances for considered Heat Intensities ................................................................................................. 228
Figure 7-9Pool Fire Scenario for Acetone Tanks Enclosed in Tank farm Area showing Damage Distances
for considered Heat Intensities .................................................................................................................. 229
Figure 7-10Jet Fire Scenario for Acetone Tanks Enclosed in Tank farm area showing Damage Distances
for considered Heat Intensities .................................................................................................................. 230
Figure 7-11Tank on fire Scenario for Acetone Tanks Enclosed in Tank Farm Area showing Damage
Distances for considered Heat Intensities ................................................................................................. 231
Figure 7-12: Pool Fire Scenario for Ethyl Acetate Tanks Enclosed in Tank farm Area showing Damage
Distances for considered Heat Intensities ................................................................................................. 232
Figure 7-13Jet Fire Scenario for Ethyl Acetate Tanks Enclosed in Tank farm area showing Damage
Distances for considered Heat Intensities ................................................................................................. 233
Figure 7-14Tank on fire Scenario for Ethyl Acetate Tanks Enclosed in Tank Farm Area showing Damage
Distances for considered Heat Intensities ................................................................................................. 234
Figure 7-15Pool Fire Scenario for Denatured Sprit Tanks Enclosed in Tank farm Area showing Damage
Distances for considered Heat Intensities ................................................................................................. 235
Figure 7-16Jet Fire Scenario for Denatured Sprit Tanks Enclosed in Tank farm Area showing Damage
Distances for considered Heat Intensities ................................................................................................. 236
Figure 7-17Tank on fire Scenario for Denatured Sprit Tanks Enclosed in Tank Farm Area showing Damage
Distances for considered Heat Intensities ................................................................................................. 237
Figure 7-18Pool Fire Scenario for Triethyl amine drum Enclosed in Tank farm Area showing Damage
Distances for considered Heat Intensities ................................................................................................. 238
Figure 7-19Damage Distances Due to BLEVE Fire ball in Triethyl Amine ............................................ 239
Figure 7-20Pool Fire Scenario for HSD drum Enclosed in Tank farm Area showing Damage Distances for
considered Heat Intensities ....................................................................................................................... 240
Figure 10-1Environment Management Cell ............................................................................................. 257

M/s. Shalini Organics Pvt. Ltd., MIDC Paitha, Dist- Aurangabad. EIA/EMP
Page xvii
LIST OF ABBREVIATIONS
AERMOD : American Meteorological Society/Environmental Protection Agency Regulatory
Model
APC : Air Pollution Control
APHA : The American Public Health Association
BCS : Black Cotton Soil
BLEVE : Boiling Liquid Expanding Vapour Explosion
BOD : Biological Oxygen Demand
CER Corporate Environment Responsibilities
COD : Chemical Oxygen Demand
CPCB : Central Pollution Control Board
CSR : Corporate Social Responsibilities
CTO : Consent to Operate
dB : Decibel
DG Set : Disel Generator Set
DMC : Disaster Management Cell
DO : Dissolved Oxygen
EAC : Expert Appraisal Committee
ECC : Emergency Control Centre
EIA : Environmental Impact Assessment
EMP : Environmental Management Plan
ERPGs : Emergency Response Planning Guidelines
ETP : Effluent Treatment Plant
GCV : Gross Calorific Value
GIS : Geographic information system
GLCs : Ground Level Concentrations
HAZOP : Hazard and Operability Study
HIRA : Hazard Identification & Risk Assessment
IMD : The India Meteorological Department
IMFL : Indian made Foreign Liquor
KLPD : Kilo Liter Per Day
KVA : Kilo-Volt-Ampere
MCA : Maximum Credible Accident Analysis
MCLS : Maximum Credible Loss Scenario
MCR : Maximum Continuous Rating
MEE : Multiple Effect Evaporator
MoEF&CC : Ministry of Environmental Forest and Climate Change
MSIHC : manufacture, storage and import of Hazardous Chemical Rules
MT : Metric Tonn
NAAQS : National Ambient Air Quality Standards
NE : North-East
NH-4 : National Highway Number - 4
NW : North-West
PPEs : Pesonal Protective Equipments
QCI-NABET : Quality Council of India – National Accreditation Board for Education and
Training
R & R : Rehabilitation and Resettlement
SEC : Subbarao’s Environment Center
SIA : Social Impact Assessment
SPCB : State Pollution Control Board

M/s. Shalini Organics Pvt. Ltd., MIDC Paitha, Dist- Aurangabad. EIA/EMP
Page xviii
SOPL Shalini Organics Private Limited.
ZLD : Zero liquid Discharge

M/s. Shalini Organics Pvt. Ltd., MIDC Paitha, Dist- Aurangabad. EIA/EMP
Page 1
EXECUTIVE SUMMERY
1. Introduction
M/s. Shalini Organics Pvt. Ltd. is a Greenfield project, proposes to set up Manufacturing unit for API and
API Intermediate unit at Plot No. D-10, MIDC Paithan, Taluka Paithan, Dist. Aurangabad, Maharashtra, Pin
code: 431107. Totalproduction capacity of the plant will be API= 6 Nos., Capacity = 112 MT/Month and
API Intermediate = 43 Nos., Capacity =1171 MT/MonthTotal Capacity= 1283 MT/Month. Detailed
productlist is given in Table 1.
2. Project Location
The proposed production shall be at Plot No. D-10, MIDC Paithan Aurangabad. The Geographic location of
this industry is at 19o32’55.80” N Latitude & 75o23’9.20” E Longitude with an elevation440 m above mean
sea level. The proposed project is located in MIDC Industrial Area which is meantfor various types of
industries. MIDC has provided all infrastructures like electrical power, continuouswater supply, internal
road network, external approach road etc. Figure No. 2.1 shows the location Mapof project site & Figure
No. 2.2 Google map respectively.
The project site is approachable by Road via State highway Aurangabad to Paithan- 0.5 km. Nearest railway
station is Aurangabad at about 35.46 km and Aurangabad Airport at about 36 km. Project falls within 5 km
radius ofProtected area of Jaikwadi Bird Sanctuary, which is notified under the Wild Life(Protection) Act,
1972 (53 of 1972). Subsequently this area has been declared asEco-Sensitive Zone by MoEFCC {As
perGazette Notification 2202 E, Dated 12thJuly 2017}. The distance of project from boundaryof Jaikwadi
Bird Sanctuary is 4.46 Km in South West Direction
3. Project Description
Complete list of proposed products is given in below Table.
M/s. Shalini Organics Pvt. Ltd., MIDC Paitha, Dist- Aurangabad. EIA/EMP
Page 2
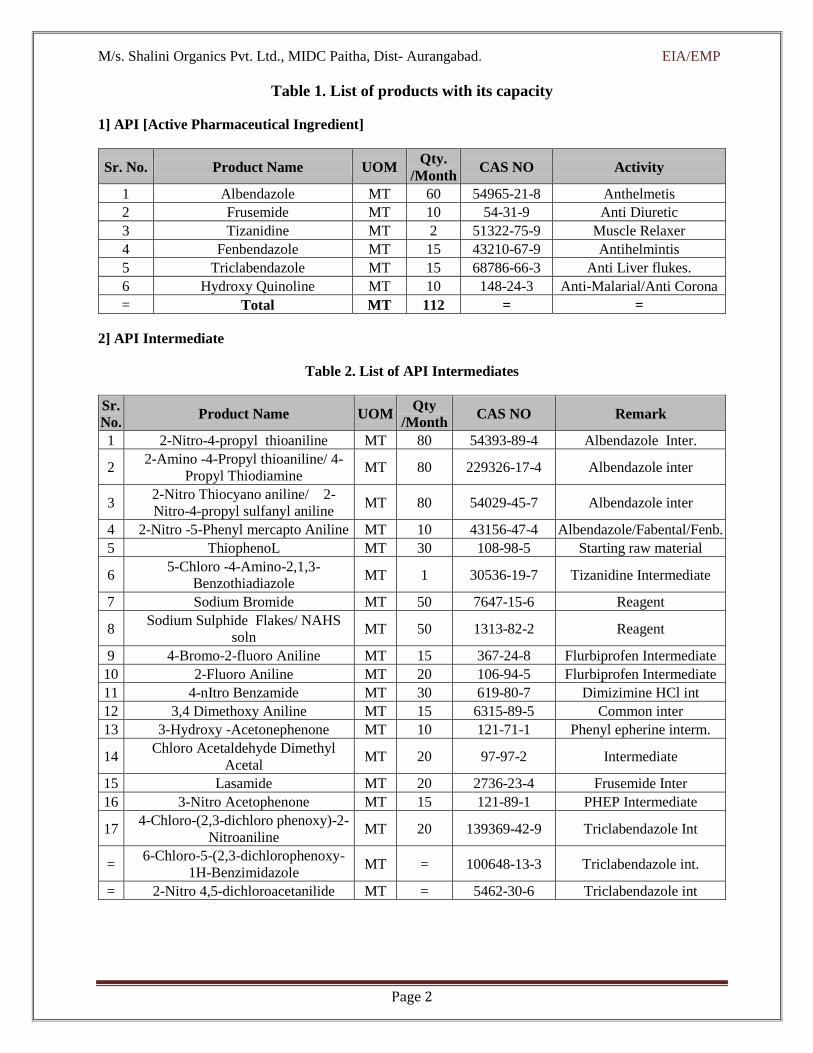
Table 1. List of products with its capacity
1] API [Active Pharmaceutical Ingredient]
Sr. No. Product Name UOM Qty.
/Month CAS NO Activity
1 Albendazole MT 60 54965-21-8 Anthelmetis
2 Frusemide MT 10 54-31-9 Anti Diuretic
3 Tizanidine MT 2 51322-75-9 Muscle Relaxer
4 Fenbendazole MT 15 43210-67-9 Antihelmintis
5 Triclabendazole MT 15 68786-66-3 Anti Liver flukes.
6 Hydroxy Quinoline MT 10 148-24-3 Anti-Malarial/Anti Corona
= Total MT 112 = =
2] API Intermediate
Table 2. List of API Intermediates
Sr.
No. Product Name UOM
Qty
/Month CAS NO Remark
1 2-Nitro-4-propyl thioaniline MT 80 54393-89-4 Albendazole Inter.
2 2-Amino -4-Propyl thioaniline/ 4-
Propyl Thiodiamine MT 80 229326-17-4 Albendazole inter
3 2-Nitro Thiocyano aniline/ 2-
Nitro-4-propyl sulfanyl aniline MT 80 54029-45-7 Albendazole inter
4 2-Nitro -5-Phenyl mercapto Aniline MT 10 43156-47-4 Albendazole/Fabental/Fenb.
5 ThiophenoL MT 30 108-98-5 Starting raw material
6 5-Chloro -4-Amino-2,1,3-
Benzothiadiazole MT 1 30536-19-7 Tizanidine Intermediate
7 Sodium Bromide MT 50 7647-15-6 Reagent
8 Sodium Sulphide Flakes/ NAHS
soln MT 50 1313-82-2 Reagent
9 4-Bromo-2-fluoro Aniline MT 15 367-24-8 Flurbiprofen Intermediate
10 2-Fluoro Aniline MT 20 106-94-5 Flurbiprofen Intermediate
11 4-nItro Benzamide MT 30 619-80-7 Dimizimine HCl int
12 3,4 Dimethoxy Aniline MT 15 6315-89-5 Common inter
13 3-Hydroxy -Acetonephenone MT 10 121-71-1 Phenyl epherine interm.
14 Chloro Acetaldehyde Dimethyl
Acetal MT 20 97-97-2 Intermediate
15 Lasamide MT 20 2736-23-4 Frusemide Inter
16 3-Nitro Acetophenone MT 15 121-89-1 PHEP Intermediate
17 4-Chloro-(2,3-dichloro phenoxy)-2-
Nitroaniline MT 20 139369-42-9 Triclabendazole Int
= 6-Chloro-5-(2,3-dichlorophenoxy-
1H-Benzimidazole MT = 100648-13-3 Triclabendazole int.
= 2-Nitro 4,5-dichloroacetanilide MT = 5462-30-6 Triclabendazole int

M/s. Shalini Organics Pvt. Ltd., MIDC Paitha, Dist- Aurangabad. EIA/EMP
Page 3
18 2-Chloro 1-(2,4-
difluorophenyl)ethanone MT 5 51336-94-8 Fluconazole int.
19
2-(4-Amino 4,5-dihydro-[1,2,4-
]triazole-1yl}-1-(2,4-difluoro
ethanone
MT 5 86404-63-9 Fluconazole intermediate
20 5-Amino Salicylic acid MT 20 89-57-6 Intermediate
21 1[4-chlorophenyl] phenyl methyl
piperzine MT 10 300543-56-0 Cetrizine diHCl int.
22 Tetra Butyl ammonium Bromide MT 30 1642-19-2 Catalyst.
23 2-(4-methoxyphenyl) acetic acid MT 30 104-01-8 Dextromethorpan HBr.int.
24 Hydrogenation of Aldehydes and
Amines[ Aldehyde to Alcohol] MT 15 NA
General hydrogenation of
aldehydes and Amines.
25 1(2,4-dichloro phenyl)-2-(1-H-
imidazole -1-yl) Etanone/Ethanol MT 20 24155-42-8 Miconazole Inter.
26 1-(carbamethyl-cyclohexyl)Acetic
acid MT 20 1157262-35-5 Gabapentin Intermediate
27 5-(4-(Ethylphenylethoxy) benzyl
thiozolidine-2,4- dione MT 10 112529-15-4 Pioglutazone intermediate
28 4-(4-Ethylphenyl-ethoxy)
benzaldehyde MT 15 114393-97-4 Pioglutazone intermediate.
29 2-(5-ethyl pyridine-ethanol) MT = 5223-06-3 Pioglutazone Intermediate
30 Ammonium thiocyanate MT 100 1762-95-4 Intermediate
31 Hydrogen Cynamide MT 50 420-04-2 Intermediate
32 N-Propyl Bromide MT 25 106-94-5 Intermediate
33 Cyanuric acid MT 25 108-80-5 Starting raw material
34 5-Methoxy-2-mercapto benzimidazole MT 20 37052-78-1 Omeprazole Intermediate
35 2-Chloro-5-Iodo Benzoic acid MT 5 19094-56-5 API Intermediate
36 4-Hydroxy coumarin MT 5 1076-38-6 Warfarin inter.
37 Cyanoacetic acid MT 25 372-09-8 Intermediate
38 5-Chloro-2- Ntroaniline MT 50 1635-61-6 Tricalbendazole
Intermediate
39 2-Nitro Aniline MT 100 88-74-4 Intermediate
40 2-Bromo Isopropyl Isobutyrate MT 10 51368-55-9 Finofibrate Intermediate
41 m-Nitro Benzaldehyde MT 05 99-61-8 Intermediate
42 2,2,4-Trichloro Acetophenone MT 15 4252-78-2 Miconazole Nitrate Interm.
43 4-Amino Benzonitrile MT 10 873-74-5 Intermediate
= Total Intermediate MT 1171 == == == == == ==

M/s. Shalini Organics Pvt. Ltd., MIDC Paitha, Dist- Aurangabad. EIA/EMP
Page 4
Total Capacity –
Table 3.List of total capacity
Sr. No. Product details Nos. Tonnage (MT)
1. API 6 112
2. API Intermediate 43 1171
Total 49 1283
Per Month capacity 42.76 MT/ M
At any given time, minimum 2 API and anyone option from intermediate as listed or as provided.
As per the EIA Notification, 2006, proposed activity is listed at S. No.5(f) - Synthetic Organic Chemicals
industry. The proposed project islocated within the notified industrial area by MIDC {Maharashtra Industrial
Development Corporation}. The project also falls within 5 km radius of Protected area of Jaikwadi Bird
Sanctuary, which is notifiedunder the Wild Life (Protection) Act, 1972 (53 of 1972). Subsequently this area
has been declared asEco-Sensitive Zone by MoEFCC {as per Gazette Notification 2202 E, dated 12th July
2017}, under Category “A”. Salient features of the project are presented in Table 4.
Table 4.Silent feature of the project
Sr.No. Particulars Details
A. Nature & Size of
the Project List of the products is mentioned in Table 1 and Table 2
B. Category of the
Project
As per EIA Notification dated 14th Sep., 2006 as amended from time to
time; the project falls in Category ‘A’, Project or Activity -5(f).
C.
Location Details
Village Paithan
Tehsil Paithan
District Aurangabad
State Maharashtra
Latitude 19°32'55.80"N
Longitude 75°23'9.20"E
Mean sea level 440 m
D.
Area Details
Total Project Area
and Green belt
development area
Total Plot Area = 20,000.00 Sq. M.
Green Belt 33% Of Plot Area = 6600.42 Sq. M.
Parking Area 10.08 % Of Plot Area = 2000 Sq. M.
E. Environmental Setting Details (with approximate aerial distance & direction from plant site)
1. Nearest Village Mudhalwadi- 1.42 km
2. Nearest town and
City Aurangabad- 36.97 km
3.
Nearest National
Highway / State
Highway
State highway Aurangabad to Paithan- 0.5 km
4. Nearest Railway
station Aurangabad – 35.46 km

M/s. Shalini Organics Pvt. Ltd., MIDC Paitha, Dist- Aurangabad. EIA/EMP
Page 5
Sr.No. Particulars Details
5. Nearest Airport Aurangabad Airport – 36 km
6.
National Parks,
Wildlife
Sanctuaries,
Biosphere
Reserves, Tiger/
Elephant
Reserves, Wildlife
Corridors
etc. within 10 km
radius
Project falls within 5 km radius of Protected area of Jaikwadi Bird
Sanctuary, which is notified under the Wild Life (Protection) Act, 1972
(53 of 1972). Subsequently this area has been declared as Eco-Sensitive
Zone by MoEFCC {As per Gazette Notification 2202 E, Dated 12th July
2017}. The distance of project from boundaryof Jaikwadi Bird
Sanctuary is 4.46 Km in South West Direction
7.
Reserved Forests
(RF)/Protected
Forests (PF)
No
8.
Water Body (within
10 km
radius)
No.
9. Seismic Zone Seismic Zone - III as per IS: 1893 (Part-I): 2002
F. Other Details
1. Product Type API and API Intermediate
2. Project Type New (Greenfield)
3. Schedule 5 (f)
4. Category A
5. Project Cost Rs. 8.62 Crores
6. EMP Cost Rs. 116 Lakhs
7. Power Requirement The power requirement for proposed project is
300 HP. (Source: - MSEDCL)
8. Water Requirement Total water consumption: 246.0 CMD
Source -MIDC
9. Fuel Requirement
For Boiler -
Briquettes 500 kg/Hr.
For Thermic Fluid -
Briquettes 250 Kg/Hr.
Diesel (HSD) 30 lit/Hr.
10. Boiler details Steam Boiler 2 TPH capacity
11. Thermic Fluid Heater 2.0 lakhs kcal/hr.
12. D.G. Set details (2 x 250 kVA)
13. Stack details
Boiler 30 m
Thermic Fluid 30 m
D.G Set 6.0 m (Above the roof)
Scrubber 11 m
(Alkali Scrubber)
14. ETP Capacity
1. HCDO/HTDS Effluent treated in STRIPPER/
MEEE/ATFD. 50 CMD 2 Nos.
2. Condensate from MEE/ATFD treated In RO
I. Permeate 92 CMD Recycled
3. Reject 23 CMD recycled to MEE/ATFD
15. Effluent Generation 145.10 m3/day
M/s. Shalini Organics Pvt. Ltd., MIDC Paitha, Dist- Aurangabad. EIA/EMP
Page 6
Sr.No. Particulars Details
Note: It will be ZLD unit
16. Man Power 60 nos. (Including Skilled and non-skilled)
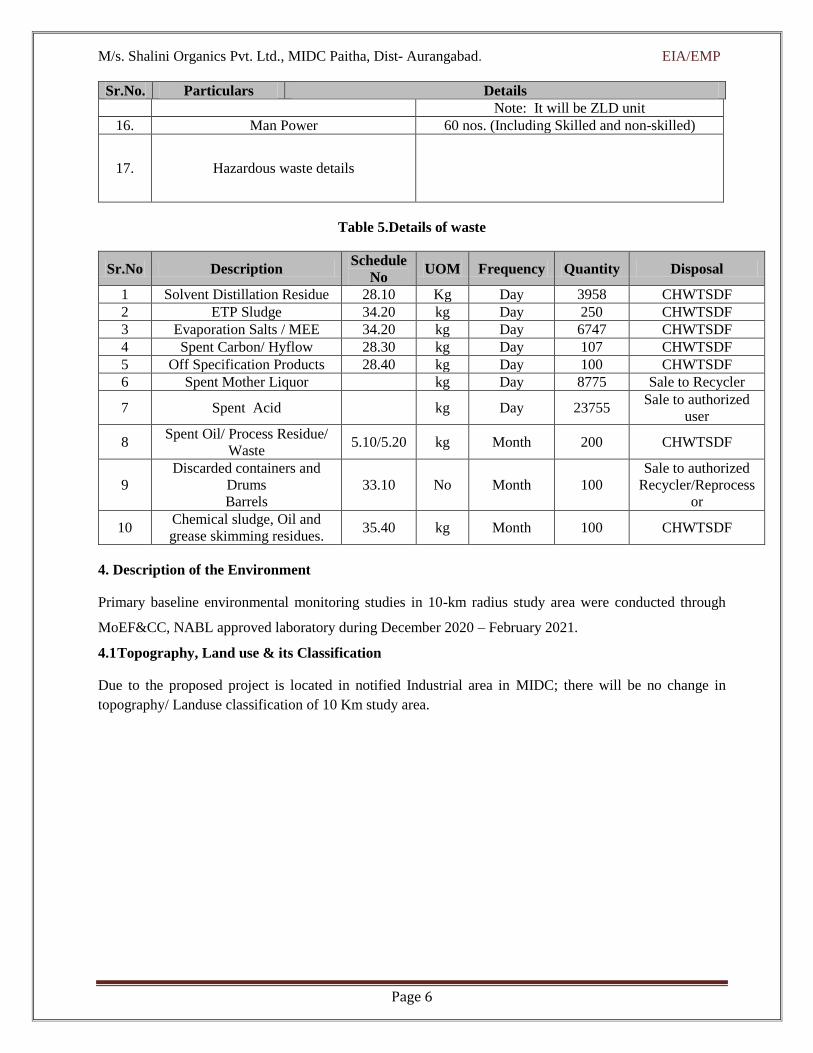
17. Hazardous waste details
Table 5.Details of waste
Sr.No Description Schedule
No UOM Frequency Quantity Disposal
1 Solvent Distillation Residue 28.10 Kg Day 3958 CHWTSDF
2 ETP Sludge 34.20 kg Day 250 CHWTSDF
3 Evaporation Salts / MEE 34.20 kg Day 6747 CHWTSDF
4 Spent Carbon/ Hyflow 28.30 kg Day 107 CHWTSDF
5 Off Specification Products 28.40 kg Day 100 CHWTSDF
6 Spent Mother Liquor kg Day 8775 Sale to Recycler
7 Spent Acid kg Day 23755 Sale to authorized
user
8 Spent Oil/ Process Residue/
Waste 5.10/5.20 kg Month 200 CHWTSDF
9
Discarded containers and
Drums
Barrels
33.10 No Month 100
Sale to authorized
Recycler/Reprocess
or
10 Chemical sludge, Oil and
grease skimming residues. 35.40 kg Month 100 CHWTSDF
4. Description of the Environment
Primary baseline environmental monitoring studies in 10-km radius study area were conducted through
MoEF&CC, NABL approved laboratory during December 2020 – February 2021.
4.1 Topography, Land use & its Classification
Due to the proposed project is located in notified Industrial area in MIDC; there will be no change in
topography/ Landuse classification of 10 Km study area.
M/s. Shalini Organics Pvt. Ltd., MIDC Paitha, Dist- Aurangabad. EIA/EMP
Page 7
4.2 Soil Environment
The soil monitoring was done for 8 different locations present within the study area of the project. The
results obtained of same, reveals that,
The texture of the soil is Clay type
the pH value for soil samples are varying in range of 7.10 to 8.20; which indicate the neutral to
slightly alkaline in nature
The Bulk density of the soil is in the range of 1.01gm/cc to 1.48 g/cc
The Water Holding capacity of the soil in the range of 42.15 % to 52.46 %
The porosity of the soil in the range of 46.35 % to 56.94 %
The Nitrogen (N) level of the soil 256.48 mg/kg to 326.98 mg/kg
Available phosphorus of the soil in the range of 81.46 mg/kg to 136.98 mg/Kg
Available potassium of the soil in the range of 148.70 mg/Kg to 226.80 mg/Kg
Analysis results of soil samples collected from the study area shows that soil has neither been
affected by liquid effluent nor by disposal of solid/ Hazardous waste
Porosity shows that soil has good percolation capacity
Soil is also observed with good fertility for crop production
4.3 Air Environment
The Ambient Air quality was monitored for PM10, PM2.5, NOx, SO2, CO, NH3, C6H6, BaP, O3, Pb and
Ni, at ten locations in the study area.
Particulate Matter (PM2.5)
The average PM2.5concentration at all locations ranged between 25.4-12.1 μg/m3. The PM2.5
concentrations for all locations were observed within stipulated standards for NAAQS (24 hourly PM2.5 =
60 μg/m3)
Particulate Matter (PM10)
The average PM10 concentrations at all locations varied in the range of 58.6μg/m3 – 40.3 μg/m3. The highest
concentration i.e. 58.6 μg/m3is noticed at project site which is attributed to windblown dust, vehicular
movements etc. The PM10 concentrations for all locations were observed to be below stipulated standards
for NAAQS (24 hourly PM10 = 100 μg/m3)
Sulphur Dioxide (SO2) & Oxides of Nitrogen (NOx)
The average SO2 concentrations at all locations were found 18.5 μg/m3-13.0 μg/m3 and the average
concentration of NOx ranged between 28.3 μg/m3 -13.8 μg/m3. The levels of gaseous pollutants were below
the stipulated CPCB standards (24 hourly SO2 is 80μg/m3 and for NOx is 80μg/m3).

M/s. Shalini Organics Pvt. Ltd., MIDC Paitha, Dist- Aurangabad. EIA/EMP
Page 8
Carbon Monoxide (CO)
The average CO concentrations at all locations were found 0.45 – 0.1 mg/m3.
In general, the ambient air quality is satisfactory with respect to all major pollutants. The 98th percentile
values of all pollutants were found to be below NAAQS. The other parameters such as Ammonia (NH3),
Benzene, Benzo-α-Pyrene (BAP), Ozone (O3), Lead (Pb) and Nickel (Ni) were found be to below respective
detection limits.
4.4 Noise Environment
The noise quality was monitored at eight (8) locations in the study area during the study period.
The day time noise level at the project premises was observed to be 58.95 dB (A) Leq while during night
time the noise level was recorded to be 51.70 dB (A) Leq. It should be noted that the noise levels during the
day time as well as night time were observed to be within the prescribed standards by Central Pollution
Control Board.
4.5 Ground Water Environment
The results indicate that the pH of all the ground water samples was within the prescribed standards. The
concentration of heavy metals like zinc was below detection limit. Iron was not detected in any of the ground
water samples. The hardness of all the ground water samples was found to be ranging between 112.0 mg/lit
to 321.21 mg/lit. The value of hardness was within the acceptable limit at all the locations. It can be observed
that the values for total dissolved solids in all the sampling locations were estimated to be under the
acceptable standards for drinking water. The concentration of total dissolved solids ranged between 166.0
mg/lit to 654.01 mg/lit. The maximum concentration was observed at location Wahegaon. It should be noted
that the microbiological analysis of all the samples indicate that Total coliform and e-coli was absent in all
the ground water samples. Thus based on the above results it can be stated that the water from the said
samples can be considered fit for consumption and potable purpose with basic primary treatment. The water
can be used for domestic utilization and gardening without any treatment.
4.6 Surface Water Environment
The values obtained are compared with the standards prescribed for the respective designated use of the
water body as categorized in the earlier part of the study. The analysis helps to concluded that the pH of all
the samples was found to vary between: 7.20 – 8.20. It should be noted that the values obtained were within
the desirable limit for pH as prescribed by CPCB. The total hardness was observed to be ranging between
98.95 mg/lit to 1104.02 mg/l . The maximum value of hardness was recorded at Wadawali and the minimum
value was recorded at Paithan Road village. The concentration of Total Dissolved Solids was estimated in
the range of 212 mg/l to 364 mg/l. The maximum concentration of Total Dissolved Solids (TDS) was
observed at Shivbhadra River whereas the minimum TDS concentration was observed at Paithan Road

M/s. Shalini Organics Pvt. Ltd., MIDC Paitha, Dist- Aurangabad. EIA/EMP
Page 9
Village. The Chemical Oxygen Demand (COD) & Biochemical Oxygen Demand (BOD) values were
calculated to be in the range of 16 mg/lit. to 7 mg/lit. & 3 mg/lit.to 5.0 mg/lit. respectively.
The presence of heavy metals like, Zinc were found out be below the detection limit for all the water samples.
It should be noted that the iron content in all the samples of surface water bodies were below the detection
limit. Surface runoff from agricultural fields using the fertilizers can be the major source of nitrate.
Conclusion: The comparison of surface water results with IS 2296:1992 ,shows that the designated best use
of water falls under category A & B.
4.7 Biological Environment
None of the identified species within the study area are Schedule I species of the Indian Wildlife Protection
Act, 1972 or listed in IUCN Red List of Threatened Species. There are no legally protected areas such as
National Parks or Wildlife Sanctuaries within 10 km of the Project Site.
4.8 Socio-Economic Environment
Social surveys were conducted in the study area during December 2020 to February 2021 in 24 villages to
collect factual information by involving community. For secondary data primary censusabstract of 2011,
Government of India has been used.
Table 6. Summary of Socio-Economic Aspects
Demographic Parameters Details
No. of States 1
No. of District 1
No. of Tehsil 1
No. of Villages 24
Total No. of House hold population 14557 nos.
Total Population 70,091
Sex Ratio (Study area)
No. of Males
No. of Females
36,459
33,632
Source: Primary Census Abstract 2011Sensus, Pune District, State Maharashtra
5. Anticipated Environmental Impacts and Mitigation Measures
Table 7: Summary of Impacts & Mitigations
Sr.
No
Environmental
Parameters Aspect Attributes Impacts
Proposed Mitigation
Measures
Construction Phase
1. Air Quality
Minor dust emissions
from handling &
transportation of
Workers getting exposed
to the dust pollution
generated due to the
Traffic management for
loading and unloading
of the materials.

M/s. Shalini Organics Pvt. Ltd., MIDC Paitha, Dist- Aurangabad. EIA/EMP
Page 10
Sr.
No
Environmental
Parameters Aspect Attributes Impacts
Proposed Mitigation
Measures
cement/concrete/stone
aggregates.
construction activity can
suffer from respiratory
problems and prolonged
exposure can lead to
malfunctioning of lungs.
Regular sprinkling of
water on the working
site, Avoiding Cement
dust emission,
Managing stockpiles.
Creating wind barrier
for controlling the dust
emissions.
2. Noise Quality
Noise generated from
construction
equipment’s/machinery
like spade, shovel,
dabber, drill, hammer,
concrete mixer etc.
Transportation of
construction materials.
The impacts of high
noise level would be
Temporary/Permanent
hearing loss, Mental
disturbance, Increase in
heart rate, Affecting
worker's performance.
Appropriate PPEs will
be provided to the
workers.
Implementation of
Traffic management.
Development of Green
belt.
3. Water Quality
Water used for
construction activity
mainly for concrete
mixing, sprinkling etc.
Contamination of the
soil and nearby water
bodies due to the surface
runoff.
Proper surface water
runoff management
would be implemented.
Storm water drain
would be provided.
4. Solid Waste
Management
No demolition work is
envisaged however
minor quantities of solid
waste generation is
anticipated in the form
of concrete/construction
materials left over.
Unhealthy Work
Conditions at project
site.
The solid waste
generated in the
construction phase
would be disposed off
through local Municipal
Corporation.
Operational Phase
1. Air Quality
Operation of
BoilerGaseous
emission from
manufacturing process,
Non-
spontaneousemissions
fromTransportation of
raw materials & finished
goods.VOC emission
generated due to the
handling and storage of
the solvents & other raw
materials.
The Health effects
related to particulate
matter are majorly
respiratory, pulmonary
injury & lung cancer etc.
Exposure to SO2 and
NOx majorly leads to
respiratory problems.
Carbon monoxide
decreases the oxygen
carrying capacity of the
blood by reducing the
hemoglobin. The health
effects related to VOC
emission are eye, nose
and throat irritation
headaches, loss of
coordination and nausea,
damage to liver, kidney
1. Combined Stack of
30 m will be provided
to the Boiler.
2. Alkali Scrubber will
be installed to catered
emissions from process
activity.
3. The roads within the
premises are paved to
avoid the dust
generation from
vehicular activity.
4. It will be ensured that
all the transportation
vehicles have a valid
PUC (Pollution under
Control) Certificate.

M/s. Shalini Organics Pvt. Ltd., MIDC Paitha, Dist- Aurangabad. EIA/EMP
Page 11
Sr.
No
Environmental
Parameters Aspect Attributes Impacts
Proposed Mitigation
Measures
and central nervous
system etc. The air
emissions in long course
of time may affect the
immediate surrounding
vegetation stature
physically (leaf
senescence, hampered
growth etc.) &
biologically thus may
affect the overall
surrounding ecology.
5. Proper servicing &
maintenance of vehicles
will be carried out.
6. Regular sweeping of
all the roads & floors
will be done.
7. The proposed thick
green belt along the
plant boundary will help
to capture the fugitive
emission.
8. Industry to ensure
that at no point of time
the air emission
concentrations exceed
the prescribed
standards.
2. Noise Quality
Operation of Boiler,
Reactors, ancillary
utilities & transportation
activity.
The impacts of high
noise level would be
Temporary/Permanent
hearing loss, Mental
disturbanceIncrease in
heart rateDecreasing in
workers performance
due to psychiatric
disorderWorkers
developing Tinnitus due
to high level of noise
exposure on regular
basis.The increased
noise level may induce
locale level disturbances/
temporary migration of
fauna in the immediate
vicinity of the project
area.
1. Acoustic enclosure
will be provided to the
high noise generating
equipment’s for
attenuation of noise
level during operation.
2. Boilers will be placed
in a confined space viz.
boiler house where the
surrounding walls acts
as a barrier for noise
propagation.
3. Isolation of high
intensity noise
generating equipment’s.
4. Using engineering
controls for reducing
the noise level.
5. Appropriate traffic
management to be
implemented.
6. Green belt developed
around the company
premises will acts a
noise barrier.
7. Appropriate PPE
should be provided to
workers.
3. Water Quality 1. Washing Effluent
from process activity.
Indiscriminate
release/discharge of
effluents may
1.It will be ZLD unit
2. The sewage effluent
load from the company

M/s. Shalini Organics Pvt. Ltd., MIDC Paitha, Dist- Aurangabad. EIA/EMP
Page 12
Sr.
No
Environmental
Parameters Aspect Attributes Impacts
Proposed Mitigation
Measures
2. Blow down water
from Boiler and Cooling
Tower.
3.Domestic wastewater
contaminate the
surrounding surface
and groundwater & there
by affecting the overall
ecology & agricultural
productivity.
will be treated in STP of
suitable capacity
3. The condensate from
MEE unit will be
utilized as feed water in
cooling tower, boiler,
and process. while the
residue from will be
disposed through
CHWTSDF.
4.
Solid Waste
Management -
Hazardous
Waste
1. Hazardous waste
generated from the
Storage of Raw material.
2. Sludge generated from
the ETP operation.
3. Residue generated
from the MEE operation.
Unscientific handling &
disposal may lead to
contamination of
surrounding soil, water
sources & there by
affecting the ecology &
health of the workers
coming in direct contact
with the hazardous waste
like skin
allergies/rashes/burns
etc.
1. Hazardous waste
generated from the
overall activity of the
project will disposed to
CHWTSDF.
2. Sludge generated
from the ETP
operations are disposed
to – CHWTSDF.
3. Residue generated
from MEE unit will be
disposed through
CHWTSDF.
Solid Waste
Management -
Non Hazardous
waste
1. Scrap Metal
2. Scrap Plastic
3. Office Waste
4.Food Waste
5. Carboys & wooden
pellets
Hap-Hazard handling &
storage may lead to
inadequate open space in
plant premises & it may
lead to rodent breeding.
Designated area for
Scrap materials will be
provided in the plant.
Scrap materials will be
recycled through
registered scrap
vendors.
Daily housekeeping
waste and food waste
will be disposed
through local waste
management facility.
6. Risk and Mitigation Measures
Pressure safety valves for storage tanks
Pressure alarm high and pressure alarm low for storage tanks
Level indicators with monitoring from control for storage tanks
Level transmitter, Level gauge and Temperature indicators for the storage tanks
Fire protection arrangements in the form of Fire Hydrants and Monitors for the storage tanks.
Emergency Handling checklist and procedure. Detailed information is given in Chapter 7.
7. Disaster Management Plan

M/s. Shalini Organics Pvt. Ltd., MIDC Paitha, Dist- Aurangabad. EIA/EMP
Page 13
Disaster Management Plan will be implemented in consultation with the District Administration to take care
of health and safety during any untoward incident.
In view of handling of processes in industry, On-site Emergency Plans are important and hence has been
prepared for the industry. Additionally, recommendations for and Off-site shall be provided to the District
Administration. During operational phase, surrounding population shall be made aware of safety precautions
to be taken in case of any emergency situation due to the overall project activity.
8. Occupational Safety & Health Management
Company is and shall continue to strictly adhere to the rules of Factories Act 1948 & the Maharashtra
Factories Rules, 1963 regarding the occupational health facilities to be provided to the workers of the
company.
The industry has provided decontamination facilities for the workers. The health records of the
workers are being maintained.
For the continuous and continual development, company will continue to train & educate the
operators and workers with the environment, health & safety rules & regulation, procedure and
measures.
Periodic medical checkup is and shall continue to be carried out to ensure the health status of the all
workers.
Job rotation will be done.
9. Post Project Environmental Monitoring Plan
The sampling, analysis and frequency of environmental attributes including monitoring locations will be as
per the guidelines provided by MoEF/CPCB/MPCB. The monitoring shall be carried out by J.V. Analytical
Services, Pune recognized by MoEFCC, GOI, New Delhi, and ISO 9001:2008, OHSAS 18001: 2007 NABL
Certified Company.
NABL Certificate No.TC-7323, dtd. 24/11/2020 and MoEF&CC Laboratory certificate No. F.No.Q-
150-15018/7/2014-CPW. Details are enclosed as Annexure
10. Environmental Management Plan
An environmental monitoring program in place, periodic review & audits are carried out for effective
environmental management and the same shall be strengthen and extended for the proposed project activity
as well. The Plant has an EHS department which ensures overall effective implementation of the
management plan.
M/s. Shalini Organics Pvt. Ltd., MIDC Paitha, Dist- Aurangabad. EIA/EMP
Page 14
In general, systems are in place to ensure compliance with respect to environmental statutory requirements
and Environment Policy of Shalini Organics Pvt. Ltd. are strongly adhered to all time. The same shall be
extended to the proposed project as well.
All recommendations given in the EIA report including that of occupational health, risk mitigation and safety
will be complied. Shalini Organics Pvt. Ltd. have allocated INR 116 Lacs as environmental pollution control
measures.
11. Project Benefits
The following benefits are expected from the proposed project:
This project of Shalini Organics Pvt. Ltd. will have positive social and economic benefits.
Some of these would be direct benefits of long term nature.
The project will overcome the demand and supply gap of steel product in the country and the
additional steel availability will boost the infrastructure of the area and the overall economic
scenario of the country.
The project will also generate additional revenue for the State Government.
The project will create additional direct/indirect employment for people.
Local people will be preferred for employment during the construction and operation stage.
12. Corporate Environment Responsibility (CER) Action Plan
CER plan has been made from this perspective, to ensure the quality of life and quality of study area people
will be improved. CER, in fact, is about business giving back to the society.
M/s. Shalini Organics Pvt. Ltd. proposes to allocate 2 % of their total expansion cost for CER activities as
suggested in MoEFCC O.M. regarding Corporate Environment Responsibility vide. F.No. 22-65/2017-IA
III. The total cost of the project is around Rs. 8.62 Crore and 2 % (i.e. Rs. 17.24 Lakh) has been allocated
for CER Action Plan. The same shall be implemented over a period of 2 years.
The activities under CER shall cover education, health, infrastructure, culture and sports, skill development
& training and women empowerment.
M/s. Shalini Organics Pvt. Ltd., MIDC Paitha, Dist- Aurangabad. EIA/EMP
Page 15
1. INTRODUCTION
1.1. Preface
An Environmental Impact Assessment (EIA) is an assessment of the possible impacts that a proposed project
may have on the environment - consisting of the environmental, social and economic aspects. It is an
assessment and management tool that evaluates the possible impacts, positive or negative, that a proposed
project may have on the environment. EIA systematically examines both beneficial and adverse
consequences of the project and ensures that these effects are taken into account during project design. The
purpose of the assessment is to ensure that decision makers consider the ensuing environmental impacts
when deciding to proceed with a project. In India, Ministry of Environment and Forests has defined
elaborated “Environmental Clearance (EC)” framework along with requirements for preparing
Environmental Impact Assessment (EIA) under the Environmental (Protection) Act, 1986 (Environmental
Impact Assessment Notification, 2006) for establishing/expanding and industry/development projects.
1.2. Purpose of the Project
The purpose of the EIA Report is to obtained an Environmental Clearance for the Proposed Active
Pharmaceutical Ingredients (APIs) and API Intermediates Manufacturing Unit” of M/s. Shalini Organics
Pvt. Ltd., by carrying out Environmental Impact Assessment Studies (EIA).
The aim of carrying out Environmental Impact Assessment (EIA) study is to assess the impacts, due to the
proposed manufacturing production as well as due to related industrial activity on the environment and
suggesting suitable mitigation measures. This EIA report also highlights some beneficial impacts of due to
proposed project. The structure of EIA Report is as per the requirement and guidelines as per the Terms of
Reference (ToR) given by MoEF&CC vide File no. IA-J-11011/281/2020-IA-II (I) dated 27.11.2020 and
the guidelines of the Technical Manual on the Synthetic Organic Chemicals. The proposed manufacturing
unit is for the Products of “Active Pharmaceutical Ingredients (APIs) and API Intermediates”. The
project also falls within 5 km radius of Protected area of Jaikwadi Bird Sanctuary, which is notified under
the Wild Life (Protection) Act, 1972 (53 of 1972).

M/s. Shalini Organics Pvt. Ltd., MIDC Paitha, Dist- Aurangabad. EIA/EMP
Page 16
Figure 1-1 Site Photographs
EIA Consultant:
M/s. Shalini Organics Pvt. Ltd., has retained Dr. Subbarao’s Environment Center’, Sangli as EIA
Consultant for this project for assessing the impact of the industry on various environmental parameters in
the study area and to prepare EIA Reports and Environmental Management Plan for negating the adverse
impact of the project. Dr. Subbarao’s Environment Center’, Sangliis accredited as Category-A
organization under the QCI-NABET Scheme for accreditation of EIA consultant Organizations: Version 3
for preparing EIA-EMP reports. Environment Impact Assessment (EIA) and Environmental Management
Plan (EMP) have been prepared after obtaining Terms of References (ToRs) from MoEF&CC.
1.3. Identification of Project and Project Proponent
The Company, M/s. Shalini Organics Pvt. Ltd, was promoted by Mr. Shirish Kulkarni, who is having huge
experience in API and API intermediate Manufacturing business. The aim of the M/s. Shalini Organics Pvt.
Ltd. is to set up manufacturing activity of API & API Intermediate based on market study and according to
the changing marketing environment.
1.4. Importance of the Project
India's chemical industry is the third largest in the world in terms of volume and ranks 14th in terms of value.
However, India lags far behind US and China mainly due to smaller scale of operations and various
regulatory restrictions in catching opportunities when thrown before entrepreneurs. It is objective of our
Government to improve ease of doing business and increase India’s contribution in World’s GDP which in
turn improve standard of living of our population.
Recently 40% of chemicals units in China were abruptly closed by Chinese Govt. due to their poor
infrastructure and polluting operations. That has been a great interruption for downstream consumers not
only in US, Europe and Japan but also in India and China itself. World is now looking to India to fulfil the
vacuum and be a permanent second source / alternative to Chinese manufacturers keeping in mind uncertain
Government Policies in China.
This has now created a very interesting opportunity for Indian economy and it is our sincere effort to cash-
in the said once-in-blue-moon opportunity.

M/s. Shalini Organics Pvt. Ltd., MIDC Paitha, Dist- Aurangabad. EIA/EMP
Page 17
The proposed products will serve to cut the supply of imports from foreign countries thus saving currency
and at the same time will earn valuable foreign currency by export of the products. The company is
manufacturing Fine Chemicals. We see a strong demand from a buoyant Pharma Industry. The market for
API and Fine Chemicals is growing and there is also a good demand from export markets. Some of our
products will be import substitute and hence will save foreign exchange for the country. This project will
help the MAKE IN INDIA concept in our own small way.
In addition, the Indian pharmaceutical industry currently tops the chart amongst India's science- based
industries with wide ranging capabilities in the complex field of drug manufacture and technology. A highly
organized sector, the Indian pharmaceutical industry is estimated to be worth $ 4.5 billion, growing at about
8 to 9 percent annually. It ranks very high amongst all the third world countries, in terms of technology,
quality and the vast range of medicines that are manufactured. It ranges from simple headache pills to
sophisticated antibiotics and complex cardiac compounds; almost every type of medicine is now made in
the Indian pharmaceutical industry.
The Indian pharmaceutical sector is highly fragmented with more than 20,000 registered units. It has
expanded drastically in the last two decades. The Pharmaceutical and Chemical industry in India is an
extremely fragmented market with severe price competition and government price control. The
Pharmaceutical industry in India meets around 70% of the country's demand for bulk drugs, drug
intermediates, pharmaceutical formulations, chemicals, tablets, capsules, orals and injectable. There are
approximately 250 large units and about 8000 Small Scale Units, which form the core of the pharmaceutical
industry in India (including 5 Central Public Sector Units).
The Indian pharma industry, which is expected to grow over 16 per cent per annum between 2017 and 2020,
will outperform the global pharma industry, which is set to grow at an annual rate of 5 percent between the
same periods. The market is expected to grow to US$ 55 billion by 2020, thereby emerging as the sixth
largest pharmaceutical market globally by absolute size, as stated Indian Ambassador to the US. Branded
generics dominate the pharmaceuticals market, constituting nearly 80 per cent of the market share (in terms
of revenues).
India has also maintained its lead over China in pharmaceutical exports with a year- on-year growth of 11.44
per cent to US$ 12.91 billion in FY 2017-18, according to data from the Ministry of Commerce and Industry.
Imports of pharmaceutical products rose marginally by 0.80 per cent year-on-year to US$ 1,641.15 million.
Overall drug approvals given by the US Food and Drug Administration (USFDA) to Indian companies have
nearly doubled to 201 in FY 2017-18 from 109 in FY 2016-17. The country accounts for around 30 per cent
(by volume) and about 10 per cent (value) in the US$ 70-80 billion US generics market.
1.5. Brief Description of the Project
Salient features of the project and list of products are given in Table 1.1 and Table 1.2, respectively;
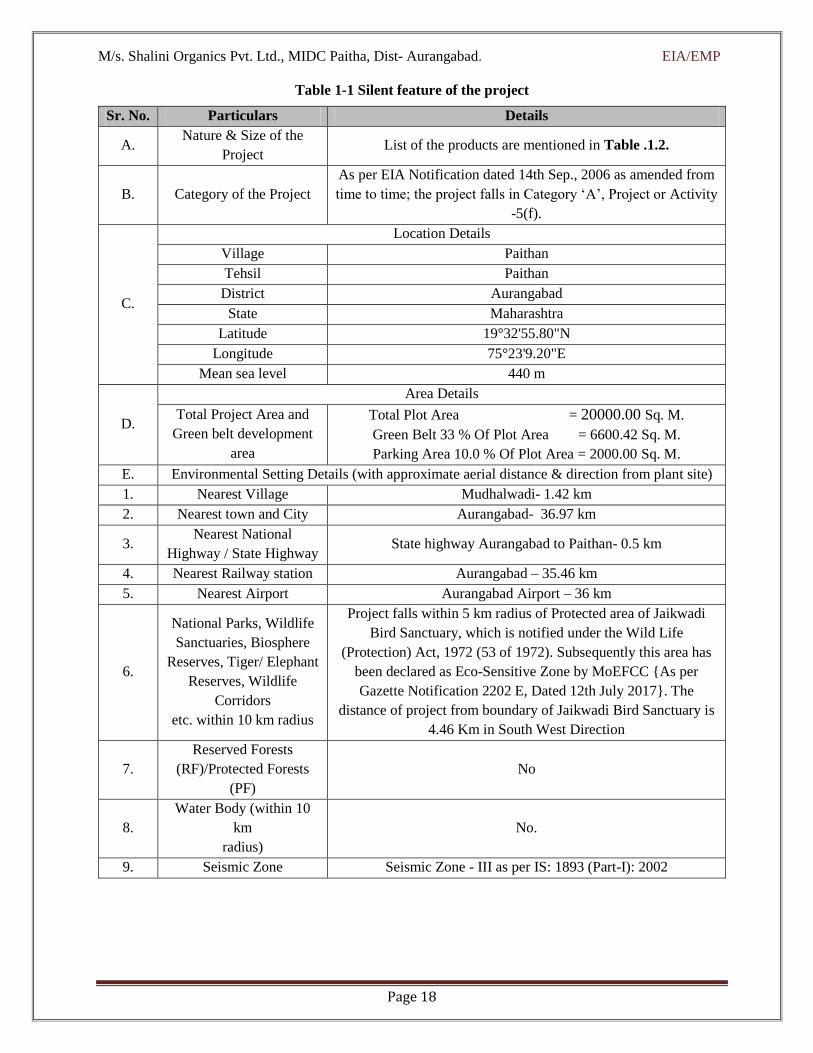
M/s. Shalini Organics Pvt. Ltd., MIDC Paitha, Dist- Aurangabad. EIA/EMP
Page 18
Table 1-1 Silent feature of the project
Sr. No. Particulars Details
A. Nature & Size of the
Project List of the products are mentioned in Table .1.2.
B. Category of the Project
As per EIA Notification dated 14th Sep., 2006 as amended from
time to time; the project falls in Category ‘A’, Project or Activity
-5(f).
C.
Location Details
Village Paithan
Tehsil Paithan
District Aurangabad
State Maharashtra
Latitude 19°32'55.80"N
Longitude 75°23'9.20"E
Mean sea level 440 m
D.
Area Details
Total Project Area and
Green belt development
area
Total Plot Area = 20000.00 Sq. M.
Green Belt 33 % Of Plot Area = 6600.42 Sq. M.
Parking Area 10.0 % Of Plot Area = 2000.00 Sq. M.
E. Environmental Setting Details (with approximate aerial distance & direction from plant site)
1. Nearest Village Mudhalwadi- 1.42 km
2. Nearest town and City Aurangabad- 36.97 km
3. Nearest National
Highway / State Highway State highway Aurangabad to Paithan- 0.5 km
4. Nearest Railway station Aurangabad – 35.46 km
5. Nearest Airport Aurangabad Airport – 36 km
6.
National Parks, Wildlife
Sanctuaries, Biosphere
Reserves, Tiger/ Elephant
Reserves, Wildlife
Corridors
etc. within 10 km radius
Project falls within 5 km radius of Protected area of Jaikwadi
Bird Sanctuary, which is notified under the Wild Life
(Protection) Act, 1972 (53 of 1972). Subsequently this area has
been declared as Eco-Sensitive Zone by MoEFCC {As per
Gazette Notification 2202 E, Dated 12th July 2017}. The
distance of project from boundary of Jaikwadi Bird Sanctuary is
4.46 Km in South West Direction
7.
Reserved Forests
(RF)/Protected Forests
(PF)
No
8.
Water Body (within 10
km
radius)
No.
9. Seismic Zone Seismic Zone - III as per IS: 1893 (Part-I): 2002

M/s. Shalini Organics Pvt. Ltd., MIDC Paitha, Dist- Aurangabad. EIA/EMP
Page 19
1.] API [Active Pharmaceutical Ingredient]
Table 1-2 List of proposed products
Sr. No. Product Name UOM Qty /Month CAS NO Remark
1 Albendazole MT 60 54965-21-8 Anthelmetis
2 Frusemide MT 10 54-31-9 Anti Diuretic
3 Tizanidine MT 2 51322-75-9 Muscle Relaxar
4 Fenbendazole MT 15 43210-67-9 Antihelmintis
5 Triclabendazole MT 15 68786-66-3 Anti Liver flukes.
6 8-Hydroxy Quinoline MT 10 148-24-3 Antimalarial/ Anti corona
= Total API MT 112 == ==
2.] API Intermediate
Table 1-3 Details of API Intermediates
Sr.
No. Product Name UOM
Qty.
/Month CAS NO Remark
1 2-Nitro-4-propyl thioaniline MT 80 54393-89-4 Albendazole Inter.
2 2-Amino -4-Propyl thioaniline/ 4-
Propyl Thiodiamine MT 80 229326-17-4 Albendazole inter
3 2-Nitro Thiocyano aniline/ 2-
Nitro-4-propyl sulfanyl aniline MT 80 54029-45-7 Albendazole inter
4 2-Nitro -5-Phenyl mercapto Aniline MT 10 43156-47-4 Albendazole/Fabental/Fenb.
5 ThiophenoL MT 30 108-98-5 Starting raw material
6 5-Chloro -4-Amino-2,1,3-
Benzothiadiazole MT 1 30536-19-7 Tizanidine Intermediate
7 Sodium Bromide MT 50 7647-15-6 Reagent
8 Sodium Sulphide Flakes/ NAHS
soln MT 50 1313-82-2 Reagent
9 4-Bromo-2-fluoro Aniline MT 15 367-24-8 Flurbiprofen Intermediate
10 2-Fluoro Aniline MT 20 106-94-5 Flurbiprofen Intermediate
11 4-nItro Benzamide MT 30 619-80-7 Dimizimine HCl int
12 3,4 Dimethoxy Aniline MT 15 6315-89-5 Common inter
13 3-Hydroxy -Acetonephenone MT 10 121-71-1 Phenyl epherine interm.
14 Chloro Acetaldehyde Dimethyl
Acetal MT 20 97-97-2 Intermediate
15 Lasamide MT 20 2736-23-4 Frusemide Inter
16 3-Nitro Acetophenone MT 15 121-89-1 PHEP Intermediate
17 4-Chloro-(2,3-dichloro phenoxy)-2-
Nitroaniline MT 20 139369-42-9 Triclabendazole Int

M/s. Shalini Organics Pvt. Ltd., MIDC Paitha, Dist- Aurangabad. EIA/EMP
Page 20
= 6-Chloro-5-(2,3-dichlorophenoxy-
1H-Benzimidazole MT = 100648-13-3 Triclabendazole int.
= 2-Nitro 4,5-dichloroacetanilide MT = 5462-30-6 Triclabendazole int
18 2-Chloro 1-(2,4-
difluorophenyl)ethanone MT 5 51336-94-8 Fluconazole int.
19
2-(4-Amino 4,5-dihydro-[1,2,4-
]triazole-1yl}-1-(2,4-difluoro
ethanone
MT 5 86404-63-9 Fluconazole intermediate
20 5-Amino Salicylic acid MT 20 89-57-6 Intermediate
21 1[4-chlorophenyl] phenyl methyl
piperzine MT 10 300543-56-0 Cetrizine diHCl int.
22 Tetra Butyl ammonium Bromide MT 30 1642-19-2 Catalyst.
23 2-(4-methoxyphenyl) acetic acid MT 30 104-01-8 Dextromethorpan HBr.int.
24 Hydrogenation of Aldehydes and
Amines[ Aldehyde to Alcohol] MT 15 NA
General hydrogenation of
aldehydes and Amines.
25 1(2,4-dichloro phenyl)-2-(1-H-
imidazole -1-yl) Etanone/Ethanol MT 20 24155-42-8 Miconazole Inter.
26 1-(carbamethyl-cyclohexyl)Acetic
acid MT 20 1157262-35-5 Gabapentin Intermediate
27 5-(4-(Ethylphenylethoxy) benzyl
thiozolidine-2,4- dione MT 10 112529-15-4 Pioglutazone intermediate
28 4-(4-Ethylphenyl-ethoxy)
benzaldehyde MT 15 114393-97-4 Pioglutazone intermediate.
29 2-(5-ethyl pyridine-ethanol) MT = 5223-06-3 Pioglutazone Intermediate
30 Ammonium thiocyanate MT 100 1762-95-4 Intermediate
31 Hydrogen Cynamide MT 50 420-04-2 Intermediate
32 N-Propyl Bromide MT 25 106-94-5 Intermediate
33 Cyanuric acid MT 25 108-80-5 Starting raw material
34 5-Methoxy-2-mercapto
benzimidazole MT 20 37052-78-1 Omeprazole Intermediate
35 2-Chloro-5-Iodo Benzoic acid MT 5 19094-56-5 API Intermediate
36 4-Hydroxy coumarin MT 5 1076-38-6 Warfarin inter.
37 Cyanoacetic acid MT 25 372-09-8 Intermediate
38 5-Chloro-2- Ntroaniline MT 50 1635-61-6 Tricalbendazole
Intermediate
39 2-Nitro Aniline MT 100 88-74-4 Intermediate
40 2-Bromo Isopropyl Isobutyrate MT 10 51368-55-9 Finofibrate Intermediate
41 m-Nitro Benzaldehyde MT 05 99-61-8 Intermediate
42 2,2,4-Trichloro Acetophenone MT 15 4252-78-2 Miconazole Nitrate Interm.
43 4-Amino Benzonitrile MT 10 873-74-5 Intermediate
= Total Intermediate MT 1171 == == == == == ==

M/s. Shalini Organics Pvt. Ltd., MIDC Paitha, Dist- Aurangabad. EIA/EMP
Page 21
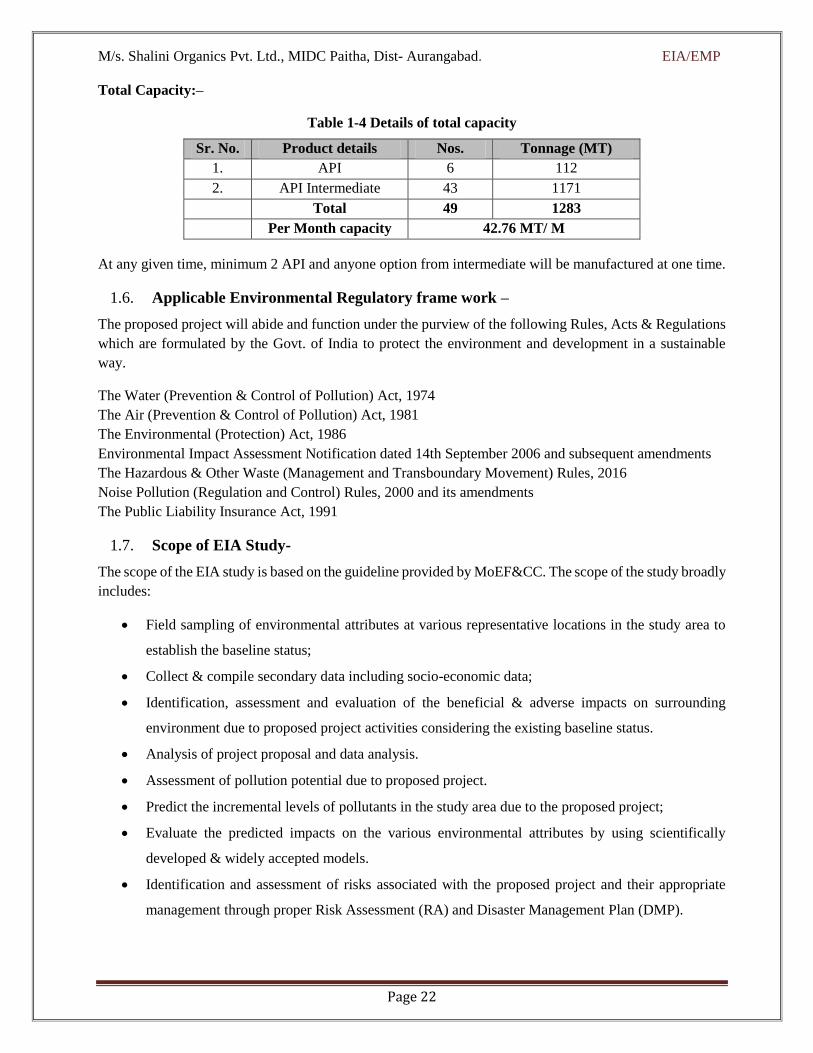
M/s. Shalini Organics Pvt. Ltd., MIDC Paitha, Dist- Aurangabad. EIA/EMP
Page 22
Total Capacity:–
Table 1-4 Details of total capacity
Sr. No. Product details Nos. Tonnage (MT)
1. API 6 112
2. API Intermediate 43 1171
Total 49 1283
Per Month capacity 42.76 MT/ M
At any given time, minimum 2 API and anyone option from intermediate will be manufactured at one time.
1.6. Applicable Environmental Regulatory frame work –
The proposed project will abide and function under the purview of the following Rules, Acts & Regulations
which are formulated by the Govt. of India to protect the environment and development in a sustainable
way.
The Water (Prevention & Control of Pollution) Act, 1974
The Air (Prevention & Control of Pollution) Act, 1981
The Environmental (Protection) Act, 1986
Environmental Impact Assessment Notification dated 14th September 2006 and subsequent amendments
The Hazardous & Other Waste (Management and Transboundary Movement) Rules, 2016
Noise Pollution (Regulation and Control) Rules, 2000 and its amendments
The Public Liability Insurance Act, 1991
1.7. Scope of EIA Study-
The scope of the EIA study is based on the guideline provided by MoEF&CC. The scope of the study broadly
includes:
Field sampling of environmental attributes at various representative locations in the study area to
establish the baseline status;
Collect & compile secondary data including socio-economic data;
Identification, assessment and evaluation of the beneficial & adverse impacts on surrounding
environment due to proposed project activities considering the existing baseline status.
Analysis of project proposal and data analysis.
Assessment of pollution potential due to proposed project.
Predict the incremental levels of pollutants in the study area due to the proposed project;
Evaluate the predicted impacts on the various environmental attributes by using scientifically
developed & widely accepted models.
Identification and assessment of risks associated with the proposed project and their appropriate
management through proper Risk Assessment (RA) and Disaster Management Plan (DMP).

M/s. Shalini Organics Pvt. Ltd., MIDC Paitha, Dist- Aurangabad. EIA/EMP
Page 23
Prepare an Environmental Management Plan (EMP) to mitigate the predicted impacts; and
Identify critical environmental attributes required to be monitored during the project execution and to
suggest post project monitoring.
The scope also includes all the conditions outlined in the ToR issued by SEAC-I and the compliance to the
ToR is given below.
1.8. Compliance of Terms of Reference
SEAC-I has prescribed Terms of reference from MoEF&CC vide File No.IA-J-11011/281/2020-IA-II(I)
on dated 27th November 2020, for undertaking detailed EIA study for the purpose of obtaining EC.
Compliance of Standard TOR for “Synthetic Organic Chemicals Industry (dyes and dye intermediates; bulk
drugs and intermediates excluding drug formation; synthetic rubber; basic organic chemicals, other synthetic
organic chemicals and chemical intermediates” Issued by MoEF&CC for EIA/EMP report for
Projects/Activates requiring Environmental Clearance under EIA Notification, 2006 is given below:
Table 1-5 ToR Compliance
Sr.
No. ToR Points Compliance of ToR
Reference in EIA
Report
A. Standard Terms of Reference
1. Executive Summary
The summary contains site details,
environmental status, air quality prediction
impacts due to all units in the industrial
complex and mitigation measures, water
balance, waste management, greenbelt,
rainwater harvesting, project description
including material balance, project cost,
CER activities, socioeconomic, ecology and
biodiversity, land use pattern, geology and
geohydrology, additional studies such as
risk assessment, and EMP etc.
Separate Chapter
as Executive
Summery
2. Introduction
i.
Details of the EIA
Consultant including
NABET accreditation
“Dr. Subbarao’s Environment Center” is the
consultant organization and the NABET
accreditation certificate no.
NABET/EIA/1922/ RA 0159
Chapter
12(Disclosure of
Consultant)
ii. Information about the
project proponent.
Mr. Shirish Kulkarni is the Owner of the
Company M/s. Shalini Organics Pvt. Ltd.
Project is a green field project. The
proponent is seeking Environment
Clearance for the proposed API and API
Intermediate Manufacturing unit. The
detailed background information of the
project proponent is provided in Chapter.
Chapter-1,
Section 1.3

M/s. Shalini Organics Pvt. Ltd., MIDC Paitha, Dist- Aurangabad. EIA/EMP
Page 24
iii. Importance and benefits of
the project.
The proposed project will play a vital role
in enhancing the Global API and
Intermediate thereby increase infrastructure
facilities & social benefits. Details are given
in of EIA/EMP report.
Chapter 1,
Section 1.4
3. Project Description
i. Cost of project and time of
completion.
Total Cost of the Project – 8.62 Crores.
Time of project completion will be about
1.0 - 1.5 years after accordance of the EC.
Chapter 2,
Section 2.1
ii. Products with capacities
for the proposed project.
Sr.
No.
Product
details Nos.
Tonnage
(MT)
1. API 6 112
2. API
Intermediate 43 1171
Total 49 1283
Per Month
capacity 42.76 MT/ M
Chapter 2,
Section 2.4.2 &
Table 2.2
iii.
If expansion project,
details of existing products
with capacities and
whether adequate land is
available for expansion,
reference of earlier EC if
any.
Not Applicable, as project is green field
project. --
iv.
List of raw materials
required and their source
along with mode of
transportation.
List of raw materials is mentioned in
Chapter 2, storage with mode of
transportation will be through Road.
Chapter 2, section
2.7
v.
Other chemicals and
materials required with
quantities and storage
capacities
Storage details of other materials are given
in EIA Report. Chapter 7
vi.
Details of emission,
effluents, hazardous waste
generation and their
management.
Emission:
Flue gas emission:
Steam boiler (1 nos.), Thermic Fluid Heater
(1 no.) and two stack of stand by D.G. Set
(2 x 250 kVA).
APCM: Cyclone separator followed by bag
filter.
Process gas emission:
Two stage alkali scrubber followed by
water and NaOH solution.
Emission &
APCM: Chapter
2, section 2.8.2.

M/s. Shalini Organics Pvt. Ltd., MIDC Paitha, Dist- Aurangabad. EIA/EMP
Page 25
Effluent:
The effluent generated from process and
from other sources shall be segregated into
LCOD and HCOD streams. LCOD stream
is allowed to pass through collection pit and
oil and grease trap through screen Chamber.
The effluent as LCOD will enter into
equalization, primary clarifier and aeration
tank. The sludge form the primary clarifier
Shall be centrifuged and then spread on
sand bed for drying. The over flow from the
aeration tank is allowed to enter into
secondary clarifier. Overflow from
secondary clarifier shall be allowed to flow
into holding tank. The treated effluent will
be tested for COD/ BOD. The treated
effluent will be passed through sand and
carbon bed through pump and connected to
Reverse Osmosis facility. The effluent from
the RO will be reused for the various
operations. The Reject from RO will be
connected to Evaporator, which is equally
part
of HCOD effluent. The thick slurry from
Evaporator shall be filtered on nutsh filter.
The Filtrate from NF is send to primary
clarifier. The solid from NF shall be packed
and send to CHWTSDF for disposal.
Conclusively the ETP shall be designed for
ZLD, the treated effluent shall be send to
CETP with quality as per with
MPCB/CPCB norms or parameters.
Hazardous waste:
Entire quantity of hazardous waste will be
handled & disposed as per Hazardous &
Other waste (Management &
Transboundary Movement) Rules, 2016
Effluent: Chapter
2, section 2.9.1.
Hazardous waste:
Chapter 2, section
2.9.3.
vii.
Requirement of water,
power, with source of
supply, status of approval,
water balance diagram,
Water –
Total water requirement will be = 246.0
CMD
Water: Detailed
breakup of water
requirement and
source are

M/s. Shalini Organics Pvt. Ltd., MIDC Paitha, Dist- Aurangabad. EIA/EMP
Page 26
man-power requirement
(regular and contract).
Fresh water requirement will be = 73.0
CMD
Source- [MIDC] Maharashtra Industrial
Development Corporation, Paithan.
Power -
Power required for the project will be 300
HP.
Source of electricity supply is Maharashtra
State Electricity Distribution Company
Limited
(MSEDCL)
DG set of capacity 2 x 250 KVA.
Boiler 2 T/Hr.; Fuel Briquette -500 kg/Hr.
Proposed Thermopack 1 no 2.0 lac Kcal/hr.
Man power
Manpower requirement will be 60 nos. of
skilled and unskilled category.
Water balance diagram is mentioned in
Chapter 2.
provided in
Chapter 2, section
2.7 .b
viii.
Process description along
with major equipment’s
and machineries, process
flow sheet (quantities)
from raw material to
products to be provided.
Process description along with flow sheet
from raw materials to product is given in
EIA Report. The detailed list of proposed
equipment’s & machinery is given in the
EIA Report.
Chapter 2, section
2.7. a
ix.
Hazard identification and
details of proposed safety
systems.
Hazard identification is described in EIA
Report. Details of proposed safety system
are covered in Risk Assessment Report.
Details are
covered in
Chapter 7
x. Expansion/modernization proposals:
a.
Copy of all the
Environmental
Clearance(s) including
Amendments thereto
obtained for the project
from MOEF/ SEIAA shall
be attached as an
Annexure. A certified
copy of the latest
Monitoring Report of the
Regional Office of the
Ministry of Environment
and Forests as per circular
Not Applicable, as project is green field
project. --

M/s. Shalini Organics Pvt. Ltd., MIDC Paitha, Dist- Aurangabad. EIA/EMP
Page 27
dated 30th May, 2012 on
the status of compliance of
conditions stipulated in all
the existing environmental
clearances including
Amendments shall be
provided. In addition,
status of compliance of
Consent to Operate for the
ongoing/ existing
operation of the project
from SPCB shall be
attached with the EIAEMP
report.
b.
In case the existing project
has not obtained
environmental clearance,
reasons for not taking EC
under the provisions of the
EIA Notification 1994
and/or EIA Notification
2006 shall be provided.
Copies of Consent to
Establish/No Objection
Certificate and (Consent to
Operate (in case of units
operating prior to EIA
Notification, 2006, CTE
and CTO of FY 2005-
2006) obtained from the
SPCB shall be submitted.
Further, compliance report
to the conditions of
consents from the SPCB
shall be submitted.
Not Applicable, as project is green field
project. --.
4. Site Details
i.
Location of the project site
covering village,
Taluka/Tehsil, District and
State, Justification for
selecting the site, whether
other sites were considered
Project is located at Plot No. D-10, MIDC
Paithan-431107, Taluka- Paithan, Dist.-
Aurangabad, Maharashtra.
As, site is in Notified Industrial area
Paithan MIDC, where all facilities are
available.
Chapter 1, Table
1.1; also shown in
Chapter 2 and
Chapter 5.

M/s. Shalini Organics Pvt. Ltd., MIDC Paitha, Dist- Aurangabad. EIA/EMP
Page 28
ii.
A Toposheet of the study
area of radius of 10km and
site location on 1:50,000/
1:25, 000 scale on an
A3/A2 sheet. (Including
all Eco sensitive areas and
environmentally sensitive
places).
Jaikwadi Bird Centaury is situated within 5
Km of the proposed project site. Distance
certificate is received from concerned
Authority.
Toposheet of the
study area is
included in
Chapter 3, Fig.
3.1.
iii.
Details w.r.t. option
analysis for selection of
site
As unit is in notified industrial area, MIDC
Paithan, Dist. Aurangabad, Maharashtra,
therefore no alternative site was considered.
--
iv. Co-ordinates (lat-long) of
all four corners of the site.
Latitude -19°32'57.43"N Longitude-
75°23'6.75"E
Latitude -19°32'56.66"N Longitude -
75°23'13.44"E
Latitude -19°32'53.40"N Longitude -
75°23'13.02"E
Latitude -19°32'53.40"N Longitude -
75°23'13.02"E
Chapter 2,
v.
Google map-Earth
downloaded of the project
site.
Google Earth image showing project site is
given in EIA/EMP report. Chapter 2
vi.
Layout maps indicating
existing unit as well as
proposed unit indicating
storage area, plant area,
greenbelt area, utilities etc.
If located within an
Industrial area/ Estate/
Complex, layout of
Industrial Area indicating
location of unit within the
Industrial area/ Estate
Project is a green field project having Plot
area 20,000 sq.mt. Master layout showing
storage area, plant area, green belt area etc.
is given in chapter no. 2.
Chapter 2
vii.
Photographs of the
proposed and existing (if
applicable) plant site. If
existing, show
photographs of plantation/
greenbelt, in particular.
Project is a green field project. Photographs
of the proposed project are shown in
Chapter 2.
Chapter 2
viii.
Land use break-up of total
land of the project site
(identified and acquired),
It is MIDC land with a plot area of 20,000
Sq.mt. Details are given in Chapter 2,
Section 2.3, Table 2.2
Details are
mentioned in
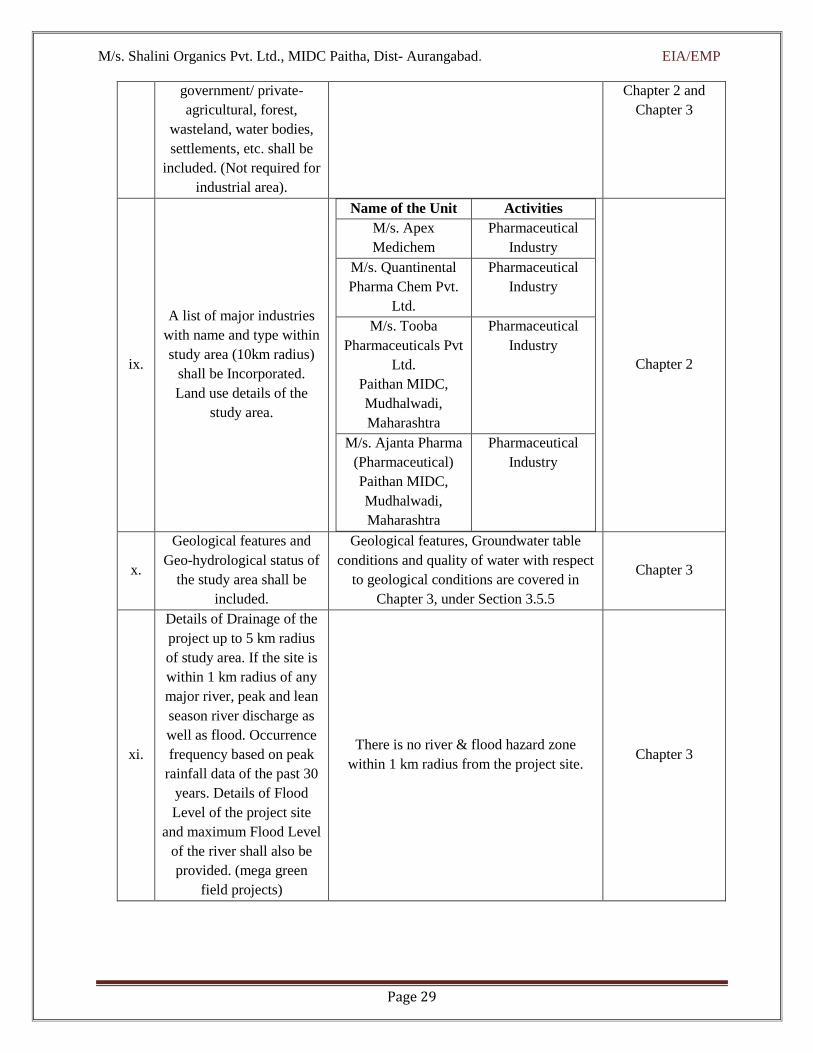
M/s. Shalini Organics Pvt. Ltd., MIDC Paitha, Dist- Aurangabad. EIA/EMP
Page 29
government/ private-
agricultural, forest,
wasteland, water bodies,
settlements, etc. shall be
included. (Not required for
industrial area).
Chapter 2 and
Chapter 3
ix.
A list of major industries
with name and type within
study area (10km radius)
shall be Incorporated.
Land use details of the
study area.
Name of the Unit Activities
M/s. Apex
Medichem
Pharmaceutical
Industry
M/s. Quantinental
Pharma Chem Pvt.
Ltd.
Pharmaceutical
Industry
M/s. Tooba
Pharmaceuticals Pvt
Ltd.
Paithan MIDC,
Mudhalwadi,
Maharashtra
Pharmaceutical
Industry
M/s. Ajanta Pharma
(Pharmaceutical)
Paithan MIDC,
Mudhalwadi,
Maharashtra
Pharmaceutical
Industry
Chapter 2
x.
Geological features and
Geo-hydrological status of
the study area shall be
included.
Geological features, Groundwater table
conditions and quality of water with respect
to geological conditions are covered in
Chapter 3, under Section 3.5.5
Chapter 3
xi.
Details of Drainage of the
project up to 5 km radius
of study area. If the site is
within 1 km radius of any
major river, peak and lean
season river discharge as
well as flood. Occurrence
frequency based on peak
rainfall data of the past 30
years. Details of Flood
Level of the project site
and maximum Flood Level
of the river shall also be
provided. (mega green
field projects)
There is no river & flood hazard zone
within 1 km radius from the project site. Chapter 3
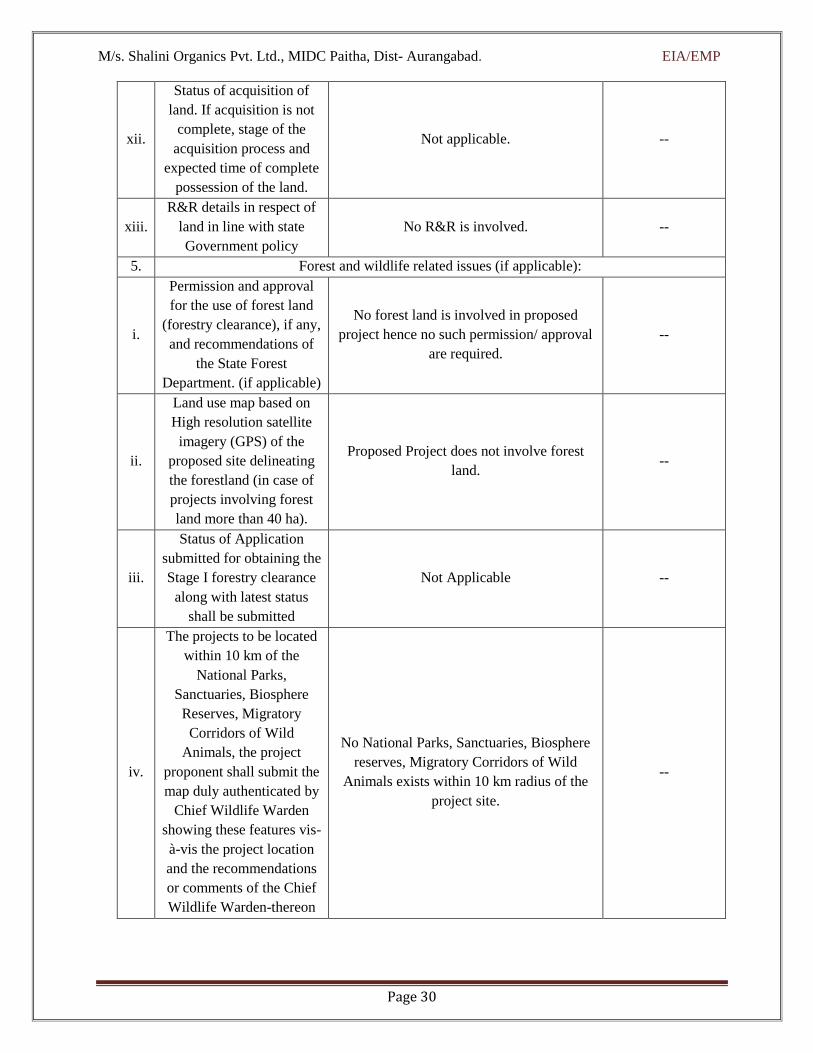
M/s. Shalini Organics Pvt. Ltd., MIDC Paitha, Dist- Aurangabad. EIA/EMP
Page 30
xii.
Status of acquisition of
land. If acquisition is not
complete, stage of the
acquisition process and
expected time of complete
possession of the land.
Not applicable. --
xiii.
R&R details in respect of
land in line with state
Government policy
No R&R is involved. --
5. Forest and wildlife related issues (if applicable):
i.
Permission and approval
for the use of forest land
(forestry clearance), if any,
and recommendations of
the State Forest
Department. (if applicable)
No forest land is involved in proposed
project hence no such permission/ approval
are required.
--
ii.
Land use map based on
High resolution satellite
imagery (GPS) of the
proposed site delineating
the forestland (in case of
projects involving forest
land more than 40 ha).
Proposed Project does not involve forest
land. --
iii.
Status of Application
submitted for obtaining the
Stage I forestry clearance
along with latest status
shall be submitted
Not Applicable --
iv.
The projects to be located
within 10 km of the
National Parks,
Sanctuaries, Biosphere
Reserves, Migratory
Corridors of Wild
Animals, the project
proponent shall submit the
map duly authenticated by
Chief Wildlife Warden
showing these features vis-
à-vis the project location
and the recommendations
or comments of the Chief
Wildlife Warden-thereon
No National Parks, Sanctuaries, Biosphere
reserves, Migratory Corridors of Wild
Animals exists within 10 km radius of the
project site.
--
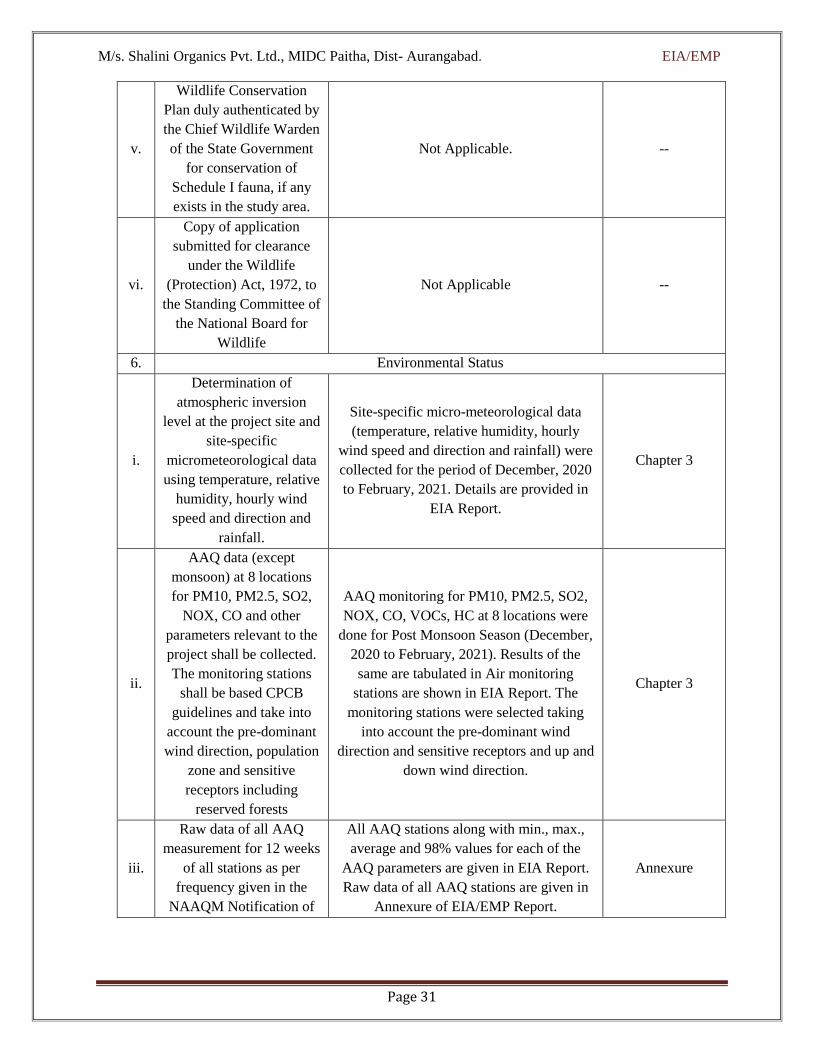
M/s. Shalini Organics Pvt. Ltd., MIDC Paitha, Dist- Aurangabad. EIA/EMP
Page 31
v.
Wildlife Conservation
Plan duly authenticated by
the Chief Wildlife Warden
of the State Government
for conservation of
Schedule I fauna, if any
exists in the study area.
Not Applicable. --
vi.
Copy of application
submitted for clearance
under the Wildlife
(Protection) Act, 1972, to
the Standing Committee of
the National Board for
Wildlife
Not Applicable --
6. Environmental Status
i.
Determination of
atmospheric inversion
level at the project site and
site-specific
micrometeorological data
using temperature, relative
humidity, hourly wind
speed and direction and
rainfall.
Site-specific micro-meteorological data
(temperature, relative humidity, hourly
wind speed and direction and rainfall) were
collected for the period of December, 2020
to February, 2021. Details are provided in
EIA Report.
Chapter 3
ii.
AAQ data (except
monsoon) at 8 locations
for PM10, PM2.5, SO2,
NOX, CO and other
parameters relevant to the
project shall be collected.
The monitoring stations
shall be based CPCB
guidelines and take into
account the pre-dominant
wind direction, population
zone and sensitive
receptors including
reserved forests
AAQ monitoring for PM10, PM2.5, SO2,
NOX, CO, VOCs, HC at 8 locations were
done for Post Monsoon Season (December,
2020 to February, 2021). Results of the
same are tabulated in Air monitoring
stations are shown in EIA Report. The
monitoring stations were selected taking
into account the pre-dominant wind
direction and sensitive receptors and up and
down wind direction.
Chapter 3
iii.
Raw data of all AAQ
measurement for 12 weeks
of all stations as per
frequency given in the
NAAQM Notification of
All AAQ stations along with min., max.,
average and 98% values for each of the
AAQ parameters are given in EIA Report.
Raw data of all AAQ stations are given in
Annexure of EIA/EMP Report.
Annexure

M/s. Shalini Organics Pvt. Ltd., MIDC Paitha, Dist- Aurangabad. EIA/EMP
Page 32
Nov. 2009 along with -
min., max., average and
98% values for each of the
AAQ parameters from
data of all AAQ stations
should be provided as an
annexure to the EIA
Report.
iv.
Surface water quality of
nearby River (100 m
upstream and downstream
of discharge point) and
other surface drains at
eight locations as per
CPCB/ MoEF&CC
guidelines.
Unit will not discharge in surface water
body. Surface water samples were collected
from 4 locations. Result of same is given in
EIA Report Surface water sampling
locations are shown in EIA Report
Chapter 3
v.
Whether the site falls near
to polluted stretch of river
identified by the CPCB/
MoEF&CC, if yes give
details.
Project site doesn’t fall near to polluted
stretch of the river identified by the
CPCB/MoEF&CC.
--
vi.
Ground water monitoring
at minimum at 8 locations
shall be included.
Ground water monitoring was carried out at
8 locations within study area. Result of
same is given in EIA Report.
Chapter 3 and
Annexure
vii.
Noise levels monitoring at
8 locations within the
study area
Noise level monitoring was carried out at 8
locations within study area. Result is given
in EIA Report.
Chapter 3 and
Annexure
viii. Soil Characteristic as per
CPCB guidelines.
Soil sampling was carried out at 8 locations
within study area. Result is given in EIA
Report with interpretation.
Chapter 3 and
Annexure
Ix
Traffic study of the area,
type of vehicles, frequency
of vehicles for
transportation of materials,
additional traffic due to
proposed project, parking
arrangement etc.
Traffic study of the area in respect of
existing traffic, type of vehicles, their
frequency, and additional traffic due to
proposed project was conducted and
covered in EIA Report. There will be
negligible impact on existing traffic due to
proposed project as existing road network
has adequate capacity to take increase load.
Chapter 4
x.
Detailed description of
flora and fauna (terrestrial
and aquatic) existing in the
study area shall be given
with special reference to
Flora & Fauna found within the study area
is given in EIA Report. Chapter 3

M/s. Shalini Organics Pvt. Ltd., MIDC Paitha, Dist- Aurangabad. EIA/EMP
Page 33
rare, endemic and
endangered species. If
Schedule-I fauna are found
within the study area, a
Wildlife Conservation
Plan shall be prepared and
furnished.
xi. Socio-economic status of
the study area
Socio-economic status of the study area is
given in EIA Report.
Chapter 3
7 Impact and Environment Management Plan
i.
Assessment of ground
level concentration of
pollutants from the stack
emission based on site
specific meteorological
features. In case the
project is located on a hilly
terrain, the AQIP
Modeling shall be done
using inputs of the specific
terrain characteristics for
determining the potential
impacts of the project on
the AAQ. Cumulative
impact of all sources of
emissions (including
transportation) on the
AAQ of the area shall be
assessed. Details of the
model used and the input
data used for modeling
shall also be provided. The
air quality contours shall
be plotted on a location
map showing the location
of project site, habitation
nearby, sensitive receptors,
if any
Assessment of incremental ground level
concentration of pollutant from the stack
emission based on site specific
meteorological features has been predicted
via computation done through mathematical
modeling and incorporated in EIA/EMP
Report.
Cumulative impact of all sources of
emissions on AAQ of the area is given in
EIA/EMP report.
Input parameters used for modeling and
additional inputs - maximum 50 (24-hr)
average concentration values for SPM,
SO2, NOx are provided in EIA/EMP
Report.
Isopleths showing air quality contours
plotted on location map is provided in
EIA/EMP report.
Chapter 4
ii.
Water Quality modeling -
in case of discharge in
water body
Not applicable, as no wastewater will be
discharged from proposed unit. --

M/s. Shalini Organics Pvt. Ltd., MIDC Paitha, Dist- Aurangabad. EIA/EMP
Page 34
iii.
Impact of the transport of
the raw materials and end
products on the
surrounding environment
shall be assessed and
provided. In this regard,
options for transport of
raw materials and finished
products and wastes (large
quantities) by rail or rail-
cum road transport or
conveyorcum-rail
transport shall be
examined.
There will be no major impact of the
transport of the raw materials and end
products on the surrounding environment
due to proposed project as proper mitigation
measures will be adopted.
Traffic study is provided in EIA Report.
Details regarding impact of the transport of
the raw materials and end products on the
surrounding environment are given in EIA
Report.
Chapter 4
iv.
A note on treatment of
wastewater from different
plant operations, extent
recycled and reused for
different purposes shall be
included. Complete
scheme of effluent
treatment. Characteristics
of untreated and treated
effluent to meet the
prescribed standards of
discharge under E(P)
Rules.
Effluent:
The effluent generated from process and
from other sources shall be segregated into
LCOD and HCOD streams. LCOD stream
is allowed to pass through collection pit and
oil and grease trap through screen Chamber.
The effluent as LCOD will enter into
equalization, primary clarifier and aeration
tank. The sludge form the primary clarifier
Shall be centrifuged and then spread on
sand bed for drying. The over flow from the
aeration tank is allowed to enter into
secondary clarifier. Overflow from
secondary clarifier shall be allowed to flow
into holding tank. The treated effluent will
be tested for COD/ BOD. The treated
effluent will be passed through sand and
carbon bed through pump and connected to
Reverse Osmosis facility. The effluent from
the RO will be reused for the various
operations. The Reject from RO will be
connected to Evaporator, which is equally
part
of HCOD effluent. The thick slurry from
Evaporator shall be filtered on nutsh filter.
The Filtrate from NF is send to primary
clarifier. The solid from NF shall be packed
and send to CHWTSDF for disposal.
Conclusively the ETP shall be designed for
Chapter 2
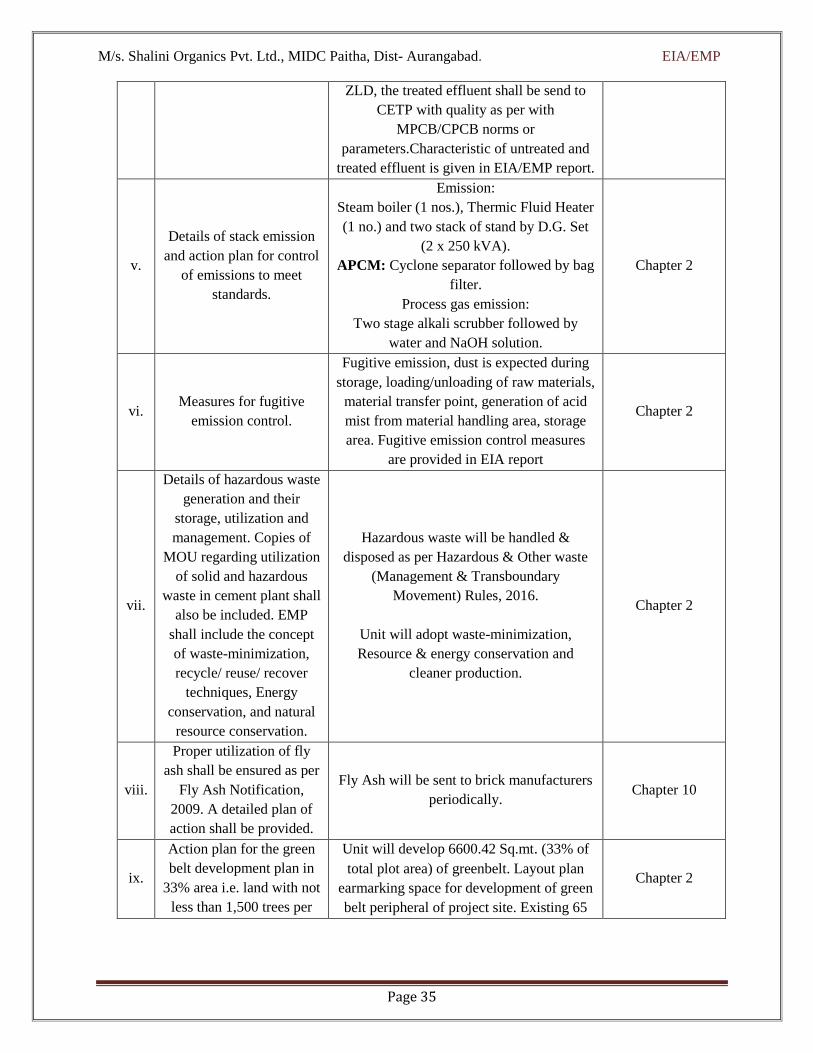
M/s. Shalini Organics Pvt. Ltd., MIDC Paitha, Dist- Aurangabad. EIA/EMP
Page 35
ZLD, the treated effluent shall be send to
CETP with quality as per with
MPCB/CPCB norms or
parameters.Characteristic of untreated and
treated effluent is given in EIA/EMP report.
v.
Details of stack emission
and action plan for control
of emissions to meet
standards.
Emission:
Steam boiler (1 nos.), Thermic Fluid Heater
(1 no.) and two stack of stand by D.G. Set
(2 x 250 kVA).
APCM: Cyclone separator followed by bag
filter.
Process gas emission:
Two stage alkali scrubber followed by
water and NaOH solution.
Chapter 2
vi. Measures for fugitive
emission control.
Fugitive emission, dust is expected during
storage, loading/unloading of raw materials,
material transfer point, generation of acid
mist from material handling area, storage
area. Fugitive emission control measures
are provided in EIA report
Chapter 2
vii.
Details of hazardous waste
generation and their
storage, utilization and
management. Copies of
MOU regarding utilization
of solid and hazardous
waste in cement plant shall
also be included. EMP
shall include the concept
of waste-minimization,
recycle/ reuse/ recover
techniques, Energy
conservation, and natural
resource conservation.
Hazardous waste will be handled &
disposed as per Hazardous & Other waste
(Management & Transboundary
Movement) Rules, 2016.
Unit will adopt waste-minimization,
Resource & energy conservation and
cleaner production.
Chapter 2
viii.
Proper utilization of fly
ash shall be ensured as per
Fly Ash Notification,
2009. A detailed plan of
action shall be provided.
Fly Ash will be sent to brick manufacturers
periodically. Chapter 10
ix.
Action plan for the green
belt development plan in
33% area i.e. land with not
less than 1,500 trees per
Unit will develop 6600.42 Sq.mt. (33% of
total plot area) of greenbelt. Layout plan
earmarking space for development of green
belt peripheral of project site. Existing 65
Chapter 2

M/s. Shalini Organics Pvt. Ltd., MIDC Paitha, Dist- Aurangabad. EIA/EMP
Page 36
ha. Giving details of
species, width of
plantation; planning
schedule etc. shall be
included. The green belt
shall be around the project
boundary and a scheme for
greening of the roads used
for the project shall also be
incorporated.
nos. of trees on site which will be retained.
Details of Green Belt Development are
provided in EIA report.
x.
Action plan for rainwater
harvesting measures at
plant site shall be
submitted to harvest
rainwater from the roof
tops and storm water
drains to recharge the
ground water and also to
use for the various
activities at the project site
to conserve fresh water
and reduce the water
requirement from other
sources.
The rain water from the building roofs will
be collected through rain water harvesting
tank.
Chapter 2
xi.
Total capital cost and
recurring cost/annum for
environmental pollution
control measures shall be
included.
The Capital cost of the project is Rs. 8.62
Crores, about 13% of the total project cost
is reserved for environment and pollution
control measures, 3.65 % for operation and
maintenance. 2 % of the total project cost
shall be reserved for corporate social
responsibility.
116.00 Lakhs and Recurring Cost will be
Rs. 31.5 Lakhs.
Cost breakup of Environment Management
is given in EIA report.
Chapter 10
xii.
Action plan for post
project environmental
monitoring shall be
submitted.
Action plan for post-project environmental
monitoring is adopted and included in EIA
report.
Chapter 10
xiii.
Onsite and Offsite Disaster
(natural and Man-made)
Preparedness and
Onsite and Offsite Disaster (natural and
man-made) Preparedness and Emergency Chapter 7

M/s. Shalini Organics Pvt. Ltd., MIDC Paitha, Dist- Aurangabad. EIA/EMP
Page 37
Emergency Management
Plan including Risk
Assessment and damage
control. Disaster
management plan should
be linked with District
Disaster Management
Plan.
Management Plan are included in EIA
Report.
8 Occupational health:
i.
Plan and fund allocation to
ensure the occupational
health & safety of all
contract and casual
workers.
Occupational health & safety plan will be
adopted by unit. Rs. 2.0 Lakhs per annum
has been allocated to ensure the
occupational health and safety of workers.
Chapter 10
ii.
Details of exposure
specific health status
evaluation of worker. If
the workers‟ health is
being evaluated by pre
designed format, chest x
rays, Audiometry,
Spirometry, Vision testing
(Far & Near vision, color
vision and any other ocular
defect) ECG, during pre-
placement and periodical
examinations give the
details of the same. Details
regarding last month
analyzed data of above
mentioned parameters as
per age, sex, duration of
exposure and department
wise.
This is a green field project. Unit will adopt
all Occupational Health & Safety
programme need based as per the statutory
requirements of Factory Act.
Chapter 7
iii.
Details of existing
Occupational & Safety
Hazards. What are the
exposure levels of hazards
and whether they are
within Permissible
Exposure Level (PEL)? If
these are not within PEL,
what measures the
As project is green field project, so there is
no existing Occupational & Safety Hazards.
Hazard analysis of materials is provided in
EIA Report including acute Exposure
Guideline Levels (AEGLS), Emergency
Response Planning Guidelines (ERPGs),
Immediately dangerous to life or health air
concentration values (IDLH values)
Chapter 7

M/s. Shalini Organics Pvt. Ltd., MIDC Paitha, Dist- Aurangabad. EIA/EMP
Page 38
company has adopted to
keep them within PEL so
that health of the workers
can be preserved
etc.
iv.
Annual report of health
status of workers with
special reference to
Occupational Health and
Safety.
Not applicable (New project proposal).
9. Corporate Environment Policy
i.
Does the company have a
well laid down
Environment Policy
approved by its Board of
Directors? If so, it may be
detailed in the EIA report.
Company has laid down
EnvironmentPolicy. Annexure
ii.
Does the Environment
Policy prescribe for
standard operating
process/ procedures to
bring into focus any
infringement/deviation /
violation of the
environmental or forest
norms/conditions? If so, it
may be detailed in the EIA
Environment Policy prescribes for standard
operating process to implement the
environmental standards. Additionally,
company has already set up a dedicated
Environment Management Cell (EMC) to
bring into focus any infringement/deviation
/ violation of the environment.
--
iii.
What is the hierarchical
system or Administrative
order of the company to
deal with the
environmental issues and
for ensuring compliance
with the environmental
clearance conditions?
Details of this system may
be given.
Hierarchical system of the company is
discussed in EIA Report. Chapter 10
iv.
Does the company have
system of reporting of
non-compliances /
violations of
environmental norms to
the Board of Directors of
the company and/or
Reporting mechanism will be adopted by
unit at the time of operational phase. Chapter 10

M/s. Shalini Organics Pvt. Ltd., MIDC Paitha, Dist- Aurangabad. EIA/EMP
Page 39
shareholders or
stakeholders at large? This
reporting mechanism shall
be detailed in the EIA
report.
10.
Details regarding
infrastructure facilities
such as sanitation, fuel,
restroom etc. to be
provided to the labor force
during construction as well
as to the casual workers
including truck drivers
during operation phase.
During construction & operation phase,
adequate infrastructure facilities like
restroom, sanitation, drinking water, etc.
will be provided to the labor force including
truck drivers. Also food facilities available
during the operation phase.
--
11. Enterprise Social Commitment (ESC)
i.
Adequate funds (at least
2.5% of the project cost)
shall be earmarked
towards the Enterprise
Social Commitment based
on Public Hearing issues
and item-wise details
along with time bound
action plan shall be
included. Socio-economic
development activities
need to be elaborated upon
The proposed project of Shalini Organics
Pvt. Ltd. is a green field project. As per
criteria given in the OM, the fund to be kept
aside by us is Rs. 17.24 Lakhs (2% of
Proposed cost i.e. Rs. 8.62 Cr.)
CER budget will be spent on creation of
infrastructural facilities, health, education,
environment, water, Sanitation & hygiene,
road & skill development etc. activities to
be carried out in discussion with District
Authority as suitable in nearby vicinity.
Budgetary
provision for CER
activities is given
in chapter 7
12
Any litigation pending
against the project and/or
any direction/order passed
by any Court of Law
against the project, if so,
details thereof shall also be
included. Has the unit
received any notice under
the Section 5 of
Environment (Protection)
Act, 1986 or relevant
Sections of Air and Water
Acts? If so, details thereof
and compliance/ ATR to
No litigation is pending against the project
and/or any direction/order passed by any
Court of Law against the project.
--
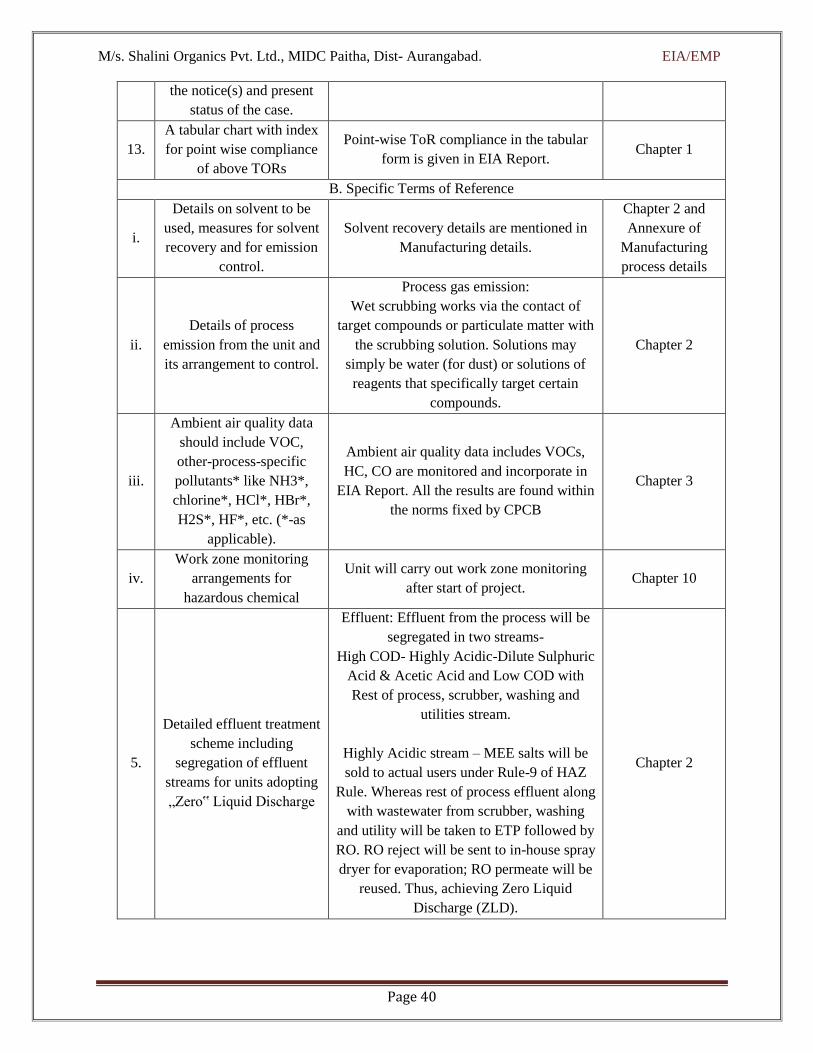
M/s. Shalini Organics Pvt. Ltd., MIDC Paitha, Dist- Aurangabad. EIA/EMP
Page 40
the notice(s) and present
status of the case.
13.
A tabular chart with index
for point wise compliance
of above TORs
Point-wise ToR compliance in the tabular
form is given in EIA Report. Chapter 1
B. Specific Terms of Reference
i.
Details on solvent to be
used, measures for solvent
recovery and for emission
control.
Solvent recovery details are mentioned in
Manufacturing details.
Chapter 2 and
Annexure of
Manufacturing
process details
ii.
Details of process
emission from the unit and
its arrangement to control.
Process gas emission:
Wet scrubbing works via the contact of
target compounds or particulate matter with
the scrubbing solution. Solutions may
simply be water (for dust) or solutions of
reagents that specifically target certain
compounds.
Chapter 2
iii.
Ambient air quality data
should include VOC,
other-process-specific
pollutants* like NH3*,
chlorine*, HCl*, HBr*,
H2S*, HF*, etc. (*-as
applicable).
Ambient air quality data includes VOCs,
HC, CO are monitored and incorporate in
EIA Report. All the results are found within
the norms fixed by CPCB
Chapter 3
iv.
Work zone monitoring
arrangements for
hazardous chemical
Unit will carry out work zone monitoring
after start of project. Chapter 10
5.
Detailed effluent treatment
scheme including
segregation of effluent
streams for units adopting
„Zero‟ Liquid Discharge
Effluent: Effluent from the process will be
segregated in two streams-
High COD- Highly Acidic-Dilute Sulphuric
Acid & Acetic Acid and Low COD with
Rest of process, scrubber, washing and
utilities stream.
Highly Acidic stream – MEE salts will be
sold to actual users under Rule-9 of HAZ
Rule. Whereas rest of process effluent along
with wastewater from scrubber, washing
and utility will be taken to ETP followed by
RO. RO reject will be sent to in-house spray
dryer for evaporation; RO permeate will be
reused. Thus, achieving Zero Liquid
Discharge (ZLD).
Chapter 2

M/s. Shalini Organics Pvt. Ltd., MIDC Paitha, Dist- Aurangabad. EIA/EMP
Page 41
6. Action plan for odour
control to be submitted.
Action plan for odour control is described
in EIA Report. Chapter 10
7.
A copy of the
Memorandum of
Understanding signed with
cement manufactures
indicating clearly that they
coprocess organic solid/
Hazardous waste in TSDF
if any
Unit has already obtained membership of
common hazardous waste disposal facility --
8.
Authorization/Membership
for the disposal of liquid
effluent in CETP and
solid/hazardous waste in
TSDF, if any.
Unit is performing ZLD with in-house ETP,
RO, MEE and spray dryer setup; hence
membership of CETP is not required. Unit
is obtained membership of common
hazardous waste disposal facility.
--
9. Action plan for utilization
of MEE/ dryers salt MEE/ dryer will be send to CHWSTDF --
10.
Material Safety Data Sheet
for all the Chemicals are
being used/will be used.
MSDS of Hazardous chemicals is attached
with EIA Report. Unit will sickly follow the
storage and handling instruction or handling
and storage of Hazardous chemicals.
Annexure
11.
Authorization/Membership
for the disposal of
solid/hazardous waste in
TSDF
Unit has obtained membership of
CHWSTDF. Annexure
12 Details of incinerator if to
be installed. -- --
13
Risk assessment for
storage and handling of
hazardous chemicals/
solvents. Action plan for
handling & safety system
to be incorporated
Risk assessment for storage and handling of
hazardous chemicals is covered in Chapter
7, Acute Exposure Guideline Levels
(AEGLS), Emergency Response Planning
Guidelines (ERPGs); Immediately
dangerous to life or health air concentration
values (IDLH values) provided in EIA
Report. Quantitative risk assessment &
consequence analysis is covered in Chapter-
7.
Chapter 7
14.
Arrangements for ensuring
health and safety of
workers engaged in
handling of toxic
materials.
Proper care will be taken at the time of
expansion of the project Chapter 7

M/s. Shalini Organics Pvt. Ltd., MIDC Paitha, Dist- Aurangabad. EIA/EMP
Page 42
1.9. Objective of EIA
The objectives of the present EIA study are to identify potential source of pollution, assess the
impacts on various environmental components due to the proposed project activity, and recommend
appropriate environmental management system and environment management plan for the unit to
ensure that the adverse impacts, if any, will be minimized.
Examine the prevailing baseline environmental and socio-economic condition of the study area
through baseline studied ad secondary data collection.
To evaluate the impacts of the project both positive and negative on the on the environment, ecology,
workers and community, due to proposed project.
The proposed methodology, including equipment, procedures and processes based on the
information received from the management and information given in Form-I and Prefeasibility
Report.
Identify mitigation measure for the adverse impacts
Define alternative in terms of project technology
Identification of major risk areas.
Hazard identification / Identification of failure cases.
Consequential analysis of probable risks / failure cases
Suggesting measures to further lower the probability of risk
1.10. Methodology for EIA
Considering the nature and magnitude of the project, surrounding area and various guidelines available, an
area of 10-km radius from the center of proposed plant site was considered for the purpose of environmental
impact assessment study. The methodology is briefly reported below,
Baseline data collection:
The baseline data for the impact zone have been generated for the following environmental parameters.
Ambient Air Quality –
Identifying and setting up Eight, Ambient Air Quality Monitoring (AAQM) stations within the study area
of 10km (as per the ToR) radius for parameter viz. PM10, PM2.5, Sulphur di-oxide (SO2), Oxides of Nitrogen
(NOx), CO and HC.
Monitoring of AAQ which entailed sampling and analysis of AAQ (December 2020 to February 2021)for
the study period, using standard monitoring methods and equipment for selected AAQM stations.
Micrometeorology –

M/s. Shalini Organics Pvt. Ltd., MIDC Paitha, Dist- Aurangabad. EIA/EMP
Page 43
Meteorological data was received for the December 2020 to February 2021 (The Study Period). TheStudy
Period using archives / information from the nearest IMD meteorological Station, and identifying the pre-
dominant downwind direction based on this exercise.
Noise Level
This entail;
Identifying a suitable number of monitoring locations
Environmental noise monitoring using SPL meter
Representing noise quality in dB(A) leq(d) and dB(A) leq(n) at the selected locations.
Surface & Ground Water Quality
Identification of surface water sources by including Rivers and other surface water like Lake, Pond etc. in
study area.
Sampling at relevant locations, considering human settlements as well as spatial spread across the study
area, for parameters as required for EIA study, along with additional
Parameters covering portability requirements, followed by testing using standard methods and equipment.
Soil Quality
This includes
Collection of information on soil types within the Region, based on secondary sources of information.
Identifying the different soil types in the Study Area.
Sampling of different soil types available in the study area for parameters and analysing as required.
Ecology & Biodiversity
This includes
Collection of authenticated lists of flora and fauna (terrestrial and aquatic) from Forest Department
(considering ToR),
Site survey of flora and fauna within study area
Socio-Economics
This includes
Collecting socio-economic data regarding population and dwelling units in the study area
Collecting information about the occupational pattern, education and health & medical infrastructure.
Collecting information about the general facilities like drinking water facilities or communication facilities
within the study area.
Cultural Attributes.
The baseline status of the above environmental parameters has been worked out based on the rapid
monitoring/analysis carried out during the study period of December, 2020 to February, 2021 supplemented
by data collected from various Govt. Dept., census publications etc. The data is collected and analyzed as
per the standard methods for establishing the baseline data and so determine the impact of proposed activity
on the same.

M/s. Shalini Organics Pvt. Ltd., MIDC Paitha, Dist- Aurangabad. EIA/EMP
Page 44
Evaluation of Impact from Project Activities-
The Environmental Impact resulting from the various project activities, have been identified, predicted and
evaluated based on the study of manufacturing process and other project related activities as well as
correlating the same with existing baseline status.
Preparation of Environmental Management Plan
Environmental Management Plan has been prepared covering pollution prevention measures at source in
terms of air and water pollution control measures, solid waste/hazardous waste management, safety
management, greenbelt development, environmental surveillance and environmental surveillance and
environmental management team. Finally, the detailed assessment of the resultant environmental impacts
has been made based on the impacts identification and evaluated from the activities over the baseline status
of various environmental components to reduce the pollution and to delineate a comprehensive environment
management plan along with recommendations and suggestions to improve environment management
system.
1.11. List of Industries Surrounding Project Site
Table 1-6 List of industries in the study area are shown below
Name of the Unit Activities
M/s. Apex Medichem Pharmaceutical Industry
M/s. Quantinental Pharma Chem Pvt. Ltd. Pharmaceutical Industry
M/s. Tooba Pharmaceuticals Pvt Ltd.
Paithan MIDC, Mudhalwadi, Maharashtra
Pharmaceutical Industry
M/s. Ajanta Pharma (Pharmaceutical)
Paithan MIDC, Mudhalwadi, Maharashtra Pharmaceutical Industry
1.12. Structure of EIA Report
Chapter 1: Introduction
Chapter one provides purpose of the report, background information of the proposed project, brief
description of nature, size and location of project, site photographs, environmental setting of the project,
estimated project cost, and scope of the study. The key environmental legislation and the standard relevant
to the project and the methodology adopted in preparation of the report have also been described in this
chapter.
Chapter 2: Project Description
Chapter two deals with the layout of the plan, location, process, details of the proposed project, other
technical and design information and sources of anticipated pollution.
Chapter 3: Description of the Environment

M/s. Shalini Organics Pvt. Ltd., MIDC Paitha, Dist- Aurangabad. EIA/EMP
Page 45
This chapter covers data of existing condition of Valued Environmental Components like air, water, noise,
soil, biological environment and socio-economic aspects, basic amenities land use pattern. It also gives
details of study area, period of study, component of environment & its methodology. Various sections of the
chapter discuss the existing land use and drainage pattern, climate and meteorological parameters.
Chapter 4: Anticipated Environmental Impacts and Mitigation Measures
This chapter describes the overall impacts of the project activities on various environmental components. It
predicts the overall impact of the project activities on different components of the environment viz. Air,
Water, Land, Noise, Biological and Socio-Economic and its mitigation measures.
Chapter 5: Analysis of Alternatives (Technology and Site)
This chapter gives details of analysis of alternatives in terms of technology & site
Chapter 6: Environmental Monitoring Program
This chapter describes technical aspects of monitoring (including measurement methodologies, frequency,
location and data analysis, reporting schedules, emergency procedures, detailed budget and procurement
schedules.
Chapter 7: Additional Studies
Chapter seven describes various additional studies carried out for the project. Various risks associated during
operational stage of the project are assessed in this chapter. Hazard identification and consequences analysis
are worked out to understand the remedial actions required during operation phase. A disaster management
plan to minimize the risks or to combat the associated risks is also presented.
Chapter 8: Project Benefits
This chapter focuses on benefits of project on improvement in physical infrastructure, social infrastructure
& other tangible benefits.
Chapter 9: Environmental Cost Benefit Analysis
This chapter focuses on ‘Environmental Cost Benefit Analysis’
Chapter 10: Environmental Management Plan
This chapter describes Environment Management Plan (EMP) to be adopted for mitigation of anticipated
adverse impacts if any and to ensure acceptable impacts.
Chapter 11: Summary and Conclusion
The summary of the EIA report has been given in this chapter along with conclusions. It is an effort to
present the EIA report in the form of a chapter. It will be easy for a reader to cover the whole report by
studying this chapter.
Chapter 12: Disclosure of the Consultant
This chapter describes the name of the consultant engaged with their brief nature of consultancy activities.
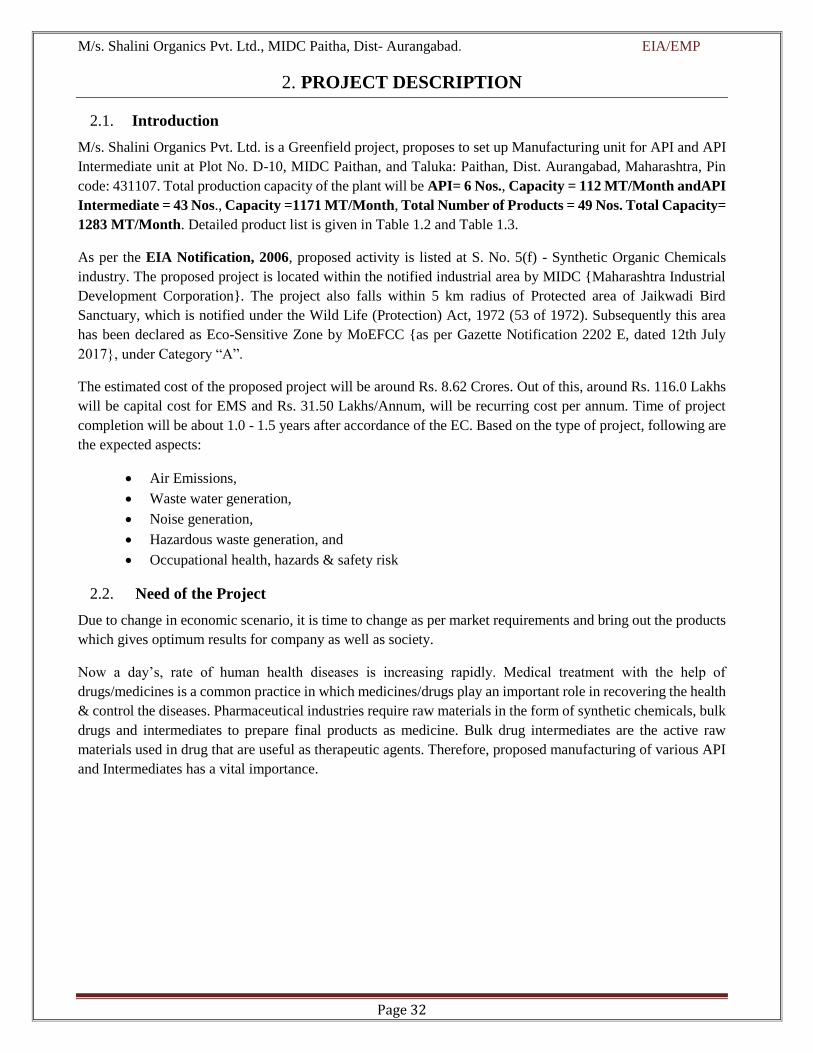
M/s. Shalini Organics Pvt. Ltd., MIDC Paitha, Dist- Aurangabad. EIA/EMP
Page 32
2. PROJECT DESCRIPTION
2.1. Introduction
M/s. Shalini Organics Pvt. Ltd. is a Greenfield project, proposes to set up Manufacturing unit for API and API
Intermediate unit at Plot No. D-10, MIDC Paithan, and Taluka: Paithan, Dist. Aurangabad, Maharashtra, Pin
code: 431107. Total production capacity of the plant will be API= 6 Nos., Capacity = 112 MT/Month andAPI
Intermediate = 43 Nos., Capacity =1171 MT/Month, Total Number of Products = 49 Nos. Total Capacity=
1283 MT/Month. Detailed product list is given in Table 1.2 and Table 1.3.
As per the EIA Notification, 2006, proposed activity is listed at S. No. 5(f) - Synthetic Organic Chemicals
industry. The proposed project is located within the notified industrial area by MIDC {Maharashtra Industrial
Development Corporation}. The project also falls within 5 km radius of Protected area of Jaikwadi Bird
Sanctuary, which is notified under the Wild Life (Protection) Act, 1972 (53 of 1972). Subsequently this area
has been declared as Eco-Sensitive Zone by MoEFCC {as per Gazette Notification 2202 E, dated 12th July
2017}, under Category “A”.
The estimated cost of the proposed project will be around Rs. 8.62 Crores. Out of this, around Rs. 116.0 Lakhs
will be capital cost for EMS and Rs. 31.50 Lakhs/Annum, will be recurring cost per annum. Time of project
completion will be about 1.0 - 1.5 years after accordance of the EC. Based on the type of project, following are
the expected aspects:
Air Emissions,
Waste water generation,
Noise generation,
Hazardous waste generation, and
Occupational health, hazards & safety risk
2.2. Need of the Project
Due to change in economic scenario, it is time to change as per market requirements and bring out the products
which gives optimum results for company as well as society.
Now a day’s, rate of human health diseases is increasing rapidly. Medical treatment with the help of
drugs/medicines is a common practice in which medicines/drugs play an important role in recovering the health
& control the diseases. Pharmaceutical industries require raw materials in the form of synthetic chemicals, bulk
drugs and intermediates to prepare final products as medicine. Bulk drug intermediates are the active raw
materials used in drug that are useful as therapeutic agents. Therefore, proposed manufacturing of various API
and Intermediates has a vital importance.

M/s. Shalini Organics Pvt. Ltd., MIDC Paitha, Dist- Aurangabad. EIA/EMP
Page 33
2.3. Location of the Project
Table 2-1 Silent feature of the project
Sr. No. Particulars Details
A.
Location Details
Village Paithan
Tehsil Paithan
District Aurangabad
State Maharashtra
Latitude 19°32'55.80"N
Longitude 75°23'9.20"E
Mean sea level 440 m
B. Environmental Setting Details (with approximate aerial distance & direction from plant
site)
1. Nearest Village Mudhalwadi- 1.42 km
2. Nearest town and City Aurangabad- 36.97 km
3. Nearest National Highway /
State Highway State highway Aurangabad to Paithan- 0.5 km
4. Nearest Railway station Aurangabad – 35.46 km
5. Nearest Airport Aurangabad Airport – 36 km
6.
National Parks, Wildlife
Sanctuaries, Biosphere
Reserves, Tiger/ Elephant
Reserves, Wildlife Corridors
etc. within 10 km radius
Project falls within 5 km radius of Protected area of
Jaikwadi Bird Sanctuary, which is notified under the
Wild Life (Protection) Act, 1972 (53 of 1972).
Subsequently this area has been declared as Eco-
Sensitive Zone by MoEFCC {As per Gazette
Notification 2202 E, Dated 12th July 2017}. The
distance of project from boundary of Jaikwadi Bird
Sanctuary is 4.46 Km in South West Direction
7. Reserved Forests
(RF)/Protected Forests (PF) No
8. Water Body (within 10 km
radius) No.
9. Seismic Zone Seismic Zone - III as per IS: 1893 (Part-I): 2002
Following are the coordinates of the project site:
Table 2-2 Co-ordinated of the site
Point Latitude Longitude
A 19°32'57.43"N 75°23'6.75"E
B 19°32'56.66"N 75°23'13.44"E
C 19°32'53.40"N 75°23'13.02"E
D 19°32'53.40"N 75°23'13.02"E

M/s. Shalini Organics Pvt. Ltd., MIDC Paitha, Dist- Aurangabad. EIA/EMP
Page 34
Figure 2-1 Project Location
Figure 2-2 Specific location
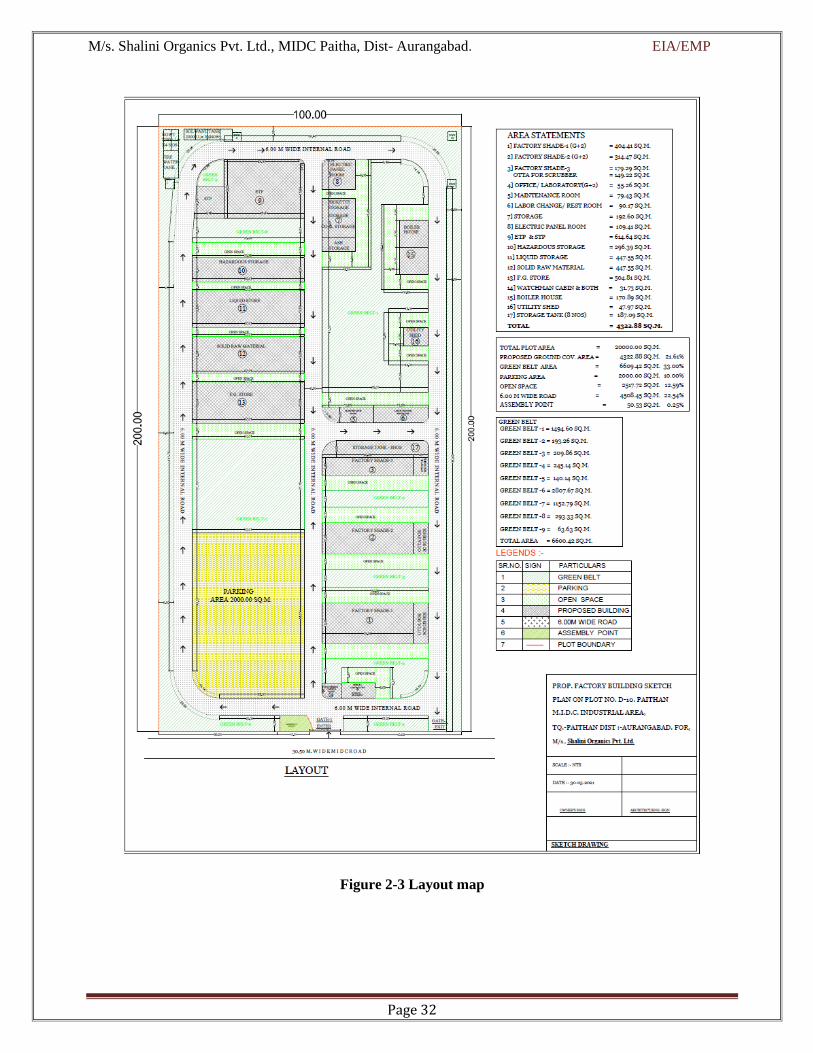
M/s. Shalini Organics Pvt. Ltd., MIDC Paitha, Dist- Aurangabad. EIA/EMP
Page 32
Figure 2-3 Layout map

M/s. Shalini Organics Pvt. Ltd., MIDC Paitha, Dist- Aurangabad. EIA/EMP
Page 36
2.4. Size or magnitude of Operation
2.4.1. Land Breakup & Project Site Layout
Proposed land area is 20,000 m2. Greenbelt will be developed in around 6600.42 m2 which tunes around 33.00 %
of the project area. Detailed break up of land is given below in Table 2.3
Table 2-3 Land use breakup
Sr. No. Description Area In Sq m. % of area
1 Proposed built-up area 4322.88 21.61
2 Green belt 6600.42 33.00
3 Parking 2000.00 10.00
4 Area Under Road 4508.45 22.54
5 Assembly point 50.53 0.25
6 Open space 2517.72 12.59
Total Plot Area 20000.00 100
Figure 2-4 10 km radius toposheet

M/s. Shalini Organics Pvt. Ltd., MIDC Paitha, Dist- Aurangabad. EIA/EMP
Page 75
2.5. Project Magnitude
Complete list of proposed products is given in below Table.2.4
1] API [Active Pharmaceutical Ingredient]
Table 2-4 List of API Products
Sr. No. Product Name UOM Qty.
/Month CAS NO Activity
1 Albendazole MT 60 54965-21-8 Anthelmetis
2 Frusemide MT 10 54-31-9 Anti Diuretic
3 Tizanidine MT 2 51322-75-9 Muscle Relaxer
4 Fenbendazole MT 15 43210-67-9 Antihelmintis
5 Triclabendazole MT 15 68786-66-3 Anti Liver flukes.
6 Hydroxy Quinoline MT 10 148-24-3 Anti-Malarial/Anti
Corona
Total MT 112
2.] API Intermediate
Table 2-5 List of API Intermediates
Sr.
No. Product Name UOM
Qty.
/Month CAS NO Remark
1 2-Nitro-4-propyl thioaniline MT 80 54393-89-4 Albendazole Inter.
2 2-Amino -4-Propyl thioaniline/ 4-
Propyl Thiodiamine MT 80 229326-17-4 Albendazole inter
3 2-Nitro Thiocyano aniline/ 2-Nitro-4-
propyl sulfanyl aniline MT 80 54029-45-7 Albendazole inter
4 2-Nitro -5-Phenyl mercapto Aniline MT 10 43156-47-4 Albendazole/Fabental/Fenb.
5 ThiophenoL MT 30 108-98-5 Starting raw material
6 5-Chloro-4-Amino-2,1,3
Benzothiadiazole MT 1 30536-19-7 Tizanidine Intermediate
7 Sodium Bromide MT 50 7647-15-6 Reagent
8 Sodium Sulphide Flakes/ NAHS soln MT 50 1313-82-2 Reagent
9 4-Bromo-2-fluoro Aniline MT 15 367-24-8 Flurbiprofen Intermediate
10 2-Fluoro Aniline MT 20 106-94-5 Flurbiprofen Intermediate
11 4-nItro Benzamide MT 30 619-80-7 Dimizimine HCl int
12
3,4 Dimethoxy Aniline MT 15 6315-89-5 Common inter
13 3-Hydroxy -Acetonephenone MT 10 121-71-1 Phenyl epherine interm.
14 Chloro Acetaldehyde Dimethyl Acetal MT 20 97-97-2 Intermediate
15 Lasamide MT 20 2736-23-4 Frusemide Inter
16 3-Nitro Acetophenone MT 15 121-89-1 PHEP Intermediate
17 4-Chloro-(2,3-dichloro phenoxy)-2-
Nitroaniline MT 20 139369-42-9 Triclabendazole Int

M/s. Shalini Organics Pvt. Ltd., MIDC Paitha, Dist- Aurangabad. EIA/EMP
Page 76
= 6-Chloro-5-(2,3-dichlorophenoxy-1H-
Benzimidazole MT = 100648-13-3 Triclabendazole int.
= 2-Nitro 4,5-dichloroacetanilide MT = 5462-30-6 Triclabendazole int
18 2-Chloro 1-(2,4-difluorophenyl)
ethanone MT 5 51336-94-8 Fluconazole int.
19 2-(4-Amino 4,5-dihydro- [1,2,4-]
triazole-1yl}-1-(2,4-difluoro ethanone MT 5 86404-63-9 Fluconazole intermediate
20 5-Amino Salicylic acid MT 20 89-57-6 Intermediate
21 1[4-chlorophenyl] phenyl methyl
piperzine MT 10 300543-56-0 Cetrizine diHCl int.
22 Tetra Butyl Ammonium Bromide MT 30 1642-19-2 Catalyst.
23 2-(4-methoxyphenyl) acetic acid MT 30 104-01-8 Dextromethorpan HBr.int.
24 Hydrogenation of Aldehydes and
Amines [ Aldehyde to Alcohol] MT 15 NA
General hydrogenation of
aldehydes and Amines.
25 1(2,4-dichloro phenyl)-2-(1-H-
imidazole -1-yl) Etanone/Ethanol MT 20 24155-42-8 Miconazole Inter.
26 1-(carbamethyl-cyclohexyl) Acetic acid MT 20 1157262-35-5 Gabapentin Intermediate
27 5-(4-(Ethylphenylethoxy) benzyl
thiozolidine-2,4- dione MT 10 112529-15-4 Pioglutazone intermediate
28 4-(4-Ethylphenyl-ethoxy)
benzaldehyde MT 15 114393-97-4 Pioglutazone intermediate.
29 2-(5-ethyl pyridine-ethanol) MT = 5223-06-3 Pioglutazone Intermediate
30 Ammonium thiocyanate MT 100 1762-95-4 Intermediate
31 Hydrogen Cynamide MT 50 420-04-2 Intermediate
32 N-Propyl Bromide MT 25 106-94-5 Intermediate
33 Cyanuric acid MT 25 108-80-5 Starting raw material
34 5-Methoxy-2-mercapto benzimidazole MT 20 37052-78-1 Omeprazole Intermediate
35 2-Chloro-5-Iodo Benzoic acid MT 5 19094-56-5 API Intermediate
36 4-Hydroxy coumarin MT 5 1076-38-6 Warfarin inter.
37 Cyanoacetic acid MT 25 372-09-8 Intermediate
38 5-Chloro-2- Ntroaniline MT 50 1635-61-6 Tricalbendazole
Intermediate
39 2-Nitro Aniline MT 100 88-74-4 Intermediate
40 2-Bromo Isopropyl Isobutyrate MT 10 51368-55-9 Finofibrate Intermediate
41 m-Nitro Benzaldehyde MT 05 99-61-8 Intermediate
42 2,2,4-Trichloro Acetophenone MT 15 4252-78-2 Miconazole Nitrate Interm.
43 4-Amino Benzonitrile MT 10 873-74-5 Intermediate
Total Intermediate MT 1171
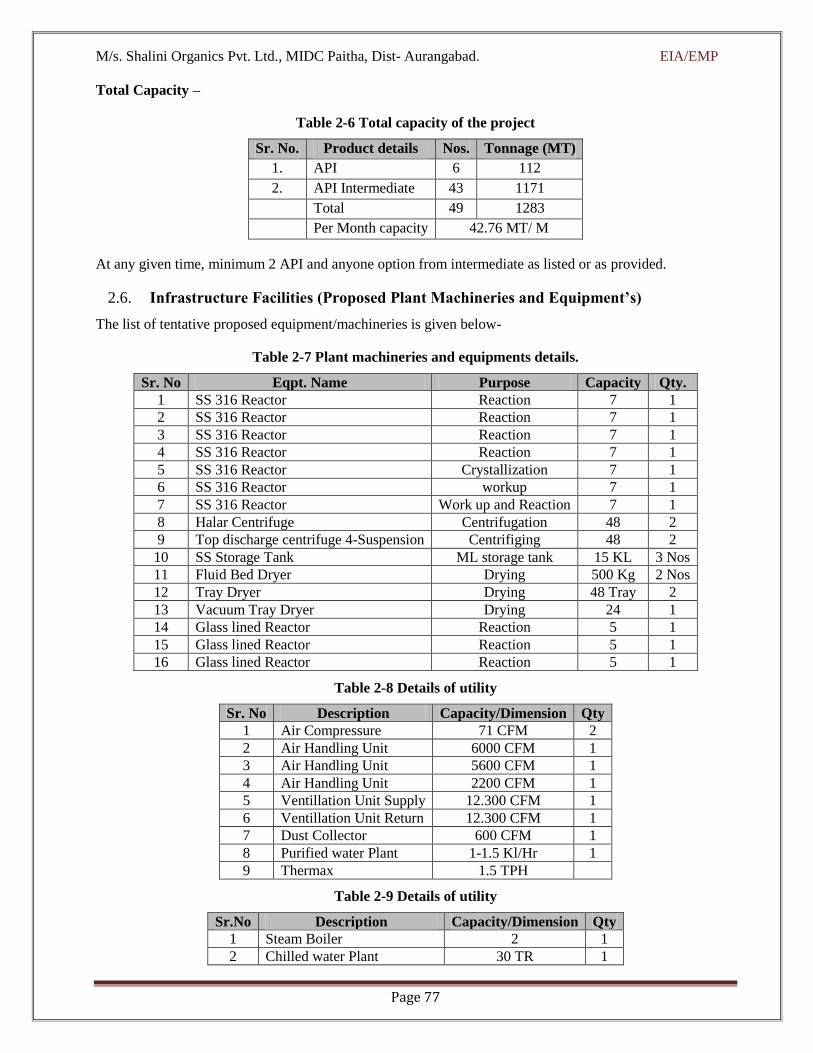
M/s. Shalini Organics Pvt. Ltd., MIDC Paitha, Dist- Aurangabad. EIA/EMP
Page 77
Total Capacity –
Table 2-6 Total capacity of the project
Sr. No. Product details Nos. Tonnage (MT)
1. API 6 112
2. API Intermediate 43 1171
Total 49 1283
Per Month capacity 42.76 MT/ M
At any given time, minimum 2 API and anyone option from intermediate as listed or as provided.
2.6. Infrastructure Facilities (Proposed Plant Machineries and Equipment’s)
The list of tentative proposed equipment/machineries is given below-
Table 2-7 Plant machineries and equipments details.
Sr. No Eqpt. Name Purpose Capacity Qty.
1 SS 316 Reactor Reaction 7 1
2 SS 316 Reactor Reaction 7 1
3 SS 316 Reactor Reaction 7 1
4 SS 316 Reactor Reaction 7 1
5 SS 316 Reactor Crystallization 7 1
6 SS 316 Reactor workup 7 1
7 SS 316 Reactor Work up and Reaction 7 1
8 Halar Centrifuge Centrifugation 48 2
9 Top discharge centrifuge 4-Suspension Centrifiging 48 2
10 SS Storage Tank ML storage tank 15 KL 3 Nos
11 Fluid Bed Dryer Drying 500 Kg 2 Nos
12 Tray Dryer Drying 48 Tray 2
13 Vacuum Tray Dryer Drying 24 1
14 Glass lined Reactor Reaction 5 1
15 Glass lined Reactor Reaction 5 1
16 Glass lined Reactor Reaction 5 1
Table 2-8 Details of utility
Sr. No Description Capacity/Dimension Qty
1 Air Compressure 71 CFM 2
2 Air Handling Unit 6000 CFM 1
3 Air Handling Unit 5600 CFM 1
4 Air Handling Unit 2200 CFM 1
5 Ventillation Unit Supply 12.300 CFM 1
6 Ventillation Unit Return 12.300 CFM 1
7 Dust Collector 600 CFM 1
8 Purified water Plant 1-1.5 Kl/Hr 1
9 Thermax 1.5 TPH
Table 2-9 Details of utility
Sr.No Description Capacity/Dimension Qty
1 Steam Boiler 2 1
2 Chilled water Plant 30 TR 1

M/s. Shalini Organics Pvt. Ltd., MIDC Paitha, Dist- Aurangabad. EIA/EMP
Page 78
3 Cooling Tower 500 TR 2
4 Cooling Tower 100 TR 1
5 Vacuum Ejector single stage 160m3/Hr 3
6 Water Ring Vacuum Pump 720 m3/Hr 1
7 Diesel Generator 250 KVA 2
9 Hoist 2.0 MT 1
10 Vacuum Blower 7.5 HP 1
11 Lifting Device 1300 Kg 1
12 Hydraulic Power Pack 20 HP 1
13 Purified water plant 2kl/Hr 1
14 DM Water plant 2kl/Hr 1
15 Thermopack 2 K.Calorie 1
Solvent and Mother Liquor Storage Tanks
Table 2-10 Details of Solvent and Mother Liquor tank
Sr. No. Description Capacity/Dimension Qty
1 Methanol Storage 15 KL 2
2 Distilled Methanol Storage 15 KL 2
3 Mother Liquor Storage 15 KL 4
4 Mother Liquor Storage 15 KL 4
Transfer Pumps
Sr. No. Description Capacity/Dimension Qty.
1 Methanol TR 5 m3/hr 2
2 Solvent Transfer 5 m3/hr 2
3 Process Water 32.4 m3/hr 1
4 Firehydrant Pump 42.40 m3/hr 1
5 ML TR Pump 5 m3/hr 1
6 Pressure filter Pump 15 m3/hr 1
7 Pressure Filter Pump 5 m3/hr 2
8 Cooling Tower Pump 80 KL/Hr 1
9 Aq. Layer TR Pump 15 m3/hr
Table 2-11 Details of Tanks
Sr. No Description Capacity/Dimension Qty
1 Feed Water Tanks 1700 Lit 1
2 Methanol Addtion Tanks 600 Lit 3
3 Solvent Receiver 2.5 Kl 1
4 Aq Layer Tr Tank 1800 Lit 1
5 Distilled Methanol Receiver 1800 Lit 1
6 Distilled Methanol Receiver 2500 Lit 1
7 Distillate Receiver 1800 Lit 3
8 Distillate Receiver 1500Lit 2
9 Distillate Receiver 2500 Lit 1
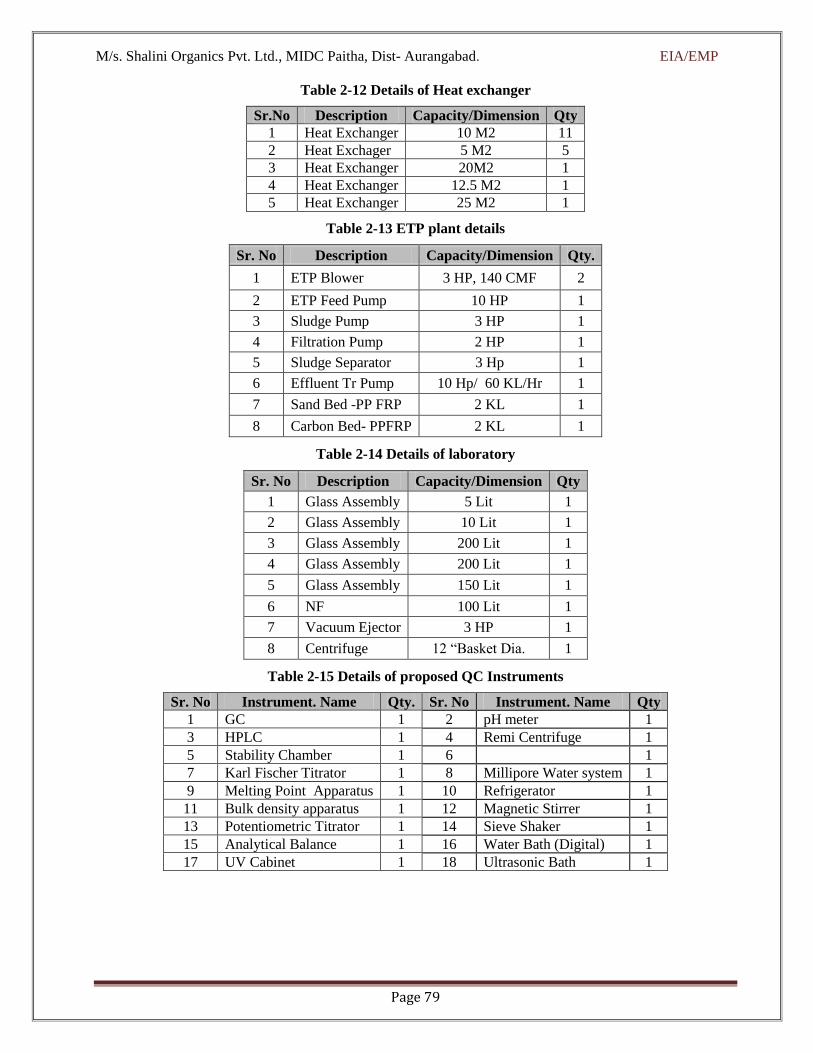
M/s. Shalini Organics Pvt. Ltd., MIDC Paitha, Dist- Aurangabad. EIA/EMP
Page 79
Table 2-12 Details of Heat exchanger
Sr.No Description Capacity/Dimension Qty
1 Heat Exchanger 10 M2 11
2 Heat Exchager 5 M2 5
3 Heat Exchanger 20M2 1
4 Heat Exchanger 12.5 M2 1
5 Heat Exchanger 25 M2 1
Table 2-13 ETP plant details
Sr. No Description Capacity/Dimension Qty.
1 ETP Blower 3 HP, 140 CMF 2
2 ETP Feed Pump 10 HP 1
3 Sludge Pump 3 HP 1
4 Filtration Pump 2 HP 1
5 Sludge Separator 3 Hp 1
6 Effluent Tr Pump 10 Hp/ 60 KL/Hr 1
7 Sand Bed -PP FRP 2 KL 1
8 Carbon Bed- PPFRP 2 KL 1
Table 2-14 Details of laboratory
Sr. No Description Capacity/Dimension Qty
1 Glass Assembly 5 Lit 1
2 Glass Assembly 10 Lit 1
3 Glass Assembly 200 Lit 1
4 Glass Assembly 200 Lit 1
5 Glass Assembly 150 Lit 1
6 NF 100 Lit 1
7 Vacuum Ejector 3 HP 1
8 Centrifuge 12 “Basket Dia. 1
Table 2-15 Details of proposed QC Instruments
Sr. No Instrument. Name Qty. Sr. No Instrument. Name Qty
1 GC 1 2 pH meter 1
3 HPLC 1 4 Remi Centrifuge 1
5 Stability Chamber 1 6 1
7 Karl Fischer Titrator 1 8 Millipore Water system 1
9 Melting Point Apparatus 1 10 Refrigerator 1
11 Bulk density apparatus 1 12 Magnetic Stirrer 1
13 Potentiometric Titrator 1 14 Sieve Shaker 1
15 Analytical Balance 1 16 Water Bath (Digital) 1
17 UV Cabinet 1 18 Ultrasonic Bath 1

M/s. Shalini Organics Pvt. Ltd., MIDC Paitha, Dist- Aurangabad. EIA/EMP
Page 80
2.7. Description of Manufacturing Process-
2.7.1. API Product Manufacturing Process-
1. Name of the Product: Albendazole
Sr. No. Description UOM Details
1 Quantity per Month: MT 60
2 No of days per Month No 30
3 Batch Output kg 2000
4 No of batches per Month No 30
5 No of Batches per Day No 1
6 Production per day kg 2000
Brief Manufacturing Process:
4- (Propylsulfanyl) benzene-1, 2- diamine and Ammonium salt of methyl-N-Cyanocarbamate is charged in
methanol at ambient temperature. The reaction mass is stirred for 20-30 minutes and acetic acid is added. The
reaction mass is heated to reflux and maintained for 3-5 hrs after completion of reflux the reaction mass is
cooled to ambient and centrifuged. The product is washed with methanol and spin dried. The wet product
unloaded from centrifuge is dried in tray dryer to get dry Albendazole. Mother liquor is subjected to distillation
to recover methanol. The concentrate reaction mass is cooled and filtered to get Ammonium acetate which is
sold to recycler. The solvent residue is dried and recycled.

M/s. Shalini Organics Pvt. Ltd., MIDC Paitha, Dist- Aurangabad. EIA/EMP
Page 81
Synthetic Route- for
S NH2
NH2
4-( Propylsulphanyl) Benzene -1,2- Diamine Mol.Wt 182
+ NCNHCOOCH3.NH4 + 2 Acetic acid
Ammonium salt of N-Cyano carbamate Mol.Wt 118
Acetic acid
Mol.Wt 60
S
NH
N
NHCOOCH3 + + Methanol
AlbendazoleMol.Wt 265.40
CH3COONH4
Ammonium acetate Mol.Wt 77.30
Mole Balance:-
Name of Output Mole Mol.Wt
Albendazole 1 265.40
Ammonia 2 34,06
Total = 299.46
Name of Material Moles Mol. Wt.
4-Propyl Benzene diamine 1 182
Cyanocarbamte 1 118
Total = 300

M/s. Shalini Organics Pvt. Ltd., MIDC Paitha, Dist- Aurangabad. EIA/EMP
Page 82
Material Balance = Input and output No of Batches /Month =30
Sr. No Input UOM Qty. Output Qty. Remark
1 4-propyl sulphanyl benzene
1,2-Diamine Kg 1400 Albendazole 2000 Final Product
2 Ammonim salt
CyanoCrabamate Kg 945 Rec.Methanol 980
Recycled to next
batch
3 Methanol Kg 1000 Ammonium Acetate 590 Sale to Recycler
4 Acetic acid kg 650 Methanol 20 Opertaional loss
5 ---------------- ---- Solvent Residue 405 To CHWTSDF
Total ----- 3995 Total 3995 --------------------
PROCESS FLOW DIGRAM:-
Total Input = 3995 kg Total Output = 3995 kg
1. SRM-I = 1400kg
2. Cyanaocarbamate = 945kg
3. Methanol = 1000kg
4. Acetic acid = 650
REACTOR
1. Albendazole = 2000kg
2. Methanol Rec. = 980kg
3. Ammonium Acetate = 590kg
4. Methanol = 20kg
5. Residue = 345 kg

M/s. Shalini Organics Pvt. Ltd., MIDC Paitha, Dist- Aurangabad. EIA/EMP
Page 83
Pollution Load Unit= kg [No of Batches/Month = 30]
Stag
e
Wat
er in
put
Effluen
t
generat
ed
Solve
nt
resid
ue
Carb
on /
Hyflo
w
Spent
Solve
nt
Spent
Moth
er
Liquo
r
Process
Emission Spent
Organ
ic
solven
t
Organ
ic
proces
s
residu
e
In-
orgnaics
Evaporati
on salts Na
me
Qt
y.
Pollution Load per Batch/Stage
-- Nil Nil 405 -- -- -- -- -- -- -- --
Pollution Load per Month
-- Nil Nil 12150 -- -- -- -- -- -- -- --
Pollution Load per Day
-- Nil Nil 405 -- -- -- -- -- -- -- --
Solvent balance: Unit=kg
Qty. in Kg/Batch or Day
Stag
e
Name
of
solvent
Solve
nt
used
Recover
ed
(distilled
)
Fugiti
ve loss
Distillati
on
process
loss
To
wast
e
wate
r
Distillati
on
residue
Produ
ct
drying
loss
spent
solve
nt
Fresh
Make
up
-- Methan
ol 1000 980 -- 20 -- -- -- -- 20
Water Balance – Unit= kg
Water
input
per
Batch
Stage
No of
Batches
per
month
No of
Working
days
Qty.
water
per
Month
Distilled
Water
Recycled
Net Water
consumption
per month
Net Water
consumption
per day
Nil Nil 100 30 -- -- -- --
Total Dissolved Solids Unit= kg, No of Batches/Month = 30
Effluent TDS /Batch
TDS /Month
TDS/ Day TDS = kg/kg Remark
Nil Nil Nil Nil Nil NA
Chemical Oxygen Demand = Unit kg, No of Batches Month = 30
Remaining Product Manufacturing details are attached as Annexure VII.
Effluent COD /Batch COD /Month COD/
Day COD – kg/kg Remark
Nil Nil Nil Nil Nil NA
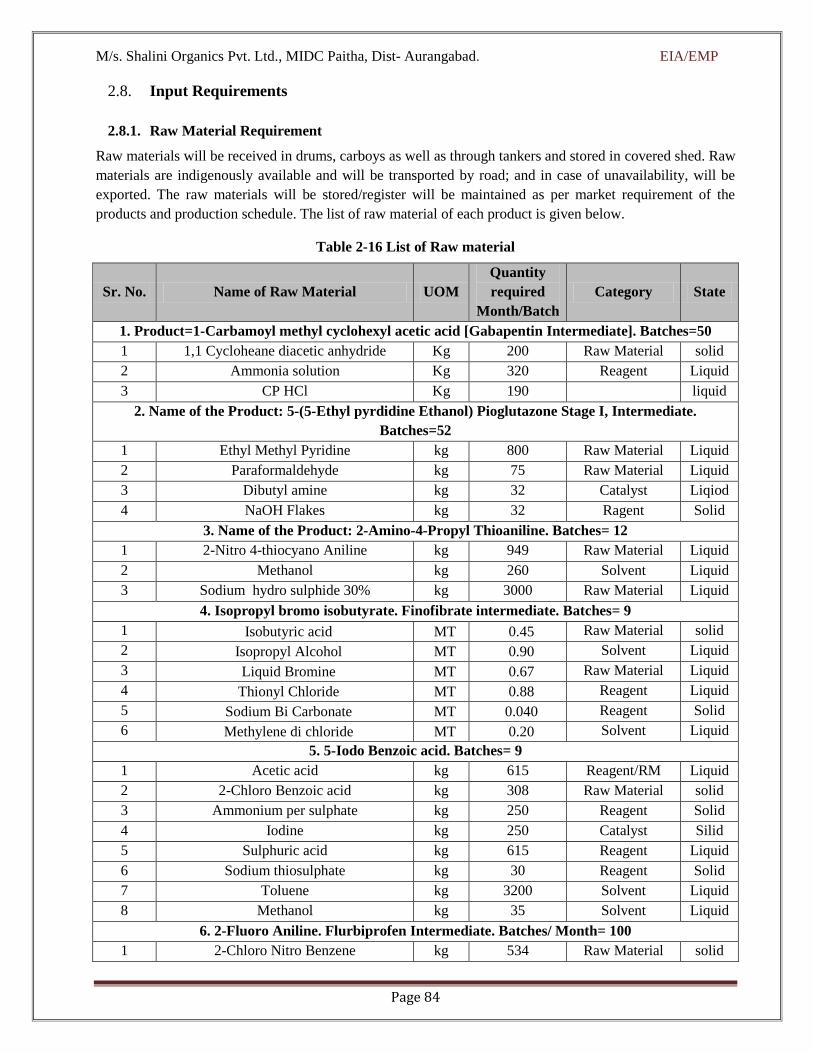
M/s. Shalini Organics Pvt. Ltd., MIDC Paitha, Dist- Aurangabad. EIA/EMP
Page 84
2.8. Input Requirements
2.8.1. Raw Material Requirement
Raw materials will be received in drums, carboys as well as through tankers and stored in covered shed. Raw
materials are indigenously available and will be transported by road; and in case of unavailability, will be
exported. The raw materials will be stored/register will be maintained as per market requirement of the
products and production schedule. The list of raw material of each product is given below.
Table 2-16 List of Raw material
Sr. No. Name of Raw Material UOM
Quantity
required
Month/Batch
Category State
1. Product=1-Carbamoyl methyl cyclohexyl acetic acid [Gabapentin Intermediate]. Batches=50
1 1,1 Cycloheane diacetic anhydride Kg 200 Raw Material solid
2 Ammonia solution Kg 320 Reagent Liquid
3 CP HCl Kg 190 liquid
2. Name of the Product: 5-(5-Ethyl pyrdidine Ethanol) Pioglutazone Stage I, Intermediate.
Batches=52
1 Ethyl Methyl Pyridine kg 800 Raw Material Liquid
2 Paraformaldehyde kg 75 Raw Material Liquid
3 Dibutyl amine kg 32 Catalyst Liqiod
4 NaOH Flakes kg 32 Ragent Solid
3. Name of the Product: 2-Amino-4-Propyl Thioaniline. Batches= 12
1 2-Nitro 4-thiocyano Aniline kg 949 Raw Material Liquid
2 Methanol kg 260 Solvent Liquid
3 Sodium hydro sulphide 30% kg 3000 Raw Material Liquid
4. Isopropyl bromo isobutyrate. Finofibrate intermediate. Batches= 9
1 Isobutyric acid MT 0.45 Raw Material solid
2 Isopropyl Alcohol MT 0.90 Solvent Liquid
3 Liquid Bromine MT 0.67 Raw Material Liquid
4 Thionyl Chloride MT 0.88 Reagent Liquid
5 Sodium Bi Carbonate MT 0.040 Reagent Solid
6 Methylene di chloride MT 0.20 Solvent Liquid
5. 5-Iodo Benzoic acid. Batches= 9
1 Acetic acid kg 615 Reagent/RM Liquid
2 2-Chloro Benzoic acid kg 308 Raw Material solid
3 Ammonium per sulphate kg 250 Reagent Solid
4 Iodine kg 250 Catalyst Silid
5 Sulphuric acid kg 615 Reagent Liquid
6 Sodium thiosulphate kg 30 Reagent Solid
7 Toluene kg 3200 Solvent Liquid
8 Methanol kg 35 Solvent Liquid
6. 2-Fluoro Aniline. Flurbiprofen Intermediate. Batches/ Month= 100
1 2-Chloro Nitro Benzene kg 534 Raw Material solid

M/s. Shalini Organics Pvt. Ltd., MIDC Paitha, Dist- Aurangabad. EIA/EMP
Page 85
Sr. No. Name of Raw Material UOM
Quantity
required
Month/Batch
Category State
2 Potassium Fluoride kg 256 Raw material liquid
3 Iron Powder kg 300 Reagent solid
4 Ferric chloride kg 20 Reagent solid
7. 2-Nitro- 4, 5- Dichloro acetanilide. Triclabendazole Intermediate. Batches/Month= 133
1 2,3-Dichloro Aniline kg 200 Raw Material solid
2 Acetic anhydride kg 190 Raw material liquid
3 Sulphuric acid kg 18 Reagent liquid
4 Acetic acid kg 575 Reagent liquid
5 Conc.Nitric acid kg 100 Raw Material liquid
6 EDC kg 400 Solvent liquid
7 Caustic lye kg 300 Reagent liquid
8. 2-Nitro-4-Propyl Thioaniline. Batches/Month= 84
1 2-Nitro 4-thiocyano aniline kg 825 Raw Material Solid
2 N-Propanol kg 2775 Raw Material Liquid
3 Sodium Hydroxide 50% kg 755 Reagent Liquid
4 N-Propyl Bromide kg 429 Raw Material Liquid
5 Sodium Chloride kg 18 Reagent Solid
9. 2-Nitro-4-Thiocyano aniline. Batches/Month= 183
1 2- Nitro Aniline kg 325 Raw Material Solid
2 Methanol kg 1000 Solvent Liquid
3 Chlorine Gas kg 190 Reagent Gas
4 Ammonium thiocynate kg 390 Reagent Solid
10. 5- phenyl Mercapto-2-Nitro Aniline. Batches/Month= 10
1 5-Chloro-2- Nitro Aniline kg 750 Raw Material Solid
2 Thiophenol kg 540 Raw material Liquid
3 Sodium Hydroxide kg 427 Reagent Solid
4 Methanol kg 3000 Solvent Liquid
11. 2-Nitro Aniline. Batches/Month= 1000
1 2-Chloro Nitro Benzene kg 1142 Raw Material Solid
2 Ammonia kg 246 Raw Material Liquid
12. 3, 4-Dimethoxy Aniline. Batches/Month = 50
1 3,4-Dihydroxy Anline kg 250 Raw Material Liquid
2 Potssium Carbonate kg 300 Reagent Solid
3 Dimethyl sulphate kg 200 Raw Material Liquid
4 Acetone kg 400 Solvent Liquid
13. 3-Hydroxy Acetophenone. Phenyl Epherine Intermediate. Batches/Month = 100
1 Acetophenone kg 175 Raw Material Solid
2 Sulphuric acid kg 1559 Reagent Liquid
3 Fuming Nitric acid kg 105 Raw Material Liquid
4 Dry ice kg 878 Cooling Media Solid
5 Soda ash Kg 23 Reagent Solid

M/s. Shalini Organics Pvt. Ltd., MIDC Paitha, Dist- Aurangabad. EIA/EMP
Page 86
Sr. No. Name of Raw Material UOM
Quantity
required
Month/Batch
Category State
6 Ammonium chloride kg 5 Reagent Solid
7 Iron powder Kg 300 Raw material Solid
8 Hydrose Kg 1 Reagent Solid
9 Sodium Nitrite kg 71 Reagent Solid
10 Toluene kg 150 Solvent Liquid
11 Ammonia solution kg 65 Reagent Liquid
12 Sodium chloride Kg 32 Helping agent Solid
14. 3-Nitro Acetophenone. Batches/Month= 46
1 Acetophenone kg 300 Raw Material Solid
2 Sulphuric acid kg 2360 Reagent Liquid
3 Dry Ice kg 1500 Media Solid
4 Soda ash kg 15.0 Reagent Solid
5 Fuming Nitric acid kg 180 Raw Material Liquid
15. 4-(4-Ethyl-phenyl ethoxy) Benzaldehyde/Benzyl thiazolidine 2, 4-Dione. Batches/ Month =66
1 Stage I=PZ-I kg 90 Raw Material Liquid
2 Toluene kg 200 Solvent Liquid
3 Triethyl amine kg 80 Reagent Liquid
4 Methane sulphonyl chloride kg 87 Reagent Liquid
5 4-Hydroxy Benzaldehyde kg 97 Raw Material Solid
6 Potassium Carbonate kg 137 Reagent Solid
7 Isopropanol kg 400 Solvent Liquid
8 Toluene kg 200 Solvent Liquid
9 NaOH kg 30 Reagent Solid
10 Methanol kg 1200 Solvent Liquid
11 Thiazoldine 2,4- Dione kg 75 Raw Material Solid
16.5-Chloro -4-Amino-2, 1, 3- Benzothiadiazole. Batches/Month = 6
1 Ethyl Acetate kg 700 Solvent Liquid
2 5-Chloro-4-Amino-2,1,3-
Bezothiadiazole kg 200 Raw Material Solid
3 Iron Powder kg 140 Raw Material Solid
4 Acetic acid kg 10 Reagent Liquid
5 Hexane kg 100 Solvent Liquid
6 Carbon/Hyflow kg 15 Filter aid/
Adosrbant solid
17. 4-Bromo-2-Fluoro Aniline. Flurbiprofen Intermediate. Batches/Month =30
1 2-Fluoro Aniline kg 180 Raw Materila Liquid
2 Acetic acid kg 400 Solvent Liquid
3 Hydrogen peroxide 50% kg 108 Reagent Liquid
4 NaOH solution 50% kg 700 Reagent Liquid
18. 4-Chloro Benzyl Alcohol = Typical hydrogenation process. Batches/Month = 100
1 4-Chloro Benzaldehyde kg 155 Raw Material Solid
2 Methanol kg 400 Solvent Liquid

M/s. Shalini Organics Pvt. Ltd., MIDC Paitha, Dist- Aurangabad. EIA/EMP
Page 87
Sr. No. Name of Raw Material UOM
Quantity
required
Month/Batch
Category State
3 Pd/Carbon kg 4 Adsorbant/
Filter aid Solid
4 Hydrogen kg 28M3 Reducung agent Gas
5 Nitrogen kg 2M3 Intert media Gas
19. 1- [4-Chloro Phenyl]-phenyl methyl piperzine- CTZ.HCl intermediate. Batches/Month =66
1 4- Chloro benzophenone kg 150 Raw Materila Solid
2 Sodium Hydroxide kg 76 Reagent Solid
3 Methanol kg 250 Solvent Liquid
4 Sodium Borohydride kg 9 Reducing agent Solid
5 HCl 30 % kg 600 Reagent Liquid
6 Toluene kg 200 Solvent Liquid
7 Piperzine kg 90 Raw material Solid
20. 4-Hydroxy Coumarin. Batches / Month =62
1 2-Hydroxy Acetophenone kg 70 Raw Material Liquid
2 Toluene kg 700 Solvent Liquid
3 Sodium Methoxide kg 50 Reagent Solid
4 Dimethyl Carbonate kg 52 Raw material Liquid
5 HCl kg 30 Reagent Liquid
6 Carbon kg 10 Adsorbant Solid
7 Hyflow kg 5 Filter aid Solid
21. 5-Amino Salicylic acid. Batches/Month =58
1 4-Amino Phenol kg 250 Raw material Solid
2 Water kg 300 Solvent Liquid
3 potassium Carbonate kg 600 Reagent Solid
4 CO2 kg 150 Reagent Gas
5 Sulphuric acid 20% kg 50 Reagent Liquid
6 Activated Carbon kg 10 Adsorbant Solid
22. 5-Chloro-2-Nitro Aniline.Batches/Month =100
1 m-Chloro Aniline kg 300 Raw material Solid
2 Acetic acid kg 600 Reagent Liquid
3 Water kg 600 Solvent Liquid
4 Nitric acid kg 150 Reagent Liquid
5 Sulphuric acid kg 450 Reagent Liquid
6 NaOH lye 50% kg 300 Reagent Liquid
7 HCl kg 300 Reagent Liquid
23. 5-Methoxy-2-Mercapto Bnezimidazole. Batches /month I=36 , / II= 55
1 4-Methoxy Phenyl Acetanilide kg 472 Raw material Solid
2 Sulphuric acid kg 600 Reagent Liquid
3 Nitric acid kg 200 Reagent Liquid
4 Sodium Sulhide Na2S, 9H2O kg 4428 Reagent Liquid
5 Carbon di Sulphide kg 200 Reagent Solid
6 Acetic acid kg 50 Reagent Liquid

M/s. Shalini Organics Pvt. Ltd., MIDC Paitha, Dist- Aurangabad. EIA/EMP
Page 88
Sr. No. Name of Raw Material UOM
Quantity
required
Month/Batch
Category State
24. Ammonium thiocyanate. Bathces /Month = 100
1 Carbon di Sulohide kg 1000 Raw material Liquid
2 25% Ammonia solution kg 1070 Reagent Liquid
3 NaOH 30 % kg 1500 Reagent Liquid
25. Chloroacetadehyde dimethyl acetal.
1 Vinyl acetate kg 1000 Raw material Liquid
2 Methanol kg 1883 Solvent Liquid
3 Chlorine Gas kg 825 Reactant Gas
4 Calcium oxide kg 200 Reagent Solid
26. Cyanamide 45-50 % Solution /Hydrogen cyanamide. Batches/Month =20
1 Aq. Solution containing NaBr kg 4000 Raw material Liquid
2 Catalyst NEO-HEXA kg 30 Catalyst Solid
27. Cyanuric acid. Bathces /Month = 208
1 Urea kg 200 Raw material Solid
2 Water 200 Solvent Liquid
28. Dichloro Phenyl Imidazole Ethanone/Ethanol [Miconazole Intermediate.]. Batches/Month = 200
1 2,2,4-Trichloro Acetophenone kg 100 Raw material Solid
2 Toluene kg 500 Solvent Liquid
3 Sodium Carbonate kg 80 Reagent Solid
4 Imidazole kg 40 Raw material Solid
5 Sodium Borohydride kg 12.50 Reagent Solid
6 Methanol kg 50 Solvent Liquid
7 NaOH kg 1.2 Reagent Solid
29. Hydrogen Cyanamide. Batches/Month = 100
1 OHCN kg 500 Raw material Liquid
2 Ammonia solution kg 1000 Raw material Liquid
30. Lasamide [ 2,4-Dichloro-5-sulphonyl chloride].Batches/Month = 111
1 2,4-Dichloro Benzoic acid kg 300 Raw material solid
2 Chlorosulphonic acid kg 600 Raw material Liquid
3 Ammonia Solution 12.5% kg 3600 Reagent Liquid
31. m-Nitro Bendzaldehyde. Batches/Month =50
1 Benzaldehyde kg 100 Raw material Liquid
2 Sodium Nitrate kg 85 Reagent Liqud
3 Sulphuric acid kg 200 Reagent Liquid
32. N-Propyl Bromide. Batches/Month = 25
1 Sodium Bromide solution kg 8000 Raw material liquid
2 Sulphuric acid kg 400 Reagent Liquid
3 Soda ash kg 200 Reagent Solid
4 N-Propanol kg 700 Solvent/Reactant Liquid
33. 2-((4-methoxy-3, 5-dimethyl pyridin-2-yl) methylthio)-2,3-dihydro-5- methoxy -1H-
benzo[d]imidazole [ Omeprazole Intermediate]. Batches/Month = 57

M/s. Shalini Organics Pvt. Ltd., MIDC Paitha, Dist- Aurangabad. EIA/EMP
Page 89
Sr. No. Name of Raw Material UOM
Quantity
required
Month/Batch
Category State
1 5-Methoxy -2-mercapto Benzimidazole kg 250 Raw material Solid
2 Chloro compound. kg 250 Raw material Solid
3 Sodium hydroxide kg 100 Reagent Solid
4 Methanol kg 800 Solvent Liquid
5 Ammonium molybdate kg 10 Catalyst Solid
34. 4-Nitro Bnezamide. Batches/Month =20
1 4-Nitro Benzoic acid kg 1670 Raw material Solid
2 Methanol kg 4000 Solvent Liquid
3 Thionyl Chloride kg 800 Reagent Liquid
4 Ammonia 25 % kg 4000 Reagent Liquid
35. Sodium Bromide. Batches/Month =50
1 Mother Liquor with Sodium Bromide kg 5000 Raw material Liquid
36. Sodium Sulphide Flakes. Bathces 33
1 Mother Liquor with Sodium Sulphide kg 5000 Raw material Liquid
2 Caustic Soda kg 1400 Reagent Solid
37. 4-Chloro-5-(2, 3-dichlorophenoxy)-2-Nitro Aniline. TBZ= II, Batches/Month= 62
1 2,3-Dichloro Phenol kg 100 Raw material solid
2 Potassium Carbonate kg 82 Reagent Solid
3 Dichloro phenyl -2-Nitro-acetanilide kg 142 Stage I Solid
4 DMF kg 200 Solvent Liquid
5 Methanol kg 200 Solvent Liquid
6 Methanolic Sodium Hydroxide kg 100 Reagent Liquid
38. 6-Chloro-5-(2, 3-dichlorophenoxy-1H-benzimidazole thiol. TBZ- III. 90
1 5-Chloro-dichloro phenoxy-nitro phenyl
amine kg 350 Raw Material Solid
2 Methanol kg 1000 Solvent Liquid
3 Raney Nickel kg 10 Catalyst Solid
4 Activated Carbon kg 10 Adsorbant Solid
5 Carbon di sulphide kg 55 Raw material Liquid
6 Hydrogen M3 50 Redcing agent Gas
7 Nitrogen M3 14 Inert media Gas
8 Methanolic Alkali solution kg 70 Reagent Liquid
10 HCl 30% Kg 80 Reagent Liquid
39. 2, 2, 4-Trichloro Acetophenone. Batches/ Month = 125
1 1,3-Dichloro Bnezene kg 100 Raw material Liquid
2 Alcl3 kg 122 Catalyst Solid
3 Chloro acetyl chloride kg 110 Raw material liquid
4 HCl 30% kg 20 Reagent Liquid
40. Tetra Butyl Ammonium Bromide. Batches/Month = 20
1 Tri butyl amine kg 1085 Raw material Liquid
2 n-Butyl Bromide kg 884 Raw material

M/s. Shalini Organics Pvt. Ltd., MIDC Paitha, Dist- Aurangabad. EIA/EMP
Page 90
Sr. No. Name of Raw Material UOM
Quantity
required
Month/Batch
Category State
3 Aceto Nitrile kg 750 Solvent Liquid
4 Ethyl acetate kg 1300 Solvent Liquid
41. Thiophenol. Batches/Month = 120
1 Isopropanol kg 1000 Solvent Liquid
2 Disulphide kg 500 Raw material Liquid
3 Sodium bi sulphite-35% kg 270 Reagent liquid
4 Acetic acid kg 700 Solvent Liquid
5 Sulphur kg 50 Catalyst Solid
2.8.2. Water Requirement
Source- [MIDC] Maharashtra Industrial Development Corporation, Paithan.
The total water budget for proposed project is shownin the Table No. 2.17
Table 2-17 Details of Water Consumption
Sr. No Water Consumption Source Quantity(m3) Remark
1 Boiler 40 Condensate Recycled
2 Cooling Tower Blow Down 30 ---
3 APCM [ Air Pollution control system] 2 ---
4 Manufacturing Process HCOD 120 ---
5 Washings, Cleaning, Equipment, Utensils etc 14 ---
6 Total Industrial 206 ---
Gardening 30 ---
Domestic 10 ---
Total 246
Table 2-18 Effluent generation
Sr. No Effluent Generation Source Quantity (m3)
1 Boiler Blow Down 2
2 Cooling Tower Blow Down 5
3 APCM [ Air Pollution control system] 1.6
4 Manufacturing Process HCOD 115
5 Washings, Cleaning, Equipment, Utensils etc. 12.50
6 Total Industrial 136.10
7 Domestic 9
8 Industrial + Domestic 145.10
HCOD/HTDS 115
LCOD/ LTDS 21.10
Table 2-19 Summary of water budget
Sr. No Description Quantity(m3)
1 Total Effluent generated and recycled 145
2 Steam Condensate Recycled 38
3 Fresh water Requirement 63
4 Total 246
5 Rain water Harvesting in rainy season 20

M/s. Shalini Organics Pvt. Ltd., MIDC Paitha, Dist- Aurangabad. EIA/EMP
Page 91
Figure 2-5 Water balance diagram
HCOD/ HTDS Treatment and disposal.
Treated in Stripper/ MEE/ ATFD and RO. Capacity Stripper
RO permeate used for make up to Boiler, cooling tower, cleaning.
RO Reject sent back to ETP for bio treatment.
LCOD/LTDS Treatment and disposal.
Effluent treated in ETP under biological treatment activated sludge method.
LCOD/LTDS effluent is treated in ETP, Bio-treatment. Treated Effluent after passing through sand and carbon
bed filter, it collected in holding tank and feed to RO. Permeate used for recycling. Reject from RO sent back
to ETP for bio-treatment.
HCOD 115 CMD, LCOD = 21.10 CMD.
ETP Based on activated sludge principal. Capacity 35 CMD
RO capacity 150 CMD, [75 CMD x 2 NO.] 20 hrs Functioning Flow 3.75 m3/Hr
Domestic Effluent 4 CMD/Day

M/s. Shalini Organics Pvt. Ltd., MIDC Paitha, Dist- Aurangabad. EIA/EMP
Page 92
Treatment in dedicated sewage treatment plant, treated sewage used for green belt treatment.
2.8.3. Power:
The power requirement for proposed project is 300 HP. (Source: - MSEDCL) Boiler 2 T/Hr.; Fuel Briquette -
500 kg/Hr. Proposed Thermopack 1 no 2.0 lac Kcal/hr. and 2 No. of DG Set having capacity of 250 KVA is
sufficient to meet emergency power requirement of the plant.
2.8.4. Fuel requirement details:
Unit proposes to use Briquette as fuel in proposed steam Boiler of 2 TPH capacity, LDO is proposed for
Thermic Fluid Heater (2.0 lac Kcal/hr.). Also, HSD will be used for 2 nos. of D.G. Set at the rate of 30 lit/hr.
in case of power failure. Details of fuel consumption are given below;
Table 2-20 Fuel requirement
Equipment Fuel Quantity required at full load
Steam Boiler of 2 T/Hr. Briquette 500 Kg/Hr.
Consumption shown is based on 100% utilization of individual fuel.
Thermopack 1 no 2.0 lac Kcal/hr. LDO 80 Lit./Hr.
D G 2 no X 250 KVA HSD 30 Lit/Hr. each
2.8.5. Man Power
Manpower requirement will be 60 nos. of skilled and unskilled category.
2.9. Generation of Pollutants
The sources of generation of pollutants are described as below;
Table 2-21 Details of effluent generation
Sr. No Effluent Generation Source Quantity(m3)
1 Boiler Blow Down 2
2 Cooling Tower Blow Down 5
3 APCM [ Air Pollution control system] 1.6
4 Manufacturing Process HCOD 115
5 Washings, Cleaning, Equipment, Utensils etc. 12.50
6 Total Industrial 136.10
7 Domestic 9
8 Industrial + Domestic 145.10
HCOD/HTDS 115
LCOD/ LTDS 21.10
2.10. Gaseous Emission
Flue gas emission will be from one common stack attached to steam boiler of 2 TPH capacity, one stack
attached to Thermic Fluid Heater (2.0 lakhs kcal/hr.) and two number of stacks of stand by D.G. Set (2 x 250
kVA). Briquette will be used as a fuel for boiler, LDO for Thermic Fluid Heater HSD for D.G. Set. Most
probable pollutants will be SPM/TPM, SO2 and NOx.

M/s. Shalini Organics Pvt. Ltd., MIDC Paitha, Dist- Aurangabad. EIA/EMP
Page 93
Table 2-22 Details of emission from process and flue gas
Sr.
No
Stack
No
Attached
to Capacity Fuel APCM
Stack
Height
Parameters
Emission
rate
Permissible
Limit
1 1 Steam
Boiler I 2 TPH
Briquette
500kg/Hr
Cyclone
separator
followed by
Dust collector
30M TPM <150 PPM
2 2 Thermopac
Boiler II 2 Lac/Hr
LDO
80 li/Hr
Dust collector
with
appropriate
Stack height.
30M
TPM
SO2
1.6 kg/H
<150 ppm
<35 ppm
3 3 DG 250 HSD 30
lit/Hr
Acoustic
Enclosure 6M*
SO2
3kg/Hr.
<150 ppm
<35 ppm
4 4 DG 250 HSD 30
lit/Hr
Acoustic
Enclosure 6M*
SO2
3kg/Hr. <35 ppm
Table 2-23 Details of proposed process and air emission
Sr.
No.
Stack
No Attached to APCM
Stack
Height Parameters
Permissible
Limit
1 1 Scrubber
Process
Catch pot with packed
column with water
supply
10m
Acid mist,
HCl
CO2/ SO2
<35 ppm
2 2
Laboratory
Fume
cupboard
Catch pot packed column
with water/Alkali
circulation.
10m SO2, HCL,
NO, HBr <35 ppm
4 3 Process
Reactor
Catch pot with packed
column 15 m
HCl, SO2,
CO2 < 35PPM.
Sources of fugitive emission:
Fugitive emission, dust is expected during storage, loading/unloading of raw materials, material transfer point,
generation of acid mist from material handling area, storage area. There will be also chances of generation of
fugitive emission from vehicular movement in the premises.

M/s. Shalini Organics Pvt. Ltd., MIDC Paitha, Dist- Aurangabad. EIA/EMP
Page 94
Table 2-24 Details of stack
Attached to Steam Boiler Thermopac DG Set
Capacity 2 TPH 2 Lac Kcal 2 x 250 KVA
Fuel type Briquette LDO HSD
Fuel 500 Kg/Hr. LDO 80 li/Hr 30 lit/Hr.
MOC MS MS MS
Shape Round Round Round
Height m
(aboveground level) 30 m 30 m
6.0 m Above roof top
of the shed
Mitigation Measures Cyclone separator Dust
Collector
Appropriate Stack and
Dust collector Stack/ Acoustic
2.10.1. Hazardous & Solid waste generation
The main solid waste from this factory will be (a) non-hazardous and (b) hazardous from process;
a. Non-hazardous waste:
Table 2-25 Details of Non-hazardous waste
Sr.No. Description Schedule No UOM Frequency Quantity
1 Boiler Ash NA kg Day 1500
2 Canteen Waste NA MT Month 0.30
3 Packaging Waste NA MT Month 0.40
4 Office waste NA MT Month 0.40
5 Septic Tank Sludge NA MT Month 0.30
6 Polythene bags NA MT Month 0.30
7 Broken Glass NA MT Month 0.02
8 Electronic Waste NA kg Month 10
9 Corrugated Box NA kg Month 100
10 Mild still [ MS Scrap] NA kg Month 250
11 SS Scrap. NA kg Month 150
Non-hazardous waste will be segregated as recyclable/ saleable.
Waste minimization at all levels for discarded products, empty containers, packing, surplus, unloading
spillages and fugitives.
The plant will produce very less amount of scrap material. All these will however be stored carefully
on raised platform, with dwarf toe-walls all around and an overhead roof. The contents will not be
stored in the factory for more than a fortnight.
b. Hazardous Waste
Table 2-26 Details of hazardous waste
Sr.No. Description Schedule
No UOM Frequency Quantity Disposal
1
Solvent
Distillation
Residue
28.10 Kg Day 3958 CHWTSDF
2 ETP Sludge 34.20 kg Day 250 CHWTSDF
3 Evaporation Salts
/MEE 34.20 kg Day 6747 CHWTSDF
4 Spent Carbon/
Hyflow 28.30 kg Day 107 CHWTSDF
5 Off Specification
Products 28.40 kg Day 100 CHWTSDF

M/s. Shalini Organics Pvt. Ltd., MIDC Paitha, Dist- Aurangabad. EIA/EMP
Page 95
6 Spent Mother
Liquor kg Day 8775 Sale to Recycler
7 Spent Acid kg Day 23755 Sale to authorized user
8 Spent Oil/ Process
Residue/ Waste 5.10/5.20 kg Month 200 CHWTSDF
9
Discarded
containers and
Drums
Barrels
33.10 No Month 100 Sale to authorized
Recycler/Reprocessor
10
Chemical sludge,
Oil and grease
skimming
residues.
35.40 kg Month 100 CHWTSDF
Reuse/ Recycle/ Recovery Systems proposed along with Details
The solvents used in manufacturing process will be recycled in the process itself.
The solvent recovery scheme will be proposed to recover maximum recovery of solvents.
Noise generation
Noise generation will be from process plant, from operation of boiler, TFH, D.G. Set and other
machineries/equipment, vehicular movements and other machineries. General noise level in the plant is
expected to come below acceptable limit.
2.11. Pollution Control Strategy
The details of pollution control strategy for various parameters are,
2.11.1. Effluent Management
1. Effluent is categorized as LCOD and HCOD based on COD value in terms of mg/Lit
2. Value more than 5000 mg/Lit is considered as LCOD and above as HCOD.
3. The corresponding streams of effluent are segregated and then sent for treatment to respective unit.
4. HCOD/ HTDS IS Treated in evaporation system. The unit has 3 no different units combined together.
Stripper column, MEE and ATFD. Condensate is pumped to RO with appropriate Capacity of RO or
sent to ETP biological treatment along with LCOD/LTDS effluent. [If COD /TDS within limit].
5. LCOD/LTDS is treated in ETP for biological treatment. Pretreated effluent shall be stored in a holding
tank and then pumped to RO for further treatment.
Description of Treatment
The total water requirement is 246 KL. Waste water generated from plant premises will be 145 KL Out of this
115 KLD will be high COD [Manufacturing Process] and 21 KLD Will be from washings, laboratory
usage,floor cleaning , equipment cleaning, product washing and utensils washings. Boiler / cooling tower blow
down etc. 9 KLD from domestic over flow from septic tank. [Treated separately in STP as outlined
below]This waste water shall be pumped into above ground level tank for storage and neutralization of HCOD.
LCOD effluent then routed to Zero liquid discharge facility in plant premises. All treatment tanks will be
constructed and installed above ground level with proof lining. HTDS/HCOD will be sent to MEE system with
stripper column followed by ATFD [Agitated thin film dryer]. The condensate from MEE/ATFD and
LTDS/LCOD effluents will be sent to either Biological ETP or recycled to MEE/ATFD. After pretreatment
the effluent will be sent to RO system.Permeate from RO system 70-75% shall be recycled and Reject shall

M/s. Shalini Organics Pvt. Ltd., MIDC Paitha, Dist- Aurangabad. EIA/EMP
Page 96
be back to MEE system or can be transferred to ETP biological treatment. Salts collected from ATFD system
will be collected and sent to CHWTSDF for safe disposal.
Effluent Management and ZLD system:
The effluent management system shall be developed to ensure ZLD. Effluent streams shall be segrated as
HCOD/ LCOD characterization. COD value upto 5000 mg/Lit is categorized as LCOD [Low Chemical
Oxygen Demand] and COD value more than 5000 mg/Lit as HCOD [High Chemical Oxygen Demand].
HCOD / HTDS EFFLUENT
The treatment system facility consist of
1. Screen Chamber. 2. Collection tank/ Neutralization tank. 3. Stripper column 4.MEE double effect forced
evaporation. 5. ATFD
Effluent is pumped to stripper column with marinating the flow and other conditions of temperature to stripped
low boiling and organic matter. The stripped condensate is collected and stored. It can be sending to incinerator
or sold to recycler.
Bottom aqueous part shall be be inlet to MEE calendriya for forced evaporation under steam pressure of 4-
bar with TVR [Thermo vapour Recompressor]. Condensate is collected in a holding tank. The concentrate
from MEE having about 10-15 % aqueous part is discharged to ATFD with appropriately regulating the flow
for proper evaporation and discharge of solid as waste. Condensate from ATFD / MEE is sent to RO. Permeate
of RO is recycled and Reject is send to MEE/ATFD or ETP for Bio treatment along with
The solid discharged from ATFD Bottom is collected and packed in appropriate packaging material. It contains
about 5-10 % of moisture, sent to CHWTSDF for disposal.
LTDS/ LCOD effluent will be generated from process washing, floor washings, utensils cleaning, Laboratory
operations, cooling tower blow down and other general operations is sent to Biological treatment.

M/s. Shalini Organics Pvt. Ltd., MIDC Paitha, Dist- Aurangabad. EIA/EMP
Page 97
Primary Treatment
The effluent enters into 2 no oil and grease chamber and then to equalization tank for dilution process for
better functioning and effective treatment. The effluent is thoroughly mixed with the help of air to get a
constant composition of the effluent. Effluent PH is adjusted to 7-8 with either acid or alkali. Neutralized
effluent is pumped to primary setting tank where the settled solid is separated. The clarified effluent is sent to
secondary treatment. Settled sludge is centrifuged and filtrate is recycled. The solid sludge is unloaded and
stored at quarantine area then disposed of to CHWTSDF or land filling if quality is compatible.
Secondary Treatment
The secondary is a biological activated sludge process. A two stage activated sludge process is adopted.
Stage I
Primary treated effluent is made inlet to aeration tank where aerobic bacterial culture is maintained in
suspension referred as mixed liquor suspended solids [MLSS].
The aerobic environment in the aerator is achieved by use of mechanical surface aerator or pure oxygen which
helps to maintain contents in a well mixed form with proper DO level. The effluent from aeration tank is
passed in to primary clarifier where the activated sludge is separated from treated waste water. A portion of
settled activated MLSS is retained. Over flow of primary goes to second stage of activated sludge process
called oxidation ditches.
Stage II
The surface aerator in series and connected in aeration tank. The treatment procedure is same as in stage I.
The overflow from the ditches is connected to secondary clarifier and collected in treated effluent sump.
Tertiary Treatment
The treated effluent collected from activated sludge process is sent to carbon and sand bed pressure filter and
collected in a separate holding tank and then pumped through RO, plant of appropriate capacity 150 kl/day
[6.85 KL/Hr]. The pump flow is based on 20 hrs functioning.
75-80 % permeate Output is collected and recycled to Cooling Tower, Boiler feed, cleaning etc. RO Reject is
sent to Evaporation system [MEE/ ATFD] or ETP for biological treatment depending upon COD/TDS values.
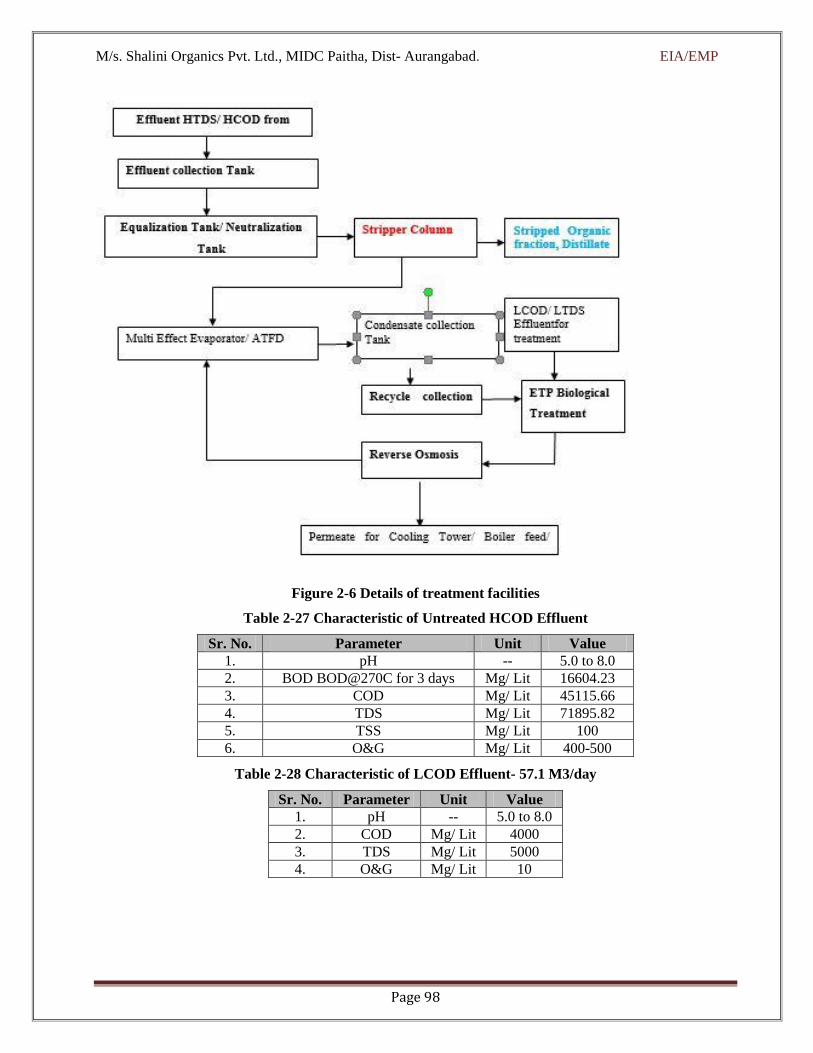
M/s. Shalini Organics Pvt. Ltd., MIDC Paitha, Dist- Aurangabad. EIA/EMP
Page 98
Figure 2-6 Details of treatment facilities
Table 2-27 Characteristic of Untreated HCOD Effluent
Sr. No. Parameter Unit Value
1. pH -- 5.0 to 8.0
2. BOD BOD@270C for 3 days Mg/ Lit 16604.23
3. COD Mg/ Lit 45115.66
4. TDS Mg/ Lit 71895.82
5. TSS Mg/ Lit 100
6. O&G Mg/ Lit 400-500
Table 2-28 Characteristic of LCOD Effluent- 57.1 M3/day
Sr. No. Parameter Unit Value
1. pH -- 5.0 to 8.0
2. COD Mg/ Lit 4000
3. TDS Mg/ Lit 5000
4. O&G Mg/ Lit 10
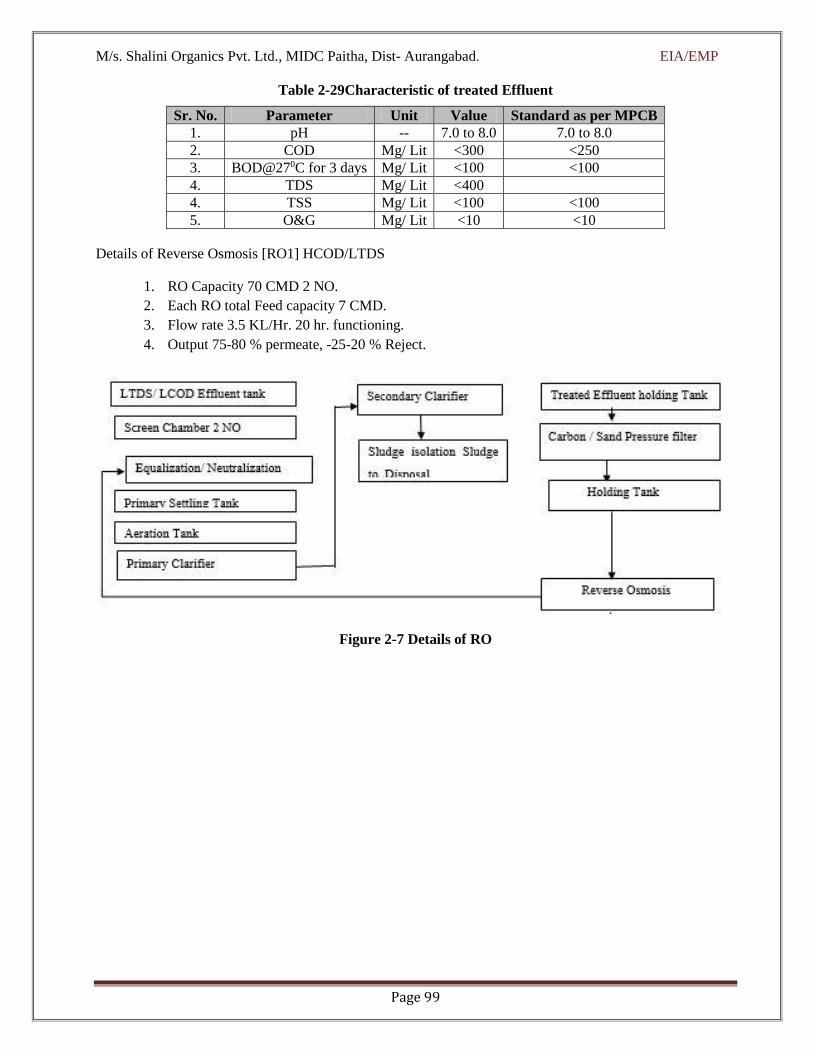
M/s. Shalini Organics Pvt. Ltd., MIDC Paitha, Dist- Aurangabad. EIA/EMP
Page 99
Table 2-29Characteristic of treated Effluent
Sr. No. Parameter Unit Value Standard as per MPCB
1. pH -- 7.0 to 8.0 7.0 to 8.0
2. COD Mg/ Lit <300 <250
3. BOD@270C for 3 days Mg/ Lit <100 <100
4. TDS Mg/ Lit <400
4. TSS Mg/ Lit <100 <100
5. O&G Mg/ Lit <10 <10
Details of Reverse Osmosis [RO1] HCOD/LTDS
1. RO Capacity 70 CMD 2 NO.
2. Each RO total Feed capacity 7 CMD.
3. Flow rate 3.5 KL/Hr. 20 hr. functioning.
4. Output 75-80 % permeate, -25-20 % Reject.
Figure 2-7 Details of RO

M/s. Shalini Organics Pvt. Ltd., MIDC Paitha, Dist- Aurangabad. EIA/EMP
Page 100
Table 2-30 Technical specification of various unit
Sr. No Facility Description Treatment Unit No Capacity
In m3 MOC
1 Screening Chamber 0.95X0.85x 1.84 1 1.5 RCC
2 Oil and grease trap 0.9x0.8x1.85 2 1.5 RCC
3 Collection tank 3.94X3.92X3.2 1 50 RCC
4 Coagulation Tank 1.3X01.50 SWD 2 2 RCC
5 Flocculation Tank 1.3x 1.53 1 2 RCC
6 Primary settling Tank 3x3.1.8 1 10 RCC
7 Aeration Tank 5x6x4 1 120 RCC
8 Secondary Clarifier with hopper Bottom 3x3x1.70 1 15 RCC
9 Filter feed Tank 2x3.98x2.48 1 30
10 Treated water Tank 2.47x2.50x3 1 24
11 Centrifuge 56” 2 400 kg cake capacity MS
12 Decantar 2-5 m3/hr 1 2-4m3/Hr MS
Table 2-31 Details of mechanical equipments
Sr.
No Description Size/ Capacity Hp Quantity MOC
1 Poly Electorate Dosing Tan 100 lit NA 1 HDPE/PP-
FRP
2 Alum Dosing Tank 100 NA 1 HDPE
3 DAP Dosing Tank 100 NA 1 HDPE
4 Urea dosing tank 100 NA 1 HDPE
5 Sludge transfer pump 12 1
6 Sludge Recycle pump 12 1 1
7 Primary feed pump 12 1 1
8 PSF Feed pump 12 3 2
9 RO feed pump 12 3 2
10 Air blower for bioreactor or aeration
Tank 700 m3/Hr 7.50 2
11 Air Blower for equalization Tank 150m3/Hr 5 1
12 Air blower for collection Tank 150 m3/Hr 5 2
13 Pressure sand filter NA NA 1 PP-FRP
14 Activated carbon filter NA NA 1 PP-FRP
15 Fine bubbled diffused aeration system 70 Dia X 2M
Length NA 20 Silicon
16 Course bubbled mixing system for
equalization tank 1000 mm Long NA 20 PVC
17 Decanter feed screw pump 1000lit/Hr 1 1 CI/SS

M/s. Shalini Organics Pvt. Ltd., MIDC Paitha, Dist- Aurangabad. EIA/EMP
Page 101
Table 2-32 Details of electrical units
Sr. No Description Size/ Capacity Hp Quantity MOC
1
Motor control center
Local motor control center
Earthling System
Area Lightening
--- NA 1 Flame proof
2 Interconnecting piping valves NA NA 1 Standard
Sewage Treatment Plant
Design Basis-
The plant is designed to treat the raw wastewater generated from domestic sources including kitchen having
following characteristics as given:
Capacity : 15 M3/D Average
Hours of Operation : 0.64 M3/Hr. @ 23 Hrs.
Peak Flow : 15 m3
Peak factor : 3.0 times for 3 hours
* The plant is designed to operate at max. +/- 10 % variation in raw wastewater parameters
The proposal for 15 CMD sewage treatment plant (STP)
• Features of MBBR Packaged system:
• Best present available highly aerobic technology for sewage treatment.
• Self-regulating biomass development and biomass holding process capability
• No operational adjustments required
• No sludge recirculation & Single pass treatment
• Lower footprints than any other technology& efficient process
• Stable under high organic loading
• Low mechanical equipment maintenance
• Low noise level
• No odour in surrounding environment
• No media replacement
• Old plants of any technology are upgraded with MBBR technology for capacity enhancement / quality
improvements.
Inlet Parameter
Parameter Details
pH 6.0-9.0
BOD 300 mg/L
COD 500-600 mg/L
Suspended Solids 200-300 mg/L
Oil & Grease 20-30 mg/L
Outlet Parameter
Parameter Details
pH 6.5-8.5
BOD <10.0 mg/L
COD <30.0 mg/L
Suspended Solids <10.0 mg/L
Oil & Grease < 01 mg/L

M/s. Shalini Organics Pvt. Ltd., MIDC Paitha, Dist- Aurangabad. EIA/EMP
Page 102
• Complies Pollution Control Board and local authority norms
• Treated water can be directly utilized for gardening, flushing etc.
Sewage Effluent Treatment Schematic Flow Diagram
Table 2-33 Details of STP
Unit Capacity
(Volume-M3) Method Of Construction Location
Screen Chamber 1.5 RCC Underground
Equalization Tank 7.5 RCC Underground
MBBR Reactor 1+1 6 RCC Underground
Tube Settler 5 RCC Underground
Filter Feed Tank 4 RCC Underground
Sludge Holding Tank 5 RCC Underground
Final Treated Water Tank
(08 Hrs HRT) 5 RCC Underground
Plant Room 1 m X 1.5 m RCC Aboveground
Total Space Requirement Approx. 15 m2
3 m
5m
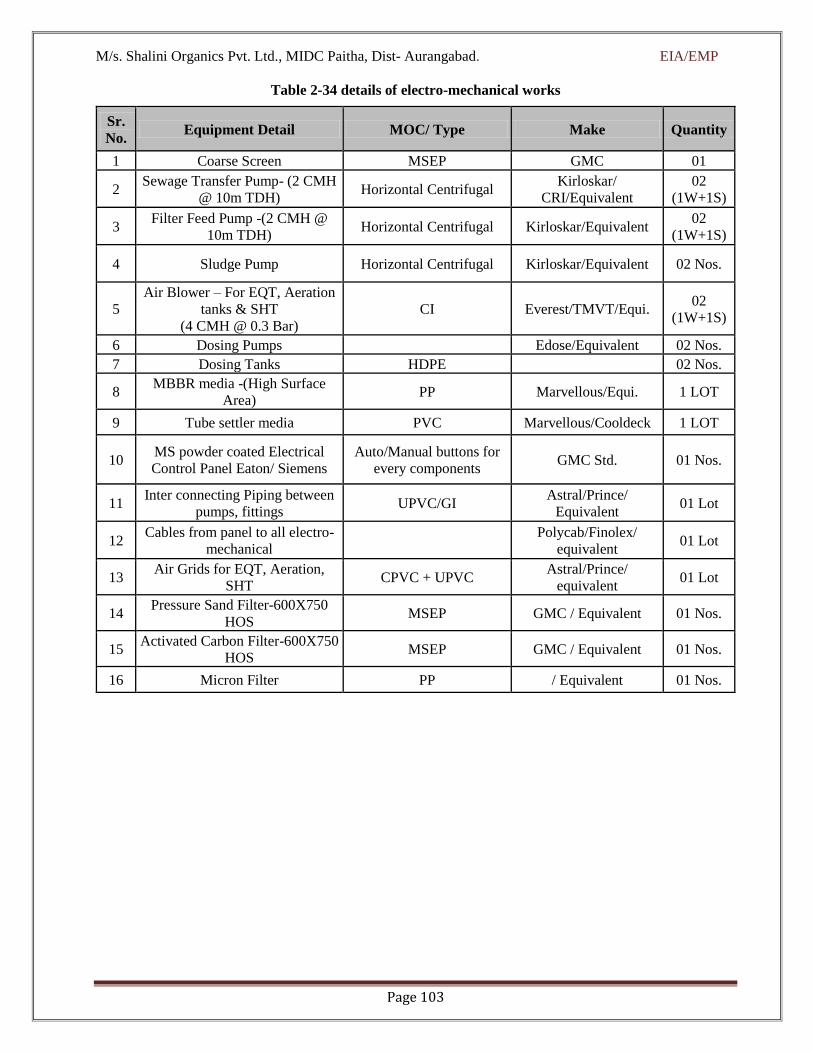
M/s. Shalini Organics Pvt. Ltd., MIDC Paitha, Dist- Aurangabad. EIA/EMP
Page 103
Table 2-34 details of electro-mechanical works
Sr.
No. Equipment Detail MOC/ Type Make Quantity
1 Coarse Screen MSEP GMC 01
2 Sewage Transfer Pump- (2 CMH
@ 10m TDH) Horizontal Centrifugal
Kirloskar/
CRI/Equivalent
02
(1W+1S)
3 Filter Feed Pump -(2 CMH @
10m TDH) Horizontal Centrifugal Kirloskar/Equivalent
02
(1W+1S)
4 Sludge Pump Horizontal Centrifugal Kirloskar/Equivalent 02 Nos.
5
Air Blower – For EQT, Aeration
tanks & SHT
(4 CMH @ 0.3 Bar)
CI Everest/TMVT/Equi. 02
(1W+1S)
6 Dosing Pumps Edose/Equivalent 02 Nos.
7 Dosing Tanks HDPE 02 Nos.
8 MBBR media -(High Surface
Area) PP Marvellous/Equi. 1 LOT
9 Tube settler media PVC Marvellous/Cooldeck 1 LOT
10 MS powder coated Electrical
Control Panel Eaton/ Siemens
Auto/Manual buttons for
every components GMC Std. 01 Nos.
11 Inter connecting Piping between
pumps, fittings UPVC/GI
Astral/Prince/
Equivalent 01 Lot
12 Cables from panel to all electro-
mechanical
Polycab/Finolex/
equivalent 01 Lot
13 Air Grids for EQT, Aeration,
SHT CPVC + UPVC
Astral/Prince/
equivalent 01 Lot
14 Pressure Sand Filter-600X750
HOS MSEP GMC / Equivalent 01 Nos.
15 Activated Carbon Filter-600X750
HOS MSEP GMC / Equivalent 01 Nos.
16 Micron Filter PP / Equivalent 01 Nos.

M/s. Shalini Organics Pvt. Ltd., MIDC Paitha, Dist- Aurangabad. EIA/EMP
Page 104
2.9.2 Air Pollution Control (APC) Measures
The main source of below mentioned gases is from manufacturing process of various products/ intermediate.
Table 2-35 Details of air pollution control measure
Sr.No. Name of the Product Name of
the Gas
Emission
kg/Day
Emission Rate
kg/Hr. Disposal Method
1 4.7- Dichloro
Quinoline
HCl
SO2
20.88
162.66
2.088
1.62
Scrubbed with chilled
water and caustic solution
2 2-Nitro thiocyano
aniline HCl 487 32.46
Scrubbed with chilled
water and caustic solution
3 2-Bromo Isobutyrate HBr, HCl,
SO2
78.20, 85.4
105.73
6.51 ,
7.11,10.57
Scrubbed with chilled
water and caustic
solution.
4 2-Nitro thiocycano
aniline HCl 487 24.35
Scrubbed with chilled
water and caustic
solution.
5 4-Nitro Benzamide HCl
SO2
86
66.60
4.30
6.66
Scrubbed with chilled
water and caustic
solution.
6 n-Propyl Bromide CO2 16.66 1.66 Disposed off to
atmosphere
7 Miconazole
Intermediate CO2 114.06 11.406
Disposed off to
atmosphere
8 Trichloro
acetophenone HCl 82.659 6.265
Scrubbed in chilled water
and caustic solution
9 4-Chloro dichloro
phenoxy Aniline CO2 201 2.01 Disposed to atmosphere
10 5-Amino Salicylic
acid CO2 186.20 12.40
Disposed off to
atmosphere
11 4-Amino Benzonitrile HCl, SO2 205.5, 180 2.055, 2 Scrubbed in chilled
water/ Caustic solution.
Fugitive Emission Control
To control fugitive emission, following steps will be implemented:
Entire process will be carried out in closed reactors.
Pneumatically transfer of liquid raw material in rector.
Provision of mechanical seals in pumps.
Raw material will be stored in the covered structure.
Regular maintenance of valves, pipes etc.
Provision dust suppression system (water sprinklers) to control air borne dust.
Fly ash will be stored in covered sheds only.
Internal road will be concreted or paved to reduce the fugitive emission during vehicular
movement.
Greenbelt will be developed around the plant to arrest the fugitive emission.
Frequent work area monitoring will be done ensure fugitive emissions level.

M/s. Shalini Organics Pvt. Ltd., MIDC Paitha, Dist- Aurangabad. EIA/EMP
Page 105
2.11.2. Hazardous/Solid Waste Management
Entire quantity of hazardous waste will be handled & disposed as per Hazardous & Other waste (Management
& Transboundary Movement) Rules, 2016. There will be ten sources of Solid/hazardous waste generation.
ETP Sludge and salt from Spray Dryer will be disposed off to approve CHWTSDF site. Iron sludge and
gypsum sludge will be sold to the cement plant for co-processing or disposed off to approve CHWTSDF site.
Iron sludge and gypsum sludge will be sold to the cement plant for co-processing or disposed off to approve
CHWTSDF site.
Table 2-36 Hazardous waste Details
Sr.
No. Description
Schedule
No UOM Frequency Quantity Disposal
1 Solvent Distillation
Residue 28.10 Kg Day 3958 CHWTSDF
2 ETP Sludge 34.20 kg Day 250 CHWTSDF
3 Evaporation Salts /
MEE 34.20 kg Day 6747 CHWTSDF
4 Spent Carbon/ Hyflow 28.30 kg Day 107 CHWTSDF
5 Off Specification
Products 28.40 kg Day 100 CHWTSDF
6 Spent Mother Liquor kg Day 8775 Sale to Recycler
7 Spent Acid kg Day 23755 Sale to authorized user
8 Spent Oil/ Process
Residue/ Waste 5.10/5.20 kg Month 200 CHWTSDF
9
Discarded containers
and Drums
Barrels
33.10 No Month 100 Sale to authorized
Recycler/Reprocessor
10
Chemical sludge, Oil
and grease skimming
residues.
35.40 kg Month 100 CHWTSDF

M/s. Shalini Organics Pvt. Ltd., MIDC Paitha, Dist- Aurangabad. EIA/EMP
Page 106
Table 2-37 Details of Non-hazardous waste
Sr.No. Description Schedule No UOM Frequency Quantity
1 Boiler Ash NA kg Day 1500
2 Canteen Waste NA MT Month 0.30
3 Packaging Waste NA MT Month 0.40
4 Office waste NA MT Month 0.40
5 Septic Tank Sludge NA MT Month 0.30
6 Polythene bags NA MT Month 0.30
7 Broken Glass NA MT Month 0.02
8 Electronic Waste NA kg Month 10
9 Corrugated Box NA kg Month 100
10 Mild still [ MS Scrap] NA kg Month 250
11 SS Scrap. NA kg Month 150
Non-hazardous waste will be segregated as recyclable/ saleable.
Waste minimization at all levels for discarded products, empty containers, packing, surplus, unloading
spillages and fugitives.
The plant will produce very less amount of scrap material. All these will however be stored carefully
on raised platform, with dwarf toe-walls all around and an overhead roof. The contents will not be
stored in the factory for more than a fortnight.
2.11.3. Noise Pollution Control Measures
The main noise generating sources in the plant will be from Boiler, Thermic Fluid Heater and D.G. set, process
plant, vehicular transportation & other machineries. All these sources will generate continuous noise.
However, the noise transmitted outside the plant boundary will be low because most of the noise generating
equipment’s will be in closed structures provided with acoustic enclosure. Ear muff, ear plug will be provided
to all workers working at noisy area. Additionally, extensive oiling, lubrication, periodic monitoring and
regular maintenance will be carried out for the machineries and equipment’s to reduce noise generation.
Adequate greenbelt (36 %) will be developed within premises and around the periphery to prevent the noise
pollution. By taking measures as mentioned, it is anticipated that noise levels in the plant will be maintained
below the permissible limit.
2.12. Rain Water Harvesting
A rainwater harvesting system comprises of various stages- transporting rainwater through pipes or drains,
filtration and storage in tanks for reuse. It is proposed to collect rainwater from roof top of building in a tank.
It is proposed to use this water for industrial purpose. Four no. of RWH Tank with capacity- 25 Cum each.
At the peak rainfall of 772 mm it is expected to generate runoff of 9076.54 m3. It is proposed to provide storm
water drainage of 0.5 m wide and 1 m depth along North boundaries of the plot. Connected to MIDC Storm
drain.
2.13. Green Belt Development
Total land area is 20,000 m2. The unit will develop greenbelt in area of 6600.42 m2. Overall greenbelt area
will be tuned around 33% of the total area of the project. As per the guidelines 2500 trees per hector of land
should br planted and the industry has exiting 65 nos. of trees and proposes 1585 nos. of trees will be planted
over the plot premises. The selection of trees is based upon the climatologically conditions of the Study area
and as per CPCB guidelines. The species for plantation have been selected on the basis of soil quality, place
of plantation, chance of survival, growth of plant etc.
M/s. Shalini Organics Pvt. Ltd., MIDC Paitha, Dist- Aurangabad. EIA/EMP
Page 107
2.14. Occupational Health and Safety
The company is concerned with the Environment, Health and Safety protection. The company will formulate
and develop an ‘Occupational Health & Safety Policy’ to ensure good health and safety of its employees.
Following key safety measures shall be a part of the Health & Safety policy of the company & shall be followed
after the project implementation:
PPE will be provided to cover occupational injury to foot, head, hearing, and eye.
Evacuation routes will be planned such that alternate route is available from any corner in more than
one direction
Extra precautions will be taken in loading/ unloading of flammable/toxic chemicals.
Ensuring that operators/workers etc. follows the SOPs, Safety procedures & standards, work permit
system etc.
Make sure existing fire extinguishers are fully charged and ready for action.
Inspection of Storage Area, Earthing & Bonding system.
Inspections of plant, machinery, tools, equipment, premises, work practices, processes, procedures
and general environment must be carried out for the health and safety of plant, people and surrounding.
On-site and Offsite Emergency Plans shall be reviewed and updated, as per the requirement
Fire Extinguishers shall be provided and Fire Hydrant System shall be installed.
Mock drills shall be periodically conducted and factors like response time shall be evaluated.
First Aid Facility and training shall be provided.
Health check-ups shall be organized at regular intervals.
Safety/Health records and MSDS shall be maintained

M/s. Shalini Organics Pvt. Ltd., MIDC Paitha, Dist- Aurangabad. EIA/EMP
Page 108
3. DESCRIPTION OF ENVIRONMENT
3.1. General
To assess environmental impacts from proposed project at a specific location, it is essential to monitor the
existing environmental quality prevailing in the surrounding area prior to implementation of the project. The
environmental status within the impact zone could be used for identification of significant environmental
issues to be addressed in the impact assessment study. Baseline data generation forms a part of the
Environmental Impact Assessment (EIA) study and helps to evaluate the predicted impacts on the various
environmental attributes in the study area by using scientifically developed and widely accepted impact
assessment methodologies. This section contains the description of baseline studies of 10 km radius
surrounding the project site. The baseline study was carried out to understand following environmental
parameters.
Land Environment
Meteorology
Air Environment
Water Environment
Soil Environment
Noise Environment
Biological Environment
Socio-economic Environment
The data collected has been used to understand the existing environment scenario around the project site
against which the potential impacts of the proposed project can be assessed.
3.2. Study Area
The unit is located at Plot No. D-10, MIDC Paithan, Taluka: Paithan, Dist. Aurangabad, Maharashtra. Pin
code: 431107. An area of 10 km radius from the boundary of the project site is considered as study area for
the EIA study as per the TOR issued by MoEF&CC.

M/s. Shalini Organics Pvt. Ltd., MIDC Paitha, Dist- Aurangabad. EIA/EMP
Page 109
Table 3-1 Environmental settling of study area
Sr.
No. particulars Details
A. Nature & Size of the
Project List of the products is mentioned in Table no.1.1
B. Category of the
Project
As per EIA Notification dated 14th Sep., 2006 as amended from time to
time; the project falls in Category ‘A’, Project or Activity -5(f).
C.
Location Details
Village Paithan
Tehsil Paithan
District Aurangabad
State Maharashtra
Latitude 19°32'55.80"N
Longitude 75°23'9.20"E
Mean sea level 440 m
D.
Area Details
Total Project Area
and Green belt
development area
Total Plot Area = 20000.00 Sq. M.
Green Belt 33% Of Plot Area = 6600.42 Sq. M.
Parking Area 10.0 % Of Plot Area = 2000.00 Sq. M.
E. Environmental Setting Details (with approximate aerial distance & direction from plant site)
1. Nearest Village Mudhalwadi- 1.42 km
2. Nearest town and
City Aurangabad- 36.97 km
3.
Nearest National
Highway / State
Highway
State highway Aurangabad to Paithan- 0.5 km
4. Nearest Railway
station Aurangabad – 35.46 km
5. Nearest Airport Aurangabad Airport – 36 km
6.
National Parks,
Wildlife
Sanctuaries,
Biosphere
Reserves, Tiger/
Elephant
Reserves, Wildlife
Corridors
etc. within 10 km
radius
Project falls within 5 km radius of Protected area of Jaikwadi Bird
Sanctuary, which is notified under the Wild Life (Protection) Act, 1972 (53
of 1972). Subsequently this area has been declared as Eco-Sensitive Zone
by MoEF&CC {As per Gazette Notification 2202 E, Dated 12th July
2017}. The distance of project from boundary of Jaikwadi Bird Sanctuary
is 4.46 Km in South West Direction.
7.
Reserved Forests
(RF)/Protected
Forests (PF)
No
8.
Water Body (within
10 km
radius)
No.
9. Seismic Zone Seismic Zone - III as per IS: 1893 (Part-I): 2002
3.3. Study Period
Baseline environmental quality represents the background scenario of various environmental components. As
part of EIA study, baseline environmental monitoring was done over a radial distance of 10 km around the
project site during the period of the period of baseline study is from December 2020 to February 2021.

M/s. Shalini Organics Pvt. Ltd., MIDC Paitha, Dist- Aurangabad. EIA/EMP
Page 110
3.4. Source of Environmental Data Generation
Baseline information on micrometeorology, ambient air quality, water quality, noise level, soil quality and
ecology (flora-fauna) are generated by J.V. Analytical Services, Pune. Apart from these, secondary data have
been collected from census book, revenue records, soil survey and forest department, meteorological
department etc. The generation of primary as well as collection of secondary data & information from the site
and surrounding was carried out during theperiod of December, 2020 to February, 2021.
3.5. Methodology
SOPL survey at project site and surrounding area was conducted and environmental samples collected were
analyzed for relevant parameters to arrive at the baseline environmental setting. Data from secondary sources
was also used to define environmental conditions. A study area of 10 km radius has been considered as per the
guidelines issued by the EAC for the collection of baseline data. The sampling locations were decided by
respective FAE’s in consultation with EC and secondary data was procured from various agencies. The
baseline monitoring for ambient air quality, water quality, soil quality and noise levels has been carried out by
J.V. Analytical Services, Pune recognized by MoEFCC, GOI, New Delhi, and ISO 9001:2008, OHSAS
18001: 2007 NABL Certified Company. NABL Certificate No.TC-7323, dtd. 24/11/2020 and MoEF&CC
Laboratory Certificate No. F. No. Q-150-15018/7/2014-CPW. Details are enclosed as Annexure II
To assess the Air environment in the study area, monitoring of the Air quality was done by setting up
reconnaissance. The samples were collected by installation of Respirable Dust Sampler (RDS) (with gaseous
attachment & FPS facility) at different locations for monitoring of primary air pollutants to work out the
existing status of air quality.
Ground water samples & surface water samples were analyzed for the parameters necessary to
determine water quality (based on IS: 10500-2012 criteria) and those which are relevant from the
point of view of environmental impacts of the project site.
Soil samples were collected using an Auger and analyzed for relevant physico-chemical
characteristics in order to assess the impact on soil.
The noise level monitoring was done at various locations at different intervals of time with the help
of sound level meter.
Socio-economic data was collected from field studies and secondary sources like Census of India
2011, Revenue record, etc.
3.5.1. Land Use of Study Area
The land-use & land cover map of the 10 km radial study area from the periphery of project site has been
prepared using Resource SAT-2 (IRS-P6), sensor-LISS-4 having 5.8 m spatial resolution and date of pass 30TH
Dec 2020 satellite image with reference to Google Earth data and the IRS-P5- Cartosat-I data having 2.5 m
spatial resolution and date of pass March 2016. In order to strengthen the baseline information on existing land
use pattern, the following data covering approx. the proposed project site as well as the 10 km radius from the
periphery of the project site i.e. 19° 38' 23.25"N to 19° 27' 27.21"N latitude and 75° 17' 22.61"E to 75° 28'
57.73"E longitude and elevation 358 to 453 meter are observed. The project is located in Survey of India topo
sheet no 47M/6 while 10 km radius study area covers two toposheets as 47M/6 and 47M/7.
The digital image processing was performed on ERDAS Imagine 2014 and QGIS 2.2 software system on high-
configured computer. This software package is a collection of image processing functions necessary for pre-
processing, rectification, band combination, filtering, statistics, classification, etc. Apart from contrast

M/s. Shalini Organics Pvt. Ltd., MIDC Paitha, Dist- Aurangabad. EIA/EMP
Page 111
stretching, there are large numbers of image processing functions that can be performed on this station. Arc
GIS map 10.1 is used for final layout presentation.
Table 3-2 details of the used satellite details
Satellite/ Image Sensor Spatial resolution Date of Acquisition
Resource SAT-2 LISS-4 5.8 m 30TH Dec 2020
IRS-P-5 Cartosat-1 2.5 m March 2016
3.5.2. Land Environment
Since, a major part of 10km study area comprises of Water body, Agricultural Area and Open scrub thus study
on land environment of ecosystem play an imperative role in identifying susceptible issues and taking
appropriate action to uphold ecological equilibrium in the region. The main objective of this section is to
provide a baseline status of the study area covering 10 km radius around the project site so that temporal
changes due to the industrial activities on the surroundings can be assessed in future.
3.5.3. Methodology
The land use pattern of the study area was studied by analysing the available secondary data published in the
District Primary Census abstract of the year 2001 & 2011.
Salient features of the adopted methodology are given below:
1. Acquisition of satellite data
2. Preparation of base map from Survey of India topo sheets
3. Data analysis using visual interpretation techniques
4. Ground truth studies or field checks using GPS
5. Finalization of the map
6. Digitization using head up vectorisation method
7. Topology construction in GIS
8. Area calculation for statistics generation
9. Masking
Four spectral bands provide high degree of measurability through band combination including FCC
generation, bands rationing, classification etc. These features of the IRS data are particularity important for
better comprehension and delineation of the land use classes. Hence, LISS-4data and IRS-P5 – Cartosat-I data
having 2.5 m spatial resolution having pan chromatic imagery has been used for land use mapping.
The satellite data from the compact disc is loaded on the hard disk and by studying quick look (the sampled
image of the appropriate area ;) the sub-scene of the study area is extracted. Supervised classification using all
the spectral bands can separate fairly accurately, the different land use classes at level II on the basis of the
spectral responses, which involve the following three steps:
Acquisition of ground truth
Calculation of the statistics of training area
Classification using maximum likelihood algorithm

M/s. Shalini Organics Pvt. Ltd., MIDC Paitha, Dist- Aurangabad. EIA/EMP
Page 112
The training areas for classification were homogeneous, well spread throughout the scene with bordering
pixels excluded in processing. Several training sets have been used through the scene for similar land use
classes. After evaluating the statistical parameters of training sets, the training areas were rectified by deleting
no congruous training sets and creating new ones.
3.5.4. Pre-Field Interpretation Of Satellite Data
The False Color Composite (FCC) of LISS-4 satellite imagery having 5.8 m spatial resolution satellite data at
1: 50,000 scales were used for pre-field interpretation work. Taking the help of topo sheets, geology, geo-
morphology and by using the image elements, the features were identified and delineated the boundaries
roughly. Each feature was identified on image by their image elements like tone, texture, color, shape, size,
pattern and association. A tentative legend in terms of land cover and land use was formulated. The sample
area for field check is selected covering all the physiographic, land use/land cover feature cum image
characteristics. Figure 3.1 shows the FCC of 10 KM radius of LISS-4Imagery.
False Colour Composite (FCC): It is an artificially generated colour image in which blue, green and red colours
are assigned to the wavelength regions to which they do not belong in nature. For example, in standard a False
Colour Composite blue is assigned to green radiations (0.5 to 0.6 μm), green is assigned to red radiations (0.6
to 0.7 μm and red is assigned to Near Infrared radiation (0.7 to 0.8 μm).
Figure 3-1 FCC of the 10 km radius with project location
3.6. Topography
The physical setting of study area shows a contrast of immense dimensions and reveals a variety of landscapes
influenced by climate, vegetation and economic use by man. Regionally, there is relatively less variation with
respect to relief features. The area shows a variation of approximately 20m-30m from North East to South

M/s. Shalini Organics Pvt. Ltd., MIDC Paitha, Dist- Aurangabad. EIA/EMP
Page 113
West and approximately 30-50 m from North West to South East. The Surface elevation map of the study area
is shown in Figure 3.2 and Figure 3.3The Elevation from 358 m to 453m MSL are observed in the study area.
Figure 3-2 Elevation Profile of NW-SE Direction with in 10 km Radius
Figure 3-3 Elevation Profile of NE-SW Direction with in 10 km Radius
Figure 3-4Digital Elevation Model with in 10 km Radius
3.6.1. Land Use/Land Cover Classification
Total three major land use/land cover classes were demarcated in the study area following Level I classification
furthermore a level II classification also adopted as per the requirement of MoEF & CC in which total 10
classifications has been classified in the study area. A thematic map of 1:50,000 scale was generated
incorporating these classified categories considering the area of the project
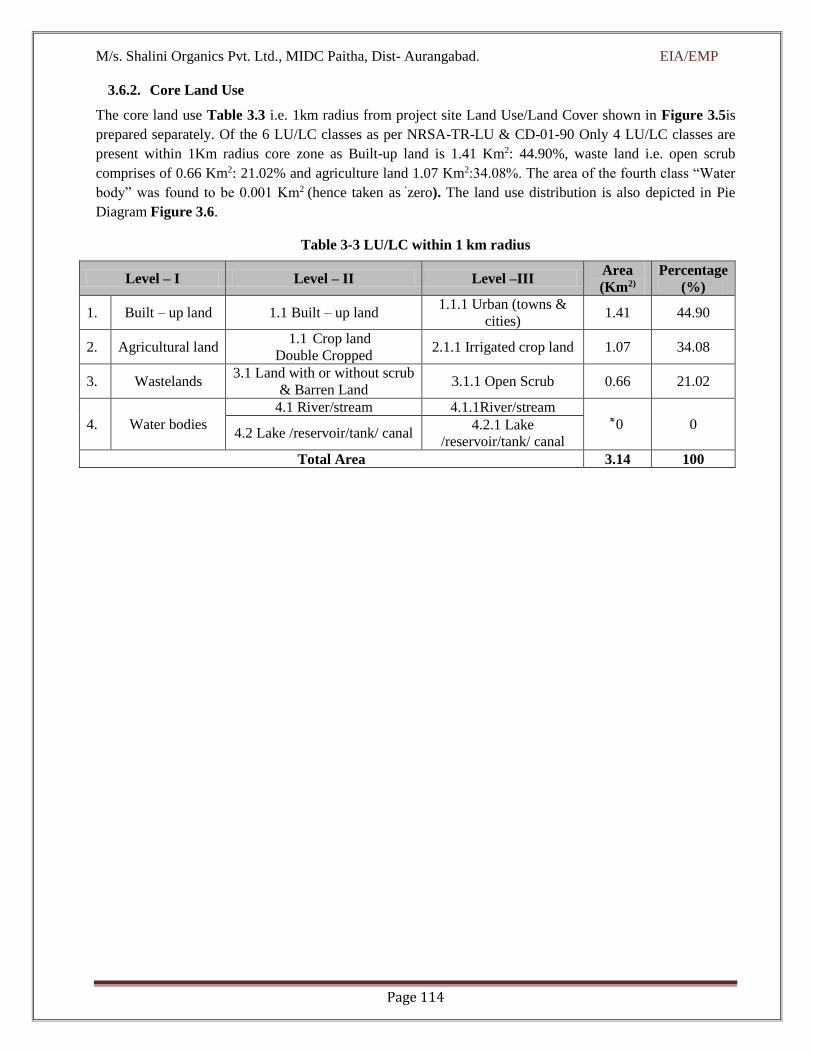
M/s. Shalini Organics Pvt. Ltd., MIDC Paitha, Dist- Aurangabad. EIA/EMP
Page 114
3.6.2. Core Land Use
The core land use Table 3.3 i.e. 1km radius from project site Land Use/Land Cover shown in Figure 3.5is
prepared separately. Of the 6 LU/LC classes as per NRSA-TR-LU & CD-01-90 Only 4 LU/LC classes are
present within 1Km radius core zone as Built-up land is 1.41 Km2: 44.90%, waste land i.e. open scrub
comprises of 0.66 Km2: 21.02% and agriculture land 1.07 Km2:34.08%. The area of the fourth class “Water
body” was found to be 0.001 Km2 (hence taken as ‘zero). The land use distribution is also depicted in Pie
Diagram Figure 3.6.
Table 3-3 LU/LC within 1 km radius
Level – I Level – II Level –III Area
(Km2)
Percentage
(%)
1. Built – up land 1.1 Built – up land 1.1.1 Urban (towns &
cities) 1.41 44.90
2. Agricultural land 1.1 Crop land
Double Cropped 2.1.1 Irrigated crop land 1.07 34.08
3. Wastelands 3.1 Land with or without scrub
& Barren Land 3.1.1 Open Scrub 0.66 21.02
4. Water bodies
4.1 River/stream 4.1.1River/stream
0 0 4.2 Lake /reservoir/tank/ canal
4.2.1 Lake
/reservoir/tank/ canal
Total Area 3.14 100

M/s. Shalini Organics Pvt. Ltd., MIDC Paitha, Dist- Aurangabad. EIA/EMP
Page 115
Figure 3-5LU/LC Details of 1 KM Radius
Figure 3-6 Pie Chart of The Lu/Lc Classification Within 1 Km Radius
The 6 LU/LC classes as per NRSA-TR-LU & CD-01-90 the 10 Km radius study area has presence of mainly
4 LU/LC classes are shown in table and fig. The categories of general land use may vary from user to user.
Table No. 3.4represents six categories of land use and total area under it. The land use classes are ranging
from 314 (Km2). The presence of different land use is shown in Figure 3.7of the pie chart distribution.
1.41, 45%
0.65, 21%
1.07, 34%
AREA OF LU/LC CLASS PRESENT WITHIN 1 KM
Builtup Open scrub Agriculture
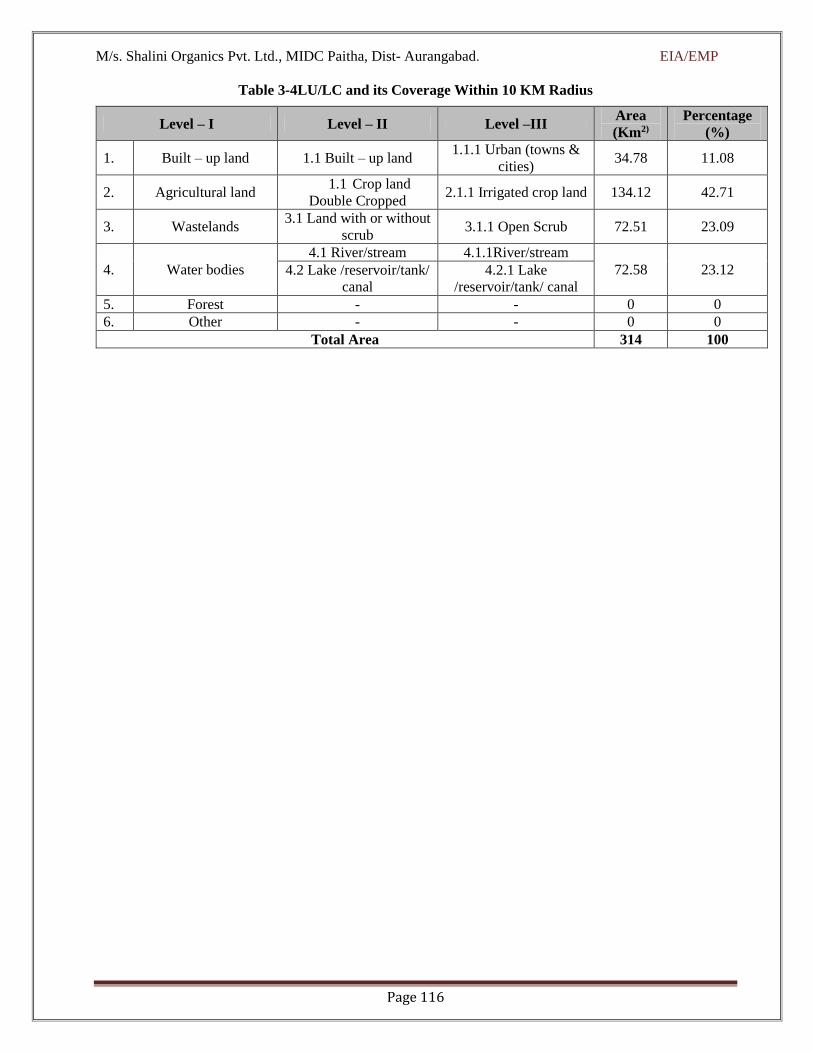
M/s. Shalini Organics Pvt. Ltd., MIDC Paitha, Dist- Aurangabad. EIA/EMP
Page 116
Table 3-4LU/LC and its Coverage Within 10 KM Radius
Level – I Level – II Level –III Area
(Km2)
Percentage
(%)
1. Built – up land 1.1 Built – up land 1.1.1 Urban (towns &
cities) 34.78 11.08
2. Agricultural land 1.1 Crop land
Double Cropped 2.1.1 Irrigated crop land 134.12 42.71
3. Wastelands 3.1 Land with or without
scrub 3.1.1 Open Scrub 72.51 23.09
4. Water bodies
4.1 River/stream 4.1.1River/stream
72.58 23.12 4.2 Lake /reservoir/tank/
canal
4.2.1 Lake
/reservoir/tank/ canal
5. Forest - - 0 0
6. Other - - 0 0
Total Area 314 100

M/s. Shalini Organics Pvt. Ltd., MIDC Paitha, Dist- Aurangabad. EIA/EMP
Page 117
Figure 3-7LU/LC Details of 10 KM Radius
Figure 3-8Pie Chart of the Lu/Lc Classification Within 10 KM Radius
Conclusion –
1. Agriculture land the highest category of land use covering as much as 42.71 % (134.12 Km2) of the total
area.
2. Water body is 23.12% (72.58Km2) followed by waste lands i.e. Open Scrub 23.09% (72.51 Km2).
3. The Built up land which is 11.08 % (34.78 Km2) of the area.
4. There are no regions which are classified under Forests and Others.
5. It is also observed that the study area is well connected to Paithan road which is passing within the 10 km
radius of the study area.
34.78, 11%
72.51, 23%
72.58, 23%
134.12, 43%
AREA OF LU/LC CLASS PRESENT WITHIN 10 KM
Builtup Open scrub Water Agriculture
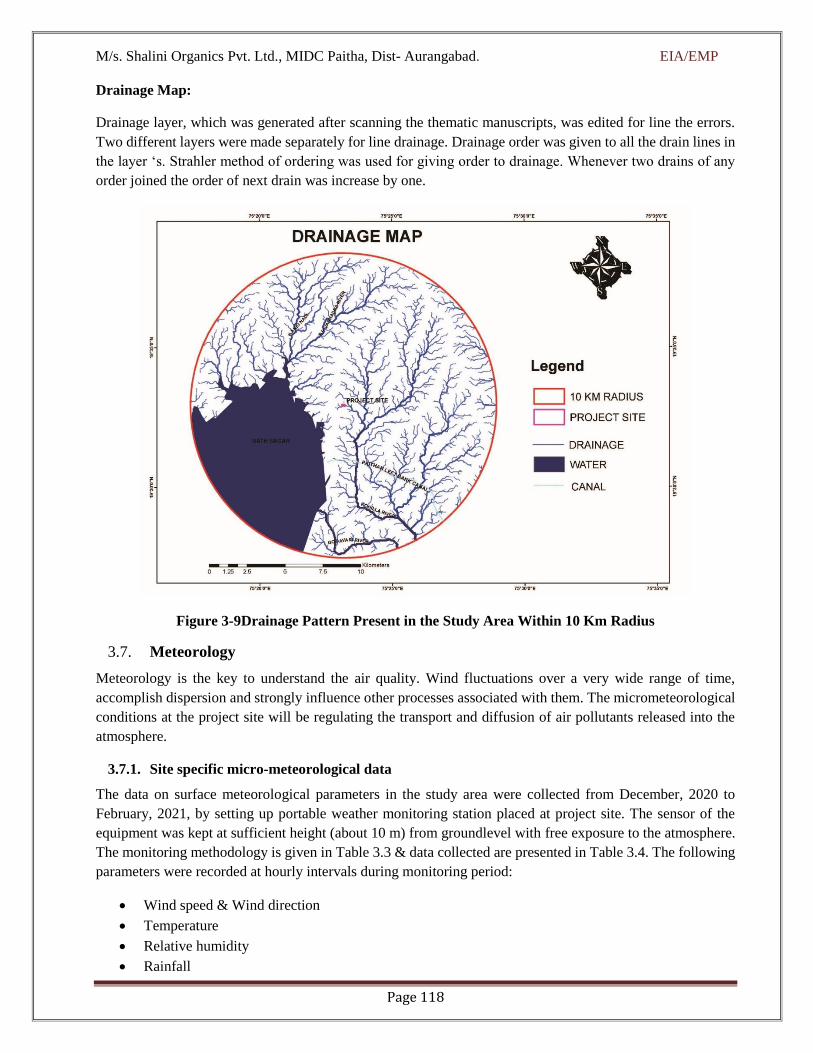
M/s. Shalini Organics Pvt. Ltd., MIDC Paitha, Dist- Aurangabad. EIA/EMP
Page 118
Drainage Map:
Drainage layer, which was generated after scanning the thematic manuscripts, was edited for line the errors.
Two different layers were made separately for line drainage. Drainage order was given to all the drain lines in
the layer ‘s. Strahler method of ordering was used for giving order to drainage. Whenever two drains of any
order joined the order of next drain was increase by one.
Figure 3-9Drainage Pattern Present in the Study Area Within 10 Km Radius
3.7. Meteorology
Meteorology is the key to understand the air quality. Wind fluctuations over a very wide range of time,
accomplish dispersion and strongly influence other processes associated with them. The micrometeorological
conditions at the project site will be regulating the transport and diffusion of air pollutants released into the
atmosphere.
3.7.1. Site specific micro-meteorological data
The data on surface meteorological parameters in the study area were collected from December, 2020 to
February, 2021, by setting up portable weather monitoring station placed at project site. The sensor of the
equipment was kept at sufficient height (about 10 m) from groundlevel with free exposure to the atmosphere.
The monitoring methodology is given in Table 3.3 & data collected are presented in Table 3.4. The following
parameters were recorded at hourly intervals during monitoring period:
Wind speed & Wind direction
Temperature
Relative humidity
Rainfall

M/s. Shalini Organics Pvt. Ltd., MIDC Paitha, Dist- Aurangabad. EIA/EMP
Page 119
Frequency of Sampling
Details of frequency of environmental sampling considered for the study are illustrated in Table 3.5.
Table 3-5Frequency of Environmental Monitoring
Attributes Sampling
Locations Attributes
Sampling
Locations
A. Air Environment
Micro-
meteorological
Data
Nr. Project Site
Temperature, Relative
Humidity, Precipitation Wind
direction, Wind Speed
Hourly data for the
period 10th November
2019 to 10th January
2020
Ambient Air
Quality
8 numbers of locations in
the study area of 10 km
radius.
PM2.5, PM10, SO2, NOx,
CO, H2S, HCl, HBr, Cl2
NH3and Total VOC
24-hour basis, twice a
week during study
period
B. Noise
Ambient Noise
8 numbers of locations in
the study area of 10 km
radius.
Noise Levels in dB (A) Once in a study period
C. Water
Ground Water
Samples from 7 numbers
of locations within 10 km
radius from the project
site.
Physical, Chemical,
Microbiological and Heavy
Metal.
Once in Study Period
Surface Water
Samples from 6 numbers
of locations within 10 km
radius from the project
site.
Physical, Chemical,
Microbiological and Heavy
Metal.
Once in Study Period.
D. Soil Quality
Soil Quality
Samples from 4 numbers
of locations within 10 km
radius from the project
site.
Physical, Chemical
Characteristics, Soil Texture. Once in Study Period.
3.7.2. Windrose –
Wind rose is the diagrammatic representation of wind speed in a specified direction with its arms representing
sixteen directions, each arms give a clear frequency distribution of wind speed in a particular direction for a
given period of time. It is one of the most important meteorological
Parameters and governs dispersion, diffusion & transportation of pollutants. The % frequencies of wind in 16
directions have been computed from the recorded data during the study period for 24-hourly intervals to plot
wind rose. The predominant wind directions –NNE, NE, ENE, E; implying that winds come from these
directions for most of the time during the period.
Wind rose diagram is shown as Figure 3.10.

M/s. Shalini Organics Pvt. Ltd., MIDC Paitha, Dist- Aurangabad. EIA/EMP
Page 120
Figure 3-10 Meteorological Data for the Monitoring Period
(December, 2020 to February, 2021)
3.8. Ambient Air Quality
3.8.1. Introduction
To quantify the impact of the proposed project on the ambient air quality, it is necessary to evaluate the existing
ambient air quality of the area. The ambient air quality monitoring with respect to the study area of 10 km
radius around the project site was done for the baseline information.

M/s. Shalini Organics Pvt. Ltd., MIDC Paitha, Dist- Aurangabad. EIA/EMP
Page 121
3.8.2. Selection of Sampling Locations
Following points were considered during the selection of Ambient Air Quality Monitoring locations.
Topography/terrain of the study area
Regional synoptic scale climatologically norms,
Densely populated areas within the region,
Location of surrounding Industries,
Representation of regional background,
Facility for Ambient Air Monitoring,
Representation of valid cross – sectional distribution in downwind direction,
Avoidance of proximity of roads, construction activity or any other perturbing activity which may be
temporary in nature, which may lead to some erroneous conclusions.
Availability of manpower, electricity, approach, sturdy structure and protection of samplers.
Dominant Wind Direction.
3.8.3. Reconnaissance
To establish the baseline status around the project site of the study region, monitoring was conducted for 8
numbers of locations during December 2020 to February 2021. At the time of location selection previous
micrometeorological data was referred and general wind pattern in the study region was considered for the
selection of minimum one location in the downwind direction and one upwind direction. However, ambient
air monitoring locations were selected in all the directions looking towards the possibility of change in wind
pattern during the study period. Ambient Air Quality monitoring locations are presented in Table 3.7and
Figure No. 3.11.
3.8.4. Parameters, Frequency and monitoring Methodology
Ambient Air quality monitoring-
The existing ambient air quality, in terms of Particulate Matter-10 (PM10), Particulate Matter-2.5 (PM2.5),
Sulphur Dioxide (SO2), Oxides of Nitrogen (NOx), Carbon Monoxide (CO), Hydro Carbon & Volatile
Organic Compounds (VOCs) has been measured. It was ensured that, the equipment was placed at open space
free from any obstacles at a height of at least 3 to 4 m above the ground level at each monitoring station to
avoid the effects of wind-blown ground dust.
Monitoring has been carried out as per the latest CPCB & MoEF&CC guidelines and notifications. Details of
methodology are given below.

M/s. Shalini Organics Pvt. Ltd., MIDC Paitha, Dist- Aurangabad. EIA/EMP
Page 122
Table 3-6Monitoring Methodology of Meteorological Data
Attributes Methods
Sampling/Preservation Analysis/data analysis
A. Air Environment
Micro-meteorological
Data
Data collected on hourly basis using
wind monitor as per CPCB Guideline.
as per IS 8829
IS 8829
Ambient air quality As per IS: 5182, CPCB & AWMA. IS:5182, CPCB & AWMA
B. Noise
Ambient Noise Instrument: Sound level meter Survey carried out as per CPCB
guideline.
C. Water
Ground Water,
Surface Water and
Marine Water
Standard Methods for Examination of
Water and Wastewater, 23rd edition,
APHA 2017
IS 3025 & Standard Methods for
Examination of Water and Wastewater,
23rd edition, APHA 2017
C. Soil Quality
Soil Quality
IS 2720, Soil Testing in India
(Department of Agriculture &
Cooperation).
IS 2720, Laboratory developed Method
as per NABL requirement and Book -
Soil Testing in India (Department of
Agriculture & Cooperation).
The duration of sampling of PM 2.5, PM10, SO2 & NOx was 24-hourly continuous sampling per day and CO,
HC & VOCs were sampled for 8-hours duration. The monitoring was done for twice a week for three months.
Parameters and frequency of sampling is given in Table 3.6.
Table 3-7Monitored Parameters and Frequency of Sampling
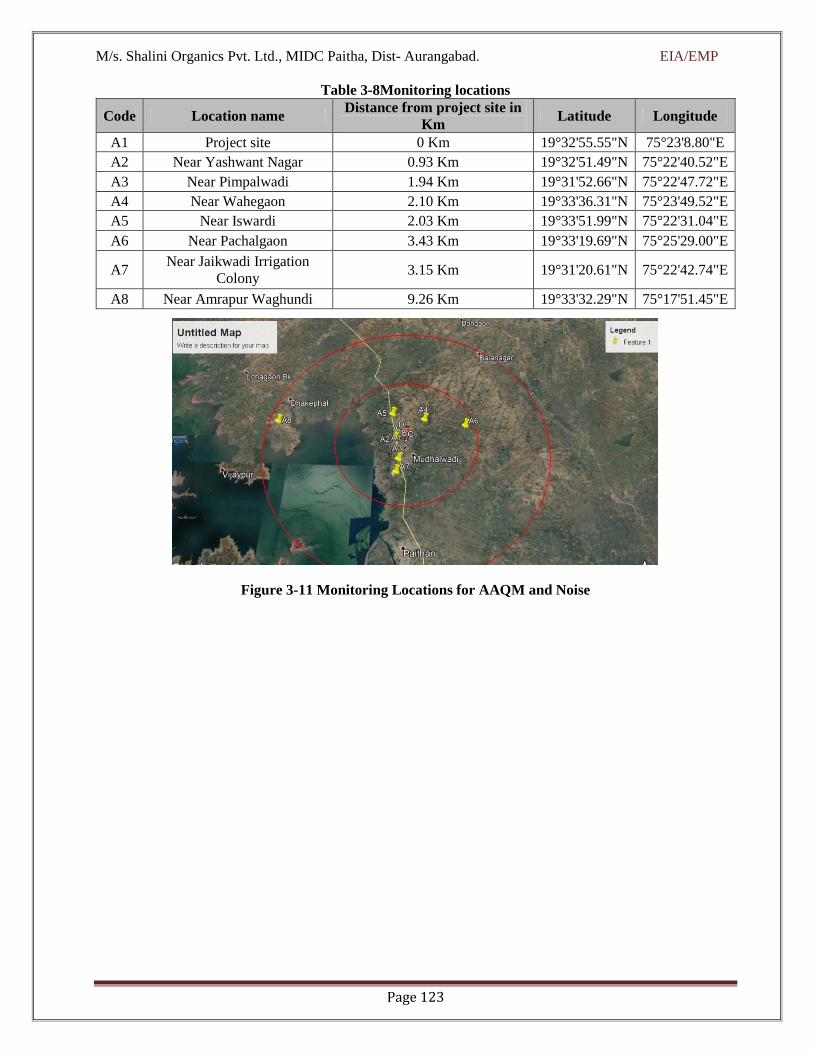
M/s. Shalini Organics Pvt. Ltd., MIDC Paitha, Dist- Aurangabad. EIA/EMP
Page 123
Table 3-8Monitoring locations
Code Location name Distance from project site in
Km Latitude Longitude
A1 Project site 0 Km 19°32'55.55"N 75°23'8.80"E
A2 Near Yashwant Nagar 0.93 Km 19°32'51.49"N 75°22'40.52"E
A3 Near Pimpalwadi 1.94 Km 19°31'52.66"N 75°22'47.72"E
A4 Near Wahegaon 2.10 Km 19°33'36.31"N 75°23'49.52"E
A5 Near Iswardi 2.03 Km 19°33'51.99"N 75°22'31.04"E
A6 Near Pachalgaon 3.43 Km 19°33'19.69"N 75°25'29.00"E
A7 Near Jaikwadi Irrigation
Colony 3.15 Km 19°31'20.61"N 75°22'42.74"E
A8 Near Amrapur Waghundi 9.26 Km 19°33'32.29"N 75°17'51.45"E
Figure 3-11 Monitoring Locations for AAQM and Noise

M/s. Shalini Organics Pvt. Ltd., MIDC Paitha, Dist- Aurangabad. EIA/EMP
Page 124
Table 3-9Monitoring Results and observations
Parameter Station
code
Name of the
location
Concentration
Minimum Maximum Average 98% percentile
Particulate
Matter (size
less than
10µm) or
(PM10,),
µg/m3 [100] *
24 Hours
A1 Project site 50.2 58.6 53.83 52.76
A2 Near Yashwant
Nagar 40.4 48.2 42.23 41.38
A3 Near Pimpalwadi 41.6 49.4 45.14 44.24
A4 Near Wahegaon 41.4 49.3 44.55 43.65
A5 Near Iswardi 40.8 47.3 44.54 43.65
A6 Near Pachalgaon 40.5 48.5 44.10 43.22
A7 Near Jaikwadi
Irrigation Colony 40.3 49.8 44.65 43.76
A8 Near Amrapur
Waghundi 42.4 48.6 44.91 44.01
Particulate
Matter (size
less than
2.5µm) or
(PM2.5),
µg/m3 [60]*
24 Hours
A1 Project site 13.7 19.4 16.12 15.79
A2 Near Yashwant
Nagar 12.1 18.8 16.94 16.60
A3 Near Pimpalwadi 14.8 23.8 17.70 17.34
A4 Near Wahegaon 12.2 19.6 16.06 15.74
A5 Near Iswardi 14.3 19.5 17.19 16.84
A6 Near Pachalgaon 13.8 22.3 17.38 17.03
A7 Near Jaikwadi
Irrigation Colony 12.6 21.5 17.05 16.70
A8 Near Amrapur
Waghundi 13.8 25.4 18.08 17.71
Sulphur
Dioxide (SO2),
µg/m3 [80]*
24 Hours
A1 Project site 13.9 17.3 15.70 15.39
A2 Near Yashwant
Nagar 13.0 16.8 14.71 14.42
A3 Near Pimpalwadi 14.1 17.6 15.54 15.23
A4 Near Wahegaon 13.1 17.7 15.76 15.45
A5 Near Iswardi 14.4 17.5 15.95 15.63
A6 Near Pachalgaon 13.4 18.5 16.19 15.87
A7 Near Jaikwadi
Irrigation Colony 13.5 18.1 15.63 15.32
A8 Near Amrapur
Waghundi 14.7 17.8 16.28 15.96
Nitrogen
Oxide (NOx),
µg/m3 [80]*
24 Hours
A1 Project site 20.5 26.2 23.72 23.24
A2 Near Yashwant
Nagar 17.6 24.3 21.38 20.96
A3 Near Pimpalwadi 13.8 27.8 23.66 23.19
A4 Near Wahegaon 17.8 25.7 22.08 21.64
A5 Near Iswardi 20.9 28.3 23.19 22.72
A6 Near Pachalgaon 18.4 26.4 23.95 23.48
A7 Near Jaikwadi
Irrigation Colony 20.3 28.6 24.12 23.63
A8 Near Amrapur
Waghundi 20.4 25.7 23.95 23.47
Carbon
monoxide
(CO), mg/m3
[80]* 8 Hours
A1 Project site 0.12 0.43 0.24 0.23
A2 Near Yashwant
Nagar 0.1 0.32 0.17 0.17
A3 Near Pimpalwadi 0.12 0.4 0.23 0.23

M/s. Shalini Organics Pvt. Ltd., MIDC Paitha, Dist- Aurangabad. EIA/EMP
Page 125
A4 Near Wahegaon 0.11 0.41 0.22 0.22
A5 Near Iswardi 0.13 0.43 0.24 0.24
A6 Near Pachalgaon 0.13 0.43 0.25 0.24
A7 Near Jaikwadi
Irrigation Colony 0.14 0.45 0.27 0.26
A8 Near Amrapur
Waghundi 0.14 0.44 0.25 0.25
Hydrocarbon
(HC), µg/m3,
24 Hours
All results are BDL
VOC µg/m3,
24 Hours All results are BDL
3.8.5. Interpretation of result
Particulate Matter (PM2.5) - The average PM2.5concentration at all locations ranged between 25.4-12.1
μg/m3. The PM2.5 concentrations for all locations were observed within stipulated standards for NAAQS (24
hourly PM2.5 = 60 μg/m3).
Particulate Matter (PM10) - The average PM10 concentrations at all locations varied in the range of 58.6
g/m3 – 40.3 μg/m3. The highest concentration i.e. 58.6 μg/m3 is noticed at project site which is attributed to
windblown dust, vehicular movements etc. The PM10 concentrations for all locations were observed to be
below stipulated standards for NAAQS (24 hourly PM10 = 100 μg/m3)
Sulphur Dioxide (SO2) & Oxides of Nitrogen (NOx)- The average SO2 concentrations at all locations were
found 18.5 μg/m3-13.0 μg/m3 and the average concentration of NOx ranged between 28.3 μg/m3 -13.8 μg/m3.
The levels of gaseous pollutants were below the stipulated CPCB standards (24 hourly SO2 is 80μg/m3 and
for NOx is 80μg/m3).
Carbon Monoxide (CO) - The average CO concentrations at all locations were found 0.45 – 0.1 mg/m3.
In general, the ambient air quality is satisfactory with respect to all major pollutants. The 98th percentile values
of all pollutants were found to be below NAAQS. The other parameters such as Ammonia (NH3), Benzene,
Benzo-α-Pyrene (BAP), Ozone (O3), Lead (Pb) and Nickel (Ni) were found be to below respective detection
limits.
Hydrocarbon and VoC- All values of Hydrocarbon and VoC’s are within limit.
Conclusion: The ambient air quality in the study area & at project site is well within prescribed.
3.8.6. Noise Environment
Ambient noise level is the background sound pressure level at a given location. Examples of background noise
levels in environment are because of waves, traffic, alarms, people talking, bio acoustic noise form animals or
birds and mechanical noise from devices such as refrigerators or air conditioning, power supplies or motors
etc. and also vehicular traffic. The objective of monitoring background noise levels in study area is to establish
baseline noise level to identify impact due to proposed activity. Locations selected for Noise Sampling are
presented in Table No. 3.10.

M/s. Shalini Organics Pvt. Ltd., MIDC Paitha, Dist- Aurangabad. EIA/EMP
Page 126
Table 3-10The Noise Level in study area
Location Project
site
Near
Yashw
ant
Nagar
Near
Pimpalw
adi
Near
Waheg
aon
Near
Iswa
rdi
Near
Pachalg
aon
Near
Jaikwa
di
Irrigat
ion
Colony
Near
AmrapurWag
hundi
Time N1 N2 N3 N4 N5 N6 N7 N8
6.00 54.2 44.1 42.2 47.9 45.7 44.5 45.3 43.8
7.00 56.6 46.3 44.3 46.3 46.7 44.5 49.2 44.7
8.00 56.7 53.1 48.7 48.6 48.7 44.2 52.3 46.2
9.00 62.8 53.6 51.1 57.8 54.6 54.1 52.6 50.8
10.00 63.7 52.7 50.8 53.2 54.1 53.6 51.1 52.6
11.00 64.5 51.5 52.6 52.6 52.3 54.0 53.0 51.4
12.00 63.4 50.3 51.4 52.1 50.9 52.4 51.3 50.2
13.00 61.0 51.6 50.1 52.8 51.6 53.6 50.6 52.1
14.00 61.3 51.2 52.5 53.1 50.5 52.8 51.3 52.8
15.00 62.4 50.1 51.2 52.9 52.7 52.1 50.0 51.3
16.00 60.5 54.6 52.6 54.7 52.2 53.8 53.3 50.1
17.00 58.2 53.3 50.2 53.4 51.0 54.3 54.2 51.6
18.00 57.9 53.1 47.1 53.3 51.2 52.4 53.1 50.1
19.00 55.1 51.3 46.6 51.1 52.4 51.2 54.6 52.7
20.00 55.6 50.2 46.9 45.7 49.1 46.8 53.7 44.1
21.00 54.6 47.9 45.8 43.4 46.5 45.6 51.4 43.8
22.00 53.8 45.2 44.9 42.1 50.2 43.1 48.0 41.1
Avg.-day
(dB(A)) 58.95 50.59 48.76 50.64 50.61 50.17 51.47 48.78
23.00 53.4 44.3 42.4 43.4 42.5 43.4 42.4 42.4
24.00 51.3 42.3 42.3 42.3 41.5 40.6 40.5 40.4
1.00 52.4 41.5 43.4 41.2 41.3 41.1 42.3 40.2
2.00 51.3 40.5 41.5 45.1 42.1 42.4 40.4 41.1
3.00 49.6 41.6 40.2 42.4 40.4 40.1 41.1 40.4
4.00 50.5 41.2 40.1 42.5 40.5 40.4 40.4 41.2
5.00 53.4 43.6 40.7 40.7 41.3 41.2 42.3 41.1
Avg.-Night
(dB(A)) 51.70 42.14 41.51 42.51 41.37 41.31 41.34 40.97
Observations: The noise quality was monitored at eight (8) locations in the study area during the study period.
The day time noise level at the project premises was observed to be 58.95 dB (A) Leq while during night time
the noise level was recorded to be 51.70 dB (A) Leq. It should be noted that the noise levels during the day
time as well as night time were observed to be within the prescribed standards by Central Pollution Control
Board.
Conclusion: The baseline monitoring of noise levels shows that, there is no disturbance due to noise in study
area.
3.9. Hydrogeology
The Godavari is the second largest basin and accounts for nearly 9.5% of the total geographical area of the
country. It extends over states of Maharashtra (48.7%), Andhra Pradesh (23.7%), Chhattisgarh (12.4%) and
Odisha (5.7%) in addition to smaller parts in Madhya Pradesh (7.8%), Karnataka (1.4%) and Union territory
of Puducherry (0.01%).
M/s. Shalini Organics Pvt. Ltd., MIDC Paitha, Dist- Aurangabad. EIA/EMP
Page 127
The basin area extends over an area of 302065.10 Sq. km, with a maximum length and width of about 995 km
and 583 km, respectively. The Central Water Commission {CWC} reported area of the basin is 312812.0 Sq.
km. The basin falls in the Deccan Plateau lying between 73°24’ to 83°4’ east longitudes and 16°19’ to 22°34’
north latitudes. The basin is bounded on the north by the Mahadeo Hills, the Satmala Hills, on the north-west
by the Ajanta Range, on the west by the North Sahyadri range of the Western Ghats, on the east and south-
east by the Eastern Ghats and on the south by the Balaghat Range. The interior part of the basin lies in
Maharashtra Plateau, the greater part of which is at an elevation of 300-600 m sloping eastward. The eastern
part of the basin is majorly covered by the Dandakaranya Range with the Eastern Ghats forming the eastern
boundary of the peninsula.
The core components of the water network include the river Godavari, the largest of the peninsular river and
its principal tributaries finally draining into the Bay of Bengal. The river Godavari rises at an elevation of 1067
m in the Western Ghats near the Triambak hills in the Nasik district of Maharashtra.
The Godavari receives the waters from the Darna, the Pravara and the Manjra on its right bank whereas from
the Kadwa, the Purna, the Kaddam, the Pranhita, the Indravati and the Sabari on its left bank. The Godavari
basin receives major part of its rainfall during the south-west monsoon season. The delta of the Godavari is
gradually extending into the sea and consists of a wide belt of river borne alluvium. The salient features for
the basin are;

M/s. Shalini Organics Pvt. Ltd., MIDC Paitha, Dist- Aurangabad. EIA/EMP
Page 128
Secondary Data Source: India-WRIS: Title –Godavari Basin
{http://india-wris.nrsc.gov.in/wrpinfo/index.php?title=Godavari#About_Godavari_Basin}

M/s. Shalini Organics Pvt. Ltd., MIDC Paitha, Dist- Aurangabad. EIA/EMP
Page 129
3.10. Hydrogeology of District
The basaltic aquifers are regarded as anisotropic because of variability in type morphology and geohydrology
of flows; the presence of dykes, lava tubes and the unpredictable patterns of vascularity weathering and
jointing with respect to their extent and thickness, as also to the frequency and inter-connections of joints. A
wide variation in aquifer parameters such as storativity, specific gravity, transmissivity and specific yield of
the well can be attributed to such anisotropism.
The Aurangabad district area is included in Deccan Trap ground province comprising of hard rock formations.
Massive Trap does not possess any granular primary porosity hard compact nature have low primary porosity,
generally unproductive. However, the secondary porosity is developed due to weathering, jointing and
fracturing. The groundwater occurs in secondary porosity and the joints and fracture provided channels for the
groundwater movement and spaces for storages.
Ground Water Scenario:
The major part (95%) of the district constitutes a sequence of basaltic lava flows (Deccan Trap) while alluvium
occupies a small portion. There are two distinct hydrogeological units in the district i.e. fissured formations
(different units of basaltic lava flows) and porous formations (isolated patches of alluvial deposits). The
occurrence and movement of ground water is controlled by variation in water bearing properties of these
formations.
Hard Rock Areas: Deccan Trap Basalt
Deccan traps are a thick pile of basaltic flows, horizontally disposed and apparently more or less uniform in
composition. Each individual flow is a typical section, which varies from porous weathered base to a massive
middle unit, becoming increasingly vesicular towards the top. The ground water occurs under water table and
semi confined to confined conditions in Deccan Trap Basalt. The vesicular units in different trappean flows
range in thickness from 2-8 meters and have primary porosity. However, the nature and density of the vesicles,
their distribution, interconnection between the vesicles, depth of weathering and topography of the area are
the decisive factor for occurrence and movement of ground water in these units. Since the zeolitic units in
vesicular traps are highly susceptible to weathering, the vesicular units comprising weathered zeolitic traps
occurring in topographic lows are the main water bearing formation in hard rock terrain of the district.
In massive unit of Deccan Trap Basalt, ground water occurs in soil cum weathered mantle, joints, cracks and
other weaker zones. The upper portion of the massive traps show persistent spheroidal weathering and
exfoliation which helps in retaining more ground water in these rocks in comparison to compact massive unit.
The storage of ground water in compact massive unit totally depends upon the presence of joints and their
nature, distribution and interconnection. The average depth range of dug wells is 12.00 m to 15.00 m and that
of borewells is 50.00 to 60.00 m in hard rock areas, whereas the yield ranges from 0.60 to 3.10 lps.
Soft Rock Areas: Alluvium
The ground water in isolated alluvial pockets in the Godavari, Shivna, Purna and their tributaries occur under
both water table and semi-confined conditions. The exploration of shallow alluvial area reveals that the
saturated thickness of the alluvial material comprising silty clay, sand and gravel ranges from 1-7 meters. The
depth to basement ranges between 16.25 to 26.45 m bgl. The aquifer horizons were encountered as coarse sand
mixed with clay and silt between 15.00 and 26.00 m bgl, which constitute the potential aquifer in the area with

M/s. Shalini Organics Pvt. Ltd., MIDC Paitha, Dist- Aurangabad. EIA/EMP
Page 130
discharge of up to 4.50 lps. The dugwells are generally down to 20 m depth and yields varying between 0.5
and 0.8 lps.
Groundwater Prospect Map:
National Remote Sensing Centre (NRSC), ISRO / Dept. of Space, Govt. of India prepared ground water
prospects maps (technically Hydro Geo Morphological-HGM maps) on 1:50,000 scale using remote sensing
and GIS technology. In the study area around 50% area having aquifer yield ranges from 100 -200 LPM with
moderate depth around 30-80 M. The area covers south and south-west part of the study area. On the other
area remaining part having aquifer yield range from above 800 LPM and 30 to 100 LPM with shallow to
moderate depth. Figure No. 3.12 showing groundwater prospect map around 10 Km. radius study area.
3.10.1. Geology
3.10.1.1. Regional Geology: Deccan Trap:
Deccan Trap basalts are heterogeneous known to be monotonously uniform volcanic rocks covering 90% part
of Aurangabad District. The lava responsible for their formation issued through long narrow fissures or cracks
in the earth’s crust.
The lavas spread out far and wide as nearly horizontal sheets forming piles of different types of basaltic flows.
Four major types of flows constitute the Deccan Trap;
1. Compact Basalts
2. Amygdaloidal Basalt
3. Vesicular Basalt
4. Tachylitic Basalt (Red bole)
3.10.1.2. Local Geology:
Aurangabad Quadrangle is bounded by latitudes 19o to 0o North, and longitudes 75o to 76o East, covering
parts of Ahmednagar, Aurangabad, Beed and Jalna district of Maharashtra. Physio graphically it forms part of
Upper Godavari Valley. It is drained by Godavari river flowing almost a straight ENE-WSW course, with
minor meanders. The entire area is occupied by sequence of basalt flows of Deccan Trap. The flows are typical
quartz normative tholeiites. Both Aa and compound Pahoehoe flows are seen. The Aa flows characterize
fragmentary top. It consists of fragment of basalt of various size and shape generally angular, few centimeters
to 0.5-meter size embedded in vesicular basaltic matrix. All the base of these flows are clinker pockets.
The compound Pohoehoe flows are characterized by the presence of basal zone of pipe vesicles, middle
massive part and top vesicular part with spherical vesicles. This character is repeated as a sequence within one
flow. They also show ropy surfaces, toe structure and squeeze ups.
Simple flows consist of lower massive part and vesicular top. Secondary minerals occur as amygdales and
consist of a variety of cryptocrystalline silica, quartz and zeolites. The flows are demarcated on the basis of
presence of red bole bed, vesicular tops or particular weathering pattern.
The entire basalt pile of above 800 m is classified into three formations. The total aggregate thickness of flows
may far exceed this, due to pinching of flows and uneven spread of flows. A very small outcrop of megacryst
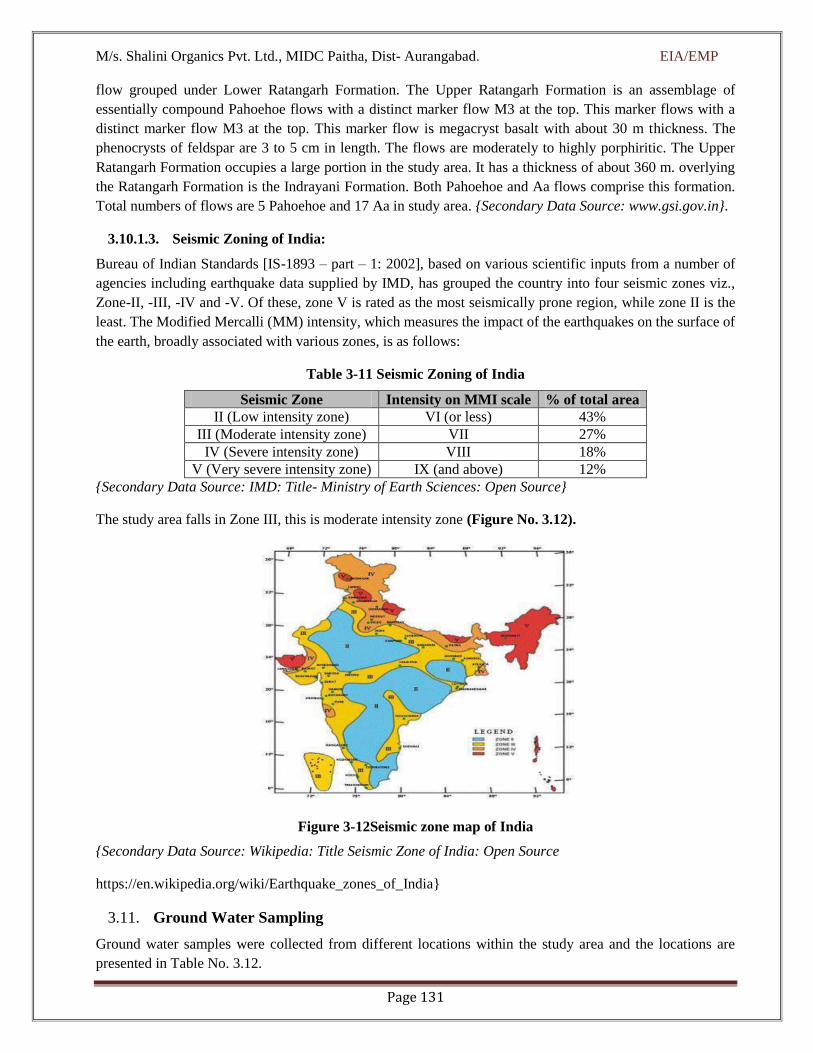
M/s. Shalini Organics Pvt. Ltd., MIDC Paitha, Dist- Aurangabad. EIA/EMP
Page 131
flow grouped under Lower Ratangarh Formation. The Upper Ratangarh Formation is an assemblage of
essentially compound Pahoehoe flows with a distinct marker flow M3 at the top. This marker flows with a
distinct marker flow M3 at the top. This marker flow is megacryst basalt with about 30 m thickness. The
phenocrysts of feldspar are 3 to 5 cm in length. The flows are moderately to highly porphiritic. The Upper
Ratangarh Formation occupies a large portion in the study area. It has a thickness of about 360 m. overlying
the Ratangarh Formation is the Indrayani Formation. Both Pahoehoe and Aa flows comprise this formation.
Total numbers of flows are 5 Pahoehoe and 17 Aa in study area. {Secondary Data Source: www.gsi.gov.in}.
3.10.1.3. Seismic Zoning of India:
Bureau of Indian Standards [IS-1893 – part – 1: 2002], based on various scientific inputs from a number of
agencies including earthquake data supplied by IMD, has grouped the country into four seismic zones viz.,
Zone-II, -III, -IV and -V. Of these, zone V is rated as the most seismically prone region, while zone II is the
least. The Modified Mercalli (MM) intensity, which measures the impact of the earthquakes on the surface of
the earth, broadly associated with various zones, is as follows:
Table 3-11 Seismic Zoning of India
Seismic Zone Intensity on MMI scale % of total area
II (Low intensity zone) VI (or less) 43%
III (Moderate intensity zone) VII 27%
IV (Severe intensity zone) VIII 18%
V (Very severe intensity zone) IX (and above) 12%
{Secondary Data Source: IMD: Title- Ministry of Earth Sciences: Open Source}
The study area falls in Zone III, this is moderate intensity zone (Figure No. 3.12).
Figure 3-12Seismic zone map of India
{Secondary Data Source: Wikipedia: Title Seismic Zone of India: Open Source
https://en.wikipedia.org/wiki/Earthquake_zones_of_India}
3.11. Ground Water Sampling
Ground water samples were collected from different locations within the study area and the locations are
presented in Table No. 3.12.

M/s. Shalini Organics Pvt. Ltd., MIDC Paitha, Dist- Aurangabad. EIA/EMP
Page 132
Table 3-12Monitoring locations for Ground water sampling
Sr.
No. Village Name
Type of
sample
Distance from project site
in Km Latitude Longitude
1. Wahegaon Well 2.16 Km 19°34'0.42"N 75°23'47.02"E
2. Dhangaon Well 3.80 km 19°34'53.21"N 75°22'30.73"E
3. Dhakephal Well 7.96 Km 19°34'46.45"N 75°18'14.14"E
4. Nanegaon Well 9.73 Km 19°33'36.31"N 75°23'49.52"E
5. Narayangaon Well 2.54 Km 19°32'13.51"N 75°24'26.62"E
6. Paithan
(MIDC) Well 2.0 Km 19°32'19.95"N 75°22'53.97"E
7. Dhorkin Well 6.08 Km 19°36'13.19"N 75°23'13.52"E
8. Rahatgaon Well 6.29 Km 19°31'23.75"N 75°26'26.30"E
Figure 3-13 Monitoring Locations for Ground water and Surface water sampling locations within 10
Km

M/s. Shalini Organics Pvt. Ltd., MIDC Paitha, Dist- Aurangabad. EIA/EMP
Page 133
Table 3-13Ground water analysis report
Sr. No. Parameter Unit(s)
Location Limits as per
IS 10500:2012 Analysis Method GW1
Wahegaon
GW2
Dhangaon
GW3
Dhakephal
GW4
Nanegaon
1. Color Hazen Clear Clear Clear Clear 5.00 IS : 3025
(Part4):1983
2. Odor -- Agreeable Agreeable Agreeable Agreeable Agreeable IS : 3025
(Part5):1983,
3. pH -- 7.50 8.10 7.40 7.30 6.5-8.5 APHA 4500 H+,
A, 23rd Ed.2017
4. Conductivity µS/cm 1012.00 590.00 674.52 640.00 Not Specified IS 3025 (Part 14)
1984 (RA 2006)
5. TDS mg/lit 654.01 384.00 434.52 410.00 < 500.00 IS 3025 (Part 16):
6. Turbidity NTU 03.00 01.00 02.00 12.00 < 1.00 IS 3025 (Part 10):
1983
7. TSS mg/lit <5.00 <5.00 <5.00 <5 Not Specified IS: 3025 (Part-
17)-1984
8. COD mg/lit 10.00 <5.00 <5.00 <5.00 Not Specified IS:3025 (Part 58)-
2006 .
9. BOD mg/lit 3.00 <4.00 <4.00 <4.00 Not Specified IS:3025 (Part 44)-
1993,
10. Ammonical
Nitrogen mg/lit 0.54 0.34 0.36 0.34 < 0.50
APHA 4500 NH3
F
11. Nitrate as NO3 mg/lit 14.23 7.14 10.12 09.80 < 45.00 APHA 4500
NO3 – B
12. Nitrite as NO2 mg/lit BDL BDL BDL BDL Not Specified IS 3025 (Part 34)
1988,
13. Nitrogen as N mg/lit BDL BDL BDL BDL Not Specified APHA-4500
14. Phosphorous as
PO4 mg/lit 3.21 2.21 2.68 2.48 Not Specified APHA 4500 P-C
15. Potassium as K mg/lit 24.21 12.42 16.52 14.10 Not Specified APHA 3111 B
16. Sodium as Na mg/lit 34.52 21.54 28.70 22.40 Not Specified APHA 3111 B
17. Calcium as Ca mg/lit 84.56 44.03 54.60 51.24 < 75.00 IS 3025 (Part 40)
1991
18. Magnesium as
Mg mg/lit 35.42 12.40 16.52 15.64 < 30.00
IS 3025 (Part 46)
1994 (RA 2009)

M/s. Shalini Organics Pvt. Ltd., MIDC Paitha, Dist- Aurangabad. EIA/EMP
Page 134
Sr. No. Parameter Unit(s)
Location Limits as per
IS 10500:2012 Analysis Method GW1
Wahegaon
GW2
Dhangaon
GW3
Dhakephal
GW4
Nanegaon
19. Total Hardness as
CaCO3 mg/lit 321.21 142.36 184.00 174.56 < 200.00
IS 3025 (Part 21):
2009
20. Carbonates as
CO32-
mg/lit 74.56 56.34 64.37 61.80 Not Specified APHA 2320
21. Bicarbonates as
HCO3 mg/lit 54.60 42.60 48.72 44.52 Not Specified APHA 2320
22. Chlorides as Cl- mg/lit 236.94 48.90 78.90 72.40 < 250.00 IS 3025 (Part 32):
23. Sulphates as SO4 mg/lit 86.31 48.72 62.34 61.42 < 200.00 IS 3025 (Part-24):
24. Sulphide as H2S mg/lit BDL BDL BDL BDL < 0.05 APHA-4500-S2
25. Fluorides as F- mg/lit 0.23 <0.01 <0.01 <0.01 < 1.00 APHA 4500-F- D
26. Iron as Fe mg/lit 0.64 <0.05 <0.05 <0.05 < 0.30 APHA 3111 B
27. Aluminum as Al mg/lit BDL BDL BDL BDL <0.03 APHA 3111 B
28. Barium as Ba mg/lit BDL BDL BDL BDL <0.70 APHA 3111 B
29. Boron as B mg/lit <0.01 <0.01 <0.01 <0.01 < 0.50 APHA 3111 B
30. Copper as Cu mg/lit <0.04 <0.04 <0.04 <0.04 < 0.05 APHA 3111 B
31. Selenium as Se mg/lit BDL BDL BDL BDL <0.01 APHA 3111 B
32. Zinc as Zn mg/lit <0.05 <0.05 <0.05 <0.05 <5.00 APHA 3111 B
33. Cadmium as Cd mg/lit BDL BDL BDL BDL <0.003 APHA 3111 B
34. Lead as Pb mg/lit BDL BDL BDL BDL <0.01 APHA 3111 B
35. Mercury as Hg mg/lit BDL BDL BDL BDL <0.001 APHA 3111 B
36. Nickel as Ni mg/lit BDL BDL BDL BDL < 0.02 APHA 3111 B
37. Arsenic as As mg/lit BDL BDL BDL BDL < 0.01 APHA 3111 B
38. Chromium as Cr mg/lit <0.05 <0.05 <0.05 <0.05 < 0.05 APHA 3111 B
39. Total Coli form No./100ml <2 <2 <2 <2 Absent
IS: 1622
(Rev.1,R.A :
2014)
40. Fecal Coli form No./100ml <2 <2 <2 <2 Absent
IS: 1622
(Rev.1,R.A :
2014)
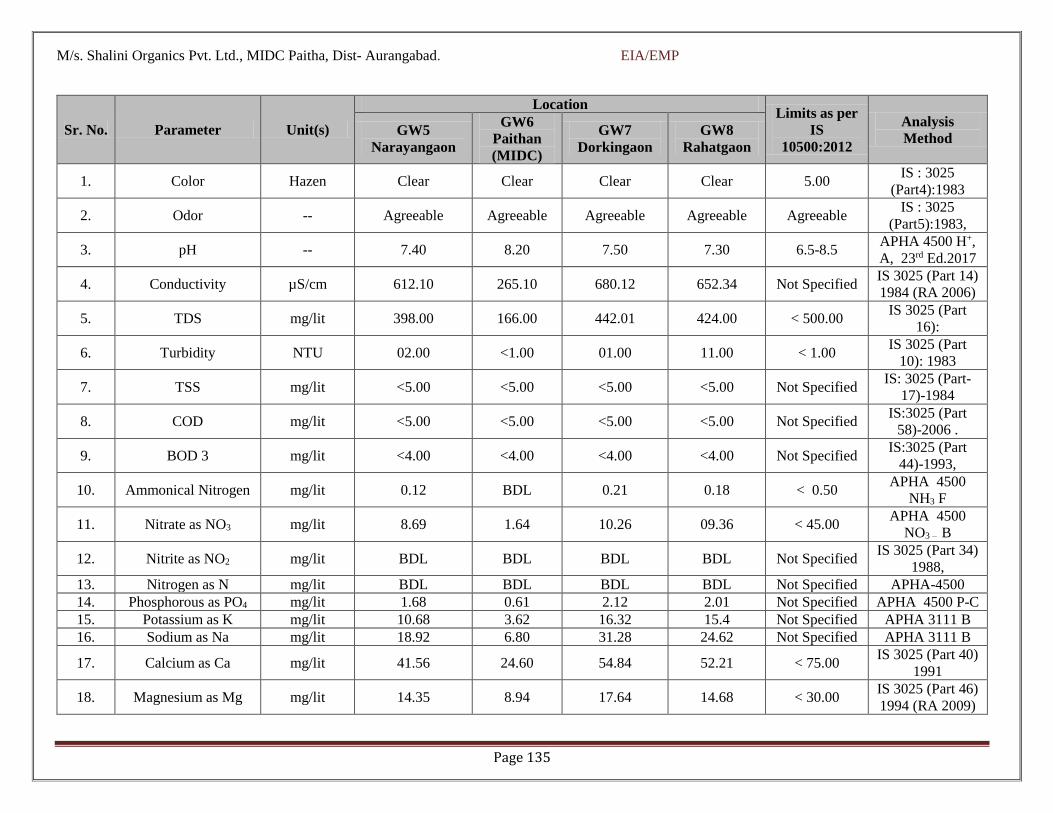
M/s. Shalini Organics Pvt. Ltd., MIDC Paitha, Dist- Aurangabad. EIA/EMP
Page 135
Sr. No. Parameter Unit(s)
Location Limits as per
IS
10500:2012
Analysis
Method GW5
Narayangaon
GW6
Paithan
(MIDC)
GW7
Dorkingaon
GW8
Rahatgaon
1. Color Hazen Clear Clear Clear Clear 5.00 IS : 3025
(Part4):1983
2. Odor -- Agreeable Agreeable Agreeable Agreeable Agreeable IS : 3025
(Part5):1983,
3. pH -- 7.40 8.20 7.50 7.30 6.5-8.5 APHA 4500 H+,
A, 23rd Ed.2017
4. Conductivity µS/cm 612.10 265.10 680.12 652.34 Not Specified IS 3025 (Part 14)
1984 (RA 2006)
5. TDS mg/lit 398.00 166.00 442.01 424.00 < 500.00 IS 3025 (Part
16):
6. Turbidity NTU 02.00 <1.00 01.00 11.00 < 1.00 IS 3025 (Part
10): 1983
7. TSS mg/lit <5.00 <5.00 <5.00 <5.00 Not Specified IS: 3025 (Part-
17)-1984
8. COD mg/lit <5.00 <5.00 <5.00 <5.00 Not Specified IS:3025 (Part
58)-2006 .
9. BOD 3 mg/lit <4.00 <4.00 <4.00 <4.00 Not Specified IS:3025 (Part
44)-1993,
10. Ammonical Nitrogen mg/lit 0.12 BDL 0.21 0.18 < 0.50 APHA 4500
NH3 F
11. Nitrate as NO3 mg/lit 8.69 1.64 10.26 09.36 < 45.00 APHA 4500
NO3 – B
12. Nitrite as NO2 mg/lit BDL BDL BDL BDL Not Specified IS 3025 (Part 34)
1988,
13. Nitrogen as N mg/lit BDL BDL BDL BDL Not Specified APHA-4500
14. Phosphorous as PO4 mg/lit 1.68 0.61 2.12 2.01 Not Specified APHA 4500 P-C
15. Potassium as K mg/lit 10.68 3.62 16.32 15.4 Not Specified APHA 3111 B
16. Sodium as Na mg/lit 18.92 6.80 31.28 24.62 Not Specified APHA 3111 B
17. Calcium as Ca mg/lit 41.56 24.60 54.84 52.21 < 75.00 IS 3025 (Part 40)
1991
18. Magnesium as Mg mg/lit 14.35 8.94 17.64 14.68 < 30.00 IS 3025 (Part 46)
1994 (RA 2009)

M/s. Shalini Organics Pvt. Ltd., MIDC Paitha, Dist- Aurangabad. EIA/EMP
Page 136
19. Total Hardness as
CaCO3 mg/lit 168.00 112.00 188.00 170.14 < 200.00
IS 3025 (Part
21): 2009
20. Carbonates as CO32- mg/lit 56.82 26.40 66.98 61.84 Not Specified APHA 2320
21. Bicarbonates as HCO3 mg/lit 42.13 12.60 45.48 42.69 Not Specified APHA 2320
22. Chlorides as Cl- mg/lit 36.10 21.40 74.69 71.23 < 250.00 IS 3025 (Part
32):
23. Sulphates as SO4 mg/lit 28.90 16.90 54.92 51.23 < 200.00 IS 3025 (Part-
24):
24. Sulphide as H2S mg/lit BDL BDL BDL BDL < 0.05 APHA-4500-S2
25. Fluorides as F- mg/lit 0.12 <0.01 <0.01 <0.01 < 1.00 APHA 4500-F-
D
26. Iron as Fe mg/lit <0.05 <0.05 <0.05 <0.05 < 0.30 APHA 3111 B
27. Aluminum as Al mg/lit BDL BDL BDL BDL <0.03 APHA 3111 B
28. Barium as Ba mg/lit BDL BDL BDL BDL <0.70 APHA 3111 B
29. Boron as B mg/lit <0.01 <0.01 <0.01 <0.01 < 0.50 APHA 3111 B
30. Copper as Cu mg/lit <0.04 <0.04 <0.04 <0.04 < 0.05 APHA 3111 B
31. Selenium as Se mg/lit BDL BDL BDL BDL <0.01 APHA 3111 B
32. Zinc as Zn mg/lit <0.05 <0.05 <0.05 <0.05 <5.00 APHA 3111 B
33. Cadmium as Cd mg/lit BDL BDL BDL BDL <0.003 APHA 3111 B
34. Lead as Pb mg/lit BDL BDL BDL BDL <0.01 APHA 3111 B
35. Mercury as Hg mg/lit BDL BDL BDL BDL <0.001 APHA 3111 B
36. Nickel as Ni mg/lit BDL BDL BDL BDL < 0.02 APHA 3111 B
37. Arsenic as As mg/lit BDL BDL BDL BDL < 0.01 APHA 3111 B
38. Chromium as Cr mg/lit <0.05 <0.05 <0.05 <0.05 < 0.05 APHA 3111 B
39. Total Coli form No./100ml <2 <2 <2 <2 Absent
IS: 1622
(Rev.1,R.A :
2014)
40. Fecal Coli form No./100ml <2 <2 <2 <2 Absent
IS: 1622
(Rev.1,R.A :
2014)

M/s. Shalini Organics Pvt. Ltd., MIDC Paitha, Dist- Aurangabad. EIA/EMP
Page 137
Observations: Ground Water samples were collected during month February 2021 for establishing baseline
of water quality within the 10 km radius for parameters like physical, chemical, biological & trace metals. The
sampling locations are listed in Table No. 3.5 and depicted in Figure No. 3.3. The results are presented in
Annexure. Parameters for analysis of water quality were selected based on the utility of the particular source
of water as per CPCB/ MoEFCC guidelines, hence quality of ground water was compared with IS:10500: 2012
for drinking purposes. Results indicate that the pH of all the ground water samples was withinthe prescribed
standards. The concentration of heavy metals like zinc was below detection limit. Iron was not detected in any
of the ground water samples. The hardness of all the ground water samples was found to be ranging between
112.0 mg/lit to 321.21 mg/lit. The value of hardness was within the acceptable limit at all the locations. It can
be observed that the values for total dissolved solids in all the sampling locations were estimated to be under
the acceptable standards for drinking water. The concentration of total dissolved solids ranged between 166.0
mg/lit to 654.01 mg/lit. The maximum concentration was observed at location Wahegaon. It should be noted
that the microbiological analysis of all the samples indicate that Total coliform and e-coli was absent in all the
ground water samples. Thus based on the above results it can be stated that the water from the said samples
can be considered fit for consumption and potable purpose with basic primary treatment. The water can be
used for domestic utilization and gardening without any treatment.
Analysis of collected samples reveals that rest of the parameters satisfy the permissible limits as per IS
10500:2012 (Annexure 3{VI}) specified for drinking water and hence the ground water is suitable for
drinking, however it is suggested that the water may be disinfected by suitable method before use for potable
purpose.
3.12. Surface Water Sampling
Surface water sample were collected from different locations within the study area and are presented
Table 3-14 Surface water locations
Sr. No. Location name Distance from project site in Km Latitude Longitude
SW1 Paithan Road 8.20 Km 19°30'53.68"N 75°22'38.19"E
SW2 North Jaikwadi Flyover 8.0 km 19°29'1.16"N 75°22'24.42"E
SW3 Amrapur 9.18 Km 19°32'25.00"N 75°18'13.41"E
SW4 wadavali 9.73 Km 19°27'36.13"N 75°25'59.26"E
SW5 Godavari River 9.26 Km 19°27'58.83"N 75°24'0.16"E
SW6 Paithan Left Bank Canal 3.65 Km 19°30'55.68"N 75°23'10.60"E
SW7 Shivbhadra River 4.43 Km 19°34'55.33"N 75°21'43.31"E

M/s. Shalini Organics Pvt. Ltd., MIDC Paitha, Dist- Aurangabad. EIA/EMP
Page 138
Table 3-15Surface water analysis report
Sr. No. Parameter Unit(s)
Location
Limits as per
IS
10500:2012
Analysis Method SW1
Paithan
Road Village
SW2
North
Jaikwadi
Flyover
SW3
Amrapur
SW4
Wadvali
1. Color Hazen Clear Clear Clear Clear 5.00 IS : 3025 (Part4):1983
2. Odor -- Agreeable Agreeable Agreeable Agreeable Agreeable IS : 3025
(Part5):1983,
3. pH -- 7.80 8.20 7.70 7.60 6.5-8.5 APHA 4500 H+, A,
23rd Ed.2017
4. Conductivity µS/cm 326.54 558.98 435.21 482.1 Not Specified IS 3025 (Part 14)
1984 (RA 2006)
5. TDS mg/lit 212.00 344.00 284.00 256.00 < 500.00 IS 3025 (Part 16):
6. Turbidity NTU 02.00 02.00 02.00 01.00 < 1.00 IS 3025 (Part 10):
1983
7. TSS mg/lit <5.00 <5.00 <5.00 <5.00 Not Specified IS: 3025 (Part-17)-
1984
8 D.O mg/lit 3.60 3.20 3.50 3.40 Not Specified IS:3025 (Part-38)-
1989
9. COD mg/lit 12.00 16.00 14.00 07.00 Not Specified IS:3025 (Part 58)-
2006 .
10. BOD 3 mg/lit 04.00 05.0 04.00 03.00 Not Specified IS:3025 (Part 44)-
1993,
11. Ammonical Nitrogen mg/lit 0.68 1.24 0.98 0.69 < 0.50 APHA 4500 NH3 F
12. Nitrate as NO3 mg/lit 14.60 16.98 12.34 8.46 < 45.00 APHA 4500 NO3 – B
13. Nitrite as NO2 mg/lit BDL BDL BDL BDL Not Specified IS 3025 (Part 34)
1988,
14. Nitrogen as N mg/lit BDL BDL BDL BDL Not Specified APHA-4500
15. Phosphorous as PO4 mg/lit BDL BDL BDL BDL Not Specified APHA 4500 P-C
16. Potassium as K mg/lit 14.62 18.92 15.64 15.34 Not Specified APHA 3111 B
17. Sodium as Na mg/lit 26.98 32.10 28.94 29.67 Not Specified APHA 3111 B
18. Calcium as Ca mg/lit 34.21 41.24 36.84 32.48 < 75.00 IS 3025 (Part 40)
1991
19. Magnesium as Mg mg/lit 10.65 16.98 12.54 11.84 < 30.00 IS 3025 (Part 46)
1994 (RA 2009)

M/s. Shalini Organics Pvt. Ltd., MIDC Paitha, Dist- Aurangabad. EIA/EMP
Page 139
Sr. No. Parameter Unit(s)
Location
Limits as per
IS
10500:2012
Analysis Method SW1
Paithan
Road Village
SW2
North
Jaikwadi
Flyover
SW3
Amrapur
SW4
Wadvali
20. Total Hardness as
CaCO3 mg/lit 98.95 136.90 112.36 1104.02 < 200.00
IS 3025 (Part 21):
2009
21. Carbonates as CO32- mg/lit 22.41 26.84 24.56 22.48 Not Specified APHA 2320
22. Bicarbonates as
HCO3 mg/lit 11.00 14.65 12.28 11.98 Not Specified APHA 2320
23. Chlorides as Cl- mg/lit 36.98 46.38 38.95 32.64 < 250.00 IS 3025 (Part 32):
24. Sulphates as SO4 mg/lit 25.64 32.54 28.46 21.45 < 200.00 IS 3025 (Part-24):
25. Sulphide as H2S mg/lit BDL BDL BDL BDL < 0.05 APHA-4500-S2
26. Fluorides as F- mg/lit <0.01 <0.01 <0.01 <0.01 < 1.00 APHA 4500-F- D
27. Iron as Fe mg/lit <0.05 <0.05 <0.05 <0.05 < 0.30 APHA 3111 B
28. Aluminum as Al mg/lit BDL BDL BDL BDL <0.03 APHA 3111 B
29. Barium as Ba mg/lit BDL BDL BDL BDL <0.70 APHA 3111 B
30. Boron as B mg/lit <0.01 <0.01 <0.01 <0.01 < 0.50 APHA 3111 B
31. Copper as Cu mg/lit <0.04 <0.04 <0.04 <0.04 < 0.05 APHA 3111 B
32. Selenium as Se mg/lit BDL BDL BDL BDL <0.01 APHA 3111 B
33. Zinc as Zn mg/lit <0.05 <0.05 <0.05 <0.05 <5.00 APHA 3111 B
34. Cadmium as Cd mg/lit BDL BDL BDL BDL <0.003 APHA 3111 B
35. Lead as Pb mg/lit BDL BDL BDL BDL <0.01 APHA 3111 B
36. Mercury as Hg mg/lit BDL BDL BDL BDL <0.001 APHA 3111 B
37. Nickel as Ni mg/lit BDL BDL BDL BDL < 0.02 APHA 3111 B
38. Arsenic as As mg/lit BDL BDL BDL BDL < 0.01 APHA 3111 B
39. Chromium as Cr mg/lit <0.05 <0.05 <0.05 <0.05 < 0.05 APHA 3111 B
40. Total Coli form No./100ml 24 26 14 11 Absent IS: 1622 (Rev.1,R.A :
2014)
41. Fecal Coli form No./100ml 06 07 04 04 Absent IS: 1622 (Rev.1,R.A :
2014)
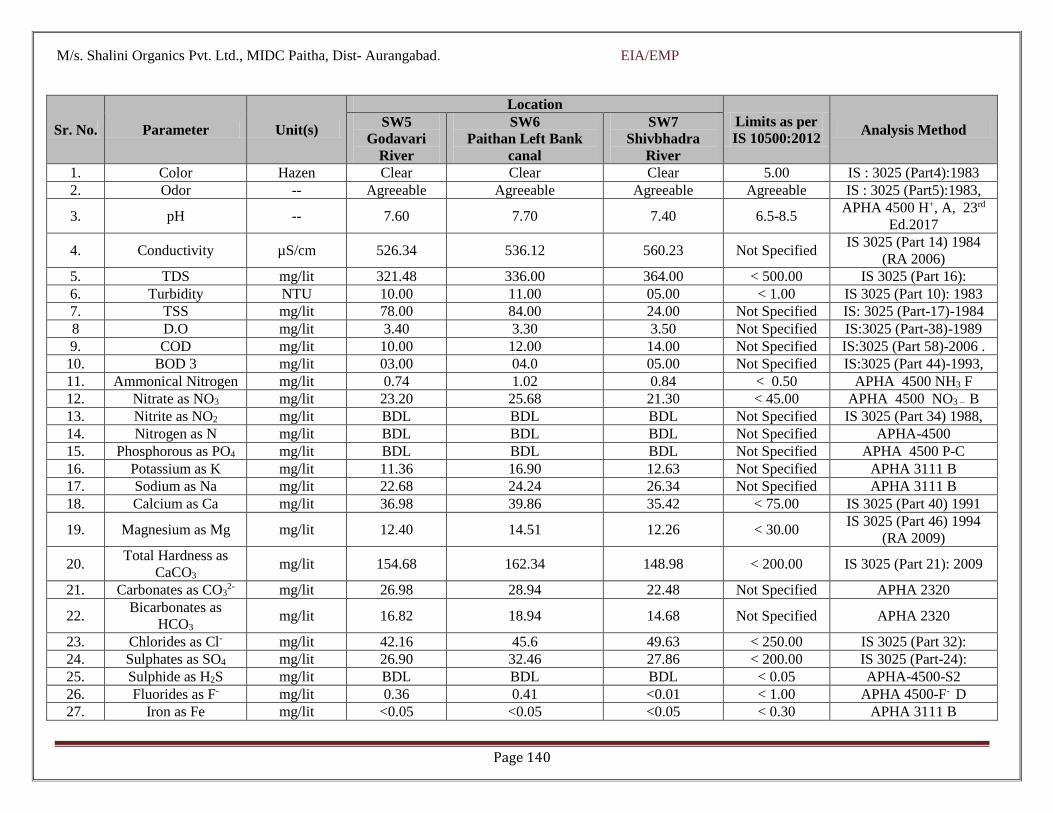
M/s. Shalini Organics Pvt. Ltd., MIDC Paitha, Dist- Aurangabad. EIA/EMP
Page 140
Sr. No. Parameter Unit(s)
Location
Limits as per
IS 10500:2012 Analysis Method
SW5
Godavari
River
SW6
Paithan Left Bank
canal
SW7
Shivbhadra
River
1. Color Hazen Clear Clear Clear 5.00 IS : 3025 (Part4):1983
2. Odor -- Agreeable Agreeable Agreeable Agreeable IS : 3025 (Part5):1983,
3. pH -- 7.60 7.70 7.40 6.5-8.5 APHA 4500 H+, A, 23rd
Ed.2017
4. Conductivity µS/cm 526.34 536.12 560.23 Not Specified IS 3025 (Part 14) 1984
(RA 2006)
5. TDS mg/lit 321.48 336.00 364.00 < 500.00 IS 3025 (Part 16):
6. Turbidity NTU 10.00 11.00 05.00 < 1.00 IS 3025 (Part 10): 1983
7. TSS mg/lit 78.00 84.00 24.00 Not Specified IS: 3025 (Part-17)-1984
8 D.O mg/lit 3.40 3.30 3.50 Not Specified IS:3025 (Part-38)-1989
9. COD mg/lit 10.00 12.00 14.00 Not Specified IS:3025 (Part 58)-2006 .
10. BOD 3 mg/lit 03.00 04.0 05.00 Not Specified IS:3025 (Part 44)-1993,
11. Ammonical Nitrogen mg/lit 0.74 1.02 0.84 < 0.50 APHA 4500 NH3 F
12. Nitrate as NO3 mg/lit 23.20 25.68 21.30 < 45.00 APHA 4500 NO3 – B
13. Nitrite as NO2 mg/lit BDL BDL BDL Not Specified IS 3025 (Part 34) 1988,
14. Nitrogen as N mg/lit BDL BDL BDL Not Specified APHA-4500
15. Phosphorous as PO4 mg/lit BDL BDL BDL Not Specified APHA 4500 P-C
16. Potassium as K mg/lit 11.36 16.90 12.63 Not Specified APHA 3111 B
17. Sodium as Na mg/lit 22.68 24.24 26.34 Not Specified APHA 3111 B
18. Calcium as Ca mg/lit 36.98 39.86 35.42 < 75.00 IS 3025 (Part 40) 1991
19. Magnesium as Mg mg/lit 12.40 14.51 12.26 < 30.00 IS 3025 (Part 46) 1994
(RA 2009)
20. Total Hardness as
CaCO3 mg/lit 154.68 162.34 148.98 < 200.00 IS 3025 (Part 21): 2009
21. Carbonates as CO32- mg/lit 26.98 28.94 22.48 Not Specified APHA 2320
22. Bicarbonates as
HCO3 mg/lit 16.82 18.94 14.68 Not Specified APHA 2320
23. Chlorides as Cl- mg/lit 42.16 45.6 49.63 < 250.00 IS 3025 (Part 32):
24. Sulphates as SO4 mg/lit 26.90 32.46 27.86 < 200.00 IS 3025 (Part-24):
25. Sulphide as H2S mg/lit BDL BDL BDL < 0.05 APHA-4500-S2
26. Fluorides as F- mg/lit 0.36 0.41 <0.01 < 1.00 APHA 4500-F- D
27. Iron as Fe mg/lit <0.05 <0.05 <0.05 < 0.30 APHA 3111 B

M/s. Shalini Organics Pvt. Ltd., MIDC Paitha, Dist- Aurangabad. EIA/EMP
Page 141
Sr. No. Parameter Unit(s)
Location
Limits as per
IS 10500:2012 Analysis Method
SW5
Godavari
River
SW6
Paithan Left Bank
canal
SW7
Shivbhadra
River
28. Aluminum as Al mg/lit BDL BDL BDL <0.03 APHA 3111 B
29. Barium as Ba mg/lit BDL BDL BDL <0.70 APHA 3111 B
30. Boron as B mg/lit <0.01 <0.01 <0.01 < 0.50 APHA 3111 B
31. Copper as Cu mg/lit <0.04 <0.04 <0.04 < 0.05 APHA 3111 B
32. Selenium as Se mg/lit BDL BDL BDL <0.01 APHA 3111 B
33. Zinc as Zn mg/lit <0.05 <0.05 <0.05 <5.00 APHA 3111 B
34. Cadmium as Cd mg/lit BDL BDL BDL <0.003 APHA 3111 B
35. Lead as Pb mg/lit BDL BDL BDL <0.01 APHA 3111 B
36. Mercury as Hg mg/lit BDL BDL BDL <0.001 APHA 3111 B
37. Nickel as Ni mg/lit BDL BDL BDL < 0.02 APHA 3111 B
38. Arsenic as As mg/lit BDL BDL BDL < 0.01 APHA 3111 B
39. Chromium as Cr mg/lit <0.05 <0.05 <0.05 < 0.05 APHA 3111 B
40. Total Coli form No./100ml 28 30 21 Absent IS: 1622 (Rev.1,R.A :
2014)
41. Fecal Coli form No./100ml 07 09 06 Absent IS: 1622 (Rev.1,R.A :
2014)

M/s. Shalini Organics Pvt. Ltd., MIDC Paitha, Dist- Aurangabad. EIA/EMP
Page 142
The values obtained are compared with the standards prescribed for the respective designated use of the water
body as categorized in the earlier part of the study. The analysis helps to concluded that the pH of all the
samples was found to vary between: 7.20 – 8.20. It should be noted that the values obtained were within the
desirable limit for pH as prescribed by CPCB. The total hardness was observed to be ranging between 1104.02
mg/l to 98.95 mg/lit. The maximum value of hardness was recorded at Wadawali and the minimum value was
recorded at Paithan Road village. The concentration of Total Dissolved Solids was estimated in the range of
212 mg/l to 364 mg/l. The maximum concentration of Total Dissolved Solids (TDS) was observed at
Shivbhadra River whereas the minimum TDS concentration was observed at Paithan Road Village. The
Chemical Oxygen Demand (COD) & Biochemical Oxygen Demand (BOD) values were calculated to be in
the range of 16 mg/lit. to 7 mg/lit. & 3 mg/lit.to 5.0 mg/lit. respectively.
The presence of heavy metals like, Zinc were found out be below the detection limit for all the water samples.
It should be noted that the iron content in all the samples of surface water bodies were below the detection
limit. Surface runoff from agricultural fields using the fertilizers can be the major source of nitrate.
Conclusion: The comparison of surface water results with IS 2296:1992 ,shows that the designated best use
of water falls under category A & B.

M/s. Shalini Organics Pvt. Ltd., MIDC Paitha, Dist- Aurangabad. EIA/EMP
Page 143
3.13. Soil Environment
The soils in the 10 km radius of study area, keeping in view the topography are covered in total 9 sampling
locations [Figure No 3.14]. The soil samples were collected as per the standard procedure. The location
identification within project area is given in following Table No. 3.16;
Table 3-16Soil Sampling Locations
Sr. No. Location name Type of soil
Distance from
project site in
Km
Latitude Longitude
S1 Project site Clay 0 Km 19°32'55.55"N 75°23'8.80"E
S2 Near Yashwant
Nagar Clay 0.93 Km 19°32'51.49"N 75°22'40.52"E
S3 Near Pimpalwadi Clay 1.94 Km 19°31'52.66"N 75°22'47.72"E
S4 Near Wahegaon Clay 2.10 Km 19°33'36.31"N 75°23'49.52"E
S5 Near Iswardi Clay 2.03 Km 19°33'51.99"N 75°22'31.04"E
S6 Near Pachalgaon Clay 3.43 Km 19°33'19.69"N 75°25'29.00"E
S7 Near Jaikwadi
Irrigation Colony Clay 3.15 Km 19°31'20.61"N 75°22'42.74"E
S8 Near Amrapur
Waghundi Clay 9.26 Km 19°33'32.29"N 75°17'51.45"E
Figure 3-14 Soil sampling locations within 10 Km radius

M/s. Shalini Organics Pvt. Ltd., MIDC Paitha, Dist- Aurangabad. EIA/EMP
Page 144
Table 3-17 Soil analysis report
Parameters unit
S1 S2 S3 S4 S5 S6 S7 S8
Project
site
Near
Yashwant
Nagar
Near
Pimpalwadi
Near
Wahegaon
Near
Iswardi
Near
Pachalgaon
Near
Jaikwadi
Irrigation
Colony
Near
Amrapur
Waghundi
Bulk Density gm/cm3 1.48 1.46 1.35 1.52 1.23 1.16 1.01 1.28
Porosity % 48.78 56.84 46.35 52.18 51.48 56.94 52.48 46.92
Water
Holding
Capacity
% 45.30 49.68 42.15 45.60 52.46 45.85 49.62 48.60
Permeability Cm/Hr. 0.51 0.42 0.48 0.58 0.78 0.31 0.41 0.36
Particle size distribution
Sand % 28.00 26.00 25.00 27.00 23.00 22.00 24.00 21.00
Clay % 56.00 59.00 57.00 56.00 60.00 58.00 58.00 63.00
Stilt % 16.00 15.00 18.00 17.00 17.00 20.00 18.00 16.00
Texture Class -- Clay Clay Clay Clay Clay Clay Clay Clay
pH (5%
Solution) -- 7.60 8.20 7.40 7.80 7.60 7.20 7.50 7.10
Electrical
Conductivity µS/cm 1480.68 1240.36 1026.32 1248.00 1124.92 1014.36 1285.46 1458.36
Cation
Exchange
Capacity
meq/100
gm 48.78 42.48 52.48 56.92 46.98 42.16 62.69 62.14
Potassium mg/Kg 212.4 226.80 198.74 210.49 162.48 148.70 187.46 221.48
Phosphorous mg/Kg 84.56 95.60 81.46 112.36 136.98 98.74 121.46 136.95
Available
Nitrogen mg/Kg 268.90 274.69 271.46 256.48 326.98 302.14 289.62 324.62
Total organic
matter mg/Kg 1.28 2.10 1.36 3.49 1.01 1.26 1.26 1.48
Iron as Fe mg/Kg 1.24 0.94 0.46 0.28 0.21 0.62 0.52 0.94
Zinc as Zn mg/Kg 2.68 1.29 2.18 1.68 2.58 3.68 1.46 1.36
Nickel as Ni mg/Kg 2.68 1.56 2.16 3.28 2.49 3.26 2.16 1.48
M/s. Shalini Organics Pvt. Ltd., MIDC Paitha, Dist- Aurangabad. EIA/EMP
Page 145
Baseline status of Soil:
Physical Characteristics
Physical characteristics of soil samples are delineated through specific parameters, viz., particle size
distribution, texture, bulk density, porosity, water holding capacity, Moisture Content and Total Organic
Matter.
The particle size distribution in terms of percentage of sand, silt and clay is furnished in Table No. 3.17.
The predominant texture of soil is clay, followed by clay loam.
The bulk density of soils is in the range of 1.01 – 1.52 gm/cc, which, is considered as moderate. and
Total Organic Matter is in the range of 1.01 – 3.49 % which shows medium to high nutrient value of
the soil. Soil porosity is a measure of air-filled pore spaces and gives information about movement of
gases, inherent moisture, and development of root system and strength of soil. Variations in soil porosity
and water holding capacity are presented in Table No.3.17
3.14. Ecology & Biodiversity
Erratism in the species composition and functioning of ecosystem carried out by anthropogenic
activities. The first part to be affected directly as well as indirectly and in a short, medium- and long-
term span would be the biotic component of the area. The biological assessment is trustworthy and
acceptable method to understand the impact on surroundings. This leads to suggestion of remedial
measures for minimizing the anticipated impacts on the ecosystem and living things.
Forest and Forest type of study area:
Project site and surrounding area of site comes under southern dry mixed deciduous and southern thorn
forest types (Chmapion and Seth 1968). Mixed forest consisting of various varieties of species the
occurrence of which is considerably influenced by biotic interferences and management. Major tree
species occurring in the forest can be listed as Teak, Moi, Arjun, Bel, Babul, Khair, Palas, Parijatak etc.
Thorny scrub type which is more or less a regressed subtype where overwood has been completely
removed and due to excessive grazing only thorny species such as karwand, henkal, amoni, ghaneri,
etc., survive. Grass lands which are well protected commercial kurans used mainly for fodder grass
which is sold on cutting terms, the main species being sheda, marvel, kunda, paonya, rosha, kusali etc.
Biological environment of the area was studied during the study period. No endangered species have
been sighted in the area. No Wildlife Sanctuary, National Park, Biosphere Reserves, Wildlife Corridors
exists within study area of 10 km radius Except Jayakwadi Bird Sanctuary.
Flora and Fauna:
To conduct the study related to flora and fauna, the 10 km radius area was surveyed and the existing
flora and fauna were recorded. The information about flora and fauna were also obtained from local
people.
Flora:
Proposed project site: Acacia nilotica, Senna auriculata, Tephrosia purpurea these kinds of common
plants were observed at proposed plant site.Buffer zone (10 km from project boundary). The structure
and composition of vegetation in the buffer zone was studied by visual observations during the site visit.
The study area is dominated by agricultural fields. Most of the area is covered by active cropping
accompanying patches of barren land and grassland inbetween. The project is located in the area which
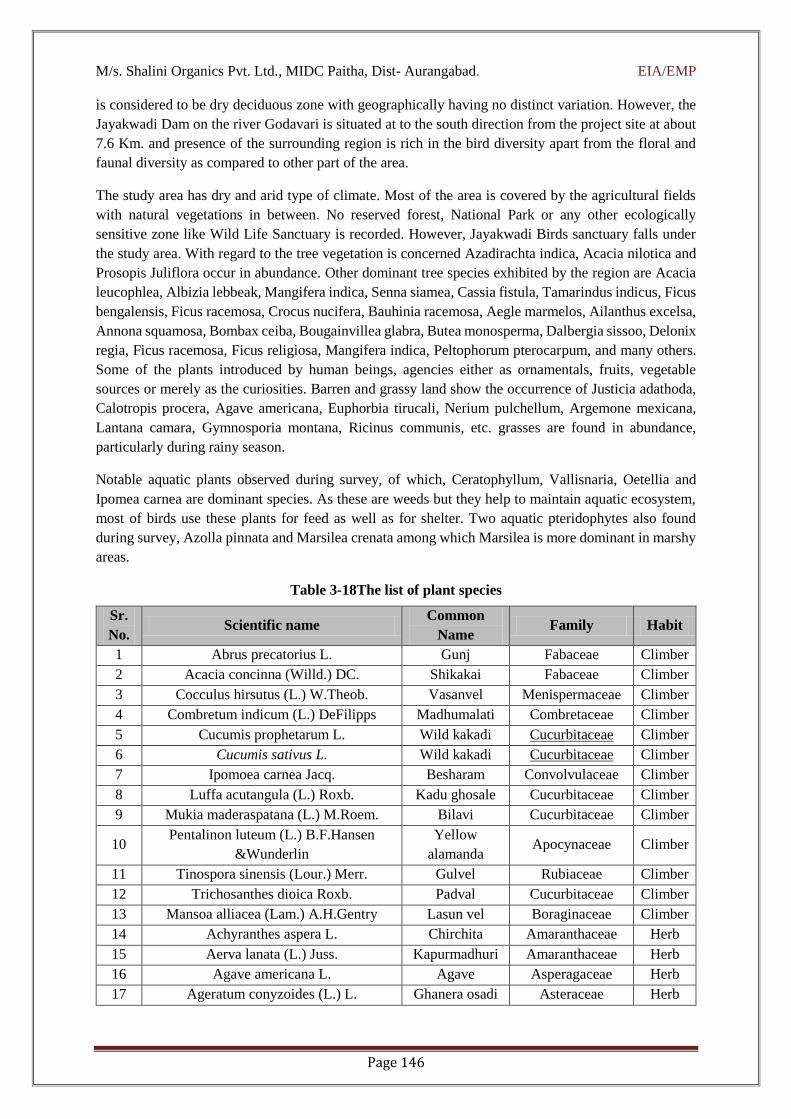
M/s. Shalini Organics Pvt. Ltd., MIDC Paitha, Dist- Aurangabad. EIA/EMP
Page 146
is considered to be dry deciduous zone with geographically having no distinct variation. However, the
Jayakwadi Dam on the river Godavari is situated at to the south direction from the project site at about
7.6 Km. and presence of the surrounding region is rich in the bird diversity apart from the floral and
faunal diversity as compared to other part of the area.
The study area has dry and arid type of climate. Most of the area is covered by the agricultural fields
with natural vegetations in between. No reserved forest, National Park or any other ecologically
sensitive zone like Wild Life Sanctuary is recorded. However, Jayakwadi Birds sanctuary falls under
the study area. With regard to the tree vegetation is concerned Azadirachta indica, Acacia nilotica and
Prosopis Juliflora occur in abundance. Other dominant tree species exhibited by the region are Acacia
leucophlea, Albizia lebbeak, Mangifera indica, Senna siamea, Cassia fistula, Tamarindus indicus, Ficus
bengalensis, Ficus racemosa, Crocus nucifera, Bauhinia racemosa, Aegle marmelos, Ailanthus excelsa,
Annona squamosa, Bombax ceiba, Bougainvillea glabra, Butea monosperma, Dalbergia sissoo, Delonix
regia, Ficus racemosa, Ficus religiosa, Mangifera indica, Peltophorum pterocarpum, and many others.
Some of the plants introduced by human beings, agencies either as ornamentals, fruits, vegetable
sources or merely as the curiosities. Barren and grassy land show the occurrence of Justicia adathoda,
Calotropis procera, Agave americana, Euphorbia tirucali, Nerium pulchellum, Argemone mexicana,
Lantana camara, Gymnosporia montana, Ricinus communis, etc. grasses are found in abundance,
particularly during rainy season.
Notable aquatic plants observed during survey, of which, Ceratophyllum, Vallisnaria, Oetellia and
Ipomea carnea are dominant species. As these are weeds but they help to maintain aquatic ecosystem,
most of birds use these plants for feed as well as for shelter. Two aquatic pteridophytes also found
during survey, Azolla pinnata and Marsilea crenata among which Marsilea is more dominant in marshy
areas.
Table 3-18The list of plant species
Sr.
No. Scientific name
Common
Name Family Habit
1 Abrus precatorius L. Gunj Fabaceae Climber
2 Acacia concinna (Willd.) DC. Shikakai Fabaceae Climber
3 Cocculus hirsutus (L.) W.Theob. Vasanvel Menispermaceae Climber
4 Combretum indicum (L.) DeFilipps Madhumalati Combretaceae Climber
5 Cucumis prophetarum L. Wild kakadi Cucurbitaceae Climber
6 Cucumis sativus L. Wild kakadi Cucurbitaceae Climber
7 Ipomoea carnea Jacq. Besharam Convolvulaceae Climber
8 Luffa acutangula (L.) Roxb. Kadu ghosale Cucurbitaceae Climber
9 Mukia maderaspatana (L.) M.Roem. Bilavi Cucurbitaceae Climber
10 Pentalinon luteum (L.) B.F.Hansen
&Wunderlin
Yellow
alamanda Apocynaceae Climber
11 Tinospora sinensis (Lour.) Merr. Gulvel Rubiaceae Climber
12 Trichosanthes dioica Roxb. Padval Cucurbitaceae Climber
13 Mansoa alliacea (Lam.) A.H.Gentry Lasun vel Boraginaceae Climber
14 Achyranthes aspera L. Chirchita Amaranthaceae Herb
15 Aerva lanata (L.) Juss. Kapurmadhuri Amaranthaceae Herb
16 Agave americana L. Agave Asperagaceae Herb
17 Ageratum conyzoides (L.) L. Ghanera osadi Asteraceae Herb

M/s. Shalini Organics Pvt. Ltd., MIDC Paitha, Dist- Aurangabad. EIA/EMP
Page 147
Sr.
No. Scientific name
Common
Name Family Habit
18 Aloe vera (L.) Burm.f. Korphad Xanthorrhoeaceae Herb
19 Alternanthera sessilis (L.) R.Br. ex DC. Kanchari Amaranthaceae Herb
20 Alternanthera ficoidea (L.) Sm. Kusal Amaranthaceae Herb
21 Amaranthus spinosus L. Katemath Amaranthacea Herb
22 Argemone mexicana L. Mexican poppy Papaveraceae Herb
23 Arundinella pumila (Hochst.) Steud. Grass Poaceae Herb
24 Asparagus racemosus Willd. Shatavari Asparagaceae Herb
25 Barleria cristata L. Koranti Acanthaceae Herb
26 Cynarospermum asperrimum (Nees)
Vollesen Dikna Acanthaceae Herb
27 Blumea lacera (Burm.f.) DC. Bamurda Asteraceae Herb
28 Boerhavia diffusa L. punarnava Nyctaginaceae Herb
29 Brassica rapa L. Mohari Brassicaceae Herb
30 Canna indica L. Karhdal Canaceae Herb
31 Senna tora (L.) Roxb. Vala Fabacea Herb
32 Senna auriculata (L.) Roxb. Tarvad Fabaceae Herb
33 Celosia argentea L. Kurdu Acanthacea herb
34 Chloris barbata Sw. Gondvel tan Poaceae Herb
35 Cleome viscosa L. Tilvan Capparaceae herb
36 Crotalaria juncea L. Dhakati ghagri Fabaceae Herb
37 Croton bonplandianus Baill. Ban Tulasi Euphorbiaceae Herb
38 Cyathocline purpurea (Buch.-Ham. ex
D.Don) Kuntze Galphule Asteraceae Herb
39 Cynodon dactylon (L.) Pers. Harali Poaceae Herb
40 Cyperus alternifolius L. Cyperaceae Herb
41 Dendrocalamus strictus (Roxb.) Nees Bamboo Poaceae Herb
42 Desmodium triflorum (L.) DC. Chipti Fabaceae Herb
43 Dichanthium annulatum (Forssk.) Stapf Grass Poaceae Herb
44 Dicliptera paniculata (Forssk.) I.Darbysh. Acanthaceae Herb
45 Dimeria Sp. Poaceae Herb
46 Echinochloa colona (L.) Link Poaceae herb
47 Eichhornia crassipes (Mart.) Solms Jalparni Hycianthaceae Herb
48 Emilia sonchifolia (L.) DC. ex DC. Sadamandee Asteraceae herb
49 Euphorbia hirta L. Dudhi Euphorbiaceae Herb
50 Euphorbia tirucalli L. Euphorbiaceae Herb
51 Flaveria trinervia (Spreng.) C.Mohr Asteraceae Herb
52 Hemidesmus indicus (L.) R. Br. ex
Schult. Karala Apocynaceae Herb
53 Heteropogon contortus (L.) P.Beauv. ex
Roem. & Schult. Grass Poaceae Herb
54 Hygrophila auriculata (Schumach.) Heine Ekhara Acanthaceae Herb
55 Imperata cylindrica (L.) Raeusch. Grass Poaceae Herb
56 Indigofera sp. Fabaceae Herb
57 Justicia procumbens L. Karambal Acanthaceae Herb

M/s. Shalini Organics Pvt. Ltd., MIDC Paitha, Dist- Aurangabad. EIA/EMP
Page 148
Sr.
No. Scientific name
Common
Name Family Habit
58 Lepidagathis cristata Willd. Bhui gend Acanthaceae Herb
59 Ludwigia prostrata Roxb. Primerose Onagraceae Herb
60 Mimosa pudica L. Lajalu Momosaceae Herb
61 Ocimum gratissimum L. Van tulasi Lamiaceae Herb
62 Oxalis stricta L. Oxalis Oxalidaceae Herb
63 Parthenium hysterophorus L. Gajar grass Asteraeae Herb
64 Cenchrus ciliaris L. Buffle grass Poaceae Herb
65 Persicaria glabra (Willd.) M.Gómez Sheral Polygonaceae Herb
66 Phyllanthus niruri L. Bhui Awala euphorbiaceae Herb
67 Physalis peruviana L. Popati Solanaceae Herb
68 Portulaca oleracea L. Parslane Portulacaceae Herb
69 Melinis repens (Willd.) Zizka Grass Poaceae Herb
70 Saccharum spontaneum L. Wild sugarcane Poaceae Herb
71 Sida acuta Burm.f. Chikna Malvaceae Herb
72 Solanum americanum Mill. Wild bringle Solanaceae Herb
73 Solanum virginianum L. Wild bringle Solanaceae Herb
74 Spilanthes acmella (L.) L. Akkalkara Asteraceae Herb
75 Synedrella nodiflora (L.) Gaertn. Pig grass Asteraceae Herb
76 Tephrosia purpurea (L.) Pers. Unhali Fabaceae Herb
77 Tribulus terrestris L. Gokharu Boraginaceae Herb
78 Trichodesma indicum (L.) Lehm. Chota kalpa Boraginaceae Herb
79 Tridax procumbance Dagadful Asteraceae Herb
80 Triumfetta rhomboidea Jacq. Nichardi Tiliaceae Herb
81 Typha angustifolia L. Paankanis Typhaceae Herb
82 Urena lobata L. Van bhendi Malvaceae Herb
83 Zea mays L. Makka Poaceae Herb
84 Ceratophyllum demersum L. Ceratophyllaceae Herb
85 Vallisneria spiralis L. Tape grass Hydrocharitaceae Herb
86 Potamogeton indicus Roxb. Potamogetonaceae Herb
87 Azolla pinnata R. Brown Salvinaceae Herb
88 Marsilea crenata C. Presl Water clover Marsileaceae Herb
89 Abutilon indicum (L.) Sweet Petari Malvaceae Shrub
90 Bougainvillea spectabilis Willd. Boganvel Nyctaginaceae Shrub
91 Caesalpinia bonduc (L.) Roxb. Sagargota Caesalpinaceae shrub
92 Caesalpinia pulcherrima (L.) Sw. Shankhasur Caesalpinaceae shrub
93 Calotropis gigantea (L.) Dryand. Rui Asclepiadaceae Shrub
94 Calotropis procera (Aiton) Dryand. Mandera Asclepiadaceae Shrub
95 Calliandra haematocephala Hassk. Red powder
puff Fabaceae shrub
96 Chromolaena odorata (L.) R.M.King &
H.Rob. Eupatorium Asteraceae shrub
97 Duranta erectaL. Golden duranta verbenaceae Shrub
98 Euphorbia pulcherrima Willd. ex
Klotzsch Euphorbiaceae Shrub

M/s. Shalini Organics Pvt. Ltd., MIDC Paitha, Dist- Aurangabad. EIA/EMP
Page 149
Sr.
No. Scientific name
Common
Name Family Habit
99 Hibiscus rosa-sinensis L. Jaswand Malvaceae Shrub
100 Hyptis suaveolens (L.) Poit. Darp Tulas Lamiaceae Shrub
101 Lantana camara L. Tantani Verbenaceae Shrub
102 Lawsonia inermis L. Mehandi Lythraceae Shrub
103 Nerium oleander L. Kanher Apocynaceae Shrub
104 Ricinus communis L. Arandi Euphorbiaceae Shrub
105 Tecoma stans (L.) Juss. ex Kunth Ghantiful Bignoniaceae Shrub
106 Vitex negundo L. Nirgudi Verbenaceae Shrub
107 Xanthium strumarium L. Ghagara Asteraceae Shrub
108 Acacia auriculiformis Benth. Australian
babul Fabaceae Tree
109 Acacia catechu (L.f.) Willd. Khair Fabaceae Tree
110 Acacia leucophloea (Roxb.) Willd. Pandhara khair Fabaceae Tree
111 Acacia nilotica (L.) Delile Babul Fabaceae Tree
112 Aegle marmelos (L.) Corrêa Bel Rutaceae Tree
113 Ailanthus excelsa Roxb. Maharukh Simaroubaceae Tree
114 Albizia lebbeck (L.) Benth. Shirish Mimosaceae Tree
115 Albizia procera (Roxb.) Benth. Safed Shirish Mimosaceae Tree
116 Alstonia scholaris (L.) R. Br. Saptparni Apocynaceae Tree
117 Annona reticulata L. Ramfal Annonaceae Tree
118 Annona squamosa L. Sitafal Annonaceae Tree
119 Neolamarckia cadamba (Roxb.) Bosser Kadamb Rubiaceae Tree
120 Azadirachta indica A.Juss. Neem Meliaceae Tree
121 Bauhinia purpurea L. Kanchan Fabaceae Tree
122 Bauhinia racemosa Lam. Apta Fabaceae Tree
123 Bombax ceiba L. Katesawar Bombacaceae Tree
124 Butea monosperma (Lam.) Taub. Palas Fabaceae Tree
125 Callistemon citrinus (Curtis) Skeels Bottle brush Myrtaceae Tree
126 Carica papaya L. Papaya Caricaceae Tree
127 Cassia fistula L. Bahava Fabacae Tree
128 Cassia javanica subsp. nodosa (Roxb.)
K.Larsen & S.S.Larsen Pink cassia Fabaceae Tree
129 Senna siamea (Lam.) H.S.Irwin &
Barneby Kashid Fabaceae Tree
130 Citrus limon (L.) Osbeck Lemon Rutaceae Tree
131 Cocos nucifera L. Naral Arecaceae Tree
132 Cordia dichotoma G.Forst. shelu Boraginaceae Tree
133 Dalbergia latifolia Roxb. Sisam Fabaceae Tree
134 Dalbergia sissoo DC. Sisoo Fabaceae Tree
135 Delonix regia (Hook.) Raf. Gulmohar Fabacea Tree
136 Eucalyptus tereticornis Sm. Nilgiri Myrtaceae Tree
137 Ficus amplissima Sm. Pimpran Moraceae Tree
138 Ficus benghalensis L. wad Moraceae Tree
139 Ficus racemose L. Umber Moraceae Tree

M/s. Shalini Organics Pvt. Ltd., MIDC Paitha, Dist- Aurangabad. EIA/EMP
Page 150
Sr.
No. Scientific name
Common
Name Family Habit
140 Ficus religiose L. Pimpal Moraceae Tree
141 Gliricidia sepium (Jacq.) Walp. Undirmari Fabaceae Tree
142 Grewia tiliifolia Vahl Dhaman Tiliaceae Tree
143 Gymnosporia montana (Roth) Benth. Mountain spike Celastraceae Tree
144 Hardwickia binata Roxb. Ajan Fabaceae Tree
145 Justicia adhatoda L. Adulasa Acanthaceae Tree
146 Lagerstroemia speciosa (L.) Pers. Taman Lythraceae Tree
147 Lannea coromandelica (Houtt.) Merr. Moi Anacardiaceae Tree
148 Leucaena latisiliqua (L.) Gillis & Stearn Subabul Fabaceae Tree
149 Mangifera indica L. Amba Anacardiaceae Tree
150 Manilkara zapota (L.) P.Royen Chiku Sapotaceae Tree
151 Melia azedarach L. Bakan neem Meliaceae Tree
152 Millingtonia hortensis L.f Bhuchache zad Bigoniaceae Tree
153 Morinda citrifolia L. Bartondi Rubiaceae Tree
154 Muntingia calabura L. Singapore
cherry Muntinginaceae Tree
155 Musa paradisiaca L. Kel Musaceae Tree
156 Nyctanthes arbor-tristis L. Parijatak Oleaceae Tree
157 Peltophorum pterocarpum (DC.)
K.Heyne Tambat sheng Caesalpinaceae Tree
158 Phoenix sylvestris (L.) Roxb. Khajur Aracaceae Tree
159 Phyllanthus emblica L. Awala Euphorbiaceae Tree
160 Pithecellobium dulce (Roxb.) Benth. Vilayati chinch Fabaceae Tree
161 Plumeria alba L. Chafa Apocynaceae Tree
162 Polyalthia longifolia (Sonn.) Thwaites Ashok Annonaceae Tree
163 Pongamia pinnata (L.) Pierre Karanj Fabaceae Tree
164 Prosopis juliflora (Sw.) DC. Shami Fabaceae Tree
165 Psidium guajava L. Peru Myrtaceae Tree
166 Punica granatum L. Dalimb Lythraceae Tree
167 Santalum album L. Chandan Santalaceae Tree
168 Albizia saman (Jacq.) Merr. Rain tree Mimosaceae Tree
169 Spathodea campanulata P.Beauv. Pichakari Bignoniaceae Tree
170 Syzygium cumini (L.) Skeels Jambhul Myrtaceae Tree
171 Tamarindus indica L. Chinch Fabaceae Tree
172 Tectona grandis L.f. Teak verbenaceae Tree
173 Terminalia arjuna (Roxb. ex DC.) Wight
& Arn. Arjun Combretaceae Tree
174 Terminalia catappa L. Badam Combretaceae Tree
175 Thespesia populnea (L.) Sol. ex Corrêa Bhend Malvaceae Tree
176 Ziziphus jujuba Mill. Ber Rhamnaceae Tree
Based on field survey, total 69 Tree species, 19 Shrubs species and 75 Herbs and 13 Climber species
are identified in entire study area. No species found during field survey which comes under IUCN RET
categories.

M/s. Shalini Organics Pvt. Ltd., MIDC Paitha, Dist- Aurangabad. EIA/EMP
Page 151
Cucumis prophetarum L. Trichodesma indicum (L.) Lehm.
Senna tora (L.) Roxb. Ziziphus jujuba Mill.
Croton bonplandianus Baill. Tephrosia purpurea (L.) Pers.
Figure 3-15 Photographs of floral species

M/s. Shalini Organics Pvt. Ltd., MIDC Paitha, Dist- Aurangabad. EIA/EMP
Page 152
Fauna:
Faunal diversity studied during field visit and categorised as per the respective groups and occurrence
as well. Photographic evidences of same provided as per the requirement of project. Proposed project
site is open and only two butterflies and two odonates found during the survey. Spider webs also found
near project site but no without spiders. Jayakwadi dam is closer to proposed project site (Within 10
Km radius) and some flocks of migratory birds has been observed. Detailed faunal investigation with
checklist and photographs enlisted below,
Odonates:
Dragonflies and damselflies play key roles in both terrestrial and aquatic habitats. They are predators
as both nymphs and adults, feeding on a variety of prey including nuisance species such as mosquitoes
and biting flies. They can be indicators of different biotypes and habitats and have been used as tools
to assess the biological health of aquatic habitats and to detect levels of heavy metals such as mercury.
They are also considered model organisms to assess the effects of global climate change.

M/s. Shalini Organics Pvt. Ltd., MIDC Paitha, Dist- Aurangabad. EIA/EMP
Page 153
Table 3-19 List of fauna
Sr. No Common Name Scientific Name
1 Ground Skimmer Diplacodes trivialis
2 Ditch Jewel Brachythemis contaminata
3 Crimson Marsh Glider Trithemis aurora
4 Black Marsh Trotter Tramea limbata
5 Crimson-tailed Marsh Hawk Orthetrum pruinosum
6 Senegal Golden Dartlet Ischnura senegalensis
7 Pygmy Dartlet Agriocnemis pygmaea
8 Saffron-faced Blue Dart Pseudagrion rubriceps
9 Grey Damselfly Pseudagrion hypermelas
10 Coromandel Marsh Dart Ceriagrion coromandelianum
5 dragonfly and 5 damselflies found during entire field visit and most of them near aquatic habitat
except ground skimmer which found on proposed project site.
Insects:
Beetles:
Beetles are important biological control agents of aphids and scale insects and useful as decomposers
and recyclers of organic nutrients also. Seven species of beetles found during faunal survey from 3
families of which Coccinellinae is more dominant family.
Table 3-20 Deatails of beetels
Sr No Scientific name Family
1. Altica sp. Chrysomelidae
2. Leaf beetle Chrysomelidae
3. Harmonia octomaculata Coccinellinae
4. Coccinella transversalis Coccinellinae
5. Hycleus polymorphus Meloidae
6. Psyllobora sp. Coccinellinae
7. Illeis sp. Coccinellinae

M/s. Shalini Organics Pvt. Ltd., MIDC Paitha, Dist- Aurangabad. EIA/EMP
Page 154
Bugs:
Insects are crucial components of many ecosystems, where they perform many important functions.
They aerate the soil, pollinate blossoms, and control insect and plant pests. As decomposers, insects
help create top soil, the nutrient-rich layer of soil that helps plants grow. Without insects to help break
down and dispose of wastes, dead animals and plants would accumulate in our environment and it would
be messy indeed. Insects are underappreciated for their role in the food web. They are the sole food
source for many amphibians, reptiles, birds, and mammals. Seven bugs were recorded during survey.
Chrysocoris sp. also known as Jewel bug was most common insect found during survey especially on
weed Croton sp., which is host plant for this bug.
Table 3-21Dertails of Bugs
Sr. No Scientific name Family
1. Leptocorisa sp. Alydidae
2. Homoeocerus sp. Coreidae
3. Nezara viridula Pentatomidae
4. Riptortus sp Alydidae
5. Cofana sp. Cicadellidae
6. Scutellera sp. Scutelleridae
7. Chrysocoris sp. Scutelleridae
Butterflies:
Ecosystem value. Butterflies and moths are indicators of a healthy environment and healthy ecosystems.
They indicate a wide range of other invertebrates, which comprise over two-thirds of all species. These
collectively provide a wide range of environmental benefits, including pollination and natural pest
control. 21 species of butterflies found during the survey.
Table 3-22 Details of Butterflies
Sr. No Common name Scientific name Family
1. Blue pansy Précis orithyia Nymphalidae
2. Chocolate pancy Junonia iphita Nymphalidae
3. Common crow Euploea core Nymphalidae
4. Common Emigrant Catopsilia crocale Pieridae
5. Common four ring Ypthima huebneri Nymphalidae
6. Common grass yellow Eurema hecade Pieridae
7. Common leopard Phalanta phalantha Nymphalidae
8. Common rose Pachliopta aristolochiae Papilionidae
9. Common sailor Neptis hylas Nymphalidae
10. Common sergeant Athyma perius Nymphalidae
11. Danaid eggfly Hypolimnas misippus Nymphalidae
12. Glassy Tiger Parantica aglea Nymphalidae
13. Grey pancy Junonia atlites Nymphalidae
14. Indian jezebel Delias eucharis Pieridae
15. Orange tip Colotis etrida Pieridae
16. Towny coster Acraea terpsicore Nymphalidae
17. Striped pierrot Tarucus nara Lycaenidae
18. Pea blue Lampides boeticus Lycaenidae
19. Peacock pansy Précis almanac Nymphalidae
20. Plain tiger Danaus chrysippus Danaidae
21. Striped Tiger Danaus genutia Nymphalidae

M/s. Shalini Organics Pvt. Ltd., MIDC Paitha, Dist- Aurangabad. EIA/EMP
Page 155
Pea Blue Striped Perriot
Blue Ground Skimmer Chrysocoris sp.
Figure 3-16 Photographs of Butterflies

M/s. Shalini Organics Pvt. Ltd., MIDC Paitha, Dist- Aurangabad. EIA/EMP
Page 156
Mammals:
Faunal assessment provides a basis for determining relative abundance and rarity of each species which
is important for assessing the diversity of fauna of a area. Since animals are capable of movements from
one place to another, this makes their study entirely different. Different animals prefer different types
of habitat for food and shelter. There was no major physical sighting of large mammals during
biodiversity study other than domestic mammals’ viz., cow, buffalo, cat, stray dogs, goat etc. During
the field studies some tracks and signs Indian Hare (Lepus nigricollis) and domesticated animals were
observed in the study area.
Table 3-23Details of Mammals
Sr. No Common name Scientific name Family
Palm Squirrel Funambulus pennanti Sciuridae
Mongoose Herpestes edwardsii Herpestidae
Indian Hare Lepus nigricollis Leporidae
Common House Rattus rattus Muridae
Avifauna:
As with other native organisms, birds help maintain sustainable population levels of their prey and
predator species and, after death, provide food for scavengers and decomposers. Many birds are
important in plant reproduction through their services as pollinators or seed dispersers. During overall
survey in the study area, a total of 53 bird species belonging to 30 families were recorded in the study
area. The bird species were mostly observed around Jayakwadi dam, agriculture fields and human
habitation.
Table 3-24 Details of Avifauna
Sr. No Common name Scientific name Family
1 Black Kite Elanus caeruleus Accipitridae
2 Marsh Harrier Circus aeruginosus Accipitridae
3 Black winged kite Elanus caeruleus Accipitridae
4 Small blue kingfisher Alcedo athhis Alcedinidae
5 White throated kingfisher Halcyon smyrnensis Alcedinidae
6 Eurasian Teal Anas crecca Anatidae
7 Ruddy Shelduck Tadorna ferruginea Anatidae
8 Cattle egret Bubulcus ibis Ardeidae
9 Grey heron Ardea cinerea Ardeidae
10 Pond heron Ardeola grayii Ardeidae
11 Large Egret Casmoerodius albus Ardeidae
12 Little ringed plover Charadrius dubius Charadiriidae
13 Red wattled lapwing Vanellus indicus Charadriidae
14 Asian openbill Anastomus oscitans Ciconiidae
15 Wooly necked stork Ciconia episcopus Ciconiidae
16 Blue Rock Pigeon Columba livia Columbidae
17 Dove Streptopelia sengalensis Columbidae
18 House Crow Corvus splendens Corvidae
19 Jungle crow Corvus macrorhynchos Corvidae
20 Crow Pheasant Centropus sinensis Cuculidae

M/s. Shalini Organics Pvt. Ltd., MIDC Paitha, Dist- Aurangabad. EIA/EMP
Page 157
21 Indian Cuckoo Cuclus micropterus Cuculidae
22 Koel Eudynamys scolopacae Cuculidae
23 Black drongo Dicrurus macrocercus Dicruridae.
24 Barn swallow Hirundo rustica Hirundinidae
25 Wire tailed swallow Hirundo smithii Hirundinidae
26 Long tailed shrike Lanius schach Laniidae
27 Common tern Sterna hirundo Laridae
28 Green Bee Eater Merops Orientalis Meropidae
29 Citrine wagtail Motacilla citreola Motacillidae
30 White browed wagtail Motacilla maderaspatensis Motacillidae
31 Yellow wagtail Motacilla flava Motacillidae
32 Pied bushchat Saxicola caprata Muscicapidae
33 Purple Sunbrid Nectarinia asiatica Nectariniidae
34 House Sparrow Passer domesticus Passerinae
35 Rose – ringed Parakeet Pesitacula Kramri Pesittacidae
36 Little cormorant Microcarbo niger Phalacrocoracidae
37 Greater Flamingo Phoenicopterus roseus Phoenicopteridae
38 Baya weaver Ploceus philippinus Ploceidae
39 Red – vented Bulbul Pycononotus cafer Pycononotidae
40 Purple swamphen Porphyrio porphyria Rallidae
41 Black winged stilt Himantopus himantopus Recurvirostridae
42 Black tailed Godwit Limosa limosa Scolopacidae
43 Wood Sandpiper Tringa glareola Scolopacidae
44 Brahminy Starling Sturnus Pagodarum Sturnidae
45 Common Myna Acridotheres tristis Sturnidae
46 Black Ibis Pseudibis papillosa Threskiornithidae
47 Glossy ibis Plegadis falcinellus Threskiornithidae
48 Jungle babbler Turdoides striatus Timaliinae
49 Hoopoe Upupa epops Upupidae
Green Bee Eater Purple sunbird

M/s. Shalini Organics Pvt. Ltd., MIDC Paitha, Dist- Aurangabad. EIA/EMP
Page 158
Yellow Wagtail Grey Wagtail
Egret Pond Heron
Eurasian spoonbill Openbilled stork and Cormorant

M/s. Shalini Organics Pvt. Ltd., MIDC Paitha, Dist- Aurangabad. EIA/EMP
Page 159
Glossy Ibis OpenBill Stork and White Ibis
SpotBill Ducks Grey Heron
Eurasian teal Black Winged Stilt
Whiskersed Tern Greater Flamingoes

M/s. Shalini Organics Pvt. Ltd., MIDC Paitha, Dist- Aurangabad. EIA/EMP
Page 160
Figure 3-17 Photographs of Avifauna
3.15. Socioeconomic Study
The socio-economic survey was conducted on January 2021. The objectives of the study were as under.
1. To collect socio-economic and demographic details of study area by adopting the methods of filling
field data Sheet, Survey Format, Participatory Rural Appraisal (PRA) and Rapid Rural Appraisal
(RRA).
2. To identify the impacts of the project on community as a whole.
3. To assess the environmental impact, Socio-economic information, communities livelihood, social
needs, agriculture information, cropping pattern survey and action plan to address the expressed needs
by communities.
• Methodology & Data Collection
Social survey, field data sheet and RRA were conducted on 8th October, 2018 to 10th December, 2018
for 21 villages within 10 km radius of the project. In order to collect the information of the desired
objective it is necessary to collect the authenticate information about the village and personal interaction
with people. Hence, village visits, field data sheet and survey forms, Van Diagram, using RRA, PRA
methods were used to obtain the baseline information of the area. The selected villages within 10 km
radius of the project site have near to similar characteristics. The published information, data collected
through Govt. Offices, Grampanchayat, and Census of India 2011 is used as the basis of the survey.
1] Venn/ Chapati Diagram: This shows relationships of various institutions, organizations, programs
with each other and with the villages as perceived by the villagers. The exercise is carried out with
theuse of different sizes of circles and colors papers which indicate the relative importance or
unimportance of a particular institution to that particular village.
2] Participatory Rural Appraisal (PRA) and Rapid Rural Appraisal (RRA): Social survey and
RRA is the methods to collect the factual information by involving the community. People’s
Participation in the development process has been now recognized as most critical input for any
programme to be successful. People Participation at all the levels of project cycle (i.e. Planning, action
plan, implementation, monitoring and evaluation) develops a sense of ownership among them, which
facilitates their involvement in planning, implementation and Public hearing and even in monitoring.
Participatory Rural Appraisal (PRA) thus, includes participatory approaches and methods
thatemphasize on villagers, farmers making their own appraisal and analysis. The purpose of PRA is to
enable development practitioners, government officials, Gram-panchayats, local farmers, villagers,

M/s. Shalini Organics Pvt. Ltd., MIDC Paitha, Dist- Aurangabad. EIA/EMP
Page 161
women’s to work together to plan appropriate programs in tune with their “felt needs” and aspirations.
Implementation, monitoring and evaluation) develops a sense of ownership among them, which
facilitates their involvement in planning, implementation and Public hearing and even in monitoring.
Participatory Rural Appraisal (PRA) thus, includes participatory approaches and methods that
emphasize on villagers, farmers making their own appraisal and analysis. The purpose of PRA is to
enable development practitioners, government officials, Gram-panchayats, local farmers, villagers,
women’s to work together to plan appropriate programs in tune with their “felt needs” and aspirations.
3] Primary data: Primary data was collected from the villages through Schools, Grampanchayat office,
Anganwadi centers, Talathi Office, villagers, farmers, SHGs, Youths as per the availability.
4] Secondary data: For secondary data Census abstract of 2011, Government of India has been used.
All the basic information as per the field data sheet of population statistics, water resources was
collected from secondary data sources like census 2011.
5] Baseline Socio-economic survey and Sampling: Basic information is required for planning of the
project which depends upon the demographic parameters of the project area population. This includes
total population, their livelihood, and total no. of households, socio-economic information, cropping
pattern, health, sanitation, village level infrastructure, community based organizations etc. Similarly,
and equally important is the data related to the occupational pattern of the population and relative size
of each occupational group.
Table 3-25Villages Identified for Socioeconomic Survey of Study Area
Sr. No. Village Distance from project site in Km
1 Dhorkin 6.2
2 Isarwadi 1.7
3 Mudhalwadi 1.5
4 Narayangaon 1.6
5 Katpur 2.5
6 Pimpalwadi 2.1
7 Wadala 3.5
8 Wawa 4.0
9 Paithan 6.5
10 Amrpur 9.3
11 Borgaon 5.2
12 Dhakephal 9.2
13 Rahatgaon 4.7
14 Kasarpadali 5.8

M/s. Shalini Organics Pvt. Ltd., MIDC Paitha, Dist- Aurangabad. EIA/EMP
Page 162
Profile at a glance: Detailed Socio economic profile of District Aurangabad, Taluka Paithan & Project
site is presented in Table 3.26
Table 3-26Socio economic Profile of District, Taluka& Project site at a Glance
Table 3-27 Details of Socio-economic Indicator

M/s. Shalini Organics Pvt. Ltd., MIDC Paitha, Dist- Aurangabad. EIA/EMP
Page 163
Table 3-28Details on Population of District Aurangabad
The Description Profile of Rural & Urban Area Population of District Aurangabad in study area is
presented in Table 3.28.

M/s. Shalini Organics Pvt. Ltd., MIDC Paitha, Dist- Aurangabad. EIA/EMP
Page 164
Table 3-29Comparison between Rural and Urabn Area
Aurangabad
The Aurangabad city was a major silk and cotton textile production center. A fine blend of silk with
locally grown cotton was developed as Himroo textile. Much of the silk industry has vanished over
time, but some manufacturers have managed to keep the tradition alive. Paithani silk saris are also made
in Aurangabad. The name of this cloth is derived from Paithan town. In 1889 a cotton-spinning and
weaving mill was erected in Aurangabad city, which employed 700 people. With the opening of the
M/s. Shalini Organics Pvt. Ltd., MIDC Paitha, Dist- Aurangabad. EIA/EMP
Page 165
Hyderabad-Godavari Valley Railways in the year 1900 several ginning factories were started. In the
Jalna alone there were 9 cotton-ginning factories and 5 cotton-presses, besides two ginning factories at
Aurangabad and Kannad, and one oil- press at Aurangabad. The total number of people employed in
the cotton-presses and ginning factories in the year 1901 was 1,016. Until 1960,
Aurangabad languished as a city, remaining industrially backward. In 1960, the region of Marathwada
was merged with Maharashtra.
The industrial development of the Marathwada region began, propelled through designated backward
area benefits. Growth began when the Maharashtra Industrial Development Corporation (MIDC) began
acquiring land and setting up industrial estates. Aurangabad is a now classic example of efforts of a
state government towards the balanced industrialization of the state. Major Industrial areas of
Aurangabad are Chikhalthana MIDC, Shendra MIDC, Waluj MIDC, Paithan MIDC and Aurangabad
MIDC.
GDP ($US): 840 million.
Conclusion: Social, cultural and economic aspects in the surrounding region due to proposed project is
expected to contribute towards change in the quality of life of local people. The proposed project will
help in improving socio – economic status of surrounding area as there will be direct employment
generation for 60 people. Preference shall be given to local people at the time of man power recruitment.
Communication with local community will be institutionalized & done on regular basis by the project
authorities.

M/s. Shalini Organics Pvt. Ltd., MIDC Paitha, Dist- Aurangabad. EIA/EMP
Page 166
4. ANTICIPATED ENVIRONMENTAL IMPACTS AND MITIGATION
MEASURES
4.1. Introduction
The chapter aims at controlling pollution at the source level to the extent possible with the available and
affordable technology followed by treatment measures before they are discharged. The proposed project
would create impact on the environment in two distinct phases:
During the construction phase which may be regarded as temporary or short term;
During the operation phase which would have long term effects.
The construction and operational phase of the proposed project comprises various activities each of
which will have an impact on some or other environmental parameters. Various impacts during the
construction and operation phase on the environmental parameters have been studied and mitigation
measures for the same are discussed briefly below and elaborated in the subsequent sections.
Anticipated environmental impacts due to the expansion project/ production has been evaluated for
significance and based on corresponding likely impacts VEC‟s (Valued environmental components)
has been identified and mitigation measures has been incorporated
4.2. Construction Phase
Impact assessment during the construction phase of the project is of importance as the construction
activities lead to adverse effects on the environment on a short term basis. The major activities that are
undertaken during this phase are civil works, mechanical works, machinery works and transportation
works.
During the construction phase, the following activities among many are considered to be important
towards creating environmental impacts:
1. Site preparation (fencing, boundary & clearing of site)
2. Excavation, backfilling and levelling
3. Hauling and dumping of earth materials & construction spoils
4. Foundation works
5. Fabrication erection of Steel structures such as, Tanks, Pipelines and Sheds
6. Construction of internal roads, drains & water supply
7. Painting and finishing
8. Cleaning, landscaping and plantations
4.2.1. Land Environment Impacts
The activities carried out during the construction phase will involve a change in the land use from vacant
industrial land to a built up industrial land, which will pose the following impacts on the land
environment.
1. Compaction of soil and a change in the soil structure due to the use of heavy construction vehicles
and machineries.

M/s. Shalini Organics Pvt. Ltd., MIDC Paitha, Dist- Aurangabad. EIA/EMP
Page 167
2. Removal of soil from the site.
3. Mixing of the topsoil and subsoil.
4. Dispersion of dust.
Mitigation measures
1. Employing techniques such as restricting access during wet conditions, using protective boarding
and low ground pressure machineries to minimize compaction of soil.
2. The removed soil will be properly stored for subsequent reinstatement.
3. Reuse of excess excavated material for road development, green belt development and landscaping.
4. A well designed closed depository for storage of construction materials to prevent land/soil
pollution.
5. Effective stabilization of altered landforms to minimize soil erosion and the potential for water
pollution (e.g. Vegetation).
6. Reuse of construction wastes such as sand, brick, gravel, cement for developing internal road and
project structures.
4.2.2. Air Environment
Impacts
The activities that might lead to a decline in the local air quality due to generation of dust are;
1. Site Preparation-fencing, boundary and clearing of site will cause disturbance to the surroundings.
2. Excavation, backfilling and levelling.
3. Hauling and dumping of earth materials and construction spoils.
4. Foundation works can cause dust generation which will decrease the air quality and it can impact the
labours working.
5. Fabrication, erection of steel structures such as tanks, pipelines and sheds.
6. Construction of internal roads drains and water supply.
7. Cleaning and landscaping.
8. Emission from Construction DG & Construction Equipment’s.
Mitigation measures
1. Barricading the construction area and minimizing exposed areas to reduce dust generation.
2. Areas generating dust during dry weather will be sprayed with water.
3. Conserving the existing vegetation screens to act as a barrier to dust.
4. Appropriate enclosed areas for storage of construction materials.
5. Facilitating the workers with the required personal protective equipment’s.
6. Efficient usage and maintenance of equipment’s/machineries to lower air emissions, noise pollution
and consumption of energy resource.

M/s. Shalini Organics Pvt. Ltd., MIDC Paitha, Dist- Aurangabad. EIA/EMP
Page 168
7. Exhaust vent of DG set will be provided with adequate stack height to ensure quick dispersal of
gaseous emissions.
8. Periodic monitoring and maintenance of transport vehicles to check on the quality of emission to be
within permissible limits and consumption of fuel
9. Regular inspection of construction site to ensure timely removal and disposal of construction debris
to the dumping sites or for recycle/reuse.
4.2.3. Water Environment
Impacts
1. Contamination of watercourses by leakage from fuel and materials storage areas.
2. Oil and suspended solids in run-off from vehicles and access roads.
3. Use of heavy machineries and vehicles causes compaction of topsoil due to which a change in the
surface water drainage pattern may occur.
4. Generation of sewage.
Mitigation measures
1. The water demand during the construction phase will be met from the private water suppliers (or)
existing bore well
2. Impenetrable lining will be provided to storage premises to avoid accidental mixing or fugitive losses.
3. Storehouse will be located at a distance away from the water storage area to prevent accidental release
or spillage.
4. Proper management of rain water run-off during monsoon and creating bunds to utilize the rain water
for construction purpose.
5. An appropriate water management system will be implemented.
Wastewater Management:
Domestic:
Sewage generated from construction activities will be collected in Septic Tank.
4.2.4. Noise Environment
Impacts
1. The major sources of noise generation at the construction site are pneumatic hammers, DG sets,
compressors, concrete mixers, operating machineries, horns & acoustic signals and communication
among workers.
2. Noise nuisance causes discomfort and health related issues in those who work at the site and those
who reside in the neighboring villages.
Mitigation measures
1. Barricading the construction site.
2. The green belt will help in reducing the noise nuisance.
3. Selection of equipment’s of high quality.

M/s. Shalini Organics Pvt. Ltd., MIDC Paitha, Dist- Aurangabad. EIA/EMP
Page 169
4. Proper planning and organizing of construction activities which will help in avoiding loud verbal
exchanges between the intervening parties.
5. Transportation activities will be carried out only during the day and only in case of emergency, the
transportation activities will be permitted in night time
6. The vehicles used for construction activities and transportation of materials will be provided with
the horn of low noise level as recommended by RTO/ concerned authorities.
7. Minimization of operation time of noisy equipment and operation of machineries/equipment that
generate high levels of noise only during day time.
8. Inadequate use of plant and equipment, namely, running on full power when the work does not
necessitate it will be avoided.
9. Personal protective equipment’s, education and public awareness and exposure control through
rotation of work will be provided to the workers engaged in construction activities in the area generating
high levels of noise.
4.2.5. Waste Generation
Sources of waste are construction debris such as bricks, steel scrap, wooden scrap, sand and gravel etc.
Mitigation measures
1. Prior to commencement of construction works, assessment of materials required, location and
planning of available space for its storage will be conducted.
2. Quality control will be implemented to reject defective materials at the time of delivery thus avoiding
later disposal.
3. Stockpiles of sand, gravel, soil will be situated in such a manner that they do not spill or washed onto
the adjacent roads.
4. Materials that come in will be labelled and the date of receiving will be recorded.
5. Preparation of a proper waste management system which includes identification of wastes, collection,
segregation, storage and disposal methods.
6. Recycling and reuse of certain construction debris.
7. Spent oils and other lubricants from equipment will be collected in enclosed containers before
disposing it to approved recyclers.
4.2.6. Ecology
The proposed facility is situated in industrial area; hence no impacts have been expected to arise on the
biological environment. Except for the removal of weeds, the ecological status of the site will be well
maintained by conserving/developing the greenbelt at the site.
4.2.7. Social Environment
The impacts of construction activities are beneficial on the social environment as it contributes to the
economic and social development by providing employment to about 10 workers during the
construction phase and thereby raising the standards of living and quality of life. Procurement of
construction materials locally leads to increase in trading opportunities.

M/s. Shalini Organics Pvt. Ltd., MIDC Paitha, Dist- Aurangabad. EIA/EMP
Page 170
4.3. Operation phase
From an environmental perspective, this phase is of paramount significance due to its potential to invoke
long-term impacts. The adverse effects that are likely to occur during this operational phase. of the
project are: Air Pollution (gaseous emissions), Effluent generation, Noise generation, Solid waste
generation etc.
4.3.1. Land Environment and Location
It is a proposed project hence there will be no change in land use pattern and no impact due to location.
4.3.2. Discharges on Land-Impact
The sewage generated from domestic usage will be treated in sewage treatment plant. The wastewater
treatment system will be maintained with ZLD, hence there will be no discharges on land premises.
Mitigation Measures
1. Periodic maintenance and check of wastewater conveyance pipelines
2. Attempt to restore by replacing a part or putting together the torn or broken parts of the conveyance
pipeline in case of any leakage is detected.
3. Necessary preventive measures for spillage from pipelines, such as surface RCC channels along the
pipelines is adopted.
4. Lining of effluent collection tank/ETP common guard pond.
5. Treated wastewater quality shall be ensured as per standards before using it for various requirements.
6. With regards to ETP-There will be institutional arrangement to check the efficiency of Zero Liquid
Discharge.
4.3.3. Impacts- Soil Contamination-
Potential impacts on land environment are envisaged due to hazardous and non-hazardous wastes
generated due to various operations in the project site. Sludge generated during production process,
chemical waste including toxic waste, burnt fuel waste, oil slurry, Salts from ATFD etc. are the source
of hazardous waste. Sludge from ETP will be generated. Poor management of such materials/wastes
from the operations is a potential risk of soil contamination.
Mitigation Measures-
Good housekeeping and best practices of waste handling shall be adopted to eliminate/minimise the
risks of soil contamination. The wastes generated will be stored in temporary storage facility and
transferred to nearby Treatment, Storage and Disposal Facility (TSDF) and also to the approved vendors
of Maharashtra State Pollution Control Board (MPCB) landfill and Co-processing.
However, waste minimisation techniques will be adopted in order to minimise the generation of wastes.
4.3.4. Air Environment
Base line data reveals that ambient air quality in the study area for the Parameters PM10, PM2.5, SO2,
NO2, CO are well within the permissible Limits as prescribed by the National Ambient Air Quality
Standards (NAAQS) for Industrial Area, Residential, Rural & Other areas.

M/s. Shalini Organics Pvt. Ltd., MIDC Paitha, Dist- Aurangabad. EIA/EMP
Page 171
The major air pollution sources from the industry are DG sets, boilers, reactors and thermic fluid heater.
The DG set and boiler sources are provided with stacks of adequate height so as to disperse the
emanating flue gases containing particulate matters, oxides of sulphur and nitrogen without affecting
the ground level concentrations. Bag filters will be installed for the Boiler. The emissions generated
from the reactors are scrubbed out by wet scrubbers.
Air Modeling-
M/s. Shalini Organics Pvt. Ltd. is a Greenfield project, proposes to set up Manufacturing unit for API
and API Intermediate unit at Plot No. D-10, MIDC Paithan, Taluka: Paithan, Dist. Aurangabad,
Maharashtra, Pin code: 431107. API= 6 Nos., Capacity = 112 MT/Month and API Intermediate = 43
Nos., Capacity =1171 MT/Month, Total Number of Products = 49 Nos. Total Capacity= 1283
MT/Month
The power requirement for proposed project is 300 HP. (Source: - MSEDCL) Boiler 2 T/Hr.; Fuel
Briquette -500 kg/Hr. Proposed Thermopack 1 no 2.0 lac Kcal/hr. and 2 No. of DG Set having capacity
of 250 KVA is sufficient to meet emergency power requirement of the plant.
For Boiler fuel will be used, which will get increased, leads to release of extra pollutants in ambient air.
Considering above it is necessary to provide suitable mitigation measures in proposed setup for
protection of air environment. The objectives for air modeling studies are narrated in below section.
The following objectives were identified for conducting air dispersion modeling studies:
To identify & classifying the sources, contributing in release of criteria air pollutants in the
environment.
To estimate emission rate of identified air pollution causing sources on gram/second basis in violation
phase as well as into proposed operational phase
To identify the sensitive receptors, present within study area of 10 km radius.
To identify the ratio of increase in baseline concentration due to proposed activity.
To identify impacts due to estimated incremental concentration on nearby environment.
To suggest suitable mitigation measures to reduce the impacts of proposed activity on air environment.
Identification of Source
The following sources/activities are identified and considered for performing Air Modeling studies:
Steam Boiler of 2 TPH capacity
Thermic Fluid heater of 2 Lac Kcal/Hr capacity.
Note: Operation of DG set will be limited and subjected to power failure; therefore operation of DG set
is not considered in air modeling studies.
For the quantitative impact analysis on the air quality, air dispersion modeling is performed. The criteria
pollutants like PM10, PM2.5, SO2, NOx & CO generated from operation of above mentioned utilities
were considered for air modeling.
Analysis Method
For the quantitative impact analysis on the air quality due to the proposed activity, air dispersion
modeling is performed. The criteria pollutants like PM10, PM2.5, SO2, NOX & CO generated from
activities mentioned in sec 3.0 were considered for air modeling.

M/s. Shalini Organics Pvt. Ltd., MIDC Paitha, Dist- Aurangabad. EIA/EMP
Page 172
AERMODCloud5 developed by Envitrans and authorized by CPCB is used for air modeling simulation
which is based on the steady state Gaussian plume equation.
Model option used for computation
Point Source Modeling is considered;
Calms processing routine is used by default;
Wind profile exponents is used by default;
Flat and elevated terrain is used for computations;
It is assumed that the pollutants do not undergo any physico-chemical transformation and
that there is no pollutant removal by dry deposition;
Washout by rain is not considered; and
Cartesian co-ordinate system has been used for computations.
Uniform polar receptor grid is used. The grid consists of 180 receptors each assumed to
be at ground level.
Modeling Procedure
The prediction of the Ground Level Concentrations (GLC’s) due to activity has been computed by
AERMODCloud5 as per CPCB guidelines. While performing the model the urban dispersion and
regulatory defaults options were selected as per guidelines on air quality models (PROBES/70/1997-
1998).
Meteorological Data Processing
The surface synoptic meteorological data of project site was collected in month of December 2020 to
February 2021. The meteorological observation station. The quality assurance process was undertaken
as required by the EPA (EPA-454/R-99-005) to identify and fill the missing data for preparation of
hourly surface meteorological data. The surface and profile met data were prepared for use in AERMOD
using the AERMET meteorological data preprocessor of Envitrans. Processing the surface file indicated
more than 90 % data availability. Meteorological inputs required are hourly wind speed and direction,
ambient temperature, pressure, precipitation, cloud cover, stability class and mixing height.
According to Micro Meteorological data received from Laboratory of JV Analytical Services.
Following Wind rose pattern is plotted using AERMET Tool.

M/s. Shalini Organics Pvt. Ltd., MIDC Paitha, Dist- Aurangabad. EIA/EMP
Page 173
Figure 4-1 Wind rose diagram
Interpretation: Above presented Figure no1, reveals that; the majority of wind during month of study
period. At project site were blowing from East to West direction.. It is also been noted that, 23% of total
air is blowing from East to West direction and 19% of total wind is from NEE direction was blowing
with speed range of 2.1-3.8 meters per second.

M/s. Shalini Organics Pvt. Ltd., MIDC Paitha, Dist- Aurangabad. EIA/EMP
Page 174
Model Input data:
Existing Phase
The emission factor is used in the air dispersion modeling for estimating the pollutants from the boiler
& TFH is calculated using the document (EPA) AP-42 Chapter No. 1 External Combustion Sources,
Section 1.8 i.e., Bagasse combustion in sugar mills is utilize to predict the emissions proposed to be
release in air environment due to burning of briquettes. The briquettes will be made up of agricultural
residues like groundnut husk, coffee husk; coir pit etc. The most significant pollutant emitted by
briquettes-fired boilers is particulate matter, caused by the turbulent movement of combustion gases
with respect to the burning briquettes and resultant ash. Emissions of sulfur dioxide (SO2) and nitrogen
oxides (NOx) are lower than conventional fossil fuels due to the characteristically low levels of sulfur
and nitrogen associated with briquettes. The moisture content in briquettes is considered to be around
10%. Emission factor units are lb of pollutant/ton of wet, as-fired briquettes containing approximately
10% moisture, by weight. As per calculation furnished under identification of sources i.e. 4.1.2.1 it is
assumed that 1 lb of briquettes will produce 6 lb of steam, in lieu of any site-specific conversion data.
Therefore, to convert lb/ton to kg/ton, emission factor is multiplied by 0.16. The modeling has been
performed to identify the existing contribution of industry into current baseline scenarios and to identify
proposed GLC concentration in current baseline by increase in fuel combustion rate of industry in its
different units.
Table 4-1Modeling Input data for Steam boiler of 2 TPH capacity
Briquettes fired boiler of 2 TPH capacity
Parameter Unit Stack (Point Source) of 30meter height
attached boiler of 2 TPH capacity
Stack No No. 1
Fuel Briquettes 500 Kg/Hr.
Ht. of stack m 30
Temp. of flue gas oC 180
Vel of flue gas m/sec 6
Dia. Of stack at top m 0.9
APCD attached - Bag Filter
Gas quantity Nm3/hr
Emission Rate of PM 10 g/s 0.03022
Emission Rate of PM 2.5 g/s 0.1866
Emission Rate of SO2 g/s 0.555
Emission Rate of NOx g/s 0.0266
Emission Rate of CO g/s 21.84
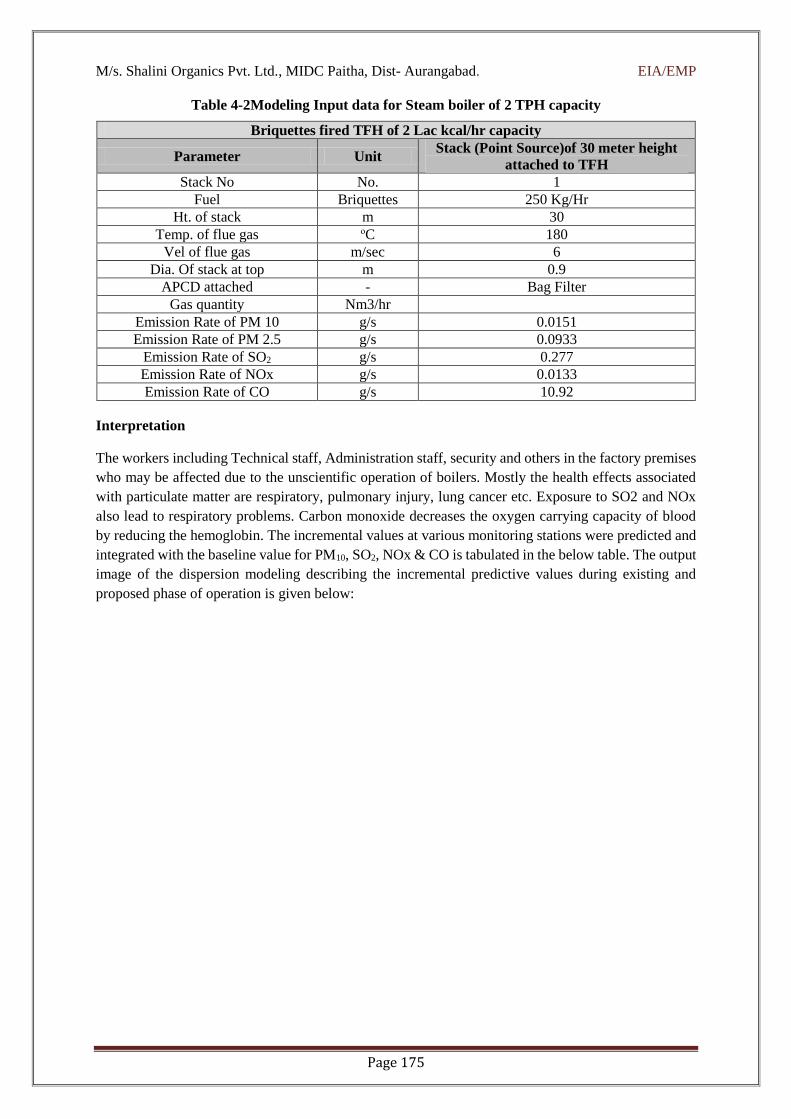
M/s. Shalini Organics Pvt. Ltd., MIDC Paitha, Dist- Aurangabad. EIA/EMP
Page 175
Table 4-2Modeling Input data for Steam boiler of 2 TPH capacity
Briquettes fired TFH of 2 Lac kcal/hr capacity
Parameter Unit Stack (Point Source)of 30 meter height
attached to TFH
Stack No No. 1
Fuel Briquettes 250 Kg/Hr
Ht. of stack m 30
Temp. of flue gas oC 180
Vel of flue gas m/sec 6
Dia. Of stack at top m 0.9
APCD attached - Bag Filter
Gas quantity Nm3/hr
Emission Rate of PM 10 g/s 0.0151
Emission Rate of PM 2.5 g/s 0.0933
Emission Rate of SO2 g/s 0.277
Emission Rate of NOx g/s 0.0133
Emission Rate of CO g/s 10.92
Interpretation
The workers including Technical staff, Administration staff, security and others in the factory premises
who may be affected due to the unscientific operation of boilers. Mostly the health effects associated
with particulate matter are respiratory, pulmonary injury, lung cancer etc. Exposure to SO2 and NOx
also lead to respiratory problems. Carbon monoxide decreases the oxygen carrying capacity of blood
by reducing the hemoglobin. The incremental values at various monitoring stations were predicted and
integrated with the baseline value for PM10, SO2, NOx & CO is tabulated in the below table. The output
image of the dispersion modeling describing the incremental predictive values during existing and
proposed phase of operation is given below:

M/s. Shalini Organics Pvt. Ltd., MIDC Paitha, Dist- Aurangabad. EIA/EMP
Page 176
Figure 4-2 Air Dispersion Modeling Image for PM10 criteria pollutant

M/s. Shalini Organics Pvt. Ltd., MIDC Paitha, Dist- Aurangabad. EIA/EMP
Page 177
Figure 4-3 Air Dispersion Modeling Image for SO2 criteria pollutant
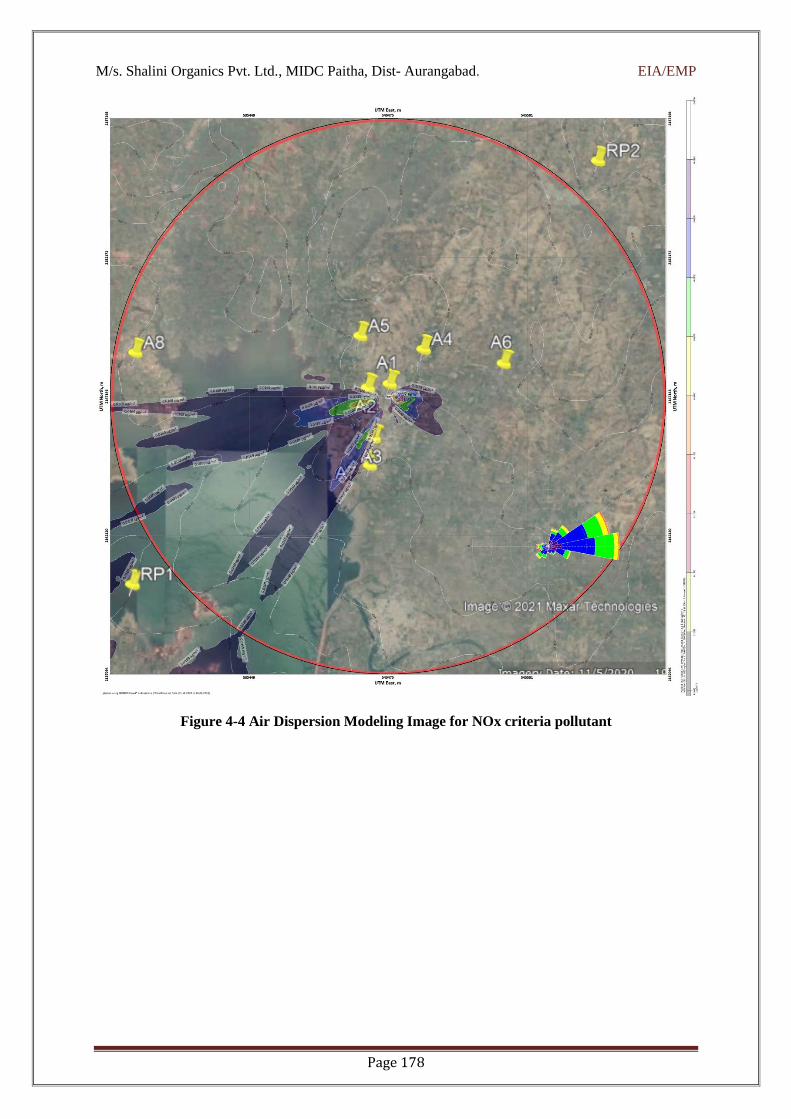
M/s. Shalini Organics Pvt. Ltd., MIDC Paitha, Dist- Aurangabad. EIA/EMP
Page 178
Figure 4-4 Air Dispersion Modeling Image for NOx criteria pollutant

M/s. Shalini Organics Pvt. Ltd., MIDC Paitha, Dist- Aurangabad. EIA/EMP
Page 179
Figure 4-5 Air Dispersion Modeling Image for CO criteria pollutant

M/s. Shalini Organics Pvt. Ltd., MIDC Paitha, Dist- Aurangabad. EIA/EMP
Page 180
Table 4-3Incremental emission load due to current activity, contributing in existing baseline values
Sr. No. Sampling Location Code & Name
PM10 (ug/m3) SO2 (ug/m3) NOx (ug/m3) CO (mg/m3)
BV IV RV BV IV RV BV IV RV BV IV RV
1 A1 41.38 0.0380 41.418 14.42 0.3534 14.7734 20.96 0.0169 20.9769 0.17 0.0427 0.2127
2 A2 44.24 0.077 44.317 15.23 1.41 16.64 23.19 0.0678 23.2578 0.23 0.256 0.486
3 A3 43.65 0.0193 43.6693 15.45 0.3534 15.8034 21.64 0.0169 21.6569 0.22 0.128 0.348
4 A4 53.83 0 53.83 15.7 0 15.7 23.72 0 23.72 0.24 0 0.24
5 A5 43.65 0 43.65 15.63 0 15.63 22.72 0 22.72 0.24 0 0.24
6 A6 43.22 0 43.22 15.87 0 15.87 23.48 0 23.48 0.24 0.085 0.325
7 A7 43.76 0 43.76 15.32 0 15.32 23.63 0 23.63 0.26 0.085 0.345
8 A8 44.01 0 44.01 15.96 0 15.96 23.47 0 23.47 0.25 0.042 0.292
NAAQS Standards 100 (24 hourly) 80 (24 hourly) 80 (24 hourly) 4 (1 hourly)

M/s. Shalini Organics Pvt. Ltd.,MIDC Paitha, Dist- Aurangabad. EIA/EMP
Page 181
The incremental value of the specific pollutant at the particular monitoring station is added to the baseline value
of that specific pollutant measured during the monitoring period of the project. The resultant value thus calculated
used for predicting the impacts of the proposed project on the air environment in the study area. The resultant
value for all the locations are well within the prescribed limit of NAAQS, the air modeling studies are carried out
considering mitigation measures.
Mitigation Measures:
The roads within the premises shall be sprinkled with water at a regular interval to avoid the dust
generation.
To ensure that all transportation vehicles carry a valid PUC (Pollution under Control) Certificate.
Proper servicing & maintenance of vehicles is being carried out.
Adequate green belt covering area greater than 33% of total plot area have been developed in the project
plot as per National Forest Policy. Green belt act as surface for settling of dust particle and thus will
reduce the particulate matter in air.
Ambient air quality shall be regularly monitored to ensure the air pollution devices are working
efficiently.
Periodic burner replacement shall be done to avoid CO generation; while sufficient air shall be provided
for combustion process.
All air pollution control measures like scrubber’s bag filters/Cyclone separator will be provided by the
industry.
Ambient air quality monitoring will be carried out regularly at selected locations in order to check and
compare the predicted concentrations with the measured concentrations.
NAAQS Exceedance if any may be checked thoroughly and adequacy/Performance of Air Pollution
Control measures shall be reviewed.
Water sprinkling shall be carried out on road surfaces in the project area.
Trucks with cargo susceptible for fugitive suspension will be covered with tarpaulin. All the vehicles will
be periodically checked to ensure compliance to the emission standards.
In addition, unit will be with essential pollution control measures as to be stated by CPCB.
VOC Control Measures
Use of double condenser system for reactors/tanks.
Addition of solvents will be carried out by dosing/ metering pumps.
Cooling and chilled water vent condenser traps will be installed on reactor/ storage tanks to control
VOC’s and recycle the trapped solvents back to the process.
Regular monitoring of VOC’s will be carried out to check the functioning of the vent condensers.
4.3.5. Noise Environment
Impact
Noise generation sources during operation phase is classified into two categories:
Stationary sources due to operation of heavy duty machineries at the project site like Boilers,
Thermopack, Compressors, DG sets, Cooling towers, Boiler feed water Pumps etc.
Mobile sources corresponding to mainly vehicular traffic for staff mobilization, materials, material
transportation, liquid fuel transportation to project site, etc.
Vibrations are expected to be generated by various activities associated with the proposed project during
operational phase. The impact of vibrations beyond the site would be negligible during normal operation
phase. However, the impacts on workers engaged in the plant area would be considerable due to
occupational exposure. The proposed fixed major equipment/units such as boiler house, compressors,

M/s. Shalini Organics Pvt. Ltd., MIDC Paitha, Dist- Aurangabad. EIA/EMP
Page 182
pumps, DG sets etc., also generate vibrations during operational phase and may cause exposures to the
workers/operators engaged at these units.
Mitigation Measures
The major noise generating equipment like Compressors, DG sets, Boiler Feed water pumps etc. will be
enclosed in an acoustic enclosure designed for an insertion loss of 25 dB (A) and silencers to other
equipment etc.
Major noise generating equipment will be designed with 85 dB (A) ensuring cumulative noise at 1.0 m
remains at 85 dB (A).
The occupational noise exposure to the workers in the form of eight hourly times weighted average will
be maintained well within the prescribed Occupational Safety and Health Administration (OSHA)
standard limits.
Adequate PPE will be provided to the staff exposing to noise risks.
Acoustic silencers will be provided in equipment wherever necessary.
Acoustic design with sound proof glass paneling will be provided for critical operator cabins control
rooms of individual modules as well as central control facilities.
Use of personal protective equipment’s/devices such as ear-muffs, ear plugs etc. will be strictly enforced
for the workers engaged in high noise areas.
Periodic maintenance of the equipment to be used in the developmental works will be carried out. Worn
out parts will be replaced and rotating parts will be lubricated to minimise noise emissions.
Implementation of greenbelt for noise attenuation will be undertaken: shrub plantation; landscaping with
horticulture; and Tree plantation at vehicle parking areas and along approach roads.
Ambient noise levels will be monitored at regular intervals during operational phase of the project.
Low vibration generating machines/equipment will be selected to meet internationalstandards and
foundations will be so designed to minimise vibrations and secured properly.
Vibration generating sources and their platforms should be maintained properly to minimize vibrations
and related impacts.
Various standards pertaining to vibrations are formulated by statutory bodies like Bureau of Indian
Standards (BIS) and Director General of Mines Safety (DGMS), which is being practiced would be
continued to mitigate the workers’ health effects due to vibrations.
Vibration dampers will be provided around the source of generation.
Transportation Management Plan will be prepared and the transportation of construction materials will
be planned in line with the same.

M/s. Shalini Organics Pvt. Ltd., MIDC Paitha, Dist- Aurangabad. EIA/EMP
Page 183
4.3.6. Vibration
There is no source of vibration which will contribute to significant impacts
Mitigation Measures
By adopting smooth roads and yard for transportation, noise due to transport shall be drastically reduced.
Plantation shall be done along the road so that noise can be reduced.
If required noise barrier shall be installed.
Steam release shall be of small duration of the time
All the machinery including pumps and compressors should be lubricated and well-fixed to minimize
noise.
DG set shall be provided with acoustic enclosure
4.3.7. Water Environment
Impact on water resources
During operation phase, water requirement of proposed units will be mainly for process, cooling water, service
water, domestic use, fire water, green belt etc.
The major use of water is for industrial purposes. Total water consumption: 246.0 CMD. Source of water will be
from MIDC. Effluent generation from the process will be from 145.10 CMD.
Wastewater generated from the project is being treated in ETP followed by MEE and Zero Liquid Discharge
concept will be adopted for proposed project also, hence the impact due to the proposed project is very minimal.
Impacts on water quality
Effluent is generated from manufacturing process, cooling tower & boiler blow down, floor washing, vessel
washing, domestic use etc. Wastewaters from the pharmaceutical industries are characterized to have a high BOD,
COD, TDS & TSS concentrations and extremely variable pH values. If this untreated wastewater discharged
outside without proper treatment than it may affect surface as well as ground water quality.
Mitigation Measures
Effluent treatment plant (ETP) will be proposed to treat the wastewater, from the proposed project. The total
waste water generation of proposed project will be 145.10 CMD. There will be negative impact on water resources
after the implementation of project. To neutralize this impact to some extent, the unit is having rain water
harvesting tank and storm water during the monsoon season.
The sewage will be treated in Sewage Treatment Plant and mitigation measures of water environment are
presented in Table.
Table 4-4 Impacts and Mitigation measure
Sr.
No. Impacting Activity Impact Mitigation measure
i. Construction Phase
1. Use of Fresh Water
Increase in the possibility ofless
water available forcompeting
users.
Use water judiciously. Usetreated
effluent from proposedETP.
2. Domestic effluentdisposal Possibility of contaminationof
the surrounding waterbodies
Domestic effluent disposedinto
septic tank & soak pit

M/s. Shalini Organics Pvt. Ltd., MIDC Paitha, Dist- Aurangabad. EIA/EMP
Page 184
due to discharge of domestic
effluent
ii. Operational Phase
1 Use of Fresh Water
Increase in the possibility ofless
water available forcompeting
users.
Minimize the waterconsumption
by recycle &reuse.Firm allocation
of water forindustrial use.
2. Disposal of treatedwaste
water.
Increase in the possibility
ofdeterioration of the water
quality surrounding waterbodies
due to discharge of waste water.
Treated waste water is reused in
process or used for gardening.No
discharge to water bodies or
outside factory premises
3.
Generation of wastewater
frommanufacturing
process,domestic
use,washings, blow downetc.
Increase in the possibility
ofdeterioration of the water
quality surrounding waterbodies
due to discharge of waste water.
Full fledge state of arttreatment
facility based onwaste
characteristics shall be Provided.
4.3.8. Land Use/Land Cover
Proposed Projects site falls in MIDC area which land is specially allotted for industrial development so the land
use and land cover changes are inevitable hence there will be no impact on Land Use/ Land Cover.
4.3.9. Geology
Proposed Projects falls in already developed MIDC area so there will be no impact on geology is envisaged from
the proposed project.
4.3.10. Solid/Hazardous Wastes
Impact
Generation of Solid/Hazardous waste due to various industrial activities may contaminate soil fertility.
Improper handling and disposal of used oil, discarded containers; incineration ash, process waste/MEE
salt, spent catalyst, STP sludge, ETP waste and fly ash may lead to occupational hazard.
Mitigation Measures
Hazardous waste generated from the site will be send to CHWSTDF
Fly ash will be sent to brick manufacturer.
Discarded containers will be sold off to authorized MPCB approved scrap dealers.
Used oil will be sold to authorized recyclers
Solid/ Hazardous waste will be collected, stored, transported and disposed as per the Hazardous Waste
(Management, Handling and Transboundary)
4.3.11. Risk and Occupational Hazards
Impacts on Occupational Health, Community Health and Safety are listed as below:
The processes for the present range of products involve reactions, which are slightly exothermic and with
medium temp and atmospheric pressure conditions and separation of Class A solvents by distillation. For
these processes HAZOP study will be carried out and all the recommendations for safe operation with
respect to instrumentation, and operating procedures will be done.
Possible accidents hazard due to reactions at high pressure.
Fire Hazard due to storage of solvents in underground tanks
Fire Hazards due to spillage, which may lead to fire and spreading the fire to other solvents stored in
other drums and can lead to serious fire and explosion.
Hazards due to handling of chemicals.
Health hazards for workers due to exposure of various chemicals

M/s. Shalini Organics Pvt. Ltd., MIDC Paitha, Dist- Aurangabad. EIA/EMP
Page 185
Mitigation Measures
It is strongly recommended to take all the preventive measures to minimize the probability of the accident
to the minimum and make the process and reactor operation as intrinsically safe as possible. Because
prediction of realistic estimation of the extent of damage and damage control after the accident is
extremely difficult in case of reactor accident.
For the reactions carried out at more than atmospheric pressures following mitigation measures will be
adopted;
Reactor will be designed at pressure which will be double than operating pressure.
It is necessary to have Pressure control loop.
Rupture Disc and safety relief valve will be installed on the reactor to control excess pressure.
It is advisable to install reactor in a separate location, away from the main plant covered on three sides
with pressure resistant walls and open roof.
All operations should be PLC based controlled from the control room, located at a safe distance.
Major hazard for underground storage tanks is fire due to
1) Leakage or failure of unloading hoses
2) Due to improper earthing of tanks and tanker from which solvent is being unloaded.
The other hazard is soil pollution due leakage of underground tanks due to improper maintenance, use of
improper anti corrosive paint, failure to conduct regular pressure testing and thickness testing.
Storage of Class A solvents must have license issued by the CCE as per the rules, all the conditions
specified there in have to be fulfilled. Fire5fighting around the storage of Class A solvents is
recommended.
Good Ventilation in the storage area. No ignition source. To be stored in good containers. No spillage.
Control of spillage. Adequate separation from each other and other storage areas and process areas.
Storage of Acids in drums/carboys.
Full fledge arrangements for fire detection and control.
Provision of in house ambulance for emergencies.
Implementation of onsite and offsite disaster management plan.
Provision of fire extinguishers and fire hydrant system.
Regular health checks up of workers.
Regular training for first aid & fire control, establishing OHC.
MSDS of all hazardous chemicals will be available at office and with responsible person.
Antidotes for all chemicals being used as per MSDS will be available at the site.
Any leakage /spillage of liquid chemical shall be immediately attended.
Instructions of emergency/disaster will be displayed.
Work area will be monitored to maintain work environment free from any dust/chemicals5fumes/vapors
and to keep well within below permissible limit.
Provisions of immediate accident/incident reporting and investigation.
Safety Posters and slogans will be exhibited at conspicuous places.
Availability of Self Breathing Apparatus at site.
Requisite personnel protective equipment shall be provided. Instruction/Notice to wear the same will be
displayed. Further, it will be insisted to use the same while at work.
Safety Committee will be constituted and safety, health and environmental matters/issue will be discussed
in the meeting and enlighten the participants in these respect.
M/s. Shalini Organics Pvt. Ltd., MIDC Paitha, Dist- Aurangabad. EIA/EMP
Page 186
4.3.12. Ecological Biodiversity
Impacts on Ecology and Biodiversity
The proposed project site is well within the premises of Paithan MIDC. The construction work to be done for the
proposed project will have minor impact on biological environment;
During construction phase, anthropogenic activity and noise generated by different machinery may lead
to temporary shifting of sensitive species of reptiles [Krait, Common Rat Snake, small mammals (Indian
Hare) and birds [Common Birds like Barn swallow, Baya weaver, Black drongo, Common Myna, Small
Bee eater etc.] to the surrounding similar habitat.
During operation phase, emission of gaseous pollutants will occur from the industry, which will impact
human health as well as biodiversity of the surrounding area.
Ecologically Important site i.e. Jayakwadi Bird sanctuary are within 1.8 km of the project area.
Mitigation Measures
There will not be adverse impact due to the proposed project on the environment specially on the bird
sanctuary as the major land use in between the bird sanctuary and MIDC area are agriculture fields and
human habitation which forms a buffer zone for the avifauna population in the bird sanctuary.
During the construction, the fencing barricading will be created which prevents the dust spread and sound
created by machinery, vehicles etc.
It has been reported that gaseous pollutants are absorbed by the leaves, while the particulate forms are
absorbed through the outer surface of the plants having thick canopy. (Prajapati & Tripathi, 2008). Plant
species, particularly trees and shrubs, are important sinks for trapping and absorbing many gases,
particulates, aerosols and airborne pollutants (Gajghate and Hassan 1999). To reduce the impact of
gaseous pollutants in the surrounding area thick plantation will be proposed in the company premises and
open areas outside the plant boundary.
During construction and operation phase proper green belt should be developed to minimize air pollution,
due to gaseous pollutants, vehicular pollution & dust to attract different faunal groups and maintain the
biodiversity.
Some of the points to create high quality habitat for avifauna in sanctuary area are as following;
Manage water level throughout the year, hydrology which is a primary driver of wetland characteristics.
Provide floating and submerged grasses in the edges of the wetland.
Do not plant huge trees on the edges of the wetland.
Provide a buffer of upland vegetation of 100 feet or more around the wetland to protect it from sediment
and chemical runoff, and other degradation.
Plant buffers to dense grass. If, necessary shrubs or trees can also be maintained within the grasses.
Maintain this buffer along streams, rivers and on lake front properties as well. The process will help in
maintaining a healthy fringe of the wetland vegetation at the edge of lakes and streams.
Leave naturally dying and decaying trees standing in swamps because they provide insects for
woodpeckers and homes for cavity dwellers.
Invasive species tend to eliminate native species and also reduce plant diversity so it can be eradicated.
Provide the verities of vegetation cover with different strata.
Specifically, designed nest site materials placed in the wetland and the area shall be free from human
encouragement.
Periodic removal of weeds to improve the ecosystem healthy.
Watch towers away from the nesting sites but good visibility sites.
Traditional vegetation management techniques can be used such as grass cutting in seasonal manner but
in a controlled (based on the local situation).

M/s. Shalini Organics Pvt. Ltd., MIDC Paitha, Dist- Aurangabad. EIA/EMP
Page 187
Provide mosaic flooded and unfolded grassland on the edges which attract diverse group of birds.
Vegetation cover in the water area should not exceed one third of the total area.
Table 4-5 Impact and mitigation measures
Sr. No Impacting Activity Impact Mitigation Measure
1. Preparation of site
Clearance of shrubs at site/
Removal of top soil and
vegetation
Possibility of loss of
local floral and faunal
species & top soil.
Use top soil for green belt
development Green belt
development may retain the
local plant species.
2. Construction Phase
2.1. Noise generation due to
movement of heavy vehicles
Possibility of disturbance
to faunal species.
Green belt development may
retain the local faunal species.
3. Operational Phase
3.1. Gaseous emission from boiler,
Thermopack & DG set
Increase in gaseous
emission, it may affect
surrounding vegetation
& faunal species
Appropriate stack height shall
be provided with APC.
3.2. Discharge of effluent
/ sewage waste water
Improper discharge of
waste water & sewage
water, may effect on
aquatic life of
surrounding water
bodies.
ETP will be installed for the
treatment of waste water.
Treated water will be reused
for gardening.
3.3. Green belt development -- Green belt development may
retain the local plant species
4.3.13. Traffic Study
Proposed Traffic study
In MIDC area, 20 feet wide tar road is already constructed. For the proposed project 3 to 4 heavy vehicles will be
required for transportation of raw material & finished products. The total number of vehicles visiting site on daily
basis on under
Two Wheeler-25 Nos
Four Wheeler- 10 Nos
Heavy Vehicles- 04 Nos.
Transportation Risk
Industry is located in the Notified Industrial area and Aurangabad Paithan Highway is near from the project site.
The traffic density of the nearest highway is high mainly commercial and passenger vehicle traffic. Raw materials
and finished products will be transported by road. The traffic generated due to the proposed project will be 2 to 3
nos. of vehicles per day. The impact will be negligible.

M/s. Shalini Organics Pvt. Ltd., MIDC Paitha, Dist- Aurangabad. EIA/EMP
Page 188
Table 4-6Impact and Mitigation Measure for Transportation
Sr. No. Impacting Activity Mitigation Measure
1. Risk during transportation of hazardous
chemicals and finished products
(Proper safety precautions will
be taken)
4.3.14. Odor Management
Odor can be defined as the “perception of smell” or in scientific terms as “a sensation resulting from the
reception of stimulus by the olfactory sensory system”. Whether pleasant or unpleasant, odor is induced by
inhaling air borne volatile organics or inorganic.
Sources of odor
Manufacturing process
1) Effluent Treatment Plant
2) Volatile Organic Compound’s (VOC’s)
Control measure
Appropriate stack height shall be provided for release of gases.
For the removal of odor, from odor emitting gases scrubber shall be installed.
Proper Ventilation system shall be provided to reduce the odor problem._
To reduce the odor from treated waste water, activated carbon filter shall be installed._
Reduction of odor at generation source, by storing volatile material in closed containers to prevent
volatile emission and carrying out chemical reactions in closed chambers._
Green Belt development can help to minimize the odor.
4.3.15. Socio- Economic
i. Vehicle Movement and utilities operation
Positive impact on employment generation for the plant operation, housekeeping, Gardner, drivers, security
staff, EHS, account and admin staff.
Mitigation Measure-
First preference will be given to local population of surrounding villages for employment
ii. Manufacturing process
Flue gas and process emission will have negative effect on health of surrounding village population.
Generation of high noise from industrial activities may disturb the routine of peoples living in
surrounding area
Mitigation Measure-
APC‟s has been provided for controlling the process emission with adequate stack height.
Padding and enclosing has been provided at noise generating machineries and area, same will be done
for proposed machineries and area
iii. Sewage and Effluent generation and treatment
Contagious and viral disease effect on surrounding village population due to disposal of untreated
sewage.
Chronic effect on the health of the surrounding village population due to the disposal of untreated treated
effluent

M/s. Shalini Organics Pvt. Ltd., MIDC Paitha, Dist- Aurangabad. EIA/EMP
Page 189
Mitigation Measure-
Generated sewage will be treated send to septic tank and generated effluent will be treated in effluent treatment
plant followed and MEE. ZLD will be achieved.
Conclusion –
Impacts on land environment, air environment, water environment, noise environment, biological
environment, socioeconomic environment and risk and hazard has been identified and mitigation
measures for the same for both construction and operation phase are incorporated.
Impact identification with and without mitigation measures has also been carried out and briefed in the
chapter.
Air modelling study has been carried out to find maximum and minimum GLC in the surrounding areas.
From the overall study and evaluation of impacts, it can be concluded that the overall negative
Impacts from various activities on different environmental parameters are negligible with proper EMP in
place.

M/s. Shalini Organics Pvt. Ltd., MIDC Paitha, Dist- Aurangabad. EIA/EMP
Page 190
5. ANALYSIS OF ALTERNATIVES (TECHNOLOGY & SITE)
5.1. Analysis to alternative-
The analysis of alternative technology and site is an important tool for the selecting the best technology and
project location.
Alternative analysis is the process of analyzing the proposed locating for suitability for basic necessities to operate
the plant safely, this analysis also covers the environmental aspect of pollution prevention and improvement in
quality of life nearby the project vicinity.
The project alternatives (Technology & Site) are the course of action in pace of another, that would meet the same
purpose and need, but which would avoid or minimize negative impacts and enhance project benefits.
Such projects may result in specific impacts which can be avoided or mitigated by adherence to certain
predetermined performance standards, guidelines or design criteria. Alternative approaches may therefore be
more effective in integrating environmental and social concerns into the project planning process.
5.2. Site Alternative
M/s. Shalini Organics Pvt. Ltd., is a green field project proposed to setup API and API Intermediate products
manufacturing unit at Plot No. D-10, MIDC Paithan, Tal. Paithan, Dist. Aurangabad., Maharashtra. Total
production capacity of the plant will be API= 6 Nos., Capacity = 112 MT/Month andAPI Intermediate = 43
Nos., Capacity =1171 MT/Month, Total Number of Products = 49 Nos. Total Capacity= 1283 MT/Month.
The area of the plot (20,000 m2) is sufficient for proposed activities to be carried out. Required facilities like
infrastructure, communication, medical facilities, fuel, water, power, unskilled & skilled manpower, raw
materials, road network etc. are readily available, too. There is no Rehabilitation and Resettlement involved.
Nearest city is Aurangabad which is about 36.97 km, nearest railway station is Aurangabad Railway station which
is about 35.46 Km, Nearest Airport is Aurangabad which is around 36 Km from the proposed project site. site is
having connectivity with other parts of the country by road, rail & air. Therefore, no other site or area was
considered.

M/s. Shalini Organics Pvt. Ltd., MIDC Paitha, Dist- Aurangabad. EIA/EMP
Page 191
5.3. Process Alternative
Production Technology M/s. Shalini Organics Pvt. Ltd. will have an experienced team of scientists who are
engaged in, Manufacturing of API and API Intermediate. Proposed technology of production is result of R&D
and no alteration is currently with the proponent. Wastewater Treatment Technology
Effluent is categorized as LCOD and HCOD based on COD value in terms of mg/Lit
Value more than 5000 mg/Lit is considered as LCOD and above as HCOD.
The corresponding streams of effluent are segregated and then sent for treatment to respective unit.
HCOD/ HTDS IS Treated in evaporation system. The unit has 3 no different units combined together.
Stripper column, MEE and ATFD. Condensate is pumped to RO with appropriate Capacity of RO or sent
to ETP biological treatment along with LCOD/LTDS effluent. [ If COD /TDS within limit].
LCOD/LTDS is treated in ETP for biological treatment. Pretreated effluent shall be stored in a holding
tank and then pumped to RO for further treatment
Description of Treatment
The total water requirement 246 KL. Waste water generated from plant premises will be 145 KL Out of this 115
KLD will be high COD. [Manufacturing Process] and 21 KLD Will be from washings, laboratory usage, floor
cleaning, equipment cleaning, product washing and utensils washings. Boiler / cooling tower blow down etc. 9
KLD from domestic over flow from septic tank. [Treated separately in STP as outlined below]
This waste water shall be pumped into above ground level tank for storage and neutralization of HCOD. LCOD
effluent then routed to Zero liquid discharge facility in plant premises. All treatment tanks will be constructed
and installed above ground level with proof lining.
HTDS/ HCOD will be sent to MEE system with stripper column followed by ATFD
Agitated thin film dryer. The condensate from MEE/ATFD and LTDS/ LCOD effluents willbe sentto either
Biological ETP or recycled to MEE/ATFD. After pretreatment the effluent will be sent to RO system Permeate
from RO system 70-75% shallbe recycled and Reject shall be back to MEE system or can be transferred to ETP
biological treatment. Salts collected from ATFD system will be collected and sent to CHWTSDF for safe disposal.
Air Pollution Control Technology
Flue gas emission is due to the combustion of fuel briquette in boiler, Thermic Fluid Heater. Cyclone dust
collector & bag filter will be installed as APCM for each flue gas emission source. Process gas emission will be
from the stack attached to process reactors The gases will be scrubbed in two stage scrubber, water followed by
caustic solution. Thus proven, most feasible and best available technology will be used for Air Pollution Control
and no other alternatives are currently with the proponent.

M/s. Shalini Organics Pvt. Ltd., MIDC Paitha, Dist- Aurangabad. EIA/EMP
Page 192
6. ENVIRONMENTAL MONITORING REPORT
6.1. Prelude
Environment monitoring is the sampling and analysis tool to know the environment conditions at particular time.
The record of environmental monitoring is most important as the environmental changes are slow in nature and
impact appears after many years. Environmental Monitoring is the technical heart of assessment of environmental
and social impacts arising due to implementation of the proposed project. An equally essential element of this
process is to develop measures to eliminate, offset or reduce impacts to acceptable levels during implementation
and operation of projects. The integration of such measures into project implementation and operation is
supported by clearly defining the environmental requirements within an Environmental Management Plan.
M/s. Shalini Organics Pvt. Ltd. Total production capacity of the plant will be API= 6 Nos., Capacity = 112
MT/Month and API Intermediate = 43 Nos., Capacity =1171MT/Month Total Capacity= 1283 MT/Month. The
environmental monitoring programme is developed as below.
6.2. Environmental Monitoring Programme
The periodical monitoring of Environmental parameters like air, water, noise, soil and performance of pollution
control facilities and safety measures in the plant are vital for proper environmental management of any industrial
project. Therefore, the company shall create environmentalmonitoring facilities by the environmental and safety
department to monitor air and water pollutants as per the guideline of MPCB & CPCB. Moreover, air and water
quality shall be monitored by outside agencies authorized by MPCB at regular frequencies. This department shall
also carry out periodical check-up of fire and safety equipment’s.
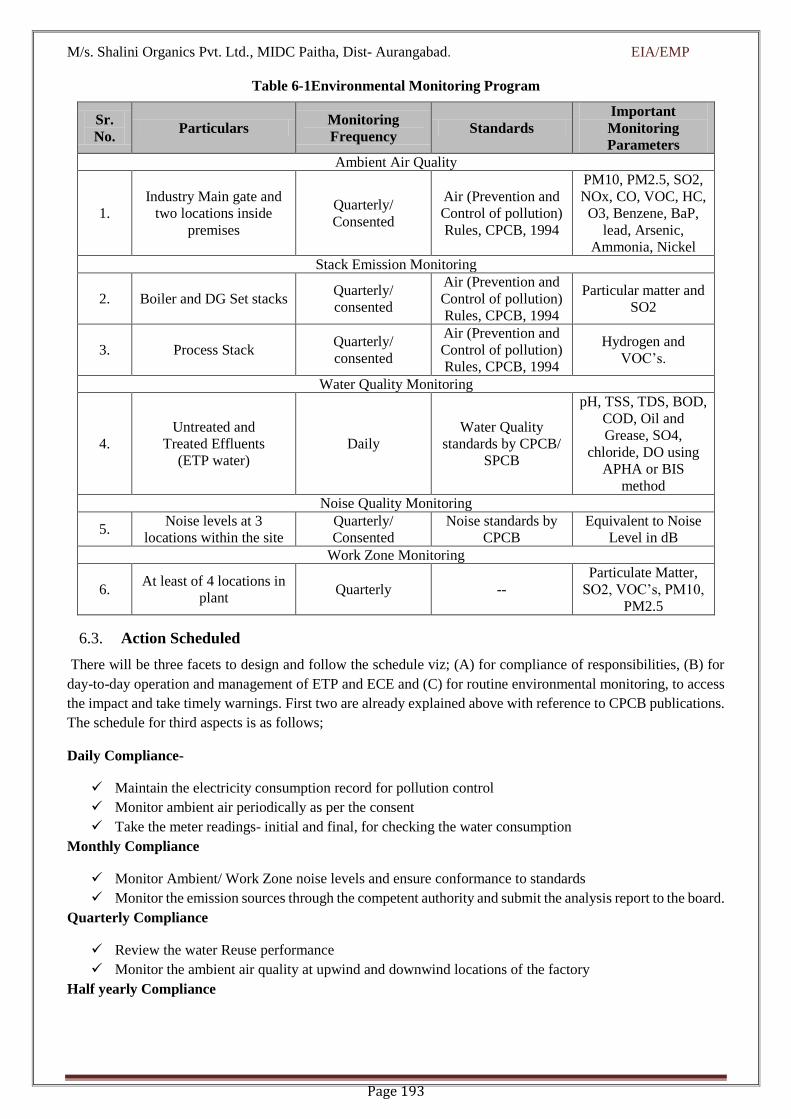
M/s. Shalini Organics Pvt. Ltd., MIDC Paitha, Dist- Aurangabad. EIA/EMP
Page 193
Table 6-1Environmental Monitoring Program
Sr.
No. Particulars
Monitoring
Frequency Standards
Important
Monitoring
Parameters
Ambient Air Quality
1.
Industry Main gate and
two locations inside
premises
Quarterly/
Consented
Air (Prevention and
Control of pollution)
Rules, CPCB, 1994
PM10, PM2.5, SO2,
NOx, CO, VOC, HC,
O3, Benzene, BaP,
lead, Arsenic,
Ammonia, Nickel
Stack Emission Monitoring
2. Boiler and DG Set stacks Quarterly/
consented
Air (Prevention and
Control of pollution)
Rules, CPCB, 1994
Particular matter and
SO2
3. Process Stack Quarterly/
consented
Air (Prevention and
Control of pollution)
Rules, CPCB, 1994
Hydrogen and
VOC’s.
Water Quality Monitoring
4.
Untreated and
Treated Effluents
(ETP water)
Daily
Water Quality
standards by CPCB/
SPCB
pH, TSS, TDS, BOD,
COD, Oil and
Grease, SO4,
chloride, DO using
APHA or BIS
method
Noise Quality Monitoring
5. Noise levels at 3
locations within the site
Quarterly/
Consented
Noise standards by
CPCB
Equivalent to Noise
Level in dB
Work Zone Monitoring
6. At least of 4 locations in
plant Quarterly --
Particulate Matter,
SO2, VOC’s, PM10,
PM2.5
6.3. Action Scheduled
There will be three facets to design and follow the schedule viz; (A) for compliance of responsibilities, (B) for
day-to-day operation and management of ETP and ECE and (C) for routine environmental monitoring, to access
the impact and take timely warnings. First two are already explained above with reference to CPCB publications.
The schedule for third aspects is as follows;
Daily Compliance-
Maintain the electricity consumption record for pollution control
Monitor ambient air periodically as per the consent
Take the meter readings- initial and final, for checking the water consumption
Monthly Compliance
Monitor Ambient/ Work Zone noise levels and ensure conformance to standards
Monitor the emission sources through the competent authority and submit the analysis report to the board.
Quarterly Compliance
Review the water Reuse performance
Monitor the ambient air quality at upwind and downwind locations of the factory
Half yearly Compliance

M/s. Shalini Organics Pvt. Ltd., MIDC Paitha, Dist- Aurangabad. EIA/EMP
Page 194
Submit the half yearly EC and Consent compliances report
Yearly Compliance
Carry out environmental Audit Statement of various environmental aspects reviews the environmental
policies with the help of experts and makes the up gradiation/ changes accordingly
Submit the Environmental statement to the State Pollution Control Board in Form-V under Rule 14 of
Environment (Protection) Second amendment Rules 1992 of the Environment (Protection) Act 1986.
Obtained Consent to Operate and Renewal time to time under the water and Air Acts.
File hazardous waste returns
Renew the Hazardous waste Authorization under sub-rule 3 of the hazardous waste (Management and
handling) Rules, 1989
Reporting accidents, if any
6.4. Success Indicator
The success of the honest and sincere efforts the PP is putting in and it will be judged by various indicators which
are as follows;
There will be no complaints from the villagers
There will be no compliant of the costumers regarding quality of product and delivery schedule
No complaints from Government, semi- Government or Non-Governmental organizations
Statistics of Health, Safety and Environment will be maintained without blemish
Other industries will come to seek our advice
6.5. Environmental Monitoring Hierarchy
M/s. Shalini Organics Pvt. Ltd., is aware that environmental monitoring is not a job, which can be handled without
careful planning. A structure of this plan and hierarchy of process flow for environment management is prepared
and enclosed as logics, which is self – explanatory.
The ultimate aim is that, the proponent and public make a combine effort in the same directions of sustainable
development.
6.6. Conclusion
It is proposed to frame an environmental Monitoring programme both in construction and operational phases to
monitor the effectiveness of the mitigation measures by judging the impact of environment.
A separate budget is proposed for the same as also a dedicated cell. A transport approach will be kept with
documentation and reporting will be statistical treatment to the data. Checklist of the statutory compliance will
be maintained and complied it time to time.
M/s. Shalini Organics Pvt. Ltd., MIDC Paitha, Dist- Aurangabad. EIA/EMP
Page 195
7. ADDITIONAL STUDIES
In this project public consultation is not applicable, as project is in MIDC. Additional studies like review of social
impact and public consultation were undertaken. Apart from the public consultation, major portion is dedicated
to the study of hazard identification and risk assessment. It also covers the requirement for onsite and offsite
disaster (natural and manmade) preparedness plan including emergency management plan.
Social Impact Assessment Studies (SIA)
Rehabilitation and Resettlement (R & R) and Social Impact Assessment (SIA) studies have not found any
relevance for the proposed project site as there would not be any temporary or permanent displacement of the
personnel or goods as the proposed project will be located in MIDC, Paithan. Hence, no R & R and SIA studies
or plan were undertaken for the particular site. The nearest residential settlement is at Yashwant Nagar- 0.84 km
(NE), Mudhalwadi- 1.40 km (S), Paithan- 7.72 km (SE), Dhangaon-3.95 km (NW) from the site. Proposed project
activity will not cause any negative impacts on the environment and on the society as it will increase the direct
and indirect job opportunities along with indirect work to the local people residing in the area. There will be some
development of secondary service market near the site which will be beneficial to the local economy.
7.1. Introduction -
M/s Shalini Organics Pvt. Ltd is Green Field project. The project will be executed at Paithan MIDC Plot No. D-
10, Taluka Paithan Dist. Aurangabad, Maharashtra. As the proposed project comes under the schedule (f) -
Synthetic Organic Chemicals industry (EIA Notification dated 14th September 2006) Company is classified as
small-Scale Industry under Red Category by Maharashtra Pollution Control Board.
Due to change in economic scenario, it is time to change as per market requirements and bring out the products
which gives optimum results for company as well as society. Now a day’s, rate of human health diseases is
increasing rapidly. Medical treatment with the help of drugs/medicines is a common practice in which
medicines/drugs play an important role in recovering the health & control the diseases. Pharmaceutical industries
require raw materials in the form of synthetic chemicals, bulk drugs and intermediates to prepare final products
as medicine. Bulk drug intermediates are the active raw materials used in drug that are useful as therapeutic
agents. Therefore, proposed manufacturing of various API and Intermediates has a vital importance. The raw
materials required for proposed activity will be procured from local market.
7.2. Objectives and Scope of work
The purpose of carrying out the Risk Analysis is to analyze the hazards & Risks, nature & impact of hazards due
to handling & storage of hazardous products. The analysis aims at quantitative evaluation of the risk involved due
to location & operation of the Plant and also to ascertain that the risk is within its acceptable limits or not. The
finding results into recommendations for minimization of the existing levels of risk.
All the important aspects of the Manufacture, Storage & Import of Hazardous Chemicals Rules, 2000 and relevant
Guidelines would be used as directives in conducting the Risk analysis.

M/s. Shalini Organics Pvt. Ltd., MIDC Paitha, Dist- Aurangabad. EIA/EMP
Page 196
Scope of work
(A) Hazard Identification:
1. Study of Proposed Plant Operations and Engineering information, Piping and Instrumentation diagrams
(P&ID), plot and layout plans.
2. Identification of fire, explosion & other health hazards
3. Analysis of inventories in process & storage units with recourse to Manufacture, Storage & Import of
Hazardous Chemical Rules, 2000 and Fire-Explosion & Toxicity Index (FE& TI)
4. Identification of accident sequences and consequences with recourse to Event Tree Analysis (ETA) and to
evaluate propensity of occurrence of the top event through Fault Tree Analysis (FTA)
5. Past accident data/information analysis in similar installations to develop the credibility of worst come worst
accident scenarios.
6. Application of Safety Review Check List
7. Visualization of Maximum Credible Accident (MCA) scenarios.
(B) Analysis of MCA Scenarios:
1. Analysis of identified MCA scenarios and quantification of primary effects and to evaluate the domino effects
with recourse to computerized mathematical models pertaining to cases of:
Solvent outflow and its release
Spilled Product fire, Jet fire & Pool fire
Explosion (Unconfined Vapor Cloud Explosion) in case of Solvents
2. Application of damage criteria for heat radiation & pressure wave levels with recourse to health criteria, dose-
response relations and vulnerability models.
(C) Consequence Analysis:
1. Study of on-site and off-site population and nearby land usage characteristics.
2. Characterization of risk/Hazard levels through study of nature of exposure, pathway & consequences of MCA
scenarios and presentation of results.
(D) Recommendations based on:
1. Observations on the operational practices & Installation hardware
2. Findings of the Risk Analysis & safety review Check-list
3. Firefighting & other emergency facilities available
4. Manufacture, Storage & Import of Hazardous Chemicals Rules, 2000
Raw materials will be received in drums, carboys as well as through tankers and stored in covered shed. Raw
materials are indigenously available and will be transported by road; and in case of unavailability, will be
exported. The raw materials will be stored/register will be maintained as per market requirement of the products
and production schedule. The list of raw material of each product is given below.
To analyze Maximum Credible Accident (MCA) Scenarios, maximum inventory of raw material is in Plant. Tank
wise storage capacity of all raw materials is shown in Table 1.

M/s. Shalini Organics Pvt. Ltd., MIDC Paitha, Dist- Aurangabad. EIA/EMP
Page 197
7.2.1. Details of source of water, fire water tanks and fire Fighting equipments (f/e’s, fier hydrants,
nozzles & monitors)
Firefighting equipment suitable for emergency will be maintained well in each section in the plant. This would
be developed according to the statutory requirements. However, fire hydrant line covering major areas will be
laid. Fire alarms will be located in the bulk storage areas. 1 Nos. of fire hydrant pump 42.40 M3/hr capacity is
installed for fire fighting purpose.
7.2.2. Availability of fire extinguishers at strategic locations and accessories and medical facilities
Fire extinguishers available at various strategic locations as per requirement, the total number of employees in
M/s Shalini Organics would be around 30 Nos. The workers will be examined by certified surgeon within 14 days
of their first employment and thereafter shall be examined by certify surgeon at intervals of not more than three
months. Also one qualified person on First Aid measures will be on duty. First aid box will be provided in every
department of the company. First aid boxes will be located as per requirement. Minimum one first aid trained
person available in all shift. Necessary specific medicines for emergency treatment of burns patients and for those
affected by toxicity would be maintained. Breathing apparatus and other emergency medical equipment would
be provided and maintained in the OHC.
Private medical practitioners & government hospital would be approached in case of emergency & short supply
in the plant. Names of medical personnel and medical facilities in the surrounding area would be prepared and
updated which can be identified in the security office and emergency control centre. The help of nearby industrial
managements would be taken under mutual aid response group agreement if required.
7.3. Hazard identification and visualization of mca scenarios
"Hazard" is a characteristic of a system, Installation or processes that present potential for an accident. Therefore,
all the relevant aspects of Solvents Products storage and handling process have been thoroughly examined to
assess their potential for initiating or propagating an unintentional event or sequence of events, which can lead to
an accident or disaster. Type, quantity, location & conditions of release of the solvents products under various
scenarios have been examined in order to estimate its damage potential, area affected, and the precautionary
measures to be taken.
7.4. Hazard potential: Deciding factor
Factors considered to identify and analyze the hazard potential are:
1. Flash point & Boiling point of the Products
2. Inventory of the Solvents
3. Potential for loss of containment
4. Pool size & dyke capacity
5. Potential for availability of ignition sources in the vicinity of leakage or spillage
Apart from the Solvents characteristics and process of its handling, size & layout of the Installation and its
equipment are also analyzed in order to assess the hazard potential.
7.5. Identification of hazards
Solvents are highly inflammable in their basic character. They are dangerous because of their intrinsic properties,
i.e. flash point, ignition energy required, heat of combustion, flammability limits, etc. In addition to such intrinsic
properties, extrinsic factors like storage & operating conditions and large storage quantity is also considered for
hazard identification
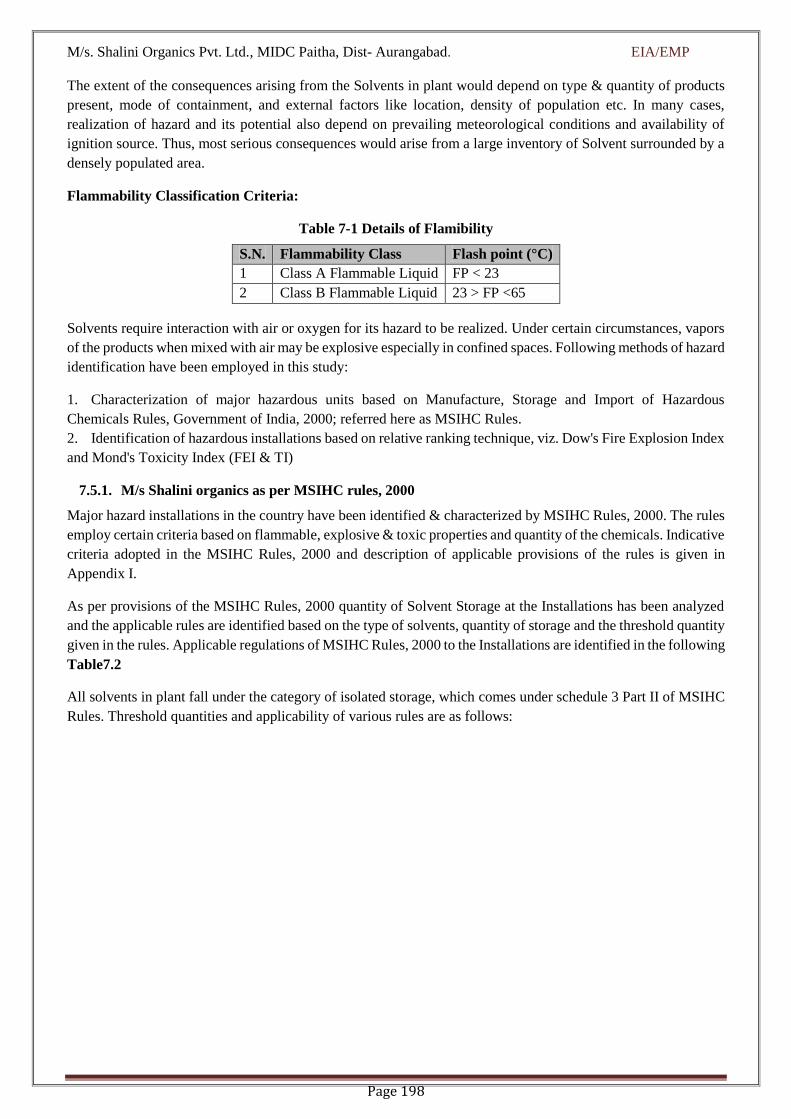
M/s. Shalini Organics Pvt. Ltd., MIDC Paitha, Dist- Aurangabad. EIA/EMP
Page 198
The extent of the consequences arising from the Solvents in plant would depend on type & quantity of products
present, mode of containment, and external factors like location, density of population etc. In many cases,
realization of hazard and its potential also depend on prevailing meteorological conditions and availability of
ignition source. Thus, most serious consequences would arise from a large inventory of Solvent surrounded by a
densely populated area.
Flammability Classification Criteria:
Table 7-1 Details of Flamibility
S.N. Flammability Class Flash point (°C)
1 Class A Flammable Liquid FP < 23
2 Class B Flammable Liquid 23 > FP <65
Solvents require interaction with air or oxygen for its hazard to be realized. Under certain circumstances, vapors
of the products when mixed with air may be explosive especially in confined spaces. Following methods of hazard
identification have been employed in this study:
1. Characterization of major hazardous units based on Manufacture, Storage and Import of Hazardous
Chemicals Rules, Government of India, 2000; referred here as MSIHC Rules.
2. Identification of hazardous installations based on relative ranking technique, viz. Dow's Fire Explosion Index
and Mond's Toxicity Index (FEI & TI)
7.5.1. M/s Shalini organics as per MSIHC rules, 2000
Major hazard installations in the country have been identified & characterized by MSIHC Rules, 2000. The rules
employ certain criteria based on flammable, explosive & toxic properties and quantity of the chemicals. Indicative
criteria adopted in the MSIHC Rules, 2000 and description of applicable provisions of the rules is given in
Appendix I.
As per provisions of the MSIHC Rules, 2000 quantity of Solvent Storage at the Installations has been analyzed
and the applicable rules are identified based on the type of solvents, quantity of storage and the threshold quantity
given in the rules. Applicable regulations of MSIHC Rules, 2000 to the Installations are identified in the following
Table7.2
All solvents in plant fall under the category of isolated storage, which comes under schedule 3 Part II of MSIHC
Rules. Threshold quantities and applicability of various rules are as follows:
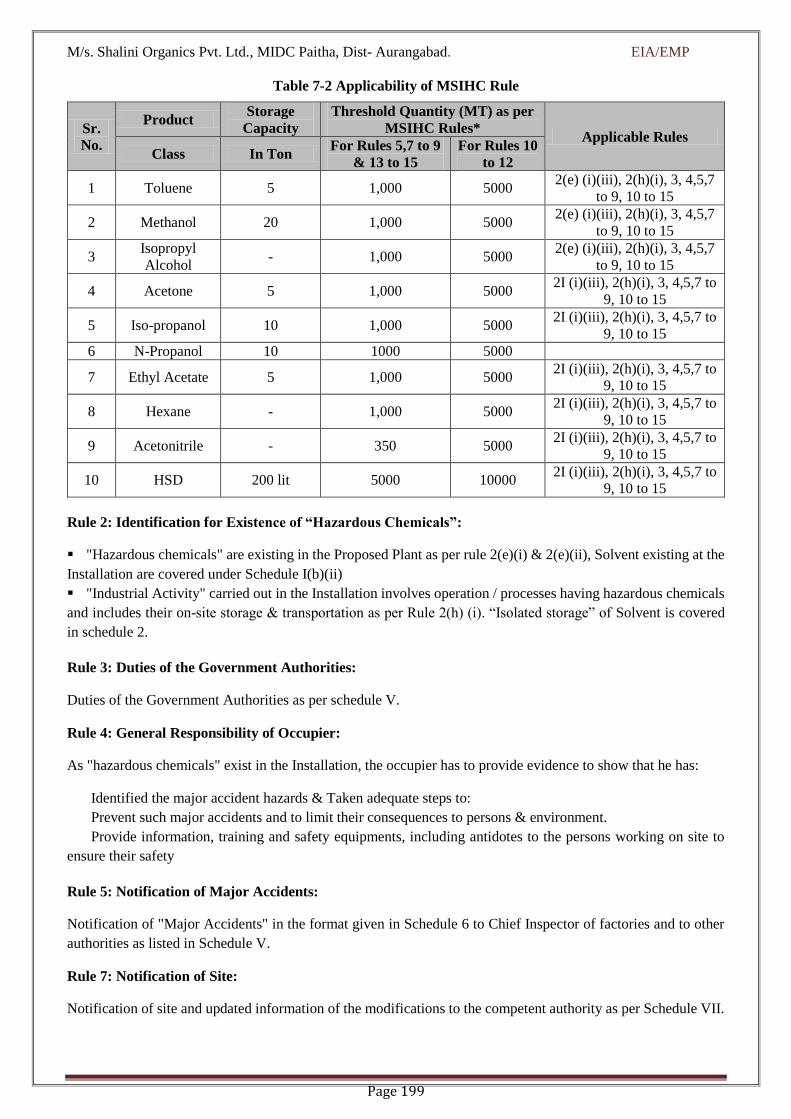
M/s. Shalini Organics Pvt. Ltd., MIDC Paitha, Dist- Aurangabad. EIA/EMP
Page 199
Table 7-2 Applicability of MSIHC Rule
Sr.
No.
Product Storage
Capacity
Threshold Quantity (MT) as per
MSIHC Rules* Applicable Rules
Class In Ton For Rules 5,7 to 9
& 13 to 15
For Rules 10
to 12
1 Toluene 5 1,000 5000 2(e) (i)(iii), 2(h)(i), 3, 4,5,7
to 9, 10 to 15
2 Methanol 20 1,000 5000 2(e) (i)(iii), 2(h)(i), 3, 4,5,7
to 9, 10 to 15
3 Isopropyl
Alcohol - 1,000 5000
2(e) (i)(iii), 2(h)(i), 3, 4,5,7
to 9, 10 to 15
4 Acetone 5 1,000 5000 2I (i)(iii), 2(h)(i), 3, 4,5,7 to
9, 10 to 15
5 Iso-propanol 10 1,000 5000 2I (i)(iii), 2(h)(i), 3, 4,5,7 to
9, 10 to 15
6 N-Propanol 10 1000 5000
7 Ethyl Acetate 5 1,000 5000 2I (i)(iii), 2(h)(i), 3, 4,5,7 to
9, 10 to 15
8 Hexane - 1,000 5000 2I (i)(iii), 2(h)(i), 3, 4,5,7 to
9, 10 to 15
9 Acetonitrile - 350 5000 2I (i)(iii), 2(h)(i), 3, 4,5,7 to
9, 10 to 15
10 HSD 200 lit 5000 10000 2I (i)(iii), 2(h)(i), 3, 4,5,7 to
9, 10 to 15
Rule 2: Identification for Existence of “Hazardous Chemicals”:
"Hazardous chemicals" are existing in the Proposed Plant as per rule 2(e)(i) & 2(e)(ii), Solvent existing at the
Installation are covered under Schedule I(b)(ii)
"Industrial Activity" carried out in the Installation involves operation / processes having hazardous chemicals
and includes their on-site storage & transportation as per Rule 2(h) (i). “Isolated storage” of Solvent is covered
in schedule 2.
Rule 3: Duties of the Government Authorities:
Duties of the Government Authorities as per schedule V.
Rule 4: General Responsibility of Occupier:
As "hazardous chemicals" exist in the Installation, the occupier has to provide evidence to show that he has:
Identified the major accident hazards & Taken adequate steps to:
Prevent such major accidents and to limit their consequences to persons & environment.
Provide information, training and safety equipments, including antidotes to the persons working on site to
ensure their safety
Rule 5: Notification of Major Accidents:
Notification of "Major Accidents" in the format given in Schedule 6 to Chief Inspector of factories and to other
authorities as listed in Schedule V.
Rule 7: Notification of Site:
Notification of site and updated information of the modifications to the competent authority as per Schedule VII.

M/s. Shalini Organics Pvt. Ltd., MIDC Paitha, Dist- Aurangabad. EIA/EMP
Page 200
Rule 8: Updating of the Site Notification Following Changes in the Threshold Quantity:
Any change in the “threshold quantity” (storage quantity) is to be notified to the competent authority.
Rule 9: Transitional Provision:
Transitional Provision for the existing activity
Rule 10: Safety Reports:
Preparation of Safety report by the occupier & to carry out an independent safety audit once in a year.
Rule 11: Updating of report under rule 10:
Updating of safety reports based on modification.
Rule 12: Requirement for further information to be sent to the authority:
Further information on safety reports to the authority.
Rule 13: Preparation to On-site emergency plan by the occupier:
Preparation of onsite emergency plan by the occupier & to conduct mock drill will take once in every 6 months.
Rule 14: Preparation of Off-site emergency plan by the occupier:
Preparation of offsite emergency plan by the occupier & to conduct mock drill will take once in every Year.
Rule 15: Information to be given to persons liable to be affected by a major accident
Rule 16: Collection, Development and Dissemination of Information on "Hazardous Chemicals" Employed
by the Occupier
Material Safety Data Sheet is to be prepared as per Schedule IX
Every container of hazardous chemical should be labeled or marked to identify
Contents of the container
The name and the address of the manufacturer
Physical, Chemical and Toxicological data as per the criteria given in Schedule I : Part I
Rule 18: Import of Hazardous Chemicals
(1) The rule is applicable as “hazardous chemicals” as per Schedule 1 Part I (b) (ii) exist in the Installation.
(2) To provide timely information to various Govt. Authorities listed in Schedule V:
Name & address of the company receiving the consignment in India
The port of entry in India
Mode of transport from exporting country to India
The quantity of chemicals being imported
Complete product safety information
7.5.2. Fire Explosion & Toxicity Index (FEI & TI) Analysis for Shalini organics
Introduction & Objectives:

M/s. Shalini Organics Pvt. Ltd., MIDC Paitha, Dist- Aurangabad. EIA/EMP
Page 201
The most widely used relative ranking hazard indices are Dow chemical Company's Fire Explosion Index (FEI)
and Mond's Toxicity Index (TI). They are commonly together referred to as Fire Explosion and Toxicity Index
(FEI & TI).
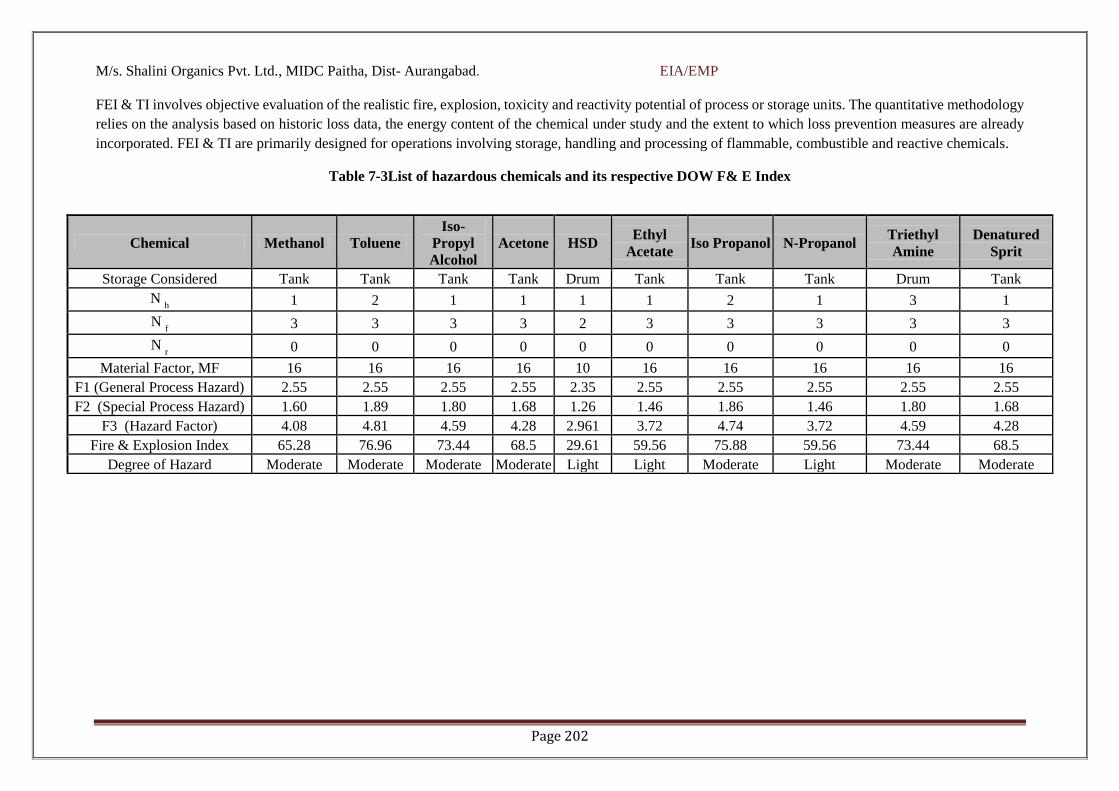
M/s. Shalini Organics Pvt. Ltd., MIDC Paitha, Dist- Aurangabad. EIA/EMP
Page 202
FEI & TI involves objective evaluation of the realistic fire, explosion, toxicity and reactivity potential of process or storage units. The quantitative methodology
relies on the analysis based on historic loss data, the energy content of the chemical under study and the extent to which loss prevention measures are already
incorporated. FEI & TI are primarily designed for operations involving storage, handling and processing of flammable, combustible and reactive chemicals.
Table 7-3List of hazardous chemicals and its respective DOW F& E Index
Chemical Methanol Toluene
Iso-
Propyl
Alcohol
Acetone HSD Ethyl
Acetate Iso Propanol N-Propanol
Triethyl
Amine
Denatured
Sprit
Storage Considered Tank Tank Tank Tank Drum Tank Tank Tank Drum Tank
N h 1 2 1 1 1 1 2 1 3 1
N f 3 3 3 3 2 3 3 3 3 3
N r 0 0 0 0 0 0 0 0 0 0
Material Factor, MF 16 16 16 16 10 16 16 16 16 16
F1 (General Process Hazard) 2.55 2.55 2.55 2.55 2.35 2.55 2.55 2.55 2.55 2.55
F2 (Special Process Hazard) 1.60 1.89 1.80 1.68 1.26 1.46 1.86 1.46 1.80 1.68
F3 (Hazard Factor) 4.08 4.81 4.59 4.28 2.961 3.72 4.74 3.72 4.59 4.28
Fire & Explosion Index 65.28 76.96 73.44 68.5 29.61 59.56 75.88 59.56 73.44 68.5
Degree of Hazard Moderate Moderate Moderate Moderate Light Light Moderate Light Moderate Moderate

M/s. Shalini Organics Pvt. Ltd.,MIDC Paitha, Dist- Aurangabad. EIA/EMP
Page 203
The DOW Index calculations, performed for storage of chemicals.
Interpretation: The Dow index has been performed for above listed chemicals storage and from the calculations
it is seen that the storage will have a maximum Dow Index of 76.96 indicating Moderate hazard potential.
Table 7-4Degree of Hazards
Degree of Hazard for F & EI
F & EI Index Range Degree of Hazard
1-60 Light
61-96 Moderate
97-127 Intermediate
128-158 Heavy
159-up Severe
Toxicity Index:
Introduction
The principle and general approach used in the DOW method of hazard evaluation have been further developed
by ICI Mond Division, the revised Mond Fire, Explosive and Toxicity index is a series of papers by Lewis (1979).
The main developments made to the DOW Index in the Mond Index are:
1. It covers a wider range of process and storage installation
2. It covers the processing of chemicals with explosive properties
3. A calculation procedure is included to allow for the off-setting effects of good design and control and
safety instrumentation
4. The procedure has been extended to cover plant layout
5. Separate indices are calculated to access the hazards of fire, internal explosion and aerial explosion.
To estimate the Monds Index for raw materials in storage area following, All the raw materials stored in the
industry premises are tabulated and data for their N (H) levels and TLV levels are obtained. Based on their highest
toxicity factor and lowest TLV level Mond’s Index was calculated for chemicals with Nh=3 or more.
To estimate the Monds Index for raw materials in storage area following,
Table 7.6 explains the toxicity index and degree of hazard associated with respective raw material.
Table 7-5Toxicity Index and degree of Hazard for Hazardous chemicals
Sr.
No.
Raw
Materials
Th
(Toxicity
factor)
Ts
(Correction
factor)
Toxicity
Index
Degree
of
hazard
1. Methanol 50 50 5.15 Light
2. Toluene 125 75 10.88 Severe
3.
Iso-
Propyl
Alcohol
50 50 4.35 Light
4. Acetone 50 50 5.23 Light
5. HSD 0 50 2.30 Light
6. Ethyl
Acetate 50 50 5.01 Light
7. Iso
Propanol 125 50 8.11 Moderate
8. Triethyl
Amine 250 125 20.06 Severe

M/s. Shalini Organics Pvt. Ltd., MIDC Paitha, Dist- Aurangabad. EIA/EMP
Page 204
Sr.
No.
Raw
Materials
Th
(Toxicity
factor)
Ts
(Correction
factor)
Toxicity
Index
Degree
of
hazard
9. N-
Propanol 50 50 5.01 Light
10. Denatured
Sprit 50 50 5.23 Light
7.6. Visualization of MCA Scenarios
7.6.1. Introduction
A Maximum Credible Accident (MCA) can be characterized as an accident with a maximum damage potential,
which is believed to be credible. For selection of a MCA scenario following factors have been taken into account.
* Flammability of the Products
* Quantity of Products present in the tank
*Process or storage conditions such as temperature, pressure, flow, mixing and presence of incompatible materials
In addition to the above factors, location of the unit with respect to adjacent establishment has been taken into
consideration to account for the potential of escalation of an accident. This phenomenon is known as the domino
or secondary effect. In order to visualize MCA scenarios Chemical Inventory Analysis, Event Tree Analysis and
Past Accident Review have been employed.
7.6.2. Chemical InventoryAnalysis
Maximum inventory of Solvents in storage tanks has been considered.
7.6.3. Identification of Chemical Release & Accident Scenarios
Credible accident scenarios for the Installation have been divided into following categories according to the mode
of release of Solvent, physical effects and the resulting damages:
Pool fire (release of chemicals from a tank, forming a pool within the dyke/fire wall and catching fire)
Jet fire (leakage of chemicals from a tank/pipe/pump/joints and the products stream catching fire)
Spilled Product Fire
Unconfined Vapor Cloud Explosion (UVCE) as a secondary effect of above mentioned scenarios
7.6.4. Even tree analysis to define outcome of release
ETA diagram for various modes of failures of storage tank/ pump/ pipe/ joints for storage of chemicals have been
developed for conditions such as overfilling, over-pressure and remote incidents like missile, lightening or bomb
attack and earthquake. The resultant ruptures of vessels or leak incidents have been identified with possible
outcomes of such incidents. These are depicted in Figure 7.3.
Scenarios pertaining to leakage & spillage are most credible in such plant.
7.6.5. Short listing of mca scenarios
Based on the hazard identification and comparing the nature of installation with that from past accidents in similar
units, a final short list of MCA scenarios for the Installation has been made, which are given in following Table.
These are the maximum credible accidents, which may occur, in the respective unit.
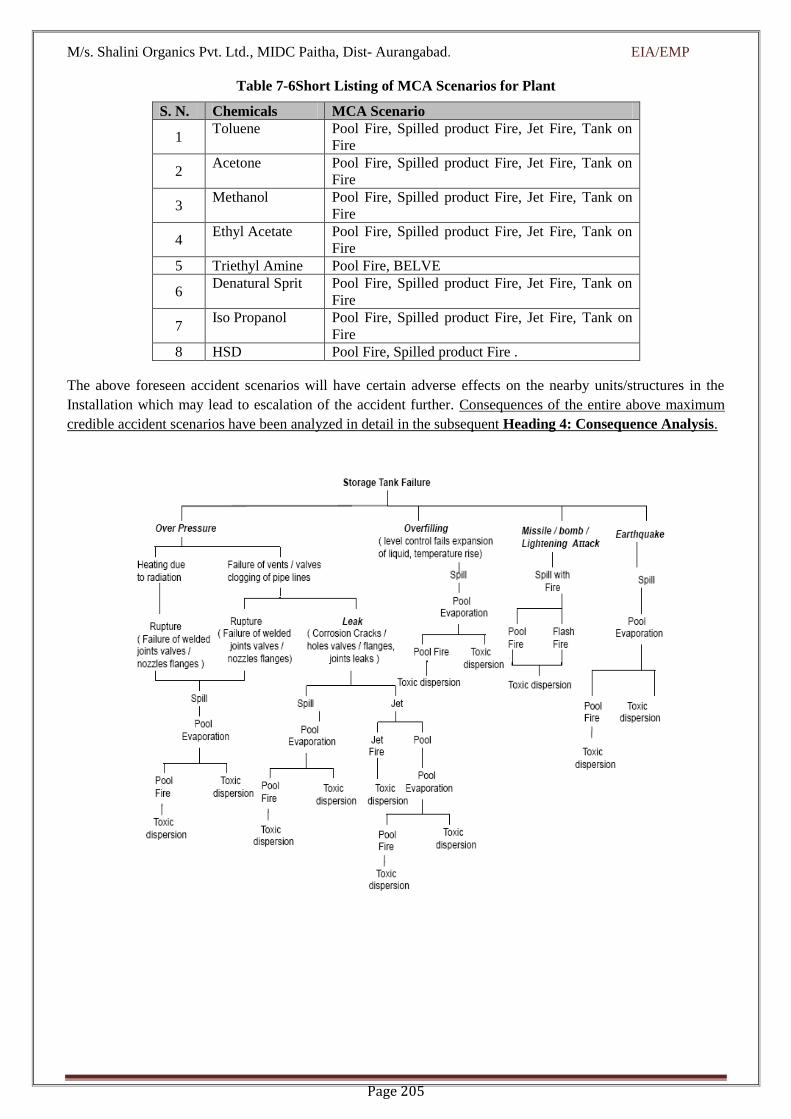
M/s. Shalini Organics Pvt. Ltd., MIDC Paitha, Dist- Aurangabad. EIA/EMP
Page 205
Table 7-6Short Listing of MCA Scenarios for Plant
S. N. Chemicals MCA Scenario
1 Toluene Pool Fire, Spilled product Fire, Jet Fire, Tank on
Fire
2 Acetone Pool Fire, Spilled product Fire, Jet Fire, Tank on
Fire
3 Methanol Pool Fire, Spilled product Fire, Jet Fire, Tank on
Fire
4 Ethyl Acetate Pool Fire, Spilled product Fire, Jet Fire, Tank on
Fire
5 Triethyl Amine Pool Fire, BELVE
6 Denatural Sprit Pool Fire, Spilled product Fire, Jet Fire, Tank on
Fire
7 Iso Propanol Pool Fire, Spilled product Fire, Jet Fire, Tank on
Fire
8 HSD Pool Fire, Spilled product Fire .
The above foreseen accident scenarios will have certain adverse effects on the nearby units/structures in the
Installation which may lead to escalation of the accident further. Consequences of the entire above maximum
credible accident scenarios have been analyzed in detail in the subsequent Heading 4: Consequence Analysis.

M/s. Shalini Organics Pvt. Ltd., MIDC Paitha, Dist- Aurangabad. EIA/EMP
Page 206
Figure 7-1 Event Tree Analysis of failure of Atmospheric Storage tank of Flammable Liquids
HAZARDS & DAMAGE CRITERIA OF MATERIALS
DEFINITIONS:
The release of flammable liquid can lead to different types of fire or explosion scenarios. These depend on the
material released, mechanism of release, temperature and pressure of the material and the point of ignition. Types
of flammable effects are as follows.
Hazards associated with Flammable materials
a. Pool fire:
The released flammable material which is a liquid stored below its normal boiling point, will collect in a pool.
The geometry of the pool will be dictated by the surroundings. If the liquid is stored under pressure above its
normal boiling point, then a fraction of the liquid will flash into vapor and the remaining portion will form a pool
in the vicinity of the release point. Once sustained combustion is achieved, liquid fires quickly reach steady state
burning. The heat release rate is a function of the liquid surface area exposed to air. An unconfined spill will tend
to have thin fuel depth (typically less than 5 mm) which will result in slower burning rates. A confined spill is
limited by the boundaries (e.g. a dyke area) and the depth of the resulting pool is greater than that for an
unconfined spill.
M/s. Shalini Organics Pvt. Ltd., MIDC Paitha, Dist- Aurangabad. EIA/EMP
Page 207
b. Flash fire:
It occurs when a vapor cloud of flammable material burns. The cloud is typically ignited on the edge and burns
towards the release point. The duration of flash fire is very short (seconds), but it may continue as jet fire if the
release continues. The overpressures generated by the combustion are not considered significant in terms of
damage potential to persons, equipment or structures. The major hazard from flash fire is direct flame
impingement. Typically, the burn zone is defined as the area the vapor cloud covers out to half of the LFL. This
definition provides a conservative estimate, allowing for fluctuations in modeling. Even where the concentration
may be above the UFL, turbulent induced combustion mixes the material with air and results in flash fire.
c. Jet Fire:
Jet flames are characterized as high-pressure release of gas from limited openings (e.g., due to small leak in a
vessel or broken drain valve). Boiling liquid expanding vapor explosion (BLEVE) or fireball: A fireball is an
intense spherical fire resulting from a sudden release of pressurized liquid or gas that is immediately ignited. The
best-known cause of a fireball is a boiling liquid expanding vapor explosion (BLEVE). Fireball duration is
typically 5 – 20 seconds
d. Unconfined Vapor Cloud Explosion (UVCE)
Vapor Cloud can ignite and burn as deflagration or fire balls causing lot of damage by radiation starting secondary
fires at some distance. Vapour Cloud ignites and explodes causing high over pressures and very heavy damage.
The latter is termed as “Percussive unconfined Vapour Cloud Explosion” i.e. PUVCE in short.
Various meteorological conditions (as mentioned above) have been considered for analyzing drifting & dilution
of a vapor cloud, so that all probable consequences of a vapor cloud explosion can be foreseen. Worst come worst,
there may be instantaneous release of the entire Solvent vapor present in the unit. If it comes in to contact of an
ignition source during or immediately after the release or as in a case of backfire resulting in jet fire, it may lead
to a BLEVE.
Otherwise, the second MCA scenario is drifting & dilution of a vapor cloud along the wind and then coming into
contact of an ignition source (i.e., case of delayed ignition), leading to a VCE. This scenario is particularly
important to identify unforeseen OFF-SITE emergencies. Two kinds of vapor release scenarios have been
considered, i.e., instantaneous and continuous.
Continuous release:
Continuous release of a product occurs where the outflow of product is in small quantity form the inventory. This
release will get dispersed in atmosphere after a period of time. For ignition of product, a particular mixture of
product with air is required (mixture between lower & upper explosive limit of Solvent). For this precaution
should be taken by Installation personnel’s, by installing Hydrocarbon Detector for a leak of Class A Slovent (We
have recommended this point separately in recommendation heading).
Instantaneous Release:
As the vapor cloud drifts in the wind direction, it may explode depending on the quantity of Solvent present
within flammability limits and availability of ignition source. Applying the pertinent models, quantity of Solvent
within flammability limits for various downwind distances have been calculated for below mentioned wind
conditions. These quantities of explosive vapor cloud are applied to further analyze the damage potential due to
a vapor cloud explosion (VCE) for heat radiation.

M/s. Shalini Organics Pvt. Ltd., MIDC Paitha, Dist- Aurangabad. EIA/EMP
Page 208
The catastrophic failure of vessel/Storage Tank is one of the major accidental scenarios whose effect is felt beyond
plant boundary. The over pressure distance are shown in table. Over pressure remain largely unaffected by wind
direction. The distances shown are for rupture of vessel filled up to its maximum capacity. The hazard distances
indicated will be much lower if the Tank of solvent contain fewer inventory at the time of accidents.
7.7. Consequence analysis
This chapter deals with the quantification of various effects of release of solvent on the surrounding area by means
of mathematical models and internationally recognized Safety software.
It is intended to give an insight into how the physical effects resulting from the release of hazardous substances
can be calculated by means of computerized models and how the vulnerability models can be used to translate
the physical effects in terms of injuries and damage to exposed population & environment.
Table 7-7Mathematical and Analytical Model for Hazard Analysis
Sr.No. Phenomenon Applicable Models
1 Outflows:
Liquid, Two phase
Mixtures, Gas/vapor
Bernoulli flow equation; phase equilibria; multiphase
flow models; orifice/nozzle flow equations; gas laws;
critical flow criteria
2 Discharges:
Spreading liquid
Vapor jets
Flashing liquids
Evaporation of liquids on land &
water
Spreading rate equation for non-penetrable surfaces
based on cylindrical liquid pools
Turbulent free jet model
Two zone flash vaporization model
Spreading, boiling & moving boundary heat transfer
models; Film & meta-stable boiling phenomenon;
cooling of semi infinite medium
3 Dispersion:
Heavy Gas
Natural Gas
Atmospheric stability
Boundary dominated, stable stratified & positive
dispersion models (similarity)
3D Models based on momentum, mass & energy
conservation
Gaussian Dispersion models for naturally buoyant
plumes
Boundary layer theory (turbulence), Gauss Ian
distribution models
4 Heat Radiation:
Liquid pool fires
Jet fires
Fire balls
Burning rate, heat radiation & incident heat correlation
(semi imperial); Flame propagation behavior models
Fire jet dispersion model
API fire ball models relating surface heat flux of flame,
geometric view factor & transmission coefficients
5 Vulnerability:
Likely damage
Probit functions; Non-Stochastic vulnerability models

M/s. Shalini Organics Pvt. Ltd., MIDC Paitha, Dist- Aurangabad. EIA/EMP
Page 209
First, attention is paid to the factors, which are decisive for the selection of the models to be used in a particular
situation, after which the various effect models are discussed.
7.7.1. Factors which influence the use of physicAL EFFECT MODEL
In order to calculate the physical effects of the incidental release of hazardous substances the following steps have
been carried out in succession:
Understanding of the form in which the hazardous substance is in existence (i.e. liquid of highly volatile nature)
Determination of the various ways in which the release can take place
Determination of the outflow volume or quantity (as a function of time) i.e. estimating rate of evaporation from
the pool of liquid;
Quantity of leaked or spilled Product along with pool size has been calculated. Finally, the analysis results in
computation of heat radiation intensity (KW/m2) with respect to distance for various MCA scenarios. In this
analysis, final effect calculations have been made for pool fire for heat radiation intensity effects with respect to
distance from dyke wall.
7.8. Models for Determining the Source Strength for The Release of Hazardous Substances
Source strength of a release means the quantity of the substance released with respect to time. The release may
be instantaneous or continuous. In case of instantaneous release, the strength of the source is given in kg whereas
in continuous release source strength depends on the outflow time and expressed in kg/s. In order to find the
source strength, it is first necessary to determine the state of a substance in a vessel or pipe along with physical
properties, viz. vapor pressure & minimum ignition energy required. Phase of Solvent at the time of accidental
release is also to be determined. This may be gas, gas condensed to liquid or liquid in equilibrium with its vapor.
7.8.1. Instantaneous Release
In the event of the instantaneous release of a liquid a pool of liquid will form. The evaporation can be calculated
on the basis of pool size, volatile nature of the product (i.e. vapor pressure) and meteorological conditions.
7.8.2. Semi-Continuous Outflow
In the case of a semi continuous outflow, it is again first of all necessary to determine whether it is gas, a gas
condensed to liquid or liquid that is flowing out. The following situations can occur here.
Gas Outflow:
The model with which the source strength is determined in the event of a gas outflow is based on the assumption
that there is no liquid in the system.
Vapor Outflow:
If the outflow point is located above the liquid level, vapor outflow will occur. In the case of a gas compressed to
liquid the liquid will start boiling as a result of the drop in pressure. The source strength of the out flowing vapor
is a function of the pressure in the storage system and after the liquid has reached the boiling point at atmospheric
pressure the temperature will remain constant.
Pressurized Liquefied Gas Outflow:
If the outflow point is located below the liquid level, liquid outflow will occur resulting in flash off. The outflow
will generally be so violent that the liquid will be turned into drops as a result of the intensity of the evaporation.
The remaining liquid, which is cooled down to boiling point, will start spreading on the ground and forms a pool.
Evaporation will also take place from this pool, resulting in a second semi continuous vapor source.

M/s. Shalini Organics Pvt. Ltd., MIDC Paitha, Dist- Aurangabad. EIA/EMP
Page 210
Liquid Outflow:
In case of liquid outflow, discharge due to overall head difference takes place.
Effects of Release
When hazardous material is released to atmosphere due to any reason, a vapor cloud is formed. Direct cloud
formation occurs when a gaseous or flashing liquid escapes to the atmosphere. Release of toxic compounds to
atmosphere may usually lead to the following:
1. Spillage of liquid hydrocarbons will result in a pool of liquid, which will evaporate taking heat from the
surface, forming a flammable atmosphere above it. Ignition of this pool will result in pool fire causing
thermal radiation hazards.
2. A fireball or BLEVE (Boiling Liquid expanding Vapor Explosion) occurs when a vessel containing a
highly volatile liquid fails and the released large mass of vapor cloud gets ignited immediately. It has
damage potential due to high intensity of radiation and generation of the overpressure waves, causing
large scale damage to nearby equipment and structures.
3. Catastrophic failure of tanks/ pressurized vessels, rotary equipment and valves etc. can result in
equipment fragments flying and hitting other equipment of the plant.
4. Release of toxic compounds results in the toxic vapour cloud traveling over long distances, affecting a
large area, before it gets sufficiently diluted to harmless concentration in the atmosphere.
5. The material is in two phases inside the containment - liquid & vapor. Depending on the location of the
leak liquid or vapor will be released from the containment. If vapor is released a vapor cloud will form
by the mixing of the vapor and air. The size of the vapor cloud will depend on the rate of release, wind
speed; wind direction & atmospheric stability will determine the dispersion and movement of the vapor
cloud.
6. If liquid is released there will be some flashing as the boiling point of liquid is below the Ambient
temperature. The vapor formed by immediate flashing will behave as vapors release. The liquid will fall
on the ground forming a pool. There will be vaporization from the pool due to the heat gained from the
atmosphere & ground.
7. There will be dispersion and movement of vapor cloud formed by evaporation of liquid The behavior of
material released by loss of containment depends on the following factors:
1. Physical properties of the material
2. Conditions of material in containment (pressure and temperature)
3. Phase of material released (liquid or gas)
4. Inventory of material released
5. Weather parameters (temperature, humidity, wind speed, atmospheric stability)
6. Material with boiling point below ambient condition.
7.9. Model for Evaporation
In application of evaporation models, Solvents is a case of volatile liquid. From the pool, which has formed,
evaporation will take place as a result of the heat flow from the ground and solar radiation. The evaporation model
only takes account of the heat flow from the ground since the heat resulting from solar radiation is negligibly
small compared with the former. The evaporation rate depends on the kind of liquid and the kind of subsoil.

M/s. Shalini Organics Pvt. Ltd., MIDC Paitha, Dist- Aurangabad. EIA/EMP
Page 211
7.10. Model for Dispersion
The gas or vapor released either instantaneously or continuously will be spread in the surrounding area under the
influence of the atmospheric turbulence. In the case of gas dispersion, a distinction is required to be made between
neutral gas dispersion and heavy gas dispersion.
The concentrations of the gas released in the surrounding area can be calculated by means of these dispersion
models. These concentrations are important for determining the nature of accidents for example an explosive gas
cloud formation injury will occur in the case of toxic gases.
Heavy Gas Dispersion Model
If the gas density is higher than that of air due to higher molecular weight or marked cooling, it will tend to spread
in a radial direction because of gravity. This results in a "gas pool" of a particular height and diameter. As a result
of this, in contrast to a neutral gas, the gas released may spread against the direction of the wind.
7.11. Modelfor HeatLoad sndShock Waves
7.11.1. Model for Flare
If an out-flowing gas forms a cloud with concentrations between the lower and upper explosion limit and ignition
takes place, a torch occurs. A model with which the length of a torch and the thermal load for the surrounding
area can be calculated, assumes an elliptic shaped torch. The volume of the flare in this model is proportional to
the outflow.
In order to calculate the thermal load, flare is regarded as a point source located at the center of the flare. This
center is taken as being half a flare length from the point of outflow.
7.11.2. Model for Pool Fire
The heat load on objects outside a burning pool of liquid can be calculated with the heat radiation model. This
model uses average radiation intensity, which is dependent on the liquid. Account is also taken of the diameter-
to-height ratio of the fire, which depends on the burning liquid. In addition, the heat load is also influenced by the
following factors:
* Distance from the fire
* Relative humidity (water vapor has relatively high heat absorbing capacity)
* The orientation i.e. horizontal/vertical of the object irradiated with respect to the fire
7.12. Vulnerability Model
Vulnerability models or dose response relations, which are used in order to determine how people are injured by
exposure to heat load or a toxic dose. Such models are designed on the basis of animal experiments or on the
basis of the analysis of injuries resulting from accidents, which have occurred. Vulnerability models often make
use of a probit function. In a probit function a link is made between the load and the percentage of people exposed
who suffer a particular type of injury. The probit function is represented as follows:
Pr = k1 + k2ln V
Pr= Probit, a measure for the percentage of people exposed who incur a particular injury
k1 = A constant depending on the type of injury and type of load

M/s. Shalini Organics Pvt. Ltd., MIDC Paitha, Dist- Aurangabad. EIA/EMP
Page 212
k2 = A constant depending on the type of load
V = Load or dose
7.12.1. Injuries resulting from flammable liquids and gases
In the case of flammable liquids and gases and immediate ignition a pool fire or a flare will occur depending on
the conditions. The injuries in this case are mainly caused by heat radiation.
7.12.2. Damage models for heat radiation
It is assumed that everyone inside the area covered by the fire ball, a torch, a burning pool or gas cloud will be
burned to death or will asphyxiate. The following Probit functions are an example of a method, which can be
used to calculate the percentage of lethality, and first-degree burns that will occur at a particular thermal load and
period of exposure of an unprotected body.
Lethality: Pr = -36.83 + 2.56 ln (t.q4/3)
First degree burn symptoms: Pr = -39.83 + 3.0186 in (t.q4/3)
In which, t = exposure time in seconds and;
q = thermal load W/m2
Two values have been chosen for the exposure time to heat radiation:
* 10 seconds: for exposed persons in populated area it is assumed that they will have found protection from the
heat radiation e.g. from a wall, within 10 seconds
* 30 seconds: this pessimistic assumption applies if people do not run away immediately or when no protection
is available
7.12.3. Summary of damage criteria
Damage Criteria:
Damage estimates due to thermal radiations and overpressure have been arrived at by taking in to consideration
the published literature on the subject. The consequences can then be visualized by the superimposing the damage
effects zones on the proposed plan site and identifying the elements within the project site as well as in the
neighboring environment, which might be adversely affected, should one or more hazards materialize in real life.
Thermal Damage:
The effect of thermal radiation on people is mainly a function of intensity of radiation and exposure time. The
effect is expressed in terms of the probability of death and different degrees of burn. The following tables give
the effect of various levels of heat flux.

M/s. Shalini Organics Pvt. Ltd., MIDC Paitha, Dist- Aurangabad. EIA/EMP
Page 213
Table 7-8Fatal Radiation Exposure Levels
Table 7-9 Detils of damage due to radiation
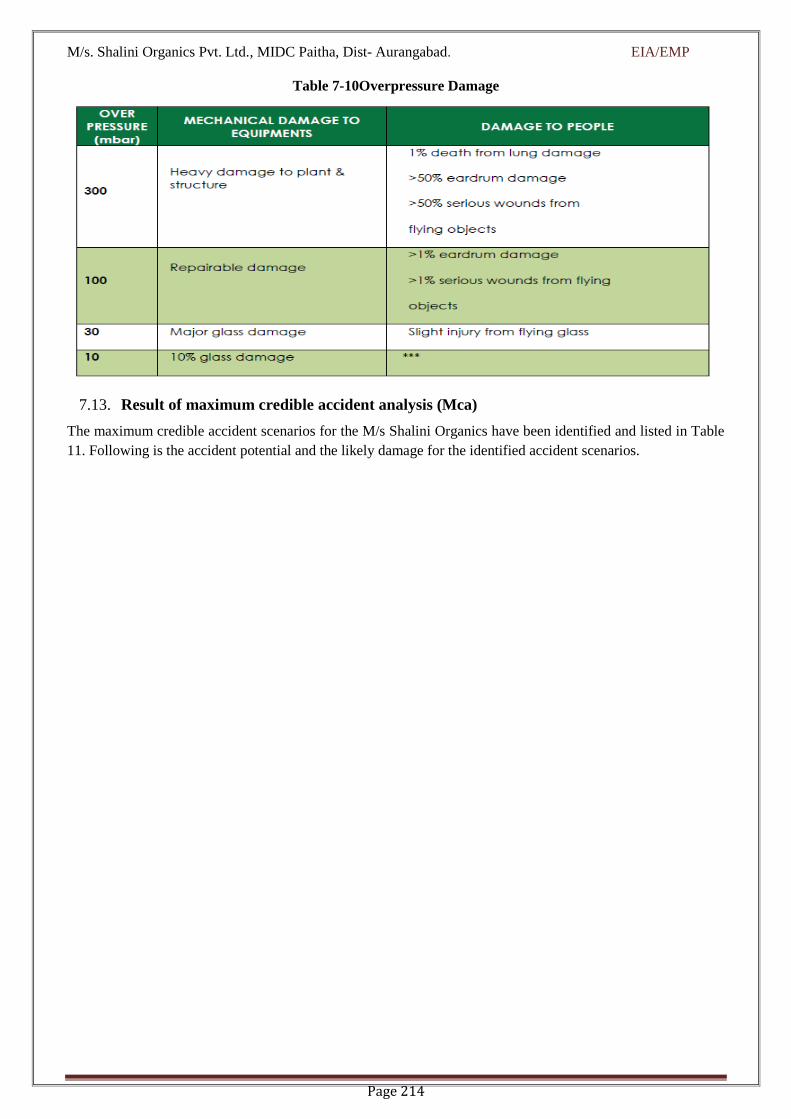
M/s. Shalini Organics Pvt. Ltd., MIDC Paitha, Dist- Aurangabad. EIA/EMP
Page 214
Table 7-10Overpressure Damage
7.13. Result of maximum credible accident analysis (Mca)
The maximum credible accident scenarios for the M/s Shalini Organics have been identified and listed in Table
11. Following is the accident potential and the likely damage for the identified accident scenarios.

M/s. Shalini Organics Pvt. Ltd., MIDC Paitha, Dist- Aurangabad. EIA/EMP
Page 215
Table 7-11 Damage Distances Due to Spilled/Pool Product Fire Scenario, Jet Fire, BLEAVE Fireball of
tank Rupture/failure, Leak from hole in tank
Methanol Storage Tank
Heat Radiation Intensity
(Kw/m2) Jet Fire Pool Fire Tank on fire
37.5 Kw/m2 for first Isopleth 7.95 M 33.06 M 2.02
25 Kw/m2 for Second Isopleth 9.89 M 40.56 M 2.02
12.5 Kw/m2 for Third Isopleth 13.74 M 57.67 M 2.52
4 Kw/m2 for fourth Isopleth 24.98 M 102.86 M 5.02
Toluene Storage Tank
Heat Radiation Intensity
(Kw/m2) Jet Fire Pool Fire Tank on fire
37.5 Kw/m2 for first Isopleth 7.00 42.42 2.01
25 Kw/m2 for Second Isopleth 9.01 52.45 2.5
12.5 Kw/m2 for Third Isopleth 12.50 73.56 3.52
4 Kw/m2 for fourth Isopleth 22.65 130.73 6.71
Acetone Storage Tank
Heat Radiation Intensity
(Kw/m2) Jet Fire Pool Fire Tank on fire
37.5 Kw/m2 for first Isopleth 14.19 1.92 2.01
25 Kw/m2 for Second Isopleth 17.69 2.92 3.21
12.5 Kw/m2 for Third Isopleth 25.19 5.42 6.51
4 Kw/m2 for fourth Isopleth 45.19 8.92 10.51
Ethyl Acetate Storage Tank
Heat Radiation Intensity
(Kw/m2) Jet Fire Pool Fire Tank on fire
37.5 Kw/m2 for first Isopleth 15.62 37.95 1.90
25 Kw/m2 for Second Isopleth 19.12 46.95 2.90
12.5 Kw/m2 for Third Isopleth 26.62 66.45 5.40
4 Kw/m2 for fourth Isopleth 47.62 117.45 8.90
Denatured Sprit Storage Tank
Heat Radiation Intensity
(Kw/m2) Jet Fire Pool Fire Tank on fire
37.5 Kw/m2 for first Isopleth 13.67 19.79 2.01
25 Kw/m2 for Second Isopleth 16.78 24.29 --
12.5 Kw/m2 for Third Isopleth 23.69 34,29 --
4 Kw/m2 for fourth Isopleth 41.76 60.36 3.01
Triethyl Amine HSD Drum
Heat Radiation Intensity
(Kw/m2) Pool Fire BLEVE Pool Fire
37.5 Kw/m2 for first Isopleth 1.55 48.18 4.56
25 Kw/m2 for Second Isopleth -- 64.18 5.56
12.5 Kw/m2 for Third Isopleth 2.54 80.01 7.56
4 Kw/m2 for fourth Isopleth 4.04 98.18 13.56
Conclusion:
Based on the unsafe distances identified by the software output file, the MCLS (maximum credible loss scenario)
for the factory works out to about 130.74 meter considering pool fire scenario for Toluene with 4.0 kW/ (Sq.
m) impact in the environment.
The scenario considered for assessing the impact by quantitative risk assessment was taken from standard
guideline.

M/s. Shalini Organics Pvt. Ltd., MIDC Paitha, Dist- Aurangabad. EIA/EMP
Page 216
The probability of occurrence of the scenario is very less. The Disaster management plan highlights the suggestive
measures to be taken during the occurrence of such an accident.
7.14. Catagorization risk based on above identifies mca’s
Based on ranking of likelihood and frequencies, each identified hazard has been evaluated based on the likelihood
of occurrence and the magnitude of consequences. The significance of the risk is expressed as the product of
likelihood and the consequence of the risk event, expressed as follows:
Significance = Likelihood X Consequence.
The Table 12 below illustrates all possible product results for the five likelihood and consequence categories
while the Table 13 assigns risk significance criteria. Depending on the position of the intersection of a column
with a row in the risk matrix, hazard prone activities have been classified as low, medium and high thereby
qualifying for a set of risk reduction / mitigation strategies.
Table 7-12Risk Matrix
Likelihood →
Frequent Probable Remote Not Likely Improbable
5 4 3 2 1
Conse
quen
ce
→
Catastrophic 5 25 20 15 10 5
Major 4 20 16 12 8 4
Moderate 3 15 12 9 6 3
Minor 2 10 8 6 4 2
Insignificant 1 5 4 3 2 1
Table 7-13Risk Criteria and Action Requirements
Risk Significance Criteria Definition & Action Requirements
High (16 - 25) “Risk requires attention” – HSE Management need to ensure that necessary
mitigation are adopted to ensure that possible risk remains within acceptable limits
Medium (10 – 15)
“Risk is tolerable” – HSE Management needs to adopt necessary measures to
prevent any change/modification of existing risk controls and ensure implementation
of all practicable controls.
Low (5 – 9)
“Risk is acceptable” – Identified risks are managed by well-established controls and
routine processes/procedures. Implementation of additional controls can be
considered.
Very Low (1 – 4) “Risk is acceptable” – All risks are managed by well-established controls and routine
processes/procedures. Additional risk controls need not to be considered
Risk category as per incidents mentioned as per below:
Table 7-14Categorization of Risk as per Identified MCA Scenarios
Sr.No. Risk Source Risk
Category
1 Spilled product Fire Low
2 Pool Fire Intermediate
3 Unconfined Vapour Cloud Explosion Intermediate
4 Spillage of product when road tanker meets with an accident enroute resulting in
fire Low
5 Storage tank hit by a flying object/under fire due to some explosion in close
vicinity areas Intermediate
M/s. Shalini Organics Pvt. Ltd., MIDC Paitha, Dist- Aurangabad. EIA/EMP
Page 217
7.15. Analysis for propensity towards predicted consequences
Risk of operation of any activity involving hazardous chemicals consists of the following two elements:
Consequences of certain unwanted event &
Propensity that these consequences will occur.
Propensity or likelihood of the predicted consequence for the Installation will depend upon the following items:
Propensity of the Installation towards occurrence of initiating event.
Propensity that the designed counter measures provided in the Installation would fail.
Propensity of certain consequence of an accident.
7.15.1. Possibility of fire & it’S propagation
Primarily there could be fire (ignition of spilled or leaked Product), flare (jet fire) or pool fire in the Installation.
Pool fire is possible at the tank farm only whereas fire and flare are possible at any pipeline containing Chemicals,
Storage yard, Pump and Road Tank Truck.
7.15.2. Spilled Product fire
The Product may get spilled and come in contact with a potential ignition source. In this case, it will catch fire.
Extent of fire will depend on quantity of Chemicals (Toluene, Acetone, Methanol, Ethyl Acetate, Denatural Spirit,
Triethyl Amine) released and profile of the surface on which it has been spilled. Such fire may also cause fire in
the nearby flammable/combustible material, if any. This type of fire must be extinguished immediately and
propagation of fire should be stopped.
7.15.3. Jet fire in Pipeline/product pump house/tank farm/tt decanting area/tank truck
If there is a leakage in the pipeline and there is availability of any ignition source, jet fire may occur. In such cases
the leaked product may travel up to the ignition source and the fire may travel back to the place of leakage or the
leaked Product may catch fire at the place of leakage itself. Considering the worst possible case, such a jet fire
may cause direct damage up to 10 to 35 m for a leak size of 2 to 5 cm diameter and Product being released with
the head of 5 to 10 m. The flame impingement and may cause further damage.
In this case also there would be sufficient time available for the persons to come out from the affected area, if
any. In such cases isolating the affected pipeline should be given first priority than extinguishing the fire. The
affected equipment (being heated by the heat) should be kept cool with flow of water from monitor/hydrant.
7.15.4. Propensity of the Installation towards occurance of such initiating event
The event could be a single component failure, for example, leakage of product from pipeline or any equipment
or any tank. To evaluate this aspect for the Plant, Hazard and Operability Studies (HAZOP) has to be carried out.
7.15.5. Propensity of failure of the designed counter measures
Upon occurrence of the initiating event, certain designed counter measures in the Installation would start
functioning for example isolation of the affected area from other areas by the personnel by closing the valves to
restrict the quantity of escaping chemicals; on hearing the emergency alarm the emergency team would
immediately start functioning and take the necessary action to restrict or limit the damage. On the contrary these
counter measures may fail also. Therefore, a lot would depend on response of the emergency team. Hazards &
Operability Studies, (HAZOP) needs to be carried out to evaluate this aspect in detail.
7.15.6. Propoensity of a certain consequence of an accident
Any initiating event would take place first, there after the designed counter measures would attempt to limit the
effects of the initiating event. Such deviations from the intended operation may lead to an accident. In reality,
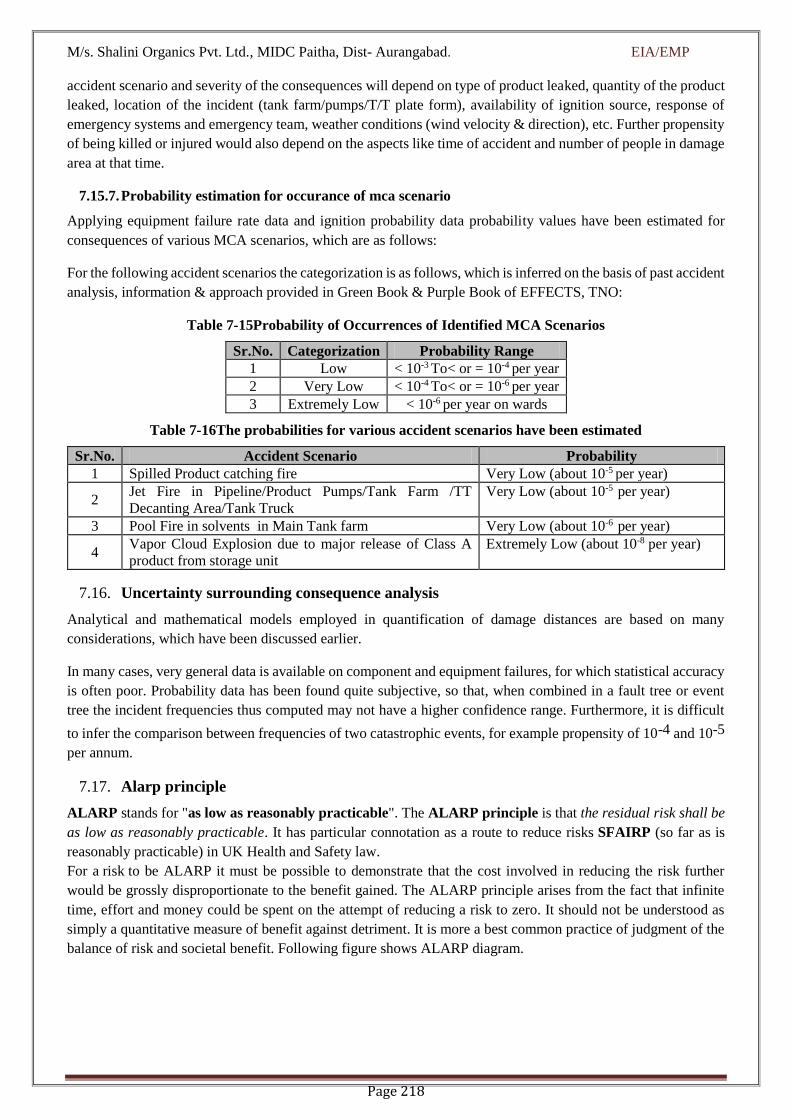
M/s. Shalini Organics Pvt. Ltd., MIDC Paitha, Dist- Aurangabad. EIA/EMP
Page 218
accident scenario and severity of the consequences will depend on type of product leaked, quantity of the product
leaked, location of the incident (tank farm/pumps/T/T plate form), availability of ignition source, response of
emergency systems and emergency team, weather conditions (wind velocity & direction), etc. Further propensity
of being killed or injured would also depend on the aspects like time of accident and number of people in damage
area at that time.
7.15.7. Probability estimation for occurance of mca scenario
Applying equipment failure rate data and ignition probability data probability values have been estimated for
consequences of various MCA scenarios, which are as follows:
For the following accident scenarios the categorization is as follows, which is inferred on the basis of past accident
analysis, information & approach provided in Green Book & Purple Book of EFFECTS, TNO:
Table 7-15Probability of Occurrences of Identified MCA Scenarios
Sr.No. Categorization Probability Range
1 Low < 10-3 To< or = 10-4 per year
2 Very Low < 10-4 To< or = 10-6 per year
3 Extremely Low < 10-6 per year on wards
Table 7-16The probabilities for various accident scenarios have been estimated
Sr.No. Accident Scenario Probability
1 Spilled Product catching fire Very Low (about 10-5 per year)
2 Jet Fire in Pipeline/Product Pumps/Tank Farm /TT
Decanting Area/Tank Truck
Very Low (about 10-5 per year)
3 Pool Fire in solvents in Main Tank farm Very Low (about 10-6 per year)
4 Vapor Cloud Explosion due to major release of Class A
product from storage unit
Extremely Low (about 10-8 per year)
7.16. Uncertainty surrounding consequence analysis
Analytical and mathematical models employed in quantification of damage distances are based on many
considerations, which have been discussed earlier.
In many cases, very general data is available on component and equipment failures, for which statistical accuracy
is often poor. Probability data has been found quite subjective, so that, when combined in a fault tree or event
tree the incident frequencies thus computed may not have a higher confidence range. Furthermore, it is difficult
to infer the comparison between frequencies of two catastrophic events, for example propensity of 10-4 and 10-5
per annum.
7.17. Alarp principle
ALARP stands for "as low as reasonably practicable". The ALARP principle is that the residual risk shall be
as low as reasonably practicable. It has particular connotation as a route to reduce risks SFAIRP (so far as is
reasonably practicable) in UK Health and Safety law.
For a risk to be ALARP it must be possible to demonstrate that the cost involved in reducing the risk further
would be grossly disproportionate to the benefit gained. The ALARP principle arises from the fact that infinite
time, effort and money could be spent on the attempt of reducing a risk to zero. It should not be understood as
simply a quantitative measure of benefit against detriment. It is more a best common practice of judgment of the
balance of risk and societal benefit. Following figure shows ALARP diagram.

M/s. Shalini Organics Pvt. Ltd., MIDC Paitha, Dist- Aurangabad. EIA/EMP
Page 219
NOTE- A risk of 10 per million per year or 10-5/Year; effectively means that any person standing at a point of
this level of risk would have a 1 in 100 000 chance of being fatally injured per year.
From table No. 15, it can be seen that, the probability / frequency of occurrence of Pool Fire due to catastrophic
failure of Storage tank structure is 1 x 10⁻⁶, and VCE is 1 x 10⁻⁸ per Year. Hence, as per ALARP Principle, the
risk is coming under “Broadly Acceptable region” which require maintaining normal precautions within the
Installation area.
Risk Assessment Criteria:
In order to determine acceptability, the risk results are assessed against a set of risk criteria as per UK HSE criteria.
UK HSE criteria:
Following points detail the UK HSE guidelines:
An individual risk below 1 x 10⁻⁶ fatalities per year is considered as acceptable for both plant workers and public.
An individual risk above 1 x 10⁻⁴ fatalities per year for public is considered as unacceptable and an individual
risk above 1 x 10⁻³ fatalities per year for workers is considered unacceptable. Between these limits the risk is
considered as ALARP (As Low as Reasonably Practicable). An indication of this is shown in the below figure
Societal risk can be represented by FN curves, which are plots of the cumulative frequency (F) of various accident
scenarios against the number (N) of casualties associated with the modelled incidents. The plot is cumulative in
the sense that, for each frequency, N is the number of casualties that could be equaled or exceeded.
Often ‘casualties’ are defined in a risk assessment as fatal injuries, in which case N is the number of people that
could be killed by the incidents.
IRPA
10-3/yr
10-4/yr
10-5/yr
10-6/yr
Intolerable
The ALARP or Tolerable
region (Risk is tolerated only)
Broadly Acceptable region
(no need for detailed working todemonstrate ALARP)
Fundamental improvements needed.Only to be considered if there are no
alternatives and people are well informed
Too high, significant effort required toimprove
High, investigate alternatives
Low, consider cost-effective alternatives
Negligible, maintain normal precautions

M/s. Shalini Organics Pvt. Ltd., MIDC Paitha, Dist- Aurangabad. EIA/EMP
Page 220
Individual Risk Criteria
The UK HSE Individual Risk Criteria was considered to assess the risk for Plant. Individual risk above 10-3 per
annum for any person shall be considered intolerable and fundamental risk reduction improvements are required.
Risk criteria for Individual Risk for on-site are as follows:
Individual risk levels above 1 x 10⁻³ per year will be considered unacceptable and will be reduced, irrespective
of cost
Individual risk levels below 1 x 10⁻⁶ per year will be broadly acceptable
Risk levels between 1 x 10⁻³ and 1 x 10⁻⁶ per year will be reduced to levels as low as reasonably practicable
(ALARP). That is the risk within this region is tolerable only of further risk reduction is considered impracticable
because the cost required to reduce the risk is grossly disproportionate to the improved gained
Societal Risk Criteria
When considering the risk associated with a major hazard facility, the risk to an individual is not always an
adequate measure of total risks; the number of the individuals at risk is also important. Catastrophic incidents
with the potential multiple fatalities have a little influence on the level of risk but have a disproportionate effect
on the response of society and impact of company reputation.
The concept of societal risk is much more than that for individual risk. A number of factors are involved which
make it difficult to determine single value criteria for application to a number of different situations. These factors
include;
- The hazard, the consequential risks and the consequential benefits
- The nature of assessment
- Factors of importance to the company, government, regulators and authorities, public attitudes and perception
and aversion to major accident

M/s. Shalini Organics Pvt. Ltd., MIDC Paitha, Dist- Aurangabad. EIA/EMP
Page 221
Societal risk is the relationship between frequency of an event and the number of people affected. Societal risk
from a major hazard facility can thus be expressed as the relationship between the number of potential fatalities
N following a major accident and frequency F at which N fatalities are predicated to occur. The relationship
between F and N, and the corresponding relationship involving F, the cumulative frequency of events causing N
or more fatalities, are usually presented graphically on log-log axis.
Societal risk should not be confused as being the risk to society or the risk as being perceived by society. The
word “societal” is merely used to indicate a group of people and societal risk refers to the frequency of multiple
fatality incidents, which includes workers and the public. Societal risk is usually represented by an FN (Frequency
– Number of Fatality) curve.
Figure 7-2 FN Curve
The highest frequency is found to be 1E-05/ year associated to Three (3) fatalities and the maximum number of
fatalities is Thirteen (13) with frequency of 4E-06/ year. F-N results, concludes that the Societal Risk falls in the
ALARP region.
Conclusion for IR/SR
1 Individual Risk (IR)
The IR value throughout the plant estimated is 4.5E-05 per year, which is in ALARP region.
2 Expected Number of Fatalities (PLL)
The estimated overall Potential Loss of Life (PLL) for the plant population is estimated 7E-05 per
year.
3 Societal Risk (F-N Curve)
The F-N curves show that societal risk for the overall population considered mostly
falls in the ALARP region (10-4 to 10-5).
NOTE - A risk of 10 per million per year, or 10-5/Year, effectively means that any person standing at a point of
this level of risk would have a 1 in 100 000 chance of being fatally injured per year.
7.17.1. Mitigation/preventive measures for mca scenarios
In order to mitigate/prevent any minor incident from becoming a major accident following measures along with
Onsite and if required Offsite Emergency (Disaster) Management Plan should be followed:

M/s. Shalini Organics Pvt. Ltd., MIDC Paitha, Dist- Aurangabad. EIA/EMP
Page 222
Spillage in tank area: small leakage through tank valves/joints will take a form of spillage if not identified
immediately. If this spillage gets on contact with ignition source will take a form of fire and lead to an accident.
In order to prevent it from becoming a major accident, stop the operation immediately. Remove the spillage with
proper corrective method from that area. REMOVE SPILLED PRODUCT using Sand or Fire Extinguishers (By
Spreading Foam Solution). Do not touch or walk through spilled material, stop leak if possible. Use water spray
to reduce vapor, do not put water directly on leak or spill area. And if ignition of spilled product takes place
necessary emergency procedure must be followed as soon as possible to avoid damage to other property due to
secondary effect accidents. For small spillage, flush area with flooding amounts of water.
Pool Fire in tank farm Area: Failure of outlet valve of tanks or any one of valve will lead to leakage of product.
This will form a pool inside tank farm area if not identified immediately. This pool if comes in contact with an
ignition source will lead to a major accident. In order to mitigate it, stop the operation immediately. Be ready will
all firefighting equipments at the site. Start sprinkler system to cool the surrounding tanks. Immediately follow
both onsite and offsite emergency plan.
Tank on Fire: For preventing tank on fire, cool the surrounding tanks by means of sprinkler system and foam
system. Bring all firefighting equipments at the site and start fighting with fire following proper onsite emergency
plan.
Unconfined Vapor Cloud Explosion: UVCE is a secondary domino effect. Vapors releasing into atmosphere
are not in so much quantity that it lead to an explosion. For an ignition, a proper mixture of fuel to air is required,
if this mixture between UEL & LEL comes in contact with an ignition source, it will lead to an explosion. In
order to prevent it, immediately stop the leakage from the source by identifying it. For this, it is recommended to
install hydrocarbon Detector in Pump House area, Tank Farm area and TT Gantry area (we have separately
recommended this point in recommendation heading 4.

M/s. Shalini Organics Pvt. Ltd.,MIDC Paitha, Dist- Aurangabad. EIA/EMP
Page 223
Figure 7-3 Pool Fire Scenario for Methanol Tanks Enclosed in Tank farm area showing Damage Distances
for considered Heat Intensities

M/s. Shalini Organics Pvt. Ltd., MIDC Paitha, Dist- Aurangabad. EIA/EMP
Page 224
Figure 7-4 Jet Fire Scenario for Methanol Tanks Enclosed in Tank farm area showing Damage Distances
for considered Heat Intensities

M/s. Shalini Organics Pvt. Ltd., MIDC Paitha, Dist- Aurangabad. EIA/EMP
Page 225
Figure 7-5 Tank on fire Scenario for Methanol Tanks Enclosed in Tank Farm Area showing Damage
Distances for considered Heat Intensities

M/s. Shalini Organics Pvt. Ltd., MIDC Paitha, Dist- Aurangabad. EIA/EMP
Page 226
Figure 7-6 Pool Fire Scenario for Toluene Tanks Enclosed in Tank farm area showing Damage Distances
for considered Heat Intensities

M/s. Shalini Organics Pvt. Ltd., MIDC Paitha, Dist- Aurangabad. EIA/EMP
Page 227
Figure 7-7 Jet Fire Scenario for Toluene Tanks Enclosed in Tank farm area showing Damage Distances
for considered Heat Intensities

M/s. Shalini Organics Pvt. Ltd., MIDC Paitha, Dist- Aurangabad. EIA/EMP
Page 228
Figure 7-8 Tank on fire Scenario for Toluene Tanks Enclosed in Tank Farm Area showing Damage
Distances for considered Heat Intensities

M/s. Shalini Organics Pvt. Ltd.,MIDC Paitha, Dist- Aurangabad. EIA/EMP
Page 229
Figure 7-9 Pool Fire Scenario for Acetone Tanks Enclosed in Tank farm Area showing Damage Distances
for considered Heat Intensities

M/s. Shalini Organics Pvt. Ltd., MIDC Paitha, Dist- Aurangabad. EIA/EMP
Page 230
Figure 7-10 Jet Fire Scenario for Acetone Tanks Enclosed in Tank farm area showing Damage Distances
for considered Heat Intensities

M/s. Shalini Organics Pvt. Ltd., MIDC Paitha, Dist- Aurangabad. EIA/EMP
Page 231
Figure 7-11 Tank on fire Scenario for Acetone Tanks Enclosed in Tank Farm Area showing Damage
Distances for considered Heat Intensities

M/s. Shalini Organics Pvt. Ltd., MIDC Paitha, Dist- Aurangabad. EIA/EMP
Page 232
Figure 7-12: Pool Fire Scenario for Ethyl Acetate Tanks Enclosed in Tank farm Area showing Damage
Distances for considered Heat Intensities
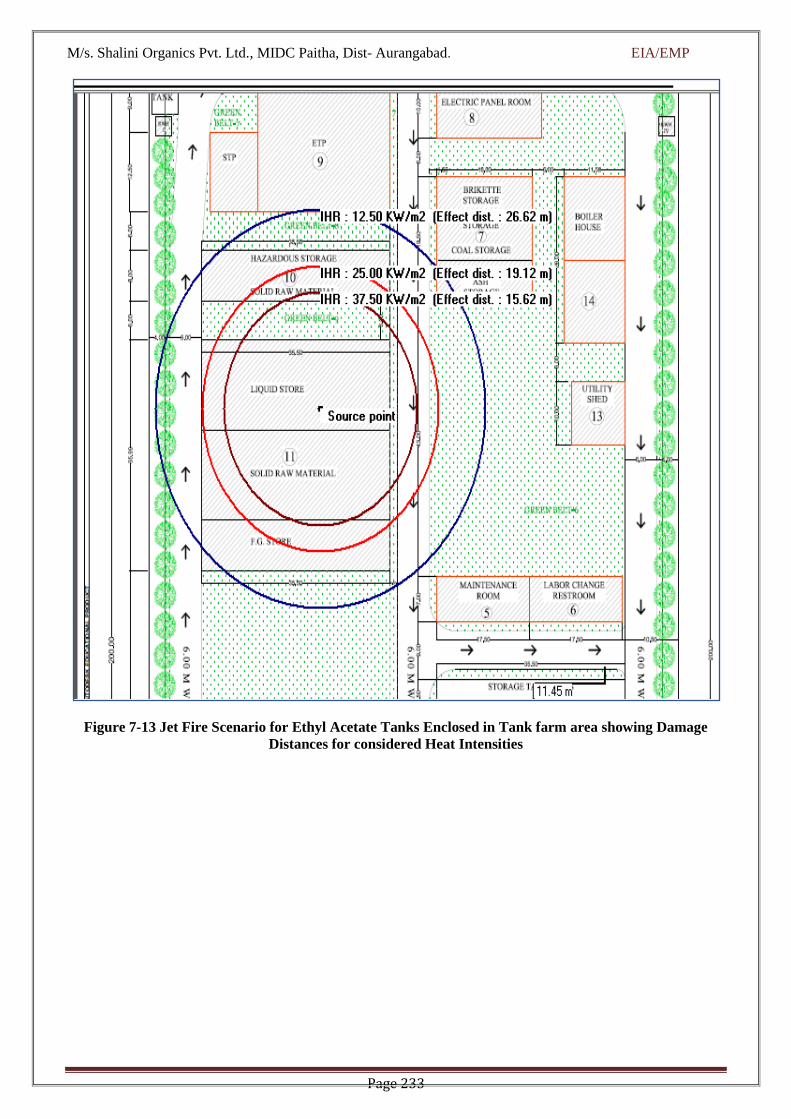
M/s. Shalini Organics Pvt. Ltd., MIDC Paitha, Dist- Aurangabad. EIA/EMP
Page 233
Figure 7-13 Jet Fire Scenario for Ethyl Acetate Tanks Enclosed in Tank farm area showing Damage
Distances for considered Heat Intensities

M/s. Shalini Organics Pvt. Ltd., MIDC Paitha, Dist- Aurangabad. EIA/EMP
Page 234
Figure 7-14 Tank on fire Scenario for Ethyl Acetate Tanks Enclosed in Tank Farm Area showing
Damage Distances for considered Heat Intensities

M/s. Shalini Organics Pvt. Ltd., MIDC Paitha, Dist- Aurangabad. EIA/EMP
Page 235
Figure 7-15 Pool Fire Scenario for Denatured Sprit Tanks Enclosed in Tank farm Area showing Damage
Distances for considered Heat Intensities
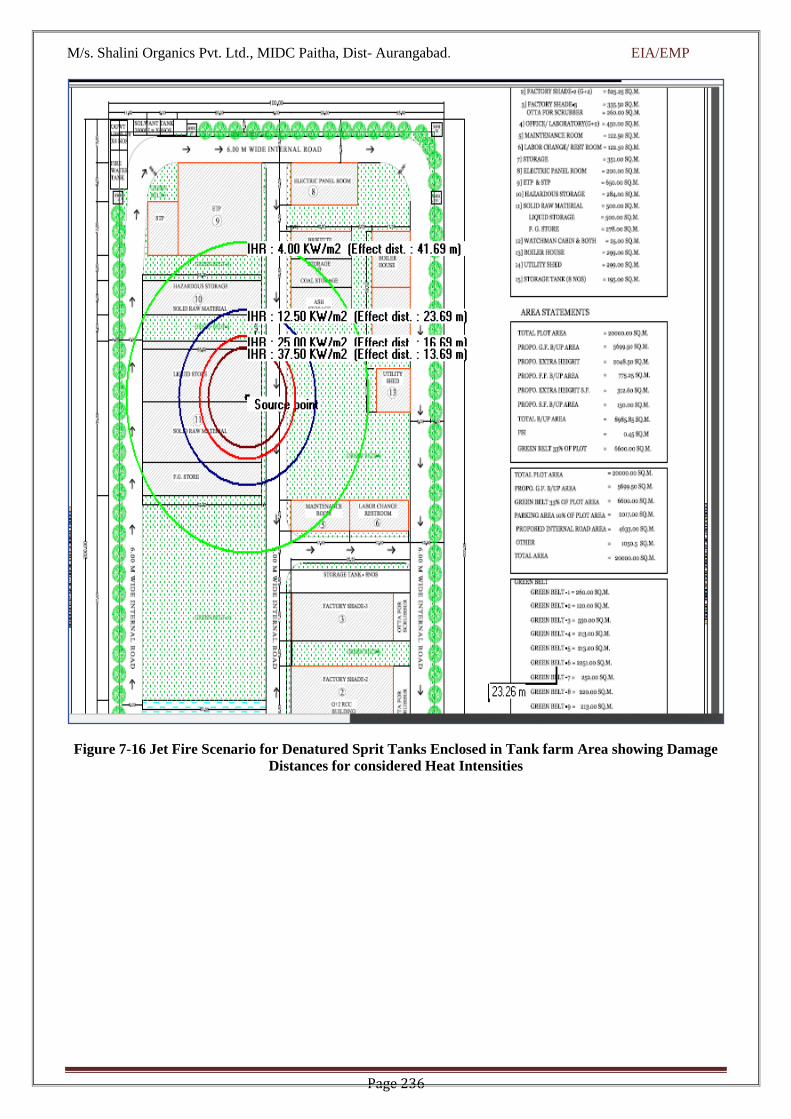
M/s. Shalini Organics Pvt. Ltd., MIDC Paitha, Dist- Aurangabad. EIA/EMP
Page 236
Figure 7-16 Jet Fire Scenario for Denatured Sprit Tanks Enclosed in Tank farm Area showing Damage
Distances for considered Heat Intensities

M/s. Shalini Organics Pvt. Ltd., MIDC Paitha, Dist- Aurangabad. EIA/EMP
Page 237
Figure 7-17 Tank on fire Scenario for Denatured Sprit Tanks Enclosed in Tank Farm Area showing
Damage Distances for considered Heat Intensities

M/s. Shalini Organics Pvt. Ltd., MIDC Paitha, Dist- Aurangabad. EIA/EMP
Page 238
Figure 7-18 Pool Fire Scenario for Triethyl amine drum Enclosed in Tank farm Area showing Damage
Distances for considered Heat Intensities

M/s. Shalini Organics Pvt. Ltd., MIDC Paitha, Dist- Aurangabad. EIA/EMP
Page 239
Figure 7-19 Damage Distances Due to BLEVE Fire ball in Triethyl Amine
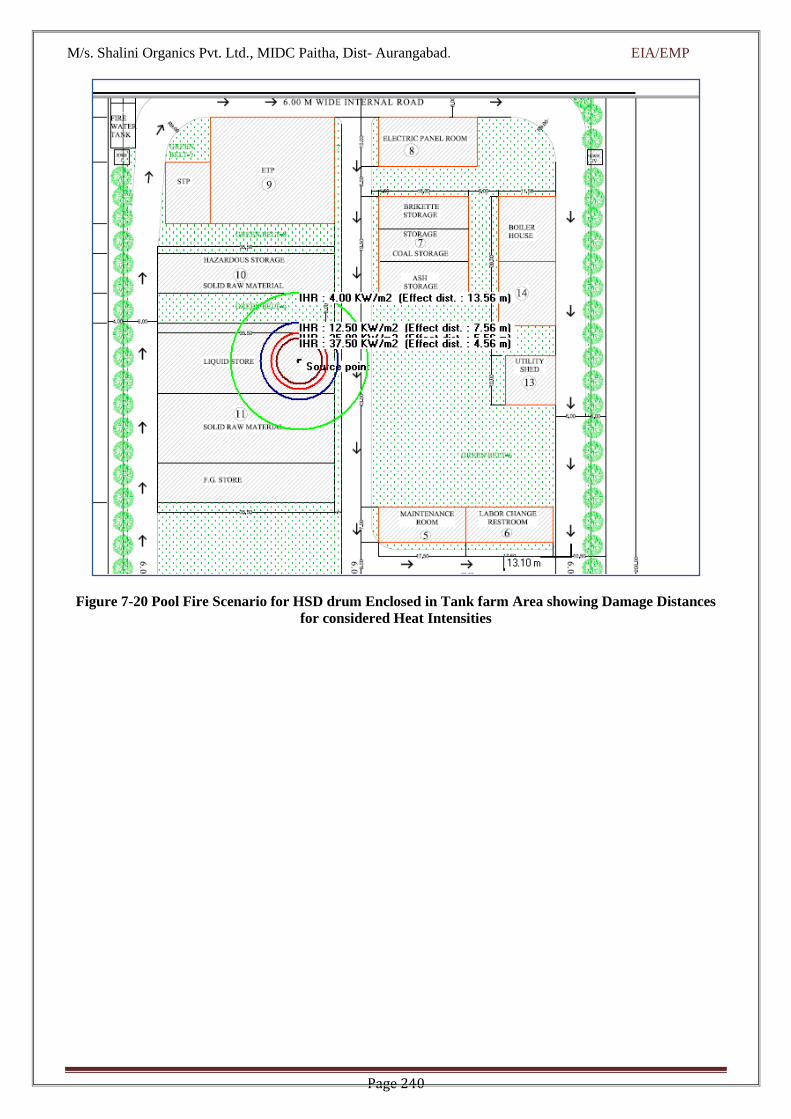
M/s. Shalini Organics Pvt. Ltd., MIDC Paitha, Dist- Aurangabad. EIA/EMP
Page 240
Figure 7-20 Pool Fire Scenario for HSD drum Enclosed in Tank farm Area showing Damage Distances
for considered Heat Intensities

M/s. Shalini Organics Pvt. Ltd., MIDC Paitha, Dist- Aurangabad. EIA/EMP
Page 241
7.17.2. Recommendations
The periodic inspection and maintenance program on the tank would be ensured.
The periodic maintenance of the pumps and piping would be ensured.
Least number of flanged joints will be provided in the pipelines.
The pipelines will be supported adequately so as to avoid sagging of the same during operation.
Visual inspection of the pipelines will be done periodically to ascertain external pitting and
corrosion.
Protective painting on the tank and pipeline shall be provided.
Protective equipment such as gloves, lab coat, vapor respirator, splash goggles shall be ensured
while handling the substance.
Prominent signage of hazards (such as “Danger”, No smoking”) of the substances shall be provided
on the tank and surroundings
The tank installation will be protected against lightening.
All Electric Equipment & Fittings (e.g. Pump-motors, lamps, junction boxes, switches etc.) shall
be of Flame-proof Type, conforming to IS/IEC 60079 i.e. old IS 2148:1981, suitable for GR. II
A/II B and shall be of type approved by the CCoE.
Earthing is to be provided to the storage area for dealing with the static charges that might generate
during the loading and unloading of the solvents.
Provision of sand buckets, foam monitor, fire extinguishers & hydrant line near PESO area were
made available.
Appropriate drainage with the slope of 2 % is provided to remove small and large spillage of the
chemicals.
Provision of spill kit is provided to deal with the minor spillage scenario.
Permission of Joint Chief Controller (explosives), West circle is obtained
Solvent storage is constructed of non combustible materials.
The secondary containment is provided and is kept clean and free from any accumulation of
inflammable liquids.
The storage shed is ventilated near the ground level and also near the roof. The ventilators are
covered with two layers of fine copper or non corrodible metal wire gauge of mesh not less than
11 meshes per linear cm.
No alteration is carried out without written permission of licensed authority.
The safety distance of 7.5mtr is kept from the shed.
All the empty receptacles are kept securely closed unless they have been thoroughly cleaned.
The suitable extinguishers (DCP) are kept immediately outside the storage shed.
Daily inventory of Solvent is to be maintained.
The chemicals are isolated from another chemical in well ventilated area and hazard warning
information is shown.
SOP is prepared for handling such chemicals and it should be strictly followed.
Spill kit is provided for storage to limit the spill of materials. Suitable Absorbent like sodium bi
carbonate is used to absorb the spill.
Proper training is provided to workers prior to handling and transporting chemicals.
PPE’s like face shield, goggles, apron, gloves, gumboots are used while handling the chemicals to
avoid exposure to chemicals.

M/s. Shalini Organics Pvt. Ltd., MIDC Paitha, Dist- Aurangabad. EIA/EMP
Page 242
The raw materials are stored according to their compatibility.
Toxic materials are stored in cool place and kept away from heat.
Toxic material can cause breathing difficulty therefore storage area is well ventilated.
Good housekeeping practice is implemented in storage area.
Appropriate drainage with the slope of 2 % is provided to remove small and large spillage of the
chemicals.
The provision of fire water supply is provided through the hydrant line passing from the raw
material storage area
PPE’s are used wherever necessary.
MSDS recommendations are strictly followed while chemical storage and handling

M/s. Shalini Organics Pvt. Ltd., MIDC Paitha, Dist- Aurangabad. EIA/EMP
Page 243
8. PROJECT BENEFITS
8.1. Introduction
This chapter illustrates beneficial points to the surrounding community or country as a whole in terms of
infrastructural development, social development, boosting employment and other tangible benefits due to
proposed API’s products manufacturing plant by M/s. Shalini Organics Pvt Ltd.
8.2. Improvement in Physical Infrastructure
M/s. Shalini Organics Chemical Pvt. Ltd. has proposed to manufacturing of API and API Intermediate.
Total production capacity of the plant will be API= 6 Nos., Capacity = 112 MT/Month and API Intermediate
= 43 Nos., Capacity =1171MT/Month Total Capacity= 1283 MT/Month. The project will have requirement
of an infrastructure; so direct benefits of infrastructure development is anticipated.
The project proposes employment generation to local people which will help to increase the income of local
people & improve their living standard. Total 60 persons are expected to be employed including skilled,
semi-skilled and unskilled category in the proposed unit for the various job categories. The preference will
be given to local population for employment in the semi-skilled and unskilled category; this will increase
the employment opportunity in the surrounding area hence, with the growth in the economic conditions,
the project may lead to growth in the social status & improvement of the quality of life in the surrounding
area. It will also help in improvement in local amenities. Thus, the project will have considerable indirect
benefits to the public physical infrastructures.
8.3. Direct Revenue Earning to the National & State Exchequer
The proposed project will contribute revenue to the Central & State exchequer in the form of Goods &
Services Tax {GST}, income tax, corporate taxes etc. Indirect contribution to the Central & State exchequer
will be there due to Income by way of registration of trucks, payment of road tax, income tax from
individuals as well as taxes from associated units. Thus, the proposed project will help the Government by
paying different taxes from time to time, which is a part of revenue and thus, will help in developing the
area.
8.4. Employment Potential
In the construction phase, direct and indirect manpower will be involved. Thus temporary and permanent
employment will be generated during construction phase. The proposed manpower requirement during
construction will be 10-20 nos. During the operation phase, 60 nos. of skilled and unskilled manpower will
be required. Moreover, unit will provide first priority to local workers for the employment. Further, the
indirect employment via increased transportation, ancillary units & local economic activities will also add
in the employment potential of the project. Thus, the unit will result in considerable benefits in terms of
employment.
8.5. Other Tangible Benefits
The proposed project is likely to have other tangible benefits as given below.
Indirect employment opportunities to local people in contractual works like housing construction,
transportations, sanitation, for supply of goods and services to the project and other community services.

M/s. Shalini Organics Pvt. Ltd., MIDC Paitha, Dist- Aurangabad. EIA/EMP
Page 244
Market and business establishment facilities
Improvement in Cultural, recreation and aesthetic facilities
Improvement in communication, transport, education, community development and medical facilities.
The project will contribute additional revenue to the State and Central exchequer in the form different
kind of taxes.

M/s. Shalini Organics Pvt. Ltd., MIDC Paitha, Dist- Aurangabad. EIA/EMP
Page 245
9. ENVIRONMENTAL COST BENEFIT ANALYSIS
As per EIA Notification 2006, this Chapter of the ‘Environmental Cost Benefit Analysis’ is applicable only
if it is recommended at the Scoping stage. As per the standard ToR issued by MoEF&CC, New Delhi vide
File No IA-J-11011/281/2020-IA-II(I) on dated 27.11.2020, the Environmental Cost Benefit Analysis is
not applicable and hence has not been prepared.
M/s. Shalini Organics Pvt. Ltd., MIDC Paitha, Dist- Aurangabad. EIA/EMP
Page 246
10. ENVIRONMENTAL MANAGEMENT PLAN
10.1. Introduction
The environmental management plan consists of the set of mitigation, management, monitoring and
institutional measures to be taken during implementation and operation to eliminate adverse environmental
impacts or reduce them to acceptable levels. The present environmental management plan addresses the
components of environmental affected during construction of the plant and by the different activities
forming part of the manufacturing processes.
Environmental Policy
i. Overall conservation of environment.
ii. Minimization of waste generation and pollution.
iii. Judicious use of natural resources and water.
iv. Safety, welfare and good health of the work force and populace.
v. Ensure effective operation of all control measures.
vi. Vigilance against probable disasters and accidents.
vii. Monitoring of cumulative and long-time impacts.
viii. Ensure effective operation of all control measures.
Annual review of the entire system and various environment management as well as process control and
monitoring systems shall be done. Environment monitoring shall be done to collect the data on air, water,
soil, noise etc. and duly recorded. Environmental Management Plan which shall be implemented is detailed
under the following heads:
i. Pollution Control Systems
ii. Waste Minimization and Resource Conservation
iii. Occupational Health and Safety
iv. Socio-Economic Development
v. Greenbelt Development Plan
Standard operating procedure, formats will be developed and records will be maintained. Provision of
internal audit will be made. Any NCs/Observation will be directly conveyed to Management and
accordingly corrective and preventive action will be taken.
10.2. Environmental management plan during Construction Phase
Construction phase results in temporary environmental pollution except for the permanent change in local
land use pattern & aesthetics in certain cases. Such pollution is mainly due to site preparation, civil works,
transportation, storage & handling of construction materials, construction worker’s sanitation etc. These
are usually short-term impacts. The project proponent will take appropriate steps to control pollution during
construction phase.
10.2.1. 10.2.1 Air and Noise Environment
During construction work, air pollution is expected in the form of increased suspended particulate matter
concentration. Installation work will generate noise and dust, but it will be within working areas. Vehicular
movement in the premises will also generate dust.

M/s. Shalini Organics Pvt. Ltd., MIDC Paitha, Dist- Aurangabad. EIA/EMP
Page 247
To mitigate the impact, following measures will be taken:
Regular sprinkling of the water will be done.
Regular preventing maintenance of machinery and transportation vehicles will be carried out.
Provision of silencer to noise generating machines, if required, and
Noise protection devices such as earmuffs/earplugs will be provided to workers working in noisy area.
10.2.2. Water supply & sanitation
During construction phase, water will be provided to workers for their requirement & for construction
activity. Water supply will be met from surface water source. Portable sanitation facilities will be provided
to maintain proper standards of hygiene. These facilities would preferably be connected to a septic tank and
shall be maintained properly to have least environmental impact.
10.2.3. Socio-Economic Environment
The proposed manpower requirement during construction will be 20-30nos. Unit will give preference to
local people through both direct andindirect employment.

M/s. Shalini Organics Pvt. Ltd., MIDC Paitha, Dist- Aurangabad. EIA/EMP
Page 248
10.2.4. Health and Safety
Adequate rest area will be provided to the construction workers, truck drivers. The safety department will
supervise the safe working of the contractor and their employees. Work spots will be maintained clean,
provided with optimum lighting and enough ventilation to eliminate dust.
10.3. Environmental Management during the Operational Phase
EMP proposed for implementation is detailed under the following heads:
Air Pollution Management
Wastewater Management
Solid/Hazardous Waste Management
Noise Management
Greenbelt Development
Occupational Safety and Health
Implementation of EMP and monitoring programme
10.3.1. Air Pollution Management
10.3.1.1. Source of Air Pollution and Control Measures
Flue gas emission will be from stacks attached with 1no. of boiler (2 TPH), one stack attached to Thermic
Fluid Heater (2.0 lakhs kcal/hr.) and two stack attached to stand by D.G. Set (2x 250 kVA). Briquette will
be used as a fuel in Boiler and TFH and HSD in stand by D.G. Set. Most probable pollutants will be SPM,
SO2 and NOx. Cyclone, Bag Filter and water scrubber will be installed for control of PM (Particulate
Matter).
Process emission will be from stack attached with process vessel. Probable pollutants will be PM, SO2,
NOx. To control pollutants, Alkali Scrubbers will be installed for process emission; whereas in-built Bag
Filter and Cyclone & water scrubber will be installed as APCM for vent of drying equipment.
Furthermore, adequate stack height and facility for sampling such as ladder, platform & sampling point will
be provided as per the MPCB guidelines.
Action plan for control of fugitive emission
Unit will adopt following measures to control fugitive emission-
Entire process will be carried out in closed reactors,
Pneumatically transfer of liquid raw material in rector,
Provision of mechanical seals in pumps
Proper preventive maintenance of seals for tanks,
Raw material will be stored in the covered structure,
Provision of dust suppression system (water sprinklers) to control air borne dust,
Fly ash will be stored in covered sheds only,
Internal road will be concreted or paved to reduce the fugitive emission during vehicular movement,
Greenbelt will be developed around the plant,

M/s. Shalini Organics Pvt. Ltd., MIDC Paitha, Dist- Aurangabad. EIA/EMP
Page 249
Frequent work area monitoring will be done ensure fugitive emissions level.
10.3.1.2. Measures for Solvent recovery
The solvent distillation activity is carried out for the minimizing the raw material cost & to reduce use of
fresh solvent in the process. The solvent recovery flow diagram as per follows:
Distillation column will be installed for the recovery of solvent. The unit shall be equipped with stainless
steel reactor, Stainless Steel packed column, Stainless Steel condensers, Stainless Steel receivers and
Stainless Steel collection tanks. The spent solvents from various processes shall be collected as mother
liquor from Production & will be sent for solvent recovery system. The distilled solvent shall be reused for
the reaction. The remaining spent residue will be send to disposal through Common Hazardous Waste
Treatment storage and Disposal facility (CHWTSDF). Adequate Firefighting system is provided to cover
the entire solvent recovery plant. The details of solvent used, solvent recovered and fresh makeup etc. are
given in Annexure 2 (ii) Detailed Manufacturing process of all products.
10.3.1.3. Odour Control Plan
Odour control outlines the methods by which odour emission will be systematically be assessed,reduced
and prevented potentially from the plant. Odour management will be done by followingmethods;
Removal of odour from collection air stream; effective air cleaning technologies like scrubbers,
bioreactors
Green belt development; can help to mitigate or obfuscate the odour problem
Reduction of odour at generation source: this is most effective way of controlling odour. This is
done by storing volatile material in closed container to prevent volatile emissionand carrying out
chemical reaction in a closed chamber.
10.3.2. Water Environment
Unit will satisfy its fresh water requirement from Surface water of MIDC water supply. Total water
requirement (Industrial + Domestic + Greenbelt) will be 246.0 KLD; out of which 73.0 KLD will be fresh
water requirement & 135.0 KLD will be recycle/treated water (ETP-RO permeate, Condensate water from
MEE). Total industrial wastewater generation will be 136.1 KLD. The main source of the industrial
wastewater generation will be from process (115.0 KLD), Washing (0.5 KLD), scrubber (1.6 KLD) Boiler
(3.8 KLD) & Cooling (5.5 KLD), others (9.7), Domestic wastewater generation will be 9.0 KLD.
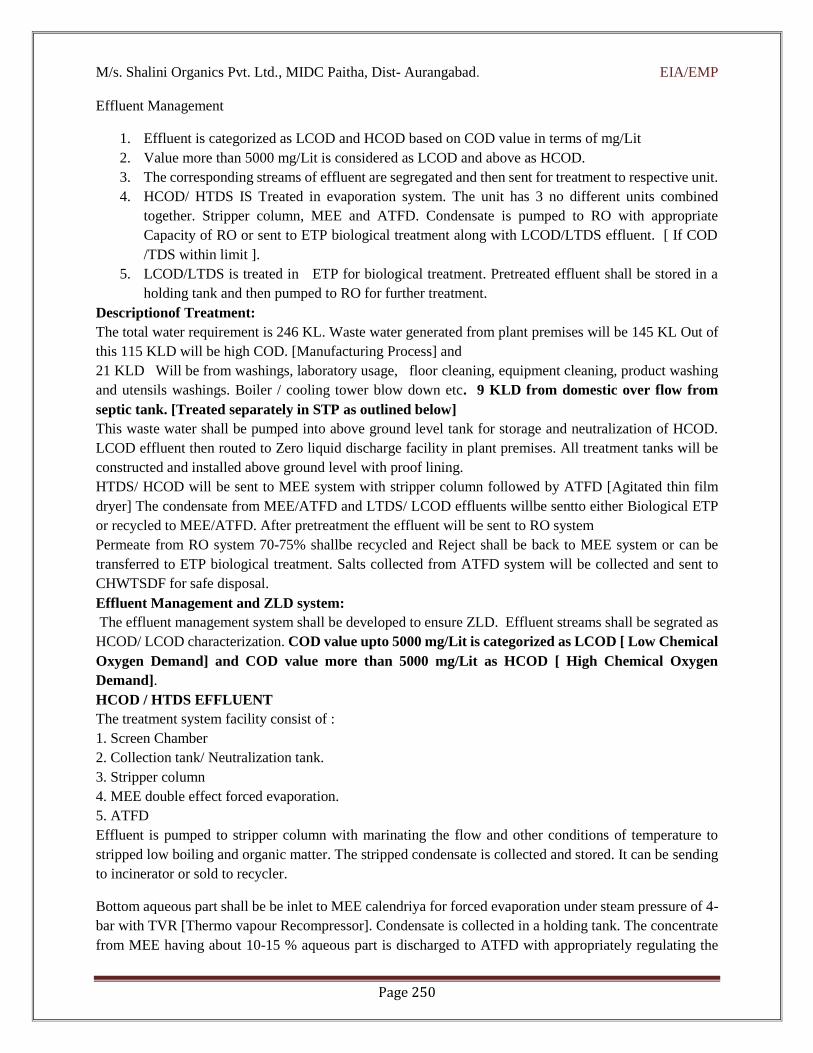
M/s. Shalini Organics Pvt. Ltd., MIDC Paitha, Dist- Aurangabad. EIA/EMP
Page 250
Effluent Management
1. Effluent is categorized as LCOD and HCOD based on COD value in terms of mg/Lit
2. Value more than 5000 mg/Lit is considered as LCOD and above as HCOD.
3. The corresponding streams of effluent are segregated and then sent for treatment to respective unit.
4. HCOD/ HTDS IS Treated in evaporation system. The unit has 3 no different units combined
together. Stripper column, MEE and ATFD. Condensate is pumped to RO with appropriate
Capacity of RO or sent to ETP biological treatment along with LCOD/LTDS effluent. [ If COD
/TDS within limit ].
5. LCOD/LTDS is treated in ETP for biological treatment. Pretreated effluent shall be stored in a
holding tank and then pumped to RO for further treatment.
Descriptionof Treatment:
The total water requirement is 246 KL. Waste water generated from plant premises will be 145 KL Out of
this 115 KLD will be high COD. [Manufacturing Process] and
21 KLD Will be from washings, laboratory usage, floor cleaning, equipment cleaning, product washing
and utensils washings. Boiler / cooling tower blow down etc. 9 KLD from domestic over flow from
septic tank. [Treated separately in STP as outlined below]
This waste water shall be pumped into above ground level tank for storage and neutralization of HCOD.
LCOD effluent then routed to Zero liquid discharge facility in plant premises. All treatment tanks will be
constructed and installed above ground level with proof lining.
HTDS/ HCOD will be sent to MEE system with stripper column followed by ATFD [Agitated thin film
dryer] The condensate from MEE/ATFD and LTDS/ LCOD effluents willbe sentto either Biological ETP
or recycled to MEE/ATFD. After pretreatment the effluent will be sent to RO system
Permeate from RO system 70-75% shallbe recycled and Reject shall be back to MEE system or can be
transferred to ETP biological treatment. Salts collected from ATFD system will be collected and sent to
CHWTSDF for safe disposal.
Effluent Management and ZLD system:
The effluent management system shall be developed to ensure ZLD. Effluent streams shall be segrated as
HCOD/ LCOD characterization. COD value upto 5000 mg/Lit is categorized as LCOD [ Low Chemical
Oxygen Demand] and COD value more than 5000 mg/Lit as HCOD [ High Chemical Oxygen
Demand].
HCOD / HTDS EFFLUENT
The treatment system facility consist of :
1. Screen Chamber
2. Collection tank/ Neutralization tank.
3. Stripper column
4. MEE double effect forced evaporation.
5. ATFD
Effluent is pumped to stripper column with marinating the flow and other conditions of temperature to
stripped low boiling and organic matter. The stripped condensate is collected and stored. It can be sending
to incinerator or sold to recycler.
Bottom aqueous part shall be be inlet to MEE calendriya for forced evaporation under steam pressure of 4-
bar with TVR [Thermo vapour Recompressor]. Condensate is collected in a holding tank. The concentrate
from MEE having about 10-15 % aqueous part is discharged to ATFD with appropriately regulating the
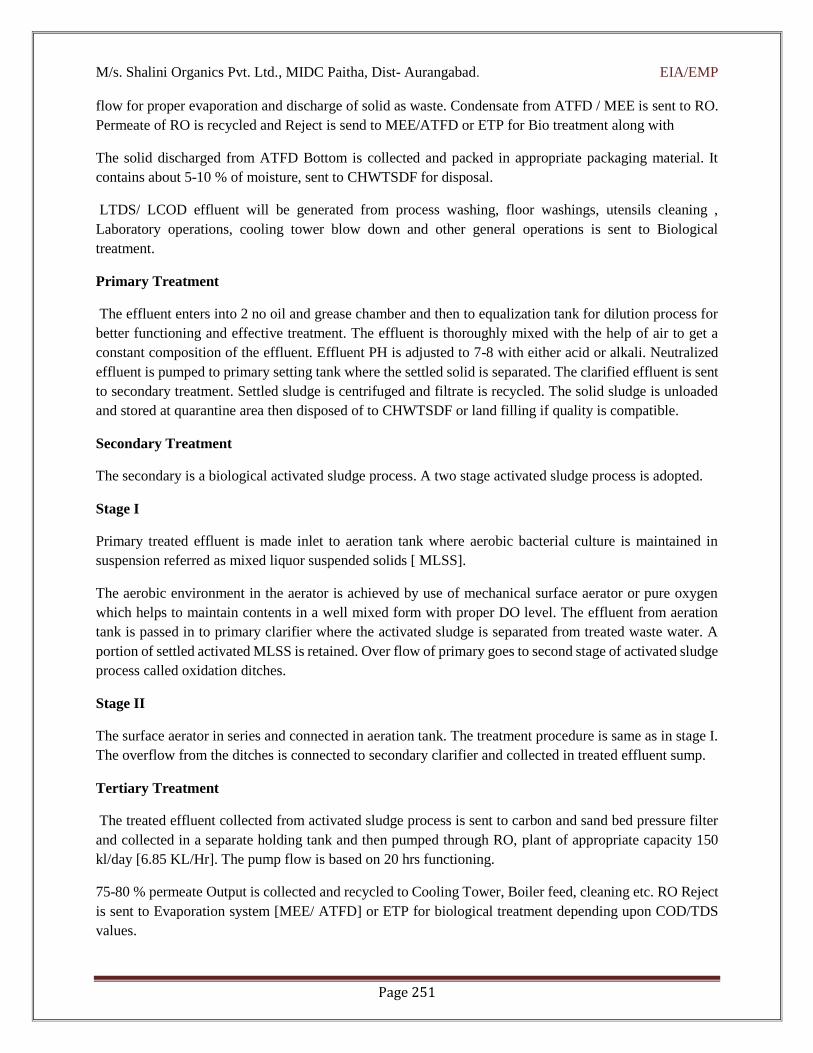
M/s. Shalini Organics Pvt. Ltd., MIDC Paitha, Dist- Aurangabad. EIA/EMP
Page 251
flow for proper evaporation and discharge of solid as waste. Condensate from ATFD / MEE is sent to RO.
Permeate of RO is recycled and Reject is send to MEE/ATFD or ETP for Bio treatment along with
The solid discharged from ATFD Bottom is collected and packed in appropriate packaging material. It
contains about 5-10 % of moisture, sent to CHWTSDF for disposal.
LTDS/ LCOD effluent will be generated from process washing, floor washings, utensils cleaning ,
Laboratory operations, cooling tower blow down and other general operations is sent to Biological
treatment.
Primary Treatment
The effluent enters into 2 no oil and grease chamber and then to equalization tank for dilution process for
better functioning and effective treatment. The effluent is thoroughly mixed with the help of air to get a
constant composition of the effluent. Effluent PH is adjusted to 7-8 with either acid or alkali. Neutralized
effluent is pumped to primary setting tank where the settled solid is separated. The clarified effluent is sent
to secondary treatment. Settled sludge is centrifuged and filtrate is recycled. The solid sludge is unloaded
and stored at quarantine area then disposed of to CHWTSDF or land filling if quality is compatible.
Secondary Treatment
The secondary is a biological activated sludge process. A two stage activated sludge process is adopted.
Stage I
Primary treated effluent is made inlet to aeration tank where aerobic bacterial culture is maintained in
suspension referred as mixed liquor suspended solids [ MLSS].
The aerobic environment in the aerator is achieved by use of mechanical surface aerator or pure oxygen
which helps to maintain contents in a well mixed form with proper DO level. The effluent from aeration
tank is passed in to primary clarifier where the activated sludge is separated from treated waste water. A
portion of settled activated MLSS is retained. Over flow of primary goes to second stage of activated sludge
process called oxidation ditches.
Stage II
The surface aerator in series and connected in aeration tank. The treatment procedure is same as in stage I.
The overflow from the ditches is connected to secondary clarifier and collected in treated effluent sump.
Tertiary Treatment
The treated effluent collected from activated sludge process is sent to carbon and sand bed pressure filter
and collected in a separate holding tank and then pumped through RO, plant of appropriate capacity 150
kl/day [6.85 KL/Hr]. The pump flow is based on 20 hrs functioning.
75-80 % permeate Output is collected and recycled to Cooling Tower, Boiler feed, cleaning etc. RO Reject
is sent to Evaporation system [MEE/ ATFD] or ETP for biological treatment depending upon COD/TDS
values.

M/s. Shalini Organics Pvt. Ltd., MIDC Paitha, Dist- Aurangabad. EIA/EMP
Page 252
10.3.3. Hazardous/Solid Waste Management
Main source of hazardous waste generation will be ETP waste (250 Kg/day) and Solvent Distillation
Residue (3958.14 Kg/month) will be disposed of at approved TSDF site. Evaporation Salts (8540 Kg/Day)
and Spent Carbon/ Hyflow (107.88 Kg/day) will be disposed of at approved TSDF site. Off Specification
Products (100 Kg/day) and Spent Oil/ Process Residue/ Waste (200 Kg/ Months) will be disposed through
CHWSTDF. Spent Mother Liquor (8275.05 Kg/day) and Spent Solvent (6747.828 Kg/day) will be Sale to
authorized user. Discarded containers and Drums Barrels (100 nos./ Month) will be send to authorised
dealers. Spent Oil/ Process Residue/ Waste and Chemical sludge, Oil and grease skimming residues will be
sending to CHWSTDF. Entire quantity of hazardous waste will be handled & disposed as per Hazardous
& Other Waste (Management & Transboundary Movement) Rules, 2016.
Storage and Transportation of Solid/Hazardous Waste:
Proper Hazardous waste storage area with impervious flooring and covered shed is provided for
storage of solid/hazardous waste.
Entire quantity of the hazardous waste is stored in the isolated hazardous waste storage area within
premises having leachate collection system and roof cover. The storage yard shall be properly
labelled for identification of wastes.
Hazardous waste shall not be stored for a period more than 90 days.
Records of the same shall be maintained and make them available for inspection.
Properly packed & labelled waste shall be transported through dedicated vehicle to authorized
TSDF facility.
10.3.4. Green belt development
The factory has its own land of 20000 Sq.m; out of which 6600.42 sq. m. area is available for greenbelt
development. At present, the Industry has planted 65 trees. As per the CPCB guidelines, 2500 tress required
to be planted. The remaining 1600 trees shall be planted within a year.
Development of greenbelt in and around the industry is an effective way to check pollutants and their
dispersion into surrounding areas. The degree of pollution attenuation by a green belt depends on its height
and width, foliage surface area and density. The main objective of the green belt around the factory is:
Mitigation of impacts due to fugitive emissions.
Attenuation of noise levels.
Ecological restoration.
Creation of the aesthetic environment.
Wastewater reuse.
Reduction in greenhouse gases and release of oxygen due to photosynthesis.Criteria for Selection
of species for Green Belt
Tolerance to water stress and extreme climatic conditions
The difference in height and growth habits
Aesthetic and pleasing appearance
Provide shade
Large biomass to provide fodder and nitrogen

M/s. Shalini Organics Pvt. Ltd., MIDC Paitha, Dist- Aurangabad. EIA/EMP
Page 253
Improving wasteland
To suit specific climate and soil characteristics (local species).
Sustainability with minimum maintenance
Recommended plant species shall be utilized for the development of green belt and greenery in and
around the factory premises.
Native species
10.3.4.1. Suggested Plant Species for Green Belt
The plantation within the green belt should be heterogeneous in composition following native plants in a
mixed composition are suggested for green belt.
Table 10-1List of Plants Suggested For Green Belt
Sr.
No. Botanical name Family
Common
name
No. of tree
existing
No. of
trees
proposed
on site
Total no.
of trees
1 Cassia fistula Ceasalpiniaceae Bahava 10 200 210
2 Bombax ceiba Bombacaceae Sawar 12 200 212
3 Asltonia shcolaris Apocynaceae Saptaparni - 250 250
4 Macaranga peltata Euphorbiaceae Chandwar - 150 150
5 Schleichera oleosa Sapindaceae Kususm - 175 175
6 Microcos
paniculata Tiliaceae Shirali 15 180 195
7 Terminalia elliptica Combretaceae Ain 25 200 225
8 Terminalia
paniculata Combretaceae Kindal 03 150 153
9 Terminalia
bellirica Combretaceae Baheda - 80 80
Total 65 1585 1650
10.3.5. Occupational Health & Safety Plan
To maintain high standard in Health, Safety and Environment, necessary key mitigation measures &
action plan as EMP has been suggested as described below.
Post-employment health check-up programs will be carried out annually and all records &
documents related with employee health check-up program will be maintained.
As per RA report, all risk control & prevention measures in the unit will be implemented.
Necessary PPEs, safety equipment’s/materials to ensure healthy & safe work conditions will be
provided to employees.
All employees will be provided with required set of PPEs like ear plug, ear muff etc. where noise
levels in excess of 80 dB (A) are regularly generated.

M/s. Shalini Organics Pvt. Ltd., MIDC Paitha, Dist- Aurangabad. EIA/EMP
Page 254
It is recommending that Pre-employment health check-up programs shall be carried out for every
new employee and all records & documents related with employee health check-up program shall
be maintained by the proponent.
Safety documents, procedures, guidelines along with MSDS shall be provided to the
associated/concerned personnel engaged in respective operational activities
Training programs & safety audit shall be done on regular basis to prevent impacts of the
operational activities on occupational health as well as to improve workplace condition & safe
work system.
The proponent shall ensure implementation of emergency management plan with provision of
fire-fighting equipment/facilities, first aid & medical facilities, evacuation procedures etc.
Proponent shall also ensure proper implementation & functioning as well as assess effectiveness
of this safety & emergency system on regular basis throughout the project operation phase.
10.3.6. Rain Water HarvestingScheme
The scheme of reuse of rainwater is implemented successfully in the unit and shall be maintained after
expansion. The total annual Rainwater Harvesting Potential of the industry is 2375.32 m3 per year. This
shall be stored in the tank and utilized for ground water recharge.
.The detailed rainwater harvesting plan is given in Annexure-V.
10.3.7. Storm water management
In developed area like Industrial estate or company premises, impervious surface such as pavements in
factory premises prevents precipitation from naturally soaking to the ground, instead of that water runs into
storm drains. Managing the quantity and quality of storm water is termed, "Storm water Management."
Storm water quantity can be estimated by three methods.
SCS Technique: Curve number method ofUSDA
Commercial Software: Storm water management model (SWMM) orSTORM
Rational Method
The details are included in Annexure-VI.
10.4. Post-Project Environmental Monitoring
The highlights of the integrated environmental monitoring plan are:
Regular monitoring of all gaseous emissions from stacks & fugitive emissions in the process areas.
The stack monitoring facilities like ladder, platform and port-hole of all the stacks maintained in
good condition.
The performance of air pollution control equipments will be evaluated based on these monitoring
results.
Water consumption in the unit recorded daily.
Analysis of effluent will be carried out regularly.
Performance of effluent treatment plant units, RO and Spray Dryer will be evaluated based on
above analysis results.
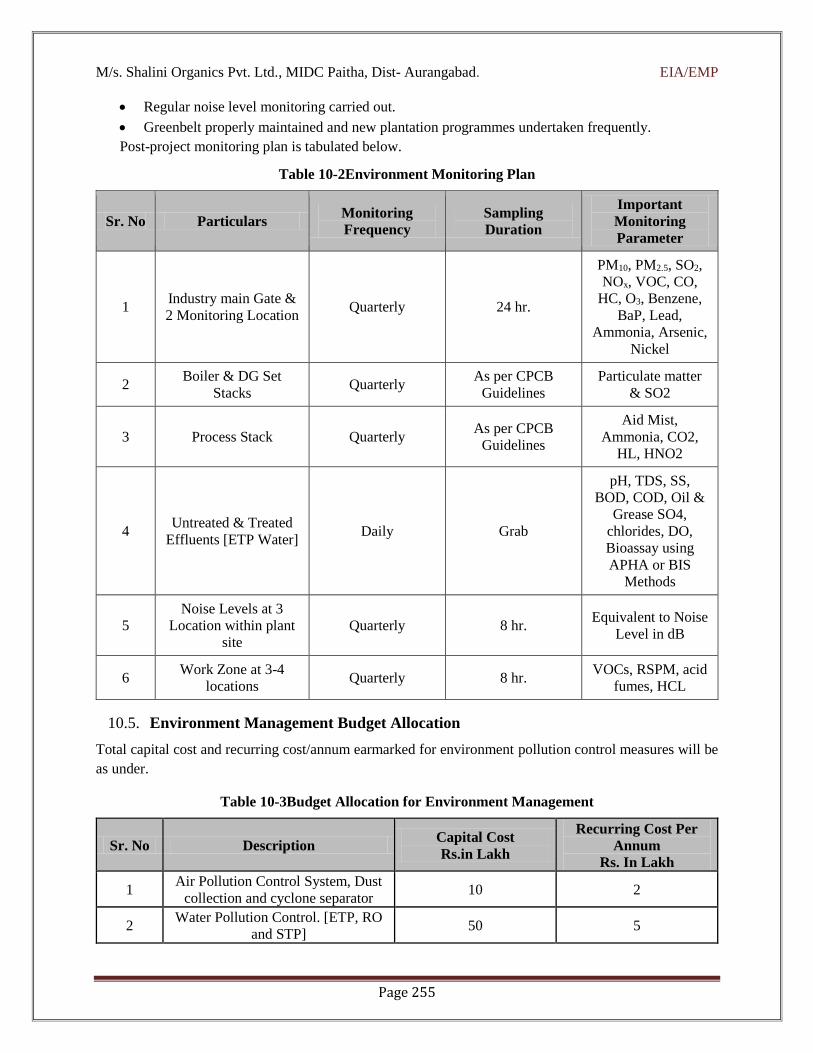
M/s. Shalini Organics Pvt. Ltd., MIDC Paitha, Dist- Aurangabad. EIA/EMP
Page 255
Regular noise level monitoring carried out.
Greenbelt properly maintained and new plantation programmes undertaken frequently.
Post-project monitoring plan is tabulated below.
Table 10-2Environment Monitoring Plan
Sr. No Particulars Monitoring
Frequency
Sampling
Duration
Important
Monitoring
Parameter
1 Industry main Gate &
2 Monitoring Location Quarterly 24 hr.
PM10, PM2.5, SO2,
NOx, VOC, CO,
HC, O3, Benzene,
BaP, Lead,
Ammonia, Arsenic,
Nickel
2 Boiler & DG Set
Stacks Quarterly
As per CPCB
Guidelines
Particulate matter
& SO2
3 Process Stack Quarterly As per CPCB
Guidelines
Aid Mist,
Ammonia, CO2,
HL, HNO2
4 Untreated & Treated
Effluents [ETP Water] Daily Grab
pH, TDS, SS,
BOD, COD, Oil &
Grease SO4,
chlorides, DO,
Bioassay using
APHA or BIS
Methods
5
Noise Levels at 3
Location within plant
site
Quarterly 8 hr. Equivalent to Noise
Level in dB
6 Work Zone at 3-4
locations Quarterly 8 hr.
VOCs, RSPM, acid
fumes, HCL
10.5. Environment Management Budget Allocation
Total capital cost and recurring cost/annum earmarked for environment pollution control measures will be
as under.
Table 10-3Budget Allocation for Environment Management
Sr. No Description Capital Cost
Rs.in Lakh
Recurring Cost Per
Annum
Rs. In Lakh
1 Air Pollution Control System, Dust
collection and cyclone separator 10 2
2 Water Pollution Control. [ETP, RO
and STP] 50 5
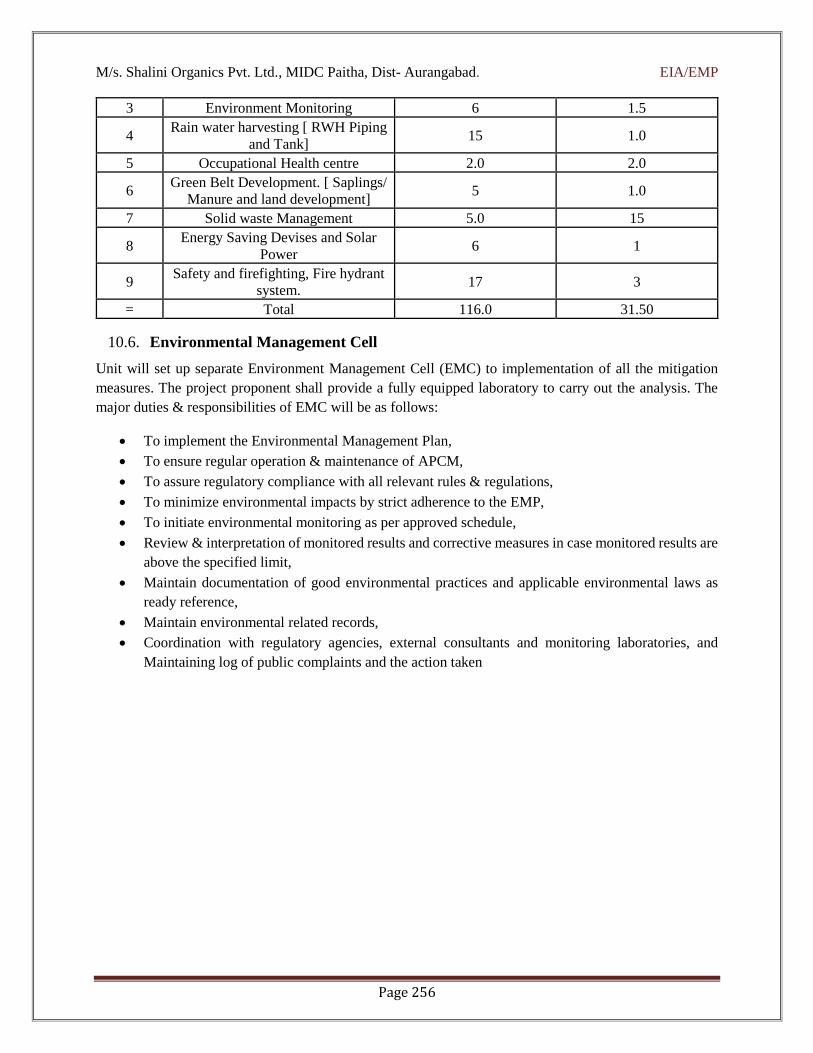
M/s. Shalini Organics Pvt. Ltd., MIDC Paitha, Dist- Aurangabad. EIA/EMP
Page 256
3 Environment Monitoring 6 1.5
4 Rain water harvesting [ RWH Piping
and Tank] 15 1.0
5 Occupational Health centre 2.0 2.0
6 Green Belt Development. [ Saplings/
Manure and land development] 5 1.0
7 Solid waste Management 5.0 15
8 Energy Saving Devises and Solar
Power 6 1
9 Safety and firefighting, Fire hydrant
system. 17 3
= Total 116.0 31.50
10.6. Environmental Management Cell
Unit will set up separate Environment Management Cell (EMC) to implementation of all the mitigation
measures. The project proponent shall provide a fully equipped laboratory to carry out the analysis. The
major duties & responsibilities of EMC will be as follows:
To implement the Environmental Management Plan,
To ensure regular operation & maintenance of APCM,
To assure regulatory compliance with all relevant rules & regulations,
To minimize environmental impacts by strict adherence to the EMP,
To initiate environmental monitoring as per approved schedule,
Review & interpretation of monitored results and corrective measures in case monitored results are
above the specified limit,
Maintain documentation of good environmental practices and applicable environmental laws as
ready reference,
Maintain environmental related records,
Coordination with regulatory agencies, external consultants and monitoring laboratories, and
Maintaining log of public complaints and the action taken
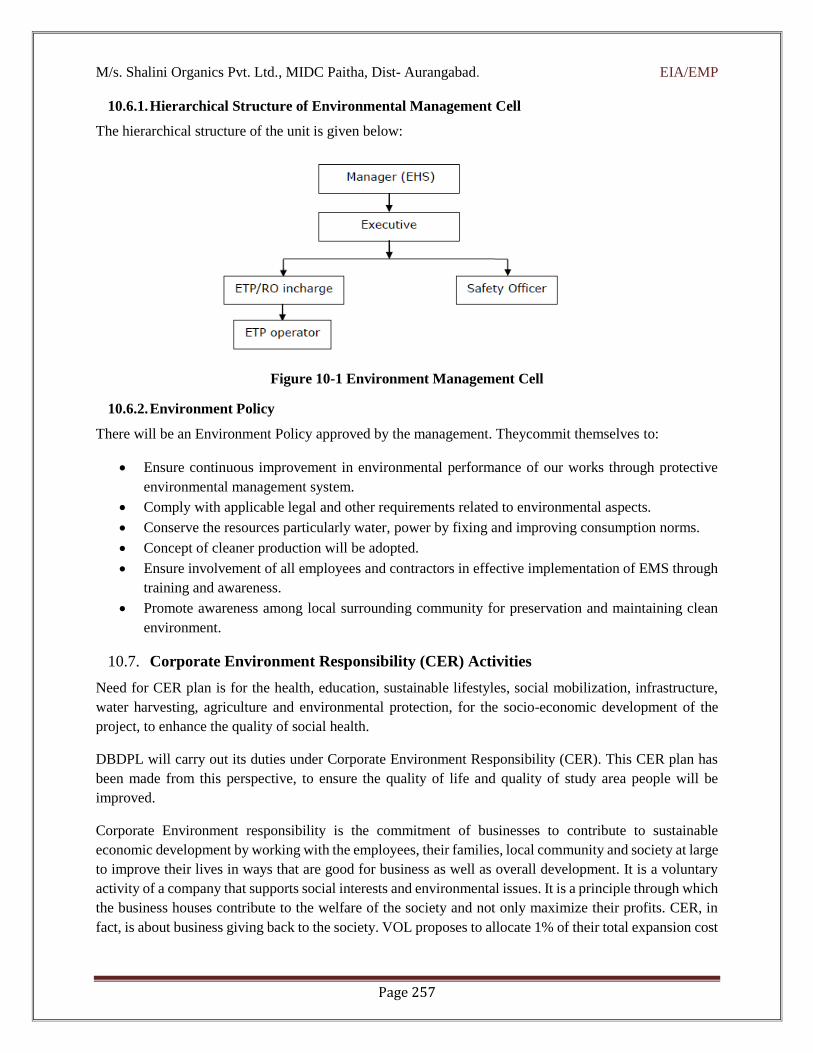
M/s. Shalini Organics Pvt. Ltd., MIDC Paitha, Dist- Aurangabad. EIA/EMP
Page 257
10.6.1. Hierarchical Structure of Environmental Management Cell
The hierarchical structure of the unit is given below:
Figure 10-1 Environment Management Cell
10.6.2. Environment Policy
There will be an Environment Policy approved by the management. Theycommit themselves to:
Ensure continuous improvement in environmental performance of our works through protective
environmental management system.
Comply with applicable legal and other requirements related to environmental aspects.
Conserve the resources particularly water, power by fixing and improving consumption norms.
Concept of cleaner production will be adopted.
Ensure involvement of all employees and contractors in effective implementation of EMS through
training and awareness.
Promote awareness among local surrounding community for preservation and maintaining clean
environment.
10.7. Corporate Environment Responsibility (CER) Activities
Need for CER plan is for the health, education, sustainable lifestyles, social mobilization, infrastructure,
water harvesting, agriculture and environmental protection, for the socio-economic development of the
project, to enhance the quality of social health.
DBDPL will carry out its duties under Corporate Environment Responsibility (CER). This CER plan has
been made from this perspective, to ensure the quality of life and quality of study area people will be
improved.
Corporate Environment responsibility is the commitment of businesses to contribute to sustainable
economic development by working with the employees, their families, local community and society at large
to improve their lives in ways that are good for business as well as overall development. It is a voluntary
activity of a company that supports social interests and environmental issues. It is a principle through which
the business houses contribute to the welfare of the society and not only maximize their profits. CER, in
fact, is about business giving back to the society. VOL proposes to allocate 1% of their total expansion cost

M/s. Shalini Organics Pvt. Ltd., MIDC Paitha, Dist- Aurangabad. EIA/EMP
Page 258
for CER activities as suggested in MoEFCC O.M. regarding Corporate Environment Responsibility vide.
F.No. 22-65/2017-IA III.
For proposed expansion project, manpower of 60 Nos is required; company propose to give employment
for local people which will help to improve their economic status
The proposed project of Shalini Organics Pvt. Ltd. is a green field project. As per criteria given in
the OM, the fund to be kept aside by us is Rs. 17.24 Lakhs (2% of Proposed cost i.e. Rs. 8.62 Cr.)
CER budget will be spent on creation of infrastructural facilities, health, education, environment,
water, Sanitation & hygiene, road & skill development etc. activities to be carried out in discussion
with District Authority as suitable in nearby vicinity.

M/s. Shalini Organics Pvt. Ltd., MIDC Paitha, Dist- Aurangabad. EIA/EMP
Page 259
11. SUMMARY & CONCLUSION
11.1. Overall Justification for Implementation of Project
The proposed project of M/s. Shalini Organics Pvt. Ltd. will pose benefits to both social environment and
economy of the country. To ensure sustainability of environmental components, Company will take upmost
precautions by adopting finest mitigation measures /technology
Company proposed to provide employment to 60 numbers of regional/local populates. Apart from this
annual CER activity of company will also improve the socio economic status of regional environment.
11.2. Explanation of How, Adverse Effects Have Been Mitigated
Through implementation of mitigation measures, suggested in this EIA report; company will be able to
maintain the sustainability of environment. The summaries for how adverse effects will be mitigated, during
operational phase are mentioned below in Table 11.1.
Table 11-1Summary on Impacts and Mitigation Measures
Environmental
Component
Summary on Impacts and Mitigation Measures
Air Environment Company proposed stack of 30 meters’ height for 2 TPH Boiler for their
proposed activity. However, Bag filter of suitable capacity will be utilized
to collect dust from briquette burning activity in boiler operation.
To cater with additional load of process emission, company will install
additional 3 nos. of alkali scrubber.
Water Environment It will be Zero Liquid Discharge plant. Therefore, there will not be any
adverse impact on aquatic environment.
Noise Environment Dispersion of Noise will be controlled by providing acoustic enclosures to
all noise generating equipment’s.
Greenbelt will be developed to control noise propagation outside the
factory premises.
The health impact of noise will be mitigated by providing PPEs and
adopting method of job rotation.
Soil Environment The adverse effects on soil will be mitigated by providing ZLD system,
paved HW/Slag storage area. The disposal of waste will be done as per HW
management rule.
Biotic Environment The project is located in MIDC area. However upmost precaution will be
taken to avoid release of any toxic pollutant into the environment.
Social Environment The adverse impacts of company operation on social environment will be
mitigated by adopting all above stated measures. Apart from this, company
will be committed towards development of Social environment by
conducting CER activities and providing jobs to the locals.
11.3. Conclusion
It can be seen from the study that air emission due to proposed capacity project will less than 50 mg/nm3.
Adequate stack height and control measures will be provided for proposed boiler. Zero effluent discharge
treatment system is proposed for the unit. Ground water table will be not expected to be disturbed as no
ground water withdrawal is proposed. Moreover, rain water harvesting system shall be provided. There will
not be significant impacts of the unit on other environmental aspects such as meteorology, topography and

M/s. Shalini Organics Pvt. Ltd., MIDC Paitha, Dist- Aurangabad. EIA/EMP
Page 260
geology, mineral resources, archaeology, cultural, religious and land use. On the contrary, the project will
have positive impacts through contribution to improvement in socio economic environment.
Other component of environment such as soil, flora, fauna etc. would also not experience significant
adverse impact as unit is already located in the designated industrial area. The conclusion emerging out of
the EIA study suggests that the unit shall adequately take the control measures and high standard of
mitigation efforts. It is therefore requested that necessary environmental clearance may be considered for
the proposed capacity of M/s. Shalini Organics Pvt. Ltd. with appropriate stipulations.
M/s. Shalini Organics Pvt. Ltd., MIDC Paitha, Dist- Aurangabad. EIA/EMP
Page 261
12. DISCLOSURE OF THE CONSULTANT
DR. SUBBARAO’S ENVIRONMENT CENTER:
“Dr. Subbarao’s Environment Center (SEC)”, formerly known as “Water and Waste Water Research
Centre”, is established by an entrepreneur Dr. B. Subbarao in the year 1982 with an objective to mitigate
Environmental Impacts and Protect Environment. It is QCI-NABET accredited consulting organization, for
conducting EIA studies. SEC is also NABL accredited laboratory. SEC is one of the most prominent
Environmental Consulting Organizations in the country. The EIA/EMP projects undertaken by SEC so far
Environmental Clearence from MOEF GOVERNMENT of India, New Delhi
1. Dr. Baburao Bapuji Tanpure S.S.K.Ltd; Rahuri, (Dist) Ahmednagar, Maharashtra State
“Expansion of the Distillery capacity from 30 KLD to 45 KLD.
2. Mula S.S.K.Ltd; (Post) :-Sonai (Dist):- Ahmednagar, Maharashtra State “Establishing a Distillery
of 30 KLD”
3. Shri Chhatrapati S.S.S.K. Ltd; Kagal. (Dist) Kolhapur, Maharashtra State. “Establishing a 45 KLD
Distillery”
4. Shri Datta Shethkari S.S.K.Ltd; Shirol. (Dist) Kolhapur, Maharashtra State, “Expansion of the
Distillery Capacity from 30 KLD to 60 KLD”
5. Somaiya Organic Chemicals Ltd; Sameerwadi, (Dist) Bagalkot, Karnataka State. “Expansion of
the Distillery capacity from 30KLD to 60 KLD”
6. Vishwanath Sugars Ltd; Bellad- Bagewadi, (Dist) Belgaum, Karnataka State. “Establishment of
Distillery of 35KLD”
7. Expansion of the Distillery Capacity from 75 KLPD to 95 KLPD at Krishna S.S.K.Ltd., Rethare
Bk., Shivanagar, Karad (Tq), Satara (Dist), Maharashtra State.
8. Expansion of the Distillery Capacity from 45 KLPD to 75 KLPD at Shri Dnyeshwar S.S.K.Ltd.,
Dnyeshwarnagar, Newasa (Tq), Ahmednagar (Dist), Maharashtra State.
9. Gangamai Sugar & Allced Industries, Aurangabad, “Establishment of 30 KLPD Distillery Unit”.
10. Expansion of the Distillery Capacity from 60 KLPD to 200 KLPD TOR for Somaiya Organo
Chemicals (A Unit of The Godavari Sugar Mills Ltd., Bagalkot (Dist), Karnataka State.
11. Establishment of 10,000 TCD Sugar 30 MW Co-generation Based on Bagasse and 240 KLPD
TOR for Shree Renuka Sugars Ltd., Belgaum, at the Village Nandur, Mangalweda (Tq), Solapur
(Dist).
12. Expansion of the Sugar Capacity from 6000 to 7500 TCD and setting up 33 MW Co-generation
Unit based on Bagasse at S.M. Shankarrao Mohite Patil S.S.K.Ltd.
13. Environmental Clearence for the Establishment of 30 KLPD Distillery at Hutatma Kisan Ahir
S.S.K.Ltd.
14. Setting up 41 MW Co-generation Unit (Interstate Distance below 25 KM) based on Bagasse at
Shri Hiranyakeshi S.S.K.Niyamit, Sankeshwar, Belgaum (Dist), Karnataka State.
15. Expansion of Sugar Plant capacity from 2500 to 5000 TCD, Expansion of Distillery capacity from
30 KLPD to 60 KLPD & establishing Co-generation Plant of 16.2 MW at Bhaurao Chavan SSK
Ltd., Laxminagar, Deagaon-Yelegaon, Nanded (Dsit).
16. Expansion of Distillery capacity from 30 KLPD to 45 KLPD at The Kopargaon SSK Ltd.,
Gautamnagar, Kolpewadi, Kopargaon (Tq), Ahmednagar (Dist).

M/s. Shalini Organics Pvt. Ltd., MIDC Paitha, Dist- Aurangabad. EIA/EMP
Page 262
17. Expansion of Sugar Plant capacity from 5000 to 11,000 TCD, Co-generation from 41 MW to 52
MW and Distillery capacity from 54 to 84 KLPD at Shree Hiranyakeshi SSK Niyamit,
Sankeshwar, Belgaum (Dist).
18. Expansion of Distillery capacity from 200 KLPD to 320 KLPD based on Sugarcane Molasses and
Grains and ENA capacity from 40 KLPD to 260 KLPD at Godavari Bio Refineries Ltd.,
Sameerwadi. Bagalkot (Dist) State Karnataka.
19. Expansion of Distillery capacity from 80 KLPD to 150 KLPD and establishing 7.5 MW Co-
generation Unit at Somaiya Organo Chemicals, (A Unit of The Godavari Sugars Ltd.,) Sakarwadi,
Kopargaon (Tq), Ahmednagar (Dist). Maharashtra State.
20. Expansion of Acetaldehyde production from 1500 MT/Month to 2100 M/Month and Ethyl Acetate
from 5400 MT/Month to 8700 MT/Month by Godavari Bio-refineries Ltd at Samerwadi, Bagalkot
(Dist), Karnataka State
21. Establishment of distillery to produce 30 KLPD Rectified Spirit/30 KLPD ENA/ 30 KLPD
Ethanol and 1 MW co-generation power by Utopian Sugars Limited, Kachrewadi, Tal.
Mangalwedha, Dist. Solapur, Maharashtra
22. Expansion of molasses based Distillery from 35 to 65 KLPD by M/s. Brima Sagar Maharashtra
Distilleries Ltd., at Shreepur, Tal. Malshiras, Dist. Solapur, Maharashtra.
ENVIRONMENTAL CLEARANCES FROM STATE LEVEL APPRAISAL COMMITTEES:
1. “Expansion of Sugar factory, capacity from 4500 TCD to 6000 TCD and expansion of the
Distillery capacity from 30 KLD to 60 KLD, Acetic Acid plant of 25 TCD and 26 MW Co-
generation Unit based on Bagasse” at Shri Sahakarao Maharshi Shankarao Mohite Patil SSK Ltd.,
Akluj. Solapur (Dist), Maharashtra State.
2. “Setting up 25 TCD pulp & Paper Unit and Distillery of 30 KLD” at Kopergaon SSK Ltd.,
Gautamnagar, Kolpewadi (Tq), Ahmednagar (Dist), Maharashtra State.
3. “Setting up 20 TCD Pulp & Paper Unit and expansion of the Sugar factory capacity from 2500
TCD to 4250 TCD at Rahuri SSK Ltd., Ahmednagar (Dist), Maharashtra State.
4. “Expansion of the Sugar factory capacity from 2500 TCD to 3500 TCD and setting up 21 MW
Co-generation Unit based on Bagasse” at Mula SSK Ltd., Sonai, Ahmednagar (Dist), Maharashtra
State.
5. “Setting up 26 MW Co-generation Unit at Dnyaneshwar SSK Ltd., Dnyaneshwarnagar,
Ahmednagar (Dist), Maharashtra State.
6. “Setting up 24 MW Co-generation unit based on Bagasse” at Jawahar SSSK Ltd., Hupari,
Kolhapur (Dist), Maharashtra State.
7. “Expansion of the Sugar factory capacity from 2500 TCD to 3500 TCD” at Shree Chhatrapati
Shahu SSK Ltd., Kagal, Kolhapur (Dist), Maharashtra State.
8. “Expansion of the Sugar factory capacity from 5000 TCD to 7000 TCD” at Shree Datta SSSK
Ltd., Shirol (Tq), Kolhapur (Dist), Maharashtra State.
9. “Expansion of the Sugar factory capacity from 5000 TCD to 7500 TCD” at Sahayadri SSK Ltd.,
Karad (Tq), Satara (Dist), Maharashtra State
10. “2500 TCD Sugar factory and 21 MW Co-generation based on Bagasse” at Gurudatta Sugars Ltd.,
Takaliwadi, Shirol (Tq), Kolhapur (Dist), Maharashtra State.
11. “Expansion of the Sugar factory capacity from 5000 TCD to 7500 TCD at Krishna SSK Ltd.,
Rethare Bk, Shivnagar (Po), Karad (Tq), Satara (Dist), Maharashtra State.
M/s. Shalini Organics Pvt. Ltd., MIDC Paitha, Dist- Aurangabad. EIA/EMP
Page 263
12. “Expansion of the Sugar factory capacity from 2500 TCD to 4000 TCD and Co-generation unit of
14 MW” at Shri Pandurang SSK Ltd., Shreepur, Solapur (Dist), Maharashtra State.
13. Expansion of the Sugar factory capacity from 2500 TCD to 3500 TCD and setting up 15 MW Co-
generation Unit at Hutatma Kisan Ahir S.S.K.Ltd., Walwe (Tq), Sangli (Dist), Maharashtra State.
14. Environmental Clearance for establishing 44 MW Co-generation Unit by Urjankur Shree
Tatyasaheb Kore Warna Power Company Ltd., at Warnanagar, Kolhapur (Dist).
15. Environmental Clearance for establishing 36 MW Co-generation Unit by Urjankur Shree Datta
Power Company Ltd., at Shirol, Kolhapur (Dsit), Maharashtra State.
16. Establishing 13 MW Co-generation Unit by Dwarkadish Sugars Lyd., Satana, Maharashtra State.
17. Expansion of Sugar Plant capacity from 2500 to 5500 TCD, Co-generation Plant capacity from 14
MW to 39 MW at Vishwanath Sugars Ltd., Bellad-Bagewadi, Karnataka State.
18. Expansion of the Sugar factory capacity from 500 TCD to 10,000 TCD and establishing Co-
generation Plant of 40 MW at Nirani Sugars Ltd., Mudhol, Bagalkot (Dist), Karnataka State.
19. Expansion of the Sugar factory capacity from 7,500 TCD to 15,000 TCD and Co-generation
capacity from 24 MW to 64 MW at Godavari Biorefineries Ltd., Samerwadi, Bagalkot (Dsit),
Karnataka State
20. Expansion of Sugar factory capacity from 7500 TCD to 9000 TCD at Dattanagar, Tal. Shirol, Dist.
Kolhapur by Shri. Datta Shetakari Sakhar karkhana Limited
21. Expansion of Sugar factory capacity from 4000 TCD to 5500 TCD and 12 MW to 27 MW by
Krishna SSK Niyamit, Athani
22. Expansion of Sugar factory capacity from 7500 TCD to 10000 TCD by Sahakar Maharshi
Shankarrao Mohite Patil SSK Limited
23. Proposed expansion in capacity through modernization in technologyat Plot No. E-89, MIDC
Ranjangaon, Tal. Shirur, Dist. Pune, Maharashtra by M/s. SI Group India Pvt. Ltd.
24. Expansion of Distillery capacity from 30 KLPD to 60 KLPD to produce Rectified
Spirit/ENA/Ethanol at Laxminagar, Degaon-Yelegaon, Tal Ardhapur, Dist. Nanded, Maharashtra
by Bhaurao Chavan Sahakari Sakhar Karkhana Limited
25. Expansion of sugarcane crushing capacity from 9,000 TCD to 15,000 TCD, Distillery capacity
from 60 KLPD to 90 KLPD and establishing Co-generation Power Plant of 21 MW and 5MW
from Incineration Boiler. at Dattanagar, Tal. Shirol, Dist. Kolhapur, Maharashtra by Shree Datta
Shetkari Sahakari Sakhar Karkhana Limited
26. Expansion of distillery from 30 KLPD to 45 KLPD RS/ENA/Ethanol based on molasses/ 45
KLPD Ethanol based on SDS (Special Denatured Spirit) at Village Kacharewadi, Tal.
Mangalwedha, Dist. Solapur, Maharashtra-413 305 by M/s. Utopian Sugars Ltd.
ONGOING PROJECTS AT STATE LEVEL APPRAISAL COMMITTEES
1. Proposed expansion in manufacturing capacity of the synthetic organic Chemicals from 2839.625
MT/M to 3308.625 MT/M at plot no. 108, 109, 110 roth (bk.), MIDC Roha, Tal. Roha, Dist.
Raigad by M/s. Anshul Speciality Molecules Pvt. Ltd.
2. Manufacture of API products (330 MT/M) at Plot No- B-20, MIDC LoteParshuram, Tal-Khed,
Dist-Ratnagiri, Maharashtra by Taaj Healthcare Chemicals Private Limited
3. Expansion in manufacturing capacity of API products from 474 MT/Annum to 930 MT/Annum
at Plot No. K-4/4, MIDC Mahad, Tal.- Mahad, District - Raigad, Maharashtra, by M/s. Kopran
Research Laboratories Ltd

M/s. Shalini Organics Pvt. Ltd., MIDC Paitha, Dist- Aurangabad. EIA/EMP
Page 264
4. Expansion in Manufacturing Capacity of Synthetic Organic Chemicals at K-4/4, Additional IDC,
At Post Bhirwadi, Tal. Mahad, Dist. Raigad by Kopran Research Laboratories Limited
5. Manufacturing of API products (210 MT/M) at PlotNo. D-12/12, 12/13, 12/14, MIDC Lote-
Parshuram, Tal. Khed, Dist. Ratnagiri, Maharashtra by Litmus Organics Private Limited
6. Manufacturing of API products (190 MT/M) at Plot No- G-13, MIDC Lote-Parshuram, Tal-Khed,
Dist-Ratnagiri, Maharashtra by Suyash Industries
Address for Correspondance:
Address: “Arundhati”, M.S.E.B Road, Opp. Sahayog Nagar, Vishrambag, Sangli.
Contact No. (0233) 2301857, Mobile No. 9372109522, 9890992118
Email: [email protected]

M/s. Shalini Organics Pvt. Ltd., MIDC Paitha, Dist- Aurangabad. EIA/EMP
Page 265
NABET CRTIFICATE

M/s. Shalini Organics Pvt. Ltd., MIDC Paitha, Dist- Aurangabad. EIA/EMP
Page 266
NABL CERTIFICATE
M/s. Shalini Organics Pvt. Ltd., MIDC Paitha, Dist- Aurangabad. EIA/EMP
Page 267
JV ANALYTICAL SERVICES CERTIFICATE