Proposal of interactive applications to enhance student’s spatial perception
15
Proposal of interactive applications to enhance student’s spatial perception Samuel Mora ´n, Ramo ´n Rubio * , Ramo ´ n Gallego, Javier Sua ´rez, Santiago Martı ´n Dept. Construccio ´ n e Ingenierı ´a de Fabricacio ´n, A ´ rea de Expresio ´n Gra ´ fica en la Ingenierı ´a, Universidad of Oviedo, Asturias, Spain Received 19 September 2005; received in revised form 9 August 2006; accepted 17 August 2006 Abstract The aim of this series of applications is to enhance students’ spatial perception capacity by means of exercises that require the student to concentrate on mentally recreating the figures represented. Each application is designed with an increasing level of difficulty, designed to increase the students’ concentration and train their spatial perception. In order to foment a degree of competition among the users and motivate them to try to improve the result achieved in each exercise, a scoring system was implemented, showing the best score obtained both by the user and in the class as a whole. Macromedia Flash tools were used to develop the applications, as these allow the generation of Web-viewable appli- cations of a very small size. In this way, we were able to develop applications accessible to the students and that do not entail any very demanding minimum requirements. Ó 2006 Elsevier Ltd. All rights reserved. Keywords: Spatial perception; Web applications; Multimedia tools; Flash applications 1. Introduction One of the basic needs for almost any technical training is that the student should have some capacity for visual perception (Mohler, 2001). This is necessary for the interpretation of views, drawings and, generally, any kind of visual representation of objects, so common in the working environment where the students will have to develop their professional careers (Sua ´rez, Rubio, Gallego, & Martı ´n, 2004). Spatial vision, better known as spatial perception, comprises (Einsenberg, 1999): 1. The recognition of a three-dimensional object from different angles. 2. Perception of the internal structure of a given spatial configuration. 3. Determination of the spatial relationships between the context and the individual (orientation). 0360-1315/$ - see front matter Ó 2006 Elsevier Ltd. All rights reserved. doi:10.1016/j.compedu.2006.08.009 * Corresponding author. Tel.: +34 984 29 75 87. E-mail address: [email protected] (R. Rubio). Computers & Education 50 (2008) 772–786 www.elsevier.com/locate/compedu
Transcript of Proposal of interactive applications to enhance student’s spatial perception
Computers & Education 50 (2008) 772–786
www.elsevier.com/locate/compedu
Proposal of interactive applications to enhancestudent’s spatial perception
Samuel Moran, Ramon Rubio *, Ramon Gallego, Javier Suarez, Santiago Martın
Dept. Construccion e Ingenierıa de Fabricacion, Area de Expresion Grafica en la Ingenierıa, Universidad of Oviedo, Asturias, Spain
Received 19 September 2005; received in revised form 9 August 2006; accepted 17 August 2006
Abstract
The aim of this series of applications is to enhance students’ spatial perception capacity by means of exercises thatrequire the student to concentrate on mentally recreating the figures represented.
Each application is designed with an increasing level of difficulty, designed to increase the students’ concentration andtrain their spatial perception. In order to foment a degree of competition among the users and motivate them to try toimprove the result achieved in each exercise, a scoring system was implemented, showing the best score obtained bothby the user and in the class as a whole.
Macromedia Flash tools were used to develop the applications, as these allow the generation of Web-viewable appli-cations of a very small size. In this way, we were able to develop applications accessible to the students and that donot entail any very demanding minimum requirements.� 2006 Elsevier Ltd. All rights reserved.
Keywords: Spatial perception; Web applications; Multimedia tools; Flash applications
1. Introduction
One of the basic needs for almost any technical training is that the student should have some capacity forvisual perception (Mohler, 2001). This is necessary for the interpretation of views, drawings and, generally,any kind of visual representation of objects, so common in the working environment where the students willhave to develop their professional careers (Suarez, Rubio, Gallego, & Martın, 2004).
Spatial vision, better known as spatial perception, comprises (Einsenberg, 1999):
1. The recognition of a three-dimensional object from different angles.2. Perception of the internal structure of a given spatial configuration.3. Determination of the spatial relationships between the context and the individual (orientation).
0360-1315/$ - see front matter � 2006 Elsevier Ltd. All rights reserved.
doi:10.1016/j.compedu.2006.08.009
* Corresponding author. Tel.: +34 984 29 75 87.E-mail address: [email protected] (R. Rubio).
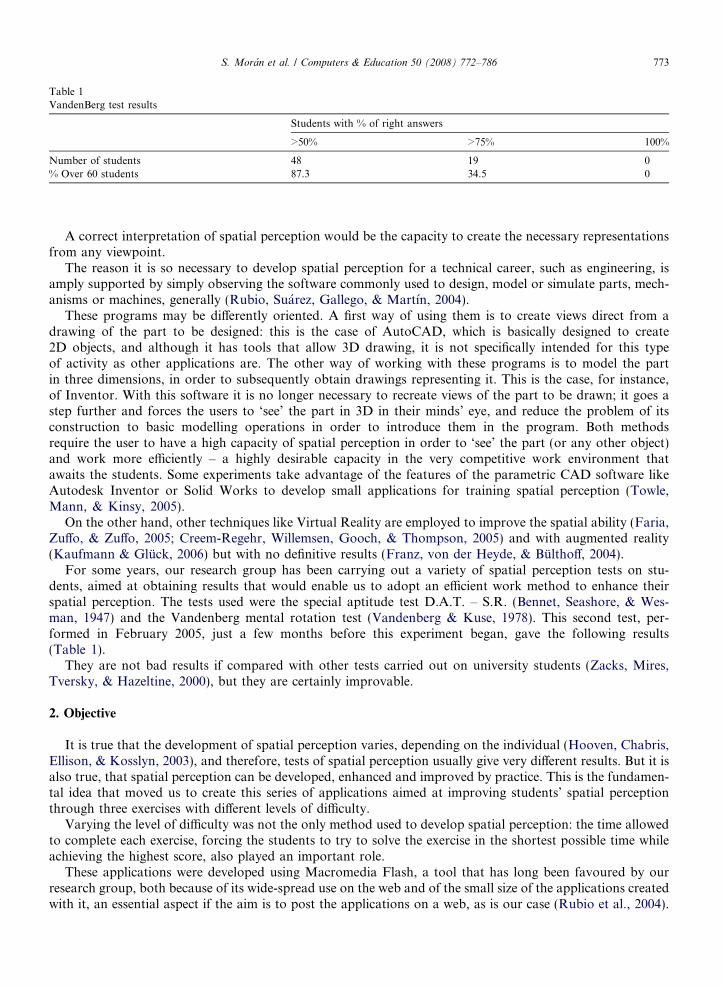
Table 1VandenBerg test results
Students with % of right answers
>50% >75% 100%
Number of students 48 19 0% Over 60 students 87.3 34.5 0
S. Moran et al. / Computers & Education 50 (2008) 772–786 773
A correct interpretation of spatial perception would be the capacity to create the necessary representationsfrom any viewpoint.
The reason it is so necessary to develop spatial perception for a technical career, such as engineering, isamply supported by simply observing the software commonly used to design, model or simulate parts, mech-anisms or machines, generally (Rubio, Suarez, Gallego, & Martın, 2004).
These programs may be differently oriented. A first way of using them is to create views direct from adrawing of the part to be designed: this is the case of AutoCAD, which is basically designed to create2D objects, and although it has tools that allow 3D drawing, it is not specifically intended for this typeof activity as other applications are. The other way of working with these programs is to model the partin three dimensions, in order to subsequently obtain drawings representing it. This is the case, for instance,of Inventor. With this software it is no longer necessary to recreate views of the part to be drawn; it goes astep further and forces the users to ‘see’ the part in 3D in their minds’ eye, and reduce the problem of itsconstruction to basic modelling operations in order to introduce them in the program. Both methodsrequire the user to have a high capacity of spatial perception in order to ‘see’ the part (or any other object)and work more efficiently – a highly desirable capacity in the very competitive work environment thatawaits the students. Some experiments take advantage of the features of the parametric CAD software likeAutodesk Inventor or Solid Works to develop small applications for training spatial perception (Towle,Mann, & Kinsy, 2005).
On the other hand, other techniques like Virtual Reality are employed to improve the spatial ability (Faria,Zuffo, & Zuffo, 2005; Creem-Regehr, Willemsen, Gooch, & Thompson, 2005) and with augmented reality(Kaufmann & Gluck, 2006) but with no definitive results (Franz, von der Heyde, & Bulthoff, 2004).
For some years, our research group has been carrying out a variety of spatial perception tests on stu-dents, aimed at obtaining results that would enable us to adopt an efficient work method to enhance theirspatial perception. The tests used were the special aptitude test D.A.T. – S.R. (Bennet, Seashore, & Wes-man, 1947) and the Vandenberg mental rotation test (Vandenberg & Kuse, 1978). This second test, per-formed in February 2005, just a few months before this experiment began, gave the following results(Table 1).
They are not bad results if compared with other tests carried out on university students (Zacks, Mires,Tversky, & Hazeltine, 2000), but they are certainly improvable.
2. Objective
It is true that the development of spatial perception varies, depending on the individual (Hooven, Chabris,Ellison, & Kosslyn, 2003), and therefore, tests of spatial perception usually give very different results. But it isalso true, that spatial perception can be developed, enhanced and improved by practice. This is the fundamen-tal idea that moved us to create this series of applications aimed at improving students’ spatial perceptionthrough three exercises with different levels of difficulty.
Varying the level of difficulty was not the only method used to develop spatial perception: the time allowedto complete each exercise, forcing the students to try to solve the exercise in the shortest possible time whileachieving the highest score, also played an important role.
These applications were developed using Macromedia Flash, a tool that has long been favoured by ourresearch group, both because of its wide-spread use on the web and of the small size of the applications createdwith it, an essential aspect if the aim is to post the applications on a web, as is our case (Rubio et al., 2004).
774 S. Moran et al. / Computers & Education 50 (2008) 772–786
3. Flash-based web applications
The applications are accessed from each user’s personal page in the web site mentioned. The level of diffi-culty chosen by the user can be selected from the initial page of the applications.
3.1. View table
The first of the three levels forming this series consists in understanding how objects located on a table areseen. Called ‘‘View table’’ it is the basic, least difficult level.
From this initial screen, the application can be started direct, or an example demonstrating how to use itcan be selected. Instructions are also given on how to carry out the exercise.
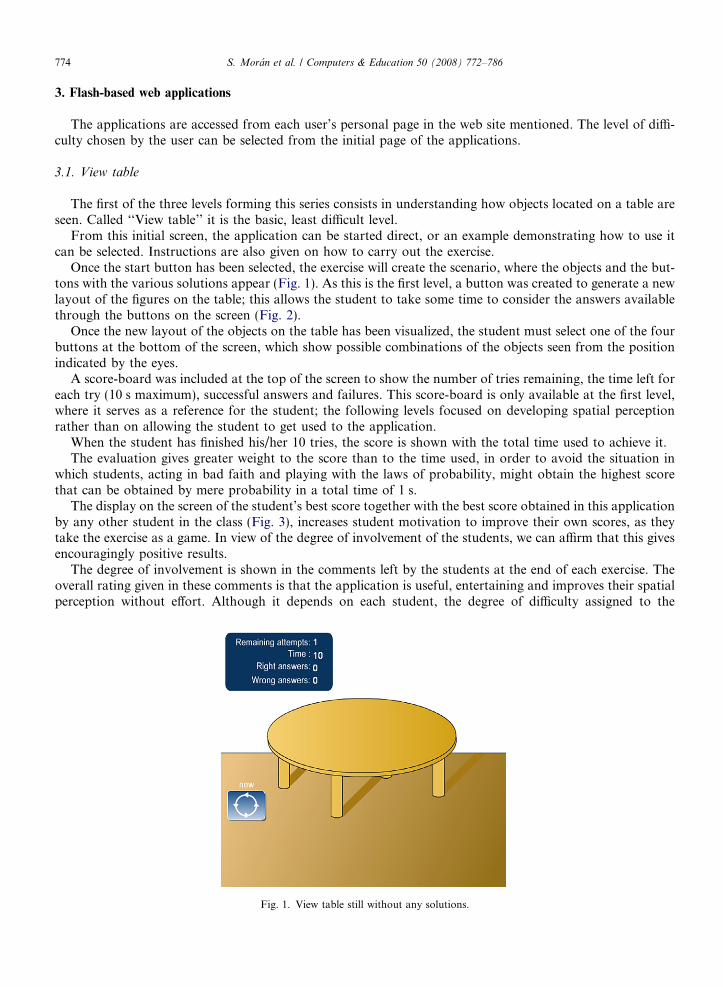
Once the start button has been selected, the exercise will create the scenario, where the objects and the but-tons with the various solutions appear (Fig. 1). As this is the first level, a button was created to generate a newlayout of the figures on the table; this allows the student to take some time to consider the answers availablethrough the buttons on the screen (Fig. 2).
Once the new layout of the objects on the table has been visualized, the student must select one of the fourbuttons at the bottom of the screen, which show possible combinations of the objects seen from the positionindicated by the eyes.
A score-board was included at the top of the screen to show the number of tries remaining, the time left foreach try (10 s maximum), successful answers and failures. This score-board is only available at the first level,where it serves as a reference for the student; the following levels focused on developing spatial perceptionrather than on allowing the student to get used to the application.
When the student has finished his/her 10 tries, the score is shown with the total time used to achieve it.The evaluation gives greater weight to the score than to the time used, in order to avoid the situation in
which students, acting in bad faith and playing with the laws of probability, might obtain the highest scorethat can be obtained by mere probability in a total time of 1 s.
The display on the screen of the student’s best score together with the best score obtained in this applicationby any other student in the class (Fig. 3), increases student motivation to improve their own scores, as theytake the exercise as a game. In view of the degree of involvement of the students, we can affirm that this givesencouragingly positive results.
The degree of involvement is shown in the comments left by the students at the end of each exercise. Theoverall rating given in these comments is that the application is useful, entertaining and improves their spatialperception without effort. Although it depends on each student, the degree of difficulty assigned to the
Fig. 1. View table still without any solutions.
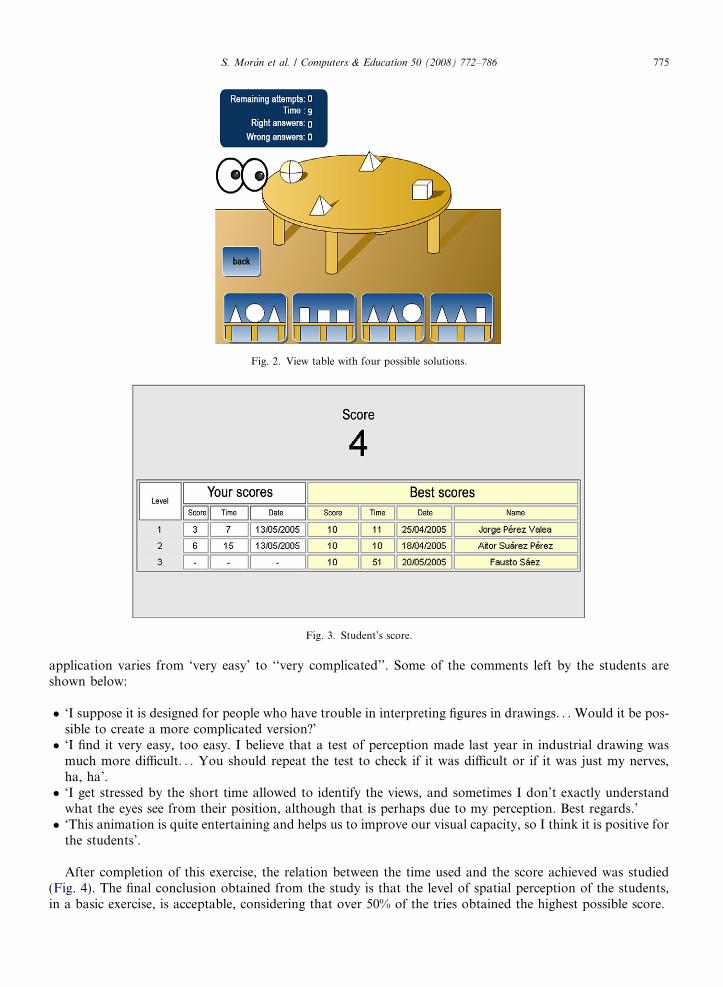
Fig. 3. Student’s score.
Fig. 2. View table with four possible solutions.
S. Moran et al. / Computers & Education 50 (2008) 772–786 775
application varies from ‘very easy’ to ‘‘very complicated’’. Some of the comments left by the students areshown below:
� ‘I suppose it is designed for people who have trouble in interpreting figures in drawings. . . Would it be pos-sible to create a more complicated version?’� ‘I find it very easy, too easy. I believe that a test of perception made last year in industrial drawing was
much more difficult. . . You should repeat the test to check if it was difficult or if it was just my nerves,ha, ha’.� ‘I get stressed by the short time allowed to identify the views, and sometimes I don’t exactly understand
what the eyes see from their position, although that is perhaps due to my perception. Best regards.’� ‘This animation is quite entertaining and helps us to improve our visual capacity, so I think it is positive for
the students’.
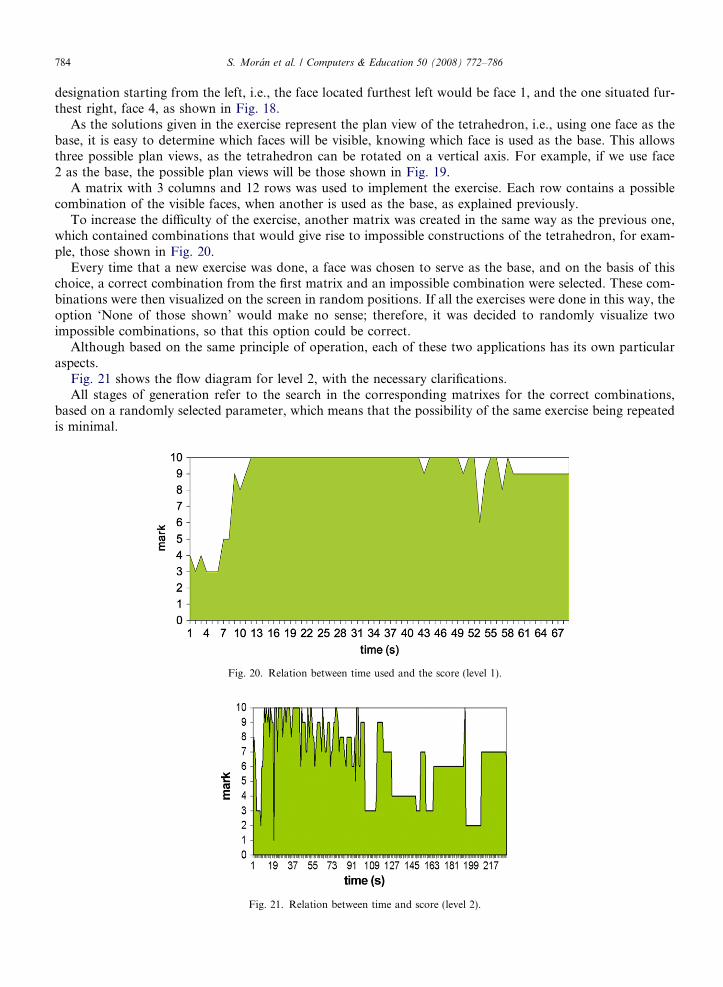
After completion of this exercise, the relation between the time used and the score achieved was studied(Fig. 4). The final conclusion obtained from the study is that the level of spatial perception of the students,in a basic exercise, is acceptable, considering that over 50% of the tries obtained the highest possible score.
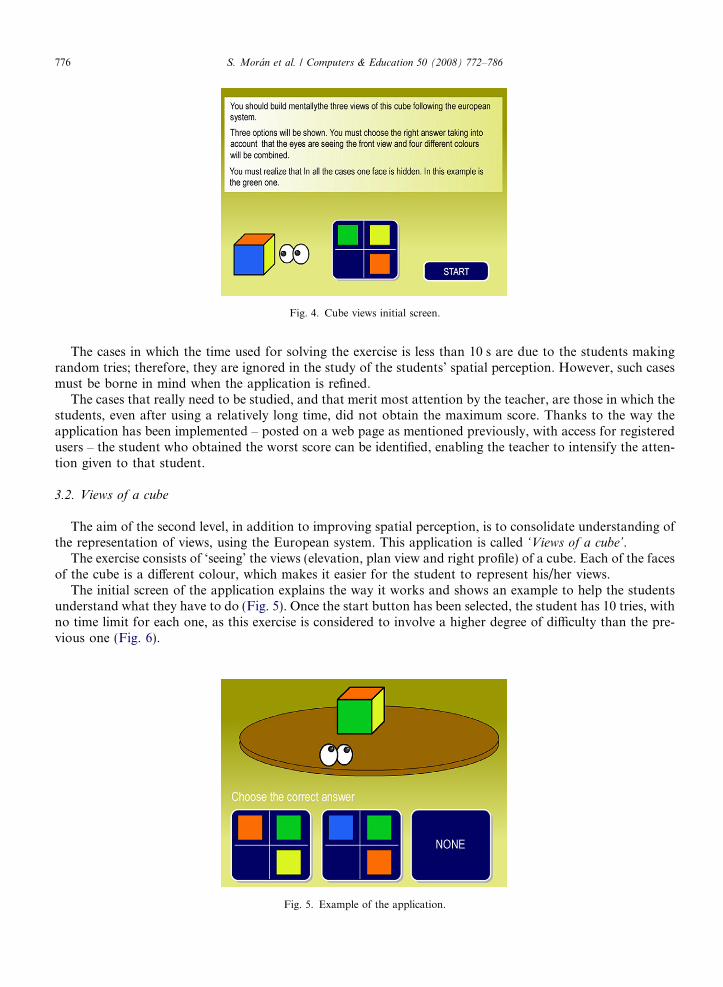
Fig. 4. Cube views initial screen.
776 S. Moran et al. / Computers & Education 50 (2008) 772–786
The cases in which the time used for solving the exercise is less than 10 s are due to the students makingrandom tries; therefore, they are ignored in the study of the students’ spatial perception. However, such casesmust be borne in mind when the application is refined.
The cases that really need to be studied, and that merit most attention by the teacher, are those in which thestudents, even after using a relatively long time, did not obtain the maximum score. Thanks to the way theapplication has been implemented – posted on a web page as mentioned previously, with access for registeredusers – the student who obtained the worst score can be identified, enabling the teacher to intensify the atten-tion given to that student.
3.2. Views of a cube
The aim of the second level, in addition to improving spatial perception, is to consolidate understanding ofthe representation of views, using the European system. This application is called ‘Views of a cube’.
The exercise consists of ‘seeing’ the views (elevation, plan view and right profile) of a cube. Each of the facesof the cube is a different colour, which makes it easier for the student to represent his/her views.
The initial screen of the application explains the way it works and shows an example to help the studentsunderstand what they have to do (Fig. 5). Once the start button has been selected, the student has 10 tries, withno time limit for each one, as this exercise is considered to involve a higher degree of difficulty than the pre-vious one (Fig. 6).
Fig. 5. Example of the application.
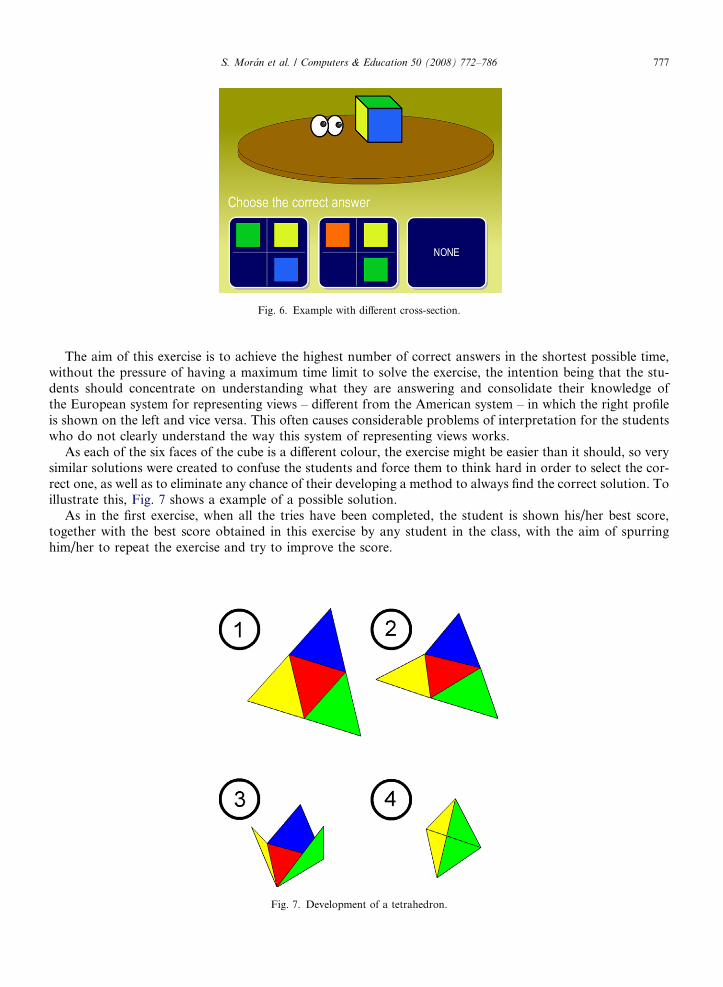
Fig. 6. Example with different cross-section.
S. Moran et al. / Computers & Education 50 (2008) 772–786 777
The aim of this exercise is to achieve the highest number of correct answers in the shortest possible time,without the pressure of having a maximum time limit to solve the exercise, the intention being that the stu-dents should concentrate on understanding what they are answering and consolidate their knowledge ofthe European system for representing views – different from the American system – in which the right profileis shown on the left and vice versa. This often causes considerable problems of interpretation for the studentswho do not clearly understand the way this system of representing views works.
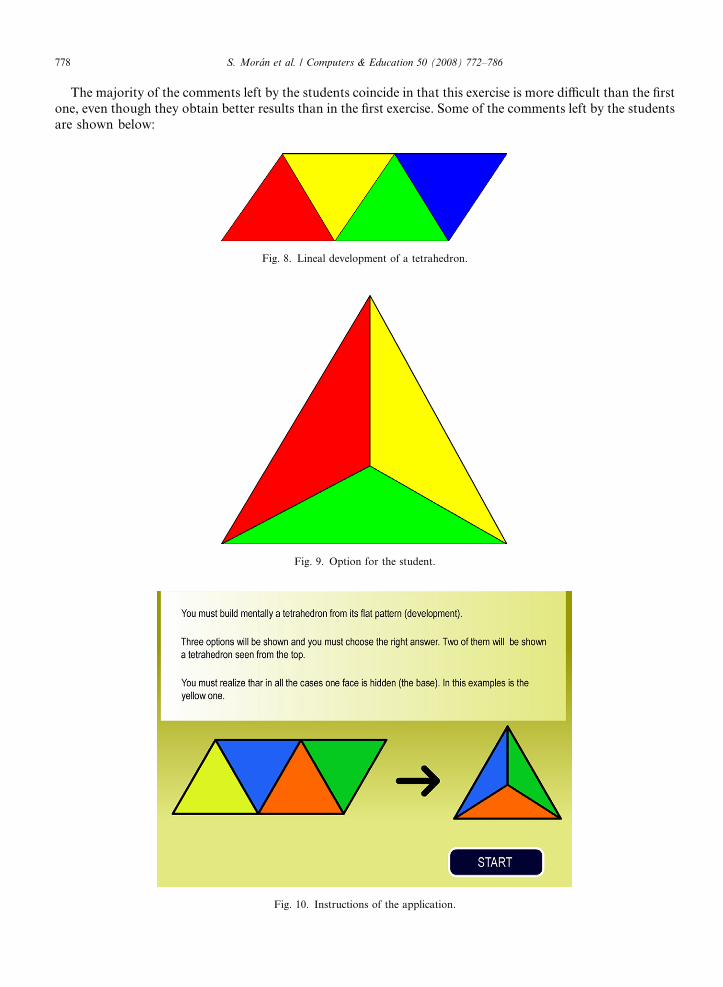
As each of the six faces of the cube is a different colour, the exercise might be easier than it should, so verysimilar solutions were created to confuse the students and force them to think hard in order to select the cor-rect one, as well as to eliminate any chance of their developing a method to always find the correct solution. Toillustrate this, Fig. 7 shows a example of a possible solution.
As in the first exercise, when all the tries have been completed, the student is shown his/her best score,together with the best score obtained in this exercise by any student in the class, with the aim of spurringhim/her to repeat the exercise and try to improve the score.
Fig. 7. Development of a tetrahedron.
778 S. Moran et al. / Computers & Education 50 (2008) 772–786
The majority of the comments left by the students coincide in that this exercise is more difficult than the firstone, even though they obtain better results than in the first exercise. Some of the comments left by the studentsare shown below:
Fig. 8. Lineal development of a tetrahedron.
Fig. 9. Option for the student.
Fig. 10. Instructions of the application.
S. Moran et al. / Computers & Education 50 (2008) 772–786 779
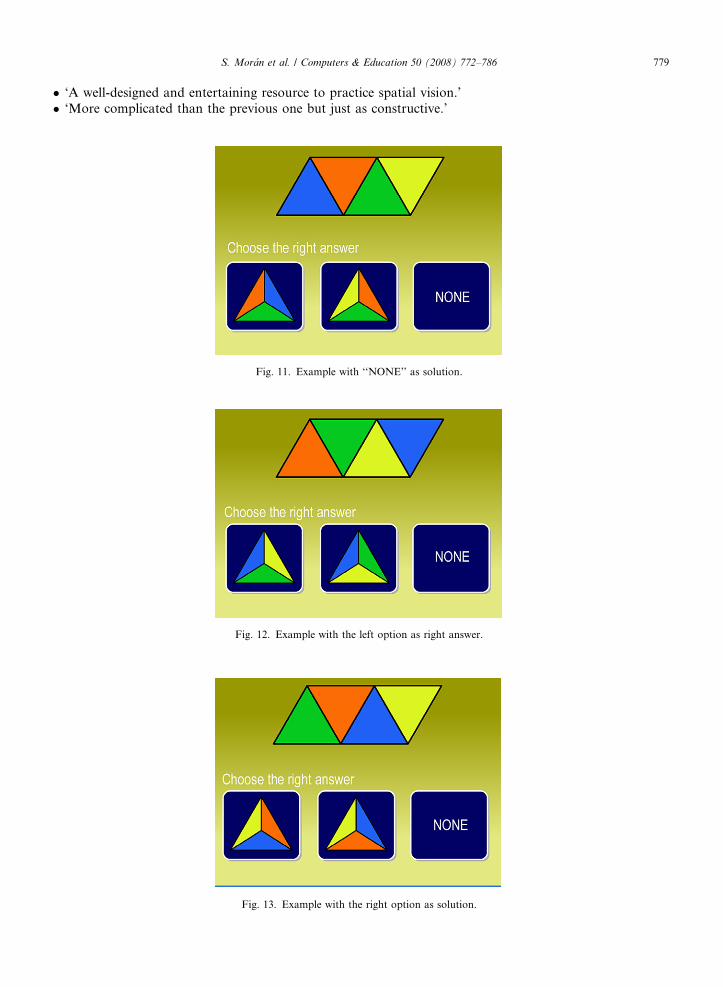
� ‘A well-designed and entertaining resource to practice spatial vision.’� ‘More complicated than the previous one but just as constructive.’
Fig. 11. Example with ‘‘NONE’’ as solution.
Fig. 12. Example with the left option as right answer.
Fig. 13. Example with the right option as solution.
780 S. Moran et al. / Computers & Education 50 (2008) 772–786
� ‘I prefer this game to level 1 and I think it is more useful.’� ‘More difficult.’
As no time limit was imposed, the students completed the exercise in the shortest time they could. From thestudy of the times used, it can be observed that an increase in the time used to complete the exercise does notimply an improvement in the score obtained (Fig. 8). The cases in which the maximum score was not achieved,even though a longer than average time was used, are the ones that merit special attention from the teacher,who should make greater efforts to help those particular students to improve their spatial perception duringthe course.
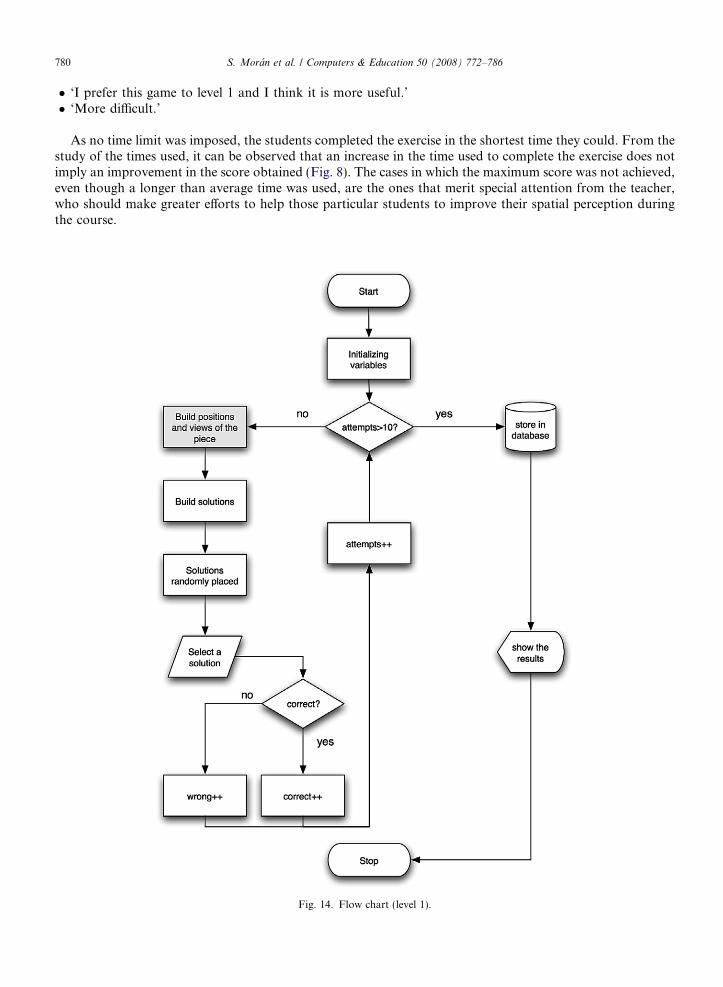
Fig. 14. Flow chart (level 1).
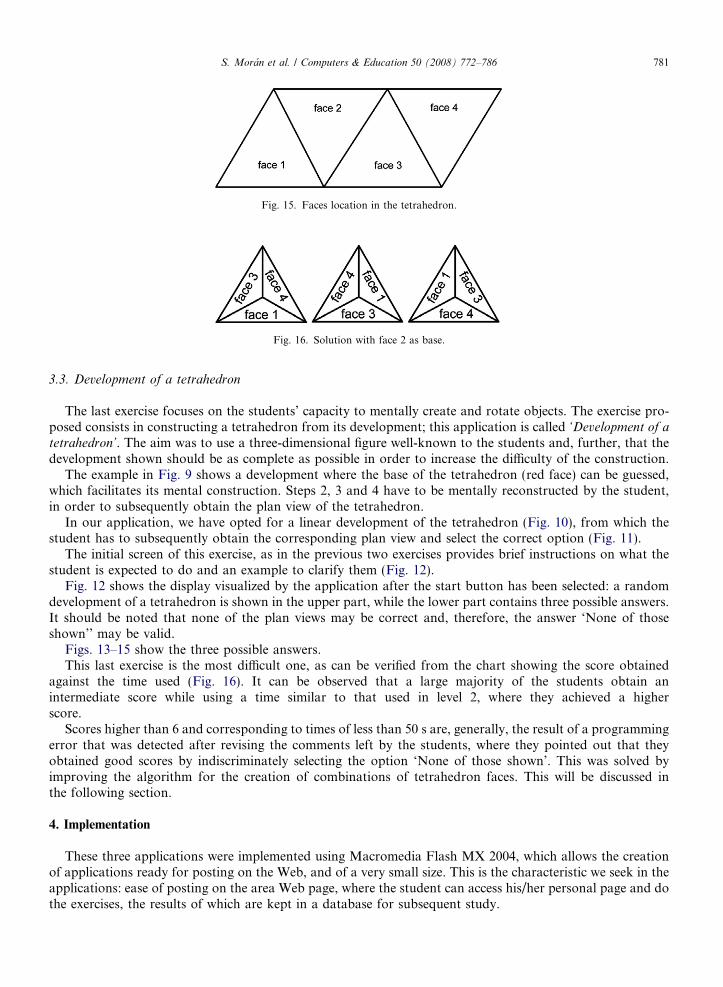
Fig. 15. Faces location in the tetrahedron.
Fig. 16. Solution with face 2 as base.
S. Moran et al. / Computers & Education 50 (2008) 772–786 781
3.3. Development of a tetrahedron
The last exercise focuses on the students’ capacity to mentally create and rotate objects. The exercise pro-posed consists in constructing a tetrahedron from its development; this application is called ‘Development of a
tetrahedron’. The aim was to use a three-dimensional figure well-known to the students and, further, that thedevelopment shown should be as complete as possible in order to increase the difficulty of the construction.
The example in Fig. 9 shows a development where the base of the tetrahedron (red face) can be guessed,which facilitates its mental construction. Steps 2, 3 and 4 have to be mentally reconstructed by the student,in order to subsequently obtain the plan view of the tetrahedron.
In our application, we have opted for a linear development of the tetrahedron (Fig. 10), from which thestudent has to subsequently obtain the corresponding plan view and select the correct option (Fig. 11).
The initial screen of this exercise, as in the previous two exercises provides brief instructions on what thestudent is expected to do and an example to clarify them (Fig. 12).
Fig. 12 shows the display visualized by the application after the start button has been selected: a randomdevelopment of a tetrahedron is shown in the upper part, while the lower part contains three possible answers.It should be noted that none of the plan views may be correct and, therefore, the answer ‘None of thoseshown’’ may be valid.
Figs. 13–15 show the three possible answers.This last exercise is the most difficult one, as can be verified from the chart showing the score obtained
against the time used (Fig. 16). It can be observed that a large majority of the students obtain anintermediate score while using a time similar to that used in level 2, where they achieved a higherscore.
Scores higher than 6 and corresponding to times of less than 50 s are, generally, the result of a programmingerror that was detected after revising the comments left by the students, where they pointed out that theyobtained good scores by indiscriminately selecting the option ‘None of those shown’. This was solved byimproving the algorithm for the creation of combinations of tetrahedron faces. This will be discussed inthe following section.
4. Implementation
These three applications were implemented using Macromedia Flash MX 2004, which allows the creationof applications ready for posting on the Web, and of a very small size. This is the characteristic we seek in theapplications: ease of posting on the area Web page, where the student can access his/her personal page and dothe exercises, the results of which are kept in a database for subsequent study.
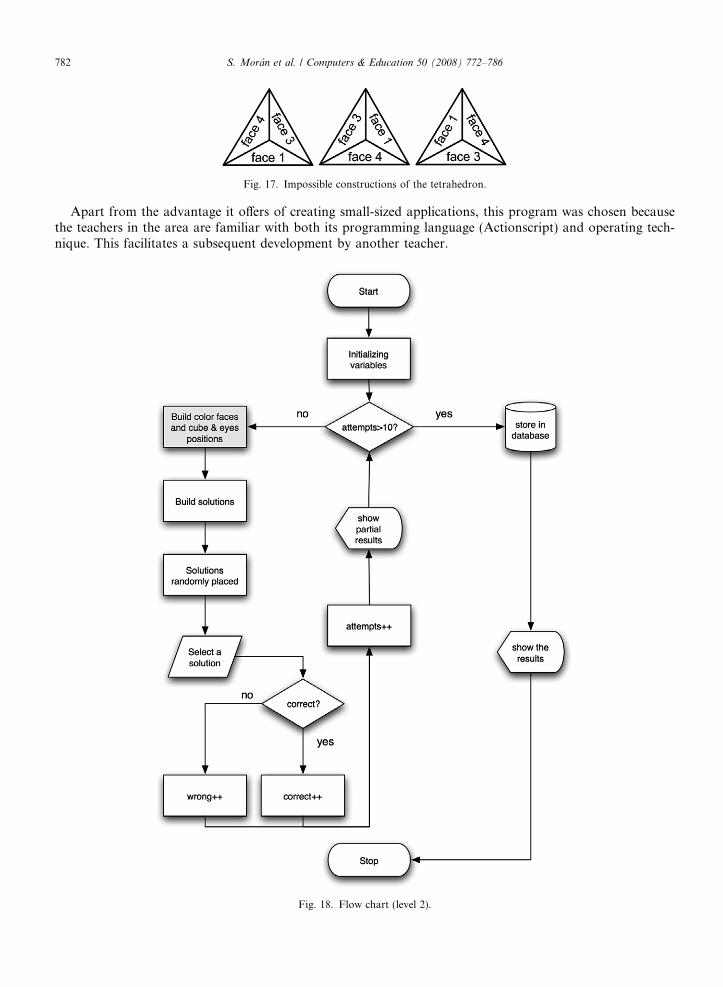
Fig. 17. Impossible constructions of the tetrahedron.
782 S. Moran et al. / Computers & Education 50 (2008) 772–786
Apart from the advantage it offers of creating small-sized applications, this program was chosen becausethe teachers in the area are familiar with both its programming language (Actionscript) and operating tech-nique. This facilitates a subsequent development by another teacher.
Fig. 18. Flow chart (level 2).
S. Moran et al. / Computers & Education 50 (2008) 772–786 783
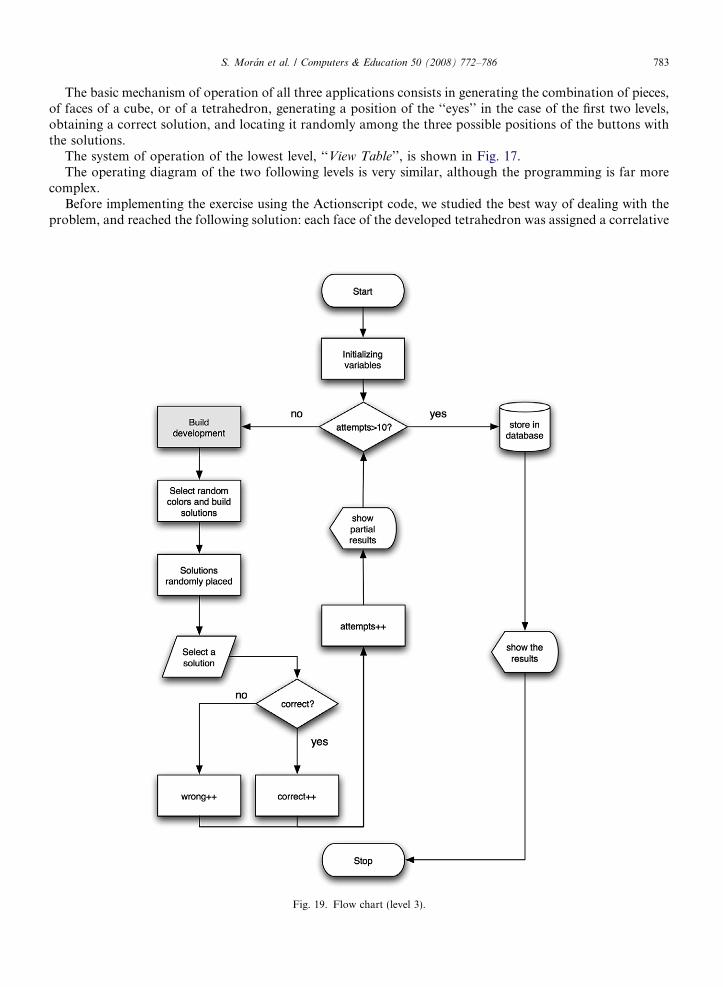
The basic mechanism of operation of all three applications consists in generating the combination of pieces,of faces of a cube, or of a tetrahedron, generating a position of the ‘‘eyes’’ in the case of the first two levels,obtaining a correct solution, and locating it randomly among the three possible positions of the buttons withthe solutions.
The system of operation of the lowest level, ‘‘View Table’’, is shown in Fig. 17.The operating diagram of the two following levels is very similar, although the programming is far more
complex.Before implementing the exercise using the Actionscript code, we studied the best way of dealing with the
problem, and reached the following solution: each face of the developed tetrahedron was assigned a correlative
Fig. 19. Flow chart (level 3).
784 S. Moran et al. / Computers & Education 50 (2008) 772–786
designation starting from the left, i.e., the face located furthest left would be face 1, and the one situated fur-thest right, face 4, as shown in Fig. 18.
As the solutions given in the exercise represent the plan view of the tetrahedron, i.e., using one face as thebase, it is easy to determine which faces will be visible, knowing which face is used as the base. This allowsthree possible plan views, as the tetrahedron can be rotated on a vertical axis. For example, if we use face2 as the base, the possible plan views will be those shown in Fig. 19.
A matrix with 3 columns and 12 rows was used to implement the exercise. Each row contains a possiblecombination of the visible faces, when another is used as the base, as explained previously.
To increase the difficulty of the exercise, another matrix was created in the same way as the previous one,which contained combinations that would give rise to impossible constructions of the tetrahedron, for exam-ple, those shown in Fig. 20.
Every time that a new exercise was done, a face was chosen to serve as the base, and on the basis of thischoice, a correct combination from the first matrix and an impossible combination were selected. These com-binations were then visualized on the screen in random positions. If all the exercises were done in this way, theoption ‘None of those shown’ would make no sense; therefore, it was decided to randomly visualize twoimpossible combinations, so that this option could be correct.
Although based on the same principle of operation, each of these two applications has its own particularaspects.
Fig. 21 shows the flow diagram for level 2, with the necessary clarifications.All stages of generation refer to the search in the corresponding matrixes for the correct combinations,
based on a randomly selected parameter, which means that the possibility of the same exercise being repeatedis minimal.
Fig. 20. Relation between time used and the score (level 1).
Fig. 21. Relation between time and score (level 2).
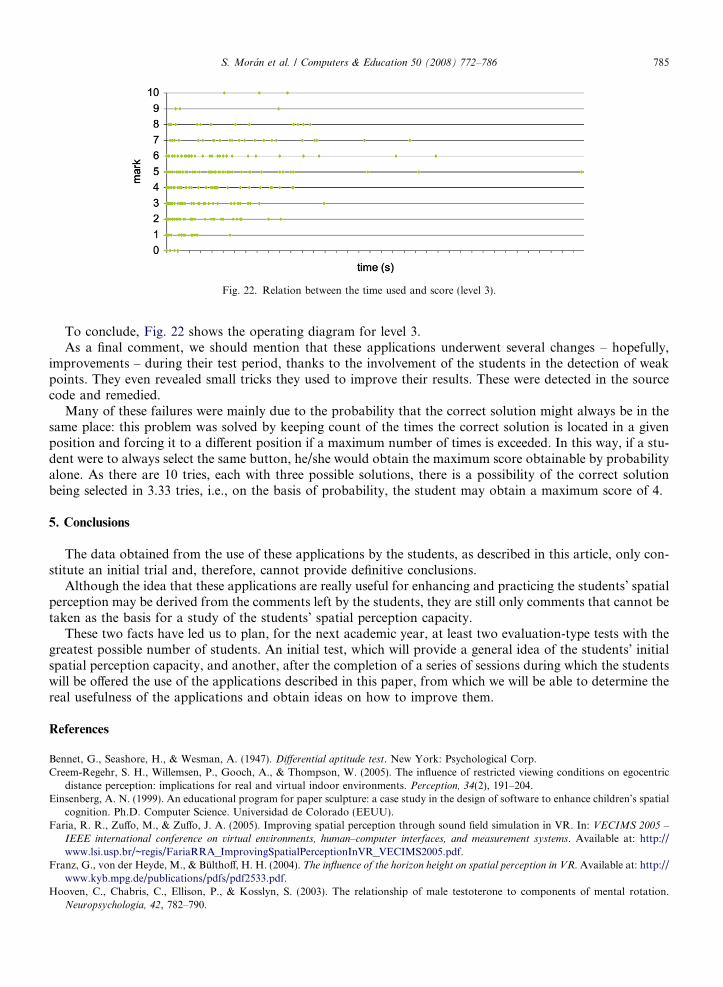
Fig. 22. Relation between the time used and score (level 3).
S. Moran et al. / Computers & Education 50 (2008) 772–786 785
To conclude, Fig. 22 shows the operating diagram for level 3.As a final comment, we should mention that these applications underwent several changes – hopefully,
improvements – during their test period, thanks to the involvement of the students in the detection of weakpoints. They even revealed small tricks they used to improve their results. These were detected in the sourcecode and remedied.
Many of these failures were mainly due to the probability that the correct solution might always be in thesame place: this problem was solved by keeping count of the times the correct solution is located in a givenposition and forcing it to a different position if a maximum number of times is exceeded. In this way, if a stu-dent were to always select the same button, he/she would obtain the maximum score obtainable by probabilityalone. As there are 10 tries, each with three possible solutions, there is a possibility of the correct solutionbeing selected in 3.33 tries, i.e., on the basis of probability, the student may obtain a maximum score of 4.
5. Conclusions
The data obtained from the use of these applications by the students, as described in this article, only con-stitute an initial trial and, therefore, cannot provide definitive conclusions.
Although the idea that these applications are really useful for enhancing and practicing the students’ spatialperception may be derived from the comments left by the students, they are still only comments that cannot betaken as the basis for a study of the students’ spatial perception capacity.
These two facts have led us to plan, for the next academic year, at least two evaluation-type tests with thegreatest possible number of students. An initial test, which will provide a general idea of the students’ initialspatial perception capacity, and another, after the completion of a series of sessions during which the studentswill be offered the use of the applications described in this paper, from which we will be able to determine thereal usefulness of the applications and obtain ideas on how to improve them.
References
Bennet, G., Seashore, H., & Wesman, A. (1947). Differential aptitude test. New York: Psychological Corp.Creem-Regehr, S. H., Willemsen, P., Gooch, A., & Thompson, W. (2005). The influence of restricted viewing conditions on egocentric
distance perception: implications for real and virtual indoor environments. Perception, 34(2), 191–204.Einsenberg, A. N. (1999). An educational program for paper sculpture: a case study in the design of software to enhance children’s spatial
cognition. Ph.D. Computer Science. Universidad de Colorado (EEUU).Faria, R. R., Zuffo, M., & Zuffo, J. A. (2005). Improving spatial perception through sound field simulation in VR. In: VECIMS 2005 –
IEEE international conference on virtual environments, human–computer interfaces, and measurement systems. Available at: http://www.lsi.usp.br/~regis/FariaRRA_ImprovingSpatialPerceptionInVR_VECIMS2005.pdf.
Franz, G., von der Heyde, M., & Bulthoff, H. H. (2004). The influence of the horizon height on spatial perception in VR. Available at: http://www.kyb.mpg.de/publications/pdfs/pdf2533.pdf.
Hooven, C., Chabris, C., Ellison, P., & Kosslyn, S. (2003). The relationship of male testoterone to components of mental rotation.Neuropsychologia, 42, 782–790.

786 S. Moran et al. / Computers & Education 50 (2008) 772–786
Kaufmann, H., & Gluck, J. (2006). Educating spatial intelligence with augmented reality. Available at: http://www.ims.tuwien.ac.at/research/spatial_abilities/.
Mohler, J. (2001). Using interactive multimedia technologies to improve student understanding of spatially-dependent engineeringconcepts. In: Actas del International Graphicon Conference on Computer Geometry and Graphics, Nyzhny Novgorod, Russia, 2001.
Rubio, R., Suarez, J., Gallego, R., & Martın, S. (2004). Propuesta de arquitectura para la generacion interactiva de entornos colaborativosde realidad virtual para el campus virtual G9. In: XVI Congreso internacional de ingenierıa grafica, Zaragoza.
Rubio, R., Suarez, J., Gallego, R., & Martın, S. (2004). Librerıa interactiva de simulaciones y animaciones multimedia de dibujoindustrial. In: XII Congreso Universitario de Innovacion Educativa en las Ensenanzas Tecnicas, Barcelona.
Suarez, J., Rubio, R., Gallego, R., & Martın, S. (2004). Desarrollo de un entrenador para la percepcion espacial basado en realidad virtualmediante tecnologıas de dominio publico. In: XII Congreso Universitario de Innovacion Educativa en las Ensenanzas Tecnicas,Barcelona.
Towle, E., Mann, J., & Kinsy, B. (2005). Work in progress – development of tools to improve the spatial ability of engineering students. In:35th ASEE/IEEE frontiers in education conference. Available at: http://fie.engrng.pitt.edu/fie2005/papers/1258.pdf.
Vandenberg, S. G., & Kuse, A. R. (1978). Mental rotation, a group test of three-dimensional spatial visualisation. Perceptual Motor Skills,
47, 599–604.Zacks, J., Mires, J., Tversky, B., & Hazeltine, E. (2000). Mental spatial transformations of objects and perspective. Spatial cognition and
computation (2). Kluwer Academic Publishers, 315–332.