
Properties of the 1979 Monte Negro (Southwest Yugoslavia) Seismic Sequence
11
PAGEOPH, Vol. 122 (1984/85) 0033-4553/85/010025-1181.50+0.20/0 1985 Birkh~iuser Verlag, Basel Properties of the 1979 Monte Negro (Southwest Yugoslavia) Seismic Sequence By G. F. KARAKAISlSI), B. G. KARACOSTAS1), E. E. PAPADIMITRIOU a) and B. C. PAPAZACHOS i) Abstract - Focal properties of the Monte Negro earthquake (15 April 1979, M = 7.1) and its seismic sequence (foreshocks and aftershocks), which occurred near the southwestern coast of Yugoslavia, are investigated. Fault plane solutions of the main shock and its largest aftershock (24 May 1979, M = 6.3) and the spatial distribution of the shocks of this sequence show that the seismic fault strikes about southeast-northwest (parallel to the coast) and dips northeast (towards the continent). It is a strike-slip left-lateral fault with a considerable thrust component. Its length is 95 km and its width 12 km. An aseismic belt, which separated the aftershock loci into two groups (the northwestern and southeastern), is interpreted as a section of the fault that slipped smoothly during the main shock. The aftershock foci were barriers where stress had been induced. One of these barriers broke later and produced the largest aftershock of 24 May. Key words: Fault plane solution, epicenter migration, barrier 1. Introduction On 15 April 1979 at 06h 19m 41s, an earthquake of surface-wave magnitude equal to 7.1 occurred near the southwest coast of Yugoslavia (41.90~ 19.03~ This earthquake was preceded by a series of foreshocks, which started on 9 April and had magnitudes of up to 5.4. The earthquake was followed by a large number of aftershocks, the largest of which occurred on 24 May at a distance of 40 km northwest from the epicenter of the main shock (42.15~ 18.71~ and had a surface-wave magnitude equal to 6.3. The main earthquake of this sequence produced extensive damage in the State of Monte Negro of Yugoslavia and in the northern district of Albania. This shock killed 94 people in Yugoslavia and 35 in Albania, while the number of injured were 1172 and 328, respectively. One volume, under the title The Monte Negro, Yugoslavia, Earthquake of April 15, 1979, published by the University 'Kiril and Metodij,' Skopje, Yugoslavia, 390 pp., 1981, includes articles on the engineering aspect of this earthquake, while another J) Geophysical Laboratory, University of Thessaloniki, Greece.
Transcript of Properties of the 1979 Monte Negro (Southwest Yugoslavia) Seismic Sequence

PAGEOPH, Vol. 122 (1984/85) 0033-4553/85/010025-1181.50+0.20/0 �9 1985 Birkh~iuser Verlag, Basel
Properties of the 1979 Monte Negro (Southwest Yugoslavia) Seismic Sequence
By G. F. KARAKAISlSI), B. G. KARACOSTAS1), E. E. PAPADIMITRIOU a)
and B. C. PAPAZACHOS i)
Abstract - Focal properties of the Monte Negro earthquake (15 April 1979, M = 7.1) and its seismic sequence (foreshocks and aftershocks), which occurred near the southwestern coast of Yugoslavia, are investigated. Fault plane solutions of the main shock and its largest aftershock (24 May 1979, M = 6.3) and the spatial distribution of the shocks of this sequence show that the seismic fault strikes about southeast-northwest (parallel to the coast) and dips northeast (towards the continent). It is a strike-slip left-lateral fault with a considerable thrust component. Its length is 95 km and its width 12 km. An aseismic belt, which separated the aftershock loci into two groups (the northwestern and southeastern), is interpreted as a section of the fault that slipped smoothly during the main shock. The aftershock foci were barriers where stress had been induced. One of these barriers broke later and produced the largest aftershock of 24 May.
Key words: Fault plane solution, epicenter migration, barrier
1. Introduction
On 15 April 1979 at 06h 19m 41s, an ear thquake of surface-wave magni tude equal
to 7.1 occurred near the southwest coast of Yugoslavia (41.90~ 19.03~ This
ear thquake was preceded by a series of foreshocks, which started on 9 Apri l and had
magnitudes of up to 5.4. The ear thquake was followed by a large number of aftershocks,
the largest of which occurred on 24 May at a distance o f 40 km northwest from the
epicenter of the main shock (42.15~ 18.71~ and had a surface-wave magnitude
equal to 6.3.
The main ear thquake of this sequence produced extensive damage in the State of
Monte Negro of Yugoslavia and in the northern district of Albania. This shock killed 94
people in Yugoslavia and 35 in Albania , while the number of injured were 1172 and 328,
respectively.
One volume, under the title The Monte Negro, Yugoslavia, Earthquake of April 15, 1979, published by the University 'Kiri l and Metodij , ' Skopje, Yugoslavia, 390 pp.,
1981, includes articles on the engineering aspect of this earthquake, while another
J) Geophysical Laboratory, University of Thessaloniki, Greece.

26 G.F. Karakaisis, B. G. Karacostas, E. E. Papadimitriou, and B. C. Papazachos PAGEOPH,
volume, under the title The Earthquake of April 15, 1979, and the Elimination of its Consequences, published by the Academy of Sciences of the People's Socialist Republic of Albania, 532 pp., 1980, includes articles on the seismological and other aspects of this earthquake. Other papers have been published on this earthquake (KAr~AMORI, 1979; ARSOVSKI and JANt~EYSKI, 1979, 1981).
The purpose of the present paper is to investigate some properties of this sequence which have not been investigated until now, or for which we give a different solution or interpretation. We base our results on new and much more accurate determinations of the earthquake loci and on additional information on the first onsets, coming mainly from instrumentation of long periods, for the determination of reliable fanlt-plane
solutions.
2. The data
Accurate determinations of the epicenters and focal depths of the earthquakes of the sequence are necessary to define the seismogenic volume (or aftershock volume) of the earthquake and the orientation of the fault plane.
For accurate epicenter and focal-depth locations of all earthquakes of the sequence having magnitudes greater than a certain value, the arrival times of the longitudinal and shear waves of the larger shocks of the sequence (M >1 4.3) at the seismological stations in all the neighbouring countries (Yugoslavia, Albania, Greece, Bulgaria, Italy) were used. These arrival times were taken from the monthly bulletins of ISC. These stations are shown in Fig. 1; in our opinion, there is good azimuth coverage.
The basic source of data concerning the earthquake magnitudes was the catalogue of COMNINAKIS and PAPAZACHOS (1982).
Accurate time delays for each of these stations, determined by PANAGIOTOPOULOS and PAPAZACHOS (1984), were used for correcting these arrival times. The HYPO 71 (revised 73) computer program for determining the hypocenter (LEE and LAHR, 1975), with a two-layer crustal model, above a half-space, was applied. The thicknesses d of the two layers and the velocities v of the waves in them and in the half-space are as follows: (a) a 'granitic' layer with d 1 = 19.0 km and vg = 6.0 km/see, and (b) a 'basaltic' layer with d 2 = 12.0 km and v o = 6.6 km/sec, and the half-space, which implies the upper mantle, with d n = ~ and v, = 7.9 km/sec. The thicknesses and the velocities considered are in agreement with the results of seismic refraction made by MAKRIS (1977).
The data for the determination of the fault-plane solutions of the two major shocks of the sequence were taken from a questionnaire that was answered by seismologists at seismological stations all over the world. Table 1 gives information on all earthquakes of the sequence which occurred between 9 April 1979, and 23 January 1980, and had surface-wave magnitudes of M ~> 4.3. This table shows the date, origin time, latitude, longitude, focal depth, surface-wave magnitude, standard error in the epicenter, standard error in the focal depth, and number of observations (P and S arrivals) used for

Vol. 122, 1984/85 Properties of the Monte Negro, Yugoslavia, Seismic Sequence 27
15" 2O" 25" ] ~' ,,LjIu "-,,. t . J " ~-'" DEV ' :' ] t TRIt �9 ,ZAG . . . . - - ~ 5 '", �9 '" _ /
. . ~ ' ~ "> CEY -" ". ARR " ~
CRN, M"'i'r N S "~ SAR I ' , , . . . . . ~ . . . . . . . . . ."" " " ' - , , PVL .L-;T J �9 / 1
~DA ",,'~K5 O ' - " ' KDZ "'~ t 1
"" =JAN
I'5 ~ 210 ~ 25"
Figure 1 Map of location of seismological stations used for determination of epicenters.
each shock of the sequence. The accuracy of the epicenter and focal-depth determinations is satisfactory, since the averages of the corresponding standard errors
are 2 km and 5 km, respectively, and the number of arrivals used is larger than 12 for all shocks.
3. Distribution of earthquake foci
Figure 2 is an epicentral map of all the earthquakes of the sequence for which information is given in Table 1. Black circles indicate the epicenters of the earthquakes
which occurred between 9 April and 15 April and which presumably are foreshocks of
the M = 7.1 main shock, and open circles indicate the earthquakes that followed this shock and that are considered aftershocks. It is seen that the epicenters are distributed
along a line AB which has a southeast-northwest direction and which very probably shows the strike of the fault plane. We are going to present additional strong evidence,
based on the fault-plane solution and on geological information, to support this conclusion.

28 G. F. Karakaisis, B. G. Karaeostas, E. E. Papadimitriou, and B. C. Papazachos PAGEOPH,
Table 1 Data on All Earthquakes of Sequence with M >/4.3
Focal Date 1979 Origin time depth Error Error Observ's,
No. to 1980 (h:m:s) ~0~ 2 E h (km) M ERfl ER~ N
1 Apr. 9 1979 02:10:21.2 41 54.1 19 02.0 0 2 ,, 02:23:55.0 41 56.8 18 58.6 6 3 ,, 10 ,, 10:54:37.1 41 55.5 19 06.7 1 4 ,, 11 ,, 02:25:43.6 41 58.7 18 59.8 1 5 ,, 11:41:18.8 41 53.9 19 06.0 1 6 . . . . 05:58:41.4 41 54.9 19 05.8 7
MS . . . . . . 06:19:41.1 41 55.8 18 59.4 1 1 . . . . . . 06:31:10.3 42 11.9 1840.1 1 2 . . . . . . 07:11:28.1 42 00.0 19 09.5 1 3 . . . . . . 07:25:32.8 41 56.8 19 25.9 1 4 . . . . . . 07:48:45.1 41 46.1 19 07.9 7 5 . . . . . . 08:08:43.3 42 13.4 18 39.4 10 6 . . . . . . 08:13:17.2 41 57.7 19 09.9 14 7 . . . . . . 09:10:56.1 41 53.7 19 27.3 1 8 . . . . . . 10:03:28.6 41 57.8 1905.2 11 9 . . . . . . 10:25:25.3 41 48.4 19 17.3 1
10 . . . . . . 11:07:31.1 4202.7 1900.0 1 11 . . . . . . 11:17:16.6 42 10.8 1843.2 1 12 . . . . . . 11:42:18.1 41 54.6 1921.6 10 13 . . . . . . 12:43:47.2 41 56.2 19 07.5 3 14 . . . . . . 13:24:34.6 42 21.1 18 38.1 10 15 . . . . . . 14:43:07.7 42 12.0 18 41.2 8 16 . . . . . . 17:20:39.9 41 51.6 19 12.6 7 17 . . . . . . 17:52:57.7 42 31.0 18 32.5 6 18 ,, , , ,, 20:49:47.3 42 01.5 1909.4 2 19 ,, 16 ,, 01:36:28.6 4156.6 1912.0 4 20 . . . . . . 04:24:41.2 41 59.8 19 23.1 2 21 . . . . . . 04:38:32.5 41 54.2 19 14.9 4 22 . . . . . . 07:56:02.4 41 49.8 19 27.6 7 23 . . . . 09:43:43.8 41 50.7 19 21.5 7 24 . . . . . . 10:04:39.4 41 53.7 19 13.6 3 25 . . . . . . 10:41:10.0 41 50.6 19 21.7 1 26 . . . . 14:30:53.1 41 59.8 18 56.1 10 27 . . . . . . 15:51:08.2 41 50.7 19 18.0 5 28 ,, , , ,, 23:00:28.2 41 53.3 19 21.9 7 29 ,, 17 ,, 01:32:26.9 4156.2 1913.9 1 30 . . . . 03:53:33.7 41 48.2 19 27.8 4 31 . . . . . . 05:39:59.4 42 27.4 18 37.3 1 32 . . . . . . 13:45:09.1 42 03.5 19 03.6 16 33 . . . . . . 18:06:17.6 42 01.1 19 01.7 0 34 . . . . . . 18:31:23.7 41 56.5 1908.8 3 35 ,, , , ,, 19:22:57.4 41 58.1 19 07.5 1 36 ,, 18 ,, 02:45:13.1 4152.6 1903.0 3 37 . . . . . . 03:50:05.8 41 56.8 19 08.2 3 38 ,, 07:39:22.5 41 53.8 19 08.0 1 39 . . . . . . 19:51:14.5 4202.6 1901.9 1 40 ,, , , ,, 20:08:54.7 42 01.8 18 57.4 3 41 ,, 19 ,, 00:17:36.7 4154.7 1912.1 5
54 1.1 1.7 53 4.5 1.8 4.8 31 4.3 2.5 2.7 20 4.4 !.7 2.4 28 4.3 2.7 3.5 23 4.3 3.0 3.8 25 7.1 1.4 2.3 33 4.3 3.6 - - 12 4.4 4.0 5.7 20 4.3 3.3 4.5 17 4.3 2.5 6.2 20 4.5 1.6 4.9 24 5.1 2.0 3.0 28 4.3 5.3 8.7 14 4.3 2.1 6.9 16 5.3 1.9 4.8 29 4.5 1.9 3.4 23 4.3 2.7 15.1 18 5.0 2.3 2.5 24 5.0 1.8 2.6 30 4.6 2.3 7.1 20 5.8 1.3 4.8 34 4.4 3.2 5.8 24 4.6 3.4 8.2 19 5.0 1.0 1.8 31 4.6 2.5 3.5 28 4.3 4.0 124 17 4.6 1.8 2.4 28 5.1 1.5 2.1 39 4.7 2.0 2.6 33 5.3 1.3 3.0 43 4.3 3.6 6.9 18 4.6 1.6 3.0 38 4.6 1.6 3.3 29 5.2 1.3 1.7 42 4.5 1.7 3.7 23 5.0 1.6 2.6 29 5.1 1.7 3.1 38 4.4 1.7 6.3 21 4.5 1.5 2.6 38 4.5 2.8 7.2 26 4.3 3.0 6.8 22 4.5 1.9 5.9 28 4.8 1.0 1.5 42 4.4 2.0 2.9 32 4.9 1.1 2.0 41 4.3 2.9 6.4 14 5.0 1.2 1.8 40

Vol. 122, 1984/85 Properties of the Monte Negro, Yugoslavia, Seismic Sequence 29
Table 1 - - c o n t .
Date, 1979 Origin time
No. to 1980 (h:m:s) tp N h E
Focal depth
h (km) M
Error Error Observ's,
ERlq ER~ N
42
43
44
45
46
47
48
49
50 51
52
53 54
55
56
57
58
59
60
61
62
63
64
. . . . . . 05:42:51.I 42 01.7 18 59.3 0
07:07:07.2 42 00.5 18 58.4 6
,, 20 ,, 23:41:46.8 41 50.2 19 10.7 12
, 21 ,, 01:49:05.7 41 52.0 1906.0 30
. . . . . . 02:38:08.7 41 59.3 19 08.2 32
. . . . . . 04:04:54.3 41 47.7 19 27.2 1
. . . . . . 04:33:02.5 41 48.0 1908.7 1
. . . . . . 04:54:38.9 41 48.9 1908.3 11
. . . . . . 11:01:40.6 41 57.4 19 11.9 9
15:59:49.8 41 51.7 19 06.3 1
,, 22 ,, 06:32:13.2 41 55.2 19 12.9 1
07:32:08.5 41 49.9 19 15.0 8
. . . . 00:23:06.0 41 47.3 19 22.4 t4
. . . . . . 16:45:02.7 41 49.1 19 08.9 25
22:26:26.5 41 55.9 19 20.3 2
]] 2; ]', 06:36:48.3 4158.4 1912.6 5
. . . . . . 15:14:32.8 41 48.9 19 08.0 2
. . . . . . 19:12:18.3 41 46.4 19 10.3 6
, 26 ,, 18:12:26.6 41 55.8 19 08.1 16
,, 28 ,o 02:09:08.7 42 10.8 18 42.7 0
. . . . . . 03:38:04.8 42 12.6 18 45.5 7
. . . . . . 20:30:56.1 41 53.6 19 23.0 20 ,, 29 ,, 10:24:20.9 41 58.2 19 13.5 36
65 ,, 30 ,, 17:00:07.3 42 12.5 18 47.2 2
66 May 3 ,, 16:39:47.0 41 53.3 19 08.2 3
67 , 6 ,, 21:15:26.8 42 13.6 1841.8 0
68 . . . . . . 22:52:59.2 41 49.7 19 21.2 13
69 ,, 11 ,, I1:30:52.2 42 14.2 18 51.3 3
70 . . . . . . 15:10:49.9 42 00.6 19 09.7 6
71 12 , 03:30:35.4 42 16.3 18 50.8 3
72 ,, 14 ,, 09:53:08.3 41 55.6 19 12.0 3
73 ,, 18 ,, 02:42:56.8 41 59.4 19 09.6 2
74 ,, 20 ,, 08:45:29.8 42 11.8 18 45.8 1
75 , 24 ,, 17:23:20.3 42 09.0 18 42.5 7 76 19:42:42.2 42 13.4 18 44.2 7
77 21:04:43.6 42 09.6 18 48.2 2
78 22:28:18.1 42 14.5 18 44.2 28
79 , 25 02:45:48.0 42 11.5 18 45.8 1
80 . . . . 07:22:05.0 42 10.6 18 47.0 1 81 . . . . 09:25:07.2 42 11.4 18 45.4 I
82 . . . . 11:45:17.9 4208.4 18 47.5 0 83 . . . . 2I :43:34.6 42 09.8 18 47.9 1
84 ,, , , 23:44:11.0 42 15.2 18 44.3 1
85 ,, 27 , 14:47:36.7 42 03.4 18 56.4 30 86 ,, 28 13:27:57.2 42 12.7 18 42.2 24
87 . . . . 23:17:40.0 41 56.4 19 12.0 7
88 ,, 30 , 05:38:04.2 41 54.0 19 04.3 28
89 ,, 22:25:26.4 42 12.1 18 45.0 1
5.1 1.5 2.8 41
4.6 2.6 4.0 29
4.3 2.6 5.9 23
4.3 3.1 11.8 18
5.0 1.6 - - 35
4.4 2.0 4.2 27
5.0 1.6 7.7 34
4.6 1.6 5.4 31
4.6 1.9 4.8 27
4.4 2.6 7.6 25
5.1 1.8 5.8 37
4.5 1.3 4.3 25
4.4 2.8 7.6 28
4.4 2.0 10.3 32
4.3 4.2 14.8 20
5.0 2.9 - - 24
4.4 2.2 3.9 25
4.4 2.6 6.4 22
4.3 2.3 6.5 27
4.5 1.8 6.4 26
4.6 1.4 4.5 32
4.4 1.9 5.6 32
4.5 1.6 - - 22
4.7 1.4 3.4 35
4.4 2.3 6.0 25
4.3 2.9 7.6 19
4.3 2.8 6.8 19
4.3 3.4 5.5 21
4.5 1.3 1.6 29
4.9 2.0 4.8 33
5.1 t.5 2.3 28
4.3 2.5 3.2 28
4.5 1.3 2.1 33
6.3 1.6 6.6 33 4.5 3.2 - - 17
4.4 2.2 6.0 23
4.5 2.1 9.7 19
4.5 2.9 9.2 20
4.5 1.9 5.9 24
4.4 2.4 6.0 19
4.7 1.3 3.1 32
4.4 3.0 6.1 2I
4.3 3.2 7.0 20
4.5 4.3 10.1 19
4.5 2.5 9.3 23
4.4 2.7 8.6 22
4.5 1.9 7.8 30
4.3 1.8 3.8 25

30 G.F . Karakaisis, B. G. Karacostas, E. E. Papadimitriou, and B. C. Papazachos PAGEOPH,
Table 1--cont.
Focal Date, 1979 Origin time depth Error Error Observ's,
No. to 1980 (h:m:s) tpN 2~ h (km) M ERI~I ER2 N
90 . . . . . . 23:27:56.4 42 07.9 18 42.0 3 4.4 2.1 4.3 27 91 . . . . . . 23:47:17.3 42 19.9 18 51.4 4 4.6 1.4 3.3 31 92 Jun. 1 ,, 09:29:01.9 42 16.8 18 41.3 3 4.4 2.2 5.4 20 93 ,, 2 ,, 02:52:50.6 41 51.5 19 14.1 1 4.4 2.6 7.5 27
94 ,, 3 ,, 11:03:24.8 42 16.9 18 37.9 0 4.4 2.6 6.2 22 95 ,, 4 ,, 02:51:43.8 4205.7 1846.0 0 4.8 2.0 5.1 31 96 . . . . . . 03:24:15.0 42 09.7 18 48.2 2 4.3 2.6 4.9 20 97 ,, 5 ,, 12:49:56.9 42 14.8 18 48.3 1 4.5 2.0 5.4 27 98 ,, 11 ,, 23:36:08.5 42 06.7 18 44.2 1 4.3 4.9 - - 14 99 ,, 13 , 06:51:25.8 4207.0 1847.5 3 4.4 3.4 7.4 21
100 ,, 15 ,, 09:41:26.5 42 16.1 18 42.8 15 4.5 3.4 10.6 19 101 ,, 18 ,, 09:56:48.3 42 13.0 18 39.7 1 4.5 2.1 5.6 25 102 ,, 20 ,, 21:18:19.9 42 10.9 1846.7 5 4.8 1.6 - - 22 103 ,, 25 ,, 14:12:26.5 42 16.6 18 38.3 1 4.5 2.3 4.7 23 104 Jul. 4 ,, 22:41:42.9 42 07.6 18 49.9 9 4.3 2.5 10.0 18 105 . . . . 23:44:15.8 42 00.2 19 05.4 2 4.5 1.9 3.0 33
i4 106 . . . . 11:29:08.0 42 17.4 18 49.6 0 4.5 2.7 4.6 27 107 ,, 20 ,, 02:56:04.3 41 52.2 19 11.5 4 4.5 2.6 3.7 21 108 Aug. 2 ,, 14:41:47.4 4200.6 19 02.6 5 4.5 2.2 - - 20 109 ,, 6 ,, 07:48:13.0 42 17.4 18 37.5 0 4.4 2.3 5.1 20 110 ,, 9 ,, 23:20:18.2 42 16.9 18 33.4 1 4.4 2.7 3.5 28 111 ,, 17 ,, 05:30:40.0 41 52.8 19 19.6 7 4.5 2.5 3.2 29 112 ,, 24 ,, 04:27:51.1 42 13.0 18 57.4 0 4.3 2.6 3.2 28 113 ,, . . . . 10:16:51.6 42 10.0 18 46.5 25 4.4 2.1 - - 19 114 Sep. 15 ,, 08:58:48.2 42 07.0 19 06.9 0 4.4 2.5 3.0 29 115 ,, 21 ,, 05:10:27.0 41 52.3 19 14.3 1 4.3 2.7 3.5 29 116 . . . . 12:02:42.9 41 56.7 19 23.6 0 4.6 1.5 2.3 30 117 Nov. 6 , 08:05:27.0 41 57.2 19 16.1 0 4.3 2.4 2.9 28 118 ,, 7 ,, 11:41:58.2 41 57.1 1921.3 5 4.3 3.9 4.0 24 119 ,, 9 ,, 01:48:50.5 41 52.1 19 14.0 1 4.5 2.1 2.9 22 120 . . . . . . 02:38:16.3 41 48.2 19 12.7 0 4.3 2.7 7.8 22 121 . . . . . . 04:20:03.2 41 48.3 19 11.0 2 4.4 3.4 14.3 22 122 ,, 10 ,, 04:19:35.0 41 51.8 19 13.6 2 4.5 1.6 2.4 33 123 ,, 17 ,, 15:21:52.5 41 56.2 19 32.7 4 4.4 2.4 2.4 30 124 . . . . . . 16:28:09.6 42 01.I 19 30.0 10 4.5 2.2 1.2 22 125 . . . . . . 17:10:07.2 42 01.1 19 32.1 3 4.3 2.6 2.3 27 126 ,, 20 ,, 18:31:59.9 42 02.8 18 58.2 0 4.5 2.5 3.6 16 127 Dec. 14 ,, 09:08:53.6 42 19.3 18 47.9 1 4.4 3.2 4.2 26 128 ,, 20 ,, 14:24:15.6 41 48.0 19 22.2 7 4.7 2.1 2.6 24 129 Jan. 16 1980 12:50:22.2 42 19.4 18 52.1 0 4.5 3.3 4.3 24 130 ,, 22 ,, 12:57:15.2 42 17.7 18 53.9 0 4.4 2.5 3.4 30 131 . . . . . . 15:45:01.1 42 19.8 18 56.6 1 4.3 3.1 5.0 30 132 ,, 23 ,, 03:48:04.5 42 22.0 18 54.1 0 4.5 4.1 6.4 14
I t is o f in t e res t t o n o t e t h a t the ep i cen t r a l a r e a is d iv ided in to t w o p a r t s ( the
s o u t h e a s t e r n a n d the n o r t h w e s t e r n ) b y a n a s e i s m i c belt . T h e m a i n s h o c k o f 15 Apr i l ( M
= 7.1) b e l o n g s to the s o u t h e a s t e r n pa r t , whi le the l a r ge s t a f t e r s h o c k o f 24 M a y ( M =
6 .3) b e l o n g s to t he n o r t h w e s t e r n pa r t . T h e e p i c e n t e r s o f all e a r t h q u a k e s (wi th M _> 4.3)

Vol. 122, 1984/85 Properties of the Monte Negro, Yugoslavia, Seismic Sequence 31
18" 19"
B. 0 0
O
~ORESHOCKS ~ M : 5"0 L 5"B �9 M : 4 . 3 - 4.9
Ud~J ~Hn~K ~ M : 7.'1
~1188SH00~S (~ ) M : 5 0 - 5 . 8
0 I~ = 4.3 - 4.9
/ /
J r t
/
e~
"r r
o 50 ken
2O" 43*
Figure 2 Distribution of the epicenters of Monte Negro seismic sequence of ! 979.
that occurred between 9 April and 15 April (black circles) are close to the epicenter of the main shock, which indicates that these earthquakes are really foreshocks.
The average focal depth of the earthquakes with ~ 4.3 is 5 km, with a standard deviation equal to 7 kin. A plot of the foci of the southeastern group of earthquakes with M/> 5.0 on a plane that is normal to the trend of epicenters (normal to the strike of the fault) and has an approximately southwest-northeast direction is shown in Fig. 3. This figure shows that the earthquake foci are close to a plane which dips to the northeast. Therefore, the distribution of the earthquake foci of this sequence indicates that the seismic fault of the Monte Negro earthquake of 15 April 1979 (M = 7.1), strikes in a southeast-northwest direction and dips to the northeast, that is, from the Adriatic Sea to the continent (Yugoslavia).
4. Fault-plane solutions
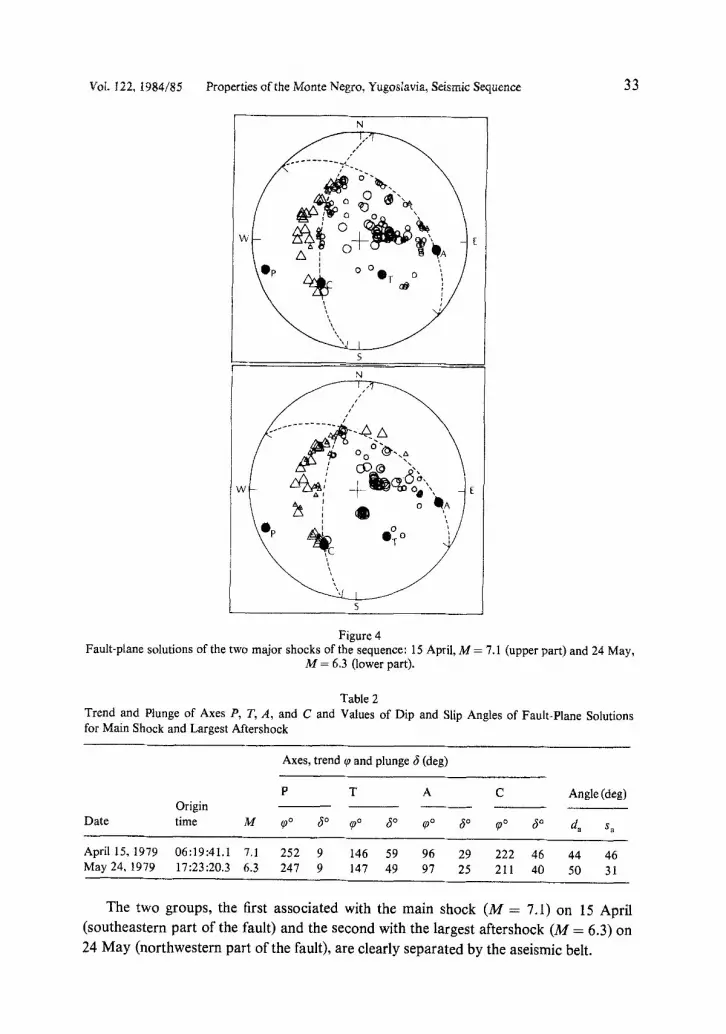
The first onsets determined from instrumentation of long and short periods were used to determine the fault-plane solutions of the main shock and of the largest aftershock of the sequence. The data were plotted on an equal-area projection of the lower hemisphere of the focal sphere, and a velocity equal to 6.8 km/sec was assumed for the longitudinal waves at the foci of the earthquakes.
The upper part of Fig. 4 shows the fault-plane solution for the 15 April (M - 7.1) main shock, and the lower part of the same figure shows the fault-plane solution for the 24 May (M = 6.3) largest aftershock. Dilatations and compressions are represented by

32 G.F. Karakaisis, B. G. Karacostas, E. E. Papadimitriou, and B. C. Papazachos PAGEOPH,
Q
C x ~ k m 10 20 30 D
| l I I
% O0
�9
Figure 3 Plot of foci of all earthquakes of southeastern group with M >1 5,0 on a plane that has a CD strike
perpendicular to the strike of the fault plane.
triangles and circles, respectively, while data of long-period and short-period instrumentation are represented by large and small triangles and circles, respectively. It is seen that the solutions for the two shocks are similar and the nodal planes are well determined.
In the two fault-plane solutions, the solution for the nodal plane sho~s that it strikes about southeast-northwest and dips to the northeast. This is taken as the fault plane because its orientation is in full agreement with the distribution of foci of the earthquakes of this sequence. It is also in agreement with geological evidence (ARSOVSKI
and JAN(~EVSKI, 1979, 1981) as well as with the isoseismal lines of the main shock, of which the largest axes strike about southeast-northwest (SuLSTAROVA and Muqo, 1980). This is a strike-slip left-lateral fault with a considerable thrust component. The fault is parallel to the coast of Yugoslavia on the Adriatic Sea, and the continental block moved northwest in respect to the Oceanic crust and overrides it.
Table 2 shows the trend and plunge of the P axis (maximum compression), axis T (maximum tension), axis A (slip direction on the fault), and axis C (normal to the fault) and the numerical values of the dip angle and the slip angle. The maximum compression is almost horizontal and shows convergence of the Adriatic lithosphere with the Balkan lithosphere, in agreement with similar observations along the western Greece-Albania-Yugoslavia coast (PAPAZACnOS et al., 1983).
5. Some features of the space-time distribution of shocks and their interpetation
Figure 5 shows a plot of the distances x of the epicenters along the strike AB of the fault from the point A of Fig. 2, as a function of the time of occurrence of the shocks. We can see in this figure several interesting features of the seismic sequence.
VoL t22, I984/85 Properties of the Monte Negro, Yugoslavia, Seismic Sequence 33
N
W E
5 N
w [
s
Figure 4 Fault-plane solutions of the two major shocks of the sequence: 15 April, M = 7.1 (upper part) and 24 May,
M = 6.3 (lower part).
Table 2 Trend and Plunge of Axes P, T, A, and C and Values of Dip and Slip Angles of Fault-Plane Solutions for Main Shock and Largest Aftershock
Axes, trend ~ and plunge 6 (deg)
P T A C Angle (deg) Origin
Date time M tp ~ ~o ~0o ~o rpo 60 ~o ~ d a sa
April 15, 1979 06:19:41.1 7,1 252 9 146 59 96 29 222 46 44 46 May 24, 1979 17:23:20.3 6.3 247 9 147 49 97 25 211 40 50 31
The two groups, the first associated with the main shock (M = 7.1) on 15 April (southeastern part of the fault) and the second with the largest aftershock (M = 6.3) on 24 May (northwestern part of the fault), are clearly separated by the aseismic belt.

34 G.F. Karakaisis, B. G. Karacostas, E. E. Papadimitriou, and B. C. Papazachos PAGEOPH,
N'Wl
loot
sat
l(m I
O
O 0
�9 M :,Tdl-tB ~ O C K S �9 M - 4.,;1-4~
M#dm SHOCK ~ ) M=ll
A F T r ~ I S M O C K S ~ ) M=fl~
�9 . - re~z o u=4JI-4J
O0 0 0 0 0 ~o~ o
8 0 oo o o o 8 ~ 0
i l 4 0 k : o o o
Ii t o o �9 ~0 0 0 0 0
F
A P R I L M A t
0 0
Y l U N E I IA L Y days
Figure 5 Space-time plotting of epicenters of the sequence. Distance x is measured from southeast to northwest.
The earthquakes that occurred between 9 April and 15 April (black circles) are very closely related, in space and time, with the main shock, which clearly show that these earthquakes are really foreshocks.
Immediately after the occurrence of the main shock the aftershock activity expanded to the southeast part of the fault and also to the northwest part by jumping the aseismic part of the fault. The loci of these aftershocks probably indicate sites of barriers where
high-stress concentrations were induced after the main shock, according to the ideas of AK1 (1979). One of these barriers, in the northwestern part of the fault, broke later when the largest aftershock, M = 6.3, occurred there on 24 May.
The aseismic belt between the two groups (without aftershocks) is probably that section of the fault which slipped smoothly during the main shock. This is in agreement with the position of the loci of the main shock at the end of the aseismic belt (Figs. 2 and 5) and the direction of the slip (northeast) of the overriding block of the fault at the focus of the main shock during its occurrence (Fig. 4).
If we assume that the distribution of the aftershock loci defines the area of the fault surface, then Fig. 5 shows that the length of the fault is 95 km and Fig. 3 shows that the
width of the fault is 12 km.
REFERENCES
AKI, K. (1979)~ Characterization of barriers on an earthquake fault, Geophys. J. R. Astr. Soc. 31, 3-25. ARSOVSKt, M., and JANCEVSKI, J. (1979), Seismotectonic characteristics of the Monte Negro coastal area

Vol. 122, 1984/85 Properties of the Monte Negro, Yugoslavia, Seismic Sequence 35
and the Northwestern part of Albania. In Proceedings of the International Research Conference on Intra-continental Earthquakes, September 17-21, 1979, Ohrid, Yugoslavia, pp. 131-- 135.
ARSOVSKI, M., and JANt~EVSKI, J. (1981). Geological and Seismotectonic Characteristics of the Region (of the Monte Negro, Yugoslavia earthquake of April 15, 1979). Institute of Earthquake Engineering and Engineering Seismology, University 'Kiril and Metodij,' Skopje, November 1981, pp. 75-88.
COMNINAKIS, P. E., and PAPAZACHOS, B. C. (t982), A Catalogue of Earthquakes in Greece and Surrounding Area for the period 1901-1980. University of Thessaloniki, Geophysical Laboratory, 5-1982, pp. 1-46.
KANAMORI, H. (1979), Seismological aspects of intra-continental Earthquakes, In Proceedings of the International Research Conference on Intra-continental Earthquakes, September 17-2 l, 1979, Ohrid, Yugoslavia, pp. 117-127.
LEE, W. H. K., and LAHR, J. C. (1975), HYPO 71 (revised): A computer program for determining hypocentre, magnitude and first motion pattern of local earthquakes, U.S.G.S. Open File Rep., 75-311.
MAKRIS, J. 0977), Geophysical investigation of the Hellenides, Geophys. Einzelchr., Harmburger, 34, pp. 1-124.
PANAGIOTOPOULOS, D. G., and PAPAZACHOS, B. C. (1984), Travel times of P n waves in the Aegean and surrounding area. Geophys. J. R. Astr. Soc. (in press). ;
PAPAZACHOS, B. C., KIRAXZl, A. A., HATZIDIMIXRIOU, P. M., and ROCCA, A. CH. (1983), Seismic faults in the Aegean area, Tectonophysics, 106, 77-85.
St~LSTAROVA, E., and Mu~:o, B. (1980), The macroseismic field of the April 15, 1979 Earthquake. In Proceedings on the Earthquake of April 15, 1979 and the Elimination of its Consequences, Shkodra, April 4-5, 1980, pp. 167-182.
(Received 9th February 1984, revised 20th August 1984, accepted 20th August 1984)