Tools and Policies for Promoting Social Equity in Seattle ...
Information Economics and Policy 23 (2011) 72–84
Contents lists available at ScienceDirect
Information Economics and Policy
journal homepage: www.elsevier .com/locate / iep
Promoting energy efficiency policies over the information barrier
Kostas Kounetas, Dimitris Skuras, Kostas Tsekouras ⇑Department of Economics, University of Patras, University Campus – Rio, P.O. Box 1391, Patras 26500, Greece
a r t i c l e i n f o
Article history:Received 6 December 2009Received in revised form 27 July 2010Accepted 4 August 2010Available online 22 August 2010
JEL classification:D80Q48Q38
Keywords:Energy policyInformationEpidemic modelsEmerging technology models
0167-6245/$ - see front matter � 2010 Elsevier B.Vdoi:10.1016/j.infoecopol.2010.08.001
⇑ Corresponding author. Tel.: +30 261 0996376; faE-mail addresses: [email protected] (K. Koun
patras.gr (D. Skuras), [email protected] (K. Ts
a b s t r a c t
Stakeholders argue that the information barrier is the major obstacle restricting firms fromadopting Energy Efficiency Technologies (EETs) in Europe. The present work examines theprocesses of information gathering as regards to EETs and explores the factors affecting thelevel of acquired information by EET adopters. Empirical evidence is provided by a data setof Greek manufacturing firms which have adopted EETs. In conclusion, we propose appro-priate policy measures able to promote the adoption of EETs by overcoming the informa-tion barrier.
� 2010 Elsevier B.V. All rights reserved.
1. Introduction
The promotion of energy efficiency efforts, i.e., theencouragement of means reducing energy consumptionwithout reducing the use of energy-consuming plantsand equipment, has a long standing history in the Euro-pean Union. The energy efficiency policy is very significantfor the EU both as a major environmental instrument de-signed to meet the targets set by the Kyoto Protocol andas a key element in the security of energy supply in theEU. The Green Paper on energy efficiency ‘‘Doing Morewith Less” (Commission, 2005) identified the industriesof manufacturing and transport as the potential championsin energy savings among all economic activities. However,and despite policy efforts, the penetration of energy effi-ciency measures regarding European firms is limited. Themost recent pan-European survey of businesses, includingSMEs and large enterprises, was carried out by the Obser-
. All rights reserved.
x: +30 261 0996130.etas), [email protected]).
vatory of European SMEs in 2006, the final year of the2000–2006 Action Plan for energy efficiency (Flash Euroba-rometer, 2007). This survey revealed that nearly two thirdsof SMEs operating in the EU do not even have simple rulesor devices for saving energy while only 4% of EU SMEs havea comprehensive system in place for energy efficiency.Even more worrying is the fact that the manufacturingindustry is not included among the top three energy-con-scious sectors while the transports sector is only third,with the hospitality and healthcare sectors taking the firsttwo places. Such results question, without doubt, the effi-ciency of energy efficiency policies.
The 2000–2006 Action Plan for energy efficiency identi-fied a number of potential barriers preventing access to andthe spread of efficient energy technologies. Lack of orincomplete information hampering the use of cost-effectiveand energy-efficient technology was among them. In 2005,and following the debate on the Green Paper on energy effi-ciency (Commission, 2006), the Commission launched avery wide debate complemented by a series of events in or-der to promote a better understanding of the energy effi-ciency initiative (Commission, 2006). The Commission
K. Kounetas et al. / Information Economics and Policy 23 (2011) 72–84 73
services received approximately 5000 answers from 241contributions to the debate (31 from NGOs, 66 from Mem-ber States and Public Bodies, 106 from industry and the pri-vate sector and 38 from private citizens). With regards tothe question ‘‘How could the community and the Commis-sion in particular, better stimulate European investment inenergy efficiency technologies” and on ‘‘How could fundsspent supporting research in this area be better targeted”,there was a unanimous response that delivered a clear mes-sage about the need for sensitization and information.Stakeholders claimed that funds would be better spent ondemonstrating and validating the potential of current tech-nology, avoiding the situation in which good solutions stayin closed boxes without delivering results. ‘‘Stakeholdersneed to know that technology exists, is effective and works”(Commission, 2006, p. 3).
The lack of or incomplete information is a real problemespecially for smaller businesses lacking the appropriatehuman capital and scientific expertise to support theirdecision to adopt energy efficiency technologies. The lackof readily available information and demonstration in-creases the cost to invest in such technologies due to: in-creased transaction/search costs making up for lack ofhuman capital; increased uncertainty regarding the invest-ment because of incomplete information or the presence ofinformation asymmetries; and finally due to the risk oflock-in an inappropriate technology when appropriatetechnologies ‘‘stay in closed boxes” or are still emergingand information is not widely available.
Taking into account the aforementioned discussion, ourresearch project develops in two stages. The first stage aimsat examining the factors influencing retrieval of informa-tion concerning energy efficiency technologies by manufac-turing firms and thus addresses issues at the heart of EU’senergy policy. The second stage deals with the distinguish-ing between readily available and emerging energy effi-ciency technologies as well as with the examination ofthe factors affecting information acquisition for each oneof these two broad sets of technologies. The empirical re-sults provide direct links to proposals for formulation andimplementation of an efficient energy efficiency policy.
The paper is organized as follows: Section 2 reviews therelevant literature and defines the theoretical underpin-nings of our research; the Section 3 presents a theoreticalapproach allowing us to classify decision makers accordingto their awareness of epidemic and emerging energy effi-ciency technologies. Based on this, a structural model ofadoption is developed. In the same section we present datacollection procedures and the statistical description ofdata. The Section 4 presents the empirical results and thelast section concludes the paper, summarizing the researchfindings and pointing out interesting research questionsfor future investigation.
2. Theoretical underpinnings
The goal of increasing energy efficiency and of instigat-ing the adoption of energy-efficient technologies (EET) ispursued through the provision of information to prospec-tive adopters (Anderson and Newell, 2004; Kounetas and
Tsekouras, 2008). Information provision as a non-priceinstrument of technology policy is the necessary initialstep in the adoption process. Its absence allows limitedinformation adding up to the barrier constraining theadoption of energy efficiency technologies (Blok et al.,2004, p.16).
The role of information prior to adoption has beenextensively documented in the economics literature (Ar-row, 1996; Feder et al., 1985; Saha et al., 1994). Especiallywhen the energy efficiency paradox is studied, informationprior to adoption is related to the existence of market bar-riers and market failures (DeCanio, 1993, 1998; Howarthand Anderson, 1993; Sutherland, 1994; Sanstand and Ho-warth, 1994) and to an industry’s learning curve which isa meaningful representation of technological change inglobal energy models (Grubler et al., 1999; Azar and Dow-latabadi, 1999; Read, 2000). Among SMEs, informationplays a crucial role for the adoption of energy-efficienttechnologies (Gillissen et al., 1995; Velthuijsen, 1995;DeGroot et al., 2001). The aforementioned studies revealthat a significant part of the total of available energy-effi-cient technologies is unknown to prospective adoptersand this information gap widens as the size of the firm getssmaller. Thus, the size and other firm-specific characteris-tics as well as the environment in which firms operate,may contribute to an explanation of the scale of the ob-served information gap.
Adoption of energy-efficient technologies has been ap-proached through a variety of models including the epi-demic, rank, order, stock and supply-side effectsparadigms (Karshenas and Stoneman, 1993). The epidemicmodel is more frequently used when the technology underconsideration is mature or not in its infancy (Geroski,2000). All other models are used for emerging technologies(Morgenstern and Al-Jurf, 1999). The level of informationpossessed and the way this information is acquired by adecision maker is a critical factor separating these models(indicatively, see Howarth et al., 2000; Morgenstern andAl-Jurf, 1999; Metcalf and Hassett, 1999). In the epidemicmodel, potential adopters acquire knowledge passively,i.e., by observing without a cost what actual adopters expe-rience. These potential adopters, heterogeneous firms withcharacteristic information asymmetries (Mansfield, 1989;Geroski, 2000), presume that the primary factor limitingdiffusion is lack of information, and that the most impor-tant source of information about a new technology is firmswhich have already adopted it. In the emerging technologymodels adopters undertake active search for informationabout new technologies themselves (Lester and McCabe,1993; Jensen, 1988; Morgenstern, 1996; Morgenstern andAl-Jurf, 1999).
The aforementioned theoretical arguments justify whyinformation provision lies at the heart of energy savingpolicies around the world. Besides the EU’s efforts to in-crease and enhance the quantity and quality of informationprovided to prospective adopters of energy-efficient tech-nologies, countries such as the US, Australia, Canada, theUK, Germany, the Netherlands and Denmark, report infor-mation dissemination policies as part of their energy poli-cies. The Long-Term Agreements on energy efficiency inthe Netherlands: (Nuijen, 1998; Rietbergen et al., 1998),
74 K. Kounetas et al. / Information Economics and Policy 23 (2011) 72–84
the Energy Efficiency Best Practice Program in the UK(Miles, 1994), the Agreements on Industrial Energy Effi-ciency in Denmark (Togeby et al., 1998), the Energy SmartBusiness Program in Australia (Cooper et al., 1999), theDeclaration of German Industry on Global Warming Pre-vention in Germany (Ramesohl and Kristof, 1999), theIndustry Program for Energy Conservation (CIPEC) in Can-ada (Jago, 1999), and the Green Light Program sponsoredby EPA (DeCanio, 1998) provide few examples. However,from a strictly technical point of view, these policy inter-ventions provide the information about new technologieswithout following the rationale of any of the aforemen-tioned models, the epidemic or the emerging technologymodels. As a result, the policies do not present informationregarding best or worst practices of firms that have alreadyadopted energy saving technologies, nor do they follow theprinciples of information supply suggested by the emerg-ing technology models such as educational workshopsand training programs for professionals, advertising, prod-uct labeling and energy audits of manufacturing plants(Anderson and Newell, 2004).
In this paper we argue that the firm’s information/knowledge level, regarding the EETs, is non-neutral be-cause it is technology-vintage dependent. Additional ele-ments of heterogeneity are introduced by the firms’ size,age, and sector of economic activity. It should be noted thatthe definition of the ‘‘informed or knowledgeable” EET firmadopted in this paper is also applicable to technologiesother than EETs, such as ICTs, waste treatment technolo-gies etc. Additionally, we argue that the absorptive capacityof firms as well as their competencies and capabilities dependupon the nature of the recognized technological opportunities(Cohen and Levinthal, 1989; Malebra and Orsenigo, 1996).Having established that the level of knowledge differsamong types of technologies we proceed by determiningthe factors influencing the capacity of firms to absorbinformation and knowledge.
3. Information and EET adoption: an empiricalimplementation
3.1. The Greek incentives schemes for the adoption of energysaving technologies
In Greece, energy saving investment projects under-taken by individual firms are supported by the central orregional authorities. The Greek government has recognizedthe need to conserve energy in manufacturing and to re-duce dangerous emissions in order to meet the criteria ofthe Kyoto Protocol. In the past two decades, energy policiesthat aim to promote conservation and induce firms toadopt environment-friendly technologies have been for-mulated based on (i) the Support Frameworks for Regionaland Industrial Development, (ii) the Energy OperationalProgram (OPE), which was part of the second European Un-ion Support Framework (1994–2000) and (iii) the Opera-tional Program ‘Competitiveness’, which was part of thethird European Union Support Framework (2000–2006).Firms submitted their energy efficiency projects and thesewere assessed by the Directorate of Renewable Energy and
Energy Saving in the Ministry of Development and the cen-tral services of the Ministry of National Economy. Success-ful proposals were selected to be supported.
The incentives that have been included in theseschemes concern grants for machinery, buildings and otherassets, interest rate subsidies, tax-free allowances, favor-able tax rates and lower social security contributions. Inaddition, a significant part of all financial resources of theabovementioned programs was dedicated to informationprovision and technical support for firms regarding energyconservation and energy consumption reduction issues.Moreover, state authorities attempted to develop andimplement activities such as data collection and statisticalanalysis, participation in the EU Project on Energy Effi-ciency Indicators and finally the energy auditing and mon-itoring program through eight intermediary agents and theestablishment and operation of 17 energy centers, respon-sible for the promotion of EU programs. These agents andcenters were responsible for the appropriate provision ofinformation concerning energy efficiency projects and forthe collection and first assessment of the firms’applications.
3.2. The sampling framework and the survey process
In order to assemble a sample of EET adopters we usedthe records provided by the Ministry of Development andthe Department of Energy and Natural Resources. The ori-ginal list contained a total number of 396 firms that had in-vested in EET. By excluding those firms of the Servicessector that implement different energy saving technology,325 manufacturing firms remain pertinent to our investi-gation. A further communication with the firms’ managersand chief-engineers indicated that only 298 firms hadactually accomplished the transition to energy saving tech-nology and 293 had been granted capital subsidies as aninvestment incentive for that purpose.
The data related to the purposes of our research is notreadily available either from any of the intermediateagents collecting data for the Greek energy policy or fromthe records kept by central authorities. The latter provideddata regarding the EET investments performed only byindividual firms. Thus, it was decided to collect additionaldata by means of a rather extensive questionnaire dividedinto nine sections and dealing with: the firms’ general,organizational and managerial characteristics, characteris-tics of the energy conservation technology project theyhave undertaken, market competition, their strategic ori-entation, their knowledge and degree of implementationof energy-efficient technologies, their investment behav-ior, their attitude towards energy saving technologies andtowards barriers to invest in energy-efficient technologies,and finally their evaluation of the investment and their po-tential expectations concerning further investments in en-ergy efficiency projects. The questionnaire was tested, forapproximately two months, in a pilot study in the regionof Western Greece for further evaluation and improve-ment. The final questionnaire was addressed to the 298firms across the country. Only 161 of them agreed to beinterviewed with the use of the questionnaire. Face to faceinterviews took place in the first six months of 2004.
K. Kounetas et al. / Information Economics and Policy 23 (2011) 72–84 75
The data derived from the central authorities responsi-ble for supporting EET projects, along with that collectedfrom the aforementioned survey were complemented byfirm specific economic and financial data from the businessdatabase maintained by the private financial and businessinformation service company called ICAP in Greece. Theannual ICAP directories provide key production, employ-ment and financial information from the published balancesheets of nearly all Plc. and Ltd. firms operating in all sec-tors of economic activity in Greece. From the annual direc-tories of ICAP we matched a database for the firmsincluded in our survey and for the period 1989–2004.The interested reader will find an analytical descriptionof survey process and descriptive outcomes in Kounetasand Tsekouras (2008).
3.3. Modelling and econometric issues
3.3.1. The level and nature of adopters’ informationLet us consider the ith firm (i = 1, 2, . . ., N), which exam-
ines the possibility of adopting an energy saving technol-ogy. In this process and under the rationality approach,the firm collects information from two distinct sources.The first source corresponds to the available K elementsof the epidemic type of information, and is denoted asIE = {e1, e2, . . . , eK}. The second source corresponds to the Lelements of the emerging technology type of information,and is denoted by the set IM = {m1, m2, . . . , mL}. In thisway, we define the set of all available information IX, irre-spective of its type, as IX ¼ [j¼E;MIj.
In addition, we can reasonably argue that IE \ IM �£.Both sets, IE and IM, are assumed to be closed and frag-mented and therefore their union, the IX set, is also closedand fragmented. The meaning of these conditions is thatthere is no information about energy saving technologies,either already adopted or emerging, that is not containedin the IX set. The ith firm forms its information set Ii usingelements from its epidemic set of information IEi
ðIEi# IEÞ
and from its emerging technology set of informationIMiðIMi
# IMÞ as Ii ¼ [j¼E;M
Iji# IX. The number of information
elements that are contained in the set Ii and come fromthe sets IEi
and IMiare denoted by ni(K) and ni(L), respec-
tively. Of course the relationship Ii # IX holds in any case.Based on the Ii set, four distinct information states of theith firm can be defined.
Definition. The information status of the ith firm, whichexamines the adoption of an energy saving technology, isdirectly related to its information set Ii.
(i) If Ii �£ the firm is non-informed in any way.(ii) If Ii � IX the firm is fully informed.
(iii) If Ii – £ and ni(K) > ni(L) then the firm is informedbut its information set is dominated by elementsthat have an epidemic rather than an emerging tech-nology character. Such being the case the firm ischaracterized as epidemically informed.
(iv) Finally, if Ii – £ and ni(K) < ni(L) then the firm is alsoinformed but in this case the elements of emergingtechnology information dominate the corresponding
elements of the epidemic character. This is the caseof the emerging technology informed firm.
The above definition allows us to formulate the follow-ing proposition:
Proposition. The ith firm is informed if and only if at leastone of the corresponding IEi
and IMiinformation sets is non-
empty.Proposition’s proof is straightforward.At this point we define the following real function
INF ¼ f ðIiÞ ¼1 if Ii–£
0 otherwise
�ð1Þ
Economically speaking, relationship (1) shows that afirm may be considered informed if it possesses any ele-ments of information regardless of its nature. It is evidentthat shedding light on the nature of this information isquite interesting, especially for policy makers. The ap-proach followed until now allows us to do so. More specif-ically, we define two additional real functions.
EPIDINF ¼ gðIEiÞ ¼
1 if IEi–£ ^ niðKÞ > niðLÞ
0 otherwise
�ð2Þ
and
EMRINF ¼ hðIMiÞ ¼
1 if IMi–£ ^ niðKÞ < niðLÞ
0 otherwise
�ð3Þ
These two real functions describe two different infor-mation statuses of the firm. Relationship (2) correspondsto a firm which is essentially informed through the experi-ence which arises from the adoption of energy saving tech-nologies, while relationship (3) involves a firm thatacquires information through research into emerging en-ergy saving technologies.
The above analysis can be extended in a straightforwardmanner under the assumption that the firm is informedepidemically, emerging in terms of technology or fully,not only in the case when Ii – £ (i.e. in the case whereIEi
–£ _ IMi–£), but also in the case when its level of infor-
mation exceeds a crucial threshold, lets say I�i , that is whenIi is a hyper set of I�i ðIi � I�i Þ. In other words and in terms ofni(j)(j = K, L), one could consider a firm informed inn�i ðKÞ > niðKÞ and/or n�i ðLÞ > niðLÞ. We should note that thisinformation level threshold, defined either in I�i terms, orn�i ðKÞ and n�i ðLÞ terms, is practically unobservable, and itsdefinition is essentially subjective or arbitrary, althoughthis arbitrary character does not affect our analysis in thesense that the notion of awareness remains stable.
3.3.2. The structural model and the econometric approachFollowing the neo-classical theory of the firm, we may
consider that a firm decides to acquire or not a specificquantity of information following a decision making pro-cess which is quite similar to the case of any other ‘‘nor-mal” input. In other words, we argue that each firmevaluates this information-input according to its contribu-tion to firm’s objectives which we can reasonably assumeto be summarized in the firm’s profit function. The pro-posed econometric analysis is not necessarily bound tothe neo-classical theoretical framework and can accommo-date various theoretical perspectives even in the case
76 K. Kounetas et al. / Information Economics and Policy 23 (2011) 72–84
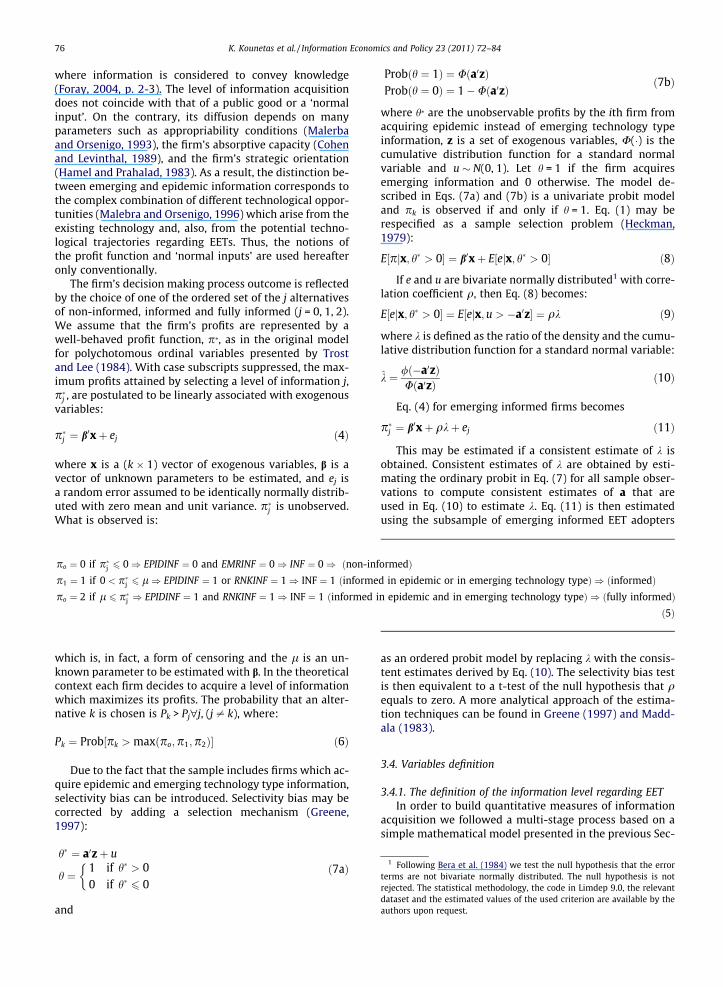
where information is considered to convey knowledge(Foray, 2004, p. 2-3). The level of information acquisitiondoes not coincide with that of a public good or a ‘normalinput’. On the contrary, its diffusion depends on manyparameters such as appropriability conditions (Malerbaand Orsenigo, 1993), the firm’s absorptive capacity (Cohenand Levinthal, 1989), and the firm’s strategic orientation(Hamel and Prahalad, 1983). As a result, the distinction be-tween emerging and epidemic information corresponds tothe complex combination of different technological oppor-tunities (Malebra and Orsenigo, 1996) which arise from theexisting technology and, also, from the potential techno-logical trajectories regarding EETs. Thus, the notions ofthe profit function and ‘normal inputs’ are used hereafteronly conventionally.
The firm’s decision making process outcome is reflectedby the choice of one of the ordered set of the j alternativesof non-informed, informed and fully informed (j = 0, 1, 2).We assume that the firm’s profits are represented by awell-behaved profit function, p*, as in the original modelfor polychotomous ordinal variables presented by Trostand Lee (1984). With case subscripts suppressed, the max-imum profits attained by selecting a level of information j,p�j , are postulated to be linearly associated with exogenousvariables:
p�j ¼ b0xþ ej ð4Þ
where x is a (k � 1) vector of exogenous variables, b is avector of unknown parameters to be estimated, and ej isa random error assumed to be identically normally distrib-uted with zero mean and unit variance. p�j is unobserved.What is observed is:
po ¼ 0 if p�j 6 0) EPIDINF ¼ 0 and EMRINF ¼ 0) INF ¼ 0) ðnon-informedÞp1 ¼ 1 if 0 < p�j 6 l) EPIDINF ¼ 1 or RNKINF ¼ 1) INF ¼ 1 ðinformed in epidemic or in emerging technology typeÞ ) ðinformedÞpo ¼ 2 if l 6 p�j ) EPIDINF ¼ 1 and RNKINF ¼ 1) INF ¼ 1 ðinformed in epidemic and in emerging technology typeÞ ) ðfully informedÞ
ð5Þ
1 Following Bera et al. (1984) we test the null hypothesis that the errorterms are not bivariate normally distributed. The null hypothesis is notrejected. The statistical methodology, the code in Limdep 9.0, the relevantdataset and the estimated values of the used criterion are available by theauthors upon request.
which is, in fact, a form of censoring and the l is an un-known parameter to be estimated with b. In the theoreticalcontext each firm decides to acquire a level of informationwhich maximizes its profits. The probability that an alter-native k is chosen is Pk > Pj"j, (j – k), where:
Pk ¼ Prob½pk > maxðpo;p1;p2Þ� ð6Þ
Due to the fact that the sample includes firms which ac-quire epidemic and emerging technology type information,selectivity bias can be introduced. Selectivity bias may becorrected by adding a selection mechanism (Greene,1997):
h� ¼ a0zþ u
h ¼1 if h� > 00 if h� 6 0
�ð7aÞ
and
Probðh ¼ 1Þ ¼ Uða0zÞProbðh ¼ 0Þ ¼ 1�Uða0zÞ
ð7bÞ
where h* are the unobservable profits by the ith firm fromacquiring epidemic instead of emerging technology typeinformation, z is a set of exogenous variables, U(�) is thecumulative distribution function for a standard normalvariable and u N(0, 1). Let h = 1 if the firm acquiresemerging information and 0 otherwise. The model de-scribed in Eqs. (7a) and (7b) is a univariate probit modeland pk is observed if and only if h = 1. Eq. (1) may berespecified as a sample selection problem (Heckman,1979):
E½p x; h� > 0j � ¼ b0xþ E½e x; h� > 0j � ð8Þ
If e and u are bivariate normally distributed1 with corre-lation coefficient q, then Eq. (8) becomes:
E½e x; h� > 0j � ¼ E½e xj ;u > �a0z� ¼ qk ð9Þ
where k is defined as the ratio of the density and the cumu-lative distribution function for a standard normal variable:
k̂ ¼ /ð�a0zÞUða0zÞ ð10Þ
Eq. (4) for emerging informed firms becomes
p�j ¼ b0xþ qkþ ej ð11Þ
This may be estimated if a consistent estimate of k isobtained. Consistent estimates of k are obtained by esti-mating the ordinary probit in Eq. (7) for all sample obser-vations to compute consistent estimates of a that areused in Eq. (10) to estimate k. Eq. (11) is then estimatedusing the subsample of emerging informed EET adopters
as an ordered probit model by replacing k with the consis-tent estimates derived by Eq. (10). The selectivity bias testis then equivalent to a t-test of the null hypothesis that qequals to zero. A more analytical approach of the estima-tion techniques can be found in Greene (1997) and Madd-ala (1983).
3.4. Variables definition
3.4.1. The definition of the information level regarding EETIn order to build quantitative measures of information
acquisition we followed a multi-stage process based on asimple mathematical model presented in the previous Sec-
K. Kounetas et al. / Information Economics and Policy 23 (2011) 72–84 77
tion 3.3. In this section we attempt to discuss the intuitionbehind the mathematical model. First, we construct a var-iable (hereinafter denoted as the INF variable) which sepa-rates the EETs’ adopters into prior informed and prior non-informed. The interviewed managers of the firms wereasked directly to rank their prior information level aboutemerging and epidemic EETs in a scale of one to five. Inthe next step the average of the distribution of responsesof all firms was calculated for the epidemic and emergingEETs separately. If the epidemic rank of a firm exceededthe epidemic average of all firms, the firm was character-ized as informed. In all other cases it was characterizedas non-informed. The same procedure was followed foremerging technologies. Furthermore, the classificationwhich resulted from this procedure was filtered by askingthe managers, who were characterized as informed in theprevious stage, to record at least two epidemic and/oremerging EETs. This question allowed us to test the agent’sperception of the notion of epidemic and emerging EETs. Ifthe interviewed manager failed to acknowledge at leasttwo epidemic and/or emerging technologies, the firm wascharacterized as non-informed. Hence, the dichotomousvariable INF takes the value of 1 if the manager’s rank ex-ceeds the average of the epidemic or emerging generalranking and if, at the same time, he or she can record atleast two epidemic or emerging EETs. On the contrary,the INF variable takes the value of 0, that is, the firm is con-sidered not to be informed when the two above mentionedconditions do not hold simultaneously.
At a second stage we constructed the variables depict-ing the level of prior information that the firms maypossess for the epidemic and emerging technology corre-spondingly. In the remaining of this paper these variableswill be referred to as EPIDINF and EMRINF for epidemicand emerging technologies correspondingly. More specifi-cally the managers of the firms that were characterizedas informed at the first stage were asked to rank theirinformation level on a scale from one to three, for fivebroad categories of information for both epidemic andemerging technologies. More specifically, the five broadcategories of information are: (i) Investment Cost andFunding Opportunities, (ii) Technical Characteristics ofEquipment, (iii) Competition and Best Practices, (iv) Envi-ronmental Regulation and Social Pressure and (v) Flexibil-ity and Adjustment of the firm in terms of the EETsembodiment.
Thus, in the second part phase of the interview, eachfirm ranked on a scale from one to three, the extent of itsinformation regarding 17 investment characteristics of epi-demic EETs which in turn comprise the aforementionedfive broad categories. For each firm the average score wascalculated and then normalized by dividing it with thestandard deviation of each firm’s scores distribution. Thenext step was to calculate the range of variation, that isthe difference between the maximum and the minimumof the normalized average scores, and two limits wereset, taking into account that the scale of ranking is threedegrees. More specifically, the lower limit that correspondsto inadequately epidemic informed firms is the product ofthe range of variation multiplied by one third (1/3) whilethe upper limit, that in turn corresponds to adequately epi-
demic informed firms is the product of the range of varia-tion multiplied by two thirds (2/3). Thus, if a firm’s score islower than or equal to the lower limit, this firm is charac-terized as insufficiently informed (EPIDINF = 0). If, on theother hand, a firm’s score lies between the two limits itis characterized as sufficiently informed (EPIDINF = 1) andfinally if it is above the upper limit it is characterized asfully informed (EPIDINF = 2). The exact same procedure isfollowed in the case where the firms are grouped withrespect to their level of information for the emerging tech-nologies. Hence the insufficiently informed firms corre-spond to EMRINF = 0, the sufficiently informed ones toEMRINF = 1 and finally the fully informed firms correspondto EMRINF = 2. Basic descriptive statistics of the useddependent variables are presented in the upper part ofTable 2.
3.4.2. The definition of explanatory variablesThe vector of factors that determine the level of infor-
mation possessed by the adopters of new technologies(the x vector of the above equations), is classified intothe following four categories: First, factors that are associ-ated with the firm’s attitude towards the research anddevelopment process (Gillissen, 1995; Anderson and New-ell, 2004) and the introduction of energy saving innova-tions. Such variables are, (RDD), (RDP), (FINFORM),(INNOVD), and (INNOVC) are defined analytically in Table1. Secondly, factors that are associated with the behaviorof the firm towards investments (DeGroot et al., 2001),captured by the variables (PINV), (PINVC), (FUTINV), (FUT-INVC) of Table 1. It must be noted here that the variable(WILINVEED) captures a combined effect of the two abovefactors since it is defined as a dummy variable which takesthe value of 1 if the firm has implemented an additionalenergy saving technology through an investment projectand of 0 if it has not. Thirdly, factors related to the techni-cal support the firm has and the opportunity it has to de-rive information relevant to energy saving technologies.Such factors are captured by the variables (ECOP) (Gillis-sen, 1995; DeGroot et al., 2001), (INFTYPE) and (LOC) in Ta-ble 1. Finally, factors related to the issue of the principalagent, (DGOVORG) and (DECINV), to the customer orientedtechnologies (DeGroot et al., 2001), captured by the vari-able (EXT), and to the firm’s size and its relation to invest-ment (SIZE) (DeGroot et al., 2001). Basic descriptivestatistics of the used explanatory variables are presentedin the lower part of Table 2.
4. Results and discussion
This section presents the empirical results of our re-search project in two stages. First the factors determiningthe level of information that adopters of energy savingtechnologies obtain are isolated, irrespective of the charac-ter of the information itself. In other words we present theresults fitting the empirical Eq. (1). Secondly, we identifythe set of determinants which specify the level of informa-tion that adopters of EET possess when the information isdistinguished into epidemic or emerging technology. As aresult, three models are presented that describe (a) the
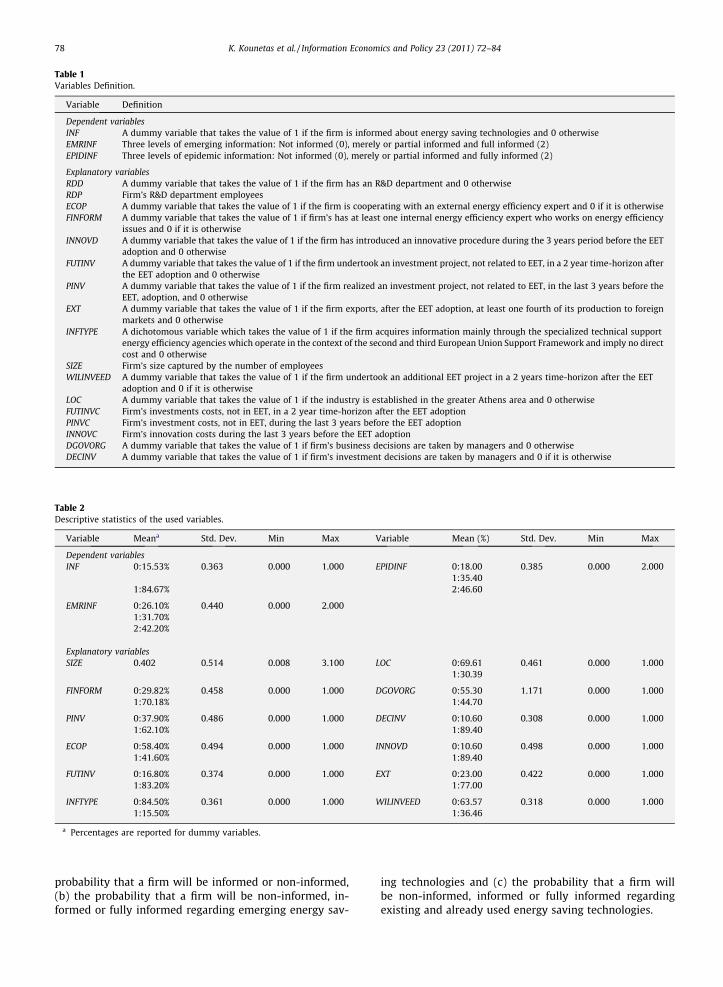
Table 1Variables Definition.
Variable Definition
Dependent variablesINF A dummy variable that takes the value of 1 if the firm is informed about energy saving technologies and 0 otherwiseEMRINF Three levels of emerging information: Not informed (0), merely or partial informed and full informed (2)EPIDINF Three levels of epidemic information: Not informed (0), merely or partial informed and fully informed (2)
Explanatory variablesRDD A dummy variable that takes the value of 1 if the firm has an R&D department and 0 otherwiseRDP Firm’s R&D department employeesECOP A dummy variable that takes the value of 1 if the firm is cooperating with an external energy efficiency expert and 0 if it is otherwiseFINFORM A dummy variable that takes the value of 1 if firm’s has at least one internal energy efficiency expert who works on energy efficiency
issues and 0 if it is otherwiseINNOVD A dummy variable that takes the value of 1 if the firm has introduced an innovative procedure during the 3 years period before the EET
adoption and 0 otherwiseFUTINV A dummy variable that takes the value of 1 if the firm undertook an investment project, not related to EET, in a 2 year time-horizon after
the EET adoption and 0 otherwisePINV A dummy variable that takes the value of 1 if the firm realized an investment project, not related to EET, in the last 3 years before the
EET, adoption, and 0 otherwiseEXT A dummy variable that takes the value of 1 if the firm exports, after the EET adoption, at least one fourth of its production to foreign
markets and 0 otherwiseINFTYPE A dichotomous variable which takes the value of 1 if the firm acquires information mainly through the specialized technical support
energy efficiency agencies which operate in the context of the second and third European Union Support Framework and imply no directcost and 0 otherwise
SIZE Firm’s size captured by the number of employeesWILINVEED A dummy variable that takes the value of 1 if the firm undertook an additional EET project in a 2 years time-horizon after the EET
adoption and 0 if it is otherwiseLOC A dummy variable that takes the value of 1 if the industry is established in the greater Athens area and 0 otherwiseFUTINVC Firm’s investments costs, not in EET, in a 2 year time-horizon after the EET adoptionPINVC Firm’s investment costs, not in EET, during the last 3 years before the EET adoptionINNOVC Firm’s innovation costs during the last 3 years before the EET adoptionDGOVORG A dummy variable that takes the value of 1 if firm’s business decisions are taken by managers and 0 otherwiseDECINV A dummy variable that takes the value of 1 if firm’s investment decisions are taken by managers and 0 if it is otherwise
Table 2Descriptive statistics of the used variables.
Variable Meana Std. Dev. Min Max Variable Mean (%) Std. Dev. Min Max
Dependent variablesINF 0:15.53% 0.363 0.000 1.000 EPIDINF 0:18.00 0.385 0.000 2.000
1:35.401:84.67% 2:46.60
EMRINF 0:26.10% 0.440 0.000 2.0001:31.70%2:42.20%
Explanatory variablesSIZE 0.402 0.514 0.008 3.100 LOC 0:69.61 0.461 0.000 1.000
1:30.39
FINFORM 0:29.82% 0.458 0.000 1.000 DGOVORG 0:55.30 1.171 0.000 1.0001:70.18% 1:44.70
PINV 0:37.90% 0.486 0.000 1.000 DECINV 0:10.60 0.308 0.000 1.0001:62.10% 1:89.40
ECOP 0:58.40% 0.494 0.000 1.000 INNOVD 0:10.60 0.498 0.000 1.0001:41.60% 1:89.40
FUTINV 0:16.80% 0.374 0.000 1.000 EXT 0:23.00 0.422 0.000 1.0001:83.20% 1:77.00
INFTYPE 0:84.50% 0.361 0.000 1.000 WILINVEED 0:63.57 0.318 0.000 1.0001:15.50% 1:36.46
a Percentages are reported for dummy variables.
78 K. Kounetas et al. / Information Economics and Policy 23 (2011) 72–84
probability that a firm will be informed or non-informed,(b) the probability that a firm will be non-informed, in-formed or fully informed regarding emerging energy sav-
ing technologies and (c) the probability that a firm willbe non-informed, informed or fully informed regardingexisting and already used energy saving technologies.
K. Kounetas et al. / Information Economics and Policy 23 (2011) 72–84 79
The search for the best empirical model was guided bytwo criteria. First, we searched for a meaningful and in-formed, as mentioned in the above discussion, set ofexplanatory variables among the available financial andeconomic variables, transformations of variables or inter-actions among variables. Secondly, we looked for the mod-els with the best econometric properties among alternativemodels. This implied that variables with no statisticallysignificant results have been included in our final model,since this is also an important finding, ensuring, however,that they do not unfavorably affect the statistical powerof the model. Separate tests examining the null hypothesisthat individual coefficients are zero, and a joint test of thenull hypothesis that all the parameters associated with theexplanatory variables are equal to zero have been carriedout. Specification test analysis involved a test for homosce-dasticity (Greene, 1997, p. 890), and a test for the omissionof certain variables. Omission of a significant variable, inthe context of a binary, dichotomous choice model, impliesthat even if the omitted variable is uncorrelated with theincluded ones, the coefficient of the included variables willbe inconsistent (Yatchew and Griliches, 1984). A goodness-of-fit measure usually reported as McFadden’s pseudo-R2
measure, or rho-square (q2) (Maddala, 1983), as well asthe percentage of correctly predicted cases are alsocomputed.
4.1. Determinants of the firms’ level of information about EEtechnologies
The first research question was examined using a probitmodel which depicts the distinction between informed andnon-informed adopters as they are reflected by the depen-dent dichotomous variable (INF). This probit model is alsoused to ‘forecast’ whether a randomly drawn adopter of EEtechnologies is informed in any of the two ways in ques-tion or not and its estimates are used to ‘correct’ the or-
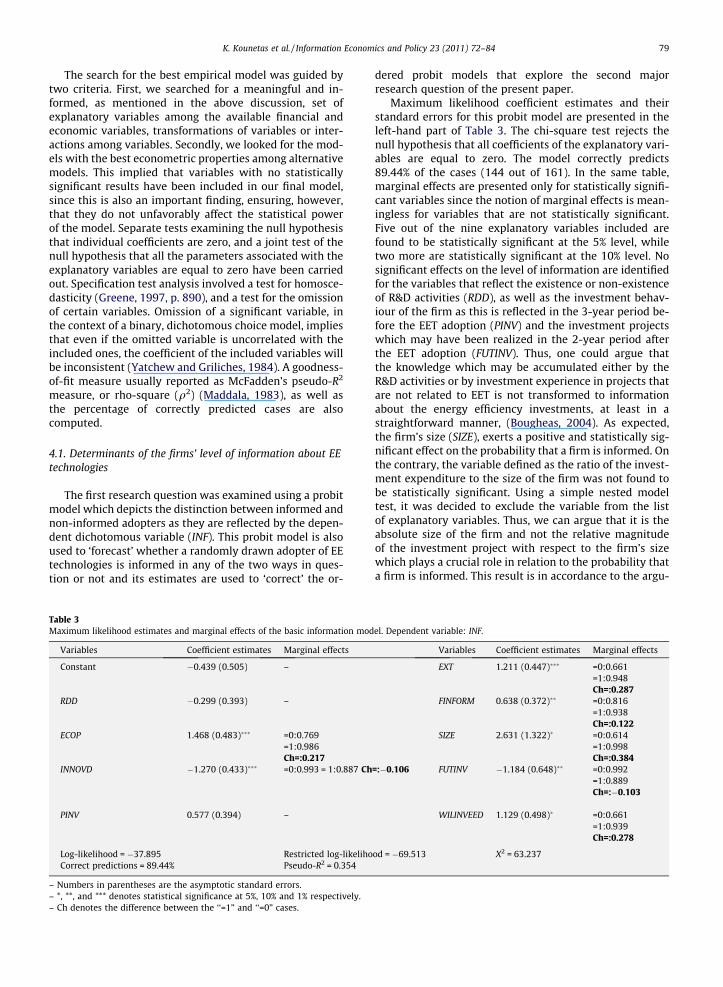
Table 3Maximum likelihood estimates and marginal effects of the basic information mod
Variables Coefficient estimates Marginal effects
Constant �0.439 (0.505) –
RDD �0.299 (0.393) –
ECOP 1.468 (0.483)��� =0:0.769=1:0.986Ch=:0.217
INNOVD �1.270 (0.433)��� =0:0.993 = 1:0.887 Ch
PINV 0.577 (0.394) –
Log-likelihood = �37.895 Restricted log-likelihoCorrect predictions = 89.44% Pseudo-R2 = 0.354
– Numbers in parentheses are the asymptotic standard errors.– *, **, and *** denotes statistical significance at 5%, 10% and 1% respectively.– Ch denotes the difference between the ‘‘=1” and ‘‘=0” cases.
dered probit models that explore the second majorresearch question of the present paper.
Maximum likelihood coefficient estimates and theirstandard errors for this probit model are presented in theleft-hand part of Table 3. The chi-square test rejects thenull hypothesis that all coefficients of the explanatory vari-ables are equal to zero. The model correctly predicts89.44% of the cases (144 out of 161). In the same table,marginal effects are presented only for statistically signifi-cant variables since the notion of marginal effects is mean-ingless for variables that are not statistically significant.Five out of the nine explanatory variables included arefound to be statistically significant at the 5% level, whiletwo more are statistically significant at the 10% level. Nosignificant effects on the level of information are identifiedfor the variables that reflect the existence or non-existenceof R&D activities (RDD), as well as the investment behav-iour of the firm as this is reflected in the 3-year period be-fore the EET adoption (PINV) and the investment projectswhich may have been realized in the 2-year period afterthe EET adoption (FUTINV). Thus, one could argue thatthe knowledge which may be accumulated either by theR&D activities or by investment experience in projects thatare not related to EET is not transformed to informationabout the energy efficiency investments, at least in astraightforward manner, (Bougheas, 2004). As expected,the firm’s size (SIZE), exerts a positive and statistically sig-nificant effect on the probability that a firm is informed. Onthe contrary, the variable defined as the ratio of the invest-ment expenditure to the size of the firm was not found tobe statistically significant. Using a simple nested modeltest, it was decided to exclude the variable from the listof explanatory variables. Thus, we can argue that it is theabsolute size of the firm and not the relative magnitudeof the investment project with respect to the firm’s sizewhich plays a crucial role in relation to the probability thata firm is informed. This result is in accordance to the argu-
el. Dependent variable: INF.
Variables Coefficient estimates Marginal effects
EXT 1.211 (0.447)��� =0:0.661=1:0.948Ch=:0.287
FINFORM 0.638 (0.372)�� =0:0.816=1:0.938Ch=:0.122
SIZE 2.631 (1.322)� =0:0.614=1:0.998Ch=:0.384
=:�0.106 FUTINV �1.184 (0.648)�� =0:0.992=1:0.889Ch=:�0.103
WILINVEED 1.129 (0.498)� =0:0.661=1:0.939Ch=:0.278
od = �69.513 X2 = 63.237
80 K. Kounetas et al. / Information Economics and Policy 23 (2011) 72–84
ment that small firms face heavy barriers regarding theadoption of EET due to information restrictions that arecaused by their size or in other words by their limitedavailable resources (Kim, 1999). Thus, the low adoptionrates of EET among European SMEs, as presented in theintroductory section of this work, should be sought outsidethe conventional scale measures.
The probability that a firm is characterized as informedis positively affected both by the orientation of firms to for-eign markets as it is captured by the (EXT) variable and bythe fact that the firm realized an additional EET investmentproject in the 2-year period after the adoption of the EET(WILINVEED). In addition, as expected, the effect of thefirm’s cooperation with a specialized agency which pro-vides technical support concerning investment projects inEE technologies (ECOP), and of the (FINFORM) variable, ispositive and statistically significant, which reflects thespending of the firm’s human resources on procedures thatmay improve energy efficiency. The positive influence ofthe firm’s exporting activities may be interpreted in a dualway. First, firms that have penetrated foreign markets havemore sources of information since they act in an interna-tional environment, and secondly they have to deal withhigh-pressure rivalry from both their competitors and therequirements of their major customers, which is combinedwith the firm’s desire to avoid being locked out of futuretendering processes or markets (Tsekouras and Skuras,2005).
On the other hand, according to our empirical findings,negative influence is exerted by the variable (INNOVD)which depicts the introduction of a product or processinnovation in the production procedure in the last 3 yearsbefore the adoption of the EET. This empirical result is inaccordance with a significant part of the relative literature,which considers the fact that the introduction of an inno-vation process absorbs financial or intangible recoursesfrom the firm, and increases the uncertainty the firm faces(see for instance Aizenman and Marion, 1993; Bell andCampa, 1997; Lensink et al., 2005). Considering that infor-mation seeking is a resources consuming process and thatthe adoption of a new technology leads to increased uncer-tainty and firms are risk-neutral, the abovementioned rela-tionship is rather easily interpretable (Leahy and Whited,1996).
At this point we should note that several other variablesthat were included as explanatory variables were not onlyfound to be statistically not significant, but also their inclu-sion resulted in the deterioration of the percentage of cor-rectly predicted cases. These variables include a set of afirm’s specific financial indices, the perception of competi-tion, dummy variables that allow us to disentangle indus-try-specific effects, the firm’s age, location and timeelapsed between the realisation of the energy efficiencyinvestment project and the year 2004 when the surveytook place.
4.2. Determinants of the different types of information
In order to determine the factors identifying an EETadopter as emerging technology informed or as epidemi-cally informed, two ordered probit models have been esti-
mated. For the first model, the dependent variable is(EMRINF) and depicts the different levels of informationthat the firm possesses before and during the adoption ofthe EE technology process, regarding only emerging EET.For the second model, the dependent variable is (EPIDINF)which depicts the level of information that the firms pos-sessed at the time they decided to adopt an existing EETthat had already been adopted by another firm beforethem. We estimated these two ordinal probit models onthe subsample of 134 EET adopters only after correctingfor selectivity bias using the estimates of the previous pro-bit model. Maximum likelihood estimated coefficients,their corresponding asymptotic standard errors, the chi-square statistic, the pseudo-R2 goodness of fit measureand the percentage of the correctly predicted cases areshown in Table 4.
The chi-square test is highly significant and the corre-sponding goodness-of-fit pseudo-R2 measure indicates aquite satisfactory fit. The emerging technology informationmodel correctly predicts 58.39% of the cases and the corre-sponding epidemic information model 54.66% of the cases.The t-value for the selectivity coefficient (q) indicates thepresence of selectivity bias for emerging technology in-formed firms. The opposite holds for the epidemically in-formed firms. Therefore the subsample limited toinformed adopters is not a random sample since it con-cerns the acquired emerging technology information. Themodels’ parameter estimates indicate the direction of theeffect of each one of the eleven explanatory variables(RDD, ECOP, FUTINV, SIZE, PINV, FINFORM, WILINVEED,LOC, DECINV, DGOVORG, INNOVD) on the information levelprobabilities (non-informed, informed, fully informed),but do not directly represent the actual probability change.Estimation of the marginal effects of the explanatory vari-ables on the probability of ranking a firm according to theinformation level it possesses (Table 4) represents theprobability changes. For continuous explanatory variablesthe marginal effects show the percentage change in theprobability that the firm will choose to acquire the specificlevel of information given a marginal change in the vari-able. For the dummy explanatory variables the marginaleffects are analyzed as discrete or relative changes whenthe respective dummy takes its two different values, 0and 1 respectively (Greene, 1997).
According to the empirical results, the variables(ECOP), (WILINVEED) and (PINV) were found to exert a po-sitive influence on the probability that a firm is informedregarding both types of information, i.e., emerging andepidemic. As it was expected, the cooperation of the firmwith a specialized energy efficiency consultant, as cap-tured by the variable (ECOP), was found to exert positiveinfluence on the possession of either an emerging tech-nology or epidemic type of information. The same holdsfor the variable (WILINVEED), which captures the fact thata firm undertook an additional EE investment project inthe 2-year period after the initial adoption. The findingregarding the (PINV) dummy variable is quite interesting,according to which, the accumulated knowledge that isgenerated from the realization of an investment projectin the recent past increases the current informationstatus of the firm and thus increases the probabilities
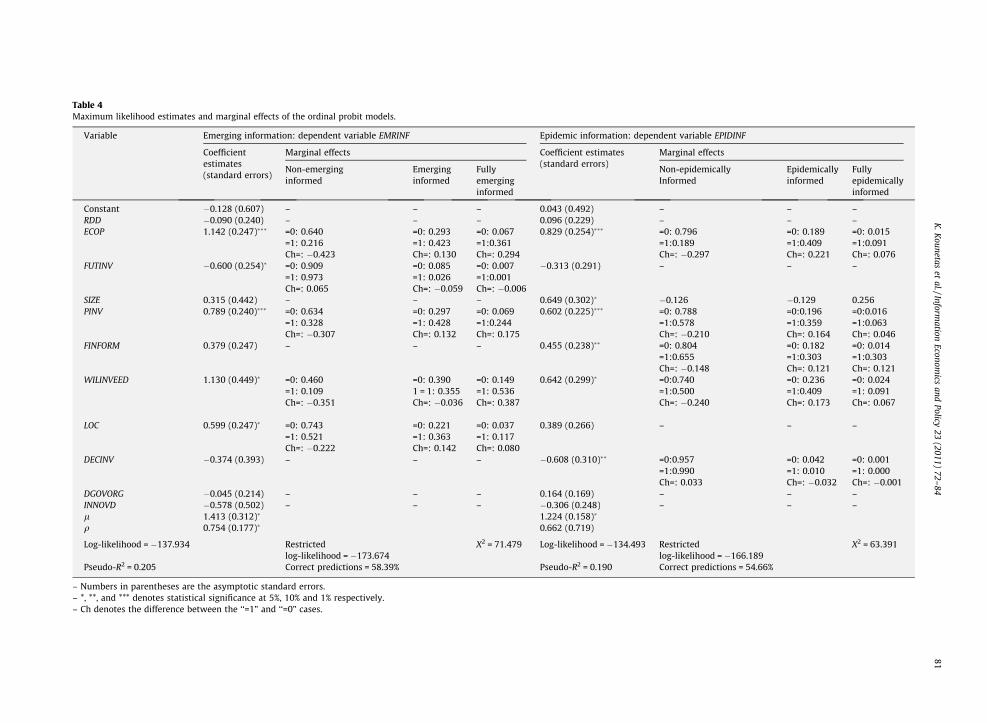
Table 4Maximum likelihood estimates and marginal effects of the ordinal probit models.
Variable Emerging information: dependent variable EMRINF Epidemic information: depende t variable EPIDINF
Coefficientestimates(standard errors)
Marginal effects Coefficient estimates(standard errors)
M ginal effects
Non-emerginginformed
Emerginginformed
Fullyemerginginformed
N -epidemicallyIn rmed
Epidemicallyinformed
Fullyepidemicallyinformed
Constant �0.128 (0.607) – – – 0.043 (0.492) – – –RDD �0.090 (0.240) – – – 0.096 (0.229) – – –ECOP 1.142 (0.247)��� =0: 0.640 =0: 0.293 =0: 0.067 0.829 (0.254)��� =0 0.796 =0: 0.189 =0: 0.015
=1: 0.216 =1: 0.423 =1:0.361 =1 .189 =1:0.409 =1:0.091Ch=: �0.423 Ch=: 0.130 Ch=: 0.294 Ch : �0.297 Ch=: 0.221 Ch=: 0.076
FUTINV �0.600 (0.254)� =0: 0.909 =0: 0.085 =0: 0.007 �0.313 (0.291) – – –=1: 0.973 =1: 0.026 =1:0.001Ch=: 0.065 Ch=: �0.059 Ch=: �0.006
SIZE 0.315 (0.442) – – – 0.649 (0.302)� � 126 �0.129 0.256PINV 0.789 (0.240)��� =0: 0.634 =0: 0.297 =0: 0.069 0.602 (0.225)��� =0 0.788 =0:0.196 =0:0.016
=1: 0.328 =1: 0.428 =1:0.244 =1 .578 =1:0.359 =1:0.063Ch=: �0.307 Ch=: 0.132 Ch=: 0.175 Ch : �0.210 Ch=: 0.164 Ch=: 0.046
FINFORM 0.379 (0.247) – – – 0.455 (0.238)�� =0 0.804 =0: 0.182 =0: 0.014=1 .655 =1:0.303 =1:0.303Ch : �0.148 Ch=: 0.121 Ch=: 0.121
WILINVEED 1.130 (0.449)� =0: 0.460 =0: 0.390 =0: 0.149 0.642 (0.299)� =0 .740 =0: 0.236 =0: 0.024=1: 0.109 1 = 1: 0.355 =1: 0.536 =1 .500 =1:0.409 =1: 0.091Ch=: �0.351 Ch=: �0.036 Ch=: 0.387 Ch : �0.240 Ch=: 0.173 Ch=: 0.067
LOC 0.599 (0.247)� =0: 0.743 =0: 0.221 =0: 0.037 0.389 (0.266) – – –=1: 0.521 =1: 0.363 =1: 0.117Ch=: �0.222 Ch=: 0.142 Ch=: 0.080
DECINV �0.374 (0.393) – – – �0.608 (0.310)�� =0 .957 =0: 0.042 =0: 0.001=1 .990 =1: 0.010 =1: 0.000Ch : 0.033 Ch=: �0.032 Ch=: �0.001
DGOVORG �0.045 (0.214) – – – 0.164 (0.169) – – –INNOVD �0.578 (0.502) – – – �0.306 (0.248) – – –l 1.413 (0.312)� 1.224 (0.158)�
q 0.754 (0.177)� 0.662 (0.719)
Log-likelihood = �137.934 Restrictedlog-likelihood = �173.674
X2 = 71.479 Log-likelihood = �134.493 Re trictedlo likelihood = �166.189
X2 = 63.391
Pseudo-R2 = 0.205 Correct predictions = 58.39% Pseudo-R2 = 0.190 Co ect predictions = 54.66%
– Numbers in parentheses are the asymptotic standard errors.– *, **, and *** denotes statistical significance at 5%, 10% and 1% respectively.– Ch denotes the difference between the ‘‘=1” and ‘‘=0” cases.
K.K
ounetaset
al./Information
Economics
andPolicy
23(2011)
72–84
81
n
ar
onfo
::0=
0.::0=::0=:0:0=
:0:0=
sg-rr
82 K. Kounetas et al. / Information Economics and Policy 23 (2011) 72–84
that a firm should be informed regardless of the type ofinformation.
Four out of the eleven explanatory variables in the ordi-nal probit models were found not to a have statistically sig-nificant influence on the probability that a firm ischaracterized as non-informed, informed or fully informedaccording to an emerging or epidemic technology type ofinformation. In particular, we refer to the existence ornon-existence of R&D activities (RDD), and the introduc-tion of any innovation other than EET in the firm’s opera-tions in the period just before the adoption of the EETwhich is captured by the (INNOVD) variable. In addition,the firm’s internal organization structure was found to ex-ert no significant effects that may lead to non-optimaldecisions, mainly due to the principal agent type of infor-mation problems. This is depicted in the (DGOVORG) vari-able. The result regarding the (RDD) variable is consistentwith the corresponding effect which we identified in thesimple probit model, as already discussed in the previoussection. The uncertainty which is associated with the intro-duction of any kind of innovation captured by the (IN-NOVD) variable does not affect the decision of a firm toacquire information of either an emerging technology oran epidemic type, concerning the specific EET. The specificfinding does not confirm the argument that a firm may notundertake an energy efficiency investment project or adoptan energy efficiency innovation process, and thus it doesnot actively search for any type of relative information, be-cause its ‘risk stock’ has been exhausted by the introduc-tion of innovation processes in technologies that are notrelated to energy efficiency (Leahy and Whited, 1996;Anderson and Newell, 2004).
If a firm is established in the greater Athens area (LOC),the probability that it will be informed about an emergingtechnology type of information is positively higher.Apparently, this finding is related to the number of avail-able sources of information, especially in the case ofemerging EET, as well as to fact that the correspondingcost increases depending on the distance between thefirm and the source of information. On the other hand,the probabilities that a firm is informed about EET regard-ing the emerging technology type of information are neg-atively affected by the (FUTINV) dummy variable whichdepicts the fact that the firm realized other kind of invest-ment project, apart from an energy efficiency project, in a2-year horizon after the EET adoption. In other words,firms do not focus on the acquisition of information con-cerning EET by researching emerging technologies whenthey are facing a capital investment project of a differenttype of technology in the near future, since the latter ab-sorbs the major part of the firm’s financial and human re-sources that are devoted to the collection and elaborationof information. Furthermore, the probability that a firm isinformed in emerging EET was found not to be affected byits size (SIZE), the existence within the firm of at least oneemployee who works on energy efficiency issues (FIN-FORM), and from an internal organization characteristicwhich depicts possible information asymmetries thatmay arise during the evaluation process of alternativeinvestment projects and is captured by the dummy vari-able (DECINV).
Moving towards the ordinal probit model, which exam-ines the determinants of the probability that a firm is in-formed according to an epidemic type, we can detect atfirst that, apart from the variables which are mentionedabove that have influence on both types of information,the influence of the firm’s size (SIZE) and the existencewithin the firm of at least one employee who works on en-ergy efficiency issues (FINFORM) is in this case positive andstatistically significant. This difference depends on thedirection of the effects identified in the case of the emerg-ing technology type of information. Larger firms and firmswhich dedicate part of their human resources on energyefficiency issues have higher probabilities to be informedin an epidemic way. This is a characteristic that fits aSchumpeterian environment, while the correspondingfindings of the emerging technology type of informationaccommodate a rather entrepreneurial environment (Acsand Audretsch, 1990; Malebra and Orsenigo, 1993).
In contrast, the probability that a firm is epidemicallyinformed is negatively affected by the (DECINV) variable,while no statistically significant influence is exerted bylocation (LOC) and by the realization of a capital invest-ment project, other than in EET, in the 2-year period afterthe EET adoption (FUTINV). The direction of the effect ofthe (DECINV) variable reveals that in the case of the EETthat is in maturity, an issue of the attitude against riskarises. The probability that the firm is informed decreaseswhen managers, and not the owners or the principal share-holders of the firm, are responsible for evaluating invest-ments. In other words, the certainty equivalence ofmanagers is smaller than that of the firm’s owners. Thisfinding may also be interpreted in a principal – agentframework from which observability and jurisdiction as-pects are generated. The statistically non significant influ-ence of the (LOC) and (FUTINV) variables, especially whenthey are compared with the corresponding influence ofthe same variables on the probabilities that a firm is in-formed about an emerging technology type of information,depicts the different relative scarcity and consequently theacquisition cost of the two types of information.
5. Conclusions and policy implications
The information barrier is like a wall that does not al-low a firm to view a wider EET landscape. Adopting EETspresumes that firms are familiar with the EET world, canevaluate the costs and benefits of adoption and can reduceits risk. Our analysis revealed that the basic building blockof this information wall is the ‘‘resource constraints”. Re-source constraints emerge in various forms. The positiveeffect of a firm’s size on the probability that the firm is in-formed in general or specifically informed about epidemictype technologies reveals the absolute advantage of largerfirms. This advantage is rooted in a firm’s financial capac-ity, and in the capability of its human resources to collect,screen and evaluate information. However, the advantageconnected to size is relative. When the firm is engaged inactivities that demand high quality human capital re-sources, such as R&D or simply innovation activities, itseffective size is reduced. In other words, when other activ-
K. Kounetas et al. / Information Economics and Policy 23 (2011) 72–84 83
ities which are vital for a firm’s survival and growth, suchas innovation, compete with the activities concerning theadoption of EETs for the firm’s same resources, then theavailability of resources to be assigned to the adoptionand introduction of EETs is condensed. We should, there-fore, be aware that when the knowledge base of a firm isextended by, for example R&D activities, the knowledgebase related to EETs is not equally enhanced. On the con-trary, the firm’s knowledge base regarding EETs may bereduced because quality human capital is re-directed toother activities. Our argument is also supported by evi-dence indicating that when resources are directly or indi-rectly offered to the firms, the progress of EETs adoption issmoothed due to higher information acquisition. As a re-sult, the probability that a firm is informed increaseswhen this firm gets free technical support from special-ized agencies, has accumulated its own expertise or is inclose proximity to other firms and exploits spillovereffects.
Evidence provided in this work supports the argumentthat the level of information or knowledge acquired by afirm is technology specific. The technology vintage is thekey factor determining the heterogeneity underlying thelevel of knowledge among firms. In this direction, the def-inition of the informed firm allowed us to test the hetero-geneity induced by technology vintages.
The conclusions of the present case study are relevantto policy makers and have implications for the designand implementation of energy efficient policies. The cur-rent policy framework exposed in the introductory sectionof this paper targets directly at the heart of the informationbarrier policy issue. It attempts to smooth the constraintsholding firms from overcoming the information hurdle.The provision of traditional policy tools such as direct cap-ital subsidies intend to flatten the levels imposed by finan-cial constraints and combat the absolute disadvantagenecessitated by smallness. Concurrently, the operation oftechnical support centers allows relatively constrainedfirms to substitute their own resources by freely availableinformation and advice. The same function is undertakenby demonstration projects. Our results indicate that bothactivities should be geographically targeted at placeswhere spillover effects are maximized.
Gaining higher levels of information may be supportedby modern flexibly tailored combinations of assistanceusing complex multi-instrument sets of support to busi-ness development efforts. Flexible instruments refer tothe whole range of assistance extended beyond the con-ventional capital subsidy approach and including activitiesaiming to search for and contract short term specializedpersonnel, visit demonstration projects or specialized exhi-bitions or facilitate cooperation with specialized agencies,research centers and institutions. Such aid reduces searchcosts as well as adjustment costs after the technology isadopted. Tailored combinations may allow assistance tobe differentiated according to various criteria. For example,our analysis revealed that firms which have undertaken aninvestment in the past have a higher level of informationconcerning epidemic and/or emerging technologies. Suchfirms are more constrained due to their past investmentsand therefore in need of assistance. It should be mentioned
that such tailored combinations may require the coordina-tion of activities among policies.
Firms employ resources in order to increase theirproduction capacity, introduce innovations, adopt ICTsand acquire competences within a globalized businessenvironment. Thus, energy efficiency policy should becoordinated with regional policies providing infrastructureand/or direct financial support to businesses, with policiesfostering innovation and ICTs and policies promoting envi-ronmental friendly business operation. To some extentsynergies have been developed among these policies buta closer coordination at local/regional level will maximizethe advantage of local knowledge in tailoring integratedactivities for energy saving as well as innovation and envi-ronmental protection.
Acknowledgments
The authors would like to thank two anonymousreviewers and the editor of this journal for their construc-tive comments, assistance and support. Financial assis-tance was provided by the European Social Fund (ESF),Operational Program for Educational and Vocational Train-ing II (EPEAEK II), and in particular by the ProgramHERAKLITOS.
References
Acs, Z.J., Audretsch, D.B., 1990. Innovation and Small Firms. MIT Press,Cambridge, MA.
Aizenman, J., Marion, N.P., 1993. Macroeconomic uncertainty and privateinvestment. Economic Letters 41, 207–210.
Anderson, S.T., Newell, R.G., 2004. Information programs for technologyadoption: the case of energy-efficiency audits. Resource and EnergyEconomics 26 (2), 7–50.
Arrow, J.K., 1996. Technical information and industrial structure.Industrial and Corporate Change 5 (2), 645–652.
Azar, C., Dowlatabadi, H., 1999. A review of the treatment of technicalchange in energy economics models. Annual Review of Energy andthe Environment 24, 513–544.
Bell, G.K., Campa, J.M., 1997. Irreversible investments and volatilitymarkets: a study of the chemical processing industry. The Review ofEconomics and Statistics 79, 79–87.
Bera, A.K., Jarque, C.M., Lee, L.F., 1984. Testing the normality assumptionin limited dependent variable models. International Economic Review25, 563–578.
Blok, K., DeGroot, H.L.F., Luiten, E.E.M., Rietbergen, M.G., 2004. TheEffectiveness of Policy Instruments for Energy-EfficiencyImprovement in Firms. The Dutch Experience, Kluwer AcademicPublishers.
Bougheas, S., 2004. Internal vs external financing of R&D. Small BusinessEconomics 22, 11–17.
Cohen, W.M., Levinthal, D.A., 1989. Innovation and learning: the two facesof R&D. The Economic Journal 99, 569–596.
Commission of the European Communities, 2005. Green Paper on EnergyEfficiency or Doing More With Less, COM (2005) 265 final. Office forthe Official Publications, Brussels.
Commission of the European Communities, 2006. Report on the Analysisof the Debate of the Green Paper on Energy Efficiency, COM (2005)265 final. Office for the Official Publications, Brussels.
Cooper, D., Duncan, R., Precious, B., Williamson, A., Workum, N., 1999.Creating demand for energy efficiency in Australian industry. In:Proceedings of the 1999 American Council for an Energy-EfficientEconomy Summer Study on Energy Efficiency in Industry. ACEEE,Washington, DC.
DeCanio, S.J., 1993. Barriers within firms to energy efficient investment.Energy Policy (September), 906–914.
DeCanio, S.J., 1998. The efficiency paradox: bureaucratic andorganizational barriers to profitable energy-saving investments.Energy Policy 26, 441–454.
84 K. Kounetas et al. / Information Economics and Policy 23 (2011) 72–84
DeGroot, H.L.F., Verhoef, E.T., Nijkamp, P., 2001. Energy saving by firms:decision-making, barriers and policies. Energy Economics 23, 717–740.
Feder, G., Just, R.E., Zilberman, D., 1985. Adoption of agriculturalinnovations in developing countries: a survey. EconomicDevelopment and Cultural Change 31, 255–298.
Flash Eurobarometer, 2007. Observatory of European SMEs AnalyticalReport. Flash Eurobarometer 196, The Gallup Organization.
Foray, D., 2004. The Economics of Knowledge. MIT Press, Cambridge, MA.Geroski, P.A., 2000. Models of technology diffusion. Research Policy 29,
603–626.Gillissen, M., 1995. Empirical modeling of the energy conservation
investment process of firms. In: ECEEE, Summer Study Proceedings.Gillissen, M., Opschoor, H., Farla, K., Blook, K., 1995. Energy Conservation
and Investment Behavior of Firms. Economic and Social Institute,Amsterdam.
Green, W., 1997. Econometric Analysis. Prentice-Hall, Englewood Cliffs,NJ.
Grubler, A., Nakicenovic, N., Victor, D.G., 1999. Modeling technologicalchange: implications for the global environment. Annual Review ofEnergy and the Environment 24, 545–569.
Hamel, G., Prahalad, C.K., 1983. Managing strategic responsibility in theMNC. Strategic Management Journal 4 (4), 341–351.
Heckman, J.J., 1979. Sample selection bias as a specification error.Econometrica 47 (1), 153–162.
Howarth, R.B., Anderson, B., 1993. Market barriers to energy efficiency.Energy Economics 262, 272.
Howarth, R.B., Haddad, B.M., Paton, B., 2000. The economics of energyefficiency: insights from voluntary participation programs. EnergyPolicy 28, 477–486.
Jago, P., 1999. The Canadian Industry program for energy conservationCIPEC: the dynamics of a 24-year partnership between governmentand industry. In: Proceedings of the 1999 American Council for anEnergy-Efficient Economy Summer Study on Energy Efficiency inIndustry. ACEEE, Washington, DC.
Jensen, M., 1988. Takeovers: their causes and consequences. Journal ofEconomic Perspectives 2 (1), 21–48.
Karshenas, M., Stoneman, P., 1993. Rank, stock, order and epidemic effectsin the diffusion of new process technology. RAND Journal ofEconomics 24 (4), 503–527.
Kim, J., 1999. The relaxation of financing constraints by the initial publicoffering of small manufacturing firms. Small Business Economics 12,191–202.
Kounetas, K., Tsekouras, K., 2008. The energy efficiency paradox revisitedthrough a partial observability approach. Energy Economics 30,2517–2536.
Leahy, J., Whited, T.M., 1996. The effect of uncertainty on investment:some stylized facts. Journal of Money, Credit and Banking 28, 64–83.
Lensink, R.P., van Steen, P., Sterken, E., 2005. Uncertainty and growth ofthe firm. Small Business Economics 24, 381–391.
Lester, K., McCabe, J.M., 1993. The effect of industrial structure onlearning by doing in nuclear power plant operation. RAND Journal ofEconomics 24 (3), 418–438.
Maddala, G.S., 1983. Limited-Dependent and Qualitative Variables inEconometrics. New York, NY, Cambridge University Press.
Malebra, F., Orsenigo, L., 1993. The dynamics and evolution of industries.Industrial and Corporate Change 5, 51–87.
Malerba, F., Orsenigo, L., 1993. Technological regimes and firm behavior.Industrial and Corporate Change 2 (1), 45–71.
Malebra, F., Orsenigo, L., 1996. Schumpeterial patterns of innovation aretechnology specific. Research Policy 25, 451–478.
Mansfield, E., 1989. Industrial robots in Japan and the USA. ResearchPolicy 18, 290–311.
Metcalf, G.E., Hassett, K.A., 1999. Measuring the energy savings fromhome improvement investments: evidence from monthly billing data.The Review of Economics and Statistics 516, 528.
Miles, J., 1994. The UK-energy efficiency best practice programme. In:International Energy Agency, Conference Proceedings – IndustrialEnergy Efficiency: Policies and Programs, Washington, DC, 26–27May, 1994.
Morgenstern, D.R., 1996. Does the Provision of Free Technical InformationReally Influence Firm Behavior? Resources for the Future DiscussionPaper, 96-106.
Morgenstern, D.R., Al-Jurf, S., 1999. Can free information rally acceleratetechnology diffusion? Technological Forecasting and Social Change61, 13–24.
Nuijen, W.,1998. Long term agreements on energy efficiency in industry.In: Martin et al., (Eds.), Industrial Energy Efficiency Policies:Understanding Success and Failure, Proceedings of a WorkshopOrganized by the International Network for Energy DemandAnalysis in the Industrial Sector. Utrecht, The Netherlands, June 11–12, 1998 (LBNL-42368).
Ramesohl, S., Kristof, K., 1999. What is the role of energy-relatedvoluntary approaches in the Post-Kyoto climate policy? A processoriented analysis of the declaration of german industry on globalwarming prevention. In: Energy Efficiency and CO2 Reduction: TheDimensions of Social Change, 1999 European Council for an Energy-Efficient Economy Summer Study May 31–June 4, Mandelieu, France.
Read, P., 2000. An information perspective on dynamic efficiency inenvironmental policy. Information Economic and Policy 12, 47–68.
Rietbergen, M., Farla, J., Blok, K., 1998. Quantitative evaluation ofvoluntary agreements on energy efficiency. In: Martin et al., (Eds.),Industrial Energy Efficiency Policies: Understanding Success andFailure, Proceedings of a Workshop Organized by the InternationalNetwork for Energy Demand Analysis in the Industrial Sector. Utrecht,The Netherlands (LBNL-42368).
Saha, A., Love, A.H., Schwartz, R.T., 1994. Adoption of emergingtechnologies under output uncertainty. American Journal ofAgricultural Economics 76, 836–846.
Sanstand, A., Howarth, R.B., 1994. Normal markets, market imperfectionsand energy efficiency. Energy Policy 22 (10), 811–818.
Sutherland, R.J., 1994. Energy efficiency or the efficient use of energyresources? Energy Sources 16, 257–268.
Togeby, M., Bjorner, T.B., Johannsen, K., 1998. Evaluation of the DanishCO2 taxes and agreements. In: Martin et al., (Eds.), Industrial EnergyEfficiency Policies: Understanding Success and Failure, Proceedings ofa Workshop Organized by the International Network for EnergyDemand Analysis in the Industrial Sector. Utrecht, The Netherlands(LBNL-42368).
Trost, R.P., Lee, Lung-Fei, 1984. Technical training and earnings: apolychotomous choice model with selectivity. The Review ofEconomics and Statistics, 151–156.
Tsekouras, K., Skuras, D., 2005. Productive efficiency and exports: anexamination of alternative hypotheses for the Greek cement industry.Applied Economics 37, 279–291.
Velthuijsen, J.W., 1995. Determinants of Investment in EnergyConservation. SEO, University of Amsterdam, Amsterdam.
Yatchew, A., Griliches, Z., 1984. Specification error in probit models. TheReview of Economics and Statistics 67 (1), 610–619.
Copyright © 2022 FDOKUMEN