Project Report at Amara Raja BY Raj durai R 1NH20BA113 ...
80
Project Report at Amara Raja BY Raj durai R 1NH20BA113 Submitted to DEPARTMENT OF MANAGEMENT STUDIES NEW HORIZON COLLEGE OF ENGINEERING, OUTER RING ROAD, MARATHALLI, BENGALURU In partial fulfilment of the requirements for the award of the degree of MASTER OF BUSINESS ADMINISTRATION Under the guidance of Mr. Santhosh Kumar Associate Professor 2020 - 22
-
Upload
khangminh22 -
Category
Documents
-
view
1 -
download
0
Transcript of Project Report at Amara Raja BY Raj durai R 1NH20BA113 ...
Project Report
at
Amara Raja
BY
Raj durai R
1NH20BA113
Submitted to
DEPARTMENT OF MANAGEMENT STUDIES
NEW HORIZON COLLEGE OF ENGINEERING,
OUTER RING ROAD, MARATHALLI,
BENGALURU
In partial fulfilment of the requirements for the award of the degree of
MASTER OF BUSINESS ADMINISTRATION
Under the guidance of
Mr. Santhosh Kumar
Associate Professor
2020 - 22
DEPARTMENT OF MANAGEMENT STUDIES
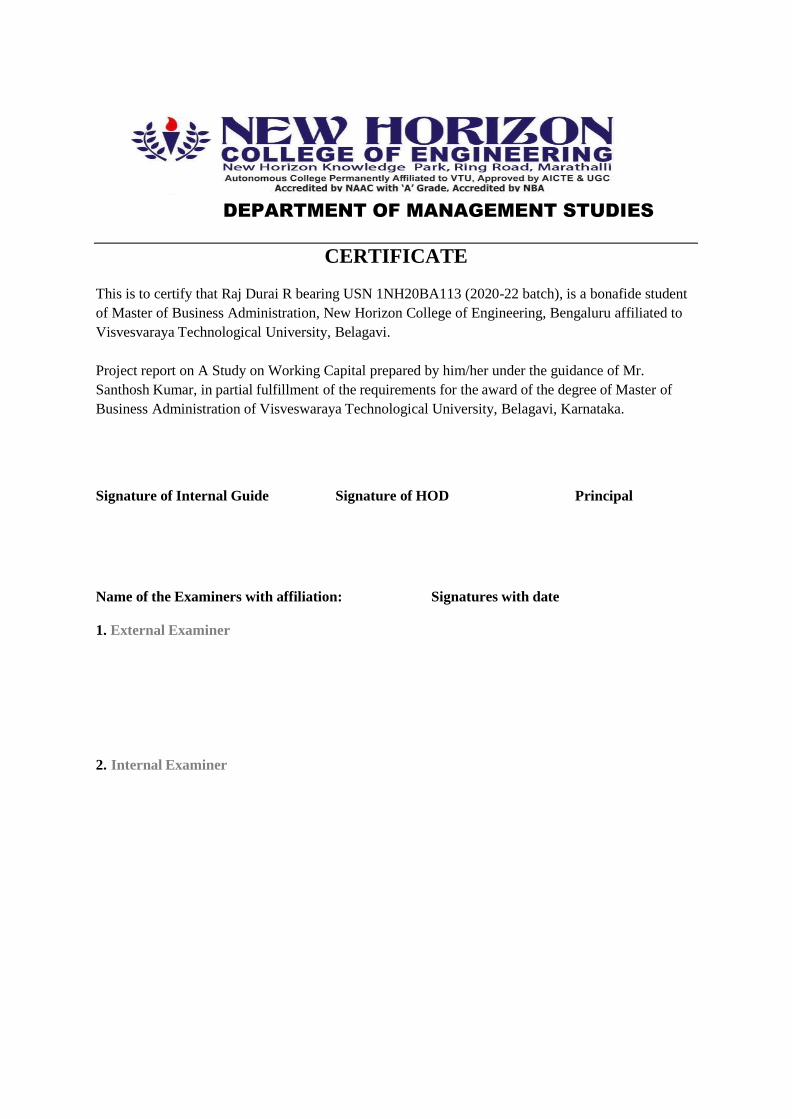
CERTIFICATE
This is to certify that Raj Durai R bearing USN 1NH20BA113 (2020-22 batch), is a bonafide student
of Master of Business Administration, New Horizon College of Engineering, Bengaluru affiliated to
Visvesvaraya Technological University, Belagavi.
Project report on A Study on Working Capital prepared by him/her under the guidance of Mr.
Santhosh Kumar, in partial fulfillment of the requirements for the award of the degree of Master of
Business Administration of Visveswaraya Technological University, Belagavi, Karnataka.
Signature of Internal Guide Signature of HOD Principal
Name of the Examiners with affiliation: Signatures with date
1. External Examiner
2. Internal Examiner
DECLARATION
I, Raj Durai R, hereby declare that The internship report at “AMARA RAJA” prepared by me
under the guidance of Mr. Santhosh Kumar, faculty of M.B.A Department, New Horizon
College of Engineering.
I also declare that this internship report is towards the partial fulfilment of the university
regulations for the award of the degree of Master of Business Administration by Visvesvaraya
Technological University, Belgaum.
I have undergone an industry internship for a period of Eight weeks. I further declare that this
report is based on the original study undertaken by me and has not been submitted for the award
of a degree/diploma from any other University / Institution.
Signature of Student
Place:
Date:

ACKNOWLEDGEMENT The successful completion of the internship would not have been possible without the
guidance and support of many people. I express my sincere gratitude to
Mr.vikramaditya , Managing Director, company Name, Bengaluru, for allowing
to do my internship at Amara Raja.
I thank the staff of Amara Raja , Bengaluru for their support and guidance and
helping me in completion of the report.
I am thankful to my internal guide Mr. Santhosh Kumar, for his/her constant
support and inspiration throughout the project and invaluable suggestions,
guidance and also for providing valuable information.
Finally, I express my gratitude towards my parents and family for their
continuous support during the study.
Raj durai R
1NH20BA113
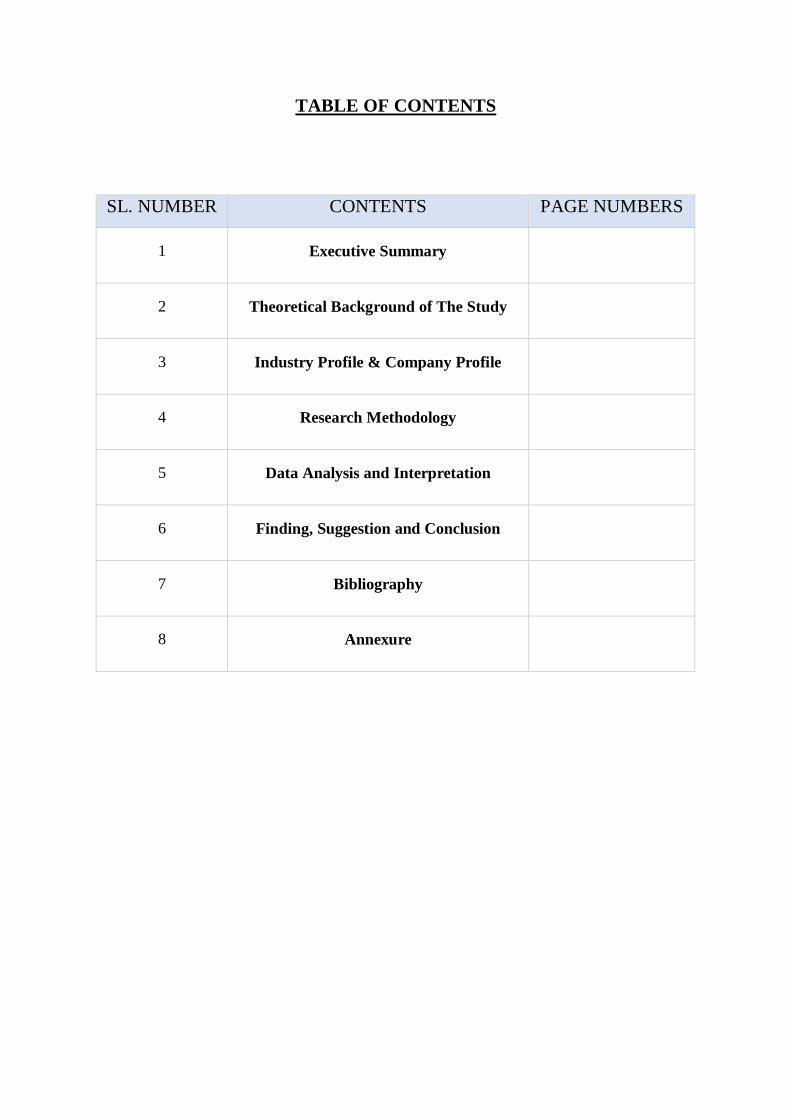
TABLE OF CONTENTS
SL. NUMBER CONTENTS PAGE NUMBERS
1 Executive Summary
2 Theoretical Background of The Study
3 Industry Profile & Company Profile
4 Research Methodology
5 Data Analysis and Interpretation
6 Finding, Suggestion and Conclusion
7 Bibliography
8 Annexure

CHAPTER-1
INTRODUCTION
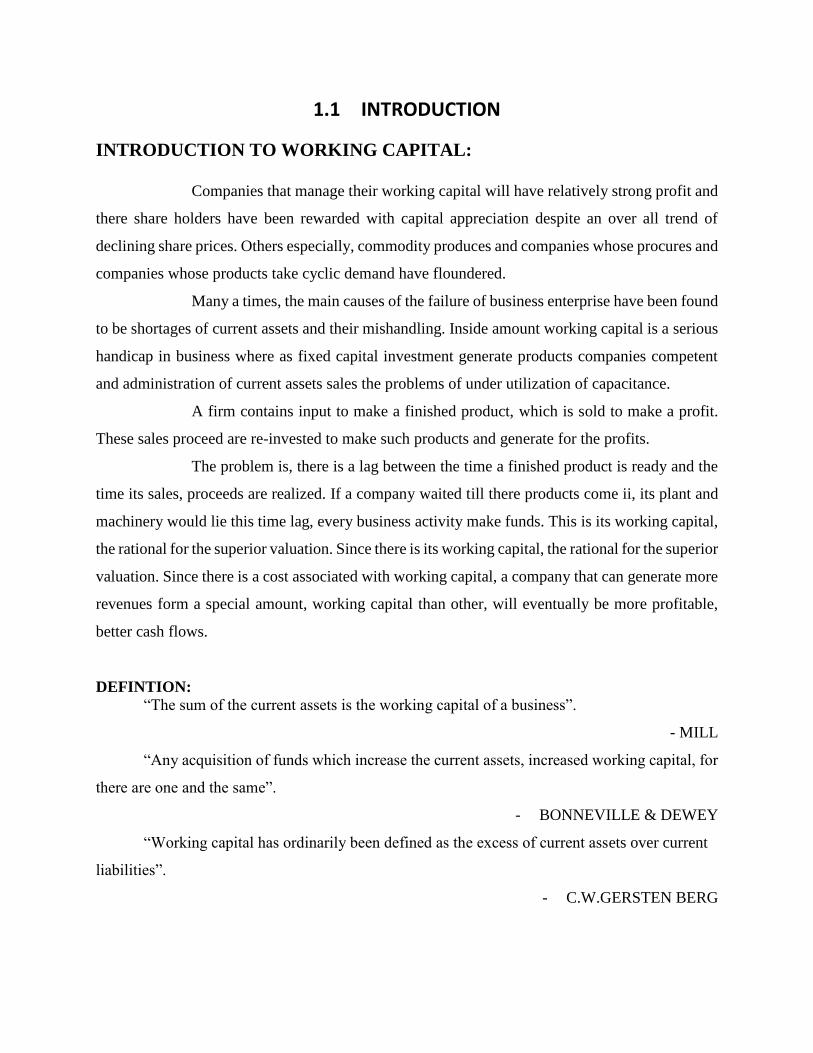
1.1 INTRODUCTION
INTRODUCTION TO WORKING CAPITAL:
Companies that manage their working capital will have relatively strong profit and
there share holders have been rewarded with capital appreciation despite an over all trend of
declining share prices. Others especially, commodity produces and companies whose procures and
companies whose products take cyclic demand have floundered.
Many a times, the main causes of the failure of business enterprise have been found
to be shortages of current assets and their mishandling. Inside amount working capital is a serious
handicap in business where as fixed capital investment generate products companies competent
and administration of current assets sales the problems of under utilization of capacitance.
A firm contains input to make a finished product, which is sold to make a profit.
These sales proceed are re-invested to make such products and generate for the profits.
The problem is, there is a lag between the time a finished product is ready and the
time its sales, proceeds are realized. If a company waited till there products come ii, its plant and
machinery would lie this time lag, every business activity make funds. This is its working capital,
the rational for the superior valuation. Since there is its working capital, the rational for the superior
valuation. Since there is a cost associated with working capital, a company that can generate more
revenues form a special amount, working capital than other, will eventually be more profitable,
better cash flows.
DEFINTION: “The sum of the current assets is the working capital of a business”.
- MILL
“Any acquisition of funds which increase the current assets, increased working capital, for
there are one and the same”.
- BONNEVILLE & DEWEY
“Working capital has ordinarily been defined as the excess of current assets over current
liabilities”.
- C.W.GERSTEN BERG

“The interaction between current assets and current liabilities is, there fore the main
theme of the theory if working management”
1.1 Concept of working capital:
There are two concepts of working capital
Gross Working Capital
Net Working Capital
Gross working Capital:
The current assets with represent the proportion of investment that circulates form
on e form to another in the ordinary conduct of business.
Networking Capital:
The difference between current assets and current liabilities or alternatively the
portion of current assets finance with long term funds.
Structure of working capital:
For a proper appreciation of the problems of working capital management, a closer look at
the individual items of working capital is essential. The components of current assets and current
liabilities which are constituents or working capital are shown in the following exhibit 1.
The total capital employed in a business organization can be categorized as fixed capital
and working capital. The fixed capital that part of the funds, which is invested in fixed assets,
where as working capital is that portion of the funds which is invested in current assets. The
investments in fixed assets is represented by land and buildings (for factory, office, go down and
stores), equipment such as machinery, furniture and fixtures. Intangible assets in the from of
patents and good will etc., to employ these fixed assets fully, again current assets are required.
Current assets consist of raw materials, work-in-progress (WIP), finished goods, stores and spares,
receivables, cash in hand and at bank and marketable securities.

Meaning:
Working capital management is concerned with the problems that arise in attempting to
manage the current assets, the current liabilities and the interrelationship that exists between them.
The term current assets refers to those assets which in the ordinary course of business can be, or
will be, turned into cash usually within one year without undergoing a diminution in value and
without disrupting the operations of the firm. Current liabilities are those liabilities are account
payables ,bills payable, bank over-drift, outstanding expenses and the portion of the lone which
to be paid in current year. The goal of working capital management is to manage the firm’s current
assets and current liabilities in such a way that a satisfactory level of working capital is maintained.
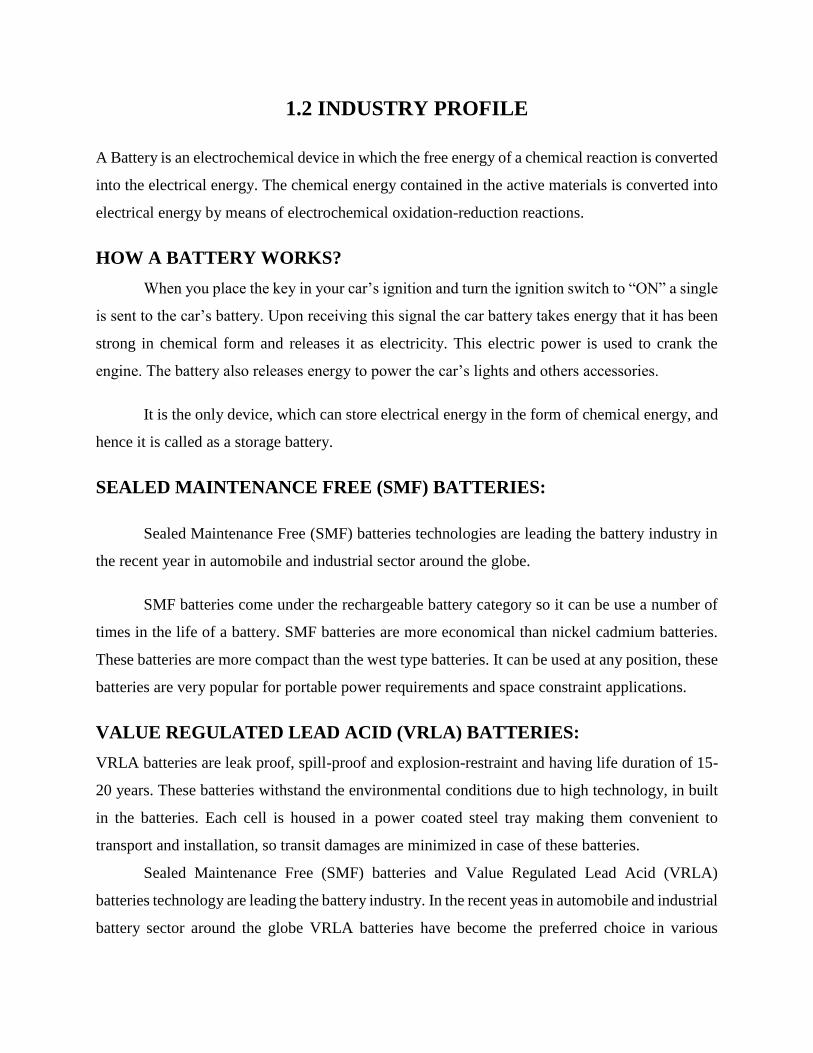
1.2 INDUSTRY PROFILE
A Battery is an electrochemical device in which the free energy of a chemical reaction is converted
into the electrical energy. The chemical energy contained in the active materials is converted into
electrical energy by means of electrochemical oxidation-reduction reactions.
HOW A BATTERY WORKS?
When you place the key in your car’s ignition and turn the ignition switch to “ON” a single
is sent to the car’s battery. Upon receiving this signal the car battery takes energy that it has been
strong in chemical form and releases it as electricity. This electric power is used to crank the
engine. The battery also releases energy to power the car’s lights and others accessories.
It is the only device, which can store electrical energy in the form of chemical energy, and
hence it is called as a storage battery.
SEALED MAINTENANCE FREE (SMF) BATTERIES:
Sealed Maintenance Free (SMF) batteries technologies are leading the battery industry in
the recent year in automobile and industrial sector around the globe.
SMF batteries come under the rechargeable battery category so it can be use a number of
times in the life of a battery. SMF batteries are more economical than nickel cadmium batteries.
These batteries are more compact than the west type batteries. It can be used at any position, these
batteries are very popular for portable power requirements and space constraint applications.
VALUE REGULATED LEAD ACID (VRLA) BATTERIES:
VRLA batteries are leak proof, spill-proof and explosion-restraint and having life duration of 15-
20 years. These batteries withstand the environmental conditions due to high technology, in built
in the batteries. Each cell is housed in a power coated steel tray making them convenient to
transport and installation, so transit damages are minimized in case of these batteries.
Sealed Maintenance Free (SMF) batteries and Value Regulated Lead Acid (VRLA)
batteries technology are leading the battery industry. In the recent yeas in automobile and industrial
battery sector around the globe VRLA batteries have become the preferred choice in various
applications such as uninterrupted power supply, emergency lights, and security systems and
weighing scales.
CLASSIFICATION OF BATTERIES:
Batteries are broadly classified into two segments like,
Automotive Batteries
Industrial Batteries
AUTOMOTIVE BATTERIES:
Apart from mopeds all other automobiles including scooters need storage battery. So
automotive batteries are playing pre-dominant role in automobile sector by influencing customers
in the automobile market. Automobile batteries can be further distinguished as the original
equipment (OE) markets as low as 5-6%. OE segment has the advantage of securing continuous
orders and inquiries. This enables manufacturers to streamline production facilities, plan
production schedules and attain certain level of operational efficiency.
The replacement market, on the other hand, is much larger. The replacement market is
characterized by the presence of large unorganized sector, which constitutes around 55-60% of the
total replacement market. This is possible due to low capital entry barrier. These players have the
advantage of inapplicability of excise duties.
INDUSTRIAL BATTERIES:
The industrial battery segment comprises of two main categories. One comprises of the
“Stationery Segment” and the second relating to “Motive Power and Electric Vehicles”. The
Motive Power and Electric Vehicle segment comprising of “Telecom, Railways and Power
Industries have registered a growth in excess of 20% and this trend is likely to continue in the next
5 years.
The Industrial Segment is highly technological intensive and access to high quality world-
class technology is an important factor and is vital for brand reference. The total demand for the
industrial battery segment is met by indigenous production with a small saves of about 10% by
imports. The demand for industrial batteries has grown slowly and steadily.
All for as industrial batteries are concerned the evolving consciousness among Corporate
and Government departments regarding environment factors will result in a shift towards
pollution-free technology. Here has been a preferential shift in this segment from the Conventional
Lead batteries to Sealed Maintenance-free batteries (SMF). The bull of battery industry admits that
the sales are fallen but at the same time they are expecting larger orders especially from telecom
industry, which gets going. Due to strong customers like telecom, railways and electricity boards,
the industrial batteries are on prosperous scale.
RECYCLING BATTERIES:
Battery acid is recycled by neutralizing it into water of converting it to sodium sulphate for
laundry detergent, glass and textile manufacturing.
Cleaning the battery cases, meeting the plastic and reforming it into uniform pellets recycle
plastic. Lead, which makes up 50% of every battery, is method, poured into slabs and purified.
The following are the major manufacturers in battery industry in India.
Exide Industries
Amara Raja Batteries Ltd.
Standard Batteries
Amoco Batteries
1.3 COMPANY PROFILE
Amara Raja Batteries Limited (ARBL) incorporated under the company’s act, 1956 in 13th
February 1985, and converted into Public Limited Company on 6th September 1990.
The Chairman of the company is “Sri GallaRamachandra Naidu”. ARBL is the first
company in India, which manufactures Value Regulated Lead Acid (VRLA) Batteries. The main
objective of the company is manufacturing of goods quality of “Sealed Maintenance Free” (SMF)
acid batteries. The company started its plant in 185 acres in Karakambadi Village,
ReniguntaMandal. The project site is notified under “B” category.
The company has the clear-cut policy of direct selling without any intermediate. So they
have set up more than 22 branches and are operated by corporate operations office located at
Hyderabad. The company has virtual monopoly in higher A.H. (Amp Hour) rating market is
product VRLA. It is also having the facility for industrial and automotive batteries.
Registered in 2009 , Amararaja Batteries Ltd. has made a name for itself in the list of top suppliers
of car batteries ,automotive batteries in India. The supplier company is located in Bengaluru,
Karnataka and is one of the leading sellers of listed products.
Amararaja Batteries Ltd. is listed in Trade India's list of verified sellers offering supreme quality
of FLO Batteries ,Hi-Way Truck Batteries etc. Buy car batteries ,automotive batteries in bulk from
us for the best quality products and service.
COLLABORATORS:
Amara Raja Batteries Limited has a strategic tie up with “Johnson Controls Inc.” of U.S.A.
who owns 26% stake in this company, Is the largest manufacturer of lead acid batteries in North
America.
The main objective of the company is manufacturing of good quality of “Sealed
Maintenance Free” acid batteries (SMF). The annual growth rate of a company in 2013-14 is 16%.
The present turnover of the company is in FY 2013-14 was Rs.34,367MM.
Amara Raja has always offered time tested world class Technology and Process developed
on international standards. High integrity VRLA systems like power stack and power plus or the
recently launched high performance UPS Battery-KOMBAT and AMARON hi-life automotive
batteries are the products of the collaborative battery efforts of engineering at Johnson controls
Inc. and Amara Raja.
AMARON launched in January 2000, Amara Raja has pioneered the introduction of hi-
cube automotive batteries in India. This zero maintenance product uses the revolutionary patented
silver X technology developed by Johnson controls for high environments and Incorporates may
superior features that make it the most advantage battery on roads anywhere in the world.
COMPETITORS:
The major competitors’ for Amara Raja Batteries products are:
Exide Industries Ltd.
Hyderabad Batteries Ltd.
GNB Industries (US based).
PRODUCTS:
1. AMARON HI-WAY (TRUCKS)
2. AMARON HARVEST (TRACTORS)
3. AMARON SHIELD (INVERTERS)
4. AMARON HIGH LIFE (PASSENGER CARS) etc.
CUSTOMERS:
ARBL has prestigious original equipment Manufacture clients like ford, general motors,
Daewoo motors, Mercedes-Benz, Daimler Crysler, MaruthiUdyog Ltd, premier auto ltd,
Ashok Leyland, and Hindustan motors, Telco, Mahindra & Mahindra and Swaraj Mazda. The
company entered the replacement battery segment with the launch of Amaron Hi-life auto
batteries.
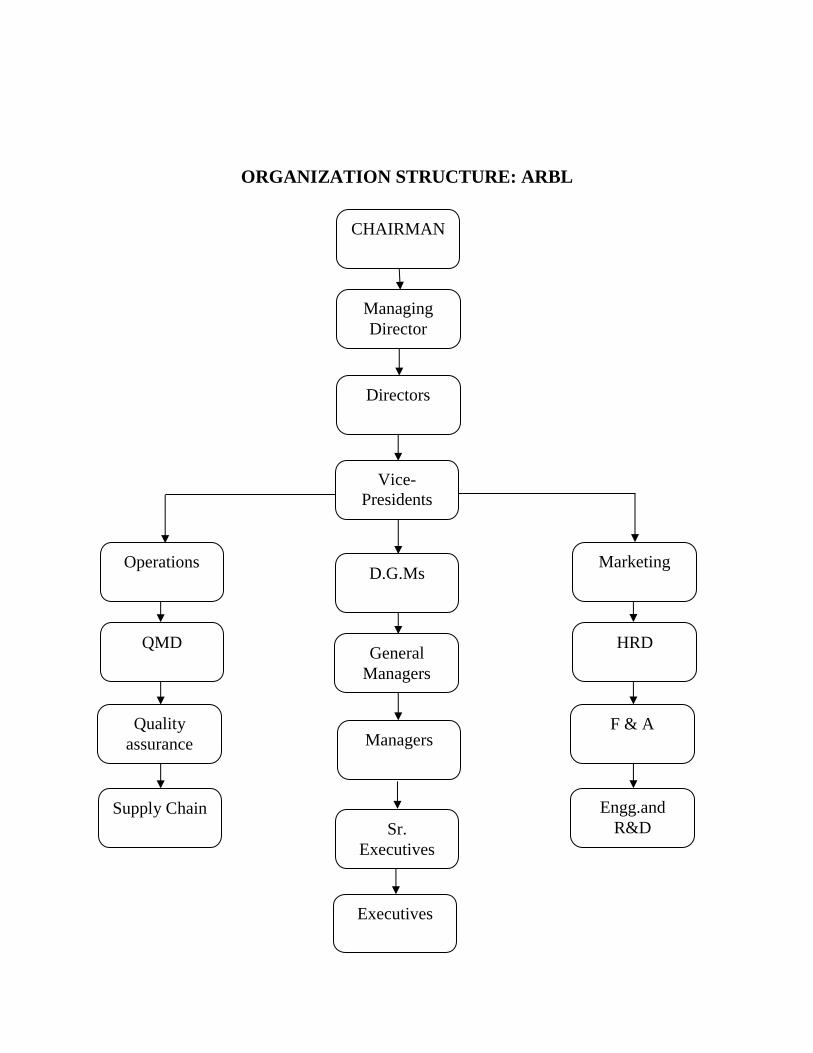
ORGANIZATION STRUCTURE: ARBL
CHAIRMAN
Managing
Director
Directors
Executives
Vice-
Presidents
D.G.Ms
General
Managers
Managers
Marketing
Engg.and
R&D
HRD
F & A
Operations
Supply Chain
QMD
Quality
assurance
Sr.
Executives
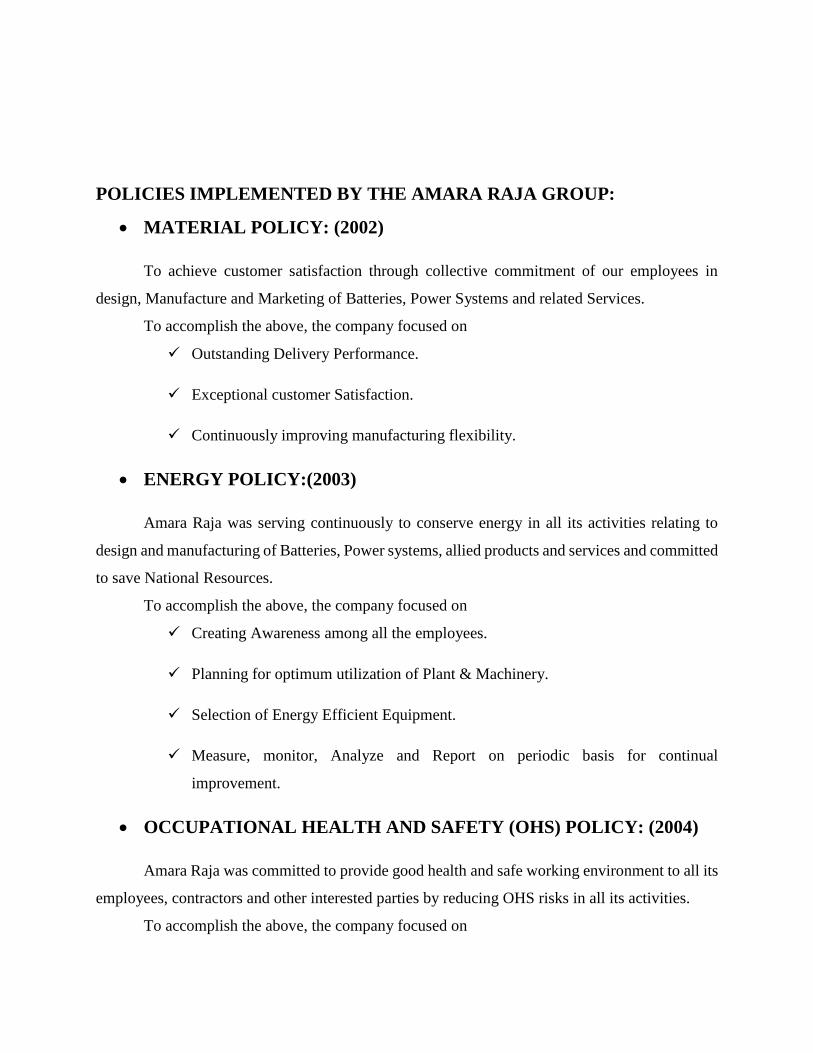
POLICIES IMPLEMENTED BY THE AMARA RAJA GROUP:
MATERIAL POLICY: (2002)
To achieve customer satisfaction through collective commitment of our employees in
design, Manufacture and Marketing of Batteries, Power Systems and related Services.
To accomplish the above, the company focused on
Outstanding Delivery Performance.
Exceptional customer Satisfaction.
Continuously improving manufacturing flexibility.
ENERGY POLICY:(2003)
Amara Raja was serving continuously to conserve energy in all its activities relating to
design and manufacturing of Batteries, Power systems, allied products and services and committed
to save National Resources.
To accomplish the above, the company focused on
Creating Awareness among all the employees.
Planning for optimum utilization of Plant & Machinery.
Selection of Energy Efficient Equipment.
Measure, monitor, Analyze and Report on periodic basis for continual
improvement.
OCCUPATIONAL HEALTH AND SAFETY (OHS) POLICY: (2004)
Amara Raja was committed to provide good health and safe working environment to all its
employees, contractors and other interested parties by reducing OHS risks in all its activities.
To accomplish the above, the company focused on

Comply with the current applicable OHS legislation and other requirements.
Adopt programmers for reducing OHS risks and improving health and safety of
employees and other interested parties.
5 S POLICY: (2004)
A Systematic and Rational approach to work place organization and Methodical housekeeping
with a sense of purpose, consisting of the following 5 elements.
1. SEIRI – Sorting Out
2. SEITON – Systematic Arrangement
3. SEISO – Spic and Span
4. SEIKETSU – Serene Atmosphere / Sanitizing
5. SHITSUKE – Self Discipline
To accomplish the above, the company focused on
Training and creating Awareness of 5 S.
Motivating and changing Behavior Pattern of employees.
Establishing Standards / procedures for the implementation of each element of 5S.
ENVIRONMENT POLICY: (2005) As a good corporate citizen, people at Amara Raja are committed to enrich the Quality of
life of their employees, Customers and Community at large by minimizing impacts on environment
in all their activities relating to design, Manufacturing and marketing of Batteries, Power systems
and allied products.
To accomplish the above, the company focused on
Comply with applicable legal and other requirements.
Ensure continual improvement in environmental program through effective
environmental management system.
QUALITY POLICY: (2006)
Amara Raja wants to exceed their customer expectations through a collective commitment
to design, Manufacturing and Marketing of Batteries, Power Systems and related Services.
To accomplish the above, the company focused on
Contemporary Technologies, Robust Design Principles and Innovation.
Continuous Enhancement of our individual Engagement, Development and
Performance.
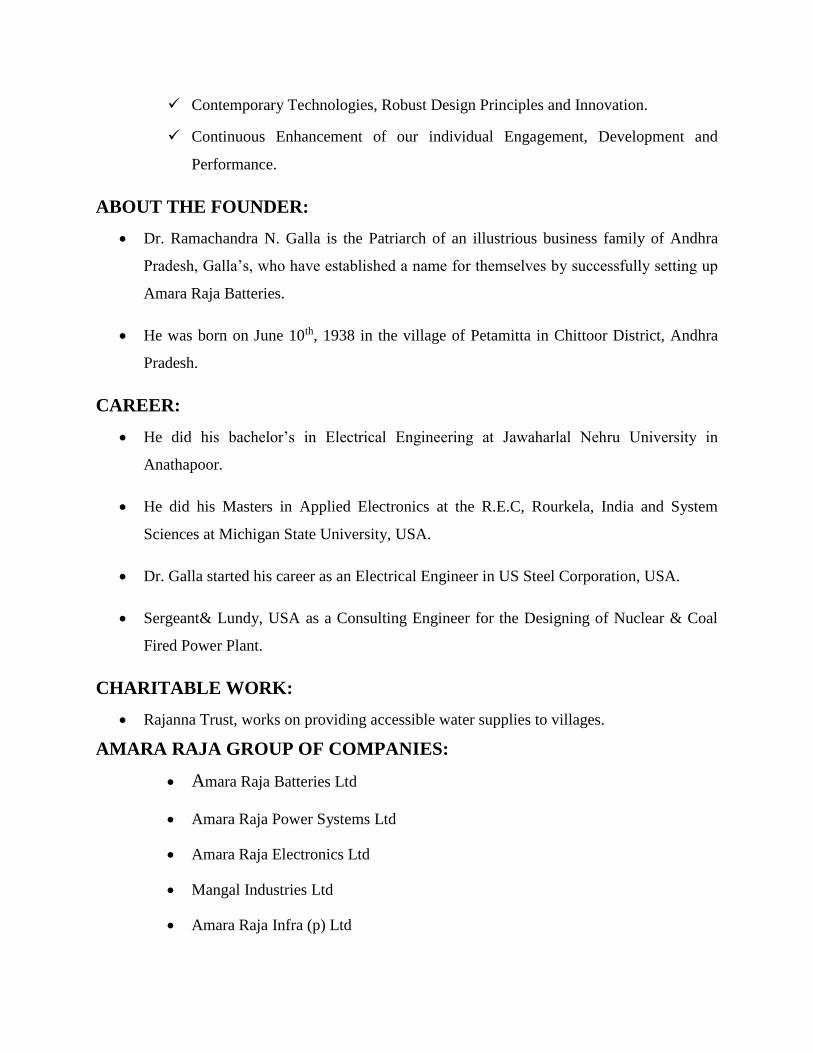
ABOUT THE FOUNDER:
Dr. Ramachandra N. Galla is the Patriarch of an illustrious business family of Andhra
Pradesh, Galla’s, who have established a name for themselves by successfully setting up
Amara Raja Batteries.
He was born on June 10th, 1938 in the village of Petamitta in Chittoor District, Andhra
Pradesh.
CAREER:
He did his bachelor’s in Electrical Engineering at Jawaharlal Nehru University in
Anathapoor.
He did his Masters in Applied Electronics at the R.E.C, Rourkela, India and System
Sciences at Michigan State University, USA.
Dr. Galla started his career as an Electrical Engineer in US Steel Corporation, USA.
Sergeant& Lundy, USA as a Consulting Engineer for the Designing of Nuclear & Coal
Fired Power Plant.
CHARITABLE WORK:
Rajanna Trust, works on providing accessible water supplies to villages.
AMARA RAJA GROUP OF COMPANIES:
Amara Raja Batteries Ltd
Amara Raja Power Systems Ltd
Amara Raja Electronics Ltd
Mangal Industries Ltd
Amara Raja Infra (p) Ltd
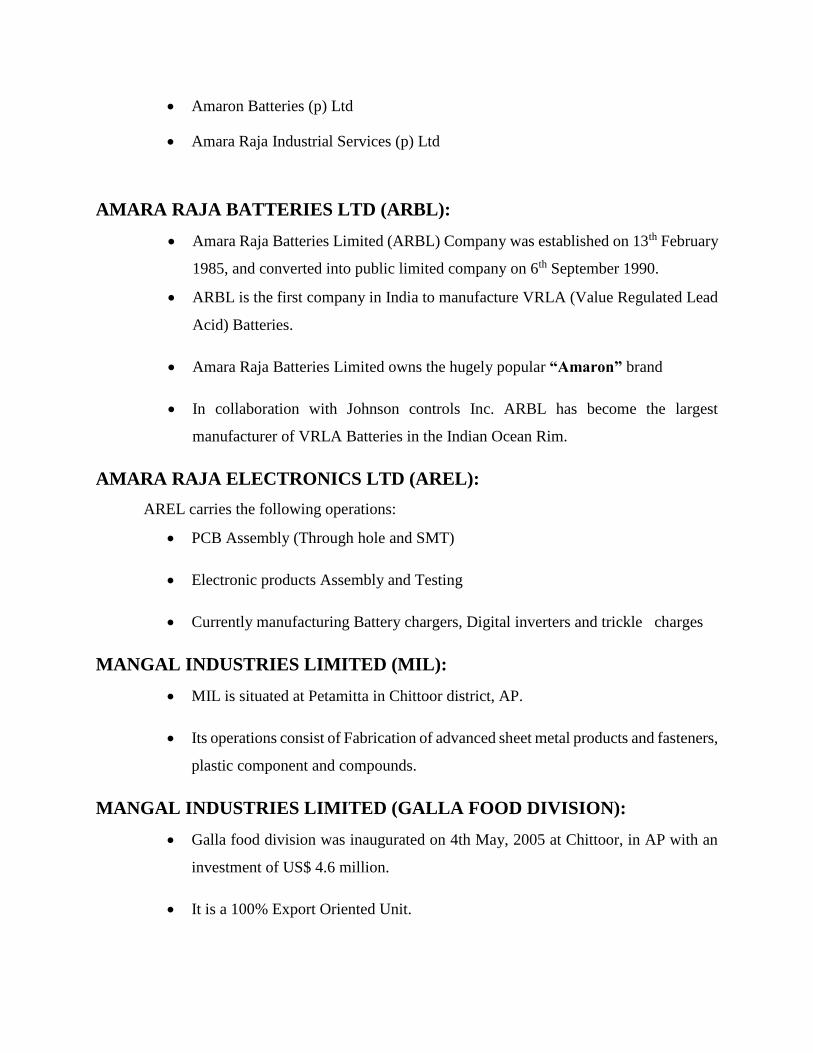
Amaron Batteries (p) Ltd
Amara Raja Industrial Services (p) Ltd
AMARA RAJA BATTERIES LTD (ARBL):
Amara Raja Batteries Limited (ARBL) Company was established on 13th February
1985, and converted into public limited company on 6th September 1990.
ARBL is the first company in India to manufacture VRLA (Value Regulated Lead
Acid) Batteries.
Amara Raja Batteries Limited owns the hugely popular “Amaron” brand
In collaboration with Johnson controls Inc. ARBL has become the largest
manufacturer of VRLA Batteries in the Indian Ocean Rim.
AMARA RAJA ELECTRONICS LTD (AREL):
AREL carries the following operations:
PCB Assembly (Through hole and SMT)
Electronic products Assembly and Testing
Currently manufacturing Battery chargers, Digital inverters and trickle charges
MANGAL INDUSTRIES LIMITED (MIL):
MIL is situated at Petamitta in Chittoor district, AP.
Its operations consist of Fabrication of advanced sheet metal products and fasteners,
plastic component and compounds.
MANGAL INDUSTRIES LIMITED (GALLA FOOD DIVISION):
Galla food division was inaugurated on 4th May, 2005 at Chittoor, in AP with an
investment of US$ 4.6 million.
It is a 100% Export Oriented Unit.

SOCIAL RESPONSIBILITIES:
A Company is known by the Society it keeps.Amara Raja believes in taking responsibility
for whatever they do, within and outside the company.
PHILOSOPHY:
Amara Raja Group mainly focused on up-liftmen of rural population and committed itself to social
activities in the following four areas: Rural employment, Learning & Education, Social
rehabilitation & rural up-liftmen. Specific schemes that benefit the local rural community like
supply/make available safe drinking water by coordination and in participation with the rural
community.
MISSION:
Mission, mantra way of thinking, philosophy, what we live for…call it what youwant,you’ll find
it below. Introduce yourself to the way we think. To transform our spheres of influence and to
improve the quality of life by building institutions that provide batter access to better opportunities,
goods and services to more people. All the time.
Introduce latest generation technology
Adapt these technologies to suit the operating environment
Develop manufacture globally competitive,customer focused products of world class
quality.
Responsibly introduce these products into relevant markets
VISION:
To create communities that is economically and socially vibrant enough to simulate growth
and self-reliance, within and outside the company.
Amara Raja Group committed themselves to social activities in the following four areas:
Education
Infrastructure
Village Development
Environment
EDUCATION:
To ensure people have a better quality of life, Amara Raja provides primary schooling
facilities for the children of their employees. They also provide their employees with the facilities
in the form of free memberships to education enhancement trusts and organizations like the library
for employees on site, the Rajanna trust for intellectual enhancement.
INFRASTRUCTURE:
Some of the infrastructural requirements provided are Bank for employees and the public,
Residential complexes for employees, Medical facilities, post-office, Subsidized transportation
and Recreational clubs.
VILLAGE DEVELOPMENT:
India lives in her villages. That is why Amara Raja Group focused a great deal on
developing the same by helping in building on roads, street lighting, rainwater storage, plants and
check dams. Under the banner of ‘GrameenaVikasam’ Amara Raja invested time and resources on
all the ongoing and long-term initiatives
ENVIRONMENT:
Respect for environment is a core business value that is reflected in all the comprehensive,
proactive environment programmers like the development of green belts, energy conservation and
water harvesting, to name a few.
BOARD OF DIRECTORS:
Non-Executive Charman :Dr.Ramachandra Naidu Galla
Managing Director : Mr.JayadevGalla
Director : Mr.Shuqing Yang
Director : Mr.P.Lakshmana Rao
Director : Mr.NagarjunValluripalli
Director : Mr.N.Sri Vishnu Raju
Director : Mr.T.R.Narayanaswamy
Director : Mr.RaymondJ.browm
1.4 PRODUCT PROFILE
Amaron Quanta is not just another UPS battery; it is a UPS battery with a back-up for
a back-up. What does this mean? Well, our UPS battery is further backed by the world-
renowned technology that others cannot provide you with. Put simply, Amaron Quanta
is the product of fail-safe, fool-proof battery technology, produced and tested in our
premier manufacturing facility and provides several firsts for a battery of its kind.
Amara Raja's Amaron Volt is a high performance battery designed to meet the demands
of a wide range of industrial applications. The Amaron Volt range is modular in
structure and is capable of accommodating a wide spectrum of capacities depending on
the application. Major application areas include Telecommunications, Power Utilities,
Railways, Defence and other heavy Industries.
Amara Raja's Power stack is a high performance battery designed to meet the demands
of a wide range of industrial applications. The Power stack range is modular in structure
and is capable of accommodating a wide spectrum of capacities depending on the
application. Major application areas include Telecommunications, Power Utilities,
Railways, Defence and other heavy Industries.
Amaron PRO, brought to you by Amara Raja Batteries Limited (ARBL), the largest
manufacturers of Stand-by VRLA Industrial Batteries in the Indian Ocean Rim and
Johnson Controls Inc., USA; the global leader in Interior experience, building
efficiency and power solutions.
Amaron FLO, brought to you by Amara Raja Batteries Limited (ARBL), the largest
manufacturers of Stand-by VRLA Industrial Batteries in the Indian Ocean Rim and
Johnson Controls Inc., USA; the global leader in Interior experience, building
efficiency and power solutions.
Amaron GO, brought to you by Amara Raja Batteries Limited (ARBL), the largest
manufacturers of Stand-by VRLA Industrial Batteries in the Indian Ocean Rim and
Johnson Controls Inc., USA; the global leader in Interior experience, building
efficiency and power solutions.
Amaron Black, brought to you by Amara Raja Batteries Limited (ARBL), the largest
manufacturers of Stand-by VRLA Industrial Batteries in the Indian Ocean Rim and
Johnson Controls Inc. USA; the global leader in Interior experience, building efficiency
and power solutions.
Amaron Fresh, brought to you by Amara Raja Batteries Limited (ARBL), the largest
manufacturers of Stand-by VRLA Industrial Batteries in the Indian Ocean Rim and
Johnson Controls Inc. USA; the global leader in Interior experience, building efficiency
and power solutions.
AmaronHi-way truck batteries, brought to you by Amara Raja Batteries Limited
(ARBL), the largest manufacturers of Stand-by VRLA Industrial Batteries in the Indian
Ocean Rim and Johnson Controls Inc. USA; the global leader in Interior experience,
building efficiency and power solutions.
Amaron Harvest, brought to you by Amara Raja Batteries Limited (ARBL), the largest
manufacturers of Stand-by VRLA Industrial Batteries in the Indian Ocean Rim and
Johnson Controls Inc., USA; the global leader in Interior experience, building
efficiency and power solutions.
The new Amaron Shield, with an unheard of 24 months warranty. A product of Amara
Raja Batteries Ltd. (ABRL), Amaron Shield is a result of a partnership between the
Amara Raja Group and Johnson Controls Inc. USA, the global leader in Interior
experience, building efficiency and power solutions.
Welcome to the elite club of Amaron Pro Bike Rider. Witness here the most researched, designed
& developed Power Fitments for today’s motorcycles that drive your passion.

CHAPTER – 2
REVIEW OF LITERATURE
2. REVIEW OF LITERATURE
WORKING CAPITAL MANAGEMENT
INTRODUCTION
One of the most important areas in the day-to-day management of the firm is the
management of working capital. Working capital management is the functional area of the finance
that covers all the current accounts of the firm. It is concerned with management of the level of
individual current assets as well as the management of total working capital. Financial
management means procurement of funds and effective utilization of these procured funds.
Procurement of funds is firstly concerned for financing working capital requirement of the firm
and secondary for financing fixed assets.
MEANING OF WORKING CAPITAL
Working Capital refers to that part of the firm’s Capital, which is required for Financing
Short Working Capital is the amount of Capital that a Business has available to meet the day-to-
day cash requirements of its operations.
Working Capital is the difference between resources in cash or readily convertible into cash
(Current Assets) and organizational commitments for which cash will soon be required (Current
Liabilities) .It refers to the amount of Current Assets that exceeds Current Liabilities (i.e. CA -
CL).
CONCEPTS OF WORKING CAPITAL:-
There are two concepts of working capital-
(1) Gross Working Capital Concept
(2) Net Working Capital concept.
(1) GROSS WORKING CAPITAL:
Gross working capital refers to firm's investment in current assets. Current assets are the assets
which can be converted into cash within an accounting year and include cash, short-term
securities, debtors, bill receivables and stock.
According to this concept, working capital means Gross working Capital which is the total of all
current assets of a business. It can be represented by the following equation:
Gross Working Capital = Total Current Assets
(2) NET WORKING CAPITAL CONCEPT:
Net working capital refers to the difference between current assets and current liabilities.
Current liabilities are those claims of outsiders which are expected to mature for payment
within an accounting year and include creditors, bills payables, and outstanding expenses.
Net working capital can be positive or negative. A positive net working capital will arise when
current assets exceed current liabilities. A negative Net working capital occurs when current
liabilities are in excess of current assets.
Net Working Capital = Current Assets - Current Liabilities
DEFINITIONS FAVORING NET WORKING CAPITAL CONCEPT:-
According to C.W.Gestenbergh
"It has ordinarily been defined as the excess of current assets over current liabilities".
According to Lawrence. J. Gitmen
" The most common definition of net working capital is the difference of firm's current assets and
current liabilities".
WORKING CAPITAL MANAGEMENT:
Decisions relating to working capital and short-term financing are referred to as working
capital management. These involve managing the relationship between a firm's short-term assets
and its short-term liabilities. The goal of working capital management is to ensure that the firm is
able to continue its operations and that it has sufficient cash flow to satisfy both maturing short-
term debt and upcoming operational expenses.
A managerial accounting strategy focusing on maintaining efficient levels of both
components of working capital, current assets and current liabilities, in respect to each other.
Working capital management ensures a company has sufficient cash flow in order to meet its short-
term debt obligations and operating expenses.
DECISION CRITERIA:
By definition, working capital management entails short-term decisions—generally, relating
to the next one-year period—which is "reversible". These decisions are therefore not taken on the
same basis as capital-investment decisions (NPV or related, as above); rather, they will be based
on cash flows, or profitability, or both.
One measure of cash flow is provided by the cash conversion cycle—the net number of
days from the outlay of cash for raw material to receiving payment from the customer. As
a management tool, this metric makes explicit the inter-relatedness of decisions relating to
inventories, accounts receivable and payable, and cash. Because this number effectively
corresponds to the time that the firm's cash is tied up in operations and unavailable for other
activities, management generally aims at a low net count.
In this context, the most useful measure of profitability is return on capital (ROC). The
result is shown as a percentage, determined by dividing relevant income for the 12 months
by capital employed; return on equity (ROE) shows this result for the firm's shareholders.
Firm value is enhanced when, and if, the return on capital, which results from working-
capital management, exceeds the cost of capital, which results from capital investment
decisions as above. ROC measures are therefore useful as a management tool, in that they
link short-term policy with long-term decision making. See economic value added (EVA).
Credit policy of the firm: Another factor affecting working capital management is credit
policy of the firm. It includes buying of raw material and selling of finished goods either
in cash or on credit. This affects the cash conversion cycle
MANAGEMENT OF WORKING CAPITAL:
Guided by the above criteria, management will use a combination of policies and
techniques for the management of working capital. The policies aim at managing the current assets
(generally cash and cash equivalents, inventories and debtors) and the short-term financing, such
that cash flows and returns are acceptable.
CASH MANAGEMENT.
Identify the cash balance which allows for the business to meet day to day expenses, but
reduces cash holding costs.
INVENTORY MANAGEMENT.
Identify the level of inventory which allows for uninterrupted production but reduces the
investment in raw materials—and minimizes reordering costs—and hence increases cash flow.
Besides this, the lead times in production should be lowered to reduce Work in Process (WIP) and
similarly, the Finished Goods should be kept on as low level as possible to avoid over production—
see Supply chain management; Just In Time (JIT); Economic order quantity (EOQ); Economic
quantity.
DEBTORS MANAGEMENT
Identify the appropriate credit policy, i.e. credit terms which will attract customers, such
that any impact on cash flows and the cash conversion cycle will be offset by increased revenue
and hence Return on Capital (or vice versa); see Discounts and allowances.
SHORT-TERM FINANCING.
Identify the appropriate source of financing, given the cash conversion cycle: the inventory
is ideally financed by credit granted by the supplier; however, it may be necessary to utilize a bank
loan (or overdraft), or to "convert debtors to cash" through "factoring".
OPERATING CYCLE:
Working capital is also called a circulating capital or revolving capital. That is the
money/capital which circulates in various forms of current assets in a continued manner. For
example, at a point of time, funds may be tied up in raw materials, then later converted into semi-
finished products, then into finished/ final products and when these finished products are sold, it
is converted either into account receivables or cash.
This cash is reinvested in current assets. Thus, the amount always keeps on circulating or
revolving from cash to current assets and back again to cash. That is why some people prefer to
use the term liquidity management instead of working capital management. Although this
circulation takes place at short intervals, the money is required again and again.
The American Institute of Certified Public Accountants defined the operating cycle as: “the
average time intervening between the acquisition of material or services entering the process and
the final cash realization.”
According to I. M. Pandey, “Operating cycle is the time duration involved in the acquisition
of resources, conversion of raw materials into work- in-process into finished goods, conversion of
finished goods into sales and collection of sales.”
THUS, OPERATING CYCLE OF A MANUFACTURING ENTERPRISE
INVOLVES THREE PHASES: 1. Acquisition of resources such as raw material, labor, power and fuel etc.
2. Manufacture of the product which includes conversion of raw material into work-in-progress
into finished goods.
3. Sale of the product either for cash or on credit. Credit sales create account receivable for
collection.
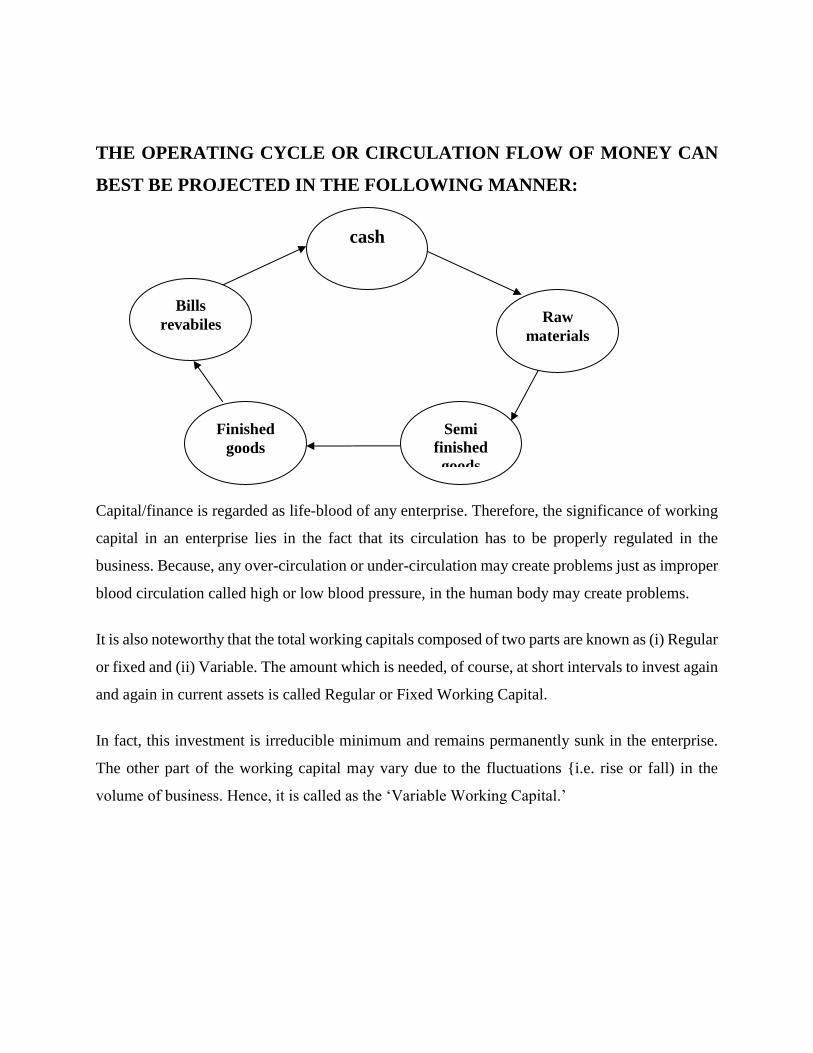
THE OPERATING CYCLE OR CIRCULATION FLOW OF MONEY CAN
BEST BE PROJECTED IN THE FOLLOWING MANNER:
Capital/finance is regarded as life-blood of any enterprise. Therefore, the significance of working
capital in an enterprise lies in the fact that its circulation has to be properly regulated in the
business. Because, any over-circulation or under-circulation may create problems just as improper
blood circulation called high or low blood pressure, in the human body may create problems.
It is also noteworthy that the total working capitals composed of two parts are known as (i) Regular
or fixed and (ii) Variable. The amount which is needed, of course, at short intervals to invest again
and again in current assets is called Regular or Fixed Working Capital.
In fact, this investment is irreducible minimum and remains permanently sunk in the enterprise.
The other part of the working capital may vary due to the fluctuations {i.e. rise or fall) in the
volume of business. Hence, it is called as the ‘Variable Working Capital.’
Semi
finished
goods
cash
Raw
materials
Finished
goods
Bills
revabiles

THE TWO PARTS OF WORKING CAPITAL ARE SHOWN IN THE
FIGURE 25.2.
Figure 25.2 clearly illustrates the difference between fixed and variable working capital. However,
the fixed working capital line need not be horizontal if the firm’s requirement for fixed working
capital is increasing or decreasing over the period.
FOR A GROWING ENTERPRISE, THE DIFFERENCE BETWEEN FIXED
AND VARIABLE WORKING CAPITAL CAN BE DEPICTED THROUGH
THE FOLLOWING FIGURE 25.3.
COMPONENTS OF WORKING CAPITAL:
Working capital in common parlance is the difference between current assets and current
liabilities. Current assets usually consist of cash, marketable securities, receivables and inventory.
A major component of current liabilities, on the other hand, is the payables.
Management of working capital refers to the practices and techniques designed to control all the
items of current assets and current liabilities. In the ordinary sense, working capital management
is the function that involves effective and efficient use of all the components of current assets and
current liabilities in order to minimize total cost.
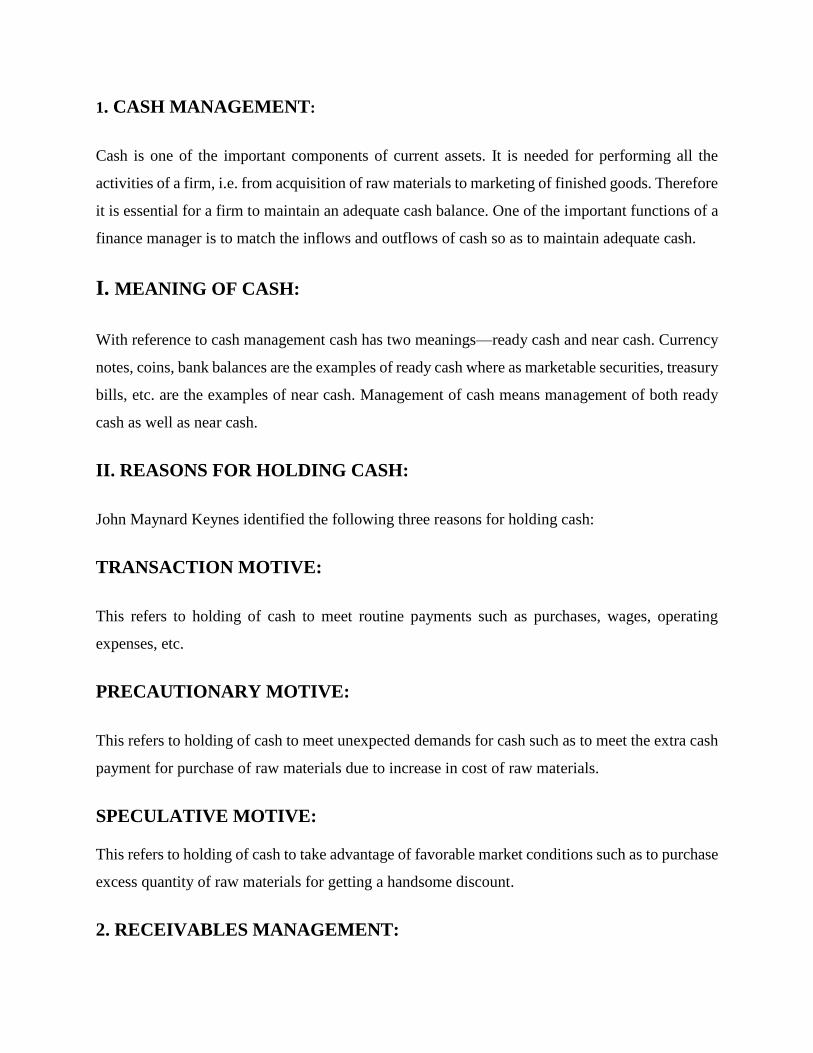
1. CASH MANAGEMENT:
Cash is one of the important components of current assets. It is needed for performing all the
activities of a firm, i.e. from acquisition of raw materials to marketing of finished goods. Therefore
it is essential for a firm to maintain an adequate cash balance. One of the important functions of a
finance manager is to match the inflows and outflows of cash so as to maintain adequate cash.
I. MEANING OF CASH:
With reference to cash management cash has two meanings—ready cash and near cash. Currency
notes, coins, bank balances are the examples of ready cash where as marketable securities, treasury
bills, etc. are the examples of near cash. Management of cash means management of both ready
cash as well as near cash.
II. REASONS FOR HOLDING CASH:
John Maynard Keynes identified the following three reasons for holding cash:
TRANSACTION MOTIVE:
This refers to holding of cash to meet routine payments such as purchases, wages, operating
expenses, etc.
PRECAUTIONARY MOTIVE:
This refers to holding of cash to meet unexpected demands for cash such as to meet the extra cash
payment for purchase of raw materials due to increase in cost of raw materials.
SPECULATIVE MOTIVE:
This refers to holding of cash to take advantage of favorable market conditions such as to purchase
excess quantity of raw materials for getting a handsome discount.
2. RECEIVABLES MANAGEMENT:
The term receivable is defined as any claim for money owed to the firm from customers arising
from sale of goods or services in normal course of business. The term account receivable represents
sundry debtors of a firm. It is one of the significant components of working capital next to cash
and inventories.
The total volume of accounts receivable depends on its credit sale and debt collection policy—
these two significantly influence the requirement of working capital. Liberal credit policy increases
the volume of sales but at the same time it also increases the investment in receivables. Therefore,
examination of costs and benefits associated with credit policy is one of the important tasks of a
finance manager.
I. COST OF MAINTAINING ACCOUNTS RECEIVABLES:
The following are costs associated with maintaining accounts receivables:
CAPITAL COST:
There is a time gap between the sale of goods and payment by debtors during which time the firm
has to arrange funds for meeting their obligations like payment for raw materials, wages, etc. This
additional financing involves some cost, known as capital cost. Collection Cost: Collection costs
are the administrative costs incurred by the firm for collecting money from the debtors.
DEFAULT COST: Default cost is the cost that arises from bad debt losses.
DELINQUENCY COST: These costs arise for extending credit to defaulting customers.
Such costs are legal charges, costs involved in putting extra effort for collection, costs associated
with sending reminders, etc.
FORMULATION OF CREDIT POLICIES:
Credit policy has significant impact on the profitability of a concern but it should be ensured that
the profit on additional sales arising out of liberal credit policy is sufficiently higher than the cost
involved for maintaining additional receivables.
3. INVENTORY MANAGEMENT:
Inventory constitutes a major part of total working capital. Efficient management of inventory
results in maximization of earnings of the shareholders. Efficient inventory management consists
of managing two conflicting objectives: Minimization of investment in inventory on the one hand;
and maintenance of the smooth flow of raw materials for production and sales on the other.
Therefore the objective of a finance manager is to calculate the level of inventory where these
conflicting interests are reconciled. Like cash, a firm holds inventory for transaction, precautionary
and speculative motives.
I. INVENTORY COSTS:
Besides purchase costs, inventory costs are of two types: Ordering costs and carrying costs.
ORDERING COST:
These costs include variable costs associated with acquisition of materials, like transportation
costs, inspection costs, etc. This cost is also known as set-up cost.
CARRYING COSTS:
These costs include costs associated with holding the inventory such as storage charges, interest
on capital, etc.
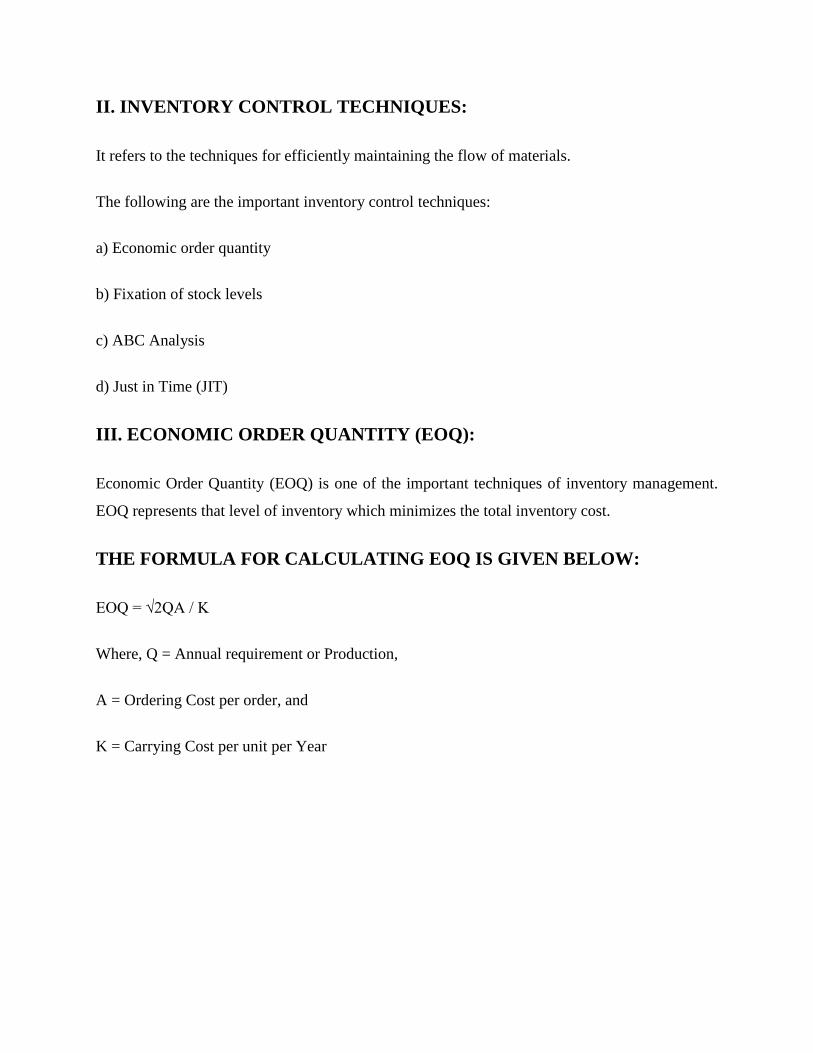
II. INVENTORY CONTROL TECHNIQUES:
It refers to the techniques for efficiently maintaining the flow of materials.
The following are the important inventory control techniques:
a) Economic order quantity
b) Fixation of stock levels
c) ABC Analysis
d) Just in Time (JIT)
III. ECONOMIC ORDER QUANTITY (EOQ):
Economic Order Quantity (EOQ) is one of the important techniques of inventory management.
EOQ represents that level of inventory which minimizes the total inventory cost.
THE FORMULA FOR CALCULATING EOQ IS GIVEN BELOW:
EOQ = √2QA / K
Where, Q = Annual requirement or Production,
A = Ordering Cost per order, and
K = Carrying Cost per unit per Year
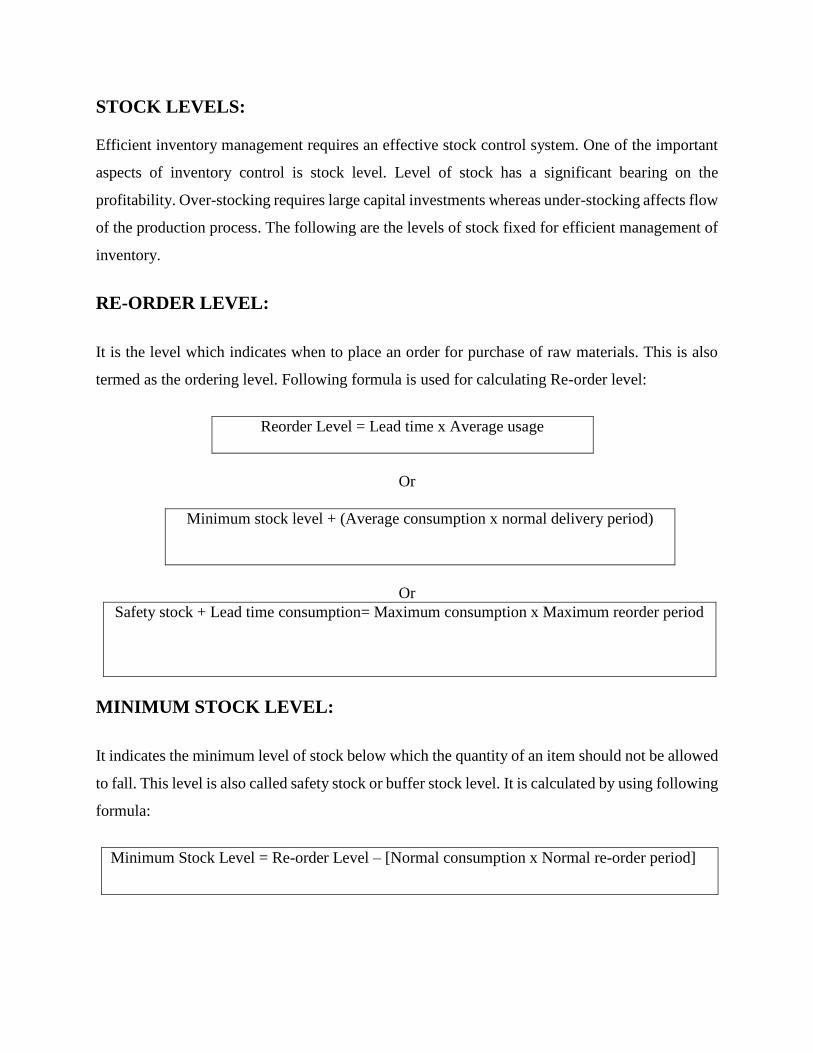
STOCK LEVELS:
Efficient inventory management requires an effective stock control system. One of the important
aspects of inventory control is stock level. Level of stock has a significant bearing on the
profitability. Over-stocking requires large capital investments whereas under-stocking affects flow
of the production process. The following are the levels of stock fixed for efficient management of
inventory.
RE-ORDER LEVEL:
It is the level which indicates when to place an order for purchase of raw materials. This is also
termed as the ordering level. Following formula is used for calculating Re-order level:
Reorder Level = Lead time x Average usage
Or
Minimum stock level + (Average consumption x normal delivery period)
Or
Safety stock + Lead time consumption= Maximum consumption x Maximum reorder period
MINIMUM STOCK LEVEL:
It indicates the minimum level of stock below which the quantity of an item should not be allowed
to fall. This level is also called safety stock or buffer stock level. It is calculated by using following
formula:
Minimum Stock Level = Re-order Level – [Normal consumption x Normal re-order period]
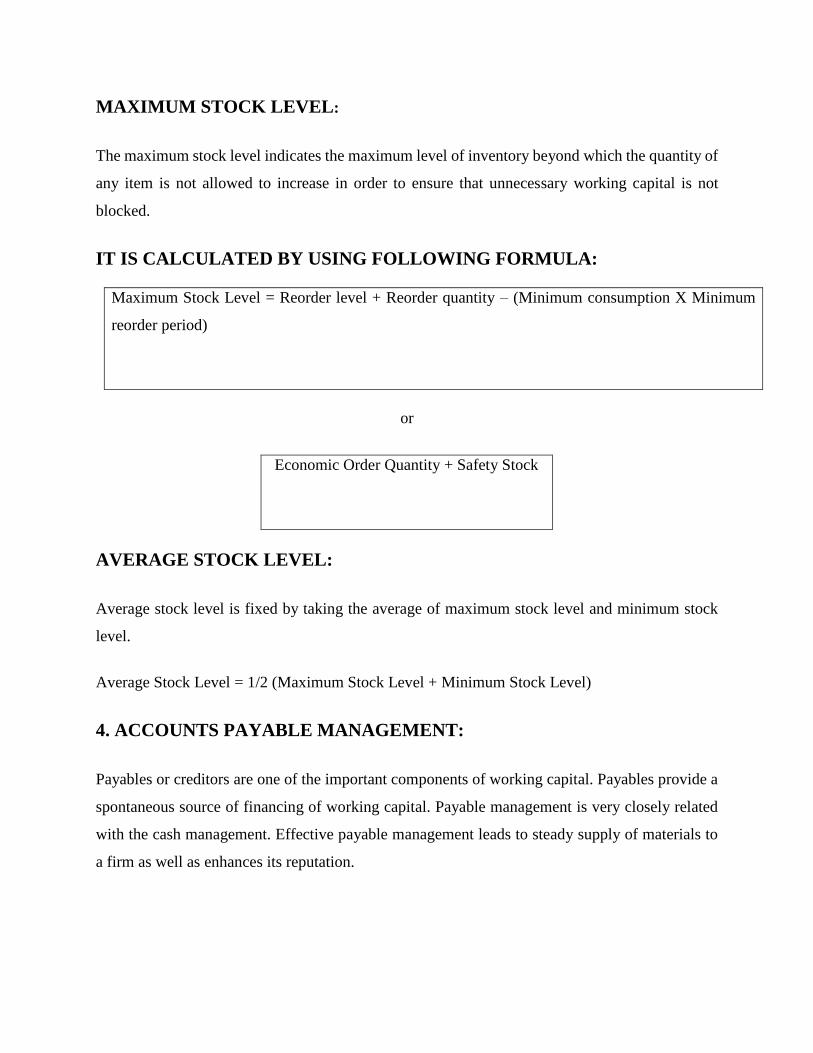
MAXIMUM STOCK LEVEL:
The maximum stock level indicates the maximum level of inventory beyond which the quantity of
any item is not allowed to increase in order to ensure that unnecessary working capital is not
blocked.
IT IS CALCULATED BY USING FOLLOWING FORMULA:
Maximum Stock Level = Reorder level + Reorder quantity – (Minimum consumption X Minimum
reorder period)
or
Economic Order Quantity + Safety Stock
AVERAGE STOCK LEVEL:
Average stock level is fixed by taking the average of maximum stock level and minimum stock
level.
Average Stock Level = 1/2 (Maximum Stock Level + Minimum Stock Level)
4. ACCOUNTS PAYABLE MANAGEMENT:
Payables or creditors are one of the important components of working capital. Payables provide a
spontaneous source of financing of working capital. Payable management is very closely related
with the cash management. Effective payable management leads to steady supply of materials to
a firm as well as enhances its reputation.
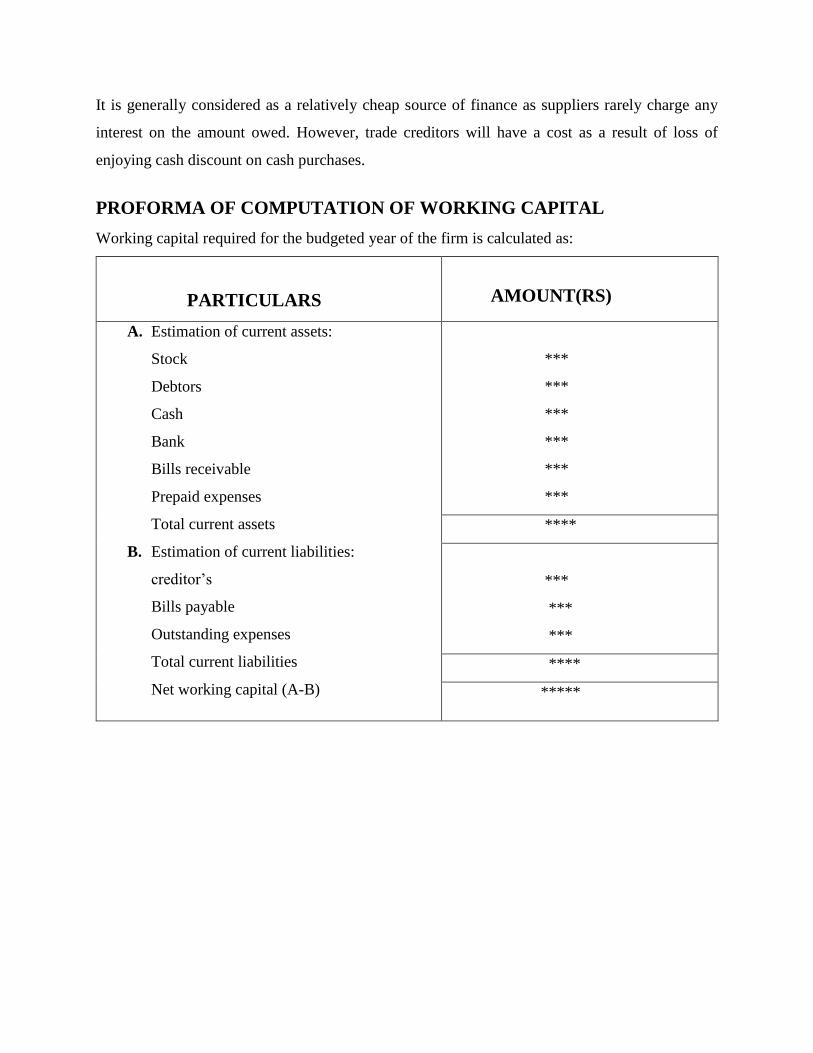
It is generally considered as a relatively cheap source of finance as suppliers rarely charge any
interest on the amount owed. However, trade creditors will have a cost as a result of loss of
enjoying cash discount on cash purchases.
PROFORMA OF COMPUTATION OF WORKING CAPITAL
Working capital required for the budgeted year of the firm is calculated as:
PARTICULARS
AMOUNT(RS)
A. Estimation of current assets:
Stock
Debtors
Cash
Bank
Bills receivable
Prepaid expenses
Total current assets
B. Estimation of current liabilities:
creditor’s
Bills payable
Outstanding expenses
Total current liabilities
Net working capital (A-B)
***
***
***
***
***
***
****
***
***
***
****
*****
CHAPTER – 3
RESEARCH METHODOLOGY
3.1 NEED FOR THE STUDY
Working capital management plays a vital role in any organization and one should have a
thorough knowledge about the working capital position.
In view of this context I have undertaken this study and it would be a great advantage to
the company also to know its working capital position.
The out sourcing can be made for the funds by the study. The study helps in estimating the
assets and liabilities of an organization.
This project work is an attempt to get acquainted with various facts of short-term finance
management.
This project work aims at encompassing working capital management practices that prevail
in the organization upon which the study was undertaken.
This project work is an endeavor to not, absorb and imbibe the mode of the current assets
management and style of the corporate sector.
Far from the routine academic exercise, it is an opportunity to go through the practical
management where adequacy at the needy hour is the touchstone for efficiency.
3.2 SCOPE OF THE STUDY
The scope of the study is defined below in terms of concepts adopted and period under focus.
First the study of working capital management is confined only to the “AMARA RAJA
BATTERIES LIMITED”.
Secondary the concepts of working capital i.e gross and net is used measuring the liquidity
and profitability performance and also to arrive at various objectives of the study.
Thirdly the study is based on annual reports of the company for a period of five years due
to time constraint the study period restricted. The contents of the total evaluation of current
assets and current liabilities and their percentage contribution in the total turnover.
The yearly increase or decrease of current assets or current liabilities in the budget of
SHIVASHAKTHI DAIRY PVT.LTD is being reviewed.
From this one would be in a position to glance the performance of current assets and current
liabilities of the Company.
This project greatly deals with the working capital requirements of SHIVASHAKTHI
DAIRYT PVT.LTD emphasize on the yearly composition of Working Capital in the total
turnover of the Company.
This also deals with key ratios to obtain a clearer picture of different resources available
and at the disposal of the organization, which will enable one to give appropriation
suggestion to the Company to improve its performance, if any.

3.3 OBJECTIVE OF THE STUDY
To measure the liquidity position of the firm by using working capital ratios during the
study period.
To study the working capital turnover of the company.
To study the trends in net working capital of the company.
To study the changes in networking capital of the company.
To understand the structure of Working Capital
To examine the utilization of Working Capital by construction of operating cycle
To study the financial position of the company
To study the Working Capital Management with reference to liquidity and solvency of the
Company
To determine the Working Capital financial policy.
To give suggestions to the Company to improve its performance.
3.4 RESEARCH DESIGN
RESEARCH
Research is the process of systematic and in depth study or search for any particular topic
subject area of investigation, collection, presentation and interpretation of data.Research is also
“A systematic search for an answer to question or a solution to a problem” is called research.
TYPES OF DATA COLLECTION
Primary data
Secondary data
PRIMARY DATA:
It will be collected from the employees in the company, which is not applicable in the present
study.
SECONDARY DATA:
It means the data which is already presented one & it is second hand information.
The present study purely depends on secondary data.
Company annual reports.
Information from internet.
Publications.
Magazines and journals etc.
3.6 LIMITATION OF THE STUDY
The study is based on the past data which cannot be predict the future performance.
The study is based on the information provided by the organization in the form of various
annual report only.
The study may not be detailed in all aspects.
The study period is limited.
CHAPTER - 4
4. DATA ANALYSIS AND INTERPRETATION
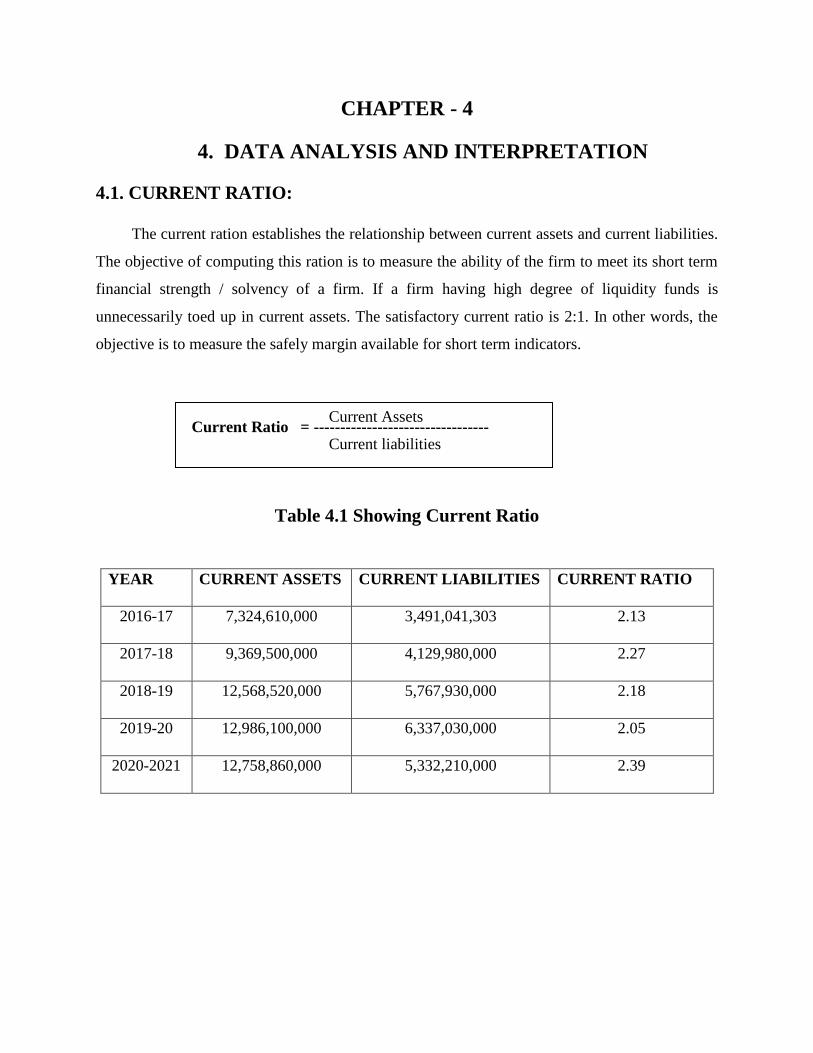
4.1. CURRENT RATIO:
The current ration establishes the relationship between current assets and current liabilities.
The objective of computing this ration is to measure the ability of the firm to meet its short term
financial strength / solvency of a firm. If a firm having high degree of liquidity funds is
unnecessarily toed up in current assets. The satisfactory current ratio is 2:1. In other words, the
objective is to measure the safely margin available for short term indicators.
Current Ratio = ---------------------------------
Table 4.1 Showing Current Ratio
YEAR CURRENT ASSETS CURRENT LIABILITIES CURRENT RATIO
2016-17 7,324,610,000 3,491,041,303 2.13
2017-18 9,369,500,000 4,129,980,000 2.27
2018-19 12,568,520,000 5,767,930,000 2.18
2019-20 12,986,100,000 6,337,030,000 2.05
2020-2021 12,758,860,000 5,332,210,000 2.39
Current Assets
Current liabilities
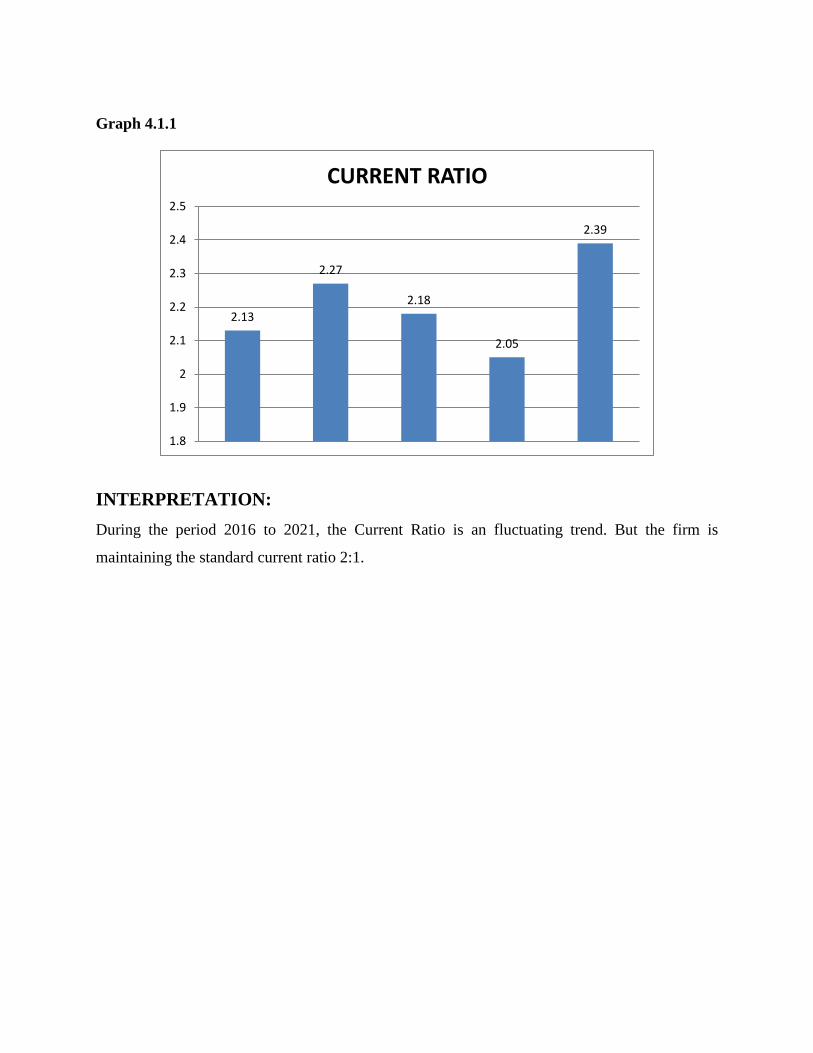
Graph 4.1.1
INTERPRETATION:
During the period 2016 to 2021, the Current Ratio is an fluctuating trend. But the firm is
maintaining the standard current ratio 2:1.
2.13
2.27
2.18
2.05
2.39
1.8
1.9
2
2.1
2.2
2.3
2.4
2.5
CURRENT RATIO
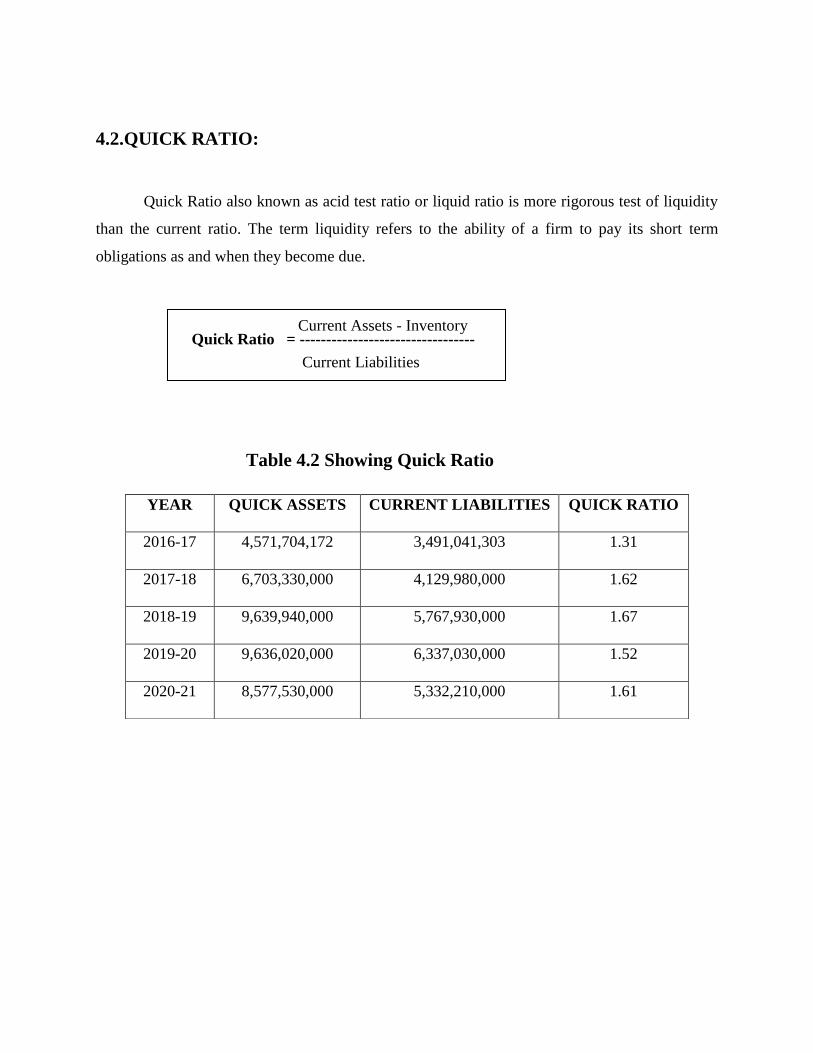
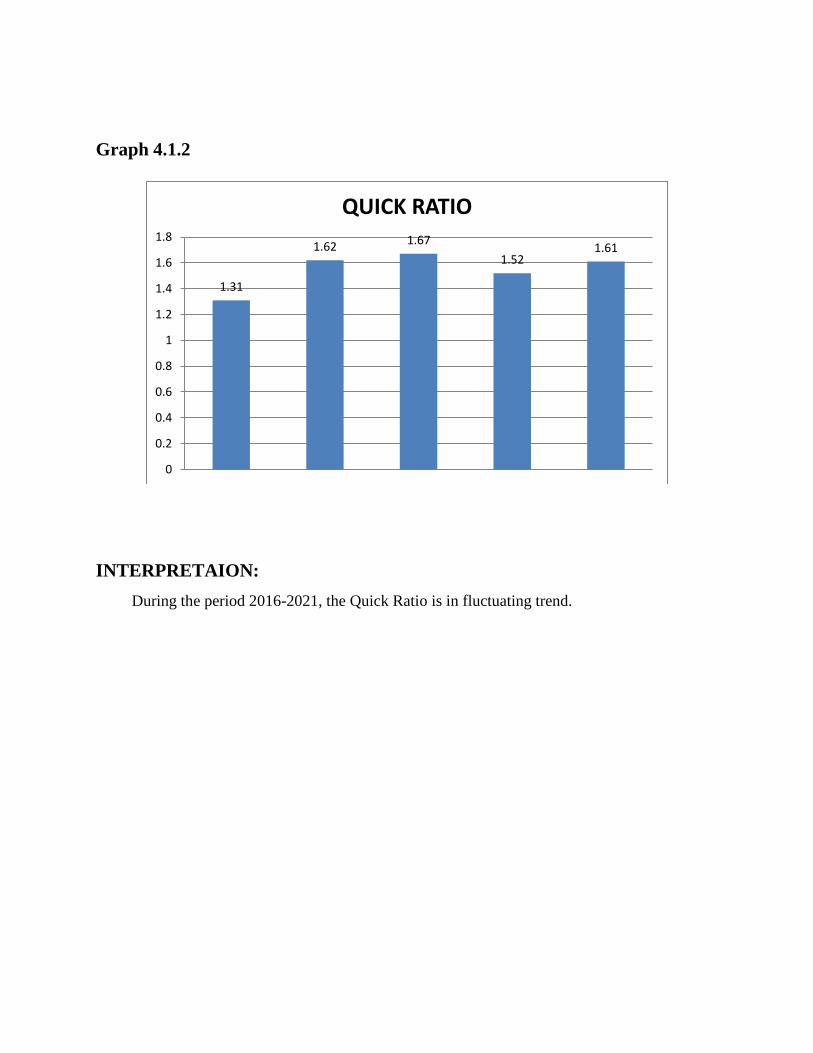
4.2.QUICK RATIO:
Quick Ratio also known as acid test ratio or liquid ratio is more rigorous test of liquidity
than the current ratio. The term liquidity refers to the ability of a firm to pay its short term
obligations as and when they become due.
Quick Ratio = ---------------------------------
Table 4.2 Showing Quick Ratio
YEAR QUICK ASSETS CURRENT LIABILITIES QUICK RATIO
2016-17 4,571,704,172 3,491,041,303 1.31
2017-18 6,703,330,000 4,129,980,000 1.62
2018-19 9,639,940,000 5,767,930,000 1.67
2019-20 9,636,020,000 6,337,030,000 1.52
2020-21 8,577,530,000 5,332,210,000 1.61
Current Assets - Inventory
Current Liabilities
Graph 4.1.2
INTERPRETAION:
During the period 2016-2021, the Quick Ratio is in fluctuating trend.
1.31
1.62 1.67
1.521.61
0
0.2
0.4
0.6
0.8
1
1.2
1.4
1.6
1.8
QUICK RATIO
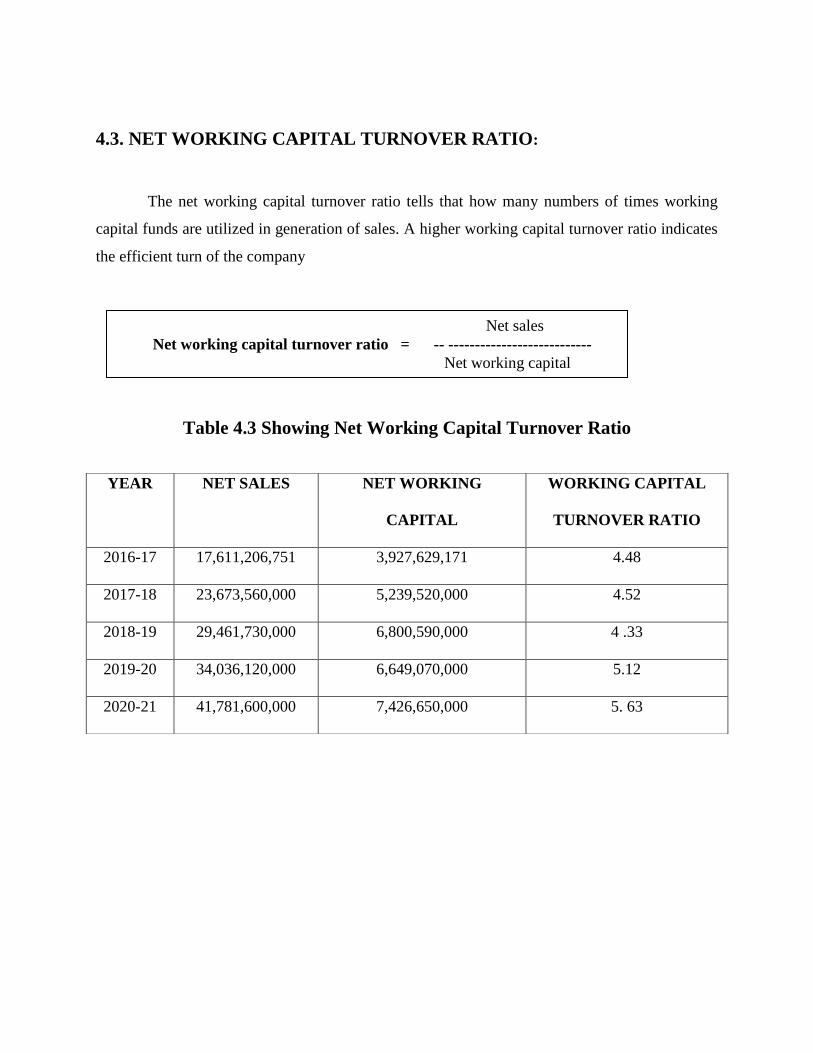
4.3. NET WORKING CAPITAL TURNOVER RATIO:
The net working capital turnover ratio tells that how many numbers of times working
capital funds are utilized in generation of sales. A higher working capital turnover ratio indicates
the efficient turn of the company
Table 4.3 Showing Net Working Capital Turnover Ratio
YEAR NET SALES NET WORKING
CAPITAL
WORKING CAPITAL
TURNOVER RATIO
2016-17 17,611,206,751 3,927,629,171 4.48
2017-18 23,673,560,000 5,239,520,000 4.52
2018-19 29,461,730,000 6,800,590,000 4 .33
2019-20 34,036,120,000 6,649,070,000 5.12
2020-21 41,781,600,000 7,426,650,000 5. 63
Net sales
Net working capital turnover ratio = -- ---------------------------
Net working capital
Graph 4.1.3
INTERPRETATION:
During the period 2016-21, the Working Capital Turnover Ratio is an increasing trend except in
the year 2018-19.
4.48 4.524.33
5.12
5.63
0
1
2
3
4
5
6
Working Capital Turnover Ratio
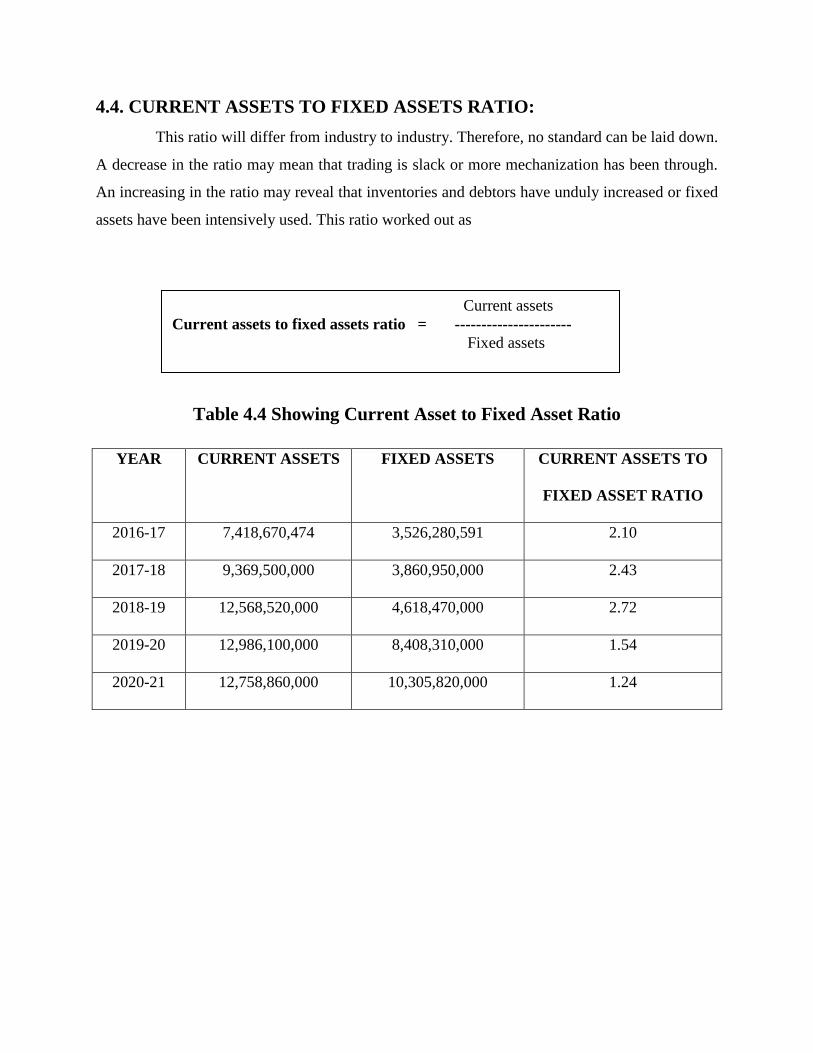
4.4. CURRENT ASSETS TO FIXED ASSETS RATIO:
This ratio will differ from industry to industry. Therefore, no standard can be laid down.
A decrease in the ratio may mean that trading is slack or more mechanization has been through.
An increasing in the ratio may reveal that inventories and debtors have unduly increased or fixed
assets have been intensively used. This ratio worked out as
Table 4.4 Showing Current Asset to Fixed Asset Ratio
YEAR CURRENT ASSETS FIXED ASSETS CURRENT ASSETS TO
FIXED ASSET RATIO
2016-17 7,418,670,474 3,526,280,591 2.10
2017-18 9,369,500,000 3,860,950,000 2.43
2018-19 12,568,520,000 4,618,470,000 2.72
2019-20 12,986,100,000 8,408,310,000 1.54
2020-21 12,758,860,000 10,305,820,000 1.24
Current assets
Current assets to fixed assets ratio = ----------------------
Fixed assets
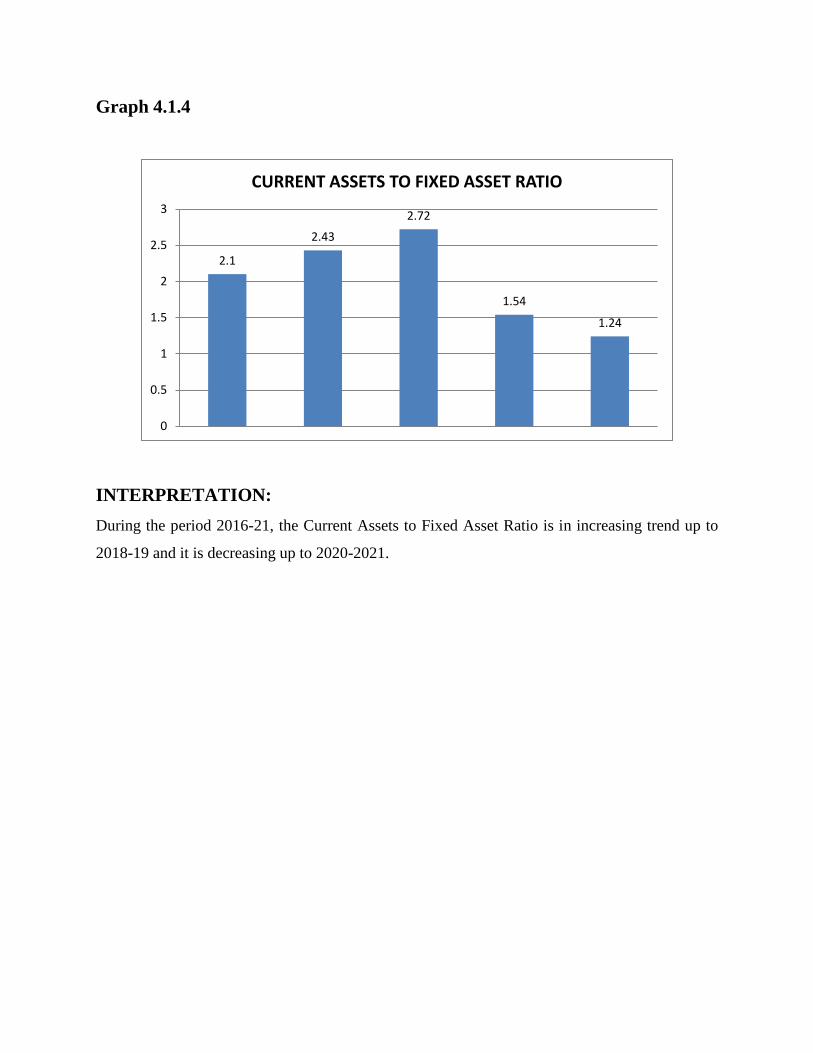
Graph 4.1.4
INTERPRETATION:
During the period 2016-21, the Current Assets to Fixed Asset Ratio is in increasing trend up to
2018-19 and it is decreasing up to 2020-2021.
2.1
2.43
2.72
1.54
1.24
0
0.5
1
1.5
2
2.5
3
CURRENT ASSETS TO FIXED ASSET RATIO
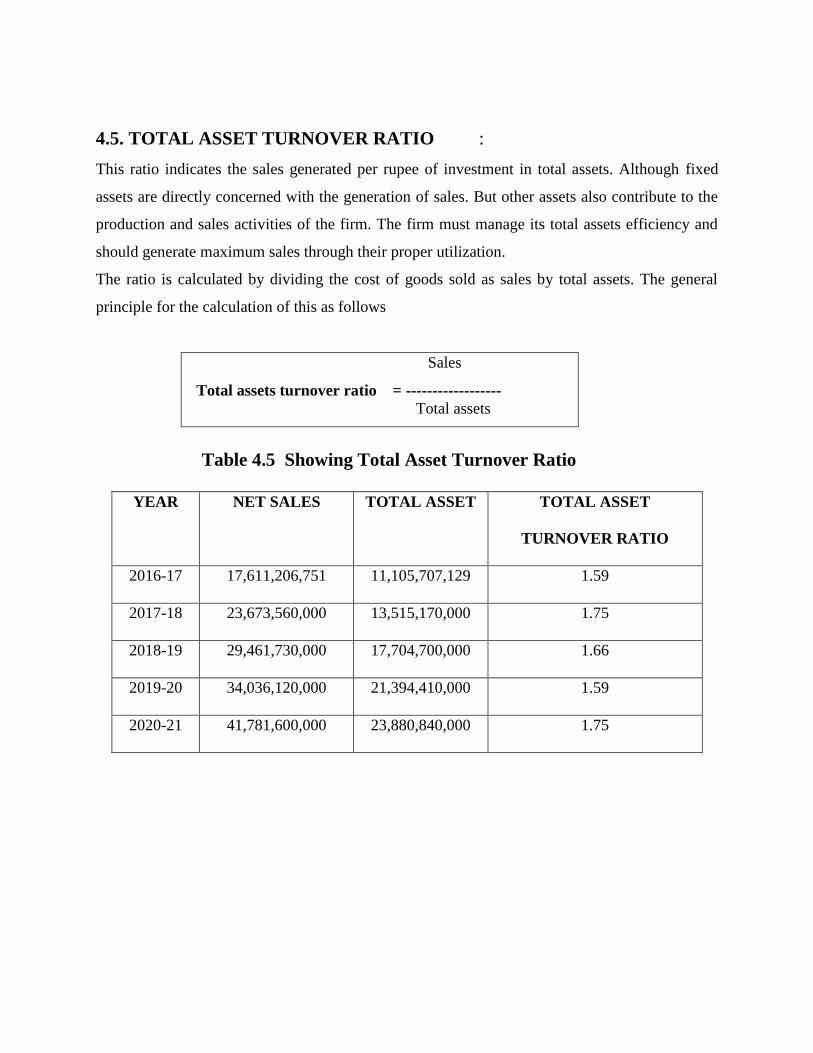
4.5. TOTAL ASSET TURNOVER RATIO :
This ratio indicates the sales generated per rupee of investment in total assets. Although fixed
assets are directly concerned with the generation of sales. But other assets also contribute to the
production and sales activities of the firm. The firm must manage its total assets efficiency and
should generate maximum sales through their proper utilization.
The ratio is calculated by dividing the cost of goods sold as sales by total assets. The general
principle for the calculation of this as follows
Sales
Total assets turnover ratio = ------------------
Total assets
Table 4.5 Showing Total Asset Turnover Ratio
YEAR NET SALES TOTAL ASSET TOTAL ASSET
TURNOVER RATIO
2016-17 17,611,206,751 11,105,707,129 1.59
2017-18 23,673,560,000 13,515,170,000 1.75
2018-19 29,461,730,000 17,704,700,000 1.66
2019-20 34,036,120,000 21,394,410,000 1.59
2020-21 41,781,600,000 23,880,840,000 1.75
Graph 4.1.5
INTERPRETATION:
During the period 2016-21, The Total Asset Turnover Ratio is in fluctuating trend.
1.59
1.75
1.66
1.59
1.75
1.5
1.55
1.6
1.65
1.7
1.75
1.8
TOTAL ASSET TURNOVER RATIO
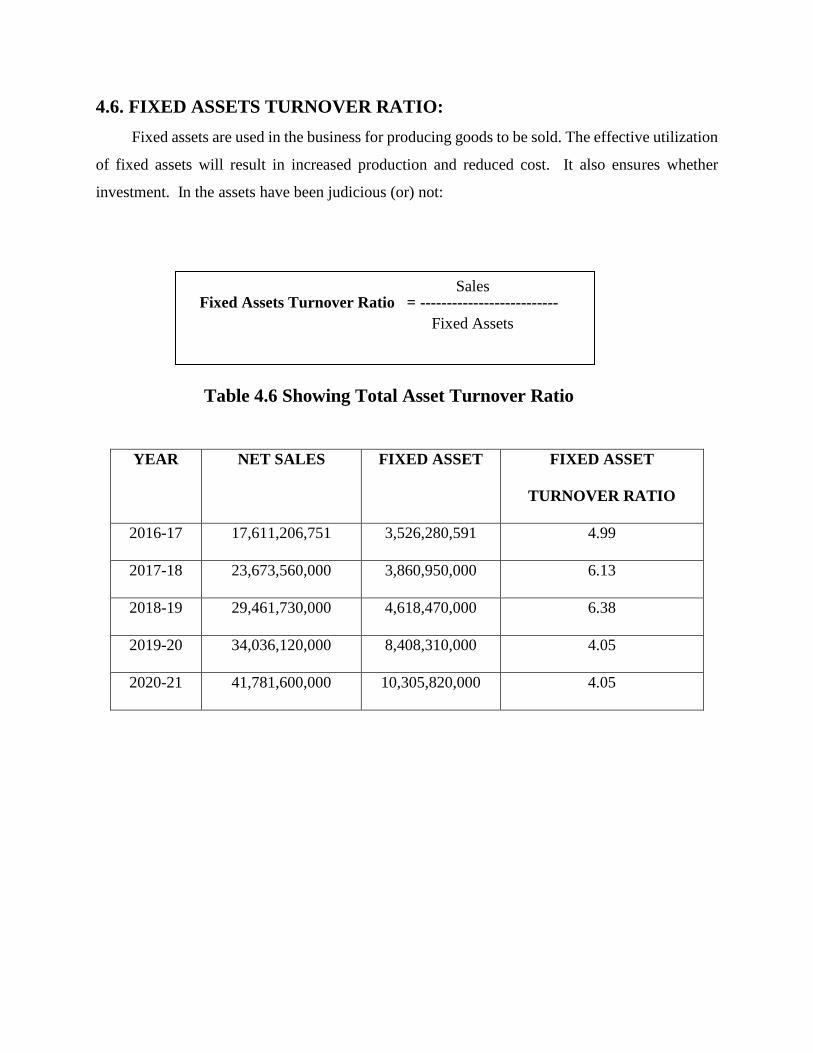
4.6. FIXED ASSETS TURNOVER RATIO:
Fixed assets are used in the business for producing goods to be sold. The effective utilization
of fixed assets will result in increased production and reduced cost. It also ensures whether
investment. In the assets have been judicious (or) not:
Fixed Assets Turnover Ratio = --------------------------
Table 4.6 Showing Total Asset Turnover Ratio
YEAR NET SALES FIXED ASSET FIXED ASSET
TURNOVER RATIO
2016-17 17,611,206,751 3,526,280,591 4.99
2017-18 23,673,560,000 3,860,950,000 6.13
2018-19 29,461,730,000 4,618,470,000 6.38
2019-20 34,036,120,000 8,408,310,000 4.05
2020-21 41,781,600,000 10,305,820,000 4.05
Sales
Fixed Assets
Graph 4.1.6
INTERPRETATION:
During the period 2016-2021, the Fixed Asset Turnover Ratio is in increasing trend up to 2018-19
and then it is decreasing up to 2020-21.
4.99
6.136.38
4.05 4.05
0
1
2
3
4
5
6
7
FIXED ASSET TURNOVER RATIO

STATEMENT SHOWING THE CHANGES IN NET WORKING CAPITAL
FOR THE ENDING 31-03-2017 (Rupees in lakhs)
INTERPRETATION:
During the period 2017, it has been found that the net working capital is increased by 807,875,458.
PARTICULARS
31-03-2016
31-03-2017
CHANGES IN
WORKING CAPITAL
INCREASR DECREASE
Current Assets:
Inventories
Sundry debtors
Cash and bank balance
Loans, Advances &
deposits
Total Current Assets (A)
Current Liabilities:
Liabilities
Provisions
Total Current Liabilities
(B)
Net Working Capital(A-
B)
Increase In Net
Working Capital
Total
2,175,723,575
2,422,954,714
624,672,429
1,087,277,467
2,846,966,302
3,056,623,935
402,084,121
1,112,996,116
671,242,727
633,669,221
222,588,308
25,718,649
262,497,038
37,687,793
807857458
6,310,628,185
7,418,670,474
1,656,390,120
1,534,466,352
1,918,887,158
1,572,154,145
3,190,856,472
3,491,041,303
3,119,771,713
807,857,458
3,927,629,171
3,927,629,171
3,927,629,171
1827685087
1827685087
STATEMENT SHOWING THE CHANGES IN NET
WORKING CAPITAL FOR THE ENDING 31-03-2018
(Rupees in lakhs)
INTERPRETATION:
During the period 2018, it has been found that the net working capital is increased by
1604.82(millions).
PARTICULARS
31-03-2017
31-03-2018
CHANGES IN
WORKING CAPITAL
INCREASR DECREASE
Current Assets:
Inventories
Trade receivables
Cash and bank balance
Loans, Advances &
deposits
Other current assets
Total Current Assets (A)
Current Liabilities:
Short-term borrowings
Trade payables
Other current liabilities
Short-term provisions
Total Current Liabilities
(B)
Net Working Capital(A-
B)
Increase In Net
Working Capital
Total
2,846.97
3,056.62
451.18
9,46.74
23.10
2,666.17
3,196.83
2,292.20
1,182.70
31.60
140.21
1841.02
235.96
8.50
144.06
165.29
180.8
156.63
592.89
1604.82
7,324.61
9,369.50
200.10
1,053.79
967.93
1,467.99
56.04
888.50
1,124.56
2,060.88
3,689.81
4,129.98
3634.80
1604.82
5239.62
5239.62
5239.62
2975.21
2975.21
STATEMENT SHOWING THE CHANGES IN NET
WORKING CAPITAL FOR THE ENDING 31-03-2019
(Rupees in lakhs)
INTERPRETATION: During the period 2019, it has been found that the net working capital is increased by
1540.63(millions).
PARTICULARS
31-03-2018
31-03-2019
CHANGES IN
WORKING CAPITAL
INCREASR DECREASE
Current Assets:
Inventories
Trade receivables
Cash and bank balances
Short term loans and
Advances
Other current assets
Total Current Assets (A)
Current Liabilities:
Short term borrowings
Trade Payables
Other current liabilities
Short-term Provisions
Total Current Liabilities
(B)
Net Working Capital(A-
B)
Increase In Net
Working Capital
Total
2,666.17
3,196.83
2,291.90
1,209.44
31.60
2,928.58
3,806.77
4,107.90
1,656.78
68.49
262.41
609.94
1,816.00
447.34
36.89
42.59
486.51
670.53
432.32
1540.63
9,395.94
12,568.52
56.04
876.33
1,136.73
2,060.88
98.63
1,362.84
1,807.26
2,493.20
4129.98
5176.93
5265.96
1540.63
6806.59
6806.59
6806.59
6806.59
6806.59

STATEMENT SHOWING THE CHANGES IN NET
WORKING CAPITAL FOR THE ENDING 31-03-2020
(Rupees in lakhs)
INTERPRETATION:
During the period 2020, it has been found that the net working capital is increased by 992.68
(millions).
PARTICULARS
31-03-2019
31-03-2020
CHANGES IN
WORKING CAPITAL
INCREASR DECREASE
Current Assets:
Inventories
Trade receivables
Cash and bank balances
Short term loans and
Advances
Other current assets
Total Current Assets (A)
Current Liabilities:
Short term borrowings
Trade Payables
Other current liabilities
Short-term Provisions
Total Current Liabilities
(B)
Net Working Capital(A-
B)
Increase In Net
Working Capital
Total
2,928.58
3,806.77
4,107.90
1,656.78
68.49
3,350.08
4,527.89
2,945.67
2,119.30
43.16
421.50
721.12
462.52
14.80
85.05
1162.23
25.33
349.42
325.53
992.68
12,568.52
12,986.10
98.63
1,362.84
1,807.26
2,493.20
83.83
1,277.79
2,156.68
2,818.73
5,761.93
6,337.03
6231.49
992.68
7224.17
7224.17
7224.17
2280.09
2280.09
STATEMENT SHOWING THE CHANGES IN NET WORKING CAPITAL
FOR THE ENDING 31-03-2021 (Rupees in lakhs)
INTERPRETATION:
During the period 2021, it has been found that the net working capital is increased by
777.58(millions).
PARTICULARS
31-03-2020
31-03-2021
CHANGES IN
WORKING CAPITAL
INCREASR(
Rs)
DECREASE(
Rs)
Current Assets:
Inventories
Trade receivables
Cash and bank balances
Short-term loans &
Advances
Other current assets
Total Current Assets (A)
Current Liabilities:
Short term borrowings
Trade Payables
Other current liabilities
Short-term Provisions
Total Current Liabilities
(B)
Net Working Capital(A-
B)
Increase In Net
Working Capital
Total
3,350.08
4,527.89
2,945.67
560.35
43.16
4,181.33
5,541.02
2,221.71
740.82
73.98
830.92
1013.13
180.47
30.82
83.83
64.06
723.96
243.01
459.01
777.58
11,427.15
12,758.86
83.83
1,277.79
2,156.68
1,259.78
1,520.80
2,615.69
1,195.72
4,778.08
5,332.21
6649.07
777.58
7426.65
7426.65
7426.65
7426.65
7426.65
CHAPTER-5
FINDINGS
SUGGESTIONS
CONCLUTION
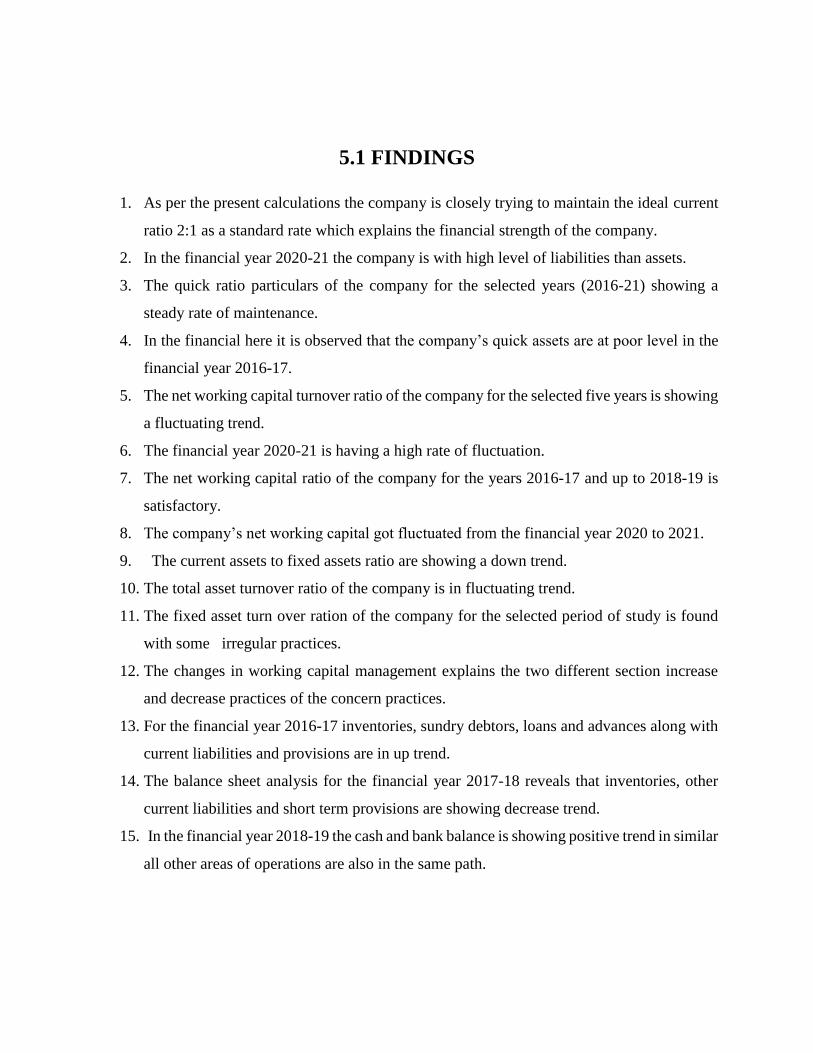
5.1 FINDINGS
1. As per the present calculations the company is closely trying to maintain the ideal current
ratio 2:1 as a standard rate which explains the financial strength of the company.
2. In the financial year 2020-21 the company is with high level of liabilities than assets.
3. The quick ratio particulars of the company for the selected years (2016-21) showing a
steady rate of maintenance.
4. In the financial here it is observed that the company’s quick assets are at poor level in the
financial year 2016-17.
5. The net working capital turnover ratio of the company for the selected five years is showing
a fluctuating trend.
6. The financial year 2020-21 is having a high rate of fluctuation.
7. The net working capital ratio of the company for the years 2016-17 and up to 2018-19 is
satisfactory.
8. The company’s net working capital got fluctuated from the financial year 2020 to 2021.
9. The current assets to fixed assets ratio are showing a down trend.
10. The total asset turnover ratio of the company is in fluctuating trend.
11. The fixed asset turn over ration of the company for the selected period of study is found
with some irregular practices.
12. The changes in working capital management explains the two different section increase
and decrease practices of the concern practices.
13. For the financial year 2016-17 inventories, sundry debtors, loans and advances along with
current liabilities and provisions are in up trend.
14. The balance sheet analysis for the financial year 2017-18 reveals that inventories, other
current liabilities and short term provisions are showing decrease trend.
15. In the financial year 2018-19 the cash and bank balance is showing positive trend in similar
all other areas of operations are also in the same path.
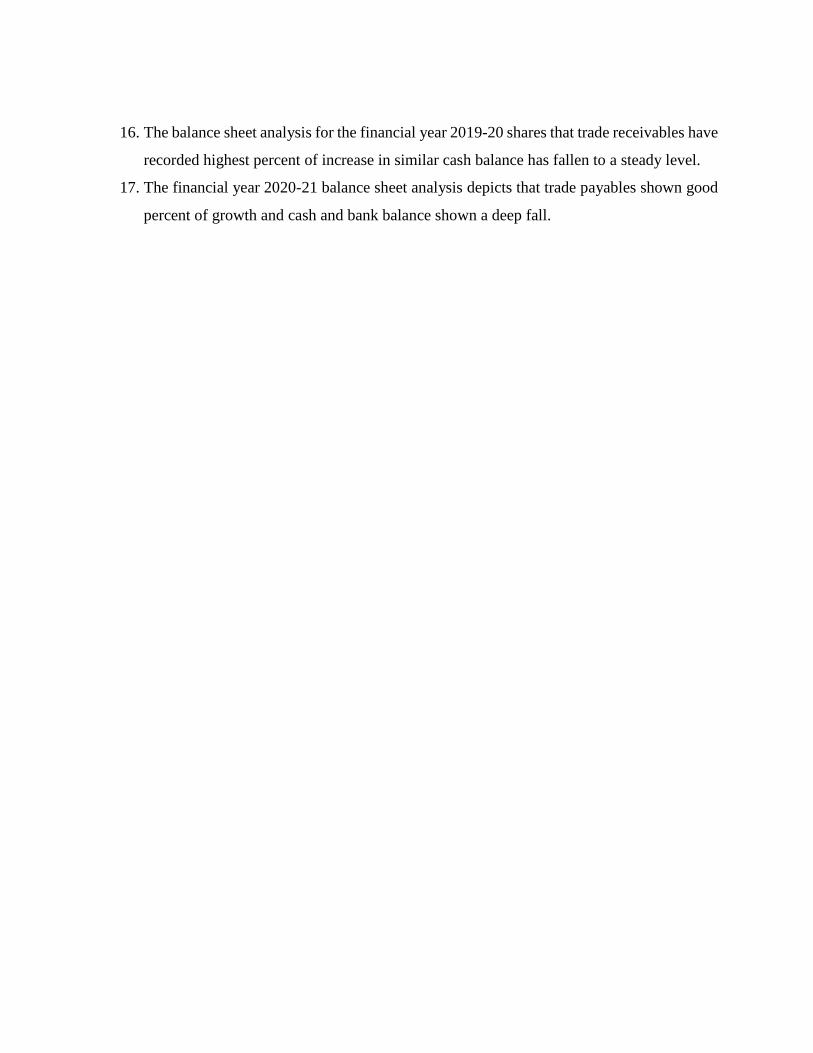
16. The balance sheet analysis for the financial year 2019-20 shares that trade receivables have
recorded highest percent of increase in similar cash balance has fallen to a steady level.
17. The financial year 2020-21 balance sheet analysis depicts that trade payables shown good
percent of growth and cash and bank balance shown a deep fall.
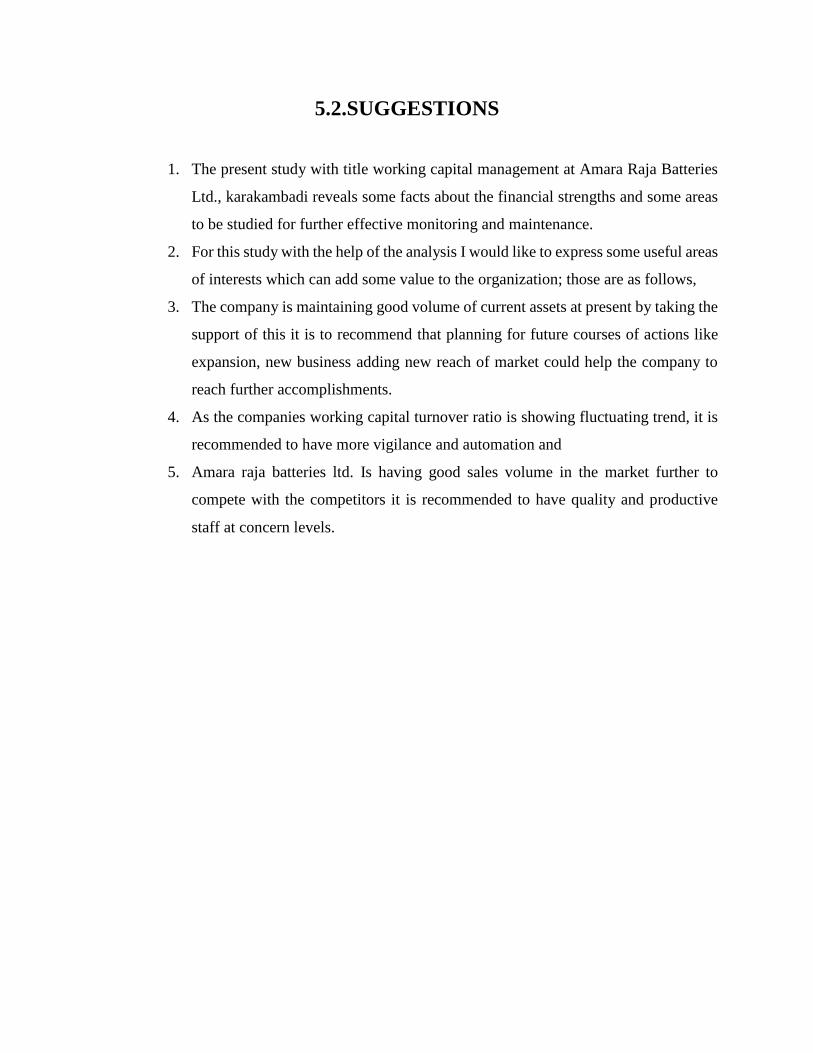
5.2.SUGGESTIONS
1. The present study with title working capital management at Amara Raja Batteries
Ltd., karakambadi reveals some facts about the financial strengths and some areas
to be studied for further effective monitoring and maintenance.
2. For this study with the help of the analysis I would like to express some useful areas
of interests which can add some value to the organization; those are as follows,
3. The company is maintaining good volume of current assets at present by taking the
support of this it is to recommend that planning for future courses of actions like
expansion, new business adding new reach of market could help the company to
reach further accomplishments.
4. As the companies working capital turnover ratio is showing fluctuating trend, it is
recommended to have more vigilance and automation and
5. Amara raja batteries ltd. Is having good sales volume in the market further to
compete with the competitors it is recommended to have quality and productive
staff at concern levels.
5.3 CONCLUSION
The present study on working capital management at Amara raja batteries ltd. Which has its own
parameters of carrot and stick expresses that, the working capital performance position of the
company is satisfactory.
ANNEXTURE
Profit and Loss Account for the year ended March 31, 2020.
(Amount in Rupees)
Particulars Year Ended 31-03-2020
Year Ended 31-03-2019
INCOME
Sales – Gross 26,057,500,000 19,443,140,000
Less: Excise duty Collected 2,383,940,000 1,832,610,000
Net Sales 23,673,560,000 17,610,530,000
Other Income 151,850,000 77,760,000
TOTAL 23,825,410,000 17,688,290,000
EXPENDITURE
Cost of material consumed 14,993,380,000 11,787,140,000
Purchase of stock in trade 840,020,000 74,140,000
Change in inventories of finished product, work-
in-process and stock in trade 121,690,000 283,140,000
Employee benefits expenses 1,002,640,000 884,590,000
Finance cost 40,590,000 30,580,000
Depreciation and amortization 464,730,000 417,120,000
Other expenses 3,175,910,000 2,574,040,000
TOTAL 20,638,960,000 15,484,470,000
Profit Before Taxation 3,186,450,000 2,203,820,000
Less Tax expenses
Current ax 1,030,210,000 731,390,000
Deferred tax(income)/expenses 14,670,000 11,420,000
Earlier years(excess)/short provision 9,060,000 2,890,000
Profit for the year 2,150,630,000 1,480,960,000
Basic Earnings Per Equity Share 25.18 17.34
BALANCE SHEET as at March 31, 2020
(Amount in Rupees)
Particulars As at 31-03-2021 As at 31-03-2020
SOURCES OF FUNDS
Shareholders' Funds
Share capital 170,810,000 170,810,000
Reserves and surplus 8,063,880,000 6,288,460,000
8,234,690,000 6,459,270,000
Noncurrent liabilities
Long term borrowings 784,720,000 701,020,000
Deferred tax liabilities 219,600,000 204,930,000
Long term provisions 146,180,000 104,170,000
1,150,500,000 1,010,120,000
Current liabilities
Short term borrowings 56,040,000 200,100,000
Trade payables 888,500.000 1,053,790,000
Other current liabilities 1,124,560,000 967,930,000
Short term provisions 2,060,880,000 1,467,990,000
4,129,980,000 3,689,810,000
Total 13,515,170,000 11,159,200,000
Assets
Noncurrent assets
Fixed asset
Tangible asset 3,524,800,000 3,132,810,000
Intangible asset 20,920,000 18,060,000
Capital work in process 310,650,000 369,570,000
3,860,950,000 3,526,280,000
Noncurrent investment 160,760,000 160,760,000
Long term loans and
advances
122,850,000 145,180,000
Other noncurrent assets 1,110,000 2,370,000
4,145,670,000 3,834,590,000
Current assets
Inventories 2,666,170,000 2,846,970,000
Trade receivables 3,196,830,000 3,056,620,000
Cash and bank balance 2,292,200,000 451,180,000
Short term loans and
advances
1,182,700,000 946,740,0000
Other current assets 31,600,000 23,100,000
9,369,500,000 7,324,610,000
Total 13,515,170,000 11,159,200,000
Profit and Loss Account for the year ended March 31, 2020
(Amount in Rupees)
BALANCE SHEETas at March 31, 2019
Particulars Year Ended
31-03-21
Year Ended
31-03-2020
INCOME
Sales of product 32,957,450,000 25,978,360,000
Less: Excise duty Collected 3,495,720,000 2,383,940,000
Net Sales 29,461,730,000 23,594,420,000
Sale of Services 137,020,000 38,960,000
Other operating revenue 15,210,000 11,300,000
Net revenue from operations 29,613,960,000 23,644,680,000
Other income 465,510,000 279,710,000
TOTAL 30,079,470,000 23,924,390,000
EXPENDITURE
Cost of material consumed 17,638,940,000 15,132,080,000
Purchase of stock in trade 2,632,540,000 840,020,000
Change in inventories of finished product, work-
in-process and stock in trade 320,890,000 98,150,000
Employee benefits expenses 1,266,230,000 1,002,640,000
Finance cost 9,980,000 24,470,000
Depreciation and amortization 660,920,000 464,730,000
Other expenses 3,882,010,000 3,175,850,000
TOTAL 25,769,730,000 20,737,940,000
Profit Before Taxation 4,309,740,000 3,186,450,000
Less Exceptional items 91,570,000 -
Less Tax expenses
Current ax 1,377,970,000 1,030,210,000
Deferred tax(income)/expenses 24,510,000 14,670,000
Earlier years(excess)/short provision 2,340,000 9,060,000
Profit for the year 2,867,050,000 2,150,630,000
Basic Earnings Per Equity Share 16.78 12.59
(Amount in Rupees)
Particulars As at 31-03-2019 As at 31-03-2018
SOURCES OF FUNDS
Shareholders' Funds Share capital 170,810,000 170,810,000 Reserves and surplus 10,427,330,000 8,063,880,000
10,598,140,000 8,234,690,000
Noncurrent liabilities Long term borrowings 773,130,000 784,720,000
Deferred tax liabilities 195,090,000 219,600,000 Long term provisions 376,410,000 146,180,000
1,334,630,000 1,150,500,000
Current liabilities Short term borrowings 98,630,000 56,040,000
Trade payables 1,362,840,000 876,330,000 Other current liabilities 1,807,260,000 1,136,730,000 Short term provisions 2,493,200,000 2,060,880,000
1,888,508,475 1,568,304,581
5,761,930,000 4,129,980,000
Total 17,704,700,000 13,515,170,00
Assets Noncurrent assets
Fixed asset
Tangible asset 3,554,970,000 3,524,800,000
Intangible asset 33,690,000 20,920,000
Capital work in process 1,024,970,000 310,650,000 Intangible asset under development 4,840,0000 4,580,000
4,618,470,000 3,860,950,000 Noncurrent investment 160,760,000 160,760,000 Long term loans and advances 353,520,000 96,410,000
Other noncurrent assets 3,430,000 1,110,000
5,136,180,000 4,119,230,000
Current assets Inventories 2,928,580,000 2,666,170,000 Trade receivables 3,806,770,000 3,196,830,000
Cash and bank balance 4,107,900,000 2,291,900,000
Short term loans and advances 1,656,780,000 1,209,440,000
Other current assets 68,490,000 31,600,000
12,568,520,000 9,395,940,000
Total 17,704,700,000 13,515,170,00
Profit and Loss Account for the year ended March 31, 2019.
(Amount in Rupees)
Particulars Year Ended 31-03-2019
Year Ended 31-03-2018
INCOME
Sales of product 38,041,270,000 32,949,370,000
Less: Excise duty Collected 4,005,150,000 3,512,450,000
Net Sales 34,036,120,000 29,436,920,000
Sale of Services 309,320,000 137,020,000
Other operating revenue 21,150,000 15,210,000
Net revenue from operations 34,366,590,000 29,589,150,000
Other income 455,140,000 465,510,000
TOTAL 34,821,730,000 30,054,660,000
EXPENDITURE
Cost of material consumed 21,011,950,000 17,603,120,000
Purchase of stock in trade 2,113,690,000 2,632,540,000
Change in inventories of finished product,
work-in-process and stock in trade ( 292,100,000) (320,890,000)
Employee benefits expenses 1,583,160,000 1,262,300,000
Finance cost 7,180,000 2,690,000
Depreciation and amortization
expenses[includes impairment loss of Rs
nil(pay Rs 75.52 million)]
645,710,000 660,920,000
Other expenses 4,346,600,000 3,904,240,000
TOTAL 29,416,190,000 25,744,920,000
Profit Before Exceptional Items And Tax 5,405,540,000 4,309,740,000
Less: Exceptional items(net) 38,840,000 91,570,000
Profit before tax 5,366,700,000 4,218,170,000
Less : Tax expense - -
Current Tax 1,580,000,000 1,377,970,000
Deferred Tax(credit)/expense 106,230,000 (24,510,000)
Earlier years (excess)/short
provision 6,110,000 (2,340,000)
Profit for the year 3,674,360,000 2,867,050,000
Basic and diluted earnings per equity share of
Rs 1 each 21.51 16.78
BALANCE SHEET as at March 31, 2019.
(Amount in Rupees)
Particulars As at 31-03-2020 As at 31-03-2019
SOURCES OF FUNDS
Shareholders' Funds
Share capital 170,810,000 170,810,000
Reserves and surplus 13,456,000,000 10,427,000,000
13,627,000,000 10,598,000,000
Non-Current Liabilities
Long-term borrowings 759,470,000 773,130,000
Long-term provisions 369,570,000 376,410,000
Deferred tax liability 301,330,000 195,090,000
1,430,370,000 1,344,630,000
Current Liabilities
Short-term borrowings 83,830,000 98,630,000
Trade payables 1,277,790,000 1,362,840,000
Other current liabilities 2,156,680,000 1,807,260,000
Short-term provisions 2,818,730,000 2,493,200,000
6,337,030,000 5,761,930,000
TOTAL 21,394,410,000 17,704,700,000
Assets
Fixed assets
Current Investments 7,678,640,000 4,618,470,000
Non- Current Investments 160,760,000 160,760,000
Long-term loans and
advances
567,690,000 353,520,000
8,408,310,000 5,136,180,000
Current assets
Inventories 3,350,080,000 2,928,580,000
Trades receivables 4,527,890,000 3,806,770,000
Cash and bank balances 2,945,670,000 4,107,900,000
Short-term loans and
advances
2,119,300,000 1,656,780,000
Other current assets 43,160,000 68,490,000
12,986,100,000 12,568,520,000
TOTAL 21,394,410,000 17,704,700,000
Profit and Loss Account for the year ended March 31, 2020.
(Amount in Rupees)
Particulars Year Ended 31-03-2020
Year Ended 31-03-2019
INCOME
Sales of product 46,039,980,000 38,041,270,000
Less: Excise duty Collected 4,258,380,000 4,005,150,000
Net Sales 41,781,600,000 34,036,120,000
Sale of Services 314,840,000 309,320,000
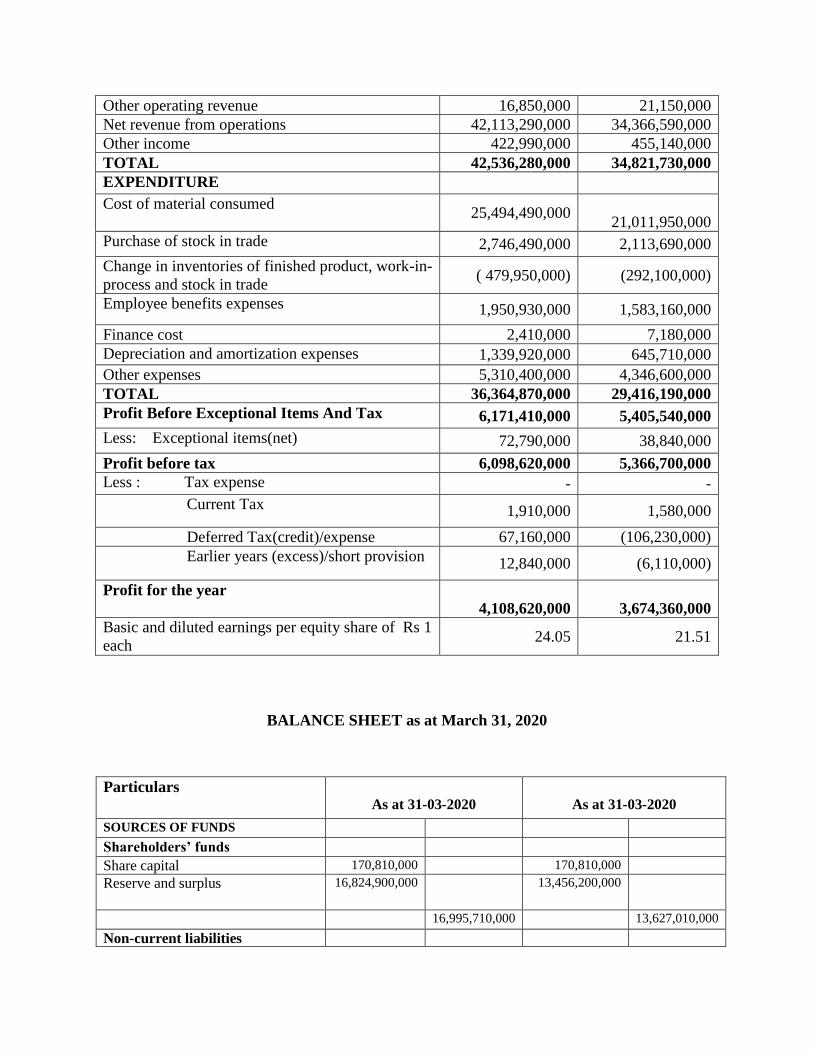
Other operating revenue 16,850,000 21,150,000
Net revenue from operations 42,113,290,000 34,366,590,000
Other income 422,990,000 455,140,000
TOTAL 42,536,280,000 34,821,730,000
EXPENDITURE
Cost of material consumed 25,494,490,000
21,011,950,000
Purchase of stock in trade 2,746,490,000 2,113,690,000
Change in inventories of finished product, work-in-
process and stock in trade ( 479,950,000) (292,100,000)
Employee benefits expenses 1,950,930,000 1,583,160,000
Finance cost 2,410,000 7,180,000
Depreciation and amortization expenses 1,339,920,000 645,710,000
Other expenses 5,310,400,000 4,346,600,000
TOTAL 36,364,870,000 29,416,190,000
Profit Before Exceptional Items And Tax 6,171,410,000 5,405,540,000
Less: Exceptional items(net) 72,790,000 38,840,000
Profit before tax 6,098,620,000 5,366,700,000
Less : Tax expense - -
Current Tax 1,910,000 1,580,000
Deferred Tax(credit)/expense 67,160,000 (106,230,000)
Earlier years (excess)/short provision 12,840,000 (6,110,000)
Profit for the year
4,108,620,000
3,674,360,000
Basic and diluted earnings per equity share of Rs 1
each 24.05 21.51
BALANCE SHEET as at March 31, 2020
Particulars
As at 31-03-2020
As at 31-03-2020
SOURCES OF FUNDS Shareholders’ funds Share capital 170,810,000 170,810,000
Reserve and surplus
16,824,900,000 13,456,200,000
16,995,710,000 13,627,010,000
Non-current liabilities
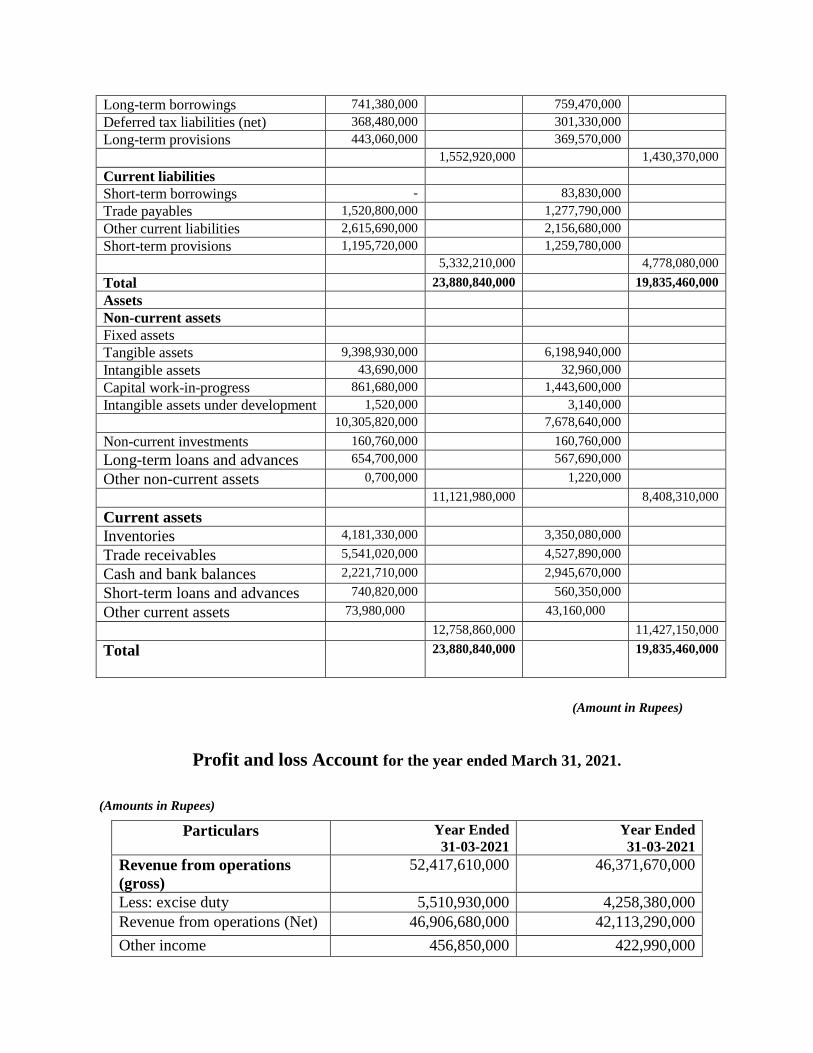
(Amount in Rupees)
Profit and loss Account for the year ended March 31, 2021.
(Amounts in Rupees)
Particulars Year Ended 31-03-2021
Year Ended 31-03-2021
Revenue from operations
(gross)
52,417,610,000 46,371,670,000
Less: excise duty 5,510,930,000 4,258,380,000
Revenue from operations (Net) 46,906,680,000 42,113,290,000
Other income 456,850,000 422,990,000
Long-term borrowings 741,380,000 759,470,000
Deferred tax liabilities (net) 368,480,000 301,330,000
Long-term provisions 443,060,000 369,570,000
1,552,920,000 1,430,370,000
Current liabilities
Short-term borrowings - 83,830,000
Trade payables 1,520,800,000 1,277,790,000
Other current liabilities 2,615,690,000 2,156,680,000
Short-term provisions 1,195,720,000 1,259,780,000
5,332,210,000 4,778,080,000
Total 23,880,840,000 19,835,460,000
Assets
Non-current assets
Fixed assets
Tangible assets 9,398,930,000 6,198,940,000
Intangible assets 43,690,000 32,960,000
Capital work-in-progress 861,680,000 1,443,600,000
Intangible assets under development 1,520,000 3,140,000
10,305,820,000 7,678,640,000
Non-current investments 160,760,000 160,760,000
Long-term loans and advances 654,700,000 567,690,000
Other non-current assets 0,700,000 1,220,000
11,121,980,000 8,408,310,000
Current assets
Inventories 4,181,330,000 3,350,080,000
Trade receivables 5,541,020,000 4,527,890,000
Cash and bank balances 2,221,710,000 2,945,670,000
Short-term loans and advances 740,820,000 560,350,000
Other current assets 73,980,000 43,160,000
12,758,860,000 11,427,150,000
Total
23,880,840,000 19,835,460,000
Total Revenue 47,363,530,000 42,536,280,000
Expenses
Cost of materials consumed 27,421,380,000 25,494,670,000
Purchase of stock – in- trade
(Traded goods)
3,254,510,000 2,746,490,000
Changes in inventories of
finished goods, Work-in-
progress and stock-in-trade
(1,031,200,000) (479,950,000)
Employee benefits expense 2,430,020,000 1,950,930,000
Finance costs(int) 4,850,000 2,410,000
Depreciation and amortization
expense
1,398,670,000 1,339,920,000
Other expenses 6,663,370,000 5,383,190,000
Total Expenses 40,141,600,000 36,437,660,000
Profit before tax 7,221,930,000 6,098,620,000
Tax expense
Current tax expense 2,115,000,000 1,910,000,000
Taxation of earlier years (7,440,000) 12,840,000
Deferred tax 219,920,000 67,160,000
Net tax Expense 2,327,480,000 1,990,000,000
Profit for the year 4,894,450,000 4,108,620,000
Earnings per share (of Rs,1/-
each)
Basic and diluted( Rs.) 28.65 24.05
BALANCE SHEET As at March 31, 2021
(Amount in Rupees)
Particulars As at 31-03-2021 As at 31-03-2021
Equity & Liabilities
Share holders funds
Share capital 170,810,000 170,810,000
Reserves and surplus 20,845,610,000 16,824,900,000
21,016,420,000 16,995,710,000
Non-current liabilities
Long-term borrowings 724,720,000 741,380,000
6.3 BIBLIOGRAPHY
M. Pandey (2005), Financial Management “, Ninth Edition, Vikas Publishing House Pvt
ltd.
Deferred tax liabilities(Net) 588,400,000 368,480,000
Long term provisions 460,150,000 443,060,000
1,773,270,000 1,552,920,000
Current liabilities
Trade payables
Total outstanding dues of Micro &
Small enterprises
14,420,000 6,940,000
Total outstanding Dues of creditors
other than Micro & Small Enterprises
3,286,210,000 2,602,140,000
Other current liabilities 2,470,550,000 1,509,430,000
Short-term provisions 522,410,000 1,195,720,000
6,293,590,000 5,314,230,000
TOTAL 29,083,280,000 23,862,860,000
ASSETS
Non currents assets
Fixed assets
Tangible assets 13,122,660,000 9,398,930,000
In-tangible assets 40,630,000 430,690,000
Capital work-in –Progress 1,197,420,000 861,680,000
In-tangible assets under developments 1,720,000 1,520,000
14,362,430,000 10,305,820,000
Non-current Investments 160,760,000 160,760,000
Long term loans & advances 479,280,000 701,700,000
15,002,470,000 11,168,280,000
Current Assets
Inventories 6,016,480,000 4,181,330,000
Trade receivables 5,921,460,000 5,541,020,000
Cash & cash equivalents 1,502,580,000 2,221,710,000
Short term loans & advances 527,750,000 660,810,000
Other current assets 112,540,000 89,710,000
14,080,810,000 12,694,580,000
TOTAL 29,083,280,000 23,862,860,000
S. N. Maheswari (2006), “Financial and Management Accounting”, Fifth Edition, Sulthan
Chand and Sons, New Delhi.
C. R. Kothari, Reaseach Methodology and Techniques”, Second Edition, New Agency
International Private Limited.
WEBSITES
www.amararaja.com
www.arbl.com
www.amararajabatteries.com
www.google.com
www.wikipedia.com
www.ercap.org
www.wikipedia.com
www.nwda,gov.in
8%SIMILARITY INDEX
%INTERNET SOURCES
8%PUBLICATIONS
%STUDENT PAPERS
1 1%
2 1%
3 1%
4 1%
Working Capital ManagementORIGINALITY REPORT
PRIMARY SOURCES
Arunkumar O. N., Divya D., Tony Mathew."Goal Programming Model for OptimizingWorking Capital Management: Case of TireRetreading Company", Journal of Operationsand Strategic Planning, 2018Publication
Adediran A. Samson, Josiah Mary, Bosun-Fakunle Yemisi, Imuzeze Obehi Erekpitan."The Impact of Working Capital Managementon the Profitability of Small and Medium ScaleEnterprises in Nigeria", Research Journal ofBusiness Management, 2012Publication
Seda Süer. "chapter 11 Relationship BetweenWorking Capital Management and SupplyChain Management", IGI Global, 2019Publication
Hans-Arthur Vogel. "Managing the financialperformance", Elsevier BV, 2019Publication