Progressive Teaching Improvement For Small Scale Learning
15
future internet Article Progressive Teaching Improvement For Small Scale Learning: A Case Study in China Bo Jiang 1, * , Yanbai He 2 , Rui Chen 3 , Chuanyan Hao 1 , Sijiang Liu 1 and Gangyao Zhang 1, * 1 School of Educational Science and Technology, Nanjing University of Posts and Telecommunications, Nanjing 210023, China; [email protected] (C.H.); [email protected] (S.L.) 2 School of Computer Science, Nanjing University of Posts and Telecommunications, Nanjing 210023, China; [email protected] 3 School of Overseas Education, Nanjing University of Posts and Telecommunications, Nanjing 210023, China; [email protected] * Correspondence: [email protected] (B.J.); [email protected] (G.Z.) Received: 16 July 2020; Accepted: 15 August 2020; Published: 17 August 2020 Abstract: Learning data feedback and analysis have been widely investigated in all aspects of education, especially for large scale remote learning scenario like Massive Open Online Courses (MOOCs) data analysis. On-site teaching and learning still remains the mainstream form for most teachers and students, and learning data analysis for such small scale scenario is rarely studied. In this work, we first develop a novel user interface to progressively collect students’ feedback after each class of a course with WeChat mini program inspired by the evaluation mechanism of most popular shopping website. Collected data are then visualized to teachers and pre-processed. We also propose a novel artificial neural network model to conduct a progressive study performance prediction. These prediction results are reported to teachers for next-class and further teaching improvement. Experimental results show that the proposed neural network model outperforms other state-of-the-art machine learning methods and reaches a precision value of 74.05% on a 3-class classifying task at the end of the term. Keywords: teaching improvement; student learning feedback; small scale dataset; multi-class classification; WeChat mini program; artificial neural network (ANN) 1. Introduction One of the targets of educational scientists is to develop a high-quality education that is intimately linked with sustainable development goals. By virtue of high dropout and low academic success rate in education, learning data analysis has received significant attention in recent years, especially for large scale remote learning scenarios like Massive Open Online Courses (MOOCs). Those researches tend to focus on education resource prediction [1], aiming to keep a track of students’ learning activities to make predictions and recommendations for online platforms. However, there are rare studies on small-scale learning data analysis, especially for on-site teaching and learning. Recently in China, the usage of internet-driven learning platforms has an exponential increment due to the corona virus outbreak. However, the teachers and students just make use of instant chatting services to continue their teaching and learning online, essentially the same as on-site form which illustrates the high significance of small-scale learning data analysis. Although the dropout rate of traditional classes is 10–20% lower than online courses, the analysis of small-scale learning data for on-site education institutions and organizations should not be ignored [2]. Currently in China, with the purpose of improving curriculum teaching quality, students in most universities are required to make evaluations for all courses of this semester with very limited time available at the end of each term. Students tend to finish the evaluation arbitrarily and casually due to Future Internet 2020, 12, 137; doi:10.3390/fi12080137 www.mdpi.com/journal/futureinternet
-
Upload
khangminh22 -
Category
Documents
-
view
1 -
download
0
Transcript of Progressive Teaching Improvement For Small Scale Learning

future internet
Article
Progressive Teaching Improvement For Small ScaleLearning: A Case Study in China
Bo Jiang 1,* , Yanbai He 2, Rui Chen 3, Chuanyan Hao 1, Sijiang Liu 1 and Gangyao Zhang 1,*1 School of Educational Science and Technology, Nanjing University of Posts and Telecommunications,
Nanjing 210023, China; [email protected] (C.H.); [email protected] (S.L.)2 School of Computer Science, Nanjing University of Posts and Telecommunications, Nanjing 210023, China;
[email protected] School of Overseas Education, Nanjing University of Posts and Telecommunications, Nanjing 210023, China;
[email protected]* Correspondence: [email protected] (B.J.); [email protected] (G.Z.)
Received: 16 July 2020; Accepted: 15 August 2020; Published: 17 August 2020
Abstract: Learning data feedback and analysis have been widely investigated in all aspects ofeducation, especially for large scale remote learning scenario like Massive Open Online Courses(MOOCs) data analysis. On-site teaching and learning still remains the mainstream form for mostteachers and students, and learning data analysis for such small scale scenario is rarely studied.In this work, we first develop a novel user interface to progressively collect students’ feedbackafter each class of a course with WeChat mini program inspired by the evaluation mechanism ofmost popular shopping website. Collected data are then visualized to teachers and pre-processed.We also propose a novel artificial neural network model to conduct a progressive study performanceprediction. These prediction results are reported to teachers for next-class and further teachingimprovement. Experimental results show that the proposed neural network model outperformsother state-of-the-art machine learning methods and reaches a precision value of 74.05% on a 3-classclassifying task at the end of the term.
Keywords: teaching improvement; student learning feedback; small scale dataset; multi-classclassification; WeChat mini program; artificial neural network (ANN)
1. Introduction
One of the targets of educational scientists is to develop a high-quality education that is intimatelylinked with sustainable development goals. By virtue of high dropout and low academic success rate ineducation, learning data analysis has received significant attention in recent years, especially for largescale remote learning scenarios like Massive Open Online Courses (MOOCs). Those researches tendto focus on education resource prediction [1], aiming to keep a track of students’ learning activitiesto make predictions and recommendations for online platforms. However, there are rare studies onsmall-scale learning data analysis, especially for on-site teaching and learning. Recently in China,the usage of internet-driven learning platforms has an exponential increment due to the corona virusoutbreak. However, the teachers and students just make use of instant chatting services to continuetheir teaching and learning online, essentially the same as on-site form which illustrates the highsignificance of small-scale learning data analysis. Although the dropout rate of traditional classesis 10–20% lower than online courses, the analysis of small-scale learning data for on-site educationinstitutions and organizations should not be ignored [2].
Currently in China, with the purpose of improving curriculum teaching quality, students in mostuniversities are required to make evaluations for all courses of this semester with very limited timeavailable at the end of each term. Students tend to finish the evaluation arbitrarily and casually due to
Future Internet 2020, 12, 137; doi:10.3390/fi12080137 www.mdpi.com/journal/futureinternet

Future Internet 2020, 12, 137 2 of 15
the boring repeated procedure, which results in inaccurate feedback from students and difficulties inhelping courses improvement. However, Data Mining (DM) approaches for MOOCs are incapableto address small-scale problems. Thus, this paper focuses on progressive learning feedback andanalysis on a case study in China, i.e., a Data Structure course during the 2019 Summer semester fromSchool of Educational Science and Technology, Nanjing University of Posts and Telecommunications.In this study, students could give satisfaction feedback instantly after each class with a convenientand time-saving manner. Consequently, the objective of this study is to address the problems asfollows: (1) How could instructors have direct knowledge of learners via their feedback data and makerelatively necessary interventions? (2) What kind of algorithm could perform well in small-scale dataprocessing and how to implement it? (3) What positive influences will this study bring for futureeducation development? The conceptual graph of this study is demonstrated in Figure 1.
Figure 1. The conceptual graph of this study.
Compared with small-scale learning such as on-site education, the data of massive online learners isrelatively convenient to collect from the virtual learning environments (VLEs) and learning managementsystems. Nevertheless, the collection of such dataset has also several inevitable limitations. For instance,scientists have no access to some dataset due to privacy issues, e.g. online-course platforms rejectedto publish users’ data due to confidentiality and privacy issues in the work done by Dalipi et al. [3].May et al. [4] also proved that promising absolute privacy, confidentiality, and anonymity are impractical.For small scale on-site education, however, the aforementioned limitations are mostly nonexistent becauselearning data are collected by teachers or universities only for the purpose of course improvement.In this paper, an innovative approach is proposed for students to submit their feedback after eachclass instantly and conveniently. Inspired by the evaluation mechanism of electronic business websites,where consumers are allowed to give a piece of evaluation to elaborate their feedback of the shoppingexperience after every deal, the proposed method develop a WeChat mini program with a novel userinterface to gather students’ feedback after each class. Students have no need to visit websites viabrowsers on computers for feedback, but taking survey in WeChat mini program via the smartphone.Furthermore, all the collected data applied in data analysis will be anonymized, protecting the privacy,confidentiality, and anonymity of students’ information.
To summarize, the main contributions of this study are as follows:
• An innovative learning feedback mechanism via widely used WeChat mini program in China,conveniently making a collection of students’ evaluations and suggestions after each class.
• A novel artificial neural network model customized to small quantity of learning data, predictingstudents’ final academic performance progressively. These predictions are then indirectlyinstructing teachers to give specific advice for diverse students and improve teaching.

Future Internet 2020, 12, 137 3 of 15
• A comprehensive comparison with other state-of-the-art machine learning methods.
The rest of the paper is organized as follows: Section 2 briefly reviews the most relevant work toours. Section 3 sheds light on the methods of course evaluation data collection, data pre-processing,and neural network model adopted. Section 4 elaborates upon the experiments and discussions aboutdata analysis and visualization, experimental results, and comparisons with other state-of-the-artmachine learning methods. Finally, we illustrate the conclusion of this paper and future work inSection 5.
2. Related Work
2.1. Educational Data Mining
Data Mining (DM) is a technique mainly targeted at analyzing gathered data. It refers to aprocedure of discovering hidden information from a large amount of data through some algorithm [5].The information and knowledge obtained via DM can be widely used for strengthening the decisionmaking procedure [6]. By using various algorithms, DM tends to build data patterns [7], which hasbeen proved to be important for fields like education, network security, and business [8–10].
Recently, a sub-field called Educational Data Mining (EDM) has emerged for the analysis andprocess of educational data. Traditional DM methods show great performance in EDM. To promotestudents’ performance [11] and polish study and instruction behavior [6], scientists design personalizedlearning and course recommendations for students. EDM often makes use of the students’ performancedata, administrative data, and activity data [12], most of which come from web-based learningenvironments. Romero et al. [13] carried out a survey in 2007, which was further improved in 2010 and2013, to provide comprehensive resources for studies in EDM. These studies show that DM techniqueslike classification, clustering, and text mining are widely used in educational institutions. With therapid evolution of machine learning techniques, there has been a proliferation of research in EDMusing Deep Learning (DL) architectures, firstly introduced in 2015.
2.2. Student Performance Prediction
Technology-enhanced learning platforms have provided teachers with sufficient students’behavior data, and allow them to study students’ performance [14,15] and optimize the learningenvironment [16].
Various machine learning models have shown great ability to analyze students’ interaction andmake predictions on students at risk of failure. Decision Tree is widely used in many academicperformance prediction tasks [17]. Ahmed et al. [18] applied ID3 model for predicting the final gradeof students. Hussain et al. [19] adopted Gradient Boosting Decision Tree to identify students who havefewer engagements in VLE. Logistic Regression is another extensively used approach for learning dataanalysis. Marbouti et al. [20] adopted Logistic Regression to identify students’ outcomes in advance ofthe course by incorporating attributes like their attendances and assessment behavior. They achievedbetter predictive performance for the last few weeks. Moreover, Logistic Regression was often utilizedas the baseline model to evaluate student performance [21]. Leitner et al. [22] show history informationlike entry tests of students and grades in previous courses can help the model classify an individual’soutcome.
Deep learning technique is a branch of machine learning, and outbreaks in recent years, especiallyin image understanding and Natural Language Processing (NLP). It also has promising consequencesin EDM tasks, e.g., predicting and classifying the performance of successful and at-risk students.Deep learning models contain multiple layers. Each layer tries to extract more abstract informationand sends it to the next layer, trying to model the complex representation of the input data [23].De Albuquerque et al. [24] applied artificial neural networks (ANNs) to identify the outcome ofstudents and achieved very high accuracy (85%). Corrigan et al. [25] deployed Long Short Term

Future Internet 2020, 12, 137 4 of 15
Memory (LSTM) model to assess the performance of participants based on interactive activities ofstudents with the VLE. Although the traditional baseline approaches are outperformed, a large numberof data are needed to feed into the deep learning model for training, which is not feasible for commonon-site learning.
2.3. Text Analysis
Human languages can be analyzed and understood by NLP algorithms. Sentiment analysisintends to parse sentiment from textual information and extract their polarity and viewpoint [26].Singla et al. [27] proposed a method to analyze the Amazon mobile phone reviews, which arecategorized into negative and positive polarity. They used SVM to classify sentiments and achieved anaccuracy of 84.9%. Zhao et al. [28] applied Weakly-Supervised Deep Embedding-LSTM for extractingfeatures from review text. This model obtained an accuracy of 87.9% on the Amazon dataset.An unsupervised attention model was proposed by He et al. [29] for sentiment analysis, using attentionto remove words that are irrelevant from the sentiment. Wang et al. [30] employed attentional-graphneural networks for Twitter sentiment analysis.
Similar to word embedding [31], sentence embedding is adopted to encode the semantic meaningof a sentence into a feature vector. Kiros et al. [32] proposed an unsupervised sentence embeddingmethod using two separate decoders to reconstruct the surrounding sentence from the surroundedone. Utilizing the capability of LSTM to capture long-distance dependency, Palangi et al. [33]used RNN with LSTM cells for modeling sentences. The LSTM-RNN model generates semanticvectors for each word in a sentence sequentially. In 2018, Devlin et al. from Google released BERT,a contextualized word representation that has achieved state-of-the-art performance in many NLP tasks.Wang et al. [34] developed a new BERT-based method for sentence embedding, called SBERT-WK,which combined the advantage of both parameterized [32,35] and non-parameterized methods [36,37].This model consistently outperforms state-of-the-art approaches with low computational cost andgood interpretability.
3. Method
To resolve the aforementioned issues in small scale learning feedback and teaching improvement,a novel pipeline is proposed to progressively collect students’ feedback after each class, visualizethe raw data for instructors and make performance prediction to help teachers improve their furtherteaching. Figure 2 illustrates the whole pipeline of the proposed method. The system firstly collectsstudents’ feedback after each lesson and saves these data into a database. The submitted data arerecorded after every class, where each kth lesson consisted of students’ feedback for that specifickth lesson. In Figure 2, Fij denotes the jth feature value for Student i before kth lesson. After datapre-processing, the processed data are then visualized to give teachers an intuitive sense of teachingeffects. Finally, an ANN model is adopted to predict the performance of every student for furtherteaching improvements. The following subsections will describe each module in the proposed pipelinein detail.

Future Internet 2020, 12, 137 5 of 15
Figure 2. The architecture of the proposed system.
3.1. Feedback Data Collection
Due to the main target of this research is to provide a fully automatic visualization and analyzingsystem for teachers after each class, the system needs to collect students’ feedback data after each class.Inspired by the evaluation mechanism of popular e-commerce websites that collect customers’ reviewson each transaction and make corresponding improvements, a WeChat mini program (Figure 2 topleft) is developed to collect students’ instant response after each class.
In this case study, data were collected from the Data Structure course opened in 2019 Summer bySchool of Educational Science and Technology, Nanjing University of Posts and Telecommunications,China, with 113 students enrolled in this course. At the end of each lesson, teacher will presentthe QR code of this WeChat mini program to students for feedback about this lesson, withoutdownloading any APPs. Students could use this mini-program to fill in the questionnaire withsmartphone conveniently. The designed questionnaire has only 10 questions, and 9 of them aremultiple choices. Thus, the participants can fill the form quickly. The whole procedure is not boring,thus can ensure the quality of the feedback. At the end of the course, 1089 records were collected fromstudents across 16 lessons. As shown in Figure 3, not every student submits feedback after each lesson,and in some cases students did not submit comments.
Figure 3. Statistics of the learning feedback dataset.
The data collected from each student’s feedback include different data type. English translatedfeedback samples are shown in Table 1. For each feedback, the first item records the knowledge pointtaught in this lesson. Items from the second to the tenth present the answer to the multiple choices.The last item is comments, i.e., what the student wants to suggest for this lesson, which is required to

Future Internet 2020, 12, 137 6 of 15
contain at least 10 Chinese characters to ensure the comment quality. Text clustering has been appliedto estimate the quality of the collected comments. All comments are roughly clustered into threeclasses. Among them, comments containing negative attitude phrases such as ‘So hard to understand‘are regarded as a category in which students were more likely to perform poorly. On the contrary,students who had more positive attitude phrases like ‘the teacher made it very clear‘ in their commentstend to achieve better academic performance, demonstrating the quality of the collected feedback. Thedetailed translated questionnaire is listed in Appendix A.
Table 1. Samples of translated students’ feedback.
Student ID Answer Submit Date
Stu1 [“Linked List”,0,1,1,1,1,1,1,1,3,“I really listened to the lecture, but Icouldn’t understand it.”]
13 March 2019 13:43:03
Stu2 [“Linked List”,0,1,1,1,1,1,2,1,3,“I hope the teacher can explain thecode in more detail”]
13 March 2019 13:43:24
3.2. Data Pre-Processing
As previously mentioned, the proposed model is expected to predict the students’ finalperformance in a progressively more accurate manner when more feedback data are introduced.Another crucial issue is data missing, i.e., not every student remembers to submit his/her feedbackafter the class due to various reasons. Thus, each student’s feature vector has to be fixed length andcontain historical information regardless of the amount of feedback he/she submitted. The procedureof data pre-processing is shown in Figure 4.
Figure 4. Data pre-processing procedure.
Specifically, after the kth lesson, all the feedback is downloaded from the database. For eachstudent ui, his/her feedback data on kth lesson is Rk
i and qkij, indicating his/her selection on question j
at kth lesson respectively. cki refers to the comment of student ui at kth lesson, which has to be converted
to an equal length feature vector. This pre-processing first removes meaningless characters in cki , such
as single English characters and punctuation. After that, sentiment analysis is adopted to estimatean overall sentiment score on each sentence [38]. For each sentence, an emotion value ek
i is calculated.ek
i greater than 0 means the comment is positive, while the value less or equal to 0 indicates negativeattitude. In addition, the higher absolute value of ek
i means the feelings are more intense. Afterwards,Sentence-bert [34] is applied to convert the processed ck
i to a sentence embedding f ki .
For multiple choices, the answers are correlated with the subscript of the question option.For example, in the question: “What do you think of the overall difficulty of this lesson?”, the indexes

Future Internet 2020, 12, 137 7 of 15
of options: Easy, Medium, and Hard are encoded as 0, 1, and 2. It can be obviously observed thatlarger index indicates more difficulty of this class. Therefore, the proposed algorithm uses the averageof each student’s options subhead to present his/her average selection on each question. Similarly, theaverage of each student’s emotion value and the comment feature vector are joined up as the students’comments. Finally, the averaged feature vector for student ui is obtained as Fi. Samples of processedfeedback are displayed in Table 2.
Table 2. Samples of processed students’ feedback
Student ID Question Value(Q1–Q9) Emotion Value Comment Features
Stu1 [0.92307, 0.69231, ..., 3.07692] −1.09782 [0.76899, −0.28807, ..., −0.63832]Stu2 [0.27273, 0.81818, ..., 3.54546] −0.52067 [−0.14123, −0.32102, ..., −0.17956]
For performance prediction, each student’s final exam score (0–100) is collected. As the numberof students who failed or scored above 90 was less than 10, to eliminate the data imbalance problem,students’ final performances are separated into three categories: students with a score of less than 70are labeled ‘Worse‘. Those with a score over 70 but less than 80 are labeled ‘Good‘, and those with ascore of more than 80 means ‘Excellent‘. The statistics of each category are listed in Table 3.
Table 3. Statistics of students’ final score distribution.
Grade Range Number of Students Label90–100 8 Excellent80–89 3670–79 39 Good60–69 26 Worse0–59 4
3.3. Artificial Neural Network Model
Progressive students’ performance prediction can help teachers adjust and improve their futureteaching. This work aims to learn a classification model that can achieve early prediction of eachstudent’s outcome into three categories: Worse, Good and Excellent. This predictor is designed toget better classification accuracy as the course goes on because the gathered data are accumulated.Furthermore, the prediction of students’ performance can also give suggestions to teachers to improvetheir teaching methods and stylize the assignments. To achieve the goal, this work proposes anArtificial Neural Network model as the predictor. The architecture of the proposed ANN model isillustrated in Figure 5.
Figure 5. The architecture of the proposed Artificial Neural Network (ANN) model.
To improve the performance of traditional ANN model, it needs to make full use of all input dataand utilize features of every hidden layer due to the small scale of collected data. Thus, this work uses
Future Internet 2020, 12, 137 8 of 15
concatenation for fully connected layers, which aggregates features from prior layers. This helps themodel utilize both low-level features generated by previous layers and condensed high-level features.This strategy enables the model to use previously generated features for improving the ability of ANN.A dense layer is followed after the concatenated features for generating softmax output. For activationfunction, Leaky Relu is imposed after each hidden layer, as Leaky Relu function overcomes the problemof dying neural networks in contrast to Relu activation function. Experimental results in the nextsection show that the proposed ANN with concatenation and Leaky Relu outperforms vanilla neuralnetwork models.
3.4. Data Visualization
In this small scale dataset, a total of 1089 course feedback records have been collected from16 lessons with 113 students enrolled. Since the first goal of this study is to give teachers a firstimpression after each class, feedback data are visualized immediately to teachers. Three data analysisand visualization techniques are adopted to help teachers understand students’ feedback.
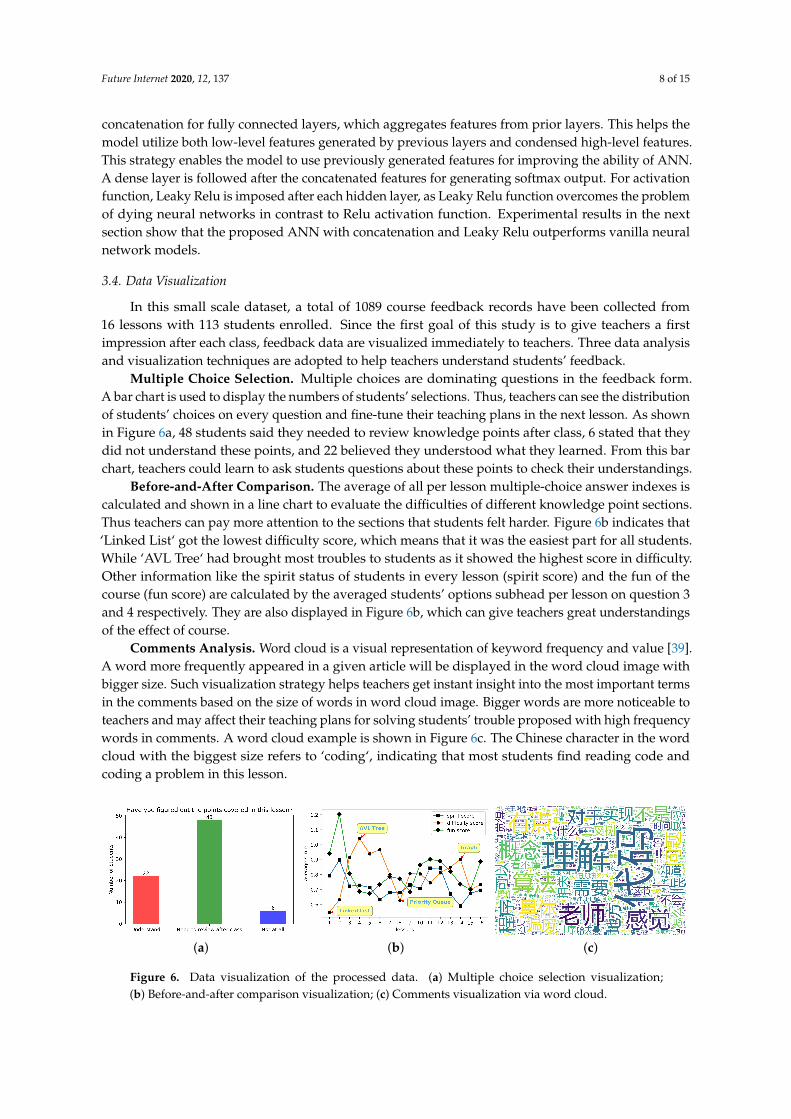
Multiple Choice Selection. Multiple choices are dominating questions in the feedback form.A bar chart is used to display the numbers of students’ selections. Thus, teachers can see the distributionof students’ choices on every question and fine-tune their teaching plans in the next lesson. As shownin Figure 6a, 48 students said they needed to review knowledge points after class, 6 stated that theydid not understand these points, and 22 believed they understood what they learned. From this barchart, teachers could learn to ask students questions about these points to check their understandings.
Before-and-After Comparison. The average of all per lesson multiple-choice answer indexes iscalculated and shown in a line chart to evaluate the difficulties of different knowledge point sections.Thus teachers can pay more attention to the sections that students felt harder. Figure 6b indicates that‘Linked List‘ got the lowest difficulty score, which means that it was the easiest part for all students.While ‘AVL Tree‘ had brought most troubles to students as it showed the highest score in difficulty.Other information like the spirit status of students in every lesson (spirit score) and the fun of thecourse (fun score) are calculated by the averaged students’ options subhead per lesson on question 3and 4 respectively. They are also displayed in Figure 6b, which can give teachers great understandingsof the effect of course.
Comments Analysis. Word cloud is a visual representation of keyword frequency and value [39].A word more frequently appeared in a given article will be displayed in the word cloud image withbigger size. Such visualization strategy helps teachers get instant insight into the most important termsin the comments based on the size of words in word cloud image. Bigger words are more noticeable toteachers and may affect their teaching plans for solving students’ trouble proposed with high frequencywords in comments. A word cloud example is shown in Figure 6c. The Chinese character in the wordcloud with the biggest size refers to ‘coding‘, indicating that most students find reading code andcoding a problem in this lesson.
(a) (b) (c)
Figure 6. Data visualization of the processed data. (a) Multiple choice selection visualization;(b) Before-and-after comparison visualization; (c) Comments visualization via word cloud.

Future Internet 2020, 12, 137 9 of 15
4. Experiments and Discussions
4.1. Experimental Settings
In this paper, a three-class classification experiment is conducted for course outcome prediction.Stratified 10-fold cross-validation is also applied to train and validate the proposed and other baselinemodels. In the dataset, 90% of the data were used for training and 10% for validation at eachfold. Grid-search was adopted to find the optimal hyperparameters for traditional machine learningmethods. Three fully-connected layers are implemented to extract features from 256 to 64 units.The dropout layer with rate 0.3 is implemented between the layers to reduce ovefitting, enablingthe proposed model to learn more effectively and rigorously. Leaky Relu is applied as the activationfunction after each fully-connected layer, except the last layer with softmax function. Adam is used asthe optimizer with learning rate setting to 0.00002. Each simulation runs for 2500 epochs with batchsize 113 (number of students). Figure 7 illustrates the metrics of the training procedure, where earlystopping was realized to prevent overfitting.
(a) (b)
Figure 7. Training metrics of the proposed ANN model across 2500 epochs with early stopping.(a) Training accuracy; (b) Training loss value.
4.2. Learning Performance Prediction
As aforementioned, an ANN model is developed to predict students’ outcomes in three categories,based on their historical feedback after each lesson. By reviewing these prediction results, teachersmay improve students’ future performance by providing special guidance to those who are potentiallyat-risk. Below, the proposed ANN model is compared with other traditional machine learning methodsin various configurations, showing the best parameters for our model.
4.2.1. Comparison with State-of-the-Art Machine Learning Methods
In this part, the proposed ANN model is compared with other state-of-the-art machine learningmethods, including Logistic Regression, Random Forest, Decision Trees, and SVM. These models havedemonstrated excellent performance in predicting students’ outcomes on large scale dataset and arecomputationally cheap. However, these traditional machine learning methods have to fine-tune theirhyperparameters to get the best results, which could be time-consuming. Moreover, for different inputdata, researchers usually have to repeat experiments to fine-tune the hyperparameters and find thebest one. In this experiment, four metrics, i.e., Accuracy, Precision, Recall and F1 score are adoptedto evaluate different algorithms. Table 4 demonstrates that the proposed ANN model obtains betterresults than other machine learning methods.

Future Internet 2020, 12, 137 10 of 15
Table 4. Metric comparisons between the proposed ANN model and other state-of-the-art methods.
Number of Lessons Techniques Accuracy % Precision Recall F1 Score
1
ANN 38.74 0.3000 0.3874 0.3425Logistic Regression 41.67 0.4167 0.4167 0.5167
Random Forest 26.67 0.2667 0.2667 0.2930Decision Trees 38.33 0.3833 0.3833 0.3930
SVM 31.67 0.3167 0.3167 0.4297
4
ANN 43.26 0.4302 0.4326 0.4338Logistic Regression 31.07 0.3107 0.3107 0.3508
Random Forest 35.89 0.3589 0.3589 0.3647Decision Trees 32.50 0.3250 0.3250 0.3386
SVM 37.86 0.3786 0.3786 0.4291
8
ANN 47.12 0.4697 0.4712 0.4941Logistic Regression 42.27 0.4227 0.4227 0.5435
Random Forest 40.36 0.4036 0.4036 0.4241Decision Trees 37.45 0.3745 0.3745 0.3826
SVM 42.09 0.4209 0.4209 0.4678
12
ANN 56.53 0.5500 0.5653 0.5703Logistic Regression 40.09 0.4009 0.4009 0.5398
Random Forest 54.00 0.5400 0.5400 0.5471Decision Trees 46.82 0.4682 0.4682 0.4682
SVM 49.45 0.4945 0.4945 0.5034
16
ANN 73.69 0.7405 0.7370 0.7372Logistic Regression 45.45 0.4545 0.4545 0.5451
Random Forest 65.27 0.6527 0.6527 0.6527Decision Trees 41.82 0.4182 0.4182 0.4225
SVM 56.36 0.5636 0.5636 0.5717
Accuracy is used to evaluate the proportion of samples that have been classified correctly.From Table 4, it is shown that ANN performed best among all classifiers of 73.69% with 16 lessons,followed by Random Forest with 65.27%.
Precision and recall metrics are widely used in data science to evaluate the performance of models.Precision indicates the ability of classifiers that predict labels correctly, and recall shows how accuratelythe model to assign true labels has been used. Since the task is to classify students’ final scores into 3classes, the precision and recall values are calculated separately for each category. The macro-averagestrategy is used when the number of these three classes is almost equal. The precision and recall valuesof all proposed models are displayed in Table 4. It can be observed that ANN outperforms othermethods significantly after data from four lessons are used. At the same time, Logistic Regressionshows relatively good results only when very few lessons data are available.
F1 score is defined as the harmonic mean between precision and recall, which can provide a morerealistic measure of a model’s performance. The F1 score of all models is listed in Table 4. ANN againshows relatively good results along with the course’s progress and performs best when 4, 8, 12 and 16lessons data are used. Logistic Regression outperforms other methods only with less than 4 lessons.
The F1 score of all compared models running with different amounts of data is illustrated inFigure 8a. It shows that traditional methods like Random Forest and SVM outperform the proposedANN model only before Week 4 because too few data are involved. After Lesson 4, the proposedmodel outperforms other methods and gets better performance when more data introduced. At theend of the course, the F1 score of the proposed method reaches 0.7372 in Lesson 16.
Figure 8b shows the F1 score of the proposed ANN model and the baseline when commentfeatures were not used. All models performed poorly in this task. Machine learning methods presentsimilar results with their performance in Figure 8a, while the proposed ANN model shows plausibleresults when both comment features and more lessons’ data are used. This indicates that commentinformation is crucial to improve the ANN’s performance. The reason that ANN and machine learningmodels have different performance on predicting accuracy is that machine learning models often lack

Future Internet 2020, 12, 137 11 of 15
domain understanding of the sentence embeddings, which are high dimensional representations oftext generated by deep neural networks. Thus, they fail to extract useful information from commentswithout specific feature engineering. At the same time, ANN can use multiple layers and non-linearactivation functions to learn, understand, and utilize the representation of sentence embedding,resulting in better performance.
(a) (b)
Figure 8. F1 score comparison of all models across 16 lessons. (a) With comment information;(b) Without comment information.
4.2.2. Comparison with Different ANN Configurations
To demonstrate the necessity of concatenation and Leaky Relu activation function, Figure 9compares the F1 score on different ANN architecture configurations. The proposed configurationachieves the best F1 score 0.7372 across four selected lessons. ANN that does not use concatenationperforms worst on this task. The dropout rate of 0.3 was applied after each layer except the last one,indicating some units were temporally ignored in the training procedure. The concatenation wasused to concatenate layer output without dropout, enabling the output layer to fully used all featuresextracted in previous layers. Concatenation helps the model to fully use uncondensed low-levelfeatures, which may contain important information ignored by high-level layers or dropout function.Leaky Relu can also preserve information in initial layers in this task.
Figure 9. Performance comparison on different ANN model architecture configurations.
5. Conclusions and Future Work
In this study, we propose a novel approach to perform progressive class feedback, qualitativevisualization, and student performance prediction, especially for small scale learning. Such analysiscould also help teachers to adjust and improve their teaching strategies throughout the whole course.A case study on the Data Structure course performed at term 2019 Summer with 113 students is

Future Internet 2020, 12, 137 12 of 15
investigated using an Artificial Neural Network model. The precision begins at 30.00%, progressivelyimproves during the term, and finally reaches 74.05% for a small dataset.
In the future, more machine learning methods could be explicitly investigated for such a smalldataset. RNN-based models (vanilla RNN, GRU and LSTM) could be applied to extract information insequential feedback data. Data completion is required to fill missing feedback after each class, whichis also an interesting direction because the absence of submission for some students will negativelyinfluence the whole dataset, especially for such a small scale dataset.
Author Contributions: Conceptualization, B.J., C.H., S.L. and G.Z.; Data curation, Y.H. and R.C.; Fundingacquisition, B.J., C.H., S.L. and G.Z.; Investigation, C.H., S.L. and G.Z.; Methodology, B.J., Y.H. He and R.C.; Projectadministration, B.J.; Resources, C.H., S.L. and G.Z.; Software, Yanbai He; Visualization, Y.H.; Writing—originaldraft, Y.H. and R.C.; Writing—review & editing, B.J. All authors have read and agreed to the published version ofthe manuscript.
Funding: This research was funded by the National Natural Science Foundation of China (Grant No. 61907025,61807020, 61702278), the Natural Science Foundation of Jiangsu Higher Education Institutions of China (Grant No.19KJB520048), Six Talent Peaks Project in Jiangsu Province (Grant No. JY-032) and the Educational Reform Projectof Nanjing University of Posts and Telecommunications (Grant No. JG01717JX105)
Acknowledgments: The authors would like to thank all the anonymous reviewers for their valuable suggestionsto improve this work. The authors would also like to thank all the students from class B181501, B181502, B181503,B181504, School of Educational Science and Technology, Nanjing University of Posts and Telecommunication,China to participate in this study.
Conflicts of Interest: The authors declare no conflict of interest.
Appendix A. WeChat Mini Programe Feedback Survey Questions
The original after-class feedback survey questions conveyed by WeChat Mini Program are inChinese. In this appendix, the translated version is presented here.
1. What location are you in within the classroom?
(a) First three rows(b) Middle rows(c) Last three rows
2. What do you think of the overall difficulty of this class?
(a) Easy(b) Medium(c) Hard
3. How do you feel about your state of mind in this class?
(a) Focused(b) Medium(c) Sleepy
4. How do you find the class interesting?
(a) Interesting(b) Medium(c) Boring
5. Have you figured out the knowledge points covered in this lesson?
(a) Already understood(b) Need to review after class(c) Not at all
6. Have you figured out the code involved in this lesson?
(a) Already understood(b) Need to review after class(c) Not at all

Future Internet 2020, 12, 137 13 of 15
7. What’s your biggest gain from this lesson?
(a) Concept of Data Structure(b) Operations of Data Structure(c) Code replication(d) Nothing
8. What drew you to the classroom?
(a) Pressure of grade points(b) Fun to learn(c) Importance of Data Structure(d) The charm of the teacher(e) Other reasons
9. What’s your overall rating for this class?
(a) 1 star(b) 2 stars(c) 3 stars(d) 4 stars(e) 5 stars
10. What do you want to say about this class?(Open question, no less than 10 Chinese characters)
References
1. Sun, G.; Cui, T.; Beydoun, G.; Chen, S.; Dong, F.; Xu, D.; Shen, J. Towards massive data and sparse datain adaptive micro open educational resource recommendation: a study on semantic knowledge baseconstruction and cold start problem. Sustainability 2017, 9, 898. [CrossRef]
2. Herbert, M. Staying the course: A study in online student satisfaction and retention. Online J. DistanceLearn. Adm. 2006, 9, 300–317.
3. Dalipi, F.; Imran, A.S.; Kastrati, Z. MOOC dropout prediction using machine learning techniques: Reviewand research challenges. In Proceedings of the 2018 IEEE Global Engineering Education Conference(EDUCON), Tenerife, Spain, 17–20 April 2018; pp. 1007–1014.
4. May, M.; Iksal, S.; Usener, C.A. The side effect of learning analytics: an empirical study on e-learningtechnologies and user privacy. In International Conference on Computer Supported Education; Springer:Berlin/Heidelberg, Germany, 2016; pp. 279–295.
5. Kaur, G.; Singh, W. Prediction of student performance using weka tool. Int. J. Eng. Sci. 2016, 17, 8–16.6. Fayyad, U.; Piatetsky-Shapiro, G.; Smyth, P. From data mining to knowledge discovery in databases.
AI Mag. 1996, 17, 37–37.7. Aziz, A.A.; Ismail, N.H.; Ahmad, F.; Abidin, Z.; Badak, K.G.; Candidate, M. Mining Students’ Academic
Performance. J. Theor. Appl. Inf. Technol. 2013, 53, 485-495.8. Injadat, M.; Salo, F.; Nassif, A.B.; Essex, A.; Shami, A. Bayesian optimization with machine learning
algorithms towards anomaly detection. In Proceedings of the 2018 IEEE Global CommunicationsConference (GLOBECOM), Abu Dhabi, United Arab Emirates, 9–13 December 2018; pp. 1–6.
9. Yang, L.; Moubayed, A.; Hamieh, I.; Shami, A. Tree-based intelligent intrusion detection system in internetof vehicles. In Proceedings of the 2019 IEEE Global Communications Conference (GLOBECOM), Waikoloa,HI, USA, 9–13 December 2019; pp. 1–6.
10. Moubayed, A.; Injadat, M.; Shami, A.; Lutfiyya, H. Dns typo-squatting domain detection: A data analytics& machine learning based approach. In Proceedings of the 2018 IEEE Global Communications Conference(GLOBECOM), Abu Dhabi, United Arab Emirates, 9–13 December 2018; pp. 1–7.
11. Helal, S.; Li, J.; Liu, L.; Ebrahimie, E.; Dawson, S.; Murray, D.J.; Long, Q. Predicting academic performanceby considering student heterogeneity. Knowl. Based Syst. 2018, 161, 134–146. [CrossRef]
12. Kehrwald, B. Understanding social presence in text-based online learning environments. Distance Educ.2008, 29, 89–106. [CrossRef]
13. Romero, C.; Ventura, S. Educational data mining: A survey from 1995 to 2005. Expert Syst. Appl. 2007,33, 135–146. [CrossRef]

Future Internet 2020, 12, 137 14 of 15
14. Wasif, M.; Waheed, H.; Aljohani, N.; Hassan, S.U. Understanding Student Learning Behavior and PredictingTheir Performance. Available online: https://doi.org/10.4018/978-1-5225-9031-6.ch001 (accessed on 16August 2020).
15. Costa, E.B.; Fonseca, B.; Santana, M.A.; de Arajo, F.F.; Rego, J. Evaluating the Effectiveness of EducationalData Mining Techniques for Early Prediction of Students’ Academic Failure in Introductory ProgrammingCourses. Comput. Hum. Behav. 2017, 73, 247–256. doi:10.1016/j.chb.2017.01.047. [CrossRef]
16. Yi, J.C.; Kang-Yi, C.D.; Burton, F.; Chen, H.D. Predictive analytics approach to improve and sustain collegestudents’ non-cognitive skills and their educational outcome. Sustainability 2018, 10, 4012. [CrossRef]
17. Kaur, H. A Literature Review from 2011 to 2014 on Student’S Academic Performance Prediction andAnalysis Using Decision Tree Algorithm. J. Glob. Res. Comput. Sci. 2018, 9, 10–15.
18. Ahmed, A.; Elaraby, I.S. Data mining: A prediction for student’s performance using classification method.World J. Comput. Appl. Technol. 2014, 2, 43–47.
19. Hussain, M.; Zhu, W.; Zhang, W.; Abidi, S.M.R. Student engagement predictions in an e-learning systemand their impact on student course assessment scores. Comput. Intell. Neurosci. 2018, 2018. [CrossRef]
20. Marbouti, F.; Diefes-Dux, H.A.; Madhavan, K. Models for early prediction of at-risk students in a courseusing standards-based grading. Comput. Educ. 2016, 103, 1–15. [CrossRef]
21. Chui, K.T.; Fung, D.C.L.; Lytras, M.D.; Lam, T.M. Predicting at-risk university students in a virtual learningenvironment via a machine learning algorithm. Comput. Hum. Behav. 2020, 107, 105584. [CrossRef]
22. Leitner, P.; Khalil, M.; Ebner, M. Learning analytics in higher education—A literature review. In LearningAnalytics: Fundaments, Applications, and Trends; Springer: Berlin/Heidelberg, Germany, 2017; pp. 1–23.
23. LeCun, Y.; Bengio, Y.; Hinton, G. Deep learning. Nature 2015, 521, 436–444. [CrossRef]24. De Albuquerque, R.M.; Bezerra, A.A.; de Souza, D.A.; do Nascimento, L.B.P.; de Mesquita Sá, J.J.;
do Nascimento, J.C. Using neural networks to predict the future performance of students. In Proceedingsof the 2015 International Symposium on Computers in Education (SIIE), Setubal, Portugal, 25–27 November2015; pp. 109–113.
25. Corrigan, O.; Smeaton, A.F. A course agnostic approach to predicting student success from VLE logdata using recurrent neural networks. In European Conference on Technology Enhanced Learning; Springer:Berlin/Heidelberg, Germany, 2017; pp. 545–548.
26. Jamal, N.; Xianqiao, C.; Aldabbas, H. Deep Learning-Based Sentimental Analysis for Large-ScaleImbalanced Twitter Data. Future Internet 2019, 11, 190. [CrossRef]
27. Singla, Z.; Randhawa, S.; Jain, S. Statistical and sentiment analysis of consumer product reviews.In Proceedings of the 2017 8th International Conference on Computing, Communication and NetworkingTechnologies (ICCCNT), Delhi, India, 3–5 July 2017; pp. 1–6.
28. Zhao, W.; Guan, Z.; Chen, L.; He, X.; Cai, D.; Wang, B.; Wang, Q. Weakly-supervised deep embedding forproduct review sentiment analysis. IEEE Trans. Knowl. Data Eng. 2017, 30, 185–197. [CrossRef]
29. He, R.; Lee, W.S.; Ng, H.T.; Dahlmeier, D. An unsupervised neural attention model for aspect extraction.In Proceedings of the 55th Annual Meeting of the Association for Computational Linguistics (Volume 1:Long Papers), Vancouver, BC, Canada, 30 July–4 August 2017; pp. 388–397.
30. Wang, M.; Hu, G. A Novel Method for Twitter Sentiment Analysis Based on Attentional-Graph NeuralNetwork. Information 2020, 11, 92. [CrossRef]
31. Levy, O.; Goldberg, Y. Neural word embedding as implicit matrix factorization. In Proceedings of theAdvances in Neural Information Processing Systems, Montreal, QC, Canada, 8–13 December 2014; pp.2177–2185.
32. Kiros, R.; Zhu, Y.; Salakhutdinov, R.R.; Zemel, R.; Urtasun, R.; Torralba, A.; Fidler, S. Skip-thought vectors.In Proceedings of the Advances in Neural Information Processing Systems (NIPS 2015), Montreal, QC,Canada, 7–12 December 2015; pp. 3294–3302.
33. Palangi, H.; Deng, L.; Shen, Y.; Gao, J.; He, X.; Chen, J.; Song, X.; Ward, R. Deep sentence embedding usinglong short-term memory networks: Analysis and application to information retrieval. IEEE/ACM Trans.Audio, Speech, Lang. Process. 2016, 24, 694–707. [CrossRef]
34. Reimers, N.; Gurevych, I. Sentence-bert: Sentence embeddings using siamese bert-networks. arXiv 2019,arXiv:1908.10084.
35. Conneau, A.; Kiela, D.; Schwenk, H.; Barrault, L.; Bordes, A. Supervised learning of universal sentencerepresentations from natural language inference data. arXiv 2017, arXiv:1705.02364.

Future Internet 2020, 12, 137 15 of 15
36. Ethayarajh, K. Unsupervised random walk sentence embeddings: A strong but simple baseline.In Proceedings of the Third Workshop on Representation Learning for NLP, Melbourne, Australia,20 July 2018; pp. 91–100.
37. Arora, S.; Liang, Y.; Ma, T. A simple but tough-to-beat baseline for sentence embeddings. Available online:https://openreview.net/forum?id=SyK00v5xx (accessed on 16 August 2020).
38. Kiritchenko, S.; Zhu, X.; Mohammad, S.M. Sentiment analysis of short informal texts. J. Artif. Intell. Res.2014, 50, 723–762.
39. Burch, M.; Lohmann, S.; Pompe, D.; Weiskopf, D. Prefix tag clouds. In Proceedings of the 2013 17thInternational Conference on Information Visualisation, London, UK, 16–18 July 2013; pp. 45–50.
c© 2020 by the authors. Licensee MDPI, Basel, Switzerland. This article is an open accessarticle distributed under the terms and conditions of the Creative Commons Attribution(CC BY) license (http://creativecommons.org/licenses/by/4.0/).