Just Caring: The Moral and Economic Costs of APOE Genotyping for Alzheimer's Disease
Upload
independentCategory
view
1download
0
Journal of PathologyJ Pathol 2008; 214: 574–583Published online 11 December 2007 in Wiley InterScience(www.interscience.wiley.com) DOI: 10.1002/path.2305
Original Paper
Progression of atherosclerosis in ApoE-deficient micethat express distinct molecular forms of TNF-alpha
M Canault,1,2 F Peiretti,1,2 M Poggi,1,2 C Mueller,3 F Kopp,2 B Bonardo,1,2 D Bastelica,1,2 A Nicolay,2,4
M-C Alessi1,2 and G Nalbone1,2*1Inserm, U626, Marseille, F-13385, France2Universite de la Mediterranee, F-13284, Marseille, France3University of Bern, Institute of Pathology, 3010 Bern, Switzerland4Service Chimie Analytique, Faculte de Pharmacie, F-13385 Marseille, France
*Correspondence to:G Nalbone, Inserm U626,Faculte de Medecine Timone, 27,Bd Jean Moulin, 13385 MarseilleCedex 05, France.E-mail: [email protected]
No conflicts of interest weredeclared.
Received: 23 May 2007Revised: 25 October 2007Accepted: 15 November 2007
AbstractTNFα (TNF) critically regulates inflammation-driven atherosclerosis. Because the trans-membrane (tmTNF) and soluble (sTNF) forms of TNF possess distinct immuno-modulatoryproperties, we hypothesized that they might differentially regulate atherosclerosis progres-sion. Three groups of male ApoE−/− mice were studied: one expressing wild-type TNF(WT-TNF); one expressing exclusively a mutated non-cleavable form of TNF (KI-TNF);and one deficient in TNF (KO-TNF). Mice aged 5 weeks were fed the high-fat diet for 5(T5) and 15 weeks (T15) or a standard chow diet for 15 weeks. At T5, in mice fed the high-fatdiet, no significant differences in lesion area were observed among the three groups, either invalves or in aortas. At T15, lesion areas in valves were significantly lower in KO-TNF micecompared with those in WT-TNF mice, whereas in KI-TNF mice, they were intermediatebetween KO- and WT-TNF mice but not significantly different from these two groups. Inaortas, lesions in KI-TNF were comparable to those of KO-TNF, both being significantlylower than those in WT-TNF. Theses differences were not linked to circulating lipids, orto macrophage, actin, and collagen contents of lesions. At T15, in mice fed the chow diet,lesion areas in valves and the aortic arch were not significantly different between the threegroups. Levels of IL-6, IFNγ , IL-10, and Foxp3 mRNAs in spleens and production of IL-6,IL-10, MCP-1, RANTES, and TNFR-2 by peritoneal macrophages at T15 of the high-fat dietshowed a decrease in pro-inflammatory status, more marked in KO-TNF than in KI-TNFmice. Apoptosis was reduced only in KO-TNF mice. In conclusion, these data show thatTNF effects on atherosclerosis development are detectable at stages succeeding fatty streaksand that wild-type TNF is superior to tmTNF alone in promoting atherosclerosis. TNF-dependent progression of atherosclerosis is probably linked to the differential production ofpro-inflammatory mediators whether tmTNF is preponderant or essentially cleaved.Copyright 2007 Pathological Society of Great Britain and Ireland. Published by JohnWiley & Sons, Ltd.
Keywords: atherosclerosis; TNF; transmembrane TNF; gene targeting; mouse;inflammation
Introduction
The role of TNF in atherosclerosis has been recog-nized for a long time [1]. This cytokine was detectedin human atherosclerotic plaques [2,3] and found tobe associated with atherosclerosis and cardiovascularevents [4–7]. Experimental data showed that geneticinactivation of TNF reduced the lesion size in a nutri-tional [8] and a genetic model of atherosclerosis [9,10],as well as the number of advanced over early lesionsin ApoE∗3-Leiden transgenic mice [11]. In addition,neutralization of circulating TNF reduced atheroscle-rosis in mice [9,12]. However, the biological effectsof TNF are not only those of its released soluble form
(sTNF), but also those of its transmembrane form(tmTNF) [13,14]. The latter may regulate cytokineproduction, probably through so-called reverse sig-nalling [13]. Distinct immuno-modulating functionsof sTNF and tmTNF have been largely documentedin mice, particularly in the structural organization oflymphoid organs, chemokine/cytokine expression, andinflammation [15,16]. Because immune cell traffickingbetween lymphoid organs and the arterial wall crit-ically regulates inflammation-driven atherosclerosis[17–19], the tmTNF/sTNF ratio might have a signifi-cant effect on atherosclerosis progression. The equilib-rium between the two TNF forms is mainly under thecontrol of the TNF-alpha converting enzyme (TACE),
Copyright 2007 Pathological Society of Great Britain and Ireland. Published by John Wiley & Sons, Ltd.www.pathsoc.org.uk

TNF and atherosclerosis 575
also named ADAM17 [20,21]. We recently showedthat TACE/ADAM17 is expressed in aortic lesions ofApoE-deficient mice fed a high-fat diet, which mayaccount for the higher release of TACE/ADAM17 sub-strates from explants of these aortas [22].
Our hypothesis was that the respective proportionsof sTNF and tmTNF may contribute to the regulationof inflammatory status in lesions. We therefore inves-tigated in ApoE-deficient mice the role of the distinctmolecular forms of TNF on atherosclerosis. The TNFphenotypes studied were wild-type TNF (WT-TNF), adeleted/mutated non-cleavable tmTNF (KI-TNF) [16],and TNF deficiency (KO-TNF). Lesions were exam-ined after 5 and 15 weeks of a high-fat diet or after15 weeks of a standard chow diet. The data indicatethat wild-type TNF, because of the presence of addi-tional sTNF, is superior to tmTNF alone in promotingatherosclerosis, essentially at advanced stages of thepathology. They suggest that these properties might belinked to the differential regulation of the productionof pro-inflammatory mediators by sTNF and tmTNF.
Materials and methods
Reagents
Culture media RPMI-1640 and DMEM, fetal calfserum (FCS), and penicillin and streptomycin (PS)were purchased from Gibco/Invitrogen (Cergy Pon-toise, France). Human serum was from PromoCell(Heidelberg, Germany). ELISA kits to assay murinesTNF, IL-6, IL-10, RANTES, and MCP-1 were pur-chased from R&D Systems (Abington, UK).
Animals and experimental conditions
Investigations conformed to the Guide for the Careand Use of Laboratory Animals (NIH Publication No85-23, revised 1996) and were approved by the localethics committee of the Faculte de Medecine of Mar-seille. ApoE−/− male mice (C57BL/6tm1unc) express-ing wild-type TNF (WT-TNF) were purchased fromCharles River Laboratories (France). These ApoE−/−mice were back-crossed with either (1) tmTNF knock-in mice on a C57BL/6 background made kindly avail-able by Dr J Sedgwick, DNAX, Palo Alto, USA,to obtain ApoE−/−/tmTNF-KI (KI-TNF) mice. Thesemice express a TNF gene lacking the TACE/ADAM17cleavage site; they display normal levels of tmTNF,
but without a functional cleavage site, therefore pre-venting the release of sTNF [16]; or (2) TNF−/− mice[23] back-crossed on a C57BL/6 background for morethan eight generations, to generate double-deficientApoE/TNF (KO-TNF) mice. TNF genotyping was per-formed as previously described [16,23].
The total number of male mice aged 5 weeks (T0)devoted to the study was 23 in the WT-TNF and theKI-TNF groups and 28 in the KO-TNF group. In orderto follow lipid plasma changes, five mice at T0 of eachgroup were anaesthetized and blood was collected byretro-orbital puncture in CTAD-containing tubes. Micewere then sacrificed by excessive anaesthesia. Fivemice in each group continued to receive the standardchow diet for 15 weeks (T15), whereas the remainingmice were fed a high-fat diet including 20% cocoabutter, 1.25% cholesterol. Mice were maintained underconventional conditions and on a 12-h light/dark cycle.Water and food were given ad libitum. For unknownreasons, one KO-TNF mouse fed the chow diet diedduring the experiment. At the end of the diet protocols(T5 and T15), blood was collected and mice weresacrificed as described above.
Plasma parameters
Blood collected at T0, T5, and T15 was centrifugedto yield plasma. Plasma total cholesterol was assayedon an automatic analyser used for clinical routines(Hitachi 911, Roche Diagnostics). Lipoproteins wereseparated by electrophoresis on agarose at pH 8.5according to the specifications of the hydragel lipopro-tein 15/30 kit (SEBIA, Evry, France). Lipoproteinswere stained with Sudan black. The surface undereach peak of lipoprotein fraction was automaticallyintegrated and expressed as a percentage of the totalpeak surface. The electrophoretic method has beenpreviously validated by comparison with the classicalFPLC separation of lipoproteins, followed by choles-terol quantification in the fractions, as already reported[8].
Monocytes/macrophages
Leukocytes were harvested from the peritoneal cav-ity at T15 with 10 ml of isotonic saline solution.After 300 g pelleting, they were suspended in RPMI-1640 containing PS/L-glutamine, 10% human serum,and left for 3–4 h in a 12-well plate. The non-adherent cells were then eliminated and the adher-ent macrophages were cultured in the human serum
Table 1. Primer sequences used for real-time PCR
Forward primer 5′ to 3′ Reverse primer 5′ to 3′
36b4 TCCAGGCTTTGGGCATCA CTTTATCAGCTGCACATCACTCAGAIFNγ ATCTGGAGGAACTGGCAAAA TTCAAGACTTCAAAGAGTCTGAGGTAIL-6 ACAAGTCGGAGGCTTAATTACACAT TTGCCATTGCACAACTCTTTTCFoxp3 CCCAGGAAAGACAGCAACCTT TTCTCACAACCAGGCCACTTGTGFβ TGGAGCAACATGTGGAACTC GTCAGCAGCCGGTTACCAIL-10 CACAAAGCAGCCTTGCAGAA AGAGCAGGCAGCATAGCAGTG
J Pathol 2008; 214: 574–583 DOI: 10.1002/pathCopyright 2007 Pathological Society of Great Britain and Ireland. Published by John Wiley & Sons, Ltd.

576 M Canault et al
medium for 5–6 days. They were stimulated or notby LPS (20 ng/ml) for 24 h. The culture medium wascollected, centrifuged, and assayed for cytokines. Theadherent macrophages were rinsed with PBS, lysed in0.2% Triton X-100, and the resulting supernatant wasused for protein determination.
Dissection and collection of organs
Spleens were collected at T5 and T15 and wereimmediately snap-frozen in liquid nitrogen. Hearts andaortas were collected at T5 and T15 and embeddedin OCT and frozen at −25 ◦C as previously reported[8,22].
Immunohistochemistry
Frozen sections of hearts and aortas were used foroil red O staining, and alternating adjacent sectionsfor immunohistochemistry (for each parameter, fourto five sections per mouse were used). Macrophageand actin contents were analysed with the mono-clonal mouse macrophage marker (clone MOMA-2; Chemicon Int) and the monoclonal anti-smoothmuscle cell α-actin conjugated to alkaline phos-phatase (clone 1A4; Sigma, l’Isles d’Abeau Chesne,France), respectively. The secondary antibodies usedwere those used previously [8,22]. Type I and typeIII collagens were stained using Picrosirius red andareas quantified under polarization microscopy [24].Detection of apoptotic cells from OCT-embeddedfrozen tissue was carried out using the single-stranded DNA (ssDNA) monoclonal antibody F7-26(Alexis Biochemicals, Lausen, Switzerland) accord-ing to the manufacturer’s protocol with slight modi-fications. The secondary rabbit anti-mouse IgM per-oxidase conjugate (Zymed, South San Francisco,CA, USA) diluted 1/200 in PBS was developedusing nickel chloride and 3,3-diaminobenzidine (Vec-tor Laboratories, Burlingame, CA, USA). Counter-staining was done with solid nuclear red (Kernechtrot).An example of apoptosis labelling in a lesion isshown in Supplementary Figure 1, available online athttp://www.interscience.wiley.com/jpages/0022-3417/suppmat/path.2305.html. All quantification of stainedareas was performed by computer-assisted planimetry(SAMBA 2005 TITN-Alcatel), as previously described[8,22].
Semi-quantitative RT-PCR
Total RNAs from spleen were prepared using theTrizol method (Invitrogen, Cergy Pontoise, France)according to the manufacturer’s recommendations.Integrity of RNA was confirmed by electrophoresis inethidium bromide-containing agarose gels. All RNAsamples were quantified on a Nanodrop ND-1000spectrophotometer (Nyxor Biotech, Paris, France).cDNA was synthesized using MMLV transcriptase(Invitrogen) from 1 µg of total RNA and stored at
−80 ◦C until use. The primers (Invitrogen) used forreal-time PCR are displayed in Table 1. PCRs wereperformed under standard conditions [25]. Relativequantification values were expressed using 2−��Ct
(User Bulletin # 2, Applied Biosystems) as foldchanges in the target gene normalized to the referencegene (36b4) and related to the expression of the WTmice at T5.
Statistics
Values are expressed as mean ± SD. The three geno-type groups were compared by one-way ANOVAusing the Kruskall–Wallis non-parametric test fol-lowed by Dunn’s multiple comparison test. Whenexamining two parameters, the Mann–Whitney non-parametric U -test was used. A value of p < 0.05 wasconsidered statistically significant.
Results
Plasma parameters in mice fed the high-fat diet
At the end of each timed diet (5 and 15 weeks), themice of all groups gained comparable weight (datanot shown). Plasma parameters are listed in Table 2.At T5, cholesterol levels increased in all groups,particularly in the KO-TNF group, which is consistentwith previous reports [9,10]. At T15, the cholesteroland TG plasma concentrations were not statisticallydifferent between groups. At T5 and T15, lipoproteinfractions exhibited similar levels in the three groups.
Atherosclerotic lesion development in mice fedthe high-fat diet
At T5, lipid deposition in aortic valves resem-bled fatty streak lesions (not shown) and showeda similar size among the three groups (Figure 1).At T15, lesions presented a more advanced pheno-type than at T5 (Figure 1). Between T5 and T15,the lesions progressed significantly in all groups(Figure 1) (0.0012 > p > 0.0001), with the fold incre-ase being less pronounced in the KI-TNF and KO-TNFgroups (×6.4 and ×5.9, respectively) than in the WT-TNF group (×8.5). However, at T15, only the lesionsin the KO-TNF mice presented a significantly lowersize (−36%, p < 0.01) than those in the WT-TNFmice, whereas in the KI-TNF group, lesion size wasintermediate and not significant from that of the twoother groups.
In the aortic arch, lesions at T5 were like fattystreaks (not shown) and were of a similar size inthe three groups (Figure 1). At T15, lesions exhib-ited a more advanced phenotype with a signifi-cantly greater size (0.02 > p > 0.0055) than in theirgenotype-matched group at T5 (Figure 1). This wasparticularly evident in WT-TNF mice, for which theincrease was 5.6-fold, whereas the increases in theother two groups were lower (×3.8 and ×3.4 in KI-
J Pathol 2008; 214: 574–583 DOI: 10.1002/pathCopyright 2007 Pathological Society of Great Britain and Ireland. Published by John Wiley & Sons, Ltd.

TNF and atherosclerosis 577
Figure 1. Quantification and representative microphotographs of oil red O area-based lesions in mice bearing the three distinctTNF phenotypes fed the high-fat diet. Left panel: measurements were done on valves (A) and the aortic arch (B). Comparisonsbetween groups were performed using one-way ANOVA (non-parametric Kruskall–Wallis test, followed by Dunn’s post-test),and comparison between T5 and T15 for each phenotype was performed using the Mann–Whitney U-test. For each of the threegroups, the increase in lesion areas between T5 and T15 is significant (see text for details of fold increase), but to simplify thepresentation of statistical differences, only comparisons between groups at a given time are displayed. Right panel: illustration ofoil red O staining performed at T15 in valves and the aortic arch
and KO-TNF, respectively). Consequently, the lipid-stained areas in the KI-TNF and KO-TNF groups werearound 80% (p < 0.05) and 212% (p < 0.01) lowerthan those in WT-TNF aortas, respectively.
Plasma parameters and atherosclerotic lesiondevelopment in mice fed the standard chow diet
In mice fed the standard chow diet and examinedat T15, the lipoprotein profiles were not significantlydifferent between the three groups, although theywere significantly more atherogenic than those at T0(Table 2). The sizes of the lesions in the valves andthe aortic arch were not statistically different amongthe three groups (Table 3).
Immunohistochemistry of lesions in mice fed thehigh-fat diet
As shown in Table 4, at T15, the MOMA-2-stainedarea, expressed as a percentage of the lesion area invalves and aortas, did not show any significant dif-ference between the three groups. At T15, the actinand collagen contents in the lesions of valves and aor-tas, respectively, were not altered in the three groups(Table 4). The number of apoptotic cells detectedby the anti-ssDNA antibody was significantly lower
Figure 2. Apoptosis determination in aortic valves inmice bearing the three distinct TNF phenotypes fedthe high-fat diet. Valves of mice fed the high-fat dietwere analysed at T15. Apoptotic cells were detectedwith the anti ssDNA F7-26 monoclonal antibody andcounted (see Supplementary Figure 1, available online athttp://www.interscience.wiley.com/jpages/0022-3417/suppmat/path.2305.html, for an example of staining). The number ofssDNA-positive cells is expressed as a percentage of the totalcells (solid red counter-staining of nuclei) normalized withthe view-field area. A total of 400–450 nuclei per mousewas examined. Values are mean ± SD. Comparison betweengroups was performed using one-way ANOVA (non-parametricKruskall–Wallis test, followed by Dunn’s post-test)
J Pathol 2008; 214: 574–583 DOI: 10.1002/pathCopyright 2007 Pathological Society of Great Britain and Ireland. Published by John Wiley & Sons, Ltd.

578 M Canault et al
Table 2. Plasma parameters in mice fed the high-fat or standard chow diet
T0 T5 T15
High-fat diet WT (5) KI (5) KO (5) WT (7) KI (6) KO (9) WT (6) KI (7) KO (9)
CH 11.1 ± 1.1 8.24 ± 1.0 8.3 ± 1.0 27.9 ± 3.8 27.5 ± 8.8 45.6 ± 4.6∗ 29.0 ± 4.8 24.1 ± 5.9 25.2 ± 4.5TG 1.24 ± 0.4 1.26 ± 0.4 0.82 ± 0.2 0.54 ± 0.2 0.53 ± 0.1 0.66 ± 0.2 0.52 ± 0.1 0.68 ± 0.1 0.60 ± 0.1HDL 10.5 ± 3.1 15.5 ± 2.1 17.7 ± 3.3∗ 3.19 ± 1.3 3.76 ± 0.8 2.26 ± 0.9 2.13 ± 0.8 2.97 ± 1.2 2.94 ± 0.9VLDL + LDL 89.4 ± 3.1 84.5 ± 2.1 82.3 ± 3.3∗ 96.8 ± 1.3 96.2 ± 0.8 97.7 ± 0.9 97.9 ± 0.8 97.0 ± 1.2 97.1 ± 1.0
T0 T5 T15
Standard chow diet WT (5) KI (5) KO (5) WT (5) KI (5) KO (4)
HDL 10.5 ± 3.1 15.5 ± 2.1 17.7 ± 3.3∗ — — — 5.5 ± 1.8 7.16 ± 2.12 5.43 ± 2.28VLDL + LDL 89.4 ± 3.1 84.5 ± 2.1 82.3 ± 3.3∗ — — — 94.6 ± 1.8 92.9 ± 2.1 94.6 ± 2.3
The high-fat diet started at T0. Cholesterol (CH) and triglycerides (TG) are expressed in mmol/l. HDL and VLDL + LDL are in % of total. Valuesare mean ± SD. In the high-fat diet protocol, comparisons between groups or times were performed with the one-way non-parametric ANOVAKruskall–Wallis test followed by Dunns’s post-test. Values bearing an asterisk are statistically different (p < 0.05) from the WT group within thesame time studied. CH, HDL, and VLDL + LDL values at T5 and T15 are all statistically different (at least p < 0.01) from their respective matchedphenotypes at T0. In the standard chow diet protocol, comparison between T0 and T15 was performed with the Student U-test (Mann–Whitney).Values at T15 are all significantly different (at least p < 0.05) from their respective matched phenotypes at T0. Values in parentheses indicate thenumber of mice studied.
Table 3. Quantification of oil red O staining-based areas in valves and arch in mice fed the standard chow diet for 15 weeks
T15
WT (5) KI (5) KO (4)
Sinus 116 400 ± 23 480 97 790 ± 17 010 85 970 ± 24 030Arch 30 360 ± 12 670 31 020 ± 15 700 35 760 ± 17 860
Values in µm2 are mean ± SD. Comparison between groups was made by the one-way non-parametric ANOVA Kruskall–Wallis test followedby Dunns’s post-test. Values in parentheses indicate the number of mice studied.
Table 4. Immunohistochemistry in lesions after 15 weeks of the high-fat diet
T15
WT (6) KI (7) KO (9)
Macrophages in valves 50.8 ± 6.3 53.1 ± 9.5 56.6 ± 9.2Actin in valves 13.0 ± 1.3 16.4 ± 6.5 18.6 ± 7.5Macrophages in aortas 46.3 ± 12.3 54.3 ± 12.7 58.6 ± 14.4Collagen in aortas 24.9 ± 6.7 17.7 ± 4.5 18.5 ± 3.5
Data are expressed as % of the total lesion area. Values are mean ± SD; comparison between groups was made by the one-way non-parametricANOVA Kruskall–Wallis test followed by Dunns’s post-test. Values in parentheses indicate the number of mice studied.
(−39%; p < 0.05) in the KO-TNF mice than in theother two groups (Figure 2).
Inflammatory status
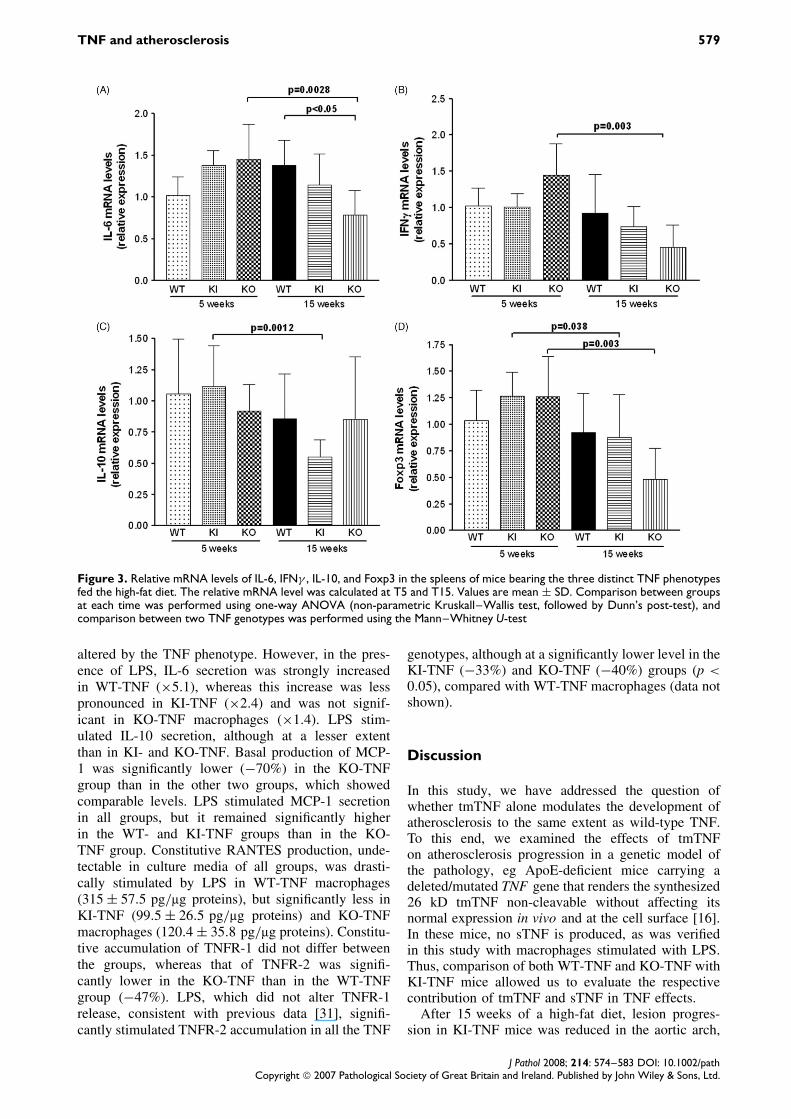
sTNF and tmTNF have different effects on immuno-inflammatory processes in lymphoid organs [15,16]that have been shown to critically regulate atheroscle-rosis [26–30]. We thus investigated by quantitativePCR the relative mRNA levels of some inflamma-tory factors in the spleen at T5 and T15. As shownin Figure 3, the most important significant changesbetween T5 and T15 were noted in KO-TNF mice forIL-6 (×0.54), IFNγ (×0.31), and Foxp3 (×0.27), andin KI-TNF mice for IL-10 (×0.49) and Foxp3 (×0.69).
TGFβ mRNA levels were too low to be subsequentlyreliably amplified.
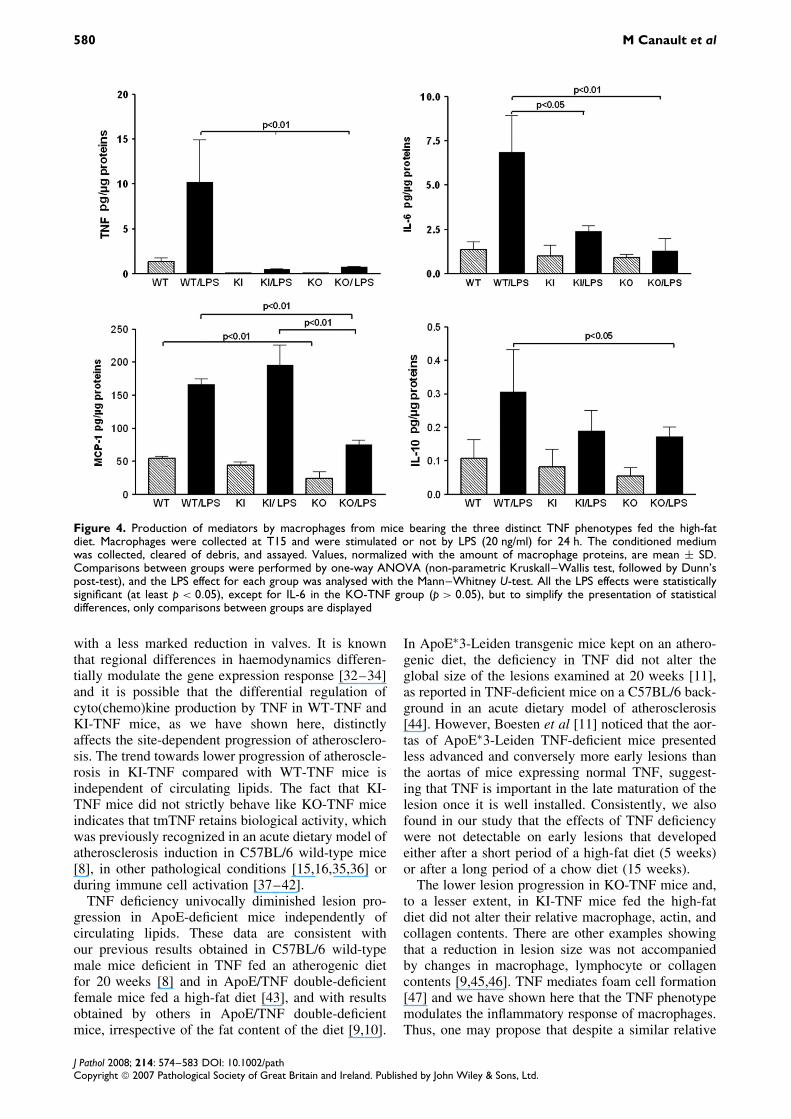
Although peritoneal macrophages cannot fully sub-stitute for macrophages present in the plaque, theyremain a good model to study how the TNF pheno-type modulates their inflammatory status. Peritonealmacrophages collected at T15 were stimulated ornot by LPS (Figure 4). In WT-TNF macrophages,the release of sTNF was drastically increased afterLPS stimulation. As expected, KI- and KO-TNFmacrophages released non-significant amounts ofsTNF even after LPS stimulation, confirming thatthe mutation in the TACE/ADAM17 cleavage regionin tmTNF and inactivation of the TNF gene wereeffective. Constitutive IL-6 and IL-10 levels were not
J Pathol 2008; 214: 574–583 DOI: 10.1002/pathCopyright 2007 Pathological Society of Great Britain and Ireland. Published by John Wiley & Sons, Ltd.
TNF and atherosclerosis 579
Figure 3. Relative mRNA levels of IL-6, IFNγ , IL-10, and Foxp3 in the spleens of mice bearing the three distinct TNF phenotypesfed the high-fat diet. The relative mRNA level was calculated at T5 and T15. Values are mean ± SD. Comparison between groupsat each time was performed using one-way ANOVA (non-parametric Kruskall–Wallis test, followed by Dunn’s post-test), andcomparison between two TNF genotypes was performed using the Mann–Whitney U-test
altered by the TNF phenotype. However, in the pres-ence of LPS, IL-6 secretion was strongly increasedin WT-TNF (×5.1), whereas this increase was lesspronounced in KI-TNF (×2.4) and was not signif-icant in KO-TNF macrophages (×1.4). LPS stim-ulated IL-10 secretion, although at a lesser extentthan in KI- and KO-TNF. Basal production of MCP-1 was significantly lower (−70%) in the KO-TNFgroup than in the other two groups, which showedcomparable levels. LPS stimulated MCP-1 secretionin all groups, but it remained significantly higherin the WT- and KI-TNF groups than in the KO-TNF group. Constitutive RANTES production, unde-tectable in culture media of all groups, was drasti-cally stimulated by LPS in WT-TNF macrophages(315 ± 57.5 pg/µg proteins), but significantly less inKI-TNF (99.5 ± 26.5 pg/µg proteins) and KO-TNFmacrophages (120.4 ± 35.8 pg/µg proteins). Constitu-tive accumulation of TNFR-1 did not differ betweenthe groups, whereas that of TNFR-2 was signifi-cantly lower in the KO-TNF than in the WT-TNFgroup (−47%). LPS, which did not alter TNFR-1release, consistent with previous data [31], signifi-cantly stimulated TNFR-2 accumulation in all the TNF
genotypes, although at a significantly lower level in theKI-TNF (−33%) and KO-TNF (−40%) groups (p <
0.05), compared with WT-TNF macrophages (data notshown).
Discussion
In this study, we have addressed the question ofwhether tmTNF alone modulates the development ofatherosclerosis to the same extent as wild-type TNF.To this end, we examined the effects of tmTNFon atherosclerosis progression in a genetic model ofthe pathology, eg ApoE-deficient mice carrying adeleted/mutated TNF gene that renders the synthesized26 kD tmTNF non-cleavable without affecting itsnormal expression in vivo and at the cell surface [16].In these mice, no sTNF is produced, as was verifiedin this study with macrophages stimulated with LPS.Thus, comparison of both WT-TNF and KO-TNF withKI-TNF mice allowed us to evaluate the respectivecontribution of tmTNF and sTNF in TNF effects.
After 15 weeks of a high-fat diet, lesion progres-sion in KI-TNF mice was reduced in the aortic arch,
J Pathol 2008; 214: 574–583 DOI: 10.1002/pathCopyright 2007 Pathological Society of Great Britain and Ireland. Published by John Wiley & Sons, Ltd.
580 M Canault et al
Figure 4. Production of mediators by macrophages from mice bearing the three distinct TNF phenotypes fed the high-fatdiet. Macrophages were collected at T15 and were stimulated or not by LPS (20 ng/ml) for 24 h. The conditioned mediumwas collected, cleared of debris, and assayed. Values, normalized with the amount of macrophage proteins, are mean ± SD.Comparisons between groups were performed by one-way ANOVA (non-parametric Kruskall–Wallis test, followed by Dunn’spost-test), and the LPS effect for each group was analysed with the Mann–Whitney U-test. All the LPS effects were statisticallysignificant (at least p < 0.05), except for IL-6 in the KO-TNF group (p > 0.05), but to simplify the presentation of statisticaldifferences, only comparisons between groups are displayed
with a less marked reduction in valves. It is knownthat regional differences in haemodynamics differen-tially modulate the gene expression response [32–34]and it is possible that the differential regulation ofcyto(chemo)kine production by TNF in WT-TNF andKI-TNF mice, as we have shown here, distinctlyaffects the site-dependent progression of atherosclero-sis. The trend towards lower progression of atheroscle-rosis in KI-TNF compared with WT-TNF mice isindependent of circulating lipids. The fact that KI-TNF mice did not strictly behave like KO-TNF miceindicates that tmTNF retains biological activity, whichwas previously recognized in an acute dietary model ofatherosclerosis induction in C57BL/6 wild-type mice[8], in other pathological conditions [15,16,35,36] orduring immune cell activation [37–42].
TNF deficiency univocally diminished lesion pro-gression in ApoE-deficient mice independently ofcirculating lipids. These data are consistent withour previous results obtained in C57BL/6 wild-typemale mice deficient in TNF fed an atherogenic dietfor 20 weeks [8] and in ApoE/TNF double-deficientfemale mice fed a high-fat diet [43], and with resultsobtained by others in ApoE/TNF double-deficientmice, irrespective of the fat content of the diet [9,10].
In ApoE∗3-Leiden transgenic mice kept on an athero-genic diet, the deficiency in TNF did not alter theglobal size of the lesions examined at 20 weeks [11],as reported in TNF-deficient mice on a C57BL/6 back-ground in an acute dietary model of atherosclerosis[44]. However, Boesten et al [11] noticed that the aor-tas of ApoE∗3-Leiden TNF-deficient mice presentedless advanced and conversely more early lesions thanthe aortas of mice expressing normal TNF, suggest-ing that TNF is important in the late maturation of thelesion once it is well installed. Consistently, we alsofound in our study that the effects of TNF deficiencywere not detectable on early lesions that developedeither after a short period of a high-fat diet (5 weeks)or after a long period of a chow diet (15 weeks).
The lower lesion progression in KO-TNF mice and,to a lesser extent, in KI-TNF mice fed the high-fatdiet did not alter their relative macrophage, actin, andcollagen contents. There are other examples showingthat a reduction in lesion size was not accompaniedby changes in macrophage, lymphocyte or collagencontents [9,45,46]. TNF mediates foam cell formation[47] and we have shown here that the TNF phenotypemodulates the inflammatory response of macrophages.Thus, one may propose that despite a similar relative
J Pathol 2008; 214: 574–583 DOI: 10.1002/pathCopyright 2007 Pathological Society of Great Britain and Ireland. Published by John Wiley & Sons, Ltd.

TNF and atherosclerosis 581
amount of macrophages in the plaque, the TNF-dependent inflammatory or differentiation state ofmacrophages may in turn alter their lipid loading.
It is known that the nature of the cellular sourceof TNF is essential for the immune inflamma-tory response. TNF does not have the same pro-inflammatory potential whether it derives frommacrophages/neutrophils, or T-cells and B-cells [48],which might be related to the ability of these cellsto release low or high amounts of sTNF [49]. Also,tmTNF expressed on T-cells appears to regulate theirimmune function [38,40,42,50–52] and mast cell-derived TNF was found not to be essential for athero-genesis [53]. Evidence of this differential modula-tion of inflammatory factors by the distinct molec-ular forms of TNF is provided herein by the datafrom macrophages and spleens. The time-dependentchanges in pro-inflammatory mediator levels mea-sured in spleens (IL-6, IFNγ ) were all lowered byTNF deficiency, although less prominent in KI-TNFspleens. Similarly, in macrophages, IL-6, RANTES,and MCP-1 production was significantly reduced byTNF deficiency, whereas MCP-1 was at a similarlevel in WT- and KI-TNF macrophages. This assumesa role for tmTNF in MCP-1 production. In WT-TNF, the mRNA levels of Foxp3, which is recog-nized as a T regulatory (Treg) cell specification tran-scription factor [54], were relatively stable betweenT5 and T15, whereas in the absence of sTNF (KI-and KO-TNF), these levels decreased, though moresignificantly in KO-TNF spleens. This may appearintriguing with regard to the lower development oflesions in KO-TNF mice, because natural Treg cellshave been described to limit atherosclerosis progres-sion [30]. The determination of the actual Treg cellcontent in lesions was not performed in this study,but it may be hypothesized that in the absence ofTNF, a smaller number of Treg cells would be neededto counter-regulate inflammation than when WT-TNFis present. This can be compared with two recentlypublished papers. First, TNF, upon binding to TNFR-2, synergistically with IL-2 promotes the expansionof Treg cells [55]. Second, although Treg cells werepoorly represented in human atherosclerotic lesions,their content was even lower in early than in highlyvulnerable lesions [56], an observation that could berelated to the enhanced inflammatory status of theadvanced lesions that is likely mediated partially byTNF. Thus, TNF exerts a complex contrasting role inatherogenesis by up-regulating both inflammation andTreg expansion. However since KO-TNF mice stilldevelop lesions, its role appears subservient to otherfactors.
Atherosclerotic lesion formation is associated withincreased signs of apoptosis in situ [57]. The lowerapoptosis level observed in valve lesions of KO-TNF mice likely contributes together with the lowerinflammatory status for the significantly attenuatedlesion progression. The extent of apoptosis was similarin KI-TNF and WT-TNF mice, which is in line with
previous data showing that the exclusive expressionof tmTNF in mice triggers apoptosis in various tissues[16,58]. In KI-TNF mice, the substantial apoptosisrate seen in the presence of tmTNF may maintainthe local innate and adaptive immune system in amore activated state, which may account for theless significant reduction in atherosclerosis progressionwhen compared with KO-TNF mice.
It is premature at this stage of investigation todelineate the molecular mechanisms that account forthe TNF (sTNF and/or tmTNF) signalling-dependenteffects on atherosclerosis. TNFR-2, which is mainlyexpressed on immune and endothelial cells, prefer-entially interacts with tmTNF [39]. Recently, it wasshown that interaction between tmTNF and TNFRs onmonocytes and T-cells contributes to enhanced sTNFproduction by monocytes [52] through the reverse sig-nalling process previously described to involve caseinkinase I activity on the tmTNF cytoplasmic part [59].In KI-TNF, this type of amplification is blocked as nosTNF is cleaved. We found that KI-TNF macrophagesproduced less TNFR-2, as already described [60], butwhether this might contribute to differential signallingin the arterial wall of WT- and KI-TNF mice remainshypothetical.
In conclusion, these data show that TNF effects onatherosclerosis development are detectable at stagesafter fatty streaks and that the wild-type and trans-membrane forms of TNF are not identical in regulat-ing inflammation-driven progression of the pathologybecause in wild-type TNF mice, sTNF that is derivedfrom tmTNF shedding has higher, though not exclu-sive, pro-inflammatory and atherogenic potential.
Acknowledgements
This work was supported by funds of Inserm (Paris, France) andUniversite de la Mediterranee (Marseille). MC was successivelya recipient of Fondation pour la Recherche Medicale (Paris) andof the Nouvelle Societe Francaise d’Atherosclerose (Paris). MPwas a recipient of Groupe de Reflexion sur la Recherche Car-diovasculaire (Paris). We wish to thank MF Bonzi (Marseille)and S Rihs (Bern, Switzerland) for their precious technical help.
Supplementary material
Supplementary material may be found at the webaddress http://www.interscience.wiley.com/jpages/0022-3417/suppmat/path.2305.html
References
1. Ross R. The pathogenesis of atherosclerosis: a perspective for the1990s. Nature 1993;362:801–809.
2. Barath P, Fishbein MC, Cao J, Berenson J, Helfant RH, For-rester JS. Detection and localization of tumor necrosis factor inhuman atheroma. Am J Cardiol 1990;65:297–302.
3. Rus HG, Niculescu F, Vlaicu R. Tumor necrosis factor-alphain human arterial wall with atherosclerosis. Atherosclerosis1991;89:247–254.
J Pathol 2008; 214: 574–583 DOI: 10.1002/pathCopyright 2007 Pathological Society of Great Britain and Ireland. Published by John Wiley & Sons, Ltd.

582 M Canault et al
4. Basaran Y, Basaran MM, Babacan KF, Ener B, Okay T,Gok H, et al. Serum tumor necrosis factor levels in acutemyocardial infarction and unstable angina pectoris. Angiology1993;44:332–337.
5. Bruunsgaard H, Skinhoj P, Pedersen AN, Schroll M,Pedersen BK. Ageing, tumour necrosis factor-alpha (TNF-alpha)and atherosclerosis. Clin Exp Immunol 2000;121:255–260.
6. Ridker PM, Rifai N, Pfeffer M, Sacks F, Lepage S, Braunwald E.Elevation of tumor necrosis factor-{alpha} and increased risk ofrecurrent coronary events after myocardial infarction. Circulation2000;101:2149–2153.
7. Skoog T, Dichtl W, Boquist S, Skoglund-Andersson C, Karpe F,Tang R, et al. Plasma tumour necrosis factor-alpha and earlycarotid atherosclerosis in healthy middle-aged men. Eur Heart J2002;23:376–383.
8. Canault M, Peiretti F, Mueller C, Kopp F, Morange P, Rihs S,et al. Exclusive expression of transmembrane TNF-[alpha] in micereduces the inflammatory response in early lipid lesions of aorticsinus. Atherosclerosis 2004;172:211–218.
9. Branen L, Hovgaard L, Nitulescu M, Bengtsson E, Nilsson J,Jovinge S. Inhibition of tumor necrosis factor-{alpha} reducesatherosclerosis in apolipoprotein E knockout mice. ArteriosclerThromb Vasc Biol 2004;24:2137–2142.
10. Ohta H, Wada H, Niwa T, Kirii H, Iwamoto N, Fujii H, et al.Disruption of tumor necrosis factor-[alpha] gene diminishesthe development of atherosclerosis in ApoE-deficient mice.Atherosclerosis 2005;180:11–17.
11. Boesten LS, Zadelaar AS, van Nieuwkoop A, Gijbels MJ, deWinther MP, Havekes LM, et al. Tumor necrosis factor-alphapromotes atherosclerotic lesion progression in APOE∗3-Leidentransgenic mice. Cardiovasc Res 2005;66:179–185.
12. Elhage R, Maret A, Pieraggi M-T, Thiers JC, Arnal JF, Bayard F.Differential effects of interleukin-1 receptor antagonist and tumornecrosis factor binding protein on fatty-streak formation inapolipoprotein E-deficient mice. Circulation 1998;97:242–244.
13. Eissner G, Kolch W, Scheurich P. Ligands working as receptors:reverse signaling by members of the TNF superfamily enhancethe plasticity of the immune system. Cytokine Growth Factor Rev2004;15:353–366.
14. MacEwan DJ. TNF ligands and receptors — a matter of life anddeath. Br J Pharmacol 2002;135:855–875.
15. Mueller C, Corazza N, Trachsel-Loseth S, Eugster H-P, Buhler-Jungo M, Brunner T, et al. Noncleavable transmembrane mousetumor necrosis factor-alpha (TNFalpha) mediates effects distinctfrom those of wild-type TNFalpha in vitro and in vivo. J BiolChem 1999;274:38112–38118.
16. Ruuls SR, Hoek RM, Ngo VN, McNeil T, Lucian LA, Janat-pour MJ, et al. Membrane-bound TNF supports secondary lym-phoid organ structure but is subservient to secreted TNF in drivingautoimmune inflammation. Immunity 2001;15:533–543.
17. Binder CJ, Chang MK, Shaw PX, Miller YI, Hartvigsen K,Dewan A, et al. Innate and acquired immunity in atherogenesis.Nature Med 2002;8:1218–1226.
18. Hansson GK, Libby P, Schonbeck U, Yan Z-Q. Innate andadaptive immunity in the pathogenesis of atherosclerosis. Circ Res2002;91:281–291.
19. Tedgui A, Mallat Z. Cytokines in atherosclerosis: pathogenic andregulatory pathways. Physiol Rev 2006;86:515–581.
20. Black RA, Rauch CT, Kozlosky CJ, Peschon JJ, Slack JL, WolfsonMF, et al. A metalloproteinase disintegrin that releases tumour-necrosis factor-alpha from cells. Nature 1997;385:729–733.
21. Moss ML, Jin SL, Milla ME, Bickett DM, Burkhart W,Carter HL, et al. Cloning of a disintegrin metalloproteinasethat processes precursor tumour-necrosis factor-alpha. Nature1997;385:733–736.
22. Canault M, Peiretti F, Kopp F, Bonardo B, Bonzi M-F, CoudeyreJ-C, et al. The TNF alpha converting enzyme (TACE/ADAM17)is expressed in the atherosclerotic lesions of apolipoprotein E-deficient mice: possible contribution to elevated plasma levels ofsoluble TNF alpha receptors. Atherosclerosis 2006;187:82–91.
23. Marino MW, Dunn A, Grail D, Inglese M, Noguchi Y, RichardsE, et al. Characterization of tumor necrosis factor-deficient mice.PNAS 1997;94:8093–8098.
24. Junqueira LC, Bignolas G, Brentani RR. Picrosirius staining pluspolarization microscopy, a specific method for collagen detectionin tissue sections. Histochem J 1979;11:447–455.
25. Alessi M-C, Bastelica D, Mavri A, Morange P, Berthet B, GrinoM, et al. Plasma PAI-1 levels are more strongly related to liversteatosis than to adipose tissue accumulation. Arterioscler ThrombVasc Biol 2003;23:1262–1268.
26. Caligiuri G, Nicoletti A, Poirier B, Hansson GK. Protectiveimmunity against atherosclerosis carried by B cells ofhypercholesterolemic mice. J Clin Invest 2002;109:745–753.
27. Buono C, Lichtman AH. Co-stimulation and plaque-antigen-specific T-cell responses in atherosclerosis. Trends Cardiovasc Med2004;14:166–172.
28. Binder CJ, Hartvigsen K, Chang M-K, Miller M, Broide D,Palinski W, et al. IL-5 links adaptive and natural immunity specificfor epitopes of oxidized LDL and protects from atherosclerosis. JClin Invest 2004;114:427–437.
29. Mallat Z, Gojova A, Brun V, Esposito B, Fournier N, Cottrez F,et al. Induction of a regulatory T cell type 1 response reduces thedevelopment of atherosclerosis in apolipoprotein E-knockout mice.Circulation 2003;108:1232–1237.
30. Ait-Oufella H, Salomon BL, Potteaux S, Robertson A-KL, GourdyP, Zoll J, et al. Natural regulatory T cells control the developmentof atherosclerosis in mice. Nature Med 2006;12:178–180.
31. Leeuwenberg J, Dentener M, Buurman W. LipopolysaccharideLPS-mediated soluble TNF receptor release and TNF receptorexpression by monocytes. Role of CD14, LPS binding protein,and bactericidal/permeability-increasing protein. J Immunol1994;152:5070–5076.
32. King VL, Szilvassy SJ Daugherty A. Interleukin-4 deficiencydecreases atherosclerotic lesion formation in a site-specific mannerin female LDL receptor − /− mice. Arterioscler Thromb Vasc Biol2002;22:456–461.
33. VanderLaan PA, Reardon CA Getz GS. Site specificity ofatherosclerosis: site-selective responses to atherosclerotic modu-lators. Arterioscler Thromb Vasc Biol 2004;24:12–22.
34. Veillard NR, Steffens S, Pelli G, Lu B, Kwak BR, Gerard C,et al. Differential influence of chemokine receptors CCR2 andCXCR3 in development of atherosclerosis in vivo. Circulation2005;112:870–878.
35. Dibbs ZI, Diwan A, Nemoto S, DeFreitas G, Abdellatif M,Carabello BA, et al. Targeted overexpression of transmembranetumor necrosis factor provokes a concentric cardiac hypertrophicphenotype. Circulation 2003;108:1002–1008.
36. Olleros ML, Guler R, Corazza N, Vesin D, Eugster H-P, Mar-chal G, et al. Transmembrane TNF induces an efficient cell-mediated immunity and resistance to Mycobacterium bovis bacillusCalmette-Guerin infection in the absence of secreted TNF andlymphotoxin-{alpha}. J Immunol 2002;168:3394–3401.
37. Perez C, Albert I, DeFay K, Zachariades N, Gooding L, KrieglerM. A nonsecretable cell surface mutant of tumor necrosis factor(TNF) kills by cell-to-cell contact. Cell 1990;63:251–258.
38. Ferran C, Dautry F, Merite S, Sheehan K, Schreiber R, Grau G,et al. Anti-tumor necrosis factor modulates anti-CD3-triggeredT cell cytokine gene expression in vivo. J Clin Invest1994;93:2189–2196.
39. Grell M, Douni E, Wajant H, Lohden M, Clauss M, Maxeiner B,et al. The transmembrane form of tumor necrosis factor is theprime activating ligand of the 80 kDa tumor necrosis factorreceptor. Cell 1995;83:793–802.
40. Parry SL, Sebbag M, Feldmann M, Brennan FM. Contact withT cells modulates monocyte IL-10 production: role of T cellmembrane TNF-alpha. J Immunol 1997;158:3673–3681.
41. Marra LE, Zhang ZX, Joe B, Campbell J, Levy GA, Penninger J,et al. IL-10 induces regulatory T cell apoptosis by up-regulation of the membrane form of TNF-{alpha}. J Immunol2004;172:1028–1035.
42. Harashima S-I, Horiuchi T, Hatta N, Morita C, Higuchi M,Sawabe T, et al. Outside-to-inside signal through the membrane
J Pathol 2008; 214: 574–583 DOI: 10.1002/pathCopyright 2007 Pathological Society of Great Britain and Ireland. Published by John Wiley & Sons, Ltd.
TNF and atherosclerosis 583
TNF-{alpha} induces E-selectin (CD62E) expression on activatedhuman CD4+ T cells. J Immunol 2001;166:130–136.
43. Kober F, Canault M, Peiretti F, Mueller C, Kopp F, Alessi M-C,et al. MRI follow-up of TNF-dependent differential progressionof atherosclerotic wall-thickening in mouse aortic arch from earlyto advanced stages. Atherosclerosis 2007;195:e93–99. Epub 2007July 30.
44. Schreyer SA, Vick CM, Le Boeuf RC. Loss of lymphotoxin-alphabut not tumor necrosis factor-alpha reduces atherosclerosis in mice.J Biol Chem 2002;277:12364–12368.
45. George J, Yacov N, Breitbart E, Bangio L, Shaish A, Gilburd B,et al. Suppression of early atherosclerosis in LDL-receptordeficient mice by oral tolerance with [beta]2-glycoprotein I.Cardiovasc Res 2004;62:603–609.
46. van Puijvelde GHM, Hauer AD, de Vos P, van den Heuvel R, vanHerwijnen MJC, van der Zee R, et al. Induction of oral toleranceto oxidized low-density lipoprotein ameliorates atherosclerosis.Circulation 2006;114:1968–1976.
47. Hsu HY, Twu YC. Tumor necrosis factor-alpha-mediated proteinkinases in regulation of scavenger receptor and foam cell formationon macrophage. J Biol Chem 2000;275:41035–41048.
48. de Boer OJ, van der Wal AC, Verhagen CE, Becker AE. Cytokinesecretion profiles of cloned T cells from human aorticatherosclerotic plaques. J Pathol 1999;188:174–179.
49. Grivennikov SI, Tumanov AV, Liepinsh DJ, Kruglov AA,Marakusha BI, Shakhov AN, et al. Distinct and nonredun-dant in vivo functions of TNF produced by T cells andmacrophages/neutrophils: protective and deleterious effects. Immu-nity 2005;22:93–104.
50. Aversa G, Punnonen J, de Vries JE. The 26-kD transmembraneform of tumor necrosis factor alpha on activated CD4+ T cellclones provides a costimulatory signal for human B cell activation.J Exp Med 1993;177:1575–1585.
51. Vudattu NK, Holler E, Ewing P, Schulz U, Haffner S, Burger V,et al. Reverse signalling of membrane-integrated tumour necrosisfactor differentially regulates alloresponses of CD4+ and CD8+ Tcells against human microvascular endothelial cells. Immunology2005;115:536–543.
52. Rossol M, Meusch U, Pierer M, Kaltenhauser S, Hantzschel H,Hauschildt S, et al. Interaction between transmembrane TNF andTNFR1/2 mediates the activation of monocytes by contact with Tcells. J Immunol 2007;179:4239–4248.
53. Sun J, Sukhova GK, Wolters PJ, Yang M, Kitamoto S, Libby P,et al. Mast cells promote atherosclerosis by releasing proinflam-matory cytokines. Nature Med 2007;13:719–724.
54. Fontenot JD, Rudensky AY. A well adapted regulatory con-trivance: regulatory T cell development and the forkhead familytranscription factor Foxp3. Nature Immunol 2005;6:331–337.
55. Chen X, Baumel M, Mannel DN, Howard OMZ, Oppenheim JJ.Interaction of TNF with TNF receptor type 2 promotes expansionand function of mouse CD4 + CD25+ T regulatory cells. JImmunol 2007;179:154–161.
56. de Boer OJ, van der Meer JJ, Teeling P, van der Loos CM, vander Wal AC. Low numbers of FOXP3 positive regulatory T cellsare present in all developmental stages of human atheroscleroticlesions. PLoS ONE 2007;2:e779.
57. Hegyi L, Skepper JN, Cary NR, Mitchinson MJ. Foam cellapoptosis and the development of the lipid core of humanatherosclerosis. J Pathol 1996;180:423–429.
58. Corazza N, Brunner T, Buri C, Rihs S, Imboden MA, Seibold I,et al. Transmembrane tumor necrosis factor is a potent inducer ofcolitis even in the absence of its secreted form. Gastroenterology2004;127:816–825.
59. Watts AD, Hunt NH, Wanigasekara Y, Bloomfield G, Wallach D,Roufogalis BD, et al. A casein kinase I motif present in thecytoplasmic domain of members of the tumour necrosis factorligand family is implicated in ‘reverse signalling’. EMBO J1999;18:2119–2126.
60. Canault M, Peiretti F, Mueller C, Deprez P, Bonardo B, Bernot D,et al. Proinflammatory properties of murine aortic endothelial cellsexclusively expressing a non-cleavable form of TNFalpha. Effecton tumor necrosis factor alpha receptor type 2. Thromb Haemost2004;92:1428–1437.
J Pathol 2008; 214: 574–583 DOI: 10.1002/pathCopyright 2007 Pathological Society of Great Britain and Ireland. Published by John Wiley & Sons, Ltd.
Copyright © 2022 FDOKUMEN