Programs and Plans of the National Center for Education ...
171
DOCUMENT RESUME AUTHOR TITLE INSTITUTION REPORT NO PUB DATE NOTE AVAILABLE FROM PUB TYPE EDRS PRICE DESCRIPTORS Sonnenberg, William, Ed. Programs and Plans of the National Center for Education Statistics. 2003 Edition. National Center for Education Statistics (ED), Washington, DC . NCES-2004-027 2003-12-00 170p.; For the 2002 Edition, see ED 472 154. ED Pubs, P.O. Box 1398, Jessup, MD 20794-1398. Tel: 877-433- 7827 (Toll Free). For full text: http://nces.ed.gov/pubs2004/2004027.pdf. Reports - Descriptive (14 1) EDRS Price MFOl/PC07 Plus Postage. *Data Collection; *Educational Research; *Planning; *Program Development ABSTRACT This report summarizes NCES's current statistical programs, major publications and plans for future work. The publication includes descriptions, timelines and plans for all of the NCES data collections, such as the Common Core of Data, Integrated Postsecondary Education Data system and the National Assessment of Education Progress. Also included are descriptions of NCES center wide programs and services such as, training, technology and customer service. (Author) Reproductions supplied by EDRS are the best that can be made from the original document.
-
Upload
khangminh22 -
Category
Documents
-
view
3 -
download
0
Transcript of Programs and Plans of the National Center for Education ...

DOCUMENT RESUME
AUTHOR
TITLE
INSTITUTION
REPORT NO PUB DATE NOTE AVAILABLE FROM
PUB TYPE EDRS PRICE DESCRIPTORS
Sonnenberg, William, Ed. Programs and Plans of the National Center for Education Statistics. 2003 Edition. National Center for Education Statistics (ED), Washington, DC . NCES-2004-027 2003-12-00 170p.; For the 2002 Edition, see ED 472 154. ED Pubs, P.O. Box 1398, Jessup, MD 20794-1398. Tel: 877-433- 7827 (Toll Free). For full text: http://nces.ed.gov/pubs2004/2004027.pdf. Reports - Descriptive (14 1) EDRS Price MFOl/PC07 Plus Postage. *Data Collection; *Educational Research; *Planning; *Program Development
ABSTRACT
This report summarizes NCES's current statistical programs, major publications and plans for future work. The publication includes descriptions, timelines and plans for all of the NCES data collections, such as the Common Core of Data, Integrated Postsecondary Education Data system and the National Assessment of Education Progress. Also included are descriptions of NCES center wide programs and services such as, training, technology and customer service. (Author)
Reproductions supplied by EDRS are the best that can be made from the original document.

National Center for Education Statistics
U.S. Depafiment of Education Institute of Education Sciences NCES 2004-027
Programs and Plans of the National Center for Education Statistics 2003 Edition
December 2003
William Sonnenberg Editor National Center for Education Statistics

U.S. Department of Education Rod Paige Secretary
lnstitute of Education Sciences Grover J. Whitehurst Director
National Center for Education Statistics Val Plisko Associate Commissioner
The National Center for Education Statistics (NCES) is the primary federal entity for collecting, analyzing, and reporting data related to education in the United States and other nations. It fulfills a congressional mandate to collect, collate, analyze, and report full and complete statistics on the condition of education in the United States; conduct and publish reports and specialized analyses of the meaning and significance of such statistics; assist state and local education agencies in improving their statistical systems; and review and report on education activities in foreign countries.
NCES activities are designed to address high prionty education data needs; provide consistent, reliable, complete, and accurate indicators of education status and trends; and report timely, useful, and high quality data to the U.S. Department of Education, the Congress, the states, other education policymakers, practitioners, data users, and the general public.
We strive to make our products available in a variety of formats and in language that is appropriate to a variety of audiences.You, as our customer, are the best judge of our success in communicating information effectively. If you have any comments or suggestions about this or any other NCES product or report, we would like to hear from you. Please direct your comments to:
National Center for Education Statistics lnstitute of Education Sciences US. Department of Education 1990 K Street NW Washington, DC 200065651
December 2003
The NCES World Wide Web Home Page address is hffp://nces.ed.gov The NCES World Wide Web Electronic Catalog is: hftp://nces.ed.gov/pubsearch
Suggested Citation
U.S. Department of Education, National Center for Education Statistics. Programs and Plans of the National Center for Education Statistics, 2003 Edition, (NCES 2004-027). Editor, William Sonnen berg. Washington, DC: 2003.
For ordering information on this report, write:
US. Department of Education ED Pubs PO. Box 1398 Jessup, MD 20794-1 398
Or call toll free 1 -877-4ED-Pubs
Content Contact: William C. Sonnenberg (202) 502-7453 William. Sonnenberg@?ed.gov
Congress has given the U.S. Department of Education's National Center for Education Statistics (NCES) the responsibility to collect and disseminate information on the condition of education in the United States and other countries, to analyze and report on the meaning and significance of these statistics, and to assist states and local education agencies in improving their own education statistics systems. To meet each of these obligations, the Center continually works with its "customers" in the education community to determine how it can best meet the demands for timely, useful information that maintains high statistical standards. The goal of NCES is to provide a balanced portfolio of products that reflect interest in data about new topics, while still recognizing the need for basic statistical information about educational institutions and trends.
This report summarizes current NCES statistical programs, including its major publications and plans for future work. In addition to updating the descriptions of longstanding data collections-such as the Common Core of Data (CCD), the Integrated Postsecondary Education Data System (IPEDS), and the National Assessment of Educational Progress (NAEP)-this edition focuses on some of the new and innovative work of NCES, especially noting the initiation of the newest longitudinal study, the Education Longitudinal Study of 2002. We are also pleased with the release of the newest interactive analysis tool on our web site (http://nces.edgov), Build a Table, which allows the user to select variables and construct tables using the past 5 years of our state, school district, and school- level data sets.
NCES has increased the availability of its data sets on CD-ROM. Together with advanced software packages that allow users to customize their search requests, these new electronic data systems, like Build a Table, greatly facilitate users' access to statistics. In addition, all recent NCES reports and an increasing proportion of survey data are available from the NCES web site.
The NCES contact persons for each study and activity are listed along with numbers where they can be reached. These staff members would be pleased to provide further information about NCES programs. NCES invites you to send comments on how to improve data collections and reports, as well as future editions of this publication.
Val Plisko Associate Commissioner, NCES
iii
Programs and Plans of the National Center for Education Statistics was prepared and edited by William Sonnenberg in the Annual Reports Program of the Early Childhood, International, and Crosscutting Studies Division in the National Center for Education Statistics, Institute of Education Sciences, U.S. Department of Education. Val Plisko, Associate Commissioner for the Early Childhood, International, and Crosscutting Studies Division, provided general guidance, although the document is a Center-wide product.
Thomas D. Snyder, Program Director of the Annual Reports Program, oversaw the development of this publication. Marilyn M. Seastrom, the Chief Statistician, was consulted for technical guidance and reviewed the entire report. Jeffrey Owings, Associate Commissioner for the Elementary1 Secondary and Libraries Studies Division; Dennis Carroll, Associate Commissioner for the Postsecondary Studies Division; and Peggy Can, Associate Commissioner for the Assessment Division, provided advice and guidance for the development of the report. Program staff cited throughout this document also reviewed the report.

... .................................................................................................................... COMMISSIONER'S STATEMENT 111
...................................................................................................................................... ACKNOWLEDGMENTS v
LIST OF TABLES ..................................................................................................................................................
1 INTRODUCTION ............................................................................................................................................... 1 What Kind of Data Does NCES Collect? .............................................................................................. 2 Who Uses NCES Statistics? ................................................................................................................. 3 How to Access NCES Data ................................................................................................................... 7
2 NCES CENTER-WIDE PROGRAMS AND SERVICES .................................................................................. 9 Statistics ................................................................................................................................................ 9
................................................................................................... Standards and Technical Review 9 ....................................................................... Quality Control and Statistical Standards Review 10
................................................................................................................................ Methodology 10 ....................................................................................................................................... Research 11
............................................................................................................................. Confidentiality 11 Customer Service ................................................................................................................................ 12
............................................................................................................. Customer Service Survey 12 .................................................................................................................. Outreach Partnerships 12
Practitioner's Web Page ............................................................................................................... 13 Training ........................................................................................................................................ 13
.......................................................................................................................................... Technology 14 ....................................................................................................................................... Web Site 15
.......................................................................................... Web Site Data Collection Operations 17
.............................................................. Building a Comprehensive. Integrated NCES Database 17
................................................................................................................... Technology Research 18 NCES Data Archive ............................................................................................................................ 18
3 ELEMENTARY AND SECONDARY EDUCATION ..................................................................................... 20 Data Uses ............................................................................................................................................ 20
................................................................................................................................................. Studies 21 ................................................................................................................. Common Core of Data 21
Schools and Staffing Survey ........................................................................................................ 24 ........................................................................................................... Teacher Follow-up Survey 28
.................................................................................................................. Private School Survey 29 ..................................... School Crime Supplement to the National Crime Victimization Survey 31
............................................................................................ School Survey on Crime and Safety 32
National Household Education Surveys Program (Early Childhood and School-Age Surveys) .. 34 Fast Response Survey System ...................................................................................................... 38
NCES Items in the Current Population Survey ............................................................................ 40
vii

Other Activities ................................................................................................................................... 41 1990 Census Mapping Project and School District Data Book .................................................... 41 Decennial Census School District 2000 Project ........................................................................... 43 Education Finance Statistical Center ............................................................................................ 44 Elementary and Secondary Handbooks ........................................................................................ 45
National Cooperative Education Statistics System ............................................................................. 47 National Forum on Education Statistics ....................................................................................... 47 Annual Meetings-Conferences .................................................................................................... 49 Cooperative System Fellows Program ......................................................................................... 50
Plans for Elementary and Secondary Education .................................................................................. 50
4 POSTSECONDARY AND ADULT EDUCATION ......................................................................................... 55 Data Uses ............................................................................................................................................ 55 Studies ................................................................................................................................................. 56
Integrated Postsecondary Education Data System ....................................................................... 56 National Household Education Surveys Program (Adult Education Surveys) ............................. 64 National Postsecondary Student Aid Study .................................................................................. 66 National Study of Postsecondary Faculty .................................................................................... 70 Survey of Earned Doctorates Awarded in the United States ........................................................ 72 Postsecondary Education Quick Information System .................................................................. 73
Other Activities ................................................................................................................................... 74 National Postsecondary Education Cooperative .......................................................................... 74 NCESBtate Postsecondary Education Coordination Network .................................................... 76 Integrated Postsecondary Education Data System (IPEDS) Workshops ..................................... 77 Postsecondary Handbooks ........................................................................................................... 78
Plans for Postsecondary and Adult Education ..................................................................................... 79
5 EDUCATIONAL ASSESSMENT .................................................................................................................... 83 Data Uses ............................................................................................................................................ 84 Studies ................................................................................................................................................. 84
National Assessment of Educational Progress ............................................................................. 84 High School Transcript Studies .................................................................................................... 89 National Assessment of Adult Literacy Survey ........................................................................... 92
Plans for Educational Assessment ....................................................................................................... 94
6 NATIONAL LONGITUDINAL STUDIES ...................................................................................................... 97 Data Uses ............................................................................................................................................ 98 Early Childhood Longitudinal Studies .............................................................. : ................................. 99
Early Childhood Longitudinal Study-Birth Cohort .................................................................... 100 Early Childhood Longitudinal Study-Kindergarten Class of 1998-99 ...................................... 103
Secondary Longitudinal Studies ........................................................................................................ 107 National Longitudinal Study of the High School Class of 1972 ................................................ 107 High School and Beyond ........................................................................................................... 109 National Education Longitudinal Study of 1988 ........................................................................ 112 The Education Longitudinal Study of 2002 ............................................................................... 117
8 viii
................................................................................................. Postsecondary Longitudinal Studies 120 ............................................................. Beginning Postsecondary Students Longitudinal Study 120
......................................................................... Baccalaureate and Beyond Longitudinal Study 122
.......................................................................................................... Plans for Longitudinal Studies 126
.................................................................................................................. 7 INTERNATIONAL STATISTICS 129 .......................................................................................................................................... Data Uses 129
........................................................................................................................ Studies and Activities 130 ........................................................... Trends in International Mathematics and Science Study 130
....................................................................................................... 1999 Civic Education Study 133 .......................................................................... Program for International Student Assessment 135
............................................................. Progress in International Reading Literacy Study 2001 136
......................................................................................... Adult Literacy and Lifeskills Survey 138
..................................................................... OECD International Education Indicators Project 139
....................................................................................... Plans for International Education Statistics 140
8 DATA ON VOCATIONAL EDUCATION .................................................................................................... 142 .......................................................................................................................................... Data Uses 142
.................................................................................................................................................... 9 LIBRARIES 145 .......................................................................................................................................... Data Uses 145
............................................................................................................................................... Studies 146 .............................................................................................................. Public Libraries Survey 146
........................................................................................................ Academic Libraries Survey 148 ............................................................................................................ School Library Statistics 149
................................................................................................... State Library Agencies Survey 150 ................................................................................ Plans for the Public Libraries Statistics Survey 151
....................................................................................................... Plans for Crosscutting Activities 152
..................................................................................................... 10 GENERAL PUBLICATIONS OF NCES 154
.............................................................................................................. The Condition of Education 154 ............................................................................................................ Digest of Education Statistics 155
.................................................................................................... Projections of Education Statistics 157
.................................................................................................... The Education Statistics Quarterly 158

.............................................................................. Table 1 . NCES Survey Data Available by Level of Education 4
Table 2 . Data Collection Calendar for Elementary and Secondary Education ..................................................... 53 Table 3 . Data Collection Calendar for Postsecondary and Adult Education ........................................................ 81
.......................................................................... Table 4 . Data Collection Calendar for Educational Assessment 95
Table 5 . Data Collection Calendar for Longitudinal Studies .............................................................................. 127 Table 6 . Data Collection Calendar for International Statistics ........................................................................... 141 Table 7 . Data Collection Calendar for Library Statistics Program ..................................................................... 153

The National Center for Education Statistics (NCES) collects statistics on the condition of education in the United States, analyzes and reports the meaning and significance of these statistics, and assists states, local education agencies, and postsecondary institutions in improving their statistical systems. NCES supports a wide range of activities, providing policy-relevant data on issues as diverse as enrollment trends, access of minorities to postsecondary education, the academic achievement of students, comparisons of the U.S. education system with education systems in other countries, and the effect of education on employment and economic productivity.
NCES programs are directed toward
maintaining and analyzing the following major cross-sectional databases: at the elementary/secondary level-the Common Core of Data (CCD), the Schools and Staffing Survey (SASS), and the Private School Survey (PSS); and at the postsecondary level-the Integrated Postsecondary Education Data System (IPEDS), the National Postsecondary Student Aid Study (NPSAS), the National Study of Postsecondary Faculty (NSOPF), and the Survey of Earned Doctorates Awarded in the United States (SED). Together, these studies provide accurate, timely, and relevant data on the condition of American education, as well as how it has changed over time. In addition, NCES conducts a National Household Education Surveys Program (NHES) covering various educational topics such as early childhood and adult education, program participation, education-related home activities, and parental involvement in education.
conducting surveys and analyzing data from the NCES Longitudinal Studies Programs: at the early childhood level-the Early Childhood Longitudinal Studies (ECLS) with birth and kindergarten cohorts; at the secondary school level-the National Longitudinal Study of 1972 (12th-grade cohort) (NLS:72), the High School and Beyond Study of 1980 (10th- and 12th-grade cohorts) (HS&B), the National Education Longitudinal Study of 1988 (eighth- grade cohort) (NELS), and the Education Longitudinal Study of 2002 (10th-grade cohort) (ELS); and at the postsecondary level-the Beginning Postsecondary Students Longitudinal Study (BPS) and Baccalaureate and Beyond Longitudinal Study (B&B), which follow students attending or completing postsecondary institutions. These studies address a variety of important education issues from birth through postsecondary school, including differences in student achievement, effects of financial aid on access to postsecondary education, youth employment, high school dropouts, discipline and order in schools, and the quality of education in public and private schools.

conducting the National Assessment of Educational Progress (NAEP), which assesses annually academic achievement at the national level in a number of domains, including reading, mathematics, writing, science, art, history, and geography. The reading and mathematics components of NAEP are administered every 2 years in grades 4, 8, and 12 at the national and state levels. Other components are administered at different times according to budgetary constraints and expressed need.
participating in international surveys of educational achievement and programs to develop cross-national education data and indicators such as the Trends in International Mathematics and Science Study (TIMSS), the largest, most comprehensive international study of schools and students ever undertaken.
administering targeted surveys through the Fast Response Survey System (FRSS) and the Postsecondary Education Quick Information System (PEQIS) 'that rapidly provide data on current policy issues.
collecting and reporting information on libraries through the Public Library Survey (PLS), ,
the Academic Library Survey (ALS), the School Library Media Center Survey, and the State Library Survey Agency (StLA).
analyzing and reporting data on vocational education.
synthesizing information from various surveys for the following NCES annual publications: Digest of Education Statistics, The Condition of Education, and Projections of Education Statistics.
Each chapter in this publication contains a brief introduction; a section on data uses; summaries of the various programs and plans; a list of selected publications, tabulations, and data files; an NCES contact person; and a data collection calendar for that group of programs.
What Kind of Data Does NCES Collect? NCES collects statistical data on all levels of education from preprimary education through
graduate study, including adult education. The surveys address a full range of education issues including student access, participation, and progress; achievement and attainment of students; organization and management of education institutions; curriculum, climate, and diversity of educational institutions; and financial and human resources of institutions, as well as economic and other outcomes of education. NCES surveys involve a broad spectrum of people and institutions involved in education.
The following examples of topics illustrate the scope of the NCES data collection and analysis activities:
Adults are asked about their participation in adult education and other learning activities.
Students are asked about their participation in school activities.
Parents are surveyed about their participation in their children's education.
Teachers are asked to report information about their classes.
Student dropout rates and achievement are measured.
Staffing ratios of public schools are compiled.
* Comprehensive finance data are collected.
Postsecondary education student participation rates in financial aid programs are gathered.
Institutions indicate program offerings.
Libraries report information on usage.
NCES data and tabulations are made available at various levels of aggregation, ranging from the institutional to the national levels (see table 1). The availability of data at a particular level of education is based on a variety of factors, including survey design and protection of confidential data. The level of aggregation of the data may affect how the data are available, whether in printed copy or only electronically. The aggregation of data required for a particular use can be an important determinant in the selection of the most appropriate survey database. Those who are interested in national-level public school enrollments have a variety of possible sources of information, while those needing enrollments for specific schools have one source. Some sample surveys, such as the NHES, are limited to national-level estimates because of the design of the survey. Data from other surveys, such as the CCD, are published as state-level summaries and district tabulations for large districts. In addition, CCD data files contain school- and school district-level records. Detailed data for individual schools, school districts, and colleges generally are made available only through electronic means because of the volume of the data. Table 1 summarizes the levels at which NCES data are available, either in printed or electronic format.
Who Uses NCES Statistics? NCES, along with other offices of the Institute of Education Sciences (IES), has developed an
information program that provides users of education statistics with access to a wide range of data. Statistical information is provided in printed and electronic formats from the web, the National Library of Education, and ED Pubs, the publication and products ordering system for the U.S. Department of Education.
Education statistics are used for a variety of purposes from research to policy formation. Congress uses data to study education issues, to plan federal education programs, to apportion federal funds among the states, and to serve the needs of constituents. Federal agencies (such as the U.S. Departments of Defense, Labor, and Commerce, and the National Science Foundation) are concerned with the supply of trained manpower coming out of schools and colleges, and also with the subjects that are being taught. State and local officials confront problems of staffing and financing public education. They use NCES statistics in all aspects of policy development and program administration. Educational organizations and professional associations use the data for planning, policy development, and research. The news media (such as national television networks, national news magazines, and many of the nation's leading daily newspapers) frequently use NCES statistics to inform the public about such matters as student achievement, school expenditures per student, and international comparisons. Business organizations use trend data on enrollments and expenditures to forecast the demand for their products. The general public uses education statistics to become more knowledgeable and to make informed decisions about current educational issues.
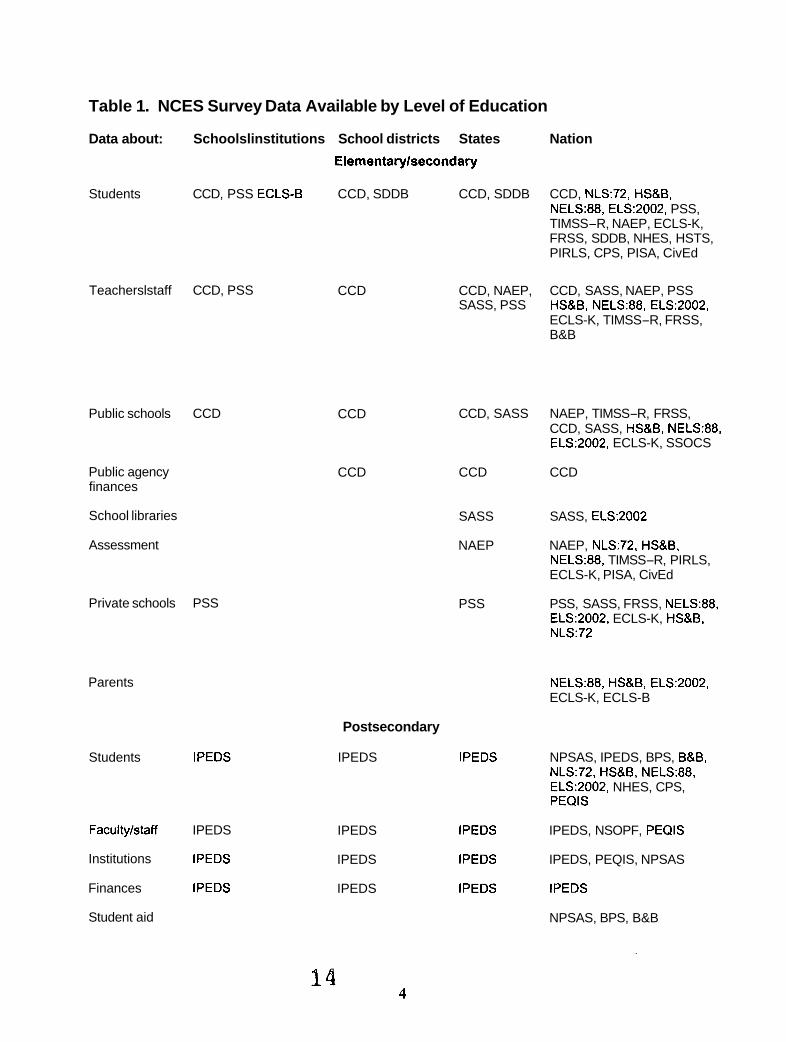
Table 1. NCES Survey Data Available by Level of Education
Data about: Schoolslinstitutions School districts States Nation
Elementarylsecondary
Students CCD, PSS ECLS-B CCD, SDDB CCD, SDDB CCD, NLS:72, HS&B, NELS:88, ELS:2002, PSS, TIMSS-R, NAEP, ECLS-K, FRSS, SDDB, NHES, HSTS, PIRLS, CPS, PISA, CivEd
Teacherslstaff CCD, PSS
Public schools CCD
Public agency finances
School libraries
Assessment
Private schools PSS
Parents
Students IPEDS
Facultylstaff IPEDS
Institutions IPEDS
Finances IPEDS
Student aid
CCD
CCD
CCD
Postsecondary
IPEDS
IPEDS
IPEDS
IPEDS
CCD, NAEP, CCD, SASS, NAEP, PSS SASS, PSS HS&B, NELS:88, ELS:2002,
ECLS-K, TIMSS-R, FRSS, B&B
CCD, SASS NAEP, TIMSS-R, FRSS, CCD, SASS, HS&B, NELS:88, ELS:2002, ECLS-K, SSOCS
CCD CCD
SASS SASS, ELS:2002
NAEP NAEP, NLS:72, HS&B, NELS:88, TIMSS-R, PIRLS, ECLS-K, PISA, CivEd
PSS PSS, SASS, FRSS, NELS:88, ELS:2002, ECLS-K, HS&B, NLS:72
NELS:88, HS&B, ELS:2002, ECLS-K, ECLS-B
IPEDS NPSAS, IPEDS, BPS, B&B, NLS:72, HS&B, NELS:88, ELS:2002, NHES, CPS, PEQIS
IPEDS IPEDS, NSOPF, PEQlS
IPEDS IPEDS, PEQIS, NPSAS
IPEDS IPEDS
NPSAS, BPS, B&B

Table 1. NCES Survey Data Available by Level of Education-Continued Data about: Schools/institutions School districts States Nation
Completions IPEDS
Adult education
Libraries
Households
ALS
IPEDS IPEDS IPEDS, BPS, B&B, NLS:72, HS&B, NELS:88, ELS:2002, SED, CPS
Lifelong learning
ALS
SDDB
NHES, NAAL, IALS, B&B, CPS, NELS:88, ELS:2002, HS&B, NLS:72
ALS, PLS, ALS, PLS, StLA, NHES, STLA FRSS
SDDB SDDB, NHES, NELS:88, ELS:2002, NAAL, IALS, HS&B, CPS
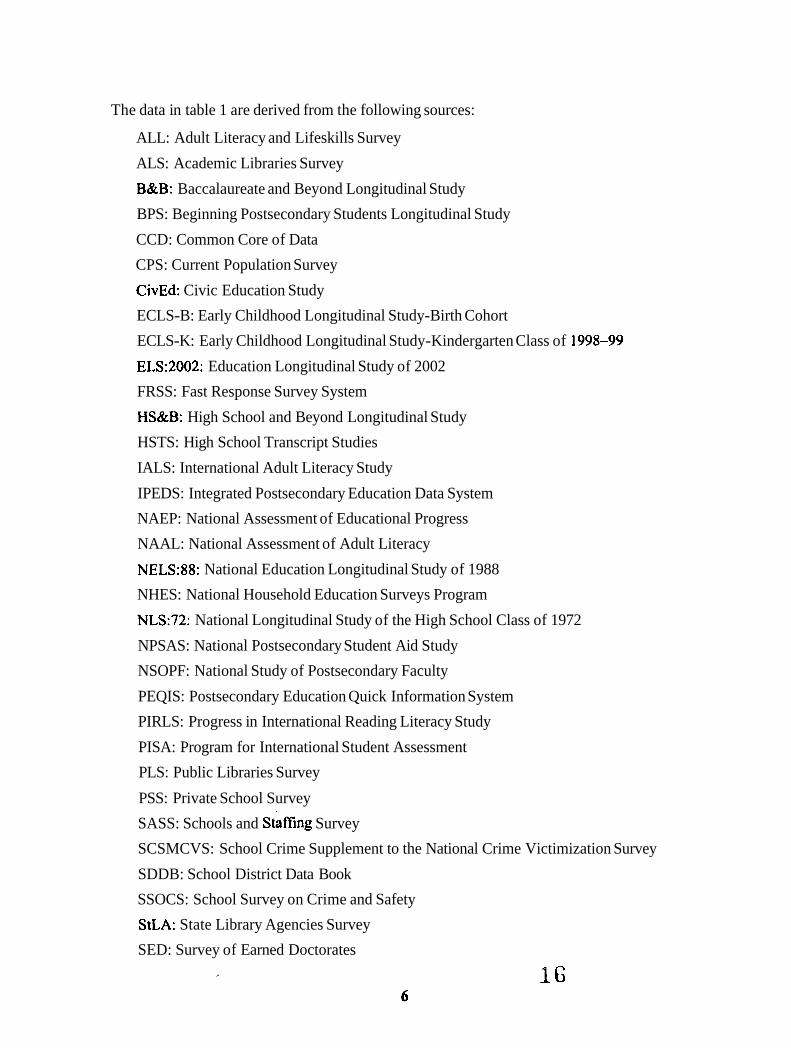
The data in table 1 are derived from the following sources:
ALL: Adult Literacy and Lifeskills Survey
ALS: Academic Libraries Survey
B&B: Baccalaureate and Beyond Longitudinal Study
BPS: Beginning Postsecondary Students Longitudinal Study
CCD: Common Core of Data
CPS: Current Population Survey
CivEd: Civic Education Study
ECLS-B: Early Childhood Longitudinal Study-Birth Cohort
ECLS-K: Early Childhood Longitudinal Study-Kindergarten Class of 1998-99
ELS:2002: Education Longitudinal Study of 2002
FRSS: Fast Response Survey System
HS&B: High School and Beyond Longitudinal Study
HSTS: High School Transcript Studies
IALS: International Adult Literacy Study
IPEDS: Integrated Postsecondary Education Data System
NAEP: National Assessment of Educational Progress
NAAL: National Assessment of Adult Literacy
NELS:88: National Education Longitudinal Study of 1988
NHES: National Household Education Surveys Program
NLS:72: National Longitudinal Study of the High School Class of 1972
NPSAS: National Postsecondary Student Aid Study
NSOPF: National Study of Postsecondary Faculty
PEQIS: Postsecondary Education Quick Information System
PIRLS: Progress in International Reading Literacy Study
PISA: Program for International Student Assessment
PLS: Public Libraries Survey
PSS: Private School Survey
SASS: Schools and staffing Survey
SCSMCVS: School Crime Supplement to the National Crime Victimization Survey
SDDB: School District Data Book
SSOCS: School Survey on Crime and Safety
StLA: State Library Agencies Survey
SED: Survey of Earned Doctorates
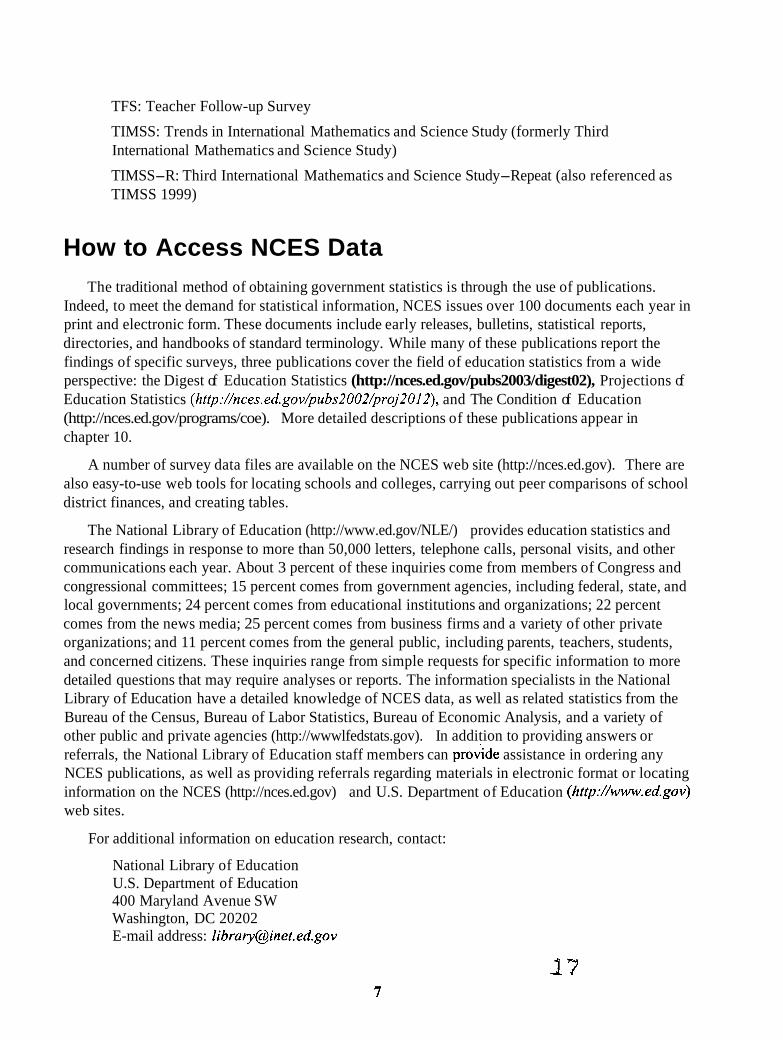
TFS: Teacher Follow-up Survey
TIMSS: Trends in International Mathematics and Science Study (formerly Third International Mathematics and Science Study)
TIMSS-R: Third International Mathematics and Science Study-Repeat (also referenced as TIMSS 1999)
How to Access NCES Data The traditional method of obtaining government statistics is through the use of publications.
Indeed, to meet the demand for statistical information, NCES issues over 100 documents each year in print and electronic form. These documents include early releases, bulletins, statistical reports, directories, and handbooks of standard terminology. While many of these publications report the findings of specific surveys, three publications cover the field of education statistics from a wide perspective: the Digest of Education Statistics (http://nces.ed.gov/pubs2003/digest02), Projections of Education Statistics (http://nces.ed.gov/pubs2002/proj2012), and The Condition of Education (http://nces.ed.gov/programs/coe). More detailed descriptions of these publications appear in chapter 10.
A number of survey data files are available on the NCES web site (http://nces.ed.gov). There are also easy-to-use web tools for locating schools and colleges, carrying out peer comparisons of school district finances, and creating tables.
The National Library of Education (http://www.ed.gov/NLE/) provides education statistics and research findings in response to more than 50,000 letters, telephone calls, personal visits, and other communications each year. About 3 percent of these inquiries come from members of Congress and congressional committees; 15 percent comes from government agencies, including federal, state, and local governments; 24 percent comes from educational institutions and organizations; 22 percent comes from the news media; 25 percent comes from business firms and a variety of other private organizations; and 11 percent comes from the general public, including parents, teachers, students, and concerned citizens. These inquiries range from simple requests for specific information to more detailed questions that may require analyses or reports. The information specialists in the National Library of Education have a detailed knowledge of NCES data, as well as related statistics from the Bureau of the Census, Bureau of Labor Statistics, Bureau of Economic Analysis, and a variety of other public and private agencies (http://wwwlfedstats.gov). In addition to providing answers or referrals, the National Library of Education staff members can provide assistance in ordering any NCES publications, as well as providing referrals regarding materials in electronic format or locating information on the NCES (http://nces.ed.gov) and U.S. Department of Education (http://w.ed.gov) web sites.
For additional information on education research, contact:
National Library of Education U.S. Department of Education 400 Maryland Avenue SW Washington, DC 20202 E-mail address: [email protected]

Telephone number in the United States: 1-800-424-16 16; From metropolitan Washington: (202) 205-50 15/50 19 (http://www.ed.gov/NLE/)
The National Library of Education also provides services through ED Pubs, the U.S. Department of Education's one-stop information products center. For copies of publications, contact:
ED Pubs Education Publications Center U.S. Department of Education P.O. Box 1398 Jessup, MD 20794-1398 E-mail address: [email protected] Telephone number: 1-877-4ED-Pubs (1-877-433-7827), toll free; TTYITDD: 1-877-576-7734, toll free
To identify and order current U.S. Department of Education publications and products, use the ED Pubs Online Ordering System (http://www.edpubs.org). The NCES web site (http://nces.ed.gov) also offers electronic access to many older publications now out of print.

NCES CENTER-WIDE PROGRAMS AND SERVICES
In order to fulfill the National Center for Education Statistics (NCES) mission, ". . .to collect, analyze, and disseminate statistics and other information related to education in the United States and in other nations," NCES strives to develop high-quality, customer-driven products that are readily available to all education stakeholders.
NCES is engaged in a set of agency-wide activities that are intended to help attain these goals. First, with respect to high quality, the reputation of NCES as a statistical agency is dependent on the integrity and the relevance of the information it produces. Second, with respect to customer-driven products, the value of NCES to the education community is contingent upon a full understanding of the data needs and interests of our customers. Third, with respect to availability, the success of NCES in making as much information available as possible hinges upon the effective use of technological advances.
Statistics
Standards and Technical Review
The NCES statistical standards provide the guiding principles for data collection, analysis, and reporting of education data. NCES staff and contractors use these standards in an ongoing effort to ensure the development of high-quality education data. From study design to final analysis, NCES products are subjected to a rigorous technical review process that involves statistical and subject- matter experts from NCES and the broader education community.
During study design and data collection, NCES uses a combination of internal work groups, external technical review groups, and contractors to design and collect data to meet the needs of the education community. Data collection and processing frequently involve the collaboration of NCES staff and several contractors configured in a manner designed to ensure checks and balances on quality control. Analyses are conducted only after analysis plans are developed and reviewed. Finally, the report review process usually involves a series of reviews by subject-matter and technical colleagues, culminating in a formal review by a combination of internal and external reviewers.
NCES continually strives to increase the efficiency of the full review process, while at the same time maintaining high standards. Thus, in the fall of 2002, NCES released the 2002 revised statistical standards and guidelines in the 2002 NCES Statistical Standards. These standards and associated guidelines are intended to assist NCES in meeting its primary goal of providing high-quality, reliable, useful, and informative statistical information to public policy decisionmakers and the general public. In particular, the standards and guidelines are intended for use by NCES staff and contractors to guide them in their data collection, analysis, and dissemination activities. These

standards and guidelines are also intended to present a clear statement to data users regarding how data should be collected in NCES surveys, and the limits of acceptable applications and use.
Quality Control and Statistical Standards Review
In the fall of 1996, the Commissioner convened the Task Force on Quality Systems to study NCES quality control procedures, with the goal of identifying ways to improve the current procedures. The work of this group was one starting point for some of the work involved in revising the NCES Statistical Standards. In addition to this work, NCES initiated agency-wide audits of survey methodology, imputation procedures, and response rates to inform the standards revisions.
In the summer of 2000, NCES convened 15 working groups that included over one-half of the agency's staff to participate in the standards revisions. The working groups were coordinated by a steering committee that included representation from the Statistical Standards Program and each of the data collection and reporting divisions within NCES. The individual working groups met regularly over a 9-month period through the spring of 2001. During that time, an NCES seminar was held to give all NCES staff an opportunity to comment on proposed revisions.
Throughout the summer and fall, the steering committee reviewed, and in some cases further revised, the drafts. As draft standards were completed, they were shared with NCES senior managers for further discussion and comments. During the spring of 2002, the steering coinmittee convened a 2-day meeting, followed by a comment period for NCES contractors, to give them an opportunity to review and comment on the NCES draft standards. After responses to those comments were incorporated and reviewed by NCES senior managers, the NCES draft standards were posted on the NCES web site for a 45-day public comment period, as part of an OMB-initiated data quality activity. Comments received during the public comment period were incorporated by the steering committee and reviewed and approved by senior managers. Then, in July 2002, NCES submitted draft standards to OMB and to an independent commissioned expert panel convened by the National Institute of Statistical Sciences (NISS). NCES incorporated comments and suggestions from these groups before the final review and adoption of the revised standards by senior managers. Following the fall 2002 adoption of the standards, members of the steering committee held a series of internal training sessions on the standards.
Methodology
In an effort to document NCES data collection procedures, the Statistical Standards Program sponsored the development of a handbook of NCES data collections. The handbook documents key aspects of the design, collection, and processing of NCES surveys. A related report that summarizes the imputation procedures in NCES data collections is also under development. In a complementary project, the Statistical Standards Program conducted a review of the response rates in each NCES data collection. The results of this review will also be published in an NCES report. The Statistical Standards Program is currently conducting Center-wide reviews of two areas: the use of incentives in NCES data collections and the application of nonresponse bias analyses in the evaluation of NCES data collections.

Periodically, statistical questions emerge that break new ground for NCES. The Statistical Standards Program consults and advises in these situations, and in some instances a panel of experts is used to consult on or review specific problems. Recent examples of this process include reviews of the issues surrounding the inclusion of students with limited English proficiency and students with disabilities in the National Assessment of Educational Progress (NAEP), of the response probability decision rules that are applied in NCES assessments, and of the NCES policies and procedures for analyzing data with low response rates.
Research
The Statistical Standards Program initiated research in two areas. The Education Statistics Services Institute (ESSI) is working on a project on total survey error for NCES data collection. The Statistical Standards Program is supporting research at ESSI and at Westat on alternative approaches to treatments for missing data and research at NISS on alternative approaches to avoiding disclosures of confidential data.
Confidentiality
Individual respondents-students, parents, teachers, and administrators-provide much of the data that NCES collects. NCES is required by law to develop and enforce standards designed to protect the confidentiality of individuals. This requirement covers the collection, reporting, and publication of data. The Statistical Standards Program has two major functions in this area. First, the program leads the Disclosure Review Board Team comprised of members from each NCES division, representatives of the Statistical Standards Program, and a representative from the U.S. Census Bureau. This team reviews disclosure risk analyses that are conducted on NCES data files to ensure that data released for public use do not place the identity of any individual respondents in jeopardy.
The second major activity in this area is to approve and monitor restricted-use data licenses. (Similar restricted-use data licenses, a concept pioneered by NCES, are now being used in other federal statistical agencies.) These licenses provide external researchers access to potentially individually identifiable NCES data covered under federal statutes and regulations by subjecting authorized users to the laws, regulations, and penalties that apply to the NCES use of confidential data. Under the license agreement, authorized users are subject to unannounced inspection visits. The Statistical Standards Program monitors the licensing process and the inspections.
Based on an analysis of inspection reports, program staff developed a set of recommendations for improved quality control and increased customer service. As a result, an automated system was developed for the field inspections. This facilitates immediate corrections of potential security problems and allows NCES staff to monitor licensees more effectively.
For more information on the NCES Statistical Standards Program, contact:
Marilyn M. Seastrom Chief Statistician Office of the Deputy Commissioner Statistical Standards Program National Center for Education Statistics

1990 K Street NW Washington, DC 20006 Telephone number: (202) 502-7303 E-mail address: [email protected]
Customer Service NCES is committed to providing a range of customer-driven products that are tailored to the
needs of different members of the education community. In an effort to meet this goal, data are made available in a variety of formats-from published statistical compendia and online data tools to microdata files for secondary analysis. NCES reports range from detailed technical, methodological, and analytic reports that provide an in-depth analysis of a particular topic or issue to Statistical Briefs and Issue Briefs that provide a short, focused analysis of a specific topic. In continuing the effort to make NCES statistics available to a broad audience, NCES launched the Education Statistics Quarterly, a periodical that includes findings from all NCES reports on a quarterly basis. All NCES publications are available online at the NCES web site (http://nces.ed.gov/pubsearch). NCES also continues to explore new and innovative ways to use the web to make education information available to as many data users as possible. (For more information, please see subsequent NCES "Technology" and "Web Site" descriptions in this chapter.)
Customer Service Survey
The NCES Commissioner established a Customer Service Team to ensure that sufficient effort is devoted to the continual monitoring of our customers' information needs. As a part of an ongoing effort to better understand the data needs and interests of the education community, this team conducts a biennial customer service survey. The purpose of the survey is to assess customer satisfaction with NCES products and services, and to identify areas that need improvement. The last customer survey was conducted in 2001. The survey's respondents do not include all NCES customers; instead, the survey focuses on specific customer groups. The 2001 survey targeted several large groups of current and potential users: federal, state, and local policyrnakers; academic researchers; and journalists.
The response rate to the 200 1 survey was 79 percent. The survey results indicate strong satisfaction with NCES and its products. However, awareness of NCES varies considerably between respondent groups and products. NCES customers use data for many purposes. Three main uses cited in the survey were general information, research and analysis, and planning. The data also suggested that the more experienced the user, the higher the level of satisfaction. The survey also indicated less satisfaction with the timeliness of NCES publications and data files, and the need for NCES to increase awareness of agency products and services. These are areas that NCES managers are seeking to improve.
Outreach Partnerships
In an effort to improve dissemination and increase the use of NCES education statistics, NCES has developed "partnerships" with external organizations whose members are either interested in education data or could become potential users. With NCES acting as a data "broker," these new
collaborative relationships provide an excellent means for expanding the NCES customer base and learning more about the needs of specific data users. And by making use of existing communication channels in other organizations, NCES is also able to make contact with potential customers.
Collaborative activities include providing information on NCES products in association newsletters and online services; developing links to web sites; providing training on NCES databases and other activities; developing individual workshops for specific data users; and identifying and assessing data needs. This two-way interaction with outside networks increases the utility of NCES products and services by more accurately reflecting the needs of various constituencies.
Practitioner's Web Page
Through focus groups and customer surveys, NCES has determined that local education practitioners (e.g., educators, administrators, counselors, librarians, and parents) are not adequately aware of NCES products and services. As a result, NCES developed a web page targeted to the data needs of these groups. This new online service, called "The K-12 Practitioners' Circle" (http://nces.e~.gov/practitioners), presents education data in a user-friendly manner and links to a wide range of NCES publications and other relevant resources. In addition to alerting users to NCES findings on both continuing and emerging education issues, it provides information on relevant research studies and other practical resource materials that local practitioners would find useful. The new web page will be updated regularly to respond to pressing education issues, and NCES will be encouraging feedback from its users.
Training
One way of ensuring that NCES staff members maintain state-of-the-art skills is through in- house training seminars on new and emerging statistical techniques and practices. The NCES training program director plans and coordinates these seminars on an as-needed basis. For example, over the past few years, seminars have been held on such topics as variance estimation; imputation of missing data; statistical significance testing; multiple regression analysis; logistic regression analysis; path analysis; hierarchical linear modeling; and special software, such as SUDAAN and Wesvar PC- computer programs, for handling survey data &om complex sample designs. The seminars also cover such topics as contract management and emerging educational priorities, issues, and policies. Although these seminars are tailored to the needs of NCES staff, they are open to the general public. Any interested staff members from other government agencies, professional associations, private companies, or other organizations may attend.
For the last several years, NCES has sponsored a series of advanced studies seminars in the Washington, D.C., area for external data users to promote and facilitate the effective use of NCES databases, such as the Early Childhood Longitudinal Study-Kindergarten Cohort, the National Education Longitudinal Study of 1988, the National Household Education Surveys Program, the Schools and Staffing Survey, the Trends in International Mathematics and Science Study, NAEP, the National Postsecondary Student Aid Study, the National Study of Postsecondary Faculty, and the Integrated Postsecondary Education Data System. These seminars are open to data users including faculty members and graduate students in higher education institutions, as well as researchers and data analysts at state and local education agencies, professional associations, and other federal

agencies. The lectures and hands-on computer seminars are designed to allow participants to conduct analyses on selected NCES databases. Applicants compete for a limited number of openings. Seminars are usually offered each summer and are about 3 to 4 days long. Participants also review certain statistical topics such as sample design, variance estimation, imputation, and sampling weights. To participate in these seminars, browse the NCES web site (http://nces.ed.gov/conferences) for seminar announcements and specifications for applying.
Instructors for both in-house and external data user seminars are usually NCES staff members who have extensive knowledge and experience in the given subject matter. Sometimes nationally known experts in pertinent fields are invited to give lectures.
An announcement for each seminar will be posted on the NCES web site (http://nces. edgov/conferences).
For more information on the NCES Customer Service Program, contact:
Beverly Coleman Training Program Director Office of the Commissioner National Center for Education Statistics 1990 K Street NW Washington, DC 20006 Telephone number: (202) 502-7427 E-mail address: [email protected]
Technology Technological advances have allowed NCES to improve both its internal activities and its ability
to provide the public with useful education statistics. NCES staff can conduct their work within the Center more efficiently and effectively, and the Center can collect, analyze, and disseminate more education data than ever before in a more flexible and easily accessible fashion.
Programs and individual projects are designed to be consistent with an overall vision of expanding access to NCES data. Advances in computer and telecommunication technologies are making it easier for all members of the education community-learners, parents, teachers, and administrators, as well as observers and policymakers-to come directly to NCES for information. Recent technology tools developed by NCES reduce the burdens of data collection, enhance the accuracy and timeliness of analysis, and increase the ease of access to education statistics.
A variety of plans are being implemented to fully incorporate current and emerging technologies into the NCES working environment, and to provide both internal and external customers with timely education statistics in useful formats. Internal activities include acquiring and supporting up-to-date desktop hardware and software to facilitate statistical analyses, developing integrated software solutions for program management, and leveraging local- and wide-area network resources to share information.
NCES currently provides access to its databases through several mechanisms. These include the dissemination of data via CD-ROMs, and most importantly through the NCES web site.
Current activities to enhance electronic access to NCES data include:
dissemination of products and services via the NCES web site;

improved data administration;
development and support of improved CD-ROM products for NCES databases;
fostering increased capabilities of data suppliers and users to submit and retrieve NCES data electronically through the NCES web site; and
expanding customer options for retrieving timely education data.
Web Site An essential component of the NCES Technology Program is the NCES web site
(http:/nces.ed.gov). The site contains an enormous amount of easily accessible education-related information, including research reports, data access tools, and raw data. It also provides links to additional information at the U.S. Department of Education web site (http://ww.ed.gov), as well as assistance in obtaining CD-ROMs of restricted-use data and survey data sets too large to download from the web.
The web site is the largest and most visible dissemination platform of NCES. Since the site's inception in May 1996, it has grown to include close to 30,000 pages, in addition to providing many online data access capabilities. Current usage statistics indicate that approximately 1,500,000 user sessions and over 7,000,000 page views take place on a monthly basis.
NCES has a full-time webmaster and a web team consisting of liaisons from all divisions and the Commissioner's office. The web site has become the primary mode of communication for NCES and its varied constituencies.
Features of the NCES web site include:
a complete catalog (over 2,000 products) of NCES publications and data products with customized search capabilities, including searches by title, author, subject, survey or program area, and other criteria, at http://nces.ed.gov/pubsearch;
product information pages containing brief descriptions, links to accessible formats of the desired products, ordering assistance, and other usehl information;
a staff directory, searchable by subject, topic specialty, or name;
the Student's Classroom for school-age visitors, with "find your school, library, or college" features, quizzes, games, easy-to-use graphing and probability functions, and many more engaging and educational activities, at http://nces.edgov/nceskids;
daily "Did You Know" education facts displayed on the site's home page;
statistical tables and education indicators for quick answers to inquiries;
the most recent data sets for downloading and analysis;
descriptions of NCES programs (http://nces.ed.gov/surveys), including separate web sites for all surveys and program areas;
a national locator (http://nces.ed.gov/globnllocator) for searches of public schools, private schools, public libraries, and postsecondary institutions; and

a "Newsflash" subscription service, organized by relevant topical areas of education research, about breaking NCES news (http://nces.ed.gov/newsflash).
The NCES web site also provides a direct link to the extensive collection of education-related materials at the Department of Education web site that includes:
information on the President's and Secretary of Education's priorities;
press releases;
descriptions of the Department's programs;
several searchable directories, including listings of education-related information centers, and Department s t a c
a bibliographical database of thousands of education-related studies;
funding opportunities;
event calendars;
Department research reports and informational publications; and
pointers to public web resources at Research and Development Centers, Regional Education Laboratories, ERIC Clearinghouses, and other Department-funded institutions.
A powerful function of the NCES web site is its ability to provide rich, flexible data access tools. NCES has developed searchable databases to facilitate the location of educational institutions and their characteristics. One example of a data access tool available through the site is the NCES Search for Public Schools (http://nces.ed.gov/ccd/schoolsearch). This feature allows customers to locate a school based on name, location, state, or other similar variables. Search for Public Schools includes statistics on individual school characteristics, such as teacher counts, number of students, studentfteacher ratio, and school enrollment by racelethnicity. Another popular search tool is College Opportunities Online (http://nces.ed.gov/ipeds/cool), an extensive searchable database of up-to-date information on over 9,000 U.S. colleges, universities, and technical institutions. Information featured in this program includes attendance charges and programs offered.
Newer and more sophisticated data access tools recently made available through the NCES web site provide users opportunities to manipulate data in increasingly more informative ways. Peer comparison tools allow users to compare the various libraries, school districts, and postsecondary institutions located throughout the United States. Using an advanced mapping application, the School District Demographics tool allows users to view census data in a more informative and intuitive manner. The Data Analysis System allows users to perform useful analyses online without having to download and format raw data, and the Quick Figures and Tables function provides access to thousands of previously analyzed data in table and figure formats to provide quick answers to topical research questions. A complete listing of NCES data access tools is available at http://nces.ed.gov/pubsearch/onlinedata.asp.
In the future, NCES will continue to enhance the utility of the web site by expanding the amount of material available and implementing more interactive capabilities within its databases.
For more information on the NCES web site, contact:
Gerald Malitz Webmaster
Office of the Deputy Commissioner Technology Support Program National Center for Education Statistics 1990 K Street NW Washington, DC 20006 Telephone number: (202) 502-7386 E-mail address: [email protected]
Web Site Data Collection Operations NCES has been developing web-based systems for the design and administration of survey data
collections for several years. Web-based surveys offer many advantages over other forms of data collection and analysis. They save time and money by reducing the amount of mailing, programming, data entry and cleaning, and preparation for analysis. They also provide more flexibility for researchers working with the data and respondents filling out the forms. Overall, web-based surveys increase the timeliness and quality of data while minimizing respondent burden.
NCES first used the web in this manner for data submissions in universe collections in the mid- 1990s. Next, the Center developed an online system to collect survey data from sampled institutions. The 1999 pilot of this system in the Institutional Prices and Student Financial Aid survey was successful, leading to its implementation in collections of data in the administration of three other surveys: Integrated Postsecondary Education Data System, State Library Agencies, and Academic Library Survey.
After these successes, NCES broke new territory in education data collection by applying data encryption methods so that it was possible to securely collect confidential survey data not just from institutions, but also from individual survey respondents. This secure data collection system will be implemented beginning with the administration of the longitudinal Baccalaureate and Beyond (B&B) survey. In 2001, NCES began creating an interactive interface for the administration of the system that allows statisticians to maintain surveys without programmer support. These online survey collection initiatives helped to create uniformity and consistency across NCES surveys and to provide a foundation for an NCES comprehensive integrated database.
NCES is working on a collaborative pilot project with four states to develop Extensible Markup Language (XML) technology for use in the collection of data from the universe of U.S. public elementary and secondary schools. NCES is also collaborating with the Planning and Performance Management Service in the Office of the Deputy Secretary of the Department of Education to evaluate the use of XML technology in support of the Performance-Based Data Base Management initiative. This technology is expected to form the foundation of the next generation of interactive data exchange. Eventually, schools and local and state education agencies will be able to use this XML technology to collect and share education-related and administrative data.
Building a Comprehensive, Integrated NCES Database The concept of providing an integrated collection of related data from multiple sources in order
to respond to complex inquiries has been around for some time. Integrating scattered resources into a central database is the next logical step in the expansion of automated information systems, enabling much more powerful and flexible analysis. With education statistics, analyses have often been
constructed with specific survey data. Cross-survey or time-trend analyses frequently required long and expansive data massaging and custom analysis. A centralized database of education information will provide a rich, yet convenient resource for in-depth research. It will also provide a mechanism to respond to simple, but specific queries, such as: "How do enrollment changes in my school district compare with those in other similar districts in another state?"
I The objective is to build a new education information source within the web site that will provide
integrated access to survey and linked survey data, metadata, survey instruments and documentation, and ultimately reports and other published analysis. The database will be distinguished from existing NCES products in three respects: It will be exclusively Web based; it will contain a growing repository of linked data from different surveys; and it will feature tools that will enable customers to easily find, extract, and analyze NCES data directly. The NCES centralized database will be designed to expand and improve as more data are uploaded and web tools become more powerful. From a customer perspective, the major benefit of the database will be more extensive web access to NCES survey data and documentation.
Technology Research In addition to incorporating current technologies into its programs and operations, NCES helps
sponsor a broad agenda to extend technological capabilities. This is a complementary effort in support of the National Science Foundation's "Digital Government Initiative."
NCES is currently working on three research topics:
the use of advanced database technologies to support statistical hnctions, such as standard error calculations for complex sample survey data;
the development of clustered index algorithms for spatial databases; and
the development of statistical analysis techniques for time-event indexed video databases.
For more information on the NCES Technology Program, contact:
Gerald Malitz Chief Technology Officer Office of the Deputy Commissioner Technology Support Program National Center for Education Statistics 1990 K Street NW Washington, DC 20006 Telephone number: (202) 502-7386 E-mail address: [email protected]
NCES Data Archive NCES sponsors the International Archive of Education Data at the Inter-University Consortium
for Political and Social Research (ICPSR), University of Michigan, to archive NCES databases. This archive includes a vast range of national and international data on education collected primarily by NCES from the 1960s to the present. These databases are available at no charge in ASCII flat file format that can be used with statistical processing software such as SAS and SPSS.

The goal of the archive is to share information about education with researchers, academics, policymakers, service providers, and other customers. NCES currently maintains over 500 national data collections relating to education. The data are collected from elementary and secondary schools, colleges, and universities, as well as from elementary, secondary, and postsecondary students and teachers. Each data collection contains an abstract, a codebook, and one or more data files for research use. No statistical tables or printed reports are included. This archive makes this wealth of data publicly available and readily accessible. Additional NCES databases, both new and old, will be routinely added to the archive.
This archiving project will preserve and enrich the research resources of NCES, as well as produce an archive of data sets that can be used effectively in the era of the web. It will also significantly enhance documentation of NCES data to make them more user friendly. The publicly available data can be accessed and downloaded directly from the ICPSR web site (http://www. icpsr. umich.edu/IA ED/).
For more information on the Data Archive, contact:
Patrick Rooney Early Childhood, International and Crosscutting Studies Division National Center for Education Statistics 1990 K Street NW Washington, DC 20006 Telephone number: (202) 502-7308 E-mail address: [email protected]

ELEMENTARY AND SECONDARY EDUCATION
The National Center for Education Statistics (NCES) program at the elementary and secondary level provides information on the condition of public and private education. Data collections include information on today's important issues, such as equity between schools and school districts, access to preschool programs, student trends, persistence, and the climate in our schools and classrooms. Other important issues addressed are school finance, school safety, teacher qualifications, school reform, teacher professional development, and the education of special-needs populations. The core program includes national, state, and local data collection systems on public elementary and secondary education (e.g., the Common Core of Data (CCD) Survey). Other key NCES data collection programs include the Schools and Staffing Survey (SASS), the Private School Survey (PSS), and the National Household Education Surveys Program (NHES). These surveys, along with the Early Childhood Longitudinal Study, National Education Longitudinal Study of 1988, the National Longitudinal Study of 1972, High School and Beyond, the National Assessment of Educational Progress, and the Trends in International Mathematics and Science Study, supply a wealth of information about elementary and secondary education in the nation.
Data Uses
The statistics collected from state education agencies, other elementary/secondary institutions, staff, and students are used extensively by people outside of NCES. They are used for testimony before congressional committees, planning in various federal executive departments, and projects developed by professional organizations. They are used by state executive and legislative staff, state and local education agencies, and associations of local school systems. Other users are colleges, universities, education research facilities, businesses that work with educational institutions, and the media (for reporting on educational issues and events).
Federal, state, and local governments make numerous requests for data. For example, representatives often request data on the demographic characteristics of school districts in their states; federal agencies request data on numbers of teachers and pupils by school level and type; state governments request data on high school dropouts and teacher attrition rates; and local governments request analyses of teacher demographics. In addition to federal, state, and local governmental requests for elementary and secondary information, foreign governments also request data on trends in American public schools.
The media often need a great deal of data on elementary and secondary education for their reporting. For example, the media have used analyses of first-time teachers in the United States, characteristics of public schools, dropout rates, test scores, and urban school trends in their reporting.
Colleges and universities request CD-ROMs of all of the elementary and secondary surveys. Some items of interest for college researchers have been teacher qualifications in mathematics and
science, poverty status of schools and school districts, free-lunch eligibility of students, dropout rates and high school completions, class size, crime and violence, and persistence and attainment.
Business organizations, including marketing and survey firms, use demographic profiles of schools and districts in their research. Also, parents use data on elementary and secondary schools and school districts (such as per pupil expenditures and class size) when they are in the process of moving their families to a new location.
Common Core of Data
The Common Core of Data (CCD) is the primary NCES database on public elementary and secondary education in the United States. The annual CCD is a comprehensive national statistical database of all public elementary and secondary schools and school districts that contains comparable data across all states.
The objectives of the CCD are twofold. First, it is designed to provide an official listing of all public elementary and secondary schools and school districts in the nation that can be used to select samples for other NCES surveys, and to provide directory information for a variety of users. Second, the CCD provides basic information and descriptive statistics on public elementary and secondary schools, students, and staff.
The data sets within the CCD can be used separately or linked with one another to provide information on many topics of interest. For example, they can be used to analyze differences in expenditures for education across large and small, or urban, suburban, and rural school districts. The CCD can be used to produce dropout rates for different types of3chool districts-and track changes -
over time. It also can be used to measure changes in the raciaVethnic distribution of students in public schools. The school universe allows users to look at characteristics, such as pupiVteacher ratios at various instructional levels, or to use the addresses in the school locator to request records for transferring students. All of this information can be found on the CCD web site (http://nces.ed.gov/ccd). In addition, an annually produced CD-ROM links all of the CCD data, fiscal and nonfiscal, with school district-level data from the 1990 Decennial Census in an easy-to-use format. (Census 2000 data will be added in 2003.)
The CCD is an important resource for policymakers at the state and local levels. The CCD provides basic statistics on schools, school districts, and states. Some examples of descriptive statistics available from CCD are student enrollment by racelethnicity, the number and types of schools, revenues and expenditures of school districts, and the number of high school completers and dropouts.
Design The CCD survey collects data on all elementary and secondary,schools, local education
agencies, and state education agencies (SEAS) throughout the United States. The CCD contains three categories of information: general descriptive information on schools and school districts, data on

students and staff, and fiscal data. The general descriptive information includes school and district name, address, phone number, and type of locale (e.g., rural or urban), as well as some information about the type of school (e.g., magnet, Title I, charter) or district (e.g., regular, state operated).
The data on students include demographic, enrollment, and outcome characteristics. The numbers and types of education staff are reported as well. The fiscal data cover revenues and expenditures by object and function.
The CCD is made up of five surveys sent to state education departments. Most of the data are obtained from administrative records maintained by SEAs. Statistical information is collected annually from public elementary and secondary schools (approximately 94,000), public school districts (approximately 17,000), the 50 states, the District of Columbia, the Bureau of Indian Affairs (BIA), the U.S. Department of Defense dependents' schools, and the 5 outlying areas. The SEAs compile CCD data into prescribed formats and transmit the information to NCES.
Components Public School Elementary/Secondary Universe Survey-Information on all public elementary and secondary schools in operation during a school year, including school location and type; latitude and longitude; locale (e.g., rural, urban); magnet, Title 1, and charter school indicators; grade span; address and telephone number; enrollment by grade and student characteristics; number of classroom teachers; and number of free lunch-eligible and migrant students.
Local Education Agency Universe Survey-Information including address and telephone number, location and type of agency, latitude and longitude, locale (e.g., rural, urban), current number of students, migrant student enrollment, number of students with limited-English proficiency served, number of students with special individual education plans, and number of high school completers and dropouts from the previous year. The numbers and types of staff (e.g., teachers and guidance counselors) are also reported.
State Nonjiscal Survey of Public Elernentary/Secondary Education-In formation on all students and staff aggregated to the state level, including number of students by grade level, full-time- equivalent staff by major employment category, and number of high school completers from the previous year.
National Public Education Finance Survey-Detailed finance data at the state level, including average daily attendance; school district revenues by source (local, state, and federal); and expenditures by hnction (instruction, support services, and noninstruction), subfunction (e.g., school administration), and object (e.g., salaries). This survey also includescapital outlay and debt service expenditures.
School District Finance Survey (F-33)-Detailed data by school district, including revenues by source, expenditures by function and subfunction, and enrollment. These data are collected annually through the Bureau of Census F-33, Survey of Local Governments. Data are collected from all districts.

Major Publications School District Revenues for Elementary and Secondary Education: 1997-98 (June 2003)
Statistics in Briefi Revenues and Expenditures for Public Elementary and Secondary Education: School Year 2000-01 (June 2003)
Statistics in Briefi Revenues and Expenditures by Public School Districts: School Year 1999-2000 (June 2003)
Overview of Public Elementary and Secondary Schools and Districts: School Year 2001-02 (May 2003)
Public School Student, Stag and Graduate Counts by State: School Year 2001-02 (May 2003)
Directory of Public Elementary and Secondary Education Agencies 2000-01 (November 2002)
Characteristics of the 100 Largest Public Elementary and Secondary School Districts in the United States: 2000-01 (August 2002)
Public High School Dropouts and Completers From the Common Core of Data: School Years 1998- 99 and 1999-2000 (August 2002)
Financing Elementary and Secondary Education in the States: 1997-98 (May 2002)
Data Files and Web Tools CCD Public School and District Locators: http://nces.ed.gov/ccd/search.asp
CCD Build a Table Tool: http://nces. ed.gov/ccd/bat
Data File: National Public Education Financial Survey: FY 2001 (June 2003)
Data File: CCD Public ElementarylSecondary School Universe Survey: School Year 2001-02 (May 2003) . - . - -
Data File: CCD State Nonfiscal Survey of Public Elementary and Secondary Education: School Year 2001-02 (May 2003)
Data File: Local Education Agency Universe Survey: School Year 2001-02 (May 2003)
Data File: Common Core of Data State Public ElementaryISecondary Education Dropout and Completion File: School Years 199 1-92 Through 1996-97 (September 2002)
CD-ROM: Common Core of Data (CCD): School Years 1996-97 Through 1999-2000 (May 2002)
The CCD can be found on the web (http://nces.edgov/ccd). For hrther information on the CCD, contact the following NCES staff members (listed by CCD survey):
Public ElementaryBecondary School Universe, Local Education Agency Universe, and State Surveys
John Sietsema ElementaryISecondary and Libraries Studies Division Elementary/Secondary Co-Operative system and Institutional Studies Program National Center for Education Statistics 1990 K Street NW
Washington, DC 20006 Telephone number: (202) 502-7425 E-mail address: [email protected]
National Public Education Finance Survey and School District Finance Survey (F-33)
Frank Johnson ElementaryISecondary and Libraries Studies Division ElementaryISecondary Co-Operative System and Institutional Studies Program National Center for Education Statistics 1990 K Street NW Washington, DC 20006 Telephone number: (202) 502-7362 E-mail address: [email protected]
State Nonfiscal Survey of Public Elementary and Secondary Education
Beth Young ElementaryISecondary and Libraries Studies Division ElementaryISecondary Co-Operative System and Institutional Studies Program National Center for Education Statistics 1990 K Street NW Washington, DC 20006 Telephone number: (202) 502-7480 E-mail address: [email protected]
Schools and Staffing Survey
The School and Staffing Survey (SASS) is an extensive survey of American public and private kindergarten through 12th-grade schools. Its linked design provides information on public, private, Bureau of Indian Affairs (BIA), and public charter schools; the principals who head these schools; and the teachers who work in them.
SASS has five unique features:
SASS is representative of K-12 teachers, principals, schools, and school districts at the state (public only) and national levels.
SASS provides detailed data on both the public and private sectors-state-reliable data on public schools and affiliation data on private schools.
SASS collects data from charter schools as part of the public section and every school operated by the BIA. It also oversamples schools that have an American Indian student enrollment of 20 percent or more.
SASS collects data from school library media centers.
SASS-licensed users can analyze data across various components of SASS. Licensed users can link teachers and principals to their schools and schools to their school districts.

The most recent data available fiom SASS were collected in the 1999-2000 school year. Over 100,000 SASS questionnaires were mailed to collect information on teachers, principals and school heads, schools, school districts, and school library media centers. In 1999-2000, SASS collected information on a number of new topics crucial to education reform. At the same time, SASS retained or expanded many of the topics covered in previous surveys, maintaining the comparability for trend analysis.
New coverage includes:
school and district performance reports--content, uses, and rewards or sanctions for performance;
computers-number, uses, access to the web, and availability of computer support;
standards for home-schooled students;
charter schools; and
migrant student enrollment and services.
Examples of retained or expanded coverage include:
teacher and principal demographics;
teacher training, experience, certification, assignment, and salary;
newly hired teachers;
teacher migration and attrition;
professional development;
parent involvement; and - - school safety.
SASS large sample sizes (approximately 6,000 school districts, 10,000 public schools, 3,500 private schools, 60,000 public school teachers, and 12,000 private school teachers) allow extensive disaggregation of data by important characteristics of schools, such as the poverty level of the students, urbanicity, and minority enrollment; and of teachers, such as their demographic characteristics and teaching assignment field. SASS data were first collected in the 1987-88 school year, and again in the 1990-9 1, 1993-94, and 1999-2000 school years. One year after each collection, a follow-up survey of teachers is conducted to measure teacher attrition and mobility (see the "Teacher Follow-up Survey" description in this section). SASS will be administered every 4 years in the future, with the next collection occurring in school year 2003-04.
Data fiom SASS are used by Congress, the U.S. Department of Education, and other federal agencies; state education agencies (SEAS); educational associations; business firms that market education services; and the education research community for the following purposes:
to profile the teacher workforce, including demographic characteristics, academic background, qualifications to teach in fields of assignment, workload, professional development, career plans, compensation, and perceptions of the teaching profession and their workplace;
to profile the principal workforce, including demographic characteristics, academic background, qualifications, and training for administration, and to assess school climate and decisionmaking;
to describe the qualifications of teachers to teach in their subject fields and, in particular, to monitor the rate of out-of-field teaching (i.e., teachers teaching in a subject area without certification, or a college major or minor in that field);
to provide information on school conditions and programs, including basic descriptors of schools, enrollments, organization, curricula, student programs and services, staffing, student characteristics, school climate, and teacher workplace conditions; and
to provide information on aspects of teacher supply and demand, shortages, and turnover, such as methods of covering unfilled vacancies, and policies, practices, and circumstances influencing supply and demand conditions.
Design The sample design for SASS is a stratified probability sample in which schools are selected first;
then within schools, the principal and a sample of teachers are surveyed. The SASS sample has been designed to support the following types of estimates and comparisons: national and state estimates for public schools, teachers, and districts; national estimates for private schools and teachers by religious affiliation or type of school; national data on BIA schools; national data on public charter schools; and national comparisons of elementary, secondary, and combined schools and teachers. The teacher sample also supports comparisons of new versus experienced teachers, teachers by teaching assignment field, and many other characteristics of teachers.
For the 1999-2000 administration of SASS, one major new component was added to the survey. SASS covered the entire population of public charter schools in the United States, as well as their principals, as of the 1998-99 school year. In addition, in the same manner as for traditional public and private schools, a sample of teachers within each charter school was surveyed.
Core Components School District Survey-Survey of public school districts on enrollment information, recruitment and hiring of teachers, compensation, school and student performances, school organization, home schooling, graduation requirements, professional development, and migrant education.
School Survey-Survey of public, private, BIA, and public charter schools on general school information, admissions, programs and performance, student and class organization, parent involvement, school safety, staffing, technology, and special programs and services.
School Principal Survey-Survey of public school principals, private school heads, and BIA and public charter school principals about their experience and training, attitudes and opinions about education and their school, teacher professional development, activities related to assessing and maintaining teacher and school performance, and demographic information.
Teacher SurvepSurvey of public, private, BIA, and public charter school teachers about their demographics, teaching assignment, certification and training, professional development, class
organization, resources and assessment of students, working conditions, involvement in decisionmaking, and compensation and general employment information.
School Library Media Center Survey-Survey of public and private school libraries or media centers on facilities, staffing, technology, collections and expenditures, scheduling and transactions, collaboration with classroom teachers, and library or media center policy.
Teacher Follow-up Survey-See later description in this section.
Major Publications A Profile of America's Schools: Results From the Schools and Staffing Survey, 1999-2000
(Forthcoming)
Qualifications of the Public School Teacher Workforce: Prevalence of Out-of-Field Teaching 1987- 88 to 1999-2000 (May 2002)
School and Staflng Survey, 1999-2000: Overview of the Data for Public, Private, Public Charter, and Bureau of Indian Affairs Elementary and Secondary Schools (May 2002)
Toward Better Teaching: Professional Development in 1993-1994 (July 1998)
Public School Districts in the United States: A Statistical Profile, 1987-88 to 1993-94 (February 1998)
Job Satisfaction Among America's Teachers: Effects of Workplace Conditions, Background Characteristics, and Teacher Compensation (August 1997)
America 's Teachers: Profile of a Profession, 1993-94 (July 1997)
Public and Private School Principals in the United States: A Statistical Profile, 1987-88 to 1993-94 (June 1997)
Data Files CD-ROM: The 1999-2000 Schools and Staffing Survey (SASS) Restricted-Use Data With
Electronic Codebook (June 2003 revised)
CD-ROM: The Schools and Staffing Survey (SASS) and Teacher Follow-up Survey (TFS) Electronic Codebook and Public-Use Data for Three Cycles of SASS and TFS (July 1998)
CD-ROM: The Schools and Staffing Survey and Teacher Follow-up Survey Electronic Codebook and Restricted-Use Data for Three Cycles of SASS and TFS (April 1998)
SASS can be found on the web (http://nces.edgov/surveys/sass). For hrther information on SASS, contact:
Kerry Gruber ElementaryISecondary and Libraries Studies Division ElementaryISecondary Sample Survey Program National Center for Education Statistics 1990 K Street NW Washington, DC 20006 Telephone number: (202) 502-7349 E-mail address: [email protected]
Teacher Follow-up Survey
The Teacher Follow-up Survey (TFS) is designed to measure attrition from the teaching profession and teacher mobility. The survey follows a sample of the teachers who were respondents to SASS in the previous school year and identifies those who left teaching, those who remained in the same schools, and those who moved to other schools. The data are used to measure rates of and reasons for teacher attrition, retention, and mobility at the national level in both public and private schools.
Attrition can be examined in terms of primary destinations of those who leave, reasons for leaving the profession, and characteristics of those who leave. Data from the base-year SASS Teacher Questionnaire allow analysis of other factors related to attrition, such as qualifications, salary, satisfaction, other working conditions, and retirement programs. The survey gathers information about teachers' decisions to leave or stay in the profession.
Design Two questionnaires comprise the TFS: The Teacher Follow-up Survey Questionnaire for Former
Teachers and the Teacher Follow-up Survey Questionnaire for Current Teachers (those who remained in the same school as well as those who moved to another school). These questionnaires ask teachers about their current status, occupational changes and plans, reasons for staying in (or leaving) teaching, and attitudes about the teaching profession.
The first administration of the TFS was in the 1988-89 school year with a sample from the 1987- 88 SASS of about 2,500 teachers who had left teaching and 5,000 who were still in teaching. The size of the sample is approximately the same for every cycle of the TFS. There have been three more administrations of the TFS, 199 1-92, 1994-95, and 2000-0 1. Each collection of the TFS is a follow- up to the SASS sample of the previous year.
Components Questionnaire for Former Teachers-Survey of former teachers to ascertain information on primary activity or occupational status, plans to remain in current position, plans for further education, plans for returning to teaching, reasons for leaving teaching, areas of satisfaction or dissatisfaction with teaching, salary and compensation, marital status, number of children, and other background information that may be related to attrition.
Questionnaire for Current Teachers-Survey of continuing teachers to ascertain change or retention in school, occupational status, teaching assignment field, further education and plans, reasons for leaving previous school, effectiveness of administration, areas of satisfaction or dissatisfaction, expected duration in teaching, time spent performing school-related tasks, professional development in last 2 years, classroom instructional practices, salary and compensation, and basic demographic characteristics.

Major Publications Teacher Attrition and Turnover: Results From the Teacher Follow-up Survey, 200&Of
(Forthcoming)
Characteristics of Stayers, Movers, and Leavers: Results From the Teacher Follow-up Survey, 1994- 95 (May 1997)
Data Files CD-ROM: Teacher Follow-up Survey Public-Use Data (Forthcoming)
CD-ROM: Teacher Follow-up Survey Restricted-Use Data (Forthcoming)
1994-95 Teacher Follow-up Survey Data File User's Manual: Public-Use Version (October 1998)
CD-ROM: Schools and Staffing Survey (SASS) and Teacher Follow-up Survey Electronic Codebook and Restricted-Use Data for Three Cycles of SASS and TFS (April 1998)
Information on the TFS can be found on the web (http://nces.ed.gov/surveys/sass) and by contacting:
Keny Gruber Elementary/Secondary and Libraries Studies Division Elementary/Secondary Sample Survey Program National Center for Education Statistics 1990 K Street NW Washington, DC 20006 Telephone number: (202) 502-7349 E-mail address: [email protected]
Private School Survey
With increasing concern about alternatives in education, the interest and need for data on private education have also increased. NCES has made the collection of data on private schools a priority.
The purposes of the Private School Survey (PSS) data collection are to build an accurate and complete list of private schools to serve as a sampling frame for NCES sample surveys including private schools, and to report data on the total number of private schools, teachers, and students in the survey universe. The PSS is conducted every 2 years, with collections in the 1989-90, 1991-92, 1993-94, 1995-96, 1997-98, 1999-2000, and 200 1-02 school years. The next survey will be conducted in the 2003-04 school year.
The PSS produces data similar to that of the CCD for public schools, and can be used for public- private comparisons. The data are useful for a variety of policy- and research-relevant issues, such as the growth of religiously affiliated schools, the number of private high school graduates, the length of the school year for various private schools, and the number of private school students and teachers.

Design The target population for the universe survey consists of all private schools in the 50 states and
the District of Columbia that meet the NCES criteria of a school (i.e., a private school is an institution that provides instruction for any of grades K through 12, has one or more teachers to give instruction, is not administered by a public agency, is not supported primarily by public funds, and is not operated in a private home. Organizations or institutions that provide support for home schooling, but do not offer classroom instruction for students are not included.). The survey universe is composed of schools identified from a variety of sources. The main source is a list frame, initially developed for the 1989-90 PSS. The list is updated regularly with lists provided by nationwide private school associations, state departments of education, and other state agencies that list private schools. In addition, the general public may submit additional schools for the survey through the NCES web site. The other source is an area frame search in approximately 120 geographic areas conducted by the Bureau of the Census.
Components 1999-2000 Private School Survey-The PSS consists of a single survey that is completed by administrative personnel in private schools. Information collected includes: level of school, religious orientation or other affiliation, length of school year and school day, total enrollment (K-12), racelethnicity of students, whether a school is coeducational or single sex, number of high school graduates, number of teachers, program emphasis, existence and type of kindergarten program, and whether school has a library media center.
Major Publications Private School Universe Survey, 1999-2000 (August 200 1)
Private School Universe Survey, 1997-98 (October 1999)
Private School Universe Survey, 1995-96 (March 1998)
Data File 1999-2000 Private School Survey Data File and Electronic Codebook (Forthcoming)
Information on the PSS can be found on the web (http://nces.ed.gov/surveys/pss). For more information on the PSS, contact:
Steve Broughman ElementaryISecondary and Libraries Studies Division ElementaryISecondary Sample Survey Studies Program National Center for Education Statistics 1990 K Street NW Washington, DC 20006 Telephone number: (202) 502-73 15 E-mail address: stephen. [email protected]

School Crime Supplement to the National Crime Victimization Survey
NCES supports a supplement to the Bureau of Justice Statistics National Crime Victimization Survey (NCVS). The NCVS is a household survey that collects data on crime from a nationally representative sample of about 45,000 households. The School Crime Supplement is an additional set of items asked of all youth ages 12 through 18 in the households. The Bureau of Justice Statistics and the National Institute of Justice supported the first School Crime Supplement in 1989. Subsequent School Crime Supplements, supported by NCES, were conducted in 1995, 1999, and 2001. It was fielded again in 2003 and is scheduled for every 2 years thereafter. The focus of the supplement is on crimes committed against 12- to 18-year-olds in elementary and secondary schools.
The School Crime Supplement contains items that will allow estimates to be tracked over time. The general topic covered by items in the questionnaire is school environment, including preventive measures employed by the school, the availability of drugs and alcohol, victimization in school, avoidance behaviors, weapons, and gangs.
Design The School Crime Supplement is conducted from January through June of the collection year in
all NCVS sample households. Within these households, eligible respondents for the School Crime Supplement are household members between the ages of 12 and 18 who attended school at any time in the previous 6 months. The school had to be one that would advance them toward the receipt of a high school diploma. Eligible individuals are administered the supplemental questions only after the entire NCVS interview is completed. Around 9,000 interviews of youth were obtained in the 2003 School Crime Supplement.
A rotation scheme is used in order to reduce the burden on respondents that could result if they were permanently in the sample. The same rotation scheme employed for the NCVS survey design is used for the School Crime Supplement. The sample of households is divided into groups or rotations. One rotation group enters the sample every 6 months, and the corresponding rotation group from a previous sample is phased out. Households remain in the sample for 3 years, and each household is interviewed once every 6 months during that time.
Households in the sample for the first time are in the incoming rotation and are interviewed in person. Subsequent interviews are conducted by telephone except the in-person fifth interview to reestablish personal contact. In 1995 and subsequent collections, about 30 percent of the households were interviewed by telephone from a centralized dialing facility using caller-assisted telephone interviewing (CATI) techniques. Other telephone interviews were conducted by the same interviewer who conducted the personal interviews. The Census Bureau conducts the data collection.
Reports released by the Bureau of Justice Statistics using NCES data can be found on the web (http:/www. ojp. usdoj.gov/bjs).

Major Publications Are America's Schools Safe? Students Speak Out: 1999 School Crime Supplement (November 2002)
Students ' Reports of School Crime: 1989 and 1995 (April 1998)
For further information on the School Crime Supplement to the NCVS, contact:
Kathryn A. Chandler ElementaryISecondary and Libraries Studies Division ElementarylSecondary Sample Survey Program National Center for Education Statistics 1990 K Street NW Washington, DC 20006 Telephone number: (202) 502-7486 E-mail address: [email protected]
School Survey on Crime and Safety
The School Survey on Crime & Safety (SSOCS) is NCES's primary source of school-level data on crime and safety. SSOCS collects information on school crime and safety from school principals in U.S. elementary and secondary schools.
Safety and discipline are necessary for effective education in schools. In order to learn, students need a secure environment where they can concentrate on their studies. Further, school crime affects school resources, sometimes diverting funds from academic programs or decreasing the ability of schools to attract and retain qualified teachers.
Measuring the extent of school crime is important. Accurate information about the nature and frequency of the problem serves as a foundation for policymakers and practitioners in the development of effective programs and policies to prevent, reduce, and cope with violence and crime in schools.
Despite the need for information about school crime, most of the data about it are limited and anecdotal in nature. Schools and policymakers have difficulty knowing which media reports reflect problems that are nationwide and which are relevant only to some schools. Schools also need to know how they compare to other schools nationwide in their policies and programs. For example, there might appear to be a trend toward certain types of school policies (e.g., metal detectors); yet there is often little information about the prevalence of such policies. SSOCS addresses this need by collecting nationally representative data and providing measures of such topics as the following:
frequency and types of crimes at schools, including homicide, rape, sexual battery, attacks with or without weapons, robbery, theft, and vandalism;
frequency and types of disciplinary actions, such as expulsions, transfers, and suspensions for selected offenses;
perceptions of other disciplinary problems, such as bullying, verbal abuse, and disorder in the classroom;
descriptions of school policies and programs concerning crime and safety; and
descriptions of the pervasiveness of student and teacher involvement in efforts that are intended to prevent or reduce school violence.
The survey data also support analyses of how these topics are related to each other and to various school characteristics.
SSOCS is a nationally representative cross-sectional survey of about 2,500 public elementary and secondary schools. The survey sample is stratified so that it can provide separate estimates by instructional level, type of locale, and enrollment size. Data are collected through a self-administered questionnaire delivered by mail. Extensive telephone follow-up is used to achieve acceptable response rates.
SSOCS was first administered in the spring and summer of 2000. It will be administered again in the spring of 2004. NCES plans to conduct SSOCS every 4 years in order to provide continued updates on crime and safety in U.S. schools.
Major Publication Violence in U.S. Public Schools: 2000 School Survey on Crime and Safety (October 2003)
Data Files/Products School Survey on Crime and Safety 2000, Detailed Data Documentation (October 2003)
School Survey on Crime and Safety 2000, Public-Use Data Files (October 2003)
School Survey on Crime and Safety 2000, Public-Use Data File User's Manual (October 2003)
School Survey on Crime and Safety 2000, Restricted-Use Data Files (October 2003)
School Survey on Crime and Safety 2000, Restricted-Use Data File User's Manual (October 2003)
For hrther information on SSOCS, contact:
Kathryn A. Chandler Elementary/Secondary and Libraries Studies Division Elementary/Secondary Sample Survey Program National Center for Education Statistics 1990 K Street NW Washington, DC 20006 Telephone number: (202) 502-7486 E-mail address: kathryn.chandler@edgov

National Household Education Surveys Program (Early Childhood and School-Age Surveys)
The National Household Education Surveys Program (NHES) is the only general-purpose survey conducted by NCES to collect education data through a household-based survey. Historically, NCES has collected data from teachers, students, and schools through school-based surveys and from administrative records through surveys of school districts and state education agencies. As a household-based survey, the NHES addresses many issues in education that had not been addressed previously by other NCES data collection activities, such as early childhood care arrangements and education, children's readiness for school, parent involvement in elementary and secondary education, and adult participation in education outside of traditional postsecondary institutions.
Full-scale NHES collections have been conducted in the spring of 199 1, 1993, 1995, 1996, 1999, 200 1, and 2003. Surveys have included Early Childhood Program Participation (ECE-NHES: 199 1, ECPP-NHES: 1995, Parent-NHES: 1999, and ECPP-NHES:200 l), School Readiness (SR-NHES: 1993 and Parent-NHES: 1999), School Safety and Discipline (SSD-NHES: 1993), Parent and Family Involvement in Education (PFI-NHES: 1996, Parent-NHES: 1999, and PFI-NHES:2003), Civic Involvement (PFVCI-NHES: 1996, YCI-NHES: 1996, Youth-NHES: 1999, and ACI-NHES: 1996), Household and Library Use (HHL-NHES: 1996), and Before- and After-School Programs and Activities (ASPA-NHES:2001). The NHES has also collected data on Adult Education (AE- NHES: 199 1, AE-NHES: 1995, AE-NHES: 1999, AELL-NHES:200 1, and AEWR-NHES:2003) (see chapter 4, "Postsecondary and Adult Education"). The NHES will be conducted again in the spring of 2005 and 2007, and periodically thereafter. NHES:2005 will include three surveys: Early Childhood Program Participation, Before- and After-School Programs and Activities, and Adult Education and Lifelong Learning.
Design The NHES is designed as a mechanism for collecting detailed information on educational issues
from a large and targeted sample of households in a timely fashion. Households are selected using random-digit-dialing (RDD) methods, and data are collected using computer-assisted telephone interviewing (CATI) procedures. The sample for the NHES is drawn from the civilian population in households having a telephone in the 50 states and the District of Columbia.
For each NHES survey, between 45,000 and 60,000 households are screened, and individuals within households who meet predetermined criteria are sampled for more detailed or extended interviews. The data are weighted to permit estimates of the entire population that the sample is intended to represent. The NHES survey for a given year typically consists of a screener questionnaire that collects household composition and demographic data and two to three substantive surveys addressing education-related topics. Generally, between 10,000 and 20,000 interviews are obtained for each survey.
One of the goals of the NHES is to produce reliable national estimates of the characteristics of children's and adults' educational experiences for the targeted populations and for relevant subgroups defined by race and ethnicity. Estimates by race and ethnicity are of great interest, especially for monitoring education trends over time. Therefore, the NHES design oversamples Black and Hispanic subgroups in order to increase the reliability of estimates for those groups.
Another goal of the NHES is to monitor educational activities over time. The NHES has collected data by repeating substantive surveys on a rotating basis in order to provide comparative data across survey years,.with the exceptions of the School Safety and Discipline (SSD-NHES: 1993) and Household and Library Use (HHL-NHES: 1996) Surveys. Each administration of the NHES has benefited from experience with previous cycles, resulting in enhancements to the survey procedures and content. Thus, while the NHES affords the opportunity for tracking phenomena over time, it is dynamic in addressing new issues and including conceptual and methodological refinements.
A design feature that was unique to the 1996 administration was the collection of demographic and educational information on members of all households rather than just those households that were eligible for a topical survey. This expanded screening feature included a brief set of questions on the use of public libraries. The total household sample size was large enough to produce state estimates for these brief topical questions.
In 1999, the NHES was designed as a special end-of-decade collection to measure key topics covered in previous NHES surveys. These topics included early childhood education and school readiness, parent and family involvement in education, civic involvement, and adult education and lifelong learning.
Surveys Early Childhood Program Participation Surveys (ECE-NHES:l 991, ECPP-NHES: 1995, and ECPP-NHES:2001)-The Early Childhood Program Participation Survey was conducted in 199 1, 1995, and 200 1 (ECE-NHES: 199 1, ECPP-NHES: 1995, and ECPP-NHES:200 1). It will be conducted again in 2005. The 1999 Parent Survey (Parent-NHES: 1999) collected information on a limited set of issues covered in earlier early childhood program participation surveys.
In the 1991 Early Childhood Education Survey, parents of 3- to 8-year-olds completed interviews about their children's early childhood education, including participation in nonparental care and education programs, characteristics of programs and care arrangements, and early school experiences, including delayed kindergarten entry and retention in grade. In addition, parents were asked about activities children engaged in with parents and other family members inside and outside the home.
In the 1995 and 2001 Early Childhood Program Participation Surveys, parents of children from birth through 3rd grade were asked about their children's participation in nonparental care and education programs such as relative care, nonrelative care, Head Start programs, and center-based programs. Additional sections included information on early school experiences of school-age children, home literacy activities, health and disability status, and parent and family characteristics.
In the 1999 Parent Survey, parents were asked about many of the nonparental care arrangements addressed in previous years.
Sample sizes for Early Childhood Program Participation Surveys were: 13,892 for ECE-NHES: 1991; 14,046 for ECPP-NHES: 1995; 6,939 for Parent-NHES: 1999; and 6,749 for ECPP-NHES:2001.
School Readiness Surveys (SR-NHES:1993 and SR-NHES:1993)-The School Readiness Survey was conducted in 1993 (SR-NHES: 1993) and portions were also included as part of the 1999 Parent Survey (P-NHES: 1999). In the School Readiness Survey, parents of 3- to 7-year-olds completed interviews about their children's developmental characteristics, their center-based program

participation, home activities with family members, and health status. For children in elementary school, parents were also asked about school adjustment, teacher feedback, and early school experiences. The 1999 Parent Survey collected information on many of the issues studied in the 1993 collection, including emerging literacy and numeracy.
Sample sizes for the School Readiness Surveys were: 10,888 for SR-NHES: 1993 and 6,939 for Parent-NHES: 1999.
School Safety and Discipline Survey (SSD-NHESfl993)-In the School Safety and Discipline Survey (SSD-NHES: 1993), interviews were conducted with parents of children in grades 3-12 and with youth in grades 6-12. Parents and youth were asked about the school learning environment, discipline policy, safety at school, victimization, the availability and use of alcohol and drugs, and alcohol and drug education. Youth were also asked about peer norms for behaviorin school and substance use.
Sample sizes for the School Safety and Discipline Survey were: 6,504 youth interviews and 12,680 parent interviews.
Parent and Family Involvement in Education Surveys (PFVCI-NHESt2996, Parent-NHES:l999, and PFI-NHES:2003)-The full Parent and Family Involvement in Education Survey was conducted in 1996 (PFVCI-NHES: 1996) and 2003 (PFLNHES:2003). In 1996, parents answered questions about their children (age 3 through 12th grade). For school-age children, questions addressed family involvement, including the involvement of nonresidential parents in four areas: children's schooling, communication with teachers or other school personnel, children's' homework, and activities with children outside of school. For children not yet in kindergarten,information was collected on center-based early childhood program participation and family activities with children outside of school. In PFI- NHES:2003, involvement questions were asked of parents of children in kindergarten through 12th grade. Portions of the survey were included for children in grades K-12 in the Parent Survey of 1999 (Parent-NHES: 1999).
Sample sizes for the Parent and Family Involvement Surveys were: 20,792 for PFIICI-NHES: 1996; 21,222 for Parent-NHES: 1999; and 12,426 for PFI-NHES:2003.
Civic Involvement Surveys (YCI-NHES:1996, ACI-NHES:1996, and Youth-NHES:1999)-In the NHES: 1996, there were three civic involvement surveys (youth, adult, and parent-YCI- NHES: 1996, ACI-NHES: 1996, and PFVCI-NHES: 1996). In the NHES: 1999, civic involvement items were asked in the youth interview (Youth-NHES: 1999). In the 1996 Civic Involvement Surveys, samples of adults, and children in grades 6-12 and their parents were asked about sources of information on government and national issues, civic participation, and knowledge and attitudes about government. In addition, the Youth and Parent Surveys asked about opportunities that youth have to develop personal responsibilities and civic involvement. The Youth-NHES: 1999 repeated the YCI-NHES: 1996 with some additional questions about community service activities.
Sample sizes for the Civic Involvement Surveys were: 9,389 for PFLICI-NHES: 1996; 8,044 for YCI- NHES: 1996; 2,250 for ACI-NHES: 1996; and 7,9 13 for Youth-NHES: 1999.
Household Public Library Use Survey (HHL-NHES:1996)-In the 1996 Household and Library Use Survey (HHL-NHES: 1996), about 56,000 households were screened using an expanded screening procedure that collected demographic and educational information on all household members and included a limited set of items on household use of public libraries. Information about household use of public libraries included items regarding proximity to a public library, borrowing of
materials, and use of the public library for schoolwork, children's activities, recreation, coursetaking, and job seeking.
The sample size for the Household and Library Use Survey was 55,708.
Before- and Ajler-School Programs and Activities Surveys (Parent-NHES=1999 and ASPA- NHES:2001)-The Before- and After-School Programs and Activities Survey was conducted in 200 1 (ASPA-NHES:200 I), although some items were first addressed in the 1999 Parent Survey (Parent-NHES: 1999). It will be conducted again in 2005. The survey asks parents of children in kindergarten through eighth grade about the nonparental care arrangements children had before and after school during the school year. These arrangements include care by relatives and nonrelatives, school- and center-based programs, scouting, sports and other extracurricular activities, and self-care. The ASPA Survey includes questions about children's activities within care arrangements, parents' preferred types of after-school arrangements, and parents' ratings of the child's primary arrangement.
Sample sizes for the Before- and After-School Programs and Activities Surveys were: 12,396 for Parent-NHES: 1999 and 9,583 for ASPA-NHES:200 1.
Major Publications Trends in the Use of School Choice: 1993 to 1999 (May 2003)
Eforts by Public K-8 Schools to Involve Parents in Children's Education: Do Schools and Parents Agree? (November 200 1)
Homeschooling in the United States: 1999 (August 200 1)
Household Survey Data (October 2000)
National Household Education Survey of 1999: Methodology Report (August 2000)
Home Literacy Activities and Signs of Children S Emerging Literacy, 1993 and 1999 (November 1999)
Service-Learning and Community Service Among 6th- Through 12th-Grade Students in the United States: 1996 and 1999 (November 1999)
Participation of Kindergartners Through Third-Graders in Before- and After-School Care (August 1999)
How Involved Are Fathers In Their Children 's Schools? (April 1998)
An Experiment in Random-Digit-Dial Screening (December 1997)
An Overview of Response Rates in the National Household Education Survey: 1991, 1993, 1995, and 1996 (July 1997)
Student Interest in National News and Its Relation to School Courses (July 1997)
Use of Public Library Services by Households in the United States: 1996 (March 1997)
Issues Related to Estimating the Home-Schooled Population in the United States With National Parents' Reports of School Practices to Involve Families (November 1996)
Da fa Files/Products 2001 National Household Education Surveys Program: CD-ROM (April 2003)

199 1, 1993, 1995, 1996, and 1999 National Household Education Surveys: CD-ROM (March 2002)
199 1, 1993, 1995, and 1996 National Household Education Surveys: CD-ROM (July 1997)
The NHES can be found on the web (http://nces.ed.gov/nhes). For further information on the NHES, contact:
Chris Chapman Early Childhood, International, and Crosscutting Studies Division National Center for Education Statistics 1990 K Street NW Washington, DC 20006 Telephone number: (202) 502-74 14 E-mail address: [email protected]
Fast Response Survey System
The Fast Response Survey System (FRSS) was established in 1975 to collect issue-oriented data quickly with minimum response burden. The FRSS was designed to meet the data needs of Department analysts, planners, and decisionmakers when information could not be collected quickly through traditional NCES surveys.
Design FRSS surveys collect and report data on key education issues at the elementary and secondary
levels. A similar survey system, the Postsecondary Education Quick Information System (PEQIS), conducts time-sensitive surveys at the postsecondary level (see description in chapter 4). Data collected through FRSS surveys are representative at the national level, drawing from a universe that is appropriate for each study. The FRSS collects data from state education agencies and national samples of other educational organizations and participants, including:
local education agencies;
public and private elementary and secondary schools;
elementary and secondary school teachers and principals; and
public and school libraries.
In order to present high-quality data quickly, the FRSS provides the following services: research on survey topics and questionnaire design, pretest of survey questionnaires, quality control of survey data, national estimates reported within 16 months of survey mail-out, guarantee of response rates of 90 percent or higher, tabulations and other analyses of data, and preparation of survey reports. The FRSS also has the capability to conduct brief surveys of households using random-digit-dialing telephone techniques.
Major Publications Effects of Energy Needs and Expenditures on U.S. Public Schools (June 2003)
Prekindergarten in U.S. Public Schools: 2000-2001 (March 2003)
Programs for Adults in Public Library Outlets (November 2002)
Public Alternative Schools and Programs for Students At Risk of Education Failure: 2000-2001 (August 2002) ,
Arts Education in Public Elementary and Secondary Schools: 1999-2000 (May 2002)
Occupational Programs at the Secondary and Postsecondary Education Levels (June 2001)
Advanced Telecommunications in US . Private Schools: 1998-99 (January 200 1)
Teachers ' Tools for the 21st Century: A Report on Teachers ' Use of Technology (September 2000)
Condition of America 's Public School Facilities: 1999 (June 2000)
Participation of Migrant Students in Title I Migrant Education Program (MEP) Summer-Term Projects, 1998 (February 2000)
Service-Learning and Community Service in K-12 Public Schools (September 1999)
Status of Education Reform in Public Elementary and Secondary Schools: Teachers' Perspective (February 1999)
Teacher Quality: A Report on the Preparation and Qualtjcations of Public School Teachers (January 1999)
State Survey on Racial and Ethnic Classifications (August 1998)
Racial and Ethnic Classifications Used by Public Schools (July 1998)
Status of Education Reform in Public Elementary and Secondary Schools: Principals' Perspectives (May 1998)
Parent Involvement in Children 's Education: Efforts by Public Elementary Schools (February 1998)
Shorter Publications Internet Access in U.S. Public Schools and Classrooms: 1994-2001 (September 2002)
Beyond School Level Internet Access: Support for Instructional Use of Technology (April 2002)
Teacher Preparation and Professional Development: 2000 (June 200 1)
Internet Access in U.S. Public Schools and Classrooms: 1994-2000 (May 200 1)
Teacher Use of Computers and the Internet in Public Schools (April 2000)
Nutrition Education in Public Elementary School Classrooms, K-5 (March 2000)
Computer and Internet Access in U S . Private Schools and Classrooms: 1995 and 1998 (February 2000)
Internet Access in U S . Public Schools and Classrooms: 1994-1 999 (February 2000)
Occupational Programs and the Use of Skill Competencies at the Secondary and Postsecondary Levels, 1999 (February 2000)
What Are the Barriers to the Use of Advanced Telecommunications for Students with Disabilities in Public Schools? (January 2000)
How Old Are America 's Public Schools? (February 1999)
Internet Access in Public Schools and Classrooms: 1994-1 998 (February 1999)
Issue Brief Web Access in Public Schools (March 1998)

Data Files Condition of Public School Facilities, 1999 (FRSS 73): Public-Use Data Files (May 2002)
Internet Access in Public Schools, Fall 1999 (FRSS 75): Public-Use Data Files (May 2002)
National Student Service-Learning and Community Service Survey (FRSS 71): Public-Use Data Files (May 2002)
Occupational Programs and the Use of Skill Competencies at the Secondary and Postsecondary Levels, 1999 (FRSS 72 and PEQIS 1 I): Public-Use Data Files (May 2002)
Information about the FRSS can be found on the web at (http://nces.ed.gov/surveys/frss). For further information on the FRSS, contact:
Bernie Greene Early Childhood, International, and Crosscutting Studies Division Data Development Program National Center for Education Statistics 1990 K Street NW Washington, DC 20006 Telephone number: (202) 502-7348 E-mail address: [email protected]
NCES Items in the Current Population Survey
The Current Population Survey (CPS) is a monthly household survey conducted by the Bureau of the Census to provide information about employment, unemployment, and other characteristics of the civilian noninstitutionalized population. Since the mid- l96Os, NCES has sponsored a supplement each October. The supplement routinely gathers data on school enrollment and educational attainment for elementary, secondary, and postsecondary education. Related data are also collected about preschoolers and the general adult population. In addition, NCES regularly includes additional items on education-related topics, such as computer and web use, language proficiency, disabilities, grade retention, and student mobility.
Design The CPS is a nationally representative probability sample survey of households. A multistage
stratified sampling scheme is used to select sample households. The survey is conducted in approximately 57,000 dwelling units monthly. Dwelling units are in sample for 4 successive months, out of sample for the next 8 months, and then returned to the sample for the following 4 months. An adult member of each household provides information for all members of the household.
Components Basic CPS--Collects information about household membership and characteristics, individual demographic characteristics, and labor force participation.
October Supplement--Collects basic annual school enrollment information for preschool, elementarylsecondary, and postsecondary students, and educational background information needed to produce dropout estimates on an annual basis.

Computer Use (1984,1989,1993,1997,2001, and 2003)-Collects information about the availability of computers and access to the web at school, home, and work. It also collects information about reasons for and frequency of computer and web use.
Public Library Use (2002)-Collects information about household and individual use of public libraries, including information about the frequency of use, materials accessed, and particular library hnctions and facilities used.
Private School Tuition (1 979,1985,1988,1991,1994, and 199 7)--Collects information about students in private schools, including data about the type of private school attended and the amount of private school tuition paid.
Selected Education Characteristics (1992,1995, and 1999)-Collects information about grade retention, language spoken at home, English proficiency, disability status, and whether an individual ever attended school in the United States.
Summer Activities (1996)-Collected information about elementary and secondary students only. Data included information about the enrollment of students in academic activities during the summer, frequency of and reasons for attendance at academic activities during the summer, employment status during the summer, participation in community service or volunteer activities during the summer, and participation in organized summer activities.
Major Publications Dropout Rates in the United States: 2000 (November 2001)
Dropout Rates in the United States: 1999 (November 2000)
The CPS can be found on the web (http://nces.ed.gov/surveys/cps/). For further information on the CPS October Supplement, contact:
Chris Chapman Early Childhood, International, and Crosscutting Studies Division National Center for Education Statistics 1990 K Street NW Washington, DC 20006 Telephone number: (202) 502-74 14 E-mail address: [email protected]
Other Activities
1990 Census Mapping Project and School District Data Book
The 1990 Census Mapping Project was initiated in 1988. Under this initiative, sponsored by NCES and coordinated by the Council of Chief State School Officers, all states participated in a program to develop school district maps. In the 1990 Decennial Census, the Bureau of the Census developed the Topologically Integrated Geographic Encoding and Referencing (TIGER) System, in which 10,000,000 census block boundaries were digitally encoded (to 6 decimal places). The
boundaries of approximately 15,274 local education agencies, special education districts, Indian reservations, and military installations that have education activities within their boundaries were similarly digitized and encoded in the TIGER system, thus making it possible to convert the data from census blocks to education entities and produce tabulations.
In 1992, under the sponsorship of NCES, the Census Bureau produced the 1990 Census School District Special Tabulation files using the basic record file of the 1990 Decennial Census data. These tabulations contain aggregate data describing attributes of groups of persons and households in school districts.
With the exception of two data items (total population and total housing units), data were sample- based estimates. In many cases, the special tabulations were produced using a process of splitting census blocks to develop estimates for a school district. Files were used in combination with NCES data (i.e., CCD) and other Census Bureau data (i.e., School District Finance Survey [Form F-331) to produce the School District Data Book. The School District Data Book is an electronic library containing social, economic, and administrative data for each of the 15,274 public school districts in the United States in 1990. The School District Data Book contains the most comprehensive demographic database ever developed for the nation's school system.
The School District Data Book is contained on a set of 44 CD-ROMs. This large database of approximately 20 gigabytes of data (after reduction by data-compression techniques) provides up to 10,000 data items for each school district. The mapping features enable users to view maps of all individual school districts in the nation for the first time.
The School District Data Book provides an effective way for the U.S. Department of Education and Congress to access, analyze, and interpret data from the 1990 Census School District Special Tabulations. Since this information can benefit state and local education agencies, as well as researchers, policy analysts, and administrators in a variety of other organizations, NCES implemented a program to meet these broader needs. The School District Data Book can be found on the web (http://nces. ed.gov/surveys/sncis/cl990.asp).
Major Publications Profile of Children in U S . School Districts (September 1996)
School District Data Book Reference Manual (November 1994)
For further information on the Census Mapping Project and School District Data Book, contact:
Tai A. Phan ElementaryISecondary and Libraries Studies Division ElementaryISecondary Co-Operative System and Institutional Studies Program
National Center for Education Statistics 1990 K Street N W Washington, DC 20006 Telephone number: (202) 502-743 1 E-mail address: [email protected]

Decennial Census School District 2000 Project
In 1998, NCES initiated a project to specify the special tabulation of the 2000 census and the 1999-2000 TIGERJLine files school district boundaries. Similar to the 1990 Census Mapping Project, the Decennial Census School District 2000 Project will provide social, economic, and demographic characteristics of children and public school districts in the United States by using the School District Special Tabulation files from the 2000 census, the 1999-2000 CCD, and the 2000 School District Finance Survey (Form F-33). These products will be used to support research and policy analysis at the national, state, and individual school district levels.
The Census 2000 School District Special Tabulation contains summary statistical data for school districts, counties, states, and the United States developed through a special tabulation of the Census 2000 basic record file. One reason that the school district special tabulation is so important is that it is the only source of data on children's demographics and their living environment. Unlike all other Census 2000 data files developed by the Census Bureau, the school district special tabulation uniquely provides universe tabulations for parents with children, households with children, children's own characteristics, children's household characteristics, and parents' characteristics (as well as the total population). Most of the subject-matter items in this school district special tabulation correspond to tables and items contained in Summary File 3. These tables are augmented with specially defined tables relating to areas of analytical interest, including number of children at risk and K-12 education.
The NCES School District Demographics web site (http://nces.ed.gov/surveys/sdds) provides access to information about the Decennial Census School District 2000 Project. This online interactive Geographic Information System will enable users to directly access school district geographic and demographic data.
The first geographically detailed data from Census 2000 are the P.L. 94-171 data files that contain data required for redistricting. The P.L. 94-171 (redistricting) data files do not provide school district summary data; however, the census block data records in these files contain applicable school district codes enabling a user to develop school district summary data by aggregating the census block-level data.
Summary File 1 (SF1) of Census 2000 presents counts and basic cross-tabulations of information collected from all people and housing units. The SF1 files do not provide school district summary data; however, the census block data records in these files contain applicable school district codes enabling a user to develop school district summary data by aggregating the census block-level data.
Summary File 3 (SF3) of Census 2000 contains population and housing tabulations based on the Census 2000 long-fotm questionnaire. The SF3 files contain richer socioeconomic data about school enrollment, educational attainment, and children, and enable analysis of school district-related demographics.
These files are now available for the entire United States and can be found on the web (http://nces.ed.gov/surveys/sdds). For further information on the 1990 Census Mapping Project and the Decennial Census School District 2000 Project, contact:
Tai A. Phan ElementaryISecondary and Libraries Studies Division

ElementaryISecondary Co-Operative System and Institutional Studies Program
National Center for Education Statistics 1990 K Street NW Washington, DC 20006 Telephone number: (202) 502-743 1 E-mail address: [email protected]
Education Finance Statistical Center
The number and sophistication of policy requests to NCES for school finance information are constantly shifting and expanding. The Education Finance Statistical Center (EFSC) is designed to conduct research to improve the collection and reporting of education finance information. EFSC projects explore definitional, measurement, collection, reporting, and analysis issues related to education finance. The EFSC web page provides an "umbrella" under which NCES publications related to education finance can be found.
The EFSC is currently conducting the following research activities:
examining whether at-risk, minority, and limited-English-proficient kindergartners have equal access to school and staff resources;
assessing public kindergarten staff compensation;
assessing public school beginning teacher compensation, including whether teachers from more competitive colleges earn more;
exploring conceptual issues in measuring and reporting school district geographic cost differences; and
creating a researchers' longitudinal file for school district finances for the decade 1990-2000.
Among the projects NCES anticipates exploring in the next year are:
How economic conditions influence school district revenues-In partnership with The Condition of Education staff, this project seeks to develop an indicator that reflects the relationship between state economic conditions and school district revenues. States have generally increased state support for education, particularly for poor school districts. Poor school districts may be the most vulnerable to reductions or smaller increases in state funding when economic conditions become less favorable.
Creation of pseudo-unified school districts-Analyses of inequality in school district funding typically only examine those school districts that are "unified; that is, are K-12. Some large states, such as Texas, California, and Illinois, have mixtures of elementary, secondary, and unified school districts. This project will attempt to match elementary and secondary school districts to create "pseudo-unified" school districts. If such districts can be created, analyses of the effect upon inequality measures will be undertaken.
Assessing school district geographic cost differences-This project will use SASS 2000 to replicate earlier NCES geographic cost adjustments, as well as explore alternative methods to develop yearly estimates of differences in geographic costs.

Major Publications Developments in School Finance, 2001-2002 (June 2003)
Effects of Energy Needs and Expenditures on U.S. Public Schools (May 2003)
Persons seeking NCES finance information, publications, and data should visit the web (http://nces.ed.gov/ed-n). For further information on the EFSC, contact:
William J. Fowler, Jr., Ed.D. ElementaryISecondary and Libraries Studies Division National Center for Education Statistics 1990 K Street NW Washington, DC 20006-565 1 Telephone number: (202) 502-7338 E-mail address: [email protected]
Elementary and Secondary Handbooks
The elementary and secondary handbooks are intended to promote the use of a standard education vocabulary and to encourage the maintenance of accurate and complete data by schools, districts, state and federal agencies, and other educational organizations. The data terms included in the handbooks reflect the best judgment of individuals representing all facets of education concerning what data might be needed in making appropriate, cost-effective, and timely decisions about elementary and secondary education.
The elementary and secondary handbooks are not data collection instruments. While they are careful to include data elements that can be used in meeting federal reporting requirements, many other practical data elements have been included as well. They are presented as a resource to those who plan and operate education information systems and others who are seeking comparable, technically acceptable data definitions.
Student Data Handbook Accurate and comprehensive information is needed to make appropriate decisions about students
within both public and private schools. These information needs are being met in an increasing number of instances by automated management information systems that allow data to be used in a variety of ways. These information systems are effective only to the extent that data are entered consistently according to established terms and definitions.
This handbook focuses on the importance of consistency in how student data are defined and maintained at various levels within the education enterprise-from schools (both public and private) and school districts to state and federal agencies. In addition to providing data terms and "best practice" definitions, the handbook suggests how data might be organized in a student data system to promote timely and effective use of student information for student services. This handbook is compatible with the StaffData Handbook. The Student Data Handbook was revised in 200 1 and is updated annually.

Staff Data Handbook Information about staff has an important role in the efficient and effective functioning of the
education enterprise. Staffing information is needed for daily administrative purposes and for making long-term program and policy decisions. Staffing information can also be used to monitor efforts to improve the education system.
This handbook offers data terms and "best practice" definitions for elementary and secondary staff at various levels within the education enterprise-from schools (both public and private) and school districts to state and federal agencies. Instructional, administrative, and support staff categories are included. The handbook makes suggestions about how data might be organized in a staff data system. The format and content of this resource are compatible with those of the Student Data Handbook. The StaffData Handbook was revised in 2001 and is updated annually.
Nonfiscal Data Handbook for Early Childhood, Elementary, and Secondary Education
This online handbook replaces the earlier Student Data Handbook and StaffData Handbook, and incorporates the new domains of local education agency, intermediate education unit, and state education agency data. The Nonfiscal Data Handbook for Early Childhood, Elementary, and Secondary Education is available only as an online database that gives users access to all of the information from the handbooks at one location. The handbook will be updated annually, beginning in the fall of 2004.
A Pilot Standard National Courses Classification System for Secondary Education
This handbook attempts to establish a common terminology, descriptions, and coding structure for course information at the secondary level of education. Ideally, it is intended to facilitate electronic and other communication among education agencies, enable questions about course taking to be answered at the national level with greater ease and precision, and provide a common methodology for researchers carrying out transcript studies.
The handbook presents a taxonomy that reflects a course's subject area, title, and level, as well as its credit and sequence (e.g., term, year) and several specific subject fields. In addition to providing course titles and "best practice" descriptions, the handbook makes suggestions concerning how information about courses can be maintained and reported.
Financial Accounting for Local and State School Systems The Financial Accounting for Local and State School Systems Handbook defines the national
standards for public education agencies to use in reporting financial data. The standards are intended for use by school districts in preparing their comprehensive annual financial reports that are submitted to state education agencies (SEAs) and by SEAs in their reports to the Department.
The purpose of this handbook is to ensure that education finance data can be reported in a comprehensive and uniform manner. The handbook gives an overview of accounting systems and provides guidelines on setting up a chart of accounts for public education agencies. Specific funds, programs, hnctions, and objects, and their accounting costs are defined and organized in accordance

with generally accepted accounting principles. This handbook provides the framework for collecting and reporting school finance data that are comprehensive and comparable. The current version of the handbook incorporates the recently updated standards of the Government Accounting Standards Board (GASB).
Major Publications Financial Accounting for Local and State School Systems (November 2003)
Nonfiscal Data Handbook for Early Childhood, Elementary, and Secondary Education (September 2003)
StaSfData Handbook: Elementary, Secondary, and Early Childhood Education: 2001 Edition (May 200 1)
A Pilot Standard National Courses Class~fication System for Secondary Education (January 1995)
For hrther information on the Elementary and Secondary Handbooks, contact:
Lee Hoffman ElementaryISecondary and Libraries Studies Division ElementaryISecondary Co-Operative System and Institutional Studies Program National Center for Education Statistics 1990 K Street NW Washington, DC 20006 Telephone number: (202) 502-7356 E-mail address: lee. [email protected]
National Cooperative Education Statistics System The National Cooperative Education Statistics System serves as the umbrella for a number of
efforts to improve the quality, timeliness, and comparability of statistics used for education policymaking at all levels of government. This system was begun in 1988, under the mandate of the Hawkins-Stafford Education Improvement Amendments (P.L. 100-297). Soon after, NCES established the National Forum on Education Statistics, an appointed group representing national, state, and federal interests in elementarylsecondary education data to address issues of data policy and develop ways of improving data systems. The system also includes training and technical assistance efforts, such as the weeklong Fellows Program and two major annual professional conferences. It has been the means for NCES to work in collaboration with state and local educators to develop guidelines that provide assistance in data collection, reporting, and both the technical and policy aspects of maintaining student records.
National Forum on Education Statistics
The National Forum on Education Statistics is broadly representative of elementary/secondary education at all levels of policy. It is composed of representatives from NCES, the 50 states, the District of Columbia, Puerto Rico, the Bureau of Indian Affairs, the Department of Defense dependents schools, local education agencies, and professional associations and federal agencies involved in the collection and reporting of education statistics. The Forum's primary mission is to

work with NCES to improve the overall quality, timeliness, and comparability of education statistics across the nation. It puts into practice the goals of the National ElementaryISecondary Cooperative Statistics System, which was mandated by the Hawkins-Stafford Education Improvement Amendments of 1988 and continued in the Education Sciences Reform Act of 2002.
Under the direction of its Steering Committee, the Forum maintains three standing committees: the National Education Statistics Agenda Committee; the Technology, Dissemination, and Communication Committee; and the Policies, Programs, and Implementation Committee. At present, the Forum is addressing such important issues as facilitating uniform development in state education information systems; promoting the adoption of guidelines and common definitions that will foster best-practice procedures in many areas of data collection and reporting; and developing guidelines or handbooks for maintaining data about school finance, education facilities, education and administrative technology, and school crime, violence, and discipline. The group is an active partner with the Department in efforts to reduce redundancy across data collections, thereby lessening the burden of reporting. In addition to these efforts, the Forum is available to respond to specific requests from the Commissioner of NCES and to raise issues and make recommendations of its own. By bringing federal and state representatives together to work cooperatively toward improving the quality of education statistics, the Forum plays an important role in determining the future of our nation's education statistics system.
In 1990, the National Forum on Education Statistics issued its first publication, Guide to Improving the National Education Data System. The report contained 36 recommendations for improving the nation's capacity to produce accurate and comparable statistics about elementary and secondary education. Since then, the Forum has produced a number of guides intended to help school districts and state education agencies (SEAs) follow best professional practice in areas relevant to the collection and use of education data. These have encompassed topics such as technology use, web security, protecting the confidentiality of student and staff records, building systems for reporting incidents of school crime and violence, and using information to manage and plan for school facilities.
The Forum is a means for providing technical assistance to states and encouraging the development of more effkient data systems. It sponsors a state-to-state personnel exchange and recommends to NCES innovative data projects to be supported under contract with SEAs. Reports of site visits assessing 33 SEA data systems in terms of their potential for increased automation are also available.
Major Publications Facilities Information Management: A Guide for State and Local Education Agencies (June 2003)
Get a Lock on Web Site Development and Security for Your School (March 2003)
Weaving a Secure Web Around Education: A Guide to Technology Standards and Security (March 2003)
Planning Guide for Maintaining School Facilities (February 2003)
Power Tools for Your Schools (brochure) (January 2003)
Technology in Schools: Suggestions, Tools and Guidelines for Assessing Technology in Elementary and Secondary Education (November 2002)

Safety in Numbers: Collecting and Using Crime, Violence, and Discipline Incident Data to Make a Difference in Schools (July 2002)
Technology @ Your Fingertips (January 200 1 )
Building an Automated Student Record System (October 2000)
Privacy Issues in Education StaffRecords (February 2000)
The Forum can be found on the web (http://nces.ed.gov/Sorum). For further information regarding the National Cooperative Education Statistics System, contact:
Ghedam Bairu Elementary/Secondary and Libraries Studies Division ElementaryISecondary Co-Operative System and Institutional Studies Program National Center for Education Statistics 1990 K Street NW Washington, DC 20006 Telephone number: (202) 502-7356 E-mail address: ghecinm. [email protected]
Annual Meetings-Conferences
The NCES Data Conference, held in Washington, D.C., each year at the end of July, includes presentations and workshops on current NCES surveys and national issues related to education statistics. New products, such as data sets on CD-ROM or electronic handbooks, are demonstrated, and hands-on training in their use is often available. This conference issues an open call for proposals, and thus reflects a wide range of topics and presenters. There is no registration fee and it is open to the public. The NCES web site (http://nces.ed.gov/conferences) gives full information about registration.
Each year NCES cosponsors a Management Information Systems (MIS) Conference with a host state. The purpose of this 3-day meeting, usually held in late February, is to encourage those who work with education MIS systems to share their innovations, developmental efforts, and issues with one another. A demonstration room is available to exhibit MIS software and programs in the public domain. Florida, California, Louisiana, Texas, Arizona, New Mexico, Mississippi, and Utah have hosted past MIS conferences. The call for papers, issued in October or November of each year, and the conference announcement are posted on the NCES web site.
For more information on the National Cooperative Education Statistics System's annual meetings and conferences, contact:
Mary McCrory ElementaryISecondary and Libraries Studies Division ElementaryISecondary Co-Operative System and Institutional Studies Program National Center for Education Statistics 1990 K Street NW Washington, DC 20006 Telephone number: (202) 502-7394 E-mail address: [email protected]

Cooperative System Fellows Program
As part of its ongoing effort to increase cooperation among federal, state, and local education data collectors, and to improve the overall quality and timeliness of education statistics, NCES initiated the Cooperative System Fellows Program in 1990. Twice each year, Fellows are nominated by local, state, higher education, and library agencies across the country to convene in Washington, D.C., for 1 week. The purpose is to provide the participants with an overview of the many NCES activities and to foster professional ties between education professionals and members of the federal statistical community.
During their stay, the Fellows take part in a series of planned activities, including presentations by NCES staff on their major data collections, reports, and dissemination practices; projects to automate state and local data systems; and efforts to integrate existing data collections. In addition, Fellows explore their own professional interests and objectives. During the week, mentors selected from NCES staff work with the Fellows and lead discussions on various topics, answer questions, and offer guidance and advice. An effort is made to help the Fellows achieve their individual program objectives. The Fellows Program is held in May and November of each year and includes approximately 30 Fellows at each session. There is no charge and NCES reimburses participants' expenses.
The Cooperative System Fellows Program can be found on the web (http://nces.ed.gov/conferences). For further information on all of the National Cooperative Education Statistics System's activities, contact:
Mary McCrory ElementaryISecondary and Libraries Studies Division ElementaryISecondary Co-Operative System and Institutional Studies Program National Center for Education Statistics 1990 K Street NW Washington, DC 20006 Telephone number: (202) 502-7394 E-mail address: [email protected]
Plans for Elementary and Secondary Education
The core surveys of the NCES elementary and secondary program are the Common Core of Data (CCD), Schools and Staffing Survey (SASS), National Household Education Surveys Program (NHES), and Private School Survey (PSS). Some topical supplements may be attached to these continuing surveys so that current data on key issues can be produced. The Fast Response Survey System (FRSS) collects additional topical data for policymakers within a short timeframe.
Beginning with the 1998-99 school year, the CCD began collecting an expanded set of information intended to greatly enhance the survey's usefulness as a sampling frame and provide baseline statistics on several programs of interest. States were asked to identify charter and magnet schools, schools that participate in Title I programs, and the numbers of migrant and limited-English- proficient students receiving special services. This additional information, coupled with the CCD's previous content and unique identifiers for every public school and agency, made it possible to
explore ways of merging information from different surveys and to reduce the chances that the same information is requested on more than one federal survey, thus reducing response burden.
In 2003, NCES published dropout and graduation rates for about 45 states. NCES released for the first time data files of school district-level financial statistics from the Survey of Local Government Finances: School Systems (F-33). Changes planned for 2004 include collecting race and gender information about teachers.
SASS was redesigned for its administration in 1999-2000. The sample design and data collection methodology remained the same, but a new conceptual framework shifted the focus of SASS from teacher supply and demand to measurement of teacher and school capacity (the objectives of recent school reform agendas). Teacher capacity is d d m d by measures of teacher quality, teacher career paths (including induction experience), professional development, and classroom instructional practices. School capacity is defined by measures of school organization and decisionmaking, curriculum and instruction, parental involvement, school safety and discipline, and school resources. Although the framework requires new item modules, important items from past surveys were retained for trend data. The Teacher Follow-up Survey will continue to be implemented 1 year after SASS.
The NHES has become a source of many key indicators of the educational status of children. NHES:200 1, which was conducted in the spring of 200 1, included questionnaires on Early Childhood Program Participation and Before- and After-School Programs and Activities. NHES:2003 included the Parent and Family Involvement in Education Survey.
NCES will continue to support the collection of educational enrollment and attainment on an annual basis in the October Supplement to the Current Population Survey (CPS). An additional topical component regarding select education characteristics, grade repetition, language and English proficiency, and disability will be collected on a periodic basis. NCES also periodically works with other agencies to develop CPS supplements on computer use.
The School Survey on Crime and Safety (SSOCS) is a relatively new survey that collects information from school principals on crime and safety in U.S. elementary and secondary public schools. SSOCS was first administered in the spring of 2000. In many ways, it covers the same topics addressed by the Principal/School Disciplinarian Survey on School Violence conducted by NCES in 1997. NCES plans to conduct SSOCS again in 2004 to provide continued updates on crime and safety in U.S. schools.
NCES is working on the Decennial Census School District 2000 Project. The project will use data from the 2000 census, 1999-2000 CCD, and the 2000 School District Finance Survey (Form F-33). The project will provide substantial social, economic, and demographic data on individual public school districts to data users, researchers, and policyrnakers.
The FRSS will continue to identify and report on issues of current interest. Studies being prepared now include Adult Services in Public Libraries, Survey of Alternative Schools and Programs, and continuing surveys on access to technology and the web in elementary and secondary schools nationwide.
The National Cooperative Education Statistics System will continue to serve as the vehicle for improving the elementary and secondary data system across the nation. Under the National Forum on Education Statistics, it will sponsor projects in individual states to adopt common data standards and

definitions, and to develop more efficient ways of collecting and reporting data electronically. Federal-state Forum task forces will complete data standards or guidelines in the areas of protecting the privacy of education staff records, creating useful performance indicators, and identifying key data elements in the area of school finance.

Table 2. Data Collection Calendar for Elementary and Secondary Education Year of Data Collection
surveys 1990 1991 1992 1993 1994 1995 1996 1997 1998 1999 2000 2001 2002 2003 2004 2005
Common Core of Data
Public School Survey X X X X X X X X X X X X X X X X
Local Education Agency Universe X X X X X X X X X X X X X X X X
State Aggregate Nonfiscal Report
X X X X X X X X X X X X X X X X
National Public EducationFinance X X X X X X X X X X X X X X X X
Survey of Local Government Finances: School Systems (F-33) X X X X X X X X X X X X X X X X
Schools and Staffing Survey (school year ending)
School District Questionnaire
X
School Principal Questionnaire X X
Teacher Questionnaire
X X
School Questionnaire X X X
School Library Media Center Questionnaire
Teacher Follow-up Survey X X
Private School Survey

Table 2. Data Collection Calendar for Elementary and Secondary Education- Continued
Year of Data Collection Surveys
1990 1991 1992 1993 1994 1995 1996 1997 1998 1999 2000 2001 2002 2003 2004 2005
National Household Education Suwey
Early Childhood EducationlProgram Participation
School Readiness
School Safety and Discipline
Parent and Family lnvolvement in Education/Civic lnvolvement
Adult Civic lnvolvement
Youth Civic lnvolvement
Before- and After- School Programs and Activities
Household Library Use
Current Population Survey (October Supplement) X X X X X X X X X X X X X X X X
School Crime Supplement to the National Crime Victimization Survey

POSTSECONDARY AND ADULT EDUCATION
Social, demographic, educational, and economic issues challenge postsecondary education today. Among the most critical are questions regarding access to postsecondary education for various populations, the effects of shifting enrollment patterns, the price of postsecondary education, student financing of postsecondary education, education outcomes, the long-range financial outlook for ~olleges and universities, demand for a d srrpply of quali5zd faculty and staff, and job opportunities for graduates.
The National Center for Education Statistics (NCES) program in postsecondary education provides statistical information used by planners, policyrnakers, and educators in addressing these issues. One major source of this information is the Integrated Postsecondary Education Data System (IPEDS), an annual series of surveys conducted by NCES that provides a variety of data on the nation's 9,800 public and private postsecondary institutions. Special studies of students, financial aid, postsecondary faculty, bachelor's degree recipients, and doctoral degree recipients complement IPEDS, as do surveys of the participation of the adult population in educational activities through the National Household Education Surveys Program. In addition, postsecondary education transcript studies have been conducted in conjunction with the National Longitudinal Study of 1972, the High School and Beyond Study, the Baccalaureate and Beyond Longitudinal Study (see "National Longitudinal Studies" in chapter 6), and the Recent College Graduates Study. Another postsecondary longitudinal survey system, Beginning Postsecondary Students, also collects institutional and student data fiom postsecondary students over a period of several years (see "National Longitudinal Studies" in chapter 6).
Data Uses The NCES postsecondary education data systems provide information such as trends in
enrollment and degree completion, patterns of expenditures and revenues of institutions, patterns of student financial aid, workload of faculty, and the relationship between educational experience and labor market outcomes. These data are used to describe the condition of postsecondary education and to monitor changes. Federal program staff have used IPEDS and student survey data to address policy issues on financial aid programs. Policymakers at the state and institutional levels have used IPEDS data for planning purposes. Government commissions have used these data to monitor compliance with federal legislation.
Thousands of requests for information, based on IPEDS and other postsecondary surveys, are received by NCES each year. Those requesting data fall roughly into the following seven categories:
federal agencies;
state agencies;
national and regional education associations;

individual institutions;
the media;
the business community; and
the general public.
Members of the executive branch, Congress and congressional committees, and a number independent federal agencies use information from NCES on a regular basis. For example, an office of the legislative branch used IPEDS information to develop a profile of for-profit, less-than-2-year institutions. Several executive branch offices use the information to track baccalaureate and higher degree data by selected fields of study and minority status of degree recipients. An independent federal agency uses the information to track degree completions in engineering and scientific fields of study.
State higher education agencies regularly use the data to help determine salary and fringe-benefit packages for their full-time instructional faculty. Other state agencies use the completions and institutional data on an annual basis to evaluate the availability of specific career training programs. Several state agencies have used the residence and migration data to determine where their high school graduates enroll in postsecondary education institutions.
National and regional education associations annually request tabulations to determine enrollment patterns by raciallethnic categories and fields of study, and finance data to review the economic health of postsecondary education institutions. Individual institutions use similar information at an institutional level for peer analyses and institutional planning purposes. These peer analyses range from comparing selected financial ratios to comparing proportions of minority student enrollments.
The media, business community, and general public use postsecondary data in a variety of ways. For example, one newspaper developed a major article comparing public 4-year institutions across selected states. Members of the business community have used degree completion data to target minority recruitment efforts in selected fields of study. The general public regularly requests information on which institutions offer degrees in specific fields of study, and the new IPEDS College Opportunities On-Line (IPEDS COOL) is used regularly by students, parents, and guidance counselors to help prospective college applicants choose the right institution. Congress, states, colleges, higher education associations, and other researchers use the data to describe students and faculty, financial aid programs, persistence and completion, and outcomes after completion.
Studies
Integrated Postsecondary Education Data System
IPEDS, established as the core postsecondary education data collection program for NCES, is a system of surveys designed to collect data from all primary providers of postsecondary education. IPEDS is a single, comprehensive system designed to encompass all institutions and educational organizations whose primary purpose is to provide postsecondary education. The IPEDS system is built around a series of interrelated surveys to collect institution-level data in such areas as

enrollments, program completions, faculty, staff, finances, institutional prices, and student financial aid.
Design Within IPEDS, postsecondary education is defined as "the provision of a formal instructional
program whose curriculum is designed primarily for students who are beyond the compulsory age for high school. This includes programs whose purpose is academic, vocational, and continuing professional education, and excludes avocational and adult basic education programs."
Organizations that provide instructional programs as described in the definition above are considered imtitutimswftAin the PEDS universe if their primary purpose is the provision of postsecondary education. The size of the institution, diversity of program offerings, levels of awards, degree or certification curricula, type of accreditation, and other distinguishing criteria are considered characteristics of particular institutions. These criteria are not used to determine which institutions are included in or excluded from the IPEDS universe.
This universe of postsecondary education institutions is divided into the following three categories based on the highest degree awarded or the length of the longest program:
baccalaureate or higher institutions;
2-year award institutions (i.e., institutions must have at least a 2-year program, but less than a 4-year program); and
less-than-2-year institutions.
Each of these three categories is further disaggregated by type of financial control: public, private not-for-profit, and private for-profit. The resulting nine institutional categories are called "sectors" within the IPEDS universe and are used, in conjunction with their Title IV eligibility status, to determine which data collection items institutions are asked to complete.
Despite the diversity of institutions across these sectors, since institutions are the primary unit for data collection, institutional units must be defined as consistently as possible. IPEDS does not request separate reports from more than one component within an individual institution. However, separate branch campuses are asked to report as individual units; thus, each institution in a multi- institutional system and each separate branch in a multi-campus system reports separately. IPEDS defines a branch institution as "a campus or site that is not temporary, is located in a community beyond a reasonable commuting distance from its parent institution, and offers organized programs of study, not just courses." This last criterion is the most important. It means that at least one degree or award program can be completed entirely at the site, without requiring any attendance at the main campus or any other institution within the system.
The IPEDS universe of postsecondary institutions includes only those institutions that are open to the general public. Therefore, training sites at prisons, military bases, and corporations are not considered separate institutions or branches in IPEDS, regardless of how the institutional system classifies such training sites. Data on enrollment, finance, and completions from such locations or training sites are to be incorporated into the data reported by the main campus or any other institution or branch campus in the system that is most appropriate.

With respect to postsecondary education provided in conjunction with hospitals, the intent of IPEDS is to include only those hospitals that contain one or more separate entities whose primary purpose is the provision of postsecondary education; schools of nursing and radiology are two examples of such entities. Hospitals offering only internships or residency programs are not included, nor are hospitals that only offer training as part of a medical school program. Training conducted as part of a medical school program is included in the reports of the postsecondary institution offering the medical program. Hospitals operating more than one school are treated as a single postsecondary entity. This is consistent with the practice for other postsecondary institutions, where NCES only requests reports for the institution as a whole, not separate reports for each program within the institution.
Since the definition of postsecondary education excludes noncredit continuing education programs and education units, organizational entities that provide only these educational services are not included as institutions. Schools whose only mission is to prepare students to take a particular test, such as the CPA examination or the bar examination, are not included in IPEDS. These programs are not considered academic, vocational, or continuing professional education. Organizations that offer training at many sites (such as H&R Block) may be consolidated into a single institutional unit when deemed appropriate by NCES. High schools with vocational programs are also excluded from IPEDS because their primary purpose is not postsecondary education.
Da fa Collection Principles The collection of IPEDS data from this diverse universe of institutions is based upon several
principles. First, data elements identify characteristics common to all providers of postsecondary education. Within these data elements, specific values define characteristics of different types of providers of postsecondary education.
Second, the data elements and the component surveys in IPEDS, through which they are collected, are interrelated to avoid duplicative reporting and to enhance the analytic potential of the database. For example, enrollment data from one survey can be used in conjunction with data on degrees granted, faculty, or financial resources from the other surveys.
Third, the surveys are compatible, but are adapted to meet the needs and characteristics of different sectors of postsecondary education providers. In general, postsecondary institutions granting baccalaureate and higher degrees provide more detailed data, while less data are requested from other institutions. This feature accommodates the varied operating characteristics, program offerings, and reporting capabilities of postsecondary institutions, while yielding comparable statistics for all institutions.
Prior to 1993, NCES sampled the private less-than-2-year sectors. However, the Higher Education Act of 1992 mandated the completion of IPEDS surveys in a timely and accurate manner for all institutions that participate, or are applicants for participation, in any federal student financial assistance program authorized by Title IV of the Higher Education Act of 1965, as amended (20 U.S.C. 1094(a)(17)). Thus, beginning in the 1993 survey year, NCES began to survey in detail all postsecondary institutions that met this mandate. Institutions that were not eligible to participate in federal student financial aid programs were asked to complete only the Institutional Characteristics survey.

Between 1993 and 2000, NCES continually improved the IPEDS data collection instruments and the list of institutions (universe) surveyed. There was a concerted effort to match files with the Office of Postsecondary Education (OPE) to ensure full coverage of all institutions having Program Participation Agreements (PPAs) with the Department. Currently, IPEDS identifies and categorizes institutions according to whether or not they have a PPA with the Department of Education and their degree-granting status.
The IPEDS program was completely redesigned for the 2000-01 academic year when the data collection converted from a paper-based data collection to a fully web-based data collection system. The universe of postsecondary institutions was divided into two basic groups: those institutions with PPAs and all others. Institutions that do not have PPAs may voluntarily complete the IPEDS online surveys, but there is no requirement to do so. Institutions with a PPA are required to complete IPEDS and are subject to extensive follow-up for nonresponse. Any institution that provides data is included on the IPEDS COOL web site.
In the near future, institutions that do not have PPAs (also referred to as non-Title IV institutions) will be subject to a telephone survey to collect a minimum set of data items (Minimum Data Set [MDS]). The MDS study is designed, through the use of area sampling, to provide a national estimate of the number of non-Title IV postsecondary institutions that are open to the public, an estimate of the number of students enrolled and staff employed at these institutions, and an indication of the types of educational programs that are being provided by these institutions. The study will also examine the extent to which MDS institutions are willing and/or able to provide the data requested. The new web-based system tailors the forms (screens) and data items for each institution based on a series of screening questions or institutional characteristics. Thus, public institutions automatically receive a different finance form than private not-for-profit institutions; 4-year schools that have graduate programs are prompted for graduate-level enrollment; and institutions that do not enroll full-time, first-time undergraduate-level students are not asked to complete information for either the Student Financial Aid or Graduation Rate components. All survey data are now collected using a web-based system. Institutions may submit data in two ways: manual data entry or file upload. The survey data are requested at different times during the year. The schedule for the 2003-04 academic year is as follows:
Components include:
Institutional Characteristics, including Institutional Price (2003-04); and
Completions (July 1,2002, through June 30,2003).
Data were collected between September 10 and October 22,2003.
Components include:
Employees by Assigned Position;
Salaries;
Fall S t a e and

Enrollment, including Age data (fall 2003), Unduplicated Counts, and Instructional Activity (2002-03).
All faculty and staff data are as of November 1,2003. Note that Enrollment data may be reported in the winter collection cycle, but are not required until the spring collection.
The data collection period extends from December 3,2003, through January 28,2004.
Components include:
Enrollment, including Age data (fall 2003), Unduplicated Counts, and Instructional Activity (2002-03), and fall-to-fall retention (fall 2002 to fall 2003);
Student Financial Aid (2002-03);
Finance (FY 2003); and
Graduation Rates (on either a 1997 or 2000 cohort).
The data collection period extends from March 10 through April 2 1,2004.
IPEDS attempts to minimize institutional response burden by coordinating data collection with state education agencies (SEAS) and other federal offices and agencies that regularly collect data from institutions. These coordinating efforts include:
State agencies-In many states, IPEDS institutional data are provided by the state higher education agency from data collected on state surveys. Alternatively, state agencies may extract data from IPEDS surveys rather than conduct their own surveys.
Office for Civil Rights (0CR)-Raciallethnic compliance data are incorporated into IPEDS surveys and are provided annually to OCR. NCES and OCR cooperate on the collection of enrollment, completions, and staff data to fulfill the mandates of Title VI and Title VII of the Civil Rights Act of 1964.
Equal Employment Opportunity Commission (EE0C)-In 1993, NCES began collecting fall staff data for EEOC in much the same way that data are collected for OCR.
Office of Vocational and Adult Education-The Completions survey includes data in response to the Carl D. Perkins Vocational Education Act. IPEDS is also part of the Vocational Education Plan for Postsecondary Education (P.L. 98-524).
Census Bureau and Bureau of Economic Analysis (BEA)-The Census Bureau and BEA both use data collected through the IPEDS Finance surveys rather than collect these data on their own.
State occupational coordinating committees and career in formation systems-The IPEDS Institutional Characteristics survey incorporates many data elements required by state Career Information Delivery Systems (CIDS), thereby reducing or eliminating the need for these organizations to conduct their own surveys.
Components Institutional Characteristics-Address, telephone number, web site URL, control or afiliation, levels of awards offered, types of programs, accreditation, admissions criteria, selected student services, calendar system, tuition, required fees, and room and board charges. In addition, the survey collects price information: tuition and fees, room and board, books and supplies, and other expenses that a full-time, first-time degree- or certificate-seeking undergraduate student would expect to pay when entering the institution. This "sticker price" information is made available to prospective students, parents, counselors, and others on a user-fiiendly web site--College Opportunities On-Line (IPEDS COOL) (http://nces.ed.gov/ipeds/cool).
Completions-Degree completions by level (associate's, bachelor's, master's, doctor's, and first- professional) and other formal awards by length of program, racelethnicity and gender of recipient, and 6-digit Classification of Instructional Programs (CIP) code. Completion data by racelethnicity at the 2-digit CIP level became an annual collection in 1990; beginning in 1995, racelethnicity data were collected at the 6-digit CIP level. Beginning with the 2001 collection, institutions were able to report the number of students with double majors by level of degree and 6-digit CIP code of the second major.
Enrollment-Full- and part-time enrollment, in the fall, by level (undergraduate, first-professional, and graduate) and by racelethnicity and gender of student. Beginning in 1990, racelethnicity data were collected annually. (Prior to 1990, racelethnicity data were collected in even-numbered years.) Age distributions are collected in odd-numbered years; data on state of residence of first-time freshmen (first-time, first-year students) are collected in even-numbered years. Four-year institutions are also required to complete enrollment data by level, racelethnicity, and gender for nine selected fields of study in even-numbered years for OCR. In addition, the enrollment survey now collects the12-month instructional activity and unduplicated headcount data, which are needed to compute a standardized, full-time-equivalent (FTE) enrollment statistic for the entire academic year. FTE is useful for gauging the size of the educational enterprise at the institution. Institutions are also asked to provide the total number of first-time undergraduate students regardless of status (degree- or non- degree-seeking; first year or transfer in; full- or part-time). Beginning in 2003, the Enrollment survey will collect fall-to-fall retention data on first-year undergraduate students.
Graduation Rates-Data on the number of students entering the institution as full-time, first-time degree- or certificate-seeking students in a particular year (cohort), by racelethnicity and gender; number completing their program within 150 percent of normal time to completion; number transferred to other institutions; and number receiving athletically related student aid in the cohort and number completing within 150 percent of normal time to completion. Worksheets automatically calculate rates, including average rates over 4 years. This survey was developed to help institutions comply with requirements of the Student Right-to-Know Act.
Student Financial Aid-Number of full-time, first-time degree- and certificate-seeking undergraduate students, total number of these students receiving financial aid, and average amount of aid received by type of aid.
Employees by Assigned Position-Data on the number of full- and part-time employees by occupational category, faculty status, and tenure status (if applicable). Data on employees in medical schools are collected separately. This survey was first implemented in 2001.
Fall Staff-Number of full-time faculty by racelethnicity and gender, contract length, and salary class intervals; number of other persons employed full time by racelethnicity and gender, primary occupational activity, and salary class intervals; number of part-time employees by primary occupational activity, racelethnicity, and gender; and tenure of full-time faculty by academic rank and new hires by primary occupational activity, both by racelethnicity and gender. Beginning with the 1993 survey year, Fall Staff replaced the EEO-6 survey conducted by the EEOC.
Salaries-Number of full-time instructional faculty by rank, gender, and length of contract; total salary outlay; and fringe benefits and number of full-time instructional faculty covered by these benefits. The survey became annual in 1990, but data were not collected in 2000. Prior to 2001, data were collected by tenure status.
Finance-Revenues by source (e.g., tuition and fees, government grants and contracts, private gifts); current fund expenditures by function (e.g., instruction, research, plant maintenance and operation); physical plant assets and indebtedness; and endowment investments. Survey forms differ substantially for public and private institutions because of differences in accounting standards.
Special Features State Coordinator workshops-These are conducted on an annual basis, usually in the spring. A full- day workshop is planned to provide IPEDS State Coordinators and other interested parties with up- to-date information on IPEDS, plans for the future, anticipated changes, and other issues of interest. This forum allows for exchanges of ideas and practices and a general sharing of information among the various state, federal agency, and educational association representatives.
Regional workshops-Through a grant to the Association for Institutional Research (AIR), IPEDS funds a series of regional workshops to provide institutional respondents with training on the new web-based data collection. These are generally held in conjunction with state or regional association meetings or in various key cities across the nation to allow respondents to attend one close to their institution's location.
IPEDS COOL-In response to the Higher Education Amendments of 1998, NCES developed a web site to provide up-to-date statistics on a broad range of postsecondary institutions for easy access by consumers. The site presents data on institution prices, financial aid, enrollment, degrees and awards conferred, accreditation, and types of programs that are offered by the institution. IPEDS COOL is designed to help college students, future students, and their parents understand the differences among colleges and how much it costs to attend college. The site also provides direct links to each institution's home page, campus crime statistics, student financial aid information, and various other postsecondary education web sites.
IPEDS Peer Analysis System-This feature enables a user to easily compare one institution of the user's choosing to a group of peer institutions by generating reports using selected IPEDS variables of interest. The user may create a group of peers or have the system create it. This system also includes file download capabilities.
Graduate certificate programs in institutional research-Through a contract with AIR, IPEDS helps fund a graduate certificate program in institutional research at five major universities. AIR, in turn, provides grants to the institutions to develop interdisciplinary graduate certificate programs in

institutional research. These programs teach skills that are increasingly important to the practice and advancement of institutional research and the maintenance and use of national data sets.
Senior fellowship-IPEDS, through a contract with AIR, accepts proposals for an annual senior fellowship project. The fellowship is awarded on the basis of proposals submitted and is usually in support of improvements to the IPEDS process, data collection, data dissemination, or data use. A maximum of $1 10,000 is available to the selected fellow for salary replacement, support, and travel expenses for projects that may span up to 1 calendar year.
Grants program-IPEDSINCES and the National Science Foundation (NSF), through AIR, have developed a program entitled Improving Institutional Research in Postsecondary Educational Institutions. The goals of this program are to provide professional development opportunities to doctoral students, institutional researchers, educators, and administrators, and to foster the use of federal databases for institutional research in postsecondary education. The program has the following three major components:
dissertation research fellowships for doctoral students for outstanding dissertation proposals;
research grants for institutional researchers and faculty; and
a Summer Data Policy Institute to study the national databases of NSF and NCES.
Dissertation fellowships-Funds of up to $15,000 to support 1 year of activity are available to assist the doctoral student in the acquisition, analysis, and reporting of data from the NCES and NSF data sets. Work will be conducted at the student's home institution, and fellowship funds are expected to cover budget items such as the costs of supplying data, dissemination of project results, travel, and salary support. Proposals are solicited from doctoral students beginning their dissertation work.
Research grants-Funds of up to $30,000 annually are available. Grants are usually made for 1 year. It is expected that work will be conducted at the principal investigator's home institution and that grant f h d s will cover budget items such as the costs of supplying data, dissemination of project results, travel, and perhaps some salary replacement. The program provides grants to principal investigators to conduct institutional research on postsecondary education using the NCES and NSF national databases; conduct other institutional research that promises a significant contribution to the national knowledge of the nature and operation of postsecondary education; conduct other institutional research activities that will make a contribution to our knowledge of postsecondary education; or conduct institutional research activities that will contribute to the professional development of professional personnel working in postsecondary education.
Summer Data Policy Institute fellowships-Forty fellowships for AIR'S Summer Data Policy Institute are open to institutional research practitioners, faculty, graduate students, and educators affiliated with U.S. postsecondary institutions or governance agencies. To provide an international comparative perspective, one fellowship will be awarded through each of the five international affiliated AIR groups. The Summer Data Policy Institute is a 2-week intensive session scheduled each June in the Washington, DC, area.
For further information on IPEDS, contact:
Susan G. Broyles Program Director Postsecondary Institutional Studies Program

National Center for Education Statistics 1990 K Street NW Washington, DC 20006 Telephone number: (202) 502-73 18 E-mail address: susan. [email protected]
National Household Education Surveys Program (Adult Education Surveys)
The National Household Education Surveys Program (NHES) is the only general-purpose survey conducted by NCES to collect education data through a household-based survey. Historically, NCES has collected data from teachers, students, and schools through school-based surveys and from administrative records through surveys of school districts and state education agencies. As a household-based survey, the NHES addresses many issues in education that had not been addressed previously by other NCES data collection activities, such as early childhood care arrangements and education, children's readiness for school, parent involvement in elementary and secondary education, and adult participation in education outside of traditional postsecondary institutions. Full- scale NHES collections have been conducted in the spring of 199 1, 1993, 1995, 1996, 1999,200 1, and 2003. Topical surveys on adult education and lifelong learning were collected in 1991, 1995, 1999, 200 1, and 2003. In addition, a survey about the civic involvement of adults, the Adult Civic Involvement survey, was conducted in 1996. Surveys covering topics related to children from birth through 12th grade have also been conducted. See chapter 3, "Elementary and Secondary Education," for more details on these surveys. The NHES will be conducted again in the spring of 2005 and 2007, and periodically thereafter. NHES:2005 will include three surveys: Early Childhood Program Participation, Before- and After-School Programs and Activities, and Adult Education and Lifelong Learning.
Design The NHES is designed as a mechanism for collecting detailed information on educational issues
from a large sample of households in a timely fashion. Households are selected using random-digit- dialing (RDD) methods, and data are collected using computer-assisted telephone interviewing (CATI) procedures. The sample for the NHES is drawn from the civilian population in households having a telephone in the 50 states and the District of Columbia.
In each NHES survey, between 45,000 and 60,000 households are screened, and individuals within households who meet predetermined criteria are sampled for more detailed or extended interviews. The data are weighted to permit estimates of the entire population that the sample is intended to represent. The NHES survey for a given year typically consists of a screener questionnaire that collects household composition and demographic data and two to three substantive surveys addressing education-related topics. Generally, between 10,000 and 20,000 interviews are obtained for each survey.
One of the goals of the NHES is to produce reliable national estimates of the characteristics of children's and adults' educational experiences for the targeted populations and for relevant subgroups defined by race and ethnicity. Estimates by race and ethnicity are of great interest,
especially for monitoring education trends over time. Therefore, the NHES design oversamples Black and Hispanic subgroups in order to increase the reliability of estimates for those groups.
Another goal of the NHES is to monitor educational activities over time. The NHES has collected data by repeating substantive surveys on a rotating basis in order to provide comparative data across survey years, with the exceptions of the School Safety and Discipline (SSD-NHES: 1993) and Household and Library Use (HHL-NHES: 1996) surveys. Each administration of the NHES has benefited from experience with previous cycles, resulting in enhancements to the survey procedures and content. Thus, while the NHES affords the opportunity for tracking phenomena over time, it is dynamic in addressing new issues and including conceptual and methodological refinements.
A design feature that was unique to the 1996 administration was the collection of demographic and educational information on members of all households rather than just those households that were eligible for a topical survey. This expanded screening feature included a brief set of questions on the use of public libraries. The total household sample size was large enough to produce state estimates for these brief topical questions.
In 1999, the NHES was designed as a special end-of-decade collection to measure key topics covered in previous NHES surveys. These topics included early childhood education and school readiness, parent and family involvement in education, civic involvement, and adult education and lifelong learning.
Surveys Adult Education Surveys (AE-NHES:1991, AE-NHES:1995, AE-NHES:1999, AELL- NHES:ZOOI, and AE WR- NHES:2003)-Adult Education surveys were conducted in 199 1, 1995, 1999,2001, and 2003 (AE-NHES: 199 1, AE-NHES: 1995, AE-NHES: 1999, AELL-NHES:2001, and AEWR- NHES:2003). The Adult Education for Lifelong Learning Survey (AELL) will be conducted again in 2005. The Adult Education surveys ask persons 16 years of age and older about their participation in basic skills courses, English as a Second Language (ESL) courses, credential (degree or diploma) programs, apprenticeships, work-related courses, and personal development/interest courses. AELL-NHES:2001 also asked about less formal learning at work. The Adult Education for Work-Related Reasons Survey (AEWR- NHES:2003) asked adults about participation in credential (degree or diploma) programs, apprenticeships, and formal courses and informal activities for work- related reasons. Adults participating in programs or courses provided information about those programs or courses, including subject matter, duration, cost, location and sponsorship, and employer support. In 199 1, 1995, and 2003, nonparticipants in selected types of adult education were asked about their interest in educational activities and their perceived barriers to participation in adult education. Extensive background, employment, and household information was collected for each adult.
Sample sizes for the Adult Education surveys were: 14,892 for AE-NHES: 199 1 ; 19,722 for AE- NHES: 1995; 6,697 for AE-NHES: 1999; 10,873 for AELL-NHES:2001; and 12,725 for AEWR- NHES:2003.
Civic Involvement Survey (ACI-NHES:1996)-In the NHES: 1996, there were three Civic Involvement surveys (Youth, Adult, and Parent-YCI-NHES: 1996, ACI-NHES: 1996, and PFYCI- NHES: 1996). In the NHES: 1999, civic involvement items were asked in the Youth interview (Youth- NHES: 1999). In the 1996 Civic Involvement surveys, samples of adults, and children in grades 6-12

and their parents were asked about sources of information on government and national issues, civic participation, and knowledge and attitudes about government. In addition, the Youth and Parent surveys asked about opportunities that youth have to develop personal responsibilities and civic involvement. The Youth-NHES: 1999 repeated the YCI-NHES: 1996 with some additional questions about community service activities.
Sample sizes for the Civic Involvement surveys were: 9,389 for PFVCI-NHES: 1996; 8,044 for YCI- NHES: 1996; 2,250 for ACI-NHES: 1996; and 7,913 for Youth-NHES: 1999.
Major Publications Participation Trends and the Cost of Pursuing Adult Education: 1994-95 (Forthcoming)
Participation Trends and Patterns in Adult Education: 1991 to 1999 (February 20C
Participation in Adult Education in the United States: 1998-99 (November 1999)
Employer Aid for Postsecondary Education (July 1999)
Participation of Adults in English as a Second Language Classes: 1994-95 (July 1
E.D. Tab: Adult Civic Involvement in the United States (March 1997)
Data Files 199 1, 1993, 1995, 1996, and 1999 National Household Education Surveys: CD-ROM (Forthcoming)
2001 National Household Education Surveys Program: CD-ROM (April 2003)
199 1, 1993, 1995, and 1996 National Household Education Surveys: CD-ROM (July 1997)
NHES can be found on the web (http://nces.ed.gov/nhes). For further information on NHES, contact:
Chris Chapman Early Childhood, International, and Crosscutting Studies Division National Center for Education Statistics 1990 K Street NW Washington, DC 20006 Telephone number: (202) 502-74 14 E-mail address: [email protected]
National Postsecondary Student Aid Study
The National Postsecondary Student Aid Study (NPSAS) is a comprehensive nationwide study of students enrolled in less-than-2-year institutions, community colleges, 4-year colleges, and major universities located in the United States and Puerto Rico. Undergraduate, graduate, and first- professional students who receive financial aid, as well as those who do not receive aid, participate in the NPSAS.
The NPSAS collects information on student demographics, family income, education expenses, employment, education aspirations, parental demographic characteristics, parental support, and how students and their families meet the costs of postsecondary education. In addition to describing

characteristics of students enrolled in postsecondary education, the results are used in part to help determine future federal policy regarding student financial aid.
The first NPSAS was conducted during the 1986-87 school year. Data were gathered from institutional records on about 60,000 students at 1,100 colleges, universities, and other postsecondary institutions. About 43,000 of these students and 13,000 parents also completed questionnaires. During 1989-90, information from institutional records on about 69,000 students at 1,130 postsecondary institutions was collected. About 5 1,400 students and 16,000 parents also completed computer-assisted telephone interviews (CATIs). During 1992-93, information from institutional records on about 77,000 students at 1,000 postsecondary institutions was collected. About 52,000 students and 12,500 parents were interviewed by telephone. The 1995-96 NPSAS had a smaller sample due to budget constraints. Institutional administrative records data were collected on about 60,000 students at 830 institutions. About 3 1,000 students were interviewed by telephone. In 1999- 2000, institutional records data were collected on about 62,000 students (50,000 undergraduates and 12,000 graduatelfirst-professional students) at 1,000 institutions. About 44,500 students were interviewed by telephone.
In 2004, NCES will combine the NPSAS and the National Study of Postsecondary Faculty (NSOPF) into the National Study of Faculty and Students (NSoFaS). About 80,000 students and 24,000 faculty and instructional staff are expected to participate. Results should be available in late spring/early summer 2005.
The data collected provide information on the price of postsecondary education, the distribution of financial aid, and the characteristics of both aided and nonaided students and their families. Following each survey, NCES publishes three major reports: Undergraduate Financing of Postsecondary Education, Student Financing of Graduate and First-Professional Education, and Profile of Undergraduates in American Postsecondary Institutions.
Design With the increased use of technology, the design for the NPSAS sample has changed over the
years. The design no longer involves an initial sample of geographic areas and institutions within geographic areas. To be eligible for inclusion in the institutional sample, an institution must satisfy the following conditions:
offer an education program designed for persons who have completed secondary education;
offer an academic, occupational, or vocational program;
offer access to persons other than those employed by the institution;
offer more than just correspondence courses;
offer at least one program lasting 3 months or longer; and
be located in the 50 states, the District of Columbia, or Puerto Rico.
Additional information on the sample design for each NPSAS is described in the Methodology Report for each cycle.

NPSAS data come fiom multiple sources, including institutional records and student and parent interviews. Detailed data concerning participation in student financial aid programs are extracted fiom the U.S. Department of Education's financial aid application system, the National Student Loan Data System, and institutional records. In 1986-87, family circumstances, demographic data, and plans and aspirations were collected using student and parent questionnaires. Beginning with the 1989-90 NPSAS, student and parent data were collected using CATIs. Parent data were last collected with the 1992-93 NPSAS.
The 1986-87 NPSAS sampled students enrolled in the fall of 1986. Beginning with the 1989-90 NPSAS, students enrolled at any time during the year were eligible for the study. This design change provided the data necessary to estimate hll-year financial aid awards.
Beginning with the 1989-90 survey, the NPSAS included two longitudinal studies called the Beginning Postsecondary Students Longitudinal Study (BPS) and the Baccalaureate and Beyond Longitudinal Study (B&B). For BPS, there were two cohorts of beginning students. These cohorts served to examine issues such as persistence and effects of financial aid on subsequent enrollment. One cohort included students who began their postsecondary education during 1989-90, were interviewed in 1992 (BPS:90/92), and were interviewed again in 1994 (BPS:90/94). Another cohort included students who began in 1995-96, and were interviewed in 1998 (BPS:96198) and 2001 (BPS:96101). For B&B, there were two cohorts of students who completed their undergraduate degrees. These cohorts served to examine issues such as the transition from college to work and access to graduate school. One cohort included students who graduated with a baccalaureate degree during 1992-93, were surveyed in 1994 (B&B:93194), and were surveyed again in 1997 (B&B:93/97). These students will be surveyed again in 2003 as part of the BB:93/03 study. Another cohort included students who graduated with a baccalaureate degree in 1999-2000, and were surveyed again in 2001 (B&B:2000/01). Both BPS and B&B studies are described more thoroughly in chapter 6, "National Longitudinal Studies."
The NPSAS covers a number of topics of interest to policyrnakers, educators, and researchers. For example, the NPSAS analyzes the participation of students in financial aid programs. The goal is to identify institutional, student, family, and other characteristics related to program participation. Special population enrollment in postsecondary education is also analyzed. These populations include students with disabilities, raciallethnic minorities, students taking remedial-developmental courses, students from families with low incomes, and older students. Another aspect of the NPSAS is the study of the distribution of students by major field of study. Major fields of particular interest include mathematics, science, and engineering, as well as teacher preparation and health studies. The NPSAS generates data on factors associated with choice of postsecondary institution, participation in postsecondary vocational education, parental support for postsecondary education, and occupational and educational aspirations.
Components Student Records Cfrom institutional records)-Year in school, major field of study, type and control of institution, attendance status, tuition and fees, admission test scores, financial aid received, price of attendance, student budget information and expected family contribution for aided students, grade point average, age, and date first enrolled.

Student Telephone Intervie-Financial aid at other schools attended during year, other sources of financial support, reasons for selecting the school they are attending, current marital status, age, race/ethnicity, sex, highest degree expected, employment and income, voting in recent elections, and community service.
Parent Interview (limited sample of some studentdparents for NPSAS:87 through NPSAS:93 only)-Parents' marital status, age, highest level of education achieved, income, amount of financial support provided to children, types of financing used to pay children's educational expenses, occupation, and industry.
Major Publications How Families of Low- and Middle-income Undergraduates Pay for College: Full-Time Dependent
Students in 1999-2000 (June 2003)
What Colleges Contribute: institutional Aid to Full-time Undergraduates Attending 4-Year Colleges and Universities (April 2003)
Characteristics of Undergraduate Borrowers: 1999-2000 (January 2003)
What Students Pay for College: Changes in Net Price of College Attendance Between 1992-9.3 and 1999-2000 (September 2002)
Profile of Undergraduates in U. S. Postsecondary Institutions: 1 999-2000 (June 2002)
Student Financing of Graduate and First-Professional Education, 1999-2000: ProJiles of Students in Selected Degree Programs and Their Use of Assistantships (June 2002)
Student Financing of Undergraduate Education: 1 999-2000 (June 2002)
Da fa Files Public-use data from the NPSAS studies are available through the web and on CD-ROM. The
public-use online Data Analysis Systems (DAS) for the NPSAS study years are available on the web at http://nces.ed.gov/dasol. Information on NPSAS public-use data on CD-ROM may be found on the web at http://nces. ed.gov/surveys/npsas.
Restricted-use data files (containing student-level data) are available, such as:
CD-ROM: NPSAS: National Postsecondary Student Aid 'study: 1999-2000 (July 2002)
CD-ROM: NPSAS: National Postsecondary Student Aid Study: 1995-96 (July 1998)
To obtain a restricted-use CD-ROM with data files, you must first apply and receive approval for licensure. More information may be found on the web at http://nces.edgov/pubsearch/licenses.asp.
Detailed information on the NPSAS may be found on the web at http://nces.edgov/surveys/npsas or by contacting:
Aurora M. D'Amico Postsecondary Studies Division Postsecondary Co-Operative System, Analysis, and Dissemination Program National Center for Education Statistics 1990 K Street NW Washington, DC 20006
Telephone number: (202) 502-7334 E-mail address: aurora.d '[email protected]
National Study of Postsecondary Faculty
The National Study of Postsecondary Faculty (NSOPF) was developed in response to a continuing need for data on faculty and instructors. An institution's faculty often determine curriculum content, student performance standards, and the quality of students' preparation for careers. Through their research, development, and public service activities, faculty members make valuable contributions to society. For these reasons, it is essential to understand who they are; what they do; and whether, how, and why they are changing. The NSOPF was designed to provide data about faculty to postsecondary education researchers, planners, and policymakers. The NSOPF is currently the most comprehensive study of faculty in postsecondary education institutions.
The NSOPF contains data that can be applied to policy and research issues related to postsecondary faculty. For example, the NSOPF can be used to analyze whether the size and composition of the postsecondary labor force is changing. NSOPF data can also be used to analyze faculty job satisfaction and how it correlates with an area of specialization, how background and specialization skills relate to present assignments, and the relationship between academic rank and outside employment. Benefits and compensation can also be studied across institutions, and faculty can be aggregated by sociodemographic characteristics.
Design The first cycle of NSOPF was conducted by NCES with support fiom the National Endowment
for the Humanities (NEH) in 1987-88 (NSOPF:88) with a sample of about 500 colleges and universities, over 3,000 department chairpersons, and over 1 1,000 instructional faculty.
The second and third cycles of NSOPF were conducted by NCES with support fiom NEH and the National Science Foundation in 1992-93 (NSOPF:93) and 1998-99 (NSOPF:99), respectively. NSOPF:93 and NSOPF:99 were limited to surveys of institutions and faculty, but with substantially expanded samples of about 975 colleges and universities, and 30,000 faculty and instructional staff. NSOPF:88 was limited to faculty and staff who had some instructional responsibilities (e.g., teaching one or more courses for credit, supervising thesis or dissertation committees, individualized instruction), while NSOPF:93 and NSOPF:99 included these individuals, as well as faculty who had no instructional responsibilities (e.g., those engaged exclusively in research, administration, or public service). Faculty status was determined by each institution.
A two-stage stratified random sample design was used for all three studies. The first-stage sampling frame consisted of a subset of postsecondary institutions drawn from the IPEDS universe. The subset of institutions included all public and private, not-for-profit U.S. postsecondary institutions that granted a 2-year or higher degree. A modified Carnegie classification was used to stratify institutions by type and control. The second-stage sampling Frame consisted of a subset of faculty and instructional staff drawn from lists of faculty and instructional staff provided by the institutions selected in the first-stage sampling. This subset of faculty and instructional staff was surveyed by mail, with computer-assisted telephone interview (CATI) nonresponse follow-up. In addition, web versions of the questionnaires were made available for NSOPF:99.

All three studies gathered information regarding the backgrounds, responsibilities, workloads, salaries, benefits, attitudes, and future plans of both full- and part-time faculty. In addition, information was gathered from institutional- and department-level respondents (department-level data collected in 1988 only) on such issues as faculty composition, turnover, recruitment, retention, and tenure policies. The next cycle of NSOPF is planned for 2003-04.
Components Institutional Survey (1988, 1993, and 1999)--Counts of faculty, hires and departures, employment and tenure status, and policies regarding tenure, retirement, and benefits for faculty.
Department Chairperson Survey (1988 only)-Faculty composition in department, tenure status of faculty in department, faculty hires and departures in department, hiring practices, activities to assess faculty performance, and professional and developmental activities.
Faculty Survey (1988,1993, and 1999)-Sociodemographic characteristics; academic and professional background; field of instruction; employment history; current employment status, including rank and tenure; workload; courses taught; publications; job satisfaction and attitudes; career and retirement plans; and benefits and compensation.
Major Publications A Profile of Part-Time Faculty: Fall 1998 (October 2002)
Gender and RaciaUEthnic Differences in Salary and Other Characteristics of Postsecondary Faculty: Fall 1998 (September 2002)
Teaching Undergraduates in U.S. Postsecondary Institutions: Fall 1998 (August 2002)
The Gender and Racial/Ethnic Composition of Postsecondary Instructional Faculty and StaSf: 1992- 98 (August 2002)
Teaching With Technology: Use of Telecommunications Technology by Postsecondary Instructional Faculty and Staff in Fall 1998 (July 2002)
Tenure Status of Postsecondary Instructional Faculty and Stafl 1992-98 (July 2002)
Distance Education Instruction by Postsecondary Faculty and Stafl Fall 1998 (February 2002)
Data Files Public-use data from NSOPF are available through the web and on CD-ROM. The public-use
online Data Analysis Systems (DAS) for NSOPF are available on the web at http://nces.ed.gov/dasol. Information on public-use data on CD-ROM may be found on the web at http://nces. ed.gov/surveys/nsopf:
Restricted-use data files (containing faculty-level data) are available, such as:
CD-ROM: 1999 National Study of Postsecondary Faculty (May 2002)
CD-ROM: 1993 National Study of Postsecondary Faculty (September 1997)

To obtain a restricted-use CD-ROM with data files, you must first apply and receive approval for licensure. More information may be found on the web at http://nces.edgov/pubsearch/licenses.asp.
Detailed information on NSOPF may be found on the web at http://nces.edgov/suweys/nsopf or by contacting:
Aurora M. D'Amico Postsecondary Studies Division Postsecondary Co-Operative System, Analysis, and Dissemination Program National Center for Education Statistics 1990 K Street NW Washington, DC 20006 Telephone number: (202) 502-7334 E-mail address: aurora.d hrnico@?ed.gov
Survey of Earned Doctorates Awarded in the United States
This survey has collected basic statistics from the universe of doctoral recipients in the United States each year since the 1920s. It is conducted by the National Science Foundation (NSF) and is supported by NCES, as well as several other federal agencies including the NSF, National Endowment for the Humanities, U.S. Department of Agriculture, National Institutes of Health, and National Aeronautics and Space Administration.
From the Survey of Earned Doctorates data, it is possible to determine whether the number of doctoral recipients is increasing or decreasing by field of study. The various sources of financial aid for doctoral students can be assessed, as can the average time it takes to complete the degree. Future or present employment can be studied, which is useful to postsecondary institutions and research organizations. Trend data on who is receiving doctorates by sex, racelethnicity, and other characteristics can also be analyzed.
Design Survey forms are mailed to graduate deans each May for distribution to individuals receiving
their doctorates between July 1 and June 30 of the next year. The data are collected, edited, and published by the National Opinion Research Corporation (NORC). Each year, NORC publishes general survey results in a summary report. NORC also provides detailed tabulations to each sponsoring agency.
Component Survey of Earned Doctorates-Sex, age, racelethnicity, marital status, citizenship, disabilities, dependents, specialty field of doctorate, all institutions attended from high school to completion of doctorate, time spent in completion of doctorate, source of financial support for graduate study, education debt incurred, postdoctoral plans, and educational attainment of parents.
The Survey of Earned Doctorates can be found on the web (http://www.ns~gov/sbe/srs/ssed/start.htm). For more information on the Survey of Earned Doctorates, contact:
Nancy Borkow Postsecondary Studies Division Postsecondary Co-Operative System, Analysis, and Dissemination Program National Center for Education Statistics 1990 K Street NW Washington, DC 20006 Telephone number: (202) 502-73 1 1 E-mail address: [email protected]
Postsecondary Education Quick Information System
Policy analysts, program planners, and decisionmakers in postsecondary education frequently need data on emerging issues quickly. It is not always feasible for NCES to use its large, recurring surveys to provide such data, due to the length of time required to implement large-scale data collection efforts. NCES established the Postsecondary Education Quick Information System (PEQIS) in 199 1 to collect timely data on focused issues needed for program planning and policy development with a minimum burden on respondents. Recent survey topics include distance learning, remedial education, campus crime and security, finances, and accommodation of disabled students. In addition to obtaining information on emerging issues, PEQIS surveys are used to assess the feasibility of developing large-scale data collection efforts on a given topic or to supplement other NCES postsecondary surveys.
Design The PEQIS employs a standing sample (panel) of approximately 1,600 postsecondary education
institutions and a panel of 5 1 state higher education agencies. The PEQIS is designed to conduct brief surveys of postsecondary institutions or state higher education agencies on topics of national importance. Surveys are generally limited to two or three pages of questions, with a response burden of about 30 minutes per respondent. The sampling frame for the PEQIS panel recruited in 2002 was constructed from the 2000 IPEDS Institutional Characteristics file. The PEQIS frame included 2- and 4-year (including graduate-level) postsecondary education institutions located in the 50 states and the District of Columbia. The PEQIS sampling frame was stratified by instructional level (4-year, 2- year,), control (public, private not-for-profit, and private for-profit), highest level of offering (doctor's/first-professional, master's, bachelor's, and less than bachelor's), and total enrollment. Within each of the strata, institutions were sorted by region (Northeast, Southeast, Central, and West) and minority enrollment.
Each institution in the PEQIS panel was asked to identify a campus representative to serve as survey coordinator. The campus representative facilitates data collection by identifying the appropriate respondent for each survey and forwarding the questionnaire to that person.

Major Publications Distance Education at Degree-Granting Postsecondary Institutions: 2000-01 (July 2003)
Features of Occupational Programs at the Secondary and Postsecondary Education Levels (June 200 1)
Distance Education at Postsecondary Education Institutions: 1997-98 (December 1999)
An Institutional Perspective on Students with Disabilities in Postsecondary Education (August 1999)
Issue Brie8 Distance Education in Higher Education Institutions: Incidence, Audience, and Plans to Expand (February 1998)
Distance Education in Higher Education Institutions (November 1997)
Campus Crime and Security at Postsecondary Education Institutions (February 1997)
Remedial Education at Higher Education Institutions in Fall 1995 (October 1996)
Data File Distance Education at Postsecondary Education Institutions, 1997-98 (PEQIS 9 1): Public-Use Data
Files (May 2002)
Information about the PEQIS can be found on the web (http://nces.edgov/surveys/peqis/). For more information on the PEQIS, contact:
Bernard R. Greene Early Childhood, International, and Crosscutting Studies Division Data Development Program National Center for Education Statistics 1990 K Street NW Washington, DC 20006 Telephone number: (202) 502-7348 E-mail address: [email protected]
Other Activities
National Postsecondary Education Cooperative
The National Postsecondary Education Cooperative (NPEC), one of three cooperatives created by Congress and supported by NCES, is a voluntary partnership of postsecondary institutions; associations; federal, state, and local government agencies; and organizations. Its mission is "to promote the quality, comparability, and utility of postsecondary data and information that support policy development at the federal, state, and institution levels."
NPEC has made a number of organizational changes in the past few years, including hiring its first full-time Executive Director in 2002, as well as creating a new Executive Committee. NPEC also recently adopted a new membership structure-NPEC Associates, a group that includes current Executive Committee members, subcommittee members, working group members, and current

NPEC project consultants. NPEC also supports the NPEC Network, an electronic community that includes current and past members of NPEC and others who are interested in NPEC's work.
Recent initiatives include a new focused grant program. This activity, sponsored jointly by NPEC and the Association for Institutional Research (AIR), will support 5 to 10 one-year research and analysis grants ranging up to $15,000 for dissertation work and up to $30,000 for other proposals in a content area identified as important by the NPEC Executive Committee. The first focal content area for the 2003-04 grant year is student success in postsecondary education. This focal area derives from another NPEC initiative, NPEC's Student Success Project. This project is taking a multifaceted approach to examining student success in postsecondary education by supporting several different research activities in the area of student success in postsecondary education, including commissioned papers, data analyses and syntheses, case studies, and the development of data tools. It is anticipated that the activities in this area will culminate in a national conference in the spring of 2006.
Other ongoing activities include:
the development and maintenance of an online tool, ANSWERS, available at http://nces.ed.gov/npec/answers. This web-based tool is designed to help users quickly find the surveys, data, and support needed for institutional research, policy analysis, and other studies;
the development of state-level indicators related to the student and the economy on the National Information Center for Higher Education Policymaking and Analysis web site (http://www.highererlinfo.org). This site is maintained by the National Center for Higher Education Management Systems (NCHEMS);
the creation of a catalog on the multitude of definitions and concepts associated with persistence and completion data and reporting. This catalog will serve as a guide to the various methodologies used in calculating indicators of persistence and completion; and
the development of a data feedback system, which will provide reports to responding institutions based on their Integrated Postsecondary Education Data System (IPEDS) data. The data feedback project will develop indicators initially focused on enrollment, faculty, and finance for each institution and its national comparison group, and incorporate them into a published report that institution personnel can use for internal management and external dissemination.
Major Publications Defining and Assessing Learning: Exploring Competency-Based Initiatives (September 2002)
Paving the Way to Postsecondaty Education: K-12 Intervention Programs for Underrepresented Youth (September 200 1 )
The NPEC Sourcebook on Assessment, Volume 1: Definitions and Assessment Methods for Critical Thinking, Problem Solving, and Writing (September 2000)
Best Practices for Data Collectors and Data Providers (January 1999)
Technology and its Ramifications for Data Systems (August 1998)

For more information about NPEC, contact:
Nancy Borkow Postsecondary Studies Division Postsecondary Co-Operative System, Analysis, and Dissemination Program National Center for Education Statistics 1990 K Street NW Washington, DC 20006 Telephone number: (202) 502-73 1 1 E-mail address: nancy. [email protected]
NCESlState Postsecondary Education Coordination Network The NCESJState Postsecondary Education Coordination Network has been in continuous
operation since 1976. The purpose of the Network is to represent states' mutual interest in postsecondary data selection, collection, analysis, and utilization, and to provide feedback to NCES about its plans for data collection and related activities through a single formal organization or network composed of representatives from all the states, the District of Columbia, and Puerto Rico.
Toward this effort, the Network facilitates cooperation and coordination between NCES and the State Higher Education Executive Officers (SHEEO) and other state postsecondary entities regarding national postsecondary survey-related activities. The Network provides a vehicle through which NCES can disseminate information directly and quickly to the highest-level postsecondary education officials in the states, thereby facilitating the exchange of ideas and information on matters of mutual concern involving postsecondary education data collection and related activities. The Network also serves as an organization through which states and postsecondary institutions can exchange technological expertise and current information, and provide technical assistance regarding state-of the-art technologies for their own data collection and data exchange activities, as well as NCES data collection and data exchange efforts.
Additionally, because of its relationship with the states, the Network is in a unique position to 1) work with NCES in the development, dissemination, and testing of standard data definitions in published and electronic formats; and 2) advise in the development and design of new surveys and data collection methodologies. The Network is also able to provide support for a partnership between states, postsecondary institutions, and the federal government in the implementation of the mission and activities of NCES.
Project activities include meetings with the Network Steering Committee and an annual national meeting and IPEDS workshop with SHEEO Network representatives. The Network issues a quarterly technical report containing information about NCES and state activities, with a focus on selected issues of significance to the postsecondary community. It also provides an advisory service summarizing developing postsecondary education issues and related data needs. Additionally, the Network maintains a library service providing information about state and federal postsecondary education data collections. There is also a personnel exchange service that provides funds for staff of state higher education agencies to meet each other and share technical assistance information .
regarding their data collection and dissemination efforts.

For more information on SHEEO, contact:
Nancy Borkow Postsecondary Studies Division Postsecondary Co-Operative System, Analysis, and Dissemination Program National Center for Education Statistics 1990 K Street NW Washington, DC 20006 Telephone number: (202) 502-73 1 1 E-mail address: [email protected]
Integrated Postsecondary Education Data System (IPEDS) Workshops
State Coordinator Workshops-These are conducted on an annual basis, usually in the spring. A full-day workshop provides IPEDS State Coordinators and other interested parties with up-to-date information on IPEDS, plans for the future, anticipated changes, and other issues of interest. This forum allows for the exchange of ideas and practices, and a general sharing of information among the various state coordinators, federal agencies, and education association representatives.
Regional workshops-IPEDS staff conduct regional workshops on an as-needed basis. These are generally held when new surveys (such as the Graduation Rate Survey) are implemented or when significant changes are made to the survey forms that warrant training of institutional respondents. Workshops are held in various key cities across the nation to allow respondents to attend one close to their institution's location. Attendees are provided with materials such as new survey forms, Guidelines for Survey Respondents, and frequently asked questions and answers to help them understand the changes and the new requirements. Regional workshops were last held in 1993 (for all IPEDS surveys) and in 1997 (for the Graduation Rate Survey).
Cooperative System Fellows Program-In 1990, NCES initiated the Cooperative System Fellows Program as part of its ongoing effort to increase cooperation among federal, state, and local education data collectors, and to improve the overall quality and timeliness of education statistics. Twice each year, Fellows nominated by local, state, higher education, and library agencies across the country convene in Washington, D.C., for 1 week. The purpose is to provide participants with an overview of the many NCES activities and to foster professional ties between education professionals and members of the federal statistical community.
During their stay, Fellows take part in a series of planned activities, including presentations by NCES staff on NCES major data collections, reports, and dissemination practices; projects to automate state and local data systems; and efforts to integrate existing data collections. In addition, Fellows explore their own professional interests and objectives. During the week, mentors selected from NCES staff work with Fellows and lead discussions on various topics, answer questions, and offer guidance and advice. An effort is made to help Fellows achieve their individual program objectives. The Fellows Program is held in May and November of each year, and includes approximately 30 Fellows at each session. There is no charge and NCES reimburses participants' expenses.
Postsecondary Handbooks
NCES develops, disseminates, and encourages the use of handbooks to promote commonality and consistency in the data elements and definitions that are used to define, measure, and report postsecondary education data. This activity is an important part of NCES efforts to improve the quality and comparability of education data.
Handbooks have been an integral part of the NCES postsecondary program since the late 1960s. In 1966, NCES established a common language that higher education institutions could use to record and report on major fields of study. This language-codes from the Higher Education General Information Survey (HEGISjevolved into the Classification of Instructional Programs (CIP) that encompasses not only the academic programs included in the HEGIS program codes, but vocational and occupational program codes as well. The CIP was implemented in 1986 with the beginning of IPEDS and revised in 1990. It forms the basis for the IPEDS "Completions" report. A revision of the 1990 CIP, CIP: 2000, has been available since May 2002.
In 1973, NCES published the Higher Education Facilities Inventory and Classification Manual. This manual, initially developed by a group of facilities experts, evolved through several versions and was issued and used with the approval of professional groups, state agencies, and institutional associations. Last published in 1974, the manual was widely used and adapted. In recognition of the fact that planning for and use of facilities had changed significantly and many states and institutions were beginning to devise their own classification structures, SHEEO assembled a Working Group on College and University Facilities in 1989. The work of these groups resulted in the 1992 Postsecondary Education Facilities Inventory and Classification Manual (FICM). The 1992 FICM provides a common framework and coding structure for use in collecting and reporting inventory data on postsecondary institution buildings and on the space within those structures, primarily rooms. The manual also suggests to institutions a pattern for compiling essential data on their physical facilities, and provides a set of common building definitions and room codes so that reported data are reasonably consistent and comparable across institutions and states. Plans to update the 1992 manual are underway.
NCES has published the first handbook on faculty and staff in postsecondary institutions. The 1998 Handbook on Human Resources: Recordkeeping and Analysis provides postsecondary institutions with coding structures, data element definitions, analytic conventions, and recommendations for developing and maintaining a central data file on the institution's faculty and staff that will be useful for resource and policy analysis and planning at the institutional level. This handbook, as with all other NCES handbooks and manuals, was developed in conjunction with a technical panel of experts in the field of faculty and human resource issues and problems. One objective in developing this handbook was to provide institutions with the necessary tools to report high-quality data to the IPEDS Staff and Salary surveys, and to facilitate their participation in the NSOPF. An update of the 1998 manual is currently underway.
The development of the Postsecondary Student Handbook is a cooperative effort among NCES, SHEEO, and the American Association of Collegiate Registrars and Admissions Officers. The primary objective of this handbook is to promote commonality and consistency in the data elements and definitions that are used to define, track, measure, and report postsecondary student data. The handbook identifies a comprehensive and uniform set of data elements, definitions, and coding descriptors to use in postsecondary student record-keeping systems. The handbook also provides
recommendations for standardizing the methods and practices by which data on students are collected, reported, and exchanged; suggests a framework for developing or upgrading student tracking systems; and identifies and promotes sound practices for institutional reporting to state and federal agencies.
The Classification of Instructional Programs: 2000 Edition is available as a searchable database on the NCES web site.
Major Publications ClassiJication of Instructional Programs: 2000 Edition (2002)
Handbook on Human Resources: Recordkeeping and Analysis (1 998)
Postsecondary Student Handbook (Forthcoming)
For further information on the NCES postsecondary education handbook program, contact:
Roslyn Korb Postsecondary Studies Division Postsecondary Co-Operative System, Analysis, and Dissemination Program National Center for Education Statistics 1990 K Street NW Washington, DC 20006 Telephone number: (202) 502-7378 E-mail address: roslyn. [email protected]
Plans for Postsecondary and Adult Education NCES recently completed a major redesign of the IPEDS program, converting it from a paper-
based system to a totally web-based system. Changes in collection procedures, data elements, timing, and processing were phased in through the 2001-02 academic year.
Part of the redesign focused on separate data collections for Title IV and non-Title IV institutions. The approximately 6,900 Title IV institutions are required to respond to the full set of IPEDS surveys according to the Higher Education Amendments of 1998. However, the non-Title IV institutions have no similar requirement. NCES has already identified 2,700 non-Title IV institutions and is planning an 18-month study to estimate the number of these institutions and the characteristics of the students they serve. This will be done through an area search, followed by a telephone survey of the institutions identified through the area search. This study is called the IPEDS MDS (minimum data set) since institutions will be asked to provide a minimum number of data items.
IPEDS will continue to provide a sampling frame for other postsecondary surveys, such as the ongoing NPSAS and NSOPF. PEQIS will be used to collect data for addressing emerging and focused issues that the ongoing data collection systems are unable to provide. PEQIS surveys being planned or implemented include Distance Education, Students with Disabilities in Postsecondary Education, Faculty Workload, and Noncredit Course Offerings.
Some postsecondary institutions use an automated data system for a nationwide electronic records transfer system. The Standardization of Postsecondary Education Electronic Data Exchange

developed a set of data elements and definitions in American National Standards Institute format to be used in the pilot electronic transfer of student records among postsecondary institutions. Data elements are included in five different areas: demographics, academic history, special programs and services, health, and test information. NCES is examining other applications for the electronic exchange of data among postsecondary institutions.
The NHES has become a source of many key indicators of the educational status of children and adults. The 2001 NHES included the Adult Education and Lifelong Learning Survey. This survey was largely a repeat of the Adult Education surveys done in detail in 1991 and 1995, and in brief in 1999. The 2003 NHES included a survey with more focus on work-related adult education.
The last cycle of the NSOPF occurred in the 1998-99 academic year. NSOPF:99 was limited to surveys of institutions, faculty, and instructional staff. It allowed for comparisons to be made over time and expanded existing topics surrounding faculty and instructional staff that have developed as critical issues since the first two studies. Expansion topics included the increasing use of part-time instructional faculty and staff at higher education institutions and their credentials for teaching; the decline of full-time tenure-track appointments as institutions explore possible alternatives to tenure; faculty's allocation of time to teaching versus research; measures of faculty workload and productivity; the presence of women and minority faculty in higher education institutions; and the effects, if any, of the removal of mandatory retirement for faculty and instructional staff. NSOPF:99 was also collected over the web for the first time. The fourth cycle of NSOPF will be conducted in 2003-04 and will make even greater use of web technology.
Meeting the challenges of maintaining current data and possibly establishing new data collection activities takes a cooperative effort among institutions, states, and NCES. As part of this effort, the NCESIState Postsecondary Education Coordination Network and NPEC will continue to facilitate coordination and the exchange of data, technology, and information between the states, postsecondary institutions, and NCES. Further, NPEC will continue to strive to identify new trends in postsecondary education and emerging issues that have implications for data collection, reporting, and dissemination in order to facilitate the production of better data for better decisions. Continuing activities will focus on NPEC's strategic areas: student success in postsecondary education and data infrastructure.
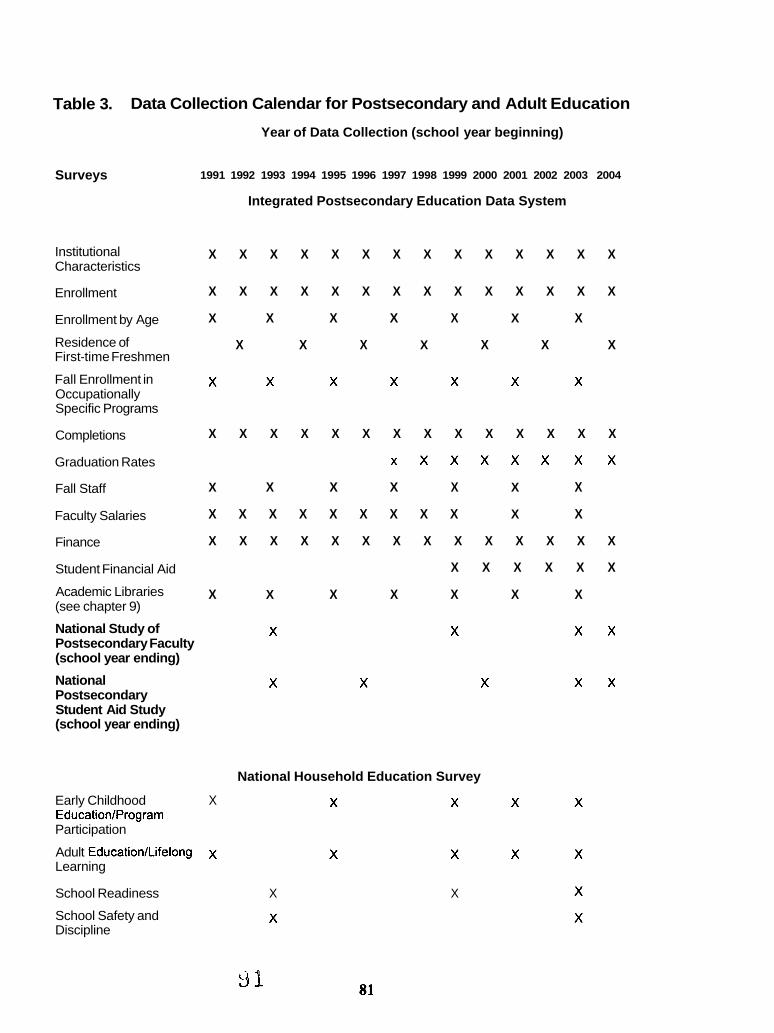
Table 3. Data Collection Calendar for Postsecondary and Adult Education
Year of Data Collection (school year beginning)
Surveys
Institutional Characteristics
Enrollment
Enrollment by Age
Residence of First-time Freshmen
Fall Enrollment in Occupationally Specific Programs
Completions
Graduation Rates
Fall Staff
Faculty Salaries
Finance
Student Financial Aid
Academic Libraries (see chapter 9)
National Study of Postsecondary Faculty (school year ending)
1991 1992 1993 1994 1995 1996 1997 1998 1999 2000 2001 2002 2003 2004
Integrated Postsecondary Education Data System
National Postsecondary Student Aid Study (school year ending)
X X X X X X X X X X X X X X
X X X X X X X X X X X X X X
X X X X X X X
X X X X X X X
X X X X X X X X X X X X X X
x X X X X X X X
X X X X X X X
X X X X X X X X X X X
X X X X X X X X X X X X X X
X X X X X X
X X X X X X X
Early Childhood X EducationIProgram Participation
Adult EducationILifelong x Learning
National Household Education Survey
School Readiness X X
School Safety and Discipline

Table 3. Data Collection Calendar for Postsecondary and Adult Education- Continued
Year of Data Collection (school year beginning)
Surveys
Parent and Family Involvement in EducationlCivic lnvolvement
Adult Civic Involvement
Youth Civic Involvement
Before- and After-School Programs and Activities
Household Public Library Use
Survey of Earned Doctorates
October Supplement X X
National Household Education Survey-continued
X X X X X X X X
NCES Items in the Current Population Survey (see chapter 3)
X X X X X X X X
The National Center for Education Statistics (NCES) collects and reports information on the academic performance of the nation's students and assesses the literacy level of the adult population. NCES also participates in international assessments (see chapter 7, "International Statistics").
The congressionally mandated National Assessment of Educational Progress (NAEP) is the primary NCES assessment of what American elementary and secondary students know and can do in academic subjects. For more than 3 decades, NAEP has collected and reported information on the knowledge and skills of national and, since 1990, state samples of grade-representative populations in a variety of school subjects. In 2002, NAEP also began a multiyear study of the feasibility of assessing additional samples that would allow the reporting of student achievement in major urban school districts.
Besides assessing student achievement, the educational assessment program at NCES also assesses the proficiency of adults in performing basic literacy and mathematical tasks through the National Assessment of Adult Literacy Survey. In 1992, NCES conducted the National Adult Literacy Survey PALS)-a household-based literacy survey of adults age 16 and over. The 2003 National Assessment of Adult Literacy (NAAL) survey builds upon the 1992 NALS and will provide an accurate benchmark for measuring the literacy capabilities of adults. Both surveys include the general adult population as well as adults in institutional settings such as prisons.
NCES also collects data from students' high school transcripts. These data include courses students have taken as well as the grades they attained. These studies are generally conducted in conjunction with NAEP and other major survey studies to facilitate the incorporation of achievement data. High school transcript data have been used for a variety of assessment purposes. Most notably, such data serve as a barometer for changes in high school student course-taking patterns. These data, in combination with school course offerings, provide valuable information about the rigor of high school curriculums across the nation. The 2000 High School Transcript Study examined the trends and changes in high school curriculum and student course-taking patterns over the past decade (1 990-2000).
Together with performance results in subject areas, the basic descriptive information about students, teachers, administrators, and communities collected systematically by NAEP from its surveys has been used to address the following four educational policy issues that are of concern to educators, policymakers, and researchers:
Instructional practices: What instructional methods are being used?
Students at risk: How many students appear to be at risk, in terms of achievement, and what are their characteristics?
Distribution of teacher qualities among different student populations: What are the characteristics of teachers of various subjects that students are exposed to?
Education reform: What, if any, policy changes are being made by our nation's schools?

Over the past 30 years, NAEP has generated more than 200 reports spanning 11 instructional areas. It is the nation's only ongoing, comprehensive, and representative assessment of what American students know and can do.
Data Uses NAEP data have been used frequently in numerous ways by researchers, educators,
policymakers, and the general public. Researchers have used NAEP data to describe performance trends in many subject areas, such as learning reading and mathematics skills, achievement in the arts, teachers' instructional practices, and school contextual characteristics. Policymakers often cite NAEP data to illustrate the state of the American education system. Educators have used the results to develop standards for improving mathematics and science curriculums. State and local officials have used NAEP data to identi@ the need for education reform. State performance on NAEP reading and mathematics assessments will be a major tool for examining state success in the No Child Left Behind Act (NCLB).
Studies
National Assessment of Educational Progress
The National Assessment of Educational Progress (NAEP) is mandated by Congress (Elementary and Secondary Education Act [ESEA], Section 4 1 1, as amended by NCLB) to continuously monitor the knowledge, skills, and performance of the nation's children and youth. Under this legislation, NAEP is required to provide objective data about student performance at national, regional, and state levels.
Design
NAEP has evolved since 1969 through a number of stages. Since 1969, NAEP reported on the performance of 9-, 13-, and 17-year-old students representative of the nation and four geographic regions. Subjects assessed included reading, writing, mathematics, science, music, art, consumer skills, and energy awareness. Reporting consisted of the percentage of students correctly responding to test questions.
A number of improvements were made to NAEP beginning in 1984. Performance of students began to be reported on a scale, rather than by individual item statistics. Samples representative of both grades (4th, 8th, and 12th) and ages (9, 13, and 17) were collected. Subjects assessed included reading, writing, history, geography, civics, computer competence, and literature.
In 1988, the National Assessment Governing Board (NAGB) was created to set policy for NAEP, in connection with its task to report academic performance on state representative samples. State NAEP assesses mathematics, reading, writing, and science. The assessments given in the states are exactly the same as those given nationally but, because the national NAEP samples were not designed to support the reporting of accurate and representative state-level results, separate

representative samples of students were selected for each participating jurisdictionlstate. State NAEP assesses at grades 4 and 8, but not at grade 12.
NAGB developed new frameworks for subjects assessed. For these newly specified test specifications, NAGB set achievement levels of Basic, Proficient, and Advanced for new subjects assessed, beginning in 1990. NAEP assessed mathematics, reading, writing, and science for both national and state representative samples. These NAEP assessments made it possible for the program to reflect current educational content and assessment methodology. Items for this version of NAEP (main NAEP) include both multiple-choice and constructed-response (requiring written answers) questions, and the content and nature of the instruments evolve to match instructional practice and incorporate the latest advances in assessment methodology.
NAEP administers national main NAEP assessments according to the NAGB-adopted assessment schedule. For example, a national assessment of foreign language is planned for 2004, and assessments of U.S. history, civics, and economics are scheduled for 2006. National NAEP reports statistical information about student performance and factors related to educational performance for the nation and specific subgroups of the population.
In 2002, NAEP began a Trial Urban District Assessment. In 2002, five districts participated; in 2003, four additional districts participated in addition to the original five.
The final component of NAEP is the long-term trend. This assessment used the same types of questions (mostly multiple-choice) and data collection procedures that were used in the early 1970s for assessing reading, mathematics, and science. Age-representative samples were used, and data from assessments prior to 1984 were placed on the same scale in order to measure academic change over the decades. The writing long-term trend began in 1984, reporting results for grade- representative samples (4th, 8th, and 1 1 th grades). Because of technical problems, the last data point for the writing long-term trend was for 1996. The long-term trend is being revised to improve the quality of the assessment. The next long-term trend assessment in 2004 will report on the mathematics performance of 9-, 13-, and 17-year-olds relative to achievement in 1973, and 2004 reading achievement relative to 1971 performance. Results are reported for the nation, geographic regions of the nation, and various subgroups of the population such as racial and ethnic groups.
Because the long-term trend assessment uses different instruments from those used in the main assessments and because students are sampled by age for the long-term trend assessment rather than by grade as in the main assessments, it is not possible to compare results from the two assessment programs. The existence of the two national assessment programs-long-term trend and main- makes it possible for NAEP to meet two important objectives: measuring educational progress over time and developing new assessment instruments that periodically reflect current educational content and assessment methodology.
Since 1990, NAEP assessments in reading, mathematics, science, and writing have also been conducted for states and other jurisdictions that choose to participate. Beginning with the 2002 assessments, a combined sample of public schools was selected for both state and national NAEP. It was thought that drawing a subset of schools from all of the state samples to produce national estimates would reduce burden by decreasing,the total number of schools participating in state and national NAEP. From this group of schools, representing 50 states, a subsample was identified as the national subset.
Therefore, the national main NAEP sample is the combined sample of students assessed in each participating state, plus an additional sample from the states that did not participate in the state assessment. This additional sample ensures that the national sample is representative of the total national student population. The full data set is analyzed together, allowing all data to contribute to the final results and setting a single scale for the assessment. All results are then reported in the scale score metric used for the specific assessment.
States and local school districts receiving Title I funds are required by NCLB to participate in biennial reading and mathematics assessments beginning in 2003. In 2003, the baseline year for NCLB, reading and mathematics were assessed at the state and national levels at grades 4 and 8. All 50 states, 4 jurisdictions, and 9 large urban school districts participated in the 2003 reading and mathematics assessments. These assessments involved about 700,000 students in over 13,000 schools.
Reading and mathematics will now be assessed every 2 years at the national and state levels. Writing and science will be assessed at least every 4 years. Frameworks for these subjects will be developed to last through three assessments (i.e., 12 years). Other subjects, such as geography, history, the arts, and foreign languages, will be assessed in the intervening years. Streamlining NAEP's sampling scheme, data collections, and reporting schedule, while increasing the information value of the various subject-matter tests, will enable NCES to provide the nation an enriched, technically rigorous, and authoritative basis for making decisions about education.
Components In the main national and main state assessments, background information is collected from
students, teachers, and school administrators. Data are available on such student characteristics as gender, race and ethnicity, level of parents' education, eligibility for the Eree or reduced-price lunch program, participation in Title I to assist at-risk students, attendance at public or private schools, limited English proficiency, and presence of a disability. Characteristics of teachers include academic preparation and classroom practices. NAEP also reports on school characteristics, such as courses offered, availability of computers, participation of parents, and the existence of problems such as tardiness or violence. For the long-term trends, background information is collected from students and school administrators only.
Elementary and Secondary School Students Survey-The primary data collected by NAEP are about student performance and educational experience. Major current assessment areas include reading, writing, mathematics, science, civics, U.S. history, geography, foreign languages, and the arts. Data include overall performance, performance on specific content dimensions, demographic characteristics, classroom experiences, and aspirations for the future.
School Characteristics and Policy Survey-In conjunction with student performance surveys, NCES routinely collects important supplemental data about school characteristics and school policies, including enrollment, cumculum testing, and objective-setting practices; school administrative practices; school conditions and facilities; special services; and programs.
Teacher Survey-NAEP also collects important supplemental data from teachers whose students are respondents of the assessment surveys. Teacher data include racelethnicity, sex, field of study, teaching certification, professional development, full-time teaching experience, classroom instructional practices, and subject-matter specialization.

Major Publications
The Nation 's Report Card: Mathematics Highlights 2002 (October 2003)
The Nation 's Report Card: Reading Highlights 2003 (October 2003)
The Nation 's Report Card: Trial Urban District Mathematics Highlights 2002 (October 2003)
The Nation 's Report Card: Trial Urban District Reading Highlights 2002 (October 2003)
The Nation 's Report Card: Reading 2002 Trial Urban District Assessment (July 2003)
The Nation 's Report Card: Writing Highlights 2002 (July 2003)
The Nation 's Report Card: Writing 2002 (July 2003)
The Nation 's Report Card: Reading Highlights 2002 (June 2003)
The Nation 's Report Card: Reading 2002 (June 2003)
The Nation's Report Card: Science 2000 (February 2003)
The Nation 's Report Card: Geography Highlights 2001 (June 2002)
The Nation 's Report Card: Geography 2001 (June 2002)
The Nation 's Report Card: U.S. History Highlights 2001 (May 2002)
The Nation 's Report Card: U.S. History 2001 (May 2002)
The Nation S Report Card: Science Highlights 2000 (November 200 1)
Impact of Students ' Background Variables on Students ' NAEP Mathematics Performance (October 200 1)
A Comparison on the National Assessment of Educational Progress (NAEP), the Third International Mathematics and Science Study-Repeat (TIMSS-R), and the Program for International Student Assessment (PISA) (September 200 1)
Assessing the Best: NAEP S 1996 Assessment of Twelfth-Graders Taking Advanced Science Courses (September 200 1 )
NAEP 2000 Mathematics State Reports (one for each participating jurisdiction) (August 2001)
NAEP 1998 Technical Report (August 200 1)
NAEP 2000 Fourth-Grade Reading Report Card (April 200 1)
Monitoring School Quality: An Indicators Report (November 2000) [Similar reports were published for the 1992,1994, and 1996 long-term trend assessments.]
NAEP 1999 Trends in Academic Progress: Three Decades of Student Performance (August 2000)
Estimation Skills, Mathematics-in-Context, and Advanced Skills in Mathematics (March 2000)
NAEP 1998 Civics Report Card for the Nation (November 1999)
Student Work and Teacher Practices in Mathematics (July 1999)
NAEP 1998 Reading Report Card for the Nation and the States (March 1999)
NAEP 1998 Reading State Reports (Alabama Through Wyoming) (March 1999)
The NAEP 1997 Arts Report Card: Eighth-Grade Findings From the National Assessment of Educational Progress (November 1998)
School Policies and Practices Affecting Instruction in Mathematics (October 1998)

Students Learning Science (October 1998)
School Policies and Practices Affecting Instruction in Mathematics: Findings From NAEP (September 1998)
Linking the National Assessment of Educational Progress (NAEP) and the Third International Mathematics and Science Study (TIMSS): A Technical Report (August 1998)
Linking the National Assessment of Educational Progress (NAEP) and the Third International Mathematics and Science Study (TIMSS): Eighth-Grade Results (July 1998)
NAEPS Constituents: What Do They Want? (February 1998)
Brief Publications
Frequency of Arts Instruction for Students (January 200 1)
How Does NAEP Ensure Consistency in Scoring? (January 200 1)
NAEP Scoring of Eighth-Grade Informative Writing (January 200 1 )
NAEP Scoring of Fourth-Grade Narrative Writing (January 200 1)
NAEP Scoring of Twelfth-Grade Persuasive Writing (January 200 1)
Student Musical Activities and Achievement in Music: NAEP 1997 Arts Assessment (January 200 1)
Student Subgroup Achievement on the NAEP Arts Assessment (January 200 1)
How Does NAEP Select Schools and Students? (September 2000)
Reading Results for Low-Performing Students (September 2000)
Students Who Prepare for College and a Vocation (August 1999)
Long-Term Trends in Student Mathematics Performance (October 1998)
Long-Term Trends in Student Science Performance (October 1998)
User Guides
The Nation 's Report Card: Parent's Guide to NAEP (February 2003)
The Nation 's Report Card: An Overview of NAEP (October 2002)
The NAEP Guide: A Description of the Contents and Methods of the 1999 and 2000 Assessments, Revised Edition (November 1999)
Technical Issues in Large-Scale Assessments (May 1996)
Overview of the NAEP Assessment Frameworks (March 1994)
Interpreting NAEP Scales (April 1993)
Other Reports of Interest
The ESfects of Accommodations on the Assessment of LEP Students in NAEP (October 2001)
A Comparison of NAEP, TIMSS-R, and PISA (June 2001)
The Measurement of Home Background Indicators (March 200 1)

Increasing the Participation of Special-Needs Students in NAEP (March 2000)
Learning About Our World and Our Past: Using the Tools and Resources of Geography and History (January 1998)
Essential Skills in Mathematics: A Comparative Analysis of American and Japanese Assessments of Eighth- Graders (April 1 997)
Data Files
1996 Almanac Viewer (Mathematics and Science) (June 1998)
1996 National and State Summary Data Tables (June 1998)
1996 National Assessment (June 1998)
1996 State Assessment (June 1998)
1994 National Assessment (September 1996)
1994 State Reading Assessment (September 1996)
1994 Almanac Viewer (Reading, Geography, and History) (February 1996)
More current NAEP data are released on the web concurrently with the public release of reports and can be accessed with the easy-to-use NAEP Data Tool. Public-use data files are available for each assessment in NAEP prior to 1990. Only restricted-use data files are available beginning with 1990. Reports are available from the U.S. Government Printing Office or on the web (http://nces.ed.gov/nationsreportcard).
For hrther information on NAEP, contact:
Sherran Osborne Assessment Division National Center for Education Statistics 1990 K Street NW Washington, DC 20006 Telephone number: (202) 502-7420 E-mail address: [email protected]
High School Transcript Studies
The High School Transcript Studies (HSTS) are a series of studies, seven in total, that provide educational researchers and policymakers with information regarding current course offerings and course-taking patterns in the nation's secondary schools. In 1983, the National Commission on Excellence in Education (NCEE) released a report, A Nation at Risk, which recommended a minimum high school course of study. Since the NCEE report, there have been a number of critics advocating the strengthening of the high school core curriculum. Students have been encouraged- through a reformed curriculum-to increase the number of academic courses they take in English, mathematics, science, social studies, computer science, and foreign languages. The changes in student course-taking patterns across the past 2 decades are reflected in the results of the various transcript studies.

The first study was part of the High School and Beyond (HS&B) first follow-up survey in 1982 (see chapter 6 for more information on HS&B). Transcripts were collected for the HS&B sophomore cohort of students who were seniors in 1982. In 1992, another transcript study was conducted in conjunction with the 1992 second follow-up survey from the National Educational Longitudinal Study of 1988 (NELS:88) (see chapter 6 for more information). The majority of the transcript studies, however, have been conducted in conjunction with the National Assessment of Educational Progress (NAEP). These transcript studies were conducted in 1987, 1990, 1994, 1998, and 2000 and provide additional information on the relationship between student course- taking patterns and achievement as measured by NAEP. While the 1987 HSTS was a study of the 1 1 th-grade cohort of the 1986 NAEP long-term trend assessment, subsequent transcript studies conducted in conjunction with NAEP collected over 20,000 transcripts per study from a nationally representative sample of students, most of which participated in the main NAEP assessments that year. The next HSTS is scheduled for 2005.
Transcript data are measures of student exposure to courses rather than measures of student classroom learning since the studies do not include information on course content. The data collected by the transcript studies allow investigation of student course-taking patterns, school curriculum, and the relationship between course-taking patterns and academic performance.
Design The HSTS is conducted with a nationally representative sample of students and schools.
Beginning in the summer and continuing through the fall of the year, high school transcripts are collected for students who graduated from public and nonpublic high schools that were sampled for the NAEP assessments. The sample of schools is nationally representative of all schools in the United States, and the sample of students is representative of graduating seniors from each school. The transcript study includes only those students whose transcripts indicate that they graduated the year that the study was conducted. Most of the students sampled in the transcript study are in schools that participated in NAEP, and the remaining students were sampled specifically for the transcript study. The data collected from those students who participated in NAEP make it possible to associate course-taking patterns to academic performance, as measured by the NAEP assessment.
To ensure maximum possible compatibility between the various transcript studies, similar procedures and formats used in previous studies for data editing, course coding, error resolution, and documentation have been used for each subsequent transcript study. This consistency enables users to compare cohorts of students with a minimum of effort.
The HSTS database contains a variety of information on student and course-level characteristics. Some of the key variables are listed below.
Student characteristics:
gender;
type of high school program;
days absent;
grade point average;

standardized test scores (i.e., SAT, ACT); and
class rank.
Course-level characteristics:
grade earned;
credits earned;
when course was taken; and
course type (i.e., honors, exceptional, special education).
Data from the transcript studies are summarized in a set of reports: a summary report, a tabulations report, a technical report and user's guide, and a CD-ROM (restricted-use). The 2000 transcript study summary report, The High School Transcript Study: A Decade of Change in Curricula and Achievement, 1990-2000, focuses on the trends and changes in high school curriculum and student course-taking patterns for the past decade.
Major Publications
The High School Transcript Study: A Decade of Change in Curricula and Achievement, 1990-2000 (November 2003)
The 1998 High School Transcript Study Tabulations: Comparative Data on Credits Earned and Demographics for 1998, 1994, 1990, 1987, and 1982 High School Graduates (June 200 1)
The 1998 High School Transcript Study User's Guide and Technical Report (June 200 1)
For more information on the HSTS, contact the people listed below:
1982 AND 1992 STUDIES:
Jeff Owings ElementaryISecondary Libraries Studies Division Secondary Longitudinal and Transcript Studies Program National Center for Education Statistics 1990 K Street NW Washington, DC 20006 Telephone number: (202) 502-7423 E-mail address: [email protected]
1987,1990,1994,1998, AND 2000 STUDIES:
Janis Brown, Ph.D. Assessment Division Assessment Development and Quality Assurance Program National Center for Education Statistics 1990 K Street NW Washington, DC 20006 Telephone number: (202) 502-74 19 E-mail address: janis. [email protected]
P O I
National Assessment of Adult Literacy Survey
Literacy assessments inform policymakers about the extent of skills in using printed information that adults need to function in society, achieve their goals, and develop their knowledge and potential. Recently, concern has mounted that inadequacies in literacy are preventing some Americans from exercising the rights and responsibilities of citizenship. The 2003 National Assessment of Adult Literacy (NAAL) survey provides an accurate benchmark for measuring the literacy capabilities of adults. The NAAL survey builds upon the previous 1992 National Adult Literacy Survey (NALS).
There has been serious concern about the literacy level of the American workforce, as described in a number of national reports published since 1980, including A Nation At Risk, Toward a More Perfect Union, The Subtle Danger, Workforce 2000, The Bottom Line, and Literacy: Profiles of America's Young Adults. These reports have emphasized the need to increase our nation's standard of literacy in order to maintain our standard of living and to compete in the global market. The role of the NAAL survey is to provide the information needed to begin understanding our nation's literacy capabilities.
Design The 1992 NALS was administered in the summer of 1992 in person by trained interviewers to a
nationally representative probability sample of about 13,000 individuals age 16 and older and to 1,100 adults incarcerated in federal and state prisons. In addition, 12 states funded sample supplements of 1,000 adults in order to obtain literacy estimates for their state populations. This was the first national study of literacy for all adults since the Adult Performance Level surveys, which were conducted in the early 1970s.
The 2003 NAAL is a nationally representative and continuing assessment of the English language literacy skills of American adults age 16 and older. NAAL continues to use the definition of literacy underlying the 1992 assessment: usingprinted and written information to function in society, to achieve one's goals, and to develop one's knowledge andpotential. Like the 1992 assessment, the 2003 NAAL focuses on a broad range of tasks that adults perform in order to fimction at work, at home, and in the community.
The main data collection took place in 2003. Approximately 19,500 adults representing the household population from the 50 states and the District of Columbia were sampled. Black and Hispanic households were oversampled to ensure reliable estimates of their literacy proficiencies. In addition, about 1,200 inmates of federal and state prisons from across the country will be assessed in early 2004 in order to provide separate estimates of literacy levels for the incarcerated population.
Components In addition to describing the status and progress of literacy in the nation and in each of the
participating states, the 2003 NAAL will provide information about background factors associated with literacy, the skill levels of the least literate adults, and the application of literacy skills to health- related materials. The 2003 NAAL features two new components that enhance its ability to measure the literacy of the least literate adults: the Fluency Addition to NAAL (FAN) and the Adult Literacy Supplemental Assessment (ALSA). These components will provide important new data on the

literacy skills of those adults with the poorest text comprehension skills. Other enhancements to NAAL include a more extensive background questionnaire and the ability to provide a health literacy score.
Fluency Addition to NAAL (FAN). FAN is completed by all NAAL participants. FAN uses speech- recognition software to assess the ability of adults to decode and recognize words and to read with fluency. FAN tasks include reading lists of words and numbers as well as text passages. Oral directions and questions are provided in English or Spanish, depending on each participant's choice. Words-per-minute and reading accuracy are recorded for analysis and scoring. Adult education providers, in particular, may use this information to offer appropriate instruction and courseware for literacy and professional training.
Adult Literacy Supplemental Assessment (ALSA). ALSA participants are identified based on their performance on a set of core screening items; they complete ALSA instead of the main NAAL. ALSA assesses the ability of the least literate adults to identify letters and numbers and to comprehend simple prose and documents. A unique feature of ALSA is its use of highly familiar stimulus materials that can be manipulated (e.g., packaged food products) and contextualized (i.e., supported by visual information, logos, and sight words). As with FAN, oral directions and questions are provided in either English or Spanish. Unlike FAN, however, ALSA also allows participants to answer in either English or Spanish. Policymakers may use information about the skill levels of the least literate adults to create or improve programs that help their employment, health status, self- esteem, and ability to participate in a free society.
Enhanced background questionnaire. The new background questionnaire developed for NAAL provides more information about the demographics and other factors associated with literacy. Federal and state policymakers may use this information to improve literacy services that close the gap between low- and high-performing groups, to inform workplace literacy programs, and to encourage hrther research on the factors associated with low literacy.
NAAL health literacy score. The health literacy score is derived from 26 health-related questions embedded in the main NAAL, plus 10 health-related questions included in the enhanced background questionnaire. The health questions assess the ability of adults to apply literacy skills to understand health-related materials and forms. Health organizations can use the health literacy information to identify target audiences for specific types of health information, the literacy level at which materials for these audiences should be written, and the best ways of reaching them.
The 2003 NAAL data will be used to produce a comprehensive survey report and a "popular" report designed for a more general audience, both of which will address the status of literacy among adults in the United States and literacy trends over time. In addition, NCES will produce data tables for reporting statewide results for each of the six participating states (Kentucky, Maryland, Massachusetts, Missouri, New York, and Oklahoma).
Major Publications
Literacy of Older Adults in America: Results From the National Adult Literacy Survey (November 1996)
Literacy Behind Prison Walls: Profiles of the Prison Population From the National Adult Literacy Survey (October 1 994)

Adult Literacy in America: A First Look at the Results of the National Adult Literacy Survey (September 1993)
Information about NAAL can be found on the web (http://nces.ed.gov/naal). For hrther information on the 1992 NAAL Survey, contact:
Sheida White Assessment Division Office of the ~ssocia te Commissioner 1990 K Street NW Washington, DC 20006 Telephone number: (202) 502-7473 E-mail address: [email protected]
Plans for Educational Assessment
For the 2 1st century, NAEP is undergoing a fbll-scale redesign. A number of significant changes currently underway include the following:
Beginning in 1996, NAEP returned to annual assessments.
Beginning in 2000, NAEP began expanded state assessments to include both grades 4 and 8 in two subjects.
Beginning in 2003, reading and mathematics will be assessed every 2 years, and science and writing every 4 years. States and local school districts receiving Title 1 funds are now required by the No Child Left Behind Act to participate in the biennial reading and mathematics assessments.
In 2004, the long-term trends assessment will be updated while continuing to monitor trends from the past.
New comprehensive assessments will be administered in foreign languages (2005) and economics (2006).
These major changes are documented in a new calendar that identifies subjects to be tested from 2000 to 20 12, available from the National Assessment Governing Board (http://www.nagb.org).
These and other possible changes are being monitored constantly by outside panels of experts and citizens through such institutions as the National Academy of Sciences. Through this process, NAEP will endeavor to remain the nation's foremost instrument in measuring the academic skills of the nation's elementary and secondary school students.
In addition to NAEP, NCES will conclude data collection for NAAL in 2004 and conduct another HSTS in 2005.

Table 4. Data Collection Calendar for Educational Assessment
Year of Data Collection
surveys 1988 1990 1992 1994 1996 1997 1998 1999 2000 2001 2002 2003 2004 2005 2006 2007
NAEP National Assessment
Reading X X X
Mathematics X X X
Science X X
Writing X X
U.S. history X
World X geography
Civics X
Economics
The arts
Foreign language
NAEP State Assessment
X X X X X
X X X X X
X X
X X
Mathematics
Reading
Science
Writing
NAEP District Assessment
Mathematics
Reading
Science
Writing

Table 4. Data Collection Calendar for Educational Assessment-Continued
Surveys
Reading
Mathematics
Science
High School Transcript Studies
National Adult Literacy Survey1 National Assessment of Adult Literacy
Year of Data Collection
1988 1990 1992 1994 1996 1997 1998 1999 2000 2001 2002 2003 2004 2005 2006 2007
NAEP Long-Term Trend Assessment
X X X X X
X X X X
X X X X
The longitudinal studies program at the National Center for Education Statistics (NCES) was established to provide ongoing, descriptive information about what is occurring at the various levels of education and the major transition phases of students' lives. In this way, intervening processes can be studied. The program is comprised of three study areas: early childhood/elementary, secondary, and postsecondary education. Together, these studies capture critical information across the lifespan of individuals' development and education.
The early childhood longitudinal studies examine children's early home, child-care, and education experiences prior to formal schooling-that is, birth through age five-as well as during the early elementary years. These studies describe the influence of early experiences on children's success in school. The secondary and postsecondary longitudinal studies look at transitions and education experiences and their influence on educational and occupational attainment. These surveys provide for periodic examination of such attainment, as well as students' aspirations, attitudes, and motivations during the pivotal years before, during, and after middle school or junior high school, high school, and college.
With extensive questioning over succeeding years, the longitudinal studies make it possible to make long-range comparisons between early learning environments and children's preparation for school, between early school experiences and later school success, and between what individuals expect and what actually occurs. Consequently, such studies are critical to understanding the processes by which early experiences influence education and, in turn, the processes by which education leads individuals to develop their abilities and roles in society.
The National Longitudinal Study of the High School Class of 1972 (NLS:72) began with that year's high school senior class and followed them through 1986. The High School and Beyond (HS&B) Longitudinal Study began with both the sophomore and senior classes of 1980. Four other longitudinal studies have also been conducted: the National Education Longitudinal Study of 1988 (NELS:88), which began with the 8th-grade class of 1988 and followed them through 2000; the Beginning Postsecondary Students (BPS) Longitudinal Studies of 1990 and 1996, the most recent of which started with postsecondary students who began their postsecondary education in 1995-96 and w&e followed in 1998 and 2001, and the earlier cohort that began in 1989-90 with follow-ups in 1992 and 1994; the Baccalaureate and Beyond (B&B) Longitudinal Study that began with college seniors in 1992-93 who were followed in 1997 and will again be contacted in 2003, with a second cohort that graduated From college in 1999-2000 with a one-time follow-up in 2001; and the Early Childhood Longitudinal Study-Kindergarten Class of 1998-99 (ECLS-K), which began following a cohort of kindergarten children in 1998-99 and completed five waves of data collection through 2002. A new longitudinal study, the Early Childhood Longitudinal Study-Birth Cohort (ECLS-B), began with a group of children born in 2001 and will follow these children into formal school.

Data Uses
The NLS:72 data have been widely used for investigating educational policy issues. For example, in the early 1980s, a congressional committee turned to these data to develop a model for estimating the costs of tuition tax credits. Capsule descriptions of this cohort have been produced and attrition rates from college have been studied, as have transitions from high school and college into the workplace. Postsecondary attainment, access, and financial aid studies have all used NLS:72.
The enlarged scope of HS&B provided even more data than NLS:72 for examining a wide variety of education policy issues. Like NLS:72, HS&B yielded a number of capsule descriptions of high school students. Additionally, HS&B data have been used to study the achievement of Hispanic students; discipline and order in high schools; economic issues, such as students working while in school; comparisons of public and private schools; the continuity of early employment of high school sophomores; and course-taking patterns of American high school students. Because similar items were used in HS&B, NELS:88, and NLS:72, it is possible to compare the high school seniors of 1980, 1982, and 1992, with those of 1972.
NELS:88 completed the fourth follow-up data collection in 2000. Data from this survey are being used to study transition patterns of eighth-grade students as they move through school (e.g., moving from public to private school, dropping out of school, and moving into and out of high school and college). Other research issues that can be addressed include:
students' academic growth over time and the family, community, and classroom factors that promote or inhibit such growth;
the tracking of course-taking patterns during high school;
the educational outcomes and generational status among Asian and Hispanic eighth- graders;
at-risk students' successful navigation of the pipeline to college enrollment and the process of dropping out of school;
the role of the school in helping the disadvantaged;
the school experiences and academic performance of language-minority students;
the process of attracting students to the study of mathematics and science;
the transition to postsecondary education and the workforce;
students' employment and postsecondary persistence histories;
family formation, including marital status and children; and
trend analyses with previous longitudinal studies.
The ECLS-K and ECLS-B focus on the early childhood years and the influence of the home, classroom, school, and childcare on children's development. To date, the ECLS-K has completed a baseline and four follow-up data collections. The ECLS-B started collecting data on its sample of children as they turned 9 months old. ECLS-K data have been used to produce descriptions of kindergartners as they enter school for the first time and describe their achievement gains in

kindergarten and first grade. Data from this study are being used to examine the differences in children (e.g., their backgrounds, skills, and knowledge) at school entry and to describe teacher, classroom, and school characteristics. The research issues being addressed by these two studies fall into the following four broad areas:
children's growth and development in critical cognitive and noncognitive domains;
children's transitions to child-care and education programs, kindergarten, and beyond;
school readiness; and
the relationship between early experiences and later school performance.
BPS studies have provided new information on traditional as well as nontraditional entrants to postsecondary education. These data have included such topics as high school preparation and persistence, differences in receipt and use of financial aid, patterns of transfer and completion, family difficulties and formation, education debt, and posteducation employment. The complementary B&B study has provided information on bachelor's degree graduates. These data have included such topics as entry into and progress through graduate school, employment after completion, family formation, methods of financing graduate education, both undergraduate and graduate debt, and the resulting education debt burden. In addition, B&B has a special component concerning those entering the elementary/secondary teacher pipeline, and has begun tracking entry into and exit from the pipeline as well as career paths among teachers.
Early Childhood Longitudinal Studies NCES and several federal health, education, and human services agencies are sponsoring an
ambitious program to provide comprehensive and reliable data sets that can be used to inform policy regarding children, their families, early care, and education. The data collected by the ECLS program, and the information that is disseminated through reports prepared by NCES and others, will inform decisionmakers, educational practitioners, researchers, and parents about the experience of young children.
The ECLS program consists of two cohort studies-a birth cohort study and a kindergarten cohort study. Together, these studies provide the range and breadth of data required to more fully describe children's early learning and education experiences. The birth cohort study (ECLS-B) is designed to study children's early learning and development from birth through first grade. It focuses on those characteristics of children, their families, and out-of-home experiences that influence children's first experiences with the demands of formal school (e.g., kindergarten and first grade), and provides important information about the way America raises, nurtures, cares for, and prepares its children for school. The kindergarten cohort (ECLS-K) measures aspects of children's development and their home, classroom, and school environments as they enter school for the first time, and examines how factors from these environments influence their academic achievement, social development, and school experiences through fifih grade.
Early Childhood Longitudinal Study-Birth Cohort Parents, educators, health practitioners, and policymakers are seeking effective ways for caring
for and educating children throughout early childhood. Researchers and practitioners searching for answers are turning to the critical years before formal schooling as a source of information and a place to start. Several factors have contributed to this research and policy focus on children's early care and education experiences before entering school, including:
new research, such as that on early brain development, highlighting the significant growth and development occumng in the first 3 years;
public awareness of the importance of children's early experiences for later school success;
large numbers of working mothers and dual-employed families, resulting in children entering childcare at earlier ages; and
the increasingly diverse population of children entering school.
Vital to any effort to improve the health, early care, and education for all of the nation's children is a research and data collection program that increases primary understanding of the dynamics that lead to differential school success. NCES, in collaboration with several health, education, and human services agencies, has embarked upon an ambitious new study on the early years before formal schooling. The Early Childhood Longitudinal Study-Birth Cohort (ECLS-B) follows a national sample of children, born in the year 200 1, From birth through first grade.
The four key areas addressed by the ECLS-B are children's health status at birth and various points thereafter; children's growth and development in critical cognitive and noncognitive domains; children's transitions to child- care and early childhood education programs, kindergarten, and beyond; and children's preparation for school.
First, the relationship of children's early health to their later growth and development is of special interest to the ECLS-B. The study provides information on prenatal care and children's health status at birth and across the early childhood years, covering basic topics such as health insurance, nutrition, doctor visits, hospitalizations, and chronic health conditions (e.g., asthma, ear infections). Over time, the study will be able to analyze the potential connections between young children's health and their growth and development.
Second, the ECLS-B follows children's growth and development during the critical years before school. In these early years, children are quickly achieving developmental milestones that build upon one another. The ECLS-B seeks to accurately describe children's physical, social, emotional, cognitive, and language development in relation to important influences in their lives prior to school entry. It then follows their progress during the first 2 years of school-kindergarten and first grade.
Third, children and adults are continually making transitions from one status to another-for example, from home to childcare and to school. Most notably is the transition that occurs as young children go from being cared for exclusively by their parents to being cared for by other persons. For some children, this transition may occur shortly after birth; for others, their first significant experience with adults other than their parents in a regular care and educational setting may be when they enter school for the first time. The ECLS-B is especially focused on looking at these transitions and their impact on different groups of children and families defined by racelethnicity,

socioeconomic status, birthweight, language minority status, plurality (i.e., twins), and family structure (i.e., single-parent families and teenage mothers).
Fourth, most children attend kindergarten before entering first grade. However, the nature of children's early experiences in and before kindergarten is quite variable, and the demands placed on children differ across programs. The ECLS-B examines children's preparation for school by prospectively studying the different characteristics of children, their families, and their out-of-home care and educational experiences leading up to and at school entry.
Design The design of the ECLS-B is based on the assumption that children's preparation for school
begins at (or before) birth and continues upon school entry. It is guided by a framework of children's development, care, and schooling that emphasizes the interaction among the child; the family; health care, child-care and education programs; and the community. The ECLS-B recognizes the importance and interrelatedness of factors that represent a child's health status and socioemotional and intellectual development.
A nationally representative sample of approximately 13,500 children born during calendar year 2001 was selected for participation in the study. The sample consists of children from different raciaVethnic and socioeconomic backgrounds. Asian and Pacific Islander, Chinese, and American Indian children; moderately low birthweight (1,500-2,500 grams) and very low birthweight (under 1,500 grams) children; and twins were oversampled.
Children were selected at birth from birth certificates, the best and most affordable way of sampling newborns. The first data collection occurred when the children were approximately 9 months of age. Capturing data this soon after birth is important because much of the data collected at this time pertains to prenatal care and the health care of the mother and child during the first months of life. Data will be collected again when the children reach 2 and 4 years of age. Data will also be collected when the children enter kindergarten and first grade.
Components The emphasis that is being placed on the different aspects of children's development and the
different environments in which learning occurs is critically important for the design of the ECLS-B. While children's parents are the primary reporters throughout the life of the study, at varying points it is necessary to gather data from children's birth records, their care and early education providers, their schools and teachers, and from the children themselves.
Children's Birth Certificates-A variety of useful data is captured in birth certificates. They provide information on the date of birth and children's gender. Information is also available on parents' education, parents' race and ethnicity (including Hispanic origin), and mother's marital status. Birth certificates provide information on the mother's pregnancy history, prenatal care, medical and other risk factors during this pregnancy, and complications during labor and birth. Health characteristics of children, such as congenital anomalies and abnormal conditions of the baby and the baby's APGAR score, are also provided.

Parent-Guardian Interviews-Parents and guardians are an important source of information about themselves, their children, and the home environment. A parent-guardian interview is conducted in the child's home at each data collection point using computer-assisted personal interviewing (CAPI) and a self-administered questionnaire. Parent-guardian interviews capture information about children's early health and development and their experiences with family members and others. Parents report on children's development in such areas as children's temperament and developmental milestones (e.g., crawling). Parent-guardian interviews also capture detailed information on children's health (e.g., developmental difficulties, illness, ear infections) and access to health care (e.g., health insurance). Parents-guardians provide key information about themselves as caregivers, the home environment, and the neighborhood in which they live. Several aspects of the economic stability of the home environment are tracked (e.g., welfare receipt, household food sufficiency, employment situation). The parent-guardian interviewed is the individual who is the primary caregiver and the most knowledgeable about the care and education of the child. In most cases, this is the child's mother or female guardian.
Father Questionnaires-The ECLS-B collects information from fathers as well. Fathers complete a self-administered questionnaire regarding the particular role they play in the development of their children. The father questionnaire captures information about children's well-being and activities fathers engage in with their children. Fathers also provide key information about themselves as caregivers. Both resident fathers and nonresident biological fathers complete self-administered questionnaires designed to collect information about their roles in their children's lives.
Direct Child Assessments-Children's participation in the study occurs with the full permission of their parents-guardians. Beginning at 9 months, children participate in activities designed to directly measure important developmental skills in the cognitive, social, emotional, and physical domains. The ECLS-B uses the Bayley Short Form-Research Edition. This instrument, designed specifically for the ECLS-B, is based on a smaller set of items from the Bayley Scales for Infant Development (BSID-11). It assesses children's gross and fine motor skills as well as their receptive and expressive language skills and emotion regulation. The Nursing Child Assessment Teaching Scale (NCATS) from the Nursing Child Assessment Satellite Training (NCAST) assesses the parent-child interaction for early precursors of cognitive and social skills. These interactions are videotaped and coded along several dimensions (e.g., mother responsiveness, cognitive growth fostering), providing rich information on early parent-child interactions. At the 9-month home visit and again at age 2, height, weight, and middle upper arm circumference are measured for all children. In addition, head circumference is measured for very low birthweight infants.
Early Care and Education Providers-With the permission of the child's parents, individuals and organizations that provide regular care andlor education for a child are interviewed. Care providers and preschool teachers, like parents, represent a significant source of information on themselves (their backgrounds, teaching practices, and experiences), the children in their care, and the children's learning environments. Much of the data needed to describe the structure of children's care arrangements and education programs, develop indicators of the quality of these arrangements and programs, and profile the background and experience of the persons caring for these children can only be reported accurately by the providers, teachers, and organizations themselves. Contacting children's care and education providers also opens up other data collection opportunities (e.g., collecting information about children's development from sources other than their parents). Children's child-care providers are interviewed using computer-assisted telephone interviewing

(CATI). This information is collected when the children are 24 months of age and again at 48 months. Observations of children s child-care settings are conducted in a sample of the arrangements attended by ECLS-B children.
Teacher Questionnaires-As the ECLS-B cohort enters kindergarten and first grade, their school .
teachers become valuable sources of information on one of children's most immediate learning environments-the classroom. Teachers also represent important sources of information about themselves (e.g., their backgrounds, teaching practices, and experiences) and children's development, both cognitive and social. The plan is to use a subset of the ECLS-K teacher questionnaires (see http://nces.ed.gov/ecls).
School Questionnaires--Once the children enter formal schooling, school administrators provide information on the physical, fiscal, and organizational characteristics of their schools and on the schools' learning environments, educational philosophies, and programs. Again, the plan is to use a subset of the ECLS-K school questionnaires (see http://nces.ed.gov/ecls).
Information about the ECLS-B can be found on the web (http://nces.ed.gov/ecls). For further information on the ECLS-By contact:
Jerry West Early Childhood, International, and Crosscutting Studies Division Early Childhood and Household Studies Program National Center for Education Statistics 1990 K Street NW Washington, DC 20006 Telephone number: (202) 502-7335 E-mail address: jerry. [email protected]
Early Childhood Longitudinal Study-Kindergarten Class of 1998-99
In recent years, parents, educators, and policymakers have been reconsidering the ways young children are taught in schools and have been looking for more effective approaches to education. Several factors that have contributed to this research and policy focus on children's early school experiences include:
an increased public awareness of the importance of children's early experiences;
the changing nature of children's preschool and early school experiences;
the increasingly diverse population of children entering school and the demands this places on schools; and
the expanded role that schools are expected to play in supporting and nurturing development and learning.
NCES has embarked on an ambitious study to provide a comprehensive and reliable data set that can be used to inform policies related to early and middle childhood education, defined as kindergarten through fifth grade. The Early Childhood Longitudinal Study-Kindergarten Class of
1998-99 (ECLS-K), in which a cohort of kindergarten children is sampled and studied intensively over time, responds directly to the concerns decisionmakers, educational practitioners, researchers, and parents have about our nation's schools and American education.
The three key issues to be addressed by the ECLS-K are children's transition to school, student performance in the early grades in literacy and numeracy, and the interaction of school, family, and community. First, the ECLS-K examines children's transition to school. Of particular interest to the study are the transitions that occur as young children go fiom being kindergartners to being first graders and as they move fiom first grade to the later elementary grades. These transitions are an ongoing process mutually influenced by a child's characteristics, the family and school environments, and the demands, resources, and responses within both family and school settings. Therefore, these transitions may be quite different for children depending upon the characteristics of the setting and their experience in each one.
Second, a major goal of the ECLS-K is to describe student learning and academic progress during the early school years. It begins by focusing on children's characteristics and experiences as they enter school, and seeks to describe ways in which these are related to different aspects of children, their families, and the kindergarten programs they attend. Then by closely chronicling the relationship between children's kindergarten experience and their school performance in grades 1 through 5, the study provides useful information on achievement differences between boys and girls, among minority groups, and among members of different socioeconomic groups as children pass through school. The study also provides usefbl data on when children begin to experience problems with their schoolwork and the circumstances surrounding these difficulties. It provides data on the longevity of these problems and on the responses of the children's families, schools, and teachers.
Third, numerous factors influence children's school and other life outcomes, including the school, family, and community. The ECLS-K examines how the educational system prepares for and responds to children. It gathers information on how schools and teachers respond to the diverse backgrounds and experiences that children bring with them as they enter school for the first time. The ECLS-K also looks outward to the family and community in which children live by focusing on the resources of the family, the home environment, and the community that have a profound impact on children's success in school and provide the context within which schools must operate. The ECLS- K provides critical information on the roles that parents and families play in preparing for and supporting their children's education, and how families, schools, and communities interact to support children's education.
Design The design of the ECLS-K is guided by a framework of children's development and schooling
that emphasizes the interaction between the child and family, the child and school, the family and school, and the family, school, and community. Thus, the ECLS-K recognizes the importance of factors that represent the child's health status and socioemotional and intellectual development, and incorporates factors from the child's family, community, and school and classroom environments. The study is particularly focused on the role that parents and families play in helping children adjust to formal school and in supporting their education through the primary and middle elementary grades. It also gathers information for understanding how schools prepare for and respond to the diverse backgrounds and experiences of the children and families they serve.
A nationally representative sample of approximately 22,000 children enrolled in about 1,000 kindergarten programs during the 1998-99 school year was selected for participation in the ECLS-K. These children were selected from full-day and part-day programs in public and private schools. The sample consisted of children from different raciallethnic and socioeconomic backgrounds. NCES oversampled private kindergartens and kindergartners, as well as Asian and Pacific Islander children. The ECLS-K sample will support separate analyses of public and private kindergartens, as well as White, Black, Hispanic, and Asian and Pacific Islander children's school experiences and outcomes.
To date, NCES has collected data on the sampled children and their environments in the fall and spring of the kindergarten year, the spring of first grade, and the spring of third grade. It also conducted child assessments and parent interviews in the fall of first grade for 30 percent of the sample. Current plans call for a spring fifth-grade data collection.
Components Because numerous factors in schools, homes, and communities influence children's academic
and social outcomes, data for the ECLS-K are collected not only from children, but also from their parents-guardians, teachers, and school administrators.
Student Assessments-Sampled children participate in various activities that measure the extent to which they exhibit those abilities and skills deemed important for success in school. They are asked to participate in activities designed to measure important cognitive (e.g., general knowledge, literacy, and quantitative skills) and noncognitive (e.g., physical) outcomes. Measures of a child's cognitive skills are obtained through an untimed one-on-one assessment of the child. Measures of physical development include both height and weight measurements. Also, in the fall of kindergarten, a psychomotor assessment is administered to measure children's motor abilities, coordination, and visual motor skills. In the years when most of the children are in the third and fifth grades, they are asked to report on their perceptions of and interests in school and school subjects such as reading and mathematics. In the fifth grade, children are asked to report on the types of food and beverages they can purchase at school and that they consume at home.
Parent-Guardian Interviews-Parents and guardians are an important source of information about the families of the children selected for the study and about themselves. In telephone interviews (or in personal interviews for households without telephones), they provide key information about children's development and their experiences with family members, schools, and others. The parent- guardian interviews of the ECLS-K cover family background, demographics, and home environment. The content includes family structure; nativity (i.e., country of origin); primary language spoken; parental involvement with the child's school; childcare; child's health and well-being; parental values, beliefs, and expectations; home environment, activities, and cognitive stimulation; parental monitoring; neighborhood; parent education; parent employment; parent income and assets; receipt of welfare and other public transfers; discipline, warmth, and emotional supportiveness; parents' psychological well-being and health; and critical family processes. In the kindergarten and first-grade data collections, parent-guardian interviews also include items asking parents-guardians to rate their child's social skills, problem behaviors, and approaches toward learning.
Teacher Questionnaires-Like parents, teachers represent a valuable source of information on themselves and the children's learning environment (i.e., the classroom). In self-administered questionnaires, teachers are asked to provide information about their own backgrounds, teaching

practices, and experiences, along with information on the classroom setting for the sampled children they teach. The content covered in the teacher questionnaires of the ECLS-K includes class type and composition, class organization, class activities, curricular focus and evaluation methods, parent involvement, views on readiness, professional development, and the teacher's professional background.
Teacher Ratings-Teachers are also asked to evaluate sampled children on a number of critical cognitive and behavioral dimensions. Teacher cognitive ratings measure teachers' perceptions of students' academic achievement and dispositions for learning in three domains-language/literacy, mathematics, and general knowledge (i.e., science and social studies). Ratings of children's socioemotional behaviors provide measures of children's prosocial and problem behaviors and their approaches toward learning. Teachers also complete checklists on the sampled children, reporting on such things as the children's language skills, special needs, program placements, attendance, and physical activity levels.
Special Education Teacher Questionnaires-Special education teachers represent a valuable source of information on themselves and on the children's experience with special education services. In a self-administered questionnaire, they are asked to provide information about their background and experience and the instructional approaches used for the sampled children who receive these services. They also provide information on sampled children's disabilities, Individualized Education Programs (IEPs), and receipt of related services.
School Questionnaires-In a self-administered questionnaire, school administrators, principals, and headmasters provide information on the physical and organizational characteristics of their schools, and on the schools' learning environments and programs. Special attention is paid to the instructional philosophy of the school and its expectations for students. The content covered in the school questionnaires of the ECLS-K includes school characteristics, student characteristics, teaching staff characteristics, school policies and programs, principal characteristics, and school governance and climate. Additionally, field staff conduct an independent survey of the schools' physical facilities, atmosphere (e.g., fighting in hallways), and learning environments (e.g., student work displayed).
Salary and Benefits Questionnaire-In order to trace resources directly available to children, school district business offices or headmasters complete a self-administered questionnaire capturing information on salary, merit pay (e.g., education stipends), and benefits (e.g., payroll taxes, medical insurance) for sampled children's teachers and school administrators. It represents one of the first times that specific teacher salary data can be linked to outcomes of specific children. This information is collected during the kindergarten year.
Student Records Abstract Form-For each sampled ECLS-K child, information is gathered from hidher school records. This form, completed by the school with information from its records, provides data on the child's attendance, the child's home language, whether the child has an IEP on record, and whether the child attended Head Start.
Verification of Head Start Program Participation-Head Start participation data have proven to be somewhat unreliable, as reported by either parents or schools. The ECLS-K contacts each Head Start site that a sampled child is reported to have attended. This report of participation comes from either the parent-guardian interview or the student record. The Head Start site completes a self- administered form for each child that verifies attendance and asks about attendance dates and program type (e.g., part- vs. full-day, center- vs. home-based).
Major Publications
Schools ' Use of Assessments for Kindergarten Entrance and Placement: 1998-99 (March 2003)
Young Children 's Access to Computers in the Home and at School in 1999 and 2000 (March 2003)
Children 's Reading and Mathematics Achievement in Kindergarten and First Grade (March 2002)
Entering Kindergarten: Findings from the Condition of Education (January 200 1)
The Kindergarten Year (December 2000)
America 's Kindergartners (February 2000)
Information on the ECLS-K can be found on the web (http://nces.ed.gov/ecls). For hrther information, contact:
Elvira Germino-Hausken Early Childhood, International, and Crosscutting Studies Division Early Childhood and Household Studies Program National Center for Education Statistics 1990 K Street NW Washington, DC 20006 Telephone number: (202) 502-7352 E-mail address: [email protected]
Secondary Longitudinal Studies
National Longitudinal Study of the High School Class of 1972
Young people's success in making the transition from high school or college to the workforce varies enormously for reasons only partially understood. Some cling to dependency; others move into self-determination smoothly. The National Longitudinal Study of the High School Class of 1972 (NLS:72) base-year study and its five follow-up surveys provide data to allow researchers to study how these transitions evolve.
NLS:72 can provide information about quality, equity, and diversity of educational opportunity, and the effect of those factors on cognitive growth, individual development, and educational outcomes. It can also provide information about changes in educational and career outcomes and other transitions over time. The NLS:72 data cover the sampled cohort from 1972 to 1986.
Design NLS:72 was designed to produce representative data at the national level on the cohort of
students who were in the 12th grade in 1972. The sample for the base year of NLS:72 was a I stratified, two-stage probability sample of 12th-grade students from all schools (public and private)
in the 50 states and the District of Columbia during the 1971-72 school year. A sample of schools was selected in the first stage. In the second stage, a random sample of 18 high school seniors was selected within each participating school.

Data were collected by mail, telephone, and personal interviews. In addition, the survey obtained high school transcript data on high school cumculum, credit hours in major courses, grade point average, standardized test scores, and related information for each senior. To conduct intensive studies of disadvantaged students, NCES oversampled schools in low-income areas and schools with significant minority enrollments.
The size of the student sample was increased during the first follow-up survey because base-year nonrespondents were recontacted at that time. Those who provided base-year information during the first follow-up were retained and included in later follow-up efforts. Consequently, in 1972 there were 16,683 respondents, but in the first follow-up in 1973, the number increased to 21,350. The numbers of respondents in subsequent follow-ups in 1974, 1976, 1979, and 1986 were 20,872, 20,092, 18,630, and l2,84 1, respectively (only a subsample of 14,489 of the original sample was contacted in 1986).
In addition to the follow-ups, a number of supplemental data collection efforts were undertaken. For example, a Postsecondary Education Transcript Study was undertaken in 1984, and the fifth follow-up survey in 1986 included a supplement for those who became teachers.
Components Base Year Survey-Age, sex, racial/ethnic background, physical handicap, socioeconomic status of family and community, school characteristics, future education and work plans, test scores, school experience, school performance, work status, and work performance and satisfaction.
Follow-up Surveys (1973,1974,1976, 1979, and 1986)-Marital status, community characteristics, education and work plans, educational attainment, work history, attitudes and opinions, postsecondary school characteristics, grade point average, credits earned, and financial assistance for postsecondary education.
Major Publications
Trends Among High School Seniors, 1972-1992 (July 1995)
Statistics in Briefi High School Seniors Look to the Future, 1972 and 1992 (December 1993)
Careers in Teaching: Following Members of the High School Class of 1972-In and Out of Teaching (July 199 1)
Trends in Postsecondary Credit Production: 1972 and 1980 High School Graduates (June 1990)
Patterns and Consequences of Delay in Postsecondary Education (February 1990)
Data File
CD-ROM: National Longitudinal Study of the High School Class of 1972 (April 1994)
NLS:72 can be found on the web ( http://nces.ed.gov/surveys/nls72). For further information on NLS:72, contact:
Aurora D'Amico Postsecondary Studies Division

Postsecondary Co-Operative System, Analysis, and Dissemination Program National Center for Education Statistics 1990 K Street NW Washington, DC 20006 Telephone number: (202) 502-7334 E-mail address: aur0ra.d '[email protected]
High School and Beyond
New education issues arose after NCES began its longitudinal study of the 1972 senior class. For example, declining test scores and minimum competency testing caused concern among parents and educators alike. The rate at which many students dropped out of high school before graduation was also a concern. Anxiety over access to postsecondary and vocational education sharpened the focus on the educational experiences of Hispanic and other minority youths.
To examine these and other issues, NCES initiated a second longitudinal study, High School and Beyond (HS&B), to complement the first. HS&B studied the high school students of 1980, attempting to collect the same types of data gathered in NLS:72. However, the second study differed from the first in two significant ways. First, it addressed many newer issues of the educational process. Second, it included a sophomore cohort as well as a senior cohort. Adding the sophomore cohort made it possible to study high school dropouts and analyze changes and processes during high school.
The base-year survey of HS&B and the follow-up surveys have addressed the issues of educational attainment, employment, family formation, personal values, and community activities since 1980. For example, a major study on high school dropouts used HS&B data to demonstrate that a large number of dropouts return to school and earn a high school diploma or an equivalency certificate. Other examples of issues and questions that can be addressed with HS&B data are:
How, when, and why do students enroll in postsecondary education institutions?
Did those who (while in high school) expected to complete the baccalaureate (BA) degree actually do so?
How has the percentage of recent graduates from a given cohort who enter the workforce in their field changed over the past years?
What are the medium-term effects of not completing high school in the traditional way?
How do employment and earnings event histories of traditional high school graduates differ from those who did not finish high school in the traditional manner?
Do individuals who attend college earn more than those who do not attend college?
What is the effect of student financial aid?
What percentage of college graduates are eligible or qualified to enter a public service profession such as teaching?
How many enter the workforce full time in the area for which they are qualified?
In what ways do public and private schools differ?

Design The survey design provided for a highly stratified national probability sample of over 1,100
secondary schools as the first-stage units of selection. To make the study more useful for policy analyses, certain types of schools were oversampled: public schools with a high percentage of Hispanic students, Catholic schools with a high percentage of minority students, alternative public schools, and private schools with high-achieving students. The initial national sample for HS&B was considerably larger than that drawn in NLS:72. In this survey, 36 seniors and 36 sophomores were selected in each school. Parents of these students were also sampled. In schools with fewer than 36 students in either of these groups, all eligible students were selected. The base year of this survey, which was conducted early in 1980, collected data from over 28,000 sophomores and 30,000 seniors.
The longitudinal design of the study called for follow-up surveys of substantial subsets of the two cohorts at 2-year intervals. Data collection for the first follow-up was in spring 1982. Subsequent follow-ups were also undertaken in 1984 and 1986, and another follow-up of the sophomores was conducted in 1992. The first follow-up survey, conducted in 1982, sampled almost 40,000 students (12,000 seniors and 27,000 sophomores); the second, in 1984, sampled approximately 27,000 students (12,000 seniors and 15,000 sophomores); and the third, in 1986, sampled almost 27,000 students (also 12,000 seniors and 15,000 sophomores). The 1992 follow-up collected data from almost 15,000 sophomores. In 1993, a Postsecondary Education Transcript Study was conducted for the sophomore cohort.
Data collection instruments in the base-year survey included:
sophomore and senior student questionnaires with a series of cognitive tests;
school questionnaires filled out by an official in each participating school;
teacher comment checklists filled out by a teacher of the sampled student;
second-language questionnaires; and
parent questionnaires filled out by a sample of parents from both cohorts.
The student questionnaires focused on individual and family background, high school experiences, work experiences, and future plans. Cognitive tests administered to students measured both verbal and quantitative abilities. Sophomore tests included brief achievement measures in science, writing, and civics, while seniors were asked to respond to tests measuring abstract and nonverbal abilities. The parent questionnaire elicited information about family attitudes, financial planning, and educational goals. The school questionnaire gathered information about enrollment, staff, educational programs, facilities and services, dropout rates, and special programs for handicapped and disadvantaged students. The teacher comment checklist provided teacher observations on students participating in the survey.
The first follow-up of sophomores provided insights into the school dropout problem and the influence of the last 2 years of high school on student attitudes and aspirations. The second follow-up in 1984 included a Postsecondary Education Transcript Study of the senior cohort. The later follow- ups of the sophomore cohort made it possible to trace the consequences of dropping out and the extent to which dropouts later return and complete high school. In brief, HS&B provides information on the educational, career, and personal development of young people as they move from high school into postsecondary education or the workforce and then into adult life. The initial study (NLS:72)

laid the groundwork for comparison with HS&B. It recorded the economic and social conditions surrounding high school seniors in that year and, within that context, their hopes and plans. It has since measured the outcomes, while also observing the intervening processes. HS&B allows researchers to monitor changes by retaining the same goals, measuring the economic returns of postsecondary education for minorities, and delineating the need for financial aid. By comparing the results of the two studies, researchers can determine how plans and outcomes differ in response to changing conditions or remain the same despite such changes.
Additional concerns of HS&B encompass issues that surfaced since NLS:72 began: How did the availability (or lack thereof) of student financial aid alter student plans for further education? Did middle-income families alter their attitudes toward postsecondary education? These questions, as well as concerns about declining test scores, youth employment, and bilingual education, are addressed, along with a host of others.
Components Student Questionnaire-Age, sex, raciallethnic background, religion, socioeconomic status of family and community, school experiences, test scores, school performance, future educational plans, family status and orientations, work experience and satisfaction, future occupational goals, plans for and ability to finance postsecondary education, and cognitive tests.
School Questionnaire-Enrollment, staff, educational programs, facilities and services, dropout rates, and special programs for handicapped and disadvantaged students.
Teacher Comment Checklist-Teacher observations about the student.
Parent Questionnaire-Family attitudes, family income, employment, occupation, salary, financial planning, and postsecondary education goals.
Follow-up Surveys (1982,1984,1986, and 1992)-Sophomores: similar student information as collected in the base-year survey, school information in the first follow-up, high school and postsecondary transcripts, and data on dropping out. Seniors (not surveyed in 1992 follow-up): marital status, community characteristics, work plans, educational attainment, work history, attitudes and opinions, postsecondary school and program characteristics, postsecondary transcripts and credits earned, and type of financial aid for postsecondary education.
Major Publications
Gender Dlfferences in Earnings Among Young Adults Entering the Labor Market (March 1998)
Continuity of Early Employment Among 1980 High School Sophomores (September 1997)
Urban Schools: The Challenge of Location and Poverty (August 1996)
Trends Among High School Seniors, 1972-1 992 (July 1995)
Understanding Racial/Ethnic Dlfferences in Secondary School Science and Mathematics Education (March 1995)
High School and Beyond: Educational Attainment of 1980 High School Sophomores by 1992 (March 1995)
America 's High School Sophomores: A Ten-Year Comparison, 1980-1 990 (June 1993)
1 2 1 11 1

Data Files
CD-ROM: High School & Beyond: 1992 (Restricted) Data File (June 1995)
CD-ROM: High School and Beyond Fourth Follow-up (Sophomore Cohort) HS&B: 1992 DAS (March 1995)
HS&B can be found on the web (http://nces.ed.gov/surveys/hsb). For more information on HS&B, contact:
Aurora D'Amico Postsecondary Studies Division Postsecondary Co-Operative System, Analysis, and Dissemination Program National Center for Education Statistics 1990 K Street NW Washington, DC 20006 Telephone number: (202) 502-7334 E-mail address: aurora.d '[email protected]
National Education Longitudinal Study of 1988
NELS:88 was the third major longitudinal study sponsored by NCES. The two studies that preceded NELS:88 (NLS:72 and HS&B) surveyed high school seniors (and sophomores in HS&B) through high school, postsecondary education, and work and family formation experiences. Taken together, the longitudinal studies provide not only measures of educational attainment, but also rich resources in determining the reasons for and consequences of academic success and failure. NELS:88 sought to expand on this base of knowledge by following young adolescents from an earlier age (eighth grade) and updating information throughout the 1990s.
The longitudinal design of this study permits the examination of change in young people's lives and the role of schools in promoting growth and positive life outcomes. For example, NELS:88 data can be used to investigate the following:
The students ' academic growth over time-Family, community, school, and classroom factors that promote such growth can be studied. The goal is to identify school and classroom characteristics and practices that promote student learning. The effects of the changing composition of the family, which is evidenced by increasing numbers of working mothers and families headed by single parents, can also be studied.
The process of dropping out of school, as it occurs from eighth grade on-NELS:88 provides the unprecedented opportunity to study young dropouts on a national scale, to examine the contextual factors associated with dropping out (especially those related to school), and to profile the movement of students in and out of school, including alternative high school programs.
The role of the school in helping the disadvantaged-Given the factors of increasing teenage pregnancy rates, increasing poverty among children, and the growing proportion of language- minority students, there is a need for research on the school experiences of the disadvantaged

and the approaches that hold the greatest potential for assisting them. By design, the NELS:88 sample contains an ample number of disadvantaged students to study this issue.
School experiences and academic performance of language-minority students-NELS:88 oversampled Hispanics, Asians, and Pacific Islanders to allow meaningful analyses of these subpopulations. Specifically, the data provide information on variation in achievement levels and bilingual education needs and experiences.
Attracting students to the study of mathematics and science-The data can be used to examine the math and science preparation students receive nationwide and the degree to which their interest in these subjects is captured. Information is also available on whether they were encouraged by their teachers and school to study advanced mathematics and science.
The transition from high school to college (postsecondary access and choice)-NELS:88 included the planning and postsecondary education application behaviors of the high school class of 1992, as well as their subsequent enrollments in postsecondary institutions. The transition from high school and postsecondary education to the world of work and adult roles was also examined. During the fourth follow-up, NELS:88 respondents provided information on their current activities, including work and postsecondary education experiences.
Design The base-year sample of 1988 eighth-graders was designed to be representative at the national
level. Two-stage probability sampling was used to select schools and students. The first stage involved stratified sampling of some 1,000 public and private schools from a universe of approximately 40,000 schools containing eighth-grade students. The second stage included random samples of approximately 24 to 26 students per school. Some 25,000 eighth-graders and their parents, teachers, and school principals were surveyed. When the student sample was selected, one parent and two teachers of each student were also selected. Hispanic, Asian, and Pacific Islander students were oversampled to permit analysis of the performance of language-minority students.
NELS:88 is designed to provide trend data about critical transitions experienced by young people as they develop, attend school, and embark on their careers. It can complement and strengthen state and local efforts by furnishing new information on how school policies, teacher practices, and family involvement affect student educational outcomes (i.e., academic achievement, persistence in school, and participation in postsecondary education). In the base year, four cognitive tests (reading, science, history-government, and math) were administered in addition to the student questionnaire, a parent questionnaire, a teacher questionnaire, and a school administrator questionnaire.
The design for the NELS:88 first follow-up survey included student, school administrator, teacher, and dropout questionnaires. Students took cognitive tests in reading, science, history- government, and math. The tests were designed to reflect 10th-grade coursework, but also had enough overlapping items with the 8th- and 12th-grade tests to permit measurement of academic growth. Selected teachers of each sampled student provided information about the student's study habits and performance, and about instructional practices in the student's classes. The NELS:88 first follow-up was conducted between February and May of 1990.

During the spring of 1992, NCES surveyed this eighth-grade cohort again as part of the second follow-up. This second follow-up survey included student, school administrator, parent, teacher, and dropout questionnaires. Students and dropouts also took cognitive tests in reading, science, social science, and math. High school transcripts were also collected from second follow-up participants.
During the spring of 1994, NCES surveyed this cohort again. The focus of the interviews was employment, education, and family formation experiences. The sampled population was interviewed using CAT1 in order to determine whether they completed high school, and, if so, by what means (e.g., regular completion, GED, or some other method). The interview also collected information about other activities since the last interview in 1992 (e.g., working, number ofjobs, periods worked, description of work and education, postsecondary activities, field of study, and periods of time).
Another follow-up was conducted in 2000, by which time many in this cohort had finished their postsecondary education and completed a transition into the labor force. Others had been in the labor force for about 8 years. Postsecondary transcripts were also collected in 2000.
Components
Student Questionnaire-Family background items, interaction with parents regarding in- and out-of- school activities, educational and occupational goals, perceptions about self and school, participation in classes and activities, and self-reported grades. Four cognitive tests: reading, math, science, and history-government.
Parent Questionnaire-Social-demographic characteristics, participation in student course selection, long-range educational planning, in- and out-of-school activities, establishing home discipline and interaction with the school, family educational expenses, and sources of income for children's education.
School Administrator Questionnaire-School characteristics: grade span, school type, enrollment and major program orientation, policies and practices, admission procedures and tuition, grading, testing and minimum course credits, gifted and talented programs, extracurricular activities, and school climate. Student characteristics: average daily attendance, migration, racelethnicity, single- parent households, limited-English-proficiency classes, and special student services, such as remedial classes and job training. Teaching staff characteristics: size, racelethnicity, salary, and degree.
Teacher Questionnaire-Student information: personal characteristics, behavior, academic performance, attitudes, problems, and handicaps. Class information: homework assigned, use of instructional materials, choice of textbook-workbook, curriculum, and topical coverage. Teacher information: sex, racelethnicity, age, experience, certification, degree, foreign language proficiency, in-service education, classroom preparation, parent contact, perception of school climate, and experience teaching gifted and talented children.
Student Questionnaire-School experiences and activities, plans for the future, language use, opinions about self, attitudes, religion, finances, and family composition. Four cognitive tests: reading, math, science, and history-government.
Dropout Questionnaire-Same as Student Questionnaire, except school experiences and activities section includes questions about leaving school, grades at the time, and if the student returned to school.
Teacher Questionnaire-Student information: academic performance, behavior, homework, absenteeism, parental involvement, and language-minority status. Class information: enrollment, composition, homework assigned, class schedule, teaching materials, methods, and objectives. Teacher information: sex, racelethnicity, subjects taught, and degrees held. School climate information: cooperation among staff, shared beliefs, and problems.
School Administrator Questionnaire-School characteristics: grade span, enrollment, control of school, community location, calendar system, programs, facilities and services, and absenteeism. Student characteristics: racelethnicity, single-parent homes, limited English proficiency, free lunch programs, busing, and 10th-grade dropouts. Teaching staff characteristics: meetings, departmentalization, chairpersons, full-time teachers, salaries, racelethnicity, and degrees. School admission policies and practices: grading structure, testing structure, or both; school programs; and school climate.
Student Questionnaire-School experiences and activities, age, social development, opinions about self, attitudes, occupational expectations and aspirations, money and work, language use, early graduate supplement, and school structure.
Parent Questionnaire-Family background, child's school life, parental behavior concerning student course selection, student educational outcomes, long-range educational planning, contact with child's school, family life, friends, activity in the community, child's future plans, postsecondary education aspirations, parent involvement, in- and out-of-school activities, family educational expenses, and sources of income for child's education.
School Administrator Questionnaire-School characteristics: school environment and policies, total enrollment, grade span, school type, school activities, school programs and services, grading and testing structure, and school climate. Student characteristics: average daily attendance, racelethnicity, single-parent households, and limited-English-proficiency classes and special student services, such as remedial classes and job training. Teacher staff characteristics: size, full or part time, salary, and degree.
Teacher Questionnaire-Student information: academic performance, behavior, homework, absenteeism, parent involvement, and language-minority status. Class information: enrollment, composition, homework assigned, class schedule, teaching materials, methods, and objectives. Teacher information: sex, racelethnicity, experience, certification, degree, and in-service education. School climate information: cooperation among staff, shared beliefs, and problems.
Dropout Questionnaire-How time is spent, past educational activities, reasons for dropping out, family reactions, peer group support, and plans and aspirations for returning to school.
High School Transcripts-Information on course taking, grades, and credits earned.

Student CATI I n t e r v i e ~ H i g h school completion and mode of completion, education and work plans, educational attainment, work history, marital status, family formation, personal values, community activities, postsecondary school and program characteristics, and type of financial aid for postsecondary education.
Student CATI InterviewHigh school completion and mode of completion, education and work plans, professional development activities, educational attainment, work history, marital status, family formation, personal values, community activities, postsecondary school and program characteristics, and type of financial aid for postsecondary education.
Postsecondary Transcripts-Information on course taking, grades, credits earned, and degrees awarded.
Major Publications
Coming of Age in the 1990's: The Eighth Grade Class of I988 Twelve Years Later (March 2002)
Subsequent Educational Attainment of High School Dropouts (June 1998)
Confronting the Odds: Students At Risk and the Pipeline to Higher Education (January 1998)
Access to Postsecondary Education for the 1992 High School Graduates (October 1997)
Profiles of Students With Disabilities as Identified in NELS:88 (June 1997)
Science Proficiency and Course Taking in High School: The Relationship of Science Course-Taking Patterns to Increases in Science Proficiency Between 8th and 12th Grades (April 1997)
A Comparison of High School Dropout Rates in 1982 and 1992 (October 1996)
NELS:88/94 Descriptive Summary Report, With an Essay on "Access and Choice in Postsecondary Education " (May 1996)
NELS:88 High School Seniors' Instructional Experiences in Science and Math (March 1996)
Two Years Later: Cognitive Gains and School Transitions of NELS:88 Eighth Graders (September 1995)
A Profile of the American High School Senior in 1992 (July 1995)
NELS:88 Students ' School Transition Patterns Between 8th and 10th Grades (April 1995)
A Profile of the American High School Sophomore in 1990 (March 1995)
School Engagement and Students At Risk (August 1993)
America 's High School Sophomores: A Ten- Year Comparison, 1980-1 990 (June 1993)
Data Files CD-ROM: NELS:88/2000 Public-Use Data Files and Electronic Codebook-Base Year Through
Fourth Follow-up (August 2002)

CD-ROM: NELS:88/94 Public-Use Data Files and Electronic Codebook-Base Year Through Third Follow-up (April 2000)
NELS:88 can be found on the web (http://nces.etl.gov/surveys/nels88). For further information on NELS:88, contact:
Jeff Owings Elementary/Secondary and Libraries Studies Division Secondary Longitudinal and Transcript Studies Program National Center for Education Statistics 1990 K Street NW Washington, DC 20006 Telephone number: (202) 502-7423 E-mail address: [email protected]
The Education Longitudinal Study of 2002 The Education Longitudinal Study of 2002 (ELS:2002) is the fourth in a series of NCES-
sponsored secondary school-based longitudinal studies. All four studies describe the transition of American youth from secondary schooling to subsequent education and work roles. The three studies that preceded ELS:2002 included NLS:72, HS&B:80/82, and NELS:88. ELS:2002 is designed to monitor the transition of a national sample of young people as they progress from 10th grade through high school and onto postsecondary education and/or the work world.
In the first year of data collection (2002 base year), ELS:2002 measured students' tested achievement and obtained information from students about their school and out-of-school experiences. These same students will be surveyed again in a 2004 follow-up. Under current plans, cohort members will be followed through 2014 so that later outcomes, including access to and persistence in higher education or success in the labor market, can be examined in terms of students' earlier aspirations, achievement, and high school experiences.
ELS:2002 gathers information at multiple levels. It obtains information from students and their school records, students' parents, their teachers, and the administrators (principals and library-media center directors) of their schools. Data from teachers will provide direct information not only about the student, but also about the specific mathematics and English classes in which the teachers and student interact. Additionally, teacher reports will provide information about the school as seen from the teacher's perspective. This multilevel focus will supply researchers with a comprehensive picture of the home, community, and school environments and their influences on students.
Using this multilevel and longitudinal information, the base year (2002) and first follow-up (2004) of ELS:2002 will help researchers and policymakers at all governmental levels, and inform decisionmakers, educational practitioners, and parents about the changes in the educational system over time and the effects that these changes may have on students. The policy issues to be studied include school attributes associated with achievement; the influence of parent and community involvement on students' achievement and development; the dynamics and determinants of dropping out of the educational system; the transition of different groups; cognitive outcomes and the influence of different curriculum paths and special programs; and the effectiveness of different high schools, and whether their effectiveness varies with school size, organization, climate, curriculum, academic press, and other characteristics. These data will facilitate understanding of the impact of

various instructional methods and curriculum content in bringing about educational growth and achievement.
After the high school years, ELS:2002 will continue to follow its sample of students into postsecondary education or the labor market. For students who continue on to higher education, ELS:2002 will measure the effects of their high school careers on subsequent access to postsecondary institutions, their choices of institutions and programs, postsecondary persistence, attainment, and eventual entry into the labor force and adult roles. For students who go directly into the workforce either as dropouts or high school graduates, ELS:2002 will be able to help determine how well high schools have prepared these students for the labor market and how they fare within it.
Basic elements that are encompassed in the ELS:2002 survey instruments can be classified into three broad categories: background information (normally collected in the base year only), process information (about dynamic influences on students, in the home, school, and community environments, as they move through secondary school and beyond into the world of postsecondary education and the adult workforce), and outcome information (the eventual outcomes of the transition process). Below are examples of the content of the ELS:2002 survey instruments:
Social background variables, including sex, race, family income, family structure and composition, parent education and employment, languages spoken, parental aspirations for child, health history, and prior school experience.
Home educational support system process variables, including involvement in education, cognitive stimulation, discipline, and monitoring.
Outcome variables, including tested achievement in math, achievement growth over time in mathematics, grades, retention/promotion, high school persistence/dropout status, socioemotional development, engagement in school, postsecondary access and entry, progress, attainment, labor market outcomes, family formation, and citizenship.
Design and Sample Sizes
Baseline survey of high school sophomores in spring 2002.
Cognitive tests in reading and mathematics.
In the base year (2002), one parent was surveyed for each student. Each student's English and math teachers were surveyed as well. For each school, the principal or chief administrator completed a questionnaire. The head of the library media center also completed a questionnaire. The survey administrator completed a facilities checklist that described the physical plant and circumstances of the school.
Sample sizes: 750 schools (750 principals and 750 head librarians or library media center directors completed questionnaires; 750 survey administrators completed facilities checklists), over 15,000 students and their parents, and 10,000 teachers.
Schools were selected first, then 10th-grade students were randomly selected within each school.

Because nonpublic schools are comparatively more rare than public schools, such schools (specifically, Catholic and other private schools) were sampled at a higher rate. This ensured larger numbers of these schools to support comparisons with public schools.
Some types of students from less numerous population groups (e.g., Asian Americans) were selected at a higher rate to increase their numbers so that the study can validly compare the experiences of Blacks, Asians, Hispanics, and Whites.
Follow-up in 2004, when most sample members will be seniors; some sample members will be dropouts or in other grades.
Student questionnaires, dropout questionnaires, cognitive test in mathematics, and school administrator questionnaire.
The study will return to the same 750 school records. Information regarding courses completed, grades, attendance, SATIACT scores, etc., will be collected for sample members' academic careers from 9th through 12th grades (High School Transcript Component).
SECOND FOLLOW-UP (2006)
Post-high school follow-ups will be conducted by CATI. A number of additional follow-ups may take place thereafter.
Schedule for Release of Results and Related Products
By the end of 2003, the following base-year products will be available:
data files for all study components, including a public-use version of the data, accompanied by special data extraction software;
a user's manual documenting survey procedures and providing guidance for access to the data set; and
a descriptive summary report with key findings from the base-year study.
Additional reports on selected topics will be prepared under government sponsorship; it is anticipated that nongovernment researchers will also make extensive use of the released data and publicly publish or report their results.
ELS:2002 can be found on the web (http://nces.ed.gov/surveys/els2002) For further information on ELS:2002, contact:
Jeff Owings ElementaryISecondary and Libraries Studies Division Secondary Longitudinal and Transcript Studies Program National Center for Education Statistics 1990 K Street NW Washington, DC 20006 Telephone number: (202) 502-7423 E-mail address: [email protected]

Peggy Quinn ElementaryISecondary and Libraries Studies Division Sample Surveys Study Program National Center for Education Statistics 1990 K Street NW Washington, DC 20006 Telephone number: (202) 502-7368 E-mail address: [email protected]
Postsecondary Longitudinal Studies
Beginning Postsecondary Students Longitudinal Study
The Beginning Postsecondary Students Longitudinal Study (BPS) was started to complement the high school cohort longitudinal studies and to improve data on participants in postsecondary education. Because older students, in addition to recent high school graduates, are increasingly included in postsecondary education, high school cohort studies are not representative of all postsecondary participants at a given point in time. BPS includes these "nontraditional" as well as "traditional" students and thus is more representative of all beginning students in postsecondary education.
The BPS survey includes information regarding persistence, progress, and attainment fiom initial time of entry into postsecondary education through leaving and entering the workforce. By following a postsecondary education cohort (rather than a single-age elementary or secondary school cohort), BPS describes to what extent, if any, students who start postsecondary education later differ in their progress, persistence, and attainment. Because students who delay entry into postsecondary education have different experiences prior to entry than students who enter immediately after high school, their transitions between levels of education and work may also be different. In addition to issues related to persistence, progress, and attainment, BPS also directly addresses issues concerning entry into the workforce. Its unique contribution is the inclusion of nontraditional (or older) students. This provides the ability to analyze the differences between traditional (recent high school graduates) and nontraditional students in aspirations, progress, persistence, and attainment. With two cohorts of beginning students, differences and changes over time can begin to be tracked.
Among the questions BPS addresses are: Do students who are part time or discontinuous attendees have the same educatiqnal goals as full-time, consistent attendees? Are they as likely to attain similar educational goals? Are students who change majors more or less likely to persist? The publication, Descriptive Summary of 1989-90 Beginning Postsecondary Students: 5 Years Later, presented rates of persistence and degree attainment. In addition, Nontraditional Undergraduates presented differences in persistence found for traditional and nontraditional students. The report, Descriptive Summary of 1995-96 Beginning Postseconchry Students: Sik Years Later, described the attendance patterns and completion rates of the second BPS cohort.

Design The BPS is based on the NPSAS. The NPSAS is a large, nationally representative sample of
institutions, students, and parents (see NPSAS description in chapter 4 for more information). As such, it provides a highly efficient and cost-effective way of identifying a nationally representative sample of beginning students attending postsecondary institutions. In addition, data from all components of the NPSAS (the Student Record Abstract, Student Interview, Parent Survey) are available as base-year data for the BPS sample. For the second BPS cohort (BPS:96/98/2001), annual matches with U.S. Department of Education financial aid records and SATIACT scores are also included. The first BPS followed NPSAS:90 beginning students starting in 1992. About 8,000 students who began their postsecondary education career in the 1989-90 academic year responded to NPSAS:90 and were included in the first BPS (BPS:90/92) in the spring of 1992 and the second follow-up of that cohort (BPS:90/94) in 1994. NPSAS:90 collected data for over 6,000 parents of those students. The second BPS cohort followed NPSAS:96 students beginning their postsecondary education in the 1995-96 academic year. Over 10,000 students responded to the first follow-up of the second cohort in 1998 and over 9,100 responded to the second follow-up of the BPS:96 cohort in 200 1 (BPS:96/0 1).
New BPS cohorts alternate with the Baccalaureate and Beyond Longitudinal Study (B&B) in using the NPSAS as their base.
Public-use data from BPS:90/92/94 and BPS:96/98/OI cohorts are available through the web and on CD-ROM.
Components NPSAS Base Year (1990 and 1996)-Major field of study, type and control of institution, financial aid, cost of attendance, age, sex, racelethnicity, family income, reasons for school selection, current marital status, employment and income, community service, background and preparation for college, college experience, future expectations, parents' level of education, income, and occupation.
BPS Follow-lip Siirveys (1992, 1994, 1998, and 2001)-Year in school, persistence in enrollment, academic progress, degree attainment, change in field of study, institution transfer, education-related experiences including early entry into graduate school, expenses and financial aid, employment and income, employment after completion, employment-related training, current family status, community service, political participation, and future expectations.
Major Publications Comm~rnity College Students: Goals, Acccclemic Preparation, ccnd Oirtcomes (June 2003)
Descriptive Swnmnry of 1995-96 Beginning Postseconclaty Students: Six Years Later. (December 2002)
Short-Term Enrollment in Postsecondwy Education: Stirdent Background ccncl Institiitional Differences in Rectsons for Early Departure, 1996-98 (November 2002)
Persistence and Attainment of Beginning Students With Pel1 Grants (May 2002)
High School Academic Curricul~rm and the Persistence Path Through College: Persistence and Transfer Behavior of Undergmduates 3 Years After Entering 4-Year Institutions (September 200 1)
Community College Trctnsfer Rcites to 4-Yew Institutions Using Alternative Definitions of Transjhr (July 200 1)
Bridging the Gap: Academic Preparation and Postsecon(iary Success of FirstGeneration Students (May 200 1)
Descriptive Si~mmciry of 1995-96 Beginning Postsecontiary Students: Three Years Later. With an Essay on Students Who Started at Less-Than-4-Year Institutions (March 2000)
Data Files The public-use online Data Analysis Systems (DAS) for the BPS study years are available on the
web at http://nces.eti.gov/clnsol/and on CD-ROM, such as the following:
CD-ROM: Beginning Postsecondary Students Longitudinal Study Second Follow-up Data Analysis System BPS:96/01 (contains both BPS public-use DAS systems) (March 2003)
Beginning Postsecondary Students-BPS:96/01 Data Analysis System (January 2003)
Restricted data files (containing student-level data) are available, such as:
Beginning Postsecondary Students (BPS:96/O I) Restricted CD (August 2003)
To obtain a restricted CD-ROM with data files, you must first apply and receive approval for licensure. More information may be found on the web at http://nces.eti.gov/pubsenrch/licenses.osp.
BPS may be found on the web (http://nces.edgov/surveys/bps/) or by contacting:
Aurora D'Amico Postsecondary Studies Division National Center for Education Statistics 1990 K Street NW Washington, DC 20006 Telephone number: (202) 502-7334 E-mail address: niirora.ci'[email protected]
Baccalaureate and Beyond Longitudinal Study
Baccalaureate and Beyond (B&B) provides information concerning education and work experiences after completion of the bachelor's degree. It provides both cross-sectional information 1 year after bachelor's degree completion (comparable to the Recent College Graduate (RCG) Survey) and longitudinal data concerning entry into and progress through graduate-level education and the workforce. A special emphasis of B&B is on those entering teaching.
B&B provides information on entry into, persistence and progress through, and completion of graduate-level education. This information has not been available through follow-ups involving high school cohorts or even college-entry cohorts, both of which are restricted in the number who actually complete the bachelor's degree and continue their education. B&B:93/97 provided a unique

opportunity to gather information concerning delayed entry into graduate education, time to completion of graduate education, and the interaction between work and education beyond the bachelor's degree. B&B:93/2003 will expand this opportunity and begin to provide information concerning graduate study and long-term employment experiences after degree completion.
B&B is an expansion of the former RCG Survey. The RCG focused on the immediate postdegree employment and education experiences of people who completed a bachelor's or master's degree, and also estimated the potential supply of newly qualified teachers at the elementary and secondary levels. B&B builds upon and expands that effort to provide unique information on education and employment experiences at the undergraduate level, as well as extensive information on financing undergraduate education. In addition, B&B:93 provides that information over a longer period of time and addresses issues concerning delayed entry into graduate school, progress and completion of graduate-level education, and undergraduate and graduate debt and its impact on choices related to career and family. In addition, it provides new information on the career paths of new teachers and movement into and outside the education system. B&B:2000/0 1 is comparable to previous RCG studies, with the addition of information about their undergraduate education from the NPSAS.
B&B covers a number of topics of interest to policymakers, educators, and researchers. For example, B&B allows analysis of the participation and progress of recent bachelor's degree completers in the workforce, the relationship of employment to degree, the income and ability to repay debt, and the willingness to enter public service-related fields. B&B also allows analysis of issues related to access to and choice in graduate education programs. Here, the emphasis is on ability, ease, and timing of entrance into graduate school, and attendance-employment patterns, progress, and completion timing once entered.
The unique features of B&B allow it to be used to address issues related to undergraduate education, as well as postbaccalaureate experiences. For instance, B&B allows the investigation of issues related to undergraduate course-taking patterns, progress, and time to degree. This can involve such things as course taking in the major area of study, as well as in areas other than the academic major; stopout and transfer behavior; credits and grades earned; financial aid and work experiences as an undergraduate and their relationship to postbaccalaureate education; and financial experiences. This information has been used to investigate the relationship between undergraduate debt burden and early labor force experiences, and between undergraduate academic experiences and entry into teaching. These and other relationships can be investigated both in the short term and over longer periods.
Because B&B has a special emphasis on new teachers at the elementary and seconda~y levels, it can be used to address many issues related to teacher preparation, entry into the profession (e.g., timing and ease of entty), persistence in or defection from teaching, and career movement within the education system.
Employment and enrollment patterns can also be examined for special baccalaureate degree populations. These populations include, but are not limited to, students with disabilities, racial and ethnic minorities, students from families with low incomes, and older students. B&B also allows investigation of the experiences of students by major field ofstudy at both the undergraduate and graduate levels. Major fields of particular interest include mathematics, science, engineering, teacher preparation, and health studies.
Design B&B is based on the NPSAS (described separately in chapter 4). The NPSAS is a large,
nationally representative sample of institutions, students, and parents. As such, it provides a highly efficient and cost-effective way of identifying a nationally representative sample of baccalaureate degree completers. For each NPSAS that serves as the base year for a B&B cohort, the sample is structured to provide an optimum sample of graduating seniors in all majors. This allows the accurate identification of baccalaureate degree completers, and provides additional information concerning both past education experiences and future education employment expectations. Data from all components of the NPSAS are available as base-year data for the B&B sample.
B&B follows baccalaureate degree completers identified in alternating NPSAS surveys, beginning with NPSAS:93. About 11,000 students who completed their degree in the 1992-93 academic year were included in the first B&B cohort and were followed up in 1994 and 1997 (B&B:93/94/97), with a third follow-up scheduled for 2003. NPSAS:93 also provided data for over 8,000 of their parents. In addition to the student interview data, B&B:93/94 collected postsecondary transcripts covering the undergraduate period. These transcripts provide information on progress and persistence at the undergraduate level. The second B&B follow-up took place in spring 1997 (B&B:93/97) and provided new information on employment, entry into graduate school, and progress in the teacher pipeline. A new B&B cohort began with the 2000 NPSAS and involved only a I-year follow-up in 2001. Future B&B cohorts will alternate with BPS in using NPSAS surveys as their base.
Components
NPSAS Data-Year in school, major field of study, type and control of institution, attendance status, tuition and fees, admission test scores, financial aid awards, cost of attendance, student budget information and expected family contribution for aided students, grade point average, age, date first enrolled, level, major field of study, financial aid at other schools attended during year, other sources of financial support, monthly expenses, reasons for selecting the school they attended, current marital status, age, racelethnicity, sex, highest degree expected, employment and income, community service, expectations for employment after graduation, expectations for graduate school, plans to enter the teaching profession, parents' level of education, income, and occupation.
B&B:93/94 arid B&B:2000/2001-Employment after degree completion, job search activities, expectations for and entry into teaching, teacher certification status, job training and responsibilities, expectationslentry into graduate school, enrollment after degree, financial aid, loan repaymentlstatus, income, family formation and responsibilities, community service, undergraduate coursework, institutions attended, grades, credits attempted and earned, and academic honors earned. In addition, B&B:93/94 contains undergraduate transcript records.

SECOND AND THIRD FOLLOW-UPS
B&B:93/97/03-Employment history; enrollment history; job search strategies at degree completion (each new degree completed); career progress; current status in graduate school; federal and nonfederal aid received; additional job training; e n t ~ y into, persistence in, and resignation from teaching career; teacher certification status; teacher career paths; income; family formation and responsibilities; community service; types and amounts of federal financial aid received; total federal debt accrued; and loan repayment status.
Major Publications
Competing Choices: Men 's antl Women 's Paths AJter Earning a Bachelor 's Degree (June 200 1)
From Bnchelor 's Degree To Work: Major Field qf Stiicly and Employment Otitcomes of 1992-93 Bctchelor 's Degree Recipients Who Did Not Enroll in Graduate Ediictition by 1997 (May 200 1)
Progress Throtigh the Teacher Pipeline: 1992-93 College Graclziates antl Elementary/ Secondary School Teaching as of1997 (December 1999)
Lijk Ajter College: A Descriptive Siimmttry o f 1 992-93 Bachelor's Degree Recipients in 1997, With an Essay on Prtrticipation in Glmduate antl First-Professional Ecluccttion (July 1999)
Early Labor Force Experiences and Debt Btirclen (September 1997)
America's Teachers: Projile o f a Profession, 1993-94 (July 1997)
Data Product
Public-use data from the B&B studies are available through the web and on CD-ROM. The public-use online Data Analysis Systems (DAS) for the B&B study years are available on the web at http://nces.ecl.gov/rlnsol/.
Information on public-use data on CD-ROM may be found on the web at http://nces.ecl.gov/surveys/B$B. Public-use DAS available on CD-ROM include:
Baccalaureate and Beyond Longitudinal Study 200010 1 Data Analysis System (DAS) On-line (August 2003)
CD-ROM: Baccalaureate and Beyond Longitudinal Study Second Follow-up B&B:93/97: Public-Use Data Analysis System (DAS) (January 2000)
Restricted data files (containing student-level data) are also available. To obtain a restricted CD- ROM with data files, you must first apply and receive approval for licensure. More information may be found on the web at http://nces.ecl.gov/ptibsenrch/licenses.asp.
B&B can be found on the web (http://nces.ed.gov/siirveys/B&B) or by contacting:
Aurora D'Amico Postsecondary Studies Division National Center for Education Statistics 1990 K Street NW Washington, DC 20006 Telephone number: (202) 502-7334 E-mail address: aiirorn.d'[email protected]

Plans for Longitudinal Studies NCES is in the process of collecting data for the first time for a new longitudinal survey of 10th-
graders. This collection began in the spring of 2002. Known as the Education Longitudinal Survey (ELS) 2002 10th-grade cohort, the survey is designed to provide comparisons to previous data collections (NLS:72 and NELS:88) that follow the education, career and life choices of 10th-graders over a decade or more following the 10th grade. Follow-up surveys are anticipated in 2004 and 2006.
The ECLS-K was collected in the spring of 2002, when the children were in the third grade. NCES will collect more data in 2004, when the children are in the fifth grade. In 2002, the ECLS-B will continue to collect data on the sample of children at 9 months of age and will start the second wave of data collection as children in the study reach 18 months of age.
The BPS sample of students who began their postsecondary education in 1995-96 were interviewed again in 2001. As part of B&B, a sample of students who received their bachelor's degrees in 1999-2000 were interviewed again in 2001, and the sample of 1992-93 bachelor's degree recipients will be interviewed again in 2003.
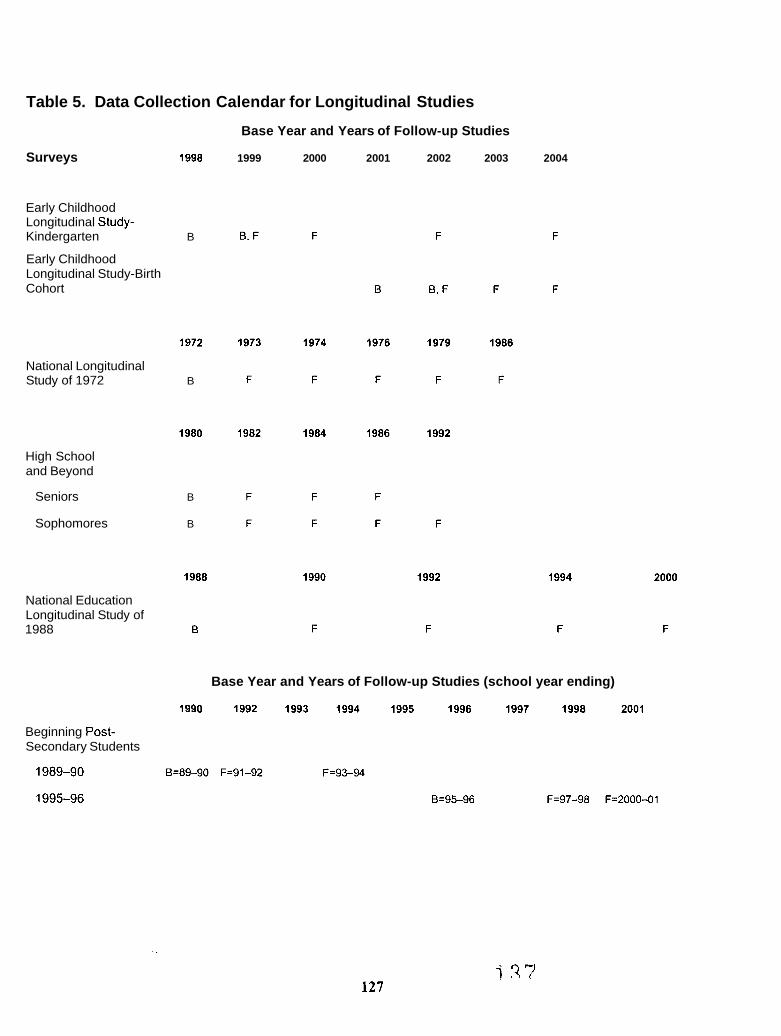
Table 5. Data Collection Calendar for Longitudinal Studies
Surveys 1998
Early Childhood Longitudinal Study- Kindergarten B
Early Childhood Longitudinal Study-Birth Cohort
National Longitudinal Study of 1972 B
High School and Beyond
Seniors B
Sophomores B
National Education Longitudinal Study of 1988 8
Base Year and Years of Follow-up Studies
1999 2000 2001 2002 2003 2004
Base Year and Years of Follow-up Studies (school year ending)
Beginning Post- Secondary Students
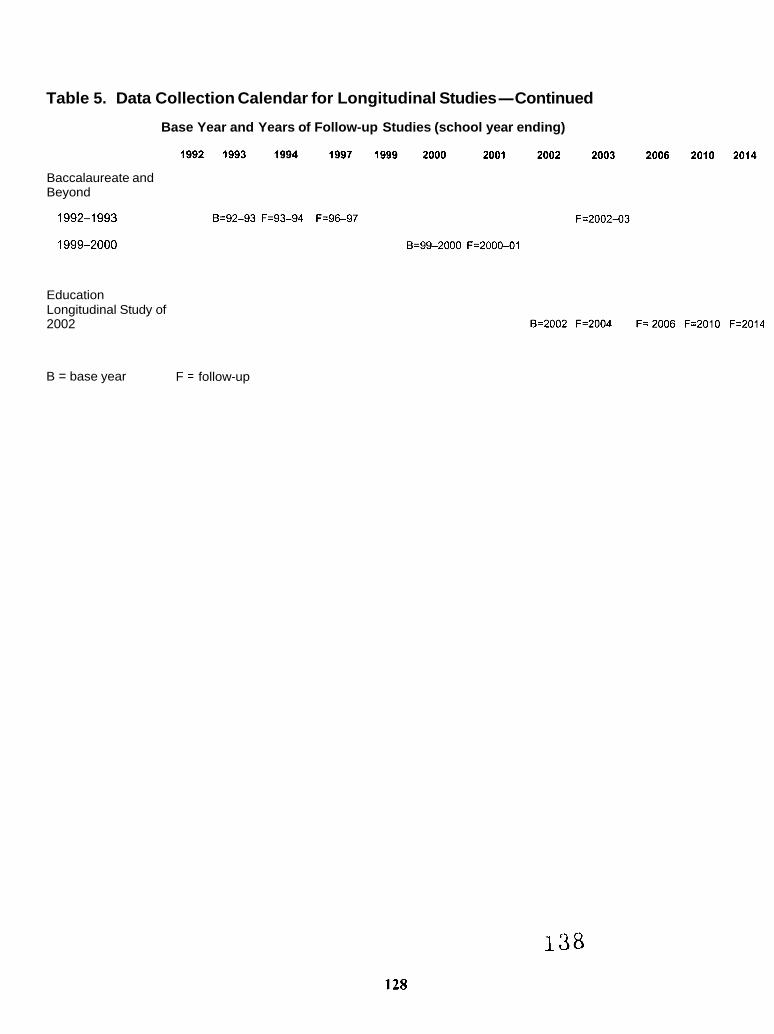
Table 5. Data Collection Calendar for Longitudinal Studies-Continued
Base Year and Years of Follow-up Studies (school year ending)
Baccalaureate and Beyond
Education Longitudinal Study of 2002
B = base year F = follow-up
Insights into the educational practices and outcomes of the United States are obtained by comparing them with those of other countries. Congress, in authorizing the National Center for Education Statistics (NCES), recognized the importance of crossnational information by including it in the agency's mission. NCES canies out a variety of activities to provide statistical information comparing the educational experiences and trends in other countries to those in the United States. Through comparisons with other countries, it is possible to learn more about the status of education in the United States and to generate new ideas for improving American education.
NCES plays a central role among organizations involved in collecting and interpreting international data and has created an International Activities Program within the Early Childhood, International, and Crosscutting Studies Division to coordinate NCES efforts in international education studies. NCES is actively involved with the Organization for Economic Cooperation and Development (OECD), based in Paris, France, and with the International Association for the Evaluation of Educational Achievement (IEA), based in Amsterdam, Netherlands. In addition, NCES works with the Office of the Under Secretary, U.S. Department of Education, on the statistics project for the Asian Pacific Economic Cooperation (APEC) Education Forum.
There is a great deal of interest in the findings of international student assessment studies and in the development of education indicators that facilitate comparisons among national systems of education. This interest has been spurred by increased concern about global economic competition and the role education plays in the economy.
International assessment studies provide answers to questions of how other countries educate their children and with what success. Such comparisons can lead to reexamination of our own teaching practices and challenge the conventional wisdom underlying them. The assessments not only compare the performance of American students with those of their peers in other nations, but can also provide insights into the factors that influence performance.
The work that NCES conducts within the International Activities Program is designed to provide comparable indicator data about the activities and outcomes of educational systems and institutions in other nations. Such data can lead to improvements in accountability and policymaking. These data are increasingly relevant to policy formulation as the political, economic, and cultural ties grow among countries.
Data Uses NCES receives many requests for information about education in other countries, such as school
achievement levels, school completion rates, school expenditure levels, and higher education enrollment rates. Policymakers, such as chief state school officers, governors, and local school officials, also want to know the average level of achievement in various subject matters in other countries. Most requests are for data concerning highly developed countries (e.g., Australia, Canada, England, France, Germany, and Japan). This particular concern relates to maintaining a leading

position in the world economy. However, interest goes beyond how well the education systems do in preparing youth for the labor force, to questions of civic engagement and hrther participation in education.
NCES also provides international data on instructional practices. These data are gathered through two vehicles: survey data gathered at the same time assessment data are collected and videotape data. Both vehicles allow researchers to examine and illustrate instructional practices around the world.
Data from these international activities appear prominently in numerous publications produced not only in the United States, but also by international organizations. For example, the OECD publication, Education at a Glance, relies heavily on data gathered through NCES. United Nations Educational, Scientific, and Cultural Organization (UNESCO) reports on literacy have begun to follow the conventions developed by the International Adult Literacy Study, which NCES helped to underwrite.
Studies and Activities
Trends in International Mathematics and Science Study
The Trends in International Mathematics and Science Study (TIMSS), sponsored by the IEA, is a study of students' mathematics and science achievement in the United States and other participating nations. Previously known as the Third International Mathematics and Science Study, the study is on a 4-year cycle, with data collection having occurred at three points in time thus far: 1995, 1999, and 2003. Results from the 1995 and 1999 data collections have been released. Results for the 2003 data collection are scheduled for release in late 2004.
In 1995,42 nations, including the United States, participated in the study. Assessments were administered to students in both grades 4 and 8 and to students at the end of secondary school (grade 12 in the United States). In 1999, 38 nations participated. Unlike the 1995 data collection, in 1999 the assessments were administered to students in grade 8 only. In 2003, 50 nations or jurisdictions collected data from students in grades 4 andlor 8. The TIMSS assessments allow the United States to compare the achievement of its students to their peers around the world. In addition, TIMSS allows for comparisons among nations on education-related contextual factors collected from schools, teachers, and students.
The United States has sponsored additional components of TIMSS to enhance the information gained through the assessments and questionnaires. The additional components are as follows:
TIMSS 1995 Videotape Classroom Study-This first-ever large-scale, international study of teaching in eighth-grade mathematics classrooms involved three nations: Germany, Japan, and the United States. The study videotaped nationally representative samples of eighth-grade mathematics teaching to provide detailed information on the practices that may contribute to the achievement of students in the three participating nations.
TIMSS 1995 Curriculum Study-Fifty nations provided information on the official curriculum and submitted representative samples of mathematics and science textbooks for this study. Through

analyses of the data, the original TIMSS curricular frameworks were developed and curricular factors that may influence student achievement were investigated.
TIMSS 1995 Case Studies-The project provided in-depth information on education in three nations: Germany, Japan, and the United States. Through interviews with administrators, teachers, parents, and students, the project investigated education standards, dealing with differences in ability; the place of school in adolescents' lives; and the training and working conditions of teachers.
TIMSS 1995 Benchmarking Project-Five states and one consortium of school districts in the United States voluntarily participated as their own "nations," following the same guidelines as the participating nations. Participants were able to assess their comparative international standing and evaluate their mathematics and science programs in an international context.
TIMSS 1999 Benchmarking Project-Modeled on the 1995 project, 13 states and 14 districts or consortia of districts throughout the United States voluntarily participated in the second administration of this project.
TIMSS 1999 Videotape Classroom StudpBuilding on the work of the first TIMSS videotape study of mathematics, the TIMSS 1999 Videotape Classroom Study examines national samples of eighth- grade mathematics and science instructional practices in seven nations. The study is designed to reveal national-level portraits of mathematics and science teaching practices that can provide a more detailed context for understanding mathematics and science teaching and learning in the classroom.
The Benchmarking Projects provide reliable data on how state and district students compare to "world-class" levels in mathematics and science. Results from the TIMSS Videotape Classroom Studies also add to our understanding of mathematics and science instructional practices in nations with high student achievement levels on assessments such as TIMSS. The TIMSS Curriculum Study and Case Studies richly detail how decisions about curriculum and some education policies may contribute to student achievement. Taken together, these components of TIMSS provide a rich source of data for better understanding the educational context in which mathematics and science teaching and learning takes place.
Through TIMSS, the following questions, among others, can be addressed about mathematics and science learning:
How does the mathematics and science knowledge of U.S. students compare to that of other nations?
Has the mathematics and science knowledge level of students changed since 1995 and has the relative international standing of U.S. students changed since the original TIMSS?
How do nations compare on education-related background factors studied in TIMSS?
How do U.S. mathematics and science teachers compare to their international colleagues in their preparation for teaching?
What instructional techniques do mathematics and science teachers in other nations employ in the classroom? How do the teaching skills of U.S. teachers compare to those of their international peers?

Design Depending on the year of data collection, TIMSS focuses on students at three different stages in
their academic careers. TIMSS 1995 was designed to focus on students in the two adjacent grades containing the largest numbers of 9- and 13-year-olds, as well as students who were completing the compulsory portion of their education. In the United States and most nations, these students were in grades 314,718, and 12. TIMSS 1999 focused only on those students in the upper of the two grades that contained the largest number of 13-year-olds. This corresponded to grade 8 in the United States and most nations. In 2003, TIMSS focused on students in grades 4 and 8. With the completion of data collection in 2003, TIMSS provides comparisons of the achievement of fourth-graders across two points in time (1995 and 2003) and eighth-graders across three points in time (1995, 1999, and 2003). The TIMSS assessment includes two parts: mathematics and science items in multiple-choice and free-response formats. In addition, TIMSS administers school, teacher, and student questionnaires that request information to help provide a context for the performance scores. An international panel of assessment and content experts developed the original assessment Framework in 1995. For the 2003 administration of TIMSS, the framework was revised to include the latest developments in mathematics and science education and assessment. The 2003 framework provided the basis for the collection of data on the problem-solving and inquiry skills of students in mathematics and science, which is new to TIMSS.
All participating nations were required to draw nationally representative samples of students and schools for the TIMSS studies. Both public and nonpublic school students in all participating nations received the TIMSS assessments and questionnaires, unless otherwise noted in the reports. Most nations, including the United States, conducted the assessment 2 to 3 months before the end of the school year. Students with special needs and disabilities that would make it difficult for them to take the test were excused from the assessment. Such exclusions were documented by each participating nation, including the United States. In each nation, the assessments and questionnaires were translated into the primary language or languages of instruction. In the United States, all testing was done in English. The student assessment portion required approximately 1 112 hours to complete.
Major Publications
Mathematics and Science in the Eighth Grade: Findings From Comparisons of the Third International Mathematics and Science Study (June 2000)
The TIMSS Videotape Classroom Study: Methods and Findings From an Exploratory Research Project on Eighth-Grade Mathematics Instruction in Germany, Japan, and the United States (February 1999)
Pursuing Excellence: A Study of U.S. Twelfth-Grade Mathematics and Science Achievement in International Context (February 1998)
Pursuing Excellence: A Study of U.S. Fourth-Grade Mathematics and Science Achievement in International Context (June 1997)
Pursuing Excellence: A Study of U S . Eighth-Grade Mathematics and Science Teaching, Learning, Curriculum, and Achievement in International Context (November 1996)

Highlights From the TIMSS I999 Video Study of Eighth-Grade Mathematics Teaching (April 2003)
Teaching Mathematics in Seven Countries: Results From the TIMSS 1999 Video Study (April 2003)
Highlights From TIMSS-R (December 2000)
Pursuing Excellence: Comparisons of International Eighth-Grade Mathematics and Science Achievement From a U.S. Perspective, 1995 and 1999 (December 2000)
Data Files U.S. Restricted-Use Data from TIMSS 1999, User's Guide, and Technical Report (October 2003)
1995 Third International Mathematics and Science Study, Data User's Guide, and United States Technical Report (June 200 1)
TIMSS 1999 data files available from the International Study Center at Boston College (June 2001)
TIMSS 1995 Population 1,2, and 3 data files available from the International Study Center at Boston College (September 1997)
Additional details and publications on TIMSS can be found on the web (http://nces.ed.gov/timss). For hrther information about TIMSS, contact:
Patrick Gonzales Early Childhood, International, and Crosscutting Studies Division Data Development Program National Center for Education Statistics 1990 K Street NW Washington, DC 20006 Telephone number: (202) 502-7346 or 502-7421 E-mail address: [email protected]
1999 Civic Education Study The Civic Education Study (CivEd) is sponsored by the International Association for the
Evaluation of Educational Achievement (IEA). CivEd, which was conducted in 1999, focuses on what 9th-graders in 28 countries, including the United States, know about democratic practices and institutions. CivEd also provides invaluable data to understand U.S. ninth-grade students' attitudes toward democracy, national identity, international relations, and social cohesion and diversity.
CivEd measures content knowledge across the following three domains:
democracy,
national identity and international relations, and
social cohesion and diversity.
Questions that CivEd can help inform include:
How does the civic achievement of U.S. ninth-grade students compare to achievement in other countries?
What are the strengths and weaknesses of U.S. ninth-grade students in civic education?
Are U.S. ninth-grade students more proficient in civic content or civic-related skills needed in daily life?
Are there significant differences across race, gender, and socioeconomic background in the civic achievement of U.S. ninth-grade students?
What is the school and classroom context for the civic achievement of U.S. ninth- grade students?
CivEd is the result of a major consensus-building effort across the participating 28 countries. Experts in civic education as well as authorities in educational measurement were involved in developing the study framework and assessment instruments. In addition, a preliminary phase of the study conducted case-study research in each participating country to inform the development of the framework and assessment instruments. CivEd includes the following two components:
Student Questionnaire-Consists of three parts and contains cognitive items related to knowledge across the three domains of civic education, questions intended to provide background data on students used to interpret the assessment results, and questions intended to determine students' understandings and perceptions of issues in the three domains.
School Questionnaire-Designed to gather information on the school's general environment, how civic education is integrated into the school curriculum, how it is structured, and how many staff members are involved in civic education.
Major Publications What Democracy Means to Ninth-Graders: U.S. Results From the International IEA Civic Education
Study (April 200 1)
Citizenship and Education in Twenty-Eight Countries: Civic Knowledge and Engagement at Age Fourteen (released by IEA in March 2001)
Additional details about CivEd can be found on the web (http://nces.edgov/surveys/cived). For further information about CivEd, contact:
Laurence T. Ogle Early Childhood, International, and Crosscutting Studies Division Data Development Program National Center for Education Statistics 1990 K Street NW Washington, DC 20006 Telephone number: (202) 502-7426 E-mail address: [email protected]

Program for International Student Assessment
The Program for International Student Assessment (PISA) is sponsored by the Organization for Economic Cooperation and Development (OECD). PISA is designed to monitor, on a regular 3-year cycle, the achievement of 15-year-old students in three subject areas: reading literacy, mathematical literacy, and scientific literacy. PISA assesses some of the knowledge and skills that enable students to participate fully in society and the economy, and to become lifelong learners. While some elements covered by PISA are likely to be part of the school curriculum, PISA goes beyond mastery of a defined body of school-based knowledge to include the knowledge and experiences gained outside of school.
In each assessment cycle (assessment cycles began in 2000), PISA focuses on one of three subject areas, devoting approximately two-thirds of testing time to an in-depth assessment of the major domain and the remaining one-third of testing time to the other two minor domains. The subject areas of PISA are:
reading literacy-Requires students to perform a range of tasks with different kinds of texts. The tasks range from retrieving specific information to demonstrating a broad understanding, interpreting text, and reflecting on its content and features. Reading literacy was the major domain of focus in 2000.
mathematical literacy-Entails the use of mathematical competencies at several levels, ranging from performance of standard mathematical operations to mathematical thinking and reflection. Mathematical literacy is the major domain of focus in 2003.
scientific literacy-Involves the use of key scientific concepts in order to understand and help make decisions about the natural world. It involves being able to recognize scientific questions, use evidence, draw scientific conclusions, and communicate these conclusions. Scientific literacy will be the major domain of focus in 2006.
On its regular 3-year cycle, PISA will provide trend data in a major subject area every 9 years. As PISA develops, it is expected that additional areas of crosscurricular or general competencies will be assessed. For example, in 2003 an assessment of problem solving will be piloted. Questions that PISA helps address include the following:
How do U.S. 15-year-olds perform in the subject areas covered by PISA in comparison to their international counterparts?
What are the strengths and weaknesses of U.S. 15-year-olds in reading literacy, mathematical literacy, and scientific literacy?
Are there significant differences across race, gender, or socioeconomic background in reading literacy, mathematical literacy, and scientific literacy as measured by PISA?
PISA is designed to focus on 15-year-old students. In the United States, these are largely 9th- and 10th-graders. A nationally representative sample of 15-year-old students is asked to complete the PISA assessment and background questionnaires in each participating country. To assess the

performance of students and to provide education-related contextual information to understand their performance, PISA includes the following three components:
Assessment Items-Students are required to read passages; interpret charts, graphs, diagrams, or other documents; and answer questions related to them. Question types range from multiple choice to extended response. The objective of the assessment items is to determine whether students can reflect and think about the domain being assessed, rather than simply repeat knowledge they have learned. The focus of the assessment items will change with each cycle of PISA.
Student Questionnaire-The student questionnaire was developed to collect information on school and out-of-school experiences of students, their attitudes toward learning, and other basic information considered important to interpreting the assessment results.
School Questionnaire-A school administrator or someone knowledgeable about the school is asked to complete a questionnaire about the staff and its policies.
PISA was designed through an intensive, collaborative process involving all participating nations. PISA brought together content and testing experts to develop the framework from which all PISA assessments are developed. Data collection for PISA 2003 in the United States took place in spring and fall 2003. Each participating nation was required to draw a nationally representative sample of 15-year-olds.
Major Publication Outcomes of Learning: Results From the 2000 Program for International Student Assessment of I S - Year-Olds in Reading, Mathematics, and Science Literacy (December 200 1)
Additional details about PISA can be found on the web (http://nces.edgov/surveys/pisa)). The international database is available from the OECD at http://www.pisa.oecdorg. For further information about PISA, contact:
Mariann Lemke Early Childhood, International, and Crosscutting Studies Division Data Development Program National Center for Education Statistics 1990 K Street NW Washington, DC 20006 Telephone number: (202) 502-73 14 E-mail address: [email protected]
Progress in International Reading Literacy Study 2001
The Progress in International Reading Literacy Study (PIRLS) 200 1 was sponsored by the International Association for the Evaluation of Educational Achievement (IEA). PIRLS 2001 focused on the reading literacy of fourth-graders and the experiences they had at home and school in learning to read. PIRLS 2001 followed the last international study of reading literacy conducted 10 years ago, and was designed to allow for the measurement of changes in reading literacy over time. PIRLS will be conducted on a planned 5-year cycle, with the next data collection scheduled for spring 2006.

PIRLS 2001 offered the possibility of making comparisons of student reading performance across nations and provided international benchmarks by focusing on the following three aspects of reading literacy:
processes of comprehension,
purposes for reading, and
reading behaviors and attitudes.
PIRLS 2001 helped measure progress toward the national goal of promoting reading literacy for all students and allowed for comparisons among nations on important educational policy issues. PIRLS 2001addressed the following questions about reading literacy:
0 How well do U.S. fourth-grade students read literary texts compared to students in other countries?
How well do U.S. fourth-grade students read informational texts compared to students in other countries?
What are students' reading habits and attitudes?
What school factors relate to students' reading literacy achievement?
PIRLS 2001 was designed to focus on students in the upper of the two adjacent grades with the most 9-year-olds (fourth-graders in most countries, including the United States). A nationally representative sample of students was asked to demonstrate how well they read and how well they understood what they read. To assess the reading performance of students and to provide education- related contextual information to understand their performance, PIRLS 2001 included the following two components:
Reading Assessment-Developed for 9-year-olds, this assessment represents a range of text types that students would have likely encountered by this age. The assessment items that accompany the texts require students to demonstrate a range of skills related to reading literacy.
Student, Teacher, and School Questionnaires-These questionnaires were developed to collect information on the school reading experiences of students, teacher expectations and beliefs, reading instruction practices, school reading programs, and students' reading habits and experiences both in and out of school.
An international panel of assessment and content experts developed the PIRLS framework, from which the reading literacy assessment and questionnaires were designed. Data collection in the United States was conducted in spring 2001, and international and national reports were released in spring 2003.
Major Publications PIRLS 2001 International Report: IEA 's Study of Reading Literacy Achievement in Primary Schools
in 35 Countries (released by IEA in April 2003)

International Comparisons in Fourth-Grade Reading Literacy: Findings From the Progress in International Reading Literacy (PIRLS) of 2001 (April 2003)
Information about PIRLS can be found on the web at (http://nces.edgov/suweys/pirls). For further information about PIRLS, contact:
Laurence T. Ogle Early Childhood, International, and Crosscutting Studies Division Data Development Program National Center for Education Statistics 1990 K Street NW Washington, DC 20006 (202) 502-7426 E-mail address: [email protected]
Adult Literacy and Lifeskills Survey The Adult Literacy and Lifeskills Survey (ALL) is an international comparative study designed
to provide six participating countries, including the United States, with information about the skills of their adult populations (ages 16-65).
ALL measures the literacy and numeracy skills of a nationally representative sample of adults from each participating country. Literacy skills encompass prose and document literacy, including the knowledge and skills to understand and use information from texts such as editorials, news stories, poems, and fiction, and the knowledge and skills required to locate and use information contained in various formats such as tables, forms, graphs, and diagrams. Numeracy refers to the ability to interpret, apply, and communicate mathematical information.
A pilot test of ALL assessed adults' problem-solving skills and gathered information on their experiences with and attitudes toward teamwork and their familiarity with information and communication technologies. This information will help educators and policymakers better understand the relative strengths and potential challenges in America's workforce and allow decisionmakers to better design policies and programs that will effectively address them.
ALL builds upon the success of the 1994 International Adult Literacy Survey (IALS) in the direct measure of literacy skills. For countries that participated in the IALS, such as the United States, ALL provides data to monitor changes in adult skill levels since 1994.
'
Questions that ALL intends to address include the following:
How do the skills demonstrated by the U.S. adult population, as measured in ALL, compare to the skills of adults in other countries?
How do the skills measured in ALL relate to one another?
What is the relationship between the skills measured in ALL to individual economic and social status?
Are there significant differences across race, gender, and socioeconomic background in the skills demonstrated by U.S. adults?

ALL consists of the following two components:
background questionnaires designed to collect general participant information and examine attitudes toward teamwork and familiarity with information and communication technology; and
assessments of the skills of participants in prose and document literacy and numeracy.
ALL is a household survey. In the 2003 assessment, participants completed approximately 45 minutes of background questions and 60 minutes of paper-and-pencil assessment items in their homes. In the United States, a nationally representative sample of approximately 4,000 adults ages 16-65 was selected. Each participating country provided a sample that is representative of their adult population as a whole. Main data collection for ALL took place from January to May 2003. Round two of ALL will take place from January to May 2004.
Additional details on ALL can be found on the web (http://nces.edgov/suvveys/all). For further information on ALL, contact:
Laurence T. Ogle Early Childhood, International, and Crosscutting Studies Division Data Development Program National Center for Education Statistics 1990 K Street NW Washington, DC 20006 Telephone number: (202) 502-7426 E-mail address: [email protected]
OECD International Education Indicators Project
NCES has been working cooperatively with the member countries of the Organization for Economic Cooperation and Development (OECD) since 1988 to develop an education indicator reporting system. The goal of the Indicators of Education Systems Project (INES) is to improve the comparability of education data across OECD countries and to develop, collect, and report on a key set of indicators of the condition of education in these countries. NCES chairs Network A, which develops indicators for student outcomes, and participates in other networks and a technical group, which develop indicators in other areas.
The set of indicators includes measures of student enrollment and achievement, labor force participation, school and school system features, and costs and resources. The primary vehicle for reporting on these indicators is a report entitled Education at a Glance (EAG). EAG was first released in September 1992. An analytical volume was added to the series in 1996, and the two volumes continue to be released annually. These indicators are under continuous refinement, and additional indicators are being developed for future editions of the report.
Major Publications Education at a Glance: OECD Indicators 2003 (released by OECD in September 2003)

Comparative Indicators of Education in the United States and Other G8 Countries: 2002 (April 2003)
Investing in Education: Analysis of the 1999 World Education Indicators (February 2001)
Elementary and Secondary Education: An International Perspective (April 2000)
International Education Indicators: A Time Series Perspective, 1985-1 995 (February 2000)
Education Indicators: An International Perspective (December 1996)
Education in States and Nations: Indicators Comparing US . States with Other Industrialized Countries in 1991 (July 1996)
For krther information about INES, contact:
Eugene Owen Early Childhood, International, and Crosscutting Studies Division Data Development Program National Center for Education Statistics 1990 K Street N W Washington, DC 20006 Telephone number: (202) 502-7422 E-mail address: [email protected]
Plans for International Education Statistics NCES has worked with its international partners to develop and implement a set of regular
international assessments and surveys in different subject areas at different grade or age levels. Under the auspices of the IEA and OECD, current NCES plans include the following international education studies:
PIRLS: PIRLS data in the United States were collected in spring 2001, with the next international data collection to take place in 2006. PIRLS focuses on the reading literacy of 9-year-olds.
TIMSS: A continuation of the assessment series is anticipated. Findings from the TIMSS 2003 assessment are scheduled to be released in December 2004.
PISA: In the United States, PISA data were collected in spring 2003, with a focus on the mathematics literacy of 15-year-olds. PISA is scheduled to collect data every 3 years, with a different subject-area focus each time. In 2000, the focus was on reading literacy; in 2006, it will be on scientific literacy. The 2003 data will be reported in December 2004.
In addition, NCES will continue its collaboration with foreign governments and agencies towards the development of international education indicators. In addition to the World Education Indicators Project-a joint program of OECD and UNESCO that gathers INES data from non-OECD countries-and INES, NCES is working with governments, organizations, and universities in the Western Hemisphere to develop an Indicators of the Americas program.

Table 6. Data Collection Calendar for International Statistics
Year of Data Collection
Surveys 2001 2002 2003 2004 2005 2006 2007
TIMSS X X
ALL
8
Data on Vocational Education
The National Center for Education Statistics (NCES) Data on Vocational Education (DOVE) system derives data about vocational education primarily from existing NCES surveys. Some of the most informative data in the DOVE system are high school student transcript data. In comparison to reports from states that categorize students as vocational using different definitions, high school transcripts provide consistent information on how many vocational education credits students earn. These data allow researchers to identify students who take different amounts and types of vocational education courses, and to examine the relationship between academic and vocational course taking. The DOVE system also uses data from NCES longitudinal studies to examine the economic and educational outcomes associated with participation in vocational education, and data from other NCES surveys to examine the characteristics of vocational teachers, programs, and students at the secondary and postsecondary levels. DOVE is supplemented with data from other federal sources, including the Bureau of Labor Statistics (National Longitudinal Survey of Youth) and the Census Bureau (Survey of Income and Program Participation and Current Population Survey).
Data Uses The primary use of the DOVE system is to report on the status of vocational education. NCES
has published several reports on vocational education topics, including trends in student participation over time, characteristics of vocational students, and vocational staff characteristics. These publications include Vocational Education in the United States, a periodic report that synthesizes vocational education data across educational levels; the last edition was published in 2000 and the next edition is planned for 2005. In addition, the DOVE system is a key data source for the National Assessment of Vocational Education (NAVE), a periodic, congressionally mandated study of vocational education and the federal legislation that supports it. For example, the current NAVE used student transcript data collected between 1982 and 1998 to examine changes in the nature of the vocational and academic curricula that students pursue.
Listed below are the primary databases and components that are used by NCES for the analysis of vocational education issues. Only brief summaries of the surveys are presented in this chapter. For a more complete description of a survey or component, refer to the appropriate chapter within this publication. The surveys are grouped by category: secondary, postsecondary and adult, and longitudinal studies.
Components
High School Transcript Studies--Complete high school transcripts, including courses taken, grades, and credits earned, in addition to student characteristics. The 1987, 1990, 1994, 1998, and 2000 studies are linked to the National Assessment of Educational Progress. The 1982 study is linked to
High School and Beyond (HS&B). The 1992 study is linked to the National Education Longitudinal Study of 1988 (NELS:88).
Schools and Staffing ~ u k e y - ~ a t a from the 1987-88, 1990-9 1, 1993-94, and 1999-2000 Teacher Questionnaire, School Administrator Questionnaire, School Questionnaire, and School District Questionnaire.
POSTSECONDARY AND ADULT STUDIES
National Postsecondary Student Aid Study (NPSAS)-Data from the 1987, 1990, 1993, 1996, and 2000 Student Record and Student Telephone Interviews.
Adult Education Survey of the National Household Education Survey (NHES)-Data from the 1991, 1995, 1999,2001, and 2003 NHES Adult Education Surveys.
National Study of Postsecondary Faculty (NS0PF)-Data from the 1988, 1993, 1999, and 2003 Faculty Surveys.
High School and Beyond (HS&B)-Data from the 1980 base-year Student, School, and Parent Questionnaires, and follow-up surveys in 1982, 1984, 1986, and 1992.
National Education Longitudinal Study (NELS:88)-Data from the 1988 base-year questionnaires and follow-up surveys in 1990, 1992, 1994, and 2000, including transcript data in 1992.
Education Longitudinal Study (ELS)-Data from the 2002 base-year surveys and (in future years) the 2004,2006, and 2012 follow-up surveys.
Beginning Postsecondary Students Longitudinal Study (BPS)-Data from the 1990 base-year NPSAS and its BPS follow-up surveys in 1992 and 1994, and from the 1996 base-year NPSAS and its BPS follow-up surveys in 1998 and 200 1.
Major Publications
Public High School Graduates Who Participated in Vocational/Technical Education: 1982-1 998 (July 2003)
Trends in High School VocationaUTechnical Coursetaking: 1982-1 998 (June 2003)
Vocational Education in the United States: Toward the Year 2000 (January 2000)
Vocational Education in the United States: The Early 1990s (November 1996)
Vocational Education in the United States: 1969-1 990 (April 1992)
Information about vocational education can be found on the web at (http://nces.ed.gov/surveys/dove/). For further information on vocational education, contact:

Lisa Hudson Early Childhood, International, and Crosscutting Studies Division Data Development Program National Center for Education Statistics 1990 K Street NW Washington, DC 20006 Telephone number: (202) 502-7358 E-mail address: lisa. [email protected]
Libraries represent an educational resource that is available to individuals regardless of age, social status, or educational background. In an effort to provide more complete information on this aspect of the education spectrum, the National Center for Education Statistics (NCES) initiated a formal Library Statistics Program in 1989. The first library survey was begun, however, in 1966 with the fielding of the Academic Libraries Survey as part of the Higher Education General Information Survey. This survey was fielded because an academic library was considered an essential component of a higher education institution.
The first survey under the auspices of the Library Statistics Program (1989) focused on public libraries in response to a congressional mandate for NCES to establish a cooperative system for public library data. The Public Libraries Survey is the product of a cooperative effort among state library agencies, NCES, the Bureau of the Census, and the National Commission on Libraries and Information Science. In addition to the Academic Libraries Survey, the Public Libraries Survey, and the School Library Media Centers Survey, the Library Statistics Program developed one additional library survey, the State Library Agencies (StLA) Survey in 1994.
Data Uses Descriptive information provided by the library surveys include staffing levels, and size and
content of the collections in libraries, populations served by the libraries, the number of items per year that libraries circulate, library expenditures, and the extent of library services.
The four library surveys provide the only current, national, and descriptive data on the status of libraries. They are used by professional associations, local practitioners, and federal, state, and local officials for planning, evaluation, and policymaking. These data are also available to researchers and educators to analyze the state of the art of librarianship and to improve its practice.
Except for the School Library Media Centers Survey, each of the library surveys is a census. Because the respondents include all known libraries of that type, the resulting data files can be used to develop frames for samples surveys by NCES, other agencies, or researchers.
In addition to the periodic surveys of libraries, NCES has conducted some sample surveys related to public libraries-both to assess the feasibility of incorporating certain items into its universe surveys and to obtain information that addresses more specific issues. For example, in 1993, NCES conducted a survey of public library services to children and young adults using the Fast Response Survey System (FRSS). Several items on the extent of children's services were added to the Public Libraries Survey in 1995 based on the results of this FRSS survey. NCES also collected information from households about frequency of use and the purposes for which households use public libraries through the National Household Education Survey in 1996. NCES plans to update these data and added some additional survey questions in fall 2002 as part of a supplement to the Current Population Survey. This usage information can be extremely helpful for policymakers setting

priorities for libraries in relation to demands for other public services. Having additional information on how individuals actually use libraries provides practitioners important insights on ways to serve their customers better.
Studies
Public Libraries Survey
Nationwide public library statistics are collected and disseminated annually through the Federal- State Cooperative System (FSCS) for Public Library Data. Descriptive statistics are collected on over 9,000 public libraries. Preparing for its 16th year of electronic data collection, FSCS is an example of the synergy that can result from combining federal-state cooperation with state-of-the-art technology. FSCS was the first national NCES data collection in which respondents supplied the information electronically, and in which data were also edited and tabulated completely in machine-readable form. This s o h a r e has been cost effective and has improved data quality.
Design Data are collected for over 9,000 public libraries identified by state library agencies in the 50
states and the District of Columbia. Beginning in 1993, the following outlying areas joined FSCS: Guam, Northern Marianas, Puerto Rico, and the Virgin Islands. At the state level and in the outlying areas, FSCS is administered by State Data Coordinators appointed by each state or outlying area's chief officer of the state library agency. State Data Coordinators collect the requested data from local public libraries and submit these data to NCES. Data are available for individual public libraries and are also aggregated to state and national levels. NCES also developed the first comprehensive public library universe file. This automated file is updated annually and includes identifying information on all known public libraries (including their service outlets). This resource is now available for use in drawing samples for special surveys on such topics as literacy, access for the disabled, and library construction.
An annual professional development conference, sponsored by NCES, is provided for State Data Coordinators. A steering committee representing State Data Coordinators and other professional organizations is active in the development of new data elements and software for the Public Libraries Survey. Technical assistance to states and outlying areas is provided by the FSCS Steering Committee and NCES staff and contractors.
Components Identifiing Information About Individual Public Libraries and Their Outlets-Identi fying data are collected for each public library and public service outlet. These data include street address, mailing address, city, county, zip code, web address, telephone number, fax number of director, and e-mail address of director.
Data About Public Libraries-Includes service measures, such as reference transactions, public service hours, interlibrary loans, circulation, library visits, children's program attendance, and circulation of children's materials. The survey also includes information about size of collection,

staffing, operating income and expenditures, number of web terminals used by the general public, number of web terminals used by staff only, type of legal basis, type of interlibrary relationship, type of geographic boundary, type of administrative structure, and number and types of public library service outlets. Recently added electronic technology data items include operating expenditures for library materials in electronic format, operating expenditures for electronic access, number of library materials in electronic format, access to electronic services, access to the web, and number of users of electronic resources in a typical week. A question-"Does this public library meet all the criteria of the FSCS public library definition?"-has also been added.
Data About Public Library Service Outlets-Includes number and types of outlets, location of public library service outlets relative to a metropolitan area, number of books-by-mail outlets, number of bookmobiles by bookmobile outlet, and square footage of outlet.
Web Data Search Tools-The Public Library Locator tool (http://nces.edgov/surveys/libraries/liblocator) is available on the Library Statistics Program web site. This tool enables users to locate the most recently available data about a library or public library service outlet in instances where they know some but not all the identifying information about the library. For example, if one knows the city the library is in, but not its name, one will still be able to locate the library and obtain most of the available FSCS data about it, including identifying information, organizational characteristics, services, staffing, size of collection, and income and expenditures.
The Library Statistics Program has also released a web-based peer comparison tool on the Library Statistics Program web site (http://nces.ed.gov/surveys/libraries/publicpeer). Using this tool, a customer can first select a library of interest. Next, the user can search for a peer group by selecting key characteristics to define the library, such as total operating expenditures, circulation per capita, etc. Finally, the user can view customized reports comparing the library of interest and its peers. These reports include bar charts, pie charts, rankings, data reports, and address/telephone reports. In addition, one can view FSCS data for individual public libraries.
Major Publications
Public Libraries in the United States: FY 2001 (June 2003)
Programs for Adults in Public Library Outlets: 2000 (November 2002)
Public Libraries in the United States: FY 2000 (July 2002)
Public Libraries in the United States: FY 1999 (February 2002)
Public Libraries in the United States: FY 1998 (June 2001)
Public Libraries in the United States: FY 1997 (June 2000)
Public Libraries in the United States: FY 1996 (February 1999)
How Does Your Public Library Compare? Service Per$ormance of Peer Groups (September 1998)
Statistics in Brief: Use of Public Library Services by Households in the United States: 1996 (March 1997)
Public Library Structure and Organization in the United States (March 1996)
Statistical Analysis Report: Services and Resourcesfor Children and Young Adults in Public Libraries (September 1995)
StafJing Data in the Public Library Statistics Program: Definitions, Internal Consistency, and Comparisons to Secondary Sources (August 1995)
Finance Data in the Public Library Statistics Program: Definitions, Internal Consistency, and Comparisons to Secondary Sources (April 1995)
Data Files
Data File, Public Use: Public Libraries Survey: Fiscal Year 2001 (June 2003)
Data File, Restricted Use: Public Libraries Survey: Fiscal Year 2001 (June 2003)
Additional information on the Public Libraries Survey may be found on the web (http://nces.ed.gov/surveys/libraries/public.asp). For further information on the Public Libraries Survey, contact:
Adrienne Chute ElementaryISecondary and Libraries Studies Division Library Statistics Program National Center for Education Statistics 1990 K Street NW Washington, DC 20006 Telephone number: (202) 502-7328 E-mail address: [email protected]
Academic Libraries Survey
NCES surveyed academic libraries on a 3-year cycle between 1966 and 1988. Since 1988, the Academic Libraries Survey (ALS) has been on a 2-year cycle. ALS provides data on about 3,500 academic libraries. In aggregate, these data provide an overview of the status of academic libraries nationally and by state. ALS data provide information for policymakers and researchers on trends in total operating expenditures on academic libraries, services available to students, and adoption of new technologies, such as giving students and researchers electronic access to bibliographic information. The survey also provides information on the staffing of academic libraries.
Design The survey collects data on the libraries in the entire universe of degree-granting, Title IV-
eligible postsecondary education institutions. ALS produces descriptive statistics on academic libraries in postsecondary institutions in the 50 states, the District of Columbia, and outlying areas. In 2000, ALS data were collected using a web-based data collection application.

Component Academic Libraries Survey-Total operating expenditures, full-time-equivalent library staff, service outlets, total volumes held at the end of the fiscal year, circulation, interlibrary loans, public service hours, patron count, and reference transactions per typical week.
Major Publications Academic Libraries: 1998 (July 200 1)
The Status of Academic Libraries in the United States: Results From the 1996 Academic Libraries Survey with Historical Comparison (May 200 1)
Da fa File Data File, Public Use: 1998 Academic Library (July 2002)
Further information on ALS may be found on the web (http://nces.ed.gov/surveys/libraries/aca&mic.asp). For more information on ALS, contact:
Jeffrey Williams Elementary/Secondary and Libraries Studies Division Library Co-Operative System and Institutional Studies Program National Center for Education Statistics 1990 K Street NW Washington, DC 20006 Telephone number: (202) 502-7476 E-mail address: jefrey. [email protected]
School Library Statistics
The last national survey exclusively of school library media centers was conducted in school year 1985-86. NCES now asks questions about libraries in public and private elementary and secondary schools as part of the Schools and Staffing Survey (SASS) (see chapter 3). These data provide a national picture of school library collections, expenditures, technology, and services. This information can be used by federal, state, and local policymakers and practitioners in assessing the status of school library media centers in the United States.
Design Information on school libraries has been collected from a sample of public and private
elementary and secondary schools in SASS. A school library media center questionnaire was administered to a sample of 13,000 public and private schools in school year 1999-2000.
Component
1999-2000 SASS
School Library Media Center Questionnaire-Library media center facilities, collections, equipment, technology, stafftng, income, expenditures, and services.
Major Publications Schools and StafJing Survey, 1999-2000: Overview of the Data for Public, Private, Public Charter,
and Bureau of Indian Affairs Elementary and Secondary Schools (May 2002)
Evaluation of Definitions and Analysis of Comparative Data for the School Library Statistics Program (September 1998)
School Library Media Centers: 1993-94 (August 1998)
Further information on the School Library Media Centers Survey may be found on the web (http://nces. edgov/surveys/libraries/school. asp) or by contacting:
Jeffiey Williams Elementary/Secondary and Libraries Studies Division Library Co-Operative System and Institutional Studies Program National Center for Education Statistics 1990 K Street, NW Washington, DC 20006 Telephone number: (202) 502-7476 E-mail address: jeflrey. [email protected]
State Library Agencies Survey
NCES surveys state library agencies annually. The first year of data collection was for fiscal year 1994. The State Library Agencies (StLA) Survey is the product of a cooperative effort between the chief officers of StLAs, the U.S. National Commission on Libraries and Information Science, the U.S. Census Bureau, and NCES.
StLAs are the official agencies designated in federal and state law with the administration of hnds authorized by the Library Services and Technology Act (P.L. 104-208). StLAs are receiving increasingly broader legislative mandates affecting libraries of all types in the state (i.e., public, academic, school, and special libraries, and library systems). The StLA Survey provides policymakers and researchers with descriptive information on StLAs. In particular, the public library data collected by the StLA Survey, when added to the data collected by the NCES Public Libraries Survey, helps complete the national picture of public library service.
Design The survey collects data on StLAs in the 50 states and the District of Columbia. The data are
collected via a web-based reporting system to reduce respondent burden and improve data quality. NCES releases the final data file and an annual E.D. Tabs report.
Component StLA Suwey-Direct library s ices; library development services; resources assigned to allied f-" operations, such as archive an records management; organizational and governance structure within which the agency operates; electronic networking; stafing; collections; and services to libraries and systems.
Major Publications State Library Agencies, Fiscal Year 2001 (October 2002)
State Library Agencies, Fiscal Year 2000 (November 2001)
State Library Agencies, Fiscal Year 1999 (September 2000)
State Library Agencies, Fiscal Year 1998 (February 2000)
Evaluation ofthe NCES State Library Agencies Survey (September 1999)
State Library Agencies, Fiscal Year 1997 (March 1999)
Data Files State Library Agencies, Fiscal Year 200 1 (October 2002)
State Library Agencies, Fiscal Year 2000 (November 2001)
State Library Agencies, Fiscal Year 1999 (September 2000)
State Library Agencies, Fiscal Year 1998 (February 2000)
State Library Agencies, Fiscal Year 1997 (March 1999)
State Library Agencies, Fiscal Year 1996 (June 1998)
Additional information on the StLA Survey may be found on the web (http://nces.edgov/surveys/libraries/sla.asp). For more information on the StLA Survey, contact:
Elaine Kroe ElementaryISecondary and Libraries Studies Division Library Co-Operative System and Institutional Studies Program National Center for Education Statistics 1990 K Street NW Washington, DC 20006 Telephone number: (202) 502-7379 E-mail address: patricia. [email protected]
Plans for the Public Libraries Statistics Survey NCES has fostered the use and analysis of FSCS data. A Data Use Subcommittee of the FSCS
Steering Committee has been addressing the analysis, dissemination, and use of FSCS data. Several analytical projects have been completed or are underway.
NCES is developing a public library geographic mapping tool to be available on the web as part of the NCES Decennial Census Geomapping School District 2000 Project. This tool is an interactive

online mapping system that integrates 2000 Decennial Census data with school district boundaries and school district data. The library part of this tool will be developed in phases over the next several years. Public library service outlets nationwide will be geocoded (geocodes are latitude and longitude coordinates). In a later phase, the boundaries of the almost 9,000 public library legal service area jurisdictions will be digitized. These will be matched to Census Tiger files and to Public Libraries Survey data files. The project will link census demographic data with Public Libraries Survey data through geographic mapping software. When fully developed, this tool will enable public libraries to identify and map census demographic data within their service boundaries or around their service outlets. For example, a library will be able to identifL and map areas with high poverty rates, numbers of elderly persons, or numbers of new Americans, etc., within their service boundaries, so that service delivery can be planned with this awareness. Libraries will also be able to compare their statistics on services with the surrounding demography and present the results in the form of maps.
Plans for Crosscutting Activities The Library Statistics Program also sponsors activities that cut across all types of libraries. For
example, NCES sponsors the attendance of librarians from all sectors at NCES training opportunities, such as the semiannual Cooperative System Fellows Program. In 2003, the Library Statistics Program is redesigning its web site (http://nces.ed.gov/surveys/libraries).

Table 7. Data Collection Calendar for Library Statistics Program
Year of Data Collection
surveys 1992 1993 1994 1995 1996 1997 1998 1999 2000 2001 2002
Public Libraries X X X X X X X X X X X
Academic Libraries X X X X X X
School Library Media Centers (SASS)
State Library Agencies X X X X X X X

General Publications of NCES
The National Center for Education Statistics (NCES) annually produces three major publications designed for general audiences: The Condition of Education, Digest of Education Statistics, and Projections of Education Statistics. In addition, NCES produces the Education Statistics Quarterly, which provides an overview of NCES work four times a year. These publications present statistics on a wide array of education topics. They are used in diverse ways by policymakers, researchers, and the general public. NCES produces other publications that draw upon a variety of data sources, such as Trends in Educational Equity of Girls and Women.
The Condition of Education Efforts to improve education in America require reliable data on the condition and progress of
education. When the original Department of Education was created in 1867, the law stated that it should "gather statistics and facts on the condition and progress of education in the United States and Territories." NCES currently carries out this mission for the Department of Education and, since 1975, has done so by publishing The Condition of Education, a mandated annual report submitted to Congress on June 1 every year.
The Condition of Education presents statistical information, drawn fiom numerous data sources, in an indicator format that is designed to make such information meaningful and accessible for a general audience. An indicator format differs fiom traditional statistical tables in that the quantitative data presented are carefully selected to convey summary information (about conditions, functioning, performance, or trends) and to serve as diagnostic tools for policymakers. Similar to leading economic indicators (e.g., the gross national product or consumer price index) that track economic trends and signal weak or strong economic performance, The Condition of Education's indicators focus national attention on important aspects of the U.S. educational system.
The print version of The Condition of Education presents approximately 45 such indicators annually, organized into six areas of measurement:
Participation in Education;
Learner Outcomes;
Student Effort and Academic Progress;
Quality of Elementary and Secondary School Environments;
The Context of Postsecondary Education; and
Societal Support for Learning.
The web version of The Condition of Education allows readers to access all indicators published since 2000. Both versions include supplemental information (e.g., statistical tables, standard errors,

and supplemental notes) when needed for indicators. In addition, both versions include introductions for each of these six areas and a special focus analysis. The 2003 special focus analysis examined young children's achievements and classroom experiences in reading.
The Condition of Education's indicators represent the most current and valid data available to quantify those aspects of the U.S. educational system that a consensus of professional judgment deems to be the most significant national measures of the condition and progress of education. Thus, the same indicators are not merely updated every year. A core set of indicators is repeated with updated information annually; however, new indicators are also developed regularly as more and better data become available. Moreover, some indicators, based on one-time studies, appear only for a few years. Other indicators, based on periodic surveys, are updated every few years as new data become available.
The web version of The Condition of Education is available to the public at http://nces.ed.gov/programs/coe/. The most recent print version of The Condition of Education can be ordered from ED Pubs at 1-877-4ED-PUBS or downloaded (along with any print version since 1996) from NCES web site (search for The Condition of Education at http://nces.ed.gov/pubsearch). The Condition of Education's special focus essays are also published as separate topical reports, and have covered such issues as entering kindergarten, the social context of education, women in mathematics and science, and first-generation students in postsecondary education.
Major Publications
The Condition of Education 2003 (June 2003)
The Condition of Education 2003 in Brief (June 2003)
For more information on The Condition of Education, contact:
John Wirt Early Childhood, International, and Crosscutting Studies Division. Annual Reports Program National Center for Education Statistics 1990 K Street NW Washington, DC 20006 Telephone number: (202) 502-7478 E-mail address: john. [email protected]
Digest of Education Statistics The Digest of Education Statistics is the primary resource publication on education statistics. It
contains a wealth of information on all levels of education, from preprimary through graduate education. This reference volume is intended for use by researchers, policy analysts, businesses, students, educators, the media, and the general public. The Digest of Education Statistics has expanded through its long history as NCES has pursued a policy of continuous development without sacrificing important trend information.

The development of the Digest of Education Statistics occurred over an extended period of time. For 40 years, from 19 16- 18 to 1956-58, the statistical component of the Office of Education (the predecessor of the U.S. Department of Education) prepared and published the Biennial Survey of Education in the United States. Most of the important data collected by the Office of Education was placed in this report, which was a resource used by researchers, planners, and others interested in the field of education statistics. The publication was discontinued in 1958, but the need for a document summarizing the various types of data collected by the Office of Education continued. Thus, in 1962, the first edition of the Digest of Education Statistics was issued.
The 2002 Digest of Education Statistics is the 37th in this series of publications. (The Digest of Education Statistics has been issued annually except for combined editions for the years 1977-78, 1983-84, and 1985-86.) Its primary purpose is to provide a compilation of statistical information covering the broad field of American education from preprimary through graduate school. The Digest of Education Statistics includes a selection of data from many sources, both government and private, and draws especially on the results of surveys and activities carried out by NCES. It contains a considerable amount of material tabulated exclusively for the publication, such as summaries of federal funds for education and detailed tabulations on degrees conferred by colleges and universities. The publication contains information on schools, teachers, enrollments, graduates, educational attainment, finances, federal funds for education, employment and income of graduates, libraries, and international comparisons of education. Supplemental information on population trends, attitudes on education, education characteristics of the labor force, government finances, and economic trends provides the background for evaluating education data.
The Digest of Education Statistics is divided into seven chapters:
All Levels of Education;
Elementary and Secondary Education;
Postsecondary Education;
Federal Programs for Education and Related Activities;
Outcomes of Education;
International Comparisons of Education; and
Libraries and Educational Technology.
To qualify for inclusion in this publication, material must be nationwide in scope, of high quality, and of current interest and value. The introductory sections supplement the tabular materials in chapters 1 through 7 by providing brief overviews of current trends in American education. Each chapter contains an introduction to the statistical materials describing that sector of education, as well as a brief discussion of the most significant data in the chapter. Charts are provided to further illuminate important data.
To make data analysis more convenient, a web version has been developed. The data are also available through the Encyclopedia of ED Stats web site, which enables users to search for and retrieve specific data. NCES also produces the Mini-Digest to make basic education statistics available in a pocket-sized booklet. The Mini-Digest, which has also been published in Spanish, includes statistics on enrollments, expenditures, faculty, degrees, and population characteristics in an abbreviated form.

The Digest of Education Statistics is designed for clarity, consistency, and comparability. High value is placed on the major recuning surveys with the objective of providing national- and state- level data that researchers and policymakers can use to measure changes over time. The Digest is intended to preserve the major series of education statistics originating with NCES and elsewhere, and to make them readily available to a wide audience of users.
Major Publications
Digest of Education Statistics, 2002 (June 2003)
Mini-Digest of Education Statistics, 2002 (May 2003)
Status and Trends in the Education of Hispanics (April 2003)
Indicators of School Crime and Safety: 2002 (November 2002)
Federal Support for Education to 2002 (October 2002)
Hispanic-Serving Institutions: Statistical Trends From 1990 to 1999 (September 2002)
Trends in Educational Equity of Girls and Women (April 2000)
Recent editions of the Digest of Education Statistics can be found on the web (http://nces.edgov/surveys/AnnualReports/reports.asp?type=digest). For more information on the Digest of Education Statistics, contact:
Thomas D. Snyder Early Childhood, International, and Crosscutting Studies Division Annual Reports Program National Center for Education Statistics 1990 K Street NW Washington, DC 20006 Telephone number: (202) 502-7452 E-mail address: [email protected]
Projections of Education Statistics NCES is the official federal source of education projections in the areas of enrollments, graduates
and earned degrees conferred, teachers, and expenditures in elementary and secondary schools and degree-granting institutions. The principal publication dealing with projections, Projections of Education Statistics, provides national statistics about elementary and secondary schools and degree- granting institutions. Included are data on enrollments, graduates, degrees, teachers, and expenditures for the past 14 years, and projections for the next 12 years. The report features state-level projections of public school enrollment and high school graduates. In addition, the report also contains a methodology section that describes models and assumptions used to develop these projections. Most of the projections are based on three alternative sets of assumptions. Although the middle alternative is the preferred set of projections, the other (high and low) alternatives provide a range of possible outcomes.
A summary of these projections is available in a pocket-sized folder called Pocket Projections. This brochure is a quick reference for projections of key education statistics. The information

provided in the report is used by researchers and policy planners in education and related areas. Projections are targeted for individuals in business, industry, government, the media, and education whose work requires information on future developments and trends affecting American education.
Major Publications
Pocket Projections of Education Statistics to 2012 (August 2002)
Projections of Education Statistics to 2012 (August 2002)
Recent editions of Projections of Education Statistics can be found on the web (http://nces.ed.gov/surveys/AnnualReports/reports.asp?type=projections). For more information on Projections of Education Statistics and projection methodology, contact:
Debra E. Gerald Early Childhood, International, and Crosscutting Studies Division Annual Reports Program National Center for Education Statistics 1990 K Street NW Washington, DC 20006 Telephone number: (202) 502-734 1 E-mail address: [email protected]
The Education Statistics Quarterly
Objective, high-quality statistics are crucial for informed decisionmaking about education- whether at the national, state, local, institutional, or family level. NCES developed the Education Statistics Quarterly as part of an overall effort to make reliable data on education more accessible to a variety of audiences. The first issue was published in April 1999.
Each issue provides a comprehensive overview of all NCES publications and data products released each quarter. Published four times a year, each issue contains:
a table of contents that provides brief descriptions of each article;
very short NCES reports in their entirety;
summaries of longer NCES reports (intended to be accessible to a broad audience that includes less technically oriented readers);
boxed information that steers interested readers to full technical details (which are only a click away in the web version);
short descriptions of other NCES products, such as data releases, handbooks, and manuals;
notices about training and funding opportunities from NCES; and
an annual comprehensive index (published in the winter issue) of all NCES publications and data products by topic and keyword, as well as by author and NCES contact.
In addition, each issue includes a featured topic, with two independent commentaries written by respected experts in the education research and policy communities. These independent perspectives on policy and data issues are intended to stimulate ideas and discussion in the field of education statistics. In each issue, the first of the two invited commentaries typically focuses on important policy implications of an NCES data set. The second commentary generally focuses on data and measurement issues, including the strengths and limitations of the data currently available, as well as actual or desirable plans for future surveys or analyses.
The Education Statistics Quarterly is designed to make information from NCES readily available to a wide variety of users in an attractive and user-friendly format. By regularly distributing a compilation of short and summary pieces covering work done across all parts of the agency over a 3- month period, along with independent commentaries, NCES hopes to increase the visibility and usability of reliable education statistics.
Major Publication Education Statistics Quarterly (published in spring, summer, fall, and winter)
Recent editions of the Education Statistics Quarterly can be found on the web (http://nces.ed.gov/pubsearch/majorpub.asp#cluarterly). For more information on the Quarterly, contact:
Barbara Marenus Office of the Commissioner National Center for Education Statistics 1990 K Street NW Washington, DC 20006 Telephone number: (202) 502-739 1 E-mail address: [email protected]
U.S. Department of Education ED Pubs 8242-B Sandy Court Jessup, MD 20794-1 398
Official Business Penalty for Private Use, $300
U.S. POSTAGE PAID U.S. DEPARTMENT OF EDUCATION
PERMIT NO. 6 1 7

U S . Department of Education Ofice of Educational Research and Improvement (OERI)
Nafional Library of Education (NLE) Educational Resources Informaion Center (ERIC)
NOTICE
Reproduction Basis
This document is covered by a signed "Reproduction Release 0 (Blanket)" form (on file within the ERIC system), encompassing all or classes of documents from its source organization and, therefore, does not require a "Specific Document" Release form.
This document is Federally-fbnded, or carries its own permission to reproduce, or is otherwise in the public domain and, therefore, may be reproduced by ERIC without a signed Reproduction Release form (either "Specific Document" or "Blanket").